Attached files
| file | filename |
|---|---|
| EX-32.1 - EXHIBIT 32.1 - Forest City Realty Trust, Inc. | fcrt-10qex3213312018.htm |
| EX-31.2 - EXHIBIT 31.2 - Forest City Realty Trust, Inc. | fcrt-10qex3123312018.htm |
| EX-31.1 - EXHIBIT 31.1 - Forest City Realty Trust, Inc. | fcrt-10qex3113312018.htm |
| EX-10.1 - EXHIBIT 10.1 - Forest City Realty Trust, Inc. | fcrt-10qex1013312018.htm |
UNITED STATES
SECURITIES AND EXCHANGE COMMISSION
Washington, D.C. 20549
_____________________________________________________________
Form 10-Q
_____________________________________________________________
(Mark One)
ý | QUARTERLY REPORT PURSUANT TO SECTION 13 OR 15 (d) OF THE SECURITIES EXCHANGE ACT OF 1934 |
For the quarterly period ended March 31, 2018
¨ | TRANSITION REPORT PURSUANT TO SECTION 13 OR 15 (d) OF THE SECURITIES EXCHANGE ACT OF 1934 |
For the transition period from to
Commission file number 1-37671
_____________________________________________________________
FOREST CITY REALTY TRUST, INC.
(Exact name of registrant as specified in its charter)
_____________________________________________________________
Maryland (State or other jurisdiction of incorporation or organization) | 47-4113168 (I.R.S. Employer Identification No.) | |||
Key Tower Suite 3100 | 127 Public Square Cleveland, Ohio | 44114 | ||
(Address of principal executive offices) | (Zip Code) | |||
216-621-6060
(Registrant’s telephone number, including area code)
Terminal Tower Suite 1100 | 50 Public Square Cleveland, Ohio | 44113 | ||
(Former name, former address and former fiscal year, if changed since last report)
_____________________________________________________________
Indicate by check mark whether the registrant (1) has filed all reports required to be filed by Section 13 or 15(d) of the Securities Exchange Act of 1934 during the preceding 12 months (or for such shorter period that the registrant was required to file such reports), and (2) has been subject to such filing requirements for the past 90 days. Yes ý No ¨
Indicate by check mark whether the registrant has submitted electronically and posted on its corporate Web site, if any, every Interactive Data File required to be submitted and posted pursuant to Rule 405 of Regulation S-T (§232.405 of this chapter) during the preceding 12 months (or for such shorter period that the registrant was required to submit and post such files). Yes ý No ¨
Indicate by check mark whether the registrant is a large accelerated filer, an accelerated filer, a non-accelerated filer, smaller reporting company, or an emerging growth company. See the definitions of “large accelerated filer,” “accelerated filer,” “smaller reporting company” and “emerging growth company” in Rule 12b-2 of the Exchange Act. (Check one):
Large accelerated filer | ý | Accelerated filer | ¨ |
Non-accelerated filer | ¨ (Do not check if a smaller reporting company) | Smaller reporting company | ¨ |
Emerging growth company | ¨ | ||
If an emerging growth company, indicate by check mark if the registrant has elected not to use the extended transition period for complying with any new or revised financial accounting standards provided pursuant to Section 13(a) of the Exchange Act. ¨
Indicate by check mark whether the registrant is a shell company (as defined in Rule 12b-2 of the Exchange Act). Yes ¨ No ý
Indicate the number of shares outstanding, including unvested restricted stock, of the issuer’s class of common stock, as of the latest practicable date.
Class | Outstanding at April 30, 2018 |
Class A Common Stock, $.01 par value | 267,191,818 shares |
Forest City Realty Trust, Inc. and Subsidiaries
Table of Contents
Page | ||
1
PART I – FINANCIAL INFORMATION
Item 1. Financial Statements
Forest City Realty Trust, Inc. and Subsidiaries
Consolidated Balance Sheets
(Unaudited)
March 31, 2018 | ||||||
(Unaudited) | December 31, 2017 | |||||
(in thousands) | ||||||
Assets | ||||||
Real Estate | ||||||
Completed rental properties | $ | 6,576,803 | $ | 7,154,607 | ||
Projects under construction and development | 593,650 | 568,552 | ||||
Land inventory | 58,717 | 57,296 | ||||
Total Real Estate | 7,229,170 | 7,780,455 | ||||
Less accumulated depreciation | (1,485,790 | ) | (1,484,163 | ) | ||
Real Estate, net – (variable interest entities $2,010.6 million and $2,383.2 million, respectively) | 5,743,380 | 6,296,292 | ||||
Cash and cash equivalents – (variable interest entities $72.9 million and $55.3 million, respectively) | 455,447 | 204,260 | ||||
Restricted cash – (variable interest entities $130.6 million and $65.5 million, respectively) | 203,829 | 146,131 | ||||
Accounts receivable, net – (variable interest entities $62.6 million and $52.6 million, respectively) | 216,464 | 225,022 | ||||
Notes receivable – (variable interest entities $139.4 million and $132.8 million, respectively) | 459,069 | 398,785 | ||||
Investments in and advances to unconsolidated entities | 645,977 | 550,362 | ||||
Other assets – (variable interest entities $61.9 million and $66.6 million, respectively) | 235,550 | 242,435 | ||||
Total Assets | $ | 7,959,716 | $ | 8,063,287 | ||
Liabilities and Equity | ||||||
Liabilities | ||||||
Nonrecourse mortgage debt and notes payable, net – (variable interest entities $1,460.8 million and $1,448.2 million, respectively) | $ | 2,967,198 | $ | 2,998,361 | ||
Revolving credit facility | — | — | ||||
Term loan, net | 333,768 | 333,668 | ||||
Convertible senior debt, net | 112,741 | 112,637 | ||||
Accounts payable, accrued expenses and other liabilities – (variable interest entities $241.1 million and $259.9 million, respectively) | 572,531 | 650,022 | ||||
Cash distributions and losses in excess of investments in unconsolidated entities | 120,833 | 123,882 | ||||
Total Liabilities | 4,107,071 | 4,218,570 | ||||
Commitments and Contingencies | — | — | ||||
Equity | ||||||
Stockholders’ Equity | ||||||
Preferred stock – $.01 par value, respectively; 20,000,000 shares authorized, no shares issued | — | — | ||||
Class A Common Stock - $.01 par value, 371,000,000 shares authorized, 265,912,983 and 265,343,283 shares issued and outstanding, respectively | 2,659 | 2,653 | ||||
Additional paid-in capital | 2,536,715 | 2,537,538 | ||||
Retained earnings | 1,048,421 | 896,806 | ||||
Accumulated other comprehensive loss | (6,143 | ) | (8,563 | ) | ||
Total Stockholders’ Equity | 3,581,652 | 3,428,434 | ||||
Noncontrolling interest | 270,993 | 416,283 | ||||
Total Equity | 3,852,645 | 3,844,717 | ||||
Total Liabilities and Equity | $ | 7,959,716 | $ | 8,063,287 | ||
The accompanying notes are an integral part of these consolidated financial statements.
2
Forest City Realty Trust, Inc. and Subsidiaries
Consolidated Statements of Operations
(Unaudited)
Three Months Ended March 31, | ||||||
2018 | 2017 | |||||
(in thousands, except per share data) | ||||||
Revenues | ||||||
Rental | $ | 162,547 | $ | 162,449 | ||
Tenant recoveries | 28,408 | 25,932 | ||||
Service and management fees | 5,563 | 10,127 | ||||
Parking and other | 7,457 | 11,738 | ||||
Land sales | 5,945 | 5,760 | ||||
Total revenues | 209,920 | 216,006 | ||||
Expenses | ||||||
Property operating and management | 71,311 | 78,793 | ||||
Real estate taxes | 21,031 | 21,200 | ||||
Ground rent | 3,685 | 3,888 | ||||
Cost of land sales | 2,986 | 2,001 | ||||
Corporate general and administrative | 12,183 | 15,583 | ||||
Organizational transformation and termination benefits | 15,950 | 4,525 | ||||
127,146 | 125,990 | |||||
Depreciation and amortization | 55,285 | 63,555 | ||||
Total expenses | 182,431 | 189,545 | ||||
Operating income | 27,489 | 26,461 | ||||
Interest and other income | 10,761 | 10,272 | ||||
Gain on change in control of interests | 117,711 | — | ||||
Interest expense | (26,967 | ) | (27,975 | ) | ||
Amortization of mortgage procurement costs | (1,306 | ) | (1,222 | ) | ||
Loss on extinguishment of debt | (2,388 | ) | (2,843 | ) | ||
Earnings before income taxes and earnings from unconsolidated entities | 125,300 | 4,693 | ||||
Earnings (loss) from unconsolidated entities | ||||||
Equity in earnings (loss) | (2,981 | ) | 9,278 | |||
Net gain on disposition of interest in unconsolidated entities | 74,959 | 17,701 | ||||
71,978 | 26,979 | |||||
Earnings before income taxes | 197,278 | 31,672 | ||||
Current income tax expense | 1,409 | 51 | ||||
Earnings before gains on disposal of real estate, net of tax | 195,869 | 31,621 | ||||
Net gain (loss) on disposition of interest in development project | 6,227 | (113 | ) | |||
Net gain (loss) on disposition of full or partial interest in rental properties | (2,534 | ) | 9,303 | |||
Net earnings | 199,562 | 40,811 | ||||
Noncontrolling interests, gross of tax | ||||||
Loss from continuing operations attributable to noncontrolling interests | 185 | 106 | ||||
Net earnings attributable to Forest City Realty Trust, Inc. | $ | 199,747 | $ | 40,917 | ||
Earnings per common share | ||||||
Net earnings attributable to common stockholders - Basic | $ | 0.75 | $ | 0.16 | ||
Net earnings attributable to common stockholders - Diluted | $ | 0.73 | $ | 0.16 | ||
The accompanying notes are an integral part of these consolidated financial statements.
3
Forest City Realty Trust, Inc. and Subsidiaries
Consolidated Statements of Comprehensive Income
(Unaudited)
Three Months Ended March 31, | ||||||
2018 | 2017 | |||||
(in thousands) | ||||||
Net earnings | $ | 199,562 | $ | 40,811 | ||
Other comprehensive income: | ||||||
Unrealized net gains on interest rate derivative contracts | 2,304 | 1,713 | ||||
Comprehensive income | 201,866 | 42,524 | ||||
Comprehensive loss attributable to noncontrolling interest | 181 | 102 | ||||
Total comprehensive income attributable to Forest City Realty Trust, Inc. | $ | 202,047 | $ | 42,626 | ||
The accompanying notes are an integral part of these consolidated financial statements.
4
Forest City Realty Trust, Inc. and Subsidiaries
Consolidated Statements of Equity
(Unaudited)
Accumulated | |||||||||||||||||||||||||
Common Stock | Additional | Other | |||||||||||||||||||||||
Class A | Class B | Paid-In | Retained | Comprehensive | Noncontrolling | ||||||||||||||||||||
Shares | Amount | Shares | Amount | Capital | Earnings | (Loss) Income | Interest | Total | |||||||||||||||||
(in thousands) | |||||||||||||||||||||||||
Balances at December 31, 2016 | 239,938 | $ | 2,399 | 18,788 | $ | 188 | $ | 2,483,275 | $ | 812,386 | $ | (14,410 | ) | $ | 501,161 | $ | 3,784,999 | ||||||||
Net earnings | 206,030 | 9,006 | 215,036 | ||||||||||||||||||||||
Other comprehensive income | 5,847 | 14 | 5,861 | ||||||||||||||||||||||
Common stock dividends | (121,610 | ) | (121,610 | ) | |||||||||||||||||||||
Conversion of Class B common stock to Class A common stock | 24,612 | 246 | (18,788 | ) | (188 | ) | (58 | ) | — | ||||||||||||||||
Cost incurred for conversion of Class B to Class A common stock | (9,305 | ) | (9,305 | ) | |||||||||||||||||||||
Restricted stock vested | 818 | 8 | (8 | ) | — | ||||||||||||||||||||
Repurchase of Class A common stock | (272 | ) | (2 | ) | (6,080 | ) | (6,082 | ) | |||||||||||||||||
Exercise of stock options | 91 | 1 | 1,497 | 1,498 | |||||||||||||||||||||
Issuance of Class A common stock under the deferred compensation plan for non-employee director | 13 | — | 309 | 309 | |||||||||||||||||||||
Stock-based compensation | 26,884 | 26,884 | |||||||||||||||||||||||
Exchange of 2006 Class A Common Units for Class A common stock | 143 | 1 | 7,287 | (7,288 | ) | — | |||||||||||||||||||
Exchange of 2006 Class A Common Units for rental property | 22,805 | (35,037 | ) | (12,232 | ) | ||||||||||||||||||||
Issuance of Class A common stock in exchange for 2018 Senior Note | — | — | 1 | 1 | |||||||||||||||||||||
Acquisition of partners’ noncontrolling interest in consolidated subsidiaries | 10,931 | (10,931 | ) | — | |||||||||||||||||||||
Contributions from noncontrolling interests | 23,168 | 23,168 | |||||||||||||||||||||||
Distributions to noncontrolling interests | (63,810 | ) | (63,810 | ) | |||||||||||||||||||||
Balances at December 31, 2017 | 265,343 | $ | 2,653 | — | $ | — | $ | 2,537,538 | $ | 896,806 | $ | (8,563 | ) | $ | 416,283 | $ | 3,844,717 | ||||||||
Cumulative effect of adoption of accounting guidance on derivatives and hedging activities | (120 | ) | 120 | — | |||||||||||||||||||||
Net earnings | 199,747 | (185 | ) | 199,562 | |||||||||||||||||||||
Other comprehensive income | 2,300 | 4 | 2,304 | ||||||||||||||||||||||
Common stock dividends | (48,012 | ) | (48,012 | ) | |||||||||||||||||||||
Restricted and performance shares vested | 861 | 9 | (9 | ) | — | ||||||||||||||||||||
Repurchase of Class A common stock | (292 | ) | (3 | ) | (6,044 | ) | (6,047 | ) | |||||||||||||||||
Stock-based compensation | 5,219 | 5,219 | |||||||||||||||||||||||
Issuance of Class A common stock in exchange for 2018 & 2020 Senior Notes | 1 | — | 11 | 11 | |||||||||||||||||||||
Deconsolidation of joint venture upon change in control | (133,090 | ) | (133,090 | ) | |||||||||||||||||||||
Contributions from noncontrolling interests | 4,481 | 4,481 | |||||||||||||||||||||||
Distributions to noncontrolling interests | (16,500 | ) | (16,500 | ) | |||||||||||||||||||||
Balances at March 31, 2018 (Unaudited) | 265,913 | $ | 2,659 | — | $ | — | $ | 2,536,715 | $ | 1,048,421 | $ | (6,143 | ) | $ | 270,993 | $ | 3,852,645 | ||||||||
The accompanying notes are an integral part of these consolidated financial statements.
5
Forest City Realty Trust, Inc. and Subsidiaries
Consolidated Statements of Cash Flows
(Unaudited)
Three Months Ended March 31, | ||||||
2018 | 2017 | |||||
(in thousands) | ||||||
Net earnings | $ | 199,562 | $ | 40,811 | ||
Depreciation and amortization | 55,285 | 63,555 | ||||
Amortization of mortgage procurement costs | 1,306 | 1,222 | ||||
Loss on extinguishment of debt | 2,388 | 2,843 | ||||
Net (gain) loss on disposition of interest in development projects, net of tax | (6,227 | ) | 113 | |||
Net (gain) loss on disposition of full or partial interest in rental properties, net of tax | 2,534 | (9,303 | ) | |||
Gain on change in control of interests | (117,711 | ) | — | |||
Equity in (earnings) loss | 2,981 | (9,278 | ) | |||
Net gain on disposition of interest in unconsolidated entities | (74,959 | ) | (17,701 | ) | ||
Stock-based compensation expense | 4,264 | 4,864 | ||||
Amortization and mark-to-market adjustments of derivative instruments | (1,436 | ) | (816 | ) | ||
Operating distributions from unconsolidated entities | 11,292 | 17,808 | ||||
Increase in land inventory | (3,034 | ) | (6,480 | ) | ||
Decrease (increase) in accounts receivable | 16,590 | (5,741 | ) | |||
Decrease (increase) in other assets | 1,605 | (171 | ) | |||
Decrease in accounts payable, accrued expenses and other liabilities | (59,709 | ) | (26,745 | ) | ||
Net cash provided by operating activities | 34,731 | 54,981 | ||||
Cash flows from investing activities | ||||||
Capital expenditures | (67,309 | ) | (96,685 | ) | ||
Payment of lease procurement costs | (3,441 | ) | (1,842 | ) | ||
Increase in notes receivable | (12,251 | ) | (6,768 | ) | ||
Proceeds from deconsolidation of a rental property | 24,000 | — | ||||
Proceeds from disposition of rental properties or development project | 157,992 | 25,796 | ||||
Contributions to unconsolidated entities | (26,892 | ) | (28,351 | ) | ||
Distributions from unconsolidated entities | 167,715 | 24,893 | ||||
Net cash provided by (used in) investing activities | 239,814 | (82,957 | ) | |||
Cash flows from financing activities | ||||||
Proceeds from nonrecourse mortgage debt and notes payable | 148,548 | 55,691 | ||||
Principal payments on nonrecourse mortgage debt and notes payable | (45,807 | ) | (33,306 | ) | ||
Payment of deferred financing costs | (2,523 | ) | (96 | ) | ||
Repurchase of Class A common shares | (6,047 | ) | (3,436 | ) | ||
Exercise of stock options | — | 425 | ||||
Dividends paid to stockholders | (48,012 | ) | (23,441 | ) | ||
Contributions from noncontrolling interests | 4,481 | 12,117 | ||||
Distributions to noncontrolling interests | (16,300 | ) | (15,119 | ) | ||
Net cash provided by (used in) financing activities | 34,340 | (7,165 | ) | |||
Net increase (decrease) in cash, cash equivalents and restricted cash | 308,885 | (35,141 | ) | |||
Cash, cash equivalents and restricted cash at beginning of period | 350,391 | 323,919 | ||||
Cash, cash equivalents and restricted cash at end of period | $ | 659,276 | $ | 288,778 | ||
Beginning of Period | ||||||||
Cash and cash equivalents | 204,260 | 174,619 | ||||||
Restricted cash | 146,131 | 149,300 | ||||||
Cash, cash equivalents and restricted cash at beginning of period | $ | 350,391 | $ | 323,919 | ||||
End of Period | ||||||||
Cash and cash equivalents | 455,447 | 146,426 | ||||||
Restricted cash | 203,829 | 142,352 | ||||||
Cash, cash equivalents and restricted cash at end of period | $ | 659,276 | $ | 288,778 | ||||
The accompanying notes are an integral part of these consolidated financial statements.
6
Forest City Realty Trust, Inc. and Subsidiaries
Notes to Consolidated Financial Statements
(Unaudited)
A. Accounting Policies
General
Forest City Realty Trust, Inc. (with its subsidiaries, the “Company”) principally engages in the operation, development, management and acquisition of office, apartment and retail real estate and land throughout the United States. The Company had approximately $8.0 billion of consolidated assets in 19 states and the District of Columbia at March 31, 2018. The Company’s core markets include Boston, Chicago, Dallas, Denver, Los Angeles, Philadelphia, and the greater metropolitan areas of New York City, San Francisco and Washington D.C. The Company has regional offices in Boston, Dallas, Denver, Los Angeles, New York City, San Francisco, Washington, D.C., and the Company’s corporate headquarters in Cleveland, Ohio.
Basis of Presentation
The accompanying consolidated financial statements have been prepared in accordance with accounting principles generally accepted in the United States of America (“GAAP”) for interim financial information and the instructions to Form 10-Q, and should be read in conjunction with the consolidated financial statements and related notes included in the Company’s annual report on Form 10-K for the year ended December 31, 2017. The results of interim periods are not necessarily indicative of results for the full year or any subsequent period. In management’s opinion, all adjustments (consisting solely of normal recurring matters) necessary for a fair statement of financial position, results of operations and cash flows as of and for the periods presented have been included.
Company Operations
The Company is organized as a Real Estate Investment Trust (“REIT”) for federal income tax purposes. The Company holds substantially all of its assets, and conducts substantially all of its business, through Forest City Enterprises, L.P. (the “Operating Partnership”). The Company is the sole general partner of the Operating Partnership and, as of March 31, 2018, owns all of the limited partnership interests directly or indirectly in the Operating Partnership.
The Company holds and operates certain of its assets through one or more taxable REIT subsidiaries (“TRSs”). A TRS is a subsidiary of a REIT subject to applicable corporate income tax. The Company’s use of TRSs enables it to continue to engage in certain businesses while complying with REIT qualification requirements and allows the Company to retain income generated by these businesses for reinvestment without the requirement of distributing those earnings. The primary businesses held in TRSs during 2018 include 461 Dean Street (sold in March 2018), an apartment building in Brooklyn, New York, Antelope Valley Mall (sold in January 2018), Mall at Robinson (sold in February 2018) and Charleston Town Center, regional malls in Palmdale, California, Pittsburgh, Pennsylvania and Charleston, West Virginia, respectively, Pacific Park Brooklyn project and land development operations. In the future, the Company may elect to reorganize and transfer certain assets or operations from its TRSs to other subsidiaries, including qualified REIT subsidiaries.
Segments
The Company is organized around real estate operations, real estate development and corporate support service functions.
Real Estate Operations represents the performance of the Company’s core rental real estate portfolio and is comprised of the following reportable operating segments:
• | Office - owns, acquires and operates office and life science buildings. |
• | Apartments - owns, acquires and operates upscale and middle-market apartments and adaptive re-use developments. |
• | Retail - owns, acquires and operates amenity retail within our mixed-use properties, and remaining regional malls and specialty/urban retail centers. |
The remaining reportable operating segments consist of the following:
• | Development - develops and constructs office and life science buildings, apartments, condominiums, amenity retail and mixed-use projects. The Development segment includes recently opened operating properties prior to stabilization and the horizontal development and sale of land to residential, commercial and industrial customers primarily at its Stapleton project in Denver, Colorado. |
• | Corporate - provides executive oversight and various support services for Operations, Development and Corporate employees. |
7
Forest City Realty Trust, Inc. and Subsidiaries
Notes to Consolidated Financial Statements
(Unaudited)
Segment Transfers
The Development segment includes projects in development and projects under construction along with recently opened operating properties prior to stabilization. Projects are reported in their applicable operating segment (Office, Apartments or Retail) beginning on January 1 of the year following stabilization. Therefore, the Development segment will continue to report results from recently opened properties until the year-end following initial stabilization. The Company generally defines stabilized properties as achieving 92% or greater occupancy or having been open and operating for one or two years, depending on the size of the project. Once a stabilized property is transferred to the applicable Operations segment on January 1, it will be considered “comparable” beginning on the following January 1, as that will be the first time the property is stabilized in each period presented.
Use of Estimates
The preparation of consolidated financial statements in conformity with GAAP requires the Company to make estimates and assumptions in certain circumstances that affect amounts reported in the accompanying consolidated financial statements and related notes. Some of the critical estimates made by the Company include, but are not limited to, determination of the primary beneficiary of variable interest entities (“VIEs”), estimates of useful lives for long-lived assets, reserves for collection on accounts and notes receivable and other investments, gain on change of control of interests, impairment of real estate and other-than-temporary impairments on equity method investments. Actual results could differ from those estimates.
Reclassifications
Certain prior period amounts in the accompanying consolidated financial statements have been reclassified to conform to the current year’s presentation as a result of adopting new accounting guidance on the classification and presentation of changes in restricted cash on the statement of cash flows.
Variable Interest Entities
As of March 31, 2018, the Company determined it was the primary beneficiary of 43 VIEs. The creditors of the consolidated VIEs do not have recourse to the Company’s general credit. As of March 31, 2018, the Company determined it was not the primary beneficiary of 36 VIEs and accounts for these interests as equity method investments. The maximum exposure to loss of these unconsolidated VIEs is limited to the Company’s investment balance of $173,000,000 as of March 31, 2018.
In January 2018, our 50% noncontrolling partner at Bayside Village, an apartment community in San Francisco, CA, closed on a transaction where they sold the majority of their 50% ownership interest to an unrelated third party. Prior to this transaction, the Company fully consolidated the property, as the outside partner, in accordance with the partnership agreement, lacked any substantive participating rights. Thus, Bayside Village was presented as a VIE in the parenthetical VIE balances in the Consolidated Balance Sheets. Simultaneously with the sale, the Company amended the partnership agreement to grant substantive participating rights to the new outside partner. The property is adequately capitalized and no longer contains characteristics of a VIE. Based on the substantive participating rights held by the new outside partner, the Company concluded it is appropriate to deconsolidate the entity and account for the Company’s 50% investment in the property using the equity method of accounting. As a result, the Company removed approximately $415,000,000 of real estate, net, $127,000,000 of nonrecourse mortgage debt, net, and $23,300,000 of accounts payable, accrued expenses and other liabilities from the Consolidated Balance Sheet line items and corresponding parenthetical VIE balances.
New Accounting Guidance
The following accounting pronouncements were adopted during the three months ended March 31, 2018:
In May 2014, the FASB issued an amendment to the accounting guidance for revenue from contracts with customers. The core principle of this guidance is that an entity should recognize revenue to depict the transfer of promised goods or services to customers in an amount that reflects the consideration to which the entity expects to be entitled in exchange for those goods or services. The guidance defines steps an entity should apply to achieve the core principle. The Company adopted this guidance as of January 1, 2018 using the modified retrospective method and therefore, the comparative information has not been adjusted. The guidance has been applied to contracts that are not completed as of the date of initial application. Rental revenue and tenant recoveries from lease contracts represents a significant portion of the Company’s total revenues and is a specific scope exception provided by this guidance. The adoption of this guidance did not result in a material impact on the Company’s consolidated financial statements or disclosures.
In November 2016, the FASB issued an amendment to the accounting guidance on the classification and presentation of changes in restricted cash on the statement of cash flows. The guidance requires restricted cash to be included with cash and cash equivalents when reconciling the beginning-of-period and end-of-period total amounts shown in the statement of cash flows. The Company adopted this guidance as of January 1, 2018 using the retrospective transition method. The adoption of this guidance significantly increased the combined beginning and ending period cash, cash equivalents and restricted cash balances as of each period presented and removed the effects of the change in restricted cash as previously presented in Company’s Consolidated Statements of Cash Flows for the three months ended March 31, 2017.
8
Forest City Realty Trust, Inc. and Subsidiaries
Notes to Consolidated Financial Statements
(Unaudited)
In February 2017, the FASB issued an amendment to the accounting guidance on the derecognition of nonfinancial assets. The guidance clarifies the definition of an in substance nonfinancial asset and the recognition of gains and losses from the transfer of nonfinancial assets and for partial sales of nonfinancial assets, which includes real estate. We elected the practical expedient to not apply the guidance on completed contracts. A completed contract is one in which “substantially all” of the revenue from the contract was recognized under the previous accounting guidance. The Company adopted this guidance using the modified retrospective method on January 1, 2018.
In August 2017, the FASB issued an amendment to the accounting guidance on derivatives and hedging activities. The purpose of this updated guidance is to better align a company’s financial reporting for hedging activities with the economic objectives of those activities. The Company early adopted this guidance on January 1, 2018, using the modified retrospective method requiring a cumulative effect adjustment of $120,000 to recognize the initial application of this guidance as an adjustment to accumulated other comprehensive income and a corresponding adjustment to beginning retained earnings.
The following new accounting pronouncements will be adopted on their respective effective dates:
In February 2016, the FASB issued an amendment to the accounting guidance on leases. This guidance sets out the principles for the recognition, measurement, presentation and disclosure of leases for both parties to a contract (i.e., lessees and lessors). The new guidance requires lessees to apply a dual approach, classifying leases as either finance or operating leases based on the principle of whether or not the lease is effectively a financed purchase by the lessee. This classification will determine whether lease expense is recognized based on an effective interest method or on a straight line basis over the term of the lease, respectively. A lessee is also required to record a right-of-use asset and a lease liability for all leases with a term of greater than 12 months regardless of their classification. Leases with a term of 12 months or less will be accounted for similar to the current guidance for operating leases. The new guidance requires lessors to account for leases using an approach that is substantially equivalent to existing guidance for sales-type leases, direct financing leases and operating leases. The guidance is expected to impact the Company’s consolidated financial statements as the Company has certain operating and land lease arrangements for which it is the lessee. The new guidance supersedes the previous leases accounting standard. The guidance is effective on January 1, 2019. The adoption of the new guidance is expected to have an impact on the consolidated financial statements as the Company has material ground lease arrangements, as well as other lease agreements. In addition, the Company believes it will be precluded from capitalizing its internal leasing costs, as the costs are not expected to be directly incremental to the successful execution of a lease, as required by the new guidance. The Company has completed an inventory of its lease agreements in which the Company is a lessee and is gathering the necessary information to determine the right of use asset and related lease liability. The Company intends to use the practical expedients available to lessees upon adoption. For leases in which the Company is the lessor, the Company is in the process of analyzing the various revenue streams from its lease agreements to determine the lease and non-lease components based on the applicable performance obligation associated with the consideration received.
On March 28, 2018, the FASB tentatively approved targeted improvements to the Leases standard that provides lessors with a practical expedient by class of underlying assets to not separate non-lease components from the lease component. Such practical expedient is limited to circumstances in which (i) the timing and pattern of transfer for the non-lease component and the related lease component are the same and (ii) the stand-alone lease component would be classified as an operating lease if accounted for separately. The Company will elect the practical expedient which would allow the Company the ability to account for the combined component based on its predominant characteristic if the underlying asset meets the two criteria defined above.
Recognition of Revenues
The Company has adopted new accounting guidance for revenue from contracts with customers on January 1, 2018. The adoption of this guidance did not result in a material impact on the Company’s consolidated financial statements at adoption and at March 31, 2018. The following is disclosure of the Company’s revenue recognition policies.
Rental – Lease terms in office buildings, retail centers and certain parking facilities generally range from 1 to 30 years, excluding leases with certain anchor tenants, which typically are longer. Minimum rents are recognized on a straight-line basis over the non-cancelable term of the lease, which include the effects of applicable rent steps and rent abatements. Overage rents are recognized after sales thresholds have been achieved. Apartment lease terms are generally one year.
Tenant Recoveries – Reimbursements from office, apartments and retail tenants for common area maintenance, taxes, insurance, utilities and other property operating expenses as defined in the lease agreements are recognized in the period the applicable costs are incurred.
Service and Management Fees – Management fee revenue in the Office, Apartment and Retail segments is a series of distinct services required to operate a property’s day to day activities with the same pattern of transfer to the customer satisfied over time. Management fee revenue is billed to the customer and recognized as revenue on a monthly basis as management services are rendered. Service fee revenue in the Office, Apartment and Retail segments primarily from leasing, financing, and other real estate services are distinct services billed and recognized in the period the Company’s performance obligation is satisfied. Development fee revenue on long-term fixed-price contracts or cost plus fee contracts are recognized as the Company’s performance obligation is satisfied. We apply the practical expedient and, as a result, do not disclose variable consideration attributable to wholly or partially unsatisfied performance obligations as of the end of the reporting period.
9
Forest City Realty Trust, Inc. and Subsidiaries
Notes to Consolidated Financial Statements
(Unaudited)
Parking and Other – Revenues derived from monthly and transient tenant parking and other revenue relates primarily to the Office and Apartment segment and is recognized in the period the Company’s performance obligation is satisfied.
Land Sales – Sales of land to residential, commercial and industrial customers, primarily at the Company’s Stapleton project in the Development segment, and sales of commercial outlots adjacent to the Company’s operating property portfolio primarily in the Retail segment are recognized at closing or upon completion of all conditions precedent to the sales contract (whichever is later).
Historic, New Market and Low Income Housing Tax Credit Entities
The Company invests in properties that have received, or the Company believes are entitled to receive, historic preservation tax credits on qualifying expenditures under Internal Revenue Code (“IRC”) section 47, low income housing tax credits on new construction and rehabilitation of existing buildings as low income rental housing under IRC section 42, and new market tax credits on qualifying investments in designated community development entities (“CDEs”) under IRC section 45D, as well as various state credit programs, which entitles the members to tax credits based on qualified expenditures at the time those qualified expenditures are placed in service (collectively “Tax Credits”). The Company typically enters into these investments with sophisticated financial investors. In exchange for the financial investors’ initial contribution into the investment, the financial investor is entitled to substantially all of the benefits derived from the tax credit. Typically, these arrangements have put/call provisions whereby the Company may be obligated (or entitled) to repurchase the financial investors’ interest. The Company has consolidated each of these entities in its consolidated financial statements and has included these investor contributions in accounts payable, accrued expenses and other liabilities.
The Company guarantees to the financial investor that in the event of a subsequent recapture by a taxing authority due to the Company’s noncompliance with applicable tax credit guidelines, it will indemnify the financial investor for any recaptured tax credits. The Company initially records a contract liability for the cash received from the financial investor, which represents consideration received prior to transferring services. The Company’s performance obligation is to comply with the recapture rules of the specified tax credit over the recapture period, which is in its control. The financial investor is simultaneously receiving and consuming the benefits provided by the Company’s performance as it complies with the recapture period. Therefore, the Company recognizes revenue in the amount of the contract liability on a straight-line basis over the tax credit recapture period, which range from 0 to 15 years. Income related to the sale of tax credits is recorded in interest and other income within the Corporate segment.
The following table summarizes the Tax Credit contract liabilities:
Three Months Ended March 31, | ||||||
2018 | 2017 | |||||
(in thousands) | ||||||
Beginning balance | $ | 60,851 | $ | 50,790 | ||
Tax credit revenue | (3,303 | ) | (2,845 | ) | ||
Tax credit contribution | — | 1,294 | ||||
Ending balance | $ | 57,548 | $ | 49,239 | ||
Related Party Transactions
The Company and certain of its affiliates entered into a Master Contribution and Sale Agreement (the “Master Contribution Agreement”) with Bruce C. Ratner (“Mr. Ratner”), Executive Vice President at the time of the transaction and currently Chairman of Forest City Ratner Companies, and certain entities and individuals affiliated with Mr. Ratner (the “BCR Entities”) in August 2006 to purchase their interests in a total of 30 retail, office and apartment operating properties and service companies in the Greater New York City metropolitan area. The Company issued Class A Common Units (“2006 Units”) in a jointly-owned, limited liability company in exchange for their interests. The 2006 Units may be exchanged for one of the following forms of consideration at the Company’s sole discretion: (i) an equal number of shares of the Company’s Class A common stock or, (ii) cash based on a formula using the average closing price of the Class A common stock at the time of conversion or, (iii) a combination of cash and shares of the Company’s Class A common stock. If the Company elects to pay cash as full or partial consideration in exchange for 2006 Units, the exchanging unit holder(s) may elect to redeem such 2006 Units for an in-kind distribution of one or more properties in lieu of cash, provided certain conditions set forth under the Exchange Rights Agreement adopted pursuant to the Master Contribution Agreement are met. The Company may, in its sole discretion, elect not to proceed with an in-kind redemption if the Company determines in good faith that the Company will suffer any adverse effects from proceeding with the in-kind redemption. The Company has no rights to redeem or repurchase the 2006 Units. Pursuant to the Master Contribution Agreement, certain projects under development would remain owned jointly until each project was completed and achieved “stabilization.” Upon stabilization, each project would be valued and the Company, in its discretion, would choose among various ownership options for the project. As of March 31, 2018, air rights for any future residential vertical development at East River Plaza, a specialty retail center in Manhattan, New York, remains the only development asset subject to this agreement.
10
Forest City Realty Trust, Inc. and Subsidiaries
Notes to Consolidated Financial Statements
(Unaudited)
In connection with the Master Contribution Agreement, the parties entered into the Tax Protection Agreement (the “Tax Protection Agreement”). The Tax Protection Agreement indemnified the BCR Entities included in the initial closing against taxes payable by reason of any subsequent sale of certain operating properties and expires in November 2018.
Pursuant to the Master Contribution Agreement, 2006 Units not exchanged are entitled to a distribution preference payment equal to the dividends paid on an equivalent number of shares of the Company’s common stock. The Company recorded $200,000 and $172,000 during the three months ended March 31, 2018 and 2017, respectively, related to the distribution preference payment, which is classified as noncontrolling interest expense on the Company’s Consolidated Statement of Operations.
In March 2017, certain BCR Entities exchanged 142,879 of the 2006 Units. The Company issued 142,879 shares of its Class A common stock for the exchanged 2006 Units. The Company accounted for the exchange as a purchase of noncontrolling interests, resulting in a reduction of noncontrolling interests of $7,288,000, an increase to Class A common stock of $1,000 and a combined increase to additional paid-in capital of $7,287,000, accounting for the fair value of common stock issued and the difference between the fair value of consideration exchanged and the historical cost basis of the noncontrolling interest balance. At March 31, 2018 and December 31, 2017, 1,111,044 of the 2006 Units were outstanding.
As a result of the January 2017 sale of Shops at Bruckner Boulevard, an unconsolidated specialty retail center in Bronx, New York, the Company accrued $482,000 related to a tax indemnity payment due to the BCR Entities in accordance with the terms of the Tax Protection Agreement during the three months ended March 31, 2017.
Other Related Party Transactions
In December 2016, the Company’s Board of Directors approved, and the Company entered into a reclassification agreement, with RMS Limited Partnership (“RMS”), the former controlling stockholder of the Company's Class B shares (the “Reclassification Agreement”). The Reclassification Agreement provided that, at the Effective Time, as defined in the Reclassification Agreement, following the satisfaction of the conditions thereto, each share of Class B Common Stock issued and outstanding immediately prior to the Effective Time would be reclassified and exchanged into 1.31 shares of Class A Common Stock, with a right to cash in lieu of fractional shares (the “Reclassification”). At the Company’s Annual Meeting of Stockholders held on June 9, 2017, the stockholders approved the Reclassification. See Note I – Capital Stock for additional information.
In October 2016, the Company entered into a Reimbursement Agreement with RMS (the “Reimbursement Agreement”). The Company agreed to reimburse RMS (together with its officers, directors, employees, beneficiaries, trustees, representatives and agents)(“Reimbursed Persons”) for reasonable and documented fees and out-of-pocket expenses of RMS’s financial, legal and public relations advisors incurred in evaluating and negotiating the Reclassification. In addition, the Company agreed to reimburse the Reimbursed Persons for (i) reasonable costs and expenses incurred in connection with any Proceeding (as defined in the Reimbursement Agreement) to which such Reimbursed Person is a party or otherwise involved in and (ii) any losses, damages or liabilities actually and reasonably suffered or incurred in any such Proceeding by a Reimbursed Person. Amounts incurred subject to the Reimbursement Agreement were approximately $50,000 for the three months ended March 31, 2017.
In March, 2018, the Company entered into agreements with Starboard Value LP ("Starboard"), which owned approximately 3.0% of the Company’s outstanding shares, Scopia Capital Management LP ("Scopia"), which owned approximately 8.3%, to reimburse Starboard and Scopia for their reasonable, documented out-of-pocket fees and expenses incurred in connection with their involvement at the Company, including, but not limited to the negotiation and the execution of their respective stockholder agreements with the Company, provided that such reimbursement will not exceed $200,000 in the aggregate for either Starboard or Scopia. In April 2018, the Company reimbursed Starboard in the amount of $188,000.
11
Forest City Realty Trust, Inc. and Subsidiaries
Notes to Consolidated Financial Statements
(Unaudited)
Accumulated Other Comprehensive Loss
Accumulated other comprehensive loss consists of unrealized losses on interest rate swaps accounted for as cash flow hedges (including unrealized losses on interest rate swaps accounted for as hedges held by certain of the Company’s equity method investees), net of noncontrolling interest. Accumulated other comprehensive loss was $6,143,000 and $8,563,000 at March 31, 2018 and December 31, 2017, respectively. See Note G – Derivative Instruments and Hedging Activities for detailed information on gains and losses recognized in and reclassified from accumulated other comprehensive loss.
Organizational Transformation and Termination Benefits
The following table summarizes the components of organizational transformation and termination benefits and are reported in the Corporate Segment:
Three Months Ended March 31, | ||||||
2018 | 2017 | |||||
(in thousands) | ||||||
Termination benefits | $ | 4,647 | $ | 4,152 | ||
Strategic alternative costs | 11,303 | — | ||||
Shareholder activism costs | — | 373 | ||||
Total | $ | 15,950 | $ | 4,525 | ||
For the periods presented, the Company experienced workplace reductions and recorded the associated termination benefits expenses (outplacement and severance payments based on years of service and other defined criteria) for each occurrence. The Company records a severance liability during the period in which costs are estimable and notification has been communicated to affected employees.
Strategic alternative costs consist primarily of professional fees (legal and investment banking advisors) incurred related to the Company’s Board of Directors’ process to consider a broad range of alternatives to enhance stockholder value, including, but not limited to, an accelerated and enhanced operating plan, structural alternatives for the Company’s assets, and potential merger, acquisition or sale transactions.
Shareholder activism costs are comprised of advisory, legal and other professional fees associated with activism matters.
The following table summarizes the activity in the accrued severance balance for termination benefits:
Three Months Ended March 31, | ||||||
2018 | 2017 | |||||
(in thousands) | ||||||
Accrued severance benefits, beginning balance | $ | 13,974 | $ | 9,969 | ||
Termination benefits expense | 4,647 | 4,152 | ||||
Payments | (7,277 | ) | (5,063 | ) | ||
Accrued severance benefits, ending balance | $ | 11,344 | $ | 9,058 | ||
12
Forest City Realty Trust, Inc. and Subsidiaries
Notes to Consolidated Financial Statements
(Unaudited)
Supplemental Non-Cash Disclosures
The following table summarizes the impact to the applicable balance sheet line items as a result of various non-cash transactions. Non-cash transactions primarily include dispositions of operating properties whereby the nonrecourse mortgage debt is assumed by the buyer or otherwise extinguished at closing, exchanges of 2006 Units or senior notes for Class A common stock, changes in consolidation methods of fully consolidated properties due to the occurrence of triggering events including, but not limited to, disposition of a partial interest in rental properties or change in control transactions, change in construction payables and other capital expenditures, notes receivable from the sale of rental properties and capitalization of stock-based compensation granted to employees directly involved with the development and construction of real estate.
Three Months Ended March 31, | ||||||
2018 | 2017 | |||||
(in thousands) | ||||||
Non-cash changes to balance sheet - Investing Activities | ||||||
Projects under construction and development | $ | 1,698 | $ | 7,513 | ||
Completed rental properties | (416,023 | ) | (60,956 | ) | ||
Notes receivable | 51,929 | 2,000 | ||||
Investments in and advances to affiliates - due to dispositions or change in control | 174,814 | (2,890 | ) | |||
Investments in and advances to affiliates - other activity | 3,329 | 166 | ||||
Total non-cash effect on investing activities | $ | (184,253 | ) | $ | (54,167 | ) |
Non-cash changes to balance sheet - Financing Activities | ||||||
Nonrecourse mortgage debt and notes payable, net | $ | (135,123 | ) | $ | (46,907 | ) |
Convertible senior debt, net | (11 | ) | — | |||
Class A common stock | — | 1 | ||||
Additional paid-in capital | 966 | 9,779 | ||||
Noncontrolling interest | (133,286 | ) | (7,456 | ) | ||
Total non-cash effect on financing activities | $ | (267,454 | ) | $ | (44,583 | ) |
B. Notes Receivable
The following table summarizes the Company’s interest bearing notes receivable:
March 31, 2018 | December 31, 2017 | Maturity Date | Weighted Average Interest Rate | |||||
(in thousands) | ||||||||
Stapleton advances | $ | 135,318 | $ | 128,676 | Various | 8.53% | ||
The Nets sale | 125,100 | 125,100 | January 2021 | 4.50% | ||||
Barclays Center sale | 92,600 | 92,600 | January 2019 | 4.50% | ||||
QIC (Regional Mall dispositions) | 88,864 | 36,935 | April 2019 | 4.25% | ||||
Other | 17,187 | 15,474 | Various | 4.84% | ||||
Total | $ | 459,069 | $ | 398,785 | ||||
On April 2, 2018, the Company completed the sale of Westchester’s Ridge Hill, a regional mall in Yonkers, New York, to Queensland Investment Company (“QIC”). In connection with the sale, the Company provided $61,136,000 in seller financing. Including the 2018 and 2017 QIC seller financings summarized in the above table, the total QIC note receivable amounts to $150,000,000, subsequent to the Westchester’s Ridge Hill sale.
In April 2018, the owners of the Brooklyn Nets closed on a partial sale of interest in the Nets. In accordance with the Promissory Note governing the Company’s Nets note receivable, the note receivable, including unpaid accrued interest, was repaid in full on April 11, 2018.
13
Forest City Realty Trust, Inc. and Subsidiaries
Notes to Consolidated Financial Statements
(Unaudited)
C. Nonrecourse Mortgage Debt and Notes Payable, Net
The following table summarizes the nonrecourse mortgage debt and notes payable, net maturities as of March 31, 2018:
Years Ending December 31, | |||
(in thousands) | |||
2018 | $ | 381,036 | |
2019 | 361,443 | ||
2020 | 244,138 | ||
2021 | 195,012 | ||
2022 | 205,260 | ||
Thereafter | 1,612,550 | ||
2,999,439 | |||
Net unamortized mortgage procurement costs | (32,241 | ) | |
Total | $ | 2,967,198 | |
D. Revolving Credit Facility
The Company’s Revolving Credit Agreement provides for total available borrowings of $600,000,000 and contains an accordion provision, subject to bank approval, allowing the Company to increase total available borrowings to $750,000,000 (“Revolving Credit Facility”).
The Revolving Credit Facility matures in November 2019, and provides for two six-month extension periods, subject to certain conditions. Borrowings bear interest at the Company’s option at either London Interbank Offered Rate (“LIBOR”) (1.88% at March 31, 2018) plus a margin of 1.15% - 1.85% (1.20% at March 31, 2018) or the Prime Rate (4.75% at March 31, 2018) plus a margin of 0.15% - 0.85% (0.20% at March 31, 2018). In addition, the Revolving Credit Facility is subject to an annual facility fee of 0.20% - 0.35% (0.20% at March 31, 2018) of total available borrowings. Up to $150,000,000 of the available borrowings can be used for letters of credit. The applicable margins and annual facility fee are based on the Company’s total leverage ratio (adjusted quarterly, if applicable).
The Revolving Credit Facility has restrictive covenants, including a prohibition on certain types of dispositions, mergers, consolidations, and limitations on lines of business the Company is allowed to conduct. Additionally, the Revolving Credit Facility contains financial covenants, including the maintenance of a maximum total leverage ratio, maximum secured and unsecured leverage ratios, maximum secured recourse leverage ratio, a minimum fixed charge coverage ratio, and a minimum unencumbered interest coverage ratio (all as specified in the Revolving Credit Agreement). At March 31, 2018, the Company was in compliance with all of these financial covenants.
The following table summarizes available credit on the Revolving Credit Facility:
March 31, 2018 | December 31, 2017 | |||||
(in thousands) | ||||||
Total available borrowings | $ | 600,000 | $ | 600,000 | ||
Less: | ||||||
Outstanding borrowings | — | — | ||||
Outstanding letters of credit | (23,136 | ) | (36,439 | ) | ||
Available credit | $ | 576,864 | $ | 563,561 | ||
As of March 31, 2018 and December 31, 2017, unamortized debt issuance costs related to the Revolving Credit Facility of $1,558,000 and $1,798,000, respectively, are included in other assets on the Consolidated Balance Sheets.
14
Forest City Realty Trust, Inc. and Subsidiaries
Notes to Consolidated Financial Statements
(Unaudited)
E. Term Loan, Net
The Company’s Term Loan Credit Agreement provides a $335,000,000 senior unsecured term loan credit facility (“Term Loan”).
The Term Loan matures in May 2021 and bears interest at the Company’s option at either LIBOR (based on the approximate date of the initial borrowings and adjusted monthly thereafter) (1.66% at March 31, 2018) plus a margin of 1.30% - 2.20% (1.35% at March 31, 2018) or the Prime Rate plus a margin of 0.30% - 1.20% (0.35% at March 31, 2018). The applicable margins are based on the Company’s total leverage ratio. Upon the Company obtaining an investment grade credit rating, established by certain debt rating agencies for the Company’s long term, senior, unsecured non-credit enhanced debt (the “Debt Ratings”), the applicable margin will, at the Company’s election, be based on the Company’s then-current Debt Ratings.
The Term Loan contains identical financial covenants as the Revolving Credit Facility as described in Note D – Revolving Credit Facility. Additionally, the Term Loan contains customary events of default provisions, including failure to pay indebtedness, breaches of covenants and bankruptcy or other insolvency events, which could result in the acceleration of all amounts and cancellation of all commitments outstanding under the Term Loan, as well as customary representations and warranties and affirmative and negative covenants.
The following table summarizes outstanding borrowings of the Term Loan, net:
March 31, 2018 | December 31, 2017 | |||||
(in thousands) | ||||||
Total outstanding borrowings | $ | 335,000 | $ | 335,000 | ||
Net unamortized debt procurement costs | (1,232 | ) | (1,332 | ) | ||
Total | $ | 333,768 | $ | 333,668 | ||
F. Convertible Senior Debt, Net
The following table summarizes the convertible senior debt, net:
March 31, 2018 | December 31, 2017 | |||||
(in thousands) | ||||||
4.250% Notes due 2018 | $ | 73,208 | $ | 73,215 | ||
3.625% Notes due 2020 | 40,017 | 40,021 | ||||
113,225 | 113,236 | |||||
Net unamortized debt procurement costs | (484 | ) | (599 | ) | ||
Total | $ | 112,741 | $ | 112,637 | ||
All of the senior debt are unsecured senior obligations and rank equally with all existing and future unsecured indebtedness; however, they are effectively subordinated to all existing and future secured indebtedness and other liabilities of the Company’s subsidiaries to the extent of the value of the collateral securing that other debt.
15
Forest City Realty Trust, Inc. and Subsidiaries
Notes to Consolidated Financial Statements
(Unaudited)
G. Derivative Instruments and Hedging Activities
Risk Management Objective of Using Derivatives
The Company maintains an overall interest rate risk management strategy using derivative instruments to minimize significant unplanned impact on earnings and cash flows caused by interest rate volatility. The strategy uses interest rate swaps and caps having indices related to the pricing of specific liabilities. The Company enters into interest rate swaps to convert floating-rate debt to fixed-rate long-term debt, and vice-versa, depending on market conditions. Interest rate swaps are generally for periods of one to ten years. Interest rate caps are generally for periods of one to three years. The use of interest rate caps is consistent with the Company’s risk management objective to reduce or eliminate exposure to variability in future cash flows primarily attributable to increases in interest rates on its floating-rate debt.
Cash Flow Hedges of Interest Rate Risk
The Company’s objectives in using interest rate derivatives are to add stability to interest expense and to manage exposure to interest rate movements. The Company primarily uses interest rate caps and swaps as part of its interest rate risk management strategy. Interest rate caps designated as cash flow hedges involve the receipt of variable-rate amounts from a counterparty if interest rates rise above the strike rate on the contract in exchange for an upfront premium. Interest rate swaps designated as cash flow hedges involve the receipt of variable-rate amounts from a counterparty in exchange for the Company making fixed-rate payments over the life of the agreements without exchange of the underlying notional amount.
Changes in the fair value of derivatives designated and qualifying as cash flow hedges is recorded in accumulated OCI and is subsequently reclassified into earnings during the period the hedged forecasted transaction affects earnings. As of March 31, 2018, the Company expects it will reclassify amounts recorded in accumulated OCI into earnings as an increase in interest expense of approximately $2,703,000 within the next twelve months. However, the actual amount reclassified could vary due to future changes in the fair value of these derivatives.
Fair Value Hedges of Interest Rate Risk
The Company enters into total rate of return swaps (“TROR”) on various tax-exempt fixed-rate borrowings. The TROR convert borrowings from a fixed rate to a variable rate. The TROR requires the payment of a variable interest rate, generally equivalent to the Securities Industry and Financial Markets Association (“SIFMA”) rate (1.58% at March 31, 2018) plus a spread. Additionally, the Company has guaranteed the fair value of the underlying borrowings. Fluctuation in the value of the TROR is offset by the fluctuation in the value of the underlying borrowings, resulting in minimal financial impact. At March 31, 2018, the aggregate notional amount of TROR designated as fair value hedging instruments is $597,166,000. The underlying TROR borrowings are subject to a fair value adjustment.
The following amounts were recored on the Consolidated Balance Sheets in nonrecourse mortgage debt and notes payable, net related to the hedged borrowings in fair value hedges:
March 31, 2018 | December 31, 2017 | |||||
(in thousands) | ||||||
Carrying amount of underlying borrowings | $ | 597,166 | $ | 605,036 | ||
Cumulative fair value adjustments to underlying borrowings | (1,241 | ) | 3,210 | |||
Fair value of underlying borrowings | $ | 595,925 | $ | 608,246 | ||
16
Forest City Realty Trust, Inc. and Subsidiaries
Notes to Consolidated Financial Statements
(Unaudited)
Nondesignated Hedges of Interest Rate Risk
The Company uses derivative contracts to hedge certain interest rate risk, even though the contracts do not qualify for, or the Company has elected not to apply, hedge accounting. In these situations, the derivative is recorded at its fair value with changes reflected in earnings.
The Company has certain undesignated TROR where the associated debt is held by an unconsolidated affiliate or unrelated third parties. The change in fair value of these TROR is recognized in earnings. At March 31, 2018, the aggregate notional amount of these TROR is $180,461,000.
In instances where the Company enters into separate derivative instruments effectively hedging the same debt for consecutive annual periods, the duplicate amount of notional is excluded from the following disclosure in an effort to provide information that enables the financial statement user to understand the Company’s volume of derivative activity.
The following table summarizes the fair values and location in the Consolidated Balance Sheets of all derivative instruments:
Fair Value of Derivative Instruments | |||||||||||||
Asset Derivatives (included in Other Assets) | Liability Derivatives (included in Accounts Payable, Accrued Expenses and Other Liabilities) | ||||||||||||
Current Notional | Fair Value | Current Notional | Fair Value | ||||||||||
(in thousands) | |||||||||||||
March 31, 2018 | |||||||||||||
Derivatives Designated as Hedging Instruments | |||||||||||||
Interest rate swaps | $ | 63,153 | $ | 1,656 | $ | 33,906 | $ | 301 | |||||
TROR | 281,151 | 1,328 | 316,015 | 2,569 | |||||||||
Total | $ | 344,304 | $ | 2,984 | $ | 349,921 | $ | 2,870 | |||||
Derivatives Not Designated as Hedging Instruments | |||||||||||||
Interest rate caps | $ | 69,518 | $ | — | $ | — | $ | — | |||||
TROR | 89,209 | 2,677 | 91,252 | 9,793 | |||||||||
Total | $ | 158,727 | $ | 2,677 | $ | 91,252 | $ | 9,793 | |||||
December 31, 2017 | |||||||||||||
Derivatives Designated as Hedging Instruments | |||||||||||||
Interest rate swaps | $ | 63,372 | $ | 1,129 | $ | 34,078 | $ | 863 | |||||
TROR | 369,021 | 3,862 | 236,015 | 652 | |||||||||
Total | $ | 432,393 | $ | 4,991 | $ | 270,093 | $ | 1,515 | |||||
Derivatives Not Designated as Hedging Instruments | |||||||||||||
Interest rate caps | $ | 69,518 | $ | — | $ | — | $ | — | |||||
TROR | 100,466 | 4,107 | 36,280 | 11,330 | |||||||||
Total | $ | 169,984 | $ | 4,107 | $ | 36,280 | $ | 11,330 | |||||
The following table summarizes the impact of gains and losses related to derivative instruments designated as cash flow hedges on accumulated other comprehensive income:
Three Months Ended March 31, | ||||||
2018 | 2017 | |||||
(in thousands) | ||||||
Gain on interest rate contracts recognized in Accumulated OCI | $ | 1,216 | $ | 241 | ||
Loss on interest rate contracts reclassified from Accumulated OCI to the Statements of Operations | ||||||
Interest expense | $ | (581 | ) | $ | (763 | ) |
Earnings (loss) from unconsolidated entities | (507 | ) | (709 | ) | ||
$ | (1,088 | ) | $ | (1,472 | ) | |
17
Forest City Realty Trust, Inc. and Subsidiaries
Notes to Consolidated Financial Statements
(Unaudited)
The following table summarizes the impact of gains and losses related to cash flow and fair value hedging relationships in the Consolidated Statements of Operations:
Three Months Ended March 31, | |||||||
Location on Consolidated Statements of Operations | 2018 | 2017 | |||||
Cash Flow Hedging Relationships | (in thousands) | ||||||
Loss on interest rate contracts reclassified from Accumulated OCI | Interest expense | $ | (581 | ) | $ | (763 | ) |
Fair Value Hedging Relationships | |||||||
Gain (loss) on TROR | Interest expense | $ | (4,451 | ) | $ | 5,351 | |
Gain (loss) on underlying borrowings | Interest expense | 4,451 | (5,351 | ) | |||
Total Fair Value Hedging Relationships | $ | — | $ | — | |||
The following table summarizes the impact of gains and losses related to derivative instruments not designated as cash flow hedges or fair value hedges in the Consolidated Statements of Operations:
Net Gain (Loss) Recognized | |||||||
Three Months Ended March 31, | |||||||
Location on Consolidated Statements of Operations | 2018 | 2017 | |||||
Derivatives Not Designated as Hedging Instruments | (in thousands) | ||||||
Interest rate caps and interest rate swaps | Interest expense | $ | — | $ | (107 | ) | |
TROR | Interest expense | 1,224 | 1,498 | ||||
Total | $ | 1,224 | $ | 1,391 | |||
Credit-risk-related Contingent Features
The principal credit risk of the Company’s interest rate risk management strategy is the potential inability of a counterparty to cover its obligations. If a counterparty fails to fulfill its obligation, the risk of loss approximates the fair value of the derivative. To mitigate this exposure, the Company generally purchases derivative financial instruments from the financial institution that issues the related debt, from financial institutions with which the Company has other lending relationships, or from financial institutions with a minimum credit rating of BBB+, at the time of the transaction.
Agreements with derivative counterparties contain provisions under which the counterparty could terminate the derivative obligations if the Company defaults on its obligations under the Revolving Credit Agreement and designated conditions are fulfilled. In instances where the Company’s subsidiaries have derivative obligations secured by a mortgage, the derivative obligations could be terminated if the indebtedness between the two parties is terminated, either by loan payoff or default of the indebtedness. In addition, certain subsidiaries have agreements containing provisions whereby the subsidiaries must maintain certain minimum financial ratios. As of March 31, 2018, the Company does not have any derivative contracts containing credit-risk related contingent features, such as a credit rating downgrade, that may trigger collateral to be posted with a counterparty.
H. Fair Value Measurements
Fair Value Measurements on a Recurring Basis
The Company’s financial assets consist of interest rate caps, interest rate swaps and TROR with positive fair values included in other assets. The Company’s financial liabilities consist of interest rate swaps and TROR with negative fair values included in accounts payable, accrued expenses and other liabilities and borrowings subject to TROR included in nonrecourse mortgage debt and notes payable, net.
18
Forest City Realty Trust, Inc. and Subsidiaries
Notes to Consolidated Financial Statements
(Unaudited)
The following table summarizes information about financial assets and liabilities measured at fair value on a recurring basis, and indicates the fair value hierarchy of the valuation techniques utilized to determine such fair value:
March 31, 2018 | ||||||||||||
Level 1 | Level 2 | Level 3 | Total | |||||||||
(in thousands) | ||||||||||||
Interest rate swaps (assets) | $ | — | $ | 1,656 | $ | — | $ | 1,656 | ||||
Interest rate swaps (liabilities) | — | (301 | ) | — | (301 | ) | ||||||
TROR (assets) | — | — | 4,005 | 4,005 | ||||||||
TROR (liabilities) | — | — | (12,362 | ) | (12,362 | ) | ||||||
Fair value adjustment to the borrowings subject to TROR | — | — | 1,241 | 1,241 | ||||||||
Total | $ | — | $ | 1,355 | $ | (7,116 | ) | $ | (5,761 | ) | ||
December 31, 2017 | ||||||||||||
(in thousands) | ||||||||||||
Interest rate swaps (assets) | $ | — | $ | 1,129 | $ | — | $ | 1,129 | ||||
Interest rate swaps (liabilities) | — | (863 | ) | — | (863 | ) | ||||||
TROR (assets) | — | — | 7,969 | 7,969 | ||||||||
TROR (liabilities) | — | — | (11,982 | ) | (11,982 | ) | ||||||
Fair value adjustment to the borrowings subject to TROR | — | — | (3,210 | ) | (3,210 | ) | ||||||
Total | $ | — | $ | 266 | $ | (7,223 | ) | $ | (6,957 | ) | ||
The following table presents a reconciliation of financial assets and liabilities measured at fair value on a recurring basis using significant unobservable inputs (Level 3):
Net TROR | Fair value adjustment to the borrowings subject to TROR | Total | |||||||
(in thousands) | |||||||||
Three Months Ended March 31, 2018 | |||||||||
Balance, January 1, 2018 | $ | (4,013 | ) | $ | (3,210 | ) | $ | (7,223 | ) |
Total realized and unrealized gains (losses): | |||||||||
Included in earnings | |||||||||
Fair market value adjustment | (2,324 | ) | 3,548 | 1,224 | |||||
Settlement of TROR designated as fair value hedge | (903 | ) | 903 | — | |||||
Settlement of TROR not designated as a fair value hedge | (1,117 | ) | — | (1,117 | ) | ||||
Balance, March 31, 2018 | $ | (8,357 | ) | $ | 1,241 | $ | (7,116 | ) | |
Three Months Ended March 31, 2017 | |||||||||
Balance, January 1, 2017 | $ | (15,573 | ) | $ | 7,434 | $ | (8,139 | ) | |
Total realized and unrealized gains (losses): | |||||||||
Included in earnings | |||||||||
Fair market value adjustment | 6,849 | (5,351 | ) | 1,498 | |||||
Balance, March 31, 2017 | $ | (8,724 | ) | $ | 2,083 | $ | (6,641 | ) | |
The following table presents quantitative information about the significant unobservable inputs used to estimate the fair value of financial instruments measured on a recurring basis as of March 31, 2018:
Quantitative Information about Level 3 Fair Value Measurements | ||||||
Fair Value March 31, 2018 | Valuation Technique | Unobservable Input | Input Values | |||
(in thousands) | ||||||
TROR | $ | (8,357 | ) | Third party bond pricing | Bond valuation | 93.73 - 109.14 |
Fair value adjustment to the borrowings subject to TROR | $ | 1,241 | Third party bond pricing | Bond valuation | 93.73 - 101.00 | |
Third party service providers involved in fair value measurements are evaluated for competency and qualifications. Fair value measurements, including unobservable inputs, are evaluated based on current transactions and experience in the real estate and capital markets.
19
Forest City Realty Trust, Inc. and Subsidiaries
Notes to Consolidated Financial Statements
(Unaudited)
The impact of changes in unobservable inputs used to determine the fair market value of the credit valuation adjustment, TROR and fair value adjustment to the borrowings subject to TROR are not deemed to be significant.
Fair Value of Other Financial Instruments
The carrying amount of accounts receivable and accounts payable, accrued expenses and other liabilities approximates fair value based upon the short-term nature of the instruments. The carrying amount of notes receivable approximates fair value since the interest rates on these notes approximates current market rates for similar instruments when considering the risk profile and quality of the collateral, if applicable. The Company estimates the fair value of its debt instruments by discounting future cash payments at interest rates the Company believes approximate the current market. Estimated fair value is based upon market prices of public debt, available industry financing data, current treasury rates, recent financing transactions, conversion features on convertible senior debt and loan to value ratios. The fair value of the Company’s debt instruments is classified as Level 3 in the fair value hierarchy.
The following table summarizes the fair value of nonrecourse mortgage debt and notes payable, net (exclusive of the fair value of derivatives), term loan, net and convertible senior debt, net:
March 31, 2018 | December 31, 2017 | ||||||||||||
Carrying Value | Fair Value | Carrying Value | Fair Value | ||||||||||
(in thousands) | |||||||||||||
Nonrecourse mortgage debt and notes payable, net | $ | 2,967,198 | $ | 2,948,720 | $ | 2,998,361 | $ | 2,995,559 | |||||
Term loan, net | 333,768 | 333,857 | 333,668 | 333,726 | |||||||||
Convertible senior debt, net | 112,741 | 113,525 | 112,637 | 130,942 | |||||||||
Total | $ | 3,413,707 | $ | 3,396,102 | $ | 3,444,666 | $ | 3,460,227 | |||||
I. Capital Stock
Share Repurchase Authorization
On March 22, 2018, the Board approved an increase in the Company's existing $100,000,000 share repurchase program to an aggregate total of $400,000,000. The shares may be repurchased, in light of prevailing market and economic conditions, to take advantage of investment opportunities at times when the Board and Company management believe the market price of the common stock does not accurately reflect the underlying value of the Company.
Reclassification Agreement
Pursuant to the Reclassification Agreement, the Board submitted a proposal for stockholder approval to eliminate the dual-class share structure at the Company’s 2017 Annual Meeting of Stockholders. This proposal was approved by the stockholders at the Company’s Annual Meeting of Stockholders on June 9, 2017 and became effective following the market close on June 12, 2017. As a result, each of the 18,788,163 shares of Class B common stock issued and outstanding immediately prior to the Effective Time were reclassified into 1.31 shares of Class A common stock. As such, 24,612,495 additional shares of Class A common stock were issued to the prior Class B common stockholders. Upon completion of this transaction, all outstanding shares of common stock are entitled to one vote per share on all matters brought to the Company’s stockholders, including but not limited to, the election of the entire Board of Directors.
During the three months ended March 31, 2017, certain professional and consulting fees, including investment banking success fees, incurred directly related to the stock conversion were recorded as a $604,000 reduction to additional paid-in capital, in accordance with applicable accounting requirements when raising permanent equity. Amounts include costs paid on behalf of RMS in accordance with the Reimbursement Agreement. See the “Other Related Party Transactions” section of Note A – Accounting Policies for detailed information on the Reimbursement Agreement.
20
Forest City Realty Trust, Inc. and Subsidiaries
Notes to Consolidated Financial Statements
(Unaudited)
J. Dividends
The following table summarizes the quarterly cash dividends declared by the Board of Directors on the Company’s common stock (in thousands, except per share data):
Date Declared | Record Date | Payment Date | Amount Per Share | Total Cash Payment | ||||
2018 | ||||||||
February 22, 2018 | March 5, 2018 | March 16, 2018 | $ | 0.18 | $ | 48,012 | ||
2017 | ||||||||
November 29, 2017 | December 20, 2017 | December 29, 2017 | $ | 0.14 | $ | 37,344 | ||
August 22, 2017 | September 5, 2017 | September 18, 2017 | 0.14 | 37,343 | ||||
May 17, 2017 | June 9, 2017 | June 23, 2017 | 0.09 | 23,482 | ||||
March 1, 2017 | March 13, 2017 | March 27, 2017 | 0.09 | 23,441 | ||||
Total | $ | 0.46 | $ | 121,610 | ||||
K. Stock-Based Compensation
During the three months ended March 31, 2018, the Company granted 632,869 shares of restricted stock and 217,548 performance shares under the Company’s 1994 Stock Plan. The restricted stock had a fair value of $20.89 per share, based on the closing price of the Class A common stock on the date of grant. The performance shares had a grant-date fair value of $17.44 per share, which was computed using a Monte Carlo simulation.
At March 31, 2018, $19,231,000 of unrecognized compensation cost related to restricted stock is expected to be recognized over a weighted-average period of 28 months and $8,756,000 of unrecognized compensation cost related to performance shares is expected to be recognized over a weighted-average period of 27 months.
The following table summarizes stock-based compensation costs recognized in the financial statements:
Three Months Ended March 31, | ||||||
2018 | 2017 | |||||
(in thousands) | ||||||
Stock option costs | $ | 84 | $ | 200 | ||
Restricted stock costs | 4,037 | 5,138 | ||||
Performance share costs | 1,098 | 2,018 | ||||
Total stock-based compensation costs | 5,219 | 7,356 | ||||
Less amount capitalized into qualifying real estate projects | (955 | ) | (2,492 | ) | ||
Amount charged to operating expenses | 4,264 | 4,864 | ||||
Depreciation expense on capitalized stock-based compensation | 341 | 215 | ||||
Total stock-based compensation expense | $ | 4,605 | $ | 5,079 | ||
The amount of grant-date fair value expensed immediately for awards granted to retirement-eligible grantees during the three months ended March 31, 2018 and 2017 was $322,000 and $867,000, respectively.
In connection with the vesting of restricted stock and performance shares during the three months ended March 31, 2018 and 2017, the Company repurchased 291,447 shares and 157,304 shares, respectively, of Class A common stock to satisfy the employees’ related minimum statutory tax withholding requirements. Shares repurchased during the three months ended March 31, 2018 and 2017 were returned to unissued shares with an aggregate cost basis of $6,047,000 and $3,436,000, respectively.
21
Forest City Realty Trust, Inc. and Subsidiaries
Notes to Consolidated Financial Statements
(Unaudited)
L. Write-Offs of Abandoned Development Projects and Demolition Costs
The Company reviews each project under development to determine whether it is probable the project will be developed. If management determines the project will not be developed, its project costs and other related project exit costs are written off as an abandoned development project cost. The Company abandons projects under development for a number of reasons, including, but not limited to, changes in local market conditions, increases in construction or financing costs or third party challenges related to entitlements or public financing. The Company recorded no write-offs of abandoned development projects and demolition costs during the three months ended March 31, 2018 and 2017, respectively.
The Company incurred $6,218,000 and $351,000 as write-offs of abandoned development projects and demolition costs of unconsolidated entities during the three months ended March 31, 2018 and 2017, respectively, which is included in equity in earnings.
M. Impairment of Real Estate and Impairment of Unconsolidated Entities
Impairment of Real Estate
The Company reviews its real estate for impairment whenever events or changes indicate its carrying value may not be recoverable. In determining whether the carrying costs are recoverable from estimated future undiscounted cash flows, the Company uses various assumptions including future estimated net operating income, estimated holding periods, risk of foreclosure and estimated cash proceeds upon the disposition of the asset. If the carrying costs are not recoverable, the Company records an impairment charge to reduce the carrying value to estimated fair value. The assumptions used to estimate fair value, which are based on current information, are Level 2 or 3 inputs. If the conditions deteriorate or if plans regarding the assets change, additional impairment charges may occur in future periods. There were no impairments of real estate recorded during the three months ended March 31, 2018 or 2017.
Impairment of Unconsolidated Entities
The Company reviews its portfolio of unconsolidated entities for other-than-temporary impairments whenever events or changes indicate its carrying value in the investments may be in excess of fair value. An equity method investment’s value is impaired if management’s estimate of its fair value is less than the carrying value and the difference is deemed to be other-than-temporary. In estimating fair value, assumptions that may be used include comparable sale prices, market discount rates, market capitalization rates and estimated future discounted cash flows specific to the geographic region and property type, all of which are considered Level 3 inputs. For recently opened properties, assumptions also include the timing of initial property lease up. In the event initial property lease up assumptions differ from actual results, estimated future discounted cash flows may vary, resulting in impairment charges in future periods. There were no impairments of unconsolidated entities recorded during the three months ended March 31, 2018 or 2017.
N. Gain on Change in Control of Interests
In January 2018, our 50% noncontrolling partner at Bayside Village, an apartment community in San Francisco, CA, closed on a transaction where they sold the majority of their 50% ownership interest to an unrelated third party. Prior to this transaction, the Company fully consolidated the property, as the outside partner, in accordance with the partnership agreement, lacked any substantive participating rights. Simultaneously with the sale, the Company amended the partnership agreement to grant substantive participating rights to the new outside partner and received a cash payment of $24,000,000 in connection with such amendment. The joint venture is adequately capitalized and does not contain the characteristics of a VIE. Based on the substantive participating rights held by the new outside partner, the Company concluded it appropriate to deconsolidate the entity and account for the Company’s 50% investment in the property using the equity method of accounting. The Company remeasured its equity interest in the property, as required by the accounting guidance, at fair value (based upon the income approach using current rents and market discount rates). As a result of the deconsolidation and the current estimated fair value, the Company removed approximately $415,000,000 of real estate, net, $127,000,000 of nonrecourse mortgage debt, net, $133,090,000 of noncontrolling interest from the Consolidated Balance Sheet, increased investments in and advances to unconsolidated entities by approximately $227,000,000 and recorded $117,711,000 as a gain on change in control of interests in the Consolidated Statement of Operations for the three months ended March 31, 2018.
O. Loss on Extinguishment of Debt
For the three months ended March 31, 2018 and 2017, the Company recorded $2,388,000 and $2,843,000, respectively, as loss on extinguishment of debt. The amount for 2018 is related to a loss on extinguishment of nonrecourse mortgage debt in connection with a debt refinancing at Pavilion, an apartment building in Chicago, Illinois. The amount for 2017 primarily relates to a loss on extinguishment of nonrecourse mortgage debt at Illinois Science and Technology Park, office buildings in Skokie, Illinois that were sold during the quarter.
22
Forest City Realty Trust, Inc. and Subsidiaries
Notes to Consolidated Financial Statements
(Unaudited)
P. Net Gain on Disposition of Interest in Unconsolidated Entities
The following table summarizes the net gain on disposition of interest in unconsolidated entities which are included in earnings (loss) from unconsolidated entities:
Three Months Ended March 31, | |||||||
2018 | 2017 | ||||||
(in thousands) | |||||||
Regional Malls - QIC | Various | $ | 74,838 | $ | — | ||
Federally assisted housing apartment | 121 | 9,349 | |||||
Shops at Bruckner Boulevard (Specialty Retail Center) | Bronx, New York | — | 8,183 | ||||
Other | — | 169 | |||||
$ | 74,959 | $ | 17,701 | ||||
During the three months ended March 31, 2018, the Company completed the sale of Antelope Valley Mall, Mall at Robinson, Shops at Wiregrass and Victoria Gardens - Bass Pro Shops under our signed definitive agreement with QIC. The dispositions generated net cash proceeds of approximately $74,203,000 and a note receivable of $51,929,000, which matures in 2019.
On April 2, 2018, the Company completed the sale of Westchester’s Ridge Hill to QIC. This disposition generated net cash proceeds of approximately $10,468,000 and note receivable of $61,136,000.
During the three months ended March 31, 2018, the Company completed the sale of one unconsolidated federally assisted housing (“FAH”) apartment community. The disposition resulted in net cash proceeds of $43,000. During the three months ended March 31, 2017, the Company completed the sale of six unconsolidated FAH apartment communities. These dispositions resulted in net cash proceeds of $18,122,000.
During the three months ended March 31, 2017, the Company sold its ownership interest in Shops at Bruckner Boulevard, an unconsolidated specialty retail center in Bronx, New York. The sale generated net cash proceeds of $8,863,000 at the Company’s ownership share.
Q. Income Taxes
Beginning for its taxable year ended December 31, 2016, the Company filed its U.S. federal tax return as a REIT and the Company’s TRSs filed as C corporations. The Company files individual separate income tax returns in various states.
As a REIT, the Company is required to annually distribute to its stockholders an amount equal to at least 90% of its REIT taxable income (computed without regard to the dividends paid deduction and net capital gain and net of any available net operating losses). The Company may be subject to certain state gross income and franchise taxes, as well as taxes on any undistributed income and federal and state corporate taxes on any income earned by its TRSs. In addition, the Company could be subject to corporate income taxes related to assets held by the REIT which are sold during the five year period following the date of conversion (ending December 31, 2020), to the extent such sold assets had a built-in gain on the date of conversion.
Income tax expense was $1,409,000 and $51,000 for the three months ended March 31, 2018 and 2017, respectively. The Company did not recognize any federal corporate income tax on its earnings in the REIT for any of the periods presented.
At December 31, 2017, the TRS had a federal net operating loss carryforward for tax purposes of $106,505,000 available to use on their tax returns expiring in the years ending December 31, 2028 through 2037. At December 31, 2017, the Company had a federal net operating loss carryforward of $76,176,000 available to use on its REIT tax return expiring in the years ending December 31, 2034 through 2036.
23
Forest City Realty Trust, Inc. and Subsidiaries
Notes to Consolidated Financial Statements
(Unaudited)
R. Net Gain (Loss) on Disposition of Full or Partial Interest in Rental Properties, Net of Tax
The following table summarizes the net gain (loss) on disposition of full or partial interest in rental properties, net of tax:
Three Months Ended March 31, | |||||||
2018 | 2017 | ||||||
(in thousands) | |||||||
Apartment: | |||||||
461 Dean Street | Brooklyn, New York | $ | (3,713 | ) | $ | — | |
Office Building: | |||||||
Illinois Science & Technology Park (4 buildings) | Skokie, Illinois | — | 3,771 | ||||
Federally assisted housing apartment | 464 | — | |||||
Other | 845 | 5,532 | |||||
(2,404 | ) | 9,303 | |||||
Income tax effect | (130 | ) | — | ||||
$ | (2,534 | ) | $ | 9,303 | |||
461 Dean Street
During the three months ended March 31, 2018, the Company completed the sale of 461 Dean Street, an apartment community in Brooklyn, New York. The Company received net cash proceeds of $147,193,000.
Illinois Science & Technology Park
During the three months ended March 31, 2017, the Company completed the sale of Illinois Science & Technology Park, comprised of four life science office buildings in Skokie, Illinois. The Company received net cash proceeds of $16,494,000.
S. Earnings Per Share
The Company’s restricted stock is considered a participating security pursuant to the two-class method for computing earnings per share (“EPS”). The 2006 Units, which are reflected as noncontrolling interests in the Consolidated Balance Sheets, are considered convertible participating securities as they are entitled to participate in dividends paid to the Company’s common stockholders. The 2006 Units are included in the computation of basic EPS using the two-class method and are included in the computation of diluted EPS using the if-converted method. The Class A common stock issuable in connection with conversion of the 2018 Senior Notes and 2020 Senior Notes is included in the computation of diluted EPS using the if-converted method.
The reconciliation of the basic and diluted EPS computations is shown in the following table:
Three Months Ended March 31, | ||||||
2018 | 2017 | |||||
Numerators (in thousands) | ||||||
Net earnings attributable to Forest City Realty Trust, Inc. | $ | 199,747 | $ | 40,917 | ||
Distributed and undistributed earnings allocated to participating securities | (1,625 | ) | (374 | ) | ||
Net earnings attributable to common stockholders ‑ Basic | $ | 198,122 | $ | 40,543 | ||
Interest on convertible debt | 1,141 | — | ||||
Net earnings attributable to common stockholders ‑ Diluted | $ | 199,263 | $ | 40,543 | ||
Denominators | ||||||
Weighted average shares outstanding ‑ Basic | 265,440,763 | 258,797,277 | ||||
Effect of stock options and performance shares | 589,985 | 402,992 | ||||
Effect of convertible debt | 5,213,392 | — | ||||
Weighted average shares outstanding ‑ Diluted (1) (2) | 271,244,140 | 259,200,269 | ||||
Earnings Per Share | ||||||
Net earnings attributable to common stockholders ‑ Basic | $ | 0.75 | $ | 0.16 | ||
Net earnings attributable to common stockholders ‑ Diluted | $ | 0.73 | $ | 0.16 | ||
(1) | Incremental shares from restricted stock and convertible securities aggregating 1,901,530 and 7,860,297 for the three months ended March 31, 2018 and 2017, respectively, were not included in the computation of diluted EPS because their effect is anti-dilutive. |
(2) | Weighted-average options, restricted stock and performance shares of 719,716 and 2,167,229 for the three months ended March 31, 2018 and 2017, respectively, were not included in the computation of diluted EPS because their effect is anti-dilutive under the treasury stock method. |
24
Forest City Realty Trust, Inc. and Subsidiaries
Notes to Consolidated Financial Statements
(Unaudited)
T. Segment Information
The following tables summarize financial data for the Company’s reportable operating segments. All amounts are presented in thousands.
March 31, 2018 | December 31, 2017 | ||||||||||||
Identifiable Assets | |||||||||||||
Office | $ | 3,061,692 | $ | 3,025,810 | |||||||||
Apartments | 2,309,164 | 2,246,479 | |||||||||||
Retail | 388,272 | 368,353 | |||||||||||
Total Operations | 5,759,128 | 5,640,642 | |||||||||||
Development | 1,563,728 | 2,020,273 | |||||||||||
Corporate | 636,860 | 402,372 | |||||||||||
$ | 7,959,716 | $ | 8,063,287 | ||||||||||
Three Months Ended March 31, | Three Months Ended March 31, | ||||||||||||
2018 | 2017 | 2018 | 2017 | ||||||||||
Revenues | Operating Expenses | ||||||||||||
Office | $ | 111,472 | $ | 113,539 | $ | 43,790 | $ | 42,776 | |||||
Apartments | 74,270 | 72,098 | 35,964 | 33,904 | |||||||||
Retail | 6,380 | 14,750 | 3,624 | 10,754 | |||||||||
Total Operations | 192,122 | 200,387 | 83,378 | 87,434 | |||||||||
Development | 17,798 | 15,619 | 15,635 | 18,448 | |||||||||
Corporate | — | — | 28,133 | 20,108 | |||||||||
$ | 209,920 | $ | 216,006 | $ | 127,146 | $ | 125,990 | ||||||
Depreciation and Amortization | Capital Expenditures | ||||||||||||
Office | $ | 27,870 | $ | 33,999 | $ | 6,209 | $ | 14,302 | |||||
Apartments | 20,494 | 18,651 | 2,695 | 3,920 | |||||||||
Retail | 782 | 3,065 | 760 | 415 | |||||||||
Total Operations | 49,146 | 55,715 | 9,664 | 18,637 | |||||||||
Development | 5,524 | 7,166 | 57,559 | 78,027 | |||||||||
Corporate | 615 | 674 | 86 | 21 | |||||||||
$ | 55,285 | $ | 63,555 | $ | 67,309 | $ | 96,685 | ||||||
The Company uses Adjusted Earnings Before Interest, Taxes, Depreciation and Amortization ("EBITDA") to manage its business and report its operating results by segment. Adjusted EBITDA, a non-GAAP measure, is defined as net earnings excluding the following items at the Company's ownership: i) non-cash charges for depreciation and amortization; ii) interest expense; iii) amortization of mortgage procurement costs; iv) income taxes; v) impairment of real estate; vi) gains or losses from extinguishment of debt; vii) gains or losses on full or partial disposition of rental properties, development projects and other investments; viii) gains or losses on change in control of interests; and ix) other transactional items, including organizational transformation and termination benefits.
The Company believes that Adjusted EBITDA is an appropriate measure to assess operating performance by segment as it represents ongoing key operating components of each segment without regard to how the business is financed. The Company’s Chief Executive Officer, the chief operating decision maker, uses Adjusted EBITDA, as presented, to assess performance of the Company’s real estate assets by reportable operating segment because it provides information on the financial performance of the core real estate portfolio operations, development, corporate general and administrative expenses and interest and other income derived from the Company's investments. Adjusted EBITDA measures the profitability of each real estate segment in operations based on the process of collecting rent and paying operating expenses and represents the equivalent of Net Operating Income (“NOI”), a non-GAAP measure, as all property level interest expense is reported in the Corporate segment. NOI by operating segment is discussed in the Net Operating Income section of the Management’s Discussion and Analysis of Financial Condition and Results of Operations (“MD&A”) of this Form 10-Q. For the development segment, adjusted EBITDA measures the profitability of our land development sales activity and any recently opened unstabilized properties, offset by development expenses that do not qualify for capitalization. Interest expense is monitored and evaluated by the chief operating decision maker on an overall company-wide basis and is not a factor in evaluating individual segment performance.
25
Forest City Realty Trust, Inc. and Subsidiaries
Notes to Consolidated Financial Statements
(Unaudited)
The reconciliations of net earnings (loss) to Adjusted EBITDA by segment are shown in the following tables. All amounts are presented in thousands.
Three Months Ended March 31, 2018 | Office | Apartments | Retail | Total Operations | Development | Corporate | Total | ||||||||||||||
Net earnings (loss) attributable to Forest City Realty Trust, Inc. | $ | 41,456 | $ | 141,053 | $ | 93,562 | $ | 276,071 | $ | (9,311 | ) | $ | (67,013 | ) | $ | 199,747 | |||||
Depreciation and amortization | 28,556 | 22,889 | 11,923 | 63,368 | 6,438 | 615 | 70,421 | ||||||||||||||
Interest expense | — | — | — | — | — | 43,118 | 43,118 | ||||||||||||||
Amortization of mortgage procurement costs | — | — | — | — | — | 1,637 | 1,637 | ||||||||||||||
Income tax expense | — | — | — | — | — | 1,824 | 1,824 | ||||||||||||||
Loss on extinguishment of debt | — | — | — | — | — | 2,269 | 2,269 | ||||||||||||||
Net (gain) loss on disposition of full or partial interests in rental properties | (94 | ) | (1,214 | ) | — | (1,308 | ) | 3,712 | — | 2,404 | |||||||||||
Gain on disposition of unconsolidated entities | — | (121 | ) | (74,486 | ) | (74,607 | ) | — | — | (74,607 | ) | ||||||||||
Gains on change in control of interests | — | (117,711 | ) | — | (117,711 | ) | — | — | (117,711 | ) | |||||||||||
Organizational transformation and termination benefits | — | — | — | — | — | 15,950 | 15,950 | ||||||||||||||
Adjusted EBITDA attributable to Forest City Realty Trust, Inc. | $ | 69,918 | $ | 44,896 | $ | 30,999 | $ | 145,813 | $ | 839 | $ | (1,600 | ) | $ | 145,052 | ||||||
Three Months Ended March 31, 2017 | Office | Apartments | Retail | Total Operations | Development | Corporate | Total | ||||||||||||||
Net earnings (loss) attributable to Forest City Realty Trust, Inc. | $ | 42,309 | $ | 41,516 | $ | 31,358 | $ | 115,183 | $ | (10,577 | ) | $ | (63,689 | ) | $ | 40,917 | |||||
Depreciation and amortization | 34,862 | 22,491 | 15,850 | 73,203 | 5,174 | 674 | 79,051 | ||||||||||||||
Interest expense | — | — | — | — | — | 47,831 | 47,831 | ||||||||||||||
Amortization of mortgage procurement costs | — | — | — | — | — | 1,832 | 1,832 | ||||||||||||||
Income tax expense | — | — | — | — | — | 51 | 51 | ||||||||||||||
Loss on extinguishment of debt | — | — | — | — | — | 4,466 | 4,466 | ||||||||||||||
Net (gain) loss on disposition of full or partial interests in rental properties | (3,771 | ) | (5,532 | ) | — | (9,303 | ) | — | — | (9,303 | ) | ||||||||||
Gain on disposition of unconsolidated entities | — | (9,518 | ) | (8,183 | ) | (17,701 | ) | — | — | (17,701 | ) | ||||||||||
Organizational transformation and termination benefits | — | — | — | — | — | 4,525 | 4,525 | ||||||||||||||
Adjusted EBITDA attributable to Forest City Realty Trust, Inc. | $ | 73,400 | $ | 48,957 | $ | 39,025 | $ | 161,382 | $ | (5,403 | ) | $ | (4,310 | ) | $ | 151,669 | |||||
U. Subsequent Event
On April 25, 2018, the Company’s jointly owned specialty retail joint venture with Madison International, acquired a 50% ownership interest in three life science office buildings (“acquired assets”) located in Cambridge, Massachusetts, for a purchase price of approximately $302,000,000. Prior to this acquisition, the Company owned the remaining 50% ownership interest in the acquired assets and accounted for this investment on the equity method of accounting. Subsequent to the acquisition, the Company continues to own the remaining 50% ownership interests in the acquired assets and continues to account for this investment on the equity method of accounting as the Madison International joint venture retains the same rights as the previous partner was entitled to. The acquisition was funded primarily through a capital contribution into the joint venture from Madison International. It is expected the Company will exchange its preferred ownership interests in certain of the specialty retail assets owned by the joint venture for the acquired assets in a non-cash transaction during the three months ended September 30, 2018. Following this anticipated exchange, the Company will own 100% of the acquired assets and expects to fully consolidate the properties. In accordance with accounting guidance, the Company will remeasure its equity interests, at fair value (based upon the income approach using current rents and market cap rates and discount rates), and expects to record a gain on change in control during the three months ended September 30, 2018.
26
Forest City Realty Trust, Inc. and Subsidiaries
Notes to Consolidated Financial Statements
(Unaudited)
Item 2. Management’s Discussion and Analysis of Financial Condition and Results of Operations
The Management’s Discussion and Analysis of Financial Condition and Results of Operations (“MD&A”) of Forest City Realty Trust, Inc. and subsidiaries should be read in conjunction with the financial statements and footnotes thereto contained in the annual report on Form 10-K for the year ended December 31, 2017.
RESULTS OF OPERATIONS
Corporate Description
We principally engage in the operation, development, management and acquisition of office, apartment and retail real estate and land throughout the United States. We have approximately $8.0 billion of consolidated assets in 19 states and the District of Columbia at March 31, 2018. Our core markets include Boston, Chicago, Dallas, Denver, Los Angeles, Philadelphia, and the greater metropolitan areas of New York City, San Francisco and Washington D.C. We have regional offices in Boston, Dallas, Denver, Los Angeles, New York City, San Francisco, Washington, D.C., and our corporate headquarters in Cleveland, Ohio.
Review of Strategic Alternatives
On March 22, 2018, we announced that our Board of Directors (the “Board”) concluded its previously announced review of strategic alternatives. After extensive evaluation and deliberation, including review and analysis of multiple offers, the Board has determined that stockholder value would be better enhanced on a standalone basis than by pursuing a transaction on the terms and pricing indicated by the offers received.
Review of Strategic Alternatives - Reconstituted Board
In addition, on March 22, 2018, we announced our entry into agreements with Starboard Value LP ("Starboard"), which owned approximately 3.0% of our outstanding shares, Scopia Capital Management LP ("Scopia"), which owned approximately 8.3% of our outstanding shares, and RMS, Limited Partnership ("RMS"), which, prior to the elimination of our dual-class stock structure in 2017, was our controlling stockholder, pursuant to which, as of March 22, 2018:
• | Nine directors agreed to resign from the Board; |
• | Michelle Felman, Adam S. Metz, Marran H. Ogilvie, William R. Roberts and Robert A. Schriesheim were appointed on April 16, 2018, effective upon completion of customary onboarding background reviews, as new independent directors to the Company's Board; |
• | James A. Ratner became Interim Chairman of the Board. The reconstituted Nominating and Governance Committee has initiated a process to identify and recommend a new Chairman or Executive Chairman of the Board. Candidates will include both new Board members as well as external candidates that are seasoned real estate industry executives or professionals; |
• | The reconstituted Nominating and Governance Committee has initiated a process to identify an additional independent director to join the Board; |
• | Each of Starboard and Scopia had the right to appoint one additional director to the Board; and |
• | RMS has agreed to alter its director nomination rights from four members of the Ratner family to two designees, one director who must be independent under NYSE listing standards and one director who may be either a family member or independent under NYSE listing standards. William R. Roberts will serve as the independent RMS nominee. RMS has also given up its right for James Ratner to be elected Chairman of the Board, and he will resign from the Chairmanship upon appointment of the new Chairman identified by the process referred to above. |
We also announced that David J. LaRue, Kenneth J. Bacon, Z. Jamie Behar and James A. Ratner will continue their service on the Board. All members of the newly reconstituted Board will stand for election at our 2018 Annual Meeting. Following completion of onboarding and appointments, the Board will be comprised of 13 directors, 11 of whom will be independent.
Review of Strategic Alternatives - Reconstituted Board Appointments
On April 16, 2018, we announced our Board has appointed Michelle Felman, Jerome J. Lande (Scopia appointee), Adam S. Metz, Gavin Molinelli (Starboard appointee), Marran H. Ogilvie, Mark S. Ordan, William R. Roberts and Robert A. Schriesheim as new independent directors.
27
Review of Strategic Alternatives - Share Repurchase Authorization
On March 22, 2018, the Board approved an increase in the Company's existing $100,000,000 share repurchase program to an aggregate total of $400,000,000. The shares may be repurchased, in light of prevailing market and economic conditions, to take advantage of investment opportunities at times when the Board and Company management believe the market price of the common stock does not accurately reflect the underlying value of the Company; to indicate to investors the Company's confidence in its business; to enhance stockholder value; and to reduce dilution.
Milestones
Significant milestones achieved in the first quarter of 2018 include:
• | Completed the sale of 461 Dean Street, an apartment community in Brooklyn, New York. The disposition generated net cash proceeds of $147,193,000; |
• | Declared and paid a $0.18 per share cash dividend on our common stock for the first quarter of 2018, representing an increase of $0.04 per share (29%) from the fourth quarter of 2017 and $0.09 per share (100%) from the first quarter of 2017; |
• | Reached an agreement with Greenland USA on the restructuring of the Pacific Park Brooklyn joint venture, a 22 acre mixed-use project in Brooklyn, New York. The transaction, which is expected to close in mid-2018, will increase Greenland USA’s ownership interest in the joint venture from 70% to 95% on future construction costs, effective January 15, 2018, and reduce our ownership interest and future obligations to fund future construction costs from 30% to 5%. Completed or partially completed projects of the joint venture, including 38 Sixth Ave, 550 Vanderbilt, 535 Carlton and the related parking garages, will remain owned by Greenland USA and us on a 70%/30% basis, respectively (there can be no assurance that the transaction will be consummated as agreed upon and described above, or at all); |
• | Completed the sale of Antelope Valley Mall, Mall at Robinson, Shops at Wiregrass and Victoria Gardens - Bass Pro Shops under our signed definitive agreement with Queensland Investment Company (“QIC”) to dispose of ten regional mall assets. The dispositions generated net cash proceeds of approximately $74,203,000 and a note receivable of $51,929,000, which matures in 2019; |
• | Commenced construction on The Yards - L2, an apartment community in Washington, D.C; |
• | Paid off the $18,970,000 nonrecourse mortgage loan which encumbered Edgeworth, an office building in Richmond, Virginia; and |
• | Paid off the $17,641,000 nonrecourse mortgage loan which encumbered Aster Town Center North, an apartment community in Denver, Colorado. |
In addition, subsequent to March 31, 2018, we achieved the following significant milestones:
• | Announced the appointment of eight new independent directors to the Board of Directors as of April 16, 2018. Subsequent to the appointment, the Board consists of 12 directors, 10 of whom are expected to be independent, with 1 vacancy; |
• | Began the phased opening at Ardan, an apartment community in Dallas, Texas; |
• | Collected the $125,000,000 note receivable ($137,673,000 with accrued interest) from the January 2016 sale of our equity method investment in the Brooklyn Nets prior to its January 2021 maturity date; |
• | Completed the sale of Westchester’s Ridge Hill, a regional mall in Yonkers, New York, to QIC. The disposition generated net cash proceeds of approximately $10,468,000 and a note receivable of $61,136,000; |
• | Completed the sale of Brooklyn Commons, a consolidated specialty retail center in Brooklyn, New York. The sale generated net cash proceeds of approximately $33,750,000, which are expected to be redeployed in a Section 1031 exchange; |
• | Closed on the conversion of our common interest to preferred interest in Queens Place, the final asset in the 11-asset specialty retail portfolio located throughout Manhattan, Brooklyn, Queens, the Bronx, Staten Island and Northern New Jersey, under our signed definitive agreement with Madison International. We expect to convert these preferred ownership interests into office and/or apartment assets during 2018, as replacement assets are secured; and |
• | Acquired our partner’s 50% equity interest in 300 Massachusetts Ave, 350 Massachusetts Ave and 38 Sidney Street, three life science office properties at University Park at MIT, a mixed-use life science office campus in Cambridge, Massachusetts, through our jointly owned specialty retail joint venture with Madison International, for a purchase price of approximately $302,000,000 funded primarily through a capital contribution from Madison International. |
28
Net Operating Income
Net Operating Income (“NOI”), a non-GAAP measure, reflects our share of the core operations of our rental real estate portfolio, prior to any financing activity. NOI is defined as revenues less operating expenses at our ownership within our Office, Apartments, Retail, and Development segments, except for revenues and cost of sales associated with sales of land held in these segments. The activity of our Corporate segment does not involve the operations of our rental property portfolio and therefore is excluded from our NOI.
We believe NOI provides important information about our core operations and, along with earnings before income taxes, is necessary to understand our business and operating results. Because NOI excludes general and administrative expenses, interest expense, depreciation and amortization, revenues and cost of sales associated with sales of land, other non-property income and losses, and gains and losses from property dispositions, it provides a performance measure that, when compared year over year, reflects the revenues and expenses directly associated with owning and operating office, apartment and retail real estate and the impact to operations from trends in occupancy rates, rental rates and operating costs, providing a perspective on operations not immediately apparent from net income. We use NOI to evaluate our operating performance on a portfolio basis since NOI allows us to evaluate the impact that factors such as occupancy levels, lease structure, rental rates, and tenant mix have on our financial results. Investors can use NOI as supplementary information to evaluate our business. In addition, management believes NOI provides useful information to the investment community about our financial and operating performance when compared to other REITs since NOI is generally recognized as a standard measure of performance in the real estate industry. NOI is not intended to be a performance measure that should be regarded as an alternative to, or more meaningful than, our GAAP measures, and may not be directly comparable to similarly-titled measures reported by other companies.
29
Reconciliation of Earnings (Loss) Before Income Taxes (GAAP) to Net Operating Income (non-GAAP) (in thousands):
Three Months Ended March 31, | ||||||
2018 | 2017 | |||||
Earnings before income taxes (GAAP) | $ | 197,278 | $ | 31,672 | ||
Earnings from unconsolidated entities | (71,978 | ) | (26,979 | ) | ||
Earnings before income taxes and earnings from unconsolidated entities | 125,300 | 4,693 | ||||
Land sales | (5,945 | ) | (5,760 | ) | ||
Cost of land sales | 2,986 | 2,001 | ||||
Other land development revenues | (2,193 | ) | (1,105 | ) | ||
Other land development expenses | 3,072 | 2,564 | ||||
Corporate general and administrative expenses | 12,183 | 15,583 | ||||
Organizational transformation and termination benefits | 15,950 | 4,525 | ||||
Depreciation and amortization | 55,285 | 63,555 | ||||
Interest and other income | (10,761 | ) | (10,272 | ) | ||
Gains on change in control of interests | (117,711 | ) | — | |||
Interest expense | 26,967 | 27,975 | ||||
Amortization of mortgage procurement costs | 1,306 | 1,222 | ||||
Loss on extinguishment of debt | 2,388 | 2,843 | ||||
NOI related to noncontrolling interest (1) | (10,939 | ) | (9,671 | ) | ||
NOI related to unconsolidated entities (2) | 45,656 | 55,100 | ||||
Net Operating Income (Non-GAAP) | $ | 143,544 | $ | 153,253 | ||
(1) NOI related to noncontrolling interest: | ||||||
Earnings from continuing operations attributable to noncontrolling interests (GAAP) | $ | 185 | $ | 106 | ||
Exclude non-NOI activity from noncontrolling interests: | ||||||
Land and non-rental activity, net | 153 | 246 | ||||
Interest and other income | 370 | 524 | ||||
Depreciation and amortization | (6,539 | ) | (6,696 | ) | ||
Amortization of mortgage procurement costs | (325 | ) | (287 | ) | ||
Interest expense and extinguishment of debt | (5,135 | ) | (3,564 | ) | ||
Gain on disposition of full or partial interests in rental properties and interest in unconsolidated entities | 352 | — | ||||
NOI related to noncontrolling interest | $ | (10,939 | ) | $ | (9,671 | ) |
(2) NOI related to unconsolidated entities: | ||||||
Equity in earnings (GAAP) | $ | (2,981 | ) | $ | 9,278 | |
Exclude non-NOI activity from unconsolidated entities: | ||||||
Land and non-rental activity, net | (887 | ) | (1,136 | ) | ||
Interest and other income | (192 | ) | (1,525 | ) | ||
Write offs of abandoned development projects and demolition costs | 6,218 | 351 | ||||
Depreciation and amortization | 21,675 | 22,192 | ||||
Amortization of mortgage procurement costs | 656 | 897 | ||||
Interest expense and extinguishment of debt | 21,167 | 25,043 | ||||
NOI related to unconsolidated entities | $ | 45,656 | $ | 55,100 | ||
30
Comparable NOI
We use comparable NOI, a non-GAAP measure, as a metric to evaluate the performance of our office and apartment properties. This operating statistic provides a same-store comparison of operating results of all stabilized properties that are open and operating in each period presented. Non-capitalizable development costs and unallocated management and service company overhead, net of service fee revenues, are not directly attributable to an individual operating property and are considered non-comparable NOI. In addition, certain income and expense items at the property level, such as lease termination income, real estate tax assessments or rebates, certain litigation expenses incurred and any related legal settlements and NOI impacts of changes in ownership percentages, are excluded from comparable NOI. Retained properties in lease-up or are otherwise considered non-comparable are disclosed in the Segment Operating Results of the MD&A. Due to the planned/ongoing disposition of substantially all of our regional mall and specialty retail portfolios, we are no longer disclosing comparable NOI for our retail properties. Other properties and activities such as federally assisted housing, straight-line rent adjustments and participation payments as a result of refinancing transactions are not evaluated on a comparable basis and the NOI from these properties and activities is considered non-comparable NOI.
We believe comparable NOI is useful because it measures the performance of the same properties on a period-to-period basis and is used to assess operating performance and resource allocation of the operating properties. While property dispositions, acquisitions or other factors impact net earnings in the short term, we believe comparable NOI presents a consistent view of the overall performance of our operating portfolio from period to period.
The following is a reconciliation of comparable NOI to total NOI.
Net Operating Income (in thousands) | |||||||||||||||||||||
Three Months Ended March 31, 2018 | Three Months Ended March 31, 2017 | Comparable | |||||||||||||||||||
Comparable | Non-Comparable | Total | Comparable | Non-Comparable | Total | NOI % Change | |||||||||||||||
Office | $ | 66,985 | $ | 569 | $ | 67,554 | $ | 66,166 | $ | 3,780 | $ | 69,946 | 1.2 | % | |||||||
Apartments | 45,267 | 632 | 45,899 | 45,458 | (54 | ) | 45,404 | (0.4 | )% | ||||||||||||
Retail | — | 29,610 | 29,610 | — | 39,623 | 39,623 | |||||||||||||||
Product Type NOI | $ | 112,252 | $ | 30,811 | $ | 143,063 | $ | 111,624 | $ | 43,349 | $ | 154,973 | |||||||||
Federally Assisted Housing | — | 167 | 167 | — | 4,285 | 4,285 | |||||||||||||||
Other NOI (1): | |||||||||||||||||||||
Straight-line rent adjustments | — | 3,292 | 3,292 | — | 2,798 | 2,798 | |||||||||||||||
Other Operations | — | (709 | ) | (709 | ) | — | (674 | ) | (674 | ) | |||||||||||
112,252 | 33,561 | 145,813 | 111,624 | 49,758 | 161,382 | ||||||||||||||||
Recently-Opened Properties/Redevelopment | — | 2,636 | 2,636 | — | (1,393 | ) | (1,393 | ) | |||||||||||||
Development Segment (2) | — | (4,905 | ) | (4,905 | ) | — | (6,736 | ) | (6,736 | ) | |||||||||||
Grand Total | $ | 112,252 | $ | 31,292 | $ | 143,544 | $ | 111,624 | $ | 41,629 | $ | 153,253 | 0.6 | % | |||||||
(1) | Includes straight-line rent adjustments, participation payments as a result of refinancing transactions on our properties and management and service company overhead, net of service fee revenue. |
(2) | Includes straight-line adjustments, non-capitalizable development overhead and other costs on our development projects. |
Percentage of NOI by Product Type (dollars in thousands)
Three Months Ended March 31, | ||||||||||
2018 | 2017 | |||||||||
NOI | % of Total | NOI | % of Total | |||||||
Office Segment | $ | 67,554 | 47.2 | % | $ | 69,946 | 45.1 | % | ||
Apartment Segment | 45,899 | 32.1 | % | 45,404 | 29.3 | % | ||||
Retail Segment | 29,610 | 20.7 | % | 39,623 | 25.6 | % | ||||
Total Product Type NOI | $ | 143,063 | $ | 154,973 | ||||||
31
Core Market NOI
(dollars in thousands)
Three Months Ended March 31, 2018 | Three Months Ended March 31, 2017 | |
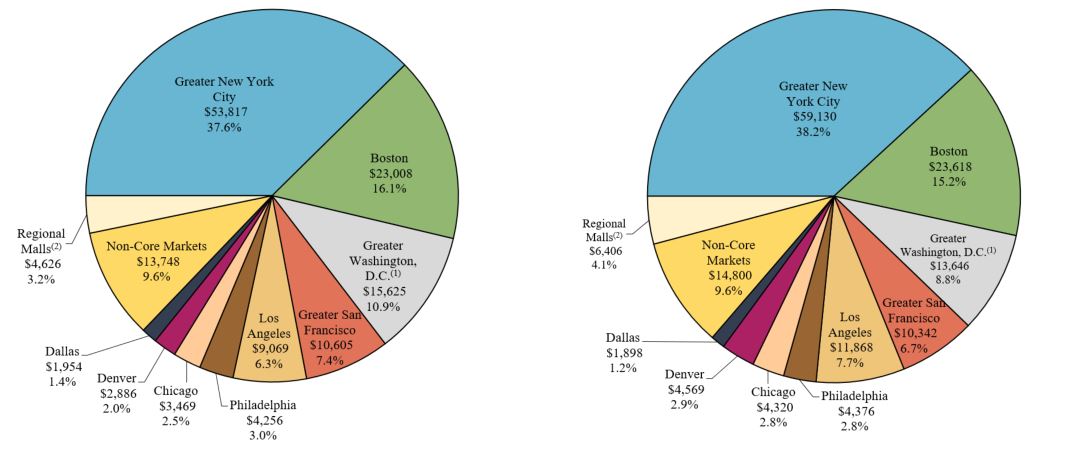
Product Type NOI | $ | 143,063 | Product Type NOI | $ | 154,973 | |||
Federally Assisted Housing | 167 | Federally Assisted Housing | 4,285 | |||||
Other NOI (3): | Other NOI (3): | |||||||
Straight-line rent adjustments | 3,292 | Straight-line rent adjustments | 2,798 | |||||
Other Operations | (709 | ) | Other Operations | (674 | ) | |||
2,583 | 2,124 | |||||||
Recently-Opened Properties/Redevelopment | 2,636 | Recently-Opened Properties/Redevelopment | (1,393 | ) | ||||
Development Segment (4) | (4,905 | ) | Development Segment (4) | (6,736 | ) | |||
Grand Total NOI | $ | 143,544 | Grand Total NOI | $ | 153,253 | |||
(1) | Includes Richmond, Virginia. |
(2) | Represents Regional Malls located in Non-Core Markets. Regional Malls located in Core Markets are included in their applicable Core Markets. |
(3) | Includes straight-line rent adjustments, participation payments as a result of refinancing transactions on our properties and management and service company overhead, net of service fee revenues. |
(4) | Includes straight-line adjustments, non-capitalizable development overhead and other costs on our development projects. |
32
FFO
Funds From Operations (“FFO”), a non-GAAP measure, along with net earnings, provides an investor important information about our core operations. While property dispositions, acquisitions or other factors impact net earnings in the short-term, we believe FFO presents a consistent view of the overall financial performance of our business from period-to-period since the core of our business is the recurring operations of our portfolio of real estate assets. Management believes that the exclusion from FFO of gains and losses from the sale of operating real estate assets allows investors and analysts to readily identify the operating results of the Company’s core assets and assists in comparing those operating results between periods. Implicit in historical cost accounting for real estate assets in accordance with GAAP is the assumption that the value of real estate assets diminishes ratably over time. Since real estate values have historically risen or fallen with market conditions, many real estate investors and analysts have considered presentations of operating results for real estate companies using historical cost accounting alone to be insufficient. Because FFO excludes depreciation and amortization of real estate assets and impairment of depreciable real estate, management believes that FFO, along with the required GAAP presentations, provides another measurement of the Company’s performance relative to its peers and an additional basis on which to make decisions involving operating, financing and investing activities than the required GAAP presentations alone would provide.
FFO is defined by the National Associate of Real Estate Investment Trusts (“NAREIT”) as net earnings excluding the following items at our ownership: i) gain (loss) on full or partial disposition of rental properties, divisions and other investments (net of tax); ii) gains or losses on change in control of interests; iii) non-cash charges for real estate depreciation and amortization; iv) impairment of depreciable real estate (net of tax); and v) cumulative or retrospective effect of change in accounting principle (net of tax).
The table below reconciles net earnings, the most comparable GAAP measure, to FFO, a non-GAAP measure.
Three Months Ended March 31, | ||||||
2018 | 2017 | |||||
(in thousands) | ||||||
Net earnings attributable to Forest City Realty Trust, Inc. (GAAP) | $ | 199,747 | $ | 40,917 | ||
Depreciation and Amortization—real estate (1) | 69,767 | 78,349 | ||||
Gain on change in control of interests | (117,711 | ) | — | |||
Gain on disposition of full or partial interests in rental properties | (72,203 | ) | (27,004 | ) | ||
Income tax expense adjustment: | ||||||
Gain on disposition of full or partial interests in rental properties | 1,711 | — | ||||
FFO attributable to Forest City Realty Trust, Inc. (Non-GAAP) | $ | 81,311 | $ | 92,262 | ||
FFO Per Share - Diluted | ||||||
Numerator (in thousands): | ||||||
FFO attributable to Forest City Realty Trust, Inc. | $ | 81,311 | $ | 92,262 | ||
If-Converted Method (adjustments for interest): | ||||||
4.250% Notes due 2018 | 778 | 778 | ||||
3.625% Notes due 2020 | 363 | 363 | ||||
FFO for per share data | $ | 82,452 | $ | 93,403 | ||
Denominator: | ||||||
Weighted average shares outstanding—Basic | 265,440,763 | 258,797,277 | ||||
Effect of stock options, restricted stock and performance shares | 1,380,471 | 1,320,911 | ||||
Effect of convertible debt | 5,213,392 | 5,031,753 | ||||
Effect of convertible 2006 Class A Common Units | 1,111,044 | 1,910,625 | ||||
Weighted average shares outstanding - Diluted | 273,145,670 | 267,060,566 | ||||
FFO Per Share - Diluted | $ | 0.30 | $ | 0.35 | ||
(1) | The following table provides detail of depreciation and amortization: |
Three Months Ended March 31, | ||||||
2018 | 2017 | |||||
(in thousands) | ||||||
Full Consolidation | $ | 55,285 | $ | 63,555 | ||
Non-Real Estate | (654 | ) | (702 | ) | ||
Real Estate Full Consolidation | 54,631 | 62,853 | ||||
Real Estate related to noncontrolling interest | (6,539 | ) | (6,696 | ) | ||
Real Estate Unconsolidated | 21,675 | 22,192 | ||||
Real Estate at Company share | $ | 69,767 | $ | 78,349 | ||
33
Operating FFO
Operating FFO, a non-GAAP measure, is an additional measure an investor may use to evaluate our operating performance. We believe it is appropriate to adjust FFO for significant items driven by transactional activity and factors relating to the financial and real estate markets, rather than factors specific to the on-going operating performance of our properties. We use Operating FFO as an indicator of continuing operating results in planning and executing our business strategy. Operating FFO should not be considered to be an alternative to net earnings computed under GAAP as an indicator of our operating performance and may not be directly comparable to similarly titled measures reported by other companies.
We define Operating FFO as FFO adjusted to exclude: i) impairment of non-depreciable real estate; ii) write-offs of abandoned development projects and demolition costs; iii) income recognized on state and federal historic and other tax credits; iv) gains or losses from extinguishment of debt; v) change in fair market value of nondesignated hedges; vi) the adjustment to recognize rental revenues and rental expense using the straight-line method; vii) participation payments to ground lessors on refinancing of our properties; viii) other transactional items; and ix) income taxes on FFO.
The table below reconciles FFO to Operating FFO.
Three Months Ended March 31, | ||||||
2018 | 2017 | |||||
(in thousands) | ||||||
FFO attributable to Forest City Realty Trust, Inc. | $ | 81,311 | $ | 92,262 | ||
Write-offs of abandoned development projects and demolition costs | 6,218 | 351 | ||||
Tax credit income | (3,275 | ) | (2,691 | ) | ||
Loss on extinguishment of debt | 2,269 | 4,466 | ||||
Change in fair market value of nondesignated hedges | (2,148 | ) | (1,502 | ) | ||
Straight-line rent adjustments | (3,693 | ) | (2,942 | ) | ||
Organizational transformation and termination benefits | 15,950 | 4,525 | ||||
Income tax expense on FFO | 113 | 51 | ||||
Operating FFO attributable to Forest City Realty Trust, Inc. | $ | 96,745 | $ | 94,520 | ||
If-Converted Method (adjustments for interest) (in thousands): | ||||||
4.250% Notes due 2018 | 778 | 778 | ||||
3.625% Notes due 2020 | 363 | 363 | ||||
Operating FFO attributable to Forest City Realty Trust, Inc. (If-Converted) | $ | 97,886 | $ | 95,661 | ||
Weighted average shares outstanding—Basic | 265,440,763 | 258,797,277 | ||||
Effect of stock options, restricted stock and performance shares | 1,380,471 | 1,320,911 | ||||
Effect of convertible debt | 5,213,392 | 5,031,753 | ||||
Effect of convertible 2006 Class A Common Units | 1,111,044 | 1,910,625 | ||||
Weighted average shares outstanding - Diluted | 273,145,670 | 267,060,566 | ||||
Operating FFO per share - Diluted | $ | 0.36 | $ | 0.36 | ||
34
Operations
Office
Comparable leased occupancy for Office is 95.0% and 93.7% as of March 31, 2018 and 2017, respectively. Leased occupancy percentage is calculated by dividing the sum of the total tenant occupied space under the lease and vacant space under lease by total gross leasable area (“GLA”) and represents leased occupancy at the end of the quarter. Office occupancy data includes leases with original terms of one year or less. Comparable leased occupancy relates to stabilized properties opened and operated in both the three months ended March 31, 2018 and 2017.
We monitor office leases expiring in the short to mid-term. Management’s plan to obtain lease renewals for expiring office leases includes signing of lease extensions, if available, and active marketing for available or soon to be available space to new or existing tenants in the normal course of business.
Office Buildings
The following table represents those new leases and GLA signed on the same space in which there was a former tenant and existing tenant renewals along with all other new leases signed within the rolling 12-month period.
Same-Space Leases | Other New Leases | ||||||||||||||||||||||
Quarter | Number of Leases Signed | GLA Signed | Contractual Rent Per SF (1) | Expired Rent Per SF (1) | Cash Basis % Change over Prior Rent | Number of Leases Signed | GLA Signed | Contractual Rent Per SF (1) | Total GLA Signed | ||||||||||||||
Q2 2017 | 20 | 290,759 | $ | 64.60 | $ | 57.69 | 12.0 | % | 5 | 27,326 | $ | 42.07 | 318,085 | ||||||||||
Q3 2017 | 7 | 53,516 | $ | 35.23 | $ | 31.42 | 12.1 | % | 2 | 6,209 | $ | 18.34 | 59,725 | ||||||||||
Q4 2017 | 14 | 340,532 | $ | 46.92 | $ | 39.39 | 19.1 | % | 3 | 1,186 | $ | 57.26 | 341,718 | ||||||||||
Q1 2018 | 13 | 183,331 | $ | 73.09 | $ | 63.36 | 15.4 | % | 3 | 7,172 | $ | 31.61 | 190,503 | ||||||||||
Total | 54 | 868,138 | $ | 57.65 | $ | 49.93 | 15.5 | % | 13 | 41,893 | $ | 37.19 | 910,031 | ||||||||||
(1) | Office contractual rent per square foot includes base rent and fixed additional charges for common area maintenance and real estate taxes as of rental commencement. |
35
Apartments
Comparable economic occupancy was 94.0% and 93.6% for the three months ended March 31, 2018 and 2017, respectively. Economic apartment occupancy is calculated by dividing gross potential rent (“GPR”) less vacancy by GPR. GPR is calculated based on actual rents per lease agreements for occupied apartment units and at market rents for vacant apartment units. Market rental rates are determined using a variety of factors which include availability of specific apartment unit types (one bedroom, two bedroom, etc.), seasonality factors and rents offered by competitive properties for similar apartment types in the same geographic market. Comparable economic occupancy relates to stabilized properties opened and operated in both the three months ended March 31, 2018 and 2017.
The following tables present leasing information of our apartment communities. Prior period amounts may differ from data as reported in previous quarters since the properties that qualify as comparable change from period to period.
Quarterly Comparison
Monthly Average Apartment Rental Rates (2) | Economic Apartment Occupancy | |||||||||||||||||
Comparable Apartment | Leasable Units | Three Months Ended March 31, | Three Months Ended March 31, | |||||||||||||||
Communities (1) | at Company % (3) | 2018 | 2017 | % Change | 2018 | 2017 | % Change | |||||||||||
Core Markets | 8,857 | $ | 2,020 | $ | 1,996 | 1.2 | % | 94.6 | % | 94.4 | % | 0.2 | % | |||||
Non-Core Markets | 7,954 | $ | 1,015 | $ | 994 | 2.1 | % | 92.8 | % | 91.7 | % | 1.1 | % | |||||
Total Comparable Apartments | 16,811 | $ | 1,544 | $ | 1,521 | 1.5 | % | 94.0 | % | 93.6 | % | 0.4 | % | |||||
Sequential Comparison
Monthly Average Apartment Rental Rates (2) | Economic Apartment Occupancy | |||||||||||||||||
Three Months Ended | Three Months Ended | |||||||||||||||||
Comparable Apartment | Leasable Units | March 31, | December 31, | March 31, | December 31, | |||||||||||||
Communities (1) | at Company % (3) | 2018 | 2017 | % Change | 2018 | 2017 | % Change | |||||||||||
Core Markets | 8,857 | $ | 2,020 | $ | 2,023 | (0.1 | )% | 94.6 | % | 93.6 | % | 1.0 | % | |||||
Non-Core Markets | 7,954 | $ | 1,015 | $ | 1,017 | (0.2 | )% | 92.8 | % | 91.6 | % | 1.2 | % | |||||
Total Comparable Apartments | 16,811 | $ | 1,544 | $ | 1,547 | (0.2 | )% | 94.0 | % | 93.0 | % | 1.0 | % | |||||
(1) | Includes stabilized apartment communities completely opened and operated in the periods presented. These apartment communities include units leased at affordable apartment rates which provide a discount from average market rental rates. For the three months ended March 31, 2018, 14.7% of leasable units in core markets and 4.9% of leasable units in non-core markets were affordable housing units. Excludes limited-distribution federally assisted housing units. |
(2) | Represents gross potential rent less concessions. |
(3) | Leasable units represent our share of comparable leasable units at the apartment community. |
36
Segment Operating Results
The following tables present revenues, operating expenses and equity in earnings by segment for the three months ended March 31, 2018 compared with the three months ended March 31, 2017. Other results of operations are discussed on a consolidated basis. All amounts in the following tables are presented in thousands.
Office | Apartments | Retail | Total Operations | Development | Total | |||||||||||||
Revenues for the three months ended March 31, 2017 | $ | 113,539 | $ | 72,098 | $ | 14,750 | $ | 200,387 | $ | 15,619 | $ | 216,006 | ||||||
Increase (decrease) due to: | ||||||||||||||||||
Comparable portfolio | 1,200 | 2,622 | (14 | ) | 3,808 | — | 3,808 | |||||||||||
Non-comparable properties (1) | (1,164 | ) | 7,304 | 201 | 6,341 | 1,625 | 7,966 | |||||||||||
Change in consolidation method due to change in control | — | (4,952 | ) | — | (4,952 | ) | — | (4,952 | ) | |||||||||
Recently disposed properties | (2,365 | ) | (2,466 | ) | (6,748 | ) | (11,579 | ) | — | (11,579 | ) | |||||||
Land sales | — | — | — | — | 185 | 185 | ||||||||||||
Other | 262 | (336 | ) | (1,809 | ) | (1,883 | ) | 369 | (1,514 | ) | ||||||||
Revenues for the three months ended March 31, 2018 | $ | 111,472 | $ | 74,270 | $ | 6,380 | $ | 192,122 | $ | 17,798 | $ | 209,920 | ||||||
Office | Apartments | Retail | Total Operations | Development | Corporate | Total | |||||||||||||||
Operating expenses for the three months ended March 31, 2017 | $ | 42,776 | $ | 33,904 | $ | 10,754 | $ | 87,434 | $ | 18,448 | $ | 20,108 | $ | 125,990 | |||||||
Increase (decrease) due to: | |||||||||||||||||||||
Comparable portfolio | 1,330 | 2,238 | 20 | 3,588 | — | — | 3,588 | ||||||||||||||
Non-comparable properties (1) | 68 | 2,782 | 13 | 2,863 | (1,434 | ) | — | 1,429 | |||||||||||||
Change in consolidation method due to change in control | — | (1,399 | ) | — | (1,399 | ) | — | — | (1,399 | ) | |||||||||||
Recently disposed properties | (1,939 | ) | (1,546 | ) | (3,200 | ) | (6,685 | ) | — | — | (6,685 | ) | |||||||||
Land cost of sales | — | — | — | — | 985 | — | 985 | ||||||||||||||
Organizational transformation and termination benefits | — | — | — | — | — | 11,425 | 11,425 | ||||||||||||||
Development, management, corporate and other | 1,555 | (15 | ) | (3,963 | ) | (2,423 | ) | (2,364 | ) | (3,400 | ) | (8,187 | ) | ||||||||
Operating expenses for the three months ended March 31, 2018 | $ | 43,790 | $ | 35,964 | $ | 3,624 | $ | 83,378 | $ | 15,635 | $ | 28,133 | $ | 127,146 | |||||||
Office | Apartments | Retail | Total Operations | Development | Corporate | Total | |||||||||||||||
Equity in earnings (loss) for the three months ended March 31, 2017 | $ | 3,563 | $ | 10,263 | $ | 22,244 | $ | 36,070 | $ | (2,377 | ) | $ | (24,415 | ) | $ | 9,278 | |||||
Increase (decrease) due to: | |||||||||||||||||||||
Comparable portfolio | (80 | ) | (1,257 | ) | (643 | ) | (1,980 | ) | — | — | (1,980 | ) | |||||||||
Non-comparable properties (1) | — | 121 | — | 121 | (917 | ) | — | (796 | ) | ||||||||||||
Recently disposed equity method properties | (129 | ) | (1,966 | ) | (3,873 | ) | (5,968 | ) | 14 | — | (5,954 | ) | |||||||||
Change in consolidation method due to change in control | — | 1,045 | — | 1,045 | — | — | 1,045 | ||||||||||||||
Land | — | — | — | — | (22 | ) | — | (22 | ) | ||||||||||||
Subsidized senior housing | — | (114 | ) | — | (114 | ) | — | — | (114 | ) | |||||||||||
Other | — | 73 | (624 | ) | (551 | ) | (6,671 | ) | 2,784 | (4,438 | ) | ||||||||||
Equity in earnings (loss) for the three months ended March 31, 2018 | $ | 3,354 | $ | 8,165 | $ | 17,104 | $ | 28,623 | $ | (9,973 | ) | $ | (21,631 | ) | $ | (2,981 | ) | ||||
37
(1) | The following table presents the increases (decreases) in revenues, operating expenses and equity in earnings (loss) for properties in lease-up or recently stabilized but not comparable and other consolidated non-comparable properties: |
Three Months Ended March 31, 2018 vs. 2017 | ||||||||||
Property | Quarter Opened | Revenues | Operating Expenses | Equity in Earnings (Loss) | ||||||
Operations | ||||||||||
Office: | ||||||||||
Property recently stabilized: | ||||||||||
1812 Ashland Ave | Q2-16 | $ | 1,104 | $ | 395 | $ | — | |||
Non-comparable property: | ||||||||||
26 Landsdowne Street (i) | (2,268 | ) | (327 | ) | — | |||||
Total Office | $ | (1,164 | ) | $ | 68 | $ | — | |||
Apartments: | ||||||||||
Properties recently stabilized: | ||||||||||
Blossom Plaza | Q2-16 | $ | 1,546 | $ | 810 | $ | — | |||
Kapolei Lofts | Q3-15/Q3-16 | 3,324 | 1,040 | — | ||||||
The Bixby | Q3-16/Q2-17 | — | — | 121 | ||||||
The Yards - Arris | Q1-16 | 2,434 | 932 | — | ||||||
Total Apartments | $ | 7,304 | $ | 2,782 | $ | 121 | ||||
Retail: | ||||||||||
Property recently stabilized: | ||||||||||
The Yards - District Winery | Q3-17 | $ | 201 | $ | 13 | $ | — | |||
Total Retail | $ | 201 | $ | 13 | $ | — | ||||
Development | ||||||||||
Properties in lease-up: | ||||||||||
535 Carlton | Q1-17/Q2-17 | $ | — | $ | — | $ | 85 | |||
461 Dean Street (ii) | Q3-16/Q1-17 | 1,876 | (1,399 | ) | — | |||||
38 Sixth Ave | Q3-17/Q4-17 | — | — | (627 | ) | |||||
Axis | Q3-17/Q2-18 | 248 | 551 | — | ||||||
Eliot on 4th | Q1-17/Q3-17 | 1,765 | 674 | — | ||||||
Mint Town Center | Q4-17/Q2-18 | 138 | 389 | — | ||||||
NorthxNorthwest | Q4-16/Q1-17 | 931 | 209 | — | ||||||
The Bridge at Cornell Tech | Q2-17 | 2,566 | 610 | — | ||||||
VYV | Q3-17 | — | — | (984 | ) | |||||
Non-comparable property: | ||||||||||
Ballston Quarter | — | — | 462 | |||||||
Transfers from development (2017) to operations (2018): | ||||||||||
1812 Ashland Ave | Q2-16 | (1,132 | ) | (382 | ) | — | ||||
Blossom Plaza | Q2-16 | (953 | ) | (753 | ) | — | ||||
Kapolei Lofts | Q3-15/Q3-16 | (1,926 | ) | (682 | ) | — | ||||
The Bixby | Q3-16/Q2-17 | — | — | 147 | ||||||
The Yards - Arris | Q1-16 | (1,888 | ) | (650 | ) | — | ||||
The Yards - District Winery | Q3-17 | — | (1 | ) | — | |||||
Total Development | $ | 1,625 | $ | (1,434 | ) | $ | (917 | ) | ||
(i) | 26 Landsdowne Street, an office building in Cambridge, Massachusetts, is classified as a non-comparable property due to its planned redevelopment, which began in Q3 2017. |
(ii) | 461 Dean Street, an apartment community in Brooklyn New York, was sold in Q1-2018. |
38
Office
The decreases in revenues and operating expenses related to recent disposals are primarily due to the sale of Illinois Science & Technology Park, office buildings in Skokie, Illinois (Q1-2017), and Post Office Plaza, an office building in Cleveland, Ohio (Q3-2017).
Apartments
The decreases in revenues and operating expenses along with the increase in equity in earnings related to the change in consolidation method are due to the change from full consolidation to equity method accounting upon the deconsolidation of Bayside Village, an apartment community in San Francisco, California (Q1-2018). The decreases in revenues and operating expenses along with the decrease in equity in earnings related to recent disposals are primarily due to the sale of 500 Sterling Place, an apartment community in Brooklyn, New York (Q3-2017), and our FAH apartment communities and related service and management companies during 2017 and 2018.
Retail
The decreases in revenues and operating expenses related to recent disposals are primarily due to the deed in lieu transaction on Boulevard Mall, a regional mall in Amherst, New York (Q4-2017), and the sale of The Shops at Northfield Stapleton (Q4-2017), a regional mall in Denver, Colorado. The decrease in equity in earnings related to recent disposals are primarily due to the various assets sold under the signed definitive agreements with QIC and Madison International to dispose of 10 regional malls and 11 specialty retail assets, respectively.
Development
The decrease in equity in earnings for other is primarily related to the $6,218,000 write-off of abandoned development projects of unconsolidated entities in the first quarter of 2018.
Corporate
The decrease in operating expenses is primarily due to the recognition of the remaining deferred gain related to the Terminal Tower sale (our previous Corporate headquarters). At the time of the Terminal Tower sale, we maintained continuing involvement through a lease and were required to defer a portion of the gain on sale. The deferred gain was being amortized over the 36 month lease term (with extensions). Upon vacating the premises early, the remaining deferred gain was recorded as contra rent expense in accordance with GAAP. The equity in earnings (loss) reported in the Corporate segment relates solely to interest expense on our equity method investments, as all interest expense is reported in the Corporate segment.
The increase in organizational transformation and termination benefits is a result of the transactional nature of these project costs. The following table summarizes the components of organizational transformation and termination benefits:
Three Months Ended March 31, | ||||||
2018 | 2017 | |||||
(in thousands) | ||||||
Termination benefits | $ | 4,647 | $ | 4,152 | ||
Strategic alternative costs | 11,303 | — | ||||
Shareholder activism costs | — | 373 | ||||
Total | $ | 15,950 | $ | 4,525 | ||
For the periods presented, we experienced workplace reductions and recorded the associated termination benefits expenses (outplacement and severance payments based on years of service and other defined criteria) for each occurrence. We record a severance liability during the period in which costs are estimable and notification has been communicated to affected employees.
Strategic alternative costs consist primarily of professional fees (legal and investment banking advisors) incurred related to the Board of Directors’ process to consider a broad range of alternatives to enhance stockholder value, including, but not limited to, an accelerated and enhanced operating plan, structural alternatives for our assets, and potential merger, acquisition or sale transactions.
Shareholder activism costs are comprised of advisory, legal and other professional fees associated with activism matters.
39
Depreciation and Amortization
Depreciation and amortization expense was $55,285,000 and $63,555,000 for the three months ended March 31, 2018 and 2017, respectively. The decrease is primarily attributable to accelerated depreciation in 2017 at Ballston Common Office Center, an office building in Arlington, Virginia, and 26 Landsdowne Street, an office building in Cambridge, Massachusetts, both of which are undergoing redevelopment, the 2017 deed-in-lieu transaction at Boulevard Mall in Amherst, New York, and the 2018 change from full consolidation to the equity method of accounting for Bayside Village, an apartment community in San Francisco, California. These decreases were partially offset by new property openings in 2017 and 2018.
Interest and Other Income
Interest and other income was $10,761,000 and $10,272,000 for the three months ended March 31, 2018 and 2017, respectively. The net increase for the three months ended March 31, 2018 compared with the three months ended March 31, 2017 is primarily related to increased income recognition on the allocation of state and federal historic preservation, low income and new market tax credits.
Gain on Change in Control of Interests
See Note N – Gain on Change in Control of Interests in the Notes to Consolidated Financial Statements in Item 1 of this Form 10‑Q for detailed information.
Interest Expense
The following table presents interest expense for the three months ended March 31, 2018 compared with the three months ended March 31, 2017. All amounts are presented in thousands.
Interest expense for the three months ended March 31, 2017 | $ | 27,975 | |
Increase (decrease) due to: | |||
Comparable operating portfolio | (1,346 | ) | |
Non-comparable operating portfolio | 2,680 | ||
Change in consolidation method due to change in control | (299 | ) | |
Recently disposed properties | (1,954 | ) | |
Capitalized interest | (182 | ) | |
Mark-to-market adjustments on non-designated swaps | (620 | ) | |
Corporate recourse debt | 463 | ||
Other | 250 | ||
Interest expense for the three months ended March 31, 2018 | $ | 26,967 | |
The decrease in interest expense for the comparable portfolio is primarily due to the paydown of the $61,000,000 nonrecourse mortgage note for Eleven MetroTech Center, an office building in Brooklyn, New York (Q4-2017). The decrease in interest expense related to the change in consolidation method is due to the change from full consolidation to equity method accounting at Bayside Village, an apartment community in San Francisco, California (Q1-2018). The decrease in interest expense related to recently disposed properties is primarily due to the deed in lieu transaction at Boulevard Mall, a regional mall in Amherst, New York (Q4-2017), and the sales of Post Office Plaza, an office building in Cleveland, Ohio (Q3-2017), and 500 Sterling Place, an apartment community in Brooklyn, New York (Q3-2017).
Amortization of Mortgage Procurement Costs
Amortization of mortgage procurement costs was $1,306,000 and $1,222,000 for the three months ended March 31, 2018 and 2017, respectively.
Loss on Extinguishment of Debt
See Note O – Loss on Extinguishment of Debt in the Notes to Consolidated Financial Statements in Item 1 of this Form 10‑Q for detailed information.
Net Gain on Disposition of Interest in Unconsolidated Entities
See Note P – Net Gain on Disposition of Interest in Unconsolidated Entities in the Notes to Consolidated Financial Statements in Item 1 of this Form 10‑Q for detailed information.
Net Gain on Disposition of Full or Partial Interest in Rental Properties, Net of Tax
See Note R – Net Gain (Loss) on Disposition of Full or Partial Interest in Rental Properties, Net of Tax in the Notes to Consolidated Financial Statements in Item 1 of this Form 10‑Q for detailed information.
40
Subsequent Event
See Note U – Subsequent Event in the Notes to Consolidated Financial Statements in Item 1 of this Form 10‑Q for detailed information.
Net Earnings Attributable to Forest City Realty Trust, Inc.
Net earnings attributable to Forest City Realty Trust, Inc. for the three months ended March 31, 2018 was $199,747,000 versus $40,917,000 of three months ended March 31, 2017. The variance to the prior year period is primarily attributable to the following fluctuations, which are pre-tax, include unconsolidated investment activity and are net of noncontrolling interests:
Asset Dispositions - $36,065,000
• | $45,199,000 related to increased gains on disposition of full or partial interest in rental properties and unconsolidated investments in 2018 compared to 2017; |
• | $(14,812,000) related to a combined fluctuation in revenues and operating expenses at properties in which we disposed of our full or partial interest during 2018 and 2017; |
• | $6,625,000 related to an increased net gain on disposition of development project in 2018 compared to 2017; and |
• | $(947,000) related to decreased land sales in 2018 compared to 2017, primarily at our Stapleton project. |
Financing Transactions - $6,728,000
• | $3,895,000 primarily related to a decrease in interest expense on nonrecourse mortgage debt due to property sales in 2017 and 2018, and our ongoing deleveraging strategy; |
• | $2,197,000 related to decreased losses on extinguishment of debt; and |
• | $636,000 related to the change in fair market value of certain derivatives not qualifying for hedge accounting between the comparable periods, which was marked to market through interest expense. |
Operations - $(1,860,000)
• | $(11,425,000) related to increased organizational transformation and termination benefits in 2018 compared to 2017; |
• | $5,079,000 related to decreased corporate general and administrative expenses primarily due to the recognition of the remaining deferred gain related to the Terminal Tower sale (our previous Corporate headquarters) upon our early vacating of the premises, and other management and service company activity; and |
• | $4,486,000 related to a combined fluctuation in revenues and operating expenses for operations and development properties in lease-up or recently stabilized but not comparable and other non-comparable properties at March 31, 2018. |
Non-Cash Transactions - $120,474,000
• | $117,711,000 related to the 2018 gain on change of control in interest related to the deconsolidation of Bayside Village; |
• | $8,630,000 related to a decrease in depreciation and amortization expense in 2018 compared with 2017 primarily due to accelerated depreciation in 2017 at two properties undergoing redevelopment, the 2017 deed-in-lieu transaction at Boulevard Mall, and the disposition of our full or partial interest in properties in 2018 and 2017, partially offset by recently opened properties; and |
• | $(5,867,000) related to increased write-offs of abandoned development projects and demolition costs included in equity in earnings in 2018 compared to 2017. |
Income Taxes
• | $(1,773,000) due to increased income tax expense. |
41
Phased Openings and Projects Under Construction
March 31, 2018
In addition to the growth in our operating portfolio through improved NOI at our existing properties, we have used development as a primary source of growth in our real estate operations. The following tables summarize phased openings and projects under construction as of March 31, 2018.
Anticipated | ||||||||||||||||||||||
Opening | Legal | Consolidated (C) | Cost at | Cost Incurred to Date (b) | No. of | Lease % | ||||||||||||||||
Location | Date | Ownership % | Unconsolidated (U) | Completion (a) | Consolidated | Unconsolidated | Units | GLA | (c) | |||||||||||||
(in millions) | ||||||||||||||||||||||
2017/2018 Phased Openings | ||||||||||||||||||||||
Apartments | ||||||||||||||||||||||
Arizona State Retirement System Joint Venture: | ||||||||||||||||||||||
Axis | Los Angeles, CA | Q3-17/Q2-18 | 30 | % | C | $ | 140.4 | $ | 144.0 | $ | 0.0 | 391 | 15,000 | 51 | % | |||||||
Mint Town Center | Denver, CO | Q4-17/Q2-18 | 88 | % | C | 94.0 | 87.6 | 0.0 | 399 | 7,000 | 28 | % | ||||||||||
$ | 234.4 | $ | 231.6 | $ | 0.0 | 790 | 22,000 | |||||||||||||||
Projects Under Construction | ||||||||||||||||||||||
Apartments: | ||||||||||||||||||||||
Arizona State Retirement System Joint Venture: | ||||||||||||||||||||||
Ardan | Dallas, TX | Q2-18 | 30 | % | C | $ | 122.0 | $ | 107.9 | $ | 0.0 | 389 | 4,250 | |||||||||
Ballston Quarter Residential | Arlington, VA | Q3-18/Q1-19 | 51 | % | U | 181.9 | 0.0 | 98.0 | 406 | 53,000 | ||||||||||||
Aster Conservatory Green North (d) | Denver, CO | Q1-19 | 0 | % | C | 59.9 | 8.1 | 0.0 | 256 | — | ||||||||||||
The Yards - The Guild (d) | Washington, D.C. | Q1-19 | 0 | % | C | 94.5 | 52.5 | 0.0 | 191 | 6,000 | ||||||||||||
Capper 769 | Washington, D.C. | Q1-19 | 25 | % | U | 71.8 | 0.0 | 30.9 | 179 | — | ||||||||||||
The Yards - L2 (d) | Washington, D.C. | Q1-20 | 0 | % | C | 134.5 | $ | 29.8 | $ | 0.0 | 264 | 14,000 | ||||||||||
$ | 664.6 | $ | 198.3 | $ | 128.9 | 1,685 | 77,250 | |||||||||||||||
Retail: | ||||||||||||||||||||||
Ballston Quarter Redevelopment | Arlington, VA | Q3-18 | 51 | % | U | 86.7 | 0.0 | 77.3 | — | 307,000 | 57 | % | ||||||||||
Total Projects Under Construction | $ | 751.3 | $ | 198.3 | $ | 206.2 | ||||||||||||||||
(a) | Represents estimated project costs to achieve stabilization. Amounts exclude capitalized interest not allocated to the underlying joint venture. |
(b) | Represents total capitalized project costs incurred to date, including all capitalized interest related to the development project. |
(c) | Lease commitments as of April 26, 2018. |
(d) | Represents an apartment community under construction in which the Company has a 0% legal ownership interest. However, the Company is the project developer, on a fee basis. In addition, the Company has issued a project completion guarantee to the first mortgagee and is funding a portion of the construction costs through a mezzanine loan to the owner. As a result, the Company determined it was the primary beneficiary of this variable interest entity and has consolidated the project. The Company has an exclusive option to purchase the constructed asset for an amount approximating cost at completion. |
42
FINANCIAL CONDITION AND LIQUIDITY
Market Conditions
Apartment performance has begun to moderate due to increased supply throughout many areas in the United States, especially in some gateway cities. The increased supply has put pressure on near-term occupancy levels and rental growth. Office and retail performance, to varying degrees, is dependent on product type and geographic market. Access to bank credit and capital remains open with banks and permanent lenders originating new loans for real estate projects. Lenders continue favoring high quality operating assets in strong markets. While banks continue to originate construction loans for multifamily projects, construction loans for office or retail projects remain difficult to obtain, unless the project has substantial pre-leasing in place or higher than historical equity commitments from the developer.
Source of Funds
Our principal sources of funds are cash provided by operations including land sales, our revolving credit facility, our term loan facility, nonrecourse mortgage debt and notes payable, dispositions of operating properties or development projects through sales or equity joint ventures, proceeds from the issuance of senior notes, common or preferred equity and other financing arrangements. We have consistently disposed of assets in an effort to recycle capital and reposition our portfolio. Over the last five years, we have generated cash proceeds from dispositions of full or partial interests in rental properties, development projects and other investments averaging well in excess of $400,000,000 per year. Given the diversity of our portfolio by market and product type, we believe the market for property dispositions will continue to be available. We believe the current market conditions will allow us to continue our historical strategy to recycle capital and reposition the portfolio through asset sales or equity joint ventures.
Our strategic plan drives our capital strategy and business focus on core products located in core markets. In order to achieve our strategic goals, we believe we can maximize cash provided by operations by concentrating our portfolio in the markets we believe are best positioned for long term growth. Additionally, we evaluate each individual asset in our operating and development portfolio to identify those having the best opportunity to provide capital through full or partial sale in conjunction with our strategy of focusing on core products located in core markets. This process may result in reductions to estimated holding periods and the total estimated undiscounted cash flows used for impairment calculations on our individual consolidated real estate assets. In some cases, this may result in estimated undiscounted cash flows being less than the carrying value of the consolidated asset and necessitating an impairment charge to write down the asset to its estimated fair value.
In addition, our capital strategy includes evaluating potential equity joint ventures to provide capital through the sales of partial interests of operating properties or to reduce our equity requirements and development risk on development opportunities. Entering into joint ventures could result in us granting joint control or losing control of the asset and, accordingly, the asset would no longer be consolidated. Upon deconsolidation, our investment balance in the joint venture would be compared to estimated fair value and recorded at the lesser of fair value or book value. Additionally, evaluation for other than temporary impairment on a quarterly basis would be required. This could result in future impairments, some of which could be significant, that would not otherwise be required if the real estate asset remained consolidated.
Retail Portfolio Dispostion
In August 2016, we announced that our Board of Directors authorized a process to review strategic alternatives for a portion of our retail portfolio. During 2017, we signed definitive agreements with both QIC and Madison International for the disposition of 10 of our regional mall assets and 12 of our specialty retail assets, respectively. Due to an anticipated deed-in-lieu transaction, Shops at Northern Boulevard in Queens, New York, was removed from the specialty retail asset agreement with Madison during the three months ended March 31, 2018, resulting in the anticipated disposition to Madison International of 11 specialty retail assets as of March 31, 2018.
43
The following table summarizes completed sales of regional mall assets to QIC:
Quarter | Property | Cash Proceeds | Note Receivable | Nonrecourse Mortgage Debt Assumed by Buyer | ||||||
2018 | (in thousands) | |||||||||
Q1 | Antelope Valley Mall | $ | 6,943 | $ | 28,310 | $ | 42,682 | |||
Q1 | Mall at Robinson | 9,656 | 23,619 | 35,320 | ||||||
Q1 | Shops at Wiregrass | 28,271 | — | 41,006 | ||||||
Q1 | Victoria Gardens - Bass Pro Shops | 29,333 | — | 14,706 | ||||||
Total Q1 | $ | 74,203 | $ | 51,929 | $ | 133,714 | ||||
Q2 | Westchester’s Ridge Hill | 10,468 | 61,136 | 155,040 | ||||||
Total 2018 | $ | 84,671 | $ | 113,065 | $ | 288,754 | ||||
2017 | ||||||||||
Q4 | Shops at Northfield Stapleton | $ | 50,019 | $ | 36,935 | $ | — | |||
Q4 | South Bay Galleria | 58,530 | — | 45,670 | ||||||
Total 2017 | $ | 108,549 | $ | 36,935 | $ | 45,670 | ||||
Total regional mall sales to QIC | $ | 193,220 | $ | 150,000 | $ | 334,424 | ||||
The remaining four regional mall assets are expected to close in a tax deferred manner as we secure replacement assets.
For the Madison International transaction, we closed on the conversion of substantially all of our common ownership interest to preferred ownership interest in 10 of the 11 specialty retail assets in December 2017. We closed on the conversion of our common interest in the remaining asset, Queens Place, in April 2018. Final closings on each of the individual specialty retail centers are expected to occur in 2018 as we secure replacement assets into which to redeploy our preferred interest.
We expect to redeploy the equity from the Madison specialty retail assets and the four remaining regional malls into apartment and office assets that align with our focus on core markets and urban, mixed-use place-making projects. Strong consideration will be given to buying out our partner’s share of core assets as a method of equity redeployment as we know the underlying asset and the reduction of joint venture partners will help simplify the business.
On April 25, 2018, our jointly owned specialty retail joint venture with Madison International, acquired a 50% ownership interest in three life science office buildings (“acquired assets”) located in Cambridge, Massachusetts, for a purchase price of approximately $302,000,000. Prior to this acquisition, we owned the remaining 50% ownership interest in the acquired assets and accounted for this investment on the equity method of accounting. Subsequent to the acquisition, we continue to own the remaining 50% ownership interests in the acquired assets and continue to account for this investment on the equity method of accounting as the Madison International joint venture retains the same rights as the previous partner was entitled to. The acquisition was funded primarily through a capital contribution into the joint venture from Madison International. We expect to exchange our preferred ownership interests in certain of the specialty retail assets owned by the joint venture for the acquired assets in a non-cash transaction during the three months ended September 30, 2018. Following this anticipated exchange, we will own 100% of the acquired assets and expect to fully consolidate the properties. In accordance with accounting guidance, we will remeasure our equity interests, at fair value (based upon the income approach using current rents and market cap rates and discount rates), and expect to record a gain on change in control during the three months ended September 30, 2018.
Based on the executed transaction agreements, the economics of the potential retail transactions reflect an average cap rate of approximately five percent on 2016 net operating income of approximately $103,000,000 and total debt of approximately $902,000,000. The QIC regional mall definitive agreement includes seller financing of $150,000,000, which matures in 2019. The NOI and total debt discussed above excludes the 42nd Street specialty retail asset, which is expected to close after resolution of a ground rent issue with the City of New York, and the Shops at Northern Boulevard specialty retail asset in anticipation of a deed-in-lieu transaction with the lender. However, there can be no assurance that the remaining transactions will be consummated on the terms described above, or at all. In addition, there can be no assurance that the remaining transactions, if consummated, could be executed in a tax deferred manner.
If we successfully execute on the retail redeployment strategy, we would expect to generate larger than average proceeds from dispositions and more acquisition activity, as discussed above, in the next 36 months than historical results.
In connection with our sale of Short Pump Town Center, a regional mall in Richmond Virginia, to QIC, we have an agreement with a third partner, which currently owns 33% of the regional mall. In accordance with this agreement, the partner may put its entire ownership interest to us, requiring us to purchase its 33% ownership interest based upon pricing agreed to in connection with the QIC definitive sales agreement. The partner must exercise this put right prior to August 31, 2018, requiring us to close on the purchase by December 31, 2018.
44
Use of Funds
Our principal uses of funds include the financing of our real estate operating and development projects, capital expenditures for our existing operating portfolio, principal and interest payments on our nonrecourse mortgage debt and notes payable, revolving credit facility, term loan facility and senior notes, our ongoing quarterly payments of common stock dividends, repurchases of common stock and selective operating asset acquisitions, including joint venture partner acquisitions. As noted in the retail portfolio discussion, if we can execute on tax-deferred sales of our retail assets, we would expect to have an increased number of asset acquisitions compared to our historical activity. We expect our $73,208,000 of Convertible Senior Notes due 2018 will convert to Class A common stock upon maturity in August 2018 and will not require cash to extinguish this upcoming debt maturity. However, we cannot assure any or all of these Convertible Senior Notes due 2018 will ultimately convert to Class A common stock. If they do not convert, we will have to pay with cash on hand or borrow on our revolving credit facility, if required.
Our capital strategy seeks to isolate the operating and financial risk at the property level to reduce risk on and of our equity capital. We typically do not cross-collateralize our mortgage debt and notes payable outside of a single identifiable project. As such, a majority of our operating and development properties are separately encumbered with nonrecourse mortgage debt or notes payable, which provides protection by allowing the lender to look only to the single asset securing the lender in the event of a default.
As discussed above, a majority of our assets are separately encumbered. Since 2011, our capital strategy has focused on reducing our overall leverage. Our unencumbered asset pool generated NOI of $31,306,000 during the three months ended March 31, 2018. We believe this change in financing strategy is consistent with our deleveraging efforts and provides us greater financial flexibility. We intend to continue to add unencumbered assets to this pool during 2018 and beyond, as we continue to make progress on our deleveraging goals.
Cash generated by operating activities, together with refinancing and property sale proceeds, has historically provided us with the necessary liquidity to take advantage of investment opportunities. The economic downturn and its impact on the lending and capital markets reduced our ability to finance development and acquisition opportunities and modified the required rates of return to make new investment opportunities appealing. As a result of these market changes, we have established self-imposed limitations on entering into new development activities.
We continue to make progress on certain pre-development projects, primarily multifamily projects located in core markets. The cash required to fund our equity in projects under construction and development plus cash necessary to extend or pay down our near-term debt maturities is anticipated to exceed our cash from operations. As a result, we intend to extend maturing debt or repay it with net proceeds from property sales, equity joint ventures, borrowings on our revolving credit facility, term loan facility or future debt or equity financing.
The Nets and Barclays Center - Notes Receivable
At March 31, 2018, we have notes receivable from the purchaser of our equity interest in the Nets and Barclays Center of $125,100,000 and $92,600,000, respectively. The Nets note receivable had an interest rate of 4.50% per annum payable at maturity and a maturity date in 2021. In April 2018, the owners of the Brooklyn Nets closed on a partial sale the Nets. In accordance with the Promissory Note governing the Company’s Nets note receivable, the note receivable, including unpaid accrued interest, was repaid in full on April 11, 2018. The Barclays Center note receivable remains outstanding and bears interest at 4.50% per annum payable semi-annually and matures in 2019.
Pacific Park Brooklyn
On June 30, 2014, we entered into a joint venture with Greenland Atlantic Yards, LLC, a subsidiary of Shanghai-based Greenland Holding Group Company Limited (“Greenland”), to develop Pacific Park Brooklyn, a 22 acre mixed-use project in Brooklyn, New York. Under the joint venture, Greenland acquired 70% of the project and will co-develop the project with us, along with sharing in the entire project costs going forward in proportion to ownership interests. During 2014, we received $208,275,000 of cash, net of transaction costs, related to the transaction. The joint venture will execute on the remaining development rights, including the infrastructure and vertical construction of the apartment units, but excludes Barclays Center and 461 Dean Street apartment community. Consistent with the approved master plan, the joint venture will develop the remaining portion of Phase I and all of Phase II of the project, including the permanent rail yard. The remaining portion of Phase I that will be developed by the joint venture is comprised of seven buildings totaling approximately 3.1 million square feet. Phase II consists of seven buildings totaling approximately 3.3 million square feet.
On June 27, 2014, the City of New York and State of New York entities revised certain project requirements of Pacific Park Brooklyn with the goal of accelerating the construction of affordable housing. Among the requirements, affordable units are required to constitute 35% of all units for which construction has commenced until 1,050 affordable units have been started, after which the percentage drops to 25%. Failure to meet this requirement will prevent the joint venture from seeking new building permits, as well as give the State the right to seek injunctive relief. Also, temporary certificates of occupancy (“TCOs”) for a total of 2,250 affordable housing units are required to be issued by May 31, 2025 or a $2,000 per unit per month penalty will be imposed for those affordable units which have not received TCOs by such date, until issued. As of March 31, 2018, 782 affordable units have been completed.
45
In order to construct the seven buildings in Phase II, substantial additional costs for rail yard and infrastructure improvements, including a platform over the new permanent rail yard, will be required. Our agreement with the Metropolitan Transit Authority (“MTA”) requires collateral to be posted and for the construction of the permanent rail yard to be substantially complete by December 2017, subject to force majeure, for which we have sent notice to the MTA and requested a 16-month delay due to unforeseen site conditions. We had previously posted $86,000,000 of collateral with the MTA, which was returned upon the closing of the joint venture on June 30, 2014. At closing, the joint venture has provided the $86,000,000 collateral to the MTA, of which our portion was 30%, or approximately $26,000,000. The joint venture is accounted for on the equity method of accounting, resulting in the deconsolidation of the Pacific Park Brooklyn development project. The closing of this joint venture allows us to accelerate the delivery of needed affordable housing while significantly reducing our future equity requirements for the full build-out of this project, thereby reducing our development risk and improving our future liquidity.
The joint venture broke ground on the first affordable apartment community, 535 Carlton, in December, 2014. In mid-2015, the joint venture commenced construction on two more buildings, 38 Sixth Avenue, an affordable apartment building, and 550 Vanderbilt, a condominium building. From the formation of the joint venture in June 2014 through the quarter ended June 30, 2016, the Company reviewed the estimates and assumptions in the discounted cash flow model and updated them as necessary.
During the three months ended September 30, 2016, it became evident the occupancy and rental rate declines in the Brooklyn market were not temporary as a result of an increased supply of new rental product amplified by the sun-setting and the uncertainty around the 421 A real estate tax abatement program. Also, the condominium market in New York had softened, causing the projected sale schedule for 550 Vanderbilt to be adjusted accordingly. Separately, the construction costs across the New York market continued to trend upward, resulting in increases in the estimated trade costs for certain infrastructure as well as vertical construction. As a result, during the three months ended September 30, 2016, as part of our formal strategic plan update, a decision was made to revise the overall project schedule for Pacific Park Brooklyn. Accordingly, we updated the discounted cash flow model to reflect the updated timing of the project schedule as well as the revenue, expense and cost assumptions. Based on the above, the estimated fair value of the investment no longer exceeded the carrying value, requiring the recording of a $299,300,000 impairment charge to adjust the carrying value to its estimated fair value during the year ended December 31, 2016.
In January 2018, we reached an agreement with Greenland USA on the restructuring of the Pacific Park Brooklyn joint venture. The transaction, which is expected to close in mid-2018, will increase Greenland USA’s ownership interest in the joint venture from 70% to 95% on future construction costs, effective January 15, 2018, and reduce our ownership interest and future obligations to fund future construction costs from 30% to 5%. Completed or partially completed projects of the joint venture, including 38 Sixth Ave, 550 Vanderbilt, 535 Carlton and the related parking garages, will remain owned by Greenland USA and us on a 70%/30% basis, respectively. There can be no assurance that the transaction will be consummated as agreed upon and described above, or at all.
461 Dean Street
461 Dean Street is an apartment building in Brooklyn, New York adjacent to the Barclays Center at the Pacific Park Brooklyn project. This modular construction project opened during the three months ended September 30, 2016. We had a fixed price contract (the “CM Contract”) with Skanska USA to construct the apartment building. In 2014, Skanska USA ceased construction and we terminated the CM Contract for cause. Each party has filed lawsuits relating primarily to the project’s delays and associated additional completion costs.
During the year ended December 31, 2017, we began the marketing process of 461 Dean Street. The initiation of the marketing process triggered management to update its undiscounted cash flow analysis including our probability weighted estimated holding period. As a result, the estimate probability weighted undiscounted cash flows no longer exceeded the carrying value, requiring the recording of a $44,288,000 impairment charge to adjust the carrying value to our estimated fair value during the year ended December 31, 2017. We intend to continue trying to recoup our damages with the action above.
During the three months ended March 31, 2018, we completed the sale of 461 Dean Street. The disposition generated net cash proceeds of $147,193,000.
We continue to vigorously pursue legal action against Skanska USA for damages related to its default of the CM Contract. However, there is no assurance we will be successful in recovering these damages or defending against Skanska USA’s claims.
Nonrecourse Mortgage Financings
As of March 31, 2018, we had $381,036,000 of nonrecourse mortgage financings with scheduled maturities during the year ending December 31, 2018, of which $27,578,000 represents regularly scheduled amortization payments. Subsequent to March 31, 2018, we addressed $48,695,000 of these maturities through closed transactions. We are currently in negotiations to refinance and/or extend the remaining nonrecourse debt. We cannot give assurance as to the ultimate result of these negotiations. As with all nonrecourse mortgages, if we are unable to negotiate an extension or otherwise refinance the mortgage, we could go into default and the lender could commence foreclosure proceedings on the single collateralized asset, which would likely result in a loss of the asset or an impairment which could be significant.
46
During the year ended December 31, 2017, the $93,096,000 nonrecourse mortgage encumbering Charleston Town Center, an unconsolidated regional mall in Charleston, West Virginia, matured and was transferred to a Special Servicer. We are in the process of working with the Special Servicer to execute a deed-in-lieu transaction. We account for our 50% ownership interest in this investment using the equity method of accounting. At March 31, 2018, we have a negative investment basis of $14,737,000.
As of March 31, 2018, we had one nonrecourse mortgage greater than five percent of our total nonrecourse mortgage debt and notes payable, net. The mortgage encumbers Fifteen Metrotech Center, an office building in Brooklyn, New York, and has a balance of $153,540,000 net of unamortized mortgage procurement costs at March 31, 2018.
As of March 31, 2018, our share of nonrecourse mortgage debt and notes payable, net recorded on our unconsolidated subsidiaries amounted to $2,158,104,000, of which $321,635,000 ($10,224,000 represents scheduled principal payments) is scheduled to mature during the year ending December 31, 2018. Subsequent to March 31, 2018, we addressed $177,219,000 of these maturities through closed transactions, including asset dispositions. Negotiations are ongoing to address the remaining 2018 maturities, but we cannot give assurance that we will obtain these financings on favorable terms or at all.
2018 Liquidity Transactions
We have recently completed the following transactions, which increased liquidity, reduced debt resulting in lower future fixed charges for interest, and strengthened our balance sheet.
• | Completed the sale of 461 Dean Street, an apartment community in Brooklyn, New York. The disposition generated net cash proceeds of $147,193,000; |
• | Completed the sale of Antelope Valley Mall, Mall at Robinson, Shops at Wiregrass and Victoria Gardens - Bass Pro Shops under our signed definitive agreement with Queensland Investment Company (“QIC”) to dispose of ten regional mall assets. The dispositions generated net cash proceeds of approximately $74,203,000 and a note receivable of $51,929,000, which matures in 2019; |
• | Reached an agreement with Greenland USA on the restructuring of the Pacific Park Brooklyn joint venture, a 22 acre mixed-use project in Brooklyn, New York. The transaction, which is expected to close in mid-2018, will increase Greenland USA’s ownership interest in the joint venture from 70% to 95% on future construction costs, effective January 15, 2018, and reduce our ownership interest and future obligations to fund future construction costs from 30% to 5%. Completed or partially completed projects of the joint venture, including 38 Sixth Ave, 550 Vanderbilt, 535 Carlton and the related parking garages, will remain owned by Greenland USA and us on a 70%/30% basis, respectively (there can be no assurance that the transaction will be consummated as agreed upon and described above, or at all); |
• | Paid off the $18,970,000 nonrecourse mortgage which encumbered Edgeworth, a consolidated office building in Richmond, Virginia; |
• | Paid off the $17,641,000 nonrecourse mortgage which encumbered Aster Town Center North, a consolidated apartment community in Denver, Colorado; and |
• | Paid down $30,000,000 ($15,300,000 at our ownership) of the nonrecourse mortgage which encumbers Galleria at Sunset, an unconsolidated regional mall in Henderson, Nevada. |
Subsequent to March 31, 2018, we completed the following transactions:
• | Collected the $125,100,000 note receivable ($137,673,000 with accrued interest) from the January 2016 sale of our equity method investment in the Brooklyn Nets prior to its January 2021 maturity date; |
• | Completed the sale of Westchester’s Ridge Hill, a regional mall in Yonkers, New York, to QIC. The disposition generated net cash proceeds of approximately $10,468,000 and a note receivable of $61,136,000; |
• | Completed the sale of Brooklyn Commons, a consolidated specialty retail center in Brooklyn, New York. The sale generated net cash proceeds of approximately $33,750,000, which are expected to be redeployed in a Section 1031 exchange; and |
• | Paid off the nonrecourse mortgages totaling $48,695,000 which encumbered American Cigar Lofts, Consolidated-Carolina Lofts and Lucky Strike Lofts, consolidated apartment communities in Richmond, Virginia. |
We continue to explore various options to strengthen our balance sheet and enhance our liquidity, but can give no assurance we can accomplish any of these other options on terms favorable to us or at all. If we cannot enhance our liquidity, it could adversely impact our growth and result in further curtailment of development activities.
47
Dividends
We operate as a REIT. As such, we intend to distribute at least 100% of our taxable income within the REIT to avoid paying federal tax. Our REIT taxable income typically will not include income earned by our TRSs except to the extent the TRSs pay dividends to us.
The following table summarizes the quarterly cash dividends declared by the Board of Directors on our common stock (in thousands, except per share data):
Date Declared | Record Date | Payment Date | Amount Per Share | Total Cash Payment | ||||
2018 | ||||||||
February 22, 2018 | March 5, 2018 | March 16, 2018 | $ | 0.18 | $ | 48,012 | ||
2017 | ||||||||
November 29, 2017 | December 20, 2017 | December 29, 2017 | $ | 0.14 | $ | 37,344 | ||
August 22, 2017 | September 5, 2017 | September 18, 2017 | 0.14 | 37,343 | ||||
May 17, 2017 | June 9, 2017 | June 23, 2017 | 0.09 | 23,482 | ||||
March 1, 2017 | March 13, 2017 | March 27, 2017 | 0.09 | 23,441 | ||||
Total | $ | 0.46 | $ | 121,610 | ||||
The amount, timing and frequency of future distributions will be at the sole discretion of our Board of Directors and will be declared based upon various factors, many of which are beyond our control, including, our financial condition and operating cash flows, the amount required to maintain REIT status and reduce any income taxes that we otherwise would be required to pay, limitations on distributions in our existing and future debt instruments, our ability to utilize net operating losses to offset, in whole or in part, our distribution requirements, limitations on our ability to fund distributions using cash generated through our TRSs and other factors that our Board of Directors may deem relevant.
Financial Covenants
Our revolving credit facility and term loan contain certain identical restrictive financial covenants. A summary of the key financial covenants as defined in the agreements, all of which we are compliant with at March 31, 2018, follows:
Requirement | As of | ||
Credit Facility Financial Covenants | Per Agreements | March 31, 2018 | |
Maximum Total Leverage Ratio | ≤65% | 43.6 | % |
Maximum Secured Leverage Ratio | ≤55% | 41.3 | % |
Maximum Secured Recourse Leverage Ratio | ≤15% | 0.0 | % |
Maximum Unsecured Leverage Ratio | ≤60% | 3.1 | % |
Minimum Fixed Charge Coverage Ratio | ≥1.50x | 1.90 | x |
Minimum Unencumbered Interest Coverage Ratio | ≥1.50x | 5.87 | x |
Revolving Credit Facility
See Note D – Revolving Credit Facility in the Notes to Consolidated Financial Statements in Item 1 of this Form 10-Q for detailed information.
Term Loan, Net
See Note E – Term Loan, Net in the Notes to Consolidated Financial Statements in Item 1 of this Form 10-Q for detailed information.
Convertible Senior Debt, Net
See Note F – Convertible Senior Debt, Net in the Notes to Consolidated Financial Statements in Item 1 of this Form 10-Q for detailed information.
48
Cash Flows
Operating Activities
Net cash provided by operating activities was $34,731,000 and $54,981,000 for the three months ended March 31, 2018 and 2017, respectively. The net decrease in cash provided by operating activities is the result of changes in operating assets and liabilities, including additional cash used to pay organizational transformation and termination benefits of approximately $13,000,000 between the comparable periods.
Investing Activities
Net cash provided by (used in) investing activities was $239,814,000 and $(82,957,000) for the three months ended March 31, 2018 and 2017, respectively, and consisted of the following:
Three Months Ended March 31, | ||||||
2018 | 2017 | |||||
(in thousands) | ||||||
Capital expenditures: | ||||||
Construction and development costs: | ||||||
The Yards - L2, an apartment community under construction in Washington, D.C. | (13,512 | ) | (619 | ) | ||
Ardan, an apartment community under construction in Dallas, Texas | (12,196 | ) | (6,093 | ) | ||
The Yards - The Guild, an apartment community under construction in Washington, D.C. | (8,188 | ) | (9,251 | ) | ||
Axis, an apartment community under construction in Los Angeles, California | (6,151 | ) | (13,052 | ) | ||
The Bridge at Cornell Tech, an office building in Roosevelt Island, New York | (5,195 | ) | (11,229 | ) | ||
Mint Town Center, an apartment community under construction in Denver, Colorado | (3,905 | ) | (12,222 | ) | ||
461 Dean Street, an apartment community in Brooklyn, New York | — | (7,828 | ) | |||
Other | (8,412 | ) | (17,733 | ) | ||
Total construction and development costs (1) | (57,559 | ) | (78,027 | ) | ||
Operating properties: | ||||||
Office Segment | (4,975 | ) | (7,087 | ) | ||
Apartment Segment | (2,695 | ) | (3,920 | ) | ||
Retail Segment | (34 | ) | (163 | ) | ||
(7,704 | ) | (11,170 | ) | |||
Tenant improvements: | ||||||
Office Segment | (1,234 | ) | (7,215 | ) | ||
Retail Segment | (726 | ) | (252 | ) | ||
(1,960 | ) | (7,467 | ) | |||
Corporate Segment | (86 | ) | (21 | ) | ||
Total capital expenditures | $ | (67,309 | ) | $ | (96,685 | ) |
Payment of lease procurement costs (2) | (3,441 | ) | (1,842 | ) | ||
Increase in notes receivable | (12,251 | ) | (6,768 | ) | ||
Proceeds from deconsolidation of a rental property | 24,000 | — | ||||
Proceeds from disposition of full or partial interest in rental properties or development project: | ||||||
461 Dean Street | $ | 147,193 | $ | — | ||
Sale of development opportunity | 10,449 | — | ||||
Federally Assisted Housing apartment communities | 350 | — | ||||
Illinois Science & Technology Park | — | 16,494 | ||||
Other | — | 9,302 | ||||
Total proceeds from disposition of full or partial interest in rental properties or development project | $ | 157,992 | $ | 25,796 | ||
Change in investments in and advances to unconsolidated entities—(contributions to) or distributions from investment: | ||||||
Dispositions: | ||||||
Regional Malls - QIC | $ | 74,203 | $ | — | ||
Federally Assisted Housing apartment communities | 43 | 18,122 | ||||
Shops at Bruckner Boulevard | — | 3,399 | ||||
Renewable energy facilities | — | 3,372 | ||||
Apartment projects: | ||||||
Bayside Village, an apartment community in San Francisco, California, refinancing proceeds | 80,896 | — | ||||
Pacific Park Brooklyn joint venture | (1,687 | ) | (18,311 | ) | ||
VYV, an apartment community under construction in Jersey City, New Jersey | (1,121 | ) | (1,611 | ) | ||
Retail projects: | ||||||
Regional retail mall joint venture, primarily reimbursements (funding) for rehabilitation and expansion projects | 12,573 | (3,986 | ) | |||
Galleria at Sunset, a regional mall in Henderson, Nevada, to fund partial mortgage paydown | (14,350 | ) | — | |||
Other | (9,734 | ) | (4,443 | ) | ||
Total change in investments in and advances to unconsolidated entities | $ | 140,823 | $ | (3,458 | ) | |
Net cash (used in) provided by investing activities | $ | 239,814 | $ | (82,957 | ) | |
49
(1) | We capitalized internal costs related to projects under construction and development of $7,309 and $8,794, including compensation related costs of $5,866 and $7,833, for the three months ended March 31, 2018 and 2017, respectively. Total capitalized internal costs represent approximately 10.86% and 9.10% of total capital expenditures for the three months ended March 31, 2018 and 2017, respectively. |
(2) | We capitalized internal costs related to leasing activities of $185 and $245, including compensation related costs of $185 and $203, for the three months ended March 31, 2018 and 2017, respectively. |
Financing Activities
Net cash provided by (used in) financing activities was $34,340,000 and $(7,165,000) for the three months ended March 31, 2018 and 2017, respectively. The Company is committed to continued deleveraging of the balance sheet and increasing our dividends to stockholders. The significant mortgage activity during the three months ended March 31, 2018 relates to the payoff of mortgages at Aster Town Center North and Edgworth Building, offset by increases in mortgages, primarily related to under construction projects. The significant mortgage activity during the three months ended March 31, 2017 related to the sale of Illinois Science & Technology Park and the related extinguishment of its $51,274,000 nonrecourse mortgage. However, this debt extinguishment occurred simultaneously at closing of the property disposition, and therefore is reflected as a non-cash cash flow transaction and not reflected in the Consolidated Statement of Cash Flows.
LEGAL PROCEEDINGS
We are involved in various claims and lawsuits incidental to our business, and management and legal counsel believe these claims and lawsuits will not have a material adverse effect on our consolidated financial statements.
NEW ACCOUNTING GUIDANCE
See the “New Accounting Guidance” section of Note A – Accounting Policies in the Notes to Consolidated Financial Statements in Item 1 of this Form 10-Q for detailed information.
50
INFORMATION RELATED TO FORWARD-LOOKING STATEMENTS
This Form 10-Q, together with other statements and information publicly disseminated by us, contains “forward-looking statements” within the meaning of Section 27A of the Securities Act of 1933, as amended, and Section 21E of the Securities Exchange Act of 1934, as amended. Such statements reflect management’s current views with respect to financial results related to future events and are based on assumptions and expectations that may not be realized and are inherently subject to risks and uncertainties, many of which cannot be predicted with accuracy and some of which might not even be anticipated. Future events and actual results, financial or otherwise, may differ, perhaps materially, from the results discussed in the forward-looking statements. Risk factors discussed in Item 1 A of our Form 10-K for the year ended December 31, 2017 and other factors that might cause differences, some of which could be material, include, but are not limited to, the uncertain impact, effects and results of our Board of Directors’ completed review of operating, strategic, financial and structural alternatives, our ability to carry out future transactions and strategic investments, as well as the acquisition related costs, unanticipated difficulties realizing benefits expected when entering into a transaction, our ability to qualify or to remain qualified as a REIT, our ability to satisfy REIT distribution requirements, the impact of issuing equity, debt or both, and selling assets to satisfy our future distributions required as a REIT or to fund capital expenditures, future growth and expansion initiatives, the impact of the amount and timing of any future distributions, the impact from complying with REIT qualification requirements limiting our flexibility or causing us to forego otherwise attractive opportunities beyond rental real estate operations, the impact of complying with the REIT requirements related to hedging, our lack of experience operating as a REIT, legislative, administrative, regulatory or other actions affecting REITs, including positions taken by the Internal Revenue Service, the possibility that our Board of Directors will unilaterally revoke our REIT election, the possibility that the anticipated benefits of qualifying as a REIT will not be realized, or will not be realized within the expected time period, the impact of current lending and capital market conditions on our liquidity, our ability to finance or refinance projects or repay our debt, the impact of the slow economic recovery on the ownership, development and management of our commercial real estate portfolio, general real estate investment and development risks, litigation risks, vacancies in our properties, risks associated with developing and managing properties in partnership with others, competition, our ability to renew leases or re-lease spaces as leases expire, illiquidity of real estate investments, our ability to identify and transact on chosen strategic alternatives for a portion of our retail portfolio, bankruptcy or defaults of tenants, anchor store consolidations or closings, the impact of terrorist acts and other armed conflicts, our substantial debt leverage and the ability to obtain and service debt, the impact of restrictions imposed by our revolving credit facility, term loan and senior debt, exposure to hedging agreements, the level and volatility of interest rates, the continued availability of tax-exempt government financing, our ability to receive payment on the note receivable issued by Onexim in connection with their purchase of our interests in the Barclays Center, the impact of credit rating downgrades, effects of uninsured or underinsured losses, effects of a downgrade or failure of our insurance carriers, environmental liabilities, competing interests of our directors and executive officers, the ability to recruit and retain key personnel, risks associated with the sale of tax credits, downturns in the housing market, the ability to maintain effective internal controls, compliance with governmental regulations, increased legislative and regulatory scrutiny of the financial services industry, changes in federal, state or local tax laws and international trade agreements, volatility in the market price of our publicly traded securities, inflation risks, cybersecurity risks, cyber incidents, shareholder activism efforts, conflicts of interest, risks related to our organizational structure including operating through our Operating Partnership and our UPREIT structure, as well as other risks listed from time to time in our SEC filings, including but not limited to, our annual and quarterly reports. We have no obligation to revise or update any forward-looking statements, other than as imposed by law, as a result of future events or new information. Readers are cautioned not to place undue reliance on such forward-looking statements.
Item 3. Quantitative and Qualitative Disclosures About Market Risk
Our market risk includes the inability to obtain construction loans, refinance existing construction loans into long-term fixed-rate nonrecourse financing, refinance existing nonrecourse financing at maturity, obtain renewals or replacement of credit enhancement devices, such as letters of credit, or otherwise obtain funds by selling real estate assets or by raising equity. We also have interest-rate exposure on our current variable-rate debt portfolio. During the construction period, we have historically used variable-rate debt to finance developmental projects. Upon opening and achieving stabilized operations, we have historically procured long-term fixed-rate financing for our rental properties. If we are unable to procure long-term fixed-rate financing, we would pursue extending maturities with existing lenders. Additionally, we are exposed to interest rate risk upon maturity of our long-term fixed-rate financings. The total weighted average interest rate includes the impact of interest rate swaps and caps for applicable fixed rate and variable rate debt in place as of March 31, 2018.
51
Interest Rate Exposure
The following table summarizes the composition of nonrecourse debt, net:
March 31, 2018 | Corporate | Operating Properties | Development Projects | Total | Total Weighted Average Rate | ||||||||||
(dollars in thousands) | |||||||||||||||
Fixed Rate | $ | 112,741 | $ | 1,687,315 | $ | 52,819 | $ | 1,852,875 | 4.23 | % | |||||
Variable Rate | |||||||||||||||
Taxable | 333,768 | 556,663 | — | 890,431 | 3.68 | % | |||||||||
Tax-Exempt | — | 593,493 | 76,908 | 670,401 | 2.47 | % | |||||||||
$ | 446,509 | $ | 2,837,471 | $ | 129,727 | $ | 3,413,707 | 3.74 | % | ||||||
Total gross commitment from lenders | $ | 228,447 | |||||||||||||
To mitigate short-term variable interest rate risk, we have purchased interest rate hedges for our variable-rate debt as follows:
Taxable (Priced off of LIBOR Index)
Swaps | ||||
Notional | Average Base | |||
Period Covered | Amount | Rate | ||
(dollars in thousands) | ||||
04/01/18 - 12/31/18 | $ | 97,059 | 1.87% | |
01/01/19 - 05/08/24 | 95,874 | 1.87% | ||
Tax-Exempt (Priced off of Securities Industry and Financial Markets Association (“SIFMA”) Index)
Caps | ||||
Notional | Average Base | |||
Period Covered | Amount | Rate | ||
(dollars in thousands) | ||||
04/01/18 - 12/31/18 | $ | 69,518 | 5.89% | |
01/01/19 - 12/31/19 | 37,208 | 6.23% | ||
01/01/20 - 8/15/20 | 28,400 | 6.00% | ||
The tax-exempt caps generally were purchased in conjunction with lender hedging requirements that require the borrower to protect against significant fluctuations in interest rates. Except for those requirements, we generally do not hedge tax-exempt debt due to its historically low interest rates.
Sensitivity Analysis to Changes in Interest Rates
Including the effect of the protection provided by the interest rate swaps, caps and long-term contracts in place as of March 31, 2018, a 100 basis point increase in taxable interest rates (including corporate debt and the effect of interest rate floors) would increase the annual pre-tax interest cost for the next 12 months of our variable-rate debt by approximately $7,934,000 at March 31, 2018. Although tax-exempt rates generally move in an amount smaller than corresponding changes in taxable interest rates, a 100 basis point increase in tax-exempt rates would increase the annual pre-tax interest cost for the next 12 months of our tax-exempt variable-rate debt by approximately $6,704,000 at March 31, 2018. This analysis includes a portion of our taxable and tax-exempt variable-rate debt related to construction loans for which the interest expense is capitalized.
We enter into total rate of return swaps (“TROR”) on various tax-exempt fixed-rate borrowings. The TROR convert borrowings from a fixed rate to a variable rate. The TROR requires the payment of a variable interest rate, generally equivalent to the SIFMA rate (1.58% at March 31, 2018) plus a spread. Additionally, we have guaranteed the fair value of the underlying borrowings. Fluctuation in the value of the TROR is offset by the fluctuation in the value of the underlying borrowings, resulting in minimal financial impact. At March 31, 2018, the aggregate notional amount of TROR designated as fair value hedging instruments is $597,166,000. The underlying TROR borrowings are subject to a fair value adjustment. In addition, we have TROR with notional amounts aggregating $180,461,000 that are not designated as fair value hedging instruments, but are subject to interest rate risk.
52
We estimate the fair value of our hedging instruments based on interest rate market and bond pricing models. At March 31, 2018 and December 31, 2017, we recorded interest rate caps, swaps and TROR with positive fair values of approximately $5,661,000 and $9,098,000, respectively, in other assets. At March 31, 2018 and December 31, 2017, we recorded interest rate swaps and TROR that had a negative fair value of approximately $12,663,000 and $12,845,000, respectively, in accounts payable, accrued expenses and other liabilities.
We estimate the fair value of our long-term debt instruments by market rates, if available, or by discounting future cash payments at interest rates that approximate the current market. Estimated fair value is based upon market prices of public debt, available industry financing data, current treasury rates and recent financing transactions. Based on these parameters, the table below contains the estimated fair value of our long-term debt, net (exclusive of the fair value of derivatives) at March 31, 2018.
Carrying Value | Fair Value | Fair Value with 100 bp Increase in Market Rates | |||||||||
(in thousands) | |||||||||||
Fixed | $ | 1,852,875 | $ | 1,835,432 | $ | 1,751,965 | |||||
Variable | |||||||||||
Taxable | 890,431 | 892,034 | 891,248 | ||||||||
Tax-Exempt | 670,401 | 668,636 | 668,469 | ||||||||
Total Variable | $ | 1,560,832 | $ | 1,560,670 | $ | 1,559,717 | |||||
Total Long-Term Debt | $ | 3,413,707 | $ | 3,396,102 | $ | 3,311,682 | |||||
The following table provides information about our long-term debt instruments that are sensitive to changes in interest rates.
53
Item 3. Quantitative and Qualitative Disclosures About Market Risk (continued)
March 31, 2018
Expected Maturity Date | |||||||||||||||||||||||||||||||||
Year Ending December 31, | |||||||||||||||||||||||||||||||||
Long-Term Debt | 2018 | 2019 | 2020 | 2021 | 2022 | Period Thereafter | Net Unamortized Procurement Costs | Total Outstanding | Fair Market Value | ||||||||||||||||||||||||
(dollars in thousands) | |||||||||||||||||||||||||||||||||
Fixed: | |||||||||||||||||||||||||||||||||
Fixed-rate debt | $ | 155,004 | $ | 99,269 | $ | 159,023 | $ | 170,626 | $ | 205,059 | $ | 962,914 | $ | (11,761 | ) | $ | 1,740,134 | $ | 1,721,907 | ||||||||||||||
Weighted average interest rate | 4.18 | % | 4.07 | % | 5.04 | % | 4.64 | % | 4.83 | % | 3.95 | % | 4.25 | % | |||||||||||||||||||
Convertible senior debt (1) | 73,208 | — | 40,017 | — | — | — | (484 | ) | 112,741 | 113,525 | |||||||||||||||||||||||
Weighted average interest rate | 4.25 | % | — | % | 3.63 | % | — | % | — | % | — | % | 4.03 | % | |||||||||||||||||||
Total Fixed-Rate Debt | 228,212 | 99,269 | 199,040 | 170,626 | 205,059 | 962,914 | (12,245 | ) | 1,852,875 | 1,835,432 | |||||||||||||||||||||||
Variable: | |||||||||||||||||||||||||||||||||
Variable-rate debt | 177,337 | 253,674 | 85,115 | 24,386 | 201 | 23,632 | (7,682 | ) | 556,663 | 558,177 | |||||||||||||||||||||||
Weighted average interest rate (2) | 4.23 | % | 3.91 | % | 4.17 | % | 4.63 | % | 4.37 | % | 4.03 | % | 4.08 | % | |||||||||||||||||||
Tax-exempt | 48,695 | 8,500 | — | — | — | 626,004 | (12,798 | ) | 670,401 | 668,636 | |||||||||||||||||||||||
Weighted average interest rate (2) | 2.58 | % | 4.62 | % | — | — | — | 2.43 | % | 2.47 | % | ||||||||||||||||||||||
Revolving credit facility (1) | — | — | — | — | — | — | — | — | |||||||||||||||||||||||||
Weighted average interest rate (2) | — | % | — | % | — | % | — | % | — | % | — | % | — | % | |||||||||||||||||||
Term loan (1) | — | — | — | 335,000 | — | — | (1,232 | ) | 333,768 | 333,857 | |||||||||||||||||||||||
Weighted average interest rate (2) | — | % | — | % | — | % | 3.01 | % | — | % | — | % | 3.01 | % | |||||||||||||||||||
Total Variable-Rate Debt | 226,032 | 262,174 | 85,115 | 359,386 | 201 | 649,636 | (21,712 | ) | 1,560,832 | 1,560,670 | |||||||||||||||||||||||
Total Long-Term Debt | $ | 454,244 | $ | 361,443 | $ | 284,155 | $ | 530,012 | $ | 205,260 | $ | 1,612,550 | $ | (33,957 | ) | $ | 3,413,707 | $ | 3,396,102 | ||||||||||||||
Weighted average interest rate | 4.04 | % | 3.97 | % | 4.58 | % | 3.61 | % | 4.83 | % | 3.36 | % | 3.74 | % | |||||||||||||||||||
(1) | Represents recourse debt. |
(2) | Weighted average interest rate is based on current market rates as of March 31, 2018. |
54
Item 4. Controls and Procedures
The Company maintains a set of disclosure controls and procedures designed to ensure that information required to be disclosed by the Company in reports that it files or furnishes under the Securities Exchange Act of 1934 (“Securities Exchange Act”) is recorded, processed, summarized and reported within the time periods specified in Securities and Exchange Commission rules and forms and that such information is accumulated and communicated to the Company’s management, including the Chief Executive Officer (“CEO”) and Chief Financial Officer (“CFO”), as appropriate, to allow timely decisions regarding required disclosure. As of the end of the period covered by this quarterly report, an evaluation of the effectiveness of the Company’s disclosure controls and procedures, as defined in Rules 13a-15(e) and 15d-15(e) under the Securities Exchange Act, was carried out under the supervision and with the participation of the Company’s management, which includes the CEO and CFO. Based on that evaluation, the CEO and CFO have concluded that the Company’s disclosure controls and procedures were effective as of March 31, 2018.
There have been no changes in the Company’s internal control over financial reporting that occurred during the quarter ended March 31, 2018 that have materially affected, or are reasonably likely to materially affect, the Company’s internal control over financial reporting.
In connection with the rules, the Company continues to review and document its disclosure controls and procedures, including the Company’s internal control over financial reporting, and may from time to time make changes aimed at enhancing their effectiveness and ensuring that the Company’s systems evolve with the business.
PART II — OTHER INFORMATION
Item 1. Legal Proceedings
The Company is involved in various claims and lawsuits incidental to its business, and management and legal counsel believe these claims and lawsuits will not have a material adverse effect on the Company’s consolidated financial statements.
55
Item 2. Unregistered Sales of Equity Securities and Use of Proceeds
(a) and (b) – Not applicable.
(c) – Repurchase of equity securities during the quarter.
Issuer Purchases of Equity Securities | |||||||||||||
Period | Total Number of Shares Purchased | Average Price Paid Per Share | Total Number of Shares Purchased as Part of Publicly Announced Plans or Programs | Maximum Dollar Amount of Shares that May Yet Be Purchased Under the Plans or Programs | |||||||||
Class A Common Stock | |||||||||||||
January 1 through January 31, 2018 | |||||||||||||
Common Stock Repurchase Program (1) | — | $ | — | — | $ | 100,000,000 | |||||||
Employee Transactions (3) | 26,816 | $ | 23.71 | — | |||||||||
February 1 through February 28, 2018 | |||||||||||||
Common Stock Repurchase Program (1) | — | $ | — | — | $ | 100,000,000 | |||||||
Employee Transactions (3) | 40,735 | $ | 22.88 | — | |||||||||
March 1 through March 31, 2018 | |||||||||||||
Common Stock Repurchase Program (2) | — | $ | — | — | $ | 400,000,000 | |||||||
Employee Transactions (3) | 223,896 | $ | 20.01 | — | |||||||||
Total | |||||||||||||
Common Stock Repurchase Program (1) (2) | — | $ | — | — | $ | 400,000,000 | |||||||
Employee Transactions (3) | 291,447 | $ | 20.75 | — | |||||||||
(1) | On November 18, 2015, our Board of Directors approved a $100,000,000 common stock repurchase program. The repurchase program authorizes us to repurchase shares of our Class A common stock and Class B common stock (prior to June 12, 2017, the effective date of the Reclassification) on the open market or otherwise in amounts and at such times and prices as our authorized officers shall determine. The repurchase program has no set expiration date. |
(2) | On March 22, 2018, our Board of Directors approved an increase in the Company’s existing $100,000,000 common stock repurchase program to an aggregate total of $400,000,000. The repurchase program authorizes us to repurchase shares of our Class A common stock on the open market or otherwise in amounts and at such times and prices as the Board of Directors and authorized officers shall determine. The repurchase program has no set expiration date. |
(3) | Class A common stock repurchased to satisfy the minimum tax withholding requirements relating to restricted stock vesting. |
56
Item 6. Exhibits
Exhibit Number | Description of Document | |
+*10.1 | - | |
10.2 | ||
10.3 | ||
10.4 | ||
*31.1 | - | |
*31.2 | - | |
**32.1 | - | |
*101 | - | The following financial information from Forest City Realty Trust, Inc.’s Quarterly Report on Form 10-Q for the quarter ended March 31, 2018, formatted in XBRL (eXtensible Business Reporting Language): (i) Consolidated Balance Sheets (unaudited); (ii) Consolidated Statements of Operations (unaudited); (iii) Consolidated Statements of Comprehensive Income (Loss) (unaudited); (iv) Consolidated Statements of Equity (unaudited); (v) Consolidated Statements of Cash Flows (unaudited); and (vi) Notes to Consolidated Financial Statements (unaudited). |
+ | Management contract or compensatory arrangement. |
* | Filed herewith. |
** | Furnished herewith. |
57
SIGNATURES
Pursuant to the requirements of the Securities Exchange Act of 1934, the registrant has duly caused this report to be signed on its behalf by the undersigned thereunto duly authorized.
FOREST CITY REALTY TRUST, INC. (Registrant) | |||
Date: | May 3, 2018 | /s/ ROBERT G. O’BRIEN | |
Name: Robert G. O’Brien | |||
Title: Executive Vice President and Chief Financial Officer | |||
Date: | May 3, 2018 | /s/ CHARLES D. OBERT | |
Name: Charles D. Obert | |||
Title: Executive Vice President, Chief Accounting Officer and Corporate Controller | |||
58