Attached files
| file | filename |
|---|---|
| EX-99.1 - EX-99.1 - Regional Management Corp. | d579092dex991.htm |
| 8-K - 8-K - Regional Management Corp. | d579092d8k.htm |
Exhibit 99.2
1Q 2018 Earnings Call Presentation May 1, 2018
Safe Harbor Statement This presentation, the related remarks, and the responses to various questions may contain various “forward-looking statements” within the meaning of the Private Securities Litigation Reform Act of 1995, which represent Regional Management Corp.’s expectations or beliefs concerning future events. Words such as “may,” “will,” “should,” “likely,” “anticipates,” “expects,” “intends,” “plans,” “projects,” “believes,” “estimates,” “outlook,” and similar expressions may be used to identify these forward-looking statements. Such forward-looking statements are about matters that are inherently subject to risks and uncertainties, many of which are outside of the control of Regional Management. Factors that could cause actual results or performance to differ from the expectations expressed or implied in such forward-looking statements include, but are not limited to, the following: changes in general economic conditions, including levels of unemployment and bankruptcies; risks associated with Regional Management’s transition to a new loan origination and servicing software system; risks related to opening new branches, including the ability or inability to open new branches as planned; risks inherent in making loans, including repayment risks and value of collateral, which risks may increase in light of adverse or recessionary economic conditions; changes in interest rates; the risk that Regional Management’s existing sources of liquidity become insufficient to satisfy its needs or that its access to these sources becomes unexpectedly restricted; changes in federal, state, or local laws, regulations, or regulatory policies and practices, and risks associated with the manner in which laws and regulations are interpreted, implemented, and enforced; the impact of changes in tax laws, guidance, and interpretations, including related to certain provisions of the Tax Cuts and Jobs Act; the timing and amount of revenues that may be recognized by Regional Management; changes in current revenue and expense trends (including trends affecting delinquencies and credit losses); changes in Regional Management’s markets and general changes in the economy (particularly in the markets served by Regional Management); changes in the competitive environment in which Regional Management operates or in the demand for its products; risks related to acquisitions; changes in operating and administrative expenses; and the departure, transition, or replacement of key personnel. Such factors and others are discussed in greater detail in Regional Management’s filings with the Securities and Exchange Commission. We cannot guarantee future events, results, actions, levels of activity, performance, or achievements. Except to the extent required by law, neither Regional Management nor any of its respective agents, employees, or advisors intend or have any duty or obligation to supplement, amend, update, or revise any forward-looking statement, whether as a result of new information, future developments, or otherwise. The information and opinions contained in this document are provided as of the date of this presentation and are subject to change without notice. This document has not been approved by any regulatory or supervisory authority. 2
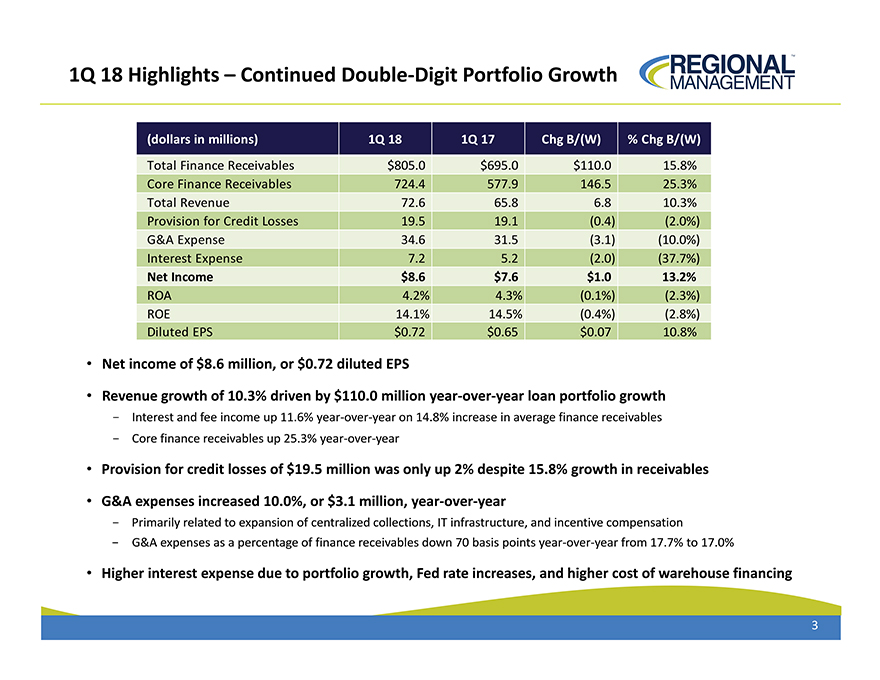
1Q 18 Highlights – Continued Double-Digit Portfolio Growth (dollars in millions) 1Q 18 1Q 17 Chg B/(W) % Chg B/(W) Total Finance Receivables $805.0 $695.0 $110.0 15.8% Core Finance Receivables 724.4 577.9 146.5 25.3% Total Revenue 72.6 65.8 6.8 10.3% Provision for Credit Losses 19.5 19.1 (0.4) (2.0%) G&A Expense 34.6 31.5 (3.1) (10.0%) Interest Expense 7.2 5.2 (2.0) (37.7%) Net Income $8.6 $7.6 $1.0 13.2% ROA 4.2% 4.3% (0.1%) (2.3%) ROE 14.1% 14.5% (0.4%) (2.8%) Diluted EPS $0.72 $0.65 $0.07 10.8% Net income of $8.6 million, or $0.72 diluted EPS Revenue growth of 10.3% driven by $110.0 million year-over-year loan portfolio growth Interest and fee income up 11.6% year-over-year on 14.8% increase in average finance receivables Core finance receivables up 25.3% year-over-year Provision for credit losses of $19.5 million was only up 2% despite 15.8% growth in receivables G&A expenses increased 10.0%, or $3.1 million, year-over-year Primarily related to expansion of centralized collections, IT infrastructure, and incentive compensation G&A expenses as a percentage of finance receivables down 70 basis points year-over-year from 17.7% to 17.0% Higher interest expense due to portfolio growth, Fed rate increases, and higher cost of warehouse financing 3
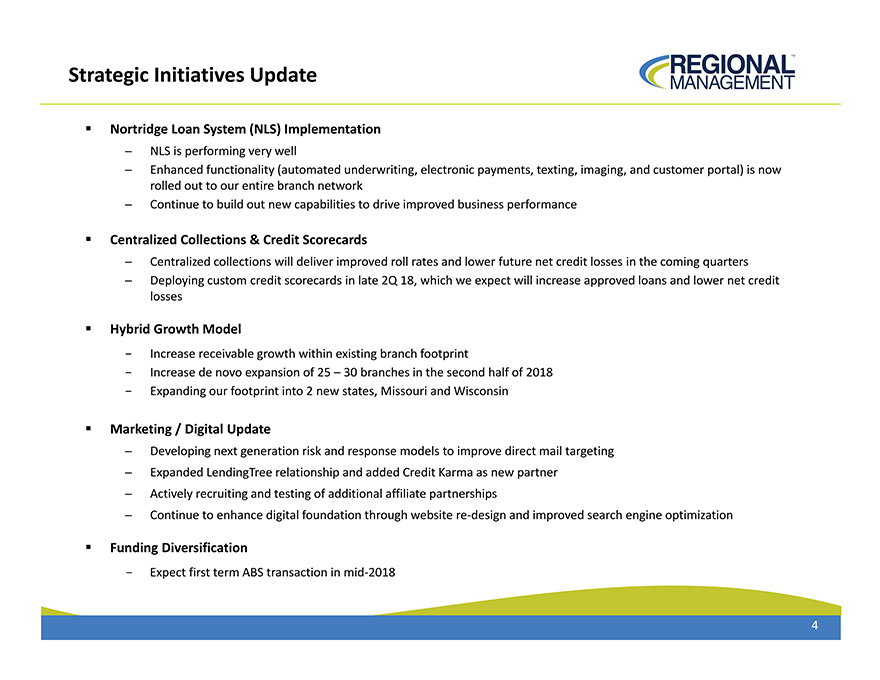
Strategic Initiatives Update Nortridge Loan System (NLS) Implementation NLS is performing very well Enhanced functionality (automated underwriting, electronic payments, texting, imaging, and customer portal) is now rolled out to our entire branch network Continue to build out new capabilities to drive improved business performance Centralized Collections & Credit Scorecards Centralized collections will deliver improved roll rates and lower future net credit losses in the coming quarters Deploying custom credit scorecards in late 2Q 18, which we expect will increase approved loans and lower net credit losses Hybrid Growth Model—Increase receivable growth within existing branch footprint—Increase de novo expansion of 25 – 30 branches in the second half of 2018—Expanding our footprint into 2 new states, Missouri and Wisconsin Marketing /Digital Update Developing next generation risk and response models to improve direct mail targeting Expanded LendingTree relationship and added Credit Karma as new partner Actively recruiting and testing of additional affiliate partnerships Continue to enhance digital foundation through website re-design and improved search engine optimization Funding Diversification—Expect first term ABS transaction in mid-2018 4
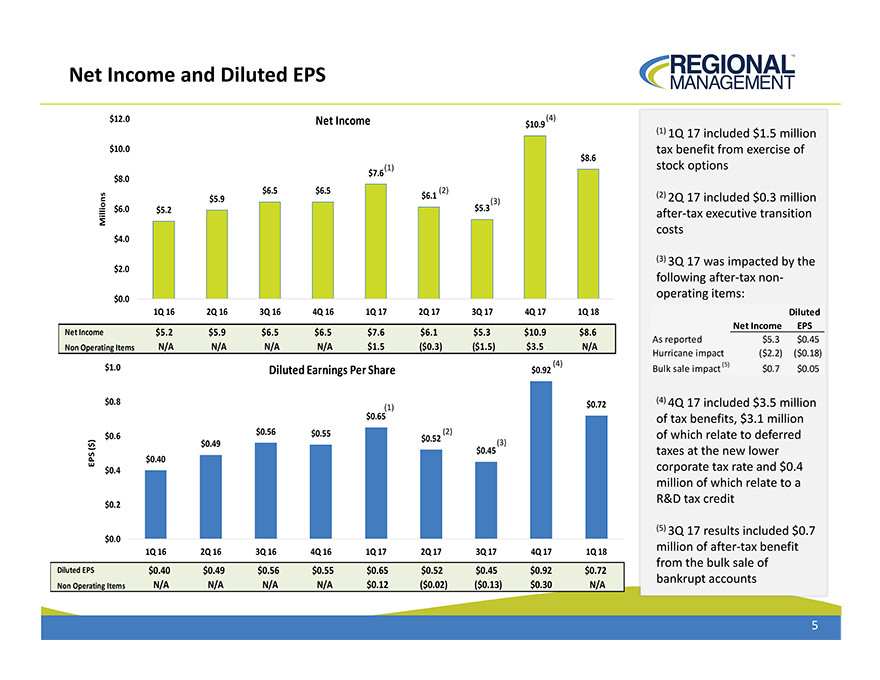
Net Income and Diluted EPS $12.0 Net Income $10.9 (4) $10.0 $8.6 $7.6 (1) $8.0 $6.5 $6.5 (2) $5.9 $6.1 (3) Millions $6.0 $5.2 $5.3 $4.0 $2.0 $0.0 1Q 16 2Q 16 3Q 16 4Q 16 1Q 17 2Q 17 3Q 17 4Q 17 1Q 18 Net Income $5.2 $5.9 $6.5 $6.5 $7.6 $6.1 $5.3 $10.9 $8.6 Non Operating Items N/A N/A N/A N/A $1.5 ($0.3) ($1.5) $3.5 N/A $1.0 Diluted Earnings Per Share $0.92 (4) $0.8 $0.72 (1) $0.65 $0.6 $0.56 $0.55 $0.52 (2) $ ) $0.49 (3) ( EPS $0.45 $0.40 $0.4 $0.2 $0.0 1Q 16 2Q 16 3Q 16 4Q 16 1Q 17 2Q 17 3Q 17 4Q 17 1Q 18 Diluted EPS $0.40 $0.49 $0.56 $0.55 $0.65 $0.52 $0.45 $0.92 $0.72 Non Operating Items N/A N/A N/A N/A $0.12 ($0.02) ($0.13) $0.30 N/A – (1) 1Q 17 included $1.5 million tax benefit from exercise of stock options – (2) 2Q 17 included $0.3 million after-tax executive transition costs – (3) 3Q 17 was impacted by the following after-tax non-operating items: Diluted Net Income EPS As reported $5.3 $0.45 Hurricane impact ($2.2) ($0.18) (5) Bulk sale impact $0.7 $0.05 – (4) 4Q 17 included $3.5 million of tax benefits, $3.1 million of which relate to deferred taxes at the new lower corporate tax rate and $0.4 million of which relate to a R&D tax credit – (5) 3Q 17 results included $0.7 million of after-tax benefit from the bulk sale of bankrupt accounts 5
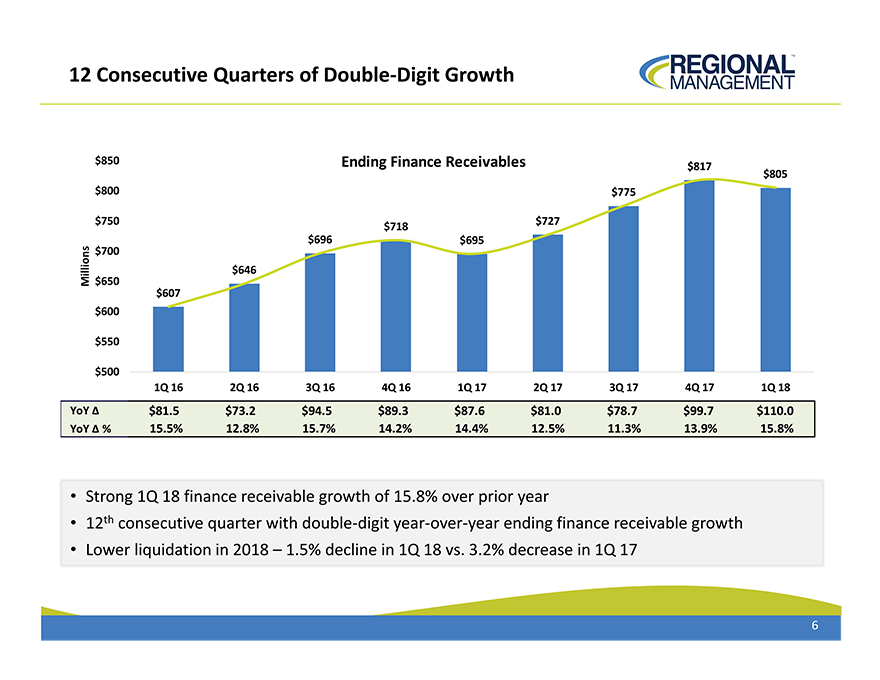
12 Consecutive Quarters of Double-Digit Growth $ 850 Ending Finance Receivables $817 $805 $ 800 $775 $ 750 $727 $718 $696 $695 $ 700 $646 Millions $ 650 $607 $ 600 $ 550 $ 500 1Q 16 2Q 16 3Q 16 4Q 16 1Q 17 2Q 17 3Q 17 4Q 17 1Q 18 YoY Δ $81.5 $73.2 $94.5 $89.3 $87.6 $81.0 $78.7 $99.7 $110.0 YoY Δ % 15.5% 12.8% 15.7% 14.2% 14.4% 12.5% 11.3% 13.9% 15.8% Strong 1Q 18 finance receivable growth of 15.8% over prior year 12th consecutive quarter with double-digit year-over-year ending finance receivable growth Lower liquidation in 2018 – 1.5% decline in 1Q 18 vs. 3.2% decrease in 1Q 17 6
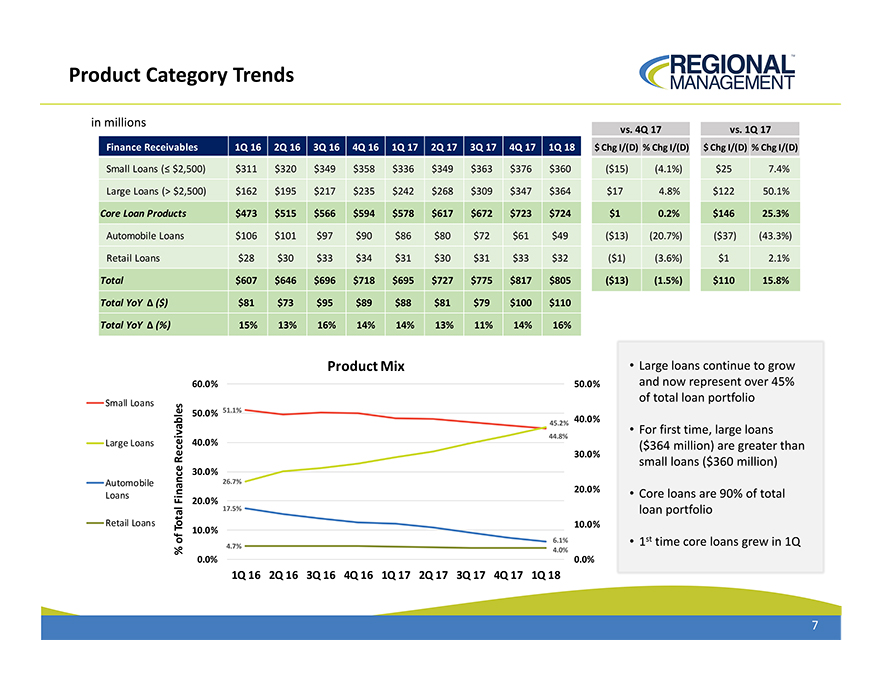
Product Category Trends in millions vs. 4Q 17 vs. 1Q 17 Finance Receivables 1Q 16 2Q 16 3Q 16 4Q 16 1Q 17 2Q 17 3Q 17 4Q 17 1Q 18 $ Chg I/(D) % Chg I/(D) $ Chg I/(D) % Chg I/(D) Small Loans (£ $2,500) $311 $320 $349 $358 $336 $349 $363 $376 $360 ($15) (4.1%) $25 7.4% Large Loans (> $2,500) $162 $195 $217 $235 $242 $268 $309 $347 $364 $17 4.8% $122 50.1% Core Loan Products $473 $515 $566 $594 $578 $617 $672 $723 $724 $1 0.2% $146 25.3% Automobile Loans $106 $101 $97 $90 $86 $80 $72 $61 $49 ($13) (20.7%) ($37) (43.3%) Retail Loans $28 $30 $33 $34 $31 $30 $31 $33 $32 ($1) (3.6%) $1 2.1% Total $607 $646 $696 $718 $695 $727 $775 $817 $805 ($13) (1.5%) $110 15.8% Total YoY Ä ($) $81 $73 $95 $89 $88 $81 $79 $100 $110 Total YoY Ä (%) 15% 13% 16% 14% 14% 13% 11% 14% 16% Product Mix Large loans continue to grow 60.0% 50.0% and now represent over 45% Small Loans of total loan portfolio 50.0% 51.1% 45.2% 40.0% For first time, large loans 44.8% Large Loans 40.0% ($364 million) are greater than 30.0% Receivables small loans ($360 million) 30.0% Automobile 26.7% Loans 20.0% Core loans are 90% of total Finance 20.0% 17.5% loan portfolio Retail Loans 10.0% Total 10.0% 6.1% 1st time core loans grew in 1Q 4.7% 4.0% 0.0% 0.0% 1Q 16 2Q 16 3Q 16 4Q 16 1Q 17 2Q 17 3Q 17 4Q 17 1Q 18 7
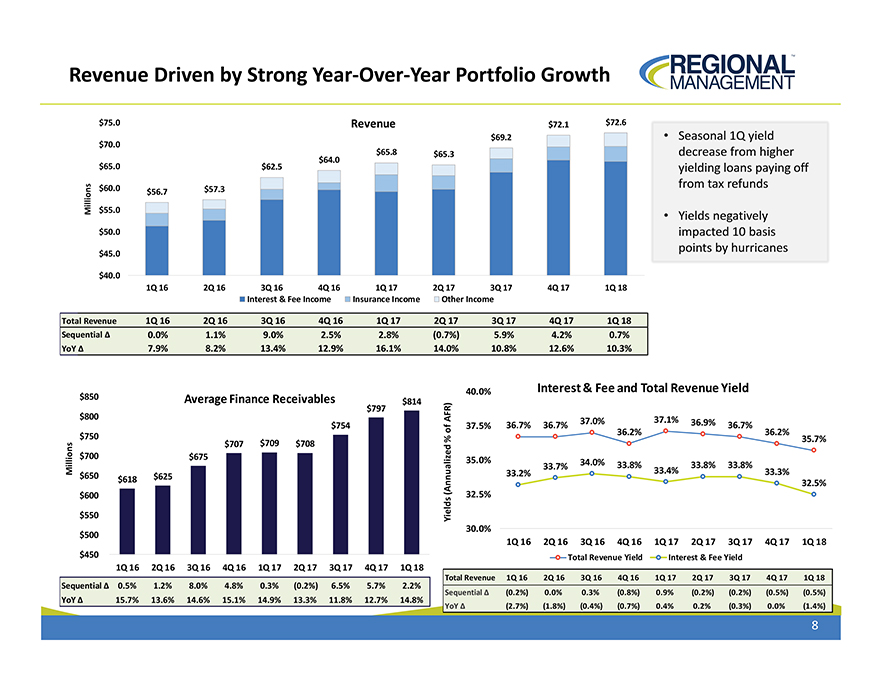
Revenue Driven by Strong Year-Over-Year Portfolio Growth $75.0 Revenue $72.1 $72.6 $69.2 Seasonal 1Q yield $70.0 $65.8 $65.3 decrease from higher $64.0 $65.0 $62.5 yielding loans paying off $60.0 $57.3 from tax refunds Millions $56.7 $55.0 Yields negatively $50.0 impacted 10 basis $45.0 points by hurricanes $40.0 1Q 16 2Q 16 3Q 16 4Q 16 1Q 17 2Q 17 3Q 17 4Q 17 1Q 18 Interest & Fee Income Insurance Income Other Income Total Revenue 1Q 16 2Q 16 3Q 16 4Q 16 1Q 17 2Q 17 3Q 17 4Q 17 1Q 18 Sequential Ä 0.0% 1.1% 9.0% 2.5% 2.8% (0.7%) 5.9% 4.2% 0.7% YoY Ä 7.9% 8.2% 13.4% 12.9% 16.1% 14.0% 10.8% 12.6% 10.3% 40.0% Interest & Fee and Total Revenue Yield $850 Average Finance Receivables $814 $797 $800 AFR) $754 37.5% 36.7% 36.7% 37.0% 37.1% 36.9% 36.7% $750 of 36.2% 36.2% 35.7% $707 $709 $708 % $700 $675 35.0% 34.0% 33.7% 33.8% 33.8% 33.8% Millions $650 33.2% 33.4% 33.3% $618 $625 32.5% $600 (Annualized 32.5% $550 Yields 30.0% $500 1Q 16 2Q 16 3Q 16 4Q 16 1Q 17 2Q 17 3Q 17 4Q 17 1Q 18 $450 Total Revenue Yield Interest & Fee Yield 1Q 16 2Q 16 3Q 16 4Q 16 1Q 17 2Q 17 3Q 17 4Q 17 1Q 18 Total Revenue 1Q 16 2Q 16 3Q 16 4Q 16 1Q 17 2Q 17 3Q 17 4Q 17 1Q 18 Sequential Ä 0.5% 1.2% 8.0% 4.8% 0.3% (0.2%) 6.5% 5.7% 2.2% Sequential Ä (0.2%) 0.0% 0.3% (0.8%) 0.9% (0.2%) (0.2%) (0.5%) (0.5%) YoY Ä 15.7% 13.6% 14.6% 15.1% 14.9% 13.3% 11.8% 12.7% 14.8% YoY Ä (2.7%) (1.8%) (0.4%) (0.7%) 0.4% 0.2% (0.3%) 0.0% (1.4%) 8
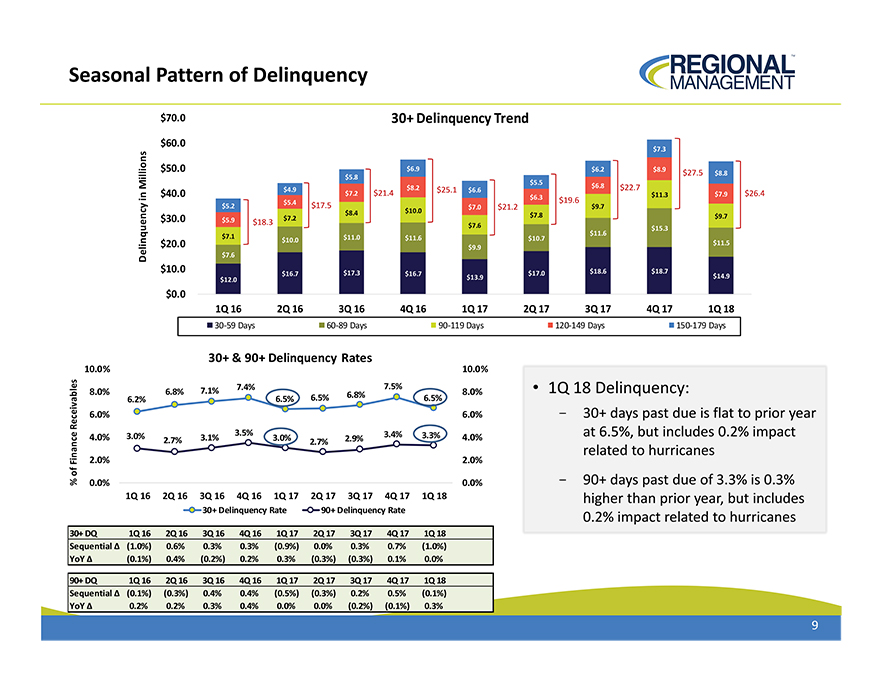
Seasonal Pattern of Delinquency $70.0 30+ Delinquency Trend $60.0 $7.3 $50.0 $6.9 $6.2 $8.9 $27.5 $8.8 $5.8 $5.5 $6.8 Millions $40.0 $4.9 $7.2 $21.4 $8.2 $25.1 $6.6 $22.7 $11.3 $7.9 $26.4 in $6.3 $19.6 Delinquency $5.2 $5.4 $17.5 $7.0 $21.2 $9.7 $10.0 $30.0 $5.9 $7.2 $8.4 $7.8 $9.7 $18.3 $7.6 $15.3 $7.1 $11.0 $11.6 $11.6 $20.0 $10.0 $10.7 $11.5 $9.9 $7.6 $10.0 $16.7 $17.3 $16.7 $17.0 $18.6 $18.7 $12.0 $13.9 $14.9 $0.0 1Q 16 2Q 16 3Q 16 4Q 16 1Q 17 2Q 17 3Q 17 4Q 17 1Q 18 30-59 Days 60-89 Days 90-119 Days 120-149 Days 150-179 Days 30+ & 90+ Delinquency Rates 10.0% 10.0% 8.0% 6.8% 7.1% 7.4% 7.5% 8.0% 1Q 18 Delinquency: 6.2% 6.5% 6.5% 6.8% 6.5% 6.0% 6.0% 30+ days past due is flat to prior year Receivables 3.5% at 6.5%, but includes 0.2% impact 4.0% 3.0% 2.7% 3.1% 3.0% 2.7% 2.9% 3.4% 3.3% 4.0% related to hurricanes Finance 2.0% 2.0% of % 0.0% 0.0% 90+ days past due of 3.3% is 0.3% 1Q 16 2Q 16 3Q 16 4Q 16 1Q 17 2Q 17 3Q 17 4Q 17 1Q 18 higher than prior year, but includes 30+ Delinquency Rate 90+ Delinquency Rate 0.2% impact related to hurricanes 30+ DQ 1Q 16 2Q 16 3Q 16 4Q 16 1Q 17 2Q 17 3Q 17 4Q 17 1Q 18 Sequential Ä (1.0%) 0.6% 0.3% 0.3% (0.9%) 0.0% 0.3% 0.7% (1.0%) YoY Ä (0.1%) 0.4% (0.2%) 0.2% 0.3% (0.3%) (0.3%) 0.1% 0.0% 90+ DQ 1Q 16 2Q 16 3Q 16 4Q 16 1Q 17 2Q 17 3Q 17 4Q 17 1Q 18 Sequential Ä (0.1%) (0.3%) 0.4% 0.4% (0.5%) (0.3%) 0.2% 0.5% (0.1%) YoY Ä 0.2% 0.2% 0.3% 0.4% 0.0% 0.0% (0.2%) (0.1%) 0.3% 9
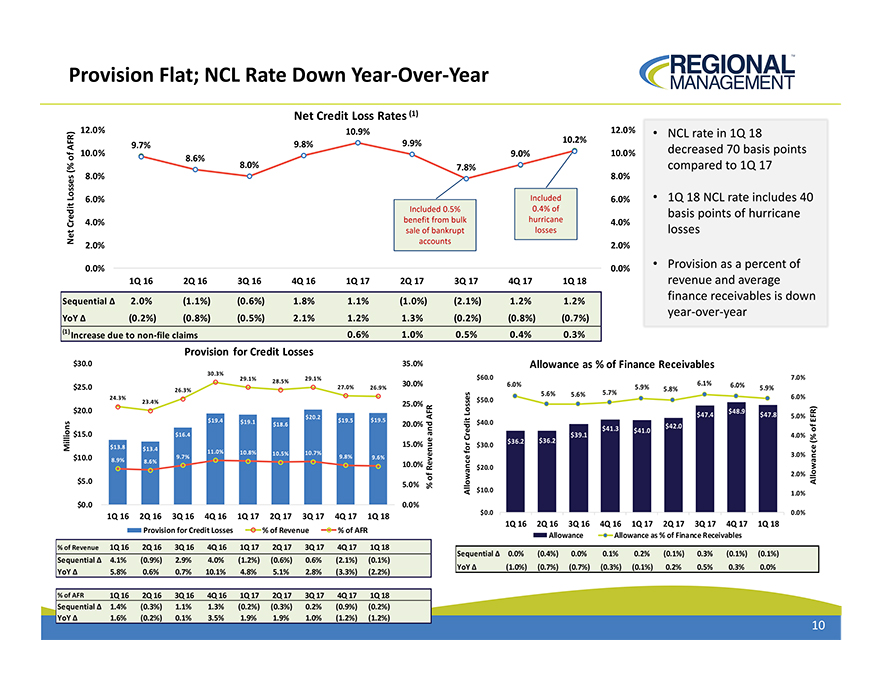
Provision Flat; NCL Rate Down Year-Over-Year Net Credit Loss Rates (1) 12.0% 10.9% 12.0% NCL rate in 1Q 18 9.7% 9.8% 9.9% 10.2% AFR) 10.0% 9.0% 10.0% decreased 70 basis points (% of 8.6% 8.0% 7.8% compared to 1Q 17 8.0% 8.0% Losses 6.0% Included 6.0% 1Q 18 NCL rate includes 40 Included 0.5% 0.4% of basis points of hurricane 4.0% benefit from bulk hurricane 4.0% Credit sale of bankrupt losses losses Net accounts 2.0% 2.0% 0.0% 0.0% Provision as a percent of 1Q 16 2Q 16 3Q 16 4Q 16 1Q 17 2Q 17 3Q 17 4Q 17 1Q 18 revenue and average Sequential Ä 2.0% (1.1%) (0.6%) 1.8% 1.1% (1.0%) (2.1%) 1.2% 1.2% finance receivables is down YoY Ä (0.2%) (0.8%) (0.5%) 2.1% 1.2% 1.3% (0.2%) (0.8%) (0.7%) year-over-year (1) Increase due to non-file claims 0.6% 1.0% 0.5% 0.4% 0.3% Provision for Credit Losses $30.0 35.0% Allowance as % of Finance Receivables 30.3% 29.1% 29.1% $60.0 7.0% 28.5% 30.0% 6.0% 6.1% $25.0 26.3% 27.0% 26.9% 5.9% 5.8% 6.0% 5.9% 5.6% 5.6% 5.7% 24.3% $50.0 6.0% 23.4% 25.0% $20.0 $48.9 $20.2 Losses $47.4 $47.8 5.0% AFR $19.4 $19.1 $18.6 $19.5 $19.5 20.0% $40.0 $42.0 EFR) $41.3 and $41.0 of $15.0 $16.4 Revenue $39.1 4.0% Credit $36.2 $36.2 (% 15.0% $30.0 Allowance Millions $13.8 $13.4 for $10.0 9.7% 11.0% 10.8% 10.5% 10.7% 9.8% 9.6% Allowance 3.0% 8.9% 8.6% 10.0% $20.0 2.0% $5.0 of 5.0% % $10.0 1.0% $0.0 0.0% 1Q 16 2Q 16 3Q 16 4Q 16 1Q 17 2Q 17 3Q 17 4Q 17 1Q 18 $0.0 0.0% 1Q 16 2Q 16 3Q 16 4Q 16 1Q 17 2Q 17 3Q 17 4Q 17 1Q 18 Provision for Credit Losses % of Revenue % of AFR Allowance Allowance as % of Finance Receivables % of Revenue 1Q 16 2Q 16 3Q 16 4Q 16 1Q 17 2Q 17 3Q 17 4Q 17 1Q 18 Sequential Ä 0.0% (0.4%) 0.0% 0.1% 0.2% (0.1%) 0.3% (0.1%) (0.1%) Sequential Ä 4.1% (0.9%) 2.9% 4.0% (1.2%) (0.6%) 0.6% (2.1%) (0.1%) YoY Ä (1.0%) (0.7%) (0.7%) (0.3%) (0.1%) 0.2% 0.5% 0.3% 0.0% YoY Ä 5.8% 0.6% 0.7% 10.1% 4.8% 5.1% 2.8% (3.3%) (2.2%) % of AFR 1Q 16 2Q 16 3Q 16 4Q 16 1Q 17 2Q 17 3Q 17 4Q 17 1Q 18 Sequential Ä 1.4% (0.3%) 1.1% 1.3% (0.2%) (0.3%) 0.2% (0.9%) (0.2%) YoY Ä 1.6% (0.2%) 0.1% 3.5% 1.9% 1.9% 1.0% (1.2%) (1.2%) 10
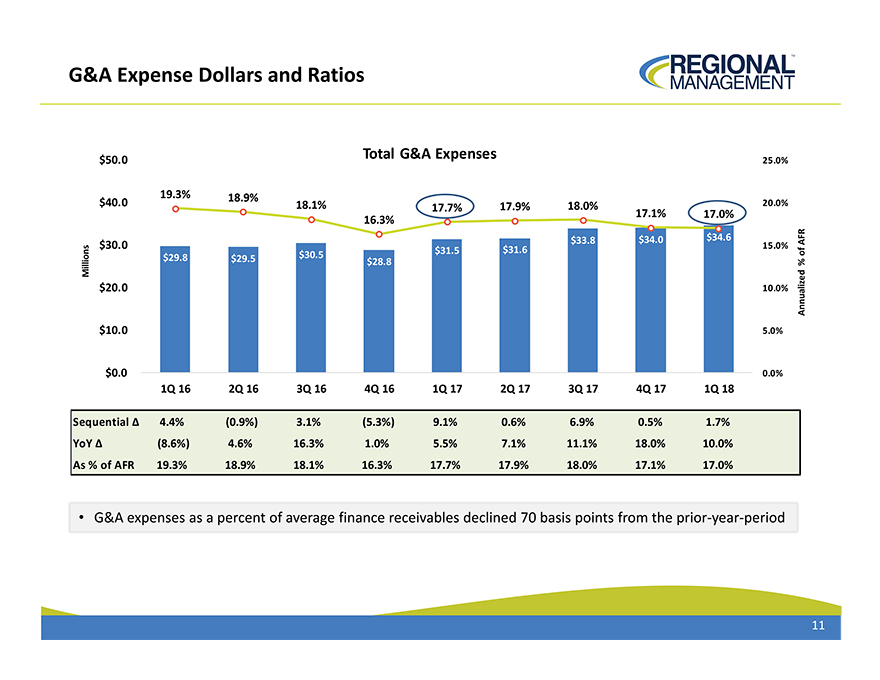
G&A Expense Dollars and Ratios Total G&A Expenses $50.0 25.0% 19.3% 18.9% $40.0 18.1% 17.7% 17.9% 18.0% 20.0% 16.3% 17.1% 17.0% $33.8 $34.0 $34.6 AFR $30.0 $31.5 $31.6 15.0% of $29.8 $29.5 $30.5 $28.8 % Millions $20.0 10.0% Annualized $10.0 5.0% $0.0 0.0% 1Q 16 2Q 16 3Q 16 4Q 16 1Q 17 2Q 17 3Q 17 4Q 17 1Q 18 Sequential Ä 4.4% (0.9%) 3.1% (5.3%) 9.1% 0.6% 6.9% 0.5% 1.7% YoY Ä (8.6%) 4.6% 16.3% 1.0% 5.5% 7.1% 11.1% 18.0% 10.0% As % of AFR 19.3% 18.9% 18.1% 16.3% 17.7% 17.9% 18.0% 17.1% 17.0% G&A expenses as a percent of average finance receivables declined 70 basis points from the prior-year-period 11
REGIONAL MANAGEMENT REGIONAL MANAGEMENT RM LISTED NYSE