Attached files
| file | filename |
|---|---|
| EX-32 - EX-32 - Regional Management Corp. | d105580dex32.htm |
| EX-31.2 - EX-31.2 - Regional Management Corp. | d105580dex312.htm |
| EX-31.1 - EX-31.1 - Regional Management Corp. | d105580dex311.htm |
| EX-10.8 - EX-10.8 - Regional Management Corp. | d105580dex108.htm |
| EX-23.1 - EX-23.1 - Regional Management Corp. | d105580dex231.htm |
| EX-21.1 - EX-21.1 - Regional Management Corp. | d105580dex211.htm |
Table of Contents
UNITED STATES
SECURITIES AND EXCHANGE COMMISSION
Washington, D.C. 20549
FORM 10-K
| x | ANNUAL REPORT PURSUANT TO SECTION 13 OR 15(d) OF THE SECURITIES EXCHANGE ACT OF 1934 |
For the fiscal year ended December 31, 2015
OR
| ¨ | TRANSITION REPORT PURSUANT TO SECTION 13 OR 15(d) OF THE SECURITIES EXCHANGE ACT OF 1934 |
For the transition period from to
Commission File Number: 001-35477
Regional Management Corp.
(Exact name of registrant as specified in its charter)
| Delaware | 57-0847115 | |
| (State or other jurisdiction of incorporation or organization) |
(I.R.S. Employer Identification No.) | |
| 509 West Butler Road Greenville, South Carolina |
29607 | |
| (Address of principal executive offices) | (Zip Code) | |
(864) 422-8011
(Registrant’s telephone number, including area code)
Securities registered pursuant to Section 12(b) of the Act:
| Title of Each Class |
Name of Each Exchange on Which Registered | |
| Common Stock, $0.10 par value | New York Stock Exchange |
Securities registered pursuant to Section 12(g) of the Act: None
Indicate by check mark if the registrant is a well-known seasoned issuer, as defined in Rule 405 of the Securities Act. Yes ¨ No x
Indicate by check mark if the registrant is not required to file reports pursuant to Section 13 or 15(d) of the Act. Yes ¨ No x
Indicate by check mark whether the registrant (1) has filed all reports required to be filed by Section 13 or 15(d) of the Securities Exchange Act of 1934 during the preceding 12 months (or for such shorter period that the registrant was required to file such reports), and (2) has been subject to such filing requirements for the past 90 days. Yes x No ¨
Indicate by check mark whether the registrant has submitted electronically and posted on its corporate Web site, if any, every Interactive Data File required to be submitted and posted pursuant to Rule 405 of Regulation S-T (§ 232.405 of this chapter) during the preceding 12 months (or for such shorter period that the registrant was required to submit and post such files). Yes x No ¨
Indicate by check mark if disclosure of delinquent filers pursuant to Item 405 of Regulation S-K (§ 229.405 of this chapter) is not contained herein, and will not be contained, to the best of registrant’s knowledge, in definitive proxy or information statements incorporated by reference in Part III of this Form 10-K or any amendment to the Form 10-K. x
Indicate by check mark whether the registrant is a large accelerated filer, an accelerated filer, a non-accelerated filer, or a smaller reporting company. See the definitions of “large accelerated filer,” “accelerated filer,” and “smaller reporting company” in Rule 12b-2 of the Exchange Act.
| Large accelerated filer | ¨ | Accelerated filer | x | |||
| Non-accelerated filer | ¨ (do not check if a smaller reporting company) | Smaller reporting company | ¨ | |||
Indicate by check mark whether the registrant is a shell company (as defined in Rule 12b-2 of the Act). Yes ¨ No x
As of June 30, 2015 (the last business day of the registrant’s most recently completed second fiscal quarter), the aggregate market value of the common stock held by non-affiliates of the registrant was $207,885,471 based upon the closing sale price as reported on the New York Stock Exchange. See Part II, Item 5 of this Annual Report on Form 10-K for additional information.
As of February 18, 2016, there were 12,841,729 shares of the registrant’s common stock outstanding.
Documents Incorporated by Reference
Certain information required by Part III of this Annual Report on Form 10-K is incorporated herein by reference to the Proxy Statement for the registrant’s 2016 Annual Meeting of Stockholders, which is expected to be filed pursuant to Regulation 14A within 120 days after the end of the registrant’s fiscal year ended December 31, 2015.
Table of Contents
REGIONAL MANAGEMENT CORP.
ANNUAL REPORT ON FORM 10-K
Fiscal Year Ended December 31, 2015
Table of Contents
This Annual Report on Form 10-K includes “forward-looking statements” within the meaning of the safe harbor provisions of the Private Securities Litigation Reform Act of 1995, including, but not limited to, certain statements and disclosures contained in Item 1, “Business,” Item 1A, “Risk Factors,” and Item 7, “Management’s Discussion and Analysis of Financial Condition and Results of Operations.” These forward-looking statements include, but are not limited to, statements about our strategies, future operations, future financial position, future revenues, projected costs, expectations regarding demand and acceptance for our financial products, growth opportunities and trends in the market in which we operate, prospects, plans and objectives of management, representations, and contentions, and are not historical facts. Forward-looking statements typically are identified by the use of terms such as “may,” “will,” “should,” “could,” “expect,” “plan,” “anticipate,” “believe,” “estimate,” “predict,” “potential,” “continue,” and similar words, although some forward-looking statements are expressed differently. We may not actually achieve the plans, intentions, or expectations disclosed in our forward-looking statements, and you should not place undue reliance on our forward-looking statements. Forward-looking statements included herein represent management’s current judgment and expectations, but our actual results, events, and performance could differ materially from the plans, intentions, and expectations disclosed in the forward-looking statements that we make. These forward-looking statements involve risks and uncertainties that could cause our actual results to differ materially from those in the forward-looking statements, including without limitation, the risks set forth in Item 1A, “Risk Factors” in this Annual Report on Form 10-K. We do not intend to update any of these forward-looking statements or publicly announce the results of or any revisions to these forward-looking statements, other than as is required under the federal securities laws.
The following discussion should be read in conjunction with, and is qualified in its entirety by reference to, our audited consolidated financial statements, including the notes thereto.
PART I
| ITEM 1. | BUSINESS. |
Overview
Regional Management Corp. (together with its subsidiaries, “Regional,” the “Company,” “we,” “us,” and “our”) was incorporated in South Carolina on March 25, 1987, and converted into a Delaware corporation on August 23, 2011. We are a diversified specialty consumer finance company providing a broad array of loan products primarily to customers with limited access to consumer credit from banks, thrifts, credit card companies, and other traditional lenders. We began operations in 1987 with four branches in South Carolina and have expanded our branch network to 331 locations with approximately 349,300 active accounts primarily across Alabama, Georgia, New Mexico, North Carolina, Oklahoma, South Carolina, Tennessee, Texas, and Virginia as of December 31, 2015. Most of our loan products are secured and each is structured on a fixed rate, fixed term basis with fully amortizing equal monthly installment payments, repayable at any time without penalty. Our loans are sourced through our multiple channel platform that includes our branches, direct mail campaigns, independent and franchise automobile dealerships, online credit application networks, retailers, and our consumer website. We operate an integrated branch model in which nearly all loans, regardless of origination channel, are serviced through our branch network, providing us with frequent in-person contact with our customers, which we believe improves our credit performance and customer loyalty. Our goal is to consistently and soundly grow our finance receivables and manage our portfolio risk while providing our customers with attractive and easy-to-understand loan products that serve their varied financial needs.
Our diversified product offerings include:
| • | Small Loans – We offer small installment loans ranging from $500 to $2,500, with terms of up to 36 months, which are typically secured by non-essential household goods. We originate these loans |
1
Table of Contents
| through our branches, via our consumer website, by customer referrals, and through direct mail campaigns. Our direct mail campaigns include convenience checks sent to pre-screened individuals who are able to enter into a loan by cashing or depositing these checks. As of December 31, 2015, we had approximately 274,700 small loans outstanding representing $338.2 million in finance receivables or an average of approximately $1,200 per loan. In 2015, 2014, and 2013, interest and fee income from small loans contributed $139.2 million, $134.7 million, and $98.0 million, respectively, to our total revenue. |
| • | Large Loans – We offer large installment loans through our branches ranging from $2,501 to $20,000, with terms of between 18 and 60 months. Our large loans are secured by either a vehicle, which may be an automobile, motorcycle, boat, or all-terrain vehicle, and/or non-essential household goods. As of December 31, 2015, we had approximately 37,700 large loans outstanding representing $146.6 million in finance receivables or an average of approximately $3,900 per loan. In 2015, 2014, and 2013, interest and fee income from large loans contributed $25.7 million, $11.5 million, and $12.5 million, respectively, to our total revenue. |
| • | Automobile Loans – We offer automobile loans of up to $27,500, generally with terms of between 36 and 72 months, that are secured by the purchased vehicle. Our automobile loans are offered through a network of dealers in our geographic footprint. Our automobile loans include both direct loans, which are sourced through a dealership and closed at one of our branches, and indirect loans, which are originated and closed at a dealership in our network without the need for the customer to visit one of our branches. As of December 31, 2015, we had approximately 13,700 automobile loans outstanding representing $116.1 million in finance receivables or an average of approximately $8,500 per loan. In 2015, 2014, and 2013, interest and fee income from automobile loans contributed $26.1 million, $33.4 million, and $36.2 million, respectively, to our total revenue. |
| • | Retail Loans – We offer indirect retail loans of up to $7,500, with terms of between 6 and 48 months, which are secured by the purchased item. These loans are offered through a network of retailers within and, to a limited extent, outside of our geographic footprint. As of December 31, 2015, we had approximately 23,200 retail loans outstanding representing $27.6 million in finance receivables or an average of approximately $1,200 per loan. In 2015, 2014, and 2013, interest and fee income from retail loans contributed $4.8 million, $5.2 million, and $5.6 million, respectively, to our total revenue. |
| • | Optional Credit Insurance Products – We offer our customers optional payment protection insurance relating to many of our loan products. In 2015, insurance income, net, was $11.7 million, or 5.4% of our total revenue. |
We have one reportable segment, which is the consumer finance segment. Our other revenue generating activities, including insurance operations, are performed in the existing branch network in conjunction with or as a complement to the lending operations. For financial information regarding the results of our only reportable segment, the consumer finance segment, for each of the last three fiscal years, refer to Item 6, “Selected Financial Data” and Item 8, “Financial Statements and Supplementary Data” of this Annual Report on Form 10-K.
Our Industry
We operate in the consumer finance industry serving the large population of non-prime and underbanked consumers who have limited access to credit from banks, thrifts, credit card companies, and other traditional lenders. According to the Federal Deposit Insurance Corporation (“FDIC”), there were approximately 51 million adults living in underbanked households in the United States in 2013, up from 43 million in 2009. While the number of non-prime consumers in the United States has grown, the supply of consumer credit to this demographic by traditional lenders has contracted. Following deregulation of the U.S. banking industry in the 1980s, many banks and finance companies that traditionally provided small denomination consumer credit refocused their businesses on larger loans with lower comparative origination costs and lower charge-off rates.
2
Table of Contents
We believe the large number of potential customers in our target market, combined with the decline in available consumer credit, provides an attractive market opportunity for our diversified product offerings – installment lending, automobile lending, and retail lending.
Installment Lending. Installment lending to non-prime and underbanked consumers is one of the most highly fragmented sectors of the consumer finance industry. Providers of installment loans, such as Regional, generally offer loans with longer terms and lower interest rates than other alternatives available to underbanked consumers, such as title, payday, and pawn lenders.
Automobile Lending. Automobile finance comprises one of the largest consumer finance markets in the United States. The automobile loan sector is generally segmented by the credit characteristics of the borrower. Automobile loans are typically initiated or arranged through automobile dealers nationwide who rely on financing to drive their automobile sales.
Retail Lending. The retail industry represents a large consumer market in which retailers often do not provide their own financing, but instead partner with large banks and credit card companies that generally limit their lending activities to prime borrowers. As a result, non-prime customers often do not qualify for financing from these traditional lenders.
Our Business Model and Operations
Integrated Branch Model. Our branch network, with 331 locations across 9 states as of December 31, 2015, serves as the foundation of our multiple channel platform and the primary point of contact with our approximately 349,300 active accounts. By integrating underwriting and loan servicing at the branch level, our employees are able to maintain a relationship with our customers throughout the life of a loan. For loans originated at a branch, underwriting decisions are typically made by our local branch manager. Our branch managers combine our company-wide underwriting standards and flexibility within our guidelines to consider each customer’s unique circumstances. This tailored branch-level underwriting approach allows us to both reject certain marginal loans that would otherwise be approved solely based on a credit report or automated loan approval system, as well as to selectively extend loans to customers with prior credit challenges who might otherwise be denied credit. In addition, nearly all loans, regardless of origination channel, are serviced through our branches, which allows us to maintain frequent, in-person contact with our customers. We believe this frequent-contact, relationship-driven lending model provides greater insight into potential payment difficulties and allows us to assess the borrowing needs of our customers and offer new loan products as their credit profiles evolve.
Multiple Channel Platform. We offer a diversified range of loan products through our multiple channel platform, which enables us to reach existing and new customers throughout our markets. We began building our strategically located branch network over 25 years ago and have expanded to 331 branches as of December 31, 2015. Our automobile loans are offered through a network of dealers in our geographic footprint. We offer direct automobile loans, which are sourced through a dealership and closed at one of our branches, and indirect automobile loans, which are closed at the dealership without the need for the customer to visit a branch. In addition, we have relationships with retailers that offer our retail loans in their stores at the point of sale. Our direct mail campaigns include pre-screened convenience check mailings and mailings of preapproved offers, prequalified offers, and invitations to apply, which enable us to market our products to hundreds of thousands of customers in a cost-effective manner. Finally, we have developed our consumer website to promote our products and facilitate loan applications and originations. We believe that our multiple channel platform provides us with a competitive advantage by giving us broad access to our existing customers and multiple avenues to attract new customers.
Attractive Products for Customers with Limited Access to Credit. Our flexible loan products, ranging from $500 to $27,500 with terms of up to 72 months, are competitively priced, easy to understand, and
3
Table of Contents
incorporate features designed to meet the varied financial needs and credit profiles of a broad array of consumers. This product diversity distinguishes us from monoline competitors and provides us with the ability to offer our customers new loan products as their credit profiles evolve, building customer loyalty and increasing the overall value of customer relationships.
We believe that the rates on our products are significantly more attractive than many other credit options available to our customers, such as payday, pawn, or title loans. We also differentiate ourselves from such alternative financial service providers by reporting our customers’ payment performance to credit bureaus. This practice provides our customers with the opportunity to improve their credit score by establishing a responsible payment history with us and ultimately to gain access to a wider range of credit options, including our own. We believe this opportunity for our customers to improve their credit history, combined with our diversity of products with competitive pricing and terms, distinguishes us in the consumer finance market and provides us with a competitive advantage.
Demonstrated Organic Growth. We have grown our finance receivables by 104.5% from $307.4 million at December 31, 2011 to $628.4 million at December 31, 2015. Our growth has come from both expanding our branch network and developing new channels and products. From 2011 to 2015, we grew our year-end branch count from 170 branches to 331 branches, a compound annual growth rate (“CAGR”) of 18.1%. We opened 31 new branches in 2015, and we have also grown our existing branch revenues. Historically, our branches have rapidly increased their outstanding finance receivables during the early years of operations and generally have quickly achieved profitability.
We have also grown by adding new channels and products, which are serviced at the local branch level. We introduced direct automobile purchase loans in 1998, and in late 2010, we expanded our product offerings to include indirect automobile purchase loans. Indirect automobile purchase loans allow customers to obtain a loan at a dealership without visiting one of our branches. Net loan originations from our convenience check program have grown from $55.3 million in 2011 to $179.5 million in 2015, a CAGR of 34.2%, as we have increased the volume of our convenience check marketing campaigns. We also introduced a consumer website enabling customers to complete a loan application online. Since the launch of our website in late 2008, we have received more than 164,000 web applications resulting in $40.9 million of gross loan originations.
Established Portfolio Performance. Despite the challenges posed by the sharp economic downturn beginning in 2008, our annual net charge-off rates between 2008 and 2013 remained consistent, ranging from 6.3% to 8.6% of our average finance receivables. In 2014, due to branch staffing issues in the first half of the year and convenience check credit quality deterioration in our mail campaigns between April and September, we experienced an uncharacteristically high annual net charge-off rate of 11.1% of our average finance receivables. In late 2014 and early 2015, we hired a Chief Risk Officer and other personnel focused on credit risk management, established a Credit Committee to oversee direct mail campaign underwriting and origination processes, implemented additional policies and internal control procedures related to the audit of direct mail campaign files, and improved upon early-stage delinquency reporting and communication. Through these initiatives and others, we reduced our annual net charge-off rate to 8.8% in 2015. We plan to carefully manage our credit exposure going forward as we grow our business, develop new products, and enter new markets.
We generally do not make loans to customers with limited stability as represented by length of time at their current employer and at their current residence, although we consider numerous other factors in evaluating a potential customer’s creditworthiness, such as unencumbered income, debt-to-income ratios, and a credit report detailing the applicant’s credit history. Our underwriting standards focus on our customers’ ability to affordably make loan payments out of their discretionary income, with the value of pledged collateral serving as a credit enhancement rather than the primary underwriting criterion. Portfolio performance is improved by our regular in-person contact with customers at our branches, which helps us anticipate repayment problems before they occur and allows us to work with customers to develop solutions prior to default, using repossession only as a last option. In addition, our centralized management information system enables regular monitoring of branch portfolio metrics. Our state operations vice presidents and district supervisors monitor loan underwriting,
4
Table of Contents
delinquencies, and charge-offs of each branch in their respective regions. In addition, the compensation received by our branch managers and assistant managers has a significant performance component and is closely tied to credit quality, among other defined performance targets. We believe our frequent-contact, relationship-driven lending model, combined with regular monitoring and alignment of employee incentives, improves our overall credit performance.
Experienced Management Team. Our executive and senior operations management teams consist of individuals highly experienced in installment lending and other consumer finance services. In 2014, we appointed a new Chief Executive Officer and a new President and Chief Operating Officer with more than 30 years and 25 years, respectively, of consumer finance experience. Also in 2015, we appointed a Chief Risk Officer with nearly 20 years of financial and consumer lending experience, including significant expertise in credit risk management. As of December 31, 2015, our state operations vice presidents averaged more than 25 years of industry experience and more than six years of service at Regional, while our district supervisors averaged 23 years of industry experience and six years of service with Regional. Our executive and senior operations management team members intend to leverage their experience and expertise in consumer lending to grow our business, deliver high-quality service to our customers, and carefully manage our credit risk.
Our Strategies
Grow Our Branch Network. We intend to continue growing the loan volume, revenue, and profitability of our existing branches, opening new branches within our existing geographic footprint, and expanding our operations into new states. Establishing local contact with our customers through the expansion of our branch network is key to our frequent-contact, relationship-driven lending model and is embodied in our marketing tagline: “Your Hometown Credit Source.”
| • | Existing Branches – We intend to continue increasing same-store revenues by further building relationships in the communities in which we operate and capitalizing on opportunities to offer our customers new loan products as their credit profiles evolve. From 2011 to 2015, we opened or acquired 161 new branches, and we expect revenues at these branches will grow faster than our overall same-store revenue growth rate as they mature. |
| • | New Branches – We believe there is sufficient demand for consumer finance services to continue our pattern of new branch openings and branch acquisitions in the states where we currently operate, allowing us to capitalize on our existing infrastructure and experience in these markets. We also analyze detailed demographic and market data to identify favorable locations for new branches. Opening new branches allows us to generate direct lending in the branches, as well as to create new origination opportunities by establishing relationships with automobile dealerships and retailers in the community. |
| • | New States – We intend to explore opportunities for growth in several states outside of our existing geographic footprint that enjoy favorable operating environments, such as Kentucky, Louisiana, Mississippi, and Missouri. We do not expect to expand into states with unfavorable operating environments even if those states are demographically attractive for our business. In 2011, we opened our first branch in Oklahoma; in 2012, we opened our first branch in New Mexico; in 2013, we opened our first branch in Georgia; and in 2015, we opened our first branch in Virginia. |
We also believe that the highly fragmented nature of the consumer finance industry and the evolving competitive, regulatory, and economic environment provide attractive opportunities for growth through acquisition.
Expand and Capitalize on Our Diverse Channels and Products. We intend to continue to expand and capitalize on our multiple channel platform and broad array of offerings as follows:
| • | Direct Mail Programs – We plan to continue to improve our screening criteria and tracking for direct mail campaigns, which we believe will enable us to improve response rates and credit performance. |
5
Table of Contents
| Since 2011, we have more than tripled the annual number of convenience checks that we have mailed, and we have diversified our direct mail campaign efforts. In 2015, we mailed over 4.5 million convenience checks, 3.6 million prequalified loan offers, and 2.0 million invitations to apply. We intend to continue increasing the size of our direct mail campaigns to grow our loan portfolio. This effort will add new customers, increase volume at our branches, and create opportunities to offer new loan products to our existing customers. In addition, we mail convenience checks in new markets as soon as new branches are open, which we believe helps our new branches more quickly develop a customer base and build finance receivables. |
| • | Automobile Loans – We source our automobile loans through a network of dealers in our geographic footprint. We have hired dedicated marketing personnel to develop relationships with these dealers and to expand our automobile financing network. We will also seek to capture a larger percentage of the financing activity of dealers in our existing network by continuing to improve our relationships with dealers, maintaining the competitiveness of the products we offer, and reducing our response time to loan applications. |
| • | Retail Loans – Our retail loans are offered through a network of retailers. We intend to continue to grow our network of retailers by having our dedicated marketing personnel continue to solicit new retailers, obtain referrals through relationships with our existing retail partners, and to a lesser extent, reach retailers through trade shows, mail programs, and industry associations. |
| • | Online Sourcing – To serve customers who want to reach us over the Internet, we developed a new channel in late 2008 by making an online loan application available on our consumer website. We intend to continue to develop and expand our online marketing efforts and increase traffic to our consumer website through the use of tools such as search engine optimization and paid online advertising. At the end of 2015, we began testing an extension to our online functionality and will continue this effort in 2016. |
We believe the expansion of our channels and products, supported by the growth of our branch network, will provide us with opportunities to reach new customers as well as to offer new loan products to our existing customers as their credit profiles evolve. We plan to continue to develop and introduce new products that are responsive to the needs of our customers in the future.
Focus on Sound Underwriting and Credit Control. In response to the credit quality deterioration in our convenience check mail campaigns in 2014, we have renewed our focus on sound underwriting and credit control. In late 2014 and early 2015, we hired a Chief Risk Officer and other personnel focused on credit risk management, established a Credit Committee to oversee direct mail campaign underwriting and origination processes, implemented additional policies and internal control procedures related to the audit of direct mail campaigns, and improved upon early-stage delinquency reporting and communication. These efforts are reflected in a sequential reduction of our net charge-off rate from 11.1% in 2014 to 8.8% in 2015.
Our philosophy is to emphasize sound underwriting standards focused on a customer’s prior credit payment history and ability to affordably make loan payments, to work with customers experiencing payment difficulties, and to use repossession only as a last option, once other options have been exhausted. For example, we permit customers to defer payments or refinance delinquent loans under limited circumstances. Only on an exception basis do we offer customers experiencing payment difficulties the opportunity to change their loan terms to help them reduce the monthly payment that they owe. A deferral extends the due date of the loan by one month and allows the customer to maintain his or her credit rating in good standing. In addition to deferrals, we also allow customers to refinance loans. We limit the refinancing of delinquent loans to those customers who otherwise satisfy our credit standards (other than with respect to the delinquency). We believe that refinancing delinquent loans for certain deserving customers who have made periodic payments allows us to help customers resolve temporary financial setbacks and repair or sustain their credit. During 2015, we refinanced only $5.4 million of loans that were 60 days or more contractually past due, representing approximately 0.5% of our total loan volume for fiscal 2015. As of December 31, 2015, the outstanding gross balance of such refinancings was only $3.5 million, or 0.4% of gross finance receivables as of such date.
6
Table of Contents
We carefully evaluate each potential customer’s creditworthiness by examining the individual’s unencumbered income or debt-to-income credit ratio, length of current employment, duration of residence, and a credit report detailing the applicant’s credit history. Our loan approval process is based on the customer’s creditworthiness rather than the value of collateral pledged. Loan amounts are established based on underwriting standards designed to allow customers to affordably make their loan payments out of their discretionary income. Each of our branches is equipped to perform immediate background, employment, and credit checks, and approve loan applications promptly while the customer waits. Our employees verify the applicant’s employment and credit histories through telephone checks with employers, other employment references, supporting documentation such as paychecks and earnings summaries, and a variety of third-party credit reporting agencies.
Each individual we solicit for a convenience check loan has been pre-screened through a major credit bureau or data aggregator against our underwriting criteria. In addition to screening each potential convenience check recipient’s credit score and bankruptcy history, we also use a proprietary model that assesses approximately 25 to 30 different attributes of potential recipients.
Our branch employees will perform an in-person appraisal of any vehicle collateral pledged for a direct loan using our multipoint checklist and will use one or more third-party valuation sources, such as the National Automobile Dealers Association Appraisal Guides, to determine an estimate of the collateral’s value. Regardless of the value of the vehicle or other collateral, we will not lend in excess of our assessment of the borrower’s ability to repay. We perfect all first-lien security interests in each pledged vehicle by retaining the title to the collateral in our files until the loan is fully repaid. In certain states, we offer loans secured by second-lien security interests on vehicles, in which case we instead seek to perfect our security interest by recording our lien on the title.
In the event we do elect to repossess a vehicle, we use third-party vendors in the vast majority of circumstances. We then sell our repossessed vehicle inventory through public sales conducted by independent automobile auction organizations or, to a lesser extent, private sales after the required post-repossession waiting period. Any excess proceeds from the sale of the collateral are returned to the customer. We work with customers experiencing payment difficulties to help them find a solution and view repossession of the collateral only as a last option.
In accordance with our philosophy, we intend to continue to refine our underwriting standards to assess an individual’s creditworthiness and ability to repay a loan. In recent years, we have implemented several new programs to continue to improve our underwriting standards and loan collection rates, including those initiatives described above. Our management information system enables us to regularly review loan volumes, collections, and delinquencies. We believe this central oversight, combined with our branch-level servicing, improves credit performance. We plan to continue to develop strategies and custom credit models utilizing our historical loan performance data and credit bureau attributes to further improve our underwriting standards and loan collection rates as we expand.
Our Products
Small Loans. We originate small loans ranging from $500 to $2,500 through our branches, which we refer to as our branch small loans, and through our convenience check program, which we refer to as our convenience checks. Our small loans are standardized to reduce documentation and related processing costs and to comply with federal and state lending laws. They are payable in fixed rate, fully amortizing equal monthly installments with terms of up to 36 months, and are repayable at any time without penalty. In 2015, the average originated net loan size and term for our small installment loans were $1,411 and 16 months, respectively. The weighted-average yield we earned on our portfolio of small loans was 43.9% in 2015. The interest rates, fees and other charges, maximum principal amounts, and maturities for our small loans vary from state to state, depending upon relevant laws and regulations.
7
Table of Contents
Branch Small Loans. Our branch small loans are made to customers who visit one of our branches and complete a standardized credit application. Customers may also complete and submit a loan application by phone or on our consumer website before closing the loan in one of our branches. We require our customers to submit a list of non-essential household goods and pledge these goods as collateral. We do not perfect our security interests by filing UCC financing statements with respect to these goods and instead typically collect a non-recording insurance fee and obtain non-recording insurance.
Convenience Checks. Our convenience check loans are originated through direct mail campaigns to pre-screened individuals. These campaigns are often timed to coincide with seasonal demand for loans to finance vacations, back-to-school needs, and holiday spending. We also launch convenience check campaigns in conjunction with opening new branches to help build an initial customer base. Customers can cash or deposit convenience checks at their convenience, thereby agreeing to the terms of the loan as prominently set forth on the check and accompanying disclosures. When a customer enters into a loan by cashing or depositing the convenience check, our personnel gather additional information on the borrower to assist us in servicing the loan and offering other products to meet the customer’s financing needs.
The following table sets forth the composition of our finance receivables for small loans by state at December 31st of each year from 2011 through 2015:
| At December 31, | ||||||||||||||||||||
| 2011 | 2012 | 2013 | 2014 | 2015 | ||||||||||||||||
| South Carolina |
40 | % | 31 | % | 26 | % | 25 | % | 23 | % | ||||||||||
| Texas |
29 | % | 31 | % | 29 | % | 29 | % | 31 | % | ||||||||||
| North Carolina |
21 | % | 21 | % | 16 | % | 15 | % | 15 | % | ||||||||||
| Alabama |
4 | % | 9 | % | 14 | % | 13 | % | 13 | % | ||||||||||
| Tennessee |
6 | % | 7 | % | 8 | % | 8 | % | 7 | % | ||||||||||
| Oklahoma |
— | 1 | % | 5 | % | 7 | % | 7 | % | |||||||||||
| New Mexico |
— | — | 2 | % | 3 | % | 3 | % | ||||||||||||
| Georgia |
— | — | — | — | 1 | % | ||||||||||||||
| Virginia |
— | — | — | — | — | |||||||||||||||
|
|
|
|
|
|
|
|
|
|
|
|||||||||||
| Total |
100 | % | 100 | % | 100 | % | 100 | % | 100 | % | ||||||||||
|
|
|
|
|
|
|
|
|
|
|
|||||||||||
The following table sets forth the total number of small loans, finance receivables, and average per loan for our small loans by state at December 31, 2015:
| Total Number of Loans |
Finance Receivables |
Average Per Loan |
||||||||||
| (In thousands) | ||||||||||||
| South Carolina |
59,509 | $ | 76,379 | $ | 1,283 | |||||||
| Texas |
91,246 | 104,673 | 1,147 | |||||||||
| North Carolina |
40,800 | 51,520 | 1,263 | |||||||||
| Alabama |
34,984 | 44,213 | 1,264 | |||||||||
| Tennessee |
20,142 | 23,675 | 1,175 | |||||||||
| Oklahoma |
17,800 | 24,492 | 1,376 | |||||||||
| New Mexico |
8,322 | 11,471 | 1,378 | |||||||||
| Georgia |
1,859 | 1,732 | 932 | |||||||||
| Virginia |
1 | 2 | 2,000 | |||||||||
|
|
|
|
|
|
|
|||||||
| Total |
274,663 | $ | 338,157 | $ | 1,231 | |||||||
|
|
|
|
|
|
|
|||||||
Large Loans. We also offer large loans through our branches in amounts ranging from $2,501 to $20,000. Our large loans are payable in fixed rate, fully amortizing equal monthly installments with terms of 18 to 60
8
Table of Contents
months, and are repayable at any time without penalty. We require our large loans to be secured by a vehicle, which may be an automobile, motorcycle, boat, or all-terrain vehicle, or non-essential household goods. In 2015, our average originated net loan size and term for large loans were $4,303 and 36 months, respectively. The weighted-average yield we earned on our portfolio of large loans was 27.6% for 2015.
A potential customer applies for a large loan by visiting one of our branches, where he or she is interviewed by one of our employees who evaluates the customer’s creditworthiness, including a review of a credit bureau report, before extending a loan.
The following table sets forth the composition of our finance receivables for large loans by state at December 31st of each year from 2011 through 2015:
| At December 31, | ||||||||||||||||||||
| 2011 | 2012 | 2013 | 2014 | 2015 | ||||||||||||||||
| South Carolina |
49 | % | 30 | % | 28 | % | 25 | % | 22 | % | ||||||||||
| Texas |
9 | % | 6 | % | 4 | % | 10 | % | 22 | % | ||||||||||
| North Carolina |
27 | % | 22 | % | 28 | % | 27 | % | 18 | % | ||||||||||
| Alabama |
7 | % | 35 | % | 30 | % | 26 | % | 17 | % | ||||||||||
| Tennessee |
8 | % | 7 | % | 9 | % | 8 | % | 7 | % | ||||||||||
| Oklahoma |
— | — | 1 | % | 2 | % | 7 | % | ||||||||||||
| New Mexico |
— | — | — | 2 | % | 7 | % | |||||||||||||
| Georgia |
— | — | — | — | — | |||||||||||||||
| Virginia |
— | — | — | — | — | |||||||||||||||
|
|
|
|
|
|
|
|
|
|
|
|||||||||||
| Total |
100 | % | 100 | % | 100 | % | 100 | % | 100 | % | ||||||||||
|
|
|
|
|
|
|
|
|
|
|
|||||||||||
The following table sets forth the total number of large loans, finance receivables, and average per loan for our large loans by state at December 31, 2015:
| Total Number of Loans |
Finance Receivables |
Average Per Loan |
||||||||||
| (In thousands) | ||||||||||||
| South Carolina |
7,362 | $ | 30,853 | $ | 4,191 | |||||||
| Texas |
8,588 | 32,065 | 3,734 | |||||||||
| North Carolina |
7,600 | 26,034 | 3,426 | |||||||||
| Alabama |
6,576 | 25,603 | 3,893 | |||||||||
| Tennessee |
2,481 | 10,922 | 4,402 | |||||||||
| Oklahoma |
2,523 | 10,808 | 4,284 | |||||||||
| New Mexico |
2,602 | 10,212 | 3,925 | |||||||||
| Georgia |
11 | 56 | 5,091 | |||||||||
| Virginia |
— | — | — | |||||||||
|
|
|
|
|
|
|
|||||||
| Total |
37,743 | $ | 146,553 | $ | 3,883 | |||||||
|
|
|
|
|
|
|
|||||||
Automobile Loans. Our automobile loans are offered through a network of dealers in our geographic footprint. These loans are offered in amounts up to $27,500 and are secured by the purchased vehicle. They are payable in fixed rate, fully amortizing equal monthly installments with terms generally of 36 to 72 months, and are repayable at any time without penalty. In 2015, our average originated net loan size and term for automobile loans were $11,572 and 53 months, respectively. The weighted-average yield we earned on our portfolio of automobile loans was 19.0% for 2015.
Direct Automobile Loans. We have business relationships with dealerships throughout our geographic footprint that offer our loans to their customers in need of financing. These dealers will contact one of
9
Table of Contents
our local branches to initiate a loan application when they have identified a customer who meets our written underwriting standards. Applications for direct automobile loans may also be received through one of the online credit application networks in which we participate, such as DealerTrack and RouteOne. We will review the application and requested loan terms and propose modifications, if necessary, before providing initial approval and inviting the dealer and the customer to come to a local branch to close the loan. Our branch employees interview the customer to verify information in the dealer’s credit application, obtain a credit bureau report on the customer, and inspect the vehicle to confirm that the customer’s order accurately describes the vehicle before closing the loan.
Indirect Automobile Loans. Since late 2010, we have also offered indirect automobile loans, which allow customers and dealers to complete a loan at the dealership without the need to visit one of our branches. We typically offer indirect loans through larger franchise and independent dealers within our geographic footprint. These larger dealers collect credit applications from their customers and either forward the applications to us specifically or, more commonly, submit the applications to numerous potential lenders through online credit application networks, such as DealerTrack and RouteOne. After receiving an indirect automobile loan application, it is processed by our centralized underwriting department or, to a lesser extent, our branches and supervisors. Once the loan is approved, the dealer closes the loan on a standardized retail installment sales contract at the point of sale. Subsequently, we purchase the loan and then service it locally through our branch network.
The following table sets forth the composition of our finance receivables for automobile loans by state at December 31st of each year from 2011 through 2015:
| At December 31, | ||||||||||||||||||||
| 2011 | 2012 | 2013 | 2014 | 2015 | ||||||||||||||||
| South Carolina |
55 | % | 48 | % | 42 | % | 42 | % | 45 | % | ||||||||||
| Texas |
13 | % | 19 | % | 22 | % | 23 | % | 18 | % | ||||||||||
| North Carolina |
26 | % | 26 | % | 26 | % | 24 | % | 23 | % | ||||||||||
| Alabama |
2 | % | 4 | % | 5 | % | 5 | % | 7 | % | ||||||||||
| Tennessee |
4 | % | 3 | % | 3 | % | 2 | % | 2 | % | ||||||||||
| Oklahoma |
— | — | 1 | % | 2 | % | 3 | % | ||||||||||||
| New Mexico |
— | — | — | — | — | |||||||||||||||
| Georgia |
— | — | 1 | % | 2 | % | 2 | % | ||||||||||||
| Virginia |
— | — | — | — | — | |||||||||||||||
|
|
|
|
|
|
|
|
|
|
|
|||||||||||
| Total |
100 | % | 100 | % | 100 | % | 100 | % | 100 | % | ||||||||||
|
|
|
|
|
|
|
|
|
|
|
|||||||||||
The following table sets forth the total number of automobile loans, finance receivables, and average per loan for our automobile loans by state at December 31, 2015:
| Total Number of Loans |
Finance Receivables |
Average Per Loan |
||||||||||
| (In thousands) | ||||||||||||
| South Carolina |
6,362 | $ | 52,071 | $ | 8,185 | |||||||
| Texas |
2,217 | 21,333 | 9,622 | |||||||||
| North Carolina |
3,295 | 26,807 | 8,136 | |||||||||
| Alabama |
863 | 7,925 | 9,183 | |||||||||
| Tennessee |
313 | 2,240 | 7,157 | |||||||||
| Oklahoma |
366 | 2,917 | 7,970 | |||||||||
| New Mexico |
51 | 500 | 9,804 | |||||||||
| Georgia |
245 | 2,316 | 9,453 | |||||||||
| Virginia |
— | — | — | |||||||||
|
|
|
|
|
|
|
|||||||
| Total |
13,712 | $ | 116,109 | $ | 8,468 | |||||||
|
|
|
|
|
|
|
|||||||
10
Table of Contents
Retail Loans. In late 2009, we began offering loans to finance the purchase of furniture, appliances, and other retail products. Our retail loans are indirect installment loans structured as retail installment sales contracts that are offered in amounts of up to $7,500. They are payable in fixed rate, fully amortizing equal monthly installments with terms of between six and 48 months, and are repayable at any time without penalty. In 2015, our average originated net loan size and term for retail loans were $1,626 and 23 months, respectively. The weighted-average yield we earned on our portfolio of retail loans was 18.8% for 2015.
Our retail loans provide financing to customers who may not qualify for prime financing from traditional lenders. As compared to other sources of non-prime financing, our retail loans often offer more attractive interest rates and terms to customers. Our retail loans are indirect loans made through a retailer at the point of sale without the need for the customer to visit one of our branches, similar to our indirect automobile loans. We partner with retailers that offer our retail loans directly to their customers. In recent years, in an effort to expand our relationship with existing retailer partners, we began offering retail loans in states outside of our nine-state brick-and-mortar footprint that are serviced centrally from our headquarters in Greenville, South Carolina. By providing a source of non-prime financing, we are often able to help our retail partners complete sales to customers who otherwise may not have been able to finance their purchase.
Our retail partners typically submit applications to us online while the customer waits. If a customer is not accepted by a retailer’s prime financing provider, we will evaluate the customer’s credit based on the same application data, without the need for the customer to complete an additional application. Underwriting for our retail loans is conducted through RMC Retail, a centralized underwriting team.
We individually evaluate the creditworthiness of potential retail loan customers using the same information and resources used for our other loan products, including a credit bureau report, before providing a credit decision to the retailer within ten minutes. If we approve the loan, the retailer completes our standardized retail installment sales contract, which includes a security interest in the purchased item. The servicing of nearly all such loans are performed within our branches, with only out-of-footprint retail loans being serviced centrally from our headquarters in Greenville, South Carolina.
The following table sets forth the composition of our finance receivables for retail loans by state at December 31st of each year from 2011 through 2015:
| At December 31, | ||||||||||||||||||||
| 2011 | 2012 | 2013 | 2014 | 2015 | ||||||||||||||||
| South Carolina |
10 | % | 8 | % | 6 | % | 6 | % | 4 | % | ||||||||||
| Texas |
59 | % | 63 | % | 61 | % | 62 | % | 69 | % | ||||||||||
| North Carolina |
25 | % | 15 | % | 15 | % | 14 | % | 10 | % | ||||||||||
| Alabama |
3 | % | 5 | % | 5 | % | 3 | % | 2 | % | ||||||||||
| Tennessee |
1 | % | 4 | % | 4 | % | 2 | % | 1 | % | ||||||||||
| Oklahoma |
— | — | 3 | % | 7 | % | 8 | % | ||||||||||||
| New Mexico |
— | — | 1 | % | 1 | % | 2 | % | ||||||||||||
| Georgia |
— | — | — | — | — | |||||||||||||||
| Virginia |
— | — | — | — | — | |||||||||||||||
| Other |
2 | % | 5 | % | 5 | % | 5 | % | 4 | % | ||||||||||
|
|
|
|
|
|
|
|
|
|
|
|||||||||||
| Total |
100 | % | 100 | % | 100 | % | 100 | % | 100 | % | ||||||||||
|
|
|
|
|
|
|
|
|
|
|
|||||||||||
11
Table of Contents
The following table sets forth the total number of retail loans, the finance receivables, and average per loan for our retail loans by state at December 31, 2015:
| Total Number of Loans |
Finance Receivables |
Average Per Loan |
||||||||||
| (In thousands) | ||||||||||||
| South Carolina |
932 | $ | 1,099 | $ | 1,179 | |||||||
| Texas |
15,650 | 19,008 | 1,215 | |||||||||
| North Carolina |
2,594 | 2,888 | 1,113 | |||||||||
| Alabama |
467 | 465 | 996 | |||||||||
| Tennessee |
452 | 414 | 916 | |||||||||
| Oklahoma |
1,699 | 2,175 | 1,280 | |||||||||
| New Mexico |
525 | 593 | 1,130 | |||||||||
| Georgia |
9 | 21 | 2,333 | |||||||||
| Virginia |
— | — | — | |||||||||
| Other |
831 | 962 | 1,158 | |||||||||
|
|
|
|
|
|
|
|||||||
| Total |
23,159 | $ | 27,625 | $ | 1,193 | |||||||
|
|
|
|
|
|
|
|||||||
Optional Credit Insurance Products. We offer our customers a number of different optional insurance products in connection with our loans. We do not sell insurance to non-borrowers. The insurance products we offer customers are voluntary and not a condition of the loan. Our insurance products, including the types of products offered and their terms and conditions, vary from state to state in compliance with applicable laws and regulations. Premiums and other charges for credit insurance and similar payment protection products are set at, or below, authorized statutory rates and are stated separately in our disclosure to customers, as required by the federal Truth in Lending Act and by various applicable state laws. In 2015, insurance income, net, was $11.7 million, or 5.4% of our total revenue.
We market and sell insurance policies as an agent for an unaffiliated third-party insurance company. The policies are then ceded to our wholly-owned reinsurance subsidiary, RMC Reinsurance, Ltd., which then bears the full risk of the policy. For the sale of insurance policies, we, as agent, write policies only within the limitations established by our agency contracts with the unaffiliated third-party insurance company.
Credit Life Insurance, Credit Accident and Health Insurance, and Involuntary Unemployment Insurance. We market and sell optional credit life insurance, credit accident and health insurance, and involuntary unemployment insurance in connection with our loans in selected markets. Credit life insurance provides for the payment in full of the borrower’s credit obligation to the lender in the event of the borrower’s death. Credit accident and health insurance provides for the repayment of certain loan installments to the lender that come due during an insured’s period of income interruption resulting from disability from illness or injury. Involuntary unemployment insurance provides for repayment of certain loan installments in the event the borrower is no longer employed as the result of a qualifying event, such as a layoff or reduction in workforce. All customers purchasing these types of insurance from us sign a statement affirming that they understand that their purchase of insurance is not a condition of our granting the loan. In addition, customers may cancel purchased insurance within 30 days of the date of purchase and receive a full refund of the insurance premium. Customers are paid a partial refund in the event of an early payoff or loan refinancing.
Property Insurance. We also require that our customers provide proof of acceptable insurance for any personal property securing a loan. Customers can provide proof of such insurance purchased from a third party (such as homeowners or renters insurance) or can purchase the property insurance that we offer. The Company also collects a state-allowed fee for collateral protection and purchases non-recording insurance in lieu of recording and perfecting the Company’s security interest in the assets pledged on certain loans. In addition to offering property insurance on the household goods used as collateral for our loan products, we also offer, in
12
Table of Contents
select markets, vehicle single interest insurance that provides coverage on automobiles used as collateral on small and large loans. This affords the borrower flexibility with regards to the requirement to maintain full coverage on the vehicle while also protecting the collateral used to secure the loan.
Reinsurance. The optional credit insurance and property insurance risks are ceded by the non-affiliated insurance company that issued the policies to RMC Reinsurance, a wholly-owned subsidiary of Regional Management Corp.
Collateral Protection Collision Insurance. Before we originate an automobile loan, we require the borrower to provide proof of acceptable liability and collision insurance on the vehicle securing the loan. While we do not offer automobile insurance to our customers, we will obtain collateral protection collision insurance (“CPI”) on behalf of customers who permit their other insurance coverage to lapse. If we obtain CPI for a vehicle, the customer has the opportunity to provide proof of insurance to cancel the CPI and receive a refund of all unearned premiums.
Insurance policy premiums, claims and expenses are included in the company’s results of operations as insurance income, net in the income statement.
Our Branches
Our branches are generally conveniently located in visible, high traffic locations, such as shopping centers. We do not need to keep large amounts of cash at our branches because we disburse the vast majority of loan proceeds by check, rather than by cash payment. As a result, our branches have an open, welcoming, and hospitable layout.
The following table sets forth the number of branches as of the dates indicated:
| At December 31, | ||||||||||||||||||||
| 2011 | 2012 | 2013 | 2014 | 2015 | ||||||||||||||||
| South Carolina |
69 | 69 | 70 | 70 | 72 | |||||||||||||||
| Texas |
44 | 56 | 67 | 83 | 98 | |||||||||||||||
| North Carolina |
24 | 26 | 29 | 34 | 36 | |||||||||||||||
| Alabama |
14 | 42 | 49 | 49 | 50 | |||||||||||||||
| Tennessee |
18 | 20 | 21 | 21 | 21 | |||||||||||||||
| Oklahoma |
1 | 6 | 21 | 27 | 28 | |||||||||||||||
| New Mexico |
— | 2 | 4 | 13 | 18 | |||||||||||||||
| Georgia |
— | — | 3 | 3 | 7 | |||||||||||||||
| Virginia |
— | — | — | — | 1 | |||||||||||||||
|
|
|
|
|
|
|
|
|
|
|
|||||||||||
| Total |
170 | 221 | 264 | 300 | 331 | |||||||||||||||
|
|
|
|
|
|
|
|
|
|
|
|||||||||||
During the period presented in the table above, we grew by 161 net branches. In 2015, we opened 31 new branches. In evaluating whether to locate a branch in a particular community, we examine several factors, including the demographic profile of the community, demonstrated demand for consumer finance, the regulatory and political climate, and the availability of suitable employees to staff, manage, and supervise the new branch. We also look for a concentration of automobile dealers and retailers to build our sales finance business.
13
Table of Contents
The following table sets forth the average finance receivables per branch based on maturity, excluding acquired branches:
| Age of Branch (As of December 31, 2015) |
Average Finance Receivables Per Branch as of December 31, 2015 |
Percentage Increase From Prior Age Category |
Number of Branches |
|||||||||
| (In thousands) | ||||||||||||
| Branches open less than one year |
$ | 597 | — | 31 | ||||||||
| Branches open one to three years |
$ | 1,500 | 151.2 | % | 81 | |||||||
| Branches open three to five years |
$ | 1,750 | 16.7 | % | 80 | |||||||
| Branches open five years or more |
$ | 2,393 | 36.8 | % | 139 | |||||||
The average contribution to operating income from our branches has historically increased as our branches mature. The following table sets forth the average operating income contribution per branch for the year ended December 31, 2015, based on maturity of the branch, excluding acquired branches.
| Age of Branch (As of December 31, 2015) |
Average Branch Operating Income (Loss) Contribution |
Percentage Increase From Prior Age Category |
Number of Branches |
|||||||||
| (In thousands) | ||||||||||||
| Branches open less than one year |
$ | (8 | ) | — | 31 | |||||||
| Branches open one to three years |
$ | 170 | 2,115.4 | % | 81 | |||||||
| Branches open three to five years |
$ | 227 | 33.9 | % | 80 | |||||||
| Branches open five years or more |
$ | 415 | 82.3 | % | 139 | |||||||
We calculate the average branch contribution as total revenues generated by the branch less the expenses directly attributable to the branch, including the provision for losses and operating expenses such as personnel, lease, and interest expenses. General corporate overhead, including management salaries, are not attributable to any individual branch. Accordingly, the sum of branch contributions from all of our branches is greater than our income before taxes.
Payment and Loan Servicing
We have implemented company-wide payment and loan servicing policies and practices, which are designed to maintain consistent portfolio performance and to facilitate regulatory compliance. Our district supervisors and state vice presidents oversee the training of each branch employee in these policies and practices, which include standard procedures for communicating with customers in our branches, over the telephone, and by mail. Our corporate procedures require the maintenance of a log of servicing activity for each account. Our state vice presidents, district supervisors, and internal audit teams regularly review these records to ensure compliance with our company procedures, which are designed to comply with applicable regulatory requirements.
Our corporate policies also include encouraging customers to visit our branches to make payments. Encouraging payment at the branch allows us to maintain regular contact with our customers and further develop our overall relationship with them. We believe that the development and continual reinforcement of personal relationships with customers improves our ability to monitor their creditworthiness, reduces credit risk, and generates opportunities to offer them new loan products as their credit profiles evolve. To reduce late payment risk, branch employees encourage customers to inform us in advance of expected payment problems.
Branch employees also promptly contact customers following the first missed payment and thereafter remain in close contact with such customers, including through phone calls and letters. We use third-party skip tracing services to locate delinquent customers in the event that our branch employees are unable to do so. In certain cases, we seek a legal judgment against delinquent customers.
14
Table of Contents
We obtain security interests for most of our loans, and we perfect the security interests in vehicles securing our loans. Our district supervisors and internal audit teams regularly review collateral documentation to confirm compliance with our guidelines. We perfect all first-lien security interests in each pledged vehicle by retaining the title to the collateral in our files until the loan is fully repaid. In certain states, we offer loans secured by second-lien security interests on vehicles, in which case we instead seek to perfect our security interest by recording our lien on the title. We only initiate repossession efforts when an account is seriously delinquent, we have exhausted other means of collection, and in the opinion of management, the customer is unlikely to make further payments. We sell substantially all repossessed vehicles through public sales conducted by independent automobile auction organizations, after the required post-repossession waiting period. Losses on the sale of repossessed collateral are charged to the allowance for credit losses.
In certain cases, we permit our existing customers to refinance their loans. Our refinancings of existing loans are divided into three categories: refinancings of loans in an amount greater than the original loan amount, renewals of existing loans at or below the original loan amount, and renewals of existing loans that are 60 or more days contractually past due, which represented 31.5%, 26.8%, and 0.5%, respectively, of our loan originations in 2015. Any refinancing of a loan in an amount greater than the original amount generally requires an underwriting review to determine a customer’s qualification for the increased loan amount. Furthermore, we obtain a new credit report and may complete a new application on renewals of existing loans if they have not completed one within the prior year. We allow customers to refinance delinquent loans on a limited basis if those customers otherwise satisfy our credit standards (other than with respect to the delinquency). We believe that refinancing delinquent loans for certain deserving customers who have made periodic payments allows us to help customers resolve temporary financial setbacks and repair or sustain their credit. During 2015, we refinanced only $5.4 million of loans that were 60 or more days contractually past due, and as of December 31, 2015, the outstanding balance of such refinancings was only $3.5 million, or 0.4% of gross finance receivables as of such date.
Accounts are charged off at 180 days contractually delinquent. We continue to service charged-off loans centrally, and until 2015, we had not sold any of our charged-off accounts to third-party debt purchasers, nor had we placed any debt with third-party collection agencies. In December 2015, we executed our first sale of existing charged-off accounts to a third party and, in connection with this transaction, we committed to selling the flow of loans charged-off between November 2015 and October 2016. For details of this transaction, see Part II, Item 8. “Financial Statements and Supplementary Data,” Note 3. We updated our charge-off policy during the fourth quarter of 2014, and we will continue to review our practices relating to our handling of charged-off accounts.
Information Technology
Since 1999, we have used a loan servicing software package developed and owned by ParaData Financial Systems and have invested in customizing the ParaData software to improve the management of our specific processes and product types. The system provides management information and control capabilities, including monitoring of all loans made, collections, delinquencies, and other functions. ParaData does not have a robust loan origination functionality. While we believe that the ParaData loan management system is adequate for our current business needs, we are evaluating loan origination software to add this important automated functionality to our business.
In addition, we rely on DealerTrack, Route One, Teledata Communications Inc., and other third-party software vendors to provide access to loan applications and/or on-screen applications.
Competition
The consumer finance industry is highly fragmented, with numerous competitors. The competition we face for each of our loan products is distinct.
15
Table of Contents
Small and Large Loans. The installment loan industry is highly fragmented in the nine states in which we operate. We compete with several large competitors operating greater than 800 branch locations each, as well as a handful of private competitors with between 100 and 250 branches in certain of the states in which we operate. We believe that the majority of our competitors are independent operators with generally less than 100 branches. We believe that competition between installment consumer loan companies occurs primarily on the basis of price, breadth of loan product offerings, flexibility of loan terms offered, and the quality of customer service provided. While underbanked customers may also use alternative financial services providers, such as title lenders, payday lenders, and pawn shops, their products offer different terms and typically carry substantially higher interest rates and fees than our installment loans. Accordingly, we believe alternative financial services providers are not an attractive alternative for customers who meet our underwriting standards, which are generally stricter than the underwriting standards of alternative financial services providers. Our small and large loans also compete with pure online lenders, peer-to-peer lenders, and issuers of non-prime credit cards.
Automobile Loans. In the automobile loan industry, we compete with numerous financial service companies, including non-prime auto lenders, dealers that provide financing, captive finance companies owned by automobile manufacturers, banks, and credit unions. Competition among automobile lenders is fierce and is largely on the basis of interest rates charged, the quality of credit accepted, the flexibility of loan terms offered, the speed of approval, and the quality of customer service provided. Much of the automobile loan marketplace has evolved to processing loan applications generated at dealers through online credit application networks such as DealerTrack or RouteOne where prompt service and response times to dealers and their customers are essential to compete in this market.
Retail Loans. In recent years, the retail loan industry has seen an increasing number of lenders dedicated to serving non-prime retail loans enter the market. We also face competition from rent-to-own financing providers and credit card companies. Our retail loans are typically made at competitive rates, and competition is largely on the same basis as automobile loans. Point-of-sale financing decisions must be made rapidly while the customer is on the sales floor. We endeavor to provide responses to customers in less than ten minutes, and we staff RMC Retail, our centralized retail loan underwriting team, with multiple shifts seven days per week during peak retail shopping hours to ensure rapid response times.
Seasonality
Our loan volume and the contractual delinquency of our finance receivable portfolio follow seasonal trends. Demand for our loans is typically highest during the third and fourth quarters, which we believe is largely due to customers borrowing money for back-to-school and holiday spending. With the exception of automobile loans, loan demand has generally been the lowest during the first quarter, which we believe is largely due to the timing of income tax refunds. During the remainder of the year, we typically experience loan growth from general operations. In addition, we typically generate higher loan volumes in the second half of the year from direct mail campaigns, which are timed to coincide with seasonal consumer demand. Also, delinquencies have generally been lower in the first half of the year than during the second half of the year. Consequently, we experience significant seasonal fluctuations in our operating results and cash needs.
Employees
As of December 31, 2015, we had 1,421 employees, none of whom were represented by labor unions. We consider our relations with our personnel to be good. We experience a high level of turnover among our entry-level employees, which we believe is typical of the consumer finance industry.
Staff and Training. Local branches are generally staffed with three to four employees. The branch manager oversees operations of the branch and is responsible for approving loan applications. Each branch has one or two assistant managers who contact delinquent customers, review loan applications, and prepare operational reports. Generally, each branch also has a customer service representative who takes loan
16
Table of Contents
applications, processes loan applications, processes payments, and assists in the preparation of operational reports, collection efforts, and marketing activities. Larger volume branches may employ additional assistant managers and customer service representatives. New employees train during the first year of employment on an operating manual that outlines our operating policies and procedures. In addition, each employee is required to complete a curriculum of compliance training modules within the first 180 days of employment. Effective July 2015, employees are also required to re-certify on certain compliance modules each year. Our training of assistant managers focuses on developing the skills necessary to allow for the future promotion of the assistant managers to branch managers.
Monitoring and Supervision. We have oversight structures and procedures in place to ensure compliance with our operational standards and policies and the applicable regulatory requirements in each state. All of our loans, other than indirect automobile and retail loans, are prepared using our loan management software, which is programmed to compute fees, interest rates, and other loan terms in compliance with our underwriting standards and applicable regulations. We work with our regulatory counsel to develop standardized forms and agreements for each state, ensuring consistency and compliance.
Our loan operations are organized by geography. We have two state vice presidents to oversee Texas; one state vice president to oversee North Carolina and Tennessee; one state vice president to oversee New Mexico and Oklahoma; one state vice president to oversee Alabama; one state vice president to oversee Georgia; one state vice president to oversee South Carolina; and one state vice president to oversee Virginia. Several levels of management monitor and supervise the operations of each of our branches. Branch managers are directly responsible for the performance of their respective branches. District supervisors are responsible for the performance of between six and 11 branches in their districts, communicating with the branch managers of each of their branches at least weekly, and visiting each branch at least monthly. Our state vice presidents monitor the performance of all of the branches in their respective states, primarily through communications with district supervisors. These state vice presidents communicate with the district supervisors of each of their districts at least weekly and visit each of their branches at least annually, or more often as necessary. Our information technology platform enables us to monitor our portfolio regularly, which we believe improves our credit performance.
The majority of our branches undergo an internal audit every year, and every branch undergoes an internal audit at least every two years. These audits, conducted by dedicated internal audit staff, include a review of compliance with state and federal laws and regulations, as well as a review of operations. The review of operations includes a review of adherence to policies and procedures concerning cash management, loan approval processes, and all other policies and procedures concerning branch operations, such as servicing procedures. Branches are rated at four different levels, and the timing of audits is impacted by the rating received. Other factors impacting the timing of branch audits include, but are not limited to, the date the branch opened, the timing of new managers commencing employment at the branch, and the results of branch examinations conducted by state regulators. Our branch employees’ compensation is directly impacted by the internal audit rating assigned to the branch.
We have a “scorecard” program to systematically monitor a range of operating metrics at each branch on a monthly basis. Our scorecard system currently tracks different dimensions of operations, including the performance of each branch on a series of credit metrics. Senior management receives daily delinquency, loan volume, charge-off, and other statistical reports consolidated by state and has access to these daily reports. At least three times each year, district supervisors audit the operations of each branch in their district and submit standardized reports detailing their findings to senior management. State vice presidents meet with the executive management team once per quarter to review branch scorecard results as well as to discuss other operational and financial performance results against our targets. Remedial plans are put in place to correct any underperformance.
17
Table of Contents
Government Regulation
Consumer finance companies are subject to extensive regulation, supervision, and licensing under various state and federal statutes, ordinances, and regulations. Many of these regulations impose detailed constraints on the terms of our loans and the retail installment sales contracts that we purchase, lending forms, and operations. The software that we use to originate loans is designed to ensure compliance with all applicable lending regulations.
State Lending Regulation. In general, state statutes establish maximum loan amounts and interest rates and the types and maximum amounts of fees and insurance premiums that may be charged for both direct and indirect lending. Specific allowable charges vary by state. For example, statutes in Texas allow for indexing the maximum small loan amounts to the Consumer Price Index and set maximum rates for automobile loans based on the age of the vehicle. Except in the states of North Carolina, New Mexico, and Virginia, our direct loan products are pre-computed loans in which the finance charge is determined at the time of the loan origination and is a combination of origination or acquisition fees, account maintenance fees, monthly account handling fees, and other charges permitted by the relevant state laws. Direct loans in North Carolina, New Mexico, and Virginia are structured as simple interest loans as prescribed by state law.
In addition, state laws regulate the keeping of books and records and other aspects of the operation of consumer finance companies, and state and federal laws regulate account collection practices. Generally, state regulations also establish minimum capital requirements for each local branch. State agency approval is required to open new branches, and each of our branches is separately licensed under the laws of the state in which the branch is located. Licenses granted by the regulatory agencies in these states are subject to renewal every year and may be revoked for failure to comply with applicable state and federal laws and regulations. In the states in which we currently operate, licenses may be revoked only after an administrative hearing. We believe we are in compliance with state law and regulations applicable to our lending operations in each state.
We and our operations are regulated by several state agencies, including the Consumer Finance Division of the South Carolina State Board of Financial Institutions, the South Carolina Department of Consumer Affairs, the North Carolina Office of the Commissioner of Banks, the Texas Office of the Consumer Credit Commissioner, the Tennessee Department of Financial Institutions, the Alabama State Banking Department, the Oklahoma Department of Consumer Credit, the New Mexico Regulation and Licensing Department, Financial Institutions Division, the Georgia Industrial Loan Division of the Office of Insurance and Safety Fire Commissioner, and the Virginia Bureau of Financial Institutions of the State Corporation Commission. These state regulatory agencies regularly audit our branches and operations.
Insurance Regulation. Premiums and charges for credit insurance and similar payment protection products are set at or below authorized statutory rates and are stated separately in our disclosure to customers, as required by the federal Truth in Lending Act and by various applicable state laws.
We are also subject to state regulations governing insurance agents in the states in which we sell insurance. State insurance regulations require that insurance agents be licensed and limit the premium amount charged for such insurance. Our captive insurance subsidiary is regulated by the insurance authorities of the Turks and Caicos Islands of the British West Indies, where the subsidiary is organized and domiciled.
Dodd-Frank Wall Street Reform and Consumer Protection Act of 2010 (the “Dodd-Frank Act”). At the federal level, Congress enacted comprehensive financial regulatory reform legislation on July 21, 2010. A significant focus of the new law, known as the Dodd-Frank Act, is heightened consumer protection. The Dodd-Frank Act established a new body, called the Consumer Financial Protection Bureau (the “CFPB”), which has regulatory, supervisory, and enforcement powers over providers of consumer financial products and services, including explicit supervisory authority to examine and require registration of non-depository lenders and promulgate rules that can affect the practices and activities of lenders.
18
Table of Contents
Although the Dodd-Frank Act expressly provides that the CFPB has no authority to establish usury limits, some consumer advocacy groups have suggested that various forms of alternative financial services or specific features of consumer loan products should be a regulatory priority, and it is possible that at some time in the future the CFPB could propose and adopt rules making such lending services materially less profitable or impractical, which may include installment finance loans or other products that we offer.
The Dodd-Frank Act also gives the CFPB the authority to examine and regulate large nondepository financial companies and gives the CFPB authority over anyone deemed by rule to be a “larger participant of a market for other consumer financial products or services.” The CFPB contemplates regulating the installment lending industry as part of the “consumer credit and related activities” market. However, this so-called “larger participant rule” will not impose substantive consumer protection requirements, but rather will provide to the CFPB the authority to supervise larger participants in certain markets, including by requiring reports and conducting examinations to ensure, among other things, that they are complying with existing federal consumer financial law. While the CFPB has defined a “larger participant” standard for certain markets, such as the debt collection, automobile finance, and consumer reporting markets, it has not yet acted to define “larger participant” in the traditional installment lending market. The rule will likely cover only the largest installment lenders, and we do not yet know whether the definition of larger participant will cover us. We do not meet the definition of “larger participant” in the automobile finance market.
In addition to the grant of certain regulatory powers to the CFPB, the Dodd-Frank Act gives the CFPB authority to pursue administrative proceedings or litigation for violations of federal consumer financial laws. In these proceedings, the CFPB can obtain cease and desist orders (which can include orders for restitution or rescission of contracts, as well as other kinds of affirmative relief) and monetary penalties.
Other Federal Laws and Regulations. In addition to the Dodd-Frank Act and state and local laws and regulations, numerous other federal laws and regulations affect our lending operations. These laws include the Truth in Lending Act, the Equal Credit Opportunity Act, the Fair Credit Reporting Act, the Gramm-Leach-Bliley Act, and in each case the regulations thereunder, and the Federal Trade Commission’s Credit Practices Rule. These laws require us to provide complete disclosure of the principal terms of each loan to the borrower, prior to the consummation of the loan transaction, prohibit misleading advertising, protect against discriminatory lending practices, and proscribe unfair credit practices.
Under the Truth in Lending Act and Regulation Z promulgated thereunder, we must disclose certain material terms related to a credit transaction, including, but not limited to, the annual percentage rate, finance charge, amount financed, total of payments, the number and amount of payments, and payment due dates to repay the indebtedness. Under the Equal Credit Opportunity Act and Regulation B promulgated thereunder, we cannot discriminate against any credit applicant on the basis of any protected category, such as race, color, religion, national origin, sex, marital status, or age. We are also required to make certain disclosures regarding consumer rights and advise customers whose credit applications are not approved of the reasons for the rejection. Under the Fair Credit Reporting Act, we must provide certain information to customers whose credit applications are not approved on the basis of a report obtained from a consumer reporting agency, promptly update any credit information reported to a credit reporting agency about a customer, and have a process by which customers may inquire about credit information furnished by us to a consumer reporting agency. Under the Gramm-Leach-Bliley Act, we must protect the confidentiality of our customers’ nonpublic personal information and disclose information on our privacy policy and practices, including with regard to the sharing of customers’ nonpublic personal information with third parties. This disclosure must be made to customers at the time the customer relationship is established and, in some cases, at least annually thereafter. The Federal Trade Commission’s Credit Practices Rule limits the types of property we may accept as collateral to secure a consumer loan. Violations of these statutes and regulations may result in actions for damages, claims for refund of payments made, certain fines and penalties, injunctions against certain practices, and the potential forfeiture of rights to repayment of loans.
19
Table of Contents
Additional Information
The Company’s principal internet address is www.regionalmanagement.com. The information contained on, or that can be accessed through, the Company’s website is not incorporated by reference into this Annual Report on Form 10-K. The Company has included its website address as a factual reference and does not intend it as an active link to its website. The Company provides its Annual Reports on Form 10-K, Quarterly Reports on Form 10-Q, and Current Reports on Form 8-K, and all amendments to those reports, free of charge on www.regionalmanagement.com, as soon as reasonably practicable after they are electronically filed, or furnished to, the Securities and Exchange Commission.
20
Table of Contents
We operate in a rapidly changing environment that involves a number of risks, some of which are beyond our control. The following discussion highlights some of the risks which may affect future operating results. These are the risks and uncertainties we believe are most important for you to consider, but the risks described below are not the only risks facing our company. Additional risks and uncertainties not presently known to us, which we currently deem immaterial, or which are similar to those faced by other companies in our industry or business in general, may also impair our business operations. If any of the following risks or uncertainties occurs, continues, or worsens, our business, financial condition, and operating results would likely suffer. You should carefully consider the risks described below together with the other information set forth in this Annual Report on Form 10-K.
Risks Related to Our Business
We have grown significantly in recent years, and our delinquency and charge-off rates and overall results of operations may be adversely affected if we do not manage our growth effectively.
We have experienced substantial growth in recent years, opening or acquiring 43 branches in 2013, 36 in 2014, and 31 in 2015, and we intend to continue our growth strategy in the future. As we increase the number of branches we operate, we will be required to find new, or relocate existing, employees to operate our branches and allocate resources to train and supervise those employees. The success of a branch depends significantly on the manager overseeing its operations and on our ability to enforce our underwriting standards and implement controls over branch operations. Recruiting suitable managers for new branches can be challenging, particularly in remote areas and in areas where we face significant competition. Furthermore, the annual turnover among our branch managers was approximately 26% in 2014 and 25% in 2015, and turnover rates of managers in our new branches may be similar or higher. Increasing the number of branches that we operate may divide the attention of our senior management or strain our ability to adapt our infrastructure and systems to accommodate our growth. If we are unable to promote, relocate, or recruit suitable managers, oversee their activities effectively, and otherwise appropriately and effectively staff our branches, our delinquency and charge-off rates may increase and our overall results of operations may be adversely impacted.
We face significant risks in implementing our growth strategy, some of which are outside of our control.
We intend to continue our growth strategy, which is based on opening and acquiring branches in existing and new markets and introducing new products and channels. Our ability to execute this growth strategy is subject to significant risks, some of which are beyond our control, including:
| • | the inherent uncertainty regarding general economic conditions; |
| • | the prevailing laws and regulatory environment of each state in which we operate or seek to operate and, to the extent applicable, federal laws and regulations, which are subject to change at any time; |
| • | the degree of competition in new markets and its effect on our ability to attract new customers; |
| • | our ability to identify attractive locations for new branches; |
| • | our ability to recruit qualified personnel, particularly in remote areas and in areas where we face a great deal of competition; and |
| • | our ability to obtain adequate financing for our expansion plans. |
For example, North Carolina requires a “needs and convenience” assessment of a new lending license and location prior to the granting of the license, which adds time and expense to opening new locations. In addition, certain states into which we may expand limit the number of lending licenses granted. There can be no assurance that if we apply for a license for a new branch, whether in one of the states where we currently operate or in a
21
Table of Contents
state into which we would like to expand, we would be granted a license to operate. We also cannot be certain that any such license, even if granted, would be obtained in a timely manner or without burdensome conditions or limitations. In addition, we may not be able to obtain and maintain the regulatory approvals, government permits, or licenses that may be required.
We face strong direct and indirect competition.
The consumer finance industry is highly competitive, and the barriers to entry for new competitors are relatively low in the markets in which we operate. We compete for customers, locations, employees, and other important aspects of our business with many other local, regional, national, and international financial institutions, many of which have greater financial resources than we do.
Our installment loan operations compete with other installment lenders as well as with alternative financial services providers (such as payday and title lenders, check advance companies, and pawnshops), online or peer-to-peer lenders, issuers of non-prime credit cards, and other competitors. We believe that future regulatory developments in the consumer finance industry may cause lenders that currently focus on alternative financial services to begin to offer installment loans. In addition, if companies in the installment loan business attempt to provide more attractive loan terms than is standard across the industry, we may lose customers to those competitors. In installment loans, we compete primarily on the basis of price, breadth of loan product offerings, flexibility of loan terms offered, and the quality of customer service provided.
Our automobile purchase loan operations compete with numerous financial services providers, including non-prime auto lenders, dealers that provide financing, captive finance companies owned by automobile manufacturers, banks, and credit unions. Our retail purchase loan operations compete with non-prime retail lenders, store and third-party credit cards, prime lending sources, rent-to-own finance providers, and other competitors. For automobile purchase loans and retail purchase loans, we compete primarily on the basis of interest rates charged, the quality of credit accepted, the flexibility of loan terms offered, the speed of approval, and the quality of customer service provided.
If we fail to compete successfully, we could face lower sales and may decide or be compelled to materially alter our lending terms to our customers, which could result in decreased profitability.
Our business could suffer if we are unsuccessful in making, continuing, and growing relationships with automobile dealers and retailers, or if the dealers and retailers with whom we have relationships experience a decline or disruption in their sales volumes.
Our automobile purchase loans and retail purchase loans are reliant on our relationships with automobile dealers and retailers. In particular, our automobile purchase loan operations depend in large part upon our ability to establish and maintain relationships with reputable dealers who direct customers to our branches or originate loans at the point of sale, which we subsequently purchase. Although we have relationships with certain automobile dealers, none of our relationships are exclusive, some of them are newly established, and they may be terminated at any time. If, due to economic reasons, competition, or otherwise, we are unable to establish and maintain relationships with reputable dealers, our business, results of operations, and financial condition may be adversely affected.
Our retail purchase loan business model is based on our ability to enter into agreements with individual retailers to provide financing to customers in their stores. If a competitor were to offer better service or more attractive loan products to our retailer partners, it is possible that our retail partners would terminate their relationships with us. If we are unable to continue to grow our existing relationships and develop new relationships, our results of operations, financial condition, and ability to continue to expand could be adversely affected.
22
Table of Contents
Even with good relationships with automobile dealers and retailers, our ability to originate automobile purchase loans and retail purchase loans is dependent, in large part, on the underlying consumer demand for automobiles and retail goods. Automobile and retail sales are subject to fluctuation as a result of general economic trends and other factors. If sales volumes at the automobile dealerships and retailers with whom we have relationships decrease in the future as a result of general economic trends or due to any other factors, we may experience a corresponding decrease in the volume of such loans that we originate. In such circumstances, we may experience an adverse effect on our business, results of operations, and financial condition.
A substantial majority of our revenue is generated by our branches in South Carolina, Texas, and North Carolina.
Our branches in South Carolina, Texas, and North Carolina accounted for 27%, 30%, and 13%, respectively, of our revenue in 2015. Furthermore, all of our operations are in five Southeastern, one mid-Atlantic, and three Southwestern states. As a result, we are highly susceptible to adverse economic conditions in those areas. The unemployment rates in some states in our footprint are among the highest in the country. High unemployment rates may reduce the number of qualified borrowers to whom we will extend loans, which would result in reduced loan originations. Adverse economic conditions may increase delinquencies and charge-offs and decrease our overall loan portfolio quality. If any of the adverse regulatory or legislative events described in this “Risk Factors” section were to occur in South Carolina, Texas, or North Carolina, it could materially adversely affect our business, results of operations, and financial condition. For example, if interest rates in South Carolina, which currently are not capped, were to be capped, our business, results of operations, and financial condition would be materially and adversely affected.
Regular turnover among our managers and other employees at our branches makes it more difficult for us to operate our branches and increases our costs of operations, which could have an adverse effect on our business, results of operations, and financial condition.
Our workforce is comprised primarily of employees who work on an hourly basis. In certain areas where we operate, there is significant competition for employees. In the past, we have lost employees and candidates to competitors who have been willing to pay higher compensation than we pay. Our ability to continue to expand our operations depends on our ability to attract, train, and retain a large and growing number of qualified employees. The turnover among all of our branch employees was approximately 38% in 2013, 44% in 2014, and 44% in 2015. This turnover increases our cost of operations and makes it more difficult to operate our branches. Our customer service representative and assistant manager roles have historically experienced high turnover. We may not be able to retain and cultivate personnel at these ranks for future promotion to branch manager. If our employee turnover rates increase above historical levels or if unanticipated problems arise from our high employee turnover and we are unable to readily replace such employees, our business, results of operations, financial condition, and ability to continue to expand could be adversely affected.
The departure, transition, or replacement of key personnel could significantly impact the results of our operations. If we cannot continue to hire and retain high quality employees, our business and financial results may be negatively affected.
Our future success significantly depends on the continued service and performance of our key management personnel. Competition for these employees is intense. Our operating results could be adversely affected by higher employee turnover or increased salary and benefit costs. Like most businesses, our employees are important to our success and we are dependent in part on our ability to retain the services of our key management, operational, finance, and administrative personnel. We have built our business on a set of core values, and we attempt to hire employees who are committed to these values. We want to hire and retain employees who will fit our culture of providing exceptional service to our customers. In order to compete and to continue to grow, we must attract, retain, and motivate employees, including those in executive, senior management, and operational positions. As our employees gain experience and develop their knowledge and skills, they become highly desired by other businesses. Therefore, to retain our employees, we must provide a
23
Table of Contents
satisfying work environment and competitive compensation and benefits. If costs to retain our skilled employees increase, then our business and financial results may be negatively affected.
Our continued growth is also dependent, in part, on the skills, experience, and efforts of our senior management, including but not limited to, Michael R. Dunn, our Chief Executive Officer, and Jody L. Anderson, our President and Chief Operating Officer. Since late 2014, we have experienced departures of members of our senior management, including C. Glynn Quattlebaum, who was a co-founder, President, and Chief Operating Officer and served on our Board of Directors, Thomas F. Fortin, who was our Chief Executive Officer and served on our Board of Directors, and A. Michelle Masters, who was our Senior Vice President of Strategic Operations and Initiatives. We may not be successful in retaining the members of our senior management team or our other key employees. While we have entered into employment agreements with Mr. Dunn and Mr. Anderson, Mr. Dunn is 64 years old, is nearing the age of retirement, and his employment agreement expires at the end of 2016. The loss of the services of Mr. Dunn, Mr. Anderson, or any member of our senior management or key team members, including state vice presidents, or the inability to attract additional qualified personnel as needed, could have an adverse effect on our business, financial condition, and results of operations. We also depend on our district supervisors to supervise, train, and motivate our branch employees. These supervisors have significant experience with our company and within our industry, and would be difficult to replace. If we lose a district supervisor to a competitor, we could also be at risk of losing other employees and customers. In addition, the process of identifying management successors creates uncertainty and could become a distraction to our senior management and our Board of Directors, and we may not be successful in attracting qualified candidates to replace key positions when necessary. The identification and recruitment of candidates to fill senior management positions, when necessary, and the resulting transition process may be disruptive to our business and operations.
Our convenience check strategy exposes us to certain risks.
A significant portion of our growth in our small installment loans has been achieved through our direct mail campaigns, which involve mailing to pre-screened recipients “convenience checks,” which customers can sign and cash or deposit, thereby agreeing to the terms of the loan, which are disclosed on the front and back of the check and in the accompanying disclosures. We use convenience checks to seed new branch openings and attract new customers and those with better credit in our geographic footprint. In 2014 and 2015, loans initiated through convenience checks represented 18.8% and 16.8%, respectively, of the value of our originated loans. We expect that convenience checks will continue to represent a meaningful portion of our small installment loan originations in the future. There are several risks associated with the use of convenience checks, including the following:
| • | it is more difficult to maintain sound underwriting standards with convenience check customers, and these customers have historically presented a higher risk of default than customers that originate loans in our branches, as we do not meet convenience check customers prior to soliciting them and extending a loan to them, and we may not be able to verify certain elements of their financial condition, including their current employment status or life circumstances; |
| • | we rely on credit information from a third-party credit bureau that is more limited than a full credit report to pre-screen potential convenience check recipients, which may not be as effective or may be inaccurate or outdated; |
| • | we face limitations on the number of potential borrowers who meet our lending criteria within proximity to our branches; |
| • | we may not be able to continue to access the demographic and credit file information that we use to generate our mailing lists due to expanded regulatory or privacy restrictions; |
| • | convenience checks pose a risk of fraud; |
| • | we depend on one bank to issue and clear our convenience checks, and any failure by that bank to properly process the convenience checks could limit the ability of a recipient to cash the check and enter into a loan with us; |
24
Table of Contents
| • | customers may opt out of direct mail solicitations and solicitations based on their credit file or may otherwise prohibit us from soliciting them; and |
| • | postal rates and piece printing rates may continue to rise. |
For example, in 2014 we experienced a convenience check credit quality deterioration in our direct mail campaigns. We responded to these issues by hiring a Chief Risk Officer and other personnel focused on credit risk management, establishing a Credit Committee to oversee direct mail campaign underwriting and origination processes, implementing additional policies and internal control procedures related to the audit of direct mail campaign files, and improving upon early-stage delinquency reporting and communication. Despite these efforts, we may experience future issues relating to our credit checks and other processes associated with our direct mail strategy. Our expected increase in the use of convenience checks will further increase our exposure to, and the magnitude of, these risks.
A reduction in demand for our products and failure by us to adapt to such reduction could adversely affect our business and results of operations.
The demand for the products we offer may be reduced due to a variety of factors, such as demographic patterns, changes in customer preferences or financial conditions, regulatory restrictions that decrease customer access to particular products, or the availability of competing products. For example, we are highly dependent upon selecting and maintaining attractive branch locations. These locations are subject to local market conditions, including the employment available in the area, housing costs, traffic patterns, crime, and other demographic influences, any of which may quickly change. Should we fail to adapt to significant changes in our customers’ demand for, or access to, our products, our revenues could decrease significantly and our operations could be harmed. Even if we do make changes to existing products or introduce new products to fulfill customer demand, customers may resist or may reject such products. Moreover, the effect of any product change on the results of our business may not be fully ascertainable until the change has been in effect for some time, and by that time it may be too late to make further modifications to such product without causing further harm to our business, results of operations, and financial condition.
We may attempt to pursue acquisitions or strategic alliances which may be unsuccessful.
We may attempt to achieve our business objectives through acquisitions and strategic alliances. We compete with other companies for these opportunities, including companies with greater financial resources, and we cannot be certain that we will be able to effect acquisitions or strategic alliances on commercially reasonable terms, or at all. Furthermore, most acquisition targets that we have pursued previously have been significantly smaller than us. We do not have extensive experience with integrating larger acquisitions. In pursuing these transactions, we may experience, among other things:
| • | overvaluing potential targets; |
| • | difficulties in integrating any acquired companies, branches, or products into our existing business, including integration of account data into our information systems; |
| • | inability to realize the benefits we anticipate in a timely fashion, or at all; |
| • | attrition of key personnel from acquired businesses; |
| • | unexpected losses due to the acquisition of loan portfolios with loans originated using less stringent underwriting criteria; |
| • | significant costs, charges, or writedowns; or |
| • | unforeseen operating difficulties that require significant financial and managerial resources that would otherwise be available for the ongoing development and expansion of our existing operations. |
25
Table of Contents
We are exposed to credit risk in our lending activities.
Our ability to collect on loans depends on the willingness and repayment ability of our borrowers. Any material adverse change in the ability or willingness of a significant portion of our borrowers to meet their obligations to us, whether due to changes in general economic conditions, the cost of consumer goods, interest rates, natural disasters, acts of war or terrorism, or other causes over which we have no control, or to changes or events affecting our borrowers such as unemployment, major medical expenses, divorce, or death, would have a material adverse impact on our earnings and financial condition. Further, a substantial majority of our borrowers are non-prime borrowers, who are more likely to be affected, and more severely affected, by adverse macroeconomic conditions. We cannot be certain that our credit administration personnel, policies, and procedures will adequately adapt to changes in economic or any other conditions affecting customers and the quality of the loan portfolio.
We may be limited in our ability to collect on our loan portfolio, and the security interests securing a significant portion of our loan portfolio are not perfected, which may increase our credit losses.
Legal and practical limitations may limit our ability to collect on our loan portfolio, resulting in increased credit losses, decreased revenues, and decreased earnings. State and federal laws and regulations restrict our collection efforts. Most of our loan portfolio is secured, but a significant portion of such security interests have not been and will not be perfected, which means that we cannot be certain that such security interests will be given first priority over other creditors. The amounts that we are able to recover from the repossession and sale of collateral typically do not cover the outstanding loan balance and costs of recovery. In cases where we repossess a vehicle securing a loan, we generally sell our repossessed automobile inventory through public sales conducted by independent automobile auction organizations after the required post-repossession waiting period. There is approximately a 30-day period between the time we repossess a vehicle or other property and the time it is sold at auction. In certain instances, we may sell repossessed collateral other than vehicles through our branches after the required post-repossession waiting period and appropriate receipt of valid bids. The proceeds we receive from such sales depend upon various factors, including the supply of, and demand for, used vehicles and other property at the time of sale. During periods of economic slowdown or recession, such as have existed in the United States for much of the past several years, there may be less demand for used vehicles and other property that we desire to resell.
Further, a significant portion of our loan portfolio is not secured by perfected security interests, including small installment loans and retail purchase loans. The lack of perfected security interests is one of several factors that may make it more difficult for us to collect on our loan portfolio. During 2015, net charge-offs as a percentage of average finance receivables on our small installment loans, which are typically secured by unperfected interests in personal property, were 11.8%, while net charge-offs as a percentage of average finance receivables for our large installment loans and automobile purchase loans, which are typically secured by perfected interests in an automobile or other vehicle, for the same periods were 2.7% and 6.6%, respectively. Additionally, for those of our loans which are unsecured, borrowers may choose to repay obligations under other indebtedness before repaying loans to us because such borrowers have no collateral at risk. Lastly, given the relatively small size of our loans, the costs of collecting loans may be high relative to the amount of the loan. As a result, many collection practices that are legally available, such as litigation, may be financially impracticable. These factors may increase our credit losses, which would have a material adverse effect on our results of operations and financial condition.
In addition, there is an inherent risk that a portion of the retail installment contracts that we hold will be in default or be subject to certain claims or defenses that the borrower may assert against the originator of the contract, or us as the holder of the contract. We face the risk that if high unemployment or adverse economic developments occur or continue in one or more of our markets, a large number of retail installment contracts will become defaulted. In addition, most of the borrowers under these contracts have some negative credit history. There can be no assurance that our allowance for credit losses will prove sufficient to cover actual losses in the future on these contracts.
26
Table of Contents
Our policies and procedures for underwriting, processing, and servicing loans are subject to potential failure or circumvention, which may adversely affect our results of operations.
A substantial portion of our underwriting activities and our credit extension decisions are made at our local branches. We train our employees individually onsite in the branch to make loans that conform to our underwriting standards. Such training includes critical aspects of state and federal regulatory compliance, cash handling, account management, and customer relations. Although we have standardized employee manuals, we primarily rely on our district supervisors, with oversight by our state vice presidents, branch auditors, and headquarters personnel, to train and supervise our branch employees, rather than centralized training programs. Therefore, the quality of training and supervision may vary from district to district and branch to branch depending upon the amount of time apportioned to training and supervision and individual interpretations of our operations policies and procedures. In addition, we sometimes rely on third-party service providers in connection with loan underwriting and origination. Any error or failure by a third-party service provider in providing loan underwriting and origination services may cause us to originate loans to borrowers that do not meet our underwriting standards. We cannot be certain that every loan is made in accordance with our underwriting standards and rules. We have in the past experienced some instances of loans extended that varied from our underwriting standards. Variances in underwriting standards and lack of supervision could expose us to greater delinquencies and charge-offs than we have historically experienced.
In addition, underwriting decisions are based on information provided by customers, counterparties, and other third parties, including credit bureaus and data aggregators, the inaccuracy or incompleteness of which may adversely affect our results of operations. In deciding whether to extend credit or enter into other transactions with customers and counterparties, we rely on such information furnished to us by or on behalf of customers, counterparties, and other third parties, including financial information. We also rely on representations of customers and counterparties as to the accuracy and completeness of that information. Our earnings and our financial condition could be negatively impacted to the extent the information furnished to us by and on behalf of customers, counterparties, and other third parties is not correct or complete.
Employee misconduct could harm us by subjecting us to significant legal liability, regulatory scrutiny, and reputational harm.
Our reputation is critical to maintaining and developing relationships with our existing and potential customers and third parties with whom we do business. There is a risk that our employees could engage in misconduct that adversely affects our business. For example, if an employee were to engage – or be accused of engaging – in illegal or suspicious activities, we could be subject to regulatory sanctions and suffer serious harm to our reputation, financial condition, customer relationships, and ability to attract future customers. Employee misconduct could prompt regulators to allege or to determine, based upon such misconduct, that we have not established adequate supervisory systems and procedures to inform employees of applicable rules or to detect and deter violations of such rules. It is not always possible to deter employee misconduct, and the precautions we take to detect and prevent misconduct may not be effective in all cases. Misconduct by our employees, or even unsubstantiated allegations, could result in a material adverse effect on our reputation and our business.
Our risk management efforts may not be effective.
We could incur substantial losses and our business operations could be disrupted if we are unable to effectively identify, manage, monitor, and mitigate financial risks, such as credit risk, interest rate risk, prepayment risk, liquidity risk, and other market-related risks, as well as operational risks related to our business, assets, and liabilities. Our risk management policies, procedures, and techniques may not be sufficient to identify all of the risks we are exposed to, mitigate the risks we have identified, or identify additional risks to which we may become subject in the future.
27
Table of Contents
We may be unsuccessful in maintaining effective internal controls over financial reporting.
Controls and procedures are particularly important for consumer finance companies. Effective internal controls over financial reporting are necessary for us to provide reliable financial reports and, together with adequate disclosure controls and procedures, are designed to prevent fraud or material error. Any system of controls, however well-designed and operated, is based in part on certain assumptions and can provide only reasonable, not absolute, assurance that the objectives of the system are met. Section 404 of the Sarbanes-Oxley Act of 2002 (the “Sarbanes-Oxley Act”) requires management of public companies to develop and implement internal controls over financial reporting and evaluate the effectiveness thereof. Under standards established by the Public Company Accounting Oversight Board, a material weakness is a deficiency, or a combination of deficiencies, in internal control over financial reporting such that there is a reasonable possibility that a material misstatement of our financial statements will not be prevented or detected on a timely basis. A significant deficiency is a deficiency, or a combination of deficiencies, in internal control over financial reporting that is less severe than a material weakness, yet important enough to merit attention by those responsible for oversight of our financial reporting. Any failure to implement current internal controls or required new or improved controls, or difficulties encountered in their implementation, could cause us to fail to meet our reporting obligations.
In November 2014, we identified a material weakness in our internal control over financial reporting related to controls over the credit risk associated with the origination of direct mail loans. In addition, we have in the past identified significant deficiencies in our internal control over financial reporting. We remediated the material weakness identified in November 2014 effective as of December 31, 2015.
If additional material weaknesses or significant deficiencies in our internal control over financial reporting are discovered or occur in the future or if our controls and procedures fail or are circumvented, our consolidated financial statements may contain material misstatements, we could be required to restate our financial results, we may be unable to produce accurate and timely financial statements, and we may be unable to maintain compliance with applicable stock exchange listing requirements, any of which could have a material adverse effect on our business, results of operations, financial condition, and stock price. The discovery of a material weakness and the disclosure of that fact, even if quickly remediated, could reduce the market value of shares of our common stock. Additionally, the existence of any material weakness or significant deficiency requires management to devote significant time and incur significant expense to remediate any such material weaknesses or significant deficiency, and management may not be able to remediate any such material weaknesses or significant deficiency in a timely manner. Undetected material weaknesses in our internal controls could lead to financial statement restatements, which could have a material adverse effect on our business, financial condition, and results of operation.
If our estimates of reserves for credit losses are not adequate to absorb actual losses, our provision for credit losses would increase, which would adversely affect our results of operations.
We maintain an allowance for credit losses for all loans we make. To estimate the appropriate level of credit loss reserves, we consider known and relevant internal and external factors that affect loan collectability, including the total amount of loans outstanding, historical loan charge-offs, delinquency rates and trends, our current collection patterns, and economic trends. Our methodology for establishing our reserves for credit losses is based in large part on our historic loss experience. If customer behavior changes as a result of economic or other conditions and if we are unable to predict how the unemployment rate and general economic uncertainty may affect our credit loss reserves, our provision may be inadequate. During fiscal 2015, our provision for credit losses was $47.3 million, and we had net charge-offs of $50.4 million related to losses on our loans. As of December 31, 2015, our finance receivables were $628.4 million. Maintaining the adequacy of our allowance for credit losses may require that we make significant and unanticipated increases in our provisions for credit losses, which would materially affect our results of operations. Our credit loss reserves, however, are estimates, and if actual credit losses are materially greater than our credit loss reserves, our financial condition and results of operations could be adversely affected. Neither state regulators nor federal regulators regulate our allowance for credit losses.
28
Table of Contents
If assumptions or estimates we use in preparing our financial statements are incorrect or are required to change, our reported results of operations and financial condition may be adversely affected.
We are required to use certain assumptions and estimates in preparing our financial statements under U.S. Generally Accepted Accounting Principles (“GAAP”), including in determining allowances for loan losses, fair value of financial instruments, asset impairment, reserves related to litigation and other legal matters, valuation of income and other taxes and regulatory exposures. In addition, significant assumptions and estimates are involved in determining certain disclosures required under GAAP, including those involving the fair value of our financial instruments. If the assumptions or estimates underlying our financial statements are incorrect, the actual amounts realized on transactions and balances subject to those estimates will be different, and this could have a material adverse effect on our results of operations and financial condition.
In addition, the Financial Accounting Standards Board (“FASB”) is currently reviewing or proposing changes to several financial accounting and reporting standards that govern key aspects of our financial statements, including areas where assumptions or estimates are required. As a result of changes to financial accounting or reporting standards, whether promulgated or required by the FASB or other regulators, we could be required to change certain of the assumptions or estimates we previously used in preparing our financial statements, which could negatively impact how we record and report our results of operations and financial condition generally. For additional information on the key areas for which assumptions and estimates are used in preparing our financial statements, see Item 7, “Management’s Discussion and Analysis of Financial Condition and Results of Operations – Critical Accounting Policies” and Note 1 (Nature of Business and Significant Accounting Policies) of our audited Consolidated Financial Statements.
Our use of derivatives exposes us to credit and market risk.
From time to time, we enter into derivative transactions for economic hedging purposes, such as managing our exposure to interest rate risk. By using derivative instruments, we are exposed to credit and market risk, including the risk of loss associated with variations in the spread between the asset yield and the funding and/or hedge cost, default risk, and the risk of insolvency or other inability of the counterparty to a particular derivative transaction to perform its obligations. For additional information, see Item 7A, “Quantitative and Qualitative Disclosures About Market Risk.”
Interest rates on automobile purchase and retail purchase loans are determined at competitive market interest rates, and we may fail to adequately set interest rates, which may adversely affect our business.
Over recent years, we have expanded our automobile purchase loan business and our retail purchase loan business, and we plan to continue to expand those businesses in the future. Unlike installment loans, which in certain states are typically made at or near the maximum interest rates permitted by law, automobile purchase loans and retail purchase loans are often made at competitive market interest rates, which are governed by laws for installment sales contracts. If we fail to set interest rates at a level that adequately reflects market rates or the credit risks of our customers, or if we set interest rates at a level too low to sustain our profitability, our business, results of operations, and financial condition could be adversely affected.
Failure of third-party service providers upon which we rely could adversely affect our business.
We rely on certain third-party service providers. In particular, we currently rely on one key vendor to print and mail our convenience checks for our direct mail marketing campaigns, and we rely on certain other third-party service providers in connection with loan underwriting and origination. Our reliance on these and other third parties can expose us to risks. For example, an error by our former convenience check vendor during 2010 and our current convenience check vendor during 2015 resulted in checks being misdirected, requiring us in some cases to notify state regulators and to refund certain interest and fee amounts, and exposing us to increased credit risk. If any of our third-party service providers, including our convenience check vendors and those third
29
Table of Contents
parties providing services in connection with loan underwriting and origination, are unable to provide their services timely, accurately, and effectively, or at all, it could have a material adverse effect on our business, financial condition, and results of operations and cash flows.
We depend to a substantial extent on borrowings under our senior revolving credit facility to fund our liquidity needs.
We have a senior revolving credit facility committed through September 2018 that allows us to borrow up to $538.0 million, assuming we are in compliance with a number of covenants and conditions. The credit facility also has an accordion provision that allows for the expansion of the facility to up to $600.0 million. The senior revolving credit facility is collateralized by certain of our assets, including substantially all of our finance receivables and equity interests of the majority of our subsidiaries. As of December 31, 2015, the amount outstanding under our senior revolving credit facility was $338.3 million and we had $199.7 million of unused capacity on the credit facility (subject to certain covenants and conditions). During fiscal 2015, the maximum amount of borrowings outstanding under the facility at one time was $403.1 million. We use our senior revolving credit facility as a source of liquidity, including for working capital and to fund the loans we make to our customers. If our existing sources of liquidity become insufficient to satisfy our financial needs or our access to these sources becomes unexpectedly restricted, we may need to try to raise additional debt or equity in the future. If such an event were to occur, we can give no assurance that such alternate sources of liquidity would be available to us on favorable terms or at all. In addition, we cannot be certain that we will be able to replace the amended and restated senior revolving credit facility when it matures on favorable terms or at all. If any of these events occur, our business, results of operations, and financial condition could be adversely affected.
Macroeconomic conditions could have a material adverse effect on our business, financial position, results of operations, and cash flows, and may increase loan defaults and affect the value and liquidity of your investment.
We are not insulated from the pressures and potentially negative consequences of financial crises and similar risks beyond our control that have in the past and may in the future affect the capital and credit markets, the broader economy, the financial services industry, or the segment of that industry in which we operate.
Beginning in 2007, the global economy experienced a significant recession, as well as a severe, ongoing disruption in the credit markets and a material and adverse effect on the jobs market and individual borrowers. While the United States economy may technically have come out of this recession, the recovery is fragile and may not be sustainable for any specific period of time, and could slip back into an even more significant recession. Our financial performance generally, and in particular the ability of our borrowers to make payments on outstanding loans, is highly dependent upon the business and economic environments in the markets where we operate and in the United States as a whole.
During an economic downturn or recession, credit losses in the financial services industry generally increase and demand for credit products often decreases. Declining asset values, defaults on consumer loans, and the lack of market and investor confidence, as well as other factors, all combine to decrease liquidity during an economic downturn. As a result of these factors, some banks and other lenders have suffered significant losses during economic downturns, and the strength and liquidity of many financial institutions worldwide has weakened due to the most recent economic crisis. Additionally, during an economic downturn, our loan servicing costs and collection costs may increase as we may have to expend greater time and resources on these activities. Our underwriting criteria, policies and procedures, and product offerings may not sufficiently protect our growth and profitability during a sustained period of economic downturn or recession. Any renewed economic downturn will adversely affect the financial resources of our customers and may result in the inability of our customers to make principal and interest payments on, or refinance, the outstanding debt when due.
In addition, periods of economic slowdown or recession are typically accompanied by decreased consumer demand for automobiles and other retail goods. Our ability to originate automobile purchase loans and retail
30
Table of Contents
purchase loans depends, in large part, on the underlying demand for such products. Further, our business is focused on customers who generally do not qualify for conventional automobile or retail financing, and customers in this demographic are more likely to be affected, and more severely affected, by an economic downturn. Accordingly, our business, financial position, results of operations and cash flows may be adversely impacted during any economic downturn or recession.
Should economic conditions worsen, they may adversely affect the credit quality of our loans. In the event of increased default by borrowers under the loans, and/or a decrease in the volume of the loans we originate, our business, results of operations, and financial condition could be adversely affected.
We are subject to interest rate risk resulting from general economic conditions and policies of various governmental and regulatory agencies.
Interest rate risk arises from the possibility that changes in interest rates will affect our results of operations and financial condition. Interest rates are highly sensitive to many factors that are beyond our control, including general economic conditions and policies of various governmental and regulatory agencies, in particular, the Federal Reserve Board. Furthermore, market conditions or regulatory restrictions on interest rates we charge may prevent us from passing any increases in interest rates along to our customers. We originate finance receivables at either prevailing market rates or at statutory limits. Subject to statutory limits, our ability to react to changes in prevailing market rates is dependent upon the speed at which our customers pay off or renew loans in our existing loan portfolio, which allows us to originate new loans at prevailing market rates. Our loan portfolio turns over approximately 1.5 times per year from cash payments, renewals, and charged-off loans. Because our automobile loans have longer maturities and typically are not refinanced prior to maturity, the rate of turnover of the loan portfolio may change as these loans change as a percentage of our portfolio.
In addition, rising interest rates will increase our cost of capital by influencing the amount of interest we pay on our senior revolving credit facility or any other floating interest rate obligations we may incur, which would increase our operating costs and decrease our operating margins. Interest payable on our senior revolving credit facility is variable, based on LIBOR with a LIBOR floor of 1.00%, and could increase in the future.
Our insurance operations are subject to a number of risks and uncertainties, including claims.
We market and sell optional credit life, credit accident and health, credit personal property, and credit involuntary unemployment insurance in connection with our loans in selected markets as an agent for an unaffiliated third-party insurance company. The policies are then ceded to our wholly-owned reinsurance subsidiary, RMC Reinsurance, Ltd., which then bears the full risk of the policies. Insurance claims and policyholder liabilities are difficult to predict and may exceed the related reserves set aside for claims and associated expenses for claims adjudication. In addition, in 2016, we plan to transition our insurance business to a new unaffiliated third-party insurance company. The transition is complex and will include, among other things, the retraining of our branch network and the reprogramming of our loan management system to appropriately calculate premium amounts and to generate required disclosures on a state-by-state basis. Any failure to timely transition our insurance operations to the new unaffiliated third-party insurance company will result in our inability to offer our insurance products in certain states, which will have a material and adverse effect on our business, results of operations, and financial condition.
Other risks relating to our insurance operations include changes to laws and regulations applicable to us, as well as changes to the regulatory environment. Examples include changes to laws or regulations affecting capital and reserve requirements; frequency and type of regulatory monitoring and reporting; consumer privacy, use of customer data, and data security; benefits or loss ratio requirements; insurance producer licensing or appointment requirements; required disclosures to consumers; and collateral protection insurance (i.e., insurance purchased at the borrower’s expense on the borrower’s loan collateral for the periods of time the borrower fails to adequately, as required by his or her loan, insure that collateral). Because our borrowers do not affirmatively consent to
31
Table of Contents
collateral protection insurance at the time it is purchased and, hence, do not directly agree to the amount charged for it, regulators may in the future prohibit us from providing this insurance. Moreover, our insurance operation is dependent on our lending operation for its sole source of business and product distribution. If our lending operations discontinue offering insurance products, our insurance operations would have no method of distribution, and our business, results of operations, and financial condition may be adversely affected.
Our revolving credit agreement contains restrictions and limitations that could affect our ability to operate our business.
The credit agreement governing our senior revolving credit facility contains a number of covenants that could adversely affect our business and the flexibility to respond to changing business and economic conditions or opportunities. Among other things, these covenants limit our ability to:
| • | incur or guarantee additional indebtedness; |
| • | purchase large loan portfolios in bulk; |
| • | pay dividends or make distributions on our capital stock or make certain other restricted payments; |
| • | sell assets, including our loan portfolio or the capital stock of our subsidiaries; |
| • | enter into transactions with our affiliates; |
| • | offer certain loan products; |
| • | create or incur liens; and |
| • | consolidate, merge, sell, or otherwise dispose of all or substantially all of our assets. |
In addition, the credit agreement imposes certain obligations on us relating to our underwriting standards, recordkeeping and servicing of our loans, and our loss reserves and charge-off policies. It also requires us to maintain certain financial ratios, including an interest coverage ratio and a borrowing base ratio. If we were to breach any covenants or obligations under the credit agreement and such breaches were to result in an event of default, our lenders could cause all amounts outstanding to become due and payable, subject to applicable grace periods. This could trigger cross-defaults under existing and future debt instruments, and materially and adversely affect our financial condition and ability to continue operating our business as a going concern.
We rely on information technology products developed, owned, and supported by third parties, including our competitors. Our ability to manage our business and monitor results is highly dependent upon these information technology products. A failure of these products and systems or of the implementation of new information technology products and systems could disrupt our business.
In the operation of our business, we are highly dependent upon a variety of information technology products, including our loan management system, which allows us to record, document, and manage our loan portfolio. We currently use a loan management software package developed and owned by ParaData Financial Systems (“ParaData”), a wholly owned subsidiary of World Acceptance Corporation, one of our primary competitors. Over the years, we have tailored this software to meet our specific needs. We depend on the willingness and ability of ParaData to continue to provide customized solutions and support our evolving products and business model. In the future, ParaData may not be willing or able to modify the loan management software to meet our needs, or it could alter the program without notice to us or cease to adequately support it. ParaData could also decide in the future to refuse to provide support for its software to us on commercially reasonable terms, or at all. If any of these events were to occur, we would be forced to migrate to an alternative software package, which could materially affect our business, results of operations, and financial condition.
We rely on DealerTrack, Route One, Teledata Communications Inc., and other third-party software vendors to provide access to loan applications and/or screen applications. There can be no assurance that these
32
Table of Contents
third party providers will continue to provide us information in accordance with our lending guidelines or that they will continue to provide us lending leads at all. If this occurs, our credit losses, business, results of operations, and financial condition may be adversely affected.
Security breaches in our branches or acts of theft, fraud, or violence could adversely affect our financial condition and results of operations.
Nearly all of our account payments occur at our branches, either in person or by mail, and frequently consist of cash payments, which we deposit at local banks throughout the day. This business practice exposes us daily to the potential for employee theft of funds or, alternatively, to theft and burglary due to the cash we maintain in our branches. Despite controls and procedures to prevent such losses, we have in the past sustained losses due to employee fraud (including collusion) and theft. We are also susceptible to break-ins at our branches, where money and/or customer records could be taken. A breach in the security of our branches or in the safety of our employees could result in employee injury, loss of funds or records, and adverse publicity, and could result in a loss of customer business or expose us to civil litigation and possible financial liability, any of which could have a material adverse effect on our financial condition and results of operations.
Security breaches, cyber-attacks, failures in our information systems, or fraudulent activity could result in damage to our operations or lead to reputational damage.
We also rely heavily on communications and information systems to conduct our business. Each branch is part of an information network that is designed to permit us to maintain adequate cash inventory, reconcile cash balances on a daily basis, and report revenues and expenses to our headquarters. Any failure, interruption, or breach in security of these systems, including any failure of our back-up systems, hardware failures, or an inability to access data maintained offsite, could result in failures or disruptions in our customer relationship management, general ledger, loan, and other systems and could result in a loss of customer business, subject us to additional regulatory scrutiny, or expose us to civil litigation, possible financial liability, and other adverse consequences, any of which could have a material adverse effect on our financial condition and results of operations. Furthermore, we may not be able to detect immediately any such breach, which may increase the losses that we would suffer. In addition, our existing insurance policies would not reimburse us for all of the damages that we might incur as a result of a breach.
A security breach or cyber-attack on our computer systems could interrupt or damage our operations or harm our reputation. Despite the implementation of security measures, our systems may still be vulnerable to data theft, computer viruses, programming errors, attacks by third parties, or similar disruptive problems. If we were to experience a security breach or cyber-attack, we could be required to incur substantial costs and liabilities, including, among other things, the following:
| • | expenses to rectify the consequences of the security breach or cyber-attack; |
| • | liability for stolen assets or information; |
| • | costs of repairing damage to our systems; |
| • | lost revenue and income resulting from any system downtime caused by such breach or attack; |
| • | increased costs of cyber security protection; |
| • | costs of incentives we may be required to offer to our customers or business partners to retain their business; and |
| • | damage to our reputation causing customers and investors to lose confidence in our company. |
In addition, any compromise of security or a cyber-attack could deter consumers from entering into transactions that require them to provide confidential information to us. Further, if confidential customer
33
Table of Contents
information or information belonging to our business partners is misappropriated from our computer systems, we could be sued by those who assert that we did not take adequate precautions to safeguard our systems and confidential data belonging to our customers or business partners, which could subject us to liability and result in significant legal fees and expenses of defending these claims. As a result, any compromise of security of our computer systems or cyber-attack could have a material adverse effect on our business, prospects, results of operations, and financial condition.
We may not be able to make technological improvements as quickly as some of our competitors, which could harm our competitive ability and adversely affect our business, prospects, results of operations, and financial condition.
The financial services industry is undergoing rapid technological changes, with frequent introductions of new technology-driven products and services. We rely on our integrated branch network as the foundation of our multiple channel platform and the primary point of contact with our active accounts. However, to serve customers who want to reach us over the Internet, we developed a new channel in late 2008 by making an online loan application available on our consumer website, and in late 2015, we began testing end-to-end origination of unsecured consumer loans via our website. Our future success and, in particular, the success of our online sourcing, will depend, in part, on our ability to address the needs of our customers by using technology to provide products and services that will satisfy customer demand for convenience, as well as to create additional efficiencies in our operations. If we fail to effectively implement new technology-driven products and services as quickly as some of our competitors or if we fail to be successful in marketing these products to our customers, our business, prospects, results of operations, and financial condition may be harmed.
Our centralized headquarters’ functions and branch operations are susceptible to disruption by catastrophic events, which could have a material adverse effect on our business, results of operations, and financial condition.
Our headquarters buildings are located in Greenville, South Carolina. Our information systems and administrative and management processes are primarily provided to our branches from this centralized location, and our separate data management facility is located in the same city. These processes could be disrupted if a catastrophic event, such as a tornado, power outage, or act of terror, affected Greenville. Any such catastrophic event or other unexpected disruption of our headquarters or data management facility could have a material adverse effect on our business, results of operations, and financial condition.
We may be required to repurchase certain finance receivables if these finance receivables fail to meet certain criteria or characteristics or under other circumstances, which could adversely affect our results of operations, financial condition, and liquidity.
On December 11, 2015, we and our wholly-owned subsidiary, Regional Management Receivables, LLC (“RMR”), entered into a credit agreement with Wells Fargo Bank, National Association, and Wells Fargo Securities, LLC as administrative agent. This credit agreement provides for a $75.7 million amortizing loan to RMR that is secured by certain retail installment contracts and promissory notes secured by new or used automobiles, light-duty trucks, minivans, sport utility vehicles, and other passenger vehicles (excluding motorcycles) which were originated (either directly or indirectly) by certain of our subsidiaries (the “Receivables”). On the closing date of the transactions contemplated by the credit agreement, RMR made certain representations and warranties about the quality and nature of the Receivables. The amortizing loan requires RMR to pay the administrative agent a release fee for the release of certain Receivables as collateral under certain circumstances, including circumstances in which the representations and warranties made by RMR concerning the quality and characteristics of the Receivables are inaccurate.
As a result of the current market environment, we believe that many purchasers of loans and other counterparties to transactions like those provided for in the amortizing loan and other similar securitization
34
Table of Contents
transactions are particularly aware of the conditions under which originators must indemnify for or repurchase finance receivables, and may benefit from enforcing any available repurchase remedies. If we are required to repurchase Receivables that we have sold or pledged, this could adversely affect our results of operations, financial condition, and liquidity.
Risks Related to Regulation and Legal Proceedings
Our business products and activities are strictly and comprehensively regulated at the local, state, and federal level.
Our business is subject to numerous local, state, and federal laws and regulations. These regulations impose significant costs and limitations on the way we conduct and expand our business, and these costs and limitations may increase in the future if such laws and regulations are changed. These laws and regulations govern or affect, among other things:
| • | the interest rates that we may charge customers; |
| • | terms of loans, including fees, maximum amounts, and minimum durations; |
| • | the number of simultaneous or consecutive loans and required waiting periods between loans; |
| • | disclosure practices, including posting of fees; |
| • | currency and suspicious activity reporting; |
| • | recording and reporting of certain financial transactions; |
| • | privacy of personal customer information; |
| • | the types of products and services that we may offer; |
| • | collection practices; |
| • | approval of licenses; and |
| • | locations of our branches. |
Changes to statutes, regulations, or regulatory policies, including the interpretation, implementation, and enforcement of statutes, regulations, or policies, could affect us in substantial and unpredictable ways, including limiting the types of financial services and products that we may offer and increasing the ability of competitors to offer competing financial services and products. Compliance with laws and regulations requires us to invest increasingly significant portions of our resources in compliance planning and training, monitoring tools, and personnel, and requires the time and attention of management. These costs divert capital and focus away from efforts intended to grow our business. Because these laws and regulations are complex and often subject to interpretation, or because of a result of unintended errors, we may, from time to time, inadvertently violate these laws, regulations, and policies, as each is interpreted by our regulators. If we do not successfully comply with laws, regulations, or policies, our compliance costs could increase, our operations could be limited, and we may suffer damage to our reputation. If more restrictive laws, rules, and regulations are enacted or more restrictive judicial and administrative interpretations of those laws are issued, compliance with the laws could become more expensive or difficult. Furthermore, changes in these laws and regulations could require changes in the way we conduct our business, and we cannot predict the impact such changes would have on our profitability.
Our primary regulators are the state regulators for the states in which we operate: Alabama, Georgia, New Mexico, North Carolina, Oklahoma, South Carolina, Tennessee, Texas, and Virginia. We operate each of our branches under licenses granted to us by these state regulators. State regulators may enter our branches and conduct audits of our records and practices at any time, with or without notice. If we fail to observe, or are not able to comply with, applicable legal requirements, we may be forced to discontinue certain product offerings, which could adversely impact our business, results of operations, and financial condition. In addition, violation
35
Table of Contents
of these laws and regulations could result in fines and other civil and/or criminal penalties, including the suspension or revocation of our branch licenses, rendering us unable to operate in one or more locations. All of the states in which we operate have laws governing the interest rate and fees that we can charge and required disclosure statements, among other restrictions. Violation of these laws could involve penalties requiring the forfeiture of principal and/or interest and fees that we have charged. Depending on the nature and scope of a violation, fines and other penalties for noncompliance of applicable requirements could be significant and could have a material adverse effect on our business, results of operation, and financial condition.
Licenses to open new branches are granted in the discretion of state regulators. Accordingly, licenses may be denied unexpectedly or for reasons outside of our control. This could hinder our ability to implement our business plans in a timely manner or at all.
As we enter new markets and develop new products, we may become subject to additional state and federal regulations. For example, although we intend to expand into new states, we may encounter unexpected regulatory or other difficulties in these new states or markets, which may prevent us from growing in new states or markets. Similarly, while we intend to grow our retail purchase and indirect automobile purchase loan operations, we may encounter unexpected regulatory or other difficulties. As a result, we may not be able to successfully execute our strategies to grow our revenue and earnings.
Changes in laws and regulations or interpretations of laws and regulations could negatively impact our business, results of operations, and financial condition.
The laws and regulations directly affecting our lending activities are under review and are subject to change, especially as a result of current economic conditions, changes in the make-up of the current executive and legislative branches, and the political focus on issues of consumer and borrower protection. In addition, consumer advocacy groups and various other media sources continue to advocate for governmental and regulatory action to prohibit or severely restrict various financial products, including the loan products we offer.
Any changes in such laws and regulations, or the implementation, interpretation, or enforcement of such laws and regulations, could force us to modify, suspend, or cease part or, in the worst case, all of our existing operations. It is also possible that the scope of federal regulations could change or expand in such a way as to preempt what has traditionally been state law regulation of our business activities. The enactment of one or more of such regulatory changes could materially and adversely affect our business, results of operations, and prospects.
State and federal legislatures and regulators may also seek to impose new requirements or interpret or enforce existing requirements in new ways. Changes in current laws or regulations or the implementation of new laws or regulations in the future may restrict our ability to continue our current methods of operation or expand our operations. Additionally, these laws and regulations could subject us to liability for prior operating activities or lower or eliminate the profitability of operations going forward by, among other things, reducing the amount of interest and fees we charge in connection with our loans. If these or other factors lead us to close our branches in a state, in addition to the loss of net revenues attributable to that closing, we would incur closing costs such as lease cancellation payments and we would have to write off assets that we could no longer use. If we were to suspend rather than permanently cease our operations in a state, we would also have continuing costs associated with maintaining our branches and our employees in that state, with little or no revenues to offset those costs.
In addition to state and federal laws and regulations, our business is subject to various local rules and regulations, such as local zoning regulations. Local zoning boards and other local governing bodies have been increasingly restricting the permitted locations of consumer finance companies. Any future actions taken to require special use permits for, or impose other restrictions on, our ability to provide products could adversely affect our ability to expand our operations or force us to attempt to relocate existing branches. If we were forced to relocate any of our branches, in addition to the costs associated with the relocation, we may be required to hire
36
Table of Contents
new employees in the new areas, which may adversely impact the operations of those branches. Relocation of an existing branch may also hinder our collection abilities, as our business model relies in part on the location of our branches being close to where our customers live in order to successfully collect on outstanding loans.
Changes in laws or regulations may have a material adverse effect on all aspects of our business in a particular state and on our overall business, results of operations, and financial condition.
The Dodd-Frank Wall Street Reform and Consumer Protection Act of 2010 (the “Dodd-Frank Act”) authorizes the Consumer Financial Protection Bureau (the “CFPB”) to adopt rules that could potentially have a serious impact on our ability to offer short-term consumer loans and have a material adverse effect on our operations and financial performance.
Title X of the Dodd-Frank Act establishes the CFPB, which became operational on July 21, 2011. Under the Dodd-Frank Act, the CFPB has regulatory, supervisory, and enforcement powers over providers of consumer financial products that we offer, including explicit supervisory authority to examine and require registration of installment lenders such as ourselves. Included in the powers afforded to the CFPB is the authority to adopt rules describing specified acts and practices as being “unfair,” “deceptive,” or “abusive,” and hence unlawful. Specifically, the CFPB has the authority to declare an act or practice abusive if it, among other things, materially interferes with the ability of a consumer to understand a term or condition of a consumer financial product or service or takes unreasonable advantage of a lack of understanding on the part of the consumer of the product or service. Although the Dodd-Frank Act expressly provides that the CFPB has no authority to establish usury limits, some consumer advocacy groups have suggested that certain forms of alternative consumer finance products, such as installment loans, should be a regulatory priority, and it is possible that at some time in the future, the CFPB could propose and adopt rules making such lending or other products that we may offer materially less profitable or impractical. Further, the CFPB may target specific features of loans or loan practices, such as refinancings, by rulemaking that could cause us to cease offering certain products or engaging in certain practices. It is possible that the CFPB will adopt rules that specifically restrict refinancings of existing loans. Our refinancings of existing loans are divided into three categories: refinancings of loans in an amount greater than the original loan amount, renewals of existing loans at or below the original loan amount, and renewals of existing loans that are 60 or more days past due, which represented 31.5%, 26.8%, and 0.5%, respectively, of our loan originations in 2015. Any such rules could have a material adverse effect on our business, results of operation, and financial condition. The CFPB could also adopt rules imposing new and potentially burdensome requirements and limitations with respect to any of our current or future lines of business, which could have a material adverse effect on our operations and financial performance.
The Dodd-Frank Act also gives the CFPB the authority to examine and regulate entities it classifies as a “larger participant of a market for other consumer financial products or services.” The rule will likely cover only the largest installment lenders. We do not yet know whether the definition of larger participant in the installment lending market will cover us. In June 2015, the CFPB adopted a rule defining larger participants of the automobile financing market as nonbank lenders that have at least 10,000 aggregate annual originations. In addition, this rule defined the term “financial product or service” to include refinancings and certain automobile leases but to exclude title loans. While our automobile purchase loan originations at this time do not qualify us as a larger participant in the automobile financing market, the continued expansion of our automobile lending operations may in the future cause us to qualify as a larger participant in the automobile financing market.
In March 2015, the CFPB announced that it was considering proposing rules under its unfair, deceptive, and abusive acts and practices rulemaking authority relating to payday, vehicle title, and similar loans. The proposal would cover short-term loans with a contractual term of 45 days or less, as well as “longer-term loans” with a term of longer than 45 days with an “all in” annualized percentage rate of interest in excess of 36% in which the lender has either a non-purchase money security interest in the consumer’s vehicle or certain rights to collect repayment from the consumer’s bank account or paycheck. While we do not originate loans with a contractual term of 45 days or less, we do originate longer-term loans with an “all in” annual percentage rate of
37
Table of Contents
interest in excess of 36% and take a non-purchase money security interest in a vehicle. The proposals would require a lender, as a condition of making a covered longer-term loan, to first make a good-faith reasonable determination that the consumer has the ability to repay the covered longer-term loan without reborrowing or defaulting. The proposals would require lenders to verify income, “major financial obligations,” and borrowing history. Lenders would also be required to determine that a consumer is able to make all projected payments under the covered longer-term loan as those payments are due, while still fulfilling other major financial obligations and meeting living expenses. This ability to repay assessment would apply to both the initial longer-term loan and to any subsequent refinancing. In addition, the proposals would include a rebuttable presumption that customers seeking to refinance a covered longer-term loan lack an “ability to repay” if certain conditions exist at the time of the proposed refinancing. The proposals are subject to several procedural requirements and to possible change before any final rules would be issued and implemented, and we cannot predict what the ultimate rulemaking will provide. These proposals, if and when implemented in final rulemaking, may require changes to our practices and procedures regarding such loans that could materially and adversely affect our ability to make such loans, the cost of making such loans, our ability to, or frequency with which we are able to, refinance any such covered loans, or the profitability of such loans.
The CFPB is also conducting supervisory audits of large vehicle lenders and has indicated it intends to study and take action with respect to possible Equal Credit Opportunity Act “disparate impact” credit discrimination in indirect vehicle finance. If the CFPB enters into a consent decree with one or more lenders on disparate impact claims, it could negatively impact the business of the affected lenders, and potentially the business of dealers and other lenders in the vehicle finance market. This impact on dealers and lenders could increase our regulatory compliance requirements and associated costs.
In October 2015, the CFPB announced that it is considering proposing rules to regulate the use of arbitration agreements in consumer financial products or services. The proposal would apply to installment loans, credit cards, checking and deposit accounts, prepaid cards, money transfer services, auto title loans, small dollar or payday loans, and several other types of financial products or services. The proposal would require any arbitration agreement subject to the rule to provide explicitly that the arbitration agreement is inapplicable to cases filed in court on behalf of a class unless and until class certification is denied or the class claims are dismissed. The proposal also would require persons subject to the rulemaking, and who continue to use arbitration agreements, to submit information on initial claim filings and awards to the CFPB. Such claims or awards information could ultimately be published by the CFPB. These proposals may have a direct material impact on our operations by increasing our litigation costs and requiring us to incur expenses related to the modification of our contracts to comply with the rule. In addition, any publication of claims or awards involving us could result in reputational damage.
In addition to the Dodd-Frank Act’s grant of regulatory powers to the CFPB, the Dodd-Frank Act gives the CFPB authority to pursue administrative proceedings or litigation for violations of federal consumer financial laws. In these proceedings, the CFPB can obtain cease and desist orders (which can include orders for restitution or rescission of contracts, as well as other kinds of affirmative relief) and monetary penalties ranging from a maximum of $5,000 per day for minor violations of federal consumer financial laws (including the CFPB’s own rules) to $25,000 per day for reckless violations and $1 million per day for knowing violations. If we are subject to such administrative proceedings, litigation, orders, or monetary penalties in the future, this could have a material adverse effect on our operations and financial performance. Also, where a company has violated Title X of the Dodd-Frank Act or CFPB regulations under Title X, the Dodd-Frank Act empowers state attorneys general and state regulators to bring civil actions for the kind of cease and desist orders available to the CFPB (but not for civil penalties). If the CFPB or one or more state officials find that we have violated the foregoing laws, they could exercise their enforcement powers in ways that would have a material adverse effect on us.
In January 2012, the CFPB launched a federal supervision program for nonbanks that offer or provide consumer financial products or services. Under the CFPB’s nonbank supervision program, the CFPB conducts
38
Table of Contents
individual examinations and requires reports from businesses to determine what businesses require greater focus by the CFPB. The frequency and scope of any such examinations will depend on the CFPB’s analysis of risks posed to consumers based on factors such as a particular nonbank’s volume of business, types of products or services, and the extent of state oversight. In conducting an investigation, the CFPB may issue a civil investigative demand (a “CID”) requiring a target company to prepare and submit, among other items, documents, written reports, answers to interrogatories, and deposition testimony. If the CFPB issues a CID to us or otherwise commences an investigation of our company, the required response could result in substantial costs and a diversion of our management’s attention and resources. In addition, the market price of our common stock could decline as a result of the initiation of a CFPB investigation of our company or even the perception that such an investigation could occur, even in the absence of any finding by the CFPB that we have violated any state or federal law.
We sell certain of our loans, including, in some instances, charged-off loans and loans where the borrower is in default. This practice could subject us to heightened regulatory scrutiny, which may expose us to legal action, cause us to incur losses, and/or limit or impede our collection activity.
On December 23, 2015, we sold approximately $112 million of our existing charged-off loan portfolio and committed to the sale of the forward flow of accounts charged off between November 2015 and October 2016. As part of our business model, we may purchase and sell other finance receivables in the future, including loans that have been charged-off and loans where the borrower is in default. The CFPB and other regulators recently have significantly increased their scrutiny of debt sales, especially delinquent and charged-off debt. The CFPB has criticized sellers of debt for insufficient documentation to support and verify the validity or amount of the debt. It has also criticized debt collectors for, among other things, collection tactics, attempting to collect debts that are no longer valid, misrepresenting the amount of the debt, and not having sufficient documentation to verify the validity or amount of the debt. Accordingly, our sales of loans could expose us to lawsuits or fines by regulators if we do not have sufficient documentation to support and verify the validity and amount of the loans underlying the transactions, or if we or purchasers of our loans use collection methods that are viewed as unfair, deceptive, or abusive. In addition, our collections could suffer and we may incur additional expenses if we are required to change collection practices or stop collecting on certain debts as a result of a lawsuit or action on the part of regulators.
In addition, our $75.7 million amortizing asset-backed loan resembles a securitization of asset-backed securities transaction. The Dodd-Frank Act may adversely affect the securitization market because it requires, among other things, that a securitizer generally retain not less than 5% of the credit risk for certain types of securitized assets that are transferred, sold, or conveyed through issuance of asset-backed securities. These regulations and others may result in additional costs or limit our ability to securitize loans or engage in similar transactions in the future.
Our use of third-party vendors is subject to increasing regulatory attention.
Recently, the CFPB and other regulators have issued regulatory guidance that has focused on the need for financial institutions to perform increased due diligence and ongoing monitoring of third-party vendor relationships, thus increasing the scope of management involvement and decreasing the benefit that we receive from using third-party vendors. Moreover, if regulators conclude that we have not met the heightened standards for oversight of our third-party vendors, we could be subject to enforcement actions, civil monetary penalties, supervisory orders to cease and desist, or other remedial actions, which could have an adverse effect on our business, financial condition, and operating results
We are subject to government regulations concerning our hourly and our other employees, including minimum wage, overtime, and health care laws.
We are subject to applicable rules and regulations relating to our relationship with our employees, including minimum wage and break requirements, health benefits, unemployment and sales taxes, overtime, and
39
Table of Contents
working conditions and immigration status. Legislated increases in the federal minimum wage and increases in additional labor cost components, such as employee benefit costs, workers’ compensation insurance rates, compliance costs and fines, as well as the cost of litigation in connection with these regulations, would increase our labor costs. Unionizing and collective bargaining efforts have received increased attention nationwide in recent periods. Should our employees become represented by unions, we would be obligated to bargain with those unions with respect to wages, hours, and other terms and conditions of employment, which is likely to increase our labor costs. Moreover, as part of the process of union organizing and collective bargaining, strikes and other work stoppages may occur, which would cause disruption to our business. Similarly, many employers nationally in similar retail environments have been subject to actions brought by governmental agencies and private individuals under wage-hour laws on a variety of claims, such as improper classification of workers as exempt from overtime pay requirements and failure to pay overtime wages properly, with such actions sometimes brought as class actions. These actions can result in material liabilities and expenses. Should we be subject to employment litigation, such as actions involving wage-hour, overtime, break, and working time, it may distract our management from business matters and result in increased labor costs. In addition, we currently sponsor employer-subsidized premiums for major medical programs for eligible personnel who elect health care coverage through our insurance programs. As a result of regulatory changes, we may not be able to continue to offer health care coverage to our employees on affordable terms or at all and subsequently may face increased difficulty in hiring and retaining employees. If we are unable to locate, attract, train, or retain qualified personnel, or if our costs of labor increase significantly, our business, results of operations, and financial condition may be adversely affected.
Rising health care costs and continuing uncertainties concerning the effect of implementation of the Patient Protection and Affordable Care Act and the Health Care and Education Affordability Reconciliation Act of 2010 and similar laws may have a material adverse effect on our business and financial performance.
Despite our efforts to control costs while still providing competitive health care benefits to our employees, significant increases in health care costs continue to occur, and we can provide no assurance that our cost containment efforts in this area will be effective. In March 2010, the federal Patient Protection and Affordable Care Act (“PPACA”) and the Health Care and Education Affordability Reconciliation Act of 2010 became law. While we have performed an analysis regarding the anticipated impact of these laws on our cost structure, we may be unable to accurately predict the impact of this federal health care legislation on our health care benefit costs due to continued uncertainty with respect to implementation of such legislation. Significant increases in costs due either to the PPACA or general health care cost increases are likely and could adversely impact our operating results, as there is no assurance that we will be able to absorb, pass through, and/or offset the costs of such legislation.
Our stock price or results of operations could be adversely affected by media and public perception of installment and automobile loans and of legislative and regulatory developments affecting activities within the installment and automobile lending sector.
Consumer advocacy groups and various media sources continue to criticize alternative financial services providers (such as payday and title lenders, check advance companies, and pawnshops). These critics frequently characterize such alternative financial services providers as predatory or abusive toward consumers. If these persons were to criticize the products that we offer, it could result in further regulation of our business and could negatively impact our relationships with existing borrowers and efforts to attract new borrowers. Furthermore, our industry is highly regulated, and announcements regarding new or expected governmental and regulatory action in the alternative financial services sector may adversely impact our stock price and perceptions of our business even if such actions are not targeted at our operations and do not directly impact us.
Legal proceedings to which we are subject or may become subject may have a material adverse impact on our financial position and results of operations.
Like many companies in our industry, we are from time to time involved in various legal proceedings and subject to claims and other actions related to our business activities brought by borrowers and others, including,
40
Table of Contents
for example, the securities class action lawsuit described in Item 3, “Legal Proceedings” of this Annual Report on Form 10-K. All such legal proceedings are inherently unpredictable and, regardless of the merits of the claims, litigation is often expensive, time-consuming, disruptive to our operations and resources, and distracting to management. If resolved against us, such legal proceedings could result in excessive verdicts and judgments, injunctive relief, equitable relief, and other adverse consequences that may affect our financial condition and how we operate our business. Similarly, if we settle such legal proceedings, it may affect our financial condition and how we operate our business. Future court decisions, alternative dispute resolution awards, business expansion, or legislative activity may increase our exposure to litigation and regulatory investigations. In some cases, substantial non-economic remedies or punitive damages may be sought. Although we maintain liability insurance coverage, there can be no assurance that such coverage will cover any particular verdict, judgment, or settlement that may be entered against us, that such coverage will prove to be adequate, or that such coverage will continue to remain available on acceptable terms, if at all. For example, we and our primary insurance carrier may in the future be required to negotiate an allocation between denied and acknowledged claims in the securities class action lawsuit. If in the securities class action lawsuit or any other legal proceeding we incur liability that exceeds our insurance coverage or that is not within the scope of the coverage in legal proceedings brought against us, it could have a material adverse effect on our business, financial condition, and results of operations.
Current and proposed regulation related to consumer privacy, data protection, and information security could increase our costs.
We are subject to a number of federal and state consumer privacy, data protection, and information security laws and regulations. Moreover, various federal and state regulatory agencies require us to notify customers in the event of a security breach. Federal and state legislators and regulators are increasingly pursuing new guidance, laws, and regulations. Compliance with current or future customer privacy, data protection, and information security laws and regulations could result in higher compliance, technology, or other operating costs. Any violations of these laws and regulations may require us to change our business practices or operational structure, and could subject us to legal claims, monetary penalties, sanctions, and the obligation to indemnify and/or notify customers or take other remedial actions.
Risks Related to the Ownership of Our Common Stock
If securities or industry analysts do not publish research or reports about our business, or if they downgrade their recommendations regarding our common stock, our stock price and trading volume could decline.
The trading market for our common stock is influenced by the research and reports that industry or securities analysts publish about us or our business. If any of the analysts who cover us downgrades our common stock or publishes inaccurate or unfavorable research about our business, our common stock price may decline. If analysts cease coverage of us or fail to regularly publish reports on us, we could lose visibility in the financial markets, which in turn could cause our common stock price or trading volume to decline and our common stock to be less liquid.
The market price of shares of our common stock may continue to be volatile, which could cause the value of your investment to decline.
The market price of our common stock has been highly volatile and could be subject to wide fluctuations. Securities markets worldwide experience significant price and volume fluctuations. This market volatility, as well as general economic, market, or political conditions, could reduce the market price of shares of our common stock in spite of our operating performance. In addition, our operating results could be below the expectations of public market analysts and investors due to a number of potential factors, including variations in our quarterly operating results, additions or departures of key management personnel, failure to meet analysts’ earnings estimates, publication of research reports about our industry, litigation and government investigations, changes or
41
Table of Contents
proposed changes in laws or regulations or differing interpretations or enforcement thereof affecting our business, adverse market reaction to any indebtedness we may incur or securities we may issue in the future, changes in market valuations of similar companies or speculation in the press or investment community, announcements by our competitors of significant contracts, acquisitions, dispositions, strategic partnerships, joint ventures, or capital commitments, adverse publicity about the industries we participate in, or individual scandals, and in response the market price of shares of our common stock could decrease significantly.
In the past several years, stock markets have experienced extreme price and volume fluctuations. In the past, following periods of volatility in the overall market and the market price of a company’s securities, Securities and Exchange Commission investigations and securities class action litigation have sometimes been instituted against these companies. We currently are subject to a securities class action lawsuit described in Item 3, “Legal Proceedings” of this Annual Report on Form 10-K. The securities class action lawsuit and any further legal proceedings of this nature that may be instituted against us could result in substantial costs and a diversion of our management’s attention and resources.
We have no current plans to pay cash dividends on our common stock for the foreseeable future.
We do not expect to pay cash dividends for the foreseeable future. Instead, we intend to retain future earnings, if any, for future operation, expansion, for our share repurchase program, and debt repayment. The declaration, amount, and payment of any future cash dividends on shares of common stock will be at the sole discretion of our Board of Directors. Our Board of Directors may take into account general and economic conditions, our financial condition and results of operations, our available cash and current and anticipated cash needs, capital requirements, contractual, legal, tax, and regulatory restrictions and implications on the payment of cash dividends by us to our stockholders or by our subsidiaries to us, and such other factors as our Board of Directors may deem relevant. In addition, our ability to pay cash dividends may be limited by covenants of any existing and future outstanding indebtedness we or our subsidiaries incur, including our senior revolving credit facility. As a result, investors may need to rely on sales of their common stock after price appreciation, which may not occur, as the only way to realize future gains on their investment.
Your stock ownership may be diluted by the future issuance of additional common stock in connection with our incentive plans, acquisitions, or otherwise.
We have approximately 987 million shares of common stock authorized but unissued. Our amended and restated certificate of incorporation authorizes us to issue these shares of common stock and options, rights, warrants, and appreciation rights relating to common stock for the consideration and on the terms and conditions established by our Board of Directors in its sole discretion, whether in connection with acquisitions or otherwise. On April 22, 2015, our stockholders approved the Regional Management Corp. 2015 Long-Term Incentive Plan (the “2015 Plan”). Subject to adjustments as provided in the 2015 Plan, the maximum aggregate number of shares of our common stock that may be issued under the 2015 Plan may not exceed the sum of (a) 350,000 shares plus (b) any shares (i) remaining available for the grant of awards as of the effective date under the 2007 Management Incentive Plan (the “2007 Plan”) or the 2011 Stock Incentive Plan (the “2011 Plan”), and/or (ii) subject to an award granted under the 2007 Plan or the 2011 Plan, which award is forfeited, cancelled, terminated, expires or lapses. We have 566,683 shares available for issuance under the 2015 Plan, as of February 18, 2016. In addition, our Board may recommend in the future that our stockholders approve new stock plans. Any common stock that we issue, including under our 2015 Plan or other equity incentive plans that we may adopt in the future, would dilute the percentage ownership held by our stockholders. In addition, the market price of our common stock could decline as a result of sales of a large number of shares of common stock in the market or the perception that such sales could occur. These sales, or the possibility that these sales may occur, also might make it more difficult for us to issue equity securities in the future at a time and at a price that we deem appropriate.
42
Table of Contents
We are an “emerging growth company,” and we cannot be certain if the reduced reporting requirements applicable to emerging growth companies will make our common stock less attractive to investors.
We are an “emerging growth company,” as defined in the Jumpstart Our Business Startups Act of 2012 (the “JOBS Act”). For as long as we continue to be an emerging growth company, we may take advantage of exemptions from various reporting requirements that are applicable to other public companies that are not emerging growth companies, including, but not limited to, not being required to comply with the auditor attestation requirements of Section 404 of the Sarbanes-Oxley Act, reduced disclosure obligations regarding executive compensation in our periodic reports and proxy statements, and exemptions from the requirements of holding a nonbinding advisory vote on executive compensation and stockholder approval of any golden parachute payments not previously approved. As a result of these exemptions, our stockholders may not have access to certain information that they may deem important.
We could be an emerging growth company for up to five years, although circumstances could cause us to lose that status earlier, including if the market value of our common stock held by non-affiliates exceeds $700 million as of any June 30th before that time, in which case we would no longer be an emerging growth company as of the following December 31st. We cannot predict if investors will find our common stock less attractive because we may rely on these exemptions. If some investors find our common stock less attractive as a result, there may be a less active trading market for our common stock and our stock price may be more volatile.
The requirements of being a public company may strain our resources and distract our management.
As a public company, we are subject to the reporting requirements of the Securities and Exchange Act of 1934, as amended (the “Exchange Act”), and requirements of the Sarbanes-Oxley Act . These requirements may place a strain on our systems and resources. The Exchange Act requires that we file annual, quarterly, and current reports with respect to our business and financial condition. The Sarbanes-Oxley Act requires that we maintain effective disclosure controls and procedures and internal controls over financial reporting. To maintain and improve the effectiveness of our disclosure controls and procedures and internal controls over financial reporting, we will need to commit significant resources, hire additional staff, and provide additional management oversight. We will be implementing additional procedures and processes for the purpose of addressing the standards and requirements applicable to public companies. In addition, sustaining our growth also will require us to commit additional management, operational, and financial resources to identify new professionals to join our firm and to maintain appropriate operational and financial systems to adequately support expansion. These activities may divert management’s attention from other business concerns, which could have a material adverse effect on our business, financial condition, results of operations, and cash flows. We expect to incur significant annual expenses related to these steps and, among other things, additional directors and officers liability insurance, director fees, reporting requirements, transfer agent fees, hiring additional accounting, legal, and administrative personnel, increased auditing and legal fees, and similar expenses.
Anti-takeover provisions in our charter documents and applicable state law might discourage or delay acquisition attempts for us that you might consider favorable.
Our amended and restated certificate of incorporation and amended and restated bylaws contain provisions that may make the acquisition of our company more difficult without the approval of our Board of Directors. Among other things, these provisions:
| • | authorize the issuance of undesignated preferred stock, the terms of which may be established and the shares of which may be issued without stockholder approval, and which may include super voting, special approval, dividend, or other rights or preferences superior to the rights of the holders of common stock; |
| • | prohibit stockholder action by written consent, which will require all stockholder actions to be taken at a meeting of our stockholders; |
43
Table of Contents
| • | provide that the Board of Directors is expressly authorized to make, alter, or repeal our bylaws and that our stockholders may only amend our bylaws with the approval of 80% or more of all of the outstanding shares of our capital stock entitled to vote; and |
| • | establish advance notice requirements for nominations for elections to our Board of Directors or for proposing matters that can be acted upon by stockholders at stockholder meetings. |
In addition, a Texas regulation requires, under certain circumstances, the approval of the Texas Consumer Credit Commissioner for the acquisition, directly or indirectly, of 10% or more of the voting or common stock of a consumer finance company. The overall effect of this law, and similar laws in other states, is to make it more difficult to acquire a consumer finance company than it might be to acquire control of a nonregulated corporation.
Furthermore, as a Delaware corporation, we are also subject to provisions of Delaware law, which may impair a takeover attempt that our stockholders may find beneficial. These anti-takeover provisions and other provisions under Delaware law could discourage, delay, or prevent a transaction involving a change in control of our company, including actions that our stockholders may deem advantageous, or negatively affect the trading price of our common stock. These provisions could also discourage proxy contests and make it more difficult for you and other stockholders to elect directors of your choosing and to cause us to take other corporate actions you desire.
Our amended and restated certificate of incorporation contains a provision renouncing our interest and expectancy in certain corporate opportunities identified by our affiliates.
Certain of our stockholders, directors, and their affiliates are in the business of providing buyout capital and growth capital to developing companies and may acquire interests in businesses that directly or indirectly compete with certain portions of our business. Our amended and restated certificate of incorporation provides for the allocation of certain corporate opportunities between us, on the one hand, and certain of our stockholders, on the other hand. As set forth in our amended and restated certificate of incorporation, neither such stockholders, nor any director, officer, stockholder, member, manager, or employee of such stockholders, will have any duty to refrain from engaging, directly or indirectly, in the same business activities or similar business activities or lines of business in which we operate. Therefore, a director or officer of our company who also serves as a director, officer, member, manager, or employee of such stockholders may pursue certain acquisition opportunities that may be complementary to our business and, as a result, such acquisition opportunities may not be available to us. These potential conflicts of interest could have a material adverse effect on our business, financial condition, results of operations, or prospects if attractive corporate opportunities are allocated by such stockholders to themselves or their other affiliates instead of to us.
| ITEM 1B. | UNRESOLVED STAFF COMMENTS. |
None.
| ITEM 2. | PROPERTIES. |
Our home office buildings are located in Greenville, South Carolina. Of the approximately 26,500 total square feet comprising our home office buildings, we own approximately 8,100 square feet and we lease approximately 18,400 square feet. Each of our 338 branches, as of February 1, 2016, is leased under fixed term lease agreements. As of February 1, 2016, our branches are located throughout South Carolina, Texas, North Carolina, Tennessee, Alabama, Oklahoma, New Mexico, Georgia, and Virginia, and the average branch size is approximately 1,500 square feet.
In the opinion of management, our properties have been well-maintained, are in sound operating condition, and contain all equipment and facilities necessary to operate at present levels. We believe all of our facilities are
44
Table of Contents
suitable and adequate for our present purposes. Our only reportable segment, which is our consumer finance segment, uses the properties described in this Item 2, “Properties.” In order to accommodate the Company’s growth, management is evaluating the relocation of the Company’s home office operations to a larger facility in Greenville County, South Carolina in 2016.
| ITEM 3. | LEGAL PROCEEDINGS. |
On May 30, 2014, a securities class action lawsuit was filed in the United States District Court for the Southern District of New York against the Company and certain of its current and former directors, executive officers, and shareholders (collectively, the “Defendants”). The complaint alleged violations of the Securities Act of 1933 (“1933 Act Claims”) and sought unspecified compensatory damages and other relief on behalf of a purported class of purchasers of the Company’s common stock in the September 2013 and December 2013 secondary public offerings. On August 25, 2014, Waterford Township Police & Fire Retirement System and City of Roseville Employees’ Retirement System were appointed as lead plaintiffs (collectively, the “Plaintiffs”). An amended complaint was filed on November 24, 2014. In addition to the 1933 Act Claims, the amended complaint also added claims for violations of the Securities Exchange Act of 1934 (“1934 Act Claims”) seeking unspecified compensatory damages on behalf of a purported class of purchasers of the Company’s common stock between May 2, 2013 and October 30, 2014, inclusive. On January 26, 2015, the Defendants filed motions to dismiss the amended complaint in its entirety. In response, the Plaintiffs sought and were granted leave to file an amended complaint. On February 27, 2015, the Plaintiffs filed a second amended complaint. Like the prior amended complaint, the second amended complaint asserts 1933 Act Claims and 1934 Act Claims and seeks unspecified compensatory damages. The Defendants’ motions to dismiss the second amended complaint were filed on April 28, 2015, the Plaintiffs’ opposition was filed on June 12, 2015, and the Defendants’ reply was filed on July 13, 2015. The motions remain under consideration by the Court. The Company believes that the claims against it are without merit and intends to defend against the litigation vigorously.
The Company’s primary insurance carrier during the applicable time period has (i) denied coverage for the 1933 Act Claims and (ii) acknowledged coverage of the Company and other insureds for the 1934 Act Claims under a reservation of rights and subject to the terms and conditions of the applicable insurance policy. The parties plan to negotiate an allocation between denied and acknowledged claims.
We are also involved in various legal proceedings and related actions that have arisen in the ordinary course of our business that have not been fully adjudicated. Our management does not believe that these matters, when ultimately concluded and determined, will have a material adverse effect on our financial condition, liquidity, or results of operations.
| ITEM 4. | MINE SAFETY DISCLOSURES. |
Not applicable.
45
Table of Contents
PART II
| ITEM 5. | MARKET FOR REGISTRANT’S COMMON EQUITY, RELATED STOCKHOLDER MATTERS AND ISSUER PURCHASES OF EQUITY SECURITIES. |
Market Information
Our common stock has been listed on the New York Stock Exchange (the “NYSE”) under the symbol “RM” since March 28, 2012. Prior to that time, there was no public market for our common stock. The following table sets forth for the periods indicated the high and low intra-day sale prices of our common stock on the NYSE. The last reported sale price of our common stock on the NYSE on February 18, 2016, was $13.76 per share.
| High | Low | |||||||
| Fiscal Year Ended December 31, 2015 |
||||||||
| First Quarter |
$ | 16.56 | $ | 13.79 | ||||
| Second Quarter |
19.24 | 13.45 | ||||||
| Third Quarter |
20.27 | 14.25 | ||||||
| Fourth Quarter |
17.62 | 13.90 | ||||||
| Fiscal Year Ended December 31, 2014 |
||||||||
| First Quarter |
$ | 36.23 | $ | 23.77 | ||||
| Second Quarter |
25.07 | 13.93 | ||||||
| Third Quarter |
19.60 | 14.75 | ||||||
| Fourth Quarter |
18.37 | 11.16 | ||||||
Holders
As of February 12, 2016, there were 11 registered holders of our common stock. As of February 12, 2016, there were approximately 1,578 beneficial holders of our common stock.
Non-Affiliate Ownership
For purposes of calculating the aggregate market value of shares of our common stock held by non-affiliates as set forth on the cover page of this Annual Report on Form 10-K, we have assumed that all outstanding shares are held by non-affiliates, except for shares held by each of our executive officers, directors, and 5% or greater stockholders as of June 30, 2015. In the case of 5% or greater stockholders, we have not deemed such stockholders to be affiliates unless there are facts and circumstances which would indicate that such stockholders exercise any control over our company or unless they hold 10% or more of our outstanding common stock. These assumptions should not be deemed to constitute an admission that all executive officers, directors, and 5% or greater stockholders are, in fact, affiliates of our company, or that there are no other persons who may be deemed to be affiliates of our company. Further information concerning shareholdings of our officers, directors, and principal stockholders is included or incorporated by reference in Part III, Item 12 of this Annual Report on Form 10-K.
Dividend Policy
We did not pay any cash dividends in fiscal 2015 or fiscal 2014. We have no current plans to pay any cash dividends on our common stock for the foreseeable future and instead currently intend to retain earnings, if any, for future operations, expansion, our share repurchase program, and debt repayment.
The declaration, amount, and payment of any future cash dividends on shares of common stock will be at the sole discretion of our Board of Directors. Our Board of Directors may take into account general and economic conditions, our financial condition and results of operations, our available cash and current and anticipated cash needs, capital requirements, contractual, legal, tax, and regulatory restrictions and implications on the payment of cash dividends by us to our stockholders or by our subsidiaries to us, and such other factors as
46
Table of Contents
our Board of Directors may deem relevant. In addition, our amended and restated senior revolving credit facility includes a provision restricting our ability to pay dividends on our common stock based upon, among other things, our net income and hypothetical availability under the credit facility. Likewise, our $75.7 million amortizing asset-backed loan restricts our wholly-owned subsidiary, Regional Management Receivables, LLC, from paying dividends to us, subject to certain exceptions.
Equity Compensation Plan Information
The following table gives information about the common stock that may be issued upon the exercise of options, warrants, and rights under all of our existing equity compensation plans as of December 31, 2015.
| Plan Category |
(a) Number of Securities to Be Issued Upon Exercise of Outstanding Options, Warrants, and Rights |
(b) Weighted-Average Exercise Price of Outstanding Options, Warrants, and Rights ($) |
(c) Number of Securities Remaining Available for Future Issuance Under Equity Compensation Plans (Excluding Securities Reflected in Column (a)) |
|||||||||
| Equity Compensation Plans Approved by Security Holders |
||||||||||||
| 2007 Management Incentive Plan(1) |
287,527 | 5.46 | — | |||||||||
| 2011 Stock Incentive Plan(2) |
590,416 | (4) | 16.75 | (5) | — | |||||||
| 2015 Long-Term Incentive Plan(3) |
351,338 | (6) | 15.33 | (5) | 560,860 | |||||||
| Equity Compensation Plans Not Approved by Security Holders |
— | — | — | |||||||||
| Total: |
1,229,281 | 13.36 | 560,860 | |||||||||
| (1) | Regional Management Corp. 2007 Management Incentive Plan, as amended (the “2007 Plan”). On April 22, 2015, the Company’s stockholders approved the Regional Management Corp. 2015 Long-Term Incentive Plan (the “2015 Plan”), at which time all shares then available for issuance under the 2007 Plan rolled over to the 2015 Plan. Awards may no longer be granted under the 2007 Plan. However, awards that are outstanding under the 2007 Plan will continue in accordance with their respective terms. |
| (2) | Regional Management Corp. 2011 Stock Incentive Plan, as amended (the “2011 Plan”). On April 22, 2015, the Company’s stockholders approved the 2015 Plan, at which time all shares then available for issuance under the 2011 Plan rolled over to the 2015 Plan. Awards may no longer be granted under the 2011 Plan. However, awards that are outstanding under the 2011 Plan will continue in accordance with their respective terms. |
| (3) | Regional Management Corp. 2015 Long-Term Incentive Plan. As of February 18, 2016, 566,683 shares remain available for issuance under the 2015 Plan, which allows for grants of incentive stock options, non-qualified stock options, stock appreciation rights, unrestricted shares, restricted shares, restricted stock units, phantom stock awards, and awards that are valued in whole or in part by reference to, or otherwise based on the fair market value of shares, including performance-based awards. |
| (4) | Includes 42,547 restricted stock units outstanding under the 2011 Plan. There is no exercise price associated with these restricted stock units. |
| (5) | Calculation excludes shares subject to restricted stock unit awards. |
| (6) | Includes 142,997 restricted stock units outstanding under the 2015 Plan. There is no exercise price associated with these restricted stock units. |
47
Table of Contents
Stock Performance Graph
This performance graph shall not be deemed “soliciting material” or to be “filed” with the SEC for purposes of Section 18 of the Securities Exchange Act of 1934, as amended (the “Exchange Act”), or otherwise subject to the liabilities under that Section, and shall not be deemed to be incorporated by reference into any filing of the Company under the Securities Act of 1933, as amended (the “Securities Act”).
The following graph shows a comparison from March 28, 2012 (the date our common stock commenced trading on the NYSE) through December 31, 2015, of the cumulative total return for our common stock, the NYSE Composite Index, and the NYSE Financial Sector Index. The graph assumes that $100 was invested at the market close on March 28, 2012, in the common stock of the Company, the NYSE Composite Index, and the NYSE Financial Sector Index, and data for the NYSE Composite Index and the NYSE Financial Sector Index assumes reinvestments of dividends. The stock price performance of the following graph is not necessarily indicative of future stock price performance.
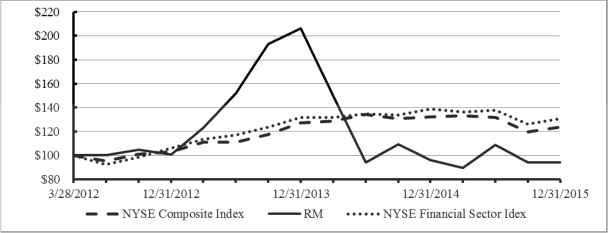
48
Table of Contents
| ITEM 6. | SELECTED FINANCIAL DATA. |
The selected consolidated historical financial data set forth below for the years ended December 31, 2011, 2012, 2013, 2014, and 2015 are derived from audited consolidated financial statements. We derived the selected historical consolidated statement of income data for each of the years ended December 31, 2013, 2014, and 2015 and the selected historical consolidated balance sheet data as of December 31, 2014 and 2015 from our audited consolidated financial statements, which appear in Item 8, “Financial Statements and Supplementary Data” of this Annual Report on Form 10-K. We have derived the selected historical consolidated statement of income data for the years ended December 31, 2011 and 2012 and the selected historical consolidated balance sheet data as of December 31, 2011, 2012, and 2013 from our audited financial statements, which do not appear elsewhere in this Annual Report on Form 10-K.
The following selected consolidated financial data should be read in conjunction with our consolidated financial statements, the related notes, and Item 7, “Management’s Discussion and Analysis of Financial Condition and Results of Operations” included elsewhere in this Annual Report on Form 10-K. The historical results are not necessarily indicative of the results to be expected for any future period.
| Year Ended December 31, | ||||||||||||||||||||
| In thousands, except per share data | 2015 | 2014 | 2013 | 2012 | 2011 | |||||||||||||||
| Consolidated Statements of Income Data: |
||||||||||||||||||||
| Revenue |
||||||||||||||||||||
| Interest and fee income |
$ | 195,794 | $ | 184,797 | $ | 152,343 | $ | 119,035 | $ | 91,513 | ||||||||||
| Insurance income, net, and other income |
21,512 | 19,922 | 18,286 | 16,662 | 13,824 | |||||||||||||||
|
|
|
|
|
|
|
|
|
|
|
|||||||||||
| Total revenue |
217,306 | 204,719 | 170,629 | 135,697 | 105,337 | |||||||||||||||
| Expenses |
||||||||||||||||||||
| Provision for credit losses |
47,348 | 69,057 | 39,192 | 27,765 | 17,854 | |||||||||||||||
| General and administrative expenses |
115,598 | 96,776 | 71,039 | 55,558 | 40,835 | |||||||||||||||
| Consulting and advisory fees(1) |
— | — | — | 1,451 | 975 | |||||||||||||||
| Interest expense |
||||||||||||||||||||
| Senior and other debt |
16,221 | 14,947 | 14,144 | 10,580 | 8,306 | |||||||||||||||
| Mezzanine debt(1) |
— | — | — | 1,030 | 4,037 | |||||||||||||||
|
|
|
|
|
|
|
|
|
|
|
|||||||||||
| Total interest expense |
16,221 | 14,947 | 14,144 | 11,610 | 12,343 | |||||||||||||||
|
|
|
|
|
|
|
|
|
|
|
|||||||||||
| Total expenses |
179,167 | 180,780 | 124,375 | 96,384 | 72,007 | |||||||||||||||
|
|
|
|
|
|
|
|
|
|
|
|||||||||||
| Income before income taxes |
38,139 | 23,939 | 46,254 | 39,313 | 33,330 | |||||||||||||||
| Income taxes |
14,774 | 9,137 | 17,460 | 14,561 | 12,290 | |||||||||||||||
|
|
|
|
|
|
|
|
|
|
|
|||||||||||
| Net income |
$ | 23,365 | $ | 14,802 | $ | 28,794 | $ | 24,752 | $ | 21,040 | ||||||||||
|
|
|
|
|
|
|
|
|
|
|
|||||||||||
| Earnings per Share Data: |
||||||||||||||||||||
| Basic earnings per share |
$ | 1.82 | $ | 1.17 | $ | 2.29 | $ | 2.12 | $ | 2.25 | ||||||||||
| Diluted earnings per share |
$ | 1.79 | $ | 1.14 | $ | 2.23 | $ | 2.07 | $ | 2.19 | ||||||||||
| Weighted-average shares used in computing basic earnings per share |
12,849 | 12,701 | 12,572 | 11,695 | 9,337 | |||||||||||||||
| Weighted-average shares used in computing diluted earnings per share |
13,074 | 12,951 | 12,894 | 11,981 | 9,621 | |||||||||||||||
| Consolidated Balance Sheet Data (at period end): |
||||||||||||||||||||
| Finance receivables(2) |
$ | 628,444 | $ | 546,192 | $ | 544,684 | $ | 439,474 | $ | 307,373 | ||||||||||
| Allowance for credit losses |
(37,452 | ) | (40,511 | ) | (30,089 | ) | (23,616 | ) | (19,300 | ) | ||||||||||
|
|
|
|
|
|
|
|
|
|
|
|||||||||||
| Net finance receivables(3) |
$ | 590,992 | $ | 505,681 | $ | 514,595 | $ | 415,858 | $ | 288,073 | ||||||||||
| Total assets |
629,065 | 530,270 | 533,888 | 434,517 | 303,988 | |||||||||||||||
| Long-term debt |
411,177 | 341,419 | 362,750 | 292,380 | 231,823 | |||||||||||||||
| Total liabilities |
423,838 | 351,947 | 372,715 | 305,313 | 239,859 | |||||||||||||||
| Temporary equity(4) |
— | — | — | — | 12,000 | |||||||||||||||
| Total stockholders’ equity |
$ | 205,227 | 178,323 | 161,173 | 129,204 | 52,129 | ||||||||||||||
49
Table of Contents
| (1) | On March 21, 2007, Palladium Equity Partners III, L.P. and Parallel 2005 Equity Fund, LP (which we sometimes refer to herein as our “sponsors”) acquired the majority of our outstanding common stock. In connection with the acquisition transaction, we issued $25.0 million of mezzanine debt at an interest rate of 18.375%, plus related fees, which we refinanced in 2007 and again in 2010 with Palladium Equity Partners III, L.P. and certain of our individual owners. Additionally, we paid the sponsors annual advisory fees of $675,000 in the aggregate and paid certain individual owners annual consulting fees of $450,000 in the aggregate, in each case, plus certain expenses. Following the closing of our initial public offering on April 2, 2012, we repaid the mezzanine debt in full with proceeds from the initial public offering and we terminated the consulting and advisory agreements following the payment of certain termination fees. |
| (2) | Finance receivables equal the total amount due from the customer, net of unearned finance charges and insurance commissions. |
| (3) | Net finance receivables equal the total amount due from the customer, net of unearned finance charges, insurance commissions, and allowance for credit losses. |
| (4) | That certain Shareholders Agreement, among us and certain of our stockholders, dated March 21, 2007, as amended and restated on March 12, 2012, provided that the individual owners had the right to put their stock back to us if an initial public offering did not occur by May 21, 2012. We valued the put option at the original purchase price of $12.0 million. The put option terminated upon the consummation of our initial public offering. |
50
Table of Contents
| ITEM 7. | MANAGEMENT’S DISCUSSION AND ANALYSIS OF FINANCIAL CONDITION AND RESULTS OF OPERATIONS. |
The following discussion and analysis should be read in conjunction with, and is qualified in its entirety by reference to our audited consolidated financial statements and the related notes that appear elsewhere in this Annual Report on Form 10-K. These discussions contain forward-looking statements reflecting our current expectations that involve risks and uncertainties. These forward-looking statements include, but are not limited to, statements concerning our strategy, future operations, future financial position, future revenues, projected costs, expectations regarding demand and acceptance for our financial products, growth opportunities and trends in the market in which we operate, prospects, and plans and objectives of management. The words “anticipates,” “believes,” “estimates,” “expects,” “intends,” “may,” “plans,” “projects,” “will,” “would,” and similar expressions are intended to identify forward-looking statements, although not all forward-looking statements contain these identifying words. We may not actually achieve the plans, intentions, or expectations disclosed in our forward-looking statements, and you should not place undue reliance on our forward-looking statements. Actual results or events could differ materially from the plans, intentions, and expectations disclosed in the forward-looking statements that we make. These forward-looking statements involve risks and uncertainties that could cause our actual results to differ materially from those in the forward-looking statements, including without limitation, the risks set forth elsewhere in this Annual Report on Form 10-K. The forward-looking information we have provided in this Annual Report on Form 10-K pursuant to the safe harbor established under the Private Securities Litigation Reform Act of 1995 should be evaluated in the context of these factors. Forward-looking statements speak only as of the date they were made, and we undertake no obligation to update or revise such statements, except as required by the federal securities laws.
Overview
We are a diversified specialty consumer finance company providing a broad array of loan products primarily to customers with limited access to consumer credit from banks, thrifts, credit card companies, and other traditional lenders. We began operations in 1987 with four branches in South Carolina and have expanded our branch network to 331 locations in the states of Alabama, Georgia, New Mexico, North Carolina, Oklahoma, South Carolina, Tennessee, Texas, and Virginia as of December 31, 2015. Most of our loan products are secured, and each is structured on a fixed rate, fixed term basis with fully amortizing equal monthly installment payments, repayable at any time without penalty. Our loans are sourced through our multiple channel platform that includes our branches, direct mail campaigns, automobile dealerships, retailers, and our consumer website. We operate an integrated branch model in which nearly all loans, regardless of origination channel, are serviced through our branch network, providing us with frequent in-person contact with our customers, which we believe improves our credit performance and customer loyalty. Our goal is to consistently and soundly grow our finance receivables and manage our portfolio risk while providing our customers with attractive and easy-to-understand loan products that serve their varied financial needs.
Our diversified product offerings include:
| • | Small Loans – Our small loan portfolio is comprised of branch small loan and convenience check receivables. As of December 31, 2015, we had approximately 274.7 thousand small loans outstanding, representing $338.2 million in finance receivables. This includes 117.0 thousand branch small installment loans and 157.7 thousand convenience check loans, representing $157.8 million and $180.4 million in finance receivables, respectively. |
| • | Large Loans – As of December 31, 2015, we had approximately 37.7 thousand large installment loans outstanding, representing $146.6 million in finance receivables. |
| • | Automobile Loans – As of December 31, 2015, we had approximately 13.7 thousand automobile purchase loans outstanding, representing $116.1 million in finance receivables. This includes 7.0 thousand indirect automobile loans and 6.7 thousand direct automobile loans, representing $63.4 million and $52.8 million in finance receivables, respectively. |
51
Table of Contents
| • | Retail Loans – As of December 31, 2015, we had approximately 23.2 thousand retail purchase loans outstanding, representing $27.6 million in finance receivables. |
| • | Insurance Products – We offer optional payment protection insurance to our direct loan customers. |
Branch small loans, convenience checks, and large loans are our core products and will be the drivers of our future growth. Our primary sources of revenue are interest and fee income from our loan products, of which interest and fees relating to branch small loans, convenience checks, and automobile loans have historically been the largest component. In addition to interest and fee income from loans, we derive revenue from optional insurance products purchased by customers of our direct loan products.
Factors Affecting Our Results of Operations
Our business is driven by several factors affecting our revenues, costs, and results of operations, including the following:
Quarterly Information and Seasonality. Our loan volume and the contractual delinquency of our finance receivable portfolio follow seasonal trends. Demand for our loans is typically highest during the third and fourth quarters, which we believe is largely due to customers borrowing money for back-to-school and holiday spending. With the exception of automobile loans, loan demand has generally been the lowest during the first quarter, which we believe is largely due to the timing of income tax refunds. During the remainder of the year, we typically experience loan growth from general operations. In addition, we typically generate higher loan volumes in the second half of the year from direct mail campaigns, which are timed to coincide with seasonal consumer demand. Also, delinquencies have generally been lower in the first half of the year than during the second half of the year. Consequently, we experience significant seasonal fluctuations in our operating results and cash needs.
Growth in Loan Portfolio. The revenue that we derive from interest and fees is largely driven by the balance of loans that we originate and purchase. We originated or purchased approximately 127.9 thousand, 143.5 thousand, and 172.9 thousand new borrower loan accounts during 2015, 2014, and 2013, respectively. Average finance receivables grew 32.2% from $361.1 million in 2012 to $477.4 million in 2013, grew 10.9% to $529.5 million in 2014, and grew 8.2% to $572.8 million in 2015. We source our loans through our branches and our direct mail program, as well as through automobile dealerships, retail partners, and our website. Our loans are made almost exclusively in geographic markets served by our network of branches. Increasing the number of loans per branch, the average size of each loan, and the number of branches we operate allows us to increase the number of loans that we are able to service. We opened or acquired 31, 36, and 43 new branches in 2015, 2014, and 2013, respectively. We believe we have the opportunity to add as many as 700 additional branches in states where it is currently favorable for us to conduct business, and we have plans to continue to grow our branch network.
Product Mix. We charge different interest rates and fees and are exposed to different credit risks with respect to the various types of loans we offer. Our product mix also varies to some extent by state, and we may further diversify our product mix in the future.
Asset Quality and Allowance for Credit Losses. Our results of operations are highly dependent upon the quality of our loan portfolio. We recorded a $47.3 million provision for credit losses during 2015 (or 8.3% of average finance receivables), a $69.1 million provision for credit losses during 2014 (or 13.0% as a percentage of average finance receivables), and a $39.2 million provision for credit losses during 2013 (or 8.2% of average finance receivables). The quality of our loan portfolio is the result of our ability to enforce sound underwriting standards, maintain diligent servicing of the portfolio, and respond to changing economic conditions as we grow our loan portfolio. In 2014, due to branch staffing issues and convenience check credit quality deterioration in our mail campaigns, we experienced an unusually high net charge-off rate. In late 2014 and 2015, we created a
52
Table of Contents
new credit risk function and have been making changes to improve our credit underwriting guidelines. We believe that these changes have impacted, and will continue to impact, our business and results of operations, including through lower refinancing volumes, lower delinquency levels, and improved credit quality in our portfolio. We will continue to monitor how these changes impact our business and results of operations, and will make further revisions to our credit underwriting guidelines when appropriate.
We evaluate losses in each of our loan categories in establishing the allowance for credit losses. The following table sets forth our allowance for credit losses compared to the related finance receivables:
| As of December 31, 2015 | As of December 31, 2014 | |||||||||||||||||||||||
| In thousands | Finance Receivables |
Allowance for Credit Losses |
Allowance as Percentage of Related Finance Receivables |
Finance Receivables |
Allowance for Credit Losses |
Allowance as Percentage of Related Finance Receivables |
||||||||||||||||||
| Branch small loans |
$ | 157,755 | $ | 9,456 | 6.0 | % | $ | 128,217 | $ | 6,960 | 5.4 | % | ||||||||||||
| Convenience checks |
180,402 | 12,079 | 6.7 | % | 191,316 | 18,320 | 9.6 | % | ||||||||||||||||
| Large loans |
146,553 | 5,593 | 3.8 | % | 46,147 | 1,980 | 4.3 | % | ||||||||||||||||
| Automobile loans |
116,109 | 8,828 | 7.6 | % | 154,382 | 11,776 | 7.6 | % | ||||||||||||||||
| Retail loans |
27,625 | 1,496 | 5.4 | % | 26,130 | 1,475 | 5.6 | % | ||||||||||||||||
|
|
|
|
|
|
|
|
|
|
|
|
|
|||||||||||||
| Total |
$ | 628,444 | $ | 37,452 | 6.0 | % | $ | 546,192 | $ | 40,511 | 7.4 | % | ||||||||||||
|
|
|
|
|
|
|
|
|
|
|
|
|
|||||||||||||
The allowance for credit losses calculation uses the net charge-off rate for the most recent six months (branch small loans and convenience checks), ten months (retail loans), and twelve months (large loans and automobile loans) as a percentage of the most recent month-end balance of loans as a key data point in estimating the allowance. In 2015, large loans were updated to use a twelve month effective life rather than ten. As we continue to grow our large loan portfolio, we are originating longer term loans, thus increasing the effective life of large loans. We believe that the primary underlying factors driving the provision for credit losses for each of these loan types are our underwriting standards, the general economic conditions in the areas in which we conduct business, portfolio growth, and the effectiveness of our collection efforts. In addition, the market for repossessed automobiles at auction is another underlying factor that we believe influences the provision for credit losses for automobile purchase loans and, to a lesser extent, large loans. We monitor these factors, the amount and past due status of delinquencies, and the slow file (which consists of all loans one or more days past due) to identify trends that might require us to modify the allowance for credit losses. Our provision was impacted in 2014 by a charge to augment our allowance for credit losses, necessitated by a higher-than-normal proportion of lower credit quality convenience check loans originated in our summer convenience check campaigns.
Interest Rates. Our costs of funds are affected by changes in interest rates, and the interest rate that we pay on our senior revolving credit facility is a variable rate. A previous interest rate cap matured unused in March 2014. In April 2015, we entered into new interest rate cap contracts to replace the matured interest rate cap. The interest rate cap contracts have an aggregate notional principal amount of $150.0 million with a 2.5% strike rate against one-month LIBOR and mature in April 2018.
Operating Costs. Our financial results are impacted by the costs of operating our branch offices and corporate functions. Those costs are included in general and administrative expenses on our consolidated statements of income. Two of our operating metrics are our efficiency ratios, which are calculated by dividing the sum of general and administrative expenses by total revenue (our revenue efficiency ratio) or average finance receivables (our receivable efficiency ratio). Our revenue efficiency ratio was 53.2% in 2015 compared to 47.3% in 2014, and our receivable efficiency ratio was 20.2% in 2015, compared to 18.3% in 2014. While these ratios are relatively in line with industry standards, we have a number of initiatives underway that we believe will improve our operating leverage over the next couple of years, including acceptance of electronic payments, reducing the amount of time it takes to originate a loan, and increasing our average loans outstanding per branch.
53
Table of Contents
Components of Results of Operations
Interest and Fee Income. Our interest and fee income consists primarily of interest earned on outstanding loans. We cease accruing interest on a loan when the customer is contractually past due 90 days. Interest accrual resumes when the customer makes at least one full payment and the account is less than 90 days contractually past due. If the account is charged off, the interest accrual is reversed as a reduction of interest and fee income during the period the charge-off occurs.
Most states allow certain fees in connection with lending activities, such as loan origination fees, acquisition fees, and maintenance fees. Some states allow for higher fees while keeping interest rates lower. Loan fees are additional charges to the customer and are included in the Truth in Lending disclosure we make to our customers. The fees may or may not be refundable to the customer in the event of an early payoff, depending on state law. Fees are accrued to income over the life of the loan on the constant yield method.
Insurance Income. Our insurance income consists of revenue from the sale of various optional credit insurance products and other payment protection products offered to customers who obtain loans directly from us. We do not sell insurance to non-borrowers. We offer optional credit life insurance, credit accident and health insurance, and involuntary unemployment insurance. The type and terms of our optional credit insurance products vary from state to state based on applicable laws and regulations. In addition, we require property insurance on any personal property securing loans and offer customers the option of providing proof of such insurance purchased from a third party in lieu of purchasing property insurance from us. We also collect a fee for collateral protection and purchase non-recording insurance in lieu of recording and perfecting our security interest in the assets pledged on certain loans. We also require proof of insurance for any vehicles securing loans, and we have the option to obtain automobile collision insurance on behalf of customers who permit their insurance coverage to lapse. We also offer, in select markets, vehicle single interest insurance, which provides coverage on automobiles used as collateral on small and large loans. This affords the borrower flexibility with regards to the requirement of maintaining full coverage on the vehicle while also protecting the collateral used to secure the loan.
We issue insurance certificates as agents on behalf of an unaffiliated insurance company and then remit to the unaffiliated insurance company the premiums we collect (net of refunds on prepaid loans and net of commission on new business). The unaffiliated insurance company cedes life insurance premiums to our wholly-owned insurance subsidiary, RMC Reinsurance, Ltd. (“RMC Reinsurance”), as written and non-life premiums as earned. We maintain a cash reserve for life insurance claims in an amount determined by the unaffiliated insurance company. As of December 31, 2015, we had pledged a $2.9 million letter of credit to the unaffiliated insurance company to secure payment of life insurance claims and unearned premium refunds. The unaffiliated insurance company maintains the reserves for non-life claims. Insurance income includes all of the above-described insurance premiums, claims, and expenses.
Other Income. Our other income consists primarily of late charges assessed on customers who fail to make a payment within a specified number of days following the due date of the payment. In addition, fees for extending the due date of a loan and returned check charges are also included in other income.
Provision for Credit Losses. Provisions for credit losses are charged to income in amounts that we judge as sufficient to maintain an allowance for credit losses at an adequate level to provide for estimated losses on the related finance receivable portfolio. Credit loss experience, delinquency of finance receivables, portfolio growth, the value of underlying collateral, and management’s judgment are factors used in assessing the overall adequacy of the allowance and the resulting provision for credit losses. Our provision for credit losses fluctuates so that we maintain an adequate credit loss allowance that reflects our estimate of losses over the effective life of our loan portfolios. Therefore, changes in our charge-off rates may result in changes to our provision for credit losses. Future adjustments to the allowance may be necessary if there are significant changes in economic conditions or portfolio performance.
54
Table of Contents
General and Administrative Expenses. Our general and administrative expenses are comprised of four categories: personnel, occupancy, marketing, and other. We measure our general and administrative expenses as a percentage of total revenue, which we refer to as our revenue efficiency ratio, and as a percentage of average finance receivables, which we refer to as our receivable efficiency ratio.
Our personnel expenses are the largest component of our general and administrative expenses and consist primarily of the salaries, bonuses, benefits, and related payroll taxes associated with all of our branch, field, and home office employees.
Our occupancy expenses consist primarily of the cost of renting our branches, all of which are leased, as well as the utility, telecommunication, software, data processing, and other non-personnel costs associated with operating our branches.
Our marketing expenses consist primarily of costs associated with our direct mail campaigns (including postage and costs associated with selecting recipients) and maintaining our website, as well as telephone directory advertisements and some local marketing by branches. These costs are expensed as incurred.
Other expenses consist primarily of legal, audit, consulting, director compensation, bank service charges, office supplies, and credit bureau charges.
Our general and administrative expenses have increased as a result of the additional legal, accounting, insurance, occupancy, and other expenses associated with being a growing public company. Due to the increase in home office employees, we have been increasing and expect to continue to increase the amount of home office space that we lease, which will increase occupancy expense. Additionally, in connection with our efforts to expand and enhance internet lending and improve our loan management system, we expect technology costs to increase in 2016. We also expect compliance costs to continue to increase due to the regulatory environment in the consumer finance industry, and we expect legal costs to continue to remain elevated as a result of the securities class action lawsuit discussed in Part I, Item 3. “Legal Proceedings.” For a discussion regarding how risks and uncertainties associated with legal proceedings and the current regulatory environment may impact our future expenses, net income, and overall financial condition, see Part I, Item 1A. “Risk Factors.”
Interest Expense. Our interest expense consists primarily of interest payable, unused line fees, and amortization of debt issuance costs in respect of long-term debt. Interest expense also includes costs attributable to the interest rate caps that we use to manage our interest rate risk. Changes in the fair value of the interest rate caps are reflected in interest expense.
Income Taxes. Income taxes consist primarily of state and federal income taxes. Deferred tax assets and liabilities are recognized for the future tax consequences attributable to temporary differences between the financial statement carrying amounts of existing assets and liabilities and their respective tax bases. Deferred tax assets and liabilities are measured using enacted tax rates expected to apply to taxable income in the years in which those temporary differences are expected to be recovered or settled. The effects of future tax rate changes are recognized in the period when the enactment of new rates occurs.
55
Table of Contents
Results of Operations
The following table summarizes our results of operations, both in dollars and as a percentage of total revenue:
| Year Ended December 31, | ||||||||||||||||||||||||
| 2015 | 2014 | 2013 | ||||||||||||||||||||||
| In thousands | Amount | % of Revenue |
Amount | % of Revenue |
Amount | % of Revenue |
||||||||||||||||||
| Revenue |
||||||||||||||||||||||||
| Interest and fee income |
$ | 195,794 | 90.1 | % | $ | 184,797 | 90.3 | % | $ | 152,343 | 89.3 | % | ||||||||||||
| Insurance income, net |
11,654 | 5.4 | % | 10,673 | 5.2 | % | 11,470 | 6.7 | % | |||||||||||||||
| Other income |
9,858 | 4.5 | % | 9,249 | 4.5 | % | 6,816 | 4.0 | % | |||||||||||||||
|
|
|
|
|
|
|
|
|
|
|
|
|
|||||||||||||
| Total revenue |
217,306 | 100.0 | % | 204,719 | 100.0 | % | 170,629 | 100.0 | % | |||||||||||||||
|
|
|
|
|
|
|
|
|
|
|
|
|
|||||||||||||
| Expenses |
||||||||||||||||||||||||
| Provision for credit losses |
47,348 | 21.8 | % | 69,057 | 33.7 | % | 39,192 | 23.0 | % | |||||||||||||||
| Personnel |
69,247 | 31.9 | % | 55,383 | 27.1 | % | 39,868 | 23.4 | % | |||||||||||||||
| Occupancy |
17,775 | 8.2 | % | 15,575 | 7.6 | % | 11,748 | 6.9 | % | |||||||||||||||
| Marketing |
7,017 | 3.2 | % | 6,330 | 3.1 | % | 3,980 | 2.3 | % | |||||||||||||||
| Other |
21,559 | 9.9 | % | 19,488 | 9.5 | % | 15,443 | 9.0 | % | |||||||||||||||
|
|
|
|
|
|
|
|
|
|
|
|
|
|||||||||||||
| Total general and administrative |
115,598 | 53.2 | % | 96,776 | 47.3 | % | 71,039 | 41.6 | % | |||||||||||||||
|
|
||||||||||||||||||||||||
| Interest expense |
16,221 | 7.4 | % | 14,947 | 7.3 | % | 14,144 | 8.3 | % | |||||||||||||||
|
|
|
|
|
|
|
|
|
|
|
|
|
|||||||||||||
| Income before income taxes |
38,139 | 17.6 | % | 23,939 | 11.7 | % | 46,254 | 27.1 | % | |||||||||||||||
| Income taxes |
14,774 | 6.8 | % | 9,137 | 4.5 | % | 17,460 | 10.2 | % | |||||||||||||||
|
|
|
|
|
|
|
|
|
|
|
|
|
|||||||||||||
| Net income |
$ | 23,365 | 10.8 | % | $ | 14,802 | 7.2 | % | $ | 28,794 | 16.9 | % | ||||||||||||
|
|
|
|
|
|
|
|
|
|
|
|
|
|||||||||||||
The following table summarizes our results of operations, both in dollars and as a percentage of average receivables:
| Year Ended December 31, | ||||||||||||||||||||||||
| 2015 | 2014 | 2013 | ||||||||||||||||||||||
| In thousands | Amount | % of Average Receivables |
Amount | % of Average Receivables |
Amount | % of Average Receivables |
||||||||||||||||||
| Revenue |
||||||||||||||||||||||||
| Interest and fee income |
$ | 195,794 | 34.2 | % | $ | 184,797 | 34.9 | % | $ | 152,343 | 31.9 | % | ||||||||||||
| Insurance income, net |
11,654 | 2.0 | % | 10,673 | 2.0 | % | 11,470 | 2.4 | % | |||||||||||||||
| Other income |
9,858 | 1.7 | % | 9,249 | 1.8 | % | 6,816 | 1.4 | % | |||||||||||||||
|
|
|
|
|
|
|
|
|
|
|
|
|
|||||||||||||
| Total revenue |
217,306 | 37.9 | % | 204,719 | 38.7 | % | 170,629 | 35.7 | % | |||||||||||||||
|
|
|
|
|
|
|
|
|
|
|
|
|
|||||||||||||
| Expenses |
||||||||||||||||||||||||
| Provision for credit losses |
47,348 | 8.3 | % | 69,057 | 13.0 | % | 39,192 | 8.2 | % | |||||||||||||||
|
|
||||||||||||||||||||||||
| Personnel |
69,247 | 12.1 | % | 55,383 | 10.5 | % | 39,868 | 8.4 | % | |||||||||||||||
| Occupancy |
17,775 | 3.1 | % | 15,575 | 2.9 | % | 11,748 | 2.5 | % | |||||||||||||||
| Marketing |
7,017 | 1.2 | % | 6,330 | 1.2 | % | 3,980 | 0.8 | % | |||||||||||||||
| Other |
21,559 | 3.8 | % | 19,488 | 3.7 | % | 15,443 | 3.2 | % | |||||||||||||||
|
|
|
|
|
|
|
|
|
|
|
|
|
|||||||||||||
| Total general and administrative |
115,598 | 20.2 | % | 96,776 | 18.3 | % | 71,039 | 14.9 | % | |||||||||||||||
|
|
||||||||||||||||||||||||
| Interest expense |
16,221 | 2.7 | % | 14,947 | 2.9 | % | 14,144 | 2.9 | % | |||||||||||||||
|
|
|
|
|
|
|
|
|
|
|
|
|
|||||||||||||
| Income before income taxes |
38,139 | 6.7 | % | 23,939 | 4.5 | % | 46,254 | 9.7 | % | |||||||||||||||
| Income taxes |
14,774 | 2.6 | % | 9,137 | 1.7 | % | 17,460 | 3.7 | % | |||||||||||||||
|
|
|
|
|
|
|
|
|
|
|
|
|
|||||||||||||
| Net income |
$ | 23,365 | 4.1 | % | $ | 14,802 | 2.8 | % | $ | 28,794 | 6.0 | % | ||||||||||||
|
|
|
|
|
|
|
|
|
|
|
|
|
|||||||||||||
56
Table of Contents
Comparison of December 31, 2015, Versus December 31, 2014
The following discussion and table describe the changes in finance receivables by product type:
| • | Branch Small Loans – Branch small loans outstanding increased by $29.5 million, or 23.0%, to $157.8 million at December 31, 2015, from $128.2 million at December 31, 2014. The growth in receivables in branches opened in 2014 and 2015 contributed to the growth in overall branch small loans outstanding. |
| • | Convenience Checks – Convenience checks outstanding decreased by $10.9 million, or 5.7%, to $180.4 million at December 31, 2015, from $191.3 million at December 31, 2014, primarily due to the higher-than-normal proportion of lower credit quality loans originated during the 2014 summer direct mail campaigns and the conversion of convenience check loans to large loans. |
| • | Large Loans – Large loans outstanding increased by $100.4 million, or 217.6%, to $146.6 million at December 31, 2015, from $46.1 million at December 31, 2014. The increase was primarily due to the addition of expertise in this product type, increased marketing, and the conversion of many convenience check loans to large loans. |
| • | Automobile Loans – Automobile loans outstanding decreased by $38.3 million, or 24.8%, to $116.1 million at December 31, 2015, from $154.4 million at December 31, 2014. This decrease was due to our strategic decision to constrain capital in the highly competitive automobile category. In August 2014, our AutoCredit Source branches were re-branded as Regional Finance branches, and we began to offer all loan products in these branches with less focus on indirect automobile loans. We anticipate that the automobile loan portfolio will remain relatively flat in the short-term as we refine our business practices in this product category. |
| • | Retail Loans – Retail loans outstanding increased $1.5 million, or 5.7%, to $27.6 million at December 31, 2015, from $26.1 million at December 31, 2014. The increase in retail loans outstanding resulted from the additional relationships we established with new retailers, as well as an expansion of volume through our existing relationships. |
| Finance Receivables by Product | ||||||||||||||||
| In thousands | 2015 | 2014 | YoY $ Inc (Dec) |
YoY % Inc (Dec) |
||||||||||||
| Branch small loans |
$ | 157,755 | $ | 128,217 | $ | 29,538 | 23.0 | % | ||||||||
| Convenience checks |
180,402 | 191,316 | (10,914 | ) | (5.7 | )% | ||||||||||
| Large loans |
146,553 | 46,147 | 100,406 | 217.6 | % | |||||||||||
|
|
|
|
|
|
|
|
|
|||||||||
| Total core loans |
484,710 | 365,680 | 119,030 | 32.6 | % | |||||||||||
| Automobile loans |
116,109 | 154,382 | (38,273 | ) | (24.8 | )% | ||||||||||
| Retail loans |
27,625 | 26,130 | 1,495 | 5.7 | % | |||||||||||
|
|
|
|
|
|
|
|
|
|||||||||
| Total finance receivables |
$ | 628,444 | $ | 546,192 | $ | 82,252 | 15.1 | % | ||||||||
|
|
|
|
|
|
|
|
|
|||||||||
|
|
||||||||||||||||
| Number of branches at period end |
331 | 300 | 31 | 10.3 | % | |||||||||||
| Average finance receivables per branch |
$ | 1,899 | $ | 1,821 | $ | 78 | 4.3 | % | ||||||||
|
|
|
|
|
|
|
|
|
|||||||||
Comparison of the Year Ended December 31, 2015, Versus the Year Ended December 31, 2014
Net Income. Net income increased $8.6 million, or 57.9%, to $23.4 million in 2015, from $14.8 million in 2014. The increase in net income in 2015 was primarily due to a decrease in provision for credit losses of $21.7 million and an increase in revenue of $12.6 million. These increases were partially offset by an increase in general and administrative expenses of $18.8 million, an increase of $5.6 million in income taxes, and an increase of $1.3 million in interest expense.
57
Table of Contents
Revenue. Total revenue increased $12.6 million, or 6.1%, to $217.3 million in 2015, from $204.7 million in 2014. The components of revenue are explained in greater detail below.
Interest and Fee Income. Interest and fee income increased $11.0 million, or 6.0%, to $195.8 million in 2015, from $184.8 million in 2014. The increase in interest and fee income was primarily due to an 8.2% increase in average finance receivables offset by a 0.7% yield decrease since 2014.
The following table sets forth the average finance receivables balance and average yield for each of our loan product categories:
| Averages and Yields | ||||||||||||||||
| 2015 | 2014 | |||||||||||||||
| In thousands | Average Finance Receivables |
Average Yield | Average Finance Receivables |
Average Yield | ||||||||||||
| Branch small loans |
$ | 138,253 | 44.3 | % | $ | 110,531 | 48.0 | % | ||||||||
| Convenience checks |
178,692 | 43.6 | % | 178,181 | 45.8 | % | ||||||||||
| Large loans |
93,243 | 27.6 | % | 42,887 | 26.9 | % | ||||||||||
| Automobile loans |
137,249 | 19.0 | % | 169,607 | 19.7 | % | ||||||||||
| Retail loans |
25,392 | 18.8 | % | 28,295 | 18.4 | % | ||||||||||
|
|
|
|
|
|
|
|
|
|||||||||
| Total interest and fee yield |
$ | 572,829 | 34.2 | % | $ | 529,501 | 34.9 | % | ||||||||
|
|
|
|
|
|
|
|
|
|||||||||
| Total revenue yield |
$ | 572,829 | 37.9 | % | $ | 529,501 | 38.7 | % | ||||||||
|
|
|
|
|
|
|
|
|
|||||||||
Branch small loan and convenience check yields decreased 3.7% and 2.2%, respectively, compared to 2014 as more of our branch small loan and convenience check customers have originated loans with larger balances and longer maturities, which typically are priced at lower interest rates. The yield decline in 2015 was also due to the absence of the higher rate, lower credit quality convenience check loans originated in 2014. We anticipate that the branch small loan and convenience check loan yields will remain flat due to demand for larger loan amounts.
The following table represents the balance of loan originations and refinancing net of unearned finance charges.
| Net Loans Originated | ||||||||||||||||
| In thousands | 2015 | 2014 | YoY $ Inc (Dec) |
YoY % Inc (Dec) |
||||||||||||
| Branch small loans |
$ | 276,908 | $ | 248,872 | $ | 28,036 | 11.3 | % | ||||||||
| Convenience checks |
315,303 | 343,982 | (28,679 | ) | (8.3 | )% | ||||||||||
| Large loans |
173,560 | 52,418 | 121,142 | 231.1 | % | |||||||||||
| Automobile loans |
41,621 | 67,422 | (25,801 | ) | (38.3 | )% | ||||||||||
| Retail loans |
31,710 | 31,236 | 474 | 1.5 | % | |||||||||||
|
|
|
|
|
|
|
|
|
|||||||||
| Total finance receivables |
$ | 839,102 | $ | 743,930 | $ | 95,172 | 12.8 | % | ||||||||
|
|
|
|
|
|
|
|
|
|||||||||
58
Table of Contents
The following table summarizes the components of the increase in interest and fee income:
| Components of Increase in Interest and Fee Income Year Ended December 31, 2015 Compared to Year Ended December 31, 2014 Increase (Decrease) |
||||||||||||
| In thousands | Volume | Rate | Net | |||||||||
| Branch small loans |
$ | 12,529 | $ | (4,289 | ) | $ | 8,240 | |||||
| Convenience checks |
233 | (3,981 | ) | (3,748 | ) | |||||||
| Large loans |
13,884 | 322 | 14,206 | |||||||||
| Automobile loans |
(6,180 | ) | (1,106 | ) | (7,286 | ) | ||||||
| Retail loans |
(543 | ) | 128 | (415 | ) | |||||||
| Change in product mix |
(4,974 | ) | 4,974 | — | ||||||||
|
|
|
|
|
|
|
|||||||
| Total increase (decrease) in interest and fee income |
$ | 14,949 | $ | (3,952 | ) | $ | 10,997 | |||||
|
|
|
|
|
|
|
|||||||
Insurance Income. Insurance income increased $1.0 million, or 9.2%, to $11.7 million in 2015 from $10.7 million in 2014. The increase in insurance income was due primarily to an 8.2% increase in average finance receivables. Insurance income as a percentage of average finance receivables remained constant at 2.0% in 2015 and 2014. During 2016, we will be transitioning our insurance business to a new unaffiliated third party provider, which will result in variances to the premiums we charge for the products we offer. Additionally, we continually assess the costs of our products for an equitable balance of costs and benefits. Due to the transition to a new vendor and our on-going assessment of costs, premiums may be changed during 2016, which may impact the revenue and/or costs of our insurance operation.
Other Income. Other income increased $0.6 million, or 6.6%, to $9.9 million in 2015 from $9.2 million in 2014. The largest component of other income is late charges, which increased $0.9 million in 2015. The increase in late charges was due primarily to the implementation of a late fee as part of the modernization of North Carolina’s consumer finance law and an 8.2% increase in average finance receivables.
Provision for Credit Losses. Our provision for credit losses decreased $21.7 million, or 31.4%, to $47.3 million in 2015 from $69.1 million in 2014. The provision represented 8.3% of average receivables and 21.8% of total revenue in 2015 compared to 13.0% of average receivables and 33.7% of total revenue in 2014. Our provision was impacted in 2014 by a charge to augment our allowance for credit losses, necessitated by a higher-than-normal proportion of lower credit quality convenience check loans originated in our summer convenience check campaigns.
In late 2014 and 2015, we created a credit risk function, which has improved our underwriting and servicing processes. We continue to build out the full capabilities of the credit risk function as we move into 2016 and believe this investment will provide additional benefits in the future.
Net charge-offs decreased $8.2 million, or 14.0%, to $50.4 million in 2015 from $58.6 million in 2014. Net charge-offs represented 8.8% of average receivables in 2015 compared to 11.1% of average receivables in 2014. Total net charge-offs decreased in 2015 even though average receivables increased 8.2%. The decrease in net charge-offs was partially due to a $2.0 million increase in recoveries from the sale of previously charged-off loans in 2015 in addition to a $2.1 million one-time charge-off in 2014 resulting from the change in our charge-off policy.
We completed the bulk sale of our existing charged-off loan portfolio in December 2015, and this resulted in increased recoveries in the allowance for credit losses and a decrease in the provision for credit losses of $2.0 million during 2015. In addition, we have committed to the sale of the forward flow of accounts charged off between November 2015 and October 2016. These transactions will be executed January through December 2016 and should result in higher future recoveries compared to our run rate levels in the first three quarters of 2015.
59
Table of Contents
Delinquencies one day and more past due as a percentage of total finance receivables decreased to 20.3% as of December 31, 2015, from 22.6% in 2014. Delinquencies 30 days and more past due as a percentage of total finance receivables decreased to 7.2% as of December 31, 2015, from 7.5% in 2014. The decrease in delinquency percentages was primarily due to the absence of lower credit quality convenience check loans originated in 2014, and the benefit of improved underwriting and servicing activity during 2015. The following tables include delinquency balances by aging and by product.
| Contractual Delinquency by Aging | ||||||||||||||||
| In thousands | 2015 | 2014 | ||||||||||||||
| Allowance for credit losses |
$ | 37,452 | 6.0 | % | $ | 40,511 | 7.4 | % | ||||||||
| Current |
500,591 | 79.7 | % | 422,342 | 77.4 | % | ||||||||||
| 1 to 29 days past due |
82,589 | 13.1 | % | 82,714 | 15.1 | % | ||||||||||
|
|
|
|
|
|
|
|
|
|||||||||
| Delinquent accounts: |
||||||||||||||||
| 30 to 59 days |
15,654 | 2.5 | % | 15,951 | 2.9 | % | ||||||||||
| 60 to 89 days |
9,858 | 1.6 | % | 9,624 | 1.8 | % | ||||||||||
| 90 to 119 days |
7,696 | 1.1 | % | 6,899 | 1.2 | % | ||||||||||
| 120 to 149 days |
6,678 | 1.1 | % | 4,988 | 0.9 | % | ||||||||||
| 150 to 179 days |
5,378 | 0.9 | % | 3,674 | 0.7 | % | ||||||||||
|
|
|
|
|
|
|
|
|
|||||||||
| Total contractual delinquency |
$ | 45,264 | 7.2 | % | $ | 41,136 | 7.5 | % | ||||||||
|
|
|
|
|
|
|
|
|
|||||||||
| Total finance receivables |
$ | 628,444 | 100.0 | % | $ | 546,192 | 100.0 | % | ||||||||
|
|
|
|
|
|
|
|
|
|||||||||
| 1 day and over past due |
$ | 127,853 | 20.3 | % | $ | 123,850 | 22.6 | % | ||||||||
|
|
|
|
|
|
|
|
|
|||||||||
| Contractual Delinquency by Product | ||||||||||||||||
| In thousands | 2015 | 2014 | ||||||||||||||
| Branch small loans |
$ | 14,765 | 9.4 | % | $ | 10,247 | 8.0 | % | ||||||||
| Convenience checks |
15,420 | 8.5 | % | 17,165 | 9.0 | % | ||||||||||
| Large loans |
4,945 | 3.4 | % | 2,106 | 4.6 | % | ||||||||||
| Automobile loans |
8,713 | 7.5 | % | 10,302 | 6.7 | % | ||||||||||
| Retail loans |
1,421 | 5.1 | % | 1,316 | 5.0 | % | ||||||||||
|
|
|
|
|
|
|
|
|
|||||||||
| Total contractual delinquency |
$ | 45,264 | 7.2 | % | $ | 41,136 | 7.5 | % | ||||||||
|
|
|
|
|
|
|
|
|
|||||||||
General and Administrative Expenses. Our general and administrative expenses, comprising expenses for personnel, occupancy, marketing, and other expenses, increased $18.8 million, or 19.4%, to $115.6 million in 2015 from $96.8 million in 2014. Our receivable efficiency ratio (general and administrative expenses as a percentage of average finance receivables) increased to 20.2% during 2015 from 18.3% in 2014. Our revenue efficiency ratio (general and administrative expenses as a percentage of revenue) increased to 53.2% during 2015 from 47.3% in 2014. This increase was primarily the result of 67 additional branches opened during 2014 and 2015, additional corporate office employees, and an increase in consulting, legal, compliance, compensation, and other costs. The increase in general and administrative expenses is explained in greater detail below.
| General & Administrative Expenses | ||||||||||||
| In thousands | 2015 | 2014 | YoY $ B(W) |
|||||||||
| Legacy branch G&A expenses |
$ | 71,187 | $ | 61,759 | $ | (9,428 | ) | |||||
| New branches’ expenses |
3,015 | 3,139 | 124 | |||||||||
|
|
|
|
|
|
|
|||||||
| Total branch G&A expenses |
74,202 | 64,898 | (9,304 | ) | ||||||||
| Marketing |
7,017 | 6,330 | (687 | ) | ||||||||
| Home office G&A expenses |
34,379 | 25,548 | (8,831 | ) | ||||||||
|
|
|
|
|
|
|
|||||||
| Total G&A expenses |
$ | 115,598 | $ | 96,776 | $ | (18,822 | ) | |||||
|
|
|
|
|
|
|
|||||||
60
Table of Contents
Personnel. The largest component of general and administrative expenses is personnel expense, which increased $13.9 million, or 25.0%, to $69.2 million in 2015 from $55.4 million in 2014. This increase was primarily due to $5.0 million in additional costs related to the 67 branches opened in 2014 and 2015, $4.1 million due to additional home office employees since 2014, non-operating compensation-related costs incurred related to a Chief Executive Officer restricted stock grant and the retirement agreement with our former Vice Chairman, 2014 reversal of $1.4 million due to change in our paid time off (“PTO”) policy, and a $1.2 million decrease in deferred loan origination costs (contra-expense) due to a lower count of loan originations compared to 2014. The additional home office employees strengthen our credit risk, internal audit, compliance, and other home office support functions.
| Headcount | ||||||||||||
| In thousands | 2015 | 2014 | YoY Inc (Dec) |
|||||||||
| Legacy branch headcount |
1,208 | 1,223 | (15 | ) | ||||||||
| New branches’ headcount |
72 | 112 | (40 | ) | ||||||||
|
|
|
|
|
|
|
|||||||
| Total branch headcount |
1,280 | 1,335 | (55 | ) | ||||||||
| Home office headcount |
133 | 105 | 28 | |||||||||
|
|
|
|
|
|
|
|||||||
| Total headcount |
1,413 | 1,440 | (27 | ) | ||||||||
|
|
|
|
|
|
|
|||||||
|
|
||||||||||||
| Number of branches |
331 | 300 | 31 | |||||||||
|
|
|
|
|
|
|
|||||||
Occupancy. Occupancy expenses increased $2.2 million, or 14.1%, to $17.8 million in 2015 from $15.6 million in 2014. The increase in occupancy expenses was the result of new branches opened. Additionally, we frequently experience increases in rent as we renew existing leases. At December 31, 2014, we had 300 branches; whereas, at December 31, 2015, we had 331 branches.
Marketing. Marketing expenses increased $0.7 million, or 10.9%, to $7.0 million in 2015 from $6.3 million in 2014. The increase was due to the increases in the volume of our mail campaigns, including convenience checks, invitations to apply, and pre-qualified offers, and to support our 31 new branches and grow our large loan product category.
Other Expenses. Other expenses increased $2.1 million, or 10.6%, to $21.6 million in 2015 from $19.5 million in 2014. The increase was primarily due to higher compliance and consulting costs.
Interest Expense. Interest expense on long-term debt increased $1.3 million, or 8.5%, to $16.2 million in 2015 from $14.9 in 2014. This increase was due primarily to the increase in the average balance of our senior revolving credit facility and the purchase of interest rate caps in April 2015. The average cost of our long-term debt increased 0.05% to 4.53% for the year ended December 31, 2015 from 4.48% for the prior period. The increase was due primarily to an increase in interest rate cap expense of $0.5 million.
Income Taxes. Income taxes increased $5.6 million, or 61.7%, to $14.8 million in 2015 from $9.1 million in 2014. The increase was primarily due to an increase in our net income before taxes. Also, our effective tax rate increased 0.5% to 38.7% in 2015 from 38.2% in 2014. The increase was primarily due to non-deductible compensation.
Comparison of December 31, 2014, Versus December 31, 2013
The following discussion and table describe the changes in finance receivables by product type:
| • | Branch Small Loans – Branch small loans outstanding increased by $18.4 million, or 16.8%, to $128.2 million at December 31, 2014, from $109.8 million at December 31, 2013. The growth in receivables at the branches opened in 2014 contributed to the growth in overall branch small loans outstanding. |
61
Table of Contents
| • | Convenience Checks – Convenience checks outstanding increased by $12.1 million, or 6.8%, to $191.3 million at December 31, 2014, from $179.2 million at December 31, 2013. Our direct mail campaigns drove loan growth in existing and new branches. |
| • | Large Loans – Large loans outstanding increased by $2.8 million, or 6.5%, to $46.1 million at December 31, 2014, from $43.3 million at December 31, 2013. The increase was primarily due to the addition of expertise in and increased marketing of this product type. |
| • | Automobile Loans – Automobile loans outstanding decreased by $26.7 million, or 14.8%, to $154.4 million at December 31, 2014, from $181.1 million at December 31, 2013. This decrease was due to our strategic decision to constrain capital in the highly competitive automobile category. In August 2014, our AutoCredit Source branches were re-branded as Regional Finance branches, and we began to offer all loan products in these branches with less focus on indirect automobile loans. |
| • | Retail Loans – Retail loans outstanding decreased $5.1 million, or 16.4%, to $26.1 million at December 31, 2014, from $31.3 million at December 31, 2013. The decrease in retail loans outstanding resulted from our inability to provide promotional financing products, such as 90 days same as cash, from our current loan management system. |
| Finance Receivables by Product | ||||||||||||||||
| In thousands | 2014 | 2013 | YoY $ Inc (Dec) |
YoY % Inc (Dec) |
||||||||||||
| Branch small loans |
$ | 128,217 | $ | 109,776 | $ | 18,441 | 16.8 | % | ||||||||
| Convenience checks |
191,316 | 179,203 | 12,113 | 6.8 | % | |||||||||||
| Large loans |
46,147 | 43,311 | 2,836 | 6.5 | % | |||||||||||
|
|
|
|
|
|
|
|
|
|||||||||
| Total core loans |
365,680 | 332,290 | 33,390 | 10.0 | % | |||||||||||
| Automobile loans |
154,382 | 181,126 | (26,744 | ) | (14.8 | )% | ||||||||||
| Retail loans |
26,130 | 31,268 | (5,138 | ) | (16.4 | )% | ||||||||||
|
|
|
|
|
|
|
|
|
|||||||||
| Total finance receivables |
$ | 546,192 | $ | 544,684 | $ | 1,508 | 0.3 | % | ||||||||
|
|
|
|
|
|
|
|
|
|||||||||
|
|
||||||||||||||||
| Number of branches at period end |
300 | 264 | 36 | 13.6 | % | |||||||||||
| Average finance receivables per branch |
$ | 1,821 | $ | 2,063 | $ | (242 | ) | (11.7 | )% | |||||||
|
|
|
|
|
|
|
|
|
|||||||||
Comparison of the Year Ended December 31, 2014, Versus the Year Ended December 31, 2013
Net Income. Net income decreased $14.0 million, or 48.6%, to $14.8 million in 2014, from $28.8 million in 2013. The decrease in net income in 2014 was primarily due to increased provision for credit losses. Total revenues increased $34.1 million during 2014, a 20.0% increase over 2013. The increase in 2014 revenues was attributable to the opening or acquisition of 36 additional branches and statutory increases in allowable interest and fees in North Carolina and Texas.
Revenue. Total revenue increased $34.1 million, or 20.0%, to $204.7 million in 2014, from $170.6 million in 2013. The components of revenue are explained in greater detail below.
Interest and Fee Income. Interest and fee income increased $32.5 million, or 21.3%, to $184.8 million in 2014, from $152.3 million in 2013. The increase in interest and fee income was due primarily to a 10.9% increase in average finance receivables during the year coupled with an increase in the average yield on loans from 31.9% to 34.9%. The yield increase was due to statutory increases in allowable interest and fees in North Carolina and Texas.
62
Table of Contents
The following table sets forth the average finance receivables balance and average yield for each of our loan product categories:
| Averages and Yields | ||||||||||||||||
| 2014 | 2013 | |||||||||||||||
| In thousands | Average Finance Receivables |
Average Yield (Annualized) |
Average Finance Receivables |
Average Yield (Annualized) |
||||||||||||
| Branch small loans |
$ | 110,531 | 48.0 | % | $ | 88,979 | 48.9 | % | ||||||||
| Convenience checks |
178,181 | 45.8 | % | 133,723 | 40.7 | % | ||||||||||
| Large loans |
42,887 | 26.9 | % | 45,374 | 27.6 | % | ||||||||||
| Automobile loans |
169,607 | 19.7 | % | 178,247 | 20.3 | % | ||||||||||
| Retail loans |
28,295 | 18.4 | % | 31,031 | 18.1 | % | ||||||||||
|
|
|
|
|
|
|
|
|
|||||||||
| Total interest and fee yield |
$ | 529,501 | 34.9 | % | $ | 477,354 | 31.9 | % | ||||||||
|
|
|
|
|
|
|
|
|
|||||||||
| Total revenue yield |
$ | 529,501 | 38.7 | % | $ | 477,354 | 35.7 | % | ||||||||
|
|
|
|
|
|
|
|
|
|||||||||
The following table represents the balance of loan originations and refinancing net of unearned finance charges.
| Net Loans Originated | ||||||||||||||||
| In thousands | 2014 | 2013 | YoY $ Inc (Dec) |
YoY % Inc (Dec) |
||||||||||||
| Branch small loans |
$ | 248,872 | $ | 216,677 | $ | 32,195 | 14.9 | % | ||||||||
| Convenience checks |
343,982 | 297,259 | 46,723 | 15.7 | % | |||||||||||
| Large loans |
52,418 | 48,454 | 3,964 | 8.2 | % | |||||||||||
| Automobile loans |
67,422 | 100,622 | (33,200 | ) | (33.0 | )% | ||||||||||
| Retail loans |
31,236 | 34,228 | (2,992 | ) | (8.7 | )% | ||||||||||
|
|
|
|
|
|
|
|
|
|||||||||
| Total finance receivables |
$ | 743,930 | $ | 697,240 | $ | 46,690 | 6.7 | % | ||||||||
|
|
|
|
|
|
|
|
|
|||||||||
The following table summarizes the components of the increase in interest and fee income:
| Components of Increase in Interest and Fee Income Year Ended December 31, 2014 Compared to Year Ended December 31, 2013 Increase (Decrease) |
||||||||||||
| In thousands | Volume | Rate | Net | |||||||||
| Branch small loans |
$ | 10,360 | $ | (830 | ) | $ | 9,530 | |||||
| Convenience checks |
19,752 | 7,456 | 27,208 | |||||||||
| Large loans |
(674 | ) | (337 | ) | (1,011 | ) | ||||||
| Automobile loans |
(1,721 | ) | (1,132 | ) | (2,853 | ) | ||||||
| Retail loans |
(501 | ) | 81 | (420 | ) | |||||||
| Change in product mix |
(9,351 | ) | 9,351 | — | ||||||||
|
|
|
|
|
|
|
|||||||
| Total increase in interest and fee income |
$ | 17,865 | $ | 14,589 | $ | 32,454 | ||||||
|
|
|
|
|
|
|
|||||||
Insurance Income. Insurance income decreased $0.8 million, or 6.9%, to $10.7 million in 2014 from $11.5 million in 2013. Insurance income as a percentage of average finance receivables decreased from 2.4% in 2013 to 2.0% in 2014. The decline was primarily attributable to the increase in loans originated through our mail campaigns where we do not have the opportunity to discuss our insurance offerings with the customer and from increased claims expense.
Other Income. Other income increased $2.4 million, or 35.7%, to $9.2 million in 2014 from $6.8 million in 2013. The largest component of other income is late charges, which increased $2.5 million in 2014.
63
Table of Contents
The increase in late charges was due primarily to the implementation of a late fee as part of the modernization of North Carolina’s consumer finance law, a 10.9% increase in average finance receivables, and an increase in average delinquent accounts.
Provision for Credit Losses. Our provision for credit losses increased $29.9 million, or 76.2%, to $69.1 million in 2014 from $39.2 million in 2013. The provision represented 13.0% of average receivables and 33.7% of total revenue in 2014 compared to 8.2% of average receivables and 23.0% of total revenue in 2013. Our provision was impacted in 2014 by a charge to augment our allowance for credit losses, necessitated by a higher-than-normal proportion of lower credit quality convenience check loans originated in our summer convenience check campaigns.
Net charge-offs of $58.6 million were 11.1% of average finance receivables for 2014, an increase from $32.7 million or 6.9% in 2013. Net charge-offs represented 28.6% of total revenue in 2014 compared to 19.2% in 2013. The increase in net charge-offs included a $2.1 million one-time charge-off resulting from the change in our charge-off policy.
We experienced a higher delinquency level and resulting higher net charge-offs in the first half of 2014 as a result of elevated accounts per employee that caused challenges in servicing the growth in accounts. Additionally, our provision was impacted in the third quarter of 2014 by a charge to augment our allowance for credit losses, necessitated by a higher-than-normal proportion of lower credit quality loans originated in our summer convenience check mailing campaigns. These lower credit quality loans led to higher delinquencies, higher subsequent charge-offs, and increased provisions for credit losses. Delinquencies for all other loan categories were consistent with expectations and historic trends.
The convenience check mailing campaigns for the fourth quarter of 2014 were adjusted to prevent a similar issue from occurring in the future. We returned to what had worked in the past, and in late 2014 and 2015, we also hired a Chief Risk Officer and other personnel focused on credit risk management, established a Credit Committee to oversee direct mail campaign underwriting and origination processes, implemented additional policies and internal control procedures related to the audit of direct mail campaign files, and improved early-state delinquency reporting and communication. We believe these initiatives and others will substantially reduce the volatility of our convenience check delinquency rates. The following tables include delinquency balances by aging and by product.
| Contractual Delinquency by Aging | ||||||||||||||||
| In thousands | 2014 | 2013 | ||||||||||||||
| Allowance for credit losses |
$ | 40,511 | 7.4 | % | $ | 30,089 | 5.5 | % | ||||||||
|
|
||||||||||||||||
| Current |
422,342 | 77.4 | % | 407,571 | 74.9 | % | ||||||||||
| 1 to 29 days past due |
82,714 | 15.1 | % | 93,303 | 17.1 | % | ||||||||||
|
|
|
|
|
|
|
|
|
|||||||||
| Delinquent accounts: |
||||||||||||||||
| 30 to 59 days |
15,951 | 2.9 | % | 17,088 | 3.1 | % | ||||||||||
| 60 to 89 days |
9,624 | 1.8 | % | 9,267 | 1.7 | % | ||||||||||
| 90 to 119 days |
6,899 | 1.2 | % | 6,843 | 1.3 | % | ||||||||||
| 120 to 149 days |
4,988 | 0.9 | % | 5,108 | 0.9 | % | ||||||||||
| 150 to 179 days |
3,674 | 0.7 | % | 3,409 | 0.6 | % | ||||||||||
| 180 days and over |
— | 0.0 | % | 2,095 | 0.4 | % | ||||||||||
|
|
|
|
|
|
|
|
|
|||||||||
| Total contractual delinquency |
$ | 41,136 | 7.5 | % | $ | 43,810 | 8.0 | % | ||||||||
|
|
|
|
|
|
|
|
|
|||||||||
| Total finance receivables |
$ | 546,192 | 100.0 | % | $ | 544,684 | 100.0 | % | ||||||||
|
|
|
|
|
|
|
|
|
|||||||||
|
|
||||||||||||||||
| 1 day and over past due |
$ | 123,850 | 22.6 | % | $ | 137,113 | 25.1 | % | ||||||||
|
|
|
|
|
|
|
|
|
|||||||||
64
Table of Contents
| Contractual Delinquency by Product | ||||||||||||||||
| In thousands | 2014 | 2013 | ||||||||||||||
| Branch small loans |
$ | 10,247 | 8.0 | % | $ | 10,211 | 9.3 | % | ||||||||
| Convenience checks |
17,165 | 9.0 | % | 15,427 | 8.6 | % | ||||||||||
| Large loans |
2,106 | 4.6 | % | 3,010 | 6.9 | % | ||||||||||
| Automobile loans |
10,302 | 6.7 | % | 12,972 | 7.2 | % | ||||||||||
| Retail loans |
1,316 | 5.0 | % | 2,190 | 7.0 | % | ||||||||||
|
|
|
|
|
|
|
|
|
|||||||||
| Total contractual delinquency |
$ | 41,136 | 7.5 | % | $ | 43,810 | 8.0 | % | ||||||||
|
|
|
|
|
|
|
|
|
|||||||||
In September 2014, the Company changed the time-based element of the charge-off policy from 365 days contractually delinquent to 180 days. The updated policy improves consistency and creates better alignment with industry practice. The policy change generated a one-time charge-off of $2.1 million as of September 2014. The amount was charged against the allowance for credit losses which included a full specific valuation allowance for these delinquent accounts and, therefore, did not impact the provision for loan losses.
The charge-off policy change modified our historic loss rate and the resulting general reserve. In addition, we converted bankrupt accounts with confirmed plans from the bankruptcy court from delinquent to current status. The bankrupt accounts continue to be accounted for as troubled debt restructurings and considered impaired finance receivables. As a net result of these changes, the provision for credit losses increased by $0.3 million in September 2014.
In addition to the time-based element, we previously charged credit losses against the allowance when management believed the finance receivable was no longer collectible. The factors used to determine whether a finance receivable is uncollectible were the age of the account, supervisory review of collection efforts, and other factors such as customers relocating to an area where collection is not practical. This discretionary element was eliminated from the policy in December 2014, subject to certain exceptions.
General and Administrative Expenses. Our general and administrative expenses, comprising expenses for personnel, occupancy, marketing, and other expenses, increased $25.7 million, or 36.2%, to $96.8 million during 2014 from $71.0 million in 2013. Our revenue efficiency ratio (general and administrative expenses as a percentage of revenue) increased to 47.3% in 2014 from 41.6% in 2013. Our receivable efficiency ratio (general and administrative expenses as a percentage of average finance receivables) increased to 18.3% in 2014 from 14.9% in 2013. This increase was the result of 2013 and 2014 branch growth, additional corporate office headcount, $1.8 million of costs related to implementation of a new loan management system, $1.2 million of executive separation costs, $1.2 million in increased health care costs, and $3.1 million in consulting, legal, compliance, compensation, and other costs. On April 2, 2015, we terminated the system implementation and service agreement with DHI Computing Service, Inc. d/b/a GOLDPoint Systems, and we are currently reevaluating the various loan management system capabilities available in today’s market.
In October 2014, we accepted the resignation of our Chief Executive Officer. The resignation was treated as a termination without cause pursuant to the executive’s Employment Agreement, dated March 18, 2013. We entered into a Separation Agreement with the executive, dated December 11, 2014. The Employment Agreement and the Separation Agreement are attached as Exhibits 10.1 to the Current Reports on Form 8-K, filed with the SEC on March 21, 2013 and December 17, 2014, respectively. In the three months ended December 31, 2014, we recorded $1.2 million for the cost of the Separation Agreement, which is included in personnel expense on the consolidated income statement.
We modernized our PTO policy effective February 1, 2014. The new policy terms are more consistent with industry practices on the amount of PTO, eligible service requirements, cash out policy, and the use of partial PTO days. The policy change had accounting implications. Under the legacy policy, employees earned PTO in one year and then were able to use the PTO in the following year. This policy created a PTO liability under
65
Table of Contents
compensated absences accounting literature. Under the new policy, PTO is earned and used in the same calendar year, eliminating a PTO liability at the end of each year (with the exception of carryover PTO granted in extenuating circumstances). In the transition to the new policy, employees were given the opportunity to forfeit earned and unused PTO days under the legacy policy in exchange for additional PTO days and other benefits under the new policy or to remain on the old policy. As a result, effective January 31, 2014, based upon employee elections in January 2014, the PTO liability for certain employees was eliminated, and beginning February 1, 2014, such employees began accruing PTO under the new policy. The effect of the policy change was reflected in the period the change was implemented. Thus, in the first quarter of 2014, this change in policy resulted in a reversal of $1.4 million of personnel expense. The policy was amended in December 2014 to allow employees to carry-over up to 40 hours of PTO into the following calendar year. Any carried over time must be used during the first quarter of the following year or it will be forfeited.
| Efficiency Ratios | ||||||||
| In thousands | 2014 | 2013 | ||||||
| General and administrative expenses |
$ | 96,776 | $ | 71,039 | ||||
| Percentage of average finance receivables |
18.3 | % | 14.9 | % | ||||
| Percentage of total revenue |
47.3 | % | 41.6 | % | ||||
| General & Administrative Expenses | ||||||||||||
| In thousands | 2014 | 2013 | YoY $ B(W) |
|||||||||
| Legacy branch G&A expenses |
$ | 61,759 | $ | 44,898 | $ | (16,861 | ) | |||||
| New branches’ expenses |
3,139 | 3,265 | 126 | |||||||||
|
|
|
|
|
|
|
|||||||
| Total branch G&A expenses |
64,898 | 48,163 | (16,735 | ) | ||||||||
| Marketing |
6,330 | 3,980 | (2,350 | ) | ||||||||
| Home office G&A expenses |
25,548 | 18,895 | (6,653 | ) | ||||||||
|
|
|
|
|
|
|
|||||||
| Total G&A expenses |
$ | 96,776 | $ | 71,038 | $ | (25,738 | ) | |||||
|
|
|
|
|
|
|
|||||||
Personnel. The largest component of general and administrative expenses is personnel expense, which increased $15.5 million, or 38.9%, to $55.4 million in 2014 from $39.9 million for 2013. This increase was primarily due to $4.0 million in additional costs related to the 79 branches opened in 2013 and 2014, $1.9 million to increase personnel and $1.2 million for overtime to improve collections, $0.8 million for increased operations car expense allowances, $1.2 million for increased insurance costs primarily due to the Affordable Care Act requirements, and $0.5 million for increased branch bonuses. In addition, we added approximately $2.0 million in corporate functions to handle growth and reduce outsourced providers in 2014 and recorded $1.2 million in executive separation costs. The Compensation Committee also revised our short-term incentive plan and implemented a long-term incentive plan. These changes added approximately $0.7 million in costs to 2014, and we expect about $0.5 million of incremental quarterly run rate going forward.
| Headcount | ||||||||||||
| In thousands | 2014 | 2013 | YoY Inc (Dec) |
|||||||||
| Legacy branch headcount |
1,223 | 929 | 294 | |||||||||
| New branches’ headcount |
112 | 114 | (2 | ) | ||||||||
|
|
|
|
|
|
|
|||||||
| Total branch headcount |
1,335 | 1,043 | 292 | |||||||||
| Home office headcount |
105 | 72 | 33 | |||||||||
|
|
|
|
|
|
|
|||||||
| Total headcount |
1,440 | 1,115 | 325 | |||||||||
|
|
|
|
|
|
|
|||||||
|
|
||||||||||||
| Number of branches |
300 | 264 | 36 | |||||||||
|
|
|
|
|
|
|
|||||||
66
Table of Contents
Occupancy. Occupancy expenses increased $3.8 million, or 32.6%, to $15.6 million in 2014 from $11.7 million in 2013. The increase in occupancy expenses was the result of 36 branches opened in 2014, telecommunications upgrades, and increased data processing needs. Additionally, we frequently experience increases in rent as we renew existing leases.
Marketing. Marketing expenses increased $2.4 million, or 59.0%, to $6.3 million in 2014 from $4.0 million in 2013. The increase was due to the increases in the volume of our mail campaigns, invitations to apply, and pre-qualified offers to support our 36 new branches and grow our loan portfolio.
Other Expenses. Other expenses increased $4.0 million, or 26.2%, to $19.5 million in 2014 from $15.4 million in 2013. The increase was primarily due to $1.8 million of non-operating expenses related to the implementation of a new loan management system, the addition of 36 new branches, and other legal, compliance, and human resources consulting costs associated with being a growing public company. The increase was offset by prior year non-operating expenses of $2.0 million related to director compensation and secondary offerings of shares of our common stock in September 2013 and December 2013.
Interest Expense. Interest expense on the senior revolving credit facility and other debt increased $0.8 million, or 5.7%, to $14.9 million in 2014 from $14.1 million in 2013. This increase was due primarily to the increase in the average balance of our senior revolving credit facility. The average cost of our senior revolving credit facility decreased by 0.03% from 4.51% for the year ended December 31, 2013 to 4.48% for the year ended December 31, 2014. The difference was due primarily to the mix between our LIBOR-based portion and the prime interest rate portion of the loan.
Income Taxes. Income taxes decreased $8.3 million, or 47.7%, to $9.1 million in 2014 from $17.5 million in 2013. The decrease in income taxes was due to a decrease in our net income before taxes. The effective tax rate increased 0.4% to 38.2% in 2014 from 37.8% in 2013. The slight increase in the effective tax rate was primarily due to the state mix of taxable income.
Liquidity and Capital Resources
Our primary cash needs relate to the funding of our lending activities and, to a lesser extent, capital expenditures relating to expanding and maintaining our branch locations. In connection with our plans to expand our branch network and improve our technology infrastructure in future years, we will incur approximately $3.0 million to $6.0 million of capital expenditures annually. We have historically financed, and plan to continue to finance, our short-term and long-term operating liquidity and capital needs through a combination of cash flows from operations and borrowings under our senior revolving credit facility and the amortizing loan that we closed in December 2015. We continue to seek ways to diversify our long-term funding sources, including through securitization of certain loans and other similar transactions.
As part of the $75.7 million amortizing asset-backed loan to Regional Management Receivables, LLC (“RMR”), $3.7 million of the cash received by RMR was deposited into a restricted cash reserve account to satisfy provisions of the credit agreement. As of December 31, 2015, these reserve requirements totaled $3.7 million. Additionally, the amortizing loan is supported by the expected cash flows from the underlying collateralized finance receivables. Collections on these accounts are remitted to a restricted cash collection account, which totaled $3.9 million as of December 31, 2015. On the closing date of this loan, RMR made certain representations and warranties about the quality and nature of these receivables. The credit agreement requires RMR to pay the administrative agent a release fee for the release of receivables in certain circumstances, including circumstances in which the representations and warranties made by RMR concerning the quality and characteristics of the receivables are inaccurate.
In February 2016, the Company announced that the Board has authorized the repurchase of up to $25 million of the Company’s outstanding shares of common stock. The authorization is effective immediately and extends through December 31, 2017. Stock repurchases under the program may be made in the open market at prevailing market prices, through privately negotiated transactions, or through other structures in accordance
67
Table of Contents
with applicable federal securities laws, at times and in amounts as management deems appropriate. The timing and the amount of any common stock repurchases will be determined by the Company’s management based on its evaluation of market conditions, the Company’s liquidity needs, legal and contractual requirements and restrictions (including covenants in the Company’s credit agreements), share price, and other factors. Repurchases of common stock may be made under a Rule 10b5-1 plan, which would permit common stock to be repurchased when the Company might otherwise be precluded from doing so under insider trading laws. The repurchase program does not obligate the Company to purchase any particular number of shares and may be suspended, modified, or discontinued at any time without prior notice. The Company intends to fund the program with a combination of cash and debt.
As a holding company, almost all of the funds generated from our operations are earned by our operating subsidiaries. In addition, our wholly-owned subsidiary, RMC Reinsurance Ltd., is required to maintain cash reserves against life insurance policies ceded to it, as determined by the ceding company, and has also purchased a cash-collateralized letter of credit in favor of the ceding company. As of December 31, 2015, these reserve requirements totaled $2.9 million.
Cash Flow.
Operating Activities. Net cash provided by operating activities decreased by $3.2 million, or 3.7%, to $82.4 million in 2015 from $85.7 million in 2014. The decrease was primarily the result of 67 additional branches opened during 2014 and 2015, additional corporate office employees, and an increase in consulting, legal, compliance, compensation, and other costs.
Net cash provided by operating activities increased by $13.1 million, or 18.0%, to $85.7 million in 2014 from $72.6 million in 2013. The increase was primarily due to higher net income, before provision for credit losses, due to growth in the business.
Investing Activities. Investing activities consist of finance receivables originated and purchased, net change in restricted cash, and the purchase of property and equipment for new and existing branches. Net cash used in investing activities for 2015 was $146.0 million compared to $64.6 million in 2014, a net increase of $81.5 million. The increase was primarily due to higher growth in finance receivables during 2015 versus lower growth in finance receivables in 2014.
Net cash used in investing activities for 2014 was $64.6 million compared to $142.7 million in 2013, a net decrease of $78.1 million. The decrease was primarily due to lower growth in finance receivables during 2014 versus higher growth in finance receivables in the prior year. We issued lower yielding, higher acceptance rate direct mail offers during 2013, driving convenience check growth. In addition, we constrained capital in the highly competitive automobile category in the second half of 2013 and all of 2014 and deployed a greater proportion of capital to the higher yielding branch small loan and convenience check loan categories.
Financing Activities. Financing activities consist of borrowings and payments on our outstanding indebtedness and issuance of common stock. During 2015, net cash provided by financing activities was $67.2 million, a change of $88.4 million compared to the $21.2 million net cash used in financing activities in 2014. The increase in net cash provided by financing activities was primarily a result of an increase in net advances on the senior revolving credit facility to fund higher net originations of finance receivables.
Net cash used in financing activities during 2014 was $21.2 million, a change of $92.1 million compared to the $70.9 million net cash provided by financing activities in 2013. The increase in net cash used in financing activities was primarily a result of an increase in net payments on the senior revolving credit facility due to increased cash available from repayments of finance receivables.
68
Table of Contents
Financing Arrangements.
Senior Revolving Credit Facility. We entered into the fifth amended and restated senior revolving credit facility with a syndicate of banks in September 2015. The senior revolving credit facility provides for up to $538.0 million in availability, with a borrowing base of 85% of eligible secured finance receivables and up to 70% of eligible unsecured finance receivables, in each case, subject to adjustment at certain credit quality levels (83% and 68% as of December 31, 2015, respectively), and matures in September 2018. The facility has an accordion provision that allows for the expansion of the facility to $600.0 million. Borrowings under the facility bear interest, payable monthly, at rates equal to LIBOR of a maturity we elect between one, two, three, four, and six months, with a LIBOR floor of 1.00%, plus a margin of 3.00%. Alternatively, we may pay interest at a rate based on the prime rate (which was 3.50% as of December 31, 2015) plus a margin of 2.00%. We also pay an unused line fee of 0.50% per annum, payable monthly. This fee decreases to 0.375% when the average outstanding balance exceeds $375.0 million. The senior revolving credit facility is collateralized by certain of our assets, including substantially all of our finance receivables and equity interests of the majority of our subsidiaries. The credit agreement contains certain restrictive covenants, including maintenance of specified interest coverage and debt ratios, restrictions on distributions, limitations on other indebtedness, maintenance of a minimum allowance for credit losses, and certain other restrictions.
Our outstanding debt under the senior revolving credit facility was $338.3 million at December 31, 2015, and the amount available for borrowing, but not yet advanced, was $69.4 million. At December 31, 2015, we were in compliance with our debt covenants. A year or more in advance of the September 2018 maturity date of our amended and restated senior revolving credit facility, we intend to extend its maturity date or take other appropriate action to address repayment upon maturity. See Part I, Item 1A. “Risk Factors” for a discussion of risks related to our amended and restated senior revolving credit facility, including refinancing risk.
Amortizing Loan. We entered into a credit agreement, by and among the Company, as servicer, RMR, as borrower, Wells Fargo Bank, National Association (“Wells Fargo”), as lender, account bank, collateral custodian, and backup servicer, and Wells Fargo Securities, LLC, as administrative agent for Wells Fargo and the other lenders from time to time a party thereto. The credit agreement provides for a $75.7 million amortizing loan to RMR that is secured by certain retail installment contracts and promissory notes secured by new or used automobiles, light-duty trucks, minivans, sport utility vehicles, and other passenger vehicles (excluding motorcycles) which either indirectly or directly were originated by certain of the Company’s subsidiaries.
We believe that cash flow from operations and borrowings under our senior revolving credit facility and amortizing loan will be adequate to fund the expected cost of opening or acquiring new branches, including funding initial operating losses of new branches and funding finance receivables originated by those branches and our other branches for the next twelve months and for the foreseeable future. From time to time, we have needed an increase in the borrowing limits under our senior revolving credit facility. We have successfully obtained such increases in the past; however, there can be no assurance that this additional funding will be available (or available on reasonable terms) if and when needed.
We entered into interest rate caps in April 2015 to manage interest rate risk associated with a notional $150.0 million of our LIBOR-based borrowings. The interest rate caps are based on the one-month LIBOR, reimburse us for the difference when the one-month LIBOR exceeds 2.50%, and have a maturity of April 2018.
Other Financing Arrangements. We had a $1.5 million line of credit with a commercial bank that provided end-of-day cash management flexibility and was secured by a mortgage on our headquarters. The interest rate was prime plus 0.25%, with a minimum of 5.00%, and interest was payable monthly. There were no significant restrictive covenants associated with this line of credit. The line of credit matured in January 2015 and was replaced by a $3.0 million commercial overdraft capability that assists with our cash management needs for intra-day temporary funding. We continue to seek ways to diversify our funding sources, including through securitization of certain finance receivables.
69
Table of Contents
Off-Balance Sheet Arrangements
Our wholly-owned subsidiary, RMC Reinsurance, Ltd., is required to maintain cash reserves against life insurance policies ceded to it, as determined by the ceding company. We have also purchased a cash collateralized letter of credit in favor of the ceding company. As of December 31, 2015, the reserve and letter of credit totaled $2.9 million.
Contractual Obligations
The following table summarizes our contractual obligations as of December 31, 2015, and the effect such obligations are expected to have on our liquidity and cash flows in future periods.
| Payments Due by Period | ||||||||||||||||||||
| In thousands | Total | Less than 1 Year |
1 –3 Years | 3 –5 Years | More than 5 Years |
|||||||||||||||
| Principal payments on long-term debt obligations |
$ | 411,177 | $ | 33,561 | $ | 369,903 | $ | 7,713 | $ | — | ||||||||||
| Interest payments on long-term debt obligations |
36,880 | 15,885 | 20,995 | — | — | |||||||||||||||
| Operating lease obligations |
14,172 | 5,642 | 6,512 | 2,011 | 7 | |||||||||||||||
|
|
|
|
|
|
|
|
|
|
|
|||||||||||
| $ | 462,229 | $ | 55,088 | $ | 397,410 | $ | 9,724 | $ | 7 | |||||||||||
|
|
|
|
|
|
|
|
|
|
|
|||||||||||
Impact of Inflation
Our results of operations and financial condition are presented based on historical cost, except for interest rate caps, which are carried at fair value. While it is difficult to accurately measure the impact of inflation due to the imprecise nature of the estimates required, we believe the effects of inflation, if any, on our results of operations and financial condition have been immaterial.
Critical Accounting Policies
Management’s discussion and analysis of financial condition and results of operations is based upon our consolidated financial statements, which have been prepared in accordance with accounting principles generally accepted in the United States (“GAAP”) and conform to general practices within the consumer finance industry. The preparation of these financial statements requires estimates and assumptions that affect the reported amounts of assets and liabilities, revenues and expenses, and disclosure of contingent assets and liabilities for the periods indicated in the financial statements. Management bases estimates on historical experience and other assumptions it believes to be reasonable under the circumstances and evaluates these estimates on an ongoing basis. Actual results may differ from these estimates under different assumptions or conditions.
We set forth below those material accounting policies that we believe are the most critical to an investor’s understanding of our financial results and condition and that involve a higher degree of complexity and management judgment.
Credit Losses.
Finance receivables are equal to the total amount due from the customer, net of unearned finance charges and insurance premiums and commissions. Net finance receivables are equal to the total amount due from the customer, net of unearned finance charges, insurance premiums and commissions, and the allowance for credit losses.
Provisions for credit losses are charged to income in amounts sufficient to maintain an adequate allowance for credit losses on our related finance receivable portfolio. Credit loss experience, contractual delinquency of finance receivables, the value of underlying collateral, and management’s judgment are factors used in assessing the overall adequacy of the allowance and the resulting provision for credit losses.
70
Table of Contents
Our loans within each loan product are homogenous and it is not possible to evaluate individual loans. We evaluate losses in each of the categories of loans in establishing the allowance for credit losses.
In making an evaluation about the portfolio, we consider the trend of delinquencies and other factors. We evaluate delinquencies by each state and by supervision district within states to identify trends requiring investigation. Historically, loss rates have been affected by several factors, including the general economic condition in the areas in which we conduct business, the number of customers filing for bankruptcy protection, the prices paid for vehicles at automobile auctions, and the effectiveness of our collection efforts. Management considers each of these factors in establishing the allowance for credit losses.
We consider impaired finance receivables to include accounts for which a customer has initiated a bankruptcy filing and finance receivables that have been modified under our loss mitigation policies. Finance receivables that have been modified are accounted for as troubled debt restructurings. We have adopted the policy of aggregating loans with similar risk characteristics for purposes of computing the amount of impairment. In connection with the adoption of this practice, we compute the estimated loss on our impaired loans in the aggregate by discounting the projected cash flows at the original contract rates on the loan using the terms imposed by the bankruptcy court or restructured by us. We applied this method to each of our categories of loans.
For customers in a Chapter 13 bankruptcy plan, the bankruptcy court reduces the post-petition interest rate we can charge, as it does for most creditors. Once the customer is in a confirmed Chapter 13 bankruptcy plan, we receive payments with respect to the remaining amount of the loan at the reduced interest rate from the bankruptcy trustee. If a customer fails to comply with the terms of the bankruptcy order, we will petition the trustee to have the customer dismissed from bankruptcy. Upon dismissal, we restore the account to the original terms and pursue collection through our normal loan servicing activities.
We charge off loans during the month the loan is contractually delinquent 180 days. Non-titled accounts in a confirmed Chapter 7 or Chapter 13 bankruptcy are charged off at 60 days contractually delinquent, subject to certain exceptions. Deceased borrower accounts are charged off in the month following the proper notification of passing, with the exception of borrowers with credit life insurance. We initiate repossession proceedings on certain loans when we have exhausted other means of collection and, in the opinion of management, the customer is unlikely to make further payments. We sell substantially all repossessed vehicles through public sales conducted by independent automobile auction organizations, after the required post-repossession waiting period. Losses on the sale of repossessed collateral are charged to the allowance for credit losses.
Income Recognition.
Interest income is recognized using the interest method (constant yield method). Therefore, we recognize revenue from interest at an equal rate over the term of the loan. Unearned finance charges on pre-compute contracts are rebated to customers utilizing statutory methods, which in many cases is the sum-of-the-years’ digits method. The difference between income recognized under the constant yield method and the statutory method is recognized as an adjustment to interest income at the time of rebate. Accrual of interest income on finance receivables is suspended when an account becomes 90 days delinquent on a contractual basis. The accrual of income is not resumed until one or more full contractual monthly payments are received and the account is less than 90 days contractually delinquent. Interest income is suspended on finance receivables for which collateral has been repossessed. If the account is charged off, the interest income is reversed as a reduction of interest and fee income.
We recognize income on credit life insurance using the sum-of-the-years’ digits method over the terms of the policies. We recognize income on credit accident and health insurance using the average of the sum-of-the-years’ digits and the straight-line methods over the terms of the policies. We recognize income on credit-related property and automobile insurance, and on credit involuntary unemployment insurance using the straight-line method over the terms of the policies. Rebates are computed using statutory methods, which in many cases
71
Table of Contents
match the GAAP method, and where it does not match, the difference between the GAAP method and the statutory method is recognized in income at the time of rebate.
We defer fees charged to automobile dealers and recognize income using the constant yield method for indirect loans and the straight-line method for direct loans over the lives of the respective loans.
Charges for late fees are recognized as income when collected.
Insurance Operations.
Insurance operations include revenue and expense from the sale of optional insurance products to our customers. These optional products include credit life insurance, credit accident and health insurance, property insurance, automobile insurance, and involuntary unemployment insurance.
Share-Based Compensation.
Our stock compensation plans are detailed in “Part I. Financial Statements, Note 15, Share-Based Compensation.” We measure compensation cost for share-based awards at estimated fair value and recognize compensation expense over the service period for awards expected to vest. All grants are made at 100% of fair value at the date of the grant. We use the closing stock price on the date of grant as the fair value of restricted stock and common stock awards. The fair value of stock options is determined using the Black-Scholes valuation model. The Black-Scholes model requires the input of highly subjective assumptions, including expected volatility, risk-free interest rate, and expected life, changes to which can materially affect the fair value estimate. The expected volatility is based on our historical stock price volatility beginning in 2014. Prior to 2014, we used the performance of the common stock of a publicly traded company whose business is comparable to ours to estimate the volatility of our stock due to a lack of historical data of our own stock price. The risk-free rate is based on the zero coupon U.S. Treasury bond rate for the expected term of the award on the grant date. The expected term is calculated by using the simplified method (average of the vesting and original contractual terms) due to insufficient historical data. In addition, the estimation of stock-based awards that will ultimately vest requires judgment, and to the extent actual results or updated estimates differ from current estimates, such amounts will be recorded as a cumulative adjustment in the period estimates are revised.
Income Taxes.
We file income tax returns in the U.S. federal jurisdiction and various states. We are generally no longer subject to federal, state, or local income tax examinations by taxing authorities before 2012, though we remain subject to examination in New Mexico, Tennessee, and Texas for the 2011 tax year.
When tax returns are filed, it is highly certain that some positions taken would be sustained upon examination by the taxing authorities, while others are subject to uncertainty about the merits of the position taken or the amount of the position that would be ultimately sustained. The benefit of a tax position is recognized in the financial statements in the period during which, based on all available evidence, it is more likely than not that the position will be sustained upon examination, including the resolution of appeals or litigation processes, if any. Tax positions taken are not offset or aggregated with other positions. Tax positions that meet the more-likely-than-not recognition threshold are measured as the largest amount of tax benefit that is more than 50% likely of being realized upon settlement with the applicable taxing authority. The portion of the benefits associated with tax positions taken that exceeds the amount measured as described above is reflected as a liability for unrecognized tax benefits in the accompanying balance sheet along with any associated interest and penalties that would be payable to the taxing authorities upon examination. As of December 31, 2015, we had not taken any tax position that exceeds the amount described above.
Interest and penalties associated with unrecognized tax benefits are classified as additional income taxes in the consolidated statements of income.
72
Table of Contents
Deferred tax assets and liabilities are recognized for the future tax consequences attributable to temporary differences between the financial statement carrying amounts of existing assets and liabilities and their respective tax bases. Deferred tax assets and liabilities are measured using enacted tax rates expected to apply to taxable income in the years in which those temporary differences are expected to be recovered or settled. The effects of future tax rate changes are recognized in the period when the enactment of new rates occurs.
Recently Issued Accounting Standards
In May 2014, the Financial Accounting Standards Board (“FASB”) issued an accounting update on the recognition of revenue from contracts with customers. The update is based on the principle that revenue is recognized to depict the transfer of goods or services to customers in an amount that reflects the consideration to which the entity expects to be entitled in exchange for those goods or services. In addition, the update specifies the accounting for certain costs to obtain or fulfill a contract with a customer and expands disclosure requirements for revenue recognition. The update applies to all contracts with customers except leases, insurance contracts, financial instruments, guarantees, and certain nonmonetary exchanges. In August 2015, the FASB issued an additional update on revenue recognition, which defers the effective date of the update to annual and interim reporting periods beginning after December 15, 2017. The Company is currently evaluating the potential impact of this guidance on the consolidated financial statements.
In August 2014, the FASB issued an accounting update on management’s responsibility to evaluate whether there is substantial doubt about an entity’s ability to continue as a going concern and to provide related footnote disclosures. The update is effective for the annual period ending after December 15, 2016, and for annual periods and interim periods thereafter. Early application is permitted. The update is not expected to have a material impact on the Company’s consolidated financial statements.
In February 2015, the FASB issued an accounting update that amends the analysis a reporting entity must perform to determine whether it should consolidate certain legal entities. Reporting entities are required to re-evaluate limited partnerships or similar entities for consolidation and revise their documentation. The update is effective for annual and interim periods beginning after December 15, 2015. The update is not expected to have a material impact on the Company’s consolidated financial statements.
In April 2015, the FASB issued an accounting update to simplify the presentation of debt issuance costs. The update requires that debt issuance costs related to a recognized debt liability be presented in the balance sheet as a direct deduction from the carrying amount of that debt liability, consistent with a debt discount. The recognition and measurement guidance for debt issuance costs are not affected by the update. The update is effective for annual and interim periods beginning after December 15, 2015. An entity should apply the new guidance on a retrospective basis, wherein the balance sheet of each individual period presented should be adjusted to reflect the period-specific effects of applying the new guidance. In August 2015, the FASB issued an additional accounting update on certain debt issue costs, which clarifies that debt issue costs associated with line-of-credit agreements may be classified as an asset or as a direct deduction to the carrying amount of the debt. The costs should continue to be deferred and amortized over the term of the line-of-credit. As a result of these accounting updates, debt issue costs will be reclassified from other assets to long-term debt.
73
Table of Contents
ITEM 7A. QUANTITATIVE AND QUALITATIVE DISCLOSURES ABOUT MARKET RISK.
Interest Rate Risk
Interest rate risk arises from the possibility that changes in interest rates will affect our results of operations and financial condition. We originate finance receivables at either prevailing market rates or at statutory limits. Our loan products are structured on a fixed rate, fixed term basis. Accordingly, subject to statutory limits, our ability to react to changes in prevailing market rates is dependent upon the speed at which our customers pay off or renew loans in our existing loan portfolio, which allows us to originate new loans at prevailing market rates. Our loan portfolio turns over approximately 1.5 times per year from cash payments, renewals, and charge-offs of loans. Because our automobile loans have longer maturities and typically are not refinanced prior to maturity, the rate of turnover of the loan portfolio may change as these loans change as a percentage of our portfolio.
We also are exposed to changes in interest rates as a result of our borrowing activities, which include a senior revolving credit facility with a group of banks used to maintain liquidity and fund the Company’s business operations. The nature and amount of our debt may vary as a result of future business requirements, market conditions, and other factors. At December 31, 2015, our outstanding debt under our senior revolving credit facility was $338.3 million and interest on borrowings under this facility was approximately 4.42% for the year ended December 31, 2015, including amortization of debt issuance costs and an unused line fee. Because the LIBOR interest rates are currently below the 1.00% floor provided for in our senior revolving credit facility, an increase of 100 basis points in the LIBOR interest rate would result in an increase of less than 100 basis points to our borrowing costs. Based on a LIBOR rate of 50 basis points and the outstanding balance at December 31, 2015, an increase of 100 basis points in the LIBOR would result in an increase of 50 basis points to our borrowing costs and would result in $1.7 million of increased interest expense on an annual basis.
We entered into interest rate caps in April 2015 to manage interest rate risk associated with a notional $150.0 million of our LIBOR-based borrowings. The interest rate caps are based on the one-month LIBOR, reimburse us for the difference when the one-month LIBOR exceeds 2.50%, and have a maturity of April 2018.
74
Table of Contents
| ITEM 8. | FINANCIAL STATEMENTS AND SUPPLEMENTARY DATA. |
REGIONAL MANAGEMENT CORP.
INDEX TO CONSOLIDATED FINANCIAL STATEMENTS
Fiscal Year Ended December 31, 2015
| Page | ||||
| 76 | ||||
| Consolidated Balance Sheets at December 31, 2015 and December 31, 2014 |
77 | |||
| 78 | ||||
| 79 | ||||
| 80 | ||||
| 81 | ||||
75
Table of Contents
Report of Independent Registered Public Accounting Firm
To the Board of Directors and Stockholders
Regional Management Corp. and Subsidiaries
We have audited the accompanying consolidated balance sheets of Regional Management Corp. and Subsidiaries as of December 31, 2015 and 2014, and the related consolidated statements of income, stockholders’ equity, and cash flows for each of the three years in the period ended December 31, 2015. These financial statements are the responsibility of the Company’s management. Our responsibility is to express an opinion on these financial statements based on our audits.
We conducted our audits in accordance with the standards of the Public Company Accounting Oversight Board (United States). Those standards require that we plan and perform the audit to obtain reasonable assurance about whether the financial statements are free of material misstatement. The Company is not required to have, nor were we engaged to perform, an audit of its internal control over financial reporting. Our audits included consideration of internal control over financial reporting as a basis for designing audit procedures that are appropriate in the circumstances, but not for the purpose of expressing an opinion on the effectiveness of the Company’s internal control over financial reporting. Accordingly, we express no such opinion. An audit also includes examining, on a test basis, evidence supporting the amounts and disclosures in the financial statements, assessing the accounting principles used and significant estimates made by management, as well as evaluating the overall financial statement presentation. We believe that our audits provide a reasonable basis for our opinion.
In our opinion, the consolidated financial statements referred to above present fairly, in all material respects, the financial position of Regional Management Corp. and Subsidiaries as of December 31, 2015 and 2014, and the results of their operations and their cash flows for each of the three years in the period ended December 31, 2015, in conformity with U.S. generally accepted accounting principles.
/s/ RSM US LLP
Raleigh, North Carolina
February 23, 2016
76
Table of Contents
Regional Management Corp. and Subsidiaries
Consolidated Balance Sheets
December 31, 2015 and 2014
(in thousands, except par value amounts)
| 2015 | 2014 | |||||||
| Assets |
||||||||
| Cash (includes VIE balances of $376 in 2015) |
$ | 7,654 | $ | 4,012 | ||||
| Gross finance receivables |
785,042 | 663,432 | ||||||
| Less unearned finance charges, insurance premiums, and commissions |
(156,598 | ) | (117,240 | ) | ||||
|
|
|
|
|
|||||
| Finance receivables (includes VIE balances of $80,309 in 2015) |
628,444 | 546,192 | ||||||
| Allowance for credit losses (includes VIE balances of $(2,588) in 2015) |
(37,452 | ) | (40,511 | ) | ||||
|
|
|
|
|
|||||
| Net finance receivables |
590,992 | 505,681 | ||||||
| Restricted cash (includes VIE balances of $7,605 in 2015) |
10,506 | 1,901 | ||||||
| Property and equipment, net of accumulated depreciation |
10,441 | 8,905 | ||||||
| Deferred tax asset, net |
1,982 | 1,870 | ||||||
| Goodwill |
716 | 716 | ||||||
| Intangible assets, net |
473 | 847 | ||||||
| Repossessed assets at net realizable value (includes VIE balances of $36 in 2015) |
307 | 556 | ||||||
| Other assets (includes VIE balances of $1,670 in 2015) |
5,994 | 5,782 | ||||||
|
|
|
|
|
|||||
| Total assets |
$ | 629,065 | $ | 530,270 | ||||
|
|
|
|
|
|||||
| Liabilities and Stockholders’ Equity |
||||||||
| Liabilities: |
||||||||
| Long-term debt (includes VIE balances of $72,896 in 2015) |
$ | 411,177 | $ | 341,419 | ||||
| Accounts payable and accrued expenses (includes VIE balances of $50 in 2015) |
12,661 | 10,528 | ||||||
|
|
|
|
|
|||||
| Total liabilities |
423,838 | 351,947 | ||||||
| Commitments and Contingencies |
||||||||
| Stockholders’ equity: |
||||||||
| Preferred stock, $0.10 par value, 100,000 shares authorized, no shares issued or outstanding |
— | — | ||||||
| Common stock, $0.10 par value, 1,000,000 shares authorized, 12,914 and 12,748 shares issued and outstanding at December 31, 2015 and 2014, respectively |
1,291 | 1,275 | ||||||
| Additional paid-in-capital |
89,178 | 85,655 | ||||||
| Retained earnings |
114,758 | 91,393 | ||||||
|
|
|
|
|
|||||
| Total stockholders’ equity |
205,227 | 178,323 | ||||||
|
|
|
|
|
|||||
| Total liabilities and stockholders’ equity |
$ | 629,065 | $ | 530,270 | ||||
|
|
|
|
|
|||||
See accompanying notes to consolidated financial statements.
77
Table of Contents
Regional Management Corp. and Subsidiaries
Consolidated Statements of Income
Years Ended December 31, 2015, 2014, and 2013
(in thousands, except per share amounts)
| 2015 | 2014 | 2013 | ||||||||||
| Revenue |
||||||||||||
| Interest and fee income |
$ | 195,794 | $ | 184,797 | $ | 152,343 | ||||||
| Insurance income, net |
11,654 | 10,673 | 11,470 | |||||||||
| Other income |
9,858 | 9,249 | 6,816 | |||||||||
|
|
|
|
|
|
|
|||||||
| Total revenue |
217,306 | 204,719 | 170,629 | |||||||||
|
|
|
|
|
|
|
|||||||
| Expenses |
||||||||||||
| Provision for credit losses |
47,348 | 69,057 | 39,192 | |||||||||
| Personnel |
69,247 | 55,383 | 39,868 | |||||||||
| Occupancy |
17,775 | 15,575 | 11,748 | |||||||||
| Marketing |
7,017 | 6,330 | 3,980 | |||||||||
| Other |
21,559 | 19,488 | 15,443 | |||||||||
|
|
|
|
|
|
|
|||||||
| Total general and administrative expenses |
115,598 | 96,776 | 71,039 | |||||||||
| Interest expense |
16,221 | 14,947 | 14,144 | |||||||||
|
|
|
|
|
|
|
|||||||
| Income before income taxes |
38,139 | 23,939 | 46,254 | |||||||||
| Income taxes |
14,774 | 9,137 | 17,460 | |||||||||
|
|
|
|
|
|
|
|||||||
| Net income |
$ | 23,365 | $ | 14,802 | $ | 28,794 | ||||||
|
|
|
|
|
|
|
|||||||
| Net income per common share: |
||||||||||||
| Basic |
$ | 1.82 | $ | 1.17 | $ | 2.29 | ||||||
|
|
|
|
|
|
|
|||||||
| Diluted |
$ | 1.79 | $ | 1.14 | $ | 2.23 | ||||||
|
|
|
|
|
|
|
|||||||
| Weighted-average common shares outstanding: |
||||||||||||
| Basic |
12,849 | 12,701 | 12,572 | |||||||||
|
|
|
|
|
|
|
|||||||
| Diluted |
13,074 | 12,951 | 12,894 | |||||||||
|
|
|
|
|
|
|
|||||||
See accompanying notes to consolidated financial statements.
78
Table of Contents
Regional Management Corp. and Subsidiaries
Consolidated Statements of Stockholders’ Equity
Years Ended December 31, 2015, 2014, and 2013
(in thousands)
| Common Stock | Additional Paid-in-Capital |
Retained Earnings |
Total | |||||||||||||||||
| Shares | Amount | |||||||||||||||||||
| Balance, December 31, 2012 |
12,487 | $ | 1,249 | $ | 80,158 | $ | 47,797 | $ | 129,204 | |||||||||||
| Issuance of stock awards |
25 | 2 | (2 | ) | — | — | ||||||||||||||
| Proceeds from exercise of stock options |
140 | 14 | 859 | — | 873 | |||||||||||||||
| Excess tax benefit from exercise of stock options |
— | — | 731 | — | 731 | |||||||||||||||
| Share-based compensation |
— | — | 1,571 | — | 1,571 | |||||||||||||||
| Net income |
— | — | — | 28,794 | 28,794 | |||||||||||||||
|
|
|
|
|
|
|
|
|
|
|
|||||||||||
| Balance, December 31, 2013 |
12,652 | 1,265 | 83,317 | 76,591 | 161,173 | |||||||||||||||
|
|
|
|
|
|
|
|
|
|
|
|||||||||||
| Issuance of restricted stock awards |
73 | 7 | (7 | ) | — | — | ||||||||||||||
| Exercise of stock options |
46 | 5 | 118 | — | 123 | |||||||||||||||
| Excess tax benefit from exercise of stock options |
— | — | 161 | — | 161 | |||||||||||||||
| Shares withheld related to net share settlement |
(23 | ) | (2 | ) | (194 | ) | — | (196 | ) | |||||||||||
| Share-based compensation |
— | — | 2,260 | — | 2,260 | |||||||||||||||
| Net income |
— | — | — | 14,802 | 14,802 | |||||||||||||||
|
|
|
|
|
|
|
|
|
|
|
|||||||||||
| Balance, December 31, 2014 |
12,748 | 1,275 | 85,655 | 91,393 | 178,323 | |||||||||||||||
|
|
|
|
|
|
|
|
|
|
|
|||||||||||
| Issuance of restricted stock awards, net of forfeiture |
108 | 11 | (11 | ) | — | — | ||||||||||||||
| Exercise of stock options |
145 | 14 | — | — | 14 | |||||||||||||||
| Excess tax benefit from exercise of stock options |
— | — | 378 | — | 378 | |||||||||||||||
| Shares withheld related to net share settlement |
(87 | ) | (9 | ) | (534 | ) | — | (543 | ) | |||||||||||
| Share-based compensation |
— | — | 3,690 | — | 3,690 | |||||||||||||||
| Net income |
— | — | — | 23,365 | 23,365 | |||||||||||||||
|
|
|
|
|
|
|
|
|
|
|
|||||||||||
| Balance, December 31, 2015 |
12,914 | $ | 1,291 | $ | 89,178 | $ | 114,758 | $ | 205,227 | |||||||||||
|
|
|
|
|
|
|
|
|
|
|
|||||||||||
See accompanying notes to consolidated financial statements.
79
Table of Contents
Regional Management Corp. and Subsidiaries
Consolidated Statements of Cash Flows
Years Ended December 31, 2015, 2014, and 2013
(in thousands)
| 2015 | 2014 | 2013 | ||||||||||
| Cash flows from operating activities: |
||||||||||||
| Net income |
$ | 23,365 | $ | 14,802 | $ | 28,794 | ||||||
| Adjustments to reconcile net income to net cash provided by operating activities: |
||||||||||||
| Provision for credit losses |
47,348 | 69,057 | 39,192 | |||||||||
| Depreciation and amortization |
3,774 | 3,790 | 3,459 | |||||||||
| Loss on disposal of property and equipment |
343 | 21 | 11 | |||||||||
| Accretion of discounts on purchased receivables |
(27 | ) | (85 | ) | (434 | ) | ||||||
| Share-based compensation |
3,638 | 2,312 | 1,571 | |||||||||
| Fair value adjustment on interest rate caps |
457 | — | 1 | |||||||||
| Deferred income taxes, net |
(122 | ) | (4,523 | ) | (3,294 | ) | ||||||
| Changes in operating assets and liabilities: |
||||||||||||
| (Increase) decrease in other assets |
1,338 | (2,687 | ) | 2,977 | ||||||||
| Increase in other liabilities |
2,329 | 2,966 | 324 | |||||||||
|
|
|
|
|
|
|
|||||||
| Net cash provided by operating activities |
82,443 | 85,653 | 72,601 | |||||||||
|
|
|
|
|
|
|
|||||||
| Cash flows from investing activities: |
||||||||||||
| Net origination of finance receivables |
(132,632 | ) | (59,962 | ) | (137,031 | ) | ||||||
| Increase in restricted cash |
(8,605 | ) | — | (562 | ) | |||||||
| Purchase of property and equipment |
(4,790 | ) | (4,463 | ) | (4,163 | ) | ||||||
| Payment for business combination, net of cash |
— | (128 | ) | (575 | ) | |||||||
| Purchase of finance receivables |
— | — | (357 | ) | ||||||||
|
|
|
|
|
|
|
|||||||
| Net cash used in investing activities |
(146,027 | ) | (64,553 | ) | (142,688 | ) | ||||||
|
|
|
|
|
|
|
|||||||
| Cash flows from financing activities: |
||||||||||||
| Net proceeds from amortizing loan |
72,896 | — | — | |||||||||
| Net advances (payments) on senior revolving credit facility |
(3,138 | ) | (21,331 | ) | 70,371 | |||||||
| Payments for debt issuance costs |
(2,237 | ) | (164 | ) | (1,065 | ) | ||||||
| Taxes paid related to net share settlement of equity awards |
(721 | ) | — | — | ||||||||
| Excess tax benefits from exercise of stock options |
426 | 167 | 731 | |||||||||
| Proceeds from exercise of stock options |
— | 119 | 873 | |||||||||
|
|
|
|
|
|
|
|||||||
| Net cash provided by (used in) financing activities |
67,226 | (21,209 | ) | 70,910 | ||||||||
|
|
|
|
|
|
|
|||||||
| Net change in cash |
3,642 | (109 | ) | 823 | ||||||||
| Cash at beginning of period |
4,012 | 4,121 | 3,298 | |||||||||
|
|
|
|
|
|
|
|||||||
| Cash at end of period |
$ | 7,654 | $ | 4,012 | $ | 4,121 | ||||||
|
|
|
|
|
|
|
|||||||
| Supplemental cash flow information |
||||||||||||
| Interest paid |
$ | 15,385 | $ | 14,367 | $ | 13,468 | ||||||
|
|
|
|
|
|
|
|||||||
| Income taxes paid |
$ | 12,449 | $ | 15,237 | $ | 16,205 | ||||||
|
|
|
|
|
|
|
|||||||
See accompanying notes to consolidated financial statements.
80
Table of Contents
Regional Management Corp. and Subsidiaries
Notes to Consolidated Financial Statements
Note 1. Nature of Business and Significant Accounting Policies
Nature of business: Regional Management Corp. (the “Company”) was incorporated and began operations in 1987. The Company is engaged in the consumer finance business, offering small loans (branch small loans and convenience checks), large loans, automobile loans, retail loans, and related credit insurance. As of December 31, 2015, the Company operated offices in 331 locations in the states of Alabama (50 offices), Georgia (7 offices), New Mexico (18 offices), North Carolina (36 offices), Oklahoma (28 offices), South Carolina (72 offices), Tennessee (21 offices), Texas (98 offices), and Virginia (1 office) under the names Regional Finance, RMC Financial Services, Anchor Finance, and RMC Retail. The process of re-branding all branches to operate under the name of Regional Finance began in 2015 and will be completed in 2016. The Company opened or acquired 31, 36, and 43 new offices during the years ended December 31, 2015, 2014, and 2013, respectively.
The Company’s loan volume and the contractual delinquency of the Company’s finance receivable portfolio follow seasonal trends. Demand for the Company’s loans is typically highest during the third and fourth quarters, which the Company believes is largely due to customers borrowing money for back-to-school and holiday spending. With the exception of automobile loans, loan demand has generally been the lowest during the first quarter, which the Company believes is largely due to the timing of income tax refunds. During the remainder of the year, the Company typically experiences loan growth from general operations. In addition, the Company typically generates higher loan volumes in the second half of the year from direct mail campaigns, which are timed to coincide with seasonal consumer demand. Also, delinquencies have generally been lower in the first half of the year than during the second half of the year. Consequently, the Company experiences significant seasonal fluctuations in its operating results and cash needs.
Significant accounting policies: The following is a description of significant accounting policies used in preparing the financial statements. The accounting and reporting policies of the Company are in accordance with GAAP and conform to general practices within the consumer finance industry.
Business segments: The Company has one reportable segment, which is the consumer finance segment. The other revenue generating activities of the Company, including insurance operations, are performed in the existing branch network in conjunction with or as a complement to the lending operations.
Principles of consolidation: The consolidated financial statements include the accounts of the Company and its wholly-owned subsidiaries. All significant intercompany balances and transactions have been eliminated in consolidation. The Company operates through a separate wholly-owned subsidiary in each state. The Company also consolidates variable interest entities (“VIE”) when it is considered to be the primary beneficiary of the VIE because it has (i) power over the significant activities of the VIE and (ii) the obligation to absorb losses or the right to receive returns that could be significant to the VIE.
Variable interest entity: The Company has an asset-backed amortizing loan for general funding purposes, and this transaction involved selling a pool of the Company’s automobile loans to its wholly-owned subsidiary, Regional Management Receivables, LLC (“RMR”), as collateral for the loan. RMR has the limited purpose of acquiring finance receivables and holding and making payments on the related debt. Assets transferred to RMR are legally isolated from the Company and the claims of the Company’s other creditors. The Company continues to service the finance receivables transferred to RMR. The lender in the debt issued by RMR generally only has recourse to the assets of RMR and does not have recourse to the general credit of the Company.
The Company’s asset-backed loan under this arrangement is structured to provide enhancements to the lender in the form of overcollateralization (principal balance of the collateral exceeds the balance of the debt) and reserve funds (restricted cash accounts held by RMR). These enhancements, along with the isolated finance receivables
81
Table of Contents
pool, increase the creditworthiness of RMR above that of the Company as a whole. This increases the marketability of the Company’s collateral for borrowing purposes, which leads to more favorable borrowing terms, improved rate risk management, and additional flexibility to grow the business.
RMR is considered a VIE under GAAP and is consolidated into the financial statements of RMR’s primary beneficiary. The Company is considered to be the primary beneficiary of RMR because it has (i) power over the significant activities of RMR through its role as servicer of the finance receivables under the credit agreement and (ii) the obligation to absorb losses or the right to receive returns that could be significant through the Company’s interest in the monthly residual cash flows of RMR after the debt is paid.
Consolidation of RMR results in the transaction being accounted for as a secured borrowing; therefore, the pooled receivables and the related debt remain on the consolidated balance sheet of the Company. The debt is secured solely by the assets of RMR and not by any other assets of the Company. The assets of RMR are the only source of funds for repayment on the debt. Restricted cash accounts held by RMR can only be used to support payments on the debt. The Company recognizes revenue and provision for credit losses on RMR’s finance receivables and interest expense on the related secured debt. See Note 9 of these Notes to Consolidated Financial Statements for further information regarding the accounting treatment of the VIE.
Use of estimates: The preparation of financial statements requires management to make estimates and assumptions that affect the reported amounts of assets and liabilities, revenues and expenses, and disclosure of contingent assets and liabilities for the periods indicated in the financial statements. Actual results could differ from those estimates.
Material estimates that are particularly susceptible to change relate to the determination of the allowance for credit losses, fair value of share-based compensation, the valuation of deferred tax assets and liabilities, and the allocation of the purchase price to assets acquired in business combinations.
Reclassifications: Certain prior period amounts have been reclassified to conform to the current presentation. Such reclassifications had no impact on previously reported net income or stockholders’ equity.
Statement of cash flows: Cash flows from finance receivables and the Company’s long-term debt are reported on a net basis.
Finance receivables: The Company’s small loan portfolio is comprised of branch small loan receivables and convenience check receivables. Branch small loan receivables are direct loans to customers closed in the branch and are secured by non-essential household goods and, in some instances, an automobile. Convenience checks are direct loans originated by mailing checks to customers based on a pre-screening process that includes a review of the prospective customer’s credit profile provided by national credit reporting bureaus or data aggregators. A recipient of a convenience check is able to enter into a loan by endorsing and depositing the check. Large loan receivables are direct loans to customers and are typically secured by automobiles, other vehicles, and non-essential household goods. Automobile loan receivables consist of direct automobile purchase loans, which are originated at the dealership and closed in one of the Company’s branches, and indirect automobile purchase loans, which are originated and closed at a dealership in the Company’s network without the need for the customer to visit one of the Company’s branches. In each case, these automobile loans are collateralized primarily by used and new automobiles and, in the case of indirect loans, are initiated by and purchased from automobile dealerships, subject to the Company’s credit approval. Retail loan receivables consist principally of retail installment sales contracts collateralized by the purchase of furniture, appliances, and other retail items, and are initiated by and purchased from retailers, subject to the Company’s credit approval.
Credit losses: Provisions for credit losses are charged to income as losses are estimated to have occurred and in amounts sufficient to maintain an allowance for credit losses at an adequate level to provide for losses on the finance receivables. In the past, the Company charged credit losses against the allowance when management
82
Table of Contents
believed the finance receivable was no longer collectible (discretionary element) or when the account was 365 days contractually delinquent (time-based element). The factors used to determine whether a finance receivable is uncollectible were the age of the account, supervisory review of collection efforts, and other factors such as customers relocating to an area where collection is not practical. In September 2014, the Company changed the time-based element of the charge-off policy from 365 days contractually delinquent to 180 days. In December 2014, the Company eliminated the discretionary element of the charge-off policy, subject to certain exceptions. The Company’s policy for non-titled accounts in a confirmed bankruptcy is to charge them off at 60 days contractually delinquent, subject to certain exceptions. Deceased borrower accounts are charged off in the month following the proper notification of passing, with the exception of borrowers with credit life insurance. The updated policy improves consistency and creates better alignment with industry practice. Subsequent recoveries, if any, are credited to the allowance. Loss experience, effective loan life, contractual delinquency of finance receivables by loan type, the value of underlying collateral, and management’s judgment are factors used in assessing the overall adequacy of the allowance and the resulting provision for credit losses. While management uses the best information available to make its evaluation, future adjustments to the allowance may be necessary if there are significant changes in economic conditions or portfolio performance. This evaluation is inherently subjective as it requires estimates that are susceptible to significant revisions as more information becomes available.
The Company initiates repossession proceedings when, in the opinion of management, the customer is unlikely to make further payments. The Company sells substantially all repossessed vehicle inventory through public sales conducted by independent automobile auction organizations after the required post-repossession waiting period. Losses on the sale of repossessed collateral are charged to the allowance for credit losses.
The allowance for credit losses consists of general and specific components. The general component of the allowance estimates credit losses for groups of finance receivables on a collective basis and is based on historic loss rates. The Company’s general component of the allowance for credit losses relates to probable incurred losses of unimpaired finance receivables. The historical loss rate for the most recent six months (branch small loans and convenience checks), ten months (retail loans), and twelve months (large loans and automobile loans) as a percentage of average finance receivables is used to estimate the general allowance.
The Company adjusts the computed historical loss percentages as described above for qualitative factors based on an assessment of internal and external influences on credit quality that are not fully reflected in the historical loss data. Those qualitative factors include trends in growth in the loan portfolio, delinquency, unemployment, bankruptcy, and other economic trends.
Impaired finance receivables: The specific component of the allowance for credit losses relates to impaired finance receivables, which include accounts for which a customer has initiated a bankruptcy filing and finance receivables that have been modified under Company loss mitigation policies. Finance receivables that have been modified are accounted for as troubled debt restructurings. At the time of the bankruptcy filing or restructuring in the case of a loss mitigation policy, a specific valuation allowance is established for such finance receivables within the allowance for credit losses. The Company computes the estimated loss on its impaired loans by discounting the projected cash flows at the original contract rates on the loan using the terms imposed by the bankruptcy court or restructured by the Company. This method is applied in the aggregate to each of the Company’s five classes of loans. In making the computations of the present value of cash payments to be received on impaired accounts in each product category, the Company uses the weighted-average interest rates and weighted-average remaining term based on data as of each balance sheet date.
For customers in a confirmed Chapter 13 bankruptcy plan, the Company reduces the interest rate to that specified in the bankruptcy order and the Company receives payments with respect to the remaining amount of the loan from the bankruptcy trustee. For customers who recently filed for Chapter 13 bankruptcy, the Company generally does not receive any payments until their bankruptcy plan is confirmed by the court. If the customers have made payments to the trustee in advance of plan confirmation, the Company may receive a lump sum payment from
83
Table of Contents
the trustee once the plan is confirmed. This lump sum payment represents the Company’s pro-rata share of the amount paid by the customer. If a customer fails to comply with the terms of the bankruptcy order, the Company will petition the trustee to have the customer dismissed from bankruptcy. Upon dismissal, the Company restores the account to the original terms and pursues collection through its normal loan servicing activities.
If a customer files for bankruptcy under Chapter 7 of the bankruptcy code, the bankruptcy court has the authority to cancel the customer’s debt. If a vehicle secures a Chapter 7 bankruptcy account, the customer has the option of buying the vehicle at fair value or reaffirming the loan and continuing to pay the loan.
Prior to the charge-off policy change in September 2014, the specific component of the allowance for credit losses included a full valuation allowance for finance receivables that were contractually delinquent 180 days and over. The charge-offs from the policy change were charged against this allowance as of September 2014.
Delinquency: The Company determines past due status using the contractual terms of the finance receivable. This is one of the primary credit quality indicators used to evaluate the allowance for credit losses for each class of finance receivables.
Repossessed assets: Repossessed collateral is valued at the lower of the receivable balance on the finance receivable prior to repossession or the estimated net realizable value. Management estimates net realizable value at the projected cash value upon liquidation, less costs to sell the related collateral.
Property and equipment: The Company owns certain of its headquarters buildings and leases certain of its headquarters buildings. Office buildings owned are depreciated on the straight-line method for financial reporting purposes over their estimated useful lives of thirty-nine years. Branch offices are leased under non-cancellable leases of one to five years with renewal options. Leasehold improvements are depreciated over the shorter of their useful lives or the remaining term of the lease. Furniture and equipment are depreciated on the straight-line method over their estimated useful lives, generally three to five years. Maintenance and repairs are charged to expense as incurred.
Restricted cash: Restricted cash includes cash and cash equivalents for which the Company’s ability to withdrawal funds is contractually limited. The Company’s restricted cash consists of cash reserves that are maintained as collateral for a letter of credit used to secure potential credit life insurance claims and cash restricted for debt servicing of our amortizing loan.
Derivative instruments: The Company holds derivative instruments in the form of interest rate caps for the purpose of hedging a portion of its exposure to interest rate risk. Derivative instruments are recorded at fair value and included in other assets with their resulting gains or losses recognized in interest expense. Changes in fair value are reported as an adjustment to net income in computing cash flows from operating activities.
Income recognition: Interest income is recognized using the interest method, also known as the constant yield method. Therefore, the Company recognizes revenue from interest at an equal rate over the term of the loan. Unearned finance charges on pre-compute contracts are rebated to customers utilizing statutory methods, which in many cases is the sum-of-the-years’ digits method. The difference between income recognized under the constant yield method and the statutory method is recognized as an adjustment to interest income at the time of rebate. Accrual of interest income on finance receivables is suspended when no payment has been received for 90 days or more on a contractual basis. The accrual of income is not resumed until one or more full contractual monthly payments are received and the finance receivable is less than 90 days contractually delinquent. Interest income is suspended on finance receivables for which collateral has been repossessed. Payments received on loans in nonaccrual status are first applied to interest, then to any late charges or other fees, with any remaining amount applied to principal.
84
Table of Contents
The Company recognizes income on credit life insurance using the sum-of-the-years’ digits method over the terms of the policies. The Company recognizes income on credit accident and health insurance using the average of the sum-of-the-years’ digits and the straight-line methods over the terms of the policies. The Company recognizes income on credit-related property and automobile insurance and on credit involuntary unemployment insurance using the straight-line method over the terms of the policies. Rebates are computed using statutory methods, which in many cases is the sum-of-the-years-digits method, and any difference between the GAAP method and the statutory method is recognized in income at the time of rebate.
The Company defers fees charged to automobile dealers and recognizes income using the constant yield method for indirect loans and the straight-line method for direct loans over the lives of the respective loans.
Charges for late fees are recognized as income when collected.
Finance receivable origination fees and costs: Non-refundable fees received and direct costs incurred for the origination of finance receivables are deferred and recognized to interest income over their contractual lives using the constant yield method. Unamortized amounts are recognized in income at the time that finance receivables are paid in full.
Share-based compensation: The Company has a share-based compensation plan and also has share-based awards outstanding under two predecessor share-based compensation plans. The stock option and other equity-based awards are recognized at the grant date fair value. Awards classified as liabilities are re-measured at fair value for each reporting period. The costs are recognized on the income statement over the service period for awards expected to vest. All awards are granted at 100% of the fair value on the date of the grant. The fair value of stock options is determined using the Black-Scholes valuation model. The Black-Scholes model requires the input of highly subjective assumptions, including expected volatility, risk-free interest rate, and expected life, changes to which can materially affect the fair value estimate. In addition, the estimation of share-based awards that will ultimately vest requires judgment, and to the extent actual results or updated estimates differ from current estimates, such amounts will be recorded as a cumulative adjustment in the period estimates are revised. Prior to the initial public offering, there was no published market value for the Company’s stock; therefore, the performance of the common stock of a publicly traded company whose business is comparable to the Company was used to estimate the volatility of the Company’s stock. In 2014, the Company began using the value of its own stock to estimate volatility for options granted.
Marketing costs: Marketing costs are expensed as incurred.
Income taxes: The Company files income tax returns in the U.S. federal jurisdiction and various states. The Company is generally no longer subject to federal, state, or local income tax examinations by taxing authorities before 2012, though the Company remains subject to examination in New Mexico, Tennessee, and Texas for the 2011 tax year.
When tax returns are filed, it is highly certain that some positions taken would be sustained upon examination by the taxing authorities, while others are subject to uncertainty about the merits of the position taken or the amount of the position that would be ultimately sustained. The benefit of a tax position is recognized in the financial statements in the period during which, based on all available evidence, it is more likely than not that the position will be sustained upon examination, including the resolution of appeals or litigation processes, if any. Tax positions taken are not offset or aggregated with other positions. Tax positions that meet the more-likely-than-not recognition threshold are measured as the largest amount of tax benefit that is more than 50% likely of being realized upon settlement with the applicable taxing authority. The portion of the benefits associated with tax positions taken that exceeds the amount measured as described above is reflected as a liability for unrecognized tax benefits in the accompanying balance sheet along with any associated interest and penalties that would be payable to the taxing authorities upon examination.
85
Table of Contents
Interest and penalties associated with unrecognized tax benefits are classified as additional income taxes in the consolidated statements of income.
Deferred tax assets and liabilities are recognized for the future tax consequences attributable to temporary differences between the financial statement carrying amounts of existing assets and liabilities and their respective tax bases. Deferred tax assets and liabilities are measured using enacted tax rates expected to apply to taxable income in the years in which those temporary differences are expected to be recovered or settled. The effects of future tax rate changes are recognized in the period when the enactment of new rates occurs.
Earnings per share: Earnings per share have been computed based on the weighted-average number of common shares outstanding during each reporting period presented. Common shares issuable upon the exercise of share-based compensation, which are computed using the treasury stock method, are included in the computation of diluted earnings per share.
Recent Accounting Pronouncements:
In May 2014, the Financial Accounting Standards Board (“FASB”) issued an accounting update on the recognition of revenue from contracts with customers. The update is based on the principle that revenue is recognized to depict the transfer of goods or services to customers in an amount that reflects the consideration to which the entity expects to be entitled in exchange for those goods or services. In addition, the update specifies the accounting for certain costs to obtain or fulfill a contract with a customer and expands disclosure requirements for revenue recognition. The update applies to all contracts with customers except leases, insurance contracts, financial instruments, guarantees, and certain nonmonetary exchanges. In August 2015, the FASB issued an additional update on revenue recognition, which defers the effective date of the update to annual and interim reporting periods beginning after December 15, 2017. The Company is currently evaluating the potential impact of this guidance on the consolidated financial statements.
In August 2014, the FASB issued an accounting update on management’s responsibility to evaluate whether there is substantial doubt about an entity’s ability to continue as a going concern and to provide related footnote disclosures. The update is effective for the annual period ending after December 15, 2016, and for annual periods and interim periods thereafter. Early application is permitted. The update is not expected to have a material impact on the Company’s consolidated financial statements.
In February 2015, the FASB issued an accounting update that amends the analysis a reporting entity must perform to determine whether it should consolidate certain legal entities. Reporting entities are required to re-evaluate limited partnerships or similar entities for consolidation and revise their documentation. The update is effective for annual and interim periods beginning after December 15, 2015. The update is not expected to have a material impact on the Company’s consolidated financial statements.
In April 2015, the FASB issued an accounting update to simplify the presentation of debt issuance costs. The update requires that debt issuance costs related to a recognized debt liability be presented in the balance sheet as a direct deduction from the carrying amount of that debt liability, consistent with a debt discount. The recognition and measurement guidance for debt issuance costs are not affected by the update. The update is effective for annual and interim periods beginning after December 15, 2015. An entity should apply the new guidance on a retrospective basis, wherein the balance sheet of each individual period presented should be adjusted to reflect the period-specific effects of applying the new guidance. In August 2015, the FASB issued an additional accounting update on certain debt issue costs, which clarifies that debt issue costs associated with line-of-credit agreements may be classified as an asset or as a direct deduction to the carrying amount of the debt. The costs should continue to be deferred and amortized over the term of the line-of-credit. As a result of these accounting updates, debt issue costs will be reclassified from other assets to long-term debt.
86
Table of Contents
Note 2. Concentrations of Credit Risk
The Company’s portfolio of finance receivables is with customers living in five southeastern states (Alabama, Georgia, North Carolina, South Carolina, and Tennessee), three southwestern states (Oklahoma, New Mexico, and Texas), and one mid-Atlantic (Virginia); consequently, such customers’ ability to honor their installment contracts may be affected by economic conditions in these areas. Additionally, the Company is exposed to a concentration of credit risk inherent in providing consumer finance products to borrowers who cannot obtain traditional bank financing.
The Company also has a risk that its customers will seek protection from creditors by filing under the bankruptcy laws. When a customer files for bankruptcy protection, the Company must cease collection efforts and petition the bankruptcy court to obtain its collateral or work out a court approved bankruptcy plan involving the Company and all other creditors of the customer. It is the Company’s experience that such plans can take an extended period of time to conclude and usually involve a reduction in the interest rate from the rate in the contract to a court-approved rate.
The Company maintains amounts in bank accounts which, at times, may exceed federally insured limits. The Company has not experienced losses in such accounts, which are maintained with large domestic banks. Management believes the Company’s exposure to credit risk is minimal for these accounts.
Note 3. Finance Receivables, Credit Quality Information, and Allowance for Credit Losses
Finance receivables for the periods indicated consisted of the following:
| In thousands | 2015 | 2014 | ||||||
| Branch small loans |
$ | 157,755 | $ | 128,217 | ||||
| Convenience checks |
180,402 | 191,316 | ||||||
| Large loans |
146,553 | 46,147 | ||||||
| Automobile loans |
116,109 | 154,382 | ||||||
| Retail loans |
27,625 | 26,130 | ||||||
|
|
|
|
|
|||||
| Finance receivables |
$ | 628,444 | $ | 546,192 | ||||
|
|
|
|
|
|||||
The contractual delinquency of the finance receivable portfolio by product and aging for the periods indicated are as follows:
| December 31, 2015 | ||||||||||||||||||||||||||||||||||||||||||||||||
| Branch Small | Convenience Check |
Large | Automobile | Retail | Total | |||||||||||||||||||||||||||||||||||||||||||
| In thousands | $ | % | $ | % | $ | % | $ | % | $ | % | $ | % | ||||||||||||||||||||||||||||||||||||
| Current |
$ | 123,525 | 78.3 | % | $ | 147,110 | 81.6 | % | $ | 127,374 | 86.9 | % | $ | 79,878 | 68.8 | % | $ | 22,704 | 82.2 | % | $ | 500,591 | 79.7 | % | ||||||||||||||||||||||||
| 1 to 29 days delinquent |
19,465 | 12.3 | % | 17,872 | 9.9 | % | 14,234 | 9.7 | % | 27,518 | 23.7 | % | 3,500 | 12.7 | % | 82,589 | 13.1 | % | ||||||||||||||||||||||||||||||
|
|
|
|
|
|
|
|
|
|
|
|
|
|
|
|
|
|
|
|
|
|
|
|
|
|||||||||||||||||||||||||
| Delinquent accounts |
||||||||||||||||||||||||||||||||||||||||||||||||
| 30 to 59 days |
4,493 | 2.9 | % | 4,348 | 2.4 | % | 2,157 | 1.5 | % | 4,119 | 3.5 | % | 537 | 1.9 | % | 15,654 | 2.5 | % | ||||||||||||||||||||||||||||||
| 60 to 89 days |
3,197 | 2.0 | % | 3,233 | 1.8 | % | 1,153 | 0.8 | % | 1,959 | 1.7 | % | 316 | 1.1 | % | 9,858 | 1.6 | % | ||||||||||||||||||||||||||||||
| 90 to 119 days |
2,654 | 1.7 | % | 2,966 | 1.6 | % | 682 | 0.4 | % | 1,147 | 1.0 | % | 247 | 1.0 | % | 7,696 | 1.1 | % | ||||||||||||||||||||||||||||||
| 120 to 149 days |
2,347 | 1.5 | % | 2,581 | 1.4 | % | 574 | 0.4 | % | 1,003 | 0.9 | % | 173 | 0.6 | % | 6,678 | 1.1 | % | ||||||||||||||||||||||||||||||
| 150 to 179 days |
2,074 | 1.3 | % | 2,292 | 1.3 | % | 379 | 0.3 | % | 485 | 0.4 | % | 148 | 0.5 | % | 5,378 | 0.9 | % | ||||||||||||||||||||||||||||||
|
|
|
|
|
|
|
|
|
|
|
|
|
|
|
|
|
|
|
|
|
|
|
|
|
|||||||||||||||||||||||||
| Total delinquency |
$ | 14,765 | 9.4 | % | $ | 15,420 | 8.5 | % | $ | 4,945 | 3.4 | % | $ | 8,713 | 7.5 | % | $ | 1,421 | 5.1 | % | $ | 45,264 | 7.2 | % | ||||||||||||||||||||||||
|
|
|
|
|
|
|
|
|
|
|
|
|
|
|
|
|
|
|
|
|
|
|
|
|
|||||||||||||||||||||||||
| Total finance receivables |
$ | 157,755 | 100.0 | % | $ | 180,402 | 100.0 | % | $ | 146,553 | 100.0 | % | $ | 116,109 | 100.0 | % | $ | 27,625 | 100.0 | % | $ | 628,444 | 100.0 | % | ||||||||||||||||||||||||
|
|
|
|
|
|
|
|
|
|
|
|
|
|
|
|
|
|
|
|
|
|
|
|
|
|||||||||||||||||||||||||
| Finance receivables in nonaccrual status |
$ | 7,075 | 4.5 | % | $ | 7,839 | 4.3 | % | $ | 1,635 | 1.1 | % | $ | 2,635 | 2.3 | % | $ | 568 | 2.1 | % | $ | 19,752 | 3.1 | % | ||||||||||||||||||||||||
|
|
|
|
|
|
|
|
|
|
|
|
|
|
|
|
|
|
|
|
|
|
|
|
|
|||||||||||||||||||||||||
87
Table of Contents
| December 31, 2014 | ||||||||||||||||||||||||||||||||||||||||||||||||
| Branch Small | Convenience Check |
Large | Automobile | Retail | Total | |||||||||||||||||||||||||||||||||||||||||||
| In thousands | $ | % | $ | % | $ | % | $ | % | $ | % | $ | % | ||||||||||||||||||||||||||||||||||||
| Current |
$ | 104,003 | 81.1 | % | $ | 154,833 | 80.9 | % | $ | 36,658 | 79.4 | % | $ | 105,424 | 68.3 | % | $ | 21,424 | 82.0 | % | $ | 422,342 | 77.4 | % | ||||||||||||||||||||||||
| 1 to 29 days delinquent |
13,967 | 10.9 | % | 19,318 | 10.1 | % | 7,383 | 16.0 | % | 38,656 | 25.0 | % | 3,390 | 13.0 | % | 82,714 | 15.1 | % | ||||||||||||||||||||||||||||||
|
|
|
|
|
|
|
|
|
|
|
|
|
|
|
|
|
|
|
|
|
|
|
|
|
|||||||||||||||||||||||||
| Delinquent accounts |
||||||||||||||||||||||||||||||||||||||||||||||||
| 30 to 59 days |
3,647 | 2.8 | % | 5,134 | 2.7 | % | 1,036 | 2.3 | % | 5,651 | 3.7 | % | 483 | 1.8 | % | 15,951 | 2.9 | % | ||||||||||||||||||||||||||||||
| 60 to 89 days |
2,275 | 1.8 | % | 4,442 | 2.3 | % | 483 | 1.0 | % | 2,114 | 1.4 | % | 310 | 1.2 | % | 9,624 | 1.8 | % | ||||||||||||||||||||||||||||||
| 90 to 119 days |
1,857 | 1.4 | % | 3,312 | 1.8 | % | 263 | 0.6 | % | 1,266 | 0.8 | % | 201 | 0.8 | % | 6,899 | 1.2 | % | ||||||||||||||||||||||||||||||
| 120 to 149 days |
1,478 | 1.2 | % | 2,343 | 1.2 | % | 204 | 0.4 | % | 758 | 0.5 | % | 205 | 0.8 | % | 4,988 | 0.9 | % | ||||||||||||||||||||||||||||||
| 150 to 179 days |
990 | 0.8 | % | 1,934 | 1.0 | % | 120 | 0.3 | % | 513 | 0.3 | % | 117 | 0.4 | % | 3,674 | 0.7 | % | ||||||||||||||||||||||||||||||
|
|
|
|
|
|
|
|
|
|
|
|
|
|
|
|
|
|
|
|
|
|
|
|
|
|||||||||||||||||||||||||
| Total delinquency |
$ | 10,247 | 8.0 | % | $ | 17,165 | 9.0 | % | $ | 2,106 | 4.6 | % | $ | 10,302 | 6.7 | % | $ | 1,316 | 5.0 | % | $ | 41,136 | 7.5 | % | ||||||||||||||||||||||||
|
|
|
|
|
|
|
|
|
|
|
|
|
|
|
|
|
|
|
|
|
|
|
|
|
|||||||||||||||||||||||||
| Total finance receivables |
$ | 128,217 | 100.0 | % | $ | 191,316 | 100.0 | % | $ | 46,147 | 100.0 | % | $ | 154,382 | 100.0 | % | $ | 26,130 | 100.0 | % | $ | 546,192 | 100.0 | % | ||||||||||||||||||||||||
|
|
|
|
|
|
|
|
|
|
|
|
|
|
|
|
|
|
|
|
|
|
|
|
|
|||||||||||||||||||||||||
| Finance receivables in nonaccrual status |
$ | 4,325 | 3.4 | % | $ | 7,589 | 4.0 | % | $ | 587 | 1.3 | % | $ | 2,537 | 1.6 | % | $ | 523 | 2.0 | % | $ | 15,561 | 2.8 | % | ||||||||||||||||||||||||
|
|
|
|
|
|
|
|
|
|
|
|
|
|
|
|
|
|
|
|
|
|
|
|
|
|||||||||||||||||||||||||
The allowance for credit losses consists of general and specific components. Prior to the charge-off policy change in September 2014, the specific component included a full valuation allowance for finance receivables that were contractually delinquent 180 days or over. The $2.1 million in charge-offs from the policy change were charged against this allowance as of September 2014 and, therefore, did not impact the provision for loan losses.
The general component of the allowance estimates credit losses for groups of finance receivables on a collective basis and is based on historic loss rates (adjusted for qualitative factors). The charge-off policy change modified this historic loss rate and the resulting general reserve. In addition, the Company converted bankrupt accounts with confirmed plans from the bankruptcy court from delinquent to current status. The bankrupt accounts continue to be accounted for as troubled debt restructurings and considered impaired finance receivables. As a net result of these changes, the Company increased the provision for credit losses by $0.3 million during the three months ended September 30, 2014, which decreased net income for the year ended December 31, 2014 by $0.2 million, or $0.02 diluted earnings per share.
Changes in the allowance for credit losses for the periods indicated are as follows:
| In thousands | 2015 | 2014 | 2013 | |||||||||
| Balance at beginning of year |
$ | 40,511 | $ | 30,089 | $ | 23,616 | ||||||
| Provision for credit losses |
47,348 | 69,057 | 39,192 | |||||||||
| Charge-offs |
(55,043 | ) | (58,236 | ) | (33,750 | ) | ||||||
| Charge-offs (180+ policy change) |
— | (2,106 | ) | — | ||||||||
| Recoveries |
4,636 | 1,707 | 1,031 | |||||||||
|
|
|
|
|
|
|
|||||||
| Balance at end of year |
$ | 37,452 | $ | 40,511 | $ | 30,089 | ||||||
|
|
|
|
|
|
|
|||||||
In December 2015, the Company began selling previously charged-off loans for all products in the portfolio to a third-party debt collector. The proceeds from these sales are recognized as a recovery in the allowance for credit losses. Recoveries during the year ended December 31, 2015 included $2.0 million from the sale of charged-off loans. No sales of previously charged-off loans were made in 2013 or 2014. In January 2016, the Company began selling the flow of loans charged-off between November 2015 and October 2016. The flow sales will be recognized as recoveries in the allowance for credit losses and a reduction of the provision for loan losses.
During the three months ended December 31, 2013, the Company changed its estimate for the allowance for credit losses based on analysis of the effective lives for all finance receivable portfolios. The methodology for estimating the allowance for credit losses changed from the trailing eight to trailing six month losses on branch
88
Table of Contents
small loans and convenience checks, trailing twelve to trailing ten month losses on large loans, and trailing twelve to trailing eleven month losses on retail loans. As a result, the Company decreased the allowance for credit losses by $3.9 million, which increased net income for the year ended December 31, 2013 by $2.4 million, or $0.19 diluted earnings per share. The Company recorded an offsetting $3.7 million pre-tax increase to the allowance for credit losses for qualitative factors on finance receivable growth and delinquency and loss trends, which decreased net income for the year ended December 31, 2013 by $2.3 million, or $0.18 diluted earnings per share.
During 2015, the effective life of the large loan product category increased from ten months to twelve months as the Company originated longer term loans. As a result, the Company increased the allowance for credit losses by $0.5 million, which decreased net income for the year ended December 31, 2015 by $0.3 million, or $0.02 diluted earnings per share. The increase in the allowance for credit losses due to the change in effective life was offset by a decrease in the Company’s normal allowance for credit losses on qualitative factors surrounding finance receivables growth and credit quality. The overall large loan allowance for credit losses as a percentage of loans declined from 4.3% to 3.8% as of December 31, 2014 and 2015, respectively.
In September 2014, the Company changed the time-based element of the charge-off policy from 365 days contractually delinquent to 180 days. The updated policy improves consistency and creates better alignment with industry practice. The policy change generated a one-time charge-off of $2.1 million as of September 2014.
The following is a reconciliation of the allowance for credit losses by product for the periods indicated:
| In thousands | Balance January 1, 2015 |
Provision | Charge-offs | Recoveries | Balance December 31, 2015 |
Finance Receivables December 31, 2015 |
Allowance as Percentage of Finance Receivable December 31, 2015 |
|||||||||||||||||||||
| Branch small loans |
$ | 6,960 | $ | 16,000 | $ | (14,627 | ) | $ | 1,123 | $ | 9,456 | $ | 157,755 | 6.0 | % | |||||||||||||
| Convenience checks |
18,320 | 17,428 | (25,432 | ) | 1,763 | 12,079 | 180,402 | 6.7 | % | |||||||||||||||||||
| Large loans |
1,980 | 6,032 | (2,762 | ) | 343 | 5,593 | 146,553 | 3.8 | % | |||||||||||||||||||
| Automobile loans |
11,776 | 6,285 | (10,466 | ) | 1,233 | 8,828 | 116,109 | 7.6 | % | |||||||||||||||||||
| Retail loans |
1,475 | 1,603 | (1,756 | ) | 174 | 1,496 | 27,625 | 5.4 | % | |||||||||||||||||||
|
|
|
|
|
|
|
|
|
|
|
|
|
|
|
|||||||||||||||
| Total |
$ | 40,511 | $ | 47,348 | $ | (55,043 | ) | $ | 4,636 | $ | 37,452 | $ | 628,444 | 6.0 | % | |||||||||||||
|
|
|
|
|
|
|
|
|
|
|
|
|
|
|
|||||||||||||||
| In thousands | Balance January 1, 2014 |
Provision | Charge-offs | Charge-offs (180+ Policy Change) |
Recoveries | Balance December 31, 2014 |
Finance Receivables December 31, 2014 |
Allowance as Percentage of Finance Receivable December 31, 2014 |
||||||||||||||||||||||||
| Branch small loans |
$ | 5,166 | $ | 13,760 | $ | (11,915 | ) | $ | (505 | ) | $ | 454 | $ | 6,960 | $ | 128,217 | 5.4 | % | ||||||||||||||
| Convenience checks |
10,204 | 36,995 | (28,782 | ) | (627 | ) | 530 | 18,320 | 191,316 | 9.6 | % | |||||||||||||||||||||
| Large loans |
2,233 | 1,985 | (2,334 | ) | (203 | ) | 299 | 1,980 | 46,147 | 4.3 | % | |||||||||||||||||||||
| Automobile loans |
10,827 | 14,259 | (12,939 | ) | (688 | ) | 317 | 11,776 | 154,382 | 7.6 | % | |||||||||||||||||||||
| Retail loans |
1,659 | 2,058 | (2,266 | ) | (83 | ) | 107 | 1,475 | 26,130 | 5.6 | % | |||||||||||||||||||||
|
|
|
|
|
|
|
|
|
|
|
|
|
|
|
|
|
|||||||||||||||||
| Total |
$ | 30,089 | $ | 69,057 | $ | (58,236 | ) | $ | (2,106 | ) | $ | 1,707 | $ | 40,511 | $ | 546,192 | 7.4 | % | ||||||||||||||
|
|
|
|
|
|
|
|
|
|
|
|
|
|
|
|
|
|||||||||||||||||
89
Table of Contents
The Company disaggregated “small loans” into “branch small loans” and “convenience checks” during the year ended December 31, 2014 due to a change in the risk characteristics of the convenience check portfolio in that period.
| In thousands | Balance January 1, 2013 |
Provision | Charge-offs | Recoveries | Balance December 31, 2013 |
Finance Receivables December 31, 2013 |
Allowance as Percentage of Finance Receivable December 31, 2013 |
|||||||||||||||||||||
| Small loans |
$ | 11,369 | $ | 22,620 | $ | (19,108 | ) | $ | 489 | $ | 15,370 | $ | 288,979 | 5.3 | % | |||||||||||||
| Large loans |
2,753 | 1,788 | (2,630 | ) | 322 | 2,233 | 43,311 | 5.2 | % | |||||||||||||||||||
| Automobile loans |
8,424 | 12,094 | (9,875 | ) | 184 | 10,827 | 181,126 | 6.0 | % | |||||||||||||||||||
| Retail loans |
1,070 | 2,690 | (2,137 | ) | 36 | 1,659 | 31,268 | 5.3 | % | |||||||||||||||||||
|
|
|
|
|
|
|
|
|
|
|
|
|
|
|
|||||||||||||||
| Total |
$ | 23,616 | $ | 39,192 | $ | (33,750 | ) | $ | 1,031 | $ | 30,089 | $ | 544,684 | 5.5 | % | |||||||||||||
|
|
|
|
|
|
|
|
|
|
|
|
|
|
|
|||||||||||||||
Impaired finance receivables as a percentage of total finance receivables were 1.2% and 1.1% for the years ended December 31, 2015 and 2014, respectively. The following is a summary of impaired finance receivables as of the periods indicated:
| In thousands | 2015 | 2014 | ||||||
| Branch small loans |
$ | 524 | $ | 582 | ||||
| Convenience checks |
485 | 544 | ||||||
| Large loans |
2,760 | 1,260 | ||||||
| Automobile loans |
3,370 | 3,698 | ||||||
| Retail loans |
121 | 119 | ||||||
|
|
|
|
|
|||||
| Total |
$ | 7,260 | $ | 6,203 | ||||
|
|
|
|
|
|||||
Following is a summary of finance receivables evaluated for impairment for the periods indicated:
| December 31, 2015 | ||||||||||||||||||||||||
| In thousands | Branch Small | Convenience Check |
Large | Automobile | Retail | Total | ||||||||||||||||||
| Impaired receivables specifically evaluated |
$ | 524 | $ | 485 | $ | 2,760 | $ | 3,370 | $ | 121 | $ | 7,260 | ||||||||||||
| Finance receivables evaluated collectively |
157,231 | 179,917 | 143,793 | 112,739 | 27,504 | 621,184 | ||||||||||||||||||
|
|
|
|
|
|
|
|
|
|
|
|
|
|||||||||||||
| Finance receivables outstanding |
$ | 157,755 | $ | 180,402 | $ | 146,553 | $ | 116,109 | $ | 27,625 | $ | 628,444 | ||||||||||||
|
|
|
|
|
|
|
|
|
|
|
|
|
|||||||||||||
| Impaired receivables in nonaccrual status |
$ | 109 | $ | 95 | $ | 83 | $ | 415 | $ | 17 | $ | 719 | ||||||||||||
|
|
|
|
|
|
|
|
|
|
|
|
|
|||||||||||||
| Amount of the specific reserve for impaired accounts |
$ | 142 | $ | 124 | $ | 560 | $ | 862 | $ | 20 | $ | 1,708 | ||||||||||||
|
|
|
|
|
|
|
|
|
|
|
|
|
|||||||||||||
| Amount of the general component of the allowance |
$ | 9,314 | $ | 11,955 | $ | 5,033 | $ | 7,966 | $ | 1,476 | $ | 35,744 | ||||||||||||
|
|
|
|
|
|
|
|
|
|
|
|
|
|||||||||||||
90
Table of Contents
| December 31, 2014 | ||||||||||||||||||||||||
| In thousands | Branch Small | Convenience Check |
Large | Automobile | Retail | Total | ||||||||||||||||||
| Impaired receivables specifically evaluated |
$ | 582 | $ | 544 | $ | 1,260 | $ | 3,698 | $ | 119 | $ | 6,203 | ||||||||||||
| Finance receivables evaluated collectively |
127,635 | 190,772 | 44,887 | 150,684 | 26,011 | 539,989 | ||||||||||||||||||
|
|
|
|
|
|
|
|
|
|
|
|
|
|||||||||||||
| Finance receivables outstanding |
$ | 128,217 | $ | 191,316 | $ | 46,147 | $ | 154,382 | $ | 26,130 | $ | 546,192 | ||||||||||||
|
|
|
|
|
|
|
|
|
|
|
|
|
|||||||||||||
| Impaired receivables in nonaccrual status |
$ | 140 | $ | 159 | $ | 133 | $ | 559 | $ | 16 | $ | 1,007 | ||||||||||||
|
|
|
|
|
|
|
|
|
|
|
|
|
|||||||||||||
| Amount of the specific reserve for impaired accounts |
$ | 143 | $ | 165 | $ | 309 | $ | 981 | $ | 18 | $ | 1,616 | ||||||||||||
|
|
|
|
|
|
|
|
|
|
|
|
|
|||||||||||||
| Amount of the general component of the allowance |
$ | 6,817 | $ | 18,155 | $ | 1,671 | $ | 10,795 | $ | 1,457 | $ | 38,895 | ||||||||||||
|
|
|
|
|
|
|
|
|
|
|
|
|
|||||||||||||
Average recorded investment in impaired finance receivables for the periods indicated are as follows:
| In thousands | 2015 | 2014 | ||||||
| Branch small |
$ | 586 | $ | 1,097 | ||||
| Convenience check |
514 | 1,265 | ||||||
| Large |
1,523 | 1,619 | ||||||
| Automobile |
3,571 | 4,150 | ||||||
| Retail |
128 | 238 | ||||||
|
|
|
|
|
|||||
| Total average recorded investment |
$ | 6,322 | $ | 8,369 | ||||
|
|
|
|
|
|||||
Prior to September 2014, impaired finance receivables included receivables that were delinquent 180 days and over. It has been the Company’s practice since September 2014 to charge off finance receivables that reach 180 days delinquent.
It is not practical to compute the amount of interest earned on impaired loans.
Note 4. Property and Equipment
For the periods indicated, property and equipment consisted of the following:
| In thousands | 2015 | 2014 | ||||||
| Land and building |
$ | 919 | $ | 922 | ||||
| Furniture, fixtures, and equipment |
21,240 | 18,423 | ||||||
| Leasehold improvements |
4,548 | 3,212 | ||||||
|
|
|
|
|
|||||
| Property and equipment cost |
26,707 | 22,557 | ||||||
| Less accumulated depreciation |
16,266 | 13,652 | ||||||
|
|
|
|
|
|||||
| Property and equipment, net of accumulated depreciation |
$ | 10,441 | $ | 8,905 | ||||
|
|
|
|
|
|||||
Depreciation expense for the years ended December 31, 2015, 2014, and 2013 totaled $2.9 million, $2.6 million, and $2.2 million, respectively.
91
Table of Contents
Note 5. Leases
Future minimum rent commitments under non-cancellable operating leases in effect as of December 31, 2015 are as follows:
| In thousands | Amount | |||
| 2016 |
$ | 5,642 | ||
| 2017 |
4,001 | |||
| 2018 |
2,511 | |||
| 2019 |
1,359 | |||
| 2020 |
652 | |||
| Thereafter |
7 | |||
|
|
|
|||
| Total |
$ | 14,172 | ||
|
|
|
|||
Leases generally contain options to extend for periods from 1 to 10 years and the cost of such extensions is not included above. Rent expense for the years ended December 31, 2015, 2014, and 2013 equaled $6.0 million, $5.2 million, and $4.3 million, respectively. In addition to rent, the Company typically pays for all operating expenses, property taxes, and repairs and maintenance on properties that it leases.
Note 6. Goodwill
The Company performs an annual impairment test during the fourth quarter of each fiscal year. There were no goodwill additions or impairment losses for the years ended 2015 and 2014.
Note 7. Intangibles
The following table provides the gross carrying amount and related accumulated amortization of definite-lived intangible assets:
| December 31, 2015 | December 31, 2014 | |||||||||||||||
| In thousands | Gross Carrying Amount |
Accumulated Amortization |
Gross Carrying Amount |
Accumulated Amortization |
||||||||||||
| Customer list |
$ | 2,516 | $ | 2,043 | $ | 2,516 | $ | 1,669 | ||||||||
|
|
|
|
|
|
|
|
|
|||||||||
Intangible amortization expense for the years ended December 31, 2015, 2014, and 2013 totaled $0.4 million, $0.6 million, and $0.7 million, respectively. The following table sets forth the future amortization of intangible assets:
| In thousands | Amount | |||
| 2016 |
$ | 264 | ||
| 2017 |
164 | |||
| 2018 |
45 | |||
|
|
|
|||
| Total |
$ | 473 | ||
|
|
|
|||
92
Table of Contents
Note 8. Other Assets
Other assets include the following as of the periods indicated:
| In thousands | 2015 | 2014 | ||||||
| Debt issuance costs, net of accumulated amortization |
$ | 2,693 | $ | 869 | ||||
| Prepaid expenses |
2,240 | 1,896 | ||||||
| Credit insurance receivable |
658 | 873 | ||||||
| Income tax receivable |
— | 1,611 | ||||||
| Other |
403 | 533 | ||||||
|
|
|
|
|
|||||
| Total |
$ | 5,994 | $ | 5,782 | ||||
|
|
|
|
|
|||||
Note 9. Long-Term Debt
Following is a summary of the Company’s debt as of the periods indicated:
| In thousands | 2015 | 2014 | ||||||
| Senior revolving credit facility |
$ | 338,281 | $ | 341,419 | ||||
| Amortizing loan |
72,896 | — | ||||||
|
|
|
|
|
|||||
| Total long-term debt |
$ | 411,177 | $ | 341,419 | ||||
|
|
|
|
|
|||||
|
|
||||||||
| Unused amount of senior revolving credit facility, subject to borrowing base |
$ | 199,719 | $ | 158,581 | ||||
|
|
|
|
|
|||||
On September 18, 2015, the Company amended and restated its senior revolving credit facility, increased availability under the facility from $500 million to $538 million, and extended the maturity of the facility from May 2016 to September 2018. The facility has an accordion provision that allows for the expansion of the facility to $600 million. Excluding the receivables held by the Company’s VIE, the senior revolving credit facility is secured by substantially all of the Company’s finance receivables and equity interests of the majority of its subsidiaries. Borrowings under the facility bear interest, payable monthly, at rates equal to LIBOR of a maturity the Company elects between one and six months, with a LIBOR floor of 1.00%, plus a 3.00% margin. The one-month LIBOR was 0.50% and 0.25% at December 31, 2015 and 2014, respectively. Alternatively, the Company may pay interest at prime rate plus a 2.00% margin. The prime rate was 3.50% and 3.25% at December 31, 2015 and 2014, respectively.
The Company also pays an unused line fee, payable monthly, of 0.50% per annum, which declines to 0.375% at certain usage levels. Advances on the facility are capped at 85% of eligible secured finance receivables plus 70% of eligible unsecured finance receivables. These rates are subject to adjustment at certain credit quality levels (83% secured and 68% unsecured as of December 31, 2015). As of December 31, 2015, the Company had $69.4 million of eligible capacity under the facility. The facility also contains restrictive covenants and monthly and annual reporting requirements to the banks. At December 31, 2015, the Company was in compliance with all debt covenants.
The Company had a $1.5 million line of credit, which was secured by a mortgage on the Company’s headquarters, with a commercial bank to facilitate its cash management program. The interest rate was prime plus 0.25% with a minimum of 5.00%, and interest was payable monthly. The line of credit matured on January 18, 2015 and was replaced by a $3.0 million overdraft provision.
93
Table of Contents
In December 2015, the Company and its wholly-owned subsidiary, Regional Management Receivables, LLC (“RMR”), entered into a credit agreement providing for a $75.7 million amortizing asset-backed loan to RMR. RMR purchased $86.1 million in automobile finance receivables, net of a $2.6 million allowance for credit losses, from the Company’s affiliates using the proceeds of the loan and an equity investment from the Company. RMR deposited $3.7 million of the cash received into a restricted cash reserve account to satisfy provisions of the credit agreement. The reserve amount may be reduced by $2.0 million if the Company modifies certain aspects of its primary bank account. RMR pays interest of 3.00% per annum on the loan balance from the closing date until the date the loan balance has been fully repaid. The amortizing loan terminates in December 2022. The credit agreement allows RMR to prepay the loan when the outstanding balance falls below 20% of the original loan amount.
The amortizing loan is supported by the expected cash flows from the underlying collateralized finance receivables. Collections on these accounts are remitted to a restricted cash collection account, which totaled $3.9 million as of December 31, 2015. Cash inflows from the finance receivables are distributed to the lender and service providers in accordance with a monthly contractual priority of payments (“waterfall”) and, as such, the inflows are directed first to servicing fees. RMR pays a 4% servicing fee to the Company, which is eliminated in consolidation. Next, all cash inflows are directed to the interest, principal, and any adjustments to the reserve account of the amortizing loan and, thereafter, to the residual interest that the Company owns. Distributions from RMR to the Company are allowed under the credit agreement.
RMR is considered a VIE under GAAP and is consolidated into the financial statements of RMR’s primary beneficiary. The Company is considered to be the primary beneficiary of RMR because it has (i) power over the significant activities of RMR through its role as servicer of the finance receivables under the credit agreement and (ii) the obligation to absorb losses or the right to receive returns that could be significant through the Company’s interest in the monthly residual cash flows of RMR after the debt is paid. See Note 1 of these Notes to Consolidated Financial Statements for further information regarding VIE.
The carrying amount of VIE assets and liabilities are as follows:
| In thousands | 2015 | |||
| Assets |
||||
| Cash |
$ | 376 | ||
| Finance receivables |
80,309 | |||
| Allowance for credit losses |
(2,588 | ) | ||
| Restricted cash |
7,605 | |||
| Repossessed assets at net realizable value |
36 | |||
| Other assets |
1,670 | |||
|
|
|
|||
| Total assets |
$ | 87,408 | ||
|
|
|
|||
| Liabilities |
||||
| Long-term debt |
$ | 72,896 | ||
| Accounts payable and accrued expenses |
50 | |||
|
|
|
|||
| Total liabilities |
$ | 72,946 | ||
|
|
|
|||
94
Table of Contents
Following is a summary of principal payments required on outstanding debt during each of the next five years:
| In thousands | Amount | |||
| 2016 |
$ | 33,561 | ||
| 2017 |
20,092 | |||
| 2018 |
349,811 | |||
| 2019 |
7,713 | |||
| 2020 |
— | |||
|
|
|
|||
| Total |
$ | 411,177 | ||
|
|
|
|||
Note 10. Interest Rate Cap
In April 2015, the Company purchased interest rate caps. The interest rate cap contracts have an aggregate notional principal amount of $150.0 million, a 2.5% strike rate against one-month LIBOR, and mature in April 2018. When the one-month LIBOR exceeds 2.5%, the counterparty reimburses the Company for the excess over 2.5%. No payment is required by the Company or the counterparty when the one-month LIBOR is below 2.5%. The following is a summary of changes in the rate caps:
| In thousands | 2015 | |||
| Balance at beginning of period |
$ | — | ||
| Purchases |
577 | |||
| Fair value adjustment included as an (increase) in interest expense |
(457 | ) | ||
|
|
|
|||
| Balance at end of period, included in other assets |
$ | 120 | ||
|
|
|
|||
Note 11. Disclosure About Fair Value of Financial Instruments
The following methods and assumptions were used to estimate the fair value of each class of financial instruments for which it is practicable to estimate that value:
Cash and restricted cash: Cash and restricted cash is recorded at cost, which approximates fair value due to its generally short maturity and highly liquid nature.
Finance receivables: Finance receivables are originated at prevailing market rates. The Company’s finance receivable portfolio turns approximately 1.5 times per year. The portfolio turnover is calculated by dividing cash payments and renewals by the average finance receivables. Management believes that the carrying value approximates the fair value of its finance receivable portfolio.
Interest rate caps: The fair value of the interest rate caps is the estimated amount the Company would receive to terminate the cap agreements at the reporting date, taking into account current interest rates and the creditworthiness of the counterparty for assets and creditworthiness of the Company for liabilities.
Repossessed assets: Repossessed assets are valued at the lower of the receivable balance on the finance receivable prior to repossession or the estimated net realizable value. The Company estimates net realizable value at the projected cash value upon liquidation, less costs to sell the related collateral.
Long-term debt: The Company’s long-term debt is frequently renewed, amended, or recently originated. As a result, the Company believes that the fair value of the variable rate revolving credit facility and the recent fixed-rate amortizing loan approximates its carrying value at December 31, 2015. The Company also considered its creditworthiness in its determination of fair value.
95
Table of Contents
The carrying amount and estimated fair values of the Company’s financial instruments summarized by level are as follows:
| December 31, 2015 | December 31, 2014 | |||||||||||||||
| In thousands | Carrying Amount |
Estimated Fair Value |
Carrying Amount |
Estimated Fair Value |
||||||||||||
| Assets |
||||||||||||||||
| Level 1 inputs |
||||||||||||||||
| Cash |
$ | 7,654 | $ | 7,654 | $ | 4,012 | $ | 4,012 | ||||||||
| Restricted cash |
10,506 | 10,506 | 1,901 | 1,901 | ||||||||||||
| Level 2 inputs |
||||||||||||||||
| Interest rate caps |
120 | 120 | — | — | ||||||||||||
| Level 3 inputs |
||||||||||||||||
| Net finance receivables |
590,992 | 590,992 | 505,681 | 505,681 | ||||||||||||
| Repossessed assets |
307 | 307 | 556 | 556 | ||||||||||||
| Liabilities |
||||||||||||||||
| Level 3 inputs |
||||||||||||||||
| Long-term debt |
411,177 | 411,177 | 341,419 | 341,419 | ||||||||||||
Certain of the Company’s assets carried at fair value are classified and disclosed in one of the following three categories:
Level 1 – Quoted market prices in active markets for identical assets or liabilities.
Level 2 – Observable market-based inputs or unobservable inputs that are corroborated by market data.
Level 3 – Unobservable inputs that are not corroborated by market data.
In determining the appropriate levels, the Company performs an analysis of the assets and liabilities that are carried at fair value. At each reporting period, all assets and liabilities for which the fair value measurement is based on significant unobservable inputs are classified as Level 3. The table below presents the balances of assets measured at fair value on a recurring basis by level within the hierarchy:
| Interest Rate Caps | ||||||||||||||||
| In thousands | Total | Level 1 | Level 2 | Level 3 | ||||||||||||
| 2015 |
$ | 120 | $ | — | $ | 120 | $ | — | ||||||||
| 2014 |
$ | — | $ | — | $ | — | $ | — | ||||||||
Certain assets are measured at fair value on a nonrecurring basis; that is, the instruments are not measured at fair value on an ongoing basis but are subject to fair value adjustments in certain circumstances (for example, when there is evidence of impairment). The following table presents the assets carried on the balance sheet by level within the hierarchy as of December 31, 2015 and 2014 for which a nonrecurring change in fair value has been recorded during the years ended December 31, 2015 and 2014:
| Repossessed Assets | ||||||||||||||||||||
| In thousands | Total | Level 1 | Level 2 | Level 3 | Total Losses | |||||||||||||||
| 2015 |
$ | 307 | $ | — | $ | — | $ | 307 | $ | 338 | ||||||||||
| 2014 |
$ | 556 | $ | — | $ | — | $ | 556 | $ | 566 | ||||||||||
Note 12. Income Taxes
The Company and its subsidiaries file a consolidated federal income tax return. The Company files consolidated or separate state income tax returns as permitted by individual states in which it operates.
96
Table of Contents
Income tax expense was $14.8 million, $9.1 million, and $17.5 million for the years ended December 31, 2015, 2014, and 2013, respectively, which differed from the amount computed by applying the federal income tax rate of 35% to total income before income taxes as a result of the following:
| In thousands | 2015 | 2014 | 2013 | |||||||||
| Federal tax expense at statutory rate |
$ | 13,349 | $ | 8,379 | $ | 16,189 | ||||||
| Increase (reduction) in income taxes resulting from: |
||||||||||||
| State tax, net of federal benefit |
1,098 | 603 | 1,112 | |||||||||
| Non-deductible compensation |
378 | — | — | |||||||||
| Other |
(51 | ) | 155 | 159 | ||||||||
|
|
|
|
|
|
|
|||||||
| $ | 14,774 | $ | 9,137 | $ | 17,460 | |||||||
|
|
|
|
|
|
|
|||||||
Income tax expense attributable to total income before income taxes consists of the following for the periods indicated:
| In thousands | 2015 | 2014 | 2013 | |||||||||
| Current: |
||||||||||||
| Federal |
$ | 13,037 | $ | 11,827 | $ | 18,297 | ||||||
| State and local |
1,859 | 1,859 | 2,457 | |||||||||
|
|
|
|
|
|
|
|||||||
| 14,896 | 13,686 | 20,754 | ||||||||||
|
|
|
|
|
|
|
|||||||
| Deferred: |
||||||||||||
| Federal |
(104 | ) | (3,958 | ) | (2,549 | ) | ||||||
| State and local |
(18 | ) | (591 | ) | (745 | ) | ||||||
|
|
|
|
|
|
|
|||||||
| (122 | ) | (4,549 | ) | (3,294 | ) | |||||||
|
|
|
|
|
|
|
|||||||
| Total |
$ | 14,774 | $ | 9,137 | $ | 17,460 | ||||||
|
|
|
|
|
|
|
|||||||
Net deferred tax assets and liabilities consist of the following as of the periods indicated:
| In thousands | 2015 | 2014 | ||||||
| Deferred tax assets: |
||||||||
| Allowance for credit losses |
$ | 14,463 | $ | 15,620 | ||||
| Share-based compensation |
2,241 | 1,694 | ||||||
| Unearned insurance commissions |
2,152 | 1,490 | ||||||
| Amortization of intangible assets |
661 | 609 | ||||||
| Accrued expenses |
475 | 828 | ||||||
| Deferred loan fees |
76 | 134 | ||||||
| State net operating loss carryforward |
17 | 69 | ||||||
| Other |
35 | 189 | ||||||
|
|
|
|
|
|||||
| Gross deferred tax assets |
20,120 | 20,633 | ||||||
|
|
|
|
|
|||||
| Deferred tax liabilities: |
||||||||
| Fair market value adjustment of finance receivables |
13,469 | 14,403 | ||||||
| Deferred loan costs |
2,302 | 2,283 | ||||||
| Tax over book depreciation |
1,585 | 1,403 | ||||||
| Prepaid expenses |
616 | 518 | ||||||
| Other |
166 | 156 | ||||||
|
|
|
|
|
|||||
| Gross deferred tax liabilities |
18,138 | 18,763 | ||||||
|
|
|
|
|
|||||
| Net deferred tax asset |
$ | 1,982 | $ | 1,870 | ||||
|
|
|
|
|
|||||
97
Table of Contents
The Company’s determination of the realization of deferred tax assets is based on its assessment of all available positive and negative evidence. At December 31, 2015, positive evidence supporting the realization of the deferred tax assets includes generation of taxable income for the two prior tax years and reversal of taxable temporary differences. At December 31, 2015, the Company has not identified significant negative evidence related to the realization of its deferred tax assets. At both December 31, 2015 and December 31, 2014, the Company was in a three-year cumulative pre-tax book income position. As noted below, the Company had certain state net operating loss carryforwards at December 31, 2015, and the Company expects to fully utilize these deferred tax assets within the state carryforward periods based on available evidence existing as of the balance sheet date.
Subsequent to the earnings release furnished as Exhibit 99.1 to the Company’s Current Report on Form 8-K filed on January 28, 2016, the Company recorded an adjustment to reclassify $2.6 million between current and deferred taxes on the Company’s balance sheet as the result of additional work performed on estimating the Company’s taxable fair market value of finance receivables. Such reclassification had no impact on previously reported net income or stockholders’ equity.
As of December 31, 2015 and 2014, the Company had state net operating loss carryforwards of approximately $0.6 million and $2.5 million, respectively, which will be available to offset future taxable income. If not used, these carryforwards will expire between 2029 and 2034.
At December 31, 2015, the Company did not have any material uncertain tax positions.
Note 13. Earnings Per Share
The following schedule reconciles the computation of basic and diluted earnings per share for the periods indicated:
| In thousands, except per share amounts | 2015 | 2014 | 2013 | |||||||||
| Numerator: |
||||||||||||
| Net income |
$ | 23,365 | $ | 14,802 | $ | 28,794 | ||||||
|
|
|
|
|
|
|
|||||||
| Denominator: |
||||||||||||
| Weighted average shares outstanding for basic earnings per share |
12,849 | 12,701 | 12,572 | |||||||||
| Effect of dilutive securities |
225 | 250 | 322 | |||||||||
|
|
|
|
|
|
|
|||||||
| Weighted average shares adjusted for dilutive securities |
13,074 | 12,951 | 12,894 | |||||||||
|
|
|
|
|
|
|
|||||||
| Earnings per share: |
||||||||||||
| Basic |
$ | 1.82 | $ | 1.17 | $ | 2.29 | ||||||
|
|
|
|
|
|
|
|||||||
| Diluted |
$ | 1.79 | $ | 1.14 | $ | 2.23 | ||||||
|
|
|
|
|
|
|
|||||||
Options to purchase 489 thousand, 478 thousand, and 27 thousand shares of common stock were outstanding during the years ended December 31, 2015, 2014, and 2013, respectively, but were not included in the computation of diluted earnings per share because they were anti-dilutive.
Note 14. Employee Benefit Plans
Retirement savings plan: The Company has a defined contribution employee benefit plan (401(k) plan) covering full-time employees who have at least one year of service. The Company made a matching contribution equal to 100 percent of the first three percent of an employee’s gross income and 50 percent of the next two
98
Table of Contents
percent of gross income in 2015, 2014, and 2013. For the years ended December 31, 2015, 2014, and 2013, the Company recorded expense for the Company’s match of $0.6 million, $0.5 million, and $0.4 million, respectively.
Health insurance plan: The Company has a fully insured health insurance plan where the per-employee cost is fixed for the plan year. Employees pay a portion of the cost and the Company pays the balance. The Company’s expense for the years ended December 31, 2015, 2014, and 2013 was $4.6 million, $3.9 million, and $2.7 million, respectively.
Annual incentive plan: The Company maintains an annual incentive plan for executive officers and management team members. The plan establishes five performance metrics with specific weighting factors. Amounts charged to operating expense under the annual incentive plan were $2.3 million, $0.8 million, and $0.6 million for the years ended December 31, 2015, 2014, and 2013, respectively. These annual incentive plan payments are subject to approval by the compensation committee of the Board of Directors (the “Board”).
Employment agreements: The Company has employment contracts or letter agreements with certain members of senior management. These contracts and agreements stipulate the payment of salary, bonus, perquisites, and share-based compensation to the affected individuals.
In October 2014, the Company accepted the resignation of the Company’s Chief Executive Officer. The resignation was treated as a termination without cause pursuant to the executive’s Employment Agreement, dated March 18, 2013. The Company entered into a Separation Agreement with the executive, dated December 11, 2014. The Employment Agreement and the Separation Agreement are attached as Exhibits 10.1 to the Current Reports on Form 8-K, filed with the SEC on March 21, 2013 and December 17, 2014, respectively. The expense related to the Separation Agreement was $1.2 million for the year ended December 31, 2014, which is included in personnel expense on the consolidated income statement.
Note 15. Share-Based Compensation
The Company previously adopted the 2007 Management Incentive Plan (the “2007 Plan”) and the 2011 Stock Incentive Plan (the “2011 Plan”). On April 22, 2015, the stockholders of the Company approved the 2015 Long-Term Incentive Plan (the “2015 Plan”). Subject to adjustments as provided in the 2015 Plan, the maximum aggregate number of shares of the Company’s common stock that may be issued under the 2015 Plan may not exceed the sum of (i) 350 thousand shares plus (ii) any shares (A) remaining available for the grant of awards as of the effective date under the 2007 Plan or the 2011 Plan, and/or (B) subject to an award granted under the 2007 Plan or the 2011 Plan, which award is forfeited, cancelled, terminated, expires, or lapses. As of the effectiveness of the 2015 Plan, there were 922 thousand shares available for grant under the 2015 Plan, inclusive of shares previously available for grant under the 2007 Plan and the 2011 Plan that were rolled over to the 2015 Plan. No further grants will be made under the 2007 Plan or the 2011 Plan. However, awards that are outstanding under the 2007 Plan and the 2011 Plan will continue in accordance with their respective terms. As of December 31, 2015, there were 561 thousand shares available for grant under the 2015 Plan.
For the years ended December 31, 2015, 2014, and 2013, the Company recorded share-based compensation expense of $3.6 million, $2.3 million, and $1.6 million, respectively. As of December 31, 2015, unrecognized share-based compensation expense to be recognized over future periods approximated $2.5 million. This amount will be recognized as expense over a weighted-average period of 1.8 years. Share-based compensation expenses are recognized on a straight-line basis over the requisite service period of the agreement. All share-based compensation is classified as equity except where otherwise noted.
The Company allows for the settlement of share-based awards on a net share basis. With net share settlement, the employee does not surrender any cash or shares upon the exercise of stock options or the vesting of stock awards or stock units. Rather, the Company withholds the number of shares with a value equivalent to the option
99
Table of Contents
exercise price, for stock options, and the minimum statutory tax withholding for all share-based awards. Net share settlements have the effect of reducing the number of shares that would have otherwise been issued as a result of exercise or vesting.
Long-term incentive program: The Company issues nonqualified stock options, performance-contingent restricted stock units (“RSU”), and cash-settled performance units (“CSPU”) under a long-term incentive program. Recurring annual grants are at the discretion of the Board and were granted in October 2014 (for the 2014 calendar year) and in April 2015 (for the 2015 calendar year). The grants cliff vest at the end of the third calendar year, subject to continued employment or as otherwise provided in the agreements. The actual value of the RSU and CSPU that may be earned can range from 0% to 150% of target based on the achievement of EBITDA and net income per share performance targets over a three-year period.
Inducement and retention program: From time to time, the Company issues share-based awards in conjunction with employment offers to select new executives and retention grants to select existing employees. The Company issues these awards to attract and retain talent and to provide market competitive compensation. The grants have various vesting terms which include fully-vested awards at the grant date and graded vesting over two- to five-year periods (subject to continued employment or as otherwise provided in the agreements).
Non-employee director compensation program: In October 2013, the Board revised its standard compensation arrangement for its non-employee directors. Effective for annual service years beginning in 2014, the Company awards its non-employee directors a cash retainer and shares of restricted common stock. The restricted stock awards are granted on the fifth business day following the Company’s annual meeting of stockholders and fully vest upon the earlier of the first anniversary of the grant date or the completion of the directors’ annual service to the Company. The Board revised the compensation arrangement in April 2015 to provide that the equity portion of the compensation program be split evenly between restricted stock awards and nonqualified stock options, with the stock options immediately vested on the grant date.
The following are the terms and amounts of the awards issued under the Company’s share-based incentive programs:
Stock options: The exercise price of all stock options is equal to the Company’s closing stock price on the date of grant. Stock options granted are subject to various vesting terms which include graded and cliff vesting over two- to five-year vesting periods. In addition, all stock options vest and become exercisable in full under certain circumstances following the occurrence of a change of control (as defined in the option award agreements). Participants who are awarded options must exercise their options within a maximum of ten years of the grant date.
The fair value of option grants are estimated on the grant date using the Black-Scholes option-pricing model with the following weighted-average assumptions for option grants during the periods indicated below.
| 2015 | 2014 | 2013 | ||||||||||
| Expected volatility |
47.15 | % | 42.68 | % | 47.74 | % | ||||||
| Expected dividends |
0.00 | % | 0.00 | % | 0.00 | % | ||||||
| Expected term (in years) |
6.15 | 6.21 | 10.00 | |||||||||
| Risk-free rate |
1.62 | % | 1.94 | % | 2.03 | % | ||||||
Expected volatility is based on the Company’s historical stock price volatility beginning in 2014. Prior years were based on the historic volatility of a publicly traded company in the same industry. The expected term is calculated by using the simplified method (average of the vesting and original contractual terms) due to insufficient historical data. The risk-free rate is based on the zero coupon U.S. Treasury bond rate over the expected term of the awards.
100
Table of Contents
The following table summarizes the stock option activity for the year ended December 31, 2015:
| In thousands, except per share amounts | Number of Shares |
Weighted-Average Exercise Price Per Share |
Weighted-Average Remaining Contractual Life (Years) |
Aggregate Intrinsic Value |
||||||||||||
| Options outstanding at January 1, 2015 |
896 | $ | 11.63 | |||||||||||||
| Granted |
310 | 15.25 | ||||||||||||||
| Exercised |
(145 | ) | 6.45 | |||||||||||||
| Forfeited |
(17 | ) | 15.96 | |||||||||||||
| Expired |
— | — | ||||||||||||||
|
|
|
|
|
|||||||||||||
| Options outstanding at December 31, 2015 |
1,044 | $ | 13.36 | 5.2 | $ | 3,129 | ||||||||||
|
|
|
|
|
|
|
|
|
|||||||||
| Options exercisable at December 31, 2015 |
618 | $ | 11.14 | 3.0 | $ | 2,983 | ||||||||||
|
|
|
|
|
|
|
|
|
|||||||||
| Available for grant at December 31, 2015 |
561 | |||||||||||||||
|
|
|
|||||||||||||||
The following table provides additional stock option information for the periods indicated:
| Year Ended December 31, | ||||||||||||
| In thousands, except per share amounts | 2015 | 2014 | 2013 | |||||||||
| Weighted-average grant date fair value per share |
$ | 7.13 | $ | 7.83 | $ | 12.09 | ||||||
| Intrinsic value of options exercised |
$ | 1,524 | $ | 584 | $ | 2,448 | ||||||
| Fair value of stock options that vested |
$ | 1,207 | $ | 1,484 | $ | 517 | ||||||
Restricted stock units: Compensation expense for restricted stock units is based on the Company’s closing stock price on the date of grant and the probability that certain financial goals are achieved over the performance period. Compensation cost is estimated based on expected performance and is adjusted at each reporting period.
The following table summarizes restricted stock unit activity during the year ended December 31, 2015:
| In thousands, except per unit amounts | Units | Weighted-Average Grant Date Fair Value Per Unit |
||||||
| Non-vested units, beginning of the year |
35 | $ | 17.76 | |||||
| Granted |
96 | 14.89 | ||||||
| Vested |
— | — | ||||||
| Forfeited |
(7 | ) | 17.76 | |||||
|
|
|
|
|
|||||
| Non-vested units, at December 31, 2015 |
124 | $ | 15.55 | |||||
|
|
|
|
|
|||||
The following table provides additional restricted stock unit information for the periods indicated:
| Year Ended December 31, | ||||||||||||
| 2015 | 2014 | 2013 | ||||||||||
| Weighted-average grant date fair value per unit |
$ | 14.89 | $ | 17.76 | $ | — | ||||||
Cash-settled performance units: Cash-settled performance units will be settled in cash at the end of the performance measurement period and are classified as a liability. Compensation cost is estimated based on expected performance and is adjusted at each reporting period.
101
Table of Contents
The following table summarizes cash-settled performance unit activity during the year ended December 31, 2015:
| In thousands, except per share amounts | Units | Weighted-Average Grant Date Fair Value Per Unit |
||||||
| Non-vested units, beginning of the year |
629 | $ | 1.00 | |||||
| Granted |
1,419 | 1.00 | ||||||
| Vested |
— | — | ||||||
| Forfeited |
(125 | ) | 1.00 | |||||
|
|
|
|
|
|||||
| Non-vested units, at December 31, 2015 |
1,923 | $ | 1.00 | |||||
|
|
|
|
|
|||||
Restricted stock awards: The fair value and compensation cost of restricted stock is calculated using the Company’s closing stock price on the date of grant.
In January 2015, the Company entered into an Employment Agreement with its Chief Executive Officer. Pursuant to the Employment Agreement, the Company granted the executive 99 thousand fully-vested shares of common stock, subject to a holding period requirement, and recognized $1.5 million of expense during the year ended December 31, 2015.
The following table summarizes restricted stock activity during the year ended December 31, 2015:
| In thousands, except per share amounts | Shares | Weighted-Average Grant Date Fair Value Per Share |
||||||
| Non-vested shares, beginning of the year |
60 | $ | 15.91 | |||||
| Granted |
120 | 15.36 | ||||||
| Vested |
(145 | ) | 15.17 | |||||
| Forfeited |
(12 | ) | 17.76 | |||||
|
|
|
|
|
|||||
| Non-vested shares, at December 31, 2015 |
23 | $ | 16.74 | |||||
|
|
|
|
|
|||||
The following table provides additional restricted stock information.
| Year Ended December 31, | ||||||||||||
| In thousands, except per share amounts | 2015 | 2014 | 2013 | |||||||||
| Weighted-average grant date fair value per share |
$ | 15.36 | $ | 16.23 | $ | — | ||||||
| Fair value of restricted stock awards that vested |
$ | 2,198 | $ | 224 | $ | — | ||||||
Note 16. Commitments and Contingencies
On May 30, 2014, a securities class action lawsuit was filed in the United States District Court for the Southern District of New York against the Company and certain of its current and former directors, executive officers, and shareholders (collectively, the “Defendants”). The complaint alleged violations of the Securities Act of 1933 (“1933 Act Claims”) and sought unspecified compensatory damages and other relief on behalf of a purported class of purchasers of the Company’s common stock in the September 2013 and December 2013 secondary public offerings. On August 25, 2014, Waterford Township Police & Fire Retirement System and City of Roseville Employees’ Retirement System were appointed as lead plaintiffs (collectively, the “Plaintiffs”). An amended complaint was filed on November 24, 2014. In addition to the 1933 Act Claims, the amended complaint also added claims for violations of the Securities Exchange Act of 1934 (“1934 Act Claims”) seeking unspecified compensatory damages on behalf of a purported class of purchasers of the Company’s common stock between May 2, 2013 and October 30, 2014, inclusive. On January 26, 2015, the Defendants filed motions to dismiss the amended complaint in its entirety. In response, the Plaintiffs sought and were granted leave to file an amended
102
Table of Contents
complaint. On February 27, 2015, the Plaintiffs filed a second amended complaint. Like the prior amended complaint, the second amended complaint asserts 1933 Act Claims and 1934 Act Claims and seeks unspecified compensatory damages. The Defendants’ motions to dismiss the second amended complaint were filed on April 28, 2015, the Plaintiffs’ opposition was filed on June 12, 2015, and the Defendants’ reply was filed on July 13, 2015. The motions remain under consideration by the Court. The Company believes that the claims against it are without merit and intends to defend against the litigation vigorously.
The Company’s primary insurance carrier during the applicable time period has (i) denied coverage for the 1933 Act Claims and (ii) acknowledged coverage of the Company and other insureds for the 1934 Act Claims under a reservation of rights and subject to the terms and conditions of the applicable insurance policy. The parties plan to negotiate an allocation between denied and acknowledged claims.
In the normal course of business, the Company has been named as a defendant in legal actions, including arbitrations, class actions, and other litigation arising in connection with its activities. Some of the actual or threatened legal actions include claims for compensatory and punitive damages or claims for indeterminate amounts of damages. While the Company will continue to identify legal actions where the Company believes a material loss to be reasonably possible and reasonably estimable, there can be no assurance that material losses will not be incurred from claims that the Company has not yet been notified of or are not yet determined to be probable, or reasonably possible and reasonable to estimate.
The Company contests liability and the amount of damages, as appropriate, in each pending matter. Where available information indicates that it is probable that a liability has been incurred and the Company can reasonably estimate the amount of that loss, the Company accrues the estimated loss by a charge to net income. As of December 31, 2015, the Company has accrued $0.5 million for these matters. In many actions, however, it is inherently difficult to determine whether any loss is probable or even reasonably possible or to estimate the amount of loss. In addition, even where a loss is reasonably possible or an exposure to loss exists in excess of the liability already accrued, it is not always possible to reasonably estimate the size of the possible loss or range of loss.
For certain legal actions, the Company cannot reasonably estimate such losses, particularly for actions that are in their early stages of development or where plaintiffs seek indeterminate damages. Numerous issues may need to be resolved, including through lengthy discovery and determination of important factual matters, and by addressing novel or unsettled legal questions relevant to the actions in question, before a loss, additional loss, range of loss, or range of additional loss can be reasonably estimated for any given action.
For certain other legal actions, the Company can estimate reasonably possible losses, additional losses, ranges of loss, or ranges of additional loss in excess of amounts accrued, but the Company does not believe, based on current knowledge and after consultation with counsel, that such losses will have a material adverse effect on the consolidated financial statements.
The Company expenses legal costs as they are incurred.
Note 17. Credit Insurance Products and Reinsurance of Certain Risks
RMC Reinsurance, Ltd. is a wholly-owned insurance subsidiary of the Company. The Company sells optional insurance products to its customers in connection with its lending operations. These optional products include credit life, credit accident and health, credit property insurance, and credit involuntary unemployment insurance. The Company also collects a fee for collateral protection and purchases non-recording insurance in lieu of recording and perfecting the Company’s security interest in the assets pledged on certain loans. Insurance premiums are remitted to an unaffiliated company that issues the policy to the customer. This unaffiliated company cedes the premiums to RMC Reinsurance, Ltd. Life insurance premiums are ceded to the Company as written and non-life products are ceded as earned.
103
Table of Contents
The Company maintains a cash reserve for life insurance claims in an amount determined by the ceding company. The cash reserve secures a letter of credit issued by a commercial bank in favor of the ceding company. The ceding company maintains the reserves for non-life claims.
Reinsurance income is accounted for over the period of the underlying reinsured policies using assumptions consistent with the policy terms. Following are total net premiums written and reinsured and total earned premiums for the periods indicated:
| In thousands | Net Written Premiums |
Earned Premiums |
||||||
| 2015 |
$ | 30,812 | $ | 20,257 | ||||
| 2014 |
17,831 | 17,385 | ||||||
| 2013 |
17,260 | 16,057 | ||||||
RMC Reinsurance, Ltd. is required to maintain cash reserves for a letter of credit against life insurance policies ceded to it, as determined by the ceding company. In September 2015, the letter of credit was increased to $2.9 million in favor of the ceding company. The letter of credit is secured by a cash deposit of $2.9 million. The cash securing the letter of credit is presented in the restricted cash category in the accompanying balance sheets, which totaled $2.9 million and $1.9 million at December 31, 2015 and 2014, respectively.
The Company has a collateral protection collision insurance (“CPI”) program. CPI is added to a loan when a customer fails to provide the Company with proof of collision insurance on an automobile securing a loan. The CPI program is administered by an independent third party, which tracks insurance lapses and cancellations and issues a policy when the customer does not provide proof of insurance. The insurance is added to the loan and increases the customers’ monthly loan payment. The third party and its insurance partner retain a percentage of the premium and pay all claims. The Company earns a commission for policies issued prior to July 1, 2014. Income is recognized on the constant yield method over the life of the insurance policy, which is generally one year. The Company does not earn a commission on policies issued on and after July 1, 2014.
The Company offers a self-insured Guaranteed Auto Protection (“GAP”) coverage to customers in North Carolina and Alabama. A GAP program is a contractual arrangement whereby the Company forgives the remaining balance of the insured customer’s automobile purchase loan if the automobile is determined to be a total loss by the primary insurance carrier and insurance proceeds are not sufficient to pay off the customer’s loan. The Company recognized $0.1 million, $0.2 million, and $0.2 million of net GAP income for the years ended December 31, 2015, 2014, and 2013, respectively. This revenue is recognized over the life of the loan. Losses are recognized in the period in which they occur.
Note 18. Quarterly Information (unaudited)
The following tables summarize the Company’s quarterly financial information for each of the four quarters of 2015 and 2014:
| 2015 | ||||||||||||||||
| In thousands | First | Second | Third | Fourth | ||||||||||||
| Total revenue |
$ | 52,524 | $ | 53,001 | $ | 55,096 | $ | 56,685 | ||||||||
| Provision for credit losses |
9,712 | 12,102 | 14,085 | 11,449 | ||||||||||||
| General and administrative expenses |
32,623 | 28,243 | 26,182 | 28,550 | ||||||||||||
| Interest expense |
3,604 | 3,932 | 4,335 | 4,350 | ||||||||||||
| Income tax |
2,502 | 3,316 | 3,987 | 4,969 | ||||||||||||
| Net income |
$ | 4,083 | $ | 5,408 | $ | 6,507 | $ | 7,367 | ||||||||
| Net income per common share: |
||||||||||||||||
| Basic |
$ | 0.32 | $ | 0.42 | $ | 0.51 | $ | 0.57 | ||||||||
| Diluted |
$ | 0.31 | $ | 0.41 | $ | 0.50 | $ | 0.56 | ||||||||
104
Table of Contents
| 2014 | ||||||||||||||||
| In thousands | First | Second | Third | Fourth | ||||||||||||
| Total revenue |
$ | 49,581 | $ | 47,437 | $ | 53,909 | $ | 53,792 | ||||||||
| Provision for credit losses |
16,945 | 13,620 | 22,542 | 15,950 | ||||||||||||
| General and administrative expenses |
19,898 | 23,198 | 25,284 | 28,396 | ||||||||||||
| Interest expense |
3,763 | 3,556 | 3,848 | 3,780 | ||||||||||||
| Income tax |
3,365 | 2,649 | 838 | 2,285 | ||||||||||||
| Net income |
$ | 5,610 | $ | 4,414 | $ | 1,397 | $ | 3,381 | ||||||||
| Net income per common share: |
||||||||||||||||
| Basic |
$ | 0.44 | $ | 0.35 | $ | 0.11 | $ | 0.27 | ||||||||
| Diluted |
$ | 0.43 | $ | 0.34 | $ | 0.11 | $ | 0.26 | ||||||||
Note 19. Subsequent Events
In February 2016, the Company announced that the Board has authorized the repurchase of up to $25 million of the Company’s outstanding shares of common stock. The authorization is effective immediately and extends through December 31, 2017. Stock repurchases under the program may be made in the open market at prevailing market prices, through privately negotiated transactions, or through other structures in accordance with applicable federal securities laws, at times and in amounts as management deems appropriate. The timing and the amount of any common stock repurchases will be determined by the Company’s management based on its evaluation of market conditions, the Company’s liquidity needs, legal and contractual requirements and restrictions (including covenants in the Company’s credit agreements), share price, and other factors. Repurchases of common stock may be made under a Rule 10b5-1 plan, which would permit common stock to be repurchased when the Company might otherwise be precluded from doing so under insider trading laws. The repurchase program does not obligate the Company to purchase any particular number of shares and may be suspended, modified, or discontinued at any time without prior notice. The Company intends to fund the program with a combination of cash and debt.
105
Table of Contents
| ITEM 9. | CHANGES IN AND DISAGREEMENTS WITH ACCOUNTANTS ON ACCOUNTING AND FINANCIAL DISCLOSURE. |
Not applicable.
| ITEM 9A. | CONTROLS AND PROCEDURES. |
Evaluation of Disclosure Controls and Procedures
Our management, with the participation of our chief executive officer and chief financial officer, evaluated the effectiveness of our disclosure controls and procedures as of December 31, 2015. The term “disclosure controls and procedures,” as defined in Rules 13a-15(e) and 15d-15(e) under the Securities Exchange Act of 1934, as amended (the “Exchange Act”), means controls and other procedures of a company that are designed to ensure that information required to be disclosed by a company in the reports that it files or submits under the Exchange Act is recorded, processed, summarized, and reported within the time periods specified in the Securities and Exchange Commission’s rules and forms. Disclosure controls and procedures include, without limitation, controls and procedures designed to ensure that information required to be disclosed by a company in the reports that it files or submits under the Exchange Act is accumulated and communicated to the company’s management, including its principal executive and principal financial officers, as appropriate to allow timely decisions regarding required disclosure.
Based on the evaluation of our disclosure controls and procedures as of December 31, 2015, our chief executive officer and chief financial officer concluded that, as of such date, our disclosure controls and procedures were effective. Management recognizes that any controls and procedures, no matter how well designed and operated, can provide only reasonable assurance of achieving their objectives, and management necessarily applies its judgment in evaluating the cost-benefit relationship of possible controls and procedures.
Management’s Report on Internal Control Over Financial Reporting
Management of the Company is responsible for the preparation, integrity, accuracy, and fair presentation of the Consolidated Financial Statements appearing in this Annual Report on Form 10-K for the fiscal year ended December 31, 2015. The financial statements were prepared in conformity with generally accepted accounting principles in the United States (“GAAP”) and include amounts based on judgments and estimates by management.
Management of the Company is responsible for establishing and maintaining adequate internal control over financial reporting, as such term is defined in Rule 13a-15(f) under the Exchange Act. The Company’s internal control over financial reporting is designed to provide reasonable assurance regarding the reliability of financial reporting and the preparation of the Consolidated Financial Statements in accordance with GAAP. Our internal control over financial reporting is supported by internal audits, appropriate reviews by management, policies and guidelines, careful selection and training of qualified personnel, and codes of ethics adopted by our company’s Board of Directors that are applicable to all directors, officers, and employees of our company.
Because of its inherent limitations, no matter how well designed, internal control over financial reporting may not prevent or detect all misstatements. Internal controls can only provide reasonable assurance with respect to financial statement preparation and presentation. Further, the evaluation of the effectiveness of internal control over financial reporting was made as of a specific date, and continued effectiveness in future periods is subject to the risks that the controls may become inadequate because of changes in conditions or that the degree of compliance with the policies and procedures may decline.
Management assessed the effectiveness of the Company’s internal control over financial reporting, with the participation of the Company’s chief executive officer and chief financial officer, as of December 31, 2015. In conducting this assessment, management used the criteria set forth by the Committee of Sponsoring
106
Table of Contents
Organizations of the Treadway Commission in Internal Control—Integrated Framework (2013). Based on our assessment, management believes that the Company maintained effective internal control over financial reporting as of December 31, 2015.
As an “emerging growth company” under the Jumpstart Our Business Startups Act of 2012, we are exempt from the auditor attestation requirements of Section 404 of the Sarbanes-Oxley Act of 2002. As a result, RSM US LLP f/k/a McGladrey LLP, our independent registered public accounting firm, has not audited or issued an attestation report with respect to the effectiveness of our internal control over financial reporting as of December 31, 2015.
Changes in Internal Control
There were no changes in our internal control over financial reporting identified in management’s evaluation pursuant to Rules 13a-15(d) or 15d-15(d) of the Exchange Act that occurred during the quarterly period ended December 31, 2015, that have materially affected, or are reasonably likely to materially affect, our internal control over financial reporting.
| ITEM 9B. | OTHER INFORMATION. |
Not applicable.
107
Table of Contents
PART III
| ITEM 10. | DIRECTORS, EXECUTIVE OFFICERS AND CORPORATE GOVERNANCE. |
The information required under this item is incorporated herein by reference to the information presented under the headings “Proposal One: Election of Directors,” “Corporate Governance Matters,” “Section 16(a) Beneficial Ownership Reporting Compliance,” and “Compensation and Other Information Concerning Our Executive Officers and Directors” in the Company’s definitive proxy statement pursuant to Regulation 14A, which proxy statement will be filed with the Securities and Exchange Commission not later than 120 days after the close of the Company’s fiscal year ended December 31, 2015.
Our Board has adopted a Code of Business Conduct and Ethics (the “Code of Ethics”) and reviews it at least annually. The Code of Ethics applies to all of our directors, officers, and employees and is posted on the Company’s Investor Relations website under the “Corporate Governance” tab at www.regionalmanagement.com. A stockholder may request a copy of the Code of Ethics by contacting our Corporate Secretary at 509 West Butler Road, Greenville, South Carolina 29607. To the extent permissible under applicable law, the rules of the SEC, and NYSE listing standards, we intend to disclose on our website any amendment to our Code of Ethics, or any grant of a waiver from a provision of our Code of Ethics, that requires disclosure under applicable law, the rules of the SEC, or NYSE listing standards.
| ITEM 11. | EXECUTIVE COMPENSATION. |
The information required under this item is incorporated herein by reference to the information presented under the headings “Corporate Governance Matters” and “Compensation and Other Information Concerning Our Executive Officers and Directors” in the Company’s definitive proxy statement pursuant to Regulation 14A, which proxy statement will be filed with the Securities and Exchange Commission not later than 120 days after the close of the Company’s fiscal year ended December 31, 2015.
| ITEM 12. | SECURITY OWNERSHIP OF CERTAIN BENEFICIAL OWNERS AND MANAGEMENT AND RELATED STOCKHOLDER MATTERS. |
The information required under this item is incorporated herein by reference to the information presented under the headings “Security Ownership of Certain Beneficial Owners and Management” and “Compensation and Other Information Concerning Our Executive Officers and Directors” in the Company’s definitive proxy statement pursuant to Regulation 14A, which proxy statement will be filed with the Securities and Exchange Commission not later than 120 days after the close of the Company’s fiscal year ended December 31, 2015.
| ITEM 13. | CERTAIN RELATIONSHIPS AND RELATED TRANSACTIONS, AND DIRECTOR INDEPENDENCE. |
The information required under this item is incorporated herein by reference to the information presented under the headings “Certain Relationships and Related Person Transactions” and “Corporate Governance Matters” in the Company’s definitive proxy statement pursuant to Regulation 14A, which proxy statement will be filed with the Securities and Exchange Commission not later than 120 days after the close of the Company’s fiscal year ended December 31, 2015.
| ITEM 14. | PRINCIPAL ACCOUNTING FEES AND SERVICES. |
The information required under this item is incorporated herein by reference to the information presented under the heading “Proposal Two: Ratification of the Appointment of Our Independent Registered Public Accounting Firm” in the Company’s definitive proxy statement pursuant to Regulation 14A, which proxy statement will be filed with the Securities and Exchange Commission not later than 120 days after the close of the Company’s fiscal year ended December 31, 2015.
108
Table of Contents
PART IV
| ITEM 15. | EXHIBITS, FINANCIAL STATEMENT SCHEDULES. |
| (a) | The following documents are filed as part of this report: |
| (1) | Financial Statements: |
| (i) | Report of Independent Registered Public Accounting Firm |
| (ii) | Consolidated Balance Sheets at December 31, 2015 and December 31, 2014 |
| (iii) | Consolidated Statements of Income for the Years Ended December 31, 2015, December 31, 2014, and December 31, 2013 |
| (iv) | Consolidated Statements of Stockholders’ Equity for the Years Ended December 31, 2015, December 31, 2014, and December 31, 2013 |
| (v) | Consolidated Statements of Cash Flows for the Years Ended December 31, 2015, December 31, 2014, and December 31, 2013 |
| (vi) | Notes to Consolidated Financial Statements |
| (2) | Financial Statement Schedules: None. Financial statement schedules have been omitted since the required information is included in our consolidated financial statements contained elsewhere in this Annual Report on Form 10-K. |
| (3) | Exhibits: The exhibits listed in the accompanying Exhibit Index are filed as a part of this Annual Report on Form 10-K. |
| (b) | Exhibits: The exhibits listed in the accompanying Exhibit Index are filed as a part of this Annual Report on Form 10-K. |
| (c) | Separate Financial Statements and Schedules: None. Financial statement schedules have been omitted since the required information is included in our consolidated financial statements contained elsewhere in this Annual Report on Form 10-K. |
109
Table of Contents
Pursuant to the requirements of Section 13 or 15(d) of the Securities Exchange Act of 1934, the registrant has duly caused this report to be signed on its behalf by the undersigned, thereunto duly authorized.
| Regional Management Corp. | ||||||
| Date: February 23, 2016 |
/s/ Michael R. Dunn | |||||
| By: Michael R. Dunn | ||||||
| Its: Chief Executive Officer | ||||||
POWER OF ATTORNEY
KNOW ALL PERSONS BY THESE PRESENTS, that each person whose signature appears below constitutes and appoints Michael R. Dunn and Donald E. Thomas, and each of them, jointly and severally, as true and lawful attorneys-in-fact and agents, with full power of substitution and re-substitution for him and in his name, place, and stead, in any and all capacities, to sign any and all amendments to this Annual Report on Form 10-K, and to file the same, with all exhibits thereto, and other documents in connection therewith, with the Securities and Exchange Commission, granting unto said attorneys-in-fact and agents, and each of them, full power and authority to do and perform each and every act and thing requisite and necessary to be done, as fully to all intents and purposes as he might or could do in person, hereby ratifying and confirming all which said attorneys-in-fact and agents or any of them, or their or his substitute or substitutes, may lawfully do or cause to be done by virtue hereof.
Pursuant to the requirements of the Securities Exchange Act of 1934, this report has been signed below by the following persons on behalf of the registrant and in the capacities indicated on February 23, 2016.
| /s/ Michael R. Dunn |
Name: | Michael R. Dunn | ||
| Title: | Chief Executive Officer and Director (principal executive officer) | |||
| /s/ Donald E. Thomas |
Name: | Donald E. Thomas | ||
| Title: | Executive Vice President and Chief Financial Officer (principal financial officer and principal accounting officer) | |||
| /s/ Alvaro G. de Molina |
Name: | Alvaro G. de Molina | ||
| Title: | Chairman of the Board of Directors | |||
| /s/ Roel C. Campos |
Name: | Roel C. Campos | ||
| Title: | Director | |||
| /s/ Steven J. Freiberg |
Name: | Steven J. Freiberg | ||
| Title: | Director | |||
| /s/ Richard A. Godley |
Name: | Richard A. Godley | ||
| Title: | Director | |||
| /s/ Peter R. Knitzer |
Name: | Peter R. Knitzer | ||
| Title: | Director | |||
| /s/ Carlos Palomares |
Name: | Carlos Palomares | ||
| Title: | Director | |||
110
Table of Contents
| Incorporated by Reference | ||||||||||||
| Exhibit Number |
Exhibit Description |
Filed |
Form |
File |
Exhibit |
Filing | ||||||
| 3.1 | Amended and Restated Certificate of Incorporation of Regional Management Corp. | 8-K | 001-35477 | 3.1 | 4/2/2012 | |||||||
| 3.2 | Amended and Restated Bylaws of Regional Management Corp. | 8-K | 001-35477 | 3.2 | 4/2/2012 | |||||||
| 10.1 | Amended and Restated Shareholders Agreement, dated as of March 27, 2012, among Regional Management Corp., Parallel 2005 Equity Fund, LP, Palladium Equity Partners III, L.P., and the other stockholders party thereto | 8-K | 001-35477 | 10.1 | 4/2/2012 | |||||||
| 10.2 | Fifth Amended and Restated Loan and Security Agreement, dated as of September 18, 2015, by and among Regional Management Corp., Regional Finance Corporation of South Carolina, Regional Finance Corporation of Georgia, Regional Finance Corporation of Texas, Regional Finance Corporation of North Carolina, Regional Finance Corporation of Alabama, Regional Finance Corporation of Tennessee, Regional Finance Company of New Mexico, LLC, Regional Finance Company of Oklahoma, LLC, Regional Finance Company of Missouri, LLC, Regional Finance Company of Georgia, LLC, RMC Financial Services of Florida, LLC, Regional Finance Company of Louisiana, LLC, Regional Finance Company of Mississippi, LLC, Regional Finance Company of Kentucky, LLC, Regional Finance Company of Virginia, LLC, Bank of America, N.A., BMO Harris Financing, First Tennessee Bank National Association, Capital One, N.A., Texas Capital Bank, N.A., Wells Fargo Bank, National Association, Capital Bank, N.A., and Bank of America, N.A., as Agent | 8-K | 001-35477 | 10.1 | 9/21/2015 | |||||||
| 10.3 | Credit Agreement, dated as of December 11, 2015, by and among Regional Management Receivables, LLC, as borrower, Regional Management Corp., as servicer, the lenders from time to time parties thereto, Wells Fargo Securities, LLC, as administrative agent for the lenders, and Wells Fargo Bank, National Association, as account bank, collateral custodian, and backup servicer | 8-K | 001-35477 | 10.1 | 12/14/2015 | |||||||
111
Table of Contents
| 10.4† | Regional Management Corp. 2007 Management Incentive Plan | S-1/A | 333-174245 | 10.4 | 6/23/2011 | |||||||
| 10.5.1† | Regional Management Corp. 2011 Stock Incentive Plan and Forms of Nonqualified Stock Option Agreement | S-1/A | 333-174245 | 10.5 | 8/4/2011 | |||||||
| 10.5.2† | Form of Stock Award Agreement under the 2011 Stock Incentive Plan | 10-K | 001-35477 | 10.4.2 | 3/17/2014 | |||||||
| 10.5.3† | Form of Restricted Stock Award Agreement under the 2011 Stock Incentive Plan (form for director grants) | 10-K | 001-35477 | 10.4.3 | 3/17/2014 | |||||||
| 10.5.4† | Form of Nonqualified Stock Option Agreement under the 2011 Stock Incentive Plan (form for grants on or after October 1, 2014) | 8-K | 001-35477 | 10.1 | 10/7/2014 | |||||||
| 10.5.5† | Form of Performance-Contingent Restricted Stock Unit Award Agreement under the 2011 Stock Incentive Plan | 8-K | 001-35477 | 10.2 | 10/7/2014 | |||||||
| 10.5.6† | Form of Cash-Settled Performance Share Award Agreement under the 2011 Stock Incentive Plan | 8-K | 001-35477 | 10.3 | 10/7/2014 | |||||||
| 10.5.7† | Form of Restricted Stock Award Agreement under the 2011 Stock Incentive Plan (form for employee grants) | 8-K | 001-35477 | 10.4 | 10/7/2014 | |||||||
| 10.6.1† | Regional Management Corp. 2015 Long-Term Incentive Plan | 8-K | 001-35477 | 10.1 | 4/28/2015 | |||||||
| 10.6.2† | Form of Nonqualified Stock Option Agreement under the 2015 Long-Term Incentive Plan | 8-K | 001-35477 | 10.3 | 4/28/2015 | |||||||
| 10.6.3† | Form of Performance-Contingent Restricted Stock Unit Award Agreement under the 2015 Long-Term Incentive Plan | 8-K | 001-35477 | 10.4 | 4/28/2015 | |||||||
| 10.6.4† | Form of Cash-Settled Performance Unit Award Agreement under the 2015 Long-Term Incentive Plan | 8-K | 001-35477 | 10.5 | 4/28/2015 | |||||||
| 10.6.5† | Form of Restricted Stock Award Agreement under the 2015 Long-Term Incentive Plan | 8-K | 001-35477 | 10.6 | 4/28/2015 | |||||||
| 10.6.6† | Form of Stock Award Agreement under the 2015 Long-Term Incentive Plan | 8-K | 001-35477 | 10.7 | 4/28/2015 | |||||||
| 10.7† | Regional Management Corp. Annual Incentive Plan (as amended and restated effective March 23, 2015) | 8-K | 001-35477 | 10.2 | 4/28/2015 | |||||||
| 10.8† | Description of Non-Employee Director Compensation Program | X | ||||||||||
112
Table of Contents
| 10.9† | Separation Agreement, dated as of December 11, 2014, between Thomas F. Fortin and Regional Management Corp. | 8-K | 001-35477 | 10.1 | 12/17/2014 | |||||||
| 10.10† | Employment Agreement, dated as of January 12, 2015, between Michael R. Dunn and Regional Management Corp. | 8-K | 001-35477 | 10.1 | 1/14/2015 | |||||||
| 10.11† | Employment Agreement, dated as of September 19, 2014, between Jody L. Anderson and Regional Management Corp. | 8-K | 001-35477 | 10.1 | 9/25/2014 | |||||||
| 10.12.1† | Letter Agreement, dated as of December 12, 2012, between Regional Management Corp. and Donald E. Thomas | 8-K | 001-35477 | 10.1 | 12/18/2012 | |||||||
| 10.12.2† | Amendment to Employment Offer Letter, dated as of October 1, 2014, between Regional Management Corp. and Donald E. Thomas | 8-K | 001-35477 | 10.5 | 10/7/2014 | |||||||
| 10.13† | Letter Agreement, dated as of January 5, 2015, between Regional Management Corp. and Daniel J. Taggart | 10-K | 001-35477 | 10.12 | 3/16/2015 | |||||||
| 10.14† | Letter Agreement, dated as of December 12, 2012, between Regional Management Corp. and Brian J. Fisher | 10-K | 001-35477 | 10.11 | 3/18/2013 | |||||||
| 10.15† | Option Award Agreement, dated as of October 11, 2007, between Regional Management Corp. and C. Glynn Quattlebaum | S-1/A | 333-174245 | 10.10 | 6/23/2011 | |||||||
| 10.16† | Option Award Agreement, dated as of February 26, 2008, between Regional Management Corp. and Thomas F. Fortin | S-1/A | 333-174245 | 10.8 | 6/23/2011 | |||||||
| 10.17† | Form of Retention Award Agreement | 8-K | 001-35477 | 10.1 | 3/13/2015 | |||||||
| 10.18† | Separation Agreement between A. Michelle Masters and Regional Management Corp., dated May 27, 2015 | 8-K | 001-35477 | 10.1 | 6/2/2015 | |||||||
| 10.19.1# | On-Line Computer Service Agreement, dated October 25, 2013, by and between DHI Computing Service, Inc. d/b/a GOLDPoint Systems and Regional Management Corp. | 8-K | 001-35477 | 10.1 | 10/30/2013 | |||||||
| 10.19.2 | Termination Agreement and Mutual Release, dated April 2, 2015, by and between DHI Computing Service, Inc. d/b/a GOLDPoint Systems and Regional Management Corp. | 8-K | 001-35477 | 10.1 | 4/6/2015 | |||||||
113
Table of Contents
| 21.1 | Subsidiaries of Regional Management Corp. | X | ||||||||||
| 23.1 | Consent of RSM US LLP | X | ||||||||||
| 31.1 | Rule 13a-14(a) / 15(d)-14(a) Certification of Principal Executive Officer | X | ||||||||||
| 31.2 | Rule 13a-14(a) / 15(d)-14(a) Certification of Principal Financial Officer | X | ||||||||||
| 32 | Section 1350 Certifications | X | ||||||||||
| 101 | The following materials from our Annual Report on Form 10-K for the year ended December 31, 2015, formatted in XBRL (eXtensible Business Reporting Language): (i) the Consolidated Balance Sheets as of December 31, 2015 and December 31, 2014, (ii) the Consolidated Statements of Income for the years ended December 31, 2015, December 31, 2014, and December 31, 2013, (iii) the Consolidated Statements of Stockholders’ Equity for the years ended December 31, 2015, December 31, 2014, and December 31, 2013, (iv) the Consolidated Statements of Cash Flows for the years ended December 31, 2015, December 31, 2014, and December 31, 2013, and (v) the Notes to the Consolidated Financial Statements, tagged as blocks of text | X | ||||||||||
| † | Indicates a management contract or a compensatory plan, contract, or arrangement. |
| # | Confidential treatment has been granted with respect to certain portions of this Exhibit, which portions have been omitted and filed separately with the Securities and Exchange Commission as part of an application for confidential treatment. |
114