Attached files
| file | filename |
|---|---|
| EX-99.1 - EX-99.1 - Cotiviti Holdings, Inc. | ex-99d1.htm |
| 8-K - 8-K - Cotiviti Holdings, Inc. | f8-k.htm |
Exhibit 99.2
|
|
Analytics. Insight. Value. Cotiviti 2018 First Quarter Financial Supplement As of March 31, 2018 |
|
|
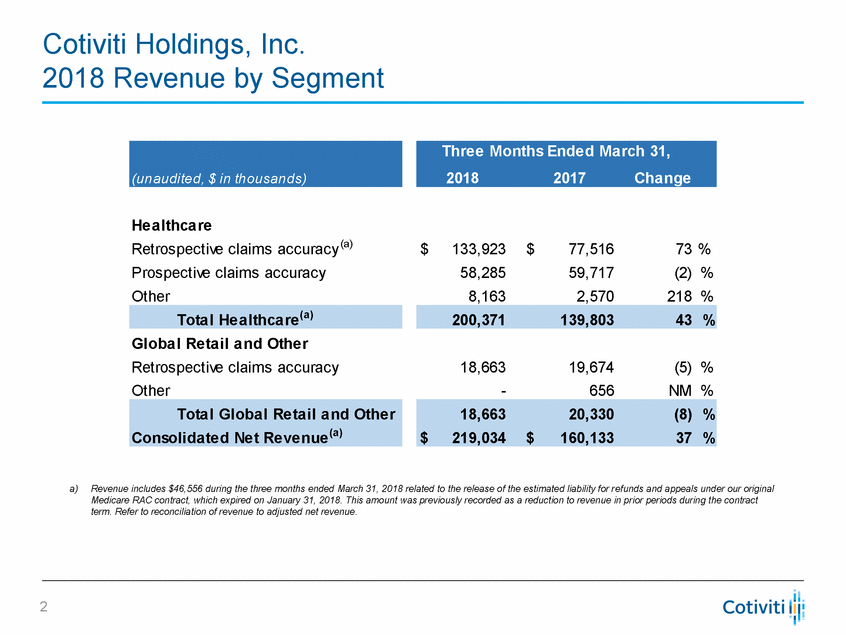
Cotiviti Holdings, Inc. 2018 Revenue by Segment Healthcare Retrospective claims accuracy(a) Prospective claims accuracy Other $ 133,923 58,285 8,163 $ 77,516 59,717 2,570 73 % (2) 218 % % Global Retail and Other Retrospective claims accuracy Other 18,663 - 19,674 656 (5) NM % % a)Revenue includes $46,556 during the three months ended March 31, 2018 related to the release of the estimated liability for refunds and appeals under our original Medicare RAC contract, which expired on January 31, 2018. This amount was previously recorded as a reduction to revenue in prior periods during the contract term. Refer to reconciliation of revenue to adjusted net revenue. 2 18,66320,330(8) % $219,034$160,13337 % Total Global Retail and Other Consolidated Net Revenue(a) 200,371139,80343 % Total Healthcare(a) Three Months Ended March 31, 20182017Change (unaudited, $ in thousands) |
|
|
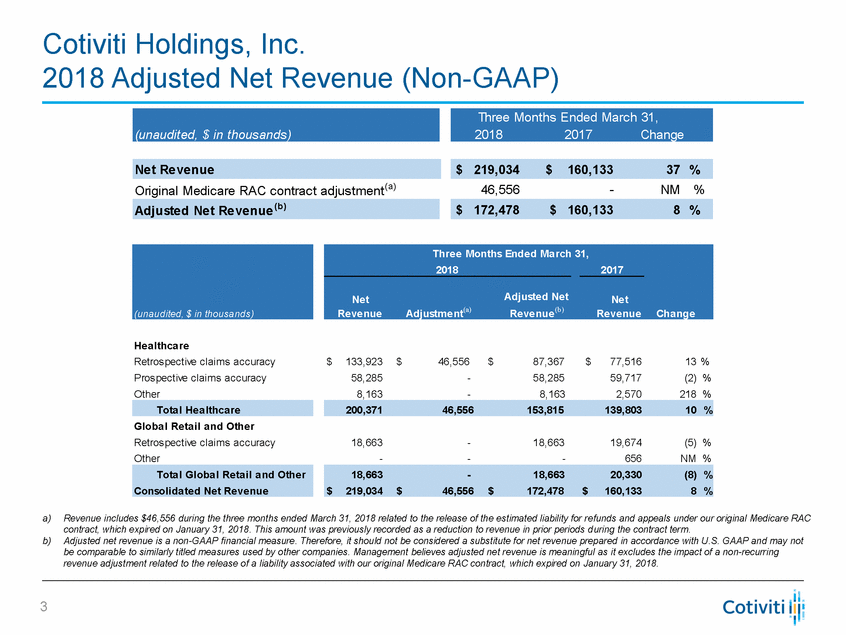
Cotiviti Holdings, Inc. 2018 Adjusted Net Revenue (Non-GAAP) Original Medicare RAC contract adjustment (a) 46,556 - NM % Adjusted Net Revenue (b) Healthcare Retrospective claims accuracy Prospective claims accuracy Other $ 133,923 58,285 8,163 $ 46,556 - - $ 87,367 58,285 8,163 $ 77,516 59,717 2,570 13 % (2) % 218 % Global Retail and Other Retrospective claims accuracy Other 18,663 - - - 18,663 - 19,674 656 (5) % NM % Total Global Retail and Other Consolidated Net Revenue a)Revenue includes $46,556 during the three months ended March 31, 2018 related to the release of the estimated liability for refunds and appeals under our original Medicare RAC contract, which expired on January 31, 2018. This amount was previously recorded as a reduction to revenue in prior periods during the contract term. b)Adjusted net revenue is a non-GAAP financial measure. Therefore, it should not be considered a substitute for net revenue prepared in accordance with U.S. GAAP and may not be comparable to similarly titled measures used by other companies. Management believes adjusted net revenue is meaningful as it excludes the impact of a non-recurring revenue adjustment related to the release of a liability associated with our original Medicare RAC contract, which expired on January 31, 2018. 3 18,663-18,66320,330(8) % $219,034$46,556$172,478$160,1338 % 200,37146,556153,815139,80310 % Total Healthcare Three Months Ended March 2018 31, 2017 Net RevenueChange NetAdjusted Net RevenueAdjustment(a)Revenue(b) (unaudited, $ in thousands) $ 172,478 $ 160,133 8 % $ 219,034 $ 160,133 37 % Net Revenue Three Months Ended March 31, 2018 2017 Change (unaudited, $ in thousands) 3 |
|
|
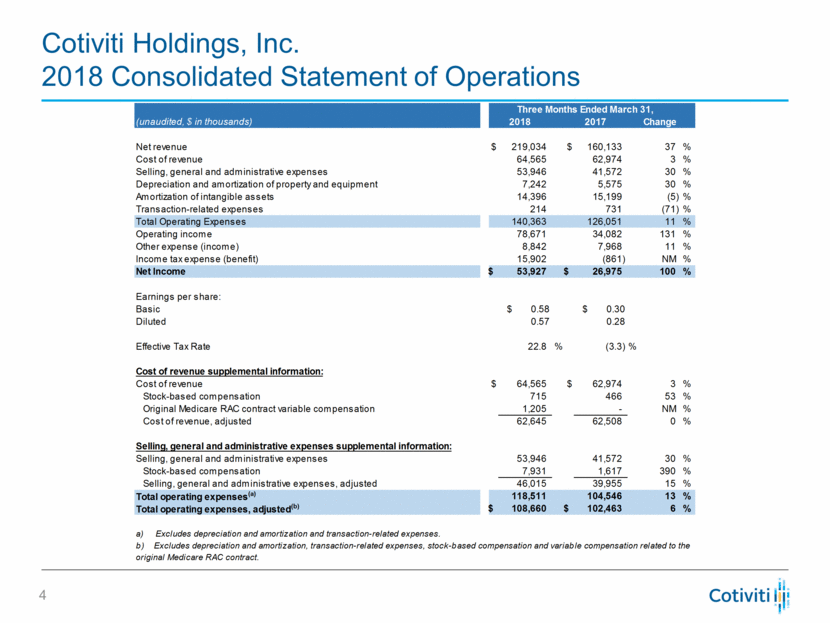
Cotiviti Holdings, Inc. 2018 Consolidated Statement of Operations (unaudited, $ in thousands) Change Net revenue $ 219,034 $ 160,133 37 % Cost of revenue 64,565 62,974 3 % Selling, general and administrative expenses 53,946 41,572 30 % Depreciation and amortization of property and equipment 7,242 5,575 30 % Amortization of intangible assets 14,396 15,199 (5) % Transaction-related expenses 214 731 (71) % Total Operating Expenses 140,363 126,051 11 % Operating income 78,671 34,082 131 % Other expense (income) 8,842 7,968 11 % Income tax expense (benefit) 15,902 (861) NM % Net Income $ 53,927 $ 26,975 100 % Earnings per share: Basic $ 0.58 $ 0.30 Diluted 0.57 0.28 Effective Tax Rate 22.8 % (3.3) % Cost of revenue supplemental information: Cost of revenue $ 64,565 $ 62,974 3 % Stock-based compensation 715 466 53 % Original Medicare RAC contract variable compensation 1,205 - NM % Cost of revenue, adjusted 62,645 62,508 0 % Selling, general and administrative expenses supplemental information: Selling, general and administrative expenses 53,946 41,572 30 % Stock-based compensation 7,931 1,617 390 % Selling, general and administrative expenses, adjusted 46,015 39,955 15 % Total operating expenses (a) 118,511 104,546 13 % Total operating expenses, adjusted (b) $ 108,660 $ 102,463 6 % a) Excludes depreciation and amortization and transaction-related expenses. b) Excludes depreciation and amortization, transaction-related expenses, stock-based compensation and variable compensation related to the original Medicare RAC contract. Three Months Ended March 31, 2018 2017 |
|
|
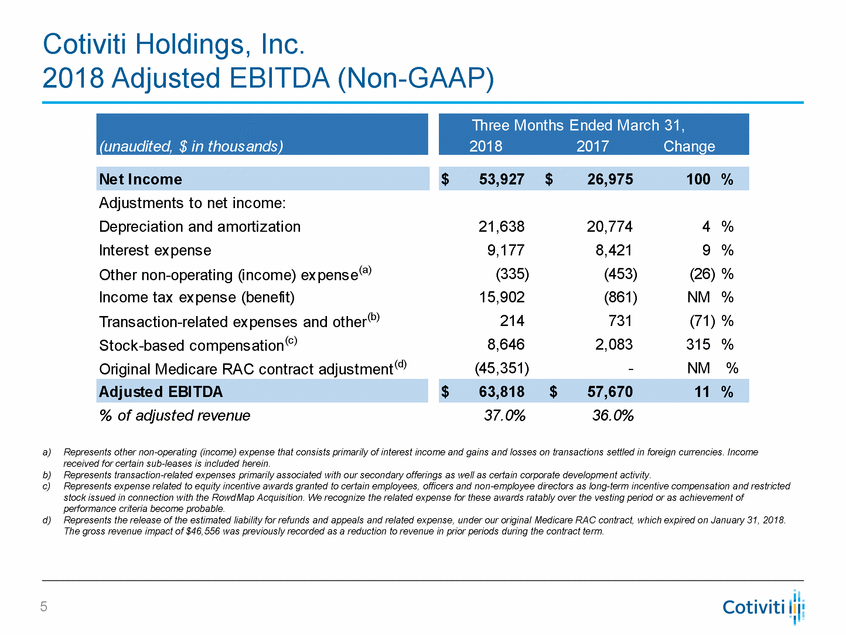
Cotiviti Holdings, Inc. 2018 Adjusted EBITDA (Non-GAAP) Adjustments to net income: Depreciation and amortization Interest expense Other non-operating (income) expense(a) Income tax expense (benefit) Transaction-related expenses and other(b) Stock-based compensation(c) Original Medicare RAC contract adjustment(d) 21,638 9,177 (335) 15,902 214 8,646 (45,351) 20,774 8,421 (453) (861) 731 2,083 - 4 % 9 % (26) % NM % (71) % 315 % NM % % of adjusted revenue 37.0% 36.0% a) Represents other non-operating (income) expense that consists primarily of interest income and gains and losses on transactions settled in foreign currencies. Income received for certain sub-leases is included herein. Represents transaction-related expenses primarily associated with our secondary offerings as well as certain corporate development activity. Represents expense related to equity incentive awards granted to certain employees, officers and non-employee directors as long-term incentive compensation and restricted stock issued in connection with the RowdMap Acquisition. We recognize the related expense for these awards ratably over the vesting period or as achievement of performance criteria become probable. Represents the release of the estimated liability for refunds and appeals and related expense, under our original Medicare RAC contract, which expired on January 31, 2018. The gross revenue impact of $46,556 was previously recorded as a reduction to revenue in prior periods during the contract term. b) c) d) 5 $63,818$57,67011 % Adjusted EBITDA $53,927$26,975100 % Net Income Three Months Ended March 31, 20182017Change (unaudited, $ in thousands) |
|
|
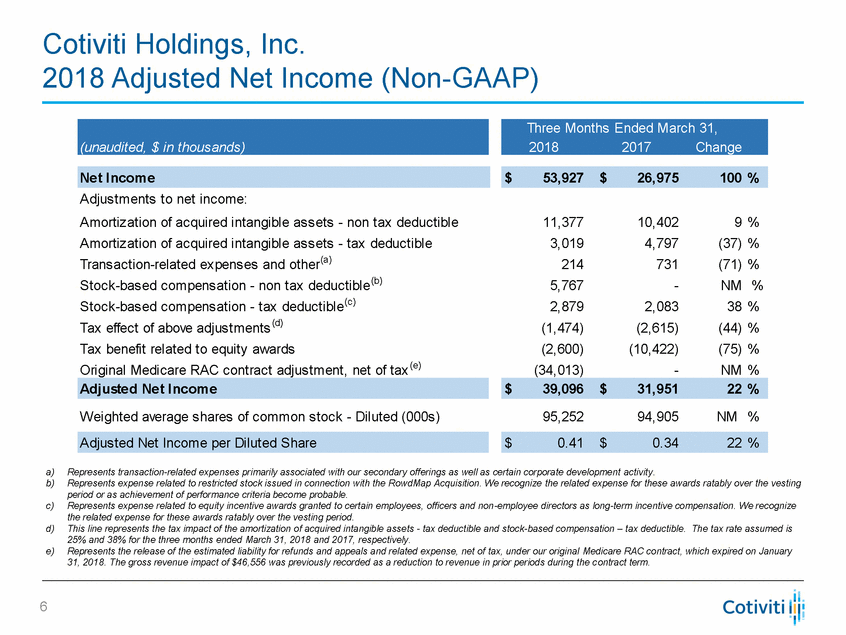
Cotiviti Holdings, Inc. 2018 Adjusted Net Income (Non-GAAP) Adjustments to net income: Amortization of acquired intangible assets - non tax deductible Amortization of acquired intangible assets - tax deductible Transaction-related expenses and other(a) Stock-based compensation - non tax deductible(b) Stock-based compensation - tax deductible(c) Tax effect of above adjustments (d) Tax benefit related to equity awards Original Medicare RAC contract adjustment, net of tax (e) 11,377 3,019 214 5,767 2,879 (1,474) (2,600) (34,013) 10,402 4,797 731 - 2,083 (2,615) (10,422) - 9 % (37) % (71) % NM % 38 % (44) % (75) % NM % Weighted average shares of common stock - Diluted (000s) 95,252 94,905 NM % a) b) Represents transaction-related expenses primarily associated with our secondary offerings as well as certain corporate development activity. Represents expense related to restricted stock issued in connection with the RowdMap Acquisition. We recognize the related expense for these awards ratably over the vesting period or as achievement of performance criteria become probable. Represents expense related to equity incentive awards granted to certain employees, officers and non-employee directors as long-term incentive compensation. We recognize the related expense for these awards ratably over the vesting period. This line represents the tax impact of the amortization of acquired intangible assets - tax deductible and stock-based compensation – tax deductible. The tax rate assumed is 25% and 38% for the three months ended March 31, 2018 and 2017, respectively. Represents the release of the estimated liability for refunds and appeals and related expense, net of tax, under our original Medicare RAC contract, which expired on January 31, 2018. The gross revenue impact of $46,556 was previously recorded as a reduction to revenue in prior periods during the contract term. c) d) e) 6 $ 0.41 $ 0.34 22 % Adjusted Net Income per Diluted Share $ 39,096 $ 31,951 22 % Adjusted Net Income $ 53,927 $ 26,975 100 % Net Income Three Months Ended March 31, 2018 2017 Change (unaudited, $ in thousands) |
|
|
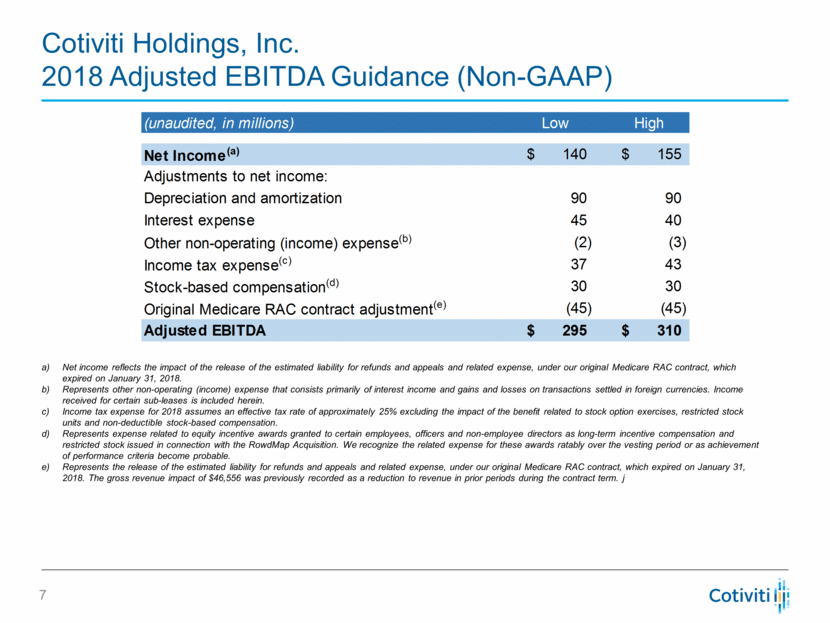
Cotiviti Holdings, Inc. 2018 Adjusted EBITDA Guidance (Non-GAAP) Net income reflects the impact of the release of the estimated liability for refunds and appeals and related expense, under our original Medicare RAC contract, which expired on January 31, 2018. Represents other non-operating (income) expense that consists primarily of interest income and gains and losses on transactions settled in foreign currencies. Income received for certain sub-leases is included herein. Income tax expense for 2018 assumes an effective tax rate of approximately 25% excluding the impact of the benefit related to stock option exercises, restricted stock units and non-deductible stock-based compensation. Represents expense related to equity incentive awards granted to certain employees, officers and non-employee directors as long-term incentive compensation and restricted stock issued in connection with the RowdMap Acquisition. We recognize the related expense for these awards ratably over the vesting period or as achievement of performance criteria become probable. Represents the release of the estimated liability for refunds and appeals and related expense, under our original Medicare RAC contract, which expired on January 31, 2018. The gross revenue impact of $46,556 was previously recorded as a reduction to revenue in prior periods during the contract term. j (unaudited, in millions) Low High Net Income (a) 140 $ 155 $ Adjustments to net income: Depreciation and amortization 90 90 Interest expense 45 40 Other non-operating (income) expense (b) (2) (3) Income tax expense (c) 37 43 Stock-based compensation (d) 30 30 Original Medicare RAC contract adjustment (e) (45) (45) Adjusted EBITDA 295 $ 310 $ |
|
|
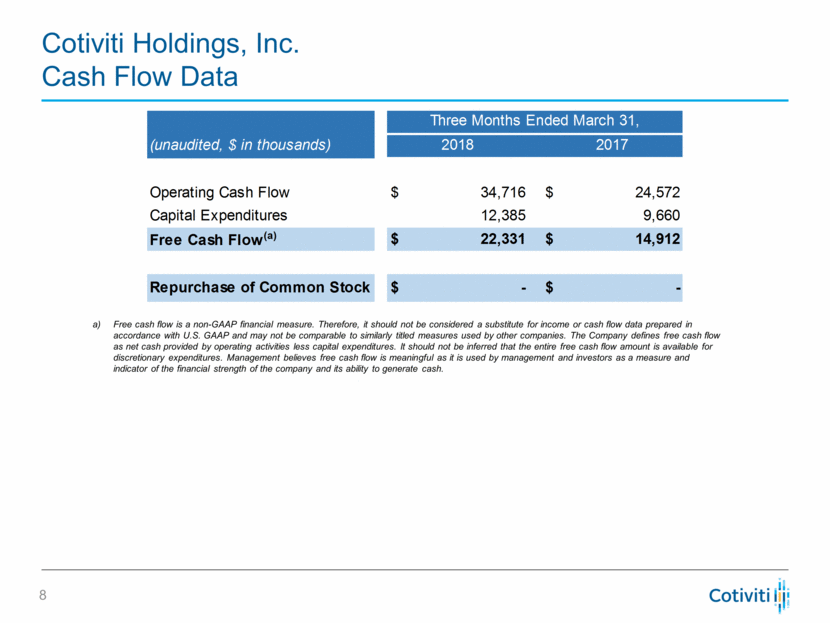
Cotiviti Holdings, Inc. Cash Flow Data Free cash flow is a non-GAAP financial measure. Therefore, it should not be considered a substitute for income or cash flow data prepared in accordance with U.S. GAAP and may not be comparable to similarly titled measures used by other companies. The Company defines free cash flow as net cash provided by operating activities less capital expenditures. It should not be inferred that the entire free cash flow amount is available for discretionary expenditures. Management believes free cash flow is meaningful as it is used by management and investors as a measure and indicator of the financial strength of the company and its ability to generate cash. Operating Cash Flow $ 34,716 $ 24,572 Capital Expenditures 12,385 9,660 Free Cash Flow (a) $ 22,331 $ 14,912 Repurchase of Common Stock $ - $ - (unaudited, $ in thousands) Three Months Ended March 31, 2018 2017 |
|
|
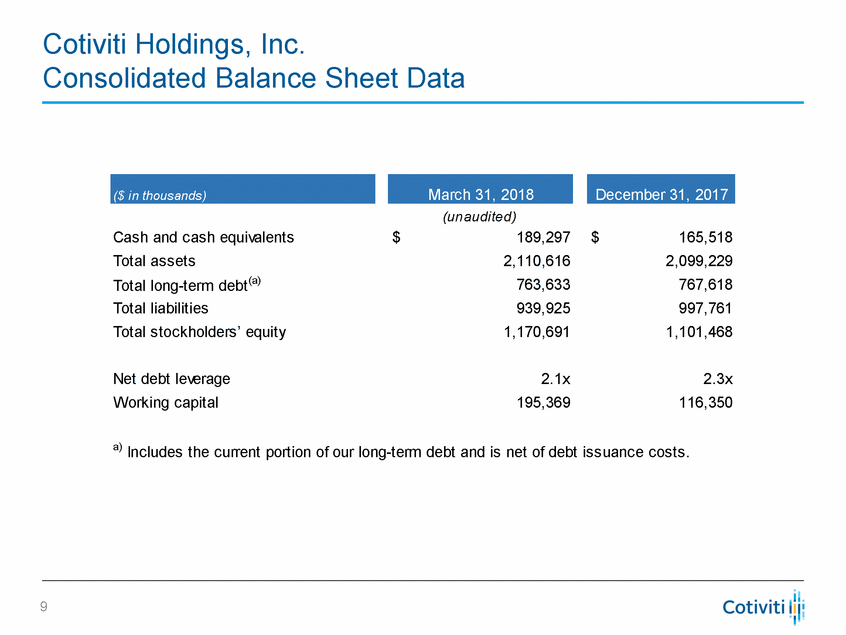
Cotiviti Holdings, Inc. Consolidated Balance Sheet Data (unaudited) Cash and cash equivalents Total assets Total long-term debt(a) Total liabilities Total stockholders’ equity $ 189,297 2,110,616 763,633 939,925 1,170,691 $ 165,518 2,099,229 767,618 997,761 1,101,468 Net debt leverage Working capital 2.1x 195,369 2.3x 116,350 a) Includes the current portion of our long-term debt and is net of debt issuance costs. 9 December 31, 2017 March 31, 2018 ($ in thousands) |
|
|
Analytics. Insight. Value. cotiviti |

