Attached files
| file | filename |
|---|---|
| EX-99.1 - EXHIBIT 99.1 - SB ONE BANCORP | tv491945_ex99-1.htm |
| 8-K - FORM 8-K - SB ONE BANCORP | tv491945_8k.htm |
Exhibit 99.2

Annual Meeting April 25, 2018

Welcome Edward J. Leppert – Chairman of the Board Anthony Labozzetta – President and Chief Executive Officer Steven Fusco – Senior Executive Vice President and Chief Financial Officer 2

3 Agenda • Chairman’s Message • Company and Market Overview • Financial Performance • Growth in Shareholder Value • Strategic Vision • CEO Presentation

Chairman’s Message

CEO Presentation

This presentation , and the oral presentation that supplements it, have been developed by SB One Bancorp (“SB One” or the “Company”), and are not an offer or the solicitation of an offer to buy securities. Neither this presentation, nor the oral presentation that supplements it, nor any of their contents, may be used, reproduced, disseminated, quoted or referred to for any other purpose, in whole or in part, without the prior written consent of the Company. Some of the statements contained in this presentation are “forward - looking statements” within the meaning of Section 27A of the Securities Act of 1933, as amended, and Section 21E of the Securities Exchange Act of 1934, as amended. When used in this presentation, words such as “may,” “plan,” “contemplate,” “anticipate,” “believe,” “intend,” “continue,” “expect,” “project,” “predict,” “estimate,” “target,” “could,” “is likely,” “should,” “would,” “will,” or similar expressions are intended to ide nti fy “forward - looking statements” within the meaning of the Private Securities Litigation Reform Act of 1995. You are cautioned not t o place undue reliance on any forward - looking statements, which speak only as of the date made. These statements may relate to the Company’s future financial performance, strategic plans or objectives, revenue, expense or earnings projections, or other financial items. By their nature, these statements are subject to numerous uncertainties that could cause actual results to dif fer materially from those anticipated in the statements . Factors that may cause actual results to differ materially from those contemplated by such forward - looking statements include, among others, changes to interest rates, the ability to control costs and expenses, general economic conditions, the success of the Company’s efforts to diversify its revenue base by developing additional sources of non - interest income while continuing to manage its existing fee - based business, risks associated with the quality of the Company’s assets, the ability of its borrowers to comply with repayment terms, the inability to realize expected cost savings or to implement integration plans and other adver se consequences associated with the acquisition of Community Bank of Bergen County, NJ (“Community Bank”), the inability to retain Community Bank’s customers, the risk that the businesses of Community Bank and the Bank may not be combined successfully or may take longer than expected, and the diversion of management’s time on issues relating to integration of Community. Further information about these and other relevant risks and uncertainties may be found in the Company’s Annual Report on Form 10 - K for the fiscal year ended December 31, 2017 and in subsequent filings with the Securities and Exchange Commission. The Company undertakes no obligation to publicly release the results of any revisions to those forward looking statements that may be made to reflect events or circumstances after this date or to reflect the occurrence of unanticipated events. 6 FORWARD - LOOKING STATEMENT

Company and Market Overview
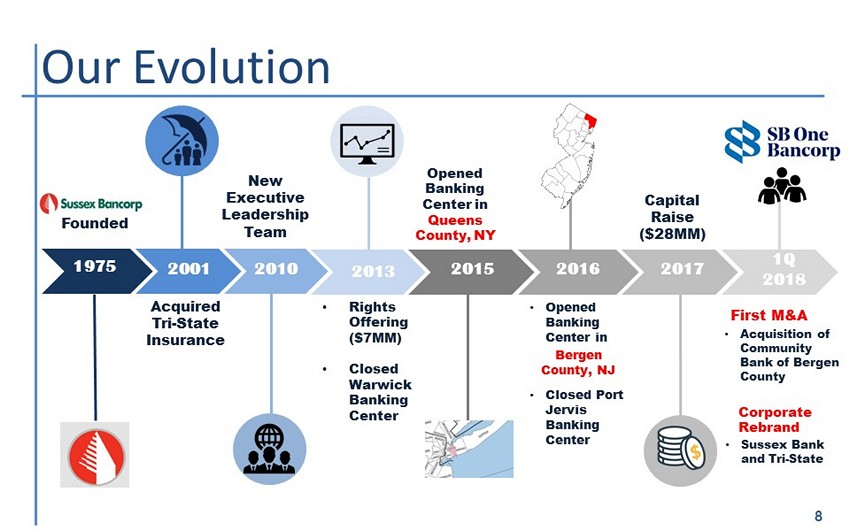
2010 8 Our Evolution Acquired Tri - State Insurance Founded • Acquisition of Community Bank of Bergen County Opened Banking Center in Queens County, NY First M&A 1975 2001 New Executive Leadership Team 2013 • Rights Offering ($7MM) • Closed Warwick Banking Center 2015 2016 • Opened Banking Center in Bergen County, NJ • Closed Port Jervis Banking Center 2017 1Q 2018 Corporate Rebrand Capital Raise ($28MM) • Sussex Bank and Tri - State

□ Operating in one of the most desirable and competitive MSAs* (NY/NJ) in the US □ New York and New Jersey are some of the most densely populated and attractive markets in the US 9 * Source: SNL Company Overview □ $ 1.4 Billion in Total Assets □ $1.1 billion in net loans □ $1.0 billion in total deposits □ 14 Branch Locations □ Corporate offices in Rockaway and Rochelle Park □ Regional Lending Offices in Sussex, Bergen and Morris Counties, NJ & Queens, NYC Coming soon: Weehawken, NJ (Hudson County) □ NASDAQ: SBBX* □ 12/31/2009: $11MM □ 04/19/2018: $238MM As at 03 - 31 - 2018 Market Capitalization

Ticker Symbol SBBX 4 - 21 - 2017 SBBX 4 - 19 - 2018 Closing Price * $24.40 $30.05 Price to tangible book value per common share * 199.5% 198.7% Price to LTM EPS * (reported 12/31/2017) 20.5x 28.6x Price to 2018 Yr. est. EPS* 17.5x 15.4x Annualized Dividend/ Yield * $0.16 / 0.7% $0.24/ 0.8% 52 week high * $26.45 (3/17/17) $32.85 (3/08/18) 52 week low* $12.54 (5/9/16) $19.75 (9/19/17) 10 * Source: SNL Company Market Overview

Financial Performance

2017 and 1Q 2018 Highlights 12 □ Raised $28 million in common stock offering in June of 2017, issuing 1.25 million shares RECORD EARNINGS □ Issued $15 million in fixed - to - floating rate subordinated notes due 2026 in Dec ‘16. FY ‘17 included the full year absorption of $860,000 in interest expense CAPITAL □ Merger between Sussex Bank and Community Bank of Bergen County (“CBBC”) completed January 4, 2018; □ Full systems and staff integration successfully completed March 26, 2018 □ Total Assets grew from $979 million(12/31/17) to approximately $1.4 billion(03/31/18) M&A ACTIVITY □ Record earnings for FY ‘17 of $7.7 million excluding M&A and Capital Raise costs □ FY ‘17 vs. FY ‘16 ▪ Net Loans: +18% ▪ Deposits : +15% ▪ TSIA: +18%

13 Performance Trends - Deposits $430 $458 $518 $661 $762 FY-13 FY-14 FY-15 FY-16 FY-17 +15% Deposits ($ in millions) Deposit Mix, FY End ‘17 19% 25% 13% 19% 24% Demand, non-interest bearing NOW Money market Savings Time » Deposit growth of $102MM, or 15 % » Non - interest bearing demand growth of 18% » Interest bearing demand growth of 26 % 12/31/2017 vs. 12/31/2016 12/31/2017 vs. 12/31/2016

$387 $466 $538 $689 $813 FY-13 FY-14 FY-15 FY-16 FY-17 14 Performance Trends - Loans +18% Loans ($ in millions) Loan Mix, FY End ‘17 » Net loan growth of $ 125MM, or 18 % » Commercial loan p ortfolio growth of $103MM, or 19% 6.7% 5.2% 32.7% 34.4% 20.9% 0.1% Commercial and industrial Construction Commercial real estate - Owner Occupied Commercial real estate - Investment Residential real estate Consumer and other loans 12/31/2017 vs. 12/31/2016 12/31/2017 vs. 12/31/2016

$1.4 $2.6 $3.7 $5.5 $7.7 FY-13 FY-14 FY-15 FY-16 FY-17 Net Income ($ in millions) $5.7 * 15 Performance Trends - Profitability $0.37 $0.57 $0.81 $1.19 $1.42 FY-13 FY-14 FY-15 FY-16 FY-17 Net income per common share - diluted $ 1.05 * 0.27% 0.46% 0.59% 0.72% 0.88% 1.10% FY-13 FY-14 FY-15 FY-16 FY-17 Q1 2018 Return on average assets 0.62% 0.39% * * 3.37% 5.25% 7.02% 9.60% 8.96% 10.22% FY-13 FY-14 FY-15 FY-16 FY-17 Q1 2018 Return on average equity 7.17% * * * Excludes merger related expenses, net of tax 3.64%

16 Performance Trends $438 $501 $670 $1,199 $1,413 FY-13 FY-14 FY-15 FY-16 FY-17 TSIA Income before Tax ($ in thousands) +18% $9.42 $10.38 $11.00 $12.08 $15.13 FY-13 FY-14 FY-15 FY-16 FY-17 Tangible Book Value +25%

EPS growth +10.7% (excluding merger expenses) – Loans, net portfolio growth $368.6MM, or 52% (CBBC $236.1MM at 01/04/2018) • Commercial loan portfolio growth $212.6MM, or 38.2% (CBBC $75.8MM at 01/04/2018) – Deposit growth $346.8MM, or 50 % (CBBC deposits $301.2 MM at 01/04/2018) • Non - interest bearing demand growth of $88.3MM, or 67.9% (CBBC non - interest bearing deposits $64.5MM at 01/04/2018) – Net interest income up 60% – TSIA core revenue increased 10.85% – ROA 1.10% vs. 0.94% (excluding merger related expenses) – ROE 10.22% vs. 13.07% (excluding merger related expenses) 17 Financial Performance 1Q 2018 vs 1Q 2017 Highlights

18 Financial Performance to Targets FY 2015 FY 2016 FY 2017 Targets NJ Banks and Thrifts Avg. (a) Loans, net annual growth 15.1% 27.9% 18.1% 15% to 20% 9.22% Deposit annual growth 13.0% 27.6% 15.4% 15% to 20% 8.57% NPAs to assets 1.49% 1.10% 0.94% <1.00% 1.19% ROA 0.59% 0.72% 0.62% 0.84%* 1.00% or better 0.76% ROE 7.02% 9.60% 7.17% 9.71%* > 12.0% 6.91% Net Interest Margin 3.45% 3.37% 3.39% 3.55% Net non - interest income (expense) as % of assets (2.24)% (1.92%) (1.90%) (1.77%)* (1.87%) Tri - state Insurance income before tax $670k (+33%) $1.2m (+79%) $1.4m (+18%) 20% N/A Diluted EPS $0.81 (+42%) $1.19 (+47%) $1.42 (+20%) Double digit N/A (a) Source : SNL - NJ Banks and Thrifts (38) 12/31/17 * Excludes Merger Related expenses

Growth in Shareholder Value

Stock Performance 3 Year Total Return 20 Source: SNL as of April 19, 2018 Growth in Shareholder Value

21 Source: SNL as of April 19, 2018 Stock Performance 5 Year Total Return Growth in Shareholder Value
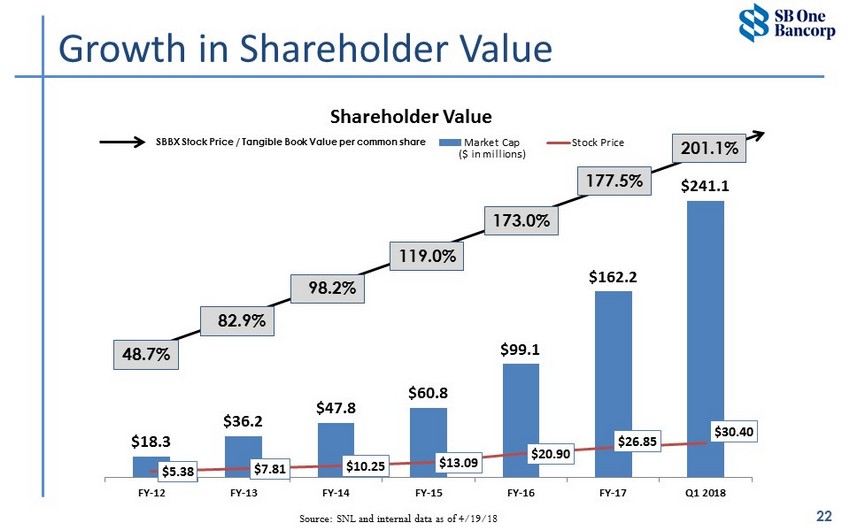
$18.3 $36.2 $47.8 $60.8 $99.1 $162.2 $241.1 $5.38 $7.81 $10.25 $13.09 $20.90 $26.85 $30.40 FY-12 FY-13 FY-14 FY-15 FY-16 FY-17 Q1 2018 Shareholder Value Market Cap Stock Price ($ in millions) 177.5% 22 173.0% Source: SNL and internal data as of 4/19/18 Growth in Shareholder Value 48.7% 119.0% 98.2% 82.9% SBBX Stock Price / Tangible Book Value per common share 201.1%

Strategic Vision

Target High Performing Peer Median (a) Total Assets $3.0 - $5.0 billion in assets $2.6 billion (average) $2.1 billion (median) ROA Old: 1.00% or better New: 1.15% or better 0.97% ROE Old: > 12.0% New: >13.5% 9.36% NPAs / Assets <1.00% 0.58% Annual EPS growth Double digit N/A We strive to be a high performing business bank that serves northern NJ and the NY Metro Region 24 (a) Source: SNL - High Performing Peers (Banks and Thrifts Assets between $1.0 bill to $5.5 bill and ROAA >0.75% at 12/31/17 Strategic Vision

25 Strategic Vision – Strategic Objectives Grow Core Deposits Further diversify the Lending Portfolio Enhance Distribution Strategy Rebranding Employee and Customer Experience Operational Efficiency and Excellence Risk Management M&A Opportunities Strategic Objectives
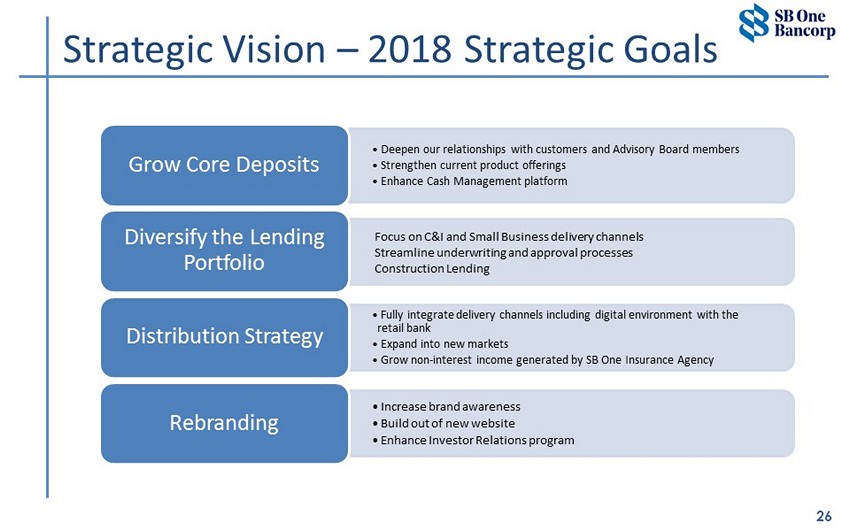
26 • Deepen our relationships with customers and Advisory Board members • Strengthen current product offerings • Enhance Cash Management platform Grow Core Deposits Focus on C&I and Small Business delivery channels Streamline underwriting and approval processes Construction Lending Diversify the Lending Portfolio • Fully integrate delivery channels including digital environment with the retail bank • Expand into new markets • Grow non - interest income generated by SB One Insurance Agency Distribution Strategy • Increase brand awareness • Build out of new website • Enhance Investor Relations program Rebranding Strategic Vision – 2018 Strategic Goals

27 • Become the best employer in the financial industry • Implement a customer net promoter system Employee and Customer Experience Increase profitability through improved processes, procedures, internal reporting and utilization of technology Operational Efficiency and Excellence • Continue to strengthen the Risk Management Culture • Implement an Enterprise Risk Management Program Risk Management • Continue to explore M&A Opportunities M&A Opportunities Strategic Vision – 2018 Strategic Goals
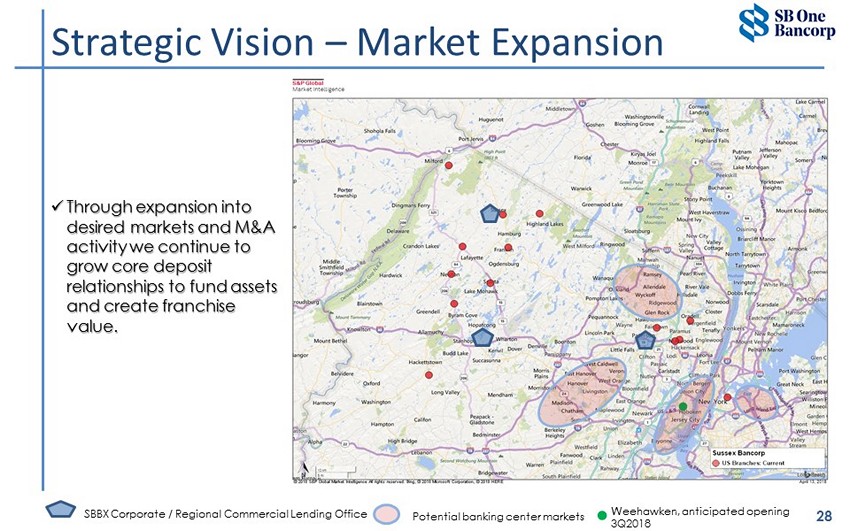
28 Strategic Vision – Market Expansion SBBX Corporate / Regional Commercial Lending Office Potential banking center markets x Through expansion into desired markets and M&A activity we continue to grow core deposit relationships to fund assets and create franchise value. . . Weehawken, anticipated opening 3Q2018

Story Behind our New Brand


31 One Bank, One Name, One Vision We worked hard on developing one name for the recently joined organization – a new name that not only captures the essence of the bank but paves the way for our future success, and yours!


Annual Meeting April 25, 2018 Q&A