Attached files
| file | filename |
|---|---|
| EX-99.1 - EXHIBIT 99.1 - Ameris Bancorp | tv491468_ex99-1.htm |
| 8-K - 8-K - Ameris Bancorp | tv491468_8k.htm |
Exhibit 99.2

Ameris Bancorp 1 st Quarter 2018 Results Investor Presentation

This presentation contains certain performance measures determined by methods other than in accordance with accounting principles generally accepted in the United States of America (“GAAP”) . Management of Ameris Bancorp (the “Company”) uses these non - GAAP measures in its analysis of the Company’s performance . These measures are useful when evaluating the underlying performance and efficiency of the Company’s operations and balance sheet . The Company’s management believes that these non - GAAP measures provide a greater understanding of ongoing operations, enhance comparability of results with prior periods and demonstrate the effects of significant gains and charges in the current period . The Company’s management believes that investors may use these non - GAAP financial measures to evaluate the Company’s financial performance without the impact of unusual items that may obscure trends in the Company’s underlying performance . These disclosures should not be viewed as a substitute for financial measures determined in accordance with GAAP, nor are they necessarily comparable to non - GAAP performance measures that may be presented by other companies . Tangible common equity and Tier 1 capital ratios are non - GAAP measures . The Company calculates the Tier 1 capital ratio using current call report instructions . The Company’s management uses these measures to assess the quality of capital and believes that investors may find them useful in their evaluation of the Company . These capital measures may, or may not be necessarily comparable to similar capital measures that may be presented by other companies . This presentation may contain statements that constitute “forward - looking statements” within the meaning of Section 27 A of the Securities Act of 1933 , as amended, and Section 21 E of the Securities Exchange Act of 1934 , as amended . The words “believe”, “estimate”, “expect”, “intend”, “anticipate” and similar expressions and variations thereof identify certain of such forward - looking statements, which speak only as of the dates which they were made . The Company undertakes no obligation to publicly update or revise any forward - looking statements, whether as a result of new information, future events or otherwise . Readers are cautioned that any such forward - looking statements are not guarantees of future performance and involve risks and uncertainties and that actual results may differ materially from those indicated in the forward - looking statements as a result of various factors . Readers are cautioned not to place undue reliance on these forward - looking statements and are referred to the Company’s periodic filings with the Securities and Exchange Commission for a summary of certain factors that may impact the Company’s results of operations and financial condition . Cautionary Statements 1

Almost singular focus of our team right now is “to produce top quartile operating results, consistently” • Manage the momentum we have to produce 15 % + growth in loans and deposits in 2018 • Continue to manage stable margins in various growth and rate scenarios • Expand non - interest income lines where appropriate to manage their contribution to EPS and ROA • Continue efforts to leverage existing staff and infrastructure to hold efficiency ratio below 60 % Current Focus Consistent Operating Performance M&A Opportunities and Impact of Crossing $10 Billion • Evaluate M&A opportunities that fit within our culture • Opportunities that compliment our existing footprint or position us in growing MSAs • Fine tune our infrastructure and systems to cross $ 10 billion and continue growing Drive Earnings Per Share from Organic Sources • Organic Sources of loans from existing set of producers . More resources supporting our relationship managers to support much larger portfolios • Insulate ourselves from rate movements and economic swings with highly stable, non - rate sensitive deposits • Grow capital levels and book value through higher than average ROAs and ROTCE • Avoid concentrations ; take the long view 2

Earnings Summary – Operating Basis 3 Quarter to Date Results 1Q18 1Q17 Change Operating Earnings $ 27,780 $ 21,606 29% Earnings Per Share $ 0.73 $ 0.60 22% Return on Assets 1.44% 1.27% 13% Return on TCE 17.09% 15.84% 8% NIM (net of accretion) 3.84% 3.79% 1% Efficiency Ratio 59.95% 59.67% .5% Net Overhead Ratio 1.62% 1.57% - 3%

1Q 2018 Operating Highlights • Growth in adjusted net earnings of 28.6% compared with 1Q 2017 • Organic Loan Growth of $153.8 million, or 10.8% annualized during 1Q 2018 • Net Interest Margin (excluding accretion) expanded by 2bps compared to 4Q 2017 • Operating efficiency ratio of 59.95% compared to 60.88% in 4Q 2017 • Total Revenue of $95.3 million, growth of 10.4% compared to 1Q 2017 • Legacy non - accrual assets improved to 0.33% of total assets • Net income contribution from lines of business of $9.3 million or 34.7% of operating net income. Standalone efficiency ratio of 52.9% 4

Income Tax Law Impact • 1Q18 Effective tax rate of 22.4% • Positive impact to EPS of $0.08 • Positive impact to ROA of 17 bps • Negative impact to margin of 6 bps due to tax equivalent adjustment on municipal securities and loans 5
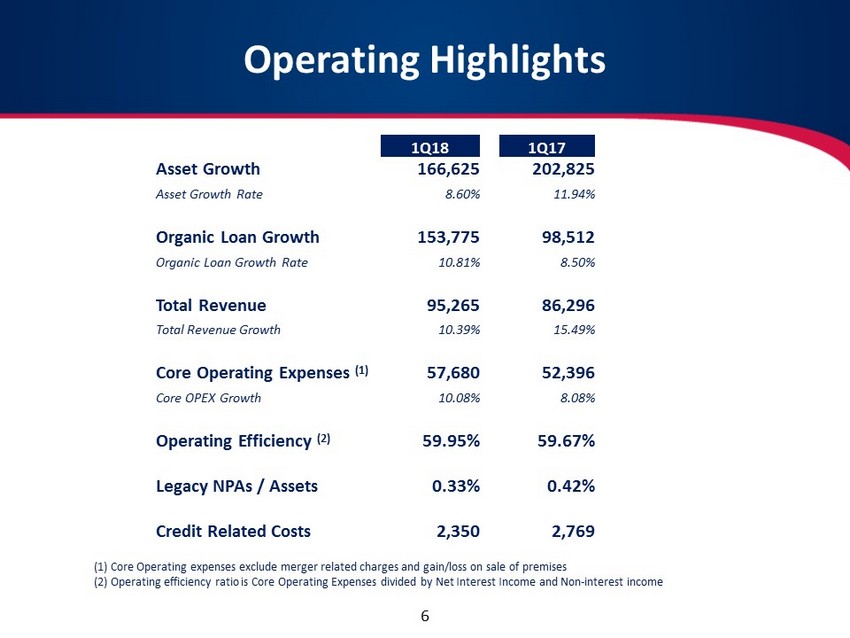
Operating Highlights (1) Core Operating expenses exclude merger related charges and gain/loss on sale of premises (2) Operating efficiency ratio is Core Operating Expenses divided by Net Interest Income and Non - interest income 6 1Q18 1Q17 Asset Growth 166,625 202,825 Asset Growth Rate 8.60% 11.94% Organic Loan Growth 153,775 98,512 Organic Loan Growth Rate 10.81% 8.50% Total Revenue 95,265 86,296 Total Revenue Growth 10.39% 15.49% Core Operating Expenses (1) 57,680 52,396 Core OPEX Growth 10.08% 8.08% Operating Efficiency (2) 59.95% 59.67% Legacy NPAs / Assets 0.33% 0.42% Credit Related Costs 2,350 2,769

Total Revenue Spread Revenues • $867.9 million or 13.7% growth in average earning assets over 1Q 2017 • Steady to increasing margin despite strong growth in existing rate environment. Margin (excluding accretion) of 3.84% in current quarter compared to 3.79% a year ago Non - Interest Income • Mortgage Revenue – increased $685,000, or 6.1% over 1Q 2017 despite tighter gain on sale. Production increased 14.2% to offset the reduced gain on sale • Service charges – declined $335,000, or 3.2%, from 1Q 2017 due to competitive service charge routines – we remain focused on attracting quality customers • SBA revenues – decreased 15.7% to $2.7 million during 1Q 2018 due to steady production but decreased premium on sale 7

Net Interest Margin Spread Income and Margin supported by: • Growth in average earning assets of $867.9 million or 13.7% compared to 1Q17 • Margin (excluding accretion) higher by 2bps; despite tax equivalent yield affect of 6bps due to tax law change Accretion income a decreasingly lower part of our revenues: • 1.5% of revenue in 1Q 2018 • 2.9% of revenue in YTD 2017 • 4.3% of revenue in YTD 2016 Margin expansion despite $1.3 billion of growth in earning assets in current rate environment Loan Production Details Period Fixed Rate (2) Variable Rate (2) Total 1Q18 230.4 5.10% 187.2 5.30% 417.6 5.19% 4Q17 264.2 4.79% 203.9 5.03% 468.1 4.89% 3Q17 296.6 4.72% 167.1 4.77% 463.7 4.74% $48.2 $51.3 $54.4 $56.0 $59.3 $61.9 $65.9 $69.4 $68.3 3.73% 3.79% 3.77% 3.80% 3.82% 3.84% 3.00% 3.50% 4.00% 4.50% $20.0 $30.0 $40.0 $50.0 $60.0 $70.0 $80.0 1Q 16 2Q 16 3Q 16 4Q 16 1Q 17 2Q 17 3Q 17 4Q17 1Q18 Net Interest Income before Accretion (in millions) 8

Expenses – 1Q18 • Basically no increase in core bank operating expenses, even with the buildout of the robust BSA department • Continue to monitor expense control throughout the company and look for efficiencies in our administrative functions • Operating expenses (excluding merger costs and loss on sale of former bank premises) decreased $ 494 , 000 in 1 Q 18 , compared to 4 Q 17 : – $ 1 . 1 million increase in payroll taxes in 1 Q 18 , which is typical for first quarter of each year – $ 1 . 2 million decrease in premium finance division due to termination of MLA agreement 1 – Recurring operating expenses exclude Problem loan and OREO costs, merger costs and special compliance charges in 4Q16 and 3Q 17. OPEX Highlights: Steady, Adjusted Operating Expenses $11.3 $12.1 $10.7 $13.7 $14.4 $16.6 $15.6 $14.2 $39.3 $39.6 $37.2 $38.1 $40.8 $41.0 $42.7 $43.5 0.0 25.0 50.0 75.0 2Q 16 3Q 16 4Q 16 1Q 17 2Q 17 3Q 17 4Q 17 1Q 18 Core Operating Expenses (in millions) LOB Expenses Core Bank 9

Capital and TBV – 1Q18 • Historically, consistent growth in TBV • TBV negatively impacted in 1Q18 by $0.25 per share due to increase in unrealized loss on available for sale securities Consistent Growth in TBV • TCE / TA at quarter end of 8.30%, down from 8.62% due to an increase in goodwill resulting from the purchase of USPF during 1Q18 • 1Q 2018 Operating ROTCE of 17.1% • Normalized ROTCE in the range of 16% - 18% for 2018 Steady Capital Levels Support Growth Rate $13.89 $14.38 $14.42 $16.57 $17.24 $17.78 $17.86 $16.90 $6.0 $8.5 $11.0 $13.5 $16.0 $18.5 2Q 16 3Q 16 4Q 16 1Q 17 2Q 17 3Q 17 4Q 17 1Q 18 Tangible Book Value 10

Investment Rationale Organic Growth Opportunities • Top Quartile ROA & Top Quartile Growth Rate • Strong ROTCE’s that support organic and M&A growth . • Efficiency ratio below 60 % ahead of pending M&A deals that should drive additional operating leverage . Operating Performance M&A Opportunities • Disciplined Acquirer that announces deals with reliable metrics • Pending acquisitions augment organic growth and earnings momentum • Current capital position gives us significantly more flexibility in driving consideration mix and metrics • Organic growth opportunities already producing double digit growth . • Pending acquisitions put us in Orlando, Tampa and Atlanta with enough presence to improve already strong growth rates . • Deposit growth has accelerated to such a point that we are funding almost 100 % of our organic loan growth with new deposits . Peer group includes CSFL, SSB, STBZ, HOMB, OZRK, PSTB, LION, PNFP, SFNC, UCBI 11

Ameris Bancorp Press Release & Financial Highlights March 31, 2018