Attached files
Table of Contents
Index to Financial Statements
UNITED STATES
SECURITIES AND EXCHANGE COMMISSION
WASHINGTON, D.C. 20549
FORM 10-K
| ¨ | ANNUAL REPORT PURSUANT TO SECTION 13 OR 15(d) OF THE SECURITIES EXCHANGE ACT OF 1934 |
For the fiscal year ended December 31, 2009
or
| ¨ | TRANSITION REPORT PURSUANT TO SECTION 13 OR 15(d) OF THE SECURITIES EXCHANGE ACT OF 1934 |
For the transition period from to .
Commission File Number
001-13901

AMERIS BANCORP
(Exact name of registrant as specified in its charter)
| GEORGIA |
58-1456434 | |
| (State of incorporation) | (IRS Employer ID No.) |
310 FIRST ST., SE, MOULTRIE, GA 31768
(Address of principal executive offices)
(229) 890-1111
(Registrant’s telephone number)
Securities registered pursuant to Section 12(b) of the Act: Common Stock, Par Value $1 Per Share
Securities registered pursuant to Section 12(g) of the Act: None
Indicate by check mark if the registrant is a well-known seasoned issuer, as defined in Rule 405 of the Securities Act. Yes ¨ No x
Indicate by check mark if the registrant is not required to file reports pursuant to Section 13 or Section 15(d) of the Securities Exchange Act. Yes ¨ No x
Indicate by check mark whether the registrant (1) has filed all reports required to be filed by Section 13 or 15(d) of the Securities Exchange Act of 1934 during the preceding 12 months (or for such shorter period that the registrant was required to file such reports), and (2) has been subject to such filing requirements for the past 90 days. Yes x No ¨
Indicate by check mark whether the registrant has submitted electronically and posted on its corporate Web site, if any, every Interactive Data File required to be submitted and posted pursuant to Rule 405 of Regulation S-T (§ 232.405 of this chapter) during the preceding 12 months (or for such shorter period that the registrant was required to submit and post such files). Yes ¨ No ¨
Indicate by check mark if disclosure of delinquent filers pursuant to Item 405 of Regulation S-K is not contained herein, and will not be contained, to the best of registrant’s knowledge, in definitive proxy or information statements incorporated by reference in Part III of this Form 10-K or any amendment to this Form 10-K. ¨
Indicate by check mark whether the registrant is a large accelerated filer, an accelerated filer, a non-accelerated filer or a smaller reporting company. See definitions of “large accelerated filer”, “accelerated filer” and “smaller reporting company” in Rule 12b-2 of the Exchange Act.
| Large accelerated filer ¨ |
Accelerated filer x | Non-accelerated filer ¨ | Smaller reporting company ¨ |
Indicate by check mark whether the registrant is a shell company (as defined in Rule 12b-2 of the Securities Exchange Act). Yes ¨ No x
As of the last business day of the registrant’s most recently completed second fiscal quarter, the aggregate market value of the voting and non-voting common equity held by nonaffiliates of the registrant was approximately $85.8 million.
As of March 11, 2010, the registrant had outstanding 13,820,817 shares of common stock, $1.00 par value per share.
DOCUMENTS INCORPORATED BY REFERENCE
The information required by Part III of this Annual Report is incorporated by reference from the Registrant’s definitive proxy statement (the “Proxy Statement”) to be filed with the Securities and Exchange Commission pursuant to Regulation 14A not later than 120 days after the end of the fiscal year covered by this Annual Report.
Table of Contents
Index to Financial Statements
AMERIS BANCORP
2
Table of Contents
Index to Financial Statements
CAUTIONARY NOTICE
REGARDING FORWARD-LOOKING STATEMENTS
Certain statements contained in this Annual Report on Form 10-K (this “Annual Report”) under the caption “Management’s Discussion and Analysis of Financial Condition and Results of Operations,” and elsewhere, including information incorporated herein by reference to other documents, are “forward-looking statements” within the meaning of, and subject to the protections of, Section 27A of the Securities Act of 1933, as amended (the “Securities Act”), and Section 21E of the Securities Exchange Act of 1934, as amended (the “Exchange Act”).
Forward-looking statements include statements with respect to our beliefs, plans, objectives, goals, expectations, anticipations, assumptions, estimates, intentions and future performance and involve known and unknown risks, uncertainties and other factors, many of which may be beyond our control and which may cause the actual results, performance or achievements of the Company to be materially different from future results, performance or achievements expressed or implied by such forward-looking statements.
All statements other than statements of historical fact are statements that could be forward-looking statements. You can identify these forward-looking statements through our use of words such as “may,” “will,” “anticipate,” “assume,” “should,” “indicate,” “would,” “believe,” “contemplate,” “expect,” “estimate,” “continue,” “plan,” “point to,” “project,” “predict,” “could,” “intend,” “target,” “potential” and other similar words and expressions of the future. These forward-looking statements may not be realized due to a variety of factors, including, without limitation, those described in Part I, Item 1A. “Risk Factors,” and elsewhere in this report and those described from time to time in our future reports filed with the Securities and Exchange Commission (the “Commission”) under the Exchange Act.
All written or oral forward-looking statements that are made by or are attributable to us are expressly qualified in their entirety by this cautionary notice. Our forward-looking statements apply only as of the date of this report or the respective date of the document from which they are incorporated herein by reference. We have no obligation and do not undertake to update, revise or correct any of the forward-looking statements after the date of this report, or after the respective dates on which such statements otherwise are made, whether as a result of new information, future events or otherwise.
3
Table of Contents
Index to Financial Statements
As used in this Annual Report, the terms “we,” “us,” “our,” “Ameris” and the “Company” mean Ameris Bancorp and its subsidiaries (unless the context indicates another meaning).
OVERVIEW
We are a financial holding company whose business is conducted primarily through our wholly-owned banking subsidiary, Ameris Bank (the “Bank”), which provides a full range of banking services to its retail and commercial customers who are primarily concentrated in selected markets in Georgia, Alabama, Florida and South Carolina. Ameris was incorporated on December 18, 1980 as a Georgia corporation. The Company’s executive office is located at 310 First St., S.E., Moultrie, Georgia 31768, our telephone number is (229) 890-1111 and our internet address is www.amerisbank.com. We operate 53 domestic banking offices with no foreign activities. At December 31, 2009, we had approximately $2.42 billion in total assets, $1.58 billion in total loans, $2.12 billion in total deposits and stockholders’ equity of $195.0 million. Our deposits are insured, up to applicable limits, by the Federal Deposit Insurance Corporation (the “FDIC”).
We make our annual reports on Form 10-K, quarterly reports on Form 10-Q, current reports on Form 8-K and amendments to those reports filed or furnished pursuant to Section 13(a) or 15(d) of the Exchange Act available free of charge on our website at www.amerisbank.com as soon as reasonably practicable after we electronically file such material with the Commission. These reports are also available without charge on the Commission’s website at www.sec.gov.
The Parent Company
Our primary business as a bank holding company is to manage the business and affairs of the Bank. As a bank holding company, we perform certain shareholder and investor relations functions and seek to provide financial support, if necessary, to our subsidiary.
Ameris Bank
Our principal subsidiary is the Bank, which is headquartered in Moultrie, Georgia and operates branches primarily concentrated in selected markets in Georgia, Alabama, Florida and South Carolina. These branches serve distinct communities in our business areas with autonomy but do so as one bank, leveraging our favorable geographic footprint in an effort to acquire more customers.
Capital Trust Securities
On September 20, 2006, the Company completed a private placement of an aggregate of $36 million of trust preferred securities. The placement occurred through a newly-formed Delaware statutory trust subsidiary of Ameris, Ameris Statutory Trust I (the “Trust”). The trust preferred securities carry a quarterly adjustable interest rate of 1.63% over three-month, mature on December 15, 2036 and are redeemable at the Company’s option beginning September 15, 2011. The terms of the trust preferred securities are set forth in that certain Amended and Restated Declaration of Trust dated as of September 20, 2006 among Ameris, Wilmington Trust Company, as institutional trustee and Delaware trustee, and the administrators named therein. The payments of distributions on, and redemption or liquidation of, the trust preferred securities issued by the Trust are guaranteed by Ameris pursuant to a Guarantee Agreement dated as of September 20, 2006 between Ameris and Wilmington Trust Company, as trustee.
The net proceeds to Ameris from the placement of the trust preferred securities by the Trust were primarily used to redeem outstanding trust preferred securities issued by Ameris on November 8, 2001. These trust preferred securities were redeemed on September 30, 2006 for $35.6 million.
On December 16, 2005, Ameris purchased First National Banc, Inc. (“FNB”). In 2004, FNB’s wholly-owned subsidiary, First National Banc Statutory Trust I, issued $5,000,000 in principal amount of trust preferred securities at a rate per annum equal to the 3-Month LIBOR plus 2.80% through a pool sponsored by a national brokerage firm. These trust preferred securities have a maturity of 30 years and are redeemable at the Company’s option on any quarterly interest payment date. See Notes to our Consolidated Financial Statements included in this Annual Report for a further discussion regarding the issuance of these trust preferred securities.
Strategy
We seek to increase our presence and grow the “Ameris” brand in the markets that we currently serve in Georgia, Alabama, Florida and South Carolina and in neighboring communities that present attractive opportunities for expansion. Management has pursued this objective through an acquisition-oriented growth strategy and a prudent, disciplined operating strategy. Our community banking philosophy emphasizes personalized service and building broad and deep customer relationships, which has
4
Table of Contents
Index to Financial Statements
provided us with a substantial base of low cost core deposits. Our markets are managed by senior level, experienced decision makers in a decentralized structure that differentiates us from our larger competitors. Management believes that this structure, along with involvement in and knowledge of our local markets, will continue to provide growth and assist in managing risk throughout our Company.
We have maintained our focus on a long-term strategy of expanding and diversifying our franchise in terms of revenues, profitability and asset size. Our growth over the past several years has been enhanced significantly by bank acquisitions. We expect to continue to take advantage of the consolidation in the financial services industry and enhance our franchise through future acquisitions, including acquisitions of failed or problem financial institutions in FDIC-assisted transactions. We intend to grow within our existing markets, to branch into or acquire financial institutions in existing markets and to branch into or acquire financial institutions in other markets consistent with our capital availability and management abilities.
BANKING SERVICES
Lending Activities
General. The Company maintains a diversified loan portfolio by providing a broad range of commercial and retail lending services to business entities and individuals. We provide agricultural loans, commercial business loans, commercial and residential real estate construction and mortgage loans, consumer loans, revolving lines of credit and letters of credit. The Company also originates first mortgage residential mortgage loans and generally enters into a commitment to sell these loans in the secondary market. We have not made or participated in foreign, energy-related or subprime type loans. In addition, the Company does not buy loan participations or portions of national credits but from time to time, may acquire balances subject to participation agreements through acquisition. At December 31, 2009 and 2008, less than 1% of the Company’s loan portfolio was subject to loan participation agreements.
At December 31, 2009, our loan portfolio totaled $1.58 billion, representing approximately 65.4% of our total assets. For additional discussion of our loan portfolio, see “Management’s Discussion of Financial Condition and Results of Operations – Loan Portfolio.”
Commercial Real Estate Loans. This portion of our loan portfolio has grown significantly over the past few years and represents the largest segment of our loan portfolio. These loans are generally extended for acquisition, development or construction of commercial properties. The loans are underwritten with an emphasis on the viability of the project, the borrower’s ability to meet certain minimum debt service requirements and an analysis and review of the collateral and guarantors, if any.
Residential Real Estate Mortgage Loans. Ameris originates adjustable and fixed-rate residential mortgage loans. These mortgage loans are generally originated under terms and conditions consistent with secondary market guidelines. Some of these loans will be placed in the Company’s loan portfolio; however, a majority are sold to the secondary mortgage market. The residential real estate mortgage loans that are included in the Company’s loan portfolio are usually owner-occupied and generally amortized over a 10 to 20 year period with three to five year maturity or repricing.
Agricultural Loans. Our agricultural loans are extended to finance crop production, the purchase of farm-related equipment or farmland and the operations of dairies, poultry producers, livestock and timber growers. Agricultural loans typically involve seasonal balance fluctuations. Although we typically look to an agricultural borrower’s cash flow as the principal source of repayment, agricultural loans are also generally secured by a security interest in the crops or the farm-related equipment and, in some cases, an assignment of crop insurance and mortgage on real estate. The lending officer visits the borrower regularly during the growing season and re-evaluates the loan in light of the borrower’s updated cash flow projections. A portion of our agricultural loans is guaranteed by the FSA Guaranteed Loan Program.
Commercial and Industrial Loans. General commercial and industrial loans consist of loans made primarily to manufacturers, wholesalers and retailers of goods, service companies and other industries. These loans are made for acquisition, expansion and working capital purposes and may be secured by real estate, accounts receivable, inventory, equipment, personal guarantees or other assets. The Company monitors these loans by requesting submission of corporate and personal financial statements and income tax returns. The Company has also generated loans which are guaranteed by the U.S. Small Business Administration (the “SBA”). SBA loans are generally underwritten in the same manner as conventional loans generated for the Bank’s portfolio. Periodically, a portion of the loans that are secured by the guaranty of the SBA will be sold in the secondary market. Management believes that making such loans helps the local community and also provides Ameris with a source of income and solid future lending relationships as such businesses grow and prosper. The primary repayment risk for commercial loans is the failure of the business due to economic or financial factors.
Consumer Loans. Our consumer loans include motor vehicle, home improvement, home equity, student and signature loans and small personal credit lines. The terms of these loans typically range from 12 to 60 months and vary based upon the nature of collateral and size of the loan. These loans are generally secured by various assets owned by the consumer.
5
Table of Contents
Index to Financial Statements
Credit Administration
We have sought to maintain a comprehensive lending policy that meets the credit needs of each of the communities served by the Bank, including low and moderate-income customers, and to employ lending procedures and policies consistent with this approach. All loans are subject to our corporate loan policy, which is reviewed annually and updated as needed. The loan policy provides that lending officers have sole authority to approve loans of various amounts commensurate with their seniority and experience. Our local market Presidents have discretion to approve loans in varying principal amounts up to established limits, and our regional credit officers review and approve loans that exceed such limits.
Individual lending authority is assigned by the Company’s Senior Credit Officer, as is the maximum limit of new extensions of credit that may be approved in each market. These approval limits are reviewed annually by the Company and adjusted as needed. All requests for extensions of credit in excess of any of these limits are reviewed by one of two regional credit officers. When the request for approval exceeds the authority level of the regional credit officer, the approval of the Company’s Director of Credit Administration and/or the Company’s loan committee are required. All new loans or modifications to existing loans in excess of $250,000 are reviewed quarterly by the Company’s credit administration department with the lender responsible for the credit. In addition, our ongoing loan review program subjects the portfolio to sampling and objective review by an assigned loan reviewer who is independent of the originating loan officer.
Each lending officer has authority to make loans only in the market area in which his or her Bank office is located and its contiguous counties. Occasionally, our Loan Committee will approve making a loan outside of the market areas of the Bank, provided the Bank has a prior relationship with the borrower. Our lending policy requires analysis of the borrower’s projected cash flow and ability to service the debt.
We actively market our services to qualified lending customers in both the commercial and consumer sectors. Our commercial lending officers actively solicit the business of new companies entering the market as well as longstanding members of that market’s business community. Through personalized professional service and competitive pricing, we have been successful in attracting new commercial lending customers. At the same time, we actively advertise our consumer loan products and continually seek to make our lending officers more accessible.
The Bank continually monitors its loan portfolio to identify areas of concern and to enable management to take corrective action when necessary. Local market Presidents, lending officers and local boards meet periodically to review all past due loans, the status of large loans and certain other credit and economic related matters. Individual lending officers are responsible for collection of past due amounts and monitoring any changes in the financial status of the borrowers.
Investment Activities
Our investment policy is designed to maximize income from funds not needed to meet loan demand in a manner consistent with appropriate liquidity and risk management objectives. Under this policy, our Company may invest in federal, state and municipal obligations, corporate obligations, public housing authority bonds, industrial development revenue bonds, Government Sponsored Entities (“GSEs”) securities and satisfactorily-rated trust preferred obligations. Investments in our portfolio must satisfy certain quality criteria. Our Company’s investments must be “investment-grade” as determined by either Moody’s or Standard and Poor’s. Investment securities where the Company has determined a certain level of credit risk are periodically reviewed to determine the financial condition of the issuer and to support the Company’s decision to continue holding the security. Our Company may purchase non-rated municipal bonds only if the issuer of such bonds is located in the Company’s general market area and such bonds are determined by the Company to have a credit risk no greater than the minimum ratings referred to above. Industrial development authority bonds, which normally are not rated, are purchased only if the issuer is located in the Company’s market area and if the bonds are considered to possess a high degree of credit soundness. Traditionally, the Company has purchased and held investment securities with very high levels of credit quality, favoring investments backed by direct or indirect guarantees of the U.S. Government.
While our investment policy permits our Company to trade securities to improve the quality of yields or marketability or to realign the composition of the portfolio, the Bank historically has not done so to any significant extent. During the fourth quarter of 2008, management realigned a small portion of the portfolio into securities with more favorable terms which were the result of market conditions.
Our investment committee implements the investment policy and portfolio strategies and monitors the portfolio. Reports on all purchases, sales, net profits or losses and market appreciation or depreciation of the bond portfolio are reviewed by our Board of Directors each month. Once a year, our written investment policy is reviewed by the Company’s Board of Directors and updated as needed.
The Company’s securities are held in safekeeping accounts at approved correspondent banks.
6
Table of Contents
Index to Financial Statements
Deposits
The Company provides a full range of deposit accounts and services to both retail and commercial customers. These deposit accounts have a variety of interest rates and terms and consist of interest-bearing and noninterest-bearing accounts, including commercial and retail checking accounts, regular interest-bearing savings accounts, money market accounts, individual retirement accounts and certificates of deposit. Our Bank obtains most of its deposits from individuals and businesses in its market areas.
Generally, our Bank has not needed to offer rates significantly higher than our competition to attract new deposits or to retain existing business. During 2008, the United States Department of the Treasury (the “Treasury”) and the Federal Reserve implemented several programs and initiatives aimed at reducing the liquidity risks in the United States economy. In addition to these governmental actions, loan demand in the Company’s markets fell considerably during 2009 for many banks and further reduced the demand for deposits. Because of these events, the Company was able to significantly reduce deposit costs and force a migration from higher cost term deposits into lower cost money market and NOW deposits.
Brokered time deposits are deposits obtained by utilizing an outside broker that is paid a fee. The Bank utilizes brokered deposits to accomplish several purposes, such as (1) acquiring a certain maturity and dollar amount without repricing the Bank’s current customers which could increase or decrease the overall cost of deposits, and (2) acquiring certain maturities and dollar amounts to help manage interest rate risk.
Other Funding Sources
The Federal Home Loan Bank (“FHLB”) allows the Company to obtain advances through its credit program. These advances are secured by securities owned by the Company and held in safekeeping by the FHLB, FHLB stock owned by the Company and certain qualifying residential mortgages.
The Company also enters into repurchase agreements. These repurchase agreements are treated as short term borrowings and are reflected on the balance sheet as such.
Use of Derivatives
The Company seeks to provide a stable net interest income despite changes in interest rates. In its review of interest rate risk, the Company regularly considers the use of derivatives to protect interest income on loans or to create a structure in institutional borrowings that limits the Company’s cost. During 2009, the Company benefited from two interest rate swaps, each with a notional amount of $35 million. One of the interest rate floors matured during the third quarter of 2009. At December 31, 2009, the remaining interest rate floor is classified as a cash flow hedge against certain variable rate loans on the Company’s balance sheet. The hedge is indexed to prime rate as are the variable rate loans and has a strike rate of 7.00%. During 2009, the Company received approximately $2.2 million of interest payments on its interest rate floors, which have been classified as interest income on loans.
CORPORATE RESTRUCTURING AND BUSINESS COMBINATIONS
On October 23, 2009, the Bank purchased substantially all of the assets and assumed substantially all the liabilities of American United Bank (“AUB”) from the FDIC, as Receiver of AUB. AUB operated only one branch in Lawrenceville, Georgia, a northeast suburb of Atlanta, Georgia, with $85.7 million in loans and $100.3 million in deposits. The Company’s agreements with the FDIC included a loss-sharing agreement which affords the Bank significant protection from losses associated with loans and other real estate owned (“OREO”). Under the terms of the loss-sharing agreement, the FDIC will absorb 80% of losses and share 80% of loss recoveries on the first $38 million of losses and absorb 95% of losses and share in 95% of loss recoveries on losses exceeding $38 million. The term for loss sharing on residential real estate loans is ten years, while the term for loss sharing on all other loans is five years.
The Company’s bid to acquire AUB included a discount on the book value of the assets totaling $19.6 million. Also included in the bid was a premium of approximately $262,000 on AUB’s deposits. The Bank’s bid resulted in a cash payment from the FDIC totaling $17.1 million.
On November 6, 2009, the Bank purchased substantially all of the assets and assumed substantially all the liabilities of United Security Bank (“USB”) from the FDIC, as Receiver of USB. USB operated one branch in Woodstock, Georgia and one branch in Sparta, Georgia, with total loans of $108.4 million and $140.0 million of total deposits. The Company’s agreements with the FDIC included a loss-sharing agreement similar to that associated with AUB, except that under the terms of the USB loss-sharing agreement, the FDIC will absorb 80% of losses and share 80% of loss recoveries on the first $46 million of losses and absorb 95% of losses and share in 95% of loss recoveries on losses exceeding $46 million. The term for loss sharing on residential real estate loans is ten years, while the term for loss sharing on all other loans is five years.
7
Table of Contents
Index to Financial Statements
The Company’s bid to acquire USB included a discount on the book value of the assets totaling $32.6 million. Also included in the bid was a premium of approximately $228,000 on USB’s deposits. The Bank’s bid resulted in a cash payment from the FDIC totaling $24.2 million.
On November 21, 2008, the Company, pursuant to the Capital Purchase Program (the “CPP”) established under the Economic Stabilization Act of 2008 (“EESA”) in connection with the Troubled Asset Relief Program (“TARP”), issued and sold to the Treasury, for an aggregate cash purchase price of $52 million, (i) 52,000 shares (the “Preferred Shares”) of the Company’s Fixed Rate Cumulative Perpetual Preferred Stock, Series A, having a liquidation preference of $1,000 per share, and (ii) a ten-year warrant (the “Warrant”) to purchase up to 679,443 shares of our common stock, par value $1.00 per share (the “Common Stock”), at an exercise price of $11.48 per share. Proceeds from the issuance of the Preferred Shares and the Warrant have been allocated based on the relative market values of each. As a result of the Company’s participation in the CPP, the Company is subject to the rules and regulations promulgated under the EESA. These rules and regulations include certain limitations on compensation for senior executives, dividend payments and payments to senior executives upon termination of employment, as well as certain obligations of the Company to increase its efforts to reduce the number of foreclosures of primary residences.
The Company considered several factors in deciding whether to participate in the CPP. Although the Company considered its common equity and earnings stream to be sufficient to withstand certain severe recessionary trends, management was unsure at the time of evaluating the Company’s CPP participation how deep the economic downturn would be or how severe its impact would be on the Company. Also, certain strategies concerning growth and continued customer acquisition efforts might have been reduced had opportunities for additional capital strength, such as the opportunity presented by the CPP, not materialized. The limitations on executive compensation initially imposed by the EESA are substantially those that management had accepted as practical prior to the Company’s participation in the CPP. These limitations include the reduction of cash incentives, limitations on excessive severance payments and the implementation of a system allowing for the “claw back” of bonuses received while relying on financial performance later determined to be erroneous.
On December 29, 2006, Ameris acquired by merger Islands Bancorp and its banking subsidiary, Islands Community Bank, N.A. (collectively, “Islands”). Islands was headquartered in Beaufort, South Carolina where it operated a single branch with satellite loan production offices in Bluffton, South Carolina and Charleston, South Carolina. The acquisition of Islands was significant to the Company, as Ameris had recruited senior level talent that would be instrumental in executing a growth strategy designed to build a meaningful franchise in South Carolina’s top markets. The consideration for the acquisition was a combination of cash and Common Stock with an aggregate purchase price of approximately $19.0 million. The total consideration consisted of $5.1 million in cash and approximately 494,000 shares of Common Stock with a value of approximately $13.9 million.
On December 16, 2005, Ameris acquired all the issued and outstanding common shares of FNB, the parent company of First National Bank, with operations in St. Mary’s, Georgia and Orange Park, Florida. The aggregate purchase price for FNB was $35.3 million, including cash of $13.1 million and Common Stock valued at $22.2 million.
On November 30, 2004, Ameris acquired Citizens Bancshares, Inc., headquartered in Crawfordville, Florida (“Citizens”). Citizens’ banking offices in Crawfordville, Panacea and Sopchoppy gave the Bank a presence in the panhandle of Florida. Cash exchanged in this transaction for 100% of the stock of Citizens was $11.5 million.
MARKET AREAS AND COMPETITION
The banking industry in general, and in the southeastern United States specifically, is highly competitive and dramatic changes continue to occur throughout the industry. Our selected market areas in Georgia, Alabama, Florida and South Carolina have experienced strong economic and population growth over the past 20 to 30 years. In recent years, however, intense market demands, economic pressures, fluctuating interest rates and increased customer awareness of product and service differences among financial institutions have forced banks to diversify their services and become more cost effective. Over the past few years, our Bank has faced strong competition in attracting deposits at profitable levels. In addition, intense demand for loans has not only impacted the interest rates and fees normally earned, but has also impacted underwriting criteria thought to be safe from historical standards such as debt to income and loan to value. Competition for deposits comes from other commercial banks, thrift institutions, mortgage bankers, finance companies, credit unions and issuers of securities such as brokerage firms. Interest rates, convenience of office locations and marketing are all significant factors in our Bank’s competition for deposits.
Competition for loans comes from other commercial banks, thrift institutions, savings banks, insurance companies, consumer finance companies, credit unions and other institutional lenders. In order to remain competitive, our Bank has varied interest rates and loan fees to some degree as well as increased the number and complexity of services provided. We have not varied or altered our underwriting standards in any material respect in response to competitor willingness to do so and in some markets have not been able to experience the growth in loans that we would have preferred. Competition is affected by the general availability of lendable funds, general and local economic conditions, current interest rate levels and other factors that are not readily predictable.
Competition among providers of financial products and services continues to increase with consumers having the opportunity to select from a growing variety of traditional and nontraditional alternatives. The industry continues to rapidly consolidate, which
8
Table of Contents
Index to Financial Statements
affects competition by eliminating some regional and local institutions, while strengthening the franchise of acquirers. Management expects that competition will become more intense in the future due to changes in state and federal laws and regulations and the entry of additional bank and nonbank competitors. See “Supervision and Regulation.”
EMPLOYEES
At December 31, 2009, the Company employed approximately 615 full-time equivalent employees. We consider our relationship with our employees to be good.
We have adopted one retirement plan for our employees, the Ameris Bancorp 401(k) Profit Sharing Plan. This plan provides deferral of compensation by our employees and contributions by Ameris. The Bank made contributions for all eligible employees in 2009. We also maintain a comprehensive employee benefits program providing, among other benefits, hospitalization and major medical insurance and life insurance. Management considers these benefits to be competitive with those offered by other financial institutions in our market areas. Our employees are not represented by any collective bargaining group.
RELATED PARTY TRANSACTIONS
The Company makes loans to our directors and their affiliates and to banking officers. These loans are made on substantially the same terms as those prevailing at the time for comparable transactions and do not involve more than normal credit risk. At December 31, 2009, we had $1.58 billion in total loans outstanding, of which $8.3 million were outstanding to certain directors and their affiliates. Company policy prohibits loans to executive officers.
SUPERVISION AND REGULATION
General
We are extensively regulated under federal and state law. Generally, these laws and regulations are intended to protect depositors and not shareholders. The following is a summary description of certain provisions of certain laws that affect the regulation of bank holding companies and banks. The discussion is qualified in its entirety by reference to applicable laws and regulations. Changes in such laws and regulations may have a material effect on our business and prospects.
Federal Bank Holding Company Regulation and Structure
As a bank holding company, we are subject to regulation under the Bank Holding Company Act and to the supervision, examination and reporting requirements of the Board of Governors of the Federal Reserve System (the “Federal Reserve”). Our Bank has a Georgia state charter and is subject to regulation, supervision and examination by the FDIC and the Georgia Department of Banking and Finance (the “GDBF”).
The Bank Holding Company Act requires every bank holding company to obtain the prior approval of the Federal Reserve before:
| • | it may acquire direct or indirect ownership or control of any voting shares of any bank if, after the acquisition, the bank holding company will directly or indirectly own or control more than 5% of the voting shares of the bank; |
| • | it or any of its subsidiaries, other than a bank, may acquire all or substantially all of the assets of any bank; or |
| • | it may merge or consolidate with any other bank holding company. |
The Bank Holding Company Act further provides that the Federal Reserve may not approve any transaction that would result in a monopoly or that would substantially lessen competition in the banking business, unless the public interest in meeting the needs of the communities to be served outweighs the anti-competitive effects. The Federal Reserve is also required to consider the financial and managerial resources and future prospects of the bank holding companies and banks involved and the convenience and needs of the communities to be served. Consideration of financial resources generally focuses on capital adequacy, and consideration of convenience and needs issues focuses, in part, on the performance under the Community Reinvestment Act of 1977, both of which are discussed elsewhere in more detail.
Subject to various exceptions, the Bank Holding Company Act and the Change in Bank Control Act, together with related regulations, require Federal Reserve approval prior to any person or company acquiring “control” of a bank holding company. Control is conclusively presumed to exist if an individual or company acquires 25% or more of any class of voting securities of a bank holding company. Control is also presumed to exist, although rebuttable, if a person or company acquires 10% or more, but less than 25%, of any class of voting securities and either:
| • | the bank holding company has registered securities under Section 12 of the Exchange Act; or |
9
Table of Contents
Index to Financial Statements
| • | no other person owns a greater percentage of that class of voting securities immediately after the transaction. |
Our Common Stock is registered under Section 12 of the Exchange Act. The regulations provide a procedure for challenging rebuttable presumptions of control.
The Bank Holding Company Act generally prohibits a bank holding company from engaging in activities other than banking; managing or controlling banks or other permissible subsidiaries and acquiring or retaining direct or indirect control of any company engaged in any activities other than activities closely related to banking or managing or controlling banks. In determining whether a particular activity is permissible, the Federal Reserve considers whether performing the activity can be expected to produce benefits to the public that outweigh possible adverse effects, such as undue concentration of resources, decreased or unfair competition, conflicts of interest or unsound banking practices. The Federal Reserve has the power to order a bank holding company or its subsidiaries to terminate any activity or control of any subsidiary when the continuation of the activity or control constitutes a serious risk to the financial safety, soundness or stability of any bank subsidiary of that bank holding company.
Under the Bank Holding Company Act, a bank holding company may file an election with the Federal Reserve to be treated as a financial holding company and engage in an expanded list of financial activities. The election must be accompanied by a certification that all of the company’s insured depository institution subsidiaries are “well capitalized” and “well managed.” Additionally, the Community Reinvestment Act of 1977 rating of each subsidiary bank must be satisfactory or better. Effective August 24, 2000, pursuant to a previously-filed election with the Federal Reserve, Ameris became a financial holding company. As such, we may engage in activities that are financial in nature or incidental or complementary to financial activities, including insurance underwriting, securities underwriting and dealing, and making merchant banking investments in commercial and financial companies. If the Bank ceases to be “well capitalized” or “well managed” under applicable regulatory standards, the Federal Reserve may, among other things, place limitations on our ability to conduct these broader financial activities. In addition, if the Bank receives a rating of less than satisfactory under the Community Reinvestment Act, we would be prohibited from engaging in any additional activities other than those permissible for bank holding companies that are not financial holding companies. If, after becoming a financial holding company and undertaking activities not permissible for a bank holding company, the company fails to continue to meet any of the prerequisites for financial holding company status, including those described above, the company must enter into an agreement with the Federal Reserve to comply with all applicable capital and management requirements. If the company does not return to compliance within 180 days, the Federal Reserve may order the company to divest its subsidiary banks or the company may discontinue or divest investments in companies engaged in, activities permissible only for a bank holding company that has elected to be treated as a financial holding company.
Under Federal Reserve policy, we are expected to act as a source of financial strength for the Bank and to commit resources to support the Bank. This support may be required at times when, without this Federal Reserve policy, we might not be inclined to provide it. In addition, any capital loans made by us to Bank will be repaid only after its deposits and various other obligations are repaid in full.
Our Bank is also subject to numerous state and federal statutes and regulations that affect its business, activities and operations and is supervised and examined by state and federal bank regulatory agencies. The FDIC and the GDBF regularly examine the operations of our Bank and are given the authority to approve or disapprove mergers, consolidations, the establishment of branches and similar corporate actions. These agencies also have the power to prevent the continuance or development of unsafe or unsound banking practices or other violations of law.
Payment of Dividends and Other Restrictions
Ameris is a legal entity separate and distinct from its subsidiaries. While there are various legal and regulatory limitations under federal and state law on the extent to which our Bank can pay dividends or otherwise supply funds to Ameris, the principal source of our cash revenues is dividends from our Bank. The prior approval of applicable regulatory authorities is required if the total dividends declared by the Bank in any calendar year exceeds 50% of the Bank’s net profits for the previous year. The relevant federal and state regulatory agencies also have authority to prohibit a state member bank or bank holding company, which would include Ameris and the Bank, from engaging in what, in the opinion of such regulatory body, constitutes an unsafe or unsound practice in conducting its business. The payment of dividends could, depending upon the financial condition of the subsidiary, be deemed to constitute an unsafe or unsound practice in conducting its business.
Under Georgia law, the prior approval of the GDBF is required before any cash dividends may be paid by a state bank if: (i) total classified assets at the most recent examination of such bank exceed 80% of the equity capital (as defined, which includes the reserve for loan losses) of such bank; (ii) the aggregate amount of dividends declared or anticipated to be declared in the calendar year exceeds 50% of the net profits (as defined) for the previous calendar year; or (iii) the ratio of equity capital to adjusted total assets is less than 6%. There were no amounts of retained earnings of our Bank available for payment of cash dividends under applicable regulations without obtaining governmental approval as of December 31, 2009.
10
Table of Contents
Index to Financial Statements
In addition, our Bank is subject to limitations under Section 23A of the Federal Reserve Act with respect to extensions of credit to, investments in and certain other transactions with Ameris. Furthermore, loans and extensions of credit are also subject to various collateral requirements.
The Federal Reserve has issued a policy statement on the payment of cash dividends by bank holding companies, which expresses the Federal Reserve’s view that a bank holding company should pay cash dividends only to the extent that the holding company’s net income for the past year is sufficient to cover both the cash dividends and a rate of earning retention that is consistent with the holding company’s capital needs, asset quality and overall financial condition. The Federal Reserve also indicated that it would be inappropriate for a holding company experiencing serious financial problems to borrow funds to pay dividends. Furthermore, under the prompt corrective action regulations adopted by the Federal Reserve, the Federal Reserve may prohibit a bank holding company from paying any dividends if one or more of the holding company’s bank subsidiaries are classified as undercapitalized.
Bank holding companies are required to give the Federal Reserve prior written notice of any purchase or redemption of its outstanding equity securities if the gross consideration for the purchase or redemption, when combined with the net consideration paid for all such purchases or redemptions during the preceding 12 months, is equal to 10% or more of their consolidated net worth. The Federal Reserve may disapprove such a purchase or redemption if it determines that the proposal would constitute an unsafe or unsound practice or would violate any law, regulation, Federal Reserve order or any condition imposed by, or written agreement with, the Federal Reserve.
Furthermore, under rules and regulations of the EESA to which the Company is subject, no dividends may be declared or paid on the Common Stock unless the dividends due with respect to Preferred Shares have been paid in full. Moreover, the consent of the Treasury will be required for any increase in the per share dividends on the Common Stock beyond the per share dividend declared prior to October 14, 2008 ($0.05 per share per quarter) until the third anniversary of the date of the Treasury’s investment in the Preferred Shares, unless prior to the third anniversary, the Preferred Shares are redeemed or the Treasury has transferred all of its Preferred Shares to third parties.
Capital Adequacy
We must comply with the Federal Reserve’s established capital adequacy standards, and our Bank is required to comply with the capital adequacy standards established by the FDIC. The Federal Reserve has promulgated two basic measures of capital adequacy for bank holding companies: a risk-based measure and a leverage measure. A bank holding company must satisfy all applicable capital standards to be considered in compliance.
The risk-based capital standards are designed to make regulatory capital requirements more sensitive to differences in risk profile among banks and bank holding companies, account for off-balance-sheet exposure and minimize disincentives for holding liquid assets.
Assets and off-balance-sheet items are assigned to broad risk categories, each with appropriate weights. The resulting capital ratios represent capital as a percentage of total risk-weighted assets and off-balance-sheet items.
The minimum guideline for the ratio of total capital to risk-weighted assets is 8%. At least half of total capital must be comprised of Tier 1 Capital, which is common stock, undivided profits, minority interests in the equity accounts of consolidated subsidiaries and noncumulative perpetual preferred stock, less goodwill and certain other intangible assets. The remainder may consist of Tier 2 Capital, which is subordinated debt, other preferred stock and a limited amount of loan loss reserves. Since 2001, our consolidated capital ratios have been increased due to the issuance of trust preferred securities. At December 31, 2009, all of our trust preferred securities were included in Tier 1 Capital. At December 31, 2009, our total risk-based capital ratio and our Tier 1 risk-based capital ratio were 14.79% and 13.53%, respectively. Neither Ameris nor its Bank has been advised by any federal banking agency of any specific minimum capital ratio requirement applicable to it.
In addition, the Federal Reserve has established minimum leverage ratio guidelines for bank holding companies. These guidelines provide for a minimum ratio of Tier 1 Capital to average assets, less goodwill and certain other intangible assets, of 3% for bank holding companies that meet specified criteria. All other bank holding companies generally are required to maintain a minimum leverage ratio of 4%. Our ratio at December 31, 2009 was 9.35%, compared to 9.42% at December 31, 2008. The guidelines also provide that bank holding companies experiencing internal growth or making acquisitions will be expected to maintain strong capital positions substantially above the minimum supervisory levels without significant reliance on intangible assets. Furthermore, the Federal Reserve has indicated that it will consider a “tangible Tier 1 Capital leverage ratio” and other indicia of capital strength in evaluating proposals for expansion or new activities. The Federal Reserve has not advised Ameris of any specific minimum leverage ratio or tangible Tier 1 Capital leverage ratio applicable to it.
Failure to meet capital guidelines could subject a bank to a variety of enforcement remedies, including issuance of a capital directive, the termination of deposit insurance by the FDIC, a prohibition on taking brokered deposits and certain other restrictions on its business. As described below, the FDIC can impose substantial additional restrictions upon FDIC-insured depository institutions that fail to meet applicable capital requirements.
11
Table of Contents
Index to Financial Statements
The Federal Deposit Insurance Act (or “FDI Act”) requires the federal regulatory agencies to take “prompt corrective action” if a depository institution does not meet minimum capital requirements. The FDI Act establishes five capital tiers: “well capitalized”, “adequately capitalized”, “undercapitalized”, “significantly undercapitalized” and “critically undercapitalized”. A depository institution’s capital tier will depend upon how its capital levels compare to various relevant capital measures and certain other factors, as established by regulation.
The federal bank regulatory agencies have adopted regulations establishing relevant capital measurers and relevant capital levels applicable to FDIC-insured banks. The relevant capital measures are the Total Capital ratio, Tier 1 Capital ratio and the leverage ratio. Under the regulations, a FDIC-insured bank will be:
| • | “well capitalized” if it has a Total Capital ratio of 10% or greater, a Tier 1 Capital ratio of 6% or greater and a leverage ratio of 5% or greater and is not subject to any order or written directive by the appropriate regulatory authority to meet and maintain a specific capital level for any capital measure; |
| • | “adequately capitalized” if it has a Total Capital ratio of 8% or greater, a Tier 1 Capital ratio of 4% or greater and a leverage ratio of 4% or greater (3% in certain circumstances) and is not “well capitalized”; |
| • | “undercapitalized” if it has a Total Capital ratio of less than 8%, a Tier 1 Capital ratio of less than 4% or a leverage ratio of less than 4% (3% in certain circumstances); |
| • | “significantly undercapitalized” if it has a Total Capital ratio of less than 6%, a Tier 1 Capital ratio of less than 3% or a leverage ratio of less than 3%; and |
| • | “critically undercapitalized” if its tangible equity is equal to or less than 2% of average quarterly tangible assets. |
An institution may be downgraded to, or deemed to be in, a capital category that is lower than is indicated by its capital ratios if it is determined to be in an unsafe or unsound condition or if it receives an unsatisfactory examination rating with respect to certain matters. As of December 31, 2009, our Bank had capital levels that qualify as “well capitalized” under such regulations.
The FDI Act generally prohibits an FDIC-insured bank from making a capital distribution (including payment of a dividend) or paying any management fee to its holding company if the bank would thereafter be “undercapitalized.” “Undercapitalized” banks are subject to growth limitations and are required to submit a capital restoration plan. The federal regulators may not accept a capital plan without determining, among other things, that the plan is based on realistic assumptions and is likely to succeed in restoring the bank’s capital. In addition, for a capital restoration plan to be acceptable, the bank’s parent holding company must guarantee that the institution will comply with such capital restoration plan. The aggregate liability of the parent holding company is limited to the lesser of: (i) an amount equal to 5% of the bank’s total assets at the time it became “undercapitalized”; and (ii) the amount which is necessary (or would have been necessary) to bring the institution into compliance with all capital standards applicable with respect to such institution as of the time it fails to comply with the plan. If a bank fails to submit an acceptable plan, it is treated as if it is “significantly undercapitalized.”
“Significantly undercapitalized” insured banks may be subject to a number of requirements and restrictions, including orders to sell sufficient voting stock to become “adequately capitalized”, requirements to reduce total assets and the cessation of receipt of deposits from correspondent banks. “Critically undercapitalized” institutions are subject to the appointment of a receiver or conservator. A bank that is not “well capitalized” is also subject to certain limitations relating to so-called “brokered” deposits.
The regulatory capital framework under which we operate is in a period of change with likely legislation or regulation that will revise the current standards and very likely increase capital requirements for the entire banking industry, including us. The resulting capital requirements are yet to be determined. The Company and the Bank are now governed by a set of capital rules that the Federal Reserve and the FDIC have had in place since 1988, with some subsequent amendments and revisions. These rules are popularly known as “Basel I.” Before the current financial crisis began to have a dramatic effect on the banking industry, the U.S. regulators had participated in an effort by the Basel Committee on Banking Supervision to develop Basel II. Basel II provides several options for determining capital requirements for credit and operational risk. In December 2007, the agencies adopted a final rule implementing Basel II’s “advanced approach” for “core banks” — U.S. banking organizations with over $250 billion in banking assets or on-balance-sheet foreign exposures of at least $10 billion. For other banking organizations, including us, the U.S. banking agencies proposed a rule in July 2008 that would have enabled these organizations to adopt the Basel II “standardized approach.” The proposed rule has not been finalized. As a result of the financial crisis that has adversely affected global credit markets and increases in credit, liquidity, interest rate and other risks, in September 2009, the Treasury issued principles for stronger capital and liquidity standards for banking firms, which included recommendations for higher capital standards for all banking organizations to be implemented as part of a broader reconsideration of international risk-based capital standards developed by Basel II.
12
Table of Contents
Index to Financial Statements
Acquisitions
As an active acquirer, we must comply with numerous laws related to our acquisition activity. Under the Bank Holding Company Act, a bank holding company may not directly or indirectly acquire ownership or control of more than 5% of the voting shares or substantially all of the assets of any bank or merge or consolidate with another bank holding company without the prior approval of the Federal Reserve. Current federal law authorizes interstate acquisitions of banks and bank holding companies without geographic limitation. Furthermore, a bank headquartered in one state is authorized to merge with a bank headquartered in another state, as long as neither of the states has opted out of such interstate merger authority prior to such date, and subject to any state requirement that the target bank shall have been in existence and operating for a minimum period of time, not to exceed five years, and to certain deposit market-share limitations. After a bank has established branches in a state through an interstate merger transaction, the bank may establish and acquire additional branches at any location in the state where a bank headquartered in that state could have established or acquired branches under applicable federal or state law.
FDIC Insurance Assessments
The FDIC insures the deposits of the Bank up to prescribed limits for each depositor. The amount of FDIC assessments paid by each Deposit Insurance Fund (“DIF”) member institution is based on its relative risks of default as measured by regulatory capital ratios and other factors. Specifically, the assessment rate is based on the institution’s capitalization risk category and supervisory subgroup category. The Company’s insurance assessment during 2009, 2008 and 2007 was $3.5 million, $932,000 and $201,000, respectively. Because of the growing number of bank failures and costs to the DIF, the FDIC required a special assessment during 2009 totaling $1.1 million and further required that we prepay the assessments that would normally have been paid during 2010–2012. This prepaid assessment amounted to $12.3 million and is carried as an Other Asset on the Company’s Consolidated Balance Sheet. An institution’s capitalization risk category is based on the FDIC’s determination of whether the institution is well capitalized, adequately capitalized or less than adequately capitalized.
An institution’s supervisory subgroup category is based on the FDIC’s assessment of the financial condition of the institution and the probability that FDIC intervention or other corrective action will be required. The FDIC may terminate insurance of deposits upon a finding that a institution has engaged in unsafe and unsound practices, is in an unsafe or unsound condition to continue operations, or has violated any applicable law, regulation, rule, order or condition imposed by the FDIC.
In February 2009, the FDIC issued new risk based assessment rates that took effect April 1, 2009. For insured depository institutions in the lowest risk category, the annual assessment rate ranges from 7 to 24 cents for every $100 of domestic deposits. For institutions assigned to higher risk categories, the new assessment rates range from 17 to 77.5 cents per $100 of domestic deposits. These ranges reflect a possible downward adjustment for unsecured debt outstanding and possible upward adjustments for secured liabilities and, in the case of institutions outside the lowest risk category, brokered deposits.
The FDIC also collects a deposit-based assessment from insured financial institutions on behalf of The Financing Corporation (the “FICO”). The funds from these assessments are used to service debt issued by FICO in its capacity as a financial vehicle for the Federal Savings & Loan Insurance Corporation. The FICO assessment rate is set quarterly and in 2009 ranged from 1.02 cents to 1.14 cents per $100 of assessable deposits. These assessments will continue until the debt matures in 2017 through 2019.
The FDIC may, without further notice-and-comment rulemaking, adopt rates that are higher or lower than the stated base assessment rates, provided that the FDIC cannot (i) increase or decrease the total rates from one quarter to the next by more than three basis points, or (ii) deviate by more than three basis points from the stated assessment rates. The FDIC has proposed maintaining current assessment rates through December 31, 2010, followed by a uniform increase in risk-based assessment rates of three basis points effective January 1, 2011.
Community Reinvestment Act
The Community Reinvestment Act requires federal bank regulatory agencies to encourage financial institutions to meet the credit needs of low and moderate-income borrowers in their local communities. An institution’s size and business strategy determines the type of examination that it will receive. Large, retail-oriented institutions are examined using a performance-based lending, investment and service test. Small institutions are examined using a streamlined approach. All institutions may opt to be evaluated under a strategic plan formulated with community input and pre-approved by the bank regulatory agency.
The Community Reinvestment Act regulations provide for certain disclosure obligations. Each institution must post a notice advising the public of its right to comment to the institution and its regulator on the institution’s Community Reinvestment Act performance and to review the institution’s Community Reinvestment Act public file. Each lending institution must maintain for public inspection a file that includes a listing of branch locations and services, a summary of lending activity, a map of its communities and any written comments from the public on its performance in meeting community credit needs. The Community Reinvestment Act requires public disclosure of a financial institution’s written Community Reinvestment Act evaluations. This promotes enforcement of Community Reinvestment Act requirements by providing the public with the status of a particular institution’s community reinvestment record.
13
Table of Contents
Index to Financial Statements
The Gramm-Leach-Bliley Act made various changes to the Community Reinvestment Act. Among other changes, Community Reinvestment Act agreements with private parties must be disclosed and annual Community Reinvestment Act reports must be made available to a bank’s primary federal regulator. A bank holding company will not be permitted to become a financial holding company and no new activities authorized under the Gramm-Leach-Bliley Act may be commenced by a holding company or by a bank financial subsidiary if any of its bank subsidiaries received less than a satisfactory Community Reinvestment Act rating in its latest Community Reinvestment Act examination.
Consumer Protection Laws
The Bank is subject to a number of federal and state laws designed to protect borrowers and promote lending to various sectors of the economy and population. These laws include the Equal Credit Opportunity Act, the Fair Credit Reporting Act, the Truth in Lending Act, the Home Mortgage Disclosure Act, the Real Estate Settlement Procedures Act, the Fair Debt Collection Act and state law counterparts.
Federal law currently contains extensive customer privacy protection provisions. Under these provisions, a financial institution must provide to its customers, at the inception of the customer relationship and annually thereafter, the institution’s policies and procedures regarding the handling of customers’ nonpublic personal financial information. These provisions also provide that, except for certain limited exceptions, an institution may not provide such personal information to unaffiliated third parties unless the institution discloses to the customer that such information may be so provided and the customer is given the opportunity to opt out of such disclosure. Federal law makes it a criminal offense, except in limited circumstances, to obtain or attempt to obtain customer information of a financial nature by fraudulent or deceptive means.
Additional Legislative and Regulatory Matters
The Uniting and Strengthening America by Providing Appropriate Tools Required to Intercept and Obstruct Terrorism Act of 2001 (the “USA PATRIOT Act”) requires each financial institution: (i) to establish an anti-money laundering program; (ii) to establish due diligence policies, procedures and controls with respect to its private banking accounts involving foreign individuals and certain foreign banks; and (iii) to avoid establishing, maintaining, administering or managing correspondent accounts in the United States for, or on behalf of, foreign banks that do not have a physical presence in any country. The USA PATRIOT Act also requires the Secretary of the Treasury to prescribe by regulation minimum standards that financial institutions must follow to verify the identity of customers, both foreign and domestic, when a customer opens an account. In addition, the USA PATRIOT Act contains a provision encouraging cooperation among financial institutions, regulatory authorities and law enforcement authorities with respect to individuals, entities and organizations engaged in, or reasonably suspected of engaging in, terrorist acts or money laundering activities.
The Sarbanes-Oxley Act of 2002 (“Sarbanes-Oxley”) mandates a variety of reforms intended to address corporate and accounting fraud and provides for the establishment of the Public Company Accounting Oversight Board (“PCAOB”), which enforces auditing, quality control and independence standards for firms that audit Commission reporting companies. Sarbanes-Oxley imposes higher standards for auditor independence, restricts the provision of consulting services by auditing firms to companies they audit and requires that certain audit partners be rotated periodically. It also requires chief executive officers and chief financial officers, or their equivalents, to certify to the accuracy of periodic reports filed with the Commission, subject to civil and criminal penalties if they knowingly or willfully violate this certification requirement, and increases the oversight and authority of audit committees of publicly traded companies.
Fiscal and Monetary Policy
Banking is a business which depends on interest rate differentials for success. In general, the difference between the interest paid by a bank on its deposits and its other borrowings, and the interest received by a bank on its loans and securities holdings, constitutes the major portion of a bank’s earnings. Thus, our earnings and growth will be subject to the influence of economic conditions generally, both domestic and foreign, and also to the monetary and fiscal policies of the United States and its agencies, particularly the Federal Reserve. The Federal Reserve regulates the supply of money through various means, including open market dealings in United States government securities, the discount rate at which banks may borrow from the Federal Reserve and the reserve requirements on deposits. The nature and timing of any changes in such policies and their effect on Ameris cannot be predicted.
Current and future legislation and the policies established by federal and state regulatory authorities will affect our future operations. Banking legislation and regulations may limit our growth and the return to our investors by restricting certain of our activities.
In addition, capital requirements could be changed and have the effect of restricting our activities or requiring additional capital to be maintained. We cannot predict with certainty what changes, if any, will be made to existing federal and state legislation and regulations or the effect that such changes may have on our business.
14
Table of Contents
Index to Financial Statements
Federal Home Loan Bank System
Our Company has a correspondent relationship with the FHLB of Atlanta, which is one of 12 regional FHLBs that administer the home financing credit function of savings companies. Each FHLB serves as a reserve or central bank for its members within its assigned region. FHLBs are funded primarily from proceeds derived from the sale of consolidated obligations of the FHLB system and make loans to members (i.e., advances) in accordance with policies and procedures, established by the Board of Directors of the FHLB which are subject to the oversight of the Federal Housing Finance Board. All advances from the FHLB are required to be fully secured by sufficient collateral as determined by the FHLB. In addition, all long-term advances are required to provide funds for residential home financing.
FHLB provides certain services to our Company such as processing checks and other items, buying and selling federal funds, handling money transfers and exchanges, shipping coin and currency, providing security and safekeeping of funds or other valuable items and furnishing limited management information and advice. As compensation for these services, our Company maintains certain balances with FHLB in interest-bearing accounts.
Under federal law, the FHLBs are required to provide funds for the resolution of troubled savings companies and to contribute to low and moderately-priced housing programs through direct loans or interest subsidies on advances targeted for community investment and low and moderate-income housing projects.
Title 6 of the Gramm-Leach-Bliley Act, entitled the Federal Home Loan Bank System Modernization Act of 1999 (called the “FHLB Modernization Act”), amended the Federal Home Loan Bank Act to allow voluntary membership and modernized the capital structure and governance of the FHLBs. The capital structure established under the FHLB Modernization Act sets forth leverage and risk-based capital requirements based on permanence of capital. It also requires some minimum investment in the stock of the FHLBs of all member entities. Capital includes retained earnings and two forms of stock: Class A stock redeemable within six months upon written notice and Class B stock redeemable within five years upon written notice. The FHLB Modernization Act also reduced the period of time in which a member exiting the FHLB system must stay out of the system.
Real Estate Lending Evaluations
The federal regulators have adopted uniform standards for evaluations of loans secured by real estate or made to finance improvements to real estate. Banks are required to establish and maintain written internal real estate lending policies consistent with safe and sound banking practices and appropriate to the size of the institution and the nature and scope of its operations. The regulations establish loan to value ratio limitations on real estate loans. Our Company’s loan policies establish limits on loan to value ratios that are equal to or less than those established in such regulations.
Commercial Real Estate Concentrations
Our lending operations may be subject to enhanced scrutiny by federal banking regulators based on our concentration of commercial real estate loans. On December 6, 2006, the federal banking regulators issued final guidance to remind financial institutions of the risk posed by commercial real estate (“CRE”) lending concentrations. CRE loans generally include land development, construction loans and loans secured by multifamily property, and nonfarm, nonresidential real property where the primary source of repayment is derived from rental income associated with the property. The guidance prescribes the following guidelines for its examiners to help identify institutions that are potentially exposed to significant CRE risk and may warrant greater supervisory scrutiny:
| • | total reported loans for construction, land development and other land (“C&D”) represent 100% or more of the institution’s total capital; or |
| • | total commercial real estate loans represent 300% or more of the institution’s total capital, and the outstanding balance of the institution’s commercial real estate loan portfolio has increased by 50% or more. |
As of December 31, 2009 and excluding covered assets, our C&D concentration as a percentage of capital totaled 97.3% and our CRE concentration, net of owner-occupied loans, as a percentage of capital totaled 246.7%. Including loans subject to loss-share agreements with the FDIC, the Company’s C&D concentration as a percentage of capital totaled 107.7% and our CRE concentration, net of owner-occupied loans, as a percentage of capital totaled 281.2%.
FDIC Temporary Liquidity Guarantee Program
On October 14, 2008, the FDIC announced that its Board of Directors, under the authority to prevent “systemic risk” in the U.S. banking system, approved the Temporary Liquidity Guarantee Program (“TLGP”). The purpose of the TLGP is to strengthen confidence and encourage liquidity in the banking system. The TLGP is composed of two components, the Debt Guarantee Program and the Transaction Account Guarantee Program, and institutions had the opportunity, prior to December 5, 2008, to opt out of either or both components of the TLGP.
The Debt Guarantee Program: Under the TLGP, the FDIC guarantees certain newly issued senior unsecured debt issued through October 31, 2009 by participating financial institutions. Neither the Company nor the Bank issued any debt guaranteed by the FDIC under the Debt Guarantee component of the TLGP.
15
Table of Contents
Index to Financial Statements
The Transaction Account Guarantee Program: Under the TLGP, the FDIC fully guarantees funds in non-interest bearing deposit accounts held at participating FDIC-insured institutions, regardless of dollar amount. The temporary guarantee originally was scheduled to expire at the end of 2009. On August 26, 2009, the FDIC extended the program through June 30, 2010. During the original period, the FDIC imposed a 10 basis point annual rate surcharge will be applied to noninterest-bearing transaction deposit amounts over $250,000. For the extension period, this surcharge will be between 15 and 25 basis points on an annualized basis. Institutions will not be assessed on amounts that are otherwise insured. We did not opt out of the original or extension periods of the Transaction Account Guarantee component of the TLGP.
TARP Regulations
Under the EESA, Congress has the ability to impose additional terms and conditions on TARP participants. As a participant in the CPP under TARP, we are subject to any such retroactive legislation. On February 10, 2009, the Treasury announced the Financial Stability Plan under the EESA (the “Financial Stability Plan”), which is intended to further stabilize financial institutions and stimulate lending across a broad range of economic sectors. On February 18, 2009, President Obama signed the American Recovery and Reinvestment Act (“ARRA”), a broad economic stimulus package that includes additional restrictions on, and potential additional regulation of, financial institutions.
On June 10, 2009, under the authority granted to it under ARRA and EESA, the Treasury issued an interim final rule under Section 111 of EESA, as amended by ARRA, regarding compensation and corporate governance restrictions that would be imposed on TARP participants, effective June 15, 2009. As a TARP participant with currently outstanding obligations under TARP, we are subject to the compensation and corporate governance restrictions and requirements set forth in the interim final rule, which, among other things: (i) prohibit us from paying or accruing bonuses, retention awards or incentive compensation, except for certain long-term stock awards, to our senior executives; (ii) prohibit us from making severance payments to any of our senior executive officers or next five most highly compensated employees; (iii) require us to conduct semi-annual risk assessments to assure that our compensation arrangements do not encourage “unnecessary and excessive risks” or the manipulation of earnings to increase compensation; (iv) require us to recoup or “claw back” any bonus, retention award or incentive compensation paid by us to a senior executive officer or any of our next 20 most highly compensated employees, if the payment was based on financial statements or other performance criteria that are later found to be materially inaccurate; (v) prohibit us from providing tax gross-ups to any of our senior executive officers or next 20 most highly compensated employees; (vi) require us to provide enhanced disclosure of perquisites, and the use and role of compensation consultants; (vii) required us to adopt a corporate policy on luxury and excessive expenditures; (viii) require our chief executive officer and chief financial officer to provide period certifications about our compensation practices and compliance with the interim final rule; (ix) require us to provide enhanced disclosure of the relationship between our compensation plans and the risk posed by those plans; and (x) require us to provide an annual nonbinding shareholder vote, or “say-on-pay” proposal, to approve the compensation of our executives, consistent with regulations promulgated by the Commission. On January 12, 2010, the SEC adopted final regulations setting forth the parameters for such say-on pay proposals for public company TARP participants.
Additional regulations applicable to TARP recipients adopted as part of EESA, the Financial Stability Plan, ARRA or other legislation may subject us to additional regulatory requirements.
Limitations on Senior Executive Compensation
On October 22, 2009, the Federal Reserve issued proposed guidance designed to help ensure that incentive compensation policies at banking organizations do not encourage excessive risk-taking or undermined the safety and soundness of the organization. In connection with the proposed guidance, the Federal Reserve announced that it will review our incentive compensation arrangements as part of the regular, risk-focused supervisory process. The Federal Reserve may take enforcement action against a banking organization if its incentive compensation arrangement or related risk management, control or governance processes pose a risk to the safety and soundness of the organization and the organization is not taking prompt and effective measures to correct the deficiencies. Due to our participation in the CPP, we are also subject to additional executive compensation limitations, as discussed above.
Economic Environment
The policies of regulatory authorities, including the monetary policy of the Federal Reserve, have a significant effect on the operating results of bank holding companies and their subsidiaries. Among the means available to the Federal Reserve to affect the money supply are open market operations in U.S. government securities, changes in the discount rate on member bank borrowings and changes in reserve requirements against member bank deposits. These means are used in varying combinations to influence overall growth and distribution of bank loans, investments and deposits, and their use may affect interest rates charged on loans or paid on deposits.
The Federal Reserve’s monetary policies have materially affected the operating results of commercial banks in the past and are expected to continue to do so in the future. The nature of future monetary policies and the effect of these policies on the business and earnings of our Company cannot be predicted.
16
Table of Contents
Index to Financial Statements
Evolving Legislation and Regulatory Action
In 2009, many emergency government programs enacted in 2008 in response to the financial crisis and the recession slowed or wound down, and global regulatory and legislative focus has generally moved to a second phase of broader regulatory reform and a restructuring of the entire financial regulatory system. Legislators and regulators in the United States are currently considering a wide range of proposals that, if enacted, could result in major changes to the way banking operations are regulated. Some of these major changes may take effect as early as 2010 and could materially impact our business.
| ITEM 1A. | RISK FACTORS |
An investment in our Common Stock is subject to risks inherent in our business. The material risks and uncertainties that management believes affect Ameris are described below. Before making an investment decision, you should carefully consider the risks and uncertainties described below, together with all of the other information included or incorporated by reference in this Annual Report. The risks and uncertainties described below are not the only ones facing the Company. Additional risks and uncertainties that management is not aware of or focused on or that management currently deems immaterial may also impair the Company’s business operations. This Annual Report is qualified in its entirety by these risk factors.
If any of the following risks actually occurs, the Company’s financial condition and results of operations could be materially and adversely affected. If this were to happen, the value of the Common Stock could decline significantly, and you could lose all or part of your investment.
RISKS RELATED TO OUR COMPANY AND INDUSTRY
Difficult market conditions have adversely affected the industry in which we operate.
The capital and credit markets have been experiencing volatility and disruption for approximately two years. Declines in the housing market over this period, with falling home prices and increasing foreclosures, unemployment and under-employment, have negatively impacted the credit performance of mortgage loans and resulted in significant write-downs of asset values by financial institutions, including government-sponsored entities as well as major commercial and investment banks. As a result of the broad based economic decline and the troubled economic conditions, financial institutions have pursued strategies that include seeking additional capital or merging with larger and stronger institutions. In some cases, financial institutions that did not pursue defensive strategies, or did not succeed in those strategies, have failed. Reflecting concern about the stability of the financial markets generally and the strength of counterparties, many lenders and institutional investors have reduced or ceased providing funding to borrowers, including to other financial institutions. Additionally, the market disruptions have increased the level of commercial and consumer delinquencies, lack of consumer confidence, increased market volatility and widespread reduction of business activity generally. We do not expect that the difficult conditions in the financial markets are likely to improve in the near future and are managing the Company with numerous defensive strategies. A worsening of the current conditions would exacerbate the adverse effects of these difficult market conditions on us and others in the financial institution industry. In particular, we may face the following risks in connection with these events:
| • | Unreliable market conditions with significantly reduced real estate activity may adversely affect our ability to determine the fair value of the assets we hold. If we determine that a significant portion of our assets have values that are significantly below their recorded carrying value, we could recognize a material charge to earnings in the quarter during which such determination was made, our capital ratios would be affected and may result in increased regulatory scrutiny. |
| • | We may expect to face increased regulation of our industry, including as a result of the EESA. Compliance with such regulation may increase our costs and limit our ability to pursue business opportunities. |
| • | Market developments and the resulting economic pressure on consumers may affect consumer confidence levels and may cause increases in delinquencies and default rates, which, among other effects, could affect our charge-offs and provision for loan losses. |
| • | Competition in the industry could intensify as a result of the increasing consolidation of financial services companies in connection with current market conditions. |
The impact of the Emergency Economic Stabilization Act of 2008 on the stability of the U.S. financial system are not yet known.
The EESA was enacted on October 3, 2008 in response to the current crisis in the financial sector. The Treasury and banking regulators implemented a number of programs under this legislation to address capital and liquidity issues in the banking system. However, the actual impact that the EESA will have on the financial markets, including the extreme levels of volatility and limited
17
Table of Contents
Index to Financial Statements
credit availability currently being experienced, is not yet known. The failure of the EESA to help stabilize the financial markets and a continuation or worsening of current financial market conditions could materially and adversely affect our business, financial condition, results of operations and access to credit or the trading price of our common stock.
Recent legislative and regulatory proposals in response to recent turmoil in the financial markets may materially adversely affect our business and results of operations.
The banking industry is heavily regulated. We are subject to examinations, supervision and comprehensive regulation by various federal and state agencies. Our compliance with these regulations is costly and restricts certain of our activities. Banking regulations are primarily intended to protect the federal deposit insurance fund and depositors, not shareholders. The burden imposed by federal and state regulations puts banks at a competitive disadvantage compared to less regulated competitors such as finance companies, mortgage banking companies and leasing companies. Changes in the laws, regulations and regulatory practices affecting the banking industry may increase our costs of doing business or otherwise adversely affect us and create competitive advantages for others. Federal economic and monetary policies may also affect our ability to attract deposits and other funding sources, make loans and investments and achieve satisfactory interest spreads.
Legislation proposing significant structural reforms to the financial services industry is being considered in the U.S. Congress, including, among other things, the creation of a Consumer Financial Protection Agency, which would have broad authority to regulate financial service providers and financial products. In addition, the Federal Reserve has proposed guidance on incentive compensation at the banking organizations it regulates, and the Treasury and the federal banking regulators have issued statements calling for higher capital and liquidity requirements for banking organizations. Complying with any new legislative or regulatory requirements, and any programs established thereunder, by federal and state governments to address the current economic crisis could have an adverse impact on our results of operations, financial condition, our ability to fill positions with the most qualified candidates available and our ability to maintain our dividend.
Our revenues are highly correlated to market interest rates.
Our assets and liabilities are primarily monetary in nature, and as a result, we are subject to significant risks tied to changes in interest rates. Our ability to operate profitably is largely dependent upon net interest income. In 2009, net interest income made up 79.6% of our recurring revenue. Unexpected movement in interest rates, that may or may not change the slope of the current yield curve, could cause our net interest margins to decrease, subsequently decreasing net interest income. In addition, such changes could materially adversely affect the valuation of our assets and liabilities.
At present, our one-year interest rate sensitivity position is mildly liability sensitive, such that a gradual increase in interest rates during the next twelve months should have a slightly negative impact on net interest income during that period. However, as with most financial institutions, our results of operations are affected by changes in interest rates and our ability to manage this risk. The difference between interest rates charged on interest-earning assets and interest rates paid on interest-bearing liabilities may be affected by changes in market interest rates, changes in relationships between interest rate indices and changes in the relationships between long-term and short-term market interest rates. In addition, the mix of assets and liabilities could change as varying levels of market interest rates might present our customer base with more attractive options.
Certain changes in interest rates, inflation, deflation or the financial markets could affect demand for our products and our ability to deliver products efficiently.
Loan originations, and potentially loan revenues, could be materially adversely impacted by sharply rising interest rates. Conversely, sharply falling rates could increase prepayments within our securities portfolio lowering interest earnings from those investments. An unanticipated increase in inflation could cause our operating costs related to salaries and benefits, technology and supplies to increase at a faster pace than revenues.
The fair market value of our securities portfolio and the investment income from these securities also fluctuate depending on general economic and market conditions. In addition, actual net investment income and cash flows from investments that carry prepayment risk, such as mortgage-backed and other asset-backed securities, may differ from those anticipated at the time of investment as a result of interest rate fluctuations.
Our concentration of real estate loans subjects the Company to risks that could materially adversely affect our results of operations and financial condition.
The majority of our loan portfolio is secured by real estate. As the economy has deteriorated and depressed real estate values, the collateral value of the portfolio and the revenue stream from those loans has come under stress and has required additional provision to the allowance for loan losses. Our ability to dispose of foreclosed real estate and resolve credit quality issues is dependent on real estate activity and real estate prices, both of which have been unpredictable in the last two years.
Greater loan losses than expected may materially adversely affect our earnings.
18
Table of Contents
Index to Financial Statements
We, as lenders, are exposed to the risk that our customers will be unable to repay their loans in accordance with their terms and that any collateral securing the payment of their loans may not be sufficient to assure repayment. Credit losses are inherent in the business of making loans and could have a material adverse effect on our operating results. Our credit risk with respect to our real estate and construction loan portfolio will relate principally to the creditworthiness of business entities and the value of the real estate serving as security for the repayment of loans. Our credit risk with respect to our commercial and consumer loan portfolio will relate principally to the general creditworthiness of businesses and individuals within our local markets.
We make various assumptions and judgments about the collectability of our loan portfolio and provide an allowance for estimated loan losses based on a number of factors. We believe that our current allowance for loan losses is adequate. However, if our assumptions or judgments prove to be incorrect, the allowance for loan losses may not be sufficient to cover actual loan losses. We may have to increase our allowance in the future in response to the request of one of our primary banking regulators, to adjust for changing conditions and assumptions, or as a result of any deterioration in the quality of our loan portfolio. The actual amount of future provisions for loan losses cannot be determined at this time and may vary from the amounts of past provisions.
Our business is highly correlated to local economic conditions in a geographically concentrated part of the United States.
Unlike larger organizations that are more geographically diversified, our banking offices are primarily concentrated in selected markets in Georgia, Alabama, Florida and South Carolina. As a result of this geographic concentration, our financial results depend largely upon economic conditions in these market areas. Deterioration in economic conditions in the markets we serve could result in one or more of the following:
| • | an increase in loan delinquencies; |
| • | an increase in problem assets and foreclosures; |
| • | a decrease in the demand for our products and services; and |
| • | a decrease in the value of collateral for loans, especially real estate, in turn reducing customers’ borrowing power, the value of assets associated with problem loans and collateral coverage. |
Our growth and financial performance may be negatively impacted if we are unable to successfully execute our growth plans.
Economic conditions and other factors, such as our ability to identify appropriate markets for expansion, our ability to recruit and retain qualified personnel, our ability to fund earning asset growth at a reasonable and profitable level, sufficient capital to support our growth initiatives, competitive factors and banking laws, will impact our success.
We may seek to supplement our internal growth through acquisitions. We cannot predict with certainty the number, size or timing of acquisitions, or whether any such acquisition will occur at all. Our acquisition efforts have traditionally focused on targeted banking entities in markets in which we currently operate and markets in which we believe we can compete effectively. However, as consolidation of the financial services industry continues, the competition for suitable acquisition candidates may increase. We may compete with other financial services companies for acquisition opportunities, and many of these competitors have greater financial resources than we do and may be able to pay more for an acquisition than we are able or willing to pay. We also may need additional debt or equity financing in the future to fund acquisitions. We may not be able to obtain additional financing or, if available, it may not be in amounts and on terms acceptable to us. If we are unable to locate suitable acquisition candidates willing to sell on terms acceptable to us, or we are otherwise unable to obtain additional debt or equity financing necessary for us to continue making acquisitions, we would be required to find other methods to grow our business and we may not grow at the same rate we have in the past, or at all.
Generally, we must receive federal regulatory approval before we can acquire a bank or bank holding company. In determining whether to approve a proposed bank acquisition, federal bank regulators will consider, among other factors, the effect of the acquisition on the competition, financial condition and future prospects. The regulators also review current and projected capital ratios and levels, the competence, experience and integrity of management and its record of compliance with laws and regulations, the convenience and needs of the communities to be served (including the acquiring institution’s record of compliance under the Community Reinvestment Act) and the effectiveness of the acquiring institution in combating money laundering activities. We cannot be certain when or if, or on what terms and conditions, any required regulatory approvals will be granted. We may also be required to sell banks or branches as a condition to receiving regulatory approval, which condition may not be acceptable to us or, if acceptable to us, may reduce the benefit of any acquisition.
In the recent past, we have utilized de novo branching in new and existing markets as a way to supplement our growth. De novo branching and any acquisition carry with it numerous risks, including the following:
| • | the inability to obtain all required regulatory approvals; |
19
Table of Contents
Index to Financial Statements
| • | significant costs and anticipated operating losses associated with establishing a de novo branch or a new bank; |
| • | the inability to secure the services of qualified senior management; |
| • | the local market may not accept the services of a new bank owned and managed by a bank holding company headquartered outside of the market area of the new bank; |
| • | economic downturns in the new market; |
| • | the inability to obtain attractive locations within a new market at a reasonable cost; and |
| • | the additional strain on management resources and internal systems and controls. |
We have experienced to some extent many of these risks with our de novo branching to date.
We rely on dividends from the Bank for most of our revenue.
Ameris is a separate and distinct legal entity from its subsidiaries. It receives substantially all of its revenue from dividends from the Bank. These dividends are the principal source of funds to pay dividends on the Common Stock and interest and principal on the Company’s debt. Various federal and state laws and regulations limit the amount of dividends that the Bank may pay to the Company. Also, the Company’s right to participate in a distribution of assets upon a subsidiary’s liquidation or reorganization is subject to the prior claims of the subsidiary’s creditors. In the event the Bank is unable to pay dividends to the Company, the Company may not be able to service debt, pay obligations or pay dividends on the Common Stock and its business, financial condition and results of operations may be materially adversely affected. At December 31, 2009, our Bank subsidiary’s earnings were not sufficient to allow for a dividend to Ameris without the prior approval of regulatory agencies. Consequently, cash-based activities, including further investments in or support of, the Bank could require borrowings or additional issuances of common or preferred stock.
We are subject to regulation by various federal and state entities.
We are subject to the regulations of the Commission, the Federal Reserve Board, the FDIC and the GDBF. New regulations issued by these agencies may adversely affect our ability to carry on our business activities. We are subject to various federal and state laws and certain changes in these laws and regulations may adversely affect our operations. Noncompliance with certain of these regulations may impact our business plans, including our ability to branch, offer certain products or execute existing or planned business strategies.
We are also subject to the accounting rules and regulations of the Commission and the Financial Accounting Standards Board. Changes in accounting rules could materially adversely affect the reported financial statements or our results of operations and may also require extraordinary efforts or additional costs to implement. Any of these laws or regulations may be modified or changed from time to time, and we cannot be assured that such modifications or changes will not adversely affect us.
We are subject to industry competition which may have an impact upon our success.
Our profitability depends on our ability to compete successfully. We operate in a highly competitive financial services environment. Certain competitors are larger and may have more resources than we do. We face competition in our regional market areas from other commercial banks, savings and loan associations, credit unions, internet banks, finance companies, mutual funds, insurance companies, brokerage and investment banking firms and other financial intermediaries that offer similar services. Some of our nonbank competitors are not subject to the same extensive regulations that govern us or our bank subsidiary and may have greater flexibility in competing for business.
Another competitive factor is that the financial services market, including banking services, is undergoing rapid changes with frequent introductions of new technology-driven products and services. Our future success may depend, in part, on our ability to use technology competitively to provide products and services that provide convenience to customers and create additional efficiencies in our operations.
Changes in the policies of monetary authorities and other government action could materially adversely affect our profitability.
The results of our operations are affected by credit policies of monetary authorities, particularly the Federal Reserve. The instruments of monetary policy employed by the Federal Reserve include open market operations in U.S. government securities, changes in the discount rate or the federal funds rate on bank borrowings and changes in reserve requirements against bank deposits. In view of changing conditions in the national economy and in the money markets, particularly in light of the continuing threat of terrorist attacks and the current military operations in the Middle East, we cannot predict with certainty possible future
20
Table of Contents
Index to Financial Statements
changes in interest rates, deposit levels, loan demand or our business and earnings. Furthermore, the actions of the U.S. government and other governments in responding to such terrorist attacks or the military operations in the Middle East may result in currency fluctuations, exchange controls, market disruption and other adverse effects.
We may need to rely on the financial markets to provide needed capital.
Our Common Stock is listed and traded on the NASDAQ Global Select Market. Although we anticipate that our capital resources will be adequate for the foreseeable future to meet our capital requirements, at times we may depend on the liquidity of the NASDAQ market to raise equity capital. If the market should fail to operate, or if conditions in the capital markets are adverse, we may be constrained in raising capital. Downgrades in the opinions of the analysts that follow our Company may cause our stock price to fall and significantly limit our ability to access the markets for additional capital requirements. Should these risks materialize, our ability to further expand our operations through internal growth or acquisition may be limited.
We may invest or spend the proceeds in stock offerings in ways with which you may not agree and in ways that may not earn a profit.
We may choose to use the proceeds of future stock offerings for general corporate purposes, including for possible acquisition opportunities that may become available, such as future FDIC-assisted transactions. It is not known whether suitable acquisition opportunities may become available or whether we will be able to successfully complete any such acquisitions. We may use the proceeds of an offering only to focus on sustaining our organic, or internal, growth or for other purposes. In addition, we may choose to use all or a portion of the proceeds of an offering to support our capital. You may not agree with the ways we decide to use the proceeds of any stock offerings, and our use of the proceeds may not yield any profits.
Our inability to use a short form registration statement on Form S-3 may affect our short-term ability to access the capital markets.
The ability to conduct primary offerings under a registration statement on Form S-3 has benefits to issuers who are eligible to use this short form registration statement. Form S-3 permits an eligible issuer to incorporate by reference its past and future filings and reports made under the Exchange Act. In addition, Form S-3 enables eligible issuers to conduct primary offerings “off the shelf” under Rule 415 of the Securities Act. The shelf registration process under Form S-3, combined with the ability to incorporate information on a forward basis, allows issuers to avoid additional delays and interruptions in the offering process and to access the capital markets in a more expeditious and efficient manner than raising capital in a standard registered offering on Form S- 1. One of the requirements for Form S-3 eligibility is for an issuer to have timely filed its Exchange Act reports (including Form 10-Ks, Form 10-Qs and certain Form 8-Ks) for the 12-month period immediately preceding either the filing of the Form S-3 or a subsequent determination date. During 2009, we did not timely file on Form 8-K certain required financial statement information with respect to the AUB acquisition (although such information was filed on March 15, 2010). As a result of having not satisfied this requirement of Form S-3, we may experience delays in our ability to raise capital in the capital markets. Any such delay may result in offering terms that may not be advantageous to us.
We face risks related to our operational, technological and organizational infrastructure.
Our ability to grow and compete is dependent on our ability to build or acquire the necessary operational and technological infrastructure and to manage the cost of that infrastructure while we expand. Similar to other large corporations, in our case, operational risk can manifest itself in many ways, such as errors related to failed or inadequate processes, faulty or disabled computer systems, fraud by employees or persons outside of our Company and exposure to external events. We are dependent on our operational infrastructure to help manage these risks. In addition, we are heavily dependent on the strength and capability of our technology systems which we use both to interface with our customers and to manage our internal financial and other systems. Our ability to develop and deliver new products that meet the needs of our existing customers and attract new customers depends in part on the functionality of our technology systems. Additionally, our ability to run our business in compliance with applicable laws and regulations is dependent on these infrastructures.
We continuously monitor our operational and technological capabilities and make modifications and improvements when we believe it will be cost effective to do so. In some instances, we may build and maintain these capabilities ourselves. We also outsource some of these functions to third parties. These third parties may experience errors or disruptions that could adversely impact us and over which we may have limited control. We also face risk from the integration of new infrastructure platforms and/or new third party providers of such platforms into our existing businesses.
Financial services companies depend on the accuracy and completeness of information about customers and counterparties.
In deciding whether to extend credit or enter into other transactions, the Company may rely on information furnished by or on behalf of customers and counterparties, including financial statements, credit reports and other financial information. The Company may also rely on representations of those customers, counterparties or other third parties, such as independent auditors, as to the accuracy and completeness of that information. Reliance on inaccurate or misleading financial statements, credit reports
21
Table of Contents
Index to Financial Statements
or other financial information could have a material adverse impact on the Company’s business and, in turn, the Company’s financial condition and results of operations.
Reputational risk and social factors may impact our results.
Our ability to originate and maintain accounts is highly dependent upon consumer and other external perceptions of our business practices and our financial health. Adverse perceptions regarding our business practices or our financial health could damage our reputation in both the customer and funding markets, leading to difficulties in generating and maintaining accounts as well as in financing them. Adverse developments with respect to the consumer or other external perceptions regarding the practices of our competitors, or our industry as a whole, may also adversely impact our reputation. In addition, adverse reputational impacts on third parties with whom we have important relationships may also adversely impact our reputation. Adverse impacts on our reputation, or the reputation of our industry, may also result in greater regulatory or legislative scrutiny, which may lead to laws, regulations or regulatory actions that may change or constrain the manner in which we engage with our customers and the products we offer. Adverse reputational impacts or events may also increase our litigation risk. We carefully monitor internal and external developments for areas of potential reputational risk and have established governance structures to assist in evaluating such risks in our business practices and decisions.
We may not be able to attract and retain skilled people.
The Company’s success depends, in large part, on its ability to attract and retain key people. Competition for the best people in most activities engaged in by the Company can be intense and the Company may not be able to hire people or to retain them. The unexpected loss of services of one or more of the Company’s key personnel could have a material adverse impact on the Company’s business because of their skills, knowledge of the Company’s market, years of industry experience and the difficulty of promptly finding qualified replacement personnel.
The FDIC has imposed a special assessment on all FDIC-insured institutions, which decreased our earnings in 2009, and future special assessments could materially adversely affect our earnings in future periods.
In May 2009, the FDIC announced that it had voted to levy a special assessment on insured institutions in order to facilitate the rebuilding of the Deposit Insurance Fund. During 2009, we were required to pay a special assessment totaling $1.1 million and also to prepay the assessments that would normally have been paid during 2010–2012. The FDIC has indicated that future special assessments are possible, although it has not determined the magnitude or timing of any future assessments. Any such future assessments will decrease our earnings.
The terms governing the issuance of the Preferred Shares and the Warrant to the Treasury may be changed, the effect of which may have an adverse effect on our operations.
The terms of the Securities Purchase Agreement – Standard Terms incorporated by reference therein (collectively, the “Purchase Agreement”), which we entered into with the Treasury in connection with its purchase of the Preferred Shares and the Warrant, provides that the Treasury may unilaterally amend any provision of the Purchase Agreement to the extent required to comply with any changes in applicable federal law that may occur in the future. We have no control over any change in the terms of the transaction that may occur in the future. Such changes may place restrictions on our business or results of operation, which may adversely affect the market price of our Common Stock.
RISKS RELATED TO FDIC-ASSISTED TRANSACTIONS
Our Company is subject to certain risks related to FDIC-assisted transactions.
The success of past FDIC-assisted transactions, including the acquisitions of AUB and USB, and any FDIC-assisted transactions in which the Company may participate in the future will depend on a number of factors, including the following:
| • | our ability to fully integrate, and to integrate successfully, the branches acquired into the Bank’s operations; |
| • | our ability to limit the outflow of deposits held by our new customers in the acquired branches and to successfully retain and manage interest-earning assets (loans) acquired in FDIC-assisted transactions; |
| • | our ability to retain existing deposits and to generate new interest-earning assets in the geographic areas previously served by the acquired banks; |
| • | our ability to effectively compete in new markets in which we did not previously have a presence; |
| • | our success in deploying the cash received in the FDIC-assisted transactions into assets bearing sufficiently high yields without incurring unacceptable credit or interest rate risk; |
22
Table of Contents
Index to Financial Statements
| • | our ability to control the incremental non-interest expense from the acquired branches in a manner that enables us to maintain a favorable overall efficiency ratio; |
| • | our ability to retain and attract the appropriate personnel to staff the acquired branches; and |
| • | our ability to earn acceptable levels of interest and non-interest income, including fee income, from the acquired branches. |
As with any acquisition involving a financial institution, particularly one involving the transfer of a large number of bank branches as is often the case with FDIC-assisted transactions, there may be higher than average levels of service disruptions that would cause inconveniences or potentially increase the effectiveness of competing financial institutions in attracting our customers. Integrating the acquired branches would not be an operation of substantial size and expense that Ameris is not familiar with, but we anticipate unique challenges and opportunities because of the nature of the transaction. Integration efforts will also likely divert our management’s attention and resources. It is not known whether we will be able to integrate acquired branches successfully, and the integration process could result in the loss of key employees, the disruption of ongoing business or inconsistencies in standards, controls, procedures and policies that adversely affect our ability to maintain relationships with clients, customers, depositors and employees or to achieve the anticipated benefits of the FDIC-assisted transactions. We may also encounter unexpected difficulties or costs during the integration that could materially adversely affect our earnings and financial condition, perhaps materially. Additionally, we may be unable to achieve results in the future similar to those achieved by our existing banking business, to compete effectively in the market areas previously served by the acquired branches or to mange any growth resulting from FDIC-assisted transactions effectively.
Our willingness and ability to grow acquired branches following FDIC-assisted transactions depend on several factors, most importantly the ability to retain certain key personnel that we hire or transfer in connection with FDIC-assisted transactions. Our failure to retain these employees could adversely affect the success of FDIC-assisted transactions and our future growth.
We engage in acquisitions of other businesses from time to time, including FDIC-assisted acquisitions. These acquisitions may not produce revenue or earnings enhancements or cost savings at levels or within timeframes originally anticipated and may result in unforeseen integration difficulties.
When appropriate opportunities arise, we will engage in acquisitions of other businesses. Difficulty in integrating an acquired business or company may cause us not to realize expected revenue increases, cost savings, increases in geographic or product presence or other anticipated benefits from any acquisition. The integration could result in higher than expected deposit attrition (run-off), loss of key employees, disruption of our business or the business of the acquired company, or otherwise adversely affect our ability to maintain relationships with customers and employees or achieve the anticipated benefits of the acquisition. We are likely to need to make additional investment in equipment and personnel to manage higher asset levels and loan balances as a result of any significant acquisition, which may materially adversely impact our earnings. Also, the negative effect of any divestitures required by regulatory authorities in acquisitions or business combinations may be greater than expected.
In evaluating potential acquisition opportunities, we may seek to acquire failed banks through FDIC-assisted transactions. While the FDIC may, in such transactions, provide assistance to mitigate certain risks, such as sharing in exposure to loan losses, and providing indemnification against certain liabilities, of the failed institution, we may not be able to accurately estimate our potential exposure to loan losses and other potential liabilities, or the difficulty of integration, in acquiring such institutions.
Depending on the condition of any institution that we may acquire, any acquisition may, at least in the near term, materially adversely affect our capital and earnings and, if not successfully integrated following the acquisition, may continue to have such effects.
FDIC-assisted acquisition opportunities may not become available and increased competition may make it more difficult for us to bid on failed bank transactions on terms we consider to be acceptable.
Our near-term business strategy includes consideration of potential acquisitions of failing banks that the FDIC plans to place in receivership. The FDIC may not place banks that meet our strategic objectives into receivership. Failed bank transactions are attractive opportunities in part because of loss-sharing arrangements with the FDIC that limit the acquirer’s downside risk on the purchased loan portfolio and, apart from our assumption of deposit liabilities, we have significant discretion as to the nondeposit liabilities that we assume. In addition, assets purchased from the FDIC are marked to their fair value and in many cases there is little or no addition to goodwill arising from an FDIC-assisted transaction. The bidding process for failing banks could become very competitive, and the increased competition may make it more difficult for us to bid on terms we consider to be acceptable.
Changes in national and local economics conditions could lead to higher loan charge-offs in connection with past FDIC-assisted transactions, all of which may not be supported by loss-sharing agreements with the FDIC.
23
Table of Contents
Index to Financial Statements
Although loan portfolios acquired in the AUB and USB acquisitions will be initially accounted for at fair value, we do not yet know whether the loans we acquired will become impaired, and impairment may result in additional charge-offs to the portfolio. The fluctuations in national, regional and local economic conditions, including those related to local residential, commercial real estate and construction markets, may increase the level of charge-offs that we make to our loan portfolio, and, consequently, reduce our net income, and may also increase the level of charge-offs on the loan portfolios that we have acquired in the AUB and USB acquisitions and correspondingly reduce our net income. These fluctuations are not predictable, cannot be controlled and may have a material adverse impact on our operations and financial condition even if other favorable events occur.
Although we have entered into loss-sharing agreements with the FDIC which provide that a significant portion of losses related to specified loan portfolios that we have acquired in connection with the FDIC-assisted transactions will be borne by the FDIC, we are not protected for all losses resulting from charge-offs with respect to those specified loan portfolios. Additionally, the loss-sharing agreements have limited terms; therefore, any charge-off of related losses that we experience after the term of the loss-sharing agreements will not be reimbursed by the FDIC and will negatively impact our net income. The loss-sharing agreements also impose standard requirements on us which must be satisfied in order to retain loss share protections.
RISKS RELATED TO OUR COMMON STOCK
The price of our Common Stock is volatile and may decline.
The trading price of our Common Stock may fluctuate widely as a result of a number of factors, many of which are outside our control. In addition, the stock market is subject to fluctuations in the share prices and trading volumes that affect the market prices of the shares of many companies. These broad market fluctuations have adversely affected and may continue to adversely affect the market price of our Common Stock. Among the factors that could affect our stock price are:
| • | actual or anticipated quarterly fluctuations in our operating results and financial condition; |
| • | changes in revenue or earnings estimates or publication of research reports and recommendations by financial analysts or actions taken by rating agencies with respect to our securities or those of other financial institutions; |
| • | failure to meet analysts’ revenue or earnings estimates; |
| • | speculation in the press or investment community; |
| • | strategic actions by us or our competitors, such as acquisitions or restructurings; |
| • | actions by institutional shareholders; |
| • | fluctuations in the stock price and operating results of our competitors; |
| • | general market conditions and, in particular, developments related to market conditions for the financial services industry; |
| • | proposed or adopted regulatory changes or developments; |
| • | anticipated or pending investigations, proceedings or litigation that involve or affect us; or |
| • | domestic and international economic factors unrelated to our performance. |
A significant decline in our stock price could result in substantial losses for individual shareholders and could lead to costly and disruptive securities litigation.
Securities issued by us, including our Common Stock, are not FDIC insured.
Securities issued by us, including our Common Stock, are not savings or deposit accounts or other obligations of any bank and are not insured by the FDIC, the Deposit Insurance Fund or any other governmental agency or instrumentality, or any private insurer, and are subject to investment risk, including the possible loss of principal.
We may issue debt and equity securities or securities convertible into equity securities, any of which may be senior to our Common Stock as to distributions and in liquidation, which could negatively affect the value of our Common Stock.
In the future, we may attempt to increase our capital resources by entering into debt or debt-like financing that is unsecured or secured by all or up to all of our assets, or by issuing additional debt or equity securities, which could include issuances of secured or unsecured commercial paper, medium-term notes, senior notes, subordinated notes, preferred stock or securities convertible
24
Table of Contents
Index to Financial Statements
into or exchangeable for equity securities. In the event of our liquidation, our lenders and holders of our debt and preferred securities would receive a distribution of our available assets before distributions to the holders of our Common Stock. Because our decision to incur debt and issue securities in our future offerings will depend on market conditions and other factors beyond our control, we cannot predict or estimate with certainty the amount, timing or nature of our future offerings and debt financings. Further, market conditions could require us to accept less favorable terms for the issuance of our securities in the future.
You may not receive dividends on the Common Stock.
Holders of our Common Stock are only entitled to receive such dividends as our Board of Directors may declare out of funds legally available for such payments. During 2008 and in response to anticipated increases in corporate risks, our Board reduced our dividend from $0.56 per common share annually to $0.20 per common share annually. During 2009, the Board took further action, replacing the cash dividend with stock dividends. Our Board may further adjust, suspend or eliminate altogether dividends on Common Stock if they believe conditions warrant such action.
Sales of a significant number of shares of our Common Stock in the public markets, or the perception of such sales, could depress the market price of our Common Stock.
Sales of a substantial number of shares of our Common Stock in the public markets and the availability of those shares for sale could adversely affect the market price of our Common Stock. In addition, future issuances of equity securities, including pursuant to outstanding options, could dilute the interests of our existing stockholders and could cause the market price of our Common Stock to decline. We may issue such additional equity or convertible securities to raise additional capital. Depending on the amount offered and the levels at which we offer the stock, issuances of common or preferred stock could be substantially dilutive to shareholders of our Common Stock. Moreover, to the extent that we issue restricted stock, phantom shares, stock appreciation rights, options or warrants to purchase our Common Stock in the future and those stock appreciation rights, options or warrants are exercised or as shares of restricted stock vest, our shareholders may experience further dilution. Holders of our shares of Common Stock have no preemptive rights that entitle holders to purchase their pro rata share of any offering of shares of any class or series and, therefore, such sales or offerings could result in increased dilution to our shareholders. We cannot predict with certainty the effect that future sales of our Common Stock would have on the market price of our Common Stock.
ITEM 1B. UNRESOLVED STAFF COMMENTS
None.
The Company’s corporate headquarters is located at 310 First St., SE, Moultrie, Georgia 31768. The Company occupies approximately 6,300 square feet at this location, plus an additional 37,248 square feet used for support services for banking operations, including credit, sales and operational support, as well as audit and loan review services. In addition to its corporate headquarters, Ameris operates 53 office or branch locations, of which 42 are owned and 11 are subject to either building or ground leases. At December 31, 2009, there were no significant encumbrances on the offices, equipment or other operational facilities owned by Ameris and the Bank.
From time to time, the Company and the Bank are parties to legal proceedings arising in the ordinary course of our business operations. Management, after consultation with legal counsel, does not anticipate that current litigation will have a material adverse effect on the Company’s financial position or results of operations or cash flows.
ITEM 4. (REMOVED AND RESERVED)
ITEM 5. MARKET FOR THE REGISTRANT’S COMMON EQUITY, RELATED STOCKHOLDER MATTERS AND ISSUER PURCHASES OF EQUITY SECURITIES
Market Price of Common Stock
The Common Stock is listed on the NASDAQ Global Select Market (“NASDAQ”) under the symbol “ABCB”. The following table sets forth: (i) the high, low and closing sales prices for the Common Stock as quoted on NASDAQ during 2009 and 2008, as adjusted for stock dividends; and (ii) the amount of quarterly dividends declared on the Common Stock during the periods indicated. The high and low sales prices reflect inter-dealer prices, without retail mark-up, mark-down or commission, and may not necessarily represent actual transactions.
25
Table of Contents
Index to Financial Statements
| Quarter Ended 2009 |
High | Low | Close | Dividend | ||||||||
| March 31 |
$ | 11.73 | $ | 3.66 | $ | 4.71 | $ | .05 | ||||
| June 30 |
7.96 | 5.21 | 6.32 | .05 | ||||||||
| September 30 |
7.47 | 5.93 | 7.15 | 1 for 130 | ||||||||
| December 31 |
7.25 | 5.13 | 7.16 | 1 for 130 | ||||||||
| Quarter Ended 2008 |
High | Low | Close | Dividend | ||||||||
| March 31 |
$ | 16.55 | $ | 12.60 | $ | 16.06 | $ | .14 | ||||
| June 30 |
16.48 | 8.70 | 8.70 | .14 | ||||||||
| September 30 |
15.07 | 7.82 | 14.85 | .05 | ||||||||
| December 31 |
14.21 | 7.19 | 11.85 | .05 | ||||||||
Dividends
The amount of and nature of any dividends declared on our Common Stock in the future will be determined by our Board of Directors in their sole discretion. During 2008, the Board reduced our dividend from $0.56 per share of Common Stock annually to $0.20 per share annually. Beginning with the third quarter of 2009, the Board also replaced our cash dividend with a stock dividend. In addition, should the Board determine to declare a cash dividend in the future, the consent of the Treasury would be required for any increase in the per share dividends on the Common Stock beyond the per share dividend declared prior to October 14, 2008 ($0.05 per share per quarter). This limitation is in effect until the third anniversary of the date of the Treasury’s investment in the Preferred Shares, unless prior to the third anniversary, the Preferred Shares are redeemed or the Treasury has transferred all of its Preferred Shares to third parties.
Holders of Common Stock
As of February 26, 2010, there were approximately 2,150 holders of record of the Common Stock. The Company believes that a portion of Common Stock outstanding is held either in nominee name or street name brokerage accounts; therefore, the Company is unable to determine the number of beneficial owners of the Common Stock.
Equity Compensation Plans
The following table sets forth certain information with respect to securities to be issued under our equity compensation plans as of December 31, 2009.
| Plan Category |
Number of securities to be issued upon exercise of outstanding options, warrants and rights |
Weighted average exercise price of outstanding options, warrants and rights |
Number of securities remaining available for future issuance under equity compensation plans | ||||
| Equity compensation plans approved by |
824,977 | $ | 14.69 | 437,814 | |||
| (1) | Consists of our (i) 2005 Omnibus Stock Ownership and Long-Term Incentive Plan, which provides for the granting to officers and certain other employees of qualified or nonqualified stock options, restricted stock, stock appreciation rights, long-term incentive compensation units consisting of a combination of cash and Common Stock or any combination thereof, and (ii) the ABC Bancorp Omnibus Stock Ownership and Long-Term Incentive Plan that was adopted in 1997, which now is operative only with respect to the exercise of options that remain outstanding under such plan and under which no further awards may be granted. All securities remaining for future issuance represent awards that may be granted under the 2005 Omnibus Stock Ownership and Long-Term Incentive Plan. |
26
Table of Contents
Index to Financial Statements
Performance Graph
Set forth below is a line graph comparing the change in the cumulative total shareholder return on the Common Stock against the cumulative return of the NASDAQ Stock Market (U.S. Companies) Index and the index of NASDAQ Bank Stocks for the five-year period commencing December 31, 2004, and ending December 31, 2009. This line graph assumes an investment of $100 on December 31, 2004 and reinvestment of dividends and other distributions to shareholders.
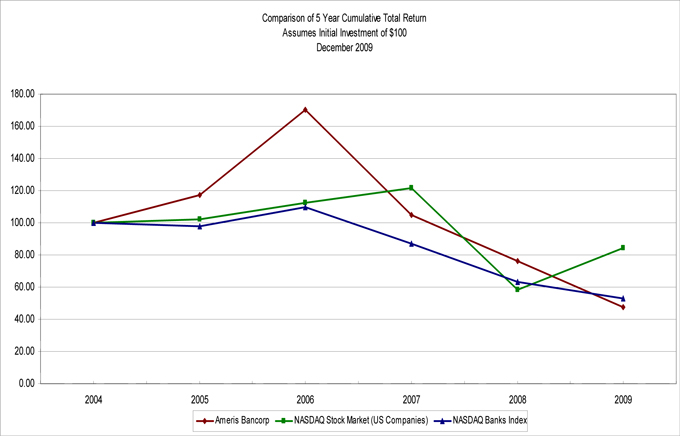
27
Table of Contents
Index to Financial Statements
Pursuant to the regulations of the Commission, this performance graph is not “soliciting material,” is not deemed filed with the Commission and is not to be incorporated by reference in any filing of the Company under the Securities Act or the Exchange Act
ITEM 6. SELECTED FINANCIAL DATA
The following table presents selected consolidated financial information for Ameris. The data set forth below is derived from the audited consolidated financial statements of Ameris. The acquisitions of FNB on December 15, 2005 and Islands on December 31, 2006 have significantly affected the comparability of selected financial data. Specifically, since these acquisitions were accounted for using the purchase method, the assets of the acquired institutions were recorded at their fair values, the excess purchase price over the net fair value of the assets was recorded as goodwill and the results of operations for these businesses have been included in the Company’s results since the date these acquisitions were completed. Accordingly, the level of our assets and liabilities and our results of operations for these acquisitions have significantly affected the Company’s financial position and results of operations. Discussion of these acquisitions can be found in the “Corporate Restructuring and Business Combinations” section of Part I, Item 1. of this Annual Report and in Note 3 – “Business Combinations” in the Notes to Consolidated Financial Statements. The selected financial data should be read in conjunction with, and is qualified in its entirety by, the Consolidated Financial Statements and the Notes thereto and Management’s Discussion and Analysis of Financial Condition and Results of Operations included elsewhere herein.
| Year Ended December 31, | |||||||||||||||||
| 2009 | 2008 | 2007 | 2006 | 2005 | |||||||||||||
| (Dollars in Thousands, Except Per Share Data) | |||||||||||||||||
| Selected Balance Sheet Data: |
|||||||||||||||||
| Total assets |
$ | 2,423,970 | $ | 2,407,090 | $ | 2,112,063 | $ | 2,047,542 | $ | 1,697,209 | |||||||
| Total loans, gross |
1,584,359 | 1,695,777 | 1,614,048 | 1,442,951 | 1,186,601 | ||||||||||||
| Total deposits |
2,123,116 | 2,013,525 | 1,757,265 | 1,710,163 | 1,375,232 | ||||||||||||
| Investment securities available for sale |
245,556 | 367,894 | 289,382 | 283,192 | 235,145 | ||||||||||||
| Stockholders’ equity |
194,964 | 239,359 | 191,249 | 178,732 | 148,703 | ||||||||||||
| Selected Income Statement Data: |
|||||||||||||||||
| Interest income |
$ | 114,573 | $ | 129,008 | $ | 146,077 | $ | 124,111 | $ | 79,539 | |||||||
| Interest expense |
40,550 | 56,343 | 70,999 | 54,150 | 26,934 | ||||||||||||
| Net interest income |
74,023 | 72,665 | 75,078 | 69,961 | 52,605 | ||||||||||||
| Provision for loan losses |
42,068 | 35,030 | 11,321 | 2,837 | 1,651 | ||||||||||||
| Other income |
58,353 | 19,149 | 17,592 | 19,262 | 13,530 | ||||||||||||
| Other expenses |
124,800 | 62,753 | 58,896 | 53,129 | 43,607 | ||||||||||||
| Income/(loss) before income taxes |
(34,492 | ) | (5,969 | ) | 22,453 | 33,257 | 20,877 | ||||||||||
| Income tax expense/(benefit) |
7,297 | (2,053 | ) | 7,300 | 11,129 | 7,149 | |||||||||||
| Net income/(loss) |
$ | (41,789 | ) | $ | (3,916 | ) | $ | 15,153 | $ | 22,128 | $ | 13,728 | |||||
| Preferred stock dividends |
3,161 | 328 | - | - | - | ||||||||||||
| Net income/(loss) available to common shareholders |
$ | (44,950 | ) | $ | (4,244 | ) | $ | 15,153 | $ | 22,128 | $ | 13,728 | |||||
| Per Share Data: |
|||||||||||||||||
| Net income/(loss) - basic |
$ | (3.27 | ) | $ | (0.31 | ) | $ | 1.12 | $ | 1.71 | $ | 1.15 | |||||
| Net income/(loss) - diluted |
(3.27 | ) | (0.31 | ) | 1.11 | 1.68 | 1.14 | ||||||||||
| Common book value |
10.52 | 14.06 | 14.12 | 13.19 | 11.48 | ||||||||||||
| Common dividends - cash |
.10 | 0.38 | 0.56 | 0.56 | 0.56 | ||||||||||||
| Common dividends - stock |
2 for 130 | - | - | - | - | ||||||||||||
28
Table of Contents
Index to Financial Statements
| Year Ended December 31, | |||||||||||||||
| 2009 | 2008 | 2007 | 2006 | 2005 | |||||||||||
| (Dollars in Thousands, Except Per Share Data) | |||||||||||||||
| Profitability Ratios: |
|||||||||||||||
| Net income to average total assets |
(1.87 | )% | (0.19 | )% | 0.74 | % | 1.22 | % | 1.04 | % | |||||
| Net income to average common stockholders’ equity |
(21.59 | ) | (2.22 | ) | 8.13 | 13.9 | 10.87 | ||||||||
| Net interest margin |
3.52 | 3.65 | 4.02 | 4.25 | 4.31 | ||||||||||
| Efficiency ratio |
94.28 | 68.35 | 63.55 | 59.55 | 65.94 | ||||||||||
| Loan Quality Ratios: |
|||||||||||||||
| Net charge-offs to average loans* |
2.77 | % | 1.36 | % | 0.53 | % | 0.09 | % | 0.03 | % | |||||
| Reserve for loan losses to total loans |
2.26 | 2.33 | 1.71 | 1.72 | 1.88 | ||||||||||
| Nonperforming assets to total loans and OREO |
6.73 | 4.13 | 1.60 | 0.61 | 0.90 | ||||||||||
| Liquidity Ratios: |
|||||||||||||||
| Loans to total deposits |
74.62 | % | 84.22 | % | 91.85 | % | 84.38 | % | 86.28 | % | |||||
| Average loans (TE) to average earnings assets (TE) |
79.26 | 82.32 | 81.72 | 79.39 | 77.32 | ||||||||||
| Noninterest-bearing deposits to total deposits |
11.16 | 10.36 | 9.36 | 12.96 | 14.6 | ||||||||||
| Capital Adequacy Ratios: |
|||||||||||||||
| Stockholders’ equity to total assets |
8.04 | % | 7.91 | % | 9.06 | % | 8.73 | % | 8.76 | % | |||||
| Common stock dividend payout ratio |
NM | NM | 50.00 | 32.94 | 48.7 | ||||||||||
| *Excludes | covered assets |
ITEM 7. MANAGEMENT’S DISCUSSION AND ANALYSIS OF FINANCIAL CONDITION AND RESULTS OF OPERATIONS
OVERVIEW
During 2009, the Company reported a net loss available to common shareholders of $45.0 million, or $3.27 per share, compared to a net loss available to common shareholders in 2008 of $4.2 million, or $0.31 per share. The Company’s loss as a percentage of average assets for 2009 and 2008 was 1.87% and 0.19%, respectively, while the Company’s loss as a percentage of average shareholders’ equity was 21.59% and 2.2, respectively.
The Company’s performance in 2009 was impacted by a number of significant items. The major influences are:
| • | A goodwill impairment charge of $54.8 million was recorded during the fourth quarter of 2009. The impairment charge was a non-cash event that was necessitated by a third-party review of our carrying value. The charge did not impact our regulatory capital ratios or our liquidity positions. |
| • | The Company participated in two federally assisted acquisitions in the fourth quarter of 2009. These transactions resulted in net income of $25.1 million, after tax. At December 31, 2009, loans and deposits from these two transactions totaled $137.2 million and $113.7 million, respectively. |
29
Table of Contents
Index to Financial Statements
| • | Credit costs increased materially over earlier years because of declines in credit quality. Several of the Company’s markets have experienced severe declines in real estate values and activity. In addition, the strength of the Company’s borrowers has been affected by national and local economic conditions which has further exacerbated the costs of collateral shortages. During 2009, the Company recorded $53.7 million of credit costs compared to $38.0 million in 2008. Credit costs include the loan loss provision, losses on the sale of problem loans or OREO, and legal oriented costs associated with problem loans or OREO. |
| • | The Company’s net interest margin declined only slightly during 2009 to 3.52% from 3.65% in 2008. Opportunities to reduce deposit and funding costs in 2009 contributed to the successful effort to maintain steady net interest margins, despite a growing level of non-performing assets and higher than normal levels of short-term assets. |
| • | Total assets ended 2009 at $2.42 billion, in part due to the additional assets acquired in the Company’s FDIC-assisted transactions. Management had systematically reduced assets through successful efforts at reducing concentrations in construction and development loans and in commercial real estate loans. This effort had reduced assets to approximately $2.2 billion at the end of the third quarter of 2009. |
| • | Deposits and our deposit mix changed dramatically during 2009. Management has focused significant efforts at increasing sales of transaction deposits with significantly less emphasis placed on time deposits. These efforts combined with the current rate environment resulted in an increase in average transaction deposits of 27.4% when compared to December 31, 2008. At the end of 2009, transaction deposits (interest bearing and non-interest bearing demand) increased to 58.6% of total deposits, compared to 43.6% of total deposits at December 31, 2008. |
| • | At December 31, 2009, the Bank had only $2 million of non-deposit borrowings outstanding and only $164 million of brokered deposits, representing only 7.5% of the Bank’s total funding. |
CRITICAL ACCOUNTING POLICIES
Ameris has established certain accounting and financial reporting policies to govern the application of accounting principles generally accepted in the United States of America in the preparation of our financial statements. Our significant accounting policies are described in the Notes to the Consolidated Financial Statements. Certain accounting policies involve significant judgments and assumptions by management which have a material impact on the carrying value of certain assets and liabilities; management considers these accounting policies to be critical accounting policies. The judgments and assumptions used by management are based on historical experience and other factors which are believed to be reasonable under the circumstances. Because of the nature of the judgments and assumptions made by management, actual results could differ from the judgments and estimates adopted by management which could have a material impact on the carrying values of assets and liabilities and the results of our operations. We believe the following accounting policies applied by Ameris represent critical accounting policies.
Allowance for Loan Losses
We believe the allowance for loan losses is a critical accounting policy that requires the most significant judgments and estimates used in the preparation of our consolidated financial statements. The allowance for loan losses represents management’s estimate of probable loan losses inherent in the Company’s loan portfolio. Calculation of the allowance for loan losses represents a critical accounting estimate due to the significant judgment, assumptions and estimates related to the amount and timing of estimated losses, consideration of subjective environmental factors and the amount and timing of cash flows related to impaired loans.
Management believes that the allowance for loan losses is adequate. While management uses available information to recognize losses on loans, future additions to the allowance for loan losses may be necessary based on changes in economic conditions. In addition, various regulatory agencies, as an integral part of their examination processes, periodically review the Company’s allowance for loan losses. Such agencies may require the Company to recognize additions to the allowance for loan losses based on their judgments about information available to them at the time of their examination.
Considering current information and events regarding a borrower’s ability to repay its obligations, management considers a loan to be impaired when the ultimate collectability of all amounts due, according to the contractual terms of the loan agreement, is in doubt. When a loan is considered to be impaired, the amount of impairment is measured based on the present value of expected future cash flows discounted at the loan’s effective interest rate or if the loan is collateral-dependent, the fair value of the collateral is used to determine the amount of impairment. Impairment losses are included in the allowance for loan losses through a charge to the provision for losses on loans.
Subsequent recoveries are credited to the allowance for loan losses. Cash receipts for accruing loans are applied to principal and interest under the contractual terms of the loan agreement. Cash receipts on impaired loans for which the accrual of interest has been discontinued are applied first to principal and then to interest income.
Certain economic and interest rate factors could have a material impact on the determination of the allowance for loan losses. An increase in interest rates by the Federal Reserve would favorably impact our net interest margin. An improving economy could
30
Table of Contents
Index to Financial Statements
result in the expansion of businesses and creation of jobs which would positively affect our loan growth and improve our gross revenue stream. Conversely, certain factors could result from an expanding economy which could increase our credit costs and materially adversely impact our net earnings. A significant rapid rise in interest rates could create higher borrowing costs and shrinking corporate profits which could have a material impact on a borrower’s ability to pay. We will continue to concentrate on maintaining a high quality loan portfolio through strict administration of our loan policy.
Another factor that we have considered in the determination of the allowance for loan losses is loan concentrations to individual borrowers or industries. We had three loans that exceed our in-house credit limit of $5.0 million. Total exposure to these three credits is $17.9 million. Additional disclosure concerning the Company’s largest loan relationships is provided below.
A substantial portion of our loan portfolio is in the commercial real estate and residential real estate sectors. Those loans are secured by real estate in our primary market areas. A substantial portion of other real estate owned is located in those same markets. Therefore, the ultimate collectability of a substantial portion of our loan portfolio and the recovery of a substantial portion of the carrying amount of other real estate owned are susceptible to changes to market conditions in our primary market area.
Fair Value Accounting Estimates
Generally accepted accounting principles require the use of fair values in determining the carrying values of certain assets and liabilities, as well as for specific disclosures. The most significant include impaired loans and foreclosed property and the net assets acquired in business combinations. Certain of these assets do not have a readily available market to determine fair value and require an estimate based on specific parameters. When market prices are unavailable, we determine fair values utilizing parameters, which are constantly changing, including interest rates, duration, prepayment speeds and other specific conditions. In most cases, these specific parameters require a significant amount of judgment by management. At December 31, 2009, the percentage of the Company’s assets measured at their fair value was 21%. See Note 19 “Fair Value” in the consolidated financial statements herein for additional disclosures regarding the fair value of our assets and liabilities.
When a loan is considered impaired, a specific valuation allowance is allocated, if necessary, so that the loan is reported net, at the present value of estimated future cash flows using the loan’s existing rate or at the fair value of collateral if repayment is expected solely from the collateral. In addition, foreclosed assets are carried at the lower of cost or “fair value”, less cost to sell, following foreclosure. The Company’s impaired loans and foreclosed property are concentrated in markets and areas where the determination of fair value through market research (recent sales and/or qualified appraisals) is difficult. Accordingly, the determination of fair value in the current environment is difficult and more subjective than it would be in traditionally stable real estate environments. Although management believes its processes for determining the value of these assets are appropriate factors and allow Ameris to arrive at a fair value, the processes require management judgment and assumptions and the value of such assets at the time they are revalued or divested may be different from management’s determination of fair value.
Assets purchased and liabilities assumed in a business combination are recorded at their fair value. The fair value of a loan portfolio acquired in a business combination requires greater levels of management estimates and judgment than the remainder of purchased assets or assumed liabilities. On the date of acquisition, when the loans have evidence of credit deterioration since origination and it is probable at the date of acquisition that the Company will not collect all contractually required principal and interest payments, the difference between contractually required payments at acquisition and the cash flows expected to be collected at acquisition is referred to as the non-accretable difference. The Company must estimate expected cash flows at each reporting date. Subsequent decreases to the expected cash flows will generally result in a provision for loan losses. Subsequent increases in cash flows result in a reversal of the provision for loan losses to the extent of prior charges and adjusted accretable yield which will have a positive impact on interest income. In addition, purchased loans without evidence of credit deterioration are also handled under this method.
Income Taxes
GAAP requires the asset and liability approach for financial accounting and reporting for deferred income taxes. We use the asset and liability method of accounting for deferred income taxes and provide deferred income taxes for all significant income tax temporary differences. See Note 13 to the Notes to Consolidated Financial Statements for additional details.
As part of the process of preparing our consolidated financial statements we are required to estimate our income taxes in each of the jurisdictions in which we operate. This process involves estimating our actual current tax exposure together with assessing temporary differences resulting from differing treatment of items, such as depreciation and the provision for loan losses, for tax and financial reporting purposes. These differences result in deferred tax assets and liabilities that are included in our consolidated balance sheet.
We must also assess the likelihood that our deferred tax assets will be recovered from future taxable income, and to the extent we believe that recovery is not likely, we must establish a valuation allowance. Significant management judgment is required in determining our provision for income taxes, our deferred tax assets and liabilities and any valuation allowance recorded against
31
Table of Contents
Index to Financial Statements
our net deferred tax assets. To the extent we establish a valuation allowance or adjust this allowance in a period, we must include an expense within the tax provisions in the statement of income.
We have recorded on our consolidated balance sheet net deferred tax liabilities of $2.0 million. Deferred gains on FDIC-assisted transactions represent the Company’s largest deferred tax liability, totaling $11.9 million. Provisions for loan losses associated with loans where no loss has yet been recorded represent the Company’s largest deferred tax asset, totaling $12.5 million. The Company does have deferred tax assets related to certain loss carryforwards. For these assets, Ameris believes there will be sufficient taxable income in the future to allow utilization of these loss carryforwards in the tax jurisdictions where they exist.
Long-Lived Assets, Including Intangibles
As in prior years, the Company engaged an independent third party to evaluate the carrying value of goodwill. During 2009, it was determined that the balance of goodwill was impaired, and as such, the Company recorded an impairment charge of $54.8 million, representing the entire balance of goodwill. No goodwill was expensed or amortized during 2007 or 2008 in accordance with GAAP.
The Company’s balance of intangible assets at December 31, 2009 totaled $3.6 million and is being amortized over its previously determined useful life. During 2009, the Bank recorded new deposit intangibles totaling $573,000 related to the acquisitions of AUB and USB.
NET INCOME/(LOSS) AND EARNINGS PER SHARE
Excluding a non-cash charge for goodwill impairment that did not affect the Company’s tangible equity or liquidity, the Company reported net income available to common shareholders of $9.9 million, or $0.72 per diluted share, for the year ended December 31, 2009, compared to a net loss of $4.2 million, or $0.31 per diluted share, for 2008. On the same basis, the Company’s net income available to common shareholders for the fourth quarter of 2009 totaled $15.7 million, or $1.14 per diluted share, compared to a net loss available to common shareholders of $10.7 million, or $0.78 per diluted share, for the same period in 2008. The Company’s results were partially driven by gains recorded on FDIC-assisted transactions totaling approximately $25.1 million, after tax.
During the fourth quarter of 2009, the Company recorded a non-cash charge for goodwill impairment totaling $54.8 million. Including the effects of this charge, the Company’s net loss available to common shareholders during 2009 was $45.0 million, or $3.27 per diluted share. On the same basis, the Company’s net loss available to common shareholders totaled $39.2 million, or $2.85 per common share, for the fourth quarter of 2009.
EARNING ASSETS AND LIABILITIES
Average earning assets in 2009 increased 4.9% to $2.13 billion as compared to 2008. The earning asset and interest-bearing liability mix is regularly monitored to maximize the net interest margin and, therefore, increase return on assets and shareholders’ equity.
The following statistical information should be read in conjunction with the remainder of “Management’s Discussion and Analysis of Financial Condition and Results of Operation” and the financial statements and related notes included elsewhere in this Annual Report and in the documents incorporated herein by reference.
The following tables set forth the amount of our interest income or interest expense for each category of interest-earning assets and interest-bearing liabilities and the average interest rate for total interest-earning assets and total interest-bearing liabilities, net interest spread and net yield on average interest-earning assets. Federally tax-exempt income is presented on a taxable-equivalent basis assuming a 35% federal tax rate.
32
Table of Contents
Index to Financial Statements
| Year Ended December 31, | |||||||||||||||||||||||||||
| 2009 | 2008 | 2007 | |||||||||||||||||||||||||
| Average Balance |
Interest Income/ Expense |
Average Yield/ Rate Paid |
Average Balance |
Interest Income/ Expense |
Average Yield/ Rate Paid |
Average Balance |
Interest Income/ Expense |
Average Yield/ Rate Paid |
|||||||||||||||||||
| (Dollars in Thousands) | |||||||||||||||||||||||||||
| ASSETS |
|||||||||||||||||||||||||||
| Interest-earning assets: |
|||||||||||||||||||||||||||
| Loans |
$ | 1,684,910 | $ | 101,559 | 6.03 | % | $ | 1,667,483 | $ | 114,186 | 6.85 | % | $ | 1,536,243 | $ | 129,376 | 8.42 | % | |||||||||
| Investment securities |
289,320 | 13,505 | 4.67 | % | 309,109 | 15,517 | 5.02 | 298,036 | 14,785 | 4.96 | |||||||||||||||||
| Short-term assets |
151,318 | 334 | 0.22 | % | 49,082 | 507 | 1.03 | 45,634 | 2,349 | 5.15 | |||||||||||||||||
| Total earning assets |
2,125,548 | 115,398 | 5.43 | % | 2,025,674 | 130,210 | 6.43 | 1,879,913 | 146,510 | 7.79 | |||||||||||||||||
| Non-earning assets |
145,791 | 175,362 | 175,015 | ||||||||||||||||||||||||
| Total assets |
$ | 2,271,339 | $ | 2,201,036 | $ | 2,054,928 | |||||||||||||||||||||
| LIABILITIES AND STOCKHOLDERS’ EQUITY |
|||||||||||||||||||||||||||
| Interest-bearing liabilities: |
|||||||||||||||||||||||||||
| Savings and interest-bearing demand deposits |
$ | 865,001 | $ | 11,107 | 1.28 | % | $ | 656,876 | $ | 11,611 | 1.77 | % | $ | 634,287 | $ | 18,014 | 2.84 | % | |||||||||
| Time deposits |
900,744 | 27,399 | 3.04 | % | 968,124 | 40,331 | 4.17 | 874,609 | 44,367 | 5.07 | |||||||||||||||||
| Other borrowings |
30,799 | 272 | 0.88 | % | 22,294 | 497 | 2.22 | 16,425 | 722 | 4.40 | |||||||||||||||||
| FHLB advances |
7,974 | 104 | 1.30 | % | 102,641 | 1,500 | 1.46 | 92,570 | 4,732 | 5.11 | |||||||||||||||||
| Trust preferred securities |
42,269 | 1,668 | 3.95 | % | 42,269 | 2,404 | 5.69 | 42,269 | 3,164 | 7.49 | |||||||||||||||||
| Total interest-bearing liabilities |
1,846,787 | 40,550 | 2.20 | % | 1,792,204 | 56,343 | 3.14 | 1,660,160 | 70,999 | 4.28 | |||||||||||||||||
| Demand deposits |
213,786 | 198,422 | 192,575 | ||||||||||||||||||||||||
| Other liabilities |
9,472 | 13,566 | 15,880 | ||||||||||||||||||||||||
| Stockholders’ equity |
201,294 | 196,844 | 186,313 | ||||||||||||||||||||||||
| Total liabilities and stockholders’ equity |
$ | 2,271,339 | $ | 2,201,036 | $ | 2,054,928 | |||||||||||||||||||||
| Interest rate spread |
3.23 | % | 3.29 | % | 3.52 | % | |||||||||||||||||||||
| Net interest income |
$ | 74,848 | $ | 73,867 | $ | 75,511 | |||||||||||||||||||||
| Net interest margin |
3.52 | % | 3.65 | % | 4.02 | % | |||||||||||||||||||||
RESULTS OF OPERATIONS
Net Interest Income
Net interest income represents the amount by which interest income on interest-bearing assets exceeds interest expense incurred on interest-bearing liabilities. Net interest income is the largest component of our income and is affected by the interest rate environment and the volume and composition of interest-earning assets and interest-bearing liabilities. Our interest-earning assets include loans, investment securities, interest-bearing deposits in banks and federal funds sold. Our interest-bearing liabilities include deposits, other short-term borrowings, FHLB advances and subordinated debentures.
2009 compared to 2008. During 2009, the Company saw several significant trends in earning assets and in its funding mix. With regard to earning assets, short-term assets (federal funds sold and interest bearing deposits) averaged $151.3 million during 2009, compared to $49.3 million in 2008. Traditionally, the Company’s yearend balance sheet contains significant amounts of excess deposits from municipalities and businesses. Expected declines in these balances will reduce the Company’s position in short-term assets and further improve capital ratios. Loans decreased during 2009 to $1.58 billion from $1.70 billion at the end of 2008. The decrease in loans resulted from the combination of continued reductions in construction and development loans and reduced demand over our entire footprint. Investment securities decreased substantially during 2009, from $367.9 million at the end of 2008 to $245.6 million at the end of 2009, because management has not invested material amounts of short-term assets in the current interest rate environment.
The Company’s funding mix improved dramatically during 2009, leading to significant savings in cost of funds. At December 31, 2009, demand deposits (interest-bearing and non-interest bearing) amounted to $1.2 billion and comprised 58.6% of total deposits compared to $878 million, or 43.6% of total deposits, at December 31, 2008. During the same time, the Company’s time deposits fell to $871 million, or 38.4% of total deposits, compared to $1.1 billion, or 56.4% of total deposits, at the end of 2008. Aggressive efforts marketing the Company’s treasury management platform as well as retail deposit sales efforts were successful, particularly in the fourth quarter of 2009.
In 2009, the Company reported $74.0 million in net interest income, a modest increase of $1.3 million, or 1.9%, from levels reported in 2008. Declines in interest income and yields on earning assets were offset by savings on interest expense realized from substantial improvements in the Company’s funding mix. Yields on earning assets declined to 5.43% in 2009 compared to 6.43% in 2008. Declines in loan yields and the Company’s concentration in low-yielding short-term assets accounted for the majority of the declines. Loan yields in 2009 were 6.03% compared to 6.85% in 2008. The concentration in short-term assets during 2009 amounted to 7.1% of earning assets, compared to 2.4% in 2008. The average yield on this higher level of liquidity in 2009 was 0.20%, a decline from 1.06% from 2008. The Company expects to begin managing towards incrementally lower levels of liquidity early in 2010.
33
Table of Contents
Index to Financial Statements
2008 compared to 2007. For the year ended December 31, 2008, interest income was $129.0 million, a decrease of $17.1 million, or 11.7%, compared to the same period in 2007. Average earning assets increased $145.8 million, or 7.8%, to $2.03 billion for the year ended December 31, 2008, compared to $1.88 billion as of December 31, 2007. Yield on average earning assets on a taxable equivalent basis for 2007 decreased to 6.43%, compared to 7.79% for the year ended December 31, 2007. The change in yields on earning assets during 2008 resulted from a lower interest rate environment in 2008 than in 2007 with benchmark interest rates falling to historic lows as well as increased levels of non-accrual loans where foregone interest income was approximately $4.6 million.
Interest expense on deposits and other borrowings for the year ended December 31, 2008 was $56.3 million, compared to $71.0 million for the year ended December 31, 2007. During 2008, average funding increased $137.9 million, or 7.4%. The majority of this growth in average total funding was in time deposits, which increased 10.7%. Average non-deposit borrowings increased 10.5% during 2008 as the Company used these lines more aggressively to counter the higher costs of deposits.
During 2008, yields on average deposit borrowings fell to 2.85% from 3.67% in 2007. Although the fall in deposit yields was significant, its level relative to falling interest income was not sufficient to preserve normal levels of net interest margin. As the year came to a close, yields on deposit borrowings began to react positively to government intervention aimed at increasing liquidity levels. Non-deposit borrowings decreased substantially from 5.70% in 2007 to 2.63% in 2008 as the majority of these deposits are tied to national rate indices that fell during 2008 to historically low levels.
On a taxable-equivalent basis, net interest income for 2008 was $73.9 million, compared to $75.5 million in 2007, a decrease of 2.2%. The Company’s net interest margin, on a tax-equivalent basis, decreased to 3.65% for the year ended December 31, 2008, compared to 4.02% in the prior year.
| Year Ended December 31, | |||||||||||||||||||||||
| 2009 vs. 2008 | 2008 vs. 2007 | ||||||||||||||||||||||
| Increase (Decrease) |
Changes Due To | Increase (Decrease) |
Changes Due To | ||||||||||||||||||||
| Rate | Volume | Rate | Volume | ||||||||||||||||||||
| (Dollars in Thousands) | |||||||||||||||||||||||
| Increase (decrease) in: |
|||||||||||||||||||||||
| Income from earning assets: |
|||||||||||||||||||||||
| Interest and fees on loans |
$ | (12,627 | ) | $ | (13,857 | ) | $ | 1,230 | $ | (15,190 | ) | $ | (26,284 | ) | $ | 11,094 | |||||||
| Interest on securities: |
(2,012 | ) | (1,019 | ) | (993 | ) | 732 | 185 | 547 | ||||||||||||||
| Short-term assets |
(173 | ) | (1,225 | ) | 1,052 | (1,842 | ) | (2,019 | ) | 177 | |||||||||||||
| Total interest income |
(14,812 | ) | (16,101 | ) | 1,289 | (16,300 | ) | (28,118 | ) | 11,818 | |||||||||||||
| Expense from interest-bearing liabilities: |
|||||||||||||||||||||||
| Interest on savings and interest-bearing demand deposits |
(504 | ) | (4,204 | ) | 3,700 | (6,403 | ) | (7,045 | ) | 642 | |||||||||||||
| Interest on time deposits |
(12,932 | ) | (10,162 | ) | (2,770 | ) | (4,035 | ) | (8,776 | ) | 4,741 | ||||||||||||
| Interest on other borrowings |
(225 | ) | (412 | ) | 187 | (225 | ) | (483 | ) | 258 | |||||||||||||
| Interest on FHLB advances |
(1,396 | ) | (12 | ) | (1,384 | ) | (3,232 | ) | (3,747 | ) | 515 | ||||||||||||
| Interest on trust preferred securities |
(736 | ) | (737 | ) | 1 | (760 | ) | (760 | ) | - | |||||||||||||
| Total interest expense |
(15,793 | ) | (15,527 | ) | (266 | ) | (14,655 | ) | (20,811 | ) | 6,156 | ||||||||||||
| Net interest income |
$ | 981 | $ | (574 | ) | $ | 1,555 | $ | (1,645 | ) | $ | (7,307 | ) | $ | 5,662 | ||||||||
Provision for Loan Losses
The allowance for loan losses is a reserve established through charges to earnings in the form of a provision for loan losses. The provision for loan losses is based on management’s evaluation of the size and composition of the loan portfolio, the level of non-performing and past due loans, historical trends of charged-off loans and recoveries, prevailing economic conditions and other factors management deems appropriate. As these factors change, the level of loan loss provision may change.
Continued declines in credit quality during 2009 resulted in a provision for loan losses of $42.1 million, compared to $35.0 million for 2008 and $11.3 million in 2007. Net charge-offs in 2009 were also elevated from historical levels at 2.26% of average loans compared to 1.36% in 2008 and 0.53% in 2007.
At December 31, 2009, non-performing assets amounted to $119.4 million, or 6.73% of total loans and OREO, compared to 4.13% at December 2008. Other real estate was approximately $23.3 million as of December 31, 2009, reflecting a significant increase from the prior year. The Company’s reserve for loan losses at December 31, 2009 was $35.8 million, or 2.26% of total loans, compared to $39.7 million, or 2.34%, and $27.6 million, or 1.71%, for December 2008 and 2007, respectively.
34
Table of Contents
Index to Financial Statements
Non-Interest Income
Following is a comparison of non-interest income for 2009, 2008 and 2007.
| Years Ended December 31, | |||||||||
| 2009 | 2008 | 2007 | |||||||
| (Dollars in Thousands) | |||||||||
| Service charges on deposit accounts |
$ | 13,593 | $ | 13,916 | $ | 12,455 | |||
| Mortgage banking activities |
3,050 | 3,180 | 3,093 | ||||||
| Gain (loss) on sale of securities |
871 | 316 | (297) | ||||||
| Gain on acquisition |
38,566 | - | - | ||||||
| Other income |
2,273 | 1,737 | 2,341 | ||||||
| $ | 58,353 | $ | 19,149 | $ | 17,592 | ||||
2009 compared to 2008. Total non-interest income in 2009 was $58.4 million, compared to $19.1 million in 2008, an increase of $39.3 million. The majority of the increase in non-interest income related to gains realized on the Company’s FDIC-assisted transactions. In determining the gain from these transactions, the Company evaluated the fair value of the assets acquired and the liabilities assumed. Because the Company’s bid to acquire the assets included discounts totaling $52.2 million and because the anticipated losses were covered by loss-sharing agreements with the FDIC, Ameris determined that the fair value of the assets acquired exceeded the liabilities assumed. The Bank received cash payments from the FDIC totaling $41.3 million to settle the transactions.
Income from mortgage banking activities declined only slightly during 2009. Although mortgage rates are at historically low levels, real estate activity and stricter underwriting guidelines from the guaranteeing agencies have limited the production to levels much lower than would have been anticipated.
Service charges on deposit accounts represent the largest component of recurring non-interest income. In 2009, excluding gains on securities and on acquisitions, service charges were 72% of total non-interest income, compared to 74% in 2008. During the economic downturn of 2009, the Bank noted a gradual reduction in the number of overdrawn accounts and as a result lower levels of insufficient funds charges were recorded.
2008 compared to 2007. The non-interest income component of total revenue grew 9.2% to $19.1 million in 2008. Service charges and fees on deposit accounts grew 8.9% to $13.9 million as the Company increased certain fees and charges. In addition to increasing fees, the Company significantly increased the number of low-cost deposit accounts in most of its markets. Mortgage origination and related fees increased slightly during 2008; primarily as a result of the increase in the sales force and continued focus on mortgage related activities.
Non-Interest Expense
Following is a comparison of non-interest expense for 2009, 2008 and 2007.
| Years Ended December 31, | |||||||||
| 2009 | 2008 | 2007 | |||||||
| (Dollars in Thousands) | |||||||||
| Salaries and employee benefits |
$ | 31,939 | $ | 31,700 | $ | 29,844 | |||
| Equipment and occupancy |
8,914 | 8,069 | 7,540 | ||||||
| Amortization of intangible assets |
643 | 1,170 | 1,297 | ||||||
| Data processing and communication costs |
6,878 | 6,457 | 6,496 | ||||||
| Advertising and public relations |
1,650 | 3,091 | 2,536 | ||||||
| Postage & Delivery |
1,245 | 1,420 | 1,336 | ||||||
| Printing & Supplies |
1,020 | 1,270 | 1,060 | ||||||
| Legal Fees |
445 | 537 | 527 | ||||||
| Other Professional Fees |
803 | 1,306 | 1,307 | ||||||
| Directors fees |
709 | 743 | 787 | ||||||
| FDIC assessments |
3,452 | 932 | 202 | ||||||
| OREO and problem loan expenses |
7,643 | 1,043 | 1,680 | ||||||
| Goodwill impairment charge |
54,813 | - | - | ||||||
| Other expense |
4,646 | 5,015 | 4,284 | ||||||
| $ | 124,800 | $ | 62,753 | $ | 58,896 | ||||
35
Table of Contents
Index to Financial Statements
2009 compared to 2008. Total operating expenses in 2009 included the charge associated with the impairment of goodwill totaling $54.8 million. Excluding this charge, operating expenses totaled $70.0 million, an increase of $7.2 million over levels recorded in 2008. Increases in problem loan and OREO expenses and FDIC insurance premiums more than accounted for the increase in operating expenses, together totaling $9.1 million. Reductions in marketing and advertising expense totaled $1.4 million, or 46.6%, as the Company reduced print and radio advertisements and focused more heavily on lower cost advertising in its local markets. Salaries and benefits were only slightly higher than in 2008 as the Company reallocated personnel from production positions to problem loan and OREO workout positions.
Expenses associated with occupancy and equipment increased by 10.4% in 2009 to $8.9 million as the Company completed work on several branches in South Carolina and in its legacy footprint. At the end of 2009, the Company has no branch projects planned or under development and notes that all costs associated with its recent de novo activity in South Carolina have been incurred.
Data processing and communication costs increased 6.5% during 2009 despite renegotiation of certain contracts and agreements with the Company’s major vendors. These increases relate partially to costs associated with the acquisitions of AUB and USB in the fourth quarter of 2009. Ameris has scheduled conversions of these banks in the first half of 2009 that will provide meaningful savings in data processing costs.
2008 compared to 2007. For the year ended December 31, 2008, total operating expenses were $62.8 million, compared to $59.0 million in 2007, an increase of 6.4%. Salaries and benefits increased 6.2% in 2008 to $31.7 million, compared to $29.8 million in 2007. Continued expansion in certain metro markets during 2008 led to additional staff and personnel costs. Offsetting some of this expense was the Company’s previous announcements to close four branches in smaller markets. Equipment and occupancy expenses increased to $8.1 million in 2008 as a result of the expansion efforts. This level of equipment and occupancy expenses was 8.0% higher than the $7.5 million recorded during 2007. Data processing and communications costs remained unchanged at $6.5 million during 2008 and 2007. Advertising and marketing expenses increased substantially as the Company worked to significantly increase deposit levels. During 2008, total advertising and marketing costs were $3.1 million, compared to $2.5 million in 2007. The Company’s advertising efforts were successful in significantly increasing deposit levels and liquidity ratios during 2008.
Income Taxes
Federal income tax expense is influenced by the amount of taxable income, the amount of tax-exempt income and the amount of non-deductible expenses. For the year ended December 31, 2009, the Company recorded income tax expense of $7.3 million. This compares to an income tax benefit of $2.1 million for the year ended December 31, 2008 and income tax expense of $7.3 million for the year ended December 31, 2007. The Company’s effective tax rate was 36%, 34% and 33% for the years ended December 31, 2009, 2008 and 2007, respectively. Management has excluded the goodwill impairment charge of $54.8 million for purposes of calculating the 2009 effective tax rate.
LOANS
Management believes that our loan portfolio is adequately diversified. The loan portfolio contains no foreign or energy-related loans or significant concentrations in any one industry. As of December 31, 2009, approximately 85.0% of our loan portfolio was secured by real estate. The amount of loans outstanding at the indicated dates is shown in the following table according to type of loans.
| December 31, | |||||||||||||||
| 2009 | 2008 | 2007 | 2006 | 2005 | |||||||||||
| (Dollars in Thousands) | |||||||||||||||
| Commercial, financial & agricultural |
$ | 168,045 | $ | 200,421 | $ | 205,141 | $ | 171,904 | $ | 161,050 | |||||
| Real estate – construction & development |
100,770 | 162,887 | 174,576 | 157,260 | 73,639 | ||||||||||
| Real estate – commercial & farmland |
1,063,369 | 1,070,483 | 996,517 | 883,583 | 719,367 | ||||||||||
| Real estate – residential |
182,483 | 189,203 | 157,334 | 147,789 | 142,609 | ||||||||||
| Consumer installment loans |
59,108 | 64,707 | 69,099 | 73,218 | 79,239 | ||||||||||
| Other |
10,583 | 8,076 | 11,381 | 9,197 | 10,697 | ||||||||||
| 1,584,359 | 1,695,777 | 1,614,048 | 1,442,951 | 1,186,601 | |||||||||||
| Less reserve for possible loan losses |
35,762 | 39,652 | 27,640 | 24,863 | 22,294 | ||||||||||
| Loans, net |
$ | 1,548,597 | $ | 1,656,125 | $ | 1,586,408 | $ | 1,418,088 | $ | 1,164,307 | |||||
36
Table of Contents
Index to Financial Statements
The following table provides additional disclosure on the various loan types comprising the subgroup “Real Estate – commercial and farmland” at December 31, 2009 (in thousands):
| Loan Type - purpose |
Outstanding Balance | Maturity (months) |
Average Rate |
% non-accrual | |||||||
| Owner-Occupied |
$ | 200,936 | 42 | 6.66 | % | 3.11 | % | ||||
| Leased Properties including residential |
124,588 | 30 | 7.09 | % | 5.24 | % | |||||
| Farmland |
115,837 | 24 | 6.62 | % | 0.39 | % | |||||
| Land |
86,323 | 18 | 7.20 | % | 20.78 | % | |||||
| Apartments |
44,554 | 50 | 6.14 | % | 10.19 | % | |||||
| Hotels / Motels |
41,770 | 35 | 5.99 | % | 6.46 | % | |||||
| Auto Dealers |
37,748 | 27 | 6.32 | % | 7.87 | % | |||||
| Offices / Office Buildings |
32,079 | 51 | 6.11 | % | 6.62 | % | |||||
| Strip Centers (Anchored & Non) |
29,948 | 35 | 6.05 | % | 0.00 | % | |||||
| Convenience Stores |
29,517 | 27 | 6.45 | % | 4.31 | % | |||||
| Retail Properties |
21,111 | 39 | 6.64 | % | 3.19 | % | |||||
| Warehouse Properties |
12,320 | 59 | 7.39 | % | 13.22 | % | |||||
| All Other |
286,638 | 29 | 7.11 | % | 2.46 | % | |||||
| $ | 1,063,369 | 30 | 6.95 | % | 6.32 | % | |||||
Covered loans totaling $137.2 million at December 31, 2009 are not included in the preceding table. The Bank recorded the loans at their fair values, taking into consideration certain risk and liquidity marks. The Company is confident in its estimation of credit risk and its adjustments to the carrying balances of the acquired loans. If the Company determines that a loan or group of loans has improved or deteriorated from its initial assessment of fair value, a reserve for loan losses will be established to account for that difference. At December 31, 2009, no such variances had been determined and no provisions for loan losses on the acquired loan portfolio had been expensed. Covered loans are shown below according to loan type as of the end of the year (in thousands):
| 2009 | |||
| Commercial, financial & agricultural |
$ | 22,854 | |
| Real estate – construction & development |
11,454 | ||
| Real estate – commercial & farmland |
65,087 | ||
| Real estate – residential |
23,168 | ||
| Consumer installment loans |
14,685 | ||
| Commercial, financial & agricultural |
$ | 137,248 | |
The Company seeks to diversify its loan portfolio across its geographic footprint and in various loan types. Also, the Company’s stated in-house legal lending limit for a single loan is $5 million which would normally prevent a concentration with a single loan project. Certain lending relationships may contain more than one loan and consequently, exceed the in-house lending limit. The Company regularly monitors its largest loan relationships to avoid a concentration with a single borrower. The largest 25 loan relationships are summarized below by type and compared to the Bank’s loan portfolio taken as a whole (in thousands):
| Balance | Average Rate |
Average Maturity (months) |
% unsecured |
% in non- accrual status |
||||||||||
| Commercial, financial and agricultural |
$ | 13,567 | 5.25 | % | 28 | 14.6 | % | - | ||||||
| Real estate – residential |
- | 0.00 | % | - | - | - | ||||||||
| Real estate – commercial and farmland |
148,468 | 5.39 | % | 29 | - | - | ||||||||
| Real estate – construction and development |
5,525 | 6.17 | % | 10 | - | - | ||||||||
| Consumer installment |
- | 0.00 | % | - | - | - | ||||||||
| Total |
$ | 167,560 | 5.40 | % | 28 | 1.2 | % | - | ||||||
| Ameris Bank Loan Portfolio |
1,584,359 | 6.46 | % | 38 | 1.2 | % | 6.8 | % | ||||||
37
Table of Contents
Index to Financial Statements
Total loans as of December 31, 2009 are shown in the following table according to their contractual maturity.
| Contractual Maturity in: | ||||||||||||
| One Year or Less |
Over One Year through Five Years |
Over Five Years |
Total | |||||||||
| (Dollars in Thousands) | ||||||||||||
| Commercial, financial & agricultural |
$ | 78,568 | $ | 67,502 | $ | 21,977 | $ | 168,046 | ||||
| Real estate – construction & development |
66,901 | 22,577 | 11,292 | 100,770 | ||||||||
| Real estate – commercial & farmland |
440,855 | 486,605 | 135,909 | 1,063,369 | ||||||||
| Real estate – residential |
39,094 | 74,870 | 68,519 | 182,483 | ||||||||
| Consumer installment loans |
14,178 | 38,500 | 6,430 | 59,108 | ||||||||
| Other |
10,583 | - | - | 10,583 | ||||||||
| $ | 650,179 | $ | 690,054 | $ | 244,127 | $ | 1,584,359 | |||||
Covered loans as of December 31, 2009, are shown below according to their contractual maturity:
| Contractual Maturity in: | ||||||||||||
| One Year or Less |
Over One Year through Five Years |
Over Five Years |
Total | |||||||||
| (Dollars in Thousands) | ||||||||||||
| Covered loans |
$ | 71,075 | $ | 55,359 | $ | 10,814 | $ | 137,248 | ||||
The following table summarizes loans at December 31, 2009 with maturity dates after one year which (1) have predetermined interest rates and (2) have floating or adjustable interest rates.
| (Dollars in Thousands) | |||
| Predetermined interest rates |
$ | 565,221 | |
| Floating or adjustable interest rates |
369,961 | ||
| $ | 935,182 | ||
ALLOWANCE AND PROVISION FOR LOAN LOSSES
The allowance for loan losses represents a reserve for inherent losses in the loan portfolio. The adequacy of the allowance for loan losses is evaluated periodically based on a review of all significant loans, with a particular emphasis on non-accruing, past due and other loans that management believes might be potentially impaired or warrant additional attention. We segregate our loan portfolio by type of loan and utilize this segregation in evaluating exposure to risks within the portfolio. In addition, based on internal reviews and external reviews performed by independent auditors and regulatory authorities, we further segregate our loan portfolio by loan grades based on an assessment of risk for a particular loan or group of loans. Certain reviewed loans are assigned specific allowances when a review of relevant data determines that a general allocation is not sufficient or when the review affords management the opportunity to fine tune the amount of exposure in a given credit. In establishing allowances, management considers historical loan loss experience but adjusts this data with a significant emphasis on data such as current loan quality trends, current economic conditions and other factors in the markets where the Bank operates. Factors considered include among others, current valuations of real estate in our markets, unemployment rates, the effect of weather conditions on agricultural related entities and other significant local economic events, such as major plant closings.
We have developed a methodology for determining the adequacy of the loan loss reserve which is monitored by the Company’s Senior Credit Officer. Procedures provide for the assignment of a risk rating for every loan included in our total loan portfolio, with the exception of credit card receivables and overdraft protection loans which are treated as pools for risk rating purposes. The risk rating schedule provides eight ratings of which four ratings are classified as pass ratings and four ratings are classified as
38
Table of Contents
Index to Financial Statements
criticized ratings. Each risk rating is assigned a percent factor to be applied to the loan balance to determine the adequate amount of reserve. Many of the larger loans require an annual review by an independent loan officer and are often reviewed by independent third parties. As a result of these loan reviews, certain loans may be assigned specific reserve allocations. Other loans that surface as problem loans may also be assigned specific reserves. Past due loans are assigned risk ratings based on the number of days past due. The calculation of the allowance for loan losses, including underlying data and assumptions, is reviewed regularly by the Company’s Chief Financial Officer as well as the Director of Internal Audit.
During periodic reviews of the Company’s methodology, the Company determined that additional reserves were potentially necessary to compensate for an increasingly negative economic outlook that prompted a few loan relationships to move to non-performing status very quickly. The Company established an unallocated, economic related reserve in the amount of $5 million that represents only that portion of the allowance for loan losses not allocated to specific loans as of December 31, 2008. During 2009, the Company determined a higher level of risk associated with certain loans and allocated this amount in its entirety to those loans. Accordingly, at December 31, 2009, the Company has no unallocated reserve for loan losses.
The following table sets forth the breakdown of the allowance for loan losses by loan category for the periods indicated. Management believes the allowance can be allocated only on an approximate basis. The allocation of the allowance to each category is not necessarily indicative of future losses and does not restrict the use of the allowance to absorb losses in any other category.
| At December 31, | ||||||||||||||||||||||||||||||
| 2009 | 2008 | 2007 | 2006 | 2005 | ||||||||||||||||||||||||||
| (Dollars in Thousands) | ||||||||||||||||||||||||||||||
| Amount | % of Total Loans |
Amount | % of Total Loans |
Amount | % of Total Loans |
Amount | % of Total Loans |
Amount | % of Total Loans |
|||||||||||||||||||||
| Commercial, financial, and agricultural |
$ | 3,375 | 11 | % | $ | 4,675 | 11 | % | $ | 3,830 | 13 | % | $ | 3,792 | 12 | % | $ | 4,215 | 14 | % | ||||||||||
| R/E Commercial & Farmland |
25,304 | 67 | 20,770 | 63 | 17,199 | 62 | 14,307 | 61 | 12,713 | 61 | ||||||||||||||||||||
| R/E Construction & Development |
3,552 | 6 | 4,907 | 10 | 3,487 | 11 | 3,293 | 11 | 1,270 | 6 | ||||||||||||||||||||
| Total Commercial |
32,231 | 84 | 30,352 | 84 | 24,516 | 86 | 21,392 | 84 | 18,198 | 81 | ||||||||||||||||||||
| R/E Residential |
2,636 | 12 | 3,285 | 11 | 2,078 | 10 | 2,325 | 10 | 2,585 | 12 | ||||||||||||||||||||
| Consumer Installment |
895 | 4 | 1,015 | 5 | 1,046 | 4 | 1,146 | 6 | 1,511 | 7 | ||||||||||||||||||||
| Unallocated |
- | - | 5,000 | - | - | - | - | - | - | - | ||||||||||||||||||||
| $ | 35,762 | 100 | % | $ | 39,652 | 100 | % | $ | 27,640 | 100 | % | $ | 24,863 | 100 | % | $ | 22,294 | 100 | % | |||||||||||
The following table presents an analysis of our loan loss experience for the periods indicated:
| December 31, | ||||||||||||||||||||
| 2009 | 2008 | 2007 | 2006 | 2005 | ||||||||||||||||
| (Dollars in Thousands) | ||||||||||||||||||||
| Average amount of loans outstanding |
$ | 1,684,910 | $ | 1,667,483 | $ | 1,536,243 | $ | 1,308,174 | $ | 952,647 | ||||||||||
| Balance of reserve for possible loan losses at beginning of period |
$ | 39,652 | $ | 27,640 | $ | 24,863 | $ | 22,294 | $ | 15,493 | ||||||||||
| Charge-offs: |
||||||||||||||||||||
| Commercial real estate, financial and agricultural |
(35,231 | ) | (18,711 | ) | (8,735 | ) | (1,726 | ) | (649 | ) | ||||||||||
| Residential real estate |
(10,859 | ) | (4,514 | ) | (623 | ) | (1,444 | ) | (543 | ) | ||||||||||
| Consumer Installment |
(1,041 | ) | (1,115 | ) | (1,057 | ) | (967 | ) | (963 | ) | ||||||||||
| Recoveries: |
||||||||||||||||||||
| Commercial real estate, financial and agricultural |
742 | 733 | 1,339 | 1,595 | 601 | |||||||||||||||
| Residential real estate |
278 | 199 | 120 | 745 | 644 | |||||||||||||||
| Consumer Installment |
153 | 390 | 412 | 505 | 532 | |||||||||||||||
| Net charge-offs |
(45,958 | ) | (23,018 | ) | (8,544 | ) | (1,292 | ) | (378 | ) | ||||||||||
| Additions to reserve charged to operating expenses |
42,068 | 35,030 | 11,321 | 2,837 | 1,651 | |||||||||||||||
| Allowance for loan losses of acquired subsidiary |
- | - | - | 1,024 | 5,528 | |||||||||||||||
| Balance of reserve for possible loan losses at end of period |
$ | 35,762 | $ | 39,652 | $ | 27,640 | $ | 24,863 | $ | 22,294 | ||||||||||
| Ratio of net loan charge-offs to average loans |
2.72 | % | 1.36 | % | 0.53 | % | 0.10 | % | 0.04 | % | ||||||||||
39
Table of Contents
Index to Financial Statements
NONPERFORMING LOANS
A loan is placed on non-accrual status when, in management’s judgment, the collection of the interest income appears doubtful. Interest receivable that has been accrued in prior years and is subsequently determined to have doubtful collectability is charged to the allowance for possible loan losses. Interest on loans that are classified as non-accrual is recognized when received. Past due loans are loans whose principal or interest is past due 90 days or more. In some cases, where borrowers are experiencing financial difficulties, loans may be restructured to provide terms significantly different from the original contractual terms. The following table presents an analysis of loans accounted for on a non-accrual basis.
| December 31, | |||||||||||||||
| 2009 | 2008 | 2007 | 2006 | 2005 | |||||||||||
| (Dollars in Thousands) | |||||||||||||||
| Loan type: |
|||||||||||||||
| Commercial, financial & agricultural |
$ | 4,774 | $ | 4,810 | $ | 1,736 | $ | 928 | $ | 1,111 | |||||
| Real estate – construction & development |
$ | 15,787 | $ | 10,522 | $ | 3,754 | $ | 2,137 | $ | 942 | |||||
| Real estate – commercial & farmland |
$ | 67,172 | $ | 44,235 | $ | 11,037 | $ | 2,358 | $ | 1,784 | |||||
| Real estate – residential |
$ | 6,965 | $ | 4,730 | $ | 1,076 | $ | 715 | $ | 3,165 | |||||
| Consumer installment loans |
$ | 1,433 | $ | 1,117 | $ | 865 | $ | 739 | $ | 2,584 | |||||
| Total |
$ | 96,131 | $ | 65,414 | $ | 18,468 | $ | 6,877 | $ | 9,586 | |||||
| Installment loans and term loans contractually past due ninety days or more as to interest or principal payments and still accruing |
- | 2 | 4 | - | - | ||||||||||
During 2008 and continuing into 2009, loans tied to the housing industry (Acquisition, Development and Construction loans) came under severe strain as housing prices fell sharply and sales activity slowed. Certain markets, where housing prices had risen sharply in recent years, suffered greater corrections than others. The Company’s exposure to certain housing related loans primarily in northern Florida and coastal Georgia and South Carolina resulted in deteriorating credit quality and caused most of the increase in non-accrual loans shown above.
Activity in non-accrual loans is shown below by quarter for 2009:
| Non-accrual Loans (in 000’s) | ||||||||||||||||
| 4th Qtr 2009 | 3rd Qtr 2009 | 2nd Qtr 2009 | 1st Qtr 2009 | |||||||||||||
| Beginning balance |
$ | 83,917 | $ | 68,858 | $ | 63,908 | $ | 65,414 | ||||||||
| Loans placed on non-accrual |
55,363 | 35,770 | 25,631 | 21,442 | ||||||||||||
| Payments received |
(9,014 | ) | (2,229 | ) | (3,869 | ) | (7,208 | ) | ||||||||
| Loans charged off |
(22,652 | ) | (11,350 | ) | (6,809 | ) | (5,147 | ) | ||||||||
| Foreclosures |
(11,483 | ) | (7,132 | ) | (10,003 | ) | (10,593 | ) | ||||||||
| Ending balance |
$ | 96,131 | $ | 83,917 | $ | 68,858 | $ | 63,908 | ||||||||
Activity in foreclosed property is shown below by quarter for 2009:
| Foreclosed Property (in 000’s) | ||||||||||||||||
| 4th Qtr 2009 | 3rd Qtr 2009 | 2nd Qtr 2009 | 1st Qtr 2009 | |||||||||||||
| Beginning balance |
$ | 21,923 | $ | 19,180 | $ | 14,271 | $ | 4,742 | ||||||||
| Foreclosures |
11,483 | 7,132 | 10,003 | 10,593 | ||||||||||||
| Sales of property |
(8,283 | ) | (4,465 | ) | (4,473 | ) | (903 | ) | ||||||||
| Write-downs and net losses |
(3,572 | ) | 76 | (621 | ) | (161 | ) | |||||||||
| Ending balance |
$ | 21,551 | $ | 21,923 | $ | 19,180 | $ | 14,271 | ||||||||
40
Table of Contents
Index to Financial Statements
LIQUIDITY AND RATE SENSITIVITY
Liquidity management involves the matching of the cash flow requirements of customers, who may be either depositors desiring to withdraw funds or borrowers needing assurance that sufficient funds will be available to meet their credit needs, and the ability of our Company to meet those needs. We seek to meet liquidity requirements primarily through management of short-term investments (principally interest-bearing deposits in banks) and monthly amortizing loans. Another source of liquidity is the repayment of maturing single payment loans. In addition, our Company maintains relationships with correspondent banks including the FHLB and FRB, which could provide funds on short notice, if needed.
A principal objective of our asset/liability management strategy is to minimize its exposure to changes in interest rates by matching the maturity and repricing horizons of interest-earning assets and interest-bearing liabilities. This strategy is overseen in part through the direction of our Asset and Liability Committee (the “ALCO Committee”) which establishes policies and monitors results to control interest rate sensitivity.
As part of our interest rate risk management policy, the ALCO Committee examines the extent to which its assets and liabilities are “interest rate sensitive” and monitors its interest rate-sensitivity “gap”. An asset or liability is considered to be interest rate sensitive if it will reprice or mature within the time period analyzed, usually one year or less. The interest rate-sensitivity gap is the difference between the interest-earning assets and interest-bearing liabilities scheduled to mature or reprice within such time period. A gap is considered positive when the amount of interest rate-sensitive assets exceeds the amount of interest rate-sensitive liabilities. A gap is considered negative when the amount of interest rate-sensitive liabilities exceeds the interest rate-sensitive assets. During a period of rising interest rates, a negative gap would tend to adversely affect net interest income, while a positive gap would tend to result in an increase in net interest income. During a period of falling interest rates, a negative gap would tend to result in an increase in net interest income, while a positive gap would tend to adversely affect net interest income. If our assets and liabilities were equally flexible and moved concurrently, the impact of any increase or decrease in interest rates on net interest income would be minimal.
A simple interest rate “gap” analysis by itself may not be an accurate indicator of how net interest income will be affected by changes in interest rates. Accordingly, the ALCO Committee also evaluates how the repayment of particular assets and liabilities is impacted by changes in interest rates. Income associated with interest-earning assets and costs associated with interest-bearing liabilities may not be affected uniformly by changes in interest rates. In addition, the magnitude and duration of changes in interest rates may have a significant impact on net interest income. For example, although certain assets and liabilities may have similar maturities or periods of repricing, they may not react identically to changes in market interest rates. Interest rates on certain types of assets and liabilities fluctuate in advance of changes in general market interest rates, while interest rates on other types may lag behind changes in general market rates. In addition, certain assets, such as adjustable rate mortgage loans, have features (generally referred to as “interest rate caps”) which limit changes in interest rates on a short-term basis and over the life of the asset. In the event of a change in interest rates, prepayment and early withdrawal levels also could deviate significantly from those assumed in calculating the interest rate gap. The ability of many borrowers to service their debts also may decrease in the event of an interest rate increase.
We manage the mix of asset and liability maturities in an effort to control the effects of changes in the general level of interest rates on net interest income. Except for its effect on the general level of interest rates, inflation does not have a material impact on the portfolio due to the rate variability and short-term maturities of its earning assets. In particular, approximately 60.7% of earning assets mature or reprice within one year or less. Mortgage loans, generally our loan with the longest maturity, are usually made with five to fifteen year maturities, but with either a variable interest rate or a fixed rate with an adjustment between origination date and maturity date.
The following table sets forth the distribution of the repricing of our earning assets and interest-bearing liabilities as of December 31, 2009, the interest rate sensitivity gap (i.e., interest rate sensitive assets divided by interest rate sensitivity liabilities), the cumulative interest rate sensitivity gap ratio (i.e., interest rate sensitive assets divided by interest rate sensitive liabilities) and the cumulative sensitivity gap ratio. The table also sets forth the time periods in which earning assets and liabilities will mature or may reprice in accordance with their contractual terms. However, the table does not necessarily indicate the impact of general interest rate movements on the net interest margin since the repricing of various categories of assets and liabilities is subject to competitive pressures and the needs of our customers. In addition, various assets and liabilities indicated as repricing within the same period may in fact reprice at different times within such period and at different rates.
41
Table of Contents
Index to Financial Statements
| At December 31, 2009 | ||||||||||||||||||
| Maturing or Repricing Within | ||||||||||||||||||
| Zero to Three Months |
Three Months to One Year |
One to Five Years |
Over Five Years |
Total | ||||||||||||||
| (Dollars in Thousands) | ||||||||||||||||||
| Earning assets: |
||||||||||||||||||
| Short-term assets |
$ | 227,622 | $ | - | $ | - | $ | - | $ | 227,622 | ||||||||
| Investment securities |
2,254 | 5,759 | 38,461 | 199,082 | 245,556 | |||||||||||||
| Loans |
860,940 | 158,202 | 492,732 | 72,485 | 1,584,359 | |||||||||||||
| Covered Loans |
56,709 | 20,053 | 54,648 | 5,838 | 137,248 | |||||||||||||
| 1,147,525 | 184,014 | 585,841 | 277,405 | 2,194,785 | ||||||||||||||
| Interest-bearing liabilities: |
||||||||||||||||||
| Interest-bearing demand deposits |
947,168 | - | - | - | 947,168 | |||||||||||||
| Savings |
60,949 | - | - | - | 60,949 | |||||||||||||
| Time deposits |
200,449 | 498,734 | 178,828 | 26 | 878,037 | |||||||||||||
| Other borrowings |
55,254 | - | - | - | 55,254 | |||||||||||||
| FHLB advances |
2,000 | - | - | - | 2,000 | |||||||||||||
| Trust preferred securities |
42,269 | - | - | - | 42,269 | |||||||||||||
| 1,308,089 | 498,734 | 178,828 | 26 | 1,985,677 | ||||||||||||||
| Interest rate sensitivity gap |
$ | (160,564 | ) | $ | (314,720 | ) | $ | 407,013 | $ | 277,379 | $ | 209,108 | ||||||
| Cumulative interest rate sensitivity gap |
$ | (160,564 | ) | $ | (475,284 | ) | $ | (68,271 | ) | $ | 209,108 | |||||||
| Interest rate sensitivity gap ratio |
0.88 | 0.37 | 3.28 | NM | ||||||||||||||
| Cumulative interest rate sensitivity gap ratio |
0.88 | 0.74 | 0.97 | 1.11 | ||||||||||||||
INVESTMENT PORTFOLIO
Following is a summary of the carrying value of investment securities available for sale as of the end of each reported period:
| December 31, | |||||||||
| 2009 | 2008 | 2007 | |||||||
| (Dollars in Thousands) | |||||||||
| U. S. Government sponsored agencies |
$ | 39,525 | $ | 132,646 | $ | 69,923 | |||
| State and municipal securities |
38,156 | 18,302 | 18,320 | ||||||
| Corporate debt securities |
8,675 | 11,618 | 9,498 | ||||||
| Mortgage-backed securities |
159,200 | 205,328 | 191,641 | ||||||
| $ | 245,556 | $ | 367,894 | $ | 289,382 | ||||
The amounts of securities available for sale in each category as of December 31, 2009 are shown in the following table according to contractual maturity classifications: (1) one year or less, (2) after one year through five years, (3) after five years through ten years and (4) after ten years.
| U. S. Treasury and Other U. S. Government Agencies and Corporations |
State and Political Subdivisions |
|||||||||||
| Amount | Yield (1) |
Amount | Yield (1)(2) |
|||||||||
| (Dollars in Thousands) | ||||||||||||
| Maturity: |
||||||||||||
| One year or less |
$ | 6,568 | 3.68 | % | $ | 1,394 | 4.20 | % | ||||
| After one year through five years |
21,249 | 2.23 | 12,350 | 5.38 | ||||||||
| After five years through ten years |
11,708 | 4.68 | 16,153 | 5.18 | ||||||||
| After ten years |
- | - | 8,259 | 5.98 | ||||||||
| $ | 39,525 | 2.94 | % | $ | 38,156 | 5.38 | % | |||||
42
Table of Contents
Index to Financial Statements
| (1) | Yields were computed using coupon interest, adding discount accretion or subtracting premium amortization, as appropriate, on a ratable basis over the life of each security. The weighted average yield for each maturity range was computed using the acquisition price of each security in that range. |
| (2) | Yields on securities of state and political subdivisions are stated on a taxable-equivalent basis, using a tax rate of 35%. |
The investment portfolio consists of securities, including equity securities with readily determinable fair values, which are classified as available for sale and recorded at fair value with unrealized gains and losses excluded from earnings and reported in accumulated other comprehensive income, net of the related deferred tax effect.
The amortization of premiums and accretion of discounts are recognized in interest income using methods approximating the interest method over the life of the securities. Realized gains and losses, determined on the basis of the cost of specific securities sold, are included in earnings on the settlement date. Declines in the fair value of securities below their cost that are deemed to be other-than-temporary are reflected in earnings as realized losses.
The Company’s methodology for determining whether other-than-temporary impairment losses exist include management considering (1) the length of time and the extent to which the fair value has been less than cost, (2) the financial condition and near-term prospects of the issuer and (3) the intent and ability of the Company to retain its investment in the issuer for a period of time sufficient to allow for any anticipated recovery in fair value.
Management evaluates securities for other-than-temporary impairment at least on a quarterly basis, and more frequently when economic or market concerns warrant such evaluation. Substantially all of the unrealized losses on debt securities are related to changes in interest rates and do not affect the expected cash flows of the issuer or underlying collateral. All unrealized losses are considered temporary because each security carries an acceptable investment grade and the Company has the intent and ability to hold to maturity.
DEPOSITS
Average amount of various deposit classes and the average rates paid thereon are presented below:
| Year Ended December 31, | ||||||||||||
| 2009 | 2008 | |||||||||||
| Amount | Rate | Amount | Rate | |||||||||
| (Dollars in Thousands) | ||||||||||||
| Noninterest-bearing demand |
$ | 213,786 | 0.00 | % | $ | 198,422 | 0.00 | % | ||||
| NOW |
458,104 | 1.14 | 278,217 | 1.05 | ||||||||
| Money Market |
349,073 | 1.57 | 324,311 | 2.48 | ||||||||
| Savings |
57,824 | 0.73 | 54,348 | 0.90 | ||||||||
| Time |
900,744 | 3.04 | 968,124 | 4.16 | ||||||||
| Total deposits |
$ | 1,979,531 | 1.95 | % | $ | 1,823,422 | 2.84 | % | ||||
We have a large, stable base of time deposits with little or no dependence on what we consider volatile deposits. Volatile deposits, in management’s opinion, are those deposit accounts that are overly rate sensitive and apt to move if our rate offerings are not at or near the top of the market. Generally speaking, these are brokered deposits or time deposits in amount greater than $100,000.
The amounts of time certificates of deposit issued in amounts of $100,000 or more as of December 31, 2009, are shown below by category, which is based on time remaining until maturity of (1) three months or less, (2) over three through twelve months and (3) greater than one year.
| (Dollars in Thousands) | |||
| Three months or less |
$ | 104,981 | |
| Three months to one year |
254,762 | ||
| One year or greater |
144,555 | ||
| Total |
$ | 504,298 | |
43
Table of Contents
Index to Financial Statements
OFF-BALANCE SHEET ARRANGEMENTS AND CONTRACTUAL OBLIGATIONS
In the ordinary course of business, our Bank has granted commitments to extend credit to approved customers. Generally, these commitments to extend credit have been granted on a temporary basis for seasonal or inventory requirements and have been approved by the Bank’s local boards. Our Bank has also granted commitments to approved customers for financial standby letters of credit. These commitments are recorded in the financial statements when funds are disbursed or the financial instruments become payable. The Bank uses the same credit policies for these off-balance sheet commitments as it does for financial instruments that are recorded in the consolidated financial statements. Commitments generally have fixed expiration dates or other termination clauses and may require payment of a fee. Since many of the commitment amounts expire without being drawn upon, the total commitment amounts do not necessarily represent future cash requirements.
Following is a summary of the commitments outstanding at December 31, 2009 and 2008.
| December 31, | ||||||
| 2009 | 2008 | |||||
| (Dollars in Thousands) | ||||||
| Commitments to extend credit |
$ | 143,868 | $ | 159,114 | ||
| Financial standby letters of credit |
3,921 | 6,358 | ||||
| $ | 147,789 | $ | 165,472 | |||
The following table summarizes short-term borrowings for the periods indicated:
| Years Ended December 31, | |||||||||||||||
| 2009 | 2008 | 2007 | |||||||||||||
| (Dollars in Thousands) | |||||||||||||||
| |
Average Balance |
Average Rate |
|
Average Balance |
Average Rate |
|
Average Balance |
Average Rate | |||||||
| Federal funds purchased and securities sold |
$ | 25,813 | 0.67% | $ | 17,294 | 2.05% | $ | 16,411 | 2.15% | ||||||
| Total Balance |
Total Balance |
Total Balance |
|||||||||||||
| Total maximum short-term borrowings |
$ | 55,254 | $ | 63,973 | $ | 32,359 | |||||||||
The following table sets forth certain information about contractual cash obligations as of December 31, 2009.
| Payments Due After December 31, 2009 | |||||||||||||||
| Total | 1 Year Or Less |
1-3 Years |
4-5 Years |
5 Years | |||||||||||
| (Dollars in Thousands) | |||||||||||||||
| Time certificates of deposit |
$ | 871,350 | $ | 693,873 | $ | 144,748 | $ | 32,703 | $ | 26 | |||||
| Federal Home Loan Bank advances |
2,000 | 2,000 | - | - | - | ||||||||||
| Subordinated debentures |
42,269 | - | - | - | 42,269 | ||||||||||
| Total contractual cash obligations |
$ | 915,619 | $ | 695,873 | $ | 144,748 | $ | 32,703 | $ | 42,295 | |||||
Our operating leases represent short-term obligations, normally with maturities of less than three years. Many of the operating leases have thirty day cancellation provisions. The total contractual obligations for operating leases do not require a material amount of our cash funds.
44
Table of Contents
Index to Financial Statements
At December 31, 2009 we had immaterial amounts of binding commitments for capital expenditures.
CAPITAL ADEQUACY
Capital Purchase Program
On November 21, 2008, the Company, elected to participate in the CPP established by the EESA in connection with TARP. Accordingly, on such date, the Company issued and sold to the Treasury, for an aggregate cash purchase price of $52 million, (i) 52,000 “Preferred Shares” having a liquidation preference of $1,000 per share, and (ii) a ten-year “Warrant” to purchase up to 679,443 shares of Common Stock, at an exercise price of $11.48 per share. The issuance and sale of these securities was a private placement exempt from registration pursuant to Section 4(2) of the Securities Act.
Cumulative dividends on the Preferred Shares will accrue on the liquidation preference at a rate of 5% per annum for the first five years and at a rate of 9% per annum thereafter, but such dividends will be paid only if, as and when declared by the Company’s Board of Directors. The Preferred Shares have no maturity date and rank senior to the Common Stock (and pari passu with the Company’s other authorized preferred stock, of which no shares are currently designated or outstanding) with respect to the payment of dividends and distributions and amounts payable upon liquidation, dissolution and winding up of the Company. Subject to the approval of the Federal Reserve, the Preferred Shares are redeemable at the option of the Company at 100% of their liquidation preference.
The Purchase Agreement pursuant to which the Preferred Shares and the Warrant were sold contains limitations on the payment of dividends on the Common Stock (including with respect to the payment of cash dividends in excess of $0.05 per share, which was the amount of the last regular dividend declared by the Company prior to October 14, 2008) and on the Company’s ability to repurchase its Common Stock, and subjects the Company to certain executive compensation limitations pursuant to the EESA and related regulations.
Capital Regulations
The capital resources of our Company are monitored on a periodic basis by state and federal regulatory authorities. During 2009, our Company’s capital decreased $44.4 million, mostly the result of the loss available to common shareholders totaling the same amount. The loss was driven primarily by the goodwill impairment change that did not affect the Company’s regulatory capital or liquidity. During 2008, we increased our capital by $48.1 million, or 25.2%. The increase is attributed to the issuance of the Preferred Shares under the CPP. Other capital related transactions, such as Common Stock issuances through the exercise of stock options and restricted stock, changes in unrealized losses on investment securities and repurchase of treasury shares combined to account for only a small change in the capital of the Company.
In accordance with risk capital guidelines issued by the Federal Reserve, we are required to maintain a minimum standard of total capital to risk-weighted assets of 8%. Additionally, all member banks must maintain “core” or “Tier 1” capital of at least 4% of total assets (“leverage ratio”). Member banks operating at or near the 4% capital level are expected to have well-diversified risks, including no undue interest rate risk exposure, excellent control systems, good earnings, high asset quality and well managed on- and off-balance sheet activities, and, in general, be considered strong banking organizations with a composite 1 rating under the CAMEL rating system of banks. For all but the most highly rated banks meeting the above conditions, the minimum leverage ratio is to be 4% plus an additional 1% to 2%.
The following table summarizes the regulatory capital levels of Ameris at December 31, 2009.
| Actual | Required | Excess | ||||||||||||||||
| Amount | Percent | Amount | Percent | Amount | Percent | |||||||||||||
| (Dollars in Thousands) | ||||||||||||||||||
| Leverage capital |
$ | 224,670 | 9.35 | % | $ | 96,122 | 4.00 | % | $ | 128,548 | 5.35 | % | ||||||
| Risk-based capital: |
||||||||||||||||||
| Core capital |
224,670 | 13.53 | 66,483 | 4.00 | 158,187 | 9.53 | ||||||||||||
| Total capital |
245,615 | 14.79 | 132,866 | 8.00 | 112,749 | 6.79 | ||||||||||||
INFLATION
The consolidated financial statements and related consolidated financial data presented herein have been prepared in accordance with GAAP and practices within the banking industry which require the measurement of financial position and operating results in terms of historical dollars without considering the changes in the relative purchasing power of money over time due to inflation. Unlike most industrial companies, virtually all the assets and liabilities of a financial institution are monetary in
45
Table of Contents
Index to Financial Statements
nature. As a result, interest rates have a more significant impact on a financial institution’s performance than the effects of general levels of inflation.
QUARTERLY FINANCIAL INFORMATION (Unaudited)
The following table sets forth certain consolidated quarterly financial information of the Company. This information is derived from unaudited consolidated financial statements, which include, in the opinion of management, all normal recurring adjustments which management considers necessary for a fair presentation of the results for such periods.
| Quarters Ended December 31, 2009 | ||||||||||||||||
| 4 | 3 | 2 | 1 | |||||||||||||
| (Dollars in Thousands, Except Per Share Data) |
||||||||||||||||
| Selected Income Statement Data: |
||||||||||||||||
| Interest income |
$ | 27,831 | $ | 28,022 | $ | 29,100 | $ | 29,617 | ||||||||
| Net interest income |
19,701 | 18,812 | 18,539 | 16,968 | ||||||||||||
| Net income (loss) available to common stockholders |
(39,192 | ) | (923 | ) | (3,498 | ) | (1,337 | ) | ||||||||
| Per Share Data: |
||||||||||||||||
| Net income – basic and diluted |
(2.84 | ) | (0.06 | ) | (0.24 | ) | (0.09 | ) | ||||||||
| Common Dividends (Cash) |
- | - | 0.05 | 0.05 | ||||||||||||
| Common Dividends (Stock) |
1 for 130 | 1 for 130 | - | - | ||||||||||||
| Quarters Ended December 31, 2008 | ||||||||||||||||
| 4 | 3 | 2 | 1 | |||||||||||||
| (Dollars in Thousands, Except Per Share Data) |
||||||||||||||||
| Selected Income Statement Data: |
||||||||||||||||
| Interest income |
$ | 30,558 | $ | 32,112 | $ | 32,249 | $ | 34,089 | ||||||||
| Net interest income |
15,972 | 19,177 | 19,056 | 18,460 | ||||||||||||
| Net income (loss) available to common stockholders |
(10,724 | ) | 366 | 3,149 | 2,966 | |||||||||||
| Per Share Data: |
||||||||||||||||
| Net income – basic |
(0.79 | ) | 0.03 | 0.23 | 0.22 | |||||||||||
| Net income – diluted |
(0.79 | ) | 0.05 | 0.23 | 0.22 | |||||||||||
| Common Dividends |
0.05 | 0.05 | 0.14 | 0.14 | ||||||||||||
ITEM 7A. QUANTITATIVE AND QUALITATIVE DISCLOSURES ABOUT MARKET RISK
We are exposed only to U.S. Dollar interest rate changes and, accordingly, we manage exposure by considering the possible changes in the net interest margin. We do not have any trading instruments nor do we classify any portion of the investment portfolio as held for trading. We do not engage in any hedging activities or enter into any derivative instruments with a higher degree of risk than mortgage-backed securities, which are commonly pass-through securities. Finally, we have no exposure to foreign currency exchange rate risk, commodity price risk and other market risks.
46
Table of Contents
Index to Financial Statements
Interest rates play a major part in the net interest income of a financial institution. The sensitivity to rate changes is known as “interest rate risk.” The repricing of interest earning assets and interest-bearing liabilities can influence the changes in net interest income. As part of our asset/liability management program, the timing of repriced assets and liabilities is referred to as gap management. Our policy is to maintain a gap ratio in the one-year time horizon of .80 to 1.20. As indicated by the gap analysis included in this Annual Report, we are somewhat asset sensitive in relation to changes in market interest rates. Being asset sensitive would result in net interest income increasing in a rising rate environment and decreasing in a declining rate environment.
We use simulation analysis to monitor changes in net interest income due to changes in market interest rates. The simulation of rising, declining and flat interest rate scenarios allow management to monitor and adjust interest rate sensitivity to minimize the impact of market interest rate swings. The analysis of the impact on net interest income over a twelve-month period is subjected to a gradual 200 basis points increase or 200 basis points decrease in market rates on net interest income and is monitored on a quarterly basis. Our most recent simulation model projects net interest income would decrease 0.66% if rates rise 200 basis points gradually over the next year. A 200 basis points decrease scenario is not meaningful at this time due to current market rates being at or near zero since the last reduction of the federal funds target rate by the Federal Reserve on December 16, 2008.
ITEM 8. FINANCIAL STATEMENTS AND SUPPLEMENTARY DATA
Report of Independent Registered Public Accounting Firm
Consolidated Balance Sheets - December 31, 2009 and 2008
Consolidated Statements of Operations - Years ended December 31, 2009, 2008 and 2007
Consolidated Statements of Comprehensive Income - Years ended December 31, 2009, 2008 and 2007
Consolidated Statements of Stockholders’ Equity - Years ended December 31, 2009, 2008 and 2007
Consolidated Statements of Cash Flows - Years ended December 31, 2009, 2008 and 2007
Notes to Consolidated Financial Statements.
ITEM 9. CHANGES IN AND DISAGREEMENTS WITH ACCOUNTANTS ON ACCOUNTING AND FINANCIAL DISCLOSURE
Previous Independent Accountants
Mauldin & Jenkins, Certified Public Accountants, LLC (“Mauldin & Jenkins”) was previously the principal accountants for the Company. On August 28, 2008, the Company dismissed Mauldin & Jenkins as its principal accountants. The Company’s Audit Committee and Board of Directors participated in and approved the decision to change independent accountants. Mauldin & Jenkins’ audit reports on the consolidated financial statements of the Company and its subsidiaries as of and for the fiscal years ended December 31, 2007 and 2006 did not contain any adverse opinion or disclaimer of opinion nor were they qualified or modified as to uncertainty, audit scope or accounting principles.
In connection with Mauldin & Jenkins’ audit for the two fiscal years ended December 31, 2007 and 2006 and the subsequent interim period through August 28, 2008, there were no disagreements with Mauldin & Jenkins on any matter of accounting principles or practices, financial statement disclosure or auditing scope or procedure, which disagreements, if not resolved to the satisfaction of Mauldin & Jenkins, would have caused it to make reference to the subject matter of the disagreements in connection with its audit reports on such financial statements. Additionally, during fiscal years 2006 and 2007 and through August 28, 2008, there were no reportable events, as such term is defined in Item 304(a)(1)(v) of Registration S-K.
New Independent Accountants
On August 28, 2008, the Company engaged Porter Keadle Moore, LLP (“PKM”) as the Company’s new independent accountants to audit the Company’s consolidated financial statements for the fiscal year ending December 31, 2008. The Audit Committee of the Company’s Board of Directors approved the Company’s engagement of PKM. PKM was subsequently engaged to audit the Company’s consolidated financial statements for the fiscal year ending December 31, 2009.
During the fiscal years 2006 and 2007 and through August 28, 2008, the Company did not consult with PKM regarding either (i) the application of accounting principles to a specified transaction, either completed or proposed, or the type of audit opinion that might be rendered on the Company’s financial statements, and neither a written report nor oral advice was provided to the Company that PKM concluded was an important factor considered by the Company in reaching a decision as to the accounting, auditing or financial reporting issue; or (ii) any matter that was the subject of either a disagreement (as defined in Item 304
47
Table of Contents
Index to Financial Statements
(a)(1)(iv) of Regulation S-K or the related instructions thereto) or a reportable event (as defined in Item 304 (a)(1)(v) of Regulation S-K).
ITEM 9A. CONTROLS AND PROCEDURES
Disclosure Controls and Procedures
The Company’s Chief Executive Officer and Chief Financial Officer have evaluated the Company’s disclosure controls and procedures (as such term is defined in Rules 13a-15(e) or 15d-15(e)) promulgated under the Exchange Act as of the end of the period covered by this Annual Report, as required by paragraph (b) of Rules 13a-15 or 15d-15 of the Exchange Act. Based on such evaluation, such officers have concluded that, as of the end of the period covered by this Annual Report, the Company’s disclosure controls and procedures are effective.
Management’s Annual Report on Internal Control Over Financial Reporting
The management of Ameris is responsible for establishing and maintaining adequate internal control over financial reporting as defined in Rules 13a-15(f) and 15d-15(f) under the Exchange Act. The Company’s internal control over financial reporting is designed to provide reasonable assurance regarding the reliability of financial reporting and the preparation of financial statements for external purposes in accordance with generally accepted accounting principles.
All internal control systems, no matter how well designed, have inherent limitations. Therefore, even those systems determined to be effective can provide only reasonable assurance with respect to financial statement preparation and presentation.
Because of its inherent limitations, internal control over financial reporting may not prevent or detect misstatements. Also, projections of any evaluation of effectiveness to future periods are subject to the risk that controls may become inadequate because of changes in conditions or that the degree of compliance with the policies or procedures may deteriorate.
Management assessed the effectiveness of the Company’s internal control over financial reporting as of December 31, 2009. In making this assessment, management used the criteria set forth by the Committee of Sponsoring Organizations of the Treadway Commission (COSO) in Internal Control-Integrated Framework. Based on this assessment and those criteria, management believes that the Company maintained effective internal control over financial reporting as of December 31, 2009.
Porter Keadle Moore, LLP, the Company’s independent auditors, has issued an attestation report on the Company’s internal control over financial reporting. That report is included in this Item under the heading “Report of Independent Registered Public Accounting Firm.”
Changes in Internal Control Over Financial Reporting
During the quarter ended December 31, 2009, there was no change in the Company’s internal control over financial reporting identified in connection with the evaluation required by paragraph (d) of Rules 13a-15 or 15d-15 of the Exchange Act that has materially affected, or is reasonably likely to materially affect, the Company’s internal control over financial reporting.
None.
48
Table of Contents
Index to Financial Statements
ITEM 10. DIRECTORS, EXECUTIVE OFFICERS AND CORPORATE GOVERNANCE
Directors and Nominees for Director
Information with respect to the Company’s directors and nominees for director is set forth in the Proxy Statement under the caption “Proposal I: Election of Directors” and is incorporated herein by reference.
Executive Officers
The following table sets forth certain information with respect to the executive officers of Ameris.
| Name, Age and Term as Officer |
Position with Ameris |
Principal Occupation for the Last Five Years and Other Directorships | ||
| Edwin W. Hortman, Jr.; 56 |
President and Chief Executive Officer | President and Chief Executive Officer since January 1, 2005. Director since November 2003. President and Chief Operating Officer from November 2003 through December 2004. Executive Vice President and Regional Bank Executive for Northern Division from August 2002 through November 2003. President, Chief Executive Officer and Director of Citizens Security Bank from April 1998 to November 2003. Director of each subsidiary bank in the Northern Division from September 2002 through March 2004. | ||
| Dennis J. Zember, Jr.; 40 |
Executive Vice President and Chief Financial Officer |
Executive Vice President and Chief Financial Officer since February 14, 2005. Senior Vice President and Treasurer of Flag Financial Corporation and Senior Vice President and Chief Financial Officer of Flag Bank from January 2002 to February 2005. Vice President and Treasurer of Century South Banks, Inc. from August 1997 to May 2001. | ||
| Jon S. Edwards; 48 |
Executive Vice President and Director of Credit Administration | Executive Vice President and Director of Credit Administration since May 2005. Executive Vice President and Regional Bank Executive for Southern Division from August 2002 through April 2005. Director of Credit Administration from March 1999 to July 2003. Senior Vice President from March 1999 to August 2002. Director of each subsidiary bank in the Southern Division from September 2002 through April 2005. | ||
| Andrew B. Cheney; 60 |
Executive Vice President and Banking Group President |
Officer since February 2009. President and Chairman Mercantile Bank from January 2000 – January 2009. | ||
| Cindi H. Lewis; 56 |
Executive Vice President, Chief Administrative Officer and Corporate Secretary | Chief Administrative Officer since May 2006, Executive Vice President since May 2002 and Corporate Secretary since May 2000. Director of Human Resources from May 2000 to May 2006 and Senior Vice President from May 2000 to May 2002. | ||
| Marc J. Bogan; 43 |
Executive Vice President and Chief Operating Officer | Executive Vice President and Chief Operating Officer since June 2008. Coastal Region Executive from September 2006 to June 2008. Sales Executive with South Carolina Bank and Trust from April 2004 to September 2006. Regional President for South Carolina Bank and Trust from June 2001 to April 2004. | ||
Officers serve at the discretion of the Company’s Board of Directors.
The information set forth in the Proxy Statement under the captions “Board and Committee Matters” and “Section 16(a) Beneficial Ownership Reporting Compliance” is incorporated herein by reference.
49
Table of Contents
Index to Financial Statements
Code of Ethics
Ameris has adopted a code of ethics that is applicable to all employees, including its Chief Executive Officer and all senior financial officers, including its Chief Financial Officer and principal accounting officer. Ameris shall provide to any person without charge, upon request, a copy of its code of ethics. Such requests should be directed to the Corporate Secretary of Ameris Bancorp at 310 First St., SE, Moultrie, Georgia 31768.
ITEM 11. EXECUTIVE COMPENSATION
The information set forth under the caption “Executive Compensation” in the Proxy Statement is incorporated herein by reference.
ITEM 12. SECURITY OWNERSHIP OF CERTAIN BENEFICIAL OWNERS AND MANAGEMENT
AND RELATED STOCKHOLDER MATTERS
The information set forth under the captions “Security Ownership of Certain Beneficial Owners and Management” and “Equity Compensation Plans” in the Proxy Statement is incorporated herein by reference.
ITEM 13. CERTAIN RELATIONSHIPS AND RELATED TRANSACTIONS, AND DIRECTOR INDEPENDENCE
The information set forth under the captions “Certain Relationships and Related Transactions” and “Proposal I: Election of Directors” in the Proxy Statement is incorporated herein by reference.
ITEM 14. PRINCIPAL ACCOUNTANT FEES AND SERVICES
The information set forth under the caption “Proposal 2: Ratification of Independent Auditors” in the Proxy Statement is incorporated herein by reference.
50
Table of Contents
Index to Financial Statements
ITEM 15. EXHIBITS AND FINANCIAL STATEMENT SCHEDULES
| 1. | Financial statements: |
| (a) | Ameris Bancorp and Subsidiaries: |
| (i) | Consolidated Balance Sheets - December 31, 2009 and 2008; |
| (ii) | Consolidated Statements of Income - Years ended December 31, 2009, 2008 and 2007; |
| (iii) | Consolidated Statements of Comprehensive Income - Years ended December 31, 2009, 2008 and 2007; |
| (iv) | Consolidated Statements of Stockholders’ Equity - Years ended December 31, 2009, 2008 and 2007; |
| (v) | Statements of Cash Flows - Years ended December 31, 2009, 2008 and 2007; and |
| (vi) | Notes to Consolidated Financial Statements |
| (b) | Ameris Bancorp (parent company only): |
| Parent company only financial information has been included in Note 21 of Notes to Consolidated Financial Statements. |
| 2. | Financial statement schedules: |
| All schedules are omitted as the required information is inapplicable or the information is presented in the financial statements or related notes. |
| 3. | A list of the Exhibits required by Item 601 of Regulation S-K to be filed as a part of this report is shown on the “Exhibit Index” filed herewith. |
51
Table of Contents
Index to Financial Statements
SIGNATURES
Pursuant to the requirements of Section 13 or 15(d) of the Securities Exchange Act of 1934, the Registrant has duly caused this report to be signed on its behalf by the undersigned, thereunto duly authorized.
AMERIS BANCORP
| Date: |
March 16, 2010 |
By: |
/s/ Edwin W. Hortman, Jr. | |||||
| Edwin W. Hortman, Jr., | ||||||||
| President and Chief Executive Officer (principal executive officer) |
POWER OF ATTORNEY
KNOW ALL MEN BY THESE PRESENTS, that each person whose signature appears below constitutes and appoints Edwin W. Hortman, Jr. as his attorney-in-fact, acting with full power of substitution for him in his name, place and stead, in any and all capacities, to sign any amendments to this Form 10-K and to file the same, with exhibits thereto, and any other documents in connection therewith, with the Securities and Exchange Commission and hereby ratifies and confirms all that said attorney-in-fact, or his substitute or substitutes, may do or cause to be done by virtue thereof.
Pursuant to the requirements of the Exchange Act, this Form 10-K has been signed by the following persons in the capacities and on the dates indicated.
| Date: |
March 16, 2010 |
/s/ Edwin W. Hortman, Jr. |
||||||||
| Edwin W. Hortman, Jr., President, Chief Executive Officer and Director |
||||||||||
| (principal executive officer) |
||||||||||
| Date: |
March 16, 2010 |
/s/ Dennis J. Zember Jr. |
||||||||
| Dennis J. Zember Jr., Executive Vice President and Chief Financial Officer |
||||||||||
| (principal accounting and financial officer) |
||||||||||
| Date: |
March 16, 2010 |
/s/ J. Raymond Fulp |
||||||||
| J. Raymond Fulp, Director |
||||||||||
| Date: |
March 16, 2010 |
/s/ Daniel B. Jeter |
||||||||
| Daniel B. Jeter, Director and Chairman of the Board |
||||||||||
| Date: |
March 16, 2010 |
/s/ Robert P. Lynch |
||||||||
| Robert P. Lynch, Director |
||||||||||
| Date: |
March 16, 2010 |
/s/ Brooks Sheldon |
||||||||
| Brooks Sheldon, Director |
||||||||||
| Date: |
March 16, 2010 |
/s/ Jimmy D. Veal |
||||||||
| Jimmy D. Veal, Director |
||||||||||
| Date: |
March 16, 2010 |
/s/ V. Wayne Williford |
||||||||
| V. Wayne Williford, Director |
||||||||||
52
Table of Contents
Index to Financial Statements
EXHIBIT INDEX
| Exhibit No. |
Description | |
| 2.1 | Purchase and Assumption Agreement dated as of October 23, 2009 among the Federal Deposit Insurance Corporation, Receiver of American United Bank, Lawrenceville, Georgia, Ameris Bank and the Federal Deposit Insurance Corporation acting in its corporate capacity (incorporated by reference to Exhibit 2.1 to Ameris Bancorp’s Current Report on Form 8-K/A filed with the Commission on March 15, 2010). | |
| 2.2 | Purchase and Assumption Agreement dated as of November 6, 2009 among the Federal Deposit Insurance Corporation, Receiver of United Security Bank, Sparta, Georgia, Ameris Bank and the Federal Deposit Insurance Corporation acting in its corporate capacity. | |
| 3.1 | Articles of Incorporation of Ameris Bancorp, as amended (incorporated by reference to Exhibit 2.1 to Ameris Bancorp’s Regulation A Offering Statement on Form 1-A filed with the Commission on August 14, 1987). | |
| 3.2 | Amendment to Amended Articles of Incorporation (incorporated by reference to Exhibit 3.1.1 to Ameris Bancorp’s Form 10-K filed with the Commission on March 28, 1996). | |
| 3.3 | Amendment to Amended Articles of Incorporation (incorporated by reference to Exhibit 4.3 to Ameris Bancorp’s Registration Statement on Form S-4 filed with the Commission on July 17, 1996). | |
| 3.4 | Articles of Amendment to the Articles of Incorporation (incorporated by reference to Exhibit 3.5 to Ameris Bancorp’s Annual Report on Form 10-K filed with the Commission on March 25, 1998). | |
| 3.5 | Articles of Amendment to the Articles of Incorporation (incorporated by reference to Exhibit 3.7 to Ameris Bancorp’s Annual Report on Form 10-K filed with the Commission on March 26, 1999). | |
| 3.6 | Articles of Amendment to the Articles of Incorporation (incorporated by reference to Exhibit 3.9 to Ameris Bancorp’s Annual Report on Form 10-K filed with the Commission on March 31, 2003). | |
| 3.7 | Articles of Amendment to the Articles of Incorporation (incorporated by reference to Exhibit 3.1 to Ameris Bancorp’s Current Report on Form 8-K filed with the Commission on December 1, 2005). | |
| 3.8 | Amended and Restated Bylaws (incorporated by reference to Exhibit 3.1 to Ameris Bancorp’s Current Report on Form 8-K filed with the Commission on March 14, 2005). | |
| 3.9 | Articles of Amendment to the Articles of Incorporation (incorporated by reference to Exhibit 3.1 to Ameris Bancorp’s Form 8-K filed with the Commission on November 21, 2008). | |
| 4.1 | Placement Agreement between Ameris Bancorp, Ameris Statutory Trust I, FTN Financial Capital Markets and Keefe, Bruyette & Woods, Inc. dated September 13, 2006 (incorporated by reference to Exhibit 4.1 to Ameris Bancorp’s Registration Statement on Form S-4 (Registration No. 333-138252) filed with the Commission on October 27, 2006). | |
| 4.2 | Subscription Agreement between Ameris Bancorp, Ameris Statutory Trust I and First Tennessee Bank National Association dated September 20, 2006 (incorporated by reference to Exhibit 4.2 to Ameris Bancorp’s Registration Statement on Form S-4 (Registration No. 333-138252) filed with the Commission on October 27, 2006). | |
| 4.3 | Subscription Agreement between Ameris Bancorp, Ameris Statutory Trust I and TWE, Ltd. dated September 20, 2006 (incorporated by reference to Exhibit 4.3 to Ameris Bancorp’s Registration Statement on Form S-4 (Registration No. 333-138252) filed with the Commission on October 27, 2006). | |
| 4.4 | Indenture between Ameris Bancorp and Wilmington Trust Company dated September 20, 2006 (incorporated by reference to Exhibit 4.4 to Ameris Bancorp’s Registration Statement on Form S-4 (Registration No. 333-138252) filed with the Commission on October 27, 2006). | |
53
Table of Contents
Index to Financial Statements
| 4.5 | Amended and Restated Declaration of Trust between Ameris Bancorp, the Administrators of Ameris Statutory Trust I signatory thereto and Wilmington Trust Company dated September 20, 2006 (incorporated by reference to Exhibit 4.5 to Ameris Bancorp’s Registration Statement on Form S-4 (Registration No. 333-138252) filed with the Commission on October 27, 2006). | |
| 4.6 | Guarantee Agreement between Ameris Bancorp and Wilmington Trust Company dated September 20, 2006 (incorporated by reference to Exhibit 4.6 to Ameris Bancorp’s Registration Statement on Form S-4 (Registration No. 333-138252) filed with the Commission on October 27, 2006). | |
| 4.7 | Floating Rate Junior Subordinated Deferrable Interest Debenture dated September 20, 2006 issued to Ameris Statutory Trust I (incorporated by reference to Exhibit 4.7 to Ameris Bancorp’s Registration Statement on Form S-4 (Registration No. 333-138252) filed with the Commission on October 27, 2006). | |
| 4.8 | Warrant to Purchase 679,443 shares of Common Stock of Ameris Bancorp, issued to the U.S. Department of Treasury on November 21, 2008 (incorporated by reference to Exhibit 3.2 to Ameris Bancorp’s Form 8-K filed with the Commission on November 21, 2008). | |
| 10.1 | Deferred Compensation Agreement for Kenneth J. Hunnicutt dated December 16, 1986 (incorporated by reference to Exhibit 5.3 to Ameris Bancorp’s Regulation A Offering Statement on Form 1-A filed with the Commission on August 14, 1987). | |
| 10.2 | Executive Salary Continuation Agreement dated February 14, 1984 (incorporated by reference to Exhibit 10.6 to Ameris Bancorp’s Annual Report on Form 10-KSB filed with the Commission on March 27, 1989). | |
| 10.3 | Form of Omnibus Stock Ownership and Long-Term Incentive Plan (incorporated by reference to Exhibit 10.17 to Ameris Bancorp’s Annual Report on Form 10-K filed with the Commission on March 25, 1998). | |
| 10.4 | ABC Bancorp 2000 Officer/Director Stock Bonus Plan (incorporated by reference to Exhibit 10.19 to Ameris Bancorp’s Annual Report on Form 10-K filed with the Commission on March 29, 2000). | |
| 10.5 | Executive Employment Agreement with Jon S. Edwards dated as of July 1, 2003 (incorporated by reference to Exhibit 10.1 to Ameris Bancorp’s Quarterly Report on Form 10-Q filed with the Commission on November 12, 2003). | |
| 10.6 | Executive Employment Agreement with Edwin W. Hortman, Jr. dated as of December 31, 2003 (incorporated by reference to Exhibit 10.19 to Ameris Bancorp’s Annual Report on Form 10-K filed with the Commission on March 15, 2004). | |
| 10.7 | Executive Employment Agreement with Cindi H. Lewis dated as of December 31, 2003 (incorporated by reference to Exhibit 10.20 to Ameris Bancorp’s Annual Report on Form 10-K filed with the Commission on March 15, 2004). | |
| 10.8 | Amendment No. 1 to Executive Employment Agreement with Edwin W. Hortman, Jr. dated as of March 10, 2005 (incorporated by reference to Exhibit 10.1 to Ameris Bancorp’s Current Report on Form 8-K filed with the Commission on March 14, 2005). | |
| 10.9 | Form of 2005 Omnibus Stock Ownership and Long-Term Incentive Plan (incorporated by reference to Appendix A to Ameris Bancorp’s Definitive Proxy Statement filed with the Commission on April 18, 2005). | |
54
Table of Contents
Index to Financial Statements
| 10.10 | Executive Employment Agreement with Dennis J. Zember Jr. dated as of May 5, 2005 (incorporated by reference to Exhibit 10.1 to Ameris Bancorp’s Current Report on Form 8-K/A filed with the Commission on May 11, 2005). | |
| 10.11 | Revolving Credit Agreement with SunTrust Bank dated as of December 14, 2005 (incorporated by reference to Exhibit 10.1 to Ameris Bancorp’s Current Report on Form 8-K filed with the Commission on December 20, 2005). | |
| 10.12 | Security Agreement with SunTrust Bank dated as of December 14, 2005 (incorporated by reference to Exhibit 10.2 to Ameris Bancorp’s Current Report on Form 8-K filed with the Commission on December 20, 2005). | |
| 10.13 | Form of Incentive Stock Option Agreement (incorporated by reference to Exhibit 4.2 to Ameris Bancorp’s Registration Statement on Form S-8 filed with the Commission on January 24, 2006). | |
| 10.14 | Form of Non-Qualified Stock Option Agreement (incorporated by reference to Exhibit 4.3 to Ameris Bancorp’s Registration Statement on Form S-8 filed with the Commission on January 24, 2006). | |
| 10.15 | Form of Restricted Stock Agreement (incorporated by reference to Exhibit 4.4 to Ameris Bancorp’s Registration Statement on Form S-8 filed with the Commission on January 24, 2006). | |
| 10.16 | Executive Employment Agreement with Marc J. Bogan dated as of May 31, 2007 (incorporated by reference to Exhibit 10.1 to Ameris Bancorp’s Current Report on Form 8-K filed with the Commission on June 6, 2007). | |
| 10.17 | Executive Employment Agreement with C. Richard Sturm dated as of May 31, 2007 (incorporated by reference to Exhibit 10.1 to Ameris Bancorp’s Current Report on Form 8-K filed with the Commission on June 6, 2007). | |
| 10.18 | Letter Agreement, dated November 21, 2008, including Securities Purchase Agreement – Standard Terms incorporated by reference therein, between Ameris Bancorp and the U.S. Department of Treasury (incorporated by reference to Exhibit 10.1 to Ameris Bancorp’s Form 8-K filed with the Commission on November 21, 2008). | |
| 10.19 | Form of Waiver, executed by each of Messrs. Edwin W. Hortman, Jr., Dennis J. Zember Jr., Jon S. Edwards, C. Johnson Hipp, III and Marc J. Bogan (incorporated by reference to Exhibit 10.2 to Ameris Bancorp’s Form 8-K filed with the Commission on November 21, 2008). | |
| 10.20 | Form of Letter Agreement, executed by Ameris Bancorp and each of Messrs. Edwin W. Hortman, Jr., Dennis J. Zember Jr., Jon S. Edwards, C. Johnson Hipp, III and Marc J. Bogan (incorporated by reference to Exhibit 10.1 to Ameris Bancorp’s Form 8-K filed with the Commission on November 21, 2008). | |
| 10.21 | Second Amendment to Executive Employment Agreement dated December 30, 2008, by and between Ameris Bancorp and Edwin W. Hortman, Jr. (incorporated by reference to Exhibit 10.1 to Ameris Bancorp’s Current Report on Form 8-K filed with the Commission on December 30, 2008). | |
| 10.22 | First Amendment to Executive Employment Agreement dated December 30, 2008, by and between Ameris Bancorp and Dennis J. Zember Jr. (incorporated by reference to Exhibit 10.2 to Ameris Bancorp’s Current Report on Form 8-K filed with the Commission on December 30, 2008). | |
| 10.23 | First Amendment to Executive Employment Agreement dated December 30, 2008, by and between Ameris Bancorp and Jon S. Edwards (incorporated by reference to Exhibit 10.4 to Ameris Bancorp’s Current Report on Form 8-K filed with the Commission on December 30, 2008). | |
| 10.24 | First Amendment to Executive Employment Agreement dated December 30, 2008, by and between Ameris Bancorp and Marc J. Bogan (incorporated by reference to Exhibit 10.5 to Ameris Bancorp’s Current Report on Form 8-K filed with the Commission on December 30, 2008). | |
| 10.25 | First Amendment to Executive Employment Agreement dated December 30, 2008, by and between Ameris Bancorp and H. Richard Sturm (incorporated by reference to Exhibit 10.6 to Ameris Bancorp’s Current Report on Form 8-K filed with the Commission on December 30, 2008). | |
55
Table of Contents
Index to Financial Statements
| 10.26 | First Amendment to Executive Employment Agreement dated December 30, 2008, by and between Ameris Bancorp and Cindi H. Lewis (incorporated by reference to Exhibit 10.7 to Ameris Bancorp’s Current Report on Form 8-K filed with the Commission on December 30, 2008). | |
| 10.27 | Executive Employment Agreement with Andrew B. Cheney, dated as of February 18, 2009 (incorporated by reference to Exhibit 10.1 to Ameris Bancorp’s Form 8-K filed with the Commission on February 23, 2009). | |
| 21.1 | Schedule of subsidiaries of Ameris Bancorp. | |
| 23.1 | Consent of Porter Keadle Moore, LLP. | |
| 24.1 | Power of Attorney relating to this Form 10-K is set forth on the signature pages of this Form 10-K. | |
| 31.1 | Rule 13a-14(a)/15d-14(a) Certification by Chief Executive Officer. | |
| 31.2 | Rule 13a-14(a)/15d-14(a) Certification by Chief Financial Officer. | |
| 32.1 | Section 1350 Certification by Chief Executive Officer. | |
| 32.2 | Section 1350 Certification by Chief Financial Officer. | |
| 99.1 | Certification of Chief Executive Officer pursuant to the Emergency Economic Stability Act of 2008. | |
| 99.2 | Certification of Chief Financial Officer pursuant to the Emergency Economic Stability Act of 2008. | |
56
Table of Contents
Index to Financial Statements
AMERIS BANCORP
INDEX TO FINANCIAL STATEMENTS AND SCHEDULES
F-1
Table of Contents
Index to Financial Statements
REPORT OF INDEPENDENT REGISTERED PUBLIC ACCOUNTING FIRM
To the Board of Directors
Ameris Bancorp
Moultrie, Georgia
We have audited the accompanying consolidated balance sheets of Ameris Bancorp and subsidiaries (the “Company”) as of December 31, 2009 and 2008, and the related consolidated statements of operations, changes in shareholders’ equity, and cash flows for each of the years then ended. The consolidated financial statements of the Company as of December 31, 2007 were audited by other auditors whose report dated March 5, 2008 expressed an unqualified opinion on those statements. We have also audited the Company’s internal controls over financial reporting as of December 31, 2009, based on the criteria established in Internal Control – Integrated Framework issued by the Committee of Sponsoring Organizations of the Treadway Commission. The Company’s management is responsible for these financial statements, for maintaining effective control over financial reporting and for its assessment of the effectiveness of internal control over financial reporting included in the accompanying Management’s Report on Internal Controls Over Financial Reporting. Our responsibility is to express an opinion on these financial statements and an opinion on the Company’s internal control over financial reporting based on our audits.
We conducted our audits in accordance with the auditing standards of the Public Company Accounting Oversight Board (United States). Those standards require that we plan and perform the audits to obtain reasonable assurance about whether the financial statements are free of material misstatement and whether effective internal control over financial reporting was maintained in all material respects. Our audits of the financial statements included examining, on a test basis, evidence supporting the amounts and disclosures in the financial statements. Our audits also included assessing the accounting principles used and significant estimates made by management, as well as evaluating the overall financial statement presentation. Our audit of internal control over financial reporting included obtaining an understanding of internal control over financial reporting, assessing the risk that a material weakness exists, and testing and evaluating the design and operating effectiveness of internal control based on the assessed risk. Our audits also included performing such other procedures as we considered necessary in the circumstances. We believe that our audits provide a reasonable basis for our opinions.
A company’s internal control over financial reporting is a process designed to provide reasonable assurance regarding the reliability of financial reporting and the preparation of the financial statements for external purposes in accordance with generally accepted accounting principles. A company’s internal control over financial reporting includes those policies and procedures that (1) pertain to the maintenance of records that, in reasonable detail, accurately and fairly reflect the transactions and dispositions of the assets of the company; (2) provide reasonable assurance that transactions are recorded as necessary to permit preparation of financial statements in accordance with generally accepted accounting principles, and that receipts and expenditures of the company are being made only in accordance with authorizations of management and directors of the company; and (3) provide reasonable assurance regarding prevention or timely detection of unauthorized acquisition, use, or disposition of the company’s assets that could have a material effect on the financial statements.
Because of its inherent limitations, internal control over financial reporting may not prevent or detect misstatements. Also, projections of any evaluation of effectiveness to future periods are subject to the risk that controls may become inadequate because of changes in conditions, or that the degree of compliance with the policies or procedures may deteriorate.
In our opinion, the consolidated financial statements referred to above present fairly, in all material respects, the financial position of Ameris Bancorp and subsidiaries as of December 31, 2009 and 2008, and the results of their operations and their cash flows for the years ended December 31, 2009 and 2008, in conformity with accounting principles generally accepted in the United States of America. Also, in our opinion, Ameris Bancorp maintained, in all material respects, effective internal control over financial reporting as of December 31, 2009, based on criteria established in Internal Control – Integrated Framework issued by the Committee of Sponsoring Organizations of the Treadway Commission.

Atlanta, Georgia
March 11, 2010
F-2
Table of Contents
Index to Financial Statements
AMERIS BANCORP AND SUBSIDIARIES
DECEMBER 31, 2009 AND 2008
(Dollars in Thousands)
| Assets |
2009 | 2008 | ||||||
| Cash and due from banks |
$ | 81,060 | $ | 66,787 | ||||
| Interest-bearing deposits in banks |
195,038 | 99,383 | ||||||
| Federal funds sold |
25,325 | 45,000 | ||||||
| Securities available for sale, at fair value |
245,556 | 367,894 | ||||||
| Other investments |
7,260 | 8,627 | ||||||
| Loans, net of unearned income |
1,584,359 | 1,695,777 | ||||||
| Less allowance for loan losses |
35,762 | 39,652 | ||||||
| Loans, net |
1,548,597 | 1,656,125 | ||||||
| Assets covered by loss-sharing agreements with the FDIC |
146,585 | - | ||||||
| Premises and equipment, net |
67,637 | 66,107 | ||||||
| Other real estate owned |
23,316 | 6,507 | ||||||
| FDIC loss-share receivable |
45,840 | - | ||||||
| Intangible assets |
3,586 | 3,631 | ||||||
| Goodwill |
- | 54,813 | ||||||
| Other assets |
33,434 | 32,216 | ||||||
| $ | 2,423,970 | $ | 2,407,090 | |||||
| Liabilities and Stockholders’ Equity |
||||||||
| Deposits |
||||||||
| Noninterest-bearing |
$ | 236,962 | $ | 208,532 | ||||
| Interest-bearing |
1,886,154 | 1,804,993 | ||||||
| Total deposits |
2,123,116 | 2,013,525 | ||||||
| Securities sold under agreements to repurchase |
55,254 | 27,416 | ||||||
| Other borrowings |
2,000 | 72,000 | ||||||
| Subordinated deferrable interest debentures |
42,269 | 42,269 | ||||||
| Other liabilities |
6,367 | 12,521 | ||||||
| Total liabilities |
2,229,006 | 2,167,731 | ||||||
| Stockholders’ equity |
||||||||
| Preferred stock, par value $1,000; 5,000,000 shares authorized; 52,000 shares issued |
49,552 | 49,028 | ||||||
| Common stock, par value $1; 30,000,000 shares authorized; 15,162,541 and 15,073,035 shares issued |
15,163 | 15,073 | ||||||
| Capital surplus |
87,790 | 87,172 | ||||||
| Retained earnings |
46,031 | 92,355 | ||||||
| Accumulated other comprehensive income, net of tax |
7,240 | 6,518 | ||||||
| 205,776 | 250,146 | |||||||
| Less cost of 1,334,224 and 1,329,939 treasury shares acquired |
(10,812 | ) | (10,787 | ) | ||||
| Total stockholders’ equity |
194,964 | 239,359 | ||||||
| $ | 2,423,970 | $ | 2,407,090 | |||||
See Notes to Consolidated Financial Statements.
F-3
Table of Contents
Index to Financial Statements
AMERIS BANCORP AND SUBSIDIARIES
CONSOLIDATED STATEMENTS OF OPERATIONS
YEARS ENDED DECEMBER 31, 2009, 2008 AND 2007
(Dollars in Thousands)
| 2009 | 2008 | 2007 | ||||||||||
| Interest income |
||||||||||||
| Interest and fees on loans |
$ | 101,312 | $ | 113,335 | $ | 128,869 | ||||||
| Interest on taxable securities |
11,858 | 14,469 | 14,171 | |||||||||
| Interest on nontaxable securities |
1,070 | 685 | 688 | |||||||||
| Interest on deposits in other banks |
262 | 514 | 2,306 | |||||||||
| Interest on federal funds sold |
71 | 5 | 43 | |||||||||
| 114,573 | 129,008 | 146,077 | ||||||||||
| Interest expense |
||||||||||||
| Interest on deposits |
38,506 | 51,942 | 62,380 | |||||||||
| Interest on other borrowings |
2,044 | 4,401 | 8,619 | |||||||||
| 40,550 | 56,343 | 70,999 | ||||||||||
| Net interest income |
74,023 | 72,665 | 75,078 | |||||||||
| Provision for loan losses |
42,068 | 35,030 | 11,321 | |||||||||
| Net interest income after provision for loan losses |
31,955 | 37,635 | 63,757 | |||||||||
| Other income |
||||||||||||
| Service charges on deposit accounts |
13,593 | 13,916 | 12,455 | |||||||||
| Mortgage origination fees |
3,050 | 3,180 | 3,093 | |||||||||
| Other service charges, commissions and fees |
531 | 708 | 1,268 | |||||||||
| Gain/(loss) on sales of securities |
871 | 316 | (297 | ) | ||||||||
| Gain on acquisitions |
38,566 | - | - | |||||||||
| Other |
1,742 | 1,029 | 1,073 | |||||||||
| 58,353 | 19,149 | 17,592 | ||||||||||
| Other expenses |
||||||||||||
| Salaries and employee benefits |
31,939 | 31,700 | 29,844 | |||||||||
| Occupancy and equipment expense |
8,914 | 8,069 | 7,540 | |||||||||
| Advertising and marketing expense |
1,661 | 3,083 | 2,546 | |||||||||
| Amortization of intangible assets |
617 | 1,170 | 1,297 | |||||||||
| Data processing and communications costs |
6,878 | 6,457 | 6,496 | |||||||||
| Goodwill impairment |
54,813 | - | - | |||||||||
| Other operating expenses |
19,978 | 12,274 | 11,173 | |||||||||
| 124,800 | 62,753 | 58,896 | ||||||||||
| (Loss)/income before income taxes |
(34,492 | ) | (5,969 | ) | 22,453 | |||||||
| Applicable income tax (benefit)/expense |
7,297 | (2,053 | ) | 7,300 | ||||||||
| Net (loss)/income |
$ | (41,789 | ) | $ | (3,916 | ) | $ | 15,153 | ||||
| Preferred stock dividends |
3,161 | 328 | - | |||||||||
| Net (loss)/income available to common stockholders |
$ | (44,950 | ) | $ | (4,244 | ) | $ | 15,153 | ||||
| Basic (loss)/earnings per share |
$ | (3.27 | ) | $ | (0.31 | ) | $ | 1.12 | ||||
| Diluted (loss)/earnings per share |
$ | (3.27 | ) | $ | (0.31 | ) | $ | 1.11 | ||||
See Notes to Consolidated Financial Statements.
F-4
Table of Contents
Index to Financial Statements
AMERIS BANCORP AND SUBSIDIARIES
CONSOLIDATED STATEMENTS OF COMPREHENSIVE INCOME/(LOSS)
YEARS ENDED DECEMBER 31, 2009, 2008 AND 2007
(Dollars in Thousands)
| 2009 | 2008 | 2007 | |||||||||
| Net (loss)/income |
$ | (41,789 | ) | $ | (3,916 | ) | $ | 15,153 | |||
| Other comprehensive income/(loss): |
|||||||||||
| Net unrealized holding gains/(losses) arising during period on investment securities available for sale, net of tax |
(265 | ) | 3,915 | 2,907 | |||||||
| Net unrealized gains/(losses) on cash flow hedge during the period, net of tax of $836, $813, and $393 |
1,553 | 1,509 | 729 | ||||||||
| Reclassification adjustment for losses/(gains) included in net income, net of tax of $305, $107 and $101 |
(566 | ) | (209 | ) | 196 | ||||||
| Total other comprehensive income |
722 | 5,215 | 3,832 | ||||||||
| Comprehensive income/(loss) |
$ | (41,067 | ) | $ | 1,299 | $ | 18,985 | ||||
See Notes to Consolidated Financial Statements.
F-5
Table of Contents
Index to Financial Statements
AMERIS BANCORP
CONSOLIDATED STATEMENTS OF STOCKHOLDERS’ EQUITY
(Dollars in thousands, except share data)
| Year Ended December 31, | |||||||||||||||||||
| 2009 | 2008 | 2007 | |||||||||||||||||
| Shares | Amount | Shares | Amount | Shares | Amount | ||||||||||||||
| PREFERRED STOCK |
|||||||||||||||||||
| Balance at beginning of period |
52,000 | $ | 49,028 | - | $ | - | - | $ | - | ||||||||||
| Issued during period |
- | - | 52,000 | 48,975 | - | $ | - | ||||||||||||
| Accretion of fair value of warrant |
- | 524 | - | 53 | - | - | |||||||||||||
| Issued at end of period |
52,000 | $ | 49,552 | 52,000 | $ | 49,028 | - | $ | - | ||||||||||
| COMMON STOCK |
|||||||||||||||||||
| Issued at beginning of period |
15,073,035 | $ | 15,073 | 15,077,256 | $ | 15,077 | 15,057,569 | $ | 15,057 | ||||||||||
| Issuance of restricted shares |
88,750 | 89 | - | - | 4,200 | 4 | |||||||||||||
| Cancellation of restricted shares |
- | - | (33,164 | ) | (33 | ) | - | - | |||||||||||
| Proceeds from exercise of stock options |
756 | 1 | 28,943 | 29 | 15,487 | 16 | |||||||||||||
| Issued at end of period |
15,162,541 | $ | 15,163 | 15,073,035 | $ | 15,073 | 15,077,256 | $ | 15,077 | ||||||||||
| CAPITAL SURPLUS |
|||||||||||||||||||
| Balance at beginning of period |
$ | 87,172 | $ | 83,884 | $ | 82,615 | |||||||||||||
| Stock-based compensation |
701 | (97 | ) | 1,095 | |||||||||||||||
| Warrants issued |
- | 3,025 | - | ||||||||||||||||
| Proceeds from exercise of stock options |
6 | 305 | 160 | ||||||||||||||||
| Issuance of restricted shares |
(89 | ) | - | (4 | ) | ||||||||||||||
| Cancellation of restricted shares |
- | 33 | - | ||||||||||||||||
| Tax adjustment for vesting of restricted shares |
- | 22 | 18 | ||||||||||||||||
| Balance at end of period |
$ | 87,790 | $ | 87,172 | $ | 83,884 | |||||||||||||
| RETAINED EARNINGS |
|||||||||||||||||||
| Balance at beginning of period |
$ | 92,355 | $ | 101,754 | $ | 94,182 | |||||||||||||
| Net (loss)/income |
(41,789 | ) | (3,916 | ) | 15,153 | ||||||||||||||
| Dividends on preferred shares |
(2,583 | ) | (328 | ) | - | ||||||||||||||
| Accretion of fair value warrant |
(578 | ) | - | - | |||||||||||||||
| Cash dividends on common shares |
(1,374 | ) | (5,155 | ) | (7,581 | ) | |||||||||||||
| Balance at end of period |
$ | 46,031 | $ | 92,355 | $ | 101,754 | |||||||||||||
| OTHER COMPREHENSIVE INCOME/(LOSS) |
|||||||||||||||||||
| Unrealized gains (losses) on securities: |
|||||||||||||||||||
| Balance at beginning of period |
$ | 4,288 | $ | 582 | $ | (2,488 | ) | ||||||||||||
| Accumulated other comprehensive income |
(896 | ) | 3,706 | 3,070 | |||||||||||||||
| Balance at end of period |
$ | 3,392 | $ | 4,288 | $ | 582 | |||||||||||||
| Unrealized gains gain on interest rate floors: |
|||||||||||||||||||
| Balance at beginning of period |
$ | 2,230 | $ | 721 | $ | (41 | ) | ||||||||||||
| Accumulated other comprehensive income |
(1,121 | ) | 1,509 | 762 | |||||||||||||||
| Balance at end of period |
$ | 1,109 | $ | 2,230 | $ | 721 | |||||||||||||
| Deferred gains on interest rate swap: |
|||||||||||||||||||
| Balance at beginning of period |
$ | - | $ | - | $ | - | |||||||||||||
| Accumulated other comprehensive income |
2,739 | - | - | ||||||||||||||||
| Balance at end of period |
$ | 2,739 | $ | - | $ | - | |||||||||||||
| Balance at end of period |
$ | 7,240 | $ | 6,518 | $ | 1,303 | |||||||||||||
F-6
Table of Contents
Index to Financial Statements
AMERIS BANCORP AND SUBSIDIARIES
CONSOLIDATED STATEMENTS OF CASH FLOWS
YEARS ENDED DECEMBER 31, 2009, 2008 AND 2007
(Dollars in Thousands)
| 2009 | 2008 | 2007 | ||||||||||
| OPERATING ACTIVITIES |
||||||||||||
| Net (loss)/income |
$ | (41,789 | ) | $ | (3,916 | ) | $ | 15,153 | ||||
| Adjustments to reconcile net (loss)/income to net cash provided by operating activities: |
||||||||||||
| Depreciation and amortization |
3,621 | 3,360 | 3,061 | |||||||||
| Amortization of intangible assets |
617 | 1,170 | 1,297 | |||||||||
| Goodwill impairment charge |
54,813 | - | - | |||||||||
| Net (gain) /loss on securities available for sale |
(871 | ) | (316 | ) | 1,095 | |||||||
| Stock based compensation expense |
701 | (97 | ) | 297 | ||||||||
| Net loss on sale or disposal of premises and equipment |
144 | 627 | 63 | |||||||||
| Net (gain)/loss on sale of other real estate owned |
4,249 | (233 | ) | 656 | ||||||||
| Gain on acquisitions, net of tax |
(25,068 | ) | - | - | ||||||||
| Provision for loan losses |
42,068 | 35,030 | 11,321 | |||||||||
| Provision for deferred taxes |
10,480 | (4,650 | ) | (1,522 | ) | |||||||
| (Increase)/decrease in interest receivable |
851 | 3,688 | (854 | ) | ||||||||
| Increase/(decrease) in interest payable |
(4,140 | ) | (691 | ) | 33 | |||||||
| Increase (decrease) in taxes payable |
(3,184 | ) | (1,512 | ) | (600 | ) | ||||||
| Increase in prepaid FDIC assessments |
(12,795 | ) | (311 | ) | (49 | ) | ||||||
| Net other operating activities |
(5,749 | ) | (6,548 | ) | (6,926 | ) | ||||||
| Total adjustments |
65,737 | 29,517 | 7,872 | |||||||||
| Net cash provided by operating activities |
23,948 | 25,601 | 23,025 | |||||||||
| INVESTING ACTIVITIES |
||||||||||||
| (Increase)/decrease in interest-bearing deposits in banks |
(93,050 | ) | (87,361 | ) | 113,771 | |||||||
| Purchases of securities available for sale |
(77,020 | ) | (168,711 | ) | (137,268 | ) | ||||||
| Proceeds from maturities of securities available for sale |
150,210 | 75,327 | 70,748 | |||||||||
| Proceeds from sale of securities available for sale |
67,317 | 20,805 | 62,912 | |||||||||
| (Increase)/decrease in restricted equity securities, net |
2,398 | 720 | (544 | ) | ||||||||
| (Increase)/decrease in federal funds sold |
19,675 | (45,000 | ) | 9,439 | ||||||||
| (Increase)/decrease in loans, net |
32,158 | (115,447 | ) | (189,913 | ) | |||||||
| Purchase of premises and equipment |
(6,884 | ) | (10,154 | ) | (15,878 | ) | ||||||
| Proceeds from sale of premises and equipment |
1,714 | 390 | 225 | |||||||||
| Proceeds from sale of other real estate owned |
16,022 | 13,181 | 3,067 | |||||||||
| Net cash proceeds received from FDIC-assisted acquisitions |
67,942 | - | - | |||||||||
| Net cash used in investing activities |
180,482 | (316,250 | ) | (83,441 | ) | |||||||
| FINANCING ACTIVITIES |
||||||||||||
| Increase/(decrease) in deposits |
(131,973 | ) | 256,260 | 47,102 | ||||||||
| Increase/(decrease) in federal funds purchased and securities sold under agreements to repurchase |
27,838 | 12,711 | (1,228 | ) | ||||||||
| Proceeds from other borrowings and debentures |
- | 220,600 | 216,500 | |||||||||
| Repayment of other borrowings and debentures |
(79,306 | ) | (239,100 | ) | (201,500 | ) | ||||||
| Deferred gain on termination of interest rate swap |
(2,739 | ) | - | - | ||||||||
| Cash dividends on preferred stock |
(2,583 | ) | - | - | ||||||||
| Cash dividends on common stock |
(1,375 | ) | (5,155 | ) | (7,510 | ) | ||||||
| Proceeds allocated to issuance of preferred stock |
- | 48,975 | - | |||||||||
| Proceeds allocated to warrants issued |
- | 3,025 | - | |||||||||
| Proceeds from exercise of stock options |
6 | 334 | 176 | |||||||||
| Purchase of treasury shares |
(25 | ) | (18 | ) | (176 | ) | ||||||
| Net cash provided by financing activities |
(190,157 | ) | 297,632 | 53,364 | ||||||||
| Net increase (decrease) in cash and due from banks |
14,273 | 6,983 | (7,052 | ) | ||||||||
| Cash and due from banks at beginning of period |
66,787 | 59,804 | 66,856 | |||||||||
| Cash and due from banks at end of period |
$ | 81,060 | $ | 66,787 | $ | 59,804 | ||||||
F-7
Table of Contents
Index to Financial Statements
AMERIS BANCORP AND SUBSIDIARIES
CONSOLIDATED STATEMENTS OF CASH FLOWS
YEARS ENDED DECEMBER 31, 2009, 2008 AND 2007
(Dollars in Thousands)
| 2009 | 2008 | 2007 | ||||||||
| SUPPLEMENTAL DISCLOSURES OF CASH FLOW |
||||||||||
| INFORMATION |
||||||||||
| Cash paid/(received) during the year for: |
||||||||||
| Interest |
$ | 44,690 | $ | 57,308 | $ | 70,966 | ||||
| Income taxes |
$ | (5,248 | ) | $ | 4,207 | $ | 9,573 | |||
| NON-CASH TRANSACTIONS |
||||||||||
| Loans transferred to other real estate owned |
$ | 39,212 | $ | 13,632 | $ | 10,272 | ||||
| Change in unrealized gain (loss) on securities available for sale |
$ | (897 | ) | $ | 3,706 | $ | 4,667 | |||
| Change in unrealized gain (loss) on cash flow hedge |
$ | (1,121 | ) | $ | 1,509 | $ | 1,105 | |||
| Change in deferred gain (loss) on termination of interest rate swap |
$ | 2,739 | $ | - | $ | - | ||||
See Notes to Consolidated Financial Statements.
F-8
Table of Contents
Index to Financial Statements
AMERIS BANCORP AND SUBSIDIARIES
NOTES TO CONSOLIDATED FINANCIAL STATEMENTS
| NOTE 1. | SUMMARY OF SIGNIFICANT ACCOUNTING POLICIES |
Nature of Business
Ameris Bancorp (the “Company”) is a financial holding company whose primary business is presently conducted by Ameris Bank, its wholly-owned banking subsidiary (the “Bank”). Through the Bank, the Company operates a full service banking business and offers a broad range of retail and commercial banking services to its customers concentrated in selected markets in Georgia, Alabama, Florida and South Carolina. The Company and the Bank are subject to the regulations of certain federal and state agencies and are periodically examined by those regulatory agencies.
Basis of Presentation and Accounting Estimates
The consolidated financial statements include the accounts of the Company and its subsidiary. Significant intercompany transactions and balances have been eliminated in consolidation.
In preparing the consolidated financial statements in conformity with accounting principles generally accepted in the United States of America, management is required to make estimates and assumptions that affect the reported amounts of assets and liabilities as of the date of the balance sheet and the reported amounts of revenues and expenses during the reporting period. Actual results could differ from those estimates.
Material estimates that are particularly susceptible to significant change in the near-term relate to the determination of the allowance for loan losses, the valuation of foreclosed assets and the carrying value of our deferred tax assets. The determination of the adequacy of the allowance for loan losses is based on estimates that are susceptible to significant changes in the economic environment and market conditions. In connection with the determination of the estimated losses on loans and the valuation of foreclosed assets, management obtains independent appraisals for significant collateral or assets. In evaluating the Company’s deferred tax assets, management considers the level of future revenues and their capacity to fully utilize the current levels of deferred tax assets.
Acquisition Accounting
Acquisitions are accounted for under the purchase method of accounting. Purchased assets and assumed liabilities are recorded at their estimated fair values as of the purchase date. Any identifiable intangible assets are also recorded at fair value. When the fair value of the assets purchased exceeded the fair value of liabilities assumed, it results in a “bargain purchase gain.” If the consideration given exceeds the fair value of the net assets received, goodwill is recognized. Fair values are subject to refinement for up to one year after the closing date of an acquisition as information relative to closing date fair values becomes available.
Purchased loans acquired in a business combination are recorded at estimated fair value on their purchase date and prohibit the carryover of the related allowance for loan losses. When the loans have evidence of credit deterioration since origination and it is probable at the date of acquisition that the Company will not collect all contractually required principal and interest payments, the difference between contractually required payments at acquisition and the cash flows expected to be collected at acquisition is referred to as the non-accretable difference. The Company must estimate expected cash flows at each reporting date. Subsequent decreases to the expected cash flows will generally result in a provision for loan losses. Subsequent increases in cash flows result in a reversal of the provision for loan losses to the extent of prior charges and adjusted accretable yield which will have a positive impact on interest income. In addition, purchased loans without evidence of credit deterioration are also handled under this method.
All identifiable intangible assets that are acquired in a business combination are recognized at fair value on the acquisition date. Identifiable intangible assets are recognized separately if they arise from contractual or other legal rights or if they are separable (i.e., capable of being sold, transferred, licensed, rented, or exchanged separately from the entity). Because deposit liabilities and the related customer relationship intangible assets may be exchanged in a sale or exchange transaction, the intangible asset associated with the depositor relationship is considered identifiable. Accordingly, the Company recorded a core deposit intangible asset associated with the American United Bank and United Security Bank acquisitions totaling $573,000.
F-9
Table of Contents
Index to Financial Statements
NOTES TO CONSOLIDATED FINANCIAL STATEMENTS
| NOTE 1. | SUMMARY OF SIGNIFICANT ACCOUNTING POLICIES (Continued) |
Acquisition Accounting (Continued)
Indemnification assets are recognized when the seller contractually indemnifies, in whole or in part, the buyer for a particular uncertainty. The recognition and measurement of an indemnification asset is based on the related indemnified item. That is, the acquirer should recognize an indemnification asset at the same time that it recognizes the indemnified item, measured on the same basis as the indemnified item, subject to collectability or contractual limitations on the indemnified amount. Therefore, if the indemnification relates to an asset or a liability that is recognized at the acquisition date and measured at its acquisition-date fair value, the acquirer should recognize the indemnification asset at its acquisition-date fair value on the acquisition date. If an indemnification asset is measured at fair value, a separate valuation allowance is not necessary, because its fair value measurement will reflect any uncertainties in future cash flows. The loans purchased in the American United Bank and United Security Bank acquisitions are covered by a loss-share agreement between the FDIC and the Company. The Company has recorded an estimated receivable from the FDIC of $45.8 million which represents the fair value of the FDIC’s portion of the losses that are expected to be incurred and reimbursed to the Company.
Cash, Due from Banks and Cash Flows
For purposes of reporting cash flows, cash and due from banks includes cash on hand, cash items in process of collection and amounts due from banks. The Bank is required to maintain reserve balances in cash or on deposit with the Federal Reserve Bank. The total of the average daily required reserve was approximately $12.0 million and $3.9 million for the years ended 2009 and 2008, respectively.
Securities
Securities, including equity securities with readily determinable fair values, are classified as available for sale and recorded at fair value with unrealized gains and losses excluded from earnings and reported in accumulated other comprehensive income, net of the related deferred tax effect. Equity securities, including restricted equity securities, are classified as available for sale and recorded at their fair market value.
F-10
Table of Contents
Index to Financial Statements
NOTES TO CONSOLIDATED FINANCIAL STATEMENTS
| NOTE 1. | SUMMARY OF SIGNIFICANT ACCOUNTING POLICIES (Continued) |
Securities (Continued)
The amortization of premiums and accretion of discounts are recognized in interest income using methods approximating the interest method over the life of the securities. Realized gains and losses, determined on the basis of the cost of specific securities sold, are included in earnings on the settlement date. A decline in the market value of any available-for-sale or held-to-maturity investment below cost that is deemed other than temporary is charged to earnings and establishes a new cost basis for the security for the decline in value deemed to be credit related. The decline in value attributed to non-credit related factors is recognized in other comprehensive income and a new cost basis in the security is established.
In determining whether other-than-temporary impairment losses exist, management considers (1) the length of time and the extent to which the fair value has been less than cost, (2) the financial condition and near-term prospects of the issuer and (3) the intent and ability of the Company to retain its investment in the issuer for a period of time sufficient to allow for any anticipated recovery in fair value.
Loans
Loans are reported at their outstanding principal balances less unearned income, net of deferred fees and origination cost and the allowance for loan losses. Interest income is accrued on the outstanding principal balance.
The accrual of interest on loans is discontinued when, in management’s opinion, the borrower may be unable to make payments as they become due, unless the loan is well-secured. Past due status is based on contractual terms of the loan. In all cases, loans are placed on nonaccrual or charged off at an earlier date if collection of principal or interest is considered doubtful. All interest accrued, but not collected for loans that are placed on nonaccrual or charged off, is reversed against interest income, unless management believes that the accrued interest is recoverable through the liquidation of collateral. Interest income on nonaccrual loans is subsequently recognized only to the extent cash payments are received until the loans are returned to accrual status. Loans are returned to accrual status when all the principal and interest amounts contractually due are brought current and future payments are reasonably assured.
F-11
Table of Contents
Index to Financial Statements
NOTES TO CONSOLIDATED FINANCIAL STATEMENTS
| NOTE 1. | SUMMARY OF SIGNIFICANT ACCOUNTING POLICIES (Continued) |
Allowance for Loan Losses
The allowance for loan losses is established as losses are estimated to have occurred through a provision for loan losses charged to expense. Loan losses are charged against the allowance when management believes the collection of a loan’s principal is unlikely. Subsequent recoveries are credited to the allowance.
The allowance is an amount that management believes will be adequate to absorb estimated losses relating to specifically identified loans, as well as probable credit losses inherent in the balance of the loan portfolio. The allowance for loan losses is evaluated on a regular basis by management and is based upon management’s periodic review of various risks in the loan portfolio highlighted by historical experience, the nature and volume of the loan portfolio, overall portfolio quality, review of specific problem loans, current economic conditions that may affect the borrower’s ability to pay, estimated value of any underlying collateral and prevailing economic conditions. This evaluation is inherently subjective as it requires estimates that are susceptible to significant revision as more information becomes available.
This evaluation does not include the effects of expected losses on specific loans or groups of loans that are related to future events or expected changes in economic conditions. While management uses the best information available to make its evaluation, future adjustments to the allowance may be necessary if there are significant changes in economic conditions. In addition, regulatory agencies, as an integral part of their examination process, periodically review the Bank’s allowance for loan losses and may require the Bank to make additions to the allowance based on their judgment about information available to them at the time of their examinations.
The allowance consists of specific and general components. The specific component includes loans management considers impaired and other loans or groups of loans that management has classified with higher risk characteristics. For such loans that are classified as impaired, an allowance is established when the discounted cash flows, collateral value or observable market price of the impaired loan is lower than the carrying value of that loan. The general component covers non-classified loans and is based on historical loss experience adjusted for qualitative factors.
Premises and Equipment
Land is carried at cost. Other premises and equipment are carried at cost, less accumulated depreciation computed on the straight-line method over the estimated useful lives of the assets. In general, estimated lives for buildings are up to 40 years, furniture and equipment useful lives range from 3 to 20 years and the lives of software and computer related equipment range from 3 to 5 years. Leasehold improvements are amortized over the life of the related lease, or the related assets, whichever is shorter. Expenditures for major improvements of the Company’s premises and equipment are capitalized and depreciated over their estimated useful lives. Minor repairs, maintenance and improvements are charged to operations as incurred. When assets are sold or disposed of, their cost and related accumulated depreciation are removed from the accounts and any gain or loss is reflected in earnings.
F-12
Table of Contents
Index to Financial Statements
NOTES TO CONSOLIDATED FINANCIAL STATEMENTS
| NOTE 1. | SUMMARY OF SIGNIFICANT ACCOUNTING POLICIES (Continued) |
Goodwill and Intangible Assets
Goodwill represents the excess of cost over the fair value of the net assets purchased in business combinations. Goodwill is required to be tested annually for impairment or whenever events occur that may indicate that the recoverability of the carrying amount is not probable. In the event of an impairment, the amount by which the carrying amount exceeds the fair value is charged to earnings. The Company performed its annual test of impairment in the fourth quarter and determined that the entire carrying value of the Company’s goodwill was impaired. An impairment charge was recognized as an expense in the fourth quarter of 2009.
Intangible assets consist of core deposit premiums acquired in connection with business combinations and are based on the established value of acquired customer deposits. The core deposit premium is initially recognized based on a valuation performed as of the consummation date and is amortized over the estimated useful life of between three and ten years. Amortization periods are reviewed annually in connection with the annual impairment testing of goodwill.
Other Real Estate Owned
Foreclosed assets acquired through or in lieu of loan foreclosure are held for sale and are initially recorded at fair value less estimated cost to sell. Any write-down to fair value at the time of transfer to foreclosed assets is charged to the allowance for loan losses. Subsequent to foreclosure, valuations are periodically performed by management and the assets are carried at the lower of carrying amount or fair value less cost to sell. Costs of improvements are capitalized up to the fair value of the property, whereas costs relating to holding foreclosed assets and subsequent adjustments to the value are charged to operations. The carrying amount of foreclosed assets at December 31, 2009 and 2008 was $21.6 million and $4.7 million, respectively.
Bank owned real estate includes land acquired directly by the Bank for its purpose and now held for sale at its fair value less estimated cost to sell. The carrying amount of bank owned real estate at December 31, 2009 and 2008 was $1.8 million and $1.8 million, respectively. The Company does not hold any other real estate owned for investment purposes.
Income Taxes
Deferred income tax assets and liabilities are determined using the balance sheet method. Under this method, the net deferred tax asset or liability is determined based on the tax effects of the temporary differences between the book and tax bases of the various balance sheet assets and liabilities and gives current recognition to changes in tax rates and laws.
F-13
Table of Contents
Index to Financial Statements
NOTES TO CONSOLIDATED FINANCIAL STATEMENTS
| NOTE 1. | SUMMARY OF SIGNIFICANT ACCOUNTING POLICIES (Continued) |
Stock-Based Compensation
The Company accounts for its stock compensation plans using a fair value based method whereby compensation cost is measured at the grant date based on the value of the award and is recognized over the service period, which is usually the vesting period.
During 2008, the Company determined that certain stock grants would not vest and as a result reversed amounts expensed in prior years. The Company recorded approximately $701,000, ($97,000), and $444,000 of stock-based compensation cost in 2009, 2008 and 2007, respectively.
Treasury Stock
The Company’s repurchases of shares of its common stock are recorded at cost as treasury stock and result in a reduction of stockholders’ equity.
F-14
Table of Contents
Index to Financial Statements
NOTES TO CONSOLIDATED FINANCIAL STATEMENTS
| NOTE 1. | SUMMARY OF SIGNIFICANT ACCOUNTING POLICIES (Continued) |
Earnings Per Share
Basic earnings per common share are computed by dividing net income by the weighted-average number of shares of common stock outstanding during the year. Diluted earnings per common share are computed by dividing net income by the effect of the issuance of potential common shares that are dilutive and by the sum of the weighted-average number of shares of common stock outstanding. Potential common shares consist of only stock options for the years ended December 31, 2009, 2008 and 2007, and are determined using the treasury stock method.
Presented below is a summary of the components used to calculate basic and diluted earnings per share:
| Years Ended December 31, | |||||||||||
| 2009 | 2008 | 2007 | |||||||||
| (Dollars in Thousands) | |||||||||||
| Net income (loss) available to common shareholders |
$ | (44,950 | ) | $ | (4,244 | ) | $ | 15,153 | |||
| Weighted average number of common shares outstanding |
13,741 | 13,723 | 13,687 | ||||||||
| Effect of dilutive warrants |
- | - | - | ||||||||
| Effect of dilutive options |
- | - | 154 | ||||||||
| Weighted average number of common shares outstanding used to calculate dilutive earnings per share |
13,741 | 13,723 | 13,841 | ||||||||
Due to losses in 2008 and 2009, the Company has excluded the effects of options and warrants as these would have been anti-dilutive. At December 31, 2007, approximately 190,000 common shares were excluded from the calculation of diluted earnings per share because of anti-dilution.
Derivative Instruments and Hedging Activities
The goal of the Company’s interest rate risk management process is to minimize the volatility in the net interest margin caused by changes in interest rates. Derivative instruments are used to hedge certain assets or liabilities as a part of this process. The Company is required to recognize certain contracts and commitments as derivatives when the characteristics of those contracts and commitments meet the definition of a derivative. All derivative instruments are required to be carried at fair value on the balance sheet.
The Company’s current hedging strategies involve utilizing interest rate floors classified as Cash Flow Hedges. Cash flows related to floating-rate assets and liabilities will fluctuate with changes in an underlying rate index. When effectively hedged, the increases or decreases in cash flows related to the floating rate asset or liability will generally be offset by changes in cash flows of the derivative instrument designated as a hedge. The fair value of derivatives is recognized as assets or liabilities in the financial statements. The accounting for the changes in the fair value of a derivative depends on the intended use of the derivative instrument at inception. The change in fair value of the effective portion of cash flow hedges is accounted for in other comprehensive income rather than net income.
F-15
Table of Contents
Index to Financial Statements
NOTES TO CONSOLIDATED FINANCIAL STATEMENTS
| NOTE 1. | SUMMARY OF SIGNIFICANT ACCOUNTING POLICIES (Continued) |
Derivative Instruments and Hedging Activities (Continued)
The Company had cash flow hedges with notional amounts totaling $35 million and $70 million at December 31, 2009 and 2008, respectively, for the purpose of converting floating rate assets to fixed rate. The fair value of these instruments amounted to approximately $1.9 million and $3.7 million as of December 31, 2009 and 2008, respectively, and was recorded as an asset. No hedge ineffectiveness from cash flow hedges was recognized in the statement of operations. All components of each derivative’s gain or loss are included in the assessment of hedge effectiveness.
Comprehensive Income
The Company’s comprehensive income consists of net income, changes in the net unrealized holding gains and losses of securities available for sale, unrealized gain or loss on the effective portion of the cash flow hedge and the realized gain or loss recognized due to the sale or unwind of cash flow hedge prior to their contractual maturity date. These amounts are carried in other comprehensive income (loss) on the consolidated statements of stockholders’ equity and presented net of taxes.
New Accounting Standards
FASB Accounting Standards Codification (“ASC”) Topic 105 — Generally Accepted Accounting Principles (Statement No. 168, The FASB Accounting Standards Codification and the Hierarchy of Generally Accepted Accounting Principles — a replacement of FASB Statement No. 162) (“ASC 105”). This accounting guidance was originally issued in June 2009 and is now included in ASC 105. The guidance identifies the FASB Accounting Standards Codification (the “Codification”) as the single source of authoritative U.S. Generally Accepted Accounting Principles (“GAAP”) recognized by the FASB to be applied by nongovernmental entities. The Codification reorganizes all previous GAAP pronouncements into roughly 90 accounting topics and displays all topics using a consistent structure. All existing standards that were used to create the Codification have been superseded, replacing the previous references to specific Statements of Financial Accounting Standards (“SFAS”) with numbers used in the Codification’s structural organization. The guidance is effective for interim and annual periods ending after September 15, 2009. After September 15, only one level of authoritative GAAP exists, other than guidance issued by the Securities and Exchange Commission. All other accounting literature excluded from the Codification is considered non-authoritative. The adoption of the Codification did not have a material impact on the Company’s consolidated financial statements.
ASC Topic 805 — Business Combinations (Statement No. 141 (Revised 2008), Business Combinations) (“ASC 805”). This accounting guidance was originally issued in December 2007 and is now included in ASC 805. The guidance requires an acquirer to recognize the assets acquired, the liabilities assumed, and any non-controlling interest in the acquiree at the acquisition date, measured at their fair values as of that date, with limited exceptions. The guidance requires prospective application for business combinations consummated in fiscal years beginning on or after December 15, 2008. The federally assisted transactions described in Note 2 were accounted for under this guidance.
F-16
Table of Contents
Index to Financial Statements
NOTES TO CONSOLIDATED FINANCIAL STATEMENTS
| NOTE 1. | SUMMARY OF SIGNIFICANT ACCOUNTING POLICIES (Continued) |
New Accounting Standards (Continued)
ASC Topic 320 — Investments — Debt and Equity Securities (FSP FAS 115-2 and FAS 124-2, Recognition and Presentation of Other-Than-Temporary Impairments) (“ASC 320”). This accounting guidance was originally issued in April 2009 and is now included in ASC 320. The guidance amends the previous other-than-temporary impairment (“OTTI”) guidance for debt securities and included additional presentation and disclosure requirements for both debt and equity securities. The guidance is effective for interim reporting periods ending after June 15, 2009. The adoption of this guidance requires an adjustment to retained earnings and other comprehensive income (“OCI”) in the period of adoption to reclassify non-credit related impairment to OCI for securities that the Company does not intend to sell (and will not more likely than not be required to sell). The adoption of the Codification did have a material impact on the Company’s consolidated financial statements.
ASC Topic 820 — Fair Value Measurements and Disclosures (Staff Position (FSP) FAS 157-4, Determining Fair Value When the Volume and Level of Activity for the Asset or Liability Have Significantly Decreased and Identifying Transactions That Are Not Orderly) (“ASC 820”). This accounting guidance was originally issued in April 2009 and is now included in ASC 820. The guidance reaffirms the exit price fair value measurement concept and also provides additional guidance for estimating fair value when the volume and level of activity for the asset or liability have significantly decreased. The guidance was effective for interim reporting periods ending after June 15, 2009. The adoption of this guidance did not have a material impact on the consolidated financial statements.
ASC Topic 825 — Financial Instruments (FSP FAS 107-1 and APB 28-1, Interim Disclosures about Fair Value of Financial Instruments) (“ASC 825”). This accounting guidance was originally issued in April 2009 and is now included in ASC 825. The guidance requires disclosures about fair value of financial instruments for interim reporting periods of publicly traded companies as well as in annual financial statements. This guidance was adopted for interim reporting periods ending after June 15, 2009 (See Note 19).
ASC Topic 855 — Subsequent Events (Statement No. 165, Subsequent Events) (“ASC 855”). This accounting guidance was originally issued in May 2009 and is now included in ASC 855. The guidance establishes general standards of accounting for and disclosure of subsequent events. Subsequent events are events that occur after the balance sheet date but before financial statements are issued or are available to be issued. The guidance is effective for interim or annual periods ending after June 15, 2009. The Company performed a review through March 11, 2010, and determined that there were no transactions qualifying as a subsequent event.
Accounting Standards Update (“ASU”) 2010-6 — Fair Value Measurements and Disclosures (Topic 820): Improving Disclosures about Fair Value Measurements. The ASU amends Subtopic 820-10 with new disclosure requirements and clarification of existing disclosure requirements. New disclosures required include the amount of significant transfers in and out of levels 1 and 2 fair value measurements and the reasons for the transfers. In addition, the reconciliation for level 3 activity will be required on a gross rather than net basis. The ASU provides additional guidance related to the level of disaggregation in determining classes of assets and liabilities and disclosures about inputs and valuation techniques. The amendments are effective for annual or interim reporting periods beginning after December 15, 2009, except for the requirement to provide the reconciliation for level 3 activity on a gross basis which will be effective for fiscal years beginning after December 15, 2010. (See Note 19).
Reclassifications. Certain reclassifications of prior year amounts have been made to conform with the current year presentations.
F-17
Table of Contents
Index to Financial Statements
NOTES TO CONSOLIDATED FINANCIAL STATEMENTS
| NOTE 2. | BUSINESS COMBINATIONS |
During 2009, the Company participated in two federally-assisted acquisitions (the “acquisitions”) whereby the Company purchased two failed institutions out of the FDIC’s receivership.
American United Bank:
On October 23, 2009, the Bank purchased substantially all of the assets and assumed substantially all the liabilities of American United Bank (“AUB”) from the FDIC, as Receiver of AUB. AUB operated only one branch in Lawrenceville, Georgia, a northeast suburb of Atlanta, Georgia, with total loans of $85.7 million and total deposits of $100.3 million. The Company’s agreements with the FDIC included a loss-sharing agreement which affords the Bank significant protection from losses associated with loans and other real estate owned (“OREO”). Under the terms of the loss-sharing agreement, the FDIC will absorb 80% of losses and share 80% of loss recoveries on the first $38 million of losses and absorb 95% of losses and share in 95% of loss recoveries on losses exceeding $38 million. The term for loss sharing on residential real estate loans is ten years, while the term for loss sharing on all other loans is five years.
The Company’s bid to acquire AUB included a discount on the book value of the assets totaling $19.6 million. Also included in the bid was a premium of approximately $262,000 on AUB’s deposits. The Bank’s bid resulted in a cash payment from the FDIC totaling $17.1 million.
United Security Bank:
On November 6, 2009, the Bank purchased substantially all of the assets and assumed substantially all the liabilities of United Security Bank (“USB”) from the FDIC, as Receiver of USB. USB operated one branch in Woodstock, Georgia and one branch in Sparta, Georgia, with total loans of $108.4 million and total deposits of $140.0 million. The Company’s agreements with the FDIC included a loss-sharing agreement similar to that associated with AUB, except that under the terms of the USB loss-sharing agreement, the FDIC will absorb 80% of losses and share 80% of loss recoveries on the first $46 million of losses and absorb 95% of losses and share in 95% of loss recoveries on losses exceeding $46 million. The term for loss sharing on residential real estate loans is ten years, while the term for loss sharing on all other loans is five years.
The Company’s bid to acquire USB included a discount on the book value of the assets totaling $32.6 million. Also included in the bid was a premium of approximately $228,000 on USB’s deposits. The Bank’s bid resulted in a cash payment from the FDIC totaling $24.2 million.
F-18
Table of Contents
Index to Financial Statements
NOTES TO CONSOLIDATED FINANCIAL STATEMENTS
| NOTE 2. | BUSINESS COMBINATIONS (Continued) |
The following table summarizes the estimated fair values of the assets acquired and liabilities assumed at the date of the acquisitions (in thousands):
| American United Bank |
United Security Bank |
Total | |||||||
| Assets acquired: |
|||||||||
| Cash and due from banks |
$ | 26,452 | $ | 41,490 | $ | 67,942 | |||
| Securities available for sale |
10,242 | 8,335 | 18,577 | ||||||
| Federal funds sold |
- | 2,605 | 2,605 | ||||||
| Loans |
56,482 | 83,646 | 140,128 | ||||||
| Foreclosed property |
2,165 | 8,069 | 10,234 | ||||||
| Estimated loss reimbursement from the FDIC |
24,200 | 21,640 | 45,840 | ||||||
| Core deposit intangible |
187 | 386 | 573 | ||||||
| Accrued interest receivable and other assets |
1,266 | 3,001 | 4,267 | ||||||
| Total assets acquired |
120,994 | 169,172 | 290,166 | ||||||
| Liabilities assumed: |
|||||||||
| Deposits |
100,470 | 141,094 | 241,564 | ||||||
| Federal Home Loan Bank advances |
7,802 | 1,504 | 9,306 | ||||||
| Accrued interest payable and other liabilities |
277 | 453 | 14,228 | ||||||
| Total liabilities assumed |
108,549 | 143,051 | 265,098 | ||||||
| Net assets acquired / gain from acquisition |
$ | 12,445 | $ | 26,121 | $ | 38,566 | |||
The loss-sharing agreement is subject to the servicing procedures as specified in the agreement with the FDIC. The expected reimbursements under the loss-sharing agreement were recorded as an indemnification asset at their estimated fair value of $45.8 million on the acquisition date. Based upon the acquisition date fair values of the net assets acquired, no goodwill was recorded. The transaction resulted in a gain of $38.6 million, before tax, which is included in the Company’s December 31, 2009 Consolidated Statement of Operations. Due to the difference in tax bases of the assets acquired and liabilities assumed, the Bank recorded a deferred tax liability of $13.5 million, resulting in an after-tax gain of $25.1 million.
Ameris Bancorp considers that the determination of the initial fair value of loans at the acquisition and the initial fair value of the related FDIC indemnification asset involves a high degree of judgment and complexity. The carrying value of the acquired loans and the FDIC indemnification asset reflect management’s best estimate of the fair value of each of these assets as of the date of acquisition. However, the amount that the Company realizes on these assets could differ materially from the carrying value reflected in these financial statements, based upon the timing and amount of collections on the acquired loans in future periods. Because of the loss-sharing agreement with the FDIC on these assets, the Company should not incur any significant losses. To the extent the actual values realized for the acquired loans are different from the estimate the indemnification asset will generally be affected in an offsetting manner due to the loss sharing support from the FDIC.
In its assumption of the deposit liabilities in the acquisitions, Ameris Bancorp believed that the customer relationships associated with these deposits have intangible value. The Company determined the fair value of a core deposit intangible asset totaling approximately $573,000. In determining the valuation amount, deposits were analyzed based on factors such as type of deposit, deposit retention, interest rates, age of deposit relationships, and the maturities of time deposits. The gain resulting from the acquisition was reduced by the fair value of the core deposit intangible asset, thus reducing the carrying value of such asset to zero.
The results of operations of AUB and USB subsequent to the acquisition date are included in Ameris Bancorp’s consolidated statements of operations. The following unaudited pro forma information reflects the Company’s estimated consolidated results of operations as if the acquisitions had occurred on December 31, 2008 and 2007, unadjusted for potential cost savings (in thousands).
F-19
Table of Contents
Index to Financial Statements
NOTES TO CONSOLIDATED FINANCIAL STATEMENTS
| NOTE 2. | BUSINESS COMBINATIONS (Continued) |
| Year ended December 31, Unaudited |
||||||||
| 2009 | 2008 | |||||||
| Net interest income and noninterest income |
$ | 133,657 | $ | 98,291 | ||||
| Net income |
$ | (56,436 | ) | $ | (6,829 | ) | ||
| Net income available to common shareholders |
$ | (59,597 | ) | $ | (7,157 | ) | ||
| Earnings per common share – basic and diluted |
$ | (4.11 | ) | $ | (0.50 | ) | ||
| Earnings per common share available to common shareholders – basic and diluted |
$ | (4.34 | ) | $ | (0.52 | ) | ||
| Average number shares outstanding, basic and diluted |
13,741 | 13,723 | ||||||
FASB ASC 310 – 30, Loans and Debt Securities Acquired with Deteriorated Credit Quality, applies to a loan with evidence of deterioration of credit quality since origination, acquired by completion of a transfer for which it is probable, at acquisition, that the investor will be unable to collect all contractually required payments receivable. FASB ASC 310 prohibits carrying over or creating an allowance for loan losses upon initial recognition for loans which fall under the scope of this statement. On the acquisition date, the preliminary estimate of the contractually required payments receivable for all FASB ASC 310 loans acquired in the acquisition were $109.8 million and the estimated fair value of the loans were $58.6 million, net of an accretable yield of $3.6 million, the difference between the value of the loans on our balance sheet and the cash flows they are expected to produce. These amounts were determined based upon the estimated remaining life of the underlying loans, which include the effects of estimated prepayments. At the acquisition dates, a majority of these loans were valued based on the liquidation value of the underlying collateral because the future cash flows are primarily based on the liquidation of underlying collateral. There was no allowance for credit losses established related to these FASB ASC 310 loans at the acquisition dates, based on the provision of this statement.
F-20
Table of Contents
Index to Financial Statements
NOTES TO CONSOLIDATED FINANCIAL STATEMENTS
| NOTE 2. | BUSINESS COMBINATIONS (Continued) |
Loans acquired for which it was probable at acquisition that all contractually required payments would not be collected are as follows (in thousands):
The covered loans at AUB at the acquisition date of October 23, 2009 are presented in the following table.
| Loans with Deterioration of Credit Quality |
Loans without a Deterioration of Credit Quality |
Total Covered Loans | |||||||
| (In thousands) | |||||||||
| Construction and development |
$ | 16,513 | $ | 991 | $ | 17,504 | |||
| Real estate secured |
8,460 | 3,583 | 12,043 | ||||||
| Commercial, industrial, agricultural |
12,102 | 14,393 | 26,495 | ||||||
| Consumer |
2 | 438 | 440 | ||||||
| $ | 37,077 | $ | 19,405 | $ | 56,482 | ||||
The covered loans at USB on the acquisition date of November 6, 2009 are presented in the following table.
| Loans with Deterioration of Credit Quality |
Loans without Deterioration of Credit Quality |
Total Covered Loans | |||||||
| (In thousands) | |||||||||
| Construction and development |
$ | 16,086 | $ | 14,190 | $ | 30,276 | |||
| Real estate secured |
3,987 | 37,100 | 41,087 | ||||||
| Commercial, industrial, agricultural |
769 | 6,135 | 6,904 | ||||||
| Consumer |
633 | 4,746 | 5,379 | ||||||
| $ | 21,475 | $ | 62,171 | $ | 83,646 | ||||
The following table presents the loans receivable (in thousands) at the acquisition date for loans with deterioration in credit quality.
| American United Bank |
United Security Bank |
Total | |||||||
| (In thousands) | |||||||||
| Contractually required principal payments receivable |
$ | 65,438 | $ | 44,372 | $ | 109,810 | |||
| Non-accretable difference |
26,416 | 21,292 | 47,708 | ||||||
| Present value of cash flows expected to be collected |
39,022 | 23,080 | 62,102 | ||||||
| Accretable difference |
1,945 | 1,605 | 3,550 | ||||||
| Fair value of loans acquired with deterioration of credit quality |
$ | 37,077 | $ | 21,475 | $ | 58,552 | |||
On loans where there was a deterioration of credit, the Company also recorded an accretable difference that will be amortized into income when the expected proceeds from individual loans are more readily determinable. The Bank recorded total accretable differences of $1.9 million associated with AUB and $1.6 million associated with USB. As of December 31, 2009, none of the accretable differences had been amortized into interest income.
F-21
Table of Contents
Index to Financial Statements
NOTES TO CONSOLIDATED FINANCIAL STATEMENTS
| NOTE 3. | SECURITIES |
The amortized cost and fair value of securities available for sale with gross unrealized gains and losses are summarized as follows:
| Amortized Cost |
Gross Unrealized Gains |
Gross Unrealized Losses |
Fair Value | ||||||||||
| (Dollars in Thousands) | |||||||||||||
| December 31, 2009: |
|||||||||||||
| U. S. Government sponsored agencies |
$ | 39,194 | $ | 416 | $ | (85 | ) | $ | 39,525 | ||||
| State and municipal securities |
37,133 | 1,048 | (25 | ) | 38,156 | ||||||||
| Corporate debt securities |
12,178 | 36 | (3,539 | ) | 8,675 | ||||||||
| Mortgage-backed securities |
151,833 | 7,536 | (169 | ) | 159,200 | ||||||||
| Total debt securities |
$ | 240,338 | $ | 9,036 | $ | (3,818 | ) | $ | 245,556 | ||||
| December 31, 2008: |
|||||||||||||
| U. S. Government-sponsored agencies |
$ | 130,966 | $ | 1,680 | $ | - | $ | 132,646 | |||||
| State and municipal securities |
18,095 | 330 | (123 | ) | 18,302 | ||||||||
| Corporate debt securities |
12,209 | 186 | (777 | ) | 11,618 | ||||||||
| Mortgage-backed securities |
200,128 | 5,332 | (132 | ) | 205,328 | ||||||||
| Total debt securities |
$ | 361,398 | $ | 7,528 | $ | (1,032 | ) | $ | 367,894 | ||||
At December 31, 2009 and 2008, all of the Company’s mortgage-backed securities were obligations of Government-sponsored agencies.
The amortized cost and fair value of debt securities available for sale as of December 31, 2009 by contractual maturity are shown below. Maturities may differ from contractual maturities in mortgage-backed securities because the mortgages underlying the securities may be called or repaid without penalty. Therefore, these securities are not included in the maturity categories in the following maturity summary.
| Amortized Cost |
Fair Value | |||||
| (Dollars in Thousands) | ||||||
| Due in one year or less |
$ | 7,893 | $ | 8,012 | ||
| Due from one year to five years |
35,063 | 35,460 | ||||
| Due from five to ten years |
30,153 | 30,416 | ||||
| Due after ten years |
15,396 | 12,468 | ||||
| Mortgage-backed securities |
151,833 | 159,200 | ||||
| $ | 240,338 | $ | 245,556 | |||
Securities with a carrying value of approximately $156.7 million and $260.8 million at December 31, 2009 and 2008, respectively, were pledged to secure public deposits and for other purposes required or permitted by law.
F-22
Table of Contents
Index to Financial Statements
NOTES TO CONSOLIDATED FINANCIAL STATEMENTS
| NOTE 3. | SECURITIES (Continued) |
Gains and losses on sales of securities available for sale consist of the following:
| December 31, | ||||||||||||
| 2009 | 2008 | 2007 | ||||||||||
| (Dollars in Thousands) | ||||||||||||
| Gross gains on sales of securities |
$ | 894 | $ | 329 | $ | 26 | ||||||
| Gross losses on sales of securities |
(23 | ) | (13 | ) | (323 | ) | ||||||
| Net realized gains (losses) on sales of securities available for sale |
$ | 871 | $ | 316 | $ | (297 | ) | |||||
The following table shows the gross unrealized losses and fair value of securities aggregated by category and length of time that securities have been in a continuous unrealized loss position at December 31, 2009 and 2008.
| Less Than 12 Months | 12 Months or More | Total | |||||||||||||||||||
| Description of Securities |
Fair Value |
Unrealized Losses |
Fair Value |
Unrealized Losses |
Fair Value |
Unrealized Losses |
|||||||||||||||
| (Dollars in Thousands) | |||||||||||||||||||||
| December 31, 2009: |
|||||||||||||||||||||
| U. S. Government sponsored agencies |
$ | 14,908 | $ | (85 | ) | $ | - | $ | - | $ | 14,908 | $ | (85 | ) | |||||||
| State and municipal securities |
3,200 | (22 | ) | 613 | (3 | ) | 3,813 | (25 | ) | ||||||||||||
| Corporate debt securities |
861 | (139 | ) | 4,722 | (3,400 | ) | 5,583 | (3,539 | ) | ||||||||||||
| Mortgage-backed securities |
- | - | 1,408 | (169 | ) | 1,408 | (169 | ) | |||||||||||||
| Total temporarily impaired securities |
$ | 18,969 | $ | (246 | ) | $ | 6,743 | $ | (3,572 | ) | $ | 25,712 | $ | (3,818 | ) | ||||||
| December 31, 2008: |
|||||||||||||||||||||
| U. S. Government sponsored agencies |
$ | - | $ | - | $ | - | $ | - | $ | - | $ | - | |||||||||
| State and municipal securities |
3,715 | (80 | ) | 981 | (43 | ) | 4,696 | (123 | ) | ||||||||||||
| Corporate debt securities |
2,178 | (777 | ) | - | - | 2,178 | (777 | ) | |||||||||||||
| Mortgage-backed securities |
7,264 | (83 | ) | 2,408 | (49 | ) | 9,672 | (132 | ) | ||||||||||||
| Total temporarily impaired securities |
$ | 13,157 | $ | (940 | ) | $ | 3,389 | $ | (92 | ) | $ | 16,546 | $ | (1,032 | ) | ||||||
Additional information concerning the Company’s investments in corporate debt securities is included in the following table.
| Class |
Amortized Cost |
Fair Value | Average Maturity (years) |
Average Book Yield |
|||||||
| Subordinated Debt |
$ | 3,998 | $ | 3,467 | 5.9 | 6.24 | % | ||||
| Preferred Securities |
$ | 8,180 | $ | 5,208 | 21.6 | 6.10 | % | ||||
| Total |
$ | 12,178 | $ | 8,675 | 16.4 | 6.15 | % | ||||
F-23
Table of Contents
Index to Financial Statements
NOTES TO CONSOLIDATED FINANCIAL STATEMENTS
| NOTE 3. | SECURITIES (Continued) |
During 2008 and 2009, the Company received timely and current interest and principal payments on all of the securities classified as corporate debt securities. The Company’s investments in subordinated debt include investments in regional and super-regional banks on which the Company prepares regular analysis through review of financial information or credit ratings. Investments in preferred securities are also concentrated in the preferred obligations of regional and super-regional banks through non-pooled investment structures. Investments in “pooled” trust preferred securities are limited to a single issue totaling $514,000 at December 31, 2009 and 2008.
Management and the Company’s ALCO committee evaluate securities for other-than-temporary impairment at least on a quarterly basis, and more frequently when economic or market concerns warrant such evaluation. While the majority of the unrealized losses on debt securities relate to changes in interest rates, corporate debt securities have also been affected by reduced levels of liquidity and higher risk premiums. Occasionally, management engages independent third parties to evaluate the Company’s position in certain corporate debt securities to aid management and the ALCO committee in its determination regarding the status of impairment. The Company believes that each investment poses minimal credit risk and further, that the Company has the intent and ability to hold these investments to their maturity date. Therefore, at December 31, 2009, these investments are not considered impaired on an other-than-temporary basis.
F-24
Table of Contents
Index to Financial Statements
NOTES TO CONSOLIDATED FINANCIAL STATEMENTS
| NOTE 4. | LOANS AND ALLOWANCE FOR LOAN LOSSES |
The composition of loans is summarized as follows:
| December 31, | ||||||
| 2009 | 2008 | |||||
| (Dollars in Thousands) | ||||||
| Commercial, financial and agricultural |
$ | 168,046 | $ | 200,421 | ||
| Real estate – residential |
182,483 | 189,203 | ||||
| Real estate – commercial and farmland |
1,063,369 | 1,070,483 | ||||
| Real estate – construction and development |
100,770 | 162,887 | ||||
| Consumer installment |
59,108 | 64,707 | ||||
| Other |
10,583 | 8,076 | ||||
| 1,584,359 | 1,695,777 | |||||
| Allowance for loan losses |
35,762 | 39,652 | ||||
| Loans, net |
$ | 1,548,597 | $ | 1,656,125 | ||
Covered loans totaling $137.2 million at December 31, 2009 are not included in the above schedule. These loans are concentrated predominately in commercial, financial and agricultural loans (16.7% of covered loans at December 31, 2009), commercial and farmland loans (47.4% of covered loans at December 31, 2009) and residential real estate loans (16.9% of covered loans at December 31, 2009).
The following is a summary of information pertaining to impaired loans:
| As of and For the Years Ended December 31, | |||||||||
| 2009 | 2008 | 2007 | |||||||
| (Dollars in Thousands) | |||||||||
| Impaired loans requiring a valuation allowance |
$ | 55,004 | $ | 29,967 | $ | 14,237 | |||
| Impaired loans no requiring a valuation allowance |
$ | 41,127 | $ | 35,447 | $ | 4,231 | |||
| Valuation allowance related to impaired loans |
$ | 15,081 | $ | 9,078 | $ | 2,978 | |||
| Average investment in impaired loans |
$ | 75,784 | $ | 40,940 | $ | 16,247 | |||
| Interest income recognized on impaired loans |
$ | 523 | $ | 323 | $ | 314 | |||
| Foregone interest income on impaired loans |
$ | 6,253 | $ | 4,643 | $ | 1,340 | |||
Loans on nonaccrual status amounted to approximately $96.1 million, $65.4 million, and $18.5 million at December 31, 2009, 2008 and 2007, respectively. There were no material amounts of loans past due ninety days or more and still accruing interest at December 31, 2009, 2008 or 2007.
F-25
Table of Contents
Index to Financial Statements
NOTES TO CONSOLIDATED FINANCIAL STATEMENTS
| NOTE 4. | LOANS AND ALLOWANCE FOR LOAN LOSSES (Continued) |
Changes in the allowance for loan losses for the years ended December 31, 2009, 2008 and 2007 are as follows:
| December 31, | ||||||||||||
| 2009 | 2008 | 2007 | ||||||||||
| (Dollars in Thousands) | ||||||||||||
| Balance, beginning of year |
$ | 39,652 | $ | 27,640 | $ | 24,863 | ||||||
| Provision for loan losses |
42,068 | 35,030 | 11,321 | |||||||||
| Loans charged off |
(47,129 | ) | (24,340 | ) | (10,418 | ) | ||||||
| Recoveries of loans previously charged off |
1,171 | 1,322 | 1,874 | |||||||||
| Balance, end of year |
$ | 35,762 | $ | 39,652 | $ | 27,640 | ||||||
In the ordinary course of business, the Company has granted loans to certain directors and their affiliates. The interest rates on these loans were substantially the same as rates prevailing at the time of the transaction and repayment terms are customary for the type of loan. Company policy provides for no loans to executive officers. Changes in related party loans are summarized as follows:
| December 31, | ||||||||
| 2009 | 2008 | |||||||
| (Dollars in Thousands) | ||||||||
| Balance, beginning of year |
$ | 8,274 | $ | 6,246 | ||||
| Advances |
3 | 282 | ||||||
| Repayments |
(93 | ) | (205 | ) | ||||
| Transactions due to changes in related parties |
152 | 1,951 | ||||||
| Balance, end of year |
$ | 8,336 | $ | 8,274 | ||||
The Bank makes commercial, residential, construction, agricultural, agribusiness and consumer loans to customers primarily concentrated in selected markets in Georgia, Alabama, Florida and South Carolina. A substantial portion of the customers’ abilities to honor their contracts is dependent on the business economy in the geographical area served by the Bank.
A substantial portion of the Company’s loans are secured by real estate in the Company’s primary market area. In addition, a substantial portion of the other real estate owned is located in those same markets. Accordingly, the ultimate collectability of a substantial portion of the Company’s loan portfolio and the recovery of a substantial portion of the carrying amount of other real estate owned are susceptible to changes in real estate conditions in the Company’s primary market area.
F-26
Table of Contents
Index to Financial Statements
NOTES TO CONSOLIDATED FINANCIAL STATEMENTS
| NOTE 5. | PREMISES AND EQUIPMENT |
Premises and equipment are summarized as follows:
| December 31, | ||||||||
| 2009 | 2008 | |||||||
| (Dollars in Thousands) | ||||||||
| Land |
$ | 24,745 | $ | 20,231 | ||||
| Buildings |
48,334 | 43,350 | ||||||
| Furniture and equipment |
29,459 | 26,307 | ||||||
| Construction in progress |
283 | 8,067 | ||||||
| 102,821 | 97,955 | |||||||
| Accumulated depreciation |
(35,184 | ) | (31,848 | ) | ||||
| $ | 67,637 | $ | 66,107 | |||||
Estimated costs to complete construction projects under progress were less than $1 million at December 31, 2009 and approximately $3.8 million at December 31, 2008. Depreciation expense was $3.6 million, $3.4 million and $3.1 million for the years ended December 31, 2009, 2008 and 2007, respectively.
Leases
The Company has a non-cancellable operating lease on its operations center with a former Chairman of the Board. The lease has an initial term of three years with one two-year renewal option. Additionally, the Company has two short-term residential leases for the convenience of bank employees who have been relocated temporarily.
The Company has various operating leases with unrelated parties on fourteen banking offices. Generally, these leases are on smaller locations with initial lease terms under ten years with up to two renewal options.
Rental expense amounted to approximately $752,000, $813,000, and $335,000 for the years ended December 31, 2009, 2008 and 2007, respectively. Future minimum lease commitments under the Company’s operating leases, excluding any renewal options, are summarized as follows:
| 2010 | $ | 446,932 | |
| 2011 | 336,188 | ||
| 2012 | 269,713 | ||
| 2013 | 186,000 | ||
| 2014 | 174,000 | ||
| Thereafter | 320,000 | ||
| $ | 1,732,833 | ||
F-27
Table of Contents
Index to Financial Statements
NOTES TO CONSOLIDATED FINANCIAL STATEMENTS
| NOTE 6. | GOODWILL AND INTANGIBLE ASSETS |
The Company recorded a core deposit intangible asset of $573,000 associated with the acquisitions of AUB and USB during the fourth quarter of 2009. The amortization period used for core deposit intangibles ranges from 3 to 10 years. Following is a summary of information related to acquired intangible assets:
| As of December 31, 2009 | As of December 31, 2008 | |||||||||||
| Gross Amount |
Accumulated Amortization |
Gross Amount |
Accumulated Amortization | |||||||||
| (Dollars in Thousands) | ||||||||||||
| Amortized intangible assets Core deposit premiums |
$ | 15,003 | $ | 11,417 | $ | 14,430 | $ | 10,799 | ||||
The aggregate amortization expense for intangible assets was approximately $615,541, $1,170,000 and $1,297,000 for the years ended December 31, 2009, 2008 and 2007, respectively.
The estimated amortization expense for each of the next five years is as follows (in thousands):
| 2010 |
$ | 738 | |
| 2011 |
738 | ||
| 2012 |
652 | ||
| 2013 |
493 | ||
| 2014 |
493 | ||
| Thereafter |
472 | ||
| $ | 3,586 | ||
Changes in the carrying amount of goodwill are as follows:
| For the Years Ended December 31, | |||||||
| 2009 | 2008 | ||||||
| (Dollars in Thousands) | |||||||
| Beginning balance |
$ | 54,813 | $ | 54,813 | |||
| Impairment of goodwill |
(54,813 | ) | - | ||||
| Ending balance |
$ | - | $ | 54,813 | |||
During our annual assessment of goodwill in the fourth quarter of 2009, we concluded that the carrying value of goodwill was impaired. GAAP requires that goodwill be reviewed for impairment at least annually. Impairment is a condition that exists when the carrying amount of the goodwill exceeds its fair value. Two tests were performed by a third party using three valuation approaches: the market approach, income approach and the cost approach. Based on the testing, it was determined that the entire carrying value of goodwill was impaired. The loss on impairment of goodwill in the amount of $54.8 million was recorded as an other expense in the statement of operations for the year ended December 31, 2009.
F-28
Table of Contents
Index to Financial Statements
NOTES TO CONSOLIDATED FINANCIAL STATEMENTS
| NOTE 7. | DEPOSITS |
The aggregate amount of time deposits in denominations of $100,000 or more at December 31, 2009 and 2008 was $504.3 million and $677.8 million, respectively. The scheduled maturities of time deposits at December 31, 2009 are as follows:
| (Dollars in Thousands) | |||||
| 2010 |
$ | 693,873 | |||
| 2011 |
94,663 | ||||
| 2012 |
50,085 | ||||
| 2013 |
25,317 | ||||
| 2014 |
7,386 | ||||
| Thereafter |
26 | ||||
| $ | 871,350 | ||||
The Company had brokered deposits of $164.3 million and $195.3 million at December 31, 2009 and 2008. The scheduled maturities of brokered deposits at December 31, 2009 and their weighted average costs are as follows:
| Balance | Average Cost |
|||||||
| (Dollars in Thousands) | ||||||||
| 2010 |
$ | 46,000 | 1.15 | % | ||||
| 2011 |
50,461 | 3.21 | ||||||
| 2012 |
40,081 | 2.87 | ||||||
| 2013 |
21,799 | 3.29 | ||||||
| 2014 |
6,000 | 3.00 | ||||||
| $ | 164,341 | 2.56 | % | |||||
| NOTE 8. | SECURITIES SOLD UNDER REPURCHASE AGREEMENTS |
Securities sold under repurchase agreements, which are secured borrowings, generally mature within one to four days from the transaction date. Securities sold under repurchase agreements are reflected at the amount of cash received in connection with the transactions. The Company may be required to provide additional collateral based on the fair value of the underlying securities. The Company monitors the fair value of the underlying securities on a daily basis. Securities sold under repurchase agreements at December 31, 2009 and 2008 were $55.3 million and $27.4 million, respectively.
| NOTE 9. | EMPLOYEE BENEFIT PLANS |
The Company has established a retirement plan for eligible employees. The Ameris Bancorp 401(k) Profit Sharing Plan allows a participant to defer a portion of his compensation and provides that the Company will match a portion of the deferred compensation. The Plan also provides for non-elective and discretionary contributions. All full-time and part-time employees are eligible to participate in the Plan provided they have met the eligibility requirements. Generally, a participant must have completed twelve months of employment with a minimum of 1,000 hours and have attained an age of 21.
Aggregate expense under the plan charged to operations during 2009, 2008 and 2007 amounted to $548,000, $1.6 million and $1.3 million, respectively. During 2009, the Company reduced contributions to the plan because of the net loss from operations.
F-29
Table of Contents
Index to Financial Statements
NOTES TO CONSOLIDATED FINANCIAL STATEMENTS
| NOTE 10. | DEFERRED COMPENSATION PLANS |
The Company and the Bank have entered into separate deferred compensation arrangements with certain former executive officers and directors. The plans call for certain amounts payable at retirement, death or disability. The estimated present value of the deferred compensation is being accrued over the expected service period. The Company and the Bank have purchased life insurance policies which they intend to use to finance this liability. Cash surrender value of life insurance of $2.3 million and $2.1 million at December 31, 2009 and 2008, is included in other assets. Accrued deferred compensation of $1.0 million and $1.3 million at December 31, 2009 and 2008, is included in other liabilities. Aggregate compensation expense under the plans was $95,000, $95,000 and $119,000 for 2009, 2008 and 2007, respectively, and is included in other operating expenses.
F-30
Table of Contents
Index to Financial Statements
NOTES TO CONSOLIDATED FINANCIAL STATEMENTS
| NOTE 11. | OTHER BORROWINGS |
Other borrowings consist of the following:
| December 31, | ||||||
| 2009 | 2008 | |||||
| (Dollars in Thousands) | ||||||
| Advances under revolving credit agreement with a regional bank with interest at thirty day LIBOR plus 1.35%, matured in December 2009, secured by subsidiary bank stock. |
$ | - | $ | 5,000 | ||
| Advances from the FHLB with adjustable interest at three month LIBOR plus 0.32%, matured in August 2009. |
- | 65,000 | ||||
| Advances from Federal Home Loan Bank with interest at fixed rates (weighted average rate of 6.12%) convertible to a variable rate at the option of the lender, due at various dates through May 2010. |
2,000 | 2,000 | ||||
| $ | 2,000 | $ | 72,000 | |||
The advances from Federal Home Loan Bank are collateralized by a blanket lien on all first mortgage loans and other specific loans in addition to FHLB stock. At December 31, 2009, $64.6 million was available for borrowing on lines with the FHLB.
As of December 31, 2009, the Company maintained credit arrangements with various financial institutions to purchase federal funds up to $55 million. The Company also participates in the Federal Reserve discount window borrowings.
| NOTE 12. | PREFERRED STOCK |
On November 21, 2008, Ameris sold 52,000 shares of preferred stock with a warrant to purchase 679,443 shares of the Company’s common stock, to the U.S. Treasury under the Treasury’s Capital Purchase Program. The proceeds from the sale of $52 million were allocated between the preferred stock and the warrant based on their relative fair values at the time of the sale. Of the $52 million in proceeds, $48.98 million was allocated to the preferred stock and $3.02 million was allocated to the warrant. The discount recorded on the preferred stock that resulted from allocating a portion of the proceeds to the warrant is being accreted as a portion of the preferred stock dividends in the Consolidated Statement of Operations to arrive at Net Income Available to Common Shareholders.
The preferred stock qualifies as Tier I capital and will pay cumulative dividends at a rate of 5% per annum for the first five years and 9% per annum thereafter. The preferred stock is redeemable at any time at $1,000 per share plus any accrued and unpaid dividends with the consent of the Company’s primary federal regulator.
F-31
Table of Contents
Index to Financial Statements
NOTES TO CONSOLIDATED FINANCIAL STATEMENTS
| NOTE 13. | INCOME TAXES |
The income tax expense in the consolidated statements of income consists of the following:
| For the Years Ended December 31, | ||||||||||||
| 2009 | 2008 | 2007 | ||||||||||
| (Dollars in Thousands) | ||||||||||||
| Current |
$ | (3,183 | ) | $ | 2,597 | $ | 8,822 | |||||
| Deferred |
10,480 | (4,650 | ) | (1,522 | ) | |||||||
| $ | 7,297 | $ | (2,053 | ) | $ | 7,300 | ||||||
The Company’s income tax expense differs from the amounts computed by applying the federal income tax statutory rates to income before income taxes. A reconciliation of the differences is as follows:
| For the Years Ended December 31, | ||||||||||||
| 2009 | 2008 | 2007 | ||||||||||
| (Dollars in Thousands) | ||||||||||||
| Tax at federal income tax rate |
$ | (12,073 | ) | $ | (2,030 | ) | $ | 7,859 | ||||
| Increase (decrease) resulting from: |
||||||||||||
| Tax-exempt interest |
(485 | ) | (364 | ) | (403 | ) | ||||||
| Goodwill Impairment |
19,058 | - | - | |||||||||
| Other |
797 | 341 | (156 | ) | ||||||||
| Provision for income taxes |
$ | 7,297 | $ | (2,053 | ) | $ | 7,300 | |||||
Net deferred income tax assets (liabilities) of ($2.0 million) and $7.5 million at December 31, 2009 and 2008, respectively, are included in other assets. The components of deferred income taxes are as follows:
| December 31, | |||||||
| 2009 | 2008 | ||||||
| (Dollars in Thousands) | |||||||
| Deferred tax assets: |
|||||||
| Loan loss reserves |
$ | 12,524 | $ | 13,862 | |||
| Deferred compensation |
337 | 355 | |||||
| Deferred gain on interest rate swap |
959 | - | |||||
| Nonaccrual interest |
804 | 411 | |||||
| Other real estate owned |
1,704 | 349 | |||||
| Capitalized costs and deferred gains |
572 | 243 | |||||
| 16,900 | 15,220 | ||||||
| Deferred tax liabilities: |
|||||||
| Depreciation and amortization |
3,679 | 3,231 | |||||
| Intangible assets |
671 | 985 | |||||
| Stock based compensation |
245 | 148 | |||||
| Deferred gain on FDIC-assisted transactions |
11,929 | - | |||||
| Unrealized gain on securities available for sale |
1,806 | 2,209 | |||||
| Unrealized gain on cash flow hedge |
597 | 1,149 | |||||
| 18,927 | 7,722 | ||||||
| Net deferred tax asset (liability) |
$ | (2,027 | ) | $ | 7,498 | ||
F-32
Table of Contents
Index to Financial Statements
NOTES TO CONSOLIDATED FINANCIAL STATEMENTS
| NOTE 14. | SUBORDINATED DEFERRABLE INTEREST DEBENTURES |
During 2005, the Company acquired First National Banc Statutory Trust I, a subsidiary of First National Banc, Inc., whose sole purpose was to issue $5,000,000 principal amount of Trust Preferred Securities at a rate per annum equal to the 3-Month LIBOR plus 2.80% (3.05% at December 31, 2009) through a pool sponsored by a national brokerage firm. The Trust Preferred Securities have a maturity of 30 years and are redeemable at the Company’s option on any quarterly interest payment date beginning in April, 2009. There are certain circumstances (as described in the Trust agreement) in which the securities may be redeemed within the first five years at the Company’s option. The aggregate principal amount of trust preferred certificates outstanding at December 31, 2009 was $5,000,000. The aggregate principal amount of Debentures outstanding was $5,155,000.
During 2006, the Company formed Ameris Statutory Trust I, issuing trust preferred certificates in the aggregate principal amount of $36,000,000. The related debentures issued by the Company were in the aggregate principal amount of $37,114,000. Both the trust preferred securities and the related Debentures bear interest at 3-Month LIBOR plus 1.63% (1.88% at December 31, 2009). Distributions on the trust preferred securities are paid quarterly, with interest on the Debentures being paid on the corresponding dates. The trust preferred securities mature on December 15, 2036 and are redeemable at the Company’s option beginning September 15, 2011.
Under applicable accounting standards, the assets and liabilities of such trusts, as well as the related income and expenses, are excluded from the Company’s Consolidated Financial Statements. However, the subordinated debentures issued by the Company and purchased by the trusts remain on the Consolidated Balance Sheet. In addition, the related interest expense continues to be included in the Consolidated Statement of Operations. For regulatory capital purposes, the Trust Securities qualify as a component of Tier 1 Capital.
F-33
Table of Contents
Index to Financial Statements
NOTES TO CONSOLIDATED FINANCIAL STATEMENTS
| NOTE 15. | STOCK-BASED COMPENSATION |
The Company awards its employees various forms of stock-based incentives under certain plans approved by its shareholders. Awards granted under the plans may be in the form of qualified or nonqualified stock options, restricted stock, stock appreciation rights (“SARs”), long-term incentive compensation units consisting of cash and common stock, or any combination thereof within the limitations set forth in the plans. The plans provide that the aggregate number of shares of the Company’s common stock which may be subject to award may not exceed 1,785,000 subject to adjustment in certain circumstances to prevent dilution.
All stock options have an exercise price that is equal to the closing fair market value of the Company’s stock on the date the options were granted. Options granted under the plans generally vest over a five year period and have a 10 year maximum term. Most options granted since 2005 contain performance-based vesting conditions.
As of December 31, 2009, the Company has outstanding a total of 87,450 restricted shares granted under the plans as compensation to certain employees. These shares carry dividend and voting rights. Sale of these shares is restricted prior to the date of vesting, which is three to five years from the date of the grant. Shares issued under the plans are recorded at their fair market value on the date of their grant. The compensation expense is recognized on a straight-line basis over the related vesting period. In 2008, certain performance based grants with different vesting structures failed to vest and the Company reversed amounts previously expensed amounting to $431,000. In 2009 and 2007, compensation expense related to these grants was approximately $201,000 and $651,000, respectively.
It is the Company’s policy to issue new shares for stock option exercises and restricted stock rather than issue treasury shares. The Company recognizes stock-based compensation expense on a straight-line basis over the options’ related vesting term. Stock-based compensation expense related to stock options was approximately $500,000, $334,000 and $444,000 for 2009, 2008 and 2007, respectively.
The weighted-average grant date fair value of non-performance based options granted during 2008 was $3.40 per share. No non-performance based options were issued during 2009 or 2007. As of December 31, 2009, there was approximately $136,000 of total unrecognized compensation cost related to nonvested share-based compensation arrangements for non-performance-based options. That cost is expected to be recognized over a weighted-average period of approximately one year. The total intrinsic value of those shares vested during the year ended December 31, 2009 and 2008 was $0 and $69,000, respectively.
A summary of the activity of non-performance based and performance based options as of December 31, 2009 is presented below:
| Non-Performance Based | Performance Based | |||||||||||||||||||||
| Shares | Weighted- Average Exercise Price |
Weighted Average Contractual Term |
Aggregate Intrinsic Value $ (000) |
Shares | Weighted- Average Exercise Price |
Weighted Average Contractual Term |
Aggregate Intrinsic Value $ (000) | |||||||||||||||
| Under option, beginning of year |
291,686 | $ | 12.72 | 374,445 | $ | 20.40 | ||||||||||||||||
| Granted |
- | - | 126,930 | 7.24 | ||||||||||||||||||
| Exercised |
- | - | - | - | ||||||||||||||||||
| Forfeited |
(33,703 | ) | 11.32 | (21,832 | ) | 21.69 | ||||||||||||||||
| Under option, end of year |
257,984 | $ | 12.90 | 4.44 | $ | - | 479,543 | $ | 16.86 | 7.20 | $ | 29 | ||||||||||
| Exercisable at end of year |
227,603 | $ | 12.65 | - | $ | - | 311,724 | $ | 18.95 | - | $ | 6 | ||||||||||
F-34
Table of Contents
Index to Financial Statements
NOTES TO CONSOLIDATED FINANCIAL STATEMENTS
| NOTE 15. | STOCK-BASED COMPENSATION (Continued) |
Additional information pertaining to non-performance based options outstanding at December 31, 2009 is as follows:
| Options Outstanding | Options Exercisable | |||||||||||
| Range of Exercise Prices |
Number Outstanding |
Weighted- Average Contractual Life in Years |
Weighted- Average Exercise Price |
Number Outstanding |
Weighted- Average Exercise Price | |||||||
| $8.12 – 11.95 | 103,738 | 1.44 | $ | 9.93 | 103,245 | $ | 9.98 | |||||
| $11.96 – 16.62 | 154,246 | 6.45 | $ | 15.10 | 124,358 | $ | 15.10 | |||||
| 257,984 | 227,603 | |||||||||||
The weighted-average grant date fair value of options granted was $1.88, $3.01 and $5.53 during 2009, 2008 and 2007, respectively. As of December 31, 2009, there was approximately $715,000 of unrecognized compensation cost related to nonvested share-based compensation arrangements granted related to performance-based options. That cost is expected to be recognized over a weighted-average period of approximately 3 years.
Additional information pertaining to performance-based options outstanding at December 31, 2009 is as follows:
| Options Outstanding | Options Exercisable | |||||||||||
| Range of Exercise Prices |
Number Outstanding |
Weighted- Average Contractual Life in Years |
Weighted- Average Exercise Price |
Number Outstanding |
Weighted- Average Exercise Price | |||||||
| $5.62 – 13.64 | 137,085 | 9.00 | $ | 7.72 | 29,448 | $ | 8.13 | |||||
| $17.73 – 28.10 | 342,458 | 6.48 | $ | 20.51 | 282,276 | $ | 20.08 | |||||
| 479,543 | 311,724 | |||||||||||
F-35
Table of Contents
Index to Financial Statements
NOTES TO CONSOLIDATED FINANCIAL STATEMENTS
| NOTE 15. | STOCK-BASED COMPENSATION (Continued) |
The fair value of each stock-based compensation grant is estimated on the date of grant using the Black-Scholes option-pricing model with the following assumptions:
| Years Ended December 31, | |||||||||
| 2009 | 2008 | 2007 | |||||||
| Dividend yield |
2.60-3.50 | % | 3.69-4.61 | % | 1.99-2.52 | % | |||
| Expected life |
8 years | 8 years | 8 years | ||||||
| Expected volatility |
29.18-36.17 | % | 27.10-32.80 | % | 18.09-25.02 | % | |||
| Risk-free interest rate |
2.35-2.84 | % | 3.57-3.88 | % | 4.59-5.20 | % | |||
A summary of the status of the Company’s restricted stock awards as of December 31, 2009 and changes during the year then ended is presented below:
| Shares | Weighted- Average Grant-Date Fair Value | |||||
| Nonvested shares at January 1, 2009 |
16,100 | $ | 22.57 | |||
| Granted |
89,250 | 6.97 | ||||
| Vested |
(9,900 | ) | 21.58 | |||
| Forfeited |
(8,000 | ) | 8.63 | |||
| Nonvested shares at December 31, 2009 |
87,450 | $ | 8.04 | |||
The balance of unearned compensation related to restricted stock grants as of December 31, 2009 and 2008 was approximately $833,000 and $223,000, respectively.
F-36
Table of Contents
Index to Financial Statements
NOTES TO CONSOLIDATED FINANCIAL STATEMENTS
| NOTE 16. | DERIVATIVE INSTRUMENTS AND HEDGING ACTIVITIES |
During 2006, the Company purchased two derivative instruments to minimize the volatility in its net interest margin due to a reduction in the prime rate and the resulting effect on interest income from its variable rate loan portfolio. Each instrument had a notional amount of $35 million, indexed to the prime rate with a 7% strike rate. One instrument matured in August, 2009 while the other instrument matures in August, 2011. The premium paid for these contracts was $497,000.
These contracts are classified as cash flow hedges of an exposure to changes in the cash flow of a recognized asset. At December 31, 2009, the fair value of the remaining instrument totaled $1.9 million, compared to $3.7 million at December 31, 2008. As a cash flow hedge, the change in fair value of a hedge that is deemed to be highly effective is recognized in other comprehensive income and the portion deemed to be ineffective is recognized in earnings. As of December 31, 2009, the hedge is deemed to be highly effective.
| NOTE 17. | COMMITMENTS AND CONTINGENT LIABILITIES |
Loan Commitments
The Company is a party to financial instruments with off-balance-sheet risk in the normal course of business to meet the financing needs of its customers. These financial instruments include commitments to extend credit and standby letters of credit. They involve, to varying degrees, elements of credit risk and interest rate risk in excess of the amount recognized in the balance sheets.
The Company’s exposure to credit loss is represented by the contractual amount of those instruments. The Company uses the same credit policies in making commitments and conditional obligations as it does for on-balance-sheet instruments. A summary of the Company’s commitments is as follows:
| December 31, | ||||||
| 2009 | 2008 | |||||
| (Dollars in Thousands) | ||||||
| Commitments to extend credit |
$ | 143,868 | $ | 159,114 | ||
| Financial standby letters of credit |
3,921 | 6,358 | ||||
| $ | 147,789 | $ | 165,472 | |||
Commitments to extend credit are agreements to lend to a customer as long as there is no violation of any condition established in the contract. Commitments generally have fixed expiration dates or other termination clauses and may require payment of a fee. Since many of the commitments are expected to expire without being drawn upon, the total commitment amounts do not necessarily represent future cash requirements. The amount of collateral obtained, if deemed necessary by the Company upon extension of credit, is based on management’s credit evaluation of the customer.
F-37
Table of Contents
Index to Financial Statements
NOTES TO CONSOLIDATED FINANCIAL STATEMENTS
| NOTE 17. | COMMITMENTS AND CONTINGENT LIABILITIES (Continued) |
Loan Commitments (Continued)
Standby letters of credit are conditional commitments issued by the Company to guarantee the performance of a customer to a third party. Those guarantees are primarily issued to support public and private borrowing arrangements. The credit risk involved in issuing letters of credit is essentially the same as that involved in extending loans to customers. Collateral is required in instances which the Company deems necessary. The Company has not been required to perform on any material financial standby letters of credit and the Company has not incurred any losses on financial standby letters of credit for the years ended December 31, 2009 and 2008.
At December 31, 2009, the Company had guaranteed the debt of certain non-executive officers’ liabilities at another financial institution totaling approximately $490,000. These guarantees represent the available credit line of those certain officers for the purchase of Company stock. Any stock purchased under this program will be assigned to the Company and held in safekeeping. The Company has not been required to perform on any of these guarantees for the year ended December 31, 2009.
Contingencies
In the normal course of business, the Company is involved in various legal proceedings. In the opinion of management, any liability resulting from such proceedings would not have a material effect on the Company’s financial statements.
F-38
Table of Contents
Index to Financial Statements
NOTES TO CONSOLIDATED FINANCIAL STATEMENTS
| NOTE 18. | REGULATORY MATTERS |
The Bank is subject to certain restrictions on the amount of dividends that may be declared without prior regulatory approval. At December 31, 2009, no amounts of retained earnings were available for dividend declaration without regulatory approval.
The Company and the Bank are subject to various regulatory capital requirements administered by the federal banking agencies. Failure to meet minimum capital requirements can initiate certain mandatory, and possibly additional discretionary, actions by regulators that, if undertaken, could have a direct material effect on the Company’s and Bank’s financial statements. Under capital adequacy guidelines and the regulatory framework for prompt corrective action, the Company and the Bank must meet specific capital guidelines that involve quantitative measures of their assets, liabilities and certain off-balance-sheet items as calculated under regulatory accounting practices. Capital amounts and classification are also subject to qualitative judgments by the regulators about components, risk weightings and other factors.
Quantitative measures established by regulation to ensure capital adequacy require the Company and the Bank to maintain minimum amounts and ratios of total and Tier I capital, as defined by the regulations, to risk-weighted assets, as defined, and of Tier I capital to average assets, as defined. Management believes, as of December 31, 2009 and 2008, the Company and the Bank met all capital adequacy requirements to which they are subject.
As of December 31, 2009, the most recent notification from the regulatory authorities categorized the Bank as well capitalized under the regulatory framework for prompt corrective action. To be categorized as well capitalized, the Bank must maintain minimum total risk-based, Tier I risk-based and Tier I leverage ratios as set forth in the following table. There are no conditions or events since that notification that management believes have changed the Bank’s category. Prompt corrective action provisions are not applicable to bank holding companies.
The Company’s and Bank’s actual capital amounts and ratios are presented in the following table.
| Actual | For Capital Adequacy Purposes |
To Be Well Capitalized Under Prompt Corrective Action Provisions |
||||||||||||||||
| Amount | Ratio | Amount | Ratio | Amount | Ratio | |||||||||||||
| As of December 31, 2009 | (Dollars in Thousands) | |||||||||||||||||
| Total Capital to Risk Weighted Assets |
||||||||||||||||||
| Consolidated |
$ | 245,615 | 14.79 | % | $ | 132,866 | 8.00 | % | ---N/A--- | |||||||||
| Ameris Bank |
$ | 240,870 | 14.53 | % | $ | 132,588 | 8.00 | % | $ | 165,735 | 10.00 | % | ||||||
| Tier I Capital to Risk Weighted Assets: |
||||||||||||||||||
| Consolidated |
$ | 224,670 | 13.53 | % | $ | 66,483 | 4.00 | % | ---N/A--- | |||||||||
| Ameris Bank |
$ | 219,967 | 13.27 | % | $ | 66,294 | 4.00 | % | $ | 165,735 | 10.00 | % | ||||||
| Tier I Capital to Average Assets: |
||||||||||||||||||
| Consolidated |
$ | 224,670 | 9.35 | % | $ | 96,122 | 4.00 | % | ---N/A--- | |||||||||
| Ameris Bank |
$ | 219,967 | 9.61 | % | $ | 91,579 | 4.00 | % | $ | 228,946 | 10.00 | % | ||||||
| Actual | For Capital Adequacy Purposes |
To Be Well Capitalized Under Prompt Corrective Action Provisions |
||||||||||||||||
| Amount | Ratio | Amount | Ratio | Amount | Ratio | |||||||||||||
| As of December 31, 2008 | (Dollars in Thousands) | |||||||||||||||||
| Total Capital to Risk Weighted Assets |
||||||||||||||||||
| Consolidated |
$ | 238,069 | 13.25 | % | $ | 143,740 | 8.00 | % | ---N/A--- | |||||||||
| Ameris Bank |
$ | 188,594 | 10.41 | % | $ | 144,933 | 8.00 | % | $ | 181,166 | 10.00 | % | ||||||
| Tier I Capital to Risk Weighted Assets: |
||||||||||||||||||
| Consolidated |
$ | 215,400 | 11.99 | % | $ | 71,860 | 4.00 | % | ---N/A--- | |||||||||
| Ameris Bank |
$ | 165,748 | 9.15 | % | $ | 72,458 | 4.00 | % | $ | 108,687 | 6.00 | % | ||||||
| Tier I Capital to Average Assets: |
||||||||||||||||||
| Consolidated |
$ | 215,400 | 9.42 | % | $ | 91,465 | 4.00 | % | ---N/A-- | |||||||||
| Ameris Bank |
$ | 165,748 | 7.25 | % | $ | 91,447 | 4.00 | % | $ | 114,309 | 5.00 | % | ||||||
F-39
Table of Contents
Index to Financial Statements
NOTES TO CONSOLIDATED FINANCIAL STATEMENTS
| NOTE 19. | FAIR VALUE OF FINANCIAL INSTRUMENTS |
Effective January 1, 2008, the Company adopted “Fair Value Measurements” which defines fair value, establishes a framework for measuring fair value, and expands disclosures about fair value measurements has been applied prospectively as of the beginning of the period and defines fair value as the price that would be received to sell an asset or paid to transfer a liability in an orderly transaction between market participants at the measurement date, and also establishes a fair value hierarchy which requires an entity to maximize the use of observable inputs and minimize the use of unobservable inputs when measuring fair value. The standard describes three levels of inputs that may be used to measure fair value:
Level 1 - Quoted prices in active markets for identical assets or liabilities.
Level 2 - Observable inputs other than Level 1 prices, such as quoted prices for similar assets or liabilities; quoted prices in active markets that are not active; or other inputs that are observable or can be corroborated by observable market data for substantially the full term of the assets or liabilities.
Level 3 - Unobservable inputs that are supported by little or no market activity and that are significant to the fair value of the assets or liabilities.
Additionally, in accordance with “Disclosures about Fair Value of Financial Instruments”, certain financial instruments and all nonfinancial instruments are excluded from its disclosure requirements requires the disclosure of information about financial instruments, whether or not recognized on the face of the balance sheet, for which it is practical to estimate that value. Where quoted prices are not available, fair values are based on estimates using discounted cash flows and other valuation techniques. The use of discounted cash flows are significantly affected by the estimates of future cash flows and discount rates. The following disclosures are not a calculation of the liquidation value of the Company, but rather a good faith estimate of the increase or decrease in value of financial instruments held by the Company.
The following methods and assumptions were used by the Company in estimating the fair value of its financial instruments and other accounts recorded based on their fair value:
Cash, Due From Banks, Interest-Bearing Deposits in Banks and Federal Funds Sold: The carrying amount of cash, due from banks , interest-bearing deposits in banks and federal funds sold approximates fair value.
Securities Available For Sale: The fair value of securities available for sale is determined by various valuation methodologies. Where quoted market prices are available in an active market, securities are classified within Level 1 of the valuation hierarchy. If quoted market prices are not available, then fair values are estimated by using pricing models, quoted prices of securities with similar characteristics, or discounted cash flows. Level 2 securities include certain U.S. agency bonds, collateralized mortgage and debt obligations, and certain municipal securities. In certain cases where Level 1 or Level 2 inputs are not available, securities are classified within Level 3 of the hierarchy and include certain residual municipal securities and other less liquid securities. Fair value of securities is based on available quoted market prices.
Loans: The carrying amount of variable-rate loans that reprice frequently and have no significant change in credit risk approximates fair value. The fair value of fixed-rate loans is estimated based on discounted contractual cash flows, using interest rates currently being offered for loans with similar terms to borrowers with similar credit quality. The fair value of impaired loans is estimated based on discounted contractual cash flows or underlying collateral values, where applicable. A loan is determined to be impaired if the Company believes it is probable that all principal and interest amounts due according to the terms of the note will not be collected as scheduled. The fair value of impaired loans is determined in accordance with “Accounting by Creditors for Impairment of a Loan” and generally results in a specific reserve established through a charge to the provision for loan losses. Losses on impaired loans are charged to the allowance when management believes the uncollectability of a loan is confirmed. Management has determined that the majority of impaired loans are Level 2 assets due to the extensive use of market appraisals. To the extent that market appraisals or other methods do not produce reliable determinations of fair value, these assets are deemed to be Level 3.
F-40
Table of Contents
Index to Financial Statements
NOTES TO CONSOLIDATED FINANCIAL STATEMENTS
| NOTE 19. | FAIR VALUE OF FINANCIAL INSTRUMENTS (Continued) |
Deposits: The carrying amount of demand deposits, savings deposits and variable-rate certificates of deposits approximates fair value. The fair value of fixed-rate certificates of deposits is estimated based on discounted contractual cash flows using interest rates currently being offered for certificates of similar maturities.
Repurchase Agreements and/or Other Borrowings: The carrying amount of variable rate borrowings and securities sold under repurchase agreements approximates fair value. The fair value of fixed rate other borrowings is estimated based on discounted contractual cash flows using the current incremental borrowing rates for similar type borrowing arrangements.
Subordinated Deferrable Interest Debentures: The carrying amount of the Company’s variable rate trust preferred securities approximates fair value.
Off-Balance-Sheet Instruments: The carrying amount of commitments to extend credit and standby letters of credit approximates fair value. The carrying amount of the off-balance-sheet financial instruments is based on fees charged to enter into such agreements.
Derivatives – The Company’s current hedging strategies involve utilizing interest rate floors. The fair value of derivatives is recognized as assets or liabilities in the financial statements. The accounting for the changes in the fair value of a derivative depends on the intended use of the derivative instrument at inception. As of December 31, 2009, the Company had cash flow hedges with a notional amount of $35 million for the purpose of converting floating rate assets to fixed rate.
Other Real Estate Owned – The fair value of other real estate owned (“OREO”) is determined using certified appraisals that value the property at its highest and best uses by applying traditional valuation methods common to the industry. The Company does not hold any OREO for profit purposes and all other real estate is actively marketed for sale. In most cases, management has determined that additional write-downs are required beyond what is calculable from the appraisal to carry the property at levels that would attract buyers. Because this additional write-down is not based on observable inputs, management has determined that other real estate owned should be classified as Level 3.
Covered Assets – Covered assets include loans and other real estate owned on which any losses would be covered by loss-sharing agreements with the FDIC. Covered loans and other real estate owned totaled $137.2 million and $9.3 million at December 31, 2009, respectively. Management initially valued these assets at fair value using mostly unobservable inputs and, as such, has classified these assets as level 3.
F-41
Table of Contents
Index to Financial Statements
NOTES TO CONSOLIDATED FINANCIAL STATEMENTS
| NOTE 19. | FAIR VALUE OF FINANCIAL INSTRUMENTS (Continued) |
The following table presents the fair value measurements of assets and liabilities measured at fair value on a recurring basis and the level within the fair value hierarchy in which the fair value measurements fall as of December 31, 2009 and 2008:
| Fair Value Measurements on a Recurring Basis As of December 31, 2009 | ||||||||||||
| Fair Value | Quoted Prices in Active Markets for Identical Assets (Level 1) |
Significant Other Observable Inputs (Level 2) |
Significant Unobservable Inputs (Level 3) | |||||||||
| (Dollars in Thousands) | ||||||||||||
| Securities available for sale |
$ | 245,556 | $ | - | $ | 243,556 | $ | 2,000 | ||||
| Derivative financial instruments |
1,882 | - | 1,882 | - | ||||||||
| Total recurring assets at fair value |
$ | 247,438 | $ | - | $ | 245,438 | $ | 2,000 | ||||
| Fair Value Measurements on a Recurring Basis As of December 31, 2008 | ||||||||||||
| Fair Value | Quoted Prices in Active Markets for Identical Assets (Level 1) |
Significant Other Observable Inputs (Level 2) |
Significant Unobservable Inputs (Level 3) | |||||||||
| (Dollars in Thousands) | ||||||||||||
| Securities available for sale |
$ | 367,894 | $ | 5,031 | $ | 360,863 | $ | 2,000 | ||||
| Derivative financial instruments |
3,697 | - | 3,697 | - | ||||||||
| Total recurring assets at fair value |
$ | 371,591 | $ | 5,031 | $ | 364,560 | $ | 2,000 | ||||
Following is a description of the valuation methodologies used for instruments measured at fair value on a nonrecurring basis, as well as the general classification of such instruments pursuant to the valuation hierarchy for the year ended 2009 and 2008:
| Fair Value Measurements on a Nonrecurring Basis As of December 31, 2009 | ||||||||||||
| Fair Value | Quoted Prices in Active Markets for Identical Assets (Level 1) |
Significant Other Observable Inputs (Level 2) |
Significant Unobservable Inputs (Level 3) | |||||||||
| (Dollars in Thousands) | ||||||||||||
| Impaired loans carried at fair value |
$ | 96,131 | $ | - | $ | 96,131 | $ | - | ||||
| Other real estate owned |
23,316 | - | - | 23,316 | ||||||||
| Covered assets |
146,585 | - | - | 146,585 | ||||||||
| Total nonrecurring assets at fair value |
$ | 266,032 | $ | - | $ | 96,131 | $ | 169,901 | ||||
F-42
Table of Contents
Index to Financial Statements
NOTES TO CONSOLIDATED FINANCIAL STATEMENTS
NOTE 19. FAIR VALUE OF FINANCIAL INSTRUMENTS (Continued)
| Fair Value Measurements on a Nonrecurring Basis As of December 31, 2008 | ||||||||||||
| Fair Value | Quoted Prices in Active Markets for Identical Assets (Level 1) |
Significant Other Observable Inputs (Level 2) |
Significant Unobservable Inputs (Level 3) | |||||||||
| (Dollars in Thousands) | ||||||||||||
| Impaired loans carried at fair value |
$ | 65,414 | $ | $ | 64,027 | $ | 1,387 | |||||
| Other real estate owned |
4,742 | 4,742 | ||||||||||
| Total nonrecurring assets at fair value |
$ | 70,156 | $ | - | $ | 68,769 | $ | 1,387 | ||||
F-43
Table of Contents
Index to Financial Statements
NOTES TO CONSOLIDATED FINANCIAL STATEMENTS
| NOTE 19. | FAIR VALUE OF FINANCIAL INSTRUMENTS (Continued) |
Below is the Company’s reconciliation of Level 3 assets recorded at fair value on a recurring basis as of December 31, 2009. Gains or losses on impaired loans are recorded in the provision for loan losses.
| Investment Securities Available for Sale |
Impaired Loans |
||||||
| (Dollars in Thousands) | |||||||
| Beginning balance, January 1, 2009 |
$ | 2,000 | $ | 1,387 | |||
| Total gains/(losses) included in net income |
- | - | |||||
| Purchases, sales, issuances, and settlements, net |
- | (1,387 | ) | ||||
| Transfers in or out of Level 3 |
- | ||||||
| Ending balance, December 31, 2009 |
$ | 2,000 | $ | - | |||
The carrying amount and estimated fair value of the Company’s financial instruments, not shown elsewhere in these financial statements, were as follows:
| December 31, 2009 | December 31, 2008 | |||||||||||
| Carrying Amount |
Fair Value |
Carrying Amount |
Fair Value | |||||||||
| (Dollars in Thousands) | ||||||||||||
| Financial assets: |
||||||||||||
| Loans, net |
$ | 1,548,597 | $ | 1,561,183 | $ | 1,656,125 | $ | 1,671,499 | ||||
| Financial liabilities: |
||||||||||||
| Deposits |
2,123,116 | 2,125,834 | 2,013,525 | 2,019,964 | ||||||||
| Other borrowings |
2,000 | 2,040 | 72,000 | 71,545 | ||||||||
F-44
Table of Contents
Index to Financial Statements
NOTES TO CONSOLIDATED FINANCIAL STATEMENTS
| NOTE 20. | CONDENSED FINANCIAL INFORMATION OF AMERIS BANCORP (PARENT COMPANY ONLY) |
CONDENSED BALANCE SHEETS
DECEMBER 31, 2009 AND 2008
(Dollars in Thousands)
| 2009 | 2008 | |||||
| Assets |
||||||
| Cash and due from banks |
$ | 6,233 | $ | 51,656 | ||
| Investment in subsidiaries |
228,522 | 230,708 | ||||
| Other assets |
3,403 | 5,833 | ||||
| Total assets |
$ | 238,158 | $ | 288,197 | ||
| Liabilities |
||||||
| Other borrowings |
$ | - | $ | 5,000 | ||
| Other liabilities |
925 | 1,569 | ||||
| Subordinated deferrable interest debentures |
42,269 | 42,269 | ||||
| Total liabilities |
43,194 | 48,838 | ||||
| Stockholders’ equity |
194,964 | 239,359 | ||||
| Total liabilities and stockholders’ equity |
$ | 238,158 | $ | 288,197 | ||
F-45
Table of Contents
Index to Financial Statements
NOTES TO CONSOLIDATED FINANCIAL STATEMENTS
| NOTE 20. | CONDENSED FINANCIAL INFORMATION OF AMERIS BANCORP (PARENT COMPANY ONLY) (Continued) |
CONDENSED STATEMENTS OF OPERATIONS
YEARS ENDED DECEMBER 31, 2009, 2008 AND 2007
(Dollars in Thousands)
| 2009 | 2008 | 2007 | |||||||||
| Income |
|||||||||||
| Dividends from subsidiaries |
$ | - | $ | 5,700 | $ | 9,000 | |||||
| Fee income from subsidiaries |
- | - | - | ||||||||
| Other income |
221 | 130 | 277 | ||||||||
| Total income |
221 | 5,830 | 9,277 | ||||||||
| Expense |
|||||||||||
| Interest |
1,766 | 2,404 | 3,534 | ||||||||
| Other expense |
757 | (87 | ) | 1,255 | |||||||
| Total expense |
2,523 | 2,317 | 4,789 | ||||||||
| Income/(loss) before income tax benefits and equity in undistributed earnings of subsidiaries |
(2,302 | ) | 3,513 | 4,488 | |||||||
| Income tax benefits |
683 | 626 | 1,526 | ||||||||
| Income before equity in undistributed earnings of subsidiaries |
(1,619 | ) | 4,139 | 6,014 | |||||||
| Equity in undistributed earnings (loss) of subsidiaries |
(40,170 | ) | (8,055 | ) | 9,139 | ||||||
| Net (loss)/ income |
$ | (41,789 | ) | $ | (3,916 | ) | $ | 15,153 | |||
| Preferred stock dividend |
3,161 | 328 | - | ||||||||
| Net income available to common shareholders |
$ | (44,950 | ) | $ | (4,244 | ) | $ | 15,153 | |||
F-46
Table of Contents
Index to Financial Statements
NOTES TO CONSOLIDATED FINANCIAL STATEMENTS
| NOTE 20. | CONDENSED FINANCIAL INFORMATION OF AMERIS BANCORP (PARENT COMPANY ONLY) (Continued) |
CONDENSED STATEMENTS OF CASH FLOWS
YEARS ENDED DECEMBER 31, 2009, 2008 AND 2007
(Dollars in Thousands)
| 2009 | 2008 | 2007 | ||||||||||
| OPERATING ACTIVITIES |
||||||||||||
| Net (loss)/income |
$ | (41,789 | ) | $ | (3,916 | ) | $ | 15,153 | ||||
| Adjustments to reconcile net (loss)/income to net cash provided by operating activities: |
||||||||||||
| Stock-based compensation expense |
701 | (97 | ) | 1,095 | ||||||||
| Undistributed (earnings)/losses of subsidiaries |
40,170 | 8,055 | (9,139 | ) | ||||||||
| Increase (decrease) in interest payable |
16 | (37 | ) | 106 | ||||||||
| Increase (decrease) in tax receivable |
3,521 | (1,373 | ) | (1,658 | ) | |||||||
| Provision for deferred taxes |
866 | 176 | 61 | |||||||||
| Accretion of discount on preferred stock |
524 | 53 | - | |||||||||
| (Increase) decrease in due from subsidiaries |
81 | (122 | ) | (40 | ) | |||||||
| Other operating activities |
(536 | ) | (1,053 | ) | (2,071 | ) | ||||||
| Total adjustments |
45,343 | 5,602 | (11,646 | ) | ||||||||
| Net cash provided by operating activities |
3,554 | 1,686 | 3,507 | |||||||||
| INVESTING ACTIVITIES |
||||||||||||
| Contribution of capital to subsidiary bank |
(40,000 | ) | - | - | ||||||||
| Net cash used in investing activities |
(40,000 | ) | - | - | ||||||||
| FINANCING ACTIVITIES |
||||||||||||
| Repayments of other borrowings and debentures |
(5,000 | ) | - | - | ||||||||
| Purchase of treasury shares |
(25 | ) | (18 | ) | (176 | ) | ||||||
| Dividends paid preferred stock |
(2,583 | ) | - | - | ||||||||
| Cash dividends paid common stock |
(1,358 | ) | (5,155 | ) | (7,510 | ) | ||||||
| Cash paid for fractional shares |
(17 | ) | - | - | ||||||||
| Proceeds allocated to issuance of preferred stock |
- | 48,975 | - | |||||||||
| Proceeds allocated to issuance of warrant |
- | 3,025 | - | |||||||||
| Proceeds from exercise of stock options |
6 | 334 | 176 | |||||||||
| Net cash used in financing activities |
(8,977 | ) | 47,161 | (7,510 | ) | |||||||
| Net increase (decrease) in cash and due from banks |
(45,423 | ) | 48,847 | (4,003 | ) | |||||||
| Cash and due from banks at beginning of year |
51,656 | 2,809 | 6,812 | |||||||||
| Cash and due from banks at end of year |
$ | 6,233 | $ | 51,656 | $ | 2,809 | ||||||
| SUPPLEMENTAL DISCLOSURE OF CASH FLOW INFORMATION |
||||||||||||
| Cash paid during the year for interest |
$ | 1,766 | $ | 2,441 | $ | 3,428 | ||||||
F-47