Attached files
| file | filename |
|---|---|
| EX-32.01 - VISION HYDROGEN Corp | ex32-1.htm |
| EX-31.02 - VISION HYDROGEN Corp | ex31-2.htm |
| EX-31.01 - VISION HYDROGEN Corp | ex31-1.htm |
| EX-21.01 - VISION HYDROGEN Corp | ex21-01.htm |
UNITED STATES
SECURITIES AND EXCHANGE COMMISSION
WASHINGTON, D.C. 20549
FORM 10-K
ANNUAL REPORT PURSUANT TO SECTION 13 OR 15(d) OF THE SECURITIES EXCHANGE ACT OF 1934
For the Fiscal Year Ended December 31, 2017
Commission File Number 000-55802
H/CELL ENERGY CORPORATION
(Exact name of registrant as specified in its charter)
| Nevada | 47-4823945 | |
| (State
or other jurisdiction of incorporation or organization) |
(IRS
Employer Identification No.) |
| 97
River Road Flemington, New Jersey |
08822 | (908) 837-9097 | ||
| (Address of principal executive office) | (Zip Code) | (Registrant’s telephone number, including area code) |
Securities registered pursuant to Section 12(b) of the Act: None
Securities registered pursuant to Section 12(g) of the Act: Common Stock, $0.0001 par value
Indicate by check mark if the registrant is a well-known seasoned issuer, as defined by Rule 405 of the Securities Act. Yes [ ] No [X]
Indicate by check mark if the registrant is not required to file reports pursuant to Section 13 or 15(d) of the Act. Yes [ ] No [X]
Indicate by check mark whether the registrant (1) has filed all reports required to be filed by Section 13 or 15(d) of the Securities Exchange Act of 1934 during the preceding 12 months (or for such shorter period that the registrant was required to file such reports), and (2) has been subject to such filing requirements for the past 90 days. Yes [X] No [ ]
Indicate by check mark whether the registrant has submitted electronically and posted on its corporate Web site, if any, every Interactive Data File required to be submitted and posted pursuant to Rule 405 of Regulation S-T (§ 229.405 of this chapter) during the preceding 12 months (or for such shorter period that the registrant was required to submit and post such files). Yes [X] No [ ]
Indicate by check mark if disclosure of delinquent filers pursuant to Item 405 of Regulation S-K (§229.405 of this chapter) is not contained herein, and will not be contained, to the best of the registrant’s knowledge, in definitive proxy or information statements incorporated by reference in Part III of this Form 10-K or any amendment to this Form 10-K. [X]
Indicate by check mark whether the registrant is a large accelerated filer, an accelerated filer, a non-accelerated filer, smaller reporting company or an emerging growth company. See the definitions of “large accelerated filer,” “accelerated filer,” “smaller reporting company” and “emerging growth company” in Rule 12b-2 of the Exchange Act.
| Large accelerated filer | [ ] | Accelerated filer | [ ] |
| Non-accelerated filer | [ ] (Do not check if a smaller reporting company) | Smaller reporting company | [X] |
| Emerging growth company | [X] |
If an emerging growth company, indicate by check mark if the registrant has elected not to use the extended transition period for complying with any new or revised financial accounting standards provided pursuant to Section 13 (a) of the Exchange Act. [ ]
Indicate by check mark whether the registrant is a shell company (as defined in Rule 12b-2 of the Exchange Act).Yes [ ] No [X]
The aggregate market value of the voting common equity held by non-affiliates as of June 30, 2017, based on the closing sales price of the common stock as quoted on the OTCQB was $889,295. For purposes of this computation, all officers, directors, and 5 percent beneficial owners of the registrant are deemed to be affiliates. Such determination should not be deemed an admission that such directors, officers, or 5 percent beneficial owners are, in fact, affiliates of the registrant.
As of March 30, 2018, there were 7,486,024 shares of registrant’s common stock outstanding.
TABLE OF CONTENTS
| 2 |
This Annual Report on Form 10-K (including the section regarding Management’s Discussion and Analysis of Financial Condition and Results of Operations) contains forward-looking statements regarding our business, financial condition, results of operations and prospects. Words such as “expects,” “anticipates,” “intends,” “plans,” “believes,” “seeks,” “estimates” and similar expressions or variations of such words are intended to identify forward-looking statements, but are not deemed to represent an all-inclusive means of identifying forward-looking statements as denoted in this Annual Report on Form 10-K. Additionally, statements concerning future matters are forward-looking statements.
Although forward-looking statements in this Annual Report on Form 10-K reflect the good faith judgment of our Management, such statements can only be based on facts and factors currently known by us. Consequently, forward-looking statements are inherently subject to risks and uncertainties and actual results and outcomes may differ materially from the results and outcomes discussed in or anticipated by the forward-looking statements. Factors that could cause or contribute to such differences in results and outcomes include, without limitation, those specifically addressed under the heading “Risks Factors” below, as well as those discussed elsewhere in this Annual Report on Form 10-K. Readers are urged not to place undue reliance on these forward-looking statements, which speak only as of the date of this Annual Report on Form 10-K. We file reports with the Securities and Exchange Commission (“SEC”). You can read and copy any materials we file with the SEC at the SEC’s Public Reference Room at 100 F Street, NE, Washington, DC 20549. You can obtain additional information about the operation of the Public Reference Room by calling the SEC at 1-800-SEC-0330. In addition, the SEC maintains an Internet site (www.sec.gov) that contains reports, proxy and information statements, and other information regarding issuers that file electronically with the SEC, including us.
We undertake no obligation to revise or update any forward-looking statements in order to reflect any event or circumstance that may arise after the date of this Annual Report on Form 10-K. Readers are urged to carefully review and consider the various disclosures made throughout the entirety of this annual Report, which attempt to advise interested parties of the risks and factors that may affect our business, financial condition, results of operations and prospects.
Overview
The Company was formed in August 2015 to expand upon the successful implementation of a solar hydrogen energy system used to completely power a residence or commercial property with clean energy so that it can run independent of the utility grid and also provide energy to the utility grid for monetary credits. This unique system uses renewal energy as its source for hydrogen production. We believe that it is a revolutionary green-energy concept that is safe, renewable, self-sustaining and cost effective. The hydrogen house concept began as a non-profit organization, The Hydrogen House Project, which was founded by Michael Strizki, our Chief Technology Officer. The organization successfully completed four hydrogen house projects, and we are now making the technology available to the general public.
Market Potential
According to the International Energy Agency, renewable energy will represent the largest single source of electricity growth over the next five years. During that time, the share of renewable energy in global power generation will rise to over 26% by 2020 from 22% in 2013. By 2020, the amount of global electricity generation coming from renewable energy will be higher than today’s combined electricity demand of China, India and Brazil. This rapid growth in the use of renewable energy is led by continued expansion in renewable energy technology, the need to lessen dependency on fossil fuel energy, grid-based vulnerabilities and the battle against global warming. According to the U.S. Energy Information Administration, renewable sources of energy accounted for about 10% of total U.S. energy consumption and 15% of electricity generation in 2016. In 2016, approximately $44 billion was spent on renewable energy production in the U.S. alone.
As we are one of the first providers of a hydrogen energy system for residential housing, we are creating this new market within the renewable energy sector. As a result, there is no expectation or basis for any projections of the future of this market. Since the market did not exist previously, there can only be growth, not a decline, and we are, through the use of these statistics, showing that there is a significant market opportunity for hydrogen energy in the renewable energy sector. While the statistics show that there is expected to be a significant growth in renewable energy market, we cannot provide any assurances as to how much, if any, of this market, we will be able to capture.
Technology Overview
There are great benefits to hydrogen energy. The use of hydrogen as a fuel produces no carbon dioxide or other greenhouse gases. Unlike fossil fuels, the only emissions from hydrogen fuel are chemically pure water and oxygen. Hydrogen can be extracted from water using renewable energy from the sun and unlike batteries, hydrogen energy can be stored indefinitely. There is no drilling, fracking or mining required to produce hydrogen energy. We believe it is safe and efficient, and the cleanest energy source on the planet.
| 3 |
In the past, there have been significant obstacles to commercializing hydrogen energy. The most significant being the need to reduce the cost of the production of hydrogen. No matter how productive an energy source may be, it will not be widely adopted if it is prohibitively expensive. As shown in the chart below, the cost of technology required to convert hydrogen gas to electricity has come down significantly over the last 10 years. As technology advances, the cost will continue to decline, making hydrogen energy more affordable.
| Decline in Cost of Technology for a Standard System between 2006 and 2016 | ||||||||||||
| Component | Cost in 2006 | Cost in 2016 | Cost Savings | |||||||||
| Hydrogen Generator | $ | 25,000 | $ | 9,000 | $ | 16,000 | ||||||
| Fuel Cell | $ | 22,000 | $ | 7,000 | $ | 15,000 | ||||||
| Solar Panels (40 275 watt panels) | $ 44,000 ($4.00 per watt) | $ 7,700 ($0.70 per watt) | $ | 36,300 | ||||||||
| TOTAL: | $ | 91,000 | $ | 23,700 | $ | 67,300 | ||||||
In addition to the cost, another challenge involves obtaining zoning and permits to install the system. Each local and state municipality needs to approve the installation. There are no special licenses or permits that are required for a client to store hydrogen on their property. The only permits that are required in connection with a hydrogen energy system are the basic building permits that are required by each town/city/municipality or county in connection with home improvement projects. In connection with the permitting process, we must adhere to safety guidelines involving the safe installation of hydrogen, which are the (i) Occupational Safety and Health Administration’s standards for the storage or delivery of hydrogen gas, and (ii) National Renewable Energy Laboratory’s stationary and portable fuel cells systems codes and standards. We have obtained all zoning and licensing permits for its prior installations, and we believe that such existing documentation will be used for future approvals.
As well, for many people, hydrogen is a new form of energy that needs to be explained and documented, so we need to educate potential customers and overcome any resistance to adoption of new technology. There is also a misperception about hydrogen gas and its storage. There are no additional safety concerns when it comes to the storage of hydrogen gas, as it is similar to storing propane, another gas that is flammable but is in wide use and actively stored in tanks. As more installations are completed, we believe these challenges will become less restrictive.
The HC-1 System
We have succeeded in developing a hydrogen energy system designed to create electricity that is generated by renewable solar energy. We call the solar hydrogen energy system the HC-1. The HC-1 system functions as a self-sustaining renewable energy system. It can be configured as an off grid solution for all your electricity needs or it can be connected to the grid to generate energy credits. Its production of hydrogen is truly eco-friendly, as it is not produced by the use of fossil fuels. It is a system comprised of solar modules, inverters, batteries, a hydrogen generator, a fuel cell and a hydrogen storage tank.
When there is solar power, the solar modules produce renewable energy that is collected through a solar inverter, which charges a bank of batteries through a battery inverter. After the batteries are fully charged, the excess electricity is then combined with water through a hydrogen generator that extracts the hydrogen from the water in a gasified state, which is safely transferred to the hydrogen tank and stored for later use. If the tank is full, excess electricity is sent from the batteries through the battery inverter to the utility grid, which results in energy credits for the system owner.
The HC-1 system is connected to the residential or commercial property through the inverters. The electricity is always provided by the charged batteries. If there is no solar power to charge the batteries, the system keeps the batteries fully charged by using hydrogen stored in the tank, which processed through a fuel cell, creates the electricity. As the system is able to produce hydrogen, that keeps the hydrogen tank full, it provides a continuous supply of clean energy and sustainability that is independent from the grid.
Each HC-1 system is custom designed to accommodate the electrical loads for an end user. The system is completely scalable. Typically, one HC-1 standard system configuration with a solar modules and a large tank for hydrogen storage can provide 40 kWh per day, which is the average amount of electricity utilized by homes in the U.S. If the customer is connected to the electric grid, energy production that is converted to hydrogen in excess of the amount stored in the hydrogen tank is transferred to the local electric company, creating energy credits.
| 4 |
For an HC-1 system installation, the battery inverters and batteries are placed in the interior of the house or building. The hydrogen generator, fuel cell, electronics, pipes and tubing are kept in an outdoor enclosure near the house or building. The solar modules and solar inverters are outdoors and can be configured on the house or building or on land depending on available space. The hydrogen tank is typically underground but can be placed above ground, if necessary.
 |
 |
 | ||
| Solar Modules and Racking | Solar Inverters | Battery Inverters |
 |
 |
 | ||
| Batteries and Enclosure | HC-1 Outdoor Enclosure | Hydrogen Generator |
 |
 |
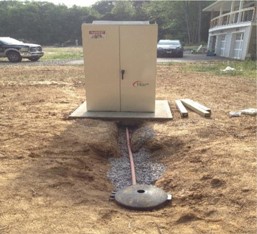 | ||
| Fuel Cell | Hydrogen Tank | Hydrogen Tank Connected |
Standard System Configuration
While the HC-1 system is completely scalable up or down, outlined below is the standard system configuration for a residential installation.
Power Specifications:
| ● | 12,000 watts of electric solar power | |
| ● | 1,200 ampere hour (AH) 48v battery pack power | |
| ● | 1,100 watts of hydrogen fuel cell power |
| 5 |
Component Specifications:
| ● | (40) 320 watt solar modules and racking | |
| ● | (2) 6,000 watt solar inverters | |
| ● | (24) 400 AH 6v valve regulated lead acid batteries | |
| ● | (2) 6,000 watt off grid battery inverters | |
| ● | (1) battery combiner and enclosure | |
| ● | (1) 1,100 watt hydrogen fuel cell | |
| ● | (1) H2 To Go hydrogen generator 600/cc @ 250 psi | |
| ● | (1) communications controller, card and interface | |
| ● | (1) outdoor enclosure | |
| ● | (1) 1,000 gallon hydrogen storage tank |
We do not manufacture any of the components of our HC-1 system. All components are purchased from various suppliers. We do not have any formal relationships with any suppliers as all of the components are readily available off-the-shelf from a number of various suppliers. As such, when we need to obtain components, we are able to source such components at that time and at the best available price.
Each project is customized to meet the particular needs of the client. Various factors, including the size of the residence, the amount of electricity needed to be generated and the amount and intensity of solar availability, all impact the price charged on a project. We anticipate that the anticipated range of prices for a hydrogen energy system is expected to be between $35,000 and $200,000.
Cost Savings
We believe that the HC-1 system has the potential to generate an excellent return on investment over time. However, we acknowledge that the initial cost of adopting a hydrogen energy system today is a significant hurdle for potential customers, as the short-term costs of electricity produced by fossil fuels is significantly cheaper to a customer than from our system, as we anticipate it will take approximately eight and one-half years before a customer has an overall net gain from our system.
For example, according to the Bureau of Labor and Statistics, the average cost in the New York/New Jersey area is 19.1 cents per kWh for the supply of electricity. An average customer in the State of New Jersey using 40 kWh per day spends approximately $300 per month on their electric bill, which includes the cost of the supply of electricity, the costs by the local utility company for the delivery of the electricity and taxes. It would cost the customer approximately $100,000 to buy our hydrogen energy system to provide that same amount of electricity. The owner received a 30% investment tax credit from the federal government for the installation of the renewable energy system. That tax credit results in a savings of $30,000, bringing the cost of the system down to $70,000.
The $300 monthly average electricity bill is eliminated, resulting in annual savings of $3,600, as the system produces all the electricity needed and also generates excess electricity that the system will generate about 18 SRECs per year. Those 18 SRECs are sold for approximately $4,500. As a result, the $70,000 HC-1 system will be repaid to the user in approximately 8.6 years, as the user is achieving annual savings of $8,100. Our calculation of cost savings assumes that the customer has purchased the system outright and not financed the purchase and does not include any maintenance costs that may be required in connection with the system. Further benefits include having a clean renewable energy source that protects our environment, lessening dependence on the aging grid and allowing for a backup power generation system if the grid malfunctions from a natural disaster or cyber-attack.
To date, there have been minimal maintenance costs for the hydrogen electric systems built, averaging less than $300 per year. In addition, there is a minimal amount of water required, no more than five gallons annually to keep the standard system replenished. The estimated life span of the system has not yet been determined at this time, as it is a relatively new application of the technology, but the first system was installed over 10 years ago and continues to properly operate.
The calculation of the number of SRECs generated each year is based upon historical results from the hydrogen electric system built to date. However, we have a very limited sample size, which may not be meaningful or accurate for all potential customers. As we are in our early stage of development with our systems, the potential cost savings may not be proven and we cannot provide any assurances to potential customers that they will achieve cost savings in the future, if at all. In addition, our calculations assume that the price of electricity remains relatively stable. If the price of electricity decreases, then it will take longer for a user to see savings from our system, and if the price of electricity increases, then a user should see savings in a shorter than anticipated timeframe.
| 6 |
Consulting and Installation Services
We will manage all projects directly and will be involved in all aspects of energy infrastructure build-out utilizing existing staff and subcontractors. We provide customers with an initial consultation free of charge, whereby we will review the customer’s location and utility bills to understand their historical energy consumption. We will then generate a proposal outline, indicating what type of system they will need, and what potential tax credits and energy credits they will be entitled to with our HC-1 system.
If the customer wishes to proceed, we are paid $5,000 to conduct a feasibility study, which involves:
| ● | Determining what government authorizations are required to proceed; | |
| ● | Determining what zoning regulations apply to the project site; | |
| ● | Designing site plans and determining what site permits are required; | |
| ● | Conducting an energy audit; | |
| ● | Providing the preliminary system design and drawings; and | |
| ● | Drafting of the project contract. |
Upon execution of the final contract, and payment of the initial fee, we initiate the system installation, which involves:
| ● | Assignment of the project manager; | |
| ● | Completed photovoltaic design with signed and sealed drawings; | |
| ● | Completed electrical distribution and interconnection design with signed and sealed drawings; | |
| ● | Execution and filing of all local construction permits and fees on behalf of the system end user; | |
| ● | Completed public utility interconnection applications; | |
| ● | Submission of all construction liability and professional liability insurance forms; | |
| ● | Confirmation of safety compliance; | |
| ● | Site preparation for implementation; | |
| ● | System installation, completion of all cabling, system start-up, testing and commissioning; | |
| ● | Site restoration; and | |
| ● | Preparation of closeout documents with as-built drawings and photos. |
All project work is performed to specifications that meet local utility requirements as well as domestic and international building codes. Once the system is operational, we remotely receive data to monitor its performance and energy efficiency to confirm the system is functioning as expected. We will also provide any additional maintenance required at standard labor rates. We provide a standard one year warranty on our workmanship. Each of the components has a manufacturer’s warranty that is at least one year in duration. If components need to be replaced after the one year workmanship warranty, we will secure replacement components, under warranty if possible, and we will install at our standard labor rates.
Growth Strategy
Currently, our employees are licensed to install our HC-1 systems in the State of New Jersey and the Commonwealth of Pennsylvania. We intend to aggressively grow our business, both organically and through strategic acquisitions. We intend to continue to acquire companies with licensed contractors in various states and regions, which will allow us to expand the territories in which we can build our systems. These acquired companies will also provide us with a consistent revenue stream, a customer base for marketing our HC-1 systems and technicians.
Pride Subsidiary
On January 31, 2017, we entered into a share exchange agreement (the “Exchange Agreement”) with The Pride Group (QLD) Pty Ltd., an Australian corporation (“Pride”), Turquino Equity LLC (“Turquino”) and Stephen Paul Mullane and Marie Louise Mullane as Trustees of the Mullane Family Trust (together with Turquino, the “Pride Shareholders”). Pursuant to the Exchange Agreement, we acquired all of the issued and outstanding capital stock of Pride from the Pride Shareholders in exchange for an aggregate of 3,800,000 shares of our common stock. Andrew Hidalgo and Matthew Hidalgo, our Chief Executive Officer and Chief Financial Officer, respectively, are each a managing partner of Turquino.
Pride sells, designs, installs and maintains a variety of technology products in the security systems market, including commercial alarm systems, access control, video surveillance, CCTV (closed circuit television)/MATV (master antenna television) systems, biometric technology, audio/visual systems, nurse call systems and public announcement systems. Pride also provides programs for annual maintenance of its products and systems. The division generates approximately half of its revenue from government contracts and the other half from the commercial sector. Pride has recurring annual maintenance revenue of close to AUD $2 million. Pride is a certified security systems integrator for the Queensland Government and has various government contracts in place for installation, maintenance and project services. Pride also works with a number of general contractors as a subcontractor for security systems integration.
| 7 |
Pride Energy Systems is Pride’s clean energy division, which sells, designs, installs and maintains a variety of technology services in the clean energy market, including audits of energy consumption, review of energy and tax credits available, feasibility studies, solar/battery energy system design, zoning and permitting analysis, site design/preparation and restoration, system startup, testing and commissioning and maintenance. The division has just begun to bid for clean energy systems and is focused on the residential, commercial and government sectors. The division is able to utilize the many contacts established in the security systems division.
Australia presents a significant opportunity for us. According to The Clean Energy Australia Report of 2016, renewable energy provided 17.3 % of Australia’s electricity in 2016. This was up from the 14.6 % of electricity from renewable energy the year before. The combination of Australia’s dry climate and latitude is an ideal environment for solar energy production. One in five residential households are turning to solar energy for their electricity needs. Since the Australian outback and outlying islands near Australia having minimal and costly access to the grid, our renewable energy systems are an attractive option.
PVBJ Subsidiary
On February 1, 2018, we acquired PVBJ, Inc. (“PVBJ”) of Downingtown, Pennsylvania for $1 million of HCCC stock and $221,800 in cash. Established in 2008 and historically profitable, PVBJ is well recognized for the design, installation, maintenance and emergency service of environmental systems both in residential and commercial markets. PVBJ is now expanding into renewable energy systems. PVBJ has an extensive and notable customer base.
Completed Projects
As previously mentioned, the hydrogen house concept began as a non-profit organization that completed four hydrogen house projects. Outlined below are descriptions of two of these installations.
Strizki Property, Hopewell, NJ
This was the first solar hydrogen energy system installed in North America. Completed in 2006, the installation is comprised of land-based and roof-based solar modules, 10 above ground tanks each holding 1,000 gallons of gasified hydrogen, six inverters, 48 6v batteries, a hydrogen generator and a fuel cell. At the time, the cost of this system was $185,000 due to the additional solar modules, storage tanks, inverters and batteries, which have all since, come down in price. This 2,800 square foot home can operate completely off the grid but is connected to the grid in order to generate energy credits. The home produces approximately $8,000 in SRECs per year.
De Tiberge Property, Pennington, NJ
This project was completed in 2015 and was comprised of land-based solar modules, one underground tank that holds 1,000 gallons of gasified hydrogen, four solar inverters, four battery inverters, 24 6v batteries, a hydrogen generator and a fuel cell. The sale price for the system was $185,000. The higher sales price reflects a larger solar module installation and multiple inverters. The system was purchased outright by the owner and included a 30% investment tax credit from the federal government. The dwelling is a 2,300 square foot home that had an average monthly electricity bill of $680. With the installation of the solar hydrogen energy system, the property generates approximately $9,000 in SRECs per year and saving approximately $8,000 per year as there is no electricity bill.
Competition
Given the increasing focus on renewable energy to offset the environmental problems caused by fossil fuels, the renewable energy industry is highly competitive, and rapidly evolving. Our major competitors include leading global companies, and other regional and local energy providers.
In the markets where we plan to conduct business, we will compete with many energy producers including electric utilities and large independent power producers. There is also competition from fossil fuel sources such as natural gas and coal, and other renewable energy sources such as solar and wind. The competition depends on the resources available within the specific markets. However, we believe that our unique system allows us to compete favorably with traditional utilities and other renewable energy systems in the regions we service.
| 8 |
Although the cost to produce clean, reliable, renewable energy is becoming more competitive with traditional fossil fuel sources, it generally remains more expensive to produce, and the reliability of its supply is less consistent than traditional fossil fuel. Deregulation and consumer preference are becoming important factors in increasing the development of renewable energy projects.
However, as a newly formed company, substantially all of our competitors have advantages over us in terms of greater operational, financial, technical, management or other resources in particular markets or in general. While hydrogen energy has certain advantages when compared to other power generating technologies, it is one of the newer and less established methods of renewable energy and therefore currently has less market acceptance.
Governmental Regulation
We are subject to laws and regulations affecting our operations in a number of areas. These U.S. and foreign laws and regulations affect the Company’s activities which include, but are not limited to, the areas of zoning, permitting, labor, advertising, consumer protection, real estate, billing, quality of services, intellectual property and ownership and infringement, tax, import and export requirements, anti-corruption, foreign exchange controls and cash repatriation restrictions, data privacy requirements, anti-competition, environmental, and health and safety. In the U.S., our operations are subject to stringent and complex federal, state and local laws and regulations governing the occupational health and safety of our employees and wage regulations. For example, we are subject to the requirements of the federal Occupational Safety and Health Act, as amended, or OSHA, and comparable state laws that protect and regulate employee health and safety. We expend resources to maintain compliance with OSHA requirements and industry best practices.
Regulatory Matters
If a customer wishes to connect our system to the electrical grid in order to generate renewable energy credits, the customer needs to obtain interconnection agreements from the applicable local primary electricity utility. Prior to an installation of the HC-1 system, on behalf of the customer, we will submit an interconnection application with the local public utility company to become a certified renewable energy generator. Approval of the application is based on a balance of historical consumption and the amount of renewable energy to be produced. In almost all cases, interconnection agreements are standard form agreements that have been pre-approved by the local public utility commission or other regulatory body with jurisdiction over interconnection. As such, no additional regulatory approvals are required once interconnection agreements are signed. In our experience, there has not been any cost involved in obtaining an interconnection agreement, but as the requirements are determined on a local basis, it may be possible that some nominal costs are involved in connection with the process.
Government Incentives
We intend to focus on states or countries whose government supports a regulatory standard requiring its utility companies to increase their production of energy from renewable energy sources. These governments have established various incentives and financial mechanisms to accelerate and promote the use of renewable energy sources. Currently, many states comply with regulatory standards including New Jersey, Massachusetts, Pennsylvania, Maryland, Ohio, Delaware, North Carolina, Virginia, Kentucky, West Virginia, Michigan, Indiana, Illinois as well as the District of Columbia. In addition, countries such as the United Kingdom, Australia, Italy, Poland, Sweden, Belgium and Chile have adopted regulatory standards. The list is expanding each year.
If the customer obtains an interconnection agreement from the applicable local primary electricity utility, once the HC-1 system is operational, the HC-1 system end user can eliminate their electric bill and, if in a permissible state, can begin generating SRECs. In certain states, an end user receives one SREC for each 1,000 kWh produced through renewal energy. The customer sells these SRECs to a broker who in turn sells the credits to a utility company so that the utility company can demonstrate their compliance with the regulatory obligations to reduce greenhouse gas emissions. The price per SREC can vary depending on supply and demand, but on average, SRECs sells for $250. Many other states, which may not offer an SREC program, as well as the Federal government, do offer other cash and tax incentives for renewable energy systems.
Employees
As of March 30, 2018, we had 50 full time employees, of which 30 work for Pride, 15 for PVBJ, and five at corporate. We plan to hire employees on an as-needed basis. None of our employees are represented by a labor union, and we believe that our relations with our employees are good.
| 9 |
Risks Related to Our Company and Our Business
We have a short operating history and have generated minimal revenue to date. This makes it difficult to evaluate our future prospects and increases the risk that we will not be successful.
We were incorporated in August 2015, have been operating for less than three years. As a result, we have a very limited operating history for you to evaluate in assessing our future prospects. We are subject to all risks inherent in a developing business enterprise. Our likelihood of continued success must be considered in light of the problems, expenses, difficulties, complications, and delays frequently encountered in connection with the services industry and the competitive and regulatory environment in which we operate. As a new industry, there are few established companies whose business models we can follow. Similarly, there is little information about comparable companies for potential investors to review in making a decision about whether to invest in the Company.
Potential investors should consider, among other factors, our prospects for success in light of the risks and uncertainties generally encountered by companies that, like us, are in their early stages. We may not successfully address these risks and uncertainties or successfully implement our operating strategies. If we fail to do so, it could materially harm our business to the point of having to cease operations and could impair the value of our common stock to the point investors may lose their entire investment.
For as long as we are an emerging growth company, we will not be required to comply with certain reporting requirements, including those relating to accounting standards and disclosure about our executive compensation, that apply to other public companies.
In April 2012, the Jumpstart Our Business Startups Act, or the JOBS Act, was signed into law. The JOBS Act contains provisions that, among other things, relax certain reporting requirements for “emerging growth companies,” including certain requirements relating to accounting standards and compensation disclosure. We are classified as an emerging growth company. For as long as we are an emerging growth company, which may be up to five full fiscal years, unlike other public companies, we will not be required to, among other things, (1) provide an auditor’s attestation report on management’s assessment of the effectiveness of our system of internal control over financial reporting pursuant to Section 404(b) of the Sarbanes Oxley Act of 2002, (2) comply with any new requirements adopted by the Public Company Accounting Oversight Board, or the PCAOB, requiring mandatory audit firm rotation or a supplement to the auditor’s report in which the auditor would be required to provide additional information about the audit and the financial statements of the issuer, (3) comply with any new audit rules adopted by the PCAOB after April 5, 2012 unless the SEC determines otherwise, (4) provide certain disclosure regarding executive compensation required of larger public companies or (5) hold unit holder advisory votes on executive compensation.
Our services have never been provided on a mass market commercial basis, and we do not know whether they will be accepted by the market.
The market for residential or commercial properties to run on hydrogen energy is a relatively new concept and the extent to which its use will be widely adopted is uncertain. To date, we are only aware of four homes, which we installed, that have been successful with this technology, and that is not a large enough market to prove our concept. If our services are not accepted by the market our financial condition will be negatively impacted. The development of a successful market for our proposed operations and our ability to implement our business plan may be affected by a number of factors, many of which are beyond our control. If our proposed operations fail to gain sufficient market acceptance, our business plans, prospects, results of operations and financial condition will be negatively impacted.
If hydrogen energy technology is not suitable for widespread adoption at economically attractive rates of return or if sufficient additional demand for hydrogen energy systems does not develop or takes longer to develop than we anticipate, we may not achieve significant net sales and we may be unable to obtain or sustain profitability.
In comparison to fossil fuel-based electricity generation, the hydrogen energy market is at an early stage of development. If hydrogen technology proves unsuitable for widespread adoption at economically attractive rates of return or if additional demand for hydrogen energy systems fails to develop sufficiently or takes longer to develop than we anticipate, we may be unable to grow our business or generate sufficient net sales to obtain profitability. In addition, demand for hydrogen energy systems in our targeted markets may develop to a lesser extent than we anticipate. Many factors may affect the viability of widespread adoption of hydrogen energy technology and demand for hydrogen energy systems, including the following:
| 10 |
| ● | cost-effectiveness of the electricity generated by hydrogen energy systems compared to conventional energy sources, such as natural gas and coal (which fuel sources may be subject to significant price fluctuations from time to time), and other non-solar renewable energy sources, such as solar or wind; |
| ● | performance, reliability, and availability of energy generated by hydrogen energy systems compared to conventional and other renewable energy sources and products, particularly conventional energy generation capable of providing 24-hour, non-intermittent baseload power; |
| ● | success of other renewable energy generation technologies, such as solar, hydroelectric, tidal, wind, geothermal, and biomass; |
| ● | fluctuations in economic and market conditions that affect the price of, and demand for, conventional and non-solar renewable energy sources, such as increases or decreases in the prices of natural gas, coal, oil, and other fossil fuels; |
| ● | fluctuations in capital expenditures by end-users of renewable energy systems, which tend to decrease when the economy slows and when interest rates increase; and |
| ● | availability, substance, and magnitude of support programs including government targets, subsidies, incentives, and renewable portfolio standards to accelerate the development of the hydrogen energy industry. |
Our business currently depends on the availability of rebates, tax credits and other financial incentives. The expiration, elimination or reduction of these rebates, credits and incentives would adversely impact our business.
U.S. federal, state and local government bodies provide incentives to end users, distributors, system integrators and manufacturers of renewable energy systems like ours to promote renewable energy electricity in the form of rebates, tax credits and other financial incentives such as system performance payments, payments for renewable energy credits associated with renewable energy generation and the exclusion of renewable energy systems from property tax assessments. We rely on these governmental rebates, tax credits and other financial incentives to incentivize customers to buy our HC-1 systems. However, these incentives may expire on a particular date, end when the allocated funding is exhausted or be reduced or terminated as solar energy adoption rates increase. These reductions or terminations often occur without warning.
The federal government currently offers a 30% investment tax credit of qualified expenditures under Section 25D of the Internal Revenue Code, or the Federal ITC, for the installation of certain residential renewable energy systems, such as our HC-1 system. The credit will remain at 30% for projects that are placed in service by December 31, 2019, then decline to 26% for systems placed in service by December 21, 2020, and to 22% for systems placed in service by December 31, 2021. The credit is scheduled to expire effective January 1, 2022. This credit was previously scheduled to expire effective January 1, 2017, and there can be no assurances that it will be further extended, or if extended, that the amount of the tax credit will remain at the same levels.
Reductions in, eliminations of, or expirations of, governmental incentives could adversely impact our results of operations and ability to compete in our industry by increasing the overall cost of the HC-1 system to our customers, which would effectively reduce the size of our addressable market.
We rely on net metering and related policies to attract and incentivize customers to purchase our hydrogen energy systems.
Forty-four states, Washington, D.C. and Puerto Rico have a regulatory policy known as net energy metering, or net metering, available to new customers. Each of the states where we currently intend to provide our services and products has adopted a net metering policy. Net metering allows our customers to interconnect their hydrogen energy systems to the utility grid and offset their utility electricity purchases by receiving a bill credit at the utility’s retail rate for energy generated by their solar energy system that is exported to the grid in excess of the electric load used by the customers. At the end of the billing period, the customer simply pays for the net energy used or receives a credit at the retail rate if more energy is produced than consumed. Utilities operating in states without a net metering policy may receive hydrogen electricity that is exported to the grid when there is no simultaneous energy demand by the customer without providing retail compensation to the customer for this generation.
Our ability to sell our hydrogen energy systems and the electricity they generate may be adversely impacted by the failure to expand existing limits on the amount of net metering in states that have implemented it, the failure to adopt a net metering policy where it currently is not in place, the imposition of new charges that only or disproportionately impact customers that utilize net metering or reductions in the amount or value of credit that customers receive through net metering. Our ability to sell our HC-1 systems and our customers’ ability to sell the electricity they generate may also be adversely impacted by the unavailability of expedited or simplified interconnection for grid-tied hydrogen energy systems or any limitation on the number of customer interconnections or amount of hydrogen energy that utilities are required to allow in their service territory or some part of the grid. For example, in October 2015, the Hawaii Public Utilities Commission capped the state’s net metering program at existing levels, and in late-December 2015, the Nevada Public Utilities Commission effectively capped the state’s net metering program at existing levels and imposed additional monthly charges on customers who interconnect their renewable energy systems. In addition, utilities in some states, such as Arizona, have proposed imposing additional monthly charges on customers who interconnect renewable energy systems installed on their homes. If such charges are imposed, the cost savings associated with switching to hydrogen energy may be significantly reduced and our ability to attract future customers could be impacted.
| 11 |
Existing electric utility industry regulations, and changes to regulations, may present technical, regulatory and economic barriers to the purchase and use of hydrogen energy systems that may reduce demand for our hydrogen energy systems.
Federal, state and local government regulations and policies concerning the electric utility industry, utility rate structures, interconnection procedures, internal policies and regulations promulgated by electric utilities, heavily influence the market for electricity generation products and services. These regulations and policies often relate to electricity pricing and the interconnection of customer-owned electricity generation. In the United States, governments and utilities continuously modify these regulations and policies. These regulations and policies could deter potential customers from purchasing renewable energy, including our HC-1 systems. This could result in a reduction in potential demand for our hydrogen energy systems. In addition, depending on the region, electricity generated by our HC-1 systems would compete most effectively with higher priced peak-hour electricity from the electric grid, rather than the lower average price of electricity. Modifications to the utilities’ peak-hour pricing policies or rate design, such as a flat rate, would require us to lower the price of our hydrogen energy systems to compete with the price of electricity from the electric grid.
Future changes to government or internal utility regulations and policies that favor electric utilities could also reduce our competitiveness, cause a significant reduction in demand for our products and services, and threaten the economics of our existing energy contracts. For example, in October 2015, the Hawaii Public Utilities Commission capped the state’s net metering program at existing levels and net metering no longer is available to new customers. In late-December 2015, the Nevada Public Utilities Commission also effectively capped the state’s net metering program at existing levels and net metering no longer is available to new customers. In addition, Nevada’s new rules include significant additional monthly charges on customers who interconnect their solar energy systems, significant reduction in the amount of bill credit for energy generated by their solar energy system that is exported to the grid in excess of electric load used by customers, and application of the new rules to existing customers with solar energy systems.
Project development or construction activities may not be successful and proposed projects may not receive required permits or construction may not proceed as planned.
The development and construction of our proposed projects will involve various risks. Success in developing a particular project is contingent upon, among other things: (i) negotiation of satisfactory engineering, procurement and construction agreements; (ii) receipt of required governmental permits and approvals, including the right to interconnect to the electric grid on economically acceptable terms; (iii) payment of interconnection and other deposits (some of which may be non-refundable); and (iv) timely implementation and satisfactory completion of construction.
Successful completion of a particular project may be adversely affected by numerous factors, including: (i) delays in obtaining required governmental permits and approvals with acceptable conditions; (ii) unforeseen engineering problems; (iii) construction delays and contractor performance shortfalls; (iv) work stoppages; (v) cost over-runs; (vi) equipment and materials supply; (vii) adverse weather conditions; and (viii) environmental and geological conditions.
The hydrogen energy industry competes with both conventional power industries and other renewable power industries.
The hydrogen energy industry faces intense competition from companies in the energy industry, such as nuclear, natural gas and fossil fuels as well as other renewable energy providers, including solar, biomass and wind. Other energy sources may benefit from innovations that reduce costs, increase safety or otherwise improve their competitiveness. New natural resources may be discovered, or global economic, business or political developments may disproportionately benefit conventional energy sources. Governments may support certain renewable energy sources and not support hydrogen energy. If we cannot compete with the providers of other energy sources, it may materially and adversely affect our business, results of operations and financial condition.
To execute our overall business strategy, we will likely require additional working capital, which may not be available on terms favorable to us or at all. If additional capital is not available or is available at unattractive terms, we may be forced to delay, reduce the scope of or eliminate our operations.
We have an ambitious business plan for strong growth of our business, which will likely require us to raise additional financing to supplement our cash flows from operations to fully execute. We intend to use proceeds from our recent private placement to implement our business strategy. We believe that since we are now a public company, we will have a greater potential ability to issue stock in lieu of cash, including for acquisitions and employee retention.
| 12 |
We expect that we will require additional financing to execute our business strategy. To the extent we raise additional capital through the sale of equity securities, the issuance of those securities could result in dilution to our shareholders. In addition, if we obtain debt financing, a substantial portion of our operating cash flow may be dedicated to the payment of principal and interest on such indebtedness, thus limiting funds available for our business activities. If adequate funds are not available, we may be required to reduce our marketing and sales efforts or reduce or curtail our operations.
There can be no assurance that if we were to need additional funds to meet obligations we have incurred, or may incur in the future, that additional financing arrangements would be available in amounts or on terms acceptable to us, if at all. Furthermore, if adequate additional funds are not available, we may be required to delay, reduce the scope of, or eliminate material parts of the implementation of our business strategy.
We face strong competition from other energy companies, including traditional and renewable providers.
Although we offer a unique solution, the energy provider business is competitive. Our competitors range in size from small companies to large multinational corporations. Our main competitors vary by region and energy services offered. We compete against other renewable energy providers that offer solar and wind, as well as traditional electricity providers. Almost all of our competitors have greater financial and other resources than we do and may be able to grow more quickly or better respond to changing business and economic conditions. Many of our competitors also have greater access to capital and we may not be able to compete successfully with them.
Our lack of diversification will increase the risk of an investment in us, and our financial condition and results of operations may deteriorate if we fail to diversify.
Our current business focuses primarily on one area of the renewable energy space, the hydrogen energy sector. Larger companies have the ability to manage their risk by diversification. However, we currently lack diversification, specifically in terms of the nature of our business. As a result, we will likely be impacted more acutely by factors affecting our industry and sector in which we operate, than we would if our business were more diversified, enhancing our risk profile.
If we fail to successfully introduce new products or services, we may lose market position.
New products, product improvements, line extensions or new services will be an important factor in our sales growth. If we fail to identify emerging technological trends, to maintain and improve the competitiveness of our existing products and services or to successfully introduce new products or services on a timely basis, we may lose market position.
The industry in which we operate has relatively low barriers to entry and increased competition could result in margin erosion, which would make profitability even more difficult to sustain.
Other than the technical skills required in our business, the barriers to entry in our business are relatively low. We do not have any intellectual property rights to protect our business methods and business start-up costs do not pose a significant barrier to entry. The success of our business is dependent on our employees, customer relations and the successful performance of our services. If we face increased competition as a result of new entrants in our markets, we could experience reduced operating margins and loss of market share and brand recognition.
Our failure to attract and retain engineering personnel or maintain appropriate staffing levels could adversely affect our business.
Our success depends upon our attracting and retaining skilled engineering personnel. Competition for such skilled personnel in our industry is high and at times can be extremely intense, especially for engineers and project managers, and we cannot be certain that we will be able to hire sufficiently qualified personnel in adequate numbers to meet the demand for our services. We also believe that our success depends to a significant extent on the ability of our key personnel to operate effectively, both individually and as a group. Additionally, we cannot be certain that we will be able to hire the requisite number of experienced and skilled personnel when necessary in order to service the number of contracts we may have at a particular time, particularly if the market for related personnel is competitive. Conversely, if we maintain or increase our staffing levels in anticipation of one or more projects and the projects are delayed, reduced or terminated, we may underutilize the additional personnel, which could reduce our operating margins, reduce our earnings and possibly harm our results of operations. If we are unable to obtain a sufficient number of contracts or effectively complete such contracts due to staffing deficiencies, our revenues may decline and we may experience continued losses.
| 13 |
Acquisitions involve risks that could result in a reduction of our operating results, cash flows and liquidity.
We have made two acquisitions since January 1, 2017 and currently intend to grow our business substantially by making additional strategic acquisitions, although we currently have no agreements to do so. However, we may not be able to identify suitable acquisition opportunities, or may be unable to complete such acquisitions. We may pay for acquisitions with our common stock or with convertible securities, which may dilute your investment in our common stock, or we may decide to pursue acquisitions that investors may not agree with. In connection with our acquisitions, we may also agree to substantial earn-out arrangements. To the extent we defer the payment of the purchase price for any acquisition through a cash earn-out arrangement, it will reduce our cash flows in subsequent periods. In addition, acquisitions may expose us to operational challenges and risks, including:
| ● | the ability to profitably manage acquired businesses or successfully integrate the acquired business’ operations and financial reporting and accounting control systems into our business; | |
| ● | increased indebtedness and contingent purchase price obligations associated with an acquisition; | |
| ● | the ability to fund cash flow shortages that may occur if anticipated revenue is not realized or is delayed, whether by general economic or market conditions, or unforeseen internal difficulties; | |
| ● | the availability of funding sufficient to meet increased capital needs; | |
| ● | diversion of management’s attention; and | |
| ● | the ability to retain or hire qualified personnel required for expanded operations. |
Completing acquisitions may require significant management time and financial resources because we may need to assimilate widely dispersed operations with distinct corporate cultures. In addition, acquired companies may have liabilities that we failed, or were unable, to discover in the course of performing due diligence investigations. We cannot assure you that the indemnification granted to us by sellers of acquired companies will be sufficient in amount, scope or duration to fully offset the possible liabilities associated with businesses or properties we assume upon consummation of an acquisition. We may learn additional information about our acquired businesses that materially adversely affect us, such as unknown or contingent liabilities and liabilities related to compliance with applicable laws. Any such liabilities, individually or in the aggregate, could have a material adverse effect on our business.
Failure to successfully manage the operational challenges and risks associated with, or resulting from, acquisitions could adversely affect our results of operations, cash flows and liquidity. Borrowings or issuances of convertible securities associated with these acquisitions may also result in higher levels of indebtedness.
Liability claims could have a material adverse effect on our operating results.
We face an inherent business risk of exposure to liability claims arising from the alleged failure of our services, including the individual components in our systems. Any material uninsured losses due to liability claims that we experience could subject us to material losses. We could be required to redesign our services if they prove to be defective. We maintain insurance against liability claims, but it is possible that our insurance coverage will not continue to be available on terms acceptable to us or that such coverage will not be adequate for liabilities actually incurred. A successful claim brought against us in excess of available insurance coverage, or any claim that results in significant expense or adverse publicity against us, could have a material adverse effect on our business, operating results and financial condition.
We are dependent upon key personnel whose loss may adversely impact our business.
We rely heavily on the expertise, experience and continued services of our founders, especially Andrew Hidalgo, our Chief Executive Officer, President and Chairman of the Board, Mike Strizki, our Chief Technology Officer and the developer of the hydrogen house concept and James Strizki, our Executive Vice President of Technical Services. We currently only have employment agreements with Andrew Hidalgo and Matthew Hidalgo, and any of our other executive officers are not restricted from leaving or competing against us. The loss of either of these individuals, or an inability to attract or retain other key individuals, could materially adversely affect us. We seek to compensate and motivate these individuals, as well as other personnel, through competitive cash and equity compensation, but there can be no assurance that these programs will allow us to retain key personnel or hire new key personnel. As a result, if any member of our key personnel were to leave, we could face substantial difficulty in hiring a qualified successor and could experience a loss in productivity while any such successor obtains the necessary training and experience.
| 14 |
Our resources may not be sufficient to manage our expected growth; failure to properly manage our potential growth would be detrimental to our business.
We may fail to adequately manage our anticipated future growth. Any growth in our operations could place a significant strain on our administrative, financial and operational resources, and increase demands on our management and on our operational and administrative systems, controls and other resources. We cannot assure you that our existing personnel, systems, procedures or controls will be adequate to support our operations in the future or that we will be able to successfully implement appropriate measures consistent with our growth strategy. As part of this growth, we may have to implement new operational and financial systems, procedures and controls to expand, train and manage our employee base, and maintain close coordination among our staff. We cannot guarantee that we will be able to do so, or that if we are able to do so, we will be able to effectively integrate them into our existing staff and systems.
If we are unable to manage growth effectively, such as if our sales and marketing efforts exceed our capacity to perform our services and maintain our products or if new employees are unable to achieve performance levels, our business, operating results and financial condition could be materially adversely affected. As with all expanding businesses, the potential exists that growth will occur rapidly. If we are unable to effectively manage this growth, our business and operating results could be negatively impacted. Anticipated growth in future operations may place a significant strain on management systems and resources. In addition, the integration of new personnel will continue to result in some disruption to ongoing operations. The ability to effectively manage growth in a rapidly evolving market requires effective planning and management processes. We will need to continue to improve operational, financial and managerial controls, reporting systems and procedures, and will need to continue to expand, train and manage our work force. Our success depends in part on our maintaining high quality customer service and any failure to do so could adversely affect our business, financial condition or results of operations.
Failure to properly manage projects may result in unanticipated costs or claims.
Our project engagements may involve large scale, highly complex projects. The quality of our performance on such projects depends in large part upon our ability to manage the relationship with our customers, and to effectively manage the project and deploy appropriate resources, in a timely manner. Any defects or errors or failure to meet customers’ expectations could result in claims for substantial damages against us. Our contracts generally limit our liability for damages that arise from negligent acts, errors, mistakes or omissions in rendering services to our customers. However, we cannot be sure that these contractual provisions will protect us from liability for damages in the event of litigation.
We are subject to operating and litigation risks that may not be covered by insurance.
Our business operations are subject to all of the operating hazards and risks normally incidental to the implementation of systems involving combustible products, such as liquefied petroleum gases, propane, natural gas and hydrogen gas, and the generation of electricity. Accidents involving our hydrogen energy systems, including leaks, ruptures, fires, explosions, sabotage and mechanical problems, could result in substantial losses due to personal injury and/or loss of life, and severe damage to and destruction of property and equipment arising from explosions and other catastrophic events. If such accidents were to occur, we could face lawsuits from our clients alleging that we were responsible for such accidents. There can be no assurance that our insurance will be adequate to protect us from all material expenses related to future claims or that such levels of insurance will be available in the future at economical prices.
Risks Related to Our Common Stock
Our officers, directors and principal shareholders will own a controlling interest in our voting stock and investors will not have any voice in our management.
Our officers, directors and principal shareholders, in the aggregate, beneficially own or control the votes of approximately 92.7% of our outstanding common stock. As a result, these stockholders, acting together, will have the ability to control substantially all matters submitted to our stockholders for approval, including:
| ● | election of our board of directors; | |
| ● | removal of any of our directors; | |
| ● | amendment of our articles of incorporation or bylaws; and | |
| ● | adoption of measures that could delay or prevent a change in control or impede a merger, takeover or other business combination involving us. |
As a result of their ownership and positions, our directors, executive officers and principal shareholders collectively are able to influence all matters requiring stockholder approval, including the election of directors and approval of significant corporate transactions. In addition, sales of significant amounts of shares held by our directors, executive officers or principal shareholders, or the prospect of these sales, could adversely affect the market price of our common stock. Management’s stock ownership may discourage a potential acquirer from making a tender offer or otherwise attempting to obtain control of us, which in turn could reduce our stock price or prevent our stockholders from realizing a premium over our stock price.
| 15 |
We have not paid cash dividends in the past and do not expect to pay cash dividends in the future. Any return on investment may be limited to the value of our common stock.
We have never paid cash dividends on our common stock and do not anticipate paying cash dividends in the foreseeable future. The payment of dividends on our common stock will depend on earnings, financial condition and other business and economic factors affecting it at such time as the board of directors may consider relevant.
We may raise capital through the sale of our securities in either private placements or a public offering, which offerings would dilute the ownership of investors in this private offering.
If our operations require additional capital in the future, we may sell additional share of our common stock and/or securities convertible into or exchangeable or exercisable for shares of our common stock. Such offerings may be in private placements or a public offering. If we conduct such additional offerings, an investor would experience dilution of his ownership of the Company.
You may experience dilution of your ownership interests because of the future issuance of additional shares of our common or preferred stock or other securities that are convertible into or exercisable for our common or preferred stock.
In the future, we may issue our authorized but previously unissued equity securities, resulting in the dilution of the ownership interests of our present stockholders. We are authorized to issue an aggregate of 25,000,000 shares of common stock and 5,000,000 shares of “blank check” preferred stock. In addition, we have reserved 2,500,000 shares of common stock for issuance under our 2016 stock option incentive plan, of which 1,150,000 million options have been issued, 100,000 have been exercised and there are none currently exercisable. The options were issued at various prices. We may issue additional shares of our common stock or other securities that are convertible into or exercisable for our common stock in connection with hiring or retaining employees, future acquisitions, future sales of our securities for capital raising purposes, or for other business purposes. The future issuance of any such additional shares of our common stock may create downward pressure on the trading price of the common stock. We will likely need to raise additional capital in the near future to meet our working capital needs, and there can be no assurance that we will not be required to issue additional shares, warrants or other convertible securities in the future in conjunction with these capital raising efforts, including at a price (or exercise or conversion prices) that could be below the price an investor paid for stock.
There has been a limited trading market for our common stock and limited market activity to date.
Currently, our common stock is available for quotation on the OTCQB Market under the symbol “HCCC.” However, our stock only became eligible for quotation in November 2016 and prior to February 2017, there was no trading activity in our common stock and there has been limited trading activity to date. It is anticipated that there will remain a limited trading market for the common stock on the OTCQB. The lack of an active market may impair your ability to sell your shares at the time you wish to sell them or at a price that you consider reasonable. The lack of an active market may also reduce the fair market value of your shares. An inactive market may also impair our ability to raise capital by selling shares of capital stock and may impair our ability to acquire other companies by using common stock as consideration.
You may have difficulty trading and obtaining quotations for our common stock.
Our common stock is not actively traded, and the bid and asked prices for our common stock on the OTCQB Market may fluctuate widely. As a result, investors may find it difficult to dispose of, or to obtain accurate quotations of the price of, our securities. This severely limits the liquidity of the common stock, and would likely reduce the market price of our common stock and hamper our ability to raise additional capital.
Our common stock is not currently traded at high volume, and you may be unable to sell at or near ask prices or at all if you need to sell or liquidate a substantial number of shares at one time.
Our common stock is currently traded, but with very low if any, volume, based on quotations on the OTCQB Market, meaning that the number of persons interested in purchasing our common stock at or near bid prices at any given time may be relatively small or non-existent. During the year ended December 31, 2017, the first shares traded on February 21, 2017, with an average number of shares traded between February 21, 2017 and December 31, 2017 of 265 shares per trading day. This situation is attributable to a number of factors, including the fact that we are a small company which is still relatively unknown to stock analysts, stock brokers, institutional investors and others in the investment community that generate or influence sales volume, and that even if we came to the attention of such persons, they tend to be risk-averse and would be reluctant to follow an unproven company such as ours or purchase or recommend the purchase of our shares until such time as we became more seasoned and viable. As a consequence, there may be periods of several days or more when trading activity in our shares is minimal or non-existent, as compared to a seasoned issuer which has a large and steady volume of trading activity that will generally support continuous sales without an adverse effect on share price. We cannot give you any assurance that a broader or more active public trading market for our common stock will develop or be sustained, or that trading levels will be sustained.
| 16 |
Shareholders should be aware that, according to Commission Release No. 34-29093, the market for “penny stocks” has suffered in recent years from patterns of fraud and abuse. Such patterns include (1) control of the market for the security by one or a few broker-dealers that are often related to the promoter or issuer; (2) manipulation of prices through prearranged matching of purchases and sales and false and misleading press releases; (3) boiler room practices involving high-pressure sales tactics and unrealistic price projections by inexperienced sales persons; (4) excessive and undisclosed bid-ask differential and markups by selling broker-dealers; and (5) the wholesale dumping of the same securities by promoters and broker-dealers after prices have been manipulated to a desired level, along with the resulting inevitable collapse of those prices and with consequent investor losses. Our management is aware of the abuses that have occurred historically in the penny stock market. Although we do not expect to be in a position to dictate the behavior of the market or of broker-dealers who participate in the market, management will strive within the confines of practical limitations to prevent the described patterns from being established with respect to our securities. The occurrence of these patterns or practices could increase the future volatility of our share price.
The market price of our common stock may, and is likely to continue to be, highly volatile and subject to wide fluctuations.
The market price of our common stock is likely to be highly volatile and could be subject to wide fluctuations in response to a number of factors that are beyond our control, including:
| ● | dilution caused by our issuance of additional shares of common stock and other forms of equity securities, which we expect to make in connection with future capital financings to fund our operations and growth, to attract and retain valuable personnel and in connection with future strategic partnerships or acquisitions of other companies; | |
| ● | quarterly variations in our revenues and operating expenses; | |
| ● | changes in the valuation of similarly situated companies, both in our industry and in other industries; | |
| ● | changes in analysts’ estimates affecting our company, our competitors and/or our industry; | |
| ● | changes in the accounting methods used in or otherwise affecting our industry; | |
| ● | additions and departures of key personnel; | |
| ● | announcements of technological innovations or new technologies or services available to the renewable energy industry; | |
| ● | fluctuations in interest rates and the availability of capital in the capital markets; and | |
| ● | significant sales of our common stock. |
These and other factors are largely beyond our control, and the impact of these risks, singly or in the aggregate, may result in material adverse changes to the market price of our Common Stock and/or our results of operations and financial condition.
The rights of the holders of common stock may be impaired by the potential issuance of preferred stock.
Our articles of incorporation give our board of directors the right to create new series of preferred stock. As a result, the board of directors may, without stockholder approval, issue preferred stock with voting, dividend, conversion, liquidation or other rights which could adversely affect the voting power and equity interest of the holders of common stock. Preferred stock, which could be issued with the right to more than one vote per share, could be utilized as a method of discouraging, delaying or preventing a change of control. The possible impact on takeover attempts could adversely affect the price of our common stock. Although we have no present intention to issue any shares of preferred stock or to create a series of preferred stock, we may issue such shares in the future.
| 17 |
Offers or availability for sale of a substantial number of shares of our common stock may cause the price of our common stock to decline.
If our stockholders sell substantial amounts of our common stock in the public market, including upon the expiration of any lockup periods or the statutory holding period under Rule 144, or issued upon the conversion of preferred stock, it could create a circumstance commonly referred to as an “overhang” and in anticipation of which the market price of our common stock could fall. The existence of an overhang, whether or not sales have occurred or are occurring, also could make more difficult our ability to raise additional financing through the sale of equity or equity-related securities in the future at a time and price that we deem reasonable or appropriate.
If we fail to comply with the rules under the Sarbanes-Oxley Act of 2002 related to accounting controls and procedures, or if we discover material weaknesses and deficiencies in our internal control and accounting procedures, our stock price could decline significantly and raising capital could be more difficult.
If we fail to comply with the rules under the Sarbanes-Oxley Act of 2002 related to disclosure controls and procedures, or, if we discover material weaknesses and other deficiencies in our internal control and accounting procedures, our stock price could decline significantly and raising capital could be more difficult. Section 404 of the Sarbanes-Oxley Act requires annual management assessments of the effectiveness of our internal control over financial reporting. If material weaknesses or significant deficiencies are discovered or if we otherwise fail to achieve and maintain the adequacy of our internal control, we may not be able to ensure that we can conclude on an ongoing basis that we have effective internal controls over financial reporting in accordance with Section 404 of the Sarbanes-Oxley Act. Moreover, effective internal controls are necessary for us to produce reliable financial reports and are important to helping prevent financial fraud. If we cannot provide reliable financial reports or prevent fraud, our business and operating results could be harmed, investors could lose confidence in our reported financial information, and the trading price of our common stock could drop significantly.
Our common stock is subject to the “Penny Stock” rules of the SEC and the trading market in our securities will be limited, which makes transactions in our common stock cumbersome and may reduce the value of an investment in our common stock.
Rule 15g-9 under the Exchange Act establishes the definition of a “penny stock,” for the purposes relevant to us, as any equity security that has a market price of less than $5.00 per share or with an exercise price of less than $5.00 per share, subject to certain exceptions. For any transaction involving a penny stock, unless exempt, the rules require: (a) that a broker or dealer approve a person’s account for transactions in penny stocks; and (b) the broker or dealer receive from the investor a written agreement to the transaction, setting forth the identity and quantity of the penny stock to be purchased.
In order to approve a person’s account for transactions in penny stocks, the broker or dealer must: (a) obtain financial information and investment experience objectives of the person and (b) make a reasonable determination that the transactions in penny stocks are suitable for that person and the person has sufficient knowledge and experience in financial matters to be capable of evaluating the risks of transactions in penny stocks.
The broker or dealer must also deliver, prior to any transaction in a penny stock, a disclosure schedule prescribed by the SEC relating to the penny stock market, which, in highlight form: (a) sets forth the basis on which the broker or dealer made the suitability determination; and (b) confirms that the broker or dealer received a signed, written agreement from the investor prior to the transaction. Generally, brokers may be less willing to execute transactions in securities subject to the “penny stock” rules. This may make it more difficult for investors to dispose of our common stock and cause a decline in the market value of our common stock.
Disclosure also has to be made about the risks of investing in penny stocks in both public offerings and in secondary trading and about the commissions payable to both the broker or dealer and the registered representative, current quotations for the securities and the rights and remedies available to an investor in cases of fraud in penny stock transactions. Finally, monthly statements have to be sent disclosing recent price information for the penny stock held in the account and information on the limited market in penny stocks.
FINRA sales practice requirements may also limit a shareholder’s ability to buy and sell our stock.
In addition to the “penny stock” rules described above, FINRA has adopted rules that require that in recommending an investment to a customer, a broker-dealer must have reasonable grounds for believing that the investment is suitable for that customer. Prior to recommending speculative low priced securities to their non-institutional customers, broker-dealers must make reasonable efforts to obtain information about the customer’s financial status, tax status, investment objectives and other information. Under interpretations of these rules, FINRA believes that there is a high probability that speculative low priced securities will not be suitable for at least some customers. The FINRA requirements make it more difficult for broker-dealers to recommend that their customers buy our common stock, which may limit your ability to buy and sell our stock and have an adverse effect on the market for our shares.
ITEM 1B – UNRESOLVED STAFF COMMENTS
Not required under Regulation S-K for “smaller reporting companies.”
| 18 |
We maintain our principal office at 97 River Road, Flemington, NJ 08822. Our telephone number at that office is (908) 837-9097. Our current office space consists of approximately 800 square feet, which is donated to us from one of our executive officers. There is no lease agreement and we pay no rent.
We believe that our existing facilities are suitable and adequate to meet our current business requirements. We maintain various websites and the information contained on those websites is not deemed to be a part of this annual report.
From time to time, we may become involved in various lawsuits and legal proceedings which arise in the ordinary course of business. However, litigation is subject to inherent uncertainties, and an adverse result in these or other matters may arise from time to time that may harm our business. We are currently not aware of any such legal proceedings or claims that we believe will have, individually or in the aggregate, a material adverse effect on our business, financial condition or operating results.
ITEM 4 – MINE SAFETY DISCLOSURES
Not applicable.
| 19 |
ITEM 5 - MARKET FOR REGISTRANT’S COMMON EQUITY, RELATED STOCKHOLDER MATTERS AND ISSUER PURCHASES OF EQUITY SECURITIES
Price Range of Common Stock
Our common stock has been available for quotation on the OTCQB Markets under the symbol “HCCC” since November 21, 2016. The price range during the year ended December 31, 2017, was a low of $1.00 per share and a high of $4.00 per share.
On March 29, 2018, the closing sale price of our common stock, as reported by the OTC Markets, was $3.00 per share. On March 29, 2018, there were 52 holders of record of our common stock. Because certain of our shares of common stock are held by brokers and other institutions on behalf of stockholders, we are unable to estimate the total number of stockholders represented by these record holders.
Dividend Policy
We have never paid any cash dividends on our capital stock and do not anticipate paying any cash dividends on our common stock in the foreseeable future. We intend to retain future earnings to fund ongoing operations and future capital requirements of our business. Any future determination to pay cash dividends will be at the discretion of the Board and will be dependent upon our financial condition, results of operations, capital requirements and such other factors as the Board deems relevant.
Equity Compensation Information
The following table summarizes information about our equity compensation plans as of December 31, 2017.
| Plan Category | Number of Shares of Common Stock to be Issued upon Exercise of Outstanding Options (a) |
Weighted-Average Exercise Price of Outstanding Options (b) |
Number of Options Remaining Available for Future Issuance Under Equity Compensation Plans (excluding securities reflected in column (a)) (c) |
|||||||||
| Equity compensation plans approved by stockholders | 1,050,000 | 0.27 | 1,350,000 | |||||||||
| Equity compensation plans not approved by stockholders | — | — | — | |||||||||
| Total | 1,050,000 | 0.27 | 1,350,000 | |||||||||
Recent Sales of Unregistered Securities
None.
Purchases of Equity Securities by the Issuer and Affiliated Purchasers
We did not purchase any of our registered securities during the period covered by this Annual Report.
ITEM 6 – SELECTED FINANCIAL DATA
Not required under Regulation S-K for “smaller reporting companies.”
| 20 |
ITEM 7. MANAGEMENT’S DISCUSSION AND ANALYSIS OF FINANCIAL CONDITION AND RESULTS OF OPERATIONS
This Management’s Discussion and Analysis of Financial Condition and Results of Operations includes a number of forward-looking statements that reflect Management’s current views with respect to future events and financial performance. You can identify these statements by forward-looking words such as “may,” “will,” “expect,” “anticipate,” “believe,” “estimate” and “continue,” or similar words. Those statements include statements regarding the intent, belief or current expectations of us and members of our management team as well as the assumptions on which such statements are based. Prospective investors are cautioned that any such forward-looking statements are not guarantees of future performance and involve risk and uncertainties, and that actual results may differ materially from those contemplated by such forward-looking statements.
Readers are urged to carefully review and consider the various disclosures made by us in this report and in our other reports filed with the Securities and Exchange Commission. Important factors currently known to Management could cause actual results to differ materially from those in forward-looking statements. We undertake no obligation to update or revise forward-looking statements to reflect changed assumptions, the occurrence of unanticipated events or changes in the future operating results over time. We believe that our assumptions are based upon reasonable data derived from and known about our business and operations. No assurances are made that actual results of operations or the results of our future activities will not differ materially from our assumptions. Factors that could cause differences include, but are not limited to, expected market demand for our products, fluctuations in pricing for materials, and competition.
Business Overview
We were formed in August 2015 to expand upon the successful implementation of a hydrogen energy system used to completely power a residence or commercial property with clean energy so that it can run independent of the utility grid and also provide energy to the utility grid for monetary credits. This unique system uses renewal energy as its source for hydrogen production. We believe that it is a revolutionary green-energy concept that is safe, renewable, self-sustaining and cost effective. On January 31, 2017, we acquired Pride. Founded in 1997, Pride is a provider of security systems integration for a variety of customers in the government and commercial sector and has launched a new clean energy systems division to focus on the high growth renewable energy market in Asia-Pacific. On February 1, 2018, we acquired PVBJ. Established in 2008 and historically profitable, PVBJ is well recognized for the design, installation, maintenance and emergency service of environmental systems both in residential and commercial markets. PVBJ is now expanding into renewable energy systems.
Pride Energy Systems is Pride’s clean energy division, which sells, designs, installs and maintains a variety of technology services in the clean energy market, including audits of energy consumption, review of energy and tax credits available, feasibility studies, solar/battery energy system design, zoning and permitting analysis, site design/preparation and restoration, system startup, testing and commissioning and maintenance. The division has just begun to bid for clean energy systems and is focused on the residential, commercial and government sectors. The division is able to utilize the many contacts established in the security systems division.
There are great benefits to hydrogen energy. The use of hydrogen as a fuel produces no carbon dioxide or other greenhouse gases. Unlike fossil fuels, the only emissions from hydrogen fuel are chemically pure water and oxygen. Hydrogen can be extracted from water using renewable energy from the sun and unlike batteries, hydrogen energy can be stored indefinitely. There is no drilling, fracking or mining required to produce hydrogen energy. We believe it is safe and efficient, and the cleanest energy source on the planet.
We have succeeded in developing a hydrogen energy system designed to create electricity that is generated by renewable solar energy. We call the hydrogen energy system the HC-1. The HC-1 system functions as a self-sustaining renewable energy system. It can be configured as an off grid solution for all your electricity needs or it can be connected to the grid to generate energy credits. Its production of hydrogen is truly eco-friendly, as it is not produced by the use of fossil fuels. It is a system comprised of solar modules, inverters, batteries, a hydrogen generator, a fuel cell and a hydrogen storage tank.
When there is solar power, the solar modules produce renewable energy that is collected through a solar inverter, which charges a bank of batteries through a battery inverter. After the batteries are fully charged, the excess electricity is then combined with water through a hydrogen generator that extracts the hydrogen from the water in a gasified state, which is safely transferred to the hydrogen tank and stored for later use. If the tank is full, excess electricity is sent from the batteries through the battery inverter to the utility grid, which results in energy credits for the system owner.
The HC-1 system is connected to the residential or commercial property through the inverters. The electricity is always provided by the charged batteries. If there is no solar power to charge the batteries, the system keeps the batteries fully charged by using hydrogen stored in the tank, which processed through a fuel cell, creates the electricity. As the system is able to produce hydrogen, that keeps the hydrogen tank full, it provides a continuous supply of clean energy and sustainability that is independent from the grid.
| 21 |
Each HC-1 system is custom designed to accommodate the electrical loads for an end user. The system is completely scalable. If the customer is connected to the electric grid, energy production that is converted to hydrogen in excess of the amount stored in the hydrogen tank is transferred to the local electric company, creating energy credits.
If a customer wishes to connect our system to the electrical grid in order to generate renewable energy credits, the customer needs to obtain interconnection agreements from the applicable local primary electricity utility. In our experience, there has not been any cost involved in obtaining an interconnection agreement, but as the requirements are determined on a local basis, it may be possible that some nominal costs are involved in connection with the process. If the customer obtains an interconnection agreement, once the HC-1 system is operational, the HC-1 system end user can eliminate their electric bill and, if in a permissible state, can begin generating energy credits. In certain states, an end user receives one energy credit for each 1,000 kWh produced through renewal energy. The customer sells these credits to a broker who in turn sells the credits to a utility company so that the utility company can demonstrate their compliance with the regulatory obligations to reduce greenhouse gas emissions. The price per credit can vary depending on supply and demand. Many other states that may not offer an energy credit program, do offer other cash incentives for renewable energy systems.
Current Operating Trends
Currently, our employees are licensed to install our HC-1 systems in the State of New Jersey and the Commonwealth of Pennsylvania. Pride sells, designs, installs and maintains a variety of technology products in the security systems market, including commercial alarm systems, access control, video surveillance, CCTV (closed circuit television)/MATV (master antenna television) systems, biometric technology, audio/visual systems, nurse call systems and public announcement systems. Pride also provides programs for annual maintenance of its products and systems. The division generates approximately half of its revenue from government contracts and the other half from the commercial sector. Pride has recurring annual maintenance revenue of close to AUD $2 million. Pride is a certified security systems integrator for the Queensland Government and has various government contracts in place for installation, maintenance and project services. Pride also works with a number of general contractors as a subcontractor for security systems integration.
We intend to aggressively grow our business, both organically and through strategic acquisitions. We intend to acquire companies with licensed contractors in various states and regions, which will allow us to expand the territories in which we can install our systems. These acquired companies will also provide us with a consistent revenue stream, a customer base for marketing our HC-1 systems and technicians. Initially, we intend to focus on states or countries whose government supports a regulatory standard requiring its utility companies to increase their production of energy from renewable energy sources.
These governments have established various incentives and financial mechanisms to accelerate and promote the use of renewable energy sources. Currently, many states comply with regulatory standards including New Jersey, Massachusetts, Pennsylvania, Maryland, Ohio, Delaware, North Carolina, Virginia, Kentucky, West Virginia, Michigan, Indiana, Illinois as well as the District of Columbia. In addition, countries such as the United Kingdom, Australia, Italy, Poland, Sweden, Belgium and Chile have adopted regulatory standards. The list is expanding each year.
We are also searching for suitable acquisition targets that will complement our services, create revenue production, allow us to expand our sales and technical staff and provide us with a larger customer base to pursue with greater geographic coverage. As of the date of this quarterly report, we have no written agreements or understandings to acquire any companies and no assurances can be given that we will identify or successfully acquire any other companies.
Results of Operations
For the years ended December 31, 2017 and 2016
Revenue and Cost of Revenue
For the year ended December 31, 2017, we had $6,352,886 of revenue and $4,329,070 of cost of revenue, of which $85,919 and $87,649 respectively, was related party. Revenues increased from 2016 to 2017 due to completion of two large contracts, each in excess of one million dollars. In the past, we typically completed only one contract each year in excess of one million dollars. For the year ended December 31, 2016, we had $5,007,103 of revenue and $3,356,676 for cost of revenue, of which $28,527 and $1,500 respectively, was related party. The revenue breakdown by segment is as follows:
| For the Year Ended | ||||||||
| December 31, 2017 | December 31, 2016 | |||||||
| Revenue by segment | ||||||||
| Renewable Systems integration | $ | 85,919 | $ | 28,527 | ||||
| Non-renewable system Integration | 6,266,967 | 4,978,576 | ||||||
| $ | 6,352,886 | $ | 5,007,103 | |||||
| 22 |
General and Administrative Expenses
During the year ended December 31, 2017, our general and administrative expenses were $1,960,863. $261,118 was related to the Renewable Systems Integration segment, including corporate expenses comprised of $94,643 of accounting fees related to audit, consulting and Pride acquisition costs, $60,689 of legal fees, $51,625 of stock-based compensation, $24,525 of dues and subscription fees, which pertained to transfer agent, EDGAR fees and OTC Market annual listing fees, $10,404 of directors and officers insurance liability, $9,097 of travel, and $10,135 of miscellaneous expenses.
The Non-renewable Systems Integration segment incurred general and administrative expenses during the year ended December 31, 2017 of $1,699,745 including management and administrative salaries of $611,178 along with $376,628 of other various employee expenses, such as vacation and sick time, and management fees of $184,004. In addition, automobile expenses totaled $181,233, which included repairs, fuel and auto allowance. Facilities lease for the Pride offices totaled $91,111. Consulting/dues and subscription fees were $4,000 which pertained to miscellaneous business subscriptions and renewals. Professional fees of $13,827 consisted of legal and accounting fees incurred for tax and human resources advice. Other expenses included $66,255 of insurance, $28,529 of telecommunications, $27,176 of computer expenses and $19,362 of utilities and safety expenses. We also incurred $31,985 of depreciation, $24,311 of bad debt expense, $7,295 of interest expense, $2,041 of travel and entertainment, and $30,810 of other miscellaneous fees.
During the year ended December 31, 2016, expenses for our general and administrative expenses were $2,355,154. $478,834 was related to the Renewable Systems Integration segment, including corporate expenses. We incurred $387,450 of stock-based compensation, $33,064 of professional fees, which consisted of legal fees incurred in connection with capital raising activities and accounting fees, $31,357 of dues and subscriptions relating to EDGAR fees, transfer agent fees and an OTCQB application fee, $15,991 of travel and entertainment related to a renewables industry convention and $4,258 of advertising/promotional fees. We also incurred $2,000 in research and development and $4,714 of miscellaneous expenses.
The Non-renewable Systems Integration segment incurred general and administrative expenses during the year ended December 31, 2016 of $1,878,320, including $680,120 of management and administrative salaries, $494,927 of other various employee expenses, such as vacation and sick time, and management fees of $158,015. Automobile expenses totaled $213,431, which included repairs, fuel, lease and auto allowance. Facilities lease for the Pride offices totaled $89,662. In addition, we incurred $54,002 for telecommunications, $62,969 of insurance, $23,562 for computer services, $21,517 of depreciation, $21,433 of legal and accounting fees, $14,657 for postage and printing, $14,423 of travel, $12,991 for safety/environmental and $16,611 of miscellaneous expenses.
As a result of the foregoing, we had net income of $8,897 for the year ended December 31, 2017, compared to a net loss of $706,727 for the year ended December 31, 2016.
Liquidity and Capital Resources
As of December 31, 2017, we had working capital of $420,550, comprised of $455,700 of cash and cash equivalents, $808,050 of accounts receivables, $51,531 of costs in excess of billings and $14,669 of prepaid expenses. This was offset by $685,439 of accounts payables and accrued expenses, $87,206 of billings in excess of cost, $61,239 of sales tax payable, $44,257 of income tax payable and $31,257 of related party management fee payables, which made up current liabilities at December 31, 2017.
For the year ended December 31, 2017, we used $69,898 of cash in operating activities, which represented our net income of $8,897, $5,128 of changes in accounts payable, $51,625 of stock-based compensation, $44,257 of increased deferred tax assets, $40,373 of costs in excess of billings, $32,585 of depreciation and amortization, $3,668 of billings in excess of cost, $420 of prepaid expenses and $77 gain on fixed asset sales, offset by $157,164 of changes in accounts receivables.
For the year ended December 31, 2016, cash provided by operating activities was $120,270, which represented our net loss of $706,727, $682,866 of changes in accounts receivables, $387,450 of stock-based compensation, $96,079 of costs in excess of billings, $25,319 loss on fixed asset sales, $22,117 of depreciation and amortization, and $5,822 of prepaid expenses, offset by $247,383 of changes in accounts payable and $53,845 of billings in excess of cost.
| 23 |
For the year ended December 31, 2017, we used $24,974 in investing activities relating to the purchase of fixed assets of $36,943, offset by $11,969 of proceeds from the disposition of property and equipment. For the year ended December 31, 2016, we used $63,483 of cash from investing activities relating to $20,077 of proceeds from the disposition of property and equipment offset by the purchase of fixed assets of $83,560.
For the year ended December 31, 2017, we received $1,000 from financing activities, which represented proceeds from the exercise of stock options. For the year ended December 31, 2016, we received $336,181 from financing activities, which represented $450,000 of proceeds from the sale of our common stock, offset by $108,399 in expenses associated with the capital raises and $5,420 of repayment to stockholders.
In the future we expect to incur expenses related to compliance for being a public company and travel related to visiting potential customer sites. We expect that our general and administrative expenses will increase as we expand our business development, add infrastructure and incur additional costs related to being a public company, including incremental audit fees, investor relations programs and increased professional services.
Our future capital requirements will depend on a number of factors, including the progress of our sales and marketing of our services, the timing and outcome of potential acquisitions, the costs involved in operating as a public reporting company, the status of competitive services, the availability of financing and our success in developing markets for our services. When we enter into contacts with customers, they will be required to make payments in tranches, including a payment after a contract is executed but prior to commencement of the project. We believe our existing cash, together with revenue generated by operations, will be sufficient to fund our operating expenses and capital equipment requirements for at least the next 12 months.
We presently do not have any available credit, bank financing or other external sources of liquidity. While we have achieved net income from operations for the year ended December 31, 2017, our operations historically have not been a source of liquidity and we cannot be assured they will be in the near future. We may need to obtain additional capital in order to expand operations and fund our activities. Future financing may include the issuance of equity or debt securities, obtaining credit facilities, or other financing mechanisms. Even if we are able to raise the funds if required, it is possible that we could incur unexpected costs and expenses, fail to collect significant amounts owed to us, or experience unexpected cash requirements that would force us to seek alternative financing. Furthermore, if we issue additional equity or debt securities, stockholders may experience additional dilution or the new equity securities may have rights, preferences or privileges senior to those of existing holders of our common stock. If additional financing is not available or is not available on acceptable terms, we may be required to delay, reduce the scope of or eliminate our marketing and business development services.
Critical Accounting Policies
Our discussion and analysis of our financial condition and results of operations are based on our financial statements, which have been prepared in accordance with U.S. GAAP. The preparation of these financial statements requires us to make estimates and judgments that affect our reported amounts of assets, liabilities, revenues and expenses. On an ongoing basis, we evaluate our estimates and judgments, including those related to accrued expenses and stock-based compensation. We based our estimates on historical experience and on various other assumptions that we believe to be reasonable under the circumstances, the results of which form the basis for making judgments about the carrying values of assets and liabilities and the reported amounts of revenues and expenses that are not readily apparent from other sources. Actual results may differ from these estimates.
We believe the following critical accounting policies affect our more significant judgments and estimates used in the preparation of our consolidated financial statements.
Cash and Cash Equivalents
Cash and cash equivalents includes cash in bank and money market funds as well as other highly liquid investments with an original maturity of year or less.
Revenue Recognition
Revenues from construction contracts are included in contract revenue in the consolidated statements of operations and are recognized under the percentage-of-completion accounting method. The percent complete is measured by the cost incurred to date compared to the estimated total cost of each project. This method is used as management considers expended cost to be the best available measure of progress on these contracts, the majority of which are completed within one year, but may occasionally extend beyond one year. Inherent uncertainties in estimating costs make it at least reasonably possible that the estimates used will change within the near term and over the life of the contracts.
| 24 |
Contract costs include all direct material and labor costs and those indirect costs related to contract performance and completion. Provisions for estimated losses on uncompleted contracts are made in the period in which such losses are determined. General and administrative costs are charged to expense as incurred.
Changes in job performance, job conditions and estimated profitability, including those arising from contract penalty provisions and final contract settlements, may result in revisions to costs and income. Such revisions are recognized in the period in which they are determined.
Costs and estimated earnings in excess of billings are comprised principally of revenue recognized on contracts (on the percentage-of-completion method) for which billings had not been presented to customers because the amounts were not billable under the contract terms at the balance sheet date. In accordance with the contract terms, any unbilled receivables at period end will be billed subsequently. Amounts are billed based on contractual terms. Billings in excess of costs and estimated earnings represent billings in excess of revenues recognized.
Research and Development Costs
Research and development costs are expensed as incurred. These costs consist primarily of consulting fees, salaries and direct payroll related costs.
Stock-Based Compensation
We measure the cost of services received in exchange for an award of equity instruments based on the fair value of the award. For employees and directors, the fair value of the award is measured on the grant date and for non-employees, the fair value of the award is generally re-measured on vesting dates and interim financial reporting dates until the service period is complete. The fair value amount is then recognized over the period during which services are required to be provided in exchange for the award, usually the vesting period.
As of December 31, 2017, we had 1,050,000 options outstanding to purchase shares of common stock, none of which were vested.
Recent Accounting Pronouncements
In May 2014, the Financial Accounting Standards Board (“FASB”) issued accounting standard update (“ASU”) No. 2014-09, “Revenue from Contracts with Customers (Topic 606)” (“ASU 2014-09”). The standard’s core principle is that a company will recognize revenue when it transfers promised goods or services to customers in an amount that reflects the consideration to which the company expects to be entitled in exchange for those goods or services. In doing so, companies will need to use more judgment and make more estimates than under previous guidance. This may include identifying performance obligations in the contract, estimating the amount of variable consideration to include in the transaction price and allocating the transaction price to each separate performance obligation. In July 2015, the FASB approved the proposal to defer the effective date of ASU 2014-09 standard by one year. Early adoption was permitted after December 15, 2016, and the standard became effective for public entities for annual reporting periods beginning after December 15, 2017 and interim periods therein. In 2016, the FASB issued final amendments to clarify the implementation guidance for principal versus agent considerations (ASU No. 2016-08), accounting for licenses of intellectual property and identifying performance obligations (ASU No. 2016-10), narrow-scope improvements and practical expedients (ASU No. 2016-12) and technical corrections and improvements to ASU 2014-09 (ASU No. 2016-20) in its new revenue standard. We have performed a review of the requirements of the new revenue standard and are monitoring the activity of the FASB and the transition resource group as it relates to specific interpretive guidance. We reviewed customer contracts, applied the five-step model of the new standard to our contracts, and compared the results to our current accounting practices. We are currently in the process of drafting disclosures required by the new standard. Based on our analysis to date, we do not believe that the adoption of this standard will have a material effect on our financial statements, but will potentially require us to expand our disclosures related to contracts with customers.
In March 2016, the FASB issued ASU No. 2016-09, “Improvements to Employee Share-based Payment Accounting” (“ASU 2016-09”). ASU 2016-09 simplifies several aspects of the accounting for employee share-based payment transactions for both public and nonpublic entities, including the accounting for income taxes, forfeitures, and statutory tax withholding requirements, as well as classification in the statement of cash flows. ASU 2016-09 is effective for annual periods beginning after December 15, 2016, and interim periods within those annual periods. The accounting standard currently adopted does not have a material effect on our financial statements. The adoption of ASU 2016-09 did not have a material impact on our financial statements.
During January 2016, the FASB issued ASU No. 2016-01, “Financial Instruments — Overall: Recognition and Measurement of Financial Assets and Financial Liabilities (“ASU 2016-01”). The standard addresses certain aspects of recognition, measurement, presentation, and disclosure of financial instruments. This ASU is effective for fiscal years, and interim periods within those years, beginning after December 15, 2017. Early adoption is not permitted with the exception of certain provisions related to the presentation of other comprehensive income. The adoption of ASU 2016-01 is not expected to have a material impact on our financial position, results of operations or cash flows.
| 25 |
During February 2016, the FASB issued ASU No. 2016-02, “Leases” (“ASU 2016-02”). The standard requires lessees to recognize a lease liability and a lease asset for all leases, including operating leases, with a term greater than 12 months on its balance sheet. The update also expands the required quantitative and qualitative disclosures surrounding leases. ASU 2016-02 is effective for fiscal years beginning after December 15, 2018, including interim periods within those fiscal years. The adoption of ASU 2016-02 is not expected to have a material impact on our financial position, results of operations or cash flows due to an insignificant number of leases that we have entered into.
In August 2016, FASB issued ASU No. 2016-15, “Classification of Certain Cash Receipts and Cash Payments” (“ASU 2016-15”). ASU 2016-15 clarifies the presentation and classification of certain cash receipts and cash payments in the statement of cash flows. ASU 2016-15 is effective for fiscal years, and interim periods within those years beginning after December 15, 2017. Early adoption is permitted. We do not expect the adoption of ASU No. 2016-15 to have a material impact on our financial statements.
In May 2017, the FASB issued ASU No. 2017-09, Compensation – Stock Compensation (Topic 718): Scope of Modification Accounting (“ASU 2017-09”) to clarify when to account for a change to the terms or conditions of a share-based payment award as a modification. Under this new guidance, modification accounting is required if the fair value, vesting conditions, or classification of the award changes as a result of the change in terms or conditions. ASU 2017-09 is effective for annual reporting periods beginning after December 15, 2017, including interim reporting periods within each annual reporting period. We do not expect the adoption of this guidance to have a material impact on the financial statements.
Management does not believe there would have been a material effect on the accompanying financial statements had any other recently issued, but not yet effective, accounting standards been adopted in the current period.
ITEM 7A – QUANTITATIVE AND QUALITATIVE DISCLOSURES ABOUT MARKET RISK
Not required under Regulation S-K for “smaller reporting companies.”
| 26 |
ITEM 8 - FINANCIAL STATEMENTS AND SUPPLEMENTARY DATA
H/CELL ENERGY CORPORATION
| F-1 |
REPORT OF INDEPENDENT REGISTERED PUBLIC ACCOUNTING FIRM
To
the Board of Directors and
Stockholders of H/Cell Energy Corporation
Opinion on the Financial Statements
We have audited the accompanying balance sheets of H/Cell Energy Corporation (the Company) as of December 31, 2017 and 2016, and the related statements of operations and comprehensive income, stockholders’ equity, and cash flows for each of the years in the two-year period ended December 31, 2017, and the related notes (collectively referred to as the financial statements). In our opinion, the financial statements present fairly, in all material respects, the financial position of the Company as of December 31, 2017 and 2016, and the results of its operations and its cash flows for each of the years in the two-year period ended December 31, 2017, in conformity with accounting principles generally accepted in the United States of America.
Basis for Opinion
These financial statements are the responsibility of the Company’s management. Our responsibility is to express an opinion on the Company’s financial statements based on our audits. We are a public accounting firm registered with the Public Company Accounting Oversight Board (United States) (PCAOB) and are required to be independent with respect to the Company in accordance with the U.S. federal securities laws and the applicable rules and regulations of the Securities and Exchange Commission and the PCAOB.
We conducted our audits in accordance with the standards of the PCAOB. Those standards require that we plan and perform the audit to obtain reasonable assurance about whether the financial statements are free of material misstatement, whether due to error or fraud. The Company is not required to have, nor were we engaged to perform, an audit of its internal control over financial reporting. As part of our audits, we are required to obtain an understanding of internal control over financial reporting, but not for the purpose of expressing an opinion on the effectiveness of the Company’s internal control over financial reporting. Accordingly, we express no such opinion.
Our audits included performing procedures to assess the risks of material misstatement of the financial statements, whether due to error or fraud, and performing procedures that respond to those risks. Such procedures included examining, on a test basis, evidence regarding the amounts and disclosures in the financial statements. Our audits also included evaluating the accounting principles used and significant estimates made by management, as well as evaluating the overall presentation of the financial statements. We believe that our audits provide a reasonable basis for our opinion.
/s/ Rosenberg Rich Baker Berman, P.A.
| |
| We have served as the Company’s auditor since 2015. | |
| Somerset, New Jersey | |
April 2, 2018 |
|
| F-2 |
PART I – FINANCIAL INFORMATION
ITEM 1. FINANCIAL STATEMENTS
CONDENSED CONSOLIDATED BALANCE SHEETS
| December 31, 2017 | December 31, 2016 | |||||||
| (As restated) | ||||||||
| ASSETS | ||||||||
| Current assets: | ||||||||
| Cash and cash equivalents | $ | 455,700 | $ | 537,867 | ||||
| Accounts receivable (net retention) | 808,050 | 650,886 | ||||||
| Prepaid expenses | 14,669 | 14,168 | ||||||
| Costs and earnings in excess of billings | 51,531 | 91,904 | ||||||
| Total current assets | 1,329,950 | 1,294,825 | ||||||
| Property and equipment, net | 102,573 | 99,816 | ||||||
| Security deposits and other non-current assets | 8,416 | 8,497 | ||||||
| Deferred tax asset | 44,257 | - | ||||||
| Total assets | $ | 1,485,196 | $ | 1,403,138 | ||||
| LIABILITIES AND STOCKHOLDERS’ EQUITY | ||||||||
| Current liabilities: | ||||||||
| Accounts payable and accrued expenses | $ | 631,385 | $ | 661,237 | ||||
| Management fees payable – related party | 31,257 | 52,000 | ||||||
| Billings in excess of costs and earnings | 87,206 | 83,538 | ||||||
| Sales tax payable | 61,239 | 114,085 | ||||||
| Income tax payable | 98,313 | - | ||||||
| Total current liabilities | $ | 909,400 | $ | 910,860 | ||||
| Commitments and contingencies | ||||||||
| Stockholders’ equity | ||||||||
| Preferred Stock - $0.0001 par value; 5,000,000 shares authorized; 0 shares issued and outstanding | - | - | ||||||
| Common Stock - $0.0001 par value; 25,000,000 shares authorized; 3,131,579 shares issued and outstanding as of December 31, 2017 and December 31, 2016, respectively | 704 | 313 | ||||||
| Additional paid-in capital | 1,335,656 | 1,283,422 | ||||||
| Accumulated deficit | (731,754 | ) | (740,651 | ) | ||||
| Accumulated other comprehensive loss | (28,810 | ) | (50,806 | ) | ||||
| Total stockholders’ equity | 575,796 | 492,278 | ||||||
| TOTAL LIABILITIES & STOCKHOLDERS’ EQUITY | $ | 1,485,196 | $ | 1,403,138 | ||||
The accompanying notes are an integral part of these audited consolidated financial statements.
| F-3 |
H/CELL ENERGY CORPORATION
CONDENSED CONSOLIDATED STATEMENT OF OPERATIONS – OTHER COMPREHENSIVE INCOME
For the Year Ended December 31, | ||||||||
| 2017 | 2016 | |||||||
| (As restated) | ||||||||
| Revenue | ||||||||
| Construction income | $ | 6,266,967 | $ | 4,978,576 | ||||
| Related party | 85,919 | 28,527 | ||||||
| Total revenue | 6,352,886 | 5,007,103 | ||||||
| Cost of goods sold | ||||||||
| Direct costs | 4,241,421 | 3,355,176 | ||||||
| Direct costs – related party | 87,649 | 1,500 | ||||||
| Total cost of goods sold | 4,329,070 | 3,356,676 | ||||||
| Gross profit | 2,023,816 | 1,650,427 | ||||||
| Operating expenses | ||||||||
| Research and development | - | 2,000 | ||||||
| General and administrative expenses | 1,776,859 | 2,197,139 | ||||||
| Management fees – related party | 184,004 | 158,015 | ||||||
| Total operating expenses | 1,960,863 | 2,357,154 | ||||||
| Income (Loss) from operations | 62,953 | (706,727 | ) | |||||
| Income tax | 54,056 | - | ||||||
| Net income (loss) | $ | 8,897 | $ | (706,727 | ) | |||
| Other comprehensive income (loss), net | ||||||||
| Foreign currency translation adjustment | 21,996 | 183,230 | ||||||
| Comprehensive income (loss) | $ | 30,893 | $ | (523,524 | ) | |||
| Earnings (Loss) per share | ||||||||
| Basic | $ | 0.00 | $ | (0.25 | ) | |||
| Diluted | $ | 0.00 | $ | (0.25 | ) | |||
| Weighted average common shares outstanding | ||||||||
| Basic | 6,703,223 | 2,853,785 | ||||||
| Diluted | 7,699,743 | 2,853,785 | ||||||
The accompanying notes are an integral part of these audited consolidated financial statements.
| F-4 |
H/CELL ENERGY CORPORATION
CONSOLIDATED STATEMENTS OF STOCKHOLDERS’ EQUITY
FOR THE YEARS ENDED DECEMBER 31, 2017 AND 2016
| Common Stock | Preferred Stock | |||||||||||||||||||||||||||||||
| Number
of Shares | Amount | Number
of shares | Amount | Additional Paid-In Capital | Accumulated Deficit | Accumulated Other Comprehensive Loss | Total Stockholders’ Equity | |||||||||||||||||||||||||
| Beginning, January 1, 2016 | 2,105,263 | $ | 211 | - | $ | - | $ | 446,074 | $ | (33,924 | ) | $ | (49,495 | ) | $ | 362,866 | ||||||||||||||||
| Issuance of common stock | 1,026,316 | 102 | - | - | 449,898 | - | - | 450,000 | ||||||||||||||||||||||||
| Stock-based compensation expense | - | - | - | - | 387,450 | - | - | 387,450 | ||||||||||||||||||||||||
| Net (loss) income | - | - | - | - | - | (706,727 | ) | (1,311 | ) | (708,038 | ) | |||||||||||||||||||||
| Ending, December 31, 2016 | 3,131,579 | $ | 313 | - | $ | - | 1,283,422 | $ | (740,651 | ) | $ | (50,806 | ) | $ | 492,278 | |||||||||||||||||
| Issuance of common stock January 2017, Pride Acquisition | 3,800,000 | 380 | - | - | (380 | ) | - | - | - | |||||||||||||||||||||||
| Common stock issued for services | 10,000 | 1 | - | - | 4,999 | - | - | 5,000 | ||||||||||||||||||||||||
| Stock-based compensation expense | - | - | - | - | 46,625 | - | - | 46,625 | ||||||||||||||||||||||||
| Proceeds from stock option exercise | 100,000 | 10 | - | - | 990 | - | - | 1,000 | ||||||||||||||||||||||||
| Net income | - | - | - | - | - | 8,897 | 21,996 | 30,893 | ||||||||||||||||||||||||
| Ending, December 31, 2017 | 7,041,579 | $ | 704 | - | $ | - | 1,335,656 | $ | (731,754 | ) | $ | (28,810 | ) | $ | 575,796 | |||||||||||||||||
The accompanying notes are an integral part of these audited consolidated financial statements.
| F-5 |
H/CELL ENERGY CORPORATION
CONSOLIDATED STATEMENT OF CASH FLOWS
| For the Year Ended December 31, | ||||||||
| 2017 | 2016 | |||||||
| (As restated) | ||||||||
| CASH FLOWS FROM OPERATING ACTIVITIES: | ||||||||
| Net income (loss) | $ | 8,897 | $ | (706,727 | ) | |||
| Adjustments to reconcile net income (loss) to net cash (used in) provided by operating activities: | ||||||||
| Depreciation and amortization | 32,585 | 22,117 | ||||||
| Stock-based compensation | 51,625 | 387,450 | ||||||
| Change in deferred tax asset | (44,257 | ) | - | |||||
| Loss on the sale of assets | (77 | ) | (25,319 | ) | ||||
| Change in operating assets and liabilities: | ||||||||
| Accounts and retainage receivable | (157,164 | ) | 682,866 | |||||
| Prepaid expenses and other costs | (420 | ) | (5,822 | ) | ||||
| Costs in excess of billings | 40,373 | 66,933 | ||||||
| Accounts payable and accrued expenses | (5,128 | ) | (247,383 | ) | ||||
| Billings in excess of costs | 3,668 | (53,845 | ) | |||||
| Net cash (used in) provided by operating activities | (69,898 | ) | 120,270 | |||||
| CASH FLOWS FROM INVESTING ACTIVITIES | ||||||||
| Purchase of fixed assets | (36,943 | ) | (83,560 | ) | ||||
| Proceeds from disposition of property and equipment | 11,969 | 20,077 | ||||||
| Net cash used in investing activities | (24,974 | ) | (63,483 | ) | ||||
| CASH FLOWS FROM FINANCING ACTIVITIES | ||||||||
| Proceeds from issuance of common stock, net | - | 341,601 | ||||||
| Proceeds related to stock option exercises | 1,000 | - | ||||||
| Repayment to stockholders | - | (5,420 | ) | |||||
| Net cash provided by financing activities | 1,000 | 336,181 | ||||||
| Net increase (decrease) in cash and cash equivalents | (93,872 | ) | 392,968 | |||||
| Effect of foreign currency translation on cash | 11,705 | 3,567 | ||||||
| Cash and cash equivalents, beginning of period | 537,867 | 141,332 | ||||||
| Cash and cash equivalents, end of period | $ | 455,700 | $ | 537,867 | ||||
The accompanying notes are an integral part of these audited consolidated financial statements.
| F-6 |
H/CELL ENERGY CORPORATION
NOTES TO CONDENSED CONSOLIDATED FINANCIAL STATEMENTS
DECEMBER 31, 2017 AND 2016
| 1. | ORGANIZATION AND LINE OF BUSINESS |
H/Cell Energy Corporation (the “Company”) was incorporated in the state of Nevada on August 17, 2015. The Company, based in Flemington, N.J., is a company whose principal operations consist of designing and installing hydrogen energy systems. Effective January 31, 2017, the Company acquired The Pride Group (QLD) Pty Ltd, an Australian company (“Pride”) (see Note 10). Founded in 1997, Pride is a provider of security systems integration for a variety of customers in the government and commercial sector and has launched a new clean energy systems division to focus on the high growth renewable energy market in Asia-Pacific. The new clean energy division has not generated any revenue but has begun to bid work and expects to have projects completed in 2018.
The Company has developed a hydrogen energy system for residential and commercial use designed to create electricity. This unique system uses renewable energy as its source for hydrogen production. It functions as a self-sustaining clean energy system. It can be configured as an off grid solution for all electricity needs or it can be connected to the grid to generate energy credits. Its production of hydrogen is truly eco-friendly, as it is not produced by the use of fossil fuels. It is a revolutionary green-energy concept that is safe, renewable, self-sustaining and cost effective.
| 2. | SUMMARY OF SIGNIFICANT ACCOUNTING POLICIES |
Basis of Presentation
The accompanying financial statements have been prepared in accordance with accounting principles generally accepted in the United States of America (“GAAP”).
Use of Estimates
The preparation of financial statements in conformity with accounting principles generally accepted in the United States of America requires management to make estimates and assumptions that affect the reported amounts of assets and liabilities, disclosure of contingent assets and liabilities at the date of the financial statements, and the reported amounts of revenues and expenses during the reporting period. Actual results could differ from those estimates. The Company bases its estimates on historical experience and on various other assumptions that are believed to be reasonable in the circumstances, the results of which form the basis for making judgments about the carrying values of assets and liabilities that are not readily apparent from other sources. Actual results may differ from these estimates under different assumptions or conditions.
Accounts and Retainage Receivable
Accounts receivable are recorded when invoices are issued and are presented in the balance sheet net of the allowance for doubtful accounts. The allowance for doubtful accounts is estimated based on the Company’s historical losses, the existing economic conditions in the construction industry, and the financial stability of its customers. Accounts are written off as uncollectible after collection efforts have failed. In addition, the Company does not generally charge interest on past-due accounts or require collateral. At December 31, 2017 and 2016, there was no allowance for doubtful accounts required.
Many of the contracts under which the Company performs work contain retainage provisions. Retainage refers to that portion of billings made by the Company but held for payment by the customer pending satisfactory completion of the project. Unless reserved, the Company assumes that all amounts retained by customers under such provisions are fully collectible. Retainage on active contracts is classified as a current asset regardless of the term of the contract and is generally collected within one year of the completion of a contract.
Property and Equipment, and Depreciation
Property and equipment are stated at cost. Depreciation is generally provided using the straight-line method over the estimated useful lives of the related assets. Leasehold improvements are amortized on a straight-line basis over the shorter of the remaining term of the lease or the estimated useful life of the improvement.
Repairs and maintenance that do not improve or extend the lives of the property and equipment are charged to expense as incurred.
| F-7 |
H/CELL ENERGY CORPORATION
NOTES TO CONDENSED CONSOLIDATED FINANCIAL STATEMENTS
DECEMBER 31, 2017 AND 2016
Comprehensive Income (Loss)
Comprehensive income (loss) consists of two components, net income (loss) and other comprehensive income (loss). The Company’s other comprehensive income (loss) is comprised of foreign currency translation adjustments.
Foreign Currency Translation
The Company translates its foreign subsidiary’s assets and liabilities denominated in foreign currencies into U.S. dollars at current rates of exchange as of the balance sheet date and income and expense items at the average exchange rate for the reporting period. Translation adjustments resulting from exchange rate fluctuations are recorded in accumulated other comprehensive income. The Company records gains and losses from changes in exchange rates on transactions denominated in currencies other than each reporting location’s functional currency in net income (loss) for each period.
Revenue Recognition
Revenues and related costs on construction contracts are recognized using the “percentage of completion method” of accounting in accordance with the Financial Accounting Standards Board (“FASB”) Accounting Standards Codification (“ASC”) 605-35, Accounting for Performance of Construction-Type and Certain Production Type Contracts. Under this method, contract revenues and related expenses are recognized over the performance period of the contract in direct proportion to the costs incurred as a percentage of total estimated costs for the entirety of the contract. Costs include direct material, direct labor, subcontract labor and any allocable indirect costs. All un-allocable indirect costs and corporate general and administrative costs are charged to the periods as incurred.
Revenues and expenses related to service and maintenance contracts are booked when costs are incurred and billed when the job is complete.
Revisions in cost and profit estimates during the course of the contract are reflected in the accounting period in which the facts, which require the revision, become known. Provisions for estimated losses on uncompleted contracts are made in the period in which such losses are determined. Changes in job performance, job conditions, and estimated profitability, including those arising from contract penalty provisions, and final contract settlements may result in revisions to costs and income and are recognized in the period in which the revisions are determined.
Cash and Cash Equivalents
Cash and cash equivalents includes cash in bank and money market funds as well as other highly liquid investments with an original maturity of three months or less. The Company had no cash equivalents as of December 31, 2017 or 2016. At times during the years ended December 31, 2017 and 2016, balances exceeded the FDIC insurance limit of $250,000.
Research and Development Costs
Research and development costs are expensed as incurred. These costs consist primarily of consulting fees, salaries and direct payroll related costs.
Stock-Based Compensation
The Company recognizes expense for its stock-based compensation based on the fair value of the awards at the time they are granted. We estimate the value of stock option awards on the date of grant using the Black-Scholes model. The determination of the fair value of stock-based payment awards on the date of grant is affected by our stock price as well as assumptions regarding a number of complex and subjective variables. These variables include our expected stock price volatility over the term of the awards, expected term, risk-free interest rate, expected dividends and expected forfeiture rates. The forfeiture rate is estimated using historical option cancellation information, adjusted for anticipated changes in expected exercise and employment termination behavior. Our outstanding awards do not contain market or performance conditions.
| F-8 |
H/CELL ENERGY CORPORATION
NOTES TO CONDENSED CONSOLIDATED FINANCIAL STATEMENTS
DECEMBER 31, 2017 AND 2016
Income Taxes
The Company uses the asset and liability method of accounting for income taxes pursuant to FASB ASC 740, Income Taxes (“ASC 740”). Under this method, deferred tax assets and liabilities are recognized for the future tax consequences attributable to differences between the financial statement carrying amounts of existing assets and liabilities and their respective tax bases. Deferred tax assets, including tax loss and credit carryforwards, and liabilities are measured using enacted tax rates expected to apply to taxable income in the years in which those temporary differences are expected to be recovered or settled. The effect on deferred tax assets and liabilities of a change in tax rates is recognized in income in the period that includes the enactment date. Deferred income tax expense represents the change during the period in the deferred tax assets and deferred tax liabilities. The components of the deferred tax assets and liabilities are individually classified as current and non-current based on their characteristics. Deferred tax assets are reduced by a valuation allowance when it is more likely than not that some portion or all of the deferred tax assets will not be realized.
The determination of the Company’s provision for income taxes requires significant judgment, the use of estimates, and the interpretation and application of complex tax laws. Significant judgment is required in assessing the timing and amounts of deductible and taxable items and the probability of sustaining uncertain tax positions. The benefits of uncertain tax positions are recorded in the Company’s financial statements only after determining a more-likely-than-not probability that the uncertain tax positions will withstand challenge, if any, from taxing authorities. When facts and circumstances change, the Company reassesses these probabilities and records any changes in the financial statements as appropriate. Accrued interest and penalties related to income tax matters are classified as a component of income tax expense.
The Company recognizes and measures its unrecognized tax benefits in accordance with ASC 740. Under that guidance, management assesses the likelihood that tax positions will be sustained upon examination based on the facts, circumstances and information, including the technical merits of those positions, available at the end of each period. The measurement of unrecognized tax benefits is adjusted when new information is available, or when an event occurs that requires a change.
The Company did not identify any material uncertain tax positions. The Company did not recognize any interest or penalties for unrecognized tax benefits.
The federal income tax returns of the Company are subject to examination by the IRS, generally for the three years after they are filed. The Company’s 2016 and 2015 income tax returns are still open for examination by the taxing authorities.
Fair Value of Financial Instruments
The carrying value of cash and cash equivalents, accounts payable and accrued liabilities, and short-term borrowings, as reflected in the balance sheets, approximate fair value because of the short-term maturity of these instruments. All other significant financial assets, financial liabilities and equity instruments of the Company are either recognized or disclosed in the financial statements together with other information relevant for making a reasonable assessment of future cash flows, interest rate risk and credit risk. Where practicable the fair values of financial assets and financial liabilities have been determined and disclosed; otherwise only available information pertinent to fair value has been disclosed.
Net Income (Loss) Per Common Share
The Company computes basic net income (loss) per share by dividing net income (loss) per share available to common stockholders by the weighted average number of common shares outstanding for the period and excludes the effects of any potentially dilutive securities. Diluted earnings per share, if presented, would include the dilution that would occur upon the exercise or conversion of all potentially dilutive securities into common stock using the “treasury stock” and/or “if converted” methods as applicable. The computation of diluted loss per share excludes dilutive securities for the year ended December 31, 2016 because its inclusion would be anti-dilutive. Potentially-dilutive securities excluded from the computation of basic and diluted net loss per share for the year ended December 31, 2016 are as follows:
| F-9 |
H/CELL ENERGY CORPORATION
NOTES TO CONDENSED CONSOLIDATED FINANCIAL STATEMENTS
DECEMBER 31, 2017 AND 2016
| December 31, 2016 | ||||
| Options to purchase common stock | 1,000,000 | |||
| Totals | 1,000,000 | |||
| 3. | RELATED PARTY TRANSACTIONS |
The Company’s current office space consists of approximately 800 square feet, which is donated to it from one of its executive officers. There is no lease agreement and the Company pays no rent.
Effective February 4, 2016, the Company sold 526,316 shares of common stock to Reza Enterprises, Inc., an entity beneficially owned by Rezaul Karim. In connection with, and as a condition of closing, the Company agreed to appoint Rezaul Karim to its board of directors. Rezaul Karim resigned from the board of directors effective April 1, 2017. On April 1, 2017, the Company entered into a consulting agreement with Rezaul Karim for a period of one year. As such his function will be to promote our products and services. In April 2017, Rezaul Karim exercised 100,000 options.
In June 2016, the Company entered into a contract with Rezaul Karim, then one of its directors, for the installation of an HC-1 system, which has been modified from time to time to increase the scope of the project. The system installation was approximately 76% complete as of December 31, 2017 and generated $85,919 of revenue for the year ended December 31, 2017. The Company subcontracted the installation of the system to Renewable Energy Holdings LLC (“REH”), a company owned by Mike Strizki, one of the Company’s executive officers. James Strizki, one of the Company’s executive officers and former director, is vice president of operations at REH. Costs incurred were $87,649 for REH for the year ended December 31, 2017. At December 31, 2016, the job was 21% complete and generated $12,374 of revenue and costs incurred were $12,127.
The Company has entered into agreements to indemnify its directors and executive officers, in addition to the indemnification provided for in the Company’s articles of incorporation and bylaws. These agreements, among other things, provide for indemnification of the Company’s directors and executive officers for certain expenses (including attorneys’ fees), judgments, fines and settlement amounts incurred by any such person in any action or proceeding, including any action by or in the right of the Company, arising out of such person’s services as a director or executive officer of the Company, any subsidiary of the Company or any other company or enterprise to which the person provided services at the Company’s request. The Company believes that these provisions and agreements are necessary to attract and retain qualified persons as directors and executive officers.
At December 31, 2017 and 2016, the balances due to Turquino Equity LLC, a significant shareholder owned by Andrew and Matthew Hidalgo, who are the Company’s chief executive officer and chief financial officer, respectively, amounted to approximately $31,000 and $52,000, respectively. These balances represent expenses for management services. For the years ended December 31, 2017 and 2016, management fees expensed totaled approximately $184,000 and $158,000, respectively.
| 4. | SIGNIFICANT CONCENTRATIONS OF CREDIT RISK |
Cash is maintained at an authorized deposit-taking institution (bank) incorporated in both the United States and Australia and is insured by the U.S. Federal Deposit Insurance Corporation and Australian Securities & Investments Commission up to $250,000 and approximately $186,000 USD in total, respectively.
Credit risk for trade accounts is concentrated as well because substantially all of the balances are receivable from entities located within certain geographic regions. To reduce credit risk, the Company performs ongoing credit evaluations of its customers’ financial conditions, but does not generally require collateral. In addition, at December 31, 2017, approximately 36% of the Company’s accounts receivable was due from three unrelated customers, 14%, 12% and 10%, respectively; and, at December 31, 2016, approximately 26% was due from one customer.
| F-10 |
H/CELL ENERGY CORPORATION
NOTES TO CONDENSED CONSOLIDATED FINANCIAL STATEMENTS
DECEMBER 31, 2017 AND 2016
| 5. | MAJOR CUSTOMERS |
During the year ended December 31, 2017, there were three customers with a concentration of 10% or higher of the Company’s revenue, with one at 24%, and two at 12%. For the year ended December 31, 2016, there were no customers with a concentration of 10% or higher.
| 6. | PROPERTY AND EQUIPMENT |
At December 31, 2017 and December 31, 2016, property and equipment were comprised of the following:
| December 31, 2017 | December 31, 2016 | |||||||
| Furniture and fixtures (5 to 7 years) | $ | 6,857 | $ | 6,320 | ||||
| Machinery and equipment (5 to 7 years) | 35,919 | 34,480 | ||||||
| Computer and software (3 to 5 years) | 94,761 | 79,098 | ||||||
| Auto and truck (5 to 7 years) | 250,044 | 227,456 | ||||||
| Leasehold improvements (life of lease) | 40,608 | 37,425 | ||||||
| 428,189 | 384,779 | |||||||
| Less accumulated depreciation | 325,616 | 284,963 | ||||||
| $ | 102,573 | $ | 99,816 | |||||
Depreciation expense for the years ended December 31, 2017 and 2016 amounted to $31,985 and $21,517, respectively.
| 7. | UNCOMPLETED CONTRACTS |
Costs, estimated earnings and billings on uncompleted contracts are summarized as follows at December 31, 2017 and December 31, 2016:
| December 31, 2017 | December 31, 2016 | |||||||
| Costs incurred on uncompleted contracts | $ | 2,485,787 | $ | 2,193,406 | ||||
| Estimated earnings | 779,598 | 629,086 | ||||||
| Costs and estimated earnings on uncompleted contracts | 3,265,385 | 2,822,492 | ||||||
| Billings to date | 3,553,817 | 2,558,700 | ||||||
| Costs and estimated earnings in excess of billings on uncompleted contracts | (288,432 | ) | 263,792 | |||||
| Costs and earnings in excess of billings on completed contracts | (252,757 | ) | 255,426 | |||||
| $ | (35,675 | ) | $ | 8,366 | ||||
| The above accounts are shown in the accompanying consolidated balance sheets under these captions at December 31, 2017 and 2016: | ||||||||
| Costs in excess of billings | $ | 51,531 | $ | 91,904 | ||||
| Billings in excess of cost | (87,206 | ) | (83,538 | ) | ||||
| $ | (35,675 | ) | $ | 8,366 | ||||
| 8. | LEASES |
The Company entered into two operating leases for office space in Woombye and Brisbane, Queensland, Australia, both expiring in April 2018. The future minimum payments on the leases for the next year and in the aggregate amount to the following:
| Year Ending December 31, | ||||
| 2018 | $ | 28,000 | ||
| $ | 28,000 | |||
Rent expense for each of the years ended December 31, 2017 and 2016 amounted to approximately $90,000 and is included in “General and Administrative” expenses on the related statements of operations.
| F-11 |
H/CELL ENERGY CORPORATION
NOTES TO CONDENSED CONSOLIDATED FINANCIAL STATEMENTS
DECEMBER 31, 2017 AND 2016
| 9. | CONTRACT BACKLOG |
As of December 31, 2017, the Company had a contract backlog approximating $1,091,816, with anticipated direct costs to completion approximating $808,098. At December 31, 2016, the Company had a contract backlog approximating $2,184,117 with anticipated direct costs to completion approximating $1,777,140.
| 10. | ACQUISITION UNDER COMMON CONTROL |
On January 31, 2017 (the “Closing Date”), the Company entered into a share exchange agreement (the “Exchange Agreement”) by and among the Company, The Pride Group (QLD) Pty Ltd., an Australian corporation (“Pride”), Turquino Equity LLC (“Turquino”) and Stephen Paul Mullane and Marie Louise Mullane as Trustees of the Mullane Family Trust (the “Mullane Trust” and together with Turquino, the “Pride Shareholders”). Andrew Hidalgo and Matthew Hidalgo, the Company’s Chief Executive Officer and Chief Financial Officer, respectively, are each a managing partner of Turquino.
Pursuant to the Exchange Agreement, the Company acquired all of the issued and outstanding capital stock of Pride from the Pride Shareholders in exchange for an aggregate of 3,800,000 shares of the Company’s common stock (the “Acquisition Shares”). As a result, the combination of the Company and Pride pursuant to the Exchange Agreement is considered a business combination of companies under common control and was accounted for in a manner similar to a pooling-of-interests. The accompanying financial statements have been retrospectively restated as a result of an acquisition of another company under common control with the Company, which was completed in January 2017.
| 11. | STOCK OPTIONS AWARDS AND GRANTS |
A summary of the stock option activity and related information for the 2016 Incentive Stock Option Plan from December 31, 2015 to December 31, 2017 is as follows:
| Shares | Weighted- Average Exercise Price | Weighted-Average Remaining Contractual Term | Aggregate Intrinsic Value | |||||||||||||
| Outstanding at December 31, 2015 | - | |||||||||||||||
| Grants | 1,000,000 | $ | 0.01 | 5.00 | $ | 387,450 | ||||||||||
| Exercised | - | |||||||||||||||
| Canceled | - | |||||||||||||||
| Outstanding at December 31, 2016 | 1,000,000 | $ | 0.01 | 3.19 | $ | 387,450 | ||||||||||
| Grants | 150,000 | 1.83 | 4.35 | 165,477 | ||||||||||||
| Exercised | (100,000 | ) | 0.01 | - | (38,745 | ) | ||||||||||
| Canceled | - | |||||||||||||||
| Outstanding at December 31, 2017 | 1,050,000 | $ | 0.27 | 3.35 | 514,182 | |||||||||||
| Exercisable at December 31, 2017 | - | $ | - | - | $ | - | ||||||||||
The aggregate intrinsic value in the preceding table represents the total pretax intrinsic value, based on options with an exercise price less than the Company’s weighted average grant date stock price of $0.473 per share which would have been received by the option holders had those option holders exercised their options as of that date. It also includes options granted at exercise prices of $2.00 and $1.50, which were equal to the closing sales price of the Corporation’s common stock on the dates of grant.
Option valuation models require the input of highly subjective assumptions. The fair value of stock-based payment awards was estimated using the Black-Scholes option model with a volatility figure derived from an index of historical stock prices of comparable entities until sufficient data exists to estimate the volatility using the Company’s own historical stock prices. Management determined this assumption to be a more accurate indicator of value.
| F-12 |
H/CELL ENERGY CORPORATION
NOTES TO CONDENSED CONSOLIDATED FINANCIAL STATEMENTS
DECEMBER 31, 2017 AND 2016
The Company accounts for the expected life of options based on the contractual life of options for non-employees. For incentive options granted to employees, the Company accounts for the expected life in accordance with the “simplified” method, which is used for “plain-vanilla” options, as defined in the accounting standards codification. The risk-free interest rate was determined from the implied yields of U.S. Treasury zero-coupon bonds with a remaining life consistent with the expected term of the options. The fair value of stock-based payment awards was estimated using the Black-Scholes pricing model.
During the year ended December 31, 2017, the Company granted an aggregate of 150,000 options to purchase shares of the Company’s common stock in connection with the services rendered at the exercise price of $2.00 and $1.50 per share for a term of five years, vesting at various dates, and have approximate fair value of $156,477. During the year ended December 31, 2016, the Company granted an aggregate of 1,000,000 options to purchase shares of the Company’s common stock in connection with the services rendered at the exercise price of $0.01 per share for a term of five years, vesting immediately, and have approximate fair value of $387,450. These options vesting dates were then amended to various dates in the future and approved by the Board.
The following table presents information related to stock options at December 31, 2017:
| Options Outstanding | Options Exercisable | |||||||||||||
| Weighted | ||||||||||||||
| Average | Exercisable | |||||||||||||
| Exercise | Number of | Remaining Life | Number of | |||||||||||
| Price | Options | In Years | Options | |||||||||||
| $ | 0.01 | 900,000 | 3.19 | - | ||||||||||
| $ | 1.50 | 50,000 | 4.54 | - | ||||||||||
| $ | 2.00 | 100,000 | 4.26 | - | ||||||||||
As of December 31, 2017, there was $110,366 of unrecognized compensation expense. At December 31, 2016, there was no unrecognized compensation expense.
| 12. | SEGMENT INFORMATION |
The Company’s business is organized into two reportable segments: renewable systems integration revenue and non-renewable systems integration revenue. Asset information by operating segment is not presented below since the Company’s chief operating decision maker (“CODM”) does not review this information by segment. The Company’s CODM is its chief executive officer. The reporting segments follow the same accounting policies used in the preparation of the Company’s unaudited consolidated financial statements. The following represents selected information for the Company’s reportable segments for the years ended December 31, 2017 and 2016.
| For the Year Ended | ||||||||
| December 31, 2017 | December 31, 2016 | |||||||
| Revenue by segment | ||||||||
| Renewable systems integration | $ | 85,919 | $ | 28,527 | ||||
| Non-renewable system integration | 6,266,967 | 4,978,576 | ||||||
| $ | 6,352,886 | $ | 5,007,103 | |||||
| Cost of sales by segment | ||||||||
| Renewable systems integration | $ | 87,649 | $ | 1,500 | ||||
| Non-renewable system integration | 4,241,421 | 3,355,176 | ||||||
| $ | 4,329,070 | $ | 3,556,676 | |||||
| Operating expenses | ||||||||
| Renewable systems integration | $ | 261,118 | $ | 478,834 | ||||
| Non-renewable system integration | 1,699,745 | 1,878,320 | ||||||
| $ | 1,960,863 | $ | 2,357,154 | |||||
| Operating (loss) income by segment | ||||||||
| Renewable systems integration | $ | (262,633 | ) | $ | (478,415 | ) | ||
| Non-renewable system integration | 325,586 | (228,312 | ) | |||||
| $ | 62,953 | $ | (706,727 | ) | ||||
| F-13 |
H/CELL ENERGY CORPORATION
NOTES TO CONDENSED CONSOLIDATED FINANCIAL STATEMENTS
DECEMBER 31, 2017 AND 2016
| 13. | RECENT ACCOUNTING PRONOUNCEMENTS |
In May 2014, the FASB issued accounting standard update (“ASU”) No. 2014-09, “Revenue from Contracts with Customers (Topic 606)” (“ASU 2014-09”). The standard’s core principle is that a company will recognize revenue when it transfers promised goods or services to customers in an amount that reflects the consideration to which the company expects to be entitled in exchange for those goods or services. In doing so, companies will need to use more judgment and make more estimates than under previous guidance. This may include identifying performance obligations in the contract, estimating the amount of variable consideration to include in the transaction price and allocating the transaction price to each separate performance obligation. In July 2015, the FASB approved the proposal to defer the effective date of ASU 2014-09 standard by one year. Early adoption was permitted after December 15, 2016, and the standard became effective for public entities for annual reporting periods beginning after December 15, 2017 and interim periods therein. In 2016, the FASB issued final amendments to clarify the implementation guidance for principal versus agent considerations (ASU No. 2016-08), accounting for licenses of intellectual property and identifying performance obligations (ASU No. 2016-10), narrow-scope improvements and practical expedients (ASU No. 2016-12) and technical corrections and improvements to ASU 2014-09 (ASU No. 2016-20) in its new revenue standard. The Company has performed a review of the requirements of the new revenue standard and is monitoring the activity of the FASB and the transition resource group as it relates to specific interpretive guidance. The Company reviewed customer contracts, applied the five-step model of the new standard to its contracts, and compared the results to its current accounting practices. The Company is currently in the process of drafting disclosures required by the new standard. Based on its analysis to date, the Company does not believe that the adoption of this standard will have a material effect on its financial statements, but will potentially require the Company to expand its disclosures related to contracts with customers.
In March 2016, FASB issued ASU No. 2016-09, “Improvements to Employee Share-based Payment Accounting” (“ASU 2016-09”). ASU 2016-09 simplifies several aspects of the accounting for employee share-based payment transactions for both public and nonpublic entities, including the accounting for income taxes, forfeitures, and statutory tax withholding requirements, as well as classification in the statement of cash flows. ASU 2016-09 is effective for annual periods beginning after December 15, 2016, and interim periods within those annual periods. As a result of adoption, there was no material effect on the Company’s accompanying consolidated financial statements.
During January 2016, the FASB issued ASU No. 2016-01, “Financial Instruments — Overall: Recognition and Measurement of Financial Assets and Financial Liabilities (“ASU 2016-01”). The standard addresses certain aspects of recognition, measurement, presentation, and disclosure of financial instruments. This ASU is effective for fiscal years, and interim periods within those years, beginning after December 15, 2017. Early adoption is not permitted with the exception of certain provisions related to the presentation of other comprehensive income. The Company is still analyzing the adoption of ASU 2016-01, but it is not expected to have a material impact on the Company’s financial position, results of operations or cash flows.
During February 2016, the FASB issued ASU No. 2016-02, “Leases” (“ASU 2016-02”). The standard requires lessees to recognize a lease liability and a lease asset for all leases, including operating leases, with a term greater than 12 months on its balance sheet. The update also expands the required quantitative and qualitative disclosures surrounding leases. ASU 2016-02 is effective for fiscal years beginning after December 15, 2018, including interim periods within those fiscal years. The adoption of ASU 2016-02 is not expected to have a material impact on the Company’s financial position, results of operations or cash flows due to an insignificant number of leases that the Company has entered into.
In August 2016, FASB issued ASU No. 2016-15, “Classification of Certain Cash Receipts and Cash Payments” (“ASU 2016-15”). ASU 2016-15 clarifies the presentation and classification of certain cash receipts and cash payments in the statement of cash flows. ASU 2016-15 is effective for fiscal years, and interim periods within those years beginning after December 15, 2017. Early adoption is permitted. The Company does not expect the adoption of ASU No. 2016-15 to have a material impact on its financial statements.
| F-14 |
H/CELL ENERGY CORPORATION
NOTES TO CONDENSED CONSOLIDATED FINANCIAL STATEMENTS
DECEMBER 31, 2017 AND 2016
In May 2017, the FASB issued ASU No. 2017-09, Compensation – Stock Compensation (Topic 718): Scope of Modification Accounting (“ASU 2017-09”) to clarify when to account for a change to the terms or conditions of a share-based payment award as a modification. Under this new guidance, modification accounting is required if the fair value, vesting conditions, or classification of the award changes as a result of the change in terms or conditions. ASU 2017-09 is effective for annual reporting periods beginning after December 15, 2017, including interim reporting periods within each annual reporting period. The Company does not expect the adoption of this guidance to have a material impact on the financial statements.
Management does not believe there would have been a material effect on the accompanying financial statements had any other recently issued, but not yet effective, accounting standards been adopted in the current period.
| 14. | NET INCOME (LOSS) PER SHARE |
The following table sets forth the information needed to compute basic and diluted earnings per share:
| Year
Ended December 31, 2017 | Year
Ended December 31, 2016 | |||||||
| Net income (loss) | $ | 8,897 | $ | (706,727 | ) | |||
| Weighted average common shares outstanding | 6,703,223 | 2,853,785 | ||||||
| Dilutive securities | ||||||||
| Options | 996,521 | 0 | ||||||
| Diluted weighted average common shares outstanding | 7,699,743 | 2,853,785 | ||||||
| Basic net income (loss) per share | $ | 0.00 | (0.25 | ) | ||||
| Diluted net income (loss) per share | $ | 0.00 | (0.25 | ) | ||||
For the years ended December 31, 2017 and 2016, certain potential shares of common stock have been excluded from the calculation of diluted income per share because of a net loss, and therefore, the effect on diluted income per share would have been anti-dilutive.
| 15. | INCOME TAXES |
The components of income tax expense (benefit) are as follows (in thousands):
| Year Ended December 31, | ||||||||
| 2017 | 2016 | |||||||
| Current | ||||||||
| U.S. Federal | $ | - | $ | - | ||||
| U.S. State and local | - | - | ||||||
| Australia | 98 | - | ||||||
| Total current | 98 | - | ||||||
| Deferred | ||||||||
| U.S. Federal | $ | - | $ | - | ||||
| U.S. State and local | - | - | ||||||
| Australia | (44 | ) | - | |||||
| Total deferred | (44 | ) | - |
| Total income tax expense (benefit) | 54 | - |
At December 31, 2017 and 2016, we had deferred tax assets of $235,000 and $41,000, respectively, against which a valuation allowance of $191,000 and $41,000, respectively, had been recorded. The change in the valuation allowance for the year ended December 31, 2017 was an increase of $150,000. The increase in the valuation allowance for the year ended December 31, 2017 was mainly attributable to increases in U.S. net operating
losses and share-based compensation, which resulted in an increase in our deferred tax assets. We established valuation allowances equal to the full amount of our U.S. deferred tax assets because of the uncertainty of the realization of these deferred tax assets in future periods. We periodically assess the likelihood that we will be able to recover the deferred tax assets. We consider all available evidence, both positive and negative, including historical levels of income, expectations and risks associated with estimates of future taxable income.
Significant components of our deferred tax assets at December 31, 2017 and 2016 were as follows ($ in thousands):
| December 31, | ||||||||
| 2017 | 2016 | |||||||
| Deferred tax assets: | ||||||||
| Net operating loss carryforwards – U.S. | $ | 68 | 41 | |||||
| Share-based compensation | 123 | - | ||||||
| Accrued liabilities | 44 | - | ||||||
| Gross deferred tax assets | 235 | 41 | ||||||
| Valuation allowance | (191 | ) | (41 | ) | ||||
| Net deferred tax assets | $ | 44 | $ | - | ||||
A reconciliation between taxes computed at the federal statutory rate and the consolidated effective tax rate is as follows:
| For the Year Ended | ||||||||
| December 31, | ||||||||
| 2017 | 2016 | |||||||
| U.S. federal statutory tax rate | 34.0 | % | 34.0 | % | ||||
| State income taxes, net of federal benefit | (67.2 | ) | 5.9 | |||||
| U.S. vs. foreign tax rate differential | (20.7 | ) | - | |||||
| Impact of tax law change | 140.5 | - | ||||||
| Deferred tax adjustments | (205.7 | ) | - | |||||
| Deemed repatriation | 34.7 | - | ||||||
| Other | (8.1 | ) | - | |||||
| Change in valuation allowance | 178.4 | (39.9 | ) | |||||
| Effective tax rate | 85.9 | % | - | % | ||||
We had approximately $235,000 and $97,000 of gross net operating loss (“NOL”) carryforwards (U.S. federal and state) as of December 31, 2017 and 2016, respectively, which begin to expire after 2036 through 2037. Sections 382 and 383 of the Internal Revenue Code, and similar state regulations, contain provisions that may limit the NOL carryforwards available to be used to offset income in any given year upon the occurrence of certain events, including changes in the ownership interests of significant stockholders. In the event of a cumulative change in ownership in excess of 50% over a three-year period, the amount of the NOL carryforwards that the Company may utilize in any one year may be limited.
The Tax Cuts and Jobs Act (the “Act”) was enacted in December 2017. Among other things, the Act reduces the U.S. federal corporate tax rate from 35 percent to 21 percent, eliminates the alternative minimum tax (“AMT”) for corporations, and creates a one-time deemed repatriation of profits earned outside of the U.S. The reduction of the corporate tax rate resulted in a write-down of our gross deferred tax assets of approximately $88,000, and a corresponding write-down of the valuation allowance. The one-time deemed repatriation of profits by our Australian subsidiary resulted in a decrease in our NOL of approximately $64,000.
| 16. | SUBSEQUENT EVENTS |
In accordance with FASB ASC 855, Subsequent Events, the Company has evaluated subsequent events through April 2, 2018, the date on which these financial statements were available to be issued.
On January 2, 2018, the Company entered into a securities purchase agreement with two of its directors that are accredited investors; Andrew Hidalgo and Michael Doyle, pursuant to which it sold an aggregate principal amount of $400,000 in 12% Convertible debentures, convertible into shares of the Company’s common stock, par value $0.0001 per share at a conversion price of $0.75 per share. The debentures, together with any accrued and unpaid interest, become due and payable on January 2, 2020.
On February 1, 2018, the Company acquired PVBJ for $1 million of the Company’s common stock and $221,800 in cash. Established in 2008 and historically profitable, PVBJ is well recognized for the design, installation, maintenance and emergency service of environmental systems both in residential and commercial markets. PVBJ is now expanding into renewable energy systems.
| F-15 |
ITEM 9 - CHANGES IN AND DISAGREEMENTS WITH ACCOUNTANTS ON ACCOUNTING AND FINANCIAL DISCLOSURES
None.
ITEM 9A – CONTROLS AND PROCEDURES
Evaluation of disclosure controls and procedures.
Our management, with the participation of our Chief Executive Officer and Chief Financial Officer, evaluated the effectiveness of our disclosure controls and procedures pursuant to Rule 13a-15 under the Exchange Act. In designing and evaluating the disclosure controls and procedures, management recognizes that any controls and procedures, no matter how well designed and operated, can provide only reasonable assurance of achieving the desired control objectives. In addition, the design of disclosure controls and procedures must reflect the fact that there are resource constraints and that management is required to apply its judgment in evaluating the benefits of possible controls and procedures relative to their costs.
Based on management’s evaluation, our Chief Executive Officer and Chief Financial Officer concluded that, as a result of the material weaknesses described below, our disclosure controls and procedures are not designed at a reasonable assurance level and are ineffective to provide reasonable assurance that information we are required to disclose in reports that we file or submit under the Exchange Act is recorded, processed, summarized, and reported within the time periods specified in SEC rules and forms, and that such information is accumulated and communicated to our management, including our chief executive officer and chief financial officer, as appropriate, to allow timely decisions regarding required disclosure. The material weaknesses, which relate to internal control over financial reporting, that were identified are:
| a) | Due to our small size, we did not have sufficient personnel in our accounting and financial reporting functions. As a result, we were not able to achieve adequate segregation of duties and were not able to provide for adequate review of the financial statements. This control deficiency, which is pervasive in nature, results in a reasonable possibility that material misstatements of the consolidated financial statements will not be prevented or detected on a timely basis; and | |
| b) | We lacked sufficient written policies and procedures for accounting and financial reporting with respect to the requirements and application of U.S. GAAP and SEC disclosure requirements. |
We intend to create written policies and procedures for accounting and financial reporting with respect to the requirements and application of U.S. GAAP and SEC disclosure requirements in the future.
We will continue to monitor and evaluate the effectiveness of our disclosure controls and procedures and our internal controls over financial reporting on an ongoing basis and are committed to taking further action and implementing additional enhancements or improvements, as necessary and as funds allow.
Changes in internal control over financial reporting.
There were no changes in our internal control over financial reporting that occurred during the quarter ended December 31, 2017 that have materially affected, or are reasonably likely to materially affect, our internal control over financial reporting.
Management’s report on internal control over financial reporting.
Our management is responsible for establishing and maintaining adequate internal control over financial reporting for our company. Internal control over financial reporting is defined in Rule 13a-15(f) and 15d-15(f) promulgated under the Exchange Act, as a process designed by, or under the supervision of, a company’s principal executive and principal financial officer and effected by the our board of directors, management and other personnel, to provide reasonable assurance regarding the reliability of financial reporting and the preparation of financial statements for external purposes in accordance with generally accepted accounting principles and includes those policies and procedures that:
| (1) | pertain to the maintenance of records that, in reasonable detail, accurately and fairly reflect the transactions and dispositions of the assets of the company; | |
| (2) | provide reasonable assurance that transactions are recorded as necessary to permit preparation of financial statements in accordance with generally accepted accounting principles, and that receipts and expenditures of the company are being made in accordance with authorizations of management and directors of the company; and | |
| (3) | provide reasonable assurance regarding prevention or timely detection of unauthorized acquisition, use or disposition of the company’s assets that could have a material effect on the financial statements. |
| 27 |
Because of its inherent limitations, internal control over financial reporting may not prevent or detect misstatements. Projections of any evaluation of effectiveness to future periods are subject to the risk that controls may become inadequate because of changes in conditions, or that the degree of compliance with the policies or procedures may deteriorate. Management recognizes that any controls and procedures, no matter how well designed and operated, can provide only reasonable assurance of achieving their objectives and management necessarily applies its judgment in evaluating the cost-benefit relationship of possible enhancements to controls and procedures.
We conducted an evaluation of the effectiveness of internal control over financial reporting based on the framework in Internal Control — Integrated Framework (2013) issued by the Committee of Sponsoring Organizations of the Treadway Commission. Based on this evaluation, our principal executive officer and principal financial officer conclude that, at December 31, 2017, our internal control over financial reporting was not effective for the reason discussed above.
This annual report does not include an attestation report by Rosenberg Rich Baker Berman, P.A., our independent registered public accounting firm regarding internal control over financial reporting. As a smaller reporting company, our management’s report was not subject to attestation by our registered public accounting firm pursuant to rules of the Securities and Exchange Commission that permit us to provide only management’s report in this annual report.
None.
| 28 |
ITEM 10 – DIRECTORS, EXECUTIVE OFFICERS AND CORPORATE GOVERNANCE
The names of our executive officers and directors and their age, title, and biography as of March 30, 2018 are set forth below:
| Name | Age | Position Held with our Company | Date
First Elected or Appointed | |||
| Andrew Hidalgo | 61 | Chief Executive Officer, President, Chairman of the Board and Director | August 17, 2015 | |||
| Matthew Hidalgo | 35 | Chief Financial Officer, Treasurer and Secretary | August 17, 2015 | |||
| Mike Strizki | 60 | Chief Technology Officer | August 17, 2015 | |||
| James Strizki | 34 | Executive Vice President of Technical Services | August 17, 2015 | |||
| Paul V. Benis, Jr. | 46 | Executive Vice President | February 1, 2018 | |||
| Michael A. Doyle | 63 | Director | April 3, 2017 | |||
| Charles F. Benton | 67 | Director | April 3, 2017 |
Business Experience
The following is a brief account of the education and business experience of each director and executive officer of our Company, indicating the person’s principal occupation during that period, and the name and principal business of the organization in which such occupation and employment were carried out.
Andrew Hidalgo – Chief Executive Officer, President, Chairman of the Board and Director.
Andy is responsible for strategic direction, business development and investor relations. Andy has over 25 years of experience in business planning, operations, mergers, acquisitions, financing, corporate governance and SEC compliance. Andy has been a Managing Partner at Turquino Equity LLC (“Turquino”) since its formation in August 2013. Turquino is a global investment firm that focuses on private equity investments, mergers and acquisitions. Andy founded WPCS International Incorporated (“WPCS”), a NASDAQ-listed, design-build engineering services company, and served as Chairman, CEO and President between November 2001 and July 2013. WPCS raised over $40 million of equity financing and acquired 19 companies on three continents during Andy’s tenure. Andy also has prior experience included operational and business development roles with 3M, Schlumberger and General Electric, where he was also a member of the corporate business development committee. Andy’s significant executive leadership experience was instrumental in his selection as a member of the board of directors.
Matthew Hidalgo – Chief Financial Officer, Treasurer and Secretary.
Matt is responsible for financial management and operations. Matt has over 10 years of experience in finance, accounting, operations, restructuring and the integration of acquisitions. Matt has been a Managing Partner at Turquino since its formation in August 2013. Between February 2010 and December 2013, he was the controller and operations manager for WPCS International – Trenton, Inc., WPCS’ largest subsidiary, managing over $30 million in annual revenue. Between February 2008 and February 2010, Matt managed accounting functions for several Australian subsidiaries of WPCS. After graduating Pennsylvania State University with a B.S. in Accounting, he began his career as an accountant for PriceWaterhouse Coopers LLP, where he focused on preparing financial statements and partnership allocations for hedge funds and private equity firms.
Mike Strizki – Chief Technology Officer.
Mike is responsible for research and development. Developer of the concept, Mike converted his own home to run on solar-hydrogen power in 2006. This included a hydrogen vehicle fueling station. The home serves as the flagship prototype for his accomplishments. Mike founded Renewable Energy Holdings LLC, or REH, a project management firm, in July 2008 and remains its sole managing member. Mike has served as the executive director of the Hydrogen House Project, a non-profit organization focused on the development of an affordable solar hydrogen energy system for residential and commercial properties, since Mike founded it in 2003. Between 1983 and 1999, Mike worked for the New Jersey Department of Transportation, where he developed two fuel cell vehicles for the state. Previously, he has assisted in the development of the Peugeot Fuel Cell Fire Engine and the Duffy Fuel Cell Electric Boat. Mike has obtained several patents for his prior work, which patents do not relate to our operations.
| 29 |
James Strizki – Executive Vice President of Technical Services
James is responsible for outlining the project scope, generating quotes, project management, site permits and system implementation. He manages our technical resources in assuring a high quality and efficient installation that meets the customer’s expectations. After graduating Rutgers University in 2006 with a degree in Civil Engineering, James worked for the New Jersey Department of Transportation between July 2006 and October 2011 as a project engineer focused on the structural evaluation of transportation infrastructure. Since October 2011, James has been the vice president of operations of REH, where his responsibilities encompassed CADD design, solar array layouts and vendor management. James holds a Professional Engineering License and a Home Inspection License. James’ significant experience with our HC-1 system was instrumental in his selection as a member of the board of directors.
Paul V. Benis, Jr. – Executive Vice President
With over 20 years of experience in the design and implementation of environmental systems, Mr. Benis is responsible for the management of designated subsidiaries. He has served as President of PVBJ Inc. since founding it in July 2008, which is an environmental systems integrator. Prior to establishing PVBJ, Mr. Benis held operation and management positions with Mauger & Company and Reedy Industries, where his focus covered project management, service operations and business development. Mr. Benis received his certification in environmental systems from Technical Careers Institute, Windsor, Connecticut.
Michael A. Doyle – Director
For over 25 years, Mr. Doyle was a key executive for Comcast Corporation where he was the President of the largest division of the multi-billion dollar Comcast Cable group representing over 18,000 employees. Mr. Doyle has been recognized by the National Cable Television Association with induction into its prestigious Cable Pioneers organization. He has also served as chairman of the management board for New England Cable News. Mr. Doyle has received the Distinguished Communications Award for Excellence in Journalism from the International Association of Business Communicators. Mr. Doyle received his B.A. from Drew University where he is also a member of their Athletic Hall of Fame.
Charles F. Benton – Director
Mr. Benton has over 30 years of experience in finance, operations and business development with major corporations. Formerly, he directed the distribution services and supply chain for Ascena Retail Group, Inc. which is a leading national specialty retailer of women’s apparel operating over 1,800 retail stores in the United States. Mr. Benton also worked 20 years for Consolidated Rail Corporation (CONRAIL) where he was responsible for finance, operations and business development. Between July 2012 and January 2018, Mr. Benton served as a director of, and chaired the audit committee of, DropCar, Inc. (formerly, WPCS International Incorporated), and served as the chairman of the Board between August 2015 and January 2018. Mr. Benton is a graduate of St. Joseph’s University with a B.S. degree in Accounting.
Family Relationships
Matthew Hidalgo is the son of Andrew Hidalgo and James Strizki is the son of Mike Strizki.
Board Independence and Committees
We are not required to have any independent members of the Board of Directors. The board of directors has determined that (i) Andrew Hidalgo has a relationship with the company which, in the opinion of the board of directors, would not allow him to be considered as an “independent director” as defined in the Marketplace Rules of The NASDAQ Stock Market.
As of the date of this annual report, we do not have any active Board committees and the Board as a whole carries out the functions of audit, nominating and compensation committees. We expect our Board of Directors, in the future, to appoint an audit committee, nominating committee and compensation committee, and to adopt charters relative to each such committee. We intend to appoint such persons to committees of the Board of Directors as are expected to be required to meet the corporate governance requirements imposed by a national securities exchange, although we are not required to comply with such requirements until we elect to seek a listing on a national securities exchange. In addition, we intend that a majority of our directors will be independent directors, of which at least one director will qualify as an “audit committee financial expert,” within the meaning of Item 407(d)(5) of Regulation S-K, as promulgated by the SEC. We do not currently have an “audit committee financial expert” since we currently do not have an audit committee in place.
Except as may be provided in our bylaws, we do not currently have specified procedures in place pursuant to which whereby security holders may recommend nominees to the Board of Directors.
| 30 |
Code of Ethics
We have adopted a Code of Business Conduct and Ethics that applies to all of our directors, officers and employees. A copy of the Code of Business Conduct and Ethics is incorporated by reference as an exhibit.
Section 16(a) Beneficial Ownership Reporting Compliance
Section 16(a) of the Securities Exchange Act of 1934, as amended, requires our directors, executive officers and holders of more than 10% of our common stock to file with the SEC reports regarding their ownership and changes in ownership of our securities. We believe that, during fiscal 2017, our directors, executive officers and 10% stockholders complied with all Section 16(a) filing requirements.
Involvement in Certain Legal Proceedings
Our Directors and Executive Officers have not been involved in any of the following events during the past ten years:
| 1. | any bankruptcy petition filed by or against such person or any business of which such person was a general partner or executive officer either at the time of the bankruptcy or within two years prior to that time; | |
| 2. | any conviction in a criminal proceeding or being subject to a pending criminal proceeding (excluding traffic violations and other minor offenses); | |
| 3. | being subject to any order, judgment, or decree, not subsequently reversed, suspended or vacated, of any court of competent jurisdiction, permanently or temporarily enjoining him from or otherwise limiting his involvement in any type of business, securities or banking activities or to be associated with any person practicing in banking or securities activities; | |
| 4. | being found by a court of competent jurisdiction in a civil action, the Securities and Exchange Commission or the Commodity Futures Trading Commission to have violated a federal or state securities or commodities law, and the judgment has not been reversed, suspended, or vacated; | |
| 5. | being subject of, or a party to, any federal or state judicial or administrative order, judgment decree, or finding, not subsequently reversed, suspended or vacated, relating to an alleged violation of any federal or state securities or commodities law or regulation, any law or regulation respecting financial institutions or insurance companies, or any law or regulation prohibiting mail or wire fraud or fraud in connection with any business entity; or | |
| 6. | being subject of or party to any sanction or order, not subsequently reversed, suspended, or vacated, of any self-regulatory organization, any registered entity or any equivalent exchange, association, entity or organization that has disciplinary authority over its members or persons associated with a member. |
ITEM 11 – EXECUTIVE COMPENSATION
Executive Officer Compensation
No cash compensation has been paid to any executive officer since inception through December 31, 2017. The Board started paying cash salaries to one executive officer in 2018. In addition, equity compensation may be granted to executive officers pursuant to the 2016 Plan, at the discretion of the Board.
The following table provides certain summary information concerning compensation awarded to, earned by or paid to our Chief Executive Officer and one other highest paid individual whose total annual salary and bonus exceeded $100,000 for fiscal years 2017 and 2016.
| 31 |
| Name
& Principal Position | Year | Salary
($) | Bonus
($) | Stock
Awards ($) | Option
Awards ($) | Other
($) | Total ($) | |||||||||||||||||||
| Andrew Hidalgo | 2017 | - | - | - | - | 184,000 | (1) | 184,000 | ||||||||||||||||||
| Chief Executive Officer | 2016 | - | - | - | 77,940 | 158,000 | (1) | 235,940 | ||||||||||||||||||
| Matthew Hidalgo | 2017 | - | - | - | 184,000 | (1) | 184,000 | |||||||||||||||||||
| Chief Financial Officer | 2016 | - | - | - | 77,940 | 158,000 | (1) | 235,940 | ||||||||||||||||||
| Jarrett Husid | 2017 | - | - | - | - | - | ||||||||||||||||||||
| Project Manager | 2016 | 116,235 | 116,235 | |||||||||||||||||||||||
| (1) | Represents management fees paid to Turquino Equity LLC, of which Mr. Hidalgo is a managing partner. |
Option/SAR Grants in Fiscal Year Ended December 31, 2017
None.
Outstanding Equity Awards at Fiscal Year-End Table
The following table sets forth information for the named executive officers regarding the number of shares subject to both exercisable and unexercisable stock options, as well as the exercise prices and expiration dates thereof, as of December 31, 2017.
| Name | Number
of Securities underlying Unexercised Options (#) Exercisable (1) | Number
of Securities underlying Unexercised Options (#) Unexercisable | Option Exercise Price ($/Sh) | Option Expiration Date | ||||||||||
| Andrew Hidalgo | - | 200,000 | $ | 0.01 | 3/10/2026 | |||||||||
| Matthew Hidalgo | - | 200,000 | $ | 0.01 | 3/10/2026 | |||||||||
| James Strizki | - | 100,000 | $ | 0.01 | 3/10/2026 | |||||||||
Employment Contracts and Termination of Employment and Change-In-Control Arrangements
On September 1, 2017, we entered into employment agreements (the “Agreements”) with Andrew Hidalgo to serve as our President and Chief Executive Officer and Matthew Hidalgo to serve as our Chief Financial Officer. The Agreements are effective as of the date that Messrs. Hidalgo and Hidalgo, either directly or indirectly (including through Turquino Equity LLC and any other entity affiliated with Messrs. Hidalgo and Hidalgo) are no longer entitled to receive compensation from The Pride Group (Qld) Pty Ltd., a wholly-owned subsidiary, or any other subsidiary, direct or indirect, of our company. Effective January 2018, Mr. Matthew Hidalgo started to receive salary, while Mr. Andrew Hidalgo continues to receive compensation through Turquino Equity LLC.
The Agreements have a term of five years. Upon each one year anniversary, the Agreements will automatically renew for another five years from the anniversary date. The base salary under the Agreements is $156,000 and $150,000 per annum for Andrew Hidalgo and Matthew Hidalgo, respectively. In addition, Messrs. Hidalgo and Hidalgo are entitled to participate in any and all benefit plans, from time to time, in effect for our employees, along with vacation, sick and holiday pay in accordance with our policies established and in effect from time to time.
Director Compensation
The following table sets forth summary information concerning the total compensation paid to our non-employee directors in 2017 for services to our company.
| Name | Option Awards ($) | Total ($) | ||||||
| Michael A. Doyle | $ | 53,826 | $ | 53,826 | ||||
| Charles F. Benton | 53,826 | 53,826 | ||||||
| Total: | $ | 107,653 | $ | 107,653 | ||||
| 32 |
ITEM 12 – SECURITY OWNERSHIP OF CERTAIN BENEFICIAL OWNERS AND MANAGEMENT AND RELATED STOCKHOLDER MATTERS
The following table sets forth certain information regarding beneficial ownership of our common stock as of March 30, 2018:
| ● | by each person who is known by us to beneficially own more than 5% of our common stock; | |
| ● | by each of our officers and directors; and | |
| ● | by all of our officers and directors as a group. |
Unless otherwise indicated in the footnotes to the following table, each person named in the table has sole voting and investment power and that person’s address is c/o H/Cell Energy Corporation, 97 River Road, Flemington, NJ 08822.
| NAME OF OWNER | TITLE
OF CLASS | NUMBER
OF SHARES OWNED (1) | PERCENTAGE
OF COMMON STOCK (2) | |||||||
| Andrew Hidalgo | Common Stock | 3,806,667 | (3) | 49.10 | % | |||||
| Matthew Hidalgo | Common Stock | 3,540,000 | (4) | 47.29 | % | |||||
| Paul Benis | Common Stock | 444,445 | (5) | 5.94 | % | |||||
| James Strizki | Common Stock | 750,000 | 10.02 | % | ||||||
| Mike Strizki | Common Stock | 750,000 | 10.02 | % | ||||||
| Charles Benton | Common Stock | 32,400 | (6) | * | ||||||
| Michael Doyle | Common Stock | 306,667 | (7) | 3.94 | % | |||||
| Officers and Directors as a Group (5 persons) | Common Stock | 6,090,179 | (8) | 75.47 | % | |||||
| Stephen Paul Mullane and Marie Louise Mullane as Trustees of the Mullane Family Trust | Common Stock | 760,000 | 10.15 | % | ||||||
| Turquino Equity LLC (9) | Common Stock | 3,540,000 | 47.29 | % | ||||||
| Karim Rezaul | Common Stock | 726,316 | (10) | 8.36 | % | |||||
| Benis Holdings LLC (11) | Common Stock | 444,445 | 5.94 | % | ||||||
(1) Beneficial Ownership is determined in accordance with the rules of the SEC and generally includes voting or investment power with respect to securities. Shares of common stock subject to options or warrants currently exercisable or convertible, or exercisable or convertible within 60 days of March 30, 2018 are deemed outstanding for computing the percentage of the person holding such option or warrant but are not deemed outstanding for computing the percentage of any other person.
(2) Percentage based upon 7,486,024 shares of common stock issued and outstanding as of March 30, 2018.
(3) Includes (i) 266,667 shares of common stock issuable upon conversion of an outstanding convertible debenture and (ii) 3,540,000 shares of common stock owned by Turquino Equity LLC. Andrew Hidalgo, as a Managing Partner of Turquino Equity, has voting and dispositive power over the shares held by such entity, and is therefore deemed a beneficial owner of such shares.
(4) Represents shares of common stock owned by Turquino Equity LLC. Matthew Hidalgo, as a Managing Partner of Turquino Equity, has voting and dispositive power over the shares held by such entity, and is therefore deemed a beneficial owner of such shares.
(5) Represents shares of common stock owned by Benis Holdings LLC. Paul Benis, as Managing Member of Benis Holdings LLC, has voting and dispositive power over the shares held by such entity, and is therefore deemed a beneficial owner of such shares.
(6) Includes 25,000 shares of common stock underlying options which are currently exercisable or become exercisable within 60 days.
(7) Includes 266,667 shares of common stock issuable upon conversion of an outstanding convertible debenture and 25,000 shares of common stock underlying options which are currently exercisable or become exercisable within 60 days.
(8) Includes (i) 533,334 shares of common stock issuable upon conversion of outstanding convertible debentures, (ii) 50,000 shares of common stock underlying options which are currently exercisable or become exercisable within 60 days, (iii) 3,540,000 shares of common stock owned by Turquino Equity LLC, and (iv) 444,445 shares of common stock owned by Benis Holdings LLC
(9) Andrew Hidalgo and Matthew Hidalgo, as Managing Partners of Turquino Equity, have voting and dispositive power over the shares held by such entity, and are therefore deemed beneficial owners of such shares.
(10) Includes (i) 100,000 shares of common stock underlying options which are currently exercisable or become exercisable within 60 days and (ii) 526,316 shares of common stock held by Reza Enterprises. Rezaul Karim, as Chief Executive Officer of Reza Enterprises, has voting and dispositive power over the shares held by such entity, and is therefore deemed a beneficial owner of such shares.
(11) Paul Benis, as Managing Member of Benis Holdings LLC, has voting and dispositive power over the shares held by such entity, and is therefore deemed a beneficial owner of such shares.
| 33 |
ITEM 13 – CERTAIN RELATIONSHIPS AND RELATED TRANSACTIONS, AND DIRECTOR INDEPENDENCE
Other than as disclosed below, since our inception in 2015, there have been no transactions, or proposed transactions, in which our company was or is to be a participant where the amount involved exceeds the lesser of $120,000 or one percent of the average of our company’s total assets at year-end and in which any director, executive officer or beneficial holder of more than 5% of the outstanding common, or any of their respective relatives, spouses, associates or affiliates, has had or will have any direct or material indirect interest. We have no policy regarding entering into transactions with affiliated parties.
Our current office space consists of approximately 800 square feet, which is donated to us from one of our executive officers. There is no lease agreement and we pay no rent.
Effective February 4, 2016, we sold 526,316 shares of common stock to Reza Enterprises, Inc., an entity beneficially owned by Rezaul Karim. In connection with, and as a condition of closing, we agreed to appoint Rezaul Karim to our Board. Rezaul Karim resigned from the board of directors effective April 1, 2017.
In June 2016, the Company entered into a contract with Rezaul Karim, then one of its directors, for the installation of an HC-1 system, which has been modified from time to time to increase the scope of the project. The system installation was approximately 75% complete as of December 31, 2017 and generated $85,919 of revenue as of December 31, 2017. The Company subcontracted the installation of the system to Renewable Energy Holdings LLC (“REH”), a company owned by Mike Strizki, one of the Company’s executive officers. James Strizki, one of the Company’s executive officers and former director, is vice president of operations at REH. Costs incurred were $87,649 for REH as of December 31, 2017. At December 31, 2016, the job was 21% complete and generated $12,374 of revenue and costs incurred were $12,127.
On January 31, 2017 (the “Closing Date”), we entered into a share exchange agreement (the “Exchange Agreement”) by and among us, The Pride Group (QLD) Pty Ltd., an Australian corporation (“Pride”), Turquino Equity LLC (“Turquino”) and Stephen Paul Mullane and Marie Louise Mullane as Trustees of the Mullane Family Trust (the “Mullane Trust” and together with Turquino, the “Pride Shareholders”). Andrew Hidalgo and Matthew Hidalgo, our Chief Executive Officer and Chief Financial Officer, respectively, are each a managing partner of Turquino. Turquino has an arrangement with Pride for a monthly management fee of $20,000 AUD. As of December 31, 2017, Pride owed Turquino $40,000 AUD. As of the date of this filing, Turquino is owed $40,000 AUD. Effective January 2018, Mr. Matthew Hidalgo started to receive salary, while Mr. Andrew Hidalgo continues to receive compensation through Turquino Equity LLC.
Pursuant to the Exchange Agreement, we acquired all of the issued and outstanding capital stock of Pride from the Pride Shareholders in exchange for an aggregate of 3,800,000 shares of our common stock (the “Acquisition Shares”). Turquino received 3,040,000 of the Acquisition Shares.
On April 1, 2017, the Company entered into a consulting agreement with Rezaul Karim for a period of one year. As such his function will be to promote our products and services. In April 2017, Rezaul Karim exercised 100,000 options.
We have entered into agreements to indemnify our directors and executive officers, in addition to the indemnification provided for in our articles of incorporation and bylaws. These agreements, among other things, provide for indemnification of our directors and executive officers for certain expenses (including attorneys’ fees), judgments, fines and settlement amounts incurred by any such person in any action or proceeding, including any action by or in the right of our company, arising out of such person’s services as a director or executive officer of ours, any subsidiary of ours or any other company or enterprise to which the person provided services at our request. We believe that these provisions and agreements are necessary to attract and retain qualified persons as directors and executive officers.
ITEM 14 – PRINCIPAL ACCOUNTING FEES AND SERVICES
Audit Fees. The aggregate fees billed by our independent auditors, for professional services rendered for the audit of our annual financial statements for the years ended December 31, 2017 and 2016, and for the reviews of the financial statements included in our Quarterly Reports on Form 10-Q during the fiscal years were $25,500 and $16,000, respectively.
Audit Related Fees. We incurred $43,225 for audit related fees and other services during the fiscal year ended December 31, 2017.
Tax and Other Fees. We did not incur any fees from our independent auditors for tax or other services during the fiscal years ended December 31, 2017 and 2016.
The Board of Directors has considered whether the provision of non-audit services is compatible with maintaining the principal accountant’s independence.
| 34 |
ITEM 15 – EXHIBITS, FINANCIAL STATEMENT SCHEDULES
| (a) | List of Documents Filed as a Part of This Report: |
| Index to Consolidated Financial Statements | F-1 | |
| Report of Independent Registered Public Accounting Firm | F-2 | |
| Balance sheets as of December 31, 2017 and 2016 | F-3 | |
| Statements of operations for the years ended December 31, 2017 and 2016 | F-4 | |
| Statements of stockholders’ equity the years ended December 31, 2017 and 2016 | F-5 | |
| Statements of cash flows for the years ended December 31, 2017 and 2016 | F-6 | |
| Notes to financial statements | F-7 |
| (b) | Index to Financial Statement Schedules: |
All schedules have been omitted because the required information is included in the consolidated financial statements or the notes thereto, or is not applicable or required.
| (c) | Index to Exhibits |
The Exhibits listed below are identified by numbers corresponding to the Exhibit Table of Item 601 of Regulation S-K. The Exhibits designated by an asterisk (*) are management contracts or compensatory plans or arrangements required to be filed pursuant to Item 15.
| 35 |
| 36 |
In accordance with the requirements of the Exchange Act, the registrant caused this report to be signed on its behalf by the undersigned, thereunto duly authorized.
| H/CELL ENERGY CORPORATION | ||
| Date:April 2, 2018 | By: | /s/ ANDREW HIDALGO |
| Andrew Hidalgo | ||
| Chief
Executive Officer (Principal Executive Officer) | ||
| Date: April 2, 2018 | By: | /s/ MATTHEW HIDALGO |
| Matthew Hidalgo | ||
| Chief
Financial Officer (Principal Financial Officer and Principal Accounting Officer) | ||
Pursuant to the requirements of the Securities Exchange Act of 1934, this report has been signed below by the following persons on behalf of the registrant and in the capacities and on the dates indicated.
| Name | Position | Date | ||
| /s/ ANDREW HIDALGO | Director | April 2, 2018 | ||
| Andrew Hidalgo | ||||
| /s/MICHAEL A. DOYLE | Director | April 2, 2018 | ||
| Michael A. Doyle | ||||
| /s/ CHARLES F. BENTON | Director | April 2, 2018 | ||
| Charles F. Benton |
| 37 |