Attached files
| file | filename |
|---|---|
| EX-32.2 - EX-32.2 - Sailpoint Technologies Holdings, Inc. | sail-ex322_235.htm |
| EX-32.1 - EX-32.1 - Sailpoint Technologies Holdings, Inc. | sail-ex321_234.htm |
| EX-31.2 - EX-31.2 - Sailpoint Technologies Holdings, Inc. | sail-ex312_236.htm |
| EX-31.1 - EX-31.1 - Sailpoint Technologies Holdings, Inc. | sail-ex311_239.htm |
| EX-23.1 - EX-23.1 - Sailpoint Technologies Holdings, Inc. | sail-ex231_420.htm |
| EX-21.1 - EX-21.1 - Sailpoint Technologies Holdings, Inc. | sail-ex211_237.htm |
| EX-10.36 - EX-10.36 - Sailpoint Technologies Holdings, Inc. | sail-ex1036_238.htm |
| EX-10.19 - EX-10.19 - Sailpoint Technologies Holdings, Inc. | sail-ex1019_240.htm |
| EX-10.17 - EX-10.17 - Sailpoint Technologies Holdings, Inc. | sail-ex1017_386.htm |
| EX-10.3 - EX-10.3 - Sailpoint Technologies Holdings, Inc. | sail-ex103_325.htm |
| EX-3.2 - EX-3.2 - Sailpoint Technologies Holdings, Inc. | sail-ex32_226.htm |
| EX-3.1 - EX-3.1 - Sailpoint Technologies Holdings, Inc. | sail-ex31_228.htm |
UNITED STATES
SECURITIES AND EXCHANGE COMMISSION
Washington, D.C. 20549
FORM 10-K
(Mark One)
|
☒ |
ANNUAL REPORT PURSUANT TO SECTION 13 OR 15(d) OF THE SECURITIES EXCHANGE ACT OF 1934 |
For the fiscal year ended December 31, 2017
OR
|
☐ |
TRANSITION REPORT PURSUANT TO SECTION 13 OR 15(d) OF THE SECURITIES EXCHANGE ACT OF 1934 FOR THE TRANSITION PERIOD FROM TO |
Commission File Number 001-38297
SailPoint Technologies Holdings, Inc.
(Exact name of Registrant as specified in its Charter)
|
Delaware |
47-1628077 |
|
(State or other jurisdiction of incorporation or organization) |
(I.R.S. Employer |
|
|
|
|
11305 Four Points Drive, Building 2, Suite 100, Austin, TX 78726 |
78726 |
|
(Address of principal executive offices) |
(Zip Code) |
Registrant’s telephone number, including area code: (512) 346-2000
Securities registered pursuant to Section 12(b) of the Act:
|
Title of each class |
|
Name of each exchange on which registered |
|
Common stock, par value $0.0001 per share |
|
New York Stock Exchange |
Securities registered pursuant to Section 12(g) of the Act: None
Indicate by check mark if the registrant is a well-known seasoned issuer, as defined in Rule 405 of the Securities Act. Yes ☐ No ☒
Indicate by check mark if the registrant is not required to file reports pursuant to Section 13 or 15(d) of the Act. Yes ☐ No ☒
Indicate by check mark whether the registrant (1) has filed all reports required to be filed by Section 13 or 15(d) of the Securities Exchange Act of 1934 during the preceding 12 months (or for such shorter period that the Registrant was required to file such reports), and (2) has been subject to such filing requirements for the past 90 days. Yes ☒ No ☐
Indicate by check mark whether the registrant has submitted electronically and posted on its corporate Website, if any, every Interactive Data File required to be submitted and posted pursuant to Rule 405 of Regulation S-T (§232.405 of this chapter) during the preceding 12 months (or for such shorter period that the Registrant was required to submit and post such files). Yes ☒ No ☐
Indicate by check mark if disclosure of delinquent filers pursuant to Item 405 of Regulation S-K (§229.405 of this chapter) is not contained herein, and will not be contained, to the best of registrant’s knowledge, in definitive proxy or information statements incorporated by reference in Part III of this Form 10-K or any amendment to this Form 10-K. ☒
Indicate by check mark whether the registrant is a large accelerated filer, an accelerated filer, a non-accelerated filer, a smaller reporting company, or emerging growth company. See the definition of “large accelerated filer,” “accelerated filer,” “smaller reporting company,” and “emerging growth company” in Rule 12b-2 of the Exchange Act.
|
Large accelerated filer |
|
☐ |
|
Accelerated filer |
|
☐ |
|||||
|
|
|
|
|
||||||||
|
Non-accelerated filer |
|
☒ (Do not check if a smaller reporting company) |
|
Smaller reporting company |
|
☐ |
|||||
|
|
|
|
|
|
|
|
|||||
|
Emerging growth company |
|
☒ |
|
|
|
||||||
If an emerging growth company, indicate by check mark if the registrant has elected not to use the extended transition period for complying with any new or revised financial accounting standards provided pursuant to Section 13(a) of the Exchange Act. ☐
Indicate by check mark whether the registrant is a shell company (as defined in Rule 12b-2 of the Exchange Act). Yes ☐ No ☒
As of June 30, 2017, the last business day of the registrant’s most recently completed second fiscal quarter, the registrant’s equity was not listed on a domestic exchange or over-the-counter market. The registrant’s common stock began trading on the New York Stock Exchange on November 17, 2017.
The registrant had 87,205,120 shares of common stock outstanding as of March 15, 2018.
|
|
|
Page |
|
PART I |
|
|
|
Item 1. |
3 |
|
|
Item 1A. |
15 |
|
|
Item 1B. |
44 |
|
|
Item 2. |
44 |
|
|
Item 3. |
44 |
|
|
Item 4. |
44 |
|
|
|
|
|
|
PART II |
|
|
|
Item 5. |
45 |
|
|
Item 6. |
48 |
|
|
Item 7. |
Management’s Discussion and Analysis of Financial Condition and Results of Operations |
50 |
|
Item 7A. |
75 |
|
|
Item 8. |
77 |
|
|
Item 9. |
Changes in and Disagreements with Accountants on Accounting and Financial Disclosure |
112 |
|
Item 9A. |
112 |
|
|
Item 9B. |
113 |
|
|
|
|
|
|
PART III |
|
|
|
Item 10. |
114 |
|
|
Item 11. |
119 |
|
|
Item 12. |
Security Ownership of Certain Beneficial Owners and Management and Related Stockholder Matters |
126 |
|
Item 13. |
Certain Relationships and Related Transactions, and Director Independence |
133 |
|
Item 14. |
136 |
|
|
|
|
|
|
PART IV |
|
|
|
Item 15. |
137 |
|
|
Item 16. |
141 |
|
|
|
142 |
|
i
SPECIAL NOTE ABOUT FORWARD-LOOKING STATEMENTS
This Annual Report on Form 10-K contains forward-looking statements within the meaning of the federal securities laws, which statements involve substantial risks and uncertainties. Forward-looking statements generally relate to future events or our future financial or operating performance. All statements of historical fact included in this Annual Report on Form 10-K regarding our strategy, future operations, financial position, estimated revenues and losses, projected costs, prospects, plans and objectives of management are forward-looking statements. In some cases, you can identify forward-looking statements because they contain words such as “may,” “will,” “should,” “expects,” “plans,” “anticipates,” “could,” “intends,” “target,” “projects,” “contemplates,” “believes,” “estimates,” “predicts,” “potential” or “continue” or the negative of these words or other similar terms or expressions that concern our expectations, strategy, plans or intentions. When considering forward-looking statements, you should keep in mind the risk factors and other cautionary statements described in the section titled “Risk Factors” and elsewhere in this Annual Report on Form 10-K. These forward-looking statements are based on management’s current beliefs, based on currently available information, as to the outcome and timing of future events. Forward-looking statements contained in this Annual Report on Form 10-K include, but are not limited to, statements about:
|
|
• |
our ability to attract and retain customers, including larger organizations; |
|
|
• |
our ability to deepen our relationships with existing customers |
|
|
• |
our expectations regarding our customer growth rate |
|
|
• |
our business plan and beliefs and objectives for future operations; |
|
|
• |
trends associated with our industry and potential market; |
|
|
• |
benefits associated with use of our platform and services; |
|
|
• |
our ability to develop or acquire new solutions, improve our platform and solutions and increase the value of our platform and solutions; |
|
|
• |
our ability to compete successfully against current and future competitors; |
|
|
• |
our ability to further develop strategic relationships; |
|
|
• |
our ability to achieve positive returns on investments; |
|
|
• |
our ability to acquire complementary businesses, products or technology; |
|
|
• |
our plans to further invest in and grow our business, and our ability to effectively manage our growth and associated investments; |
|
|
• |
our ability to timely and effectively scale and adapt our existing technology; |
|
|
• |
our ability to increase our revenue, our revenue growth rate and gross margin; |
|
|
• |
our ability to generate sufficient revenue to achieve and sustain profitability; |
|
|
• |
our future financial performance, including trends in revenue, cost of revenue, operating expenses, other income and expenses, income taxes, billings and customers; |
|
|
• |
the sufficiency of our cash and cash equivalents and cash generated from operations to meet our working capital and capital expenditure requirements; |
|
|
• |
our ability to raise capital and the loans of those financings; |
|
|
• |
our ability to attract, train and retain qualified employees and key personnel; |
|
|
• |
our ability to maintain and benefit from our corporate culture; |
|
|
• |
our ability to successfully identify, acquire and integrate companies and assets; |
|
|
• |
our ability to successfully enter new markets and manage our international expansion; and |
|
|
• |
our ability to maintain, protect and enhance our intellectual property and not infringe upon others’ intellectual property. |
1
We caution you that the foregoing list may not contain all of the forward-looking statements made in this Annual Report on Form 10-K.
You should not rely upon forward-looking statements as predictions of future events. We have based the forward-looking statements contained in this Annual Report on Form 10-K primarily on our current expectations and projections about future events and trends that we believe may affect our business, financial condition, results of operations and prospects. The outcome of the events described in these forward-looking statements is subject to risks, uncertainties and other factors described in the section titled “Risk Factors” and elsewhere in this Annual Report on Form 10-K. Moreover, we operate in a very competitive and rapidly changing environment. New risks and uncertainties emerge from time to time and it is not possible for us to predict all risks and uncertainties that could have an impact on the forward-looking statements contained in this Annual Report on Form 10-K. We cannot assure you that the results, events and circumstances reflected in the forward-looking statements will be achieved or occur, and actual results, events or circumstances could differ materially from those described in the forward-looking statements.
The forward-looking statements made in this Annual Report on Form 10-K relate only to events as of the date on which the statements are made. We undertake no obligation to update any forward-looking statements made in this Annual Report on Form 10-K to reflect events or circumstances after the date of this Annual Report on Form 10-K or to reflect new information or the occurrence of unanticipated events, except as required by law. We may not actually achieve the plans, intentions or expectations disclosed in our forward-looking statements and you should not place undue reliance on our forward-looking statements. Our forward-looking statements do not reflect the potential impact of any future acquisitions, mergers, dispositions, joint ventures or investments we may make.
2
Our Vision
Our fundamental belief is that identity is power. Our mission is to enable enterprises to grow and innovate, securely and efficiently. To do so, we have created our open identity platform that empowers users and governs their access to applications and data across complex, hybrid IT environments.
Overview
SailPoint is the leading provider of enterprise identity governance solutions. Our team of visionary industry veterans launched SailPoint to empower our customers to efficiently and securely govern the digital identities of employees, contractors, business partners and other users, and manage their constantly changing access rights to enterprise applications and data. Our open identity platform provides organizations with critical visibility into who currently has access to which resources, who should have access to those resources, and how that access is being used. We offer both on-premises software and cloud-based solutions, which provide organizations with the intelligence required to empower users and govern their access to applications and data across hybrid IT environments, whether comprised of on-premises, cloud or mobile applications. We help customers enable their businesses with more agile and innovative IT, enhance their security posture and better meet compliance and regulatory requirements. Our customers include many of the world’s largest and most complex organizations, including commercial enterprises, educational institutions and governments.
Organizations globally are investing in technologies such as cloud computing and mobility to improve employee productivity, business agility and competitiveness. Today, enterprise environments are more open and interconnected with their business partners, contractors, vendors and customers. Business users have driven a dramatic increase in the number of applications and data that organizations need to manage, much of which sits beyond the traditional network perimeter. Because of these trends, the attack surface is expanding while well-funded cyber attackers have significantly increased the frequency and sophistication of their attacks. As a result, IT professionals need to manage and secure increasingly complex hybrid IT environments within these extended enterprises.
Attackers frequently target the identity vector as it allows them to leverage user identities to gain access to high-value systems and data while concealing their activity and movements within an organization’s IT infrastructure. The consequences of a data breach can be extremely damaging, with organizations facing significant costs to remediate the breach and repair brand and reputational damage. In addition, governments and regulatory bodies have increased efforts to protect users and their data with a new wave of regulatory and compliance measures that are further burdening organizations and levying severe penalties for non-compliance. As a result of these trends, enterprises are struggling to efficiently manage and secure their digital identities.
We believe that our open identity platform is a critical, foundational layer of a modern cyber security strategy that complements and builds upon traditional perimeter- and endpoint-centric security solutions, which on their own are increasingly insufficient to secure organizations, and their applications and data. We deliver a user-centric security platform that combines identity and data governance solutions to form a holistic view of the enterprise. In combination with our technology partners, we create identity awareness throughout our customers’ environments by providing valuable insights into, and incorporating information from, a broad range of enterprise software and security solutions. Our governance platform provides a system of record for digital identities across our customers’ IT environments while allowing them to remain agile and competitive. Our adaptable solutions integrate seamlessly into existing technology stacks, allowing organizations to maximize the value of their technology investments. Our professionals work closely with customers throughout the implementation lifecycle, from documentation to development to integration.
3
Our solutions address the complex needs of global enterprises and mid-market organizations. Our go-to-market strategy consists of both direct sales and indirect sales through resellers, such as Optiv, and system integrators. Our mature system integrator channel includes global consultants such as Accenture, Deloitte, KPMG and PwC, all of whom have dedicated SailPoint practices, with some dating back more than 7 years. As of December 31, 2017, 933 customers across a wide variety of industries were using our products to enable and secure digital identities across the globe.
Our Growth Strategy
Key investments we are making to drive growth include:
|
|
• |
Driving new customer growth within existing geographic markets. Based on data from S&P Global Market Intelligence, we believe we have penetrated less than 2% of the approximately 65,000 companies in the countries where we have customers today. As a result, there is a significant opportunity to expand our footprint through both new, greenfield installations and displacement of competitive legacy solutions. We plan to expand our customer base in these countries by continuing to grow our sales organization, expand and leverage our channel partnerships and enhance our marketing efforts. |
|
|
• |
Continuing to expand our global presence. We believe there is a significant opportunity to grow our business internationally. Enterprises around the world are facing similar operational, security and compliance challenges, driving the need for identity governance. Although we have personnel in 24 countries and customers in 39 countries as of December 31, 2017, we generated only 28% of our revenue outside of the United States in 2017. We plan to leverage our existing strong relationships with global system integrators and channel partners to grow our presence in Europe, Asia Pacific and other international markets. |
4
Product, Subscription, and Support Offerings
We deliver an integrated set of products to address identity governance challenges for medium and large enterprises. This set of products supports all aspects of identity governance including provisioning, access request, compliance controls, password management, identity governance for data stored in files and identity analytics.
Our products deliver governance across the hybrid enterprise, extending from the mainframe to the cloud. We provide over 100 out-of-the-box connectors to enterprise applications such as SAP and Workday, which automate the collection and provisioning of identity data. We also provide governance over infrastructure components such as operating systems, directories, and databases and over vertical solutions such as Epic in the healthcare provider market.
Our solutions are built on our open identity platform which enables connectivity to a variety of security and operational IT applications such as access management (e.g., Microsoft, Okta and VMware), IT service management solutions (e.g., BMC Remedy and ServiceNow), privileged access management (e.g., CyberArk), enterprise mobility management (EMM), security information and event management (SIEM) and data loss prevention (DLP) solutions. Our open identity platform extends the reach of our identity governance processes across customer environments and collects additional information to improve the application of identity governance controls.
IdentityIQ
IdentityIQ is our on-premises identity governance solution. It provides large, complex enterprise customers a unified and highly configurable identity governance solution that consistently applies business and security policies as well as role and risk models across applications and data on-premises or hosted in the cloud. IdentityIQ enables organizations to:
|
|
• |
Empower users to request and gain access to enterprise applications and data; |
|
|
• |
Automate provisioning across the user lifecycle, from on-boarding, to transfers and promotions to off-boarding by simplifying processes for creating, modifying and revoking access; |
|
|
• |
Enable business users to reset their passwords via self-service tools without the need for IT involvement; |
|
|
• |
Provide on-demand visibility to IT, business and risk managers into “who has access to what resources” to help make business decisions, improve security and meet audit requirements; |
|
|
• |
Improve security and eliminate common weak points associated with data breaches, including weak passwords, orphaned accounts, entitlement creep and segregation-of-duties policy violations; and |
|
|
• |
Manage compliance using automated access certifications and policy management. |
We package and price IdentityIQ into modules with unique functionality, including:
|
|
• |
Lifecycle Manager: This module provides a business-oriented solution that delivers access securely and cost effectively. The self-service access request capabilities feature an intuitive user interface that empowers business users to take an active role in managing changes to their access while greatly reducing the burden on IT organizations. Automated provisioning manages the business processes of granting, modifying and revoking access throughout a user’s lifecycle with an organization, whether that user is an employee, contractor or business partner. Changes to user access can be automatically provisioned via a large library of direct connectors for applications such as Workday and SAP or synchronized with IT service management solutions such as ServiceNow. |
|
|
• |
Compliance Manager: This module enables the business to improve compliance and audit performance while lowering costs. It provides business user friendly access certifications and automated policy management controls (e.g., segregation of duty violation reporting) that are designed to simplify and streamline audit processes across all applications and data. Built-in audit reporting and analytics give IT, business and audit teams visibility into, and management over, all compliance activities in the organization. |
5
IdentityNow
IdentityNow is our cloud-based, multi-tenant identity governance suite, which is delivered as a subscription service. IdentityNow provides customers with a set of fully-integrated services for compliance, provisioning and password management for applications and data hosted on-premises or in the cloud. IdentityNow meets the most stringent identity governance requirements and provides enterprise-grade services that meet scalability, performance, availability and security demands. IdentityNow provides the same benefits as IdentityIQ, but additionally enables organizations to:
|
|
• |
Automate identity governance processes in one unified solution delivered from the cloud; |
|
|
• |
Accelerate deployment with built-in best practice policies, options and default settings; and |
|
|
• |
Eliminate the need to buy, deploy and maintain hardware and software to run an identity governance solution. |
We package and price IdentityNow into services with unique functionality, including:
|
|
• |
Cloud Platform: IdentityNow provides foundational components for identity governance in the cloud, including production and sandbox instances and the IdentityNow Cloud Gateway virtual appliance, which leverages our patented method for integrating with on-premises applications and data. IdentityNow also includes a large catalog of pre-built connectors and application profiles to on-premises and cloud applications, leveraging the intellectual property developed for IdentityIQ. |
|
|
• |
User Provisioning: This module enables business users to be productive from day one. With IdentityNow user provisioning, organizations can streamline the on-boarding and off-boarding process with best practice configurations and workflows, enabling IT to immediately grant employees access to the applications and data they need to do their jobs. |
|
|
• |
Access Request: This module empowers the entire enterprise with a robust self-service solution for requesting and approving access to applications and data. Automating the access request process quickly delivers business users the access they need to do their jobs. |
|
|
• |
Access Certifications: This module automates the process of reviewing user access privileges across the organization. Using IdentityNow, organizations can quickly plan, schedule and execute certification campaigns to ensure the right users have the appropriate access to corporate resources. |
|
|
• |
Password Management: This module offers business users an intuitive, self-service experience for managing and resetting passwords from any device and from anywhere. This service enforces consistent and secure password policies for all users across all systems from the cloud to the data center. |
6
Our on-premises identity governance for files solution, SecurityIQ, secures access to the growing amount of data stored in file servers, collaboration portals, mailboxes and cloud storage systems. SecurityIQ helps organizations identify where sensitive data resides, who has access to it, and how they are using it—and then puts effective controls in place to secure it. Today, SecurityIQ is designed to interoperate with IdentityIQ to provide comprehensive visibility and governance over user access to unstructured data. By augmenting identity data from structured systems with data from unstructured data targets, organizations can more quickly identify and mitigate risks, spot compliance issues and make the right decisions when granting or revoking access to sensitive data. SecurityIQ enables organizations to:
|
|
• |
Improve IT staff productivity by empowering the business to govern user access to unstructured data; |
|
|
• |
Unify identity governance for structured and unstructured data processes and policies; |
|
|
• |
Mitigate risk of inappropriate access to data stored in files whether on-premises or in the cloud; |
|
|
• |
Improve audit performance through automation of manual compliance activities such as access certifications; and |
|
|
• |
Decrease operational costs by optimizing storage resources. |
We package and price SecurityIQ by target storage systems, which include file shares, SharePoint, Exchange, Active Directory and cloud storage solutions (e.g., Box). The following core capabilities are provided across all storage systems:
|
|
• |
Data Discovery and Classification: SecurityIQ allows businesses to rapidly find and classify sensitive unstructured data stored in files located on-premises and in cloud file shares. Once identified, SecurityIQ collects and analyzes user permissions that grant access to each file and proactively flags issues for resolution. In addition, SecurityIQ provides visibility to when users access sensitive data, creating a 360-degree view of who has access and how that access is being used. |
|
|
• |
Policy Controls: SecurityIQ enables organizations to implement automated policy controls over user access to unstructured data. Through policy enforcement, SecurityIQ governs who gets access to what documents and file shares. Intuitive and actionable dashboards help data owners track and eliminate identified risk exposures and manage all data access requests. |
|
|
• |
Risk Remediation: SecurityIQ provides comprehensive options for remediating risks and optimizing file storage. The policy-based remediation model flags questionable user behavior and immediately alerts unstructured data owners to take action. |
|
|
• |
Compliance Automation: SecurityIQ streamlines compliance processes associated with privacy and data protection. The access certification capability allows organizations to review and approve ongoing user access to unstructured data, regardless of where it is stored. Interactive reports make it easy for compliance and audit teams to meet regulatory requirements, such as GDPR and HIPAA. |
IdentityAI
To help organizations detect potential threats before they turn into security breaches, we released in 2017 a new identity analytics solution, IdentityAI. Using machine learning technologies, IdentityAI analyzes identity data, such as account and entitlement assignments, combined with real-time activity information, to identify suspicious or anomalous behaviors. As a result, customers will gain a much deeper understanding of the risk associated with user access, allowing them to focus their governance controls to reduce that risk. We are continuing development of IdentityAI to enable organizations to:
|
|
• |
Improve operational efficiency of the IT organization and business productivity by automating identity governance activities for routine and low-risk access; |
|
|
• |
Detect and alert on anomalous behaviors and potential threats using artificial intelligence technology; |
7
|
|
• |
Scan massive amounts of identity data to identify risks without having to rely on a team of security experts; and |
|
|
• |
Classify behavioral threats and focus controls on high-risk scenarios and conditions. |
We are continuing to develop IdentityAI to provide the following core capabilities:
|
|
• |
Audit: IdentityAI tracks user access over time to determine historical patterns for individual digital identities. This allows for the system to quickly identify abnormal user access or activity patterns. |
|
|
• |
Peer Group Analysis: IdentityAI dynamically builds peer groups based on user attributes and access patterns. Peer group analysis is then used to identify outliers which may pose additional risk due to out-of-band or exceptional access privileges. |
|
|
• |
Behavioral Analysis: IdentityAI monitors user behaviors, including access requests and approvals and application access events, at individual and peer group levels to baseline normal patterns and alert when anomalies are detected. |
|
|
• |
Risk Assessment: IdentityAI leverages machine learning algorithms to create a dynamic risk model that automatically evolves as data changes. Risk scores are used to identify potential threats and tune identity controls to focus on high-risk users and events while deprioritizing low-risk activities. |
Technology
Our comprehensive, enterprise-grade identity governance platform is the result of both years of investment and the expertise of the company’s management and technical teams. Taking the lessons learned from our experiences with prior generation identity solutions, our engineers and architects designed a modern identity platform with internet scale, comprehensive hybrid environment coverage, and openness to optimize customers’ existing technology investments.
Identity Cube Technology
Our Identity Cube technology establishes the 360-degree control essential to govern and secure digital identities in today’s complex IT environments. Our extensive data modeling capabilities allow us to understand how each identity relates to the full IT environment, whether on-premises or in the cloud. SailPoint’s account correlation and orphan account management capabilities allow IT security professionals and business managers to track and monitor the accounts that are most frequently under attack.
Identity Cubes track all relevant information about an identity and its relationships to applications and data. They create the “identity context” which is key to an identity-aware infrastructure in which identity information is shared across the extended enterprise. With identity context, operational and security systems can make informed decisions about access and perform key remediation and change requests on our open identity platform via our standardized APIs and SDKs.
Model-Based Governance
Our model-based governance engine sits at the center of our platform and provides a comprehensive understanding of both the current state of who currently has access to what as well as the desired state of who should have access to what. The governance engine is responsible for managing the ongoing process of aligning these two states.
Governance and control models are used to drive our policy-based reconciliation service and to define how reconciliation and provisioning fulfillment actions are executed. These models are designed with graphical tools, enabling IT and business users to own and define the reconciliation and fine-grained access provisioning fulfillment processes for applications and data.
8
Our provisioning broker provides separation between identity processes at the business level (e.g., requesting access to an application) and the actual fulfillment of that request on the target system. The provisioning broker is a specialized business process workflow execution engine that manages long-running provisioning tasks and provides tracking, monitoring and statistics for the end-to-end fulfillment process.
The decoupling capability of the provisioning broker maximizes our customers’ flexibility and allows for the reuse of their existing IT investments. For example, if access to an application can only be provided manually through the opening of a help desk ticket, the provisioning broker will send that request to the help desk and report back on the status of that request. Likewise, if a customer utilizes a legacy provisioning system, the provisioning broker can pass off a request to that legacy system for fulfillment. In addition, the provisioning broker provides us with a unique migration strategy for customers moving from a legacy system to our identity governance solutions.
Enterprise-Grade Cloud Gateway
To manage on-premises infrastructure, applications and data from the cloud, we employ a Cloud Gateway Server (“CGS”), delivered as virtual machine behind the customer’s firewall, which ensures that all SailPoint communications are highly secure. Our CGS technology is a high availability, secure, self-managed container that allows for controlled and automated updates of our connector infrastructure while ensuring the integrity of individual on-premises and cloud connections.
Our CGS also provides an innovative and patented approach to protecting our customer’s credentials. Our “zero-knowledge encryption” technology allows us to store all of a customer’s passwords and security credentials inside the CGS behind their firewall. As a result, we protect the confidentiality of our customers’ system and end-user credentials, even if our cloud service provider were to be breached.
Data Ownership Assessment and Election
Verifying the business end-user who is the logical owner of information is a key challenge in managing growing volumes of unstructured data in the enterprise. We have developed a patent-pending approach to determine the rightful owner of files so they can be integrated into governance control processes, such as access certifications and access approvals. Our solution leverages profile data to determine logical owners of information based on identity attributes and usage data. Once a set of logical owners is identified, we use a crowd-sourcing approach to allow other users familiar with the data to vote on the rightful owner of the file or file storage location. This enables organizations to efficiently identify and designate specific owners for sensitive information stored in files and incorporate them into identity governance processes.
Connectivity for the Hybrid IT Environment
Our extensive library of over 100 proprietary connectors provides interfaces to on-premises and cloud applications. These connectors are the means by which we provide governance over target systems. We support granular management of a wide range of systems, from mainframe security managers, including CA ACF2 and Top Secret, IBM and RACF, to traditional enterprise applications, including Oracle E-Business Suite and SAP, and pure SaaS business applications, such as Microsoft Office365, Salesforce and ServiceNow. The same connectors are used for both our on-premises and cloud-based products. This allows both solutions to leverage fully the over 400-man years we have invested in developing these connectors.
Open and Extensible Identity Platform
Our open identity platform is the result of over a decade of investment. Recognizing identity governance is at the center of critical enterprise business and IT processes, we developed a comprehensive set of services that go beyond simple APIs. In addition to our comprehensive API strategy, we deliver SDKs and plug-in frameworks which allow our partners and customers to create their own integrations and extensions to our core product capabilities. For example, we leverage our open identity platform to integrate with third-party user provisioning solutions, such as IBM Security Identity Manager and Oracle Identity Manager, and service desk solutions, such as BMC Remedy and ServiceNow, to implement account change requests. This enables SailPoint to govern access and provide identity context to downstream processes managed by these solutions. We also collect activity and other information from third-party solutions to improve risk analytics and identity governance processes in our products.
9
Our APIs and SDKs are compliant with System for Cross-domain Identity Management (“SCIM”) and both provide standards-based bi-directional runtime access to our identity context model. Many such integrations and extensions have already been built by partners and certified for commercialization on our open identity platform.
We have 933 customers in 39 countries, as of December 31, 2017. In the years ended December 31, 2017, 2016, and 2015, we generated 28%, 30% and 33%, respectively, of our revenue outside of the United States. No single customer represented more than 10% of our revenue for the years ended December 31, 2017, 2016 or 2015.
Sales and Marketing
Sales
We sell our platform through our direct sales organization, which is comprised of field and inside sales personnel, as well as through channel partners. Our sales strategy relies on a “land-and-expand” business model, in which our initial deployment with a new customer typically addresses a limited number of use cases within a single business unit. Such initial deployments frequently expand across departments, divisions and geographies through a need for additional users, increased usage or extended functionality. As we expand our portfolio of solutions within our platform, we execute a growing number of “combination” deals that include two to three of our products in the initial transaction.
Our sales force is structured by geography, customer size, status (customer or prospect) and industry. By focusing some of our sales representatives on the specific needs of vertical industries, we have been able to drive significant results and establish ourselves as the identity governance leader for that industry. Our global sales organization is comprised of quota-carrying sales representatives supported by market development representatives, sales engineers, partner managers, product and technical specialists and architects.
Partners constitute an essential part of our selling model. We have established a model designed to create zero conflict, and typically include our partners in all of our training and enablement efforts, including our semiannual sales kick-off events. As a result, our indirect sales model, executed through our global and regional system integrators, technology partners and value-added resellers, is a key factor in our overall success.
Marketing
Our marketing strategy is focused on building a strong brand through differentiated messaging and thought leadership, educating the market on the importance of identity, communicating our product advantages and generating pipeline for our sales force. Our data-driven approach to marketing is tightly aligned to our sales and channel strategy and provides agility to leverage market opportunities as they arise. Our awareness efforts focus on branding, content marketing, public and analyst relations and social media, including blogs and bylines. Educational and pipeline maturation programs include global email campaigns and webinars, security events and customers round tables. Pipeline generation and maturation efforts focus on local events in our three major geographies: (i) Americas, (ii) Europe, the Middle East and Africa (EMEA) and (iii) Asia-Pacific (APAC). Audiences for such events are typically IT and security professionals, including CIOs and CISOs. We host an annual user conference that brings together customers, prospects and our partners to learn about our platform as well as network and share best practices with each other. Our user conferences demonstrate our strong commitment to enabling our customers to succeed, while also serving as an opportunity to create pipeline for new sales to prospective customers and additional sales to existing customers.
10
Professional Services and Maintenance and Customer Support
Professional Services
We are primarily focused on ensuring that our professional services partners, who perform a majority of the implementations for our customers, are able to implement our solutions successfully. We provide “expert services” to partners and customers, including deployment best practices, architecture and code reviews, real time technical training, and complex implementation assistance. We provide instructor-led courses, self-paced e-learning and on-site training. We expect the use of SailPoint University, our e-learning service introduced in 2016, to grow at an accelerated pace in the coming years, making it more accessible for customers and partners to get trained on our products. We also lead direct implementations when requested by a customer. We believe our investment in professional services, as well as the investment our partners are making to grow their SailPoint professional services practices, will drive increased adoption of our platform.
Maintenance and Customer Support
Our customers receive one year of software maintenance as part of their initial purchase of our on-premises solutions, and may renew their maintenance agreement following the initial period. Our cloud-based solutions include customer support. For our on-premises solutions, our maintenance provides customers with the right to receive major releases of their purchased solutions, maintenance releases and patches and access to our technical support services during the term of the agreement. We provide our cloud-based solutions customers with technical support services and all aspects of infrastructure support. We maintain a customer support organization, which includes experienced, trained engineers, that offers multiple service levels for our customers based on their needs. These customers receive contractual response times, telephonic support and access to online support portals. Our highest levels of support provide 24x7x365 support for critical issues. Our customer support organization has global capabilities, a deep expertise in our solutions and, through select support partners, is able to deliver support in multiple languages.
Customer Success Management
Our customer success strategy centers around our investment in, and ownership of, the post-sale experience for our customers. Every customer has a dedicated Customer Success Manager (“CSM”), who is responsible for ensuring that return on investment and business results, committed during the sales cycle, are achieved. Through proactive and regular engagements, the CSM makes sure every customer is satisfied and is using their SailPoint products or services optimally. When necessary, the CSM coordinates cross-departmental resources to remove any barrier to success. In addition, our customer success team utilizes customer data to identify and present any cross-sell or upsell solutions aligned to a customer’s business objectives, thereby contributing to revenue expansion and increased product penetration. By proactively managing customer relationships, our CSM team nurtures client advocates, who become a powerful asset in closing new business.
Partnerships and Strategic Relationships
As a core part of our strategy, we have cultivated strong relationships with partners to help us increase our reach and influence, while providing a broader distribution of our software platform. We have developed a large partner network consisting of technology partners, system integrators, a growing network of value-added resellers and our G4 Alliance partners (Accenture, Deloitte, KPMG and PwC). In fact, over 80% of our new customer transactions involved our partners. We believe that our extensive partnership network enables us to provide the most complete identity governance solution to our customers.
Technology Partners
We have partnered with industry leaders across a spectrum of technologies that enable organizations to integrate their entire security and operational infrastructure into our platform so that breaches can be better identified, mitigated and contained, and operations can be streamlined. We believe that solutions from companies such as CyberArk, Informatica, Microsoft, MobileIron, ServiceNow and VMware that are plugged into our open identity platform through APIs provide our customers value-added capabilities to build an identity-aware enterprise.
11
Value-added resellers bring product expertise and implementation best practices to our customers globally. They provide vertical expertise and technical advice in addition to reselling or bundling our software. All of our reseller partners have been trained to demonstrate and promote our identity platform. Our reseller channel ranges from large companies, like Optiv, to regional resellers in our markets and territories. Our reseller program is designed to scale growth, help generate new opportunities, optimize customer experience and increase profitability as well as sales efficiency.
System Integrators
We partner with many large and global system integrators. We have partnerships with global advisory firms such as Deloitte, KPMG and PwC, with global system integrators such as Accenture, Infosys and Tata, and with many regional system integrators in all three of our geographies. The focus of our system integrators program is to deliver pipeline growth and bookings, to help partners drive self-sufficiency and to foster transparency and collaboration through shared assets and resources. We have implemented joint business controls and metrics that provide a platform for discussion and partnership development and help us optimize our program and unified value proposition.
Identity+ Alliance
The SailPoint Identity+ Alliance is a technology partnering network that leverages familiar standards and methods—like SQL, SCIM and Representational State Transfer (REST)—that make it easy to share identity context and configure identity-specific policies across disparate systems. For example, when Privileged Account Management (PAM) systems are integrated with our solutions, enterprises can conduct regular audits of privileged users and automatically remediate any policy violations. Program offerings include access to SailPoint SDKs and APIs, developer support, and cloud-based certification services. After two years, the Identity+ Alliance comprises over thirty technology and implementation partners and has produced over ten certified solutions.
Innovation is one of our core values, and it is at the heart of how we think and do business. We believe ongoing and timely development of new products and features is imperative to maintaining our competitive position. We continue to invest in both our cloud and on-premises solutions across our global innovation centers in Austin, Texas, Pune, India and Tel Aviv, Israel. Additionally, we have made significant investment in our connectors business, which is a key enabler to our open identity platform. As of December 31, 2017, our research and development team had 244 employees. For the years ended December 31, 2017, 2016 and 2015, our research and development expenses totaled approximately $33.3 million, $24.4 million and $20.0 million, respectively.
As part of our relentless drive toward innovation and technical market leadership, we created SailPoint Labs in 2011. SailPoint Labs is a dedicated, stand-alone technology investigation and engineering group that sits outside of the company’s core product development and delivery teams. The Labs team has two specific charters: Labs Research, which is focused on forward-looking technology prototyping, and targets mid-to-long term product enhancements and new service offerings; and Labs Runtime, which is focused on performance and scalability testing and ensuring that we deliver the best possible solutions. Examples of Labs Research prototypes that went into production are our plugin framework, our AD password recovery technology and our recent Privileged Account Management Integration module. In addition, the Labs Research team co-authored the SCIM open standard, which provides for an automated exchange of user identity information between identity domains, or IT systems. The Labs Runtime team is responsible for developing and continually advancing the performance and scalability of our products and solutions by establishing benchmarks and best practices for high-performance and extreme scalability scenarios.
12
We operate in a highly competitive market characterized by constant change and innovation. Our competitors include large enterprise software vendors such as CA Technologies, IBM and Oracle; pure-play data access governance vendors such as Varonis; and companies of varying sizes that offer less-comprehensive solutions, which compete with individual features of our platform. We believe the principal competitive factors in our market include:
|
|
• |
Reliability and effectiveness in implementing identity governance policies; |
|
|
• |
Comprehensiveness of visibility provided by implemented identity governance policies; |
|
|
• |
Ability to deploy in hybrid IT environment; |
|
|
• |
Adherence to government and industry regulations and standards; |
|
|
• |
Comprehensiveness and interoperability of the solution with other IT and security applications; |
|
|
• |
Scalability and performance; |
|
|
• |
Ability to innovate and respond to customer needs rapidly; |
|
|
• |
Quality and responsiveness of support organizations; |
|
|
• |
Total cost of ownership; |
|
|
• |
Ease of use; and |
|
|
• |
Customer experience. |
Some of our competitors have significantly greater financial, technical, and sales and marketing resources, as well as greater name recognition and more extensive geographic presence than we do. However, we believe we compete favorably with our competitors on the basis of all the factors above.
Intellectual Property
Our success depends in part on our ability to protect our intellectual property. We rely on copyrights and trade secret laws, confidentiality procedures, employment proprietary information and inventions assignment agreements, trademarks and patents to protect our intellectual property rights. We also license software from third parties for integration into our product solutions, including open source software and other software available on commercially reasonable terms.
We control access to and use of our product solutions and other confidential information through the use of internal and external controls, including contractual protections with employees, contractors, customers and partners, and our software is protected by U.S. and international copyright and trade secret laws. Despite our efforts to protect our trade secrets and proprietary rights through intellectual property rights, licenses and confidentiality agreements, unauthorized parties may still copy or otherwise obtain and use our software and technology.
We have three issued patents and three patent applications pending in the United States relating to certain aspects of our technology. Our issued patents expire in 2034 and 2036. We cannot assure you whether any of our patent applications will result in the issuance of a patent or whether the examination process will require us to narrow our claims. Any of our existing patents and any that may issue may be contested, circumvented, found unenforceable or invalidated, and we may not be able to prevent third parties from infringing them. In addition, we have international operations and intend to continue to expand these operations, and effective patent, copyright, trademark and trade secret protection may not be available or may be limited in foreign countries.
Legal Proceedings
We are not currently a party to any material legal proceedings. We are not aware of any inquiries or investigations into our business.
13
As of December 31, 2017, we had a total of 806 employees, including 244 involved in research and development activities, 264 in our sales and marketing organization, and 211 in professional services and customer support. 33% of these employees are located outside of the United States. We consider our employee relations to be good and we have not experienced employee litigation or a work stoppage.
Segments and Geographic Areas
We operate as one operating segment. Our chief operating decision maker is our chief executive officer, who reviews financial information presented on a consolidated basis for purposes of making operating decisions, assessing financial performance and allocating resources. Because we operate as one operating segment, all required financial segment information can be found in the consolidated financial statements.
Please see Note 16 of our accompanying Notes to Consolidated Financial Statements included in Part II, Item 8 of this Annual Report on Form 10-K for financial information by geographic area.
Corporate Information
SailPoint Technologies Holdings, Inc. was incorporated in the state of Delaware on August 8, 2014, in preparation for the purchase of SailPoint Technologies, Inc. The purchase occurred on September 8, 2014 and our certificate of incorporation was amended and restated as of such date. SailPoint Technologies, Inc. was formed July 14, 2004 as a Delaware corporation
Our principal executive offices are located at 11305 Four Points Drive, Building 2, Suite 100, Austin, Texas 78726, and our telephone number at that address is (512) 346-2000. Our website address is www.sailpoint.com. Information contained on, or that can be accessed through, our website does not constitute part of this Annual Report on Form 10-K, and inclusions of our website address in this Annual Report on Form 10-K are inactive textual references only.
The SailPoint design logo and our other registered or common law trademarks, service marks or trade names appearing in this Annual Report on Form 10-K are the property of SailPoint Technologies, Inc., our wholly owned subsidiary. Other trademarks and trade names referred to in this Annual Report on Form 10-K are the property of their respective owners.
Available Information
Our website is located at www.sailpoint.com, and our investor relations website is located at https://investors.sailpoint.com. The information posted on our website is not incorporated into this Annual Report on Form 10-K. Our Annual Report on Form 10-K, Quarterly Reports on Form 10-Q, Current Reports on Form 8-K and amendments to reports filed or furnished pursuant to Sections 13(a) and 15(d) of the Securities Exchange Act of 1934 (the “Exchange Act”) are available free of charge on our investor relations website as soon as reasonably practicable after we electronically file such material with, or furnish it to, the SEC. You may also access all of our public filings through the SEC’s website at www.sec.gov. Further, a copy of this Annual Report on Form 10-K is located at the SEC’s Public Reference Room at 100 F Street, NE, Washington, D.C. 20549. Information on the operation of the Public Reference Room can be obtained by calling the SEC at 1-800-SEC-0330.
Investors and other interested parties should note that we use our media and investor relations website and our social media channels to publish important information about us, including information that may be deemed material to investors. We encourage investors and other interested parties to review the information we may publish through our media and investor relations website and the social media channels listed on our media and investor relations website, in addition to our SEC filings, press releases, conference calls and webcasts.
14
The nature of the business activities conducted by the Company subjects it to certain hazards and risks. The following is a summary of some of the material risks relating to the Company’s business activities. Other risks are described in “Part I. Item 1. Business—Competition and Markets” and “Part II. Item 7A. Quantitative and Qualitative Disclosures About Market Risk.” These risks are not the only risks facing the Company. The Company’s business could also be affected by additional risks and uncertainties not currently known to the Company or that it currently deems to be immaterial. If any of these risks actually occurs, it could materially harm the Company’s business, financial condition or results of operations and impair the Company’s ability to implement business plans. In that case, the market price of the Company’s common stock could decline.
Risks Related to Our Business and Industry
We have a history of losses, and we may not be able to generate sufficient revenue to achieve and sustain profitability.
We have incurred net losses in each year since our inception, including net losses of $7.6 million, $3.2 million and $10.8 million for the years ended December 31, 2017, 2016 and 2015, respectively. We expect our operating expenses to increase significantly as we continue to expand our sales and marketing efforts, continue to invest in research and development, and expand our operations in existing and new geographies and vertical markets. We also expect to continue to devote significant research and development resources to our on-premises solutions; if our customers and potential customers shift their IT infrastructures to the cloud faster than we anticipate, we may not realize our expected return from the costs we incur. While our revenue has grown in recent years, if our revenue declines or fails to grow at a rate faster than these increases in our operating expenses, we will not be able to achieve and maintain profitability in future periods. As a result, we may continue to generate losses. We cannot assure you that we will achieve profitability in the future or that, if we do become profitable, we will be able to sustain profitability.
We have experienced rapid growth in recent periods, and our recent growth rates may not be indicative of our future growth.
We have experienced rapid growth in recent years. From the year ended December 31, 2012 to the year ended December 31, 2017, we grew our business at a revenue compound annual growth rate of over 36%, and our revenue grew from $95.4 million to $186.1 million from the year ended December 31, 2015 to the year ended December 31, 2017. In future periods, we may not be able to sustain revenue growth consistent with recent history, or at all. We believe our revenue growth depends on a number of factors, including, but not limited to:
|
|
• |
our ability to attract new customers and retain and increase sales to existing customers; |
|
|
• |
our ability to, and the ability of our channel partners to, successfully deploy and implement our solutions, increase our existing customers’ use of our solutions and provide our customers with excellent customer support; |
|
|
• |
our ability to increase the number of our technology partners; |
|
|
• |
our ability to develop our existing solutions and introduce new solutions; and |
|
|
• |
our ability to hire substantial numbers of new sales and marketing, research and development and general and administrative personnel, and expand our global operations. |
If we are unable to achieve any of these requirements, our revenue growth will be adversely affected.
15
Our future revenues and operating results will be harmed if we are unable to acquire new customers, if our customers do not renew their arrangements with us, or if we are unable to expand sales to our existing customers or develop new solutions that achieve market acceptance.
To continue to grow our business, it is important that we continue to acquire new customers to purchase and use our solutions. Our success in adding new customers depends on numerous factors, including our ability to (i) offer a compelling identity governance platform and solutions, (ii) execute our sales and marketing strategy, (iii) attract, effectively train and retain new sales, marketing, professional services and support personnel in the markets we pursue, (iv) develop or expand relationships with technology partners, systems integrators, resellers and other channel partners, (v) expand into new geographies and vertical markets, (vi) deploy our platform and solutions for new customers and (vii) provide quality customer support once deployed.
It is important to our continued growth that our customers renew their arrangements when existing contract terms expire. Our customers have no obligation to renew their maintenance, SaaS and/or term-license agreements, and our customers may decide not to renew these agreements with a similar contract period, at the same prices and terms or with the same or a greater number of identities. Although our customer retention rate has historically been strong, some of our customers have elected not to renew their agreements with us, and it is difficult to accurately predict long-term customer retention and expansion rates. Our customer retention and expansion may decline or fluctuate as a result of a number of factors, including our customers’ satisfaction with our solutions, our customer support and professional services, our prices and pricing plans, the competitiveness of other software products and services, reductions in our customers’ spending levels, user adoption of our solutions, deployment success, utilization rates by our customers, new product releases and changes to our product offerings. If our customers do not renew their maintenance, SaaS and/or term-license agreements, or renew on less favorable terms, our business, financial condition and operating results may be adversely affected.
Our ability to increase revenue also depends in part on our ability to increase the number of identities governed with our solutions and sell more modules and solutions to our existing and new customers. Our ability to increase sales to existing customers depends on several factors, including their experience with implementing and using our platform and the existing solutions they have implemented, their ability to integrate our solutions with existing technologies, and our pricing model.
If our new solutions do not achieve adequate acceptance in the market, our competitive position could be impaired, and our potential to generate new revenue or to retain existing revenue could be diminished. The adverse effect on our financial results may be particularly acute because of the significant research, development, marketing, sales and other expenses we will have incurred in connection with the new solutions, and our ability to introduce compelling new solutions that address the requirements of our customers in light of the dynamic identity governance market in which we operate.
If we are unable to successfully acquire new customers, retain our existing customers, expand sales to existing customers or introduce new solutions, our business, financial condition and operating results could be adversely affected.
If we are unable to maintain successful relationships with our channel partners, our ability to market, sell and distribute our solutions will be limited and our business, financial condition and operating results could be adversely affected.
We derive a significant portion of our revenue from sales influenced or made through our channel partner network and expect these sales to continue to grow for the foreseeable future. Our channel partners provide implementation and other services to our customers in exchange for fees paid by those customers. We may not achieve anticipated revenue growth from our channel partners if we are unable to retain our existing channel partners and expand their sales or add additional motivated channel partners.
16
Our arrangements with our channel partners are generally non-exclusive, meaning they may offer customers the products of several different companies, including products that compete with our platform and solutions. If our channel partners do not effectively market and sell our solutions, choose to use greater efforts to market and sell our competitors’ products or services, or fail to meet the needs of our customers, our ability to grow our business and sell our solutions may be adversely affected. Our channel partners may cease marketing our products with limited or no notice and with little or no penalty. In addition, certain of our channel partners are subject to independence requirements that may prevent them from providing services to us or cooperating with us in our go-to-market efforts if they also provide services for affiliates of our controlling stockholder. Thoma Bravo, LLC (“Thoma Bravo”), the ultimate general partner of our controlling stockholders, Thoma Bravo Fund XI, L.P., Thoma Bravo Fund XI-A, L.P. and Thoma Bravo Executive Fund XI, L.P. (together, the “Thoma Bravo Funds”), is a leading private equity investment firm that holds control investments in over 20 businesses, some of which engage certain of our channel partners to provide services, and it intends to continue making control investments in the future. If one or more of our channel partners determines that it is unable to both provide services to us or cooperate with us in our go-to-market efforts and also provide services to affiliates of our controlling stockholder, those channel partners may cease marketing our products or otherwise cease providing services to us or cooperating with us in our go-to-market efforts.
We also collaborate with adjacent technology vendors to offer comprehensive solutions to our customers. If we do not effectively collaborate with them, or if they elect to terminate their relationship with us or develop and market solutions that compete with our solutions, our growth may be adversely affected.
Our ability to generate revenue in the future will depend in part on our success in maintaining effective working relationships with our channel partners, in expanding our indirect sales channel, in training our channel partners to independently sell and/or deploy our solutions and in continuing to integrate our solutions with the products and services offered by our technology partners. If we are unable to maintain our relationships with these channel partners, our business, financial condition and operating results could be adversely affected.
Our quarterly results fluctuate significantly and may not fully reflect the underlying performance of our business.
We believe our quarterly revenue and operating results may vary significantly in the future. As a result, you should not rely on the results of any one quarter as an indication of future performance and period-to-period comparisons of our revenue and operating results may not be meaningful and, as a result, may not fully reflect the underlying performance of our business.
Our quarterly operating results may fluctuate as a result of a variety of factors, including, but not limited to, those listed below, many of which are outside of our control:
|
|
• |
the loss or deterioration of our channel partner and other relationships influencing our sales execution; |
|
|
• |
the mix of revenue and associated costs attributable to licenses, subscription and professional services, which may impact our gross margins and operating income; |
|
|
• |
the mix of revenue attributable to larger transactions as opposed to smaller transactions and the associated volatility and timing of our transactions; |
|
|
• |
the growth in the market for our products; |
|
|
• |
our ability to attract new customers and retain and increase sales to existing customers; |
|
|
• |
changes in customers’ budgets and in the timing of their purchasing decisions, including seasonal buying patterns for IT spending; |
|
|
• |
the timing and success of new product introductions by our competitors and by us; |
|
|
• |
changes in our pricing policies or those of our competitors; |
|
|
• |
significant security breaches of, technical difficulties with, or interruptions to, the delivery and use of our platform; |
17
|
|
• |
foreign exchange gains and losses related to expenses and sales denominated in currencies other than the U.S. dollar or the function currencies of our subsidiaries; |
|
|
• |
increases in and timing of sales and marketing and other operating expenses that we may incur to grow and expand our operations and to remain competitive; |
|
|
• |
costs related to the acquisition of businesses, talent, technologies or intellectual property, including potentially significant amortization costs and possible write-downs; |
|
|
• |
our ability to control costs, including our operating expenses; |
|
|
• |
the collectability of receivables from customers and channel partners, which may be hindered or delayed if these customers or channel partners experience financial distress; |
|
|
• |
economic conditions specifically affecting industries in which our customers participate; |
|
|
• |
natural disasters or other catastrophic events; and |
|
|
• |
litigation-related costs, settlements or adverse litigation judgments. |
Our sales cycle is long and unpredictable, and our sales efforts require considerable time and expense.
The timing of our sales and related revenue recognition is difficult to predict because of the length and unpredictability of the sales cycle for our platform before a sale. We and our channel partners are often required to spend significant time and resources to better educate and familiarize potential customers with the value proposition of our platform and solutions. Customers often view the purchase of our solutions as a strategic decision and significant investment and, as a result, frequently require considerable time to evaluate, test and qualify our platform and solutions prior to purchasing our solutions. During the sales cycle, we expend significant time and money on sales and marketing and contract negotiation activities, which may not result in a sale. Additional factors that may influence the length and variability of our sales cycle include:
|
|
• |
the discretionary nature of purchasing and budget cycles and decisions; |
|
|
• |
lengthy purchasing approval processes; |
|
|
• |
the evaluation of competing products during the purchasing process; |
|
|
• |
time, complexity and expense involved in replacing existing solutions; |
|
|
• |
announcements or planned introductions of new products, features or functionality by our competitors or of new solutions or modules by us; and |
|
|
• |
evolving functionality demands. |
If our efforts in pursuing sales and customers are unsuccessful, or if our sales cycles lengthen, our revenue could be lower than expected, which would have an adverse effect on our business, operating results and financial condition.
We recognize some of our revenue ratably over the term of our agreements with customers and, as a result, downturns or upturns in sales may not be immediately reflected in our operating results.
We recognize revenue from our IdentityNow subscription offering ratably over the terms of our agreements with customers, which generally occurs over a three-year period. As a result, a portion of the revenue that we report in each period will be derived from the recognition of deferred revenue relating to agreements entered into during previous periods. Consequently, a decline in new sales or renewals in any one period may not be immediately reflected in our revenue results for that period. This decline, however, will negatively affect our revenue in future periods. Accordingly, the effect of significant downturns in sales and market acceptance of our products and potential changes in our rate of renewals may not be fully reflected in our operating results until future periods. Our model also makes it difficult for us to rapidly increase our subscription revenue through additional sales in any period, as revenue from new customers generally will be recognized over the term of the applicable agreement.
18
We also intend to increase our investment in research and development, sales and marketing, and general and administrative functions and other areas to grow our subscription-related business. These subscription-related costs are generally expensed as incurred (with the exception of sales commissions), as compared to the corresponding revenue, substantially all of which is recognized ratably in future periods. We are likely to recognize the costs associated with these increased investments earlier than some of the anticipated benefits and the return on these investments may develop more slowly, or may be lower, than we expect, which could adversely affect our operating results.
We face intense competition in our market, especially from larger, well established companies, and we may lack sufficient financial and other resources to maintain and improve our competitive position.
The market for identity and data governance solutions is intensely competitive and is characterized by constant change and innovation. We face competition from both traditional, larger software vendors offering enterprise-wide software frameworks and services and smaller companies offering point solutions for specific identity and data governance issues. We also compete with IT equipment vendors and systems management solution providers whose products and services address identity and data governance requirements. Our principal competitors vary depending on the product we offer and include CA Technologies, IBM, Oracle and Varonis and several smaller vendors. Many of our existing competitors have, and some of our potential competitors could have, substantial competitive advantages such as:
|
|
• |
greater name recognition and longer operating histories; |
|
|
• |
more comprehensive and varied products and services; |
|
|
• |
broader product offerings and market focus; |
|
|
• |
greater resources to develop technologies or make acquisitions; |
|
|
• |
more expansive intellectual property portfolios; |
|
|
• |
broader distribution and established relationships with distribution partners and customers; |
|
|
• |
greater customer support resources; and |
|
|
• |
substantially greater financial, technical and other resources. |
Given their larger size, greater resources and existing customer relationships, our competitors may be able to compete and respond more effectively than we can to new or changing opportunities, technologies, standards or customer requirements. Our competitors may also seek to extend or supplement their existing offerings to provide identity and data governance solutions that more closely compete with our offerings. Potential customers may also prefer to purchase, or incrementally add solutions, from their existing suppliers rather than a new or additional supplier regardless of product performance or features.
In addition, with the recent increase in large merger and acquisition transactions in the technology industry, particularly transactions involving cloud-based technologies, there is a greater likelihood that we will compete with other large technology companies in the future. Some of our competitors have made acquisitions or entered into strategic relationships to offer a more comprehensive product than they individually had offered. Companies and alliances resulting from these possible consolidations and partnerships may create more compelling product offerings and be able to offer more attractive pricing, making it more difficult for us to compete effectively. In addition, continued industry consolidation may adversely impact customers’ perceptions of the viability of small and medium-sized technology companies and consequently their willingness to purchase from those companies.
New start-up companies that innovate and large competitors that are making significant investments in research and development may invent similar or superior products and technologies that compete with our products, and our business could be materially and adversely affected if such technologies or products are widely adopted. Conditions in our market could change rapidly and significantly as a result of technological advancements, partnering by our competitors or continuing market consolidation. These competitive pressures in our market or our failure to compete effectively may result in price reductions, fewer orders, reduced revenue and gross margins, increased net losses, and loss of market share. Any failure to meet and address these factors could adversely affect our business, financial condition and operating results.
19
We anticipate that our operations will continue to increase in complexity as we grow, which will add additional challenges to the management of our business in the future.
Our business has experienced significant growth and is becoming increasingly complex. We increased the number of our employees from 514 at December 31, 2015 to 806 at December 31, 2017. We have also experienced growth in the number of customers of our solutions from 520 at December 31, 2015 to 933 at December 31, 2017. At December 31, 2017, we had personnel in 24 countries, and we expect to expand into additional countries in the future. We expect this growth to continue and for our operations to become increasingly complex. To effectively manage this growth, we have made and continue to make substantial investments to improve our operational, financial and management controls as well as our reporting systems and procedures. Our success will depend in part on our ability to manage this complexity effectively without undermining our corporate culture, which we believe has been central to our success. If we are unable to manage this complexity, our business, operations, operating results and financial condition may suffer.
As our customer base continues to grow, we will need to expand our professional services and other personnel, and maintain and enhance our existing partner network, to provide a high level of customer service. We also will need to effectively manage our direct and indirect sales processes as the number and type of our sales personnel and partner network continues to grow and become more complex and as we continue to expand into new geographies and vertical markets. This complexity is further driven by the various ways in which we sell our solutions, including on a per identity and per module basis through perpetual licenses and SaaS. If we do not effectively manage the increasing complexity of our business and operations, the quality of our solutions and customer service could suffer, and we may not be able to adequately address competitive challenges. These factors could impair our ability, and our channel partners’ ability, to attract new customers, retain existing customers, expand our customers’ use of existing solutions and adoption of more of our solutions and continue to provide high levels of customer service, all of which would adversely affect our reputation, overall business, operations, operating results and financial condition.
Interruptions with the delivery of our SaaS solutions, or third-party cloud-based systems that we use in our operations, may adversely affect our business, operating results and financial condition.
Our continued growth depends in part on the ability of our existing customers and new customers to access our platform and solutions, particularly our cloud-based deployments, at any time and within an acceptable amount of time. In addition, our ability to access certain third-party SaaS solutions is important to our operations and the delivery of our customer support and professional services, including our online training for customers, professional services partners and channel partners. We have experienced, and may in the future experience, service disruptions, outages and other performance problems both in the delivery of our SaaS solutions and in third-party SaaS solutions we use due to a variety of factors, including infrastructure changes, malicious actors, human or software errors or capacity constraints. In some instances, we may not be able to identify the cause or causes of these performance problems within an acceptable period of time. It may become increasingly difficult to maintain and improve the performance of our SaaS solutions as they become more complex. If our SaaS solutions are unavailable or if our customers are unable to access features of our SaaS solutions within a reasonable amount of time or at all, our business would be negatively affected. In addition, if any of the third-party SaaS solutions that we use were to experience a significant or prolonged outage or security breach, our business could be adversely affected.
We host our SaaS solutions using Amazon Web Services (“AWS”) data centers, a provider of cloud infrastructure services. All of our SaaS solutions reside on hardware owned or leased and operated by us in these locations. Our SaaS operations depend on protecting the virtual cloud infrastructure hosted in AWS by maintaining its configuration, architecture, features and interconnection specifications, as well as the information stored in these virtual data centers and which third-party internet service providers transmit. Although we have disaster recovery plans that utilize multiple AWS locations, any incident affecting their infrastructure that may be caused by fire, flood, severe storm, earthquake or other natural disasters, cyber-attacks, terrorist or other attacks, and other similar events beyond our control could negatively affect our SaaS platform. A prolonged AWS service disruption affecting our SaaS platform for any of the foregoing reasons would negatively impact our ability to serve our customers and could damage our reputation with current and potential customers, expose us to liability, cause us to lose customers or otherwise harm our business. We may also incur significant costs for using alternative equipment or taking other actions in preparation for, or in reaction to, events that damage the AWS services we use. In addition, AWS may
20
terminate the agreement by providing 30 days’ prior written notice and may, in some cases, terminate the agreement immediately for cause upon notice. In the event that our AWS service agreements are terminated, or there is a lapse of service, elimination of AWS services or features that we utilize, interruption of internet service provider connectivity or damage to such facilities, we could experience interruptions in access to our platform as well as significant delays and additional expense in arranging or creating new facilities and services and/or re-architecting our SaaS solutions for deployment on a different cloud infrastructure service provider, which may adversely affect our business, operating results and financial condition.
If we fail to adapt and respond effectively to rapidly changing technology, evolving industry standards, changing regulations and changing customer needs, requirements or preferences, our platform and solutions may become less competitive.
The market in which we compete is relatively new and subject to rapid technological change, evolving industry standards and changing regulations, as well as changing customer needs, requirements and preferences. The success of our business will depend, in part, on our ability to adapt and respond effectively to these changes on a timely basis. In addition, as our customers’ technologies and business plans grow more complex, we expect them to face new and increasing challenges. Our customers require that our solution effectively identifies and responds to these challenges without disrupting the performance of our customers’ IT systems. As a result, we must continually modify and improve our products in response to changes in our customers’ IT infrastructures.
We may be unable to anticipate future market needs and opportunities or be able to develop enhancements to our platform or existing solutions or new solutions to meet such needs or opportunities in a timely manner, if at all. Even if we are able to anticipate, develop and commercially introduce enhancements to our platform and existing solutions and new solutions, those enhancements and new solutions may not achieve widespread market acceptance. Our enhancements or new solutions could fail to attain sufficient market acceptance for many reasons, including:
|
|
• |
delays in releasing platform or solutions enhancements or new solutions; |
|
|
• |
inability to interoperate effectively with existing or newly introduced technologies, systems or applications of our existing and prospective customers; |
|
|
• |
defects, errors or failures in our platform or solutions; |
|
|
• |
negative publicity about the performance or effectiveness of our platform or solutions; |
|
|
• |
introduction or anticipated introduction of competing products by our competitors; |
|
|
• |
installation, configuration or usage errors by our customers or partners; and |
|
|
• |
changing of regulatory requirements related to security. |
If we were unable to enhance our platform or existing solutions or develop new solutions that keep pace with rapid technological and industry change, our business, operating results and financial condition could be adversely affected. If new technologies emerge that are able to deliver competitive products and services at lower prices, more efficiently, more conveniently or more securely, such technologies could adversely impact our ability to compete effectively.
Our failure to achieve and maintain an effective system of disclosure controls and internal control over financial reporting could adversely affect our financial position and lower our stock price.
As a public company, we are subject to the reporting requirements of the Exchange Act, the Sarbanes-Oxley Act of 2002 (the “Sarbanes-Oxley Act”), and the rules and regulations of the applicable listing standards of the New York Stock Exchange (the “NYSE”). The Sarbanes-Oxley Act requires, among other things, that we maintain effective disclosure controls and procedures and internal control over financial reporting. In order to maintain and improve the effectiveness of our disclosure controls and procedures and internal control over financial reporting, we have expended, and anticipate that we will continue to expend, significant resources, including accounting-related costs and significant management oversight. In connection with the audit of our consolidated financial statements for the year ended December 31, 2015, our independent registered public accountants identified a material weakness related to insufficient documentation evidencing the revenue recognition decisions that we made when allocating revenue to specific customer agreements, which we remediated by December 31, 2016.
21
In finalizing our financial statements for our initial public offering, our independent registered public accounting firm identified a material weakness in our internal control over financial reporting related to our accounting for certain complex, non-routine transactions affecting our presentation of amortization expense related to acquisitions, equity transactions and related disclosure and earnings per share calculations. We are taking measures to remediate the material weakness, including establishing more robust accounting policies and procedures, reviews on the adoption of new accounting positions and financial statement disclosures, and selection and engagement of consultants to assist us in determining positions and evaluating new accounting policies. We have not yet remediated this material weakness as of December 31, 2017 and we cannot assure you that these measures and any further measures that we implement will be sufficient to remediate our existing material weakness or to identify or prevent additional material weaknesses.
Our internal resources and personnel may in the future be insufficient to avoid accounting errors and there can be no assurance that we will not have additional material weaknesses in the future. Any failure to develop or maintain effective controls or any difficulties encountered implementing required new or improved controls could harm our operating results or cause us to fail to meet our reporting obligations and may result in a restatement of our financial statements for prior periods. Any failure to implement and maintain effective internal control over financial reporting also could adversely affect the results of periodic management evaluations and annual independent registered public accounting firm attestation reports regarding the effectiveness of our internal control over financial reporting that we will eventually be required to include in our periodic reports that will be filed with the Securities and Exchange Commission (the “SEC”). Ineffective disclosure controls and procedures and internal control over financial reporting could also cause investors to lose confidence in our reported financial and other information, which would likely have a negative effect on the trading price of our common stock. In addition, if we are unable to continue to meet these requirements, we may not be able to remain listed on the NYSE. As a public company, we are required to comply with the SEC rules that implement Section 404 of the Sarbanes-Oxley Act and are therefore required to make a formal assessment of the effectiveness of our internal control over financial reporting for that purpose, but we are not required to provide an annual management report on the effectiveness of our internal control over financial reporting until our second annual report on Form 10-K.
Our independent registered public accounting firm is not required to formally attest to the effectiveness of our internal control over financial reporting until after we are no longer an emerging growth company as defined in the JOBS Act. At such time, our independent registered public accounting firm may issue a report that is adverse in the event it is not satisfied with the level at which our internal control over financial reporting is documented, designed or operating. Any failure to maintain effective disclosure controls and internal control over financial reporting could have an adverse effect on our business and operating results and could cause a decline in the price of our common stock.
Forecasting our estimated annual effective tax rate for financial accounting purposes is complex and subject to uncertainty, and there may be material differences between our forecasted and actual tax rates.
Forecasts of our income tax position and effective tax rate for financial accounting purposes are complex and subject to uncertainty because our income tax position for each year combines the effects of a mix of profits earned and losses incurred by us in various tax jurisdictions with a broad range of income tax rates, as well as changes in the valuation of deferred tax assets and liabilities, the impact of various accounting rules and changes to these rules and tax laws, the results of examinations by various tax authorities, and the impact of any acquisition, business combination or other reorganization or financing transaction. To forecast our tax rate, we estimate our pre-tax profits and losses by jurisdiction and forecast our tax expense by jurisdiction. If the mix of profits and losses, our ability to use tax credits, or effective tax rates by jurisdiction is different than those estimated, our actual tax rate could be materially different than forecasted, which could have a material impact on our results of business, financial condition and results of operations.
22
On December 22, 2017, U.S. Federal tax reform was enacted with the signing of the Tax Cuts and Jobs Act, or the TCJA. Notable provisions of the TCJA include significant changes to corporate taxation, including reduction of the corporate tax rate from a top marginal rate of 35% to a flat rate of 21%, limitation of the tax deduction for interest expense to 30% of adjusted earnings (except for certain small businesses), limitation of the deduction for net operating losses to 80% of current year taxable income and elimination of net operating loss carrybacks, one time taxation of offshore earnings at reduced rates regardless of whether they are repatriated, elimination of U.S. tax on foreign earnings (subject to certain important exceptions), immediate deductions for certain new investments instead of deductions for depreciation expense over time, and modifying or repealing many business deductions and credits.
The U.S. Department of Treasury has broad authority to issue regulations and interpretative guidance that may significantly impact how we will apply the law and impact our results of operations in the period issued. As additional regulatory guidance is issued by the applicable taxing authorities, as accounting treatment is clarified, as we perform additional analysis on the application of the law, and as we refine estimates in calculating the effect, our final analysis, which will be recorded in the period completed, may be different from our current provisional amounts, which could materially affect our tax obligations and effective tax rate.
If we are not able to maintain and enhance our brand or reputation as an industry leader and innovator, our business and operating results may be adversely affected.
We believe that maintaining and enhancing our reputation as a leader and innovator in the market for identity and data governance solutions is critical to our relationship with our existing customers and commercial relationships and our ability to attract new customers and commercial relationships. The successful promotion of our brand attributes will depend on a number of factors, including our marketing efforts, our ability to continue to develop high-quality features and solutions for our platform and our ability to successfully differentiate our platform and solutions from competitive products and services. Our brand promotion activities may not be successful or yield increased revenue. In addition, independent industry analysts often provide reports of our platform and solutions, as well as products and services of our competitors, and perception of our platform and solutions in the marketplace may be significantly influenced by these reports. If these reports are negative, or less positive as compared to those of our competitors’ products and services, our reputation may be adversely affected. Additionally, the performance of our channel partners may affect our brand and reputation if customers do not have a positive experience with our solutions as implemented by our channel partners or with the implementation generally. The promotion of our brand requires us to make substantial expenditures, and we anticipate that the expenditures will increase as our market becomes more competitive, as we expand into new geographies and vertical markets, and as more sales are generated through our channel partners. To the extent that these activities yield increased revenue, this revenue may not offset the increased expenses we incur. If we do not successfully maintain and enhance our brand and reputation, our business and operating results may be adversely affected.
Real or perceived errors, failures, or disruptions in our platform and solutions could adversely affect our customers’ satisfaction with our solutions and/or our industry reputation and business could be harmed.
Our platform and solutions are very complex and have contained and may contain undetected defects or errors, especially when solutions are first introduced or enhanced. Our platform and solutions are often used in connection with large-scale computing environments with different operating systems, system management software, equipment and networking configurations, which may cause errors or failures of products, or other aspects of the computing environment into which our products are deployed. If our platform and solutions are not implemented or used correctly or as intended, inadequate performance and disruption in service may result. In addition, deployment of our platform and solutions into complicated, large-scale computing environments may expose errors, failures or vulnerabilities in our products. Any such errors, failures, or vulnerabilities may not be found until after they are deployed to our customers. We have experienced from time to time errors, failures and bugs in our platform that have resulted in customer downtime. While we were able to remedy these situations, we cannot assure you that we will be able to mitigate future errors, failures or bugs in a quick or cost-effective manner.
23
If we or our channel partners or one or more customers were to suffer a highly publicized breach, even if our platform and solutions perform effectively, such a breach could cause us to suffer reputational harm, lose existing commercial relationships and customers or deter them from purchasing additional solutions and prevent new customers from purchasing our solutions.
Since our customers use our platform and solutions for important aspects of their business, any real or perceived errors, failures or vulnerabilities in our products, or disruptions in service or other performance problems, could hurt our reputation and may damage our customers’ businesses. Furthermore, defects, errors or failures in our platform or solutions may require us to implement design changes or software updates. Any defects or errors in our platform or solutions, or the perception of such defects or errors, could result in:
|
|
• |
expenditure of significant financial and product development resources in efforts to analyze, correct, eliminate or work around errors or defects; |
|
|
• |
loss of existing or potential customers or channel partners; |
|
|
• |
delayed or lost revenue; |
|
|
• |
delay or failure to attain market acceptance; |
|
|
• |
delay in the development or release of new solutions or services; |
|
|
• |
negative publicity, which will harm our reputation; |
|
|
• |
an increase in collection cycles for accounts receivable or the expense and risk of litigation; and |
|
|
• |
harm to our operating results. |
Although we have contractual protections, such as warranty disclaimers and limitation of liability provisions, in our standard terms and conditions of sale, they may not fully or effectively protect us from claims by customers, commercial relationships or other third parties. Any insurance coverage we may have may not adequately cover all claims asserted against us or cover only a portion of such claims. In addition, even claims that ultimately are unsuccessful could result in our expenditure of funds in litigation and divert management’s time and other resources.
If our platform and solutions do not effectively interoperate with our customers’ existing or future IT infrastructures, installations could be delayed or cancelled, which would harm our business.
Our success depends on the interoperability of our platform and solutions with third-party operating systems, applications, data and devices that we have not developed and do not control. Any changes in such operating systems, applications, data or devices that degrade the functionality of our platform or solutions or give preferential treatment to competitive software could adversely affect the adoption and usage of our platform. We may not be successful in adapting our platform or solutions to operate effectively with these applications, data or devices. If it is difficult for our customers to access and use our platform or solutions, or if our platform or solutions cannot connect a broadening range of applications, data and devices, then our customer growth and retention may be harmed, and our business and operating results could be adversely affected.
Our success depends on the experience and expertise of our senior management team and key employees. If we are unable to hire, retain, train and motivate our personnel, our business, operating results and prospects may be harmed.
Our success has depended, and continues to depend, on the efforts and talents of our senior management team and key employees, including our engineers, product managers, sales and marketing personnel and professional services personnel. Our future success will also depend upon our continued ability to identify, hire and retain additional skilled and highly qualified personnel, which will require significant time, expense and attention.
Our officers and key employees are employed on an at-will basis, which means that they could terminate their employment with us at any time. The loss of one or more members of our senior management team, particularly if closely grouped, could adversely affect our ability to execute our business plan and thus, our business, operating results and prospects. We do not maintain key man insurance on any of our officers or key employees, and we may not be able to find adequate replacements. If we fail to identify, recruit and integrate strategic hires, our business, operating results and financial condition could be adversely affected.
24
We have from time to time experienced, and we expect to continue to experience, difficulty in hiring, and may in the future have difficulty retaining, employees with appropriate qualifications and many of the companies with which we compete for experienced personnel have greater resources than we have. In addition to hiring new employees, we must continue to focus on training, motivating and retaining our best employees, substantially all of whom are at-will employees, which means they may terminate their employment relationship with us at any time. Many of our employees may be able to receive significant proceeds from sales of our common stock in the public markets, which may reduce their motivation to continue to work for us. Conversely, employees may be more likely to leave us if the exercise prices of the stock options that they hold are significantly above the market price of our common stock. Competition for highly skilled personnel is intense, and we may need to invest significant amounts of cash and equity to attract and retain new employees, and we may never realize returns on these investments.
Competition for well-qualified employees in all aspects of our business, including sales personnel, professional services personnel and software engineers, is intense. Our primary recruiting competition are well-known, high-paying firms. Our continued ability to compete effectively depends on our ability to attract new employees and to retain and motivate existing employees. If we do not succeed in attracting well-qualified employees or retaining and motivating existing employees, our business would be adversely affected.
Our corporate culture has contributed to our success, and if we cannot maintain this culture as we grow, we could lose the innovation, creativity and teamwork fostered by our culture, which could adversely affect our business.
We believe that our culture has been and will continue to be a key contributor to our success. From January 1, 2016 to December 31, 2017, we have increased the size of our workforce by 211 employees domestically and 81 employees internationally, and we expect to continue to hire aggressively as we expand. In addition, we plan to continue to expand our international operations, which may affect our culture as we seek to find, hire and integrate additional international employees while maintaining our corporate culture. If we do not continue to maintain our corporate culture as we grow, we may be unable to continue to foster the innovation, integrity, and collaboration we believe we need to support our growth. Our substantial anticipated headcount growth, international expansion and our transition from a private company to a public company may result in a change to our corporate culture, which could adversely affect our business.
Because our long-term success depends, in part, on our ability to expand the sales and marketing of our platform and solutions to customers located outside of the United States, and we perform a significant portion of our development outside of the United States, our business will be susceptible to risks associated with international operations.
At December 31, 2017, we had sales and marketing and product development personnel outside the United States in Australia, Canada, Denmark, France, Germany, Hong Kong, India, Israel, Italy, the Netherlands, Singapore, South Africa, Spain, Sweden, Switzerland, Taiwan, Turkey, the United Arab Emirates and the United Kingdom, and we intend to expand our international sales and marketing operations.
Conducting international operations subjects us to risks that we do not generally face in the United States. These risks include:
|
|
• |
encountering existing and new competitors with stronger brand recognition in the new markets; |
|
|
• |
challenges developing, marketing, selling and implementing our platform and solutions caused by language, cultural and ethical differences and the competitive environment; |
|
|
• |
heightened risks of unethical, unfair or corrupt business practices, actual or claimed, in certain geographies and of improper or fraudulent sales arrangements that may impact financial results and result in restatements of, and irregularities in, financial statements; |
|
|
• |
political instability, war, armed conflict or terrorist activities; |
|
|
• |
currency fluctuations; |
25
|
|
• |
the risks of currency hedging activities to limit the impact of exchange rate fluctuations, should we engage in such activities in the future; |
|
|
• |
difficulties in managing systems integrators and technology providers; |
|
|
• |
laws imposing heightened restrictions on data usage and increased penalties for failure to comply with applicable laws, particularly in the European Union (“EU”); |
|
|
• |
risks associated with trade restrictions and foreign import requirements, including the importation, certification and localization of our solutions required in foreign countries, as well as changes in trade, tariffs, restrictions or requirements; |
|
|
• |
potentially different pricing environments, longer sales cycles and longer accounts receivable payment cycles and collections issues; |
|
|
• |
management communication and integration problems resulting from cultural differences and geographic dispersion; |
|
|
• |
increased turnover of international personnel as compared to our domestic operations; |
|
|
• |
potentially adverse tax consequences, including multiple and possibly overlapping tax structures, the complexities of foreign value added tax systems, restrictions on the repatriation of earnings and changes in tax rates; |
|
|
• |
greater difficulty in enforcing contracts, accounts receivable collection and longer collection periods; |
|
|
• |
the uncertainty and limitation of protection for intellectual property rights in some countries; |
|
|
• |
increased financial accounting and reporting burdens and complexities; and |
|
|
• |
lack of familiarity with local laws, customs and practices, and laws and business practices favoring local competitors or commercial parties. |
The occurrence of any one of these risks could harm our international business and, consequently, our operating results. Additionally, operating in international markets requires significant management attention and financial resources. We cannot be certain that the investment and additional resources required to operate in other countries will produce desired levels of revenue or net income.
Adverse economic conditions may negatively impact our business.
Our business depends on the overall demand for information technology and on the economic health of our current and prospective customers. Any significant weakening of the economy in the United States or Europe and of the global economy, more limited availability of credit, a reduction in business confidence and activity, decreased government spending, economic uncertainty and other difficulties may affect one or more of the sectors or countries in which we sell our solutions. Global economic and political uncertainty may cause some of our customers or potential customers to curtail spending generally or IT and identity and data governance spending specifically and may ultimately result in new regulatory and cost challenges to our international operations. In addition, a strong dollar could reduce demand for our products in countries with relatively weaker currencies. These adverse conditions could result in reductions in sales of our solutions, longer sales cycles, slower adoption of new technologies and increased price competition. Any of these events could have an adverse effect on our business, operating results and financial position.
Forecasts of our market and market growth may prove to be inaccurate, and even if the markets in which we compete achieve the forecasted growth, there can be no assurance that our business will grow at similar rates, or at all.
Growth forecasts included in this 10-K relating to our market opportunity and the expected growth in that market are subject to significant uncertainty and are based on assumptions and estimates which may prove to be inaccurate. Even if this market meets our size estimate and experiences the forecasted growth, we may not grow our business at a similar rate, or at all. Our growth is subject to many factors, including our success in implementing our business strategy, which is subject to many risks and uncertainties. Accordingly, the forecasts of market growth included in this 10-K should not be taken as indicative of our future growth.
26
Any failure to offer high-quality customer support may adversely affect our relationships with our customers and our financial results.
We typically bundle customer support with arrangements for our solutions. In deploying and using our platform and solutions, our customers typically require the assistance of our support teams to resolve complex technical and operational issues. We may be unable to modify the nature, scope and delivery of our customer support to compete with changes in product support services provided by our competitors. Increased customer demand for support, without corresponding revenue, could increase costs and adversely affect our operating results. We may also be unable to respond quickly enough to accommodate short-term increases in customer demand for support. Our sales are highly dependent on our reputation and on positive recommendations from our existing customers. Any failure to maintain high-quality customer support, or a market perception that we do not maintain high-quality product support, could adversely affect our reputation, and our ability to sell our solutions to existing and new customers.
If we fail to meet contractual commitments related to response time, service level commitments or quality of professional services, we could be obligated to provide credits for future service, or face contract termination, which could adversely affect our business, operating results and financial condition.
Depending on the products purchased, our customer agreements contain service level agreements, under which we guarantee specified availability of our platform and solutions. If we are unable to meet the stated service level commitments to our customers or suffer extended periods of unavailability of our SaaS platform or solutions, we may be contractually obligated to provide affected customers with service credits or customers could elect to terminate and receive refunds for prepaid amounts. In addition, if the quality of our professional services do not meet contractual requirements, we may be required to re-perform the services at our expense or refund amounts paid for the services. Any failure to meet these contractual commitments could adversely affect our revenue, operating results and financial condition and any failure to meet service level commitments or extended service outages of our SaaS solutions could adversely affect our business and reputation as customers may elect not to renew and we could lose future sales.
Our business depends, in part, on sales to the public sector, and significant changes in the contracting or fiscal policies of the public sector could have an adverse effect on our business.
We derive a portion of our revenue from sales of our solutions to federal, state, local and foreign governments, and we believe that the success and growth of our business will continue to depend in part on our successful procurement of government contracts. Factors that could impede our ability to maintain or increase the amount of revenue derived from government contracts include:
|
|
• |
changes in fiscal or contracting policies; |
|
|
• |
decreases in available government funding; |
|
|
• |
changes in government programs or applicable requirements; |
|
|
• |
the adoption of new laws or regulations or changes to existing laws or regulations; and |
|
|
• |
potential delays or changes in the government appropriations or other funding authorization processes. |
The occurrence of any of the foregoing could cause governments and governmental agencies to delay or refrain from purchasing our solutions or otherwise have an adverse effect on our business, operating results and financial condition.
Any actual or perceived failure by us to comply with our privacy policy or legal or regulatory requirements in one or multiple jurisdictions could result in proceedings, actions or penalties against us.
Our customers’ storage and use of data concerning, among others, their employees, contractors, customers and partners is essential to their use of our platform and solutions. We have implemented various features intended to enable our customers to better comply with applicable privacy and security requirements in their collection and use of data, but these features do not ensure their compliance and may not be effective against all potential privacy and data security concerns.
27
A wide variety of domestic and foreign laws and regulations apply to the collection, use, retention, protection, disclosure, transfer, disposal and other processing of personal data. These data protection and privacy-related laws and regulations are evolving and may result in regulatory and public scrutiny and escalating levels of enforcement and sanctions. Our failure to comply with applicable laws and regulations, or to protect any personal data, could result in enforcement action against us, including fines, claims for damages by customers and other affected individuals, damage to our reputation and loss of goodwill (both in relation to existing customers and prospective customers), any of which could adversely affect our business, operating results, financial performance and prospects.
Evolving and changing definitions of personal data and personal information within the EU, the United States and elsewhere may limit or inhibit our ability to operate or expand our business.
In jurisdictions outside of the United States, we may face data protection and privacy requirements that are more stringent than those in place in the United States. In the EU, for example, Directive 95/46/EC (the “Directive”) has required EU member states to implement data protection laws to meet the strict privacy requirements of the Directive. Among other requirements, the Directive regulates transfers of personal data that is subject to the Directive (“Personal Data”) to third countries, such as the United States, that have not been found to provide adequate protection to such Personal Data. The safe harbor framework previously relied on to ensure compliance with the Directive is no longer deemed to be a valid method of compliance with requirements set forth in the Directive, and so we face uncertainty as to whether our efforts to comply with our obligations under European privacy laws are sufficient. We and our customers are at risk of enforcement actions taken by certain EU data protection authorities until such point in time that we may be able to ensure that all transfers of Personal Data to us in the United States from the EU are conducted in compliance with all applicable regulatory obligations, the guidance of data protection authorities and evolving best practices. The Directive will be replaced in time with the European General Data Protection Regulation (“GDPR”), which will enter into force on May 25, 2018, and which may impose additional obligations, costs and risk upon our business. The GDPR may increase substantially the penalties to which we could be subject in the event of any non-compliance. In addition, we may incur substantial expense in complying with the new obligations to be imposed by the GDPR and we may be required to make significant changes in our business operations, all of which may adversely affect our revenues and our business overall.
In addition, we are subject to certain contractual obligations and privacy policies and practices regarding the collection, use, storage, transfer, disclosure, disposal or processing of personal data. Even the perception of a failure by us to comply with such contractual obligations and/or privacy policies and practices or other privacy concerns, whether or not valid, may harm our reputation, inhibit adoption of our solutions by current and future customers or adversely impact our ability to attract and retain workforce talent.
Loss, retention or misuse of certain information and alleged violations of laws and regulations relating to privacy and data security, and any relevant claims, may expose us to potential liability and may require us to expend significant resources on data security and in responding to and defending such allegations and claims. In addition, future laws, regulations, standards and other obligations, and changes in the interpretation of existing laws, regulations, standards and other obligations could impair our customers’ ability to collect, use or disclose data relating to individuals, which could decrease demand for our platform and solutions, increase our costs and impair our ability to maintain and grow our customer base and increase our revenue.
Around the world, there are numerous lawsuits in process against various technology companies that process personal data. If those lawsuits are successful, it could increase the likelihood that our company may be exposed to liability for our own policies and practices concerning the processing of personal data and could hurt our business. Furthermore, the costs of compliance with, and other burdens imposed by laws, regulations and policies concerning privacy and data security that are applicable to the businesses of our customers may limit the use and adoption of our platform or solutions and reduce overall demand for them. Privacy concerns, whether or not valid, may inhibit market adoption of our platform. Additionally, concerns about security or privacy may result in the adoption of new legislation that restricts the implementation of technologies like ours or requires us to make modifications to our platform, which could significantly limit the adoption and deployment of our technologies or result in significant expense to modify our platform.
28
We publicly post our privacy policies and practices concerning our processing, use and disclosure of the personally identifiable information provided to us by our website visitors. Our publication of our privacy policies and other statements we publish that provide promises and assurances about privacy and security can subject us to potential state and federal action if they are found to be deceptive or misrepresentative of our actual policies and practices or if our practices are found to be unfair.
Evolving and changing definitions of what constitutes “Personal Information” and “Personal Data” within the EU, the United States and elsewhere, especially relating to classification of IP addresses, machine or device identification numbers, location data and other information, may limit or inhibit our ability to operate or expand our business, including limiting technology alliance relationships that may involve the sharing of data.
We use third-party licensed software in or with our solutions, and the inability to maintain these licenses or issues with the software we license could result in increased costs or reduced service levels, which would adversely affect our business.
Our solutions include software or other intellectual property licensed from third parties, and we otherwise use software and other intellectual property licensed from third parties in our business. We anticipate that we will continue to rely on such third-party software and intellectual property in the future. This exposes us to risks over which we may have little or no control. The third-party software we currently license may not always be available, and we may not have access to alternative third-party software on commercially reasonable terms. In addition, a third party may assert that we or our customers are in breach of the terms of a license, which could, among other things, give such third party the right to terminate a license or seek damages from us, or both. Our inability to obtain or maintain certain licenses or other rights or to obtain or maintain such licenses or rights on favorable terms, or the need to engage in litigation regarding these matters, could result in delays in releases of new solutions, and could otherwise disrupt our business, until equivalent technology can be identified, licensed or developed, if at all. Also, to the extent that our platform and solutions depend upon the successful operation of third-party software in conjunction with our software, any undetected errors or defects in such third-party software could prevent the deployment or impair the functionality of our platform, delay new feature introductions, result in a failure of our platform and injure our reputation.
Our failure to raise additional capital or generate cash flows necessary to expand our operations and invest in new technologies in the future could reduce our ability to compete successfully and harm our operating results.
We may need to raise additional funds, and we may not be able to obtain additional debt or equity financing on favorable terms, if at all. If we raise additional equity financing, our security holders may experience significant dilution of their ownership interests. If we engage in debt financing, we may be required to accept terms that restrict our ability to incur additional indebtedness, force us to maintain specified liquidity or other ratios or restrict our ability to pay dividends or make acquisitions. If we need additional capital and cannot raise it on acceptable terms, or at all, we may not be able to, among other things:
|
|
• |
develop and enhance our products; |
|
|
• |
continue to expand our product development, sales and marketing organizations; |
|
|
• |
hire, train and retain employees; |
|
|
• |
respond to competitive pressures or unanticipated working capital requirements; or |
|
|
• |
pursue acquisition opportunities. |
29
Our debt obligations contain restrictions that impact our business and expose us to risks that could adversely affect our liquidity and financial condition.
At December 31, 2017, the balance outstanding under our term loan facility was $70.0 million, and we had a $7.5 million revolving credit facility (under which we had no outstanding borrowings and $6.1 million outstanding under a letter of credit sub-facility). Our interest expense during the years ended December 31, 2017, 2016 and 2015 was approximately $14.8 million, $7.3 million and $3.9 million, respectively, which includes non-cash amortization of loan origination fees and costs of modifying our credit facility as well as $1.4 million in cash charges for an early prepayment penalty in 2017.
The credit agreement governing our credit facility contains various covenants that are operative so long as our credit facility remain outstanding. The covenants, among other things, limit our and certain of our subsidiaries’ abilities to:
|
|
• |
incur additional indebtedness or guarantee indebtedness of others; |
|
|
• |
create additional liens on our assets; |
|
|
• |
pay dividends and make other distributions on our capital stock, and redeem and repurchase our capital stock; |
|
|
• |
make investments, including acquisitions; |
|
|
• |
make capital expenditures; |
|
|
• |
enter into mergers or consolidations or sell assets; |
|
|
• |
sell our subsidiaries; |
|
|
• |
engage in sale and leaseback transactions; or |
|
|
• |
enter into transactions with affiliates. |
Our credit facility also contains numerous affirmative covenants, including financial covenants. Even if our credit facility is terminated, any additional debt that we incur in the future could subject us to similar or additional covenants.
If we experience a decline in cash flow due to any of the factors described in this “Risk Factors” section or otherwise, we could have difficulty paying interest and principal amounts due on our indebtedness and meeting the financial covenants set forth in our credit facility. If we are unable to generate sufficient cash flow or otherwise to obtain the funds necessary to make required payments under our credit facility, or if we fail to comply with the various requirements of our indebtedness, we could default under our credit facility. Any such default that is not cured or waived could result in an acceleration of indebtedness then outstanding under our credit facility, an increase in the applicable interest rates under our credit facility, and a requirement that our subsidiaries that have guaranteed our credit facility pay the obligations in full, and would permit the lenders to exercise remedies with respect to all of the collateral that is securing our credit facility, including substantially all of our and our subsidiary guarantors’ assets. Thus, any such default could have a material adverse effect on our liquidity and financial condition.
30
We may acquire or invest in companies, which may divert our management’s attention and result in additional dilution to our stockholders. We may be unable to integrate acquired businesses and technologies successfully or achieve the expected benefits of such acquisitions.
Our success will depend, in part, on our ability to expand our solutions and services and grow our business in response to changing technologies, customer demands and competitive pressures. In some circumstances, we may choose to do so through the acquisition of, or investment in, new or complementary businesses and technologies rather than through internal development. The identification of suitable acquisition or investment candidates can be difficult, time-consuming and costly, and we may not be able to successfully complete identified acquisitions or investments. The risks we face in connection with acquisitions and/or investments include:
|
|
• |
an acquisition may negatively affect our operating results because it may require us to incur charges or assume substantial debt or other liabilities, may cause adverse tax consequences or unfavorable accounting treatment, may expose us to claims and disputes by stockholders and third parties, including intellectual property claims and disputes, or may not generate sufficient financial return to offset additional costs and expenses related to the acquisition; |
|
|
• |
we may encounter difficulties or unforeseen expenditures in integrating the business, technologies, products, personnel or operations of any company that we acquire; |
|
|
• |
an acquisition or investment may disrupt our ongoing business, divert resources, increase our expenses and distract our management; |
|
|
• |
an acquisition may result in a delay or reduction of customer purchases for both us and the company acquired due to customer uncertainty about continuity and effectiveness of service from either company; |
|
|
• |
we may encounter difficulties in, or may be unable to, successfully sell any acquired products or effectively integrate them into or with our existing solutions; |
|
|
• |
our use of cash to pay for acquisitions or investments would limit other potential uses for our cash; |
|
|
• |
if we incur debt to fund any acquisitions or investments, such debt may subject us to material restrictions on our ability to conduct our business; and |
|
|
• |
if we issue a significant amount of equity securities in connection with future acquisitions, existing stockholders may be diluted and earnings per share may decrease. |
The occurrence of any of these risks could adversely affect our business, operating results and financial condition.
If we fail to adequately protect our proprietary rights, our competitive position could be impaired, and we may lose valuable assets, generate reduced revenue and incur costly litigation to protect our rights.
We rely on copyrights and trade secret laws, confidentiality procedures, employment proprietary information and inventions assignment agreements, trademarks and patents to protect our intellectual property rights. However, the steps we take to protect our intellectual property may not be adequate. To protect our trade secrets and proprietary information, we rely in significant part on confidentiality arrangements with our employees, licensees, independent contractors, advisers, channel partners, resellers and customers. These arrangements may not be effective to prevent disclosure of confidential information, including trade secrets, and may not provide an adequate remedy in the event of unauthorized disclosure of confidential information. In addition, if others independently discover trade secrets and proprietary information, we would not be able to assert trade secret rights against such parties. To protect our intellectual property, we may be required to spend significant resources to obtain, monitor and enforce such rights. Litigation brought to enforce our intellectual property could be costly, time-consuming and distracting to management and could be met with defenses, counterclaims and countersuits attacking the validity and enforceability of our intellectual property, which may result in the impairment or loss of portions of our intellectual property. The laws of some foreign countries do not protect our intellectual property to the same extent as the laws of the United States, and effective intellectual property protection and mechanisms may not be available in those jurisdictions. We may need to expend additional resources to defend our intellectual property in these countries, and our inability to do so could impair our business or adversely affect our international expansion. Even if we are able to secure intellectual property, there can be no assurances that such rights will provide us with competitive advantages or distinguish our platform or solutions and services from those of our competitors or that our competitors will not independently develop similar technology.
31
We may be subject to intellectual property rights claims by third parties, which may be costly to defend, could require us to pay significant damages and could limit our ability to use certain technologies.
Companies in the software and technology industries, including some of our current and potential competitors, own large numbers of patents, copyrights, trademarks and trade secrets and frequently enter into litigation based on allegations of infringement, misappropriation or other violations of intellectual property rights. We have in the past and may in the future be subject to notices that claim we have infringed, misappropriated or misused the intellectual property of our competitors or other third parties, including patent holding companies whose sole business is to assert such claims. To the extent we increase our visibility in the market, we face a higher risk of being the subject of intellectual property claims. Additionally, we do not have a significant patent portfolio, which could prevent us from deterring patent infringement claims through our own patent portfolio, and our competitors and others may now or in the future have significantly larger and more mature patent portfolios than we do.
Any intellectual property claims, with or without merit, could be time-consuming and expensive and could divert our management’s attention and other resources. These claims could also subject us to significant liability for damages, potentially including treble damages if we are found to have willfully infringed patents or copyrights. These claims could also result in our having to stop using technology found to be in violation of a third party’s rights. We might be required to seek a license for the intellectual property, which may not be available on reasonable terms or at all. Even if a license is available, we could be required to pay significant royalties, which would increase our operating expenses. As a result, we may be required to develop alternative non-infringing technology, which could require significant effort and expense. If we cannot license or develop technology for any aspect of our business that may ultimately be determined to infringe on or misappropriate the intellectual property rights of another party, we could be forced to limit or stop sales of licenses to our platform and solutions and may be unable to compete effectively. Furthermore, we may be subject to indemnification obligations with respect to third-party intellectual property pursuant to our agreements with our channel partners or customers. Any of these results would adversely affect our business, operating results and financial condition.
Indemnity provisions in various agreements potentially expose us to substantial liability for intellectual property infringement and other losses.
Our agreements with customers and other third parties may include indemnification provisions under which we agree to indemnify them or otherwise be liable for losses suffered or incurred as a result of claims of intellectual property infringement or misappropriation, damages caused by us to property or persons, or other liabilities relating to or arising from our platform, solutions, services or other contractual obligations. Some of these indemnity agreements provide for uncapped liability for which we would be responsible, and some indemnity provisions survive termination or expiration of the applicable agreement.
From time to time, customers also require us to indemnify or otherwise be liable to them for breach of confidentiality, violation of applicable law or failure to implement adequate security measures with respect to their data stored, transmitted or accessed using our platform. Although we normally seek contractual limitations to our liability with respect to the foregoing obligations, the existence of such a dispute may have adverse effects on our customer relationship and reputation and even if we contractually limit our liability with respect to such obligations, we may still incur substantial liability related to them. Any assertions by a third party, whether or not successful, with respect to any of these indemnification obligations could subject us to costly and time-consuming litigation, expensive remediation and licenses, divert management attention and financial resources, harm our relationship with that customer and other current and prospective customers, reduce demand for our platform and solutions, and harm our brand, business, operating results and financial condition. Any dispute with a customer with respect to such obligations could have adverse effects on our relationship with that customer and other existing customers and new customers and adversely affect our business and operating results.
32
We may be subject to damages resulting from claims that our employees or contractors have wrongfully used or disclosed alleged trade secrets of their former employers or other parties.
We could in the future be subject to claims that we, our employees or our contractors have inadvertently or otherwise used or disclosed trade secrets or other proprietary information of our competitors or other parties. Litigation may be necessary to defend against these claims. If we fail in defending against such claims, a court could order us to pay substantial damages and prohibit us from using technologies or features that are essential to our solutions, if such technologies or features are found to incorporate or be derived from the trade secrets or other proprietary information of these parties. In addition, we may lose valuable intellectual property rights or personnel. A loss of key personnel or their work product could hamper or prevent our ability to develop, market and support potential solutions or enhancements, which could severely harm our business. Even if we are successful in defending against these claims, such litigation could result in substantial costs and be a distraction to management.
Our use of “open source” software could negatively affect our ability to sell our solutions and subject us to possible litigation.
Some aspects of our platform and solutions are built using open source software, and we intend to continue to use open source software in the future. From time to time, we contribute software source code to open source projects under open source licenses or release internal software projects under open source software licenses, and anticipate doing so in the future. The terms of certain open source licenses to which we are subject have not been interpreted by U.S. or foreign courts, and there is a risk that open source software licenses could be construed in a manner that imposes unanticipated conditions or restrictions on our ability to monetize our products. Additionally, we may from time to time face claims from third parties claiming ownership of, or demanding release of, the open source software or derivative works that we developed using such software, which could include our proprietary source code, or otherwise seeking to enforce the terms of the applicable open source software license. These claims could result in litigation and could require us to make our software source code freely available, purchase a costly license or cease offering the implicated services unless and until we can re-engineer them to avoid infringement or violation. This re-engineering process could require significant additional research and development resources, and we may not be able to complete it successfully. In addition to risks related to license requirements, use of certain open source software can lead to greater risks than use of third-party commercial software, as open source licensors generally do not provide warranties or controls on the origin of software and, thus, may contain security vulnerabilities or broken code. Additionally, because any software source code we contribute to open source projects is publicly available, our ability to protect our intellectual property rights with respect to such software source code may be limited or lost entirely, and we may be unable to prevent our competitors or others from using such contributed software source code. Any of these risks could be difficult to eliminate or manage, and if not addressed, could have a negative effect on our business, operating results and financial condition.
We may be required to defer recognition of some of our license revenue, which may harm our operating results in any given period.
We may be required to defer recognition of license revenue for a significant period of time after entering into an agreement due to a variety of factors, including, among other things, whether:
|
|
• |
the transaction involves products or features that are under development; |
|
|
• |
the transaction involves extended payment terms; or |
|
|
• |
the transaction involves acceptance criteria. |
Although we strive to enter into agreements that meet the criteria under GAAP for current revenue recognition on delivered elements, our agreements are often subject to negotiation and revision based on the demands of our customers. The final terms of our agreements sometimes result in deferred revenue recognition well after the time of delivery, which may adversely affect our financial results in any given period.
33
Furthermore, the presentation of our financial results requires us to make estimates and assumptions that may affect revenue recognition. In some instances, we could reasonably use different estimates and assumptions, and changes in estimates are likely to occur from period to period. Accordingly, actual results could differ significantly from our estimates.
If our estimates or judgments relating to our critical accounting policies prove to be incorrect, our operating results could be adversely affected.
The preparation of financial statements in conformity with GAAP requires management to make estimates and assumptions that affect the amounts reported in our consolidated financial statements and accompanying notes. We base our estimates on historical experience and on various other assumptions that we believe to be reasonable under the circumstances, as provided in Item 7. Management’s Discussion and Analysis of Financial Condition and Results of Operations. The results of these estimates form the basis for making judgments about the carrying values of assets, liabilities and equity, and the amount of revenue and expenses that are not readily apparent from other sources. Significant assumptions and estimates used in preparing our consolidated financial statements include those related to revenue recognition, capitalized internal-use software costs, income taxes, other non-income taxes, business combinations and valuation of goodwill and purchased intangible assets and stock-based compensation. Our operating results may be adversely affected if our assumptions change or if actual circumstances differ from those in our assumptions, which could cause our operating results to fall below the expectations of securities analysts and investors, resulting in a decline in the trading price of our common stock.
Changes in existing financial accounting standards or practices, or taxation rules or practices, may harm our operating results.
Changes in existing accounting or taxation rules or practices, new accounting pronouncements or taxation rules, or varying interpretations of current accounting pronouncements or taxation practice could harm our operating results or the manner in which we conduct our business. Further, such changes could potentially affect our reporting of transactions completed before such changes are effective.
GAAP is subject to interpretation by the Financial Accounting Standards Board (“FASB”), the SEC and various bodies formed to promulgate and interpret appropriate accounting principles. A change in these principles or interpretations could have a significant effect on our reported financial results and could affect the reporting of transactions completed before the announcement of a change.
For example, in May 2014 the FASB issued ASU No. 2014-09, Revenue from Contracts with Customers (“Topic 606”), for which certain elements may impact our accounting for revenue and costs incurred to acquire contracts. We will be required to implement this guidance for our annual reporting period beginning after December 15, 2018, unless we are no longer an emerging growth company on December 31, 2018. Application of Topic 606 may significantly impact the amount and timing of revenue recognition, such as recognizing revenue from existing contracts in periods other than when historically reported under existing GAAP or the revenue recognized under existing GAAP could be eliminated as part of the effect of adoption. Further, adoption of Topic 606 could result in changes to the periods when revenue is recognized in the future compared with management’s current expectations under existing GAAP. In addition, Topic 606 may significantly change the timing of when expense recognition will occur related to costs to obtain and fulfill customer contracts. While the adoption of Topic 606 does not change the cash flows received from our contracts with customers, the adoption of Topic 606 could have a material adverse effect on our financial position or results of operations.
34
Our business may be subject to additional obligations to collect and remit sales tax and other taxes, and we may be subject to tax liability for past sales. Any successful action by state, foreign or other authorities to collect additional or past sales tax could adversely affect our business.
States and some local taxing jurisdictions have differing rules and regulations governing sales and use taxes, and these rules and regulations are subject to varying interpretations that may change over time. In particular, the applicability of sales taxes to our platform in various jurisdictions is unclear. It is possible that we could face sales tax audits and that our liability for these taxes could exceed our estimates as state tax authorities could still assert that we are obligated to collect additional amounts as taxes from our customers and remit those taxes to those authorities. We could also be subject to audits in states and international jurisdictions for which we have not accrued tax liabilities. A successful assertion that we should be collecting additional sales or other taxes on our services in jurisdictions where we have not historically done so and do not accrue for sales taxes could result in substantial tax liabilities for past sales, discourage customers from purchasing our products or otherwise adversely affect our business, operating results and financial condition.
We file sales tax returns in certain states within the United States as required by law and certain customer contracts for a portion of the products that we provide. We do not collect sales or other similar taxes in other states and many of such states do not apply sales or similar taxes to the vast majority of the products that we provide. However, one or more states or foreign authorities could seek to impose additional sales, use or other tax collection and record-keeping obligations on us or may determine that such taxes should have, but have not been, paid by us. Liability for past taxes may also include substantial interest and penalty charges. Any successful action by state, foreign or other authorities to compel us to collect and remit sales tax, use tax or other taxes, either retroactively, prospectively or both, could adversely affect our business, operating results and financial condition.
If our products fail to help our customers achieve and maintain compliance with certain government regulations and industry standards, our business and operating results could be materially and adversely affected.
We believe we generate a portion of our revenues from our products and services because our customers use our products and services as part of their efforts to achieve and maintain compliance with certain government regulations and industry standards, and we expect that will continue for the foreseeable future. Examples of industry standards and government regulations include the Payment Card Industry Data Security Standard (“PCI-DSS”); the Federal Information Security Management Act (“FISMA”) and associated National Institute for Standards and Testing (“NIST”) Network Security Standards; the Sarbanes-Oxley Act; Title 21 of the U.S. Code of Federal Regulations, which governs food and drugs industries; the North American Electric Reliability Corporation Critical Infrastructure Protection Plan (“NERC-CIP”); the proposed European General Data Protection Regulation; the German Federal Financial Supervisory Authority (“BaFin”) Minimum Requirements for Risk Management; and the Monetary Authority of Singapore’s Technology Risk Management Notices. These industry standards may change with little or no notice, including changes that could make them more or less onerous for businesses. In addition, governments may also adopt new laws or regulations, or make changes to existing laws or regulations, that could affect whether our customers believe our solution assists them in maintaining compliance with such laws or regulations. If our solutions fail to expedite our customers’ compliance initiatives, our customers may lose confidence in our products and could switch to products offered by our competitors. In addition, if government regulations and industry standards related to IT security are changed in a manner that makes them less onerous, our customers may view compliance as less critical to their businesses, and our customers may be less willing to purchase our products and services. In either case, our sales and financial results would suffer.
35
Failure to comply with anti-bribery, anti-corruption, and anti-money laundering laws could subject us to penalties and other adverse consequences.
We are subject to the Foreign Corrupt Practices Act (“FCPA”), the U.K. Bribery Act and other anti-corruption, anti-bribery and anti-money laundering laws in various jurisdictions both domestic and abroad. The FCPA prohibits any U.S. individual or business from paying, offering, authorizing payment or offering of anything of value, directly or indirectly, to any foreign official, political party or candidate for the purpose of influencing any act or decision of the foreign entity in order to assist the individual or business in obtaining or retaining business. The U.K. Bribery Act is similar but even broader in scope in that it prohibits bribery of private (non-government) persons as well. The FCPA also obligates companies whose securities are listed in the United States to comply with certain accounting provisions requiring the company to maintain books and records that accurately and fairly reflect all transactions of the corporation, including international subsidiaries, and to devise and maintain an adequate system of internal accounting controls for international operations. Our sales model presents some risk under these laws. We leverage third parties, including channel partners, to sell our solutions and conduct our business abroad. We and our third-party intermediaries may have direct or indirect interactions with officials and employees of government agencies, state-owned or affiliated entities and non-governmental commercial entities, and may be held liable for the corrupt or other illegal activities of these third-party intermediaries, our employees, representatives, contractors, channel partners and agents, even if we do not explicitly authorize such activities. While we have policies and procedure to address compliance with these laws, we cannot assure you that all of our employees and agents will not take actions in violation of our policies and applicable law, for which we may be ultimately held responsible. Noncompliance with these laws could subject us to investigations, sanctions, settlements, prosecution, other enforcement actions, disgorgement of profits, significant fines, damages, other civil and criminal penalties or injunctions, adverse media coverage and other consequences. Any investigations, actions or sanctions could adversely affect our business, operating results and financial condition.
We are subject to governmental export controls and economic sanctions laws that could impair our ability to compete in international markets and subject us to liability if we are not in full compliance with applicable laws.
Our business activities are subject to various restrictions under U.S. export controls and trade and economic sanctions laws, including the U.S. Commerce Department’s Export Administration Regulations and economic and trade sanctions regulations maintained by the U.S. Treasury Department’s Office of Foreign Assets Control. The U.S. export control laws and U.S. economic sanctions laws include prohibitions on the sale or supply of certain products and services to U.S. embargoed or sanctioned countries, governments, persons and entities and also require authorization for the export of encryption items. We are also subject to Israeli export controls on encryption technology for SecurityIQ. If the applicable U.S. or Israeli requirements regarding export of encryption technology were to change or if we change the encryption means in our products, we may need to satisfy additional requirements in the United States or Israel. There can be no assurance that we will be able to satisfy any additional requirements under these circumstances in either the United States or Israel.
In addition, various countries regulate the import of certain encryption technology, including through import permitting and licensing requirements, and have enacted laws that could limit our ability to distribute our services or could limit our customers’ ability to implement our services in those countries. Although we take precautions to prevent our products from being provided in violation of such laws, our products may have been in the past, and could in the future be, provided inadvertently in violation of such laws, despite the precautions we take. If we fail to comply with these laws and regulations, we and certain of our employees could be subject to civil or criminal penalties, including the possible loss of export privileges and monetary penalties. Obtaining the necessary authorizations, including any required license, for a particular transaction may be time-consuming, is not guaranteed, and may result in the delay or loss of sales opportunities. Although we take precautions to prevent transactions with U.S. sanction targets, we could inadvertently provide our products to persons prohibited by U.S. sanctions. This could result in negative consequences to us, including government investigations, penalties and harm to our reputation.
36
Our corporate structure and intercompany arrangements are subject to the tax laws of various jurisdictions, and we could be obligated to pay additional taxes, which would harm our operating results.
Based on our current corporate structure, we may be subject to taxation in several jurisdictions around the world with increasingly complex tax laws, the application of which can be uncertain. The amount of taxes we pay in these jurisdictions could increase substantially as a result of changes in the applicable tax principles, including increased tax rates, new tax laws or revised interpretations of existing tax laws and precedents. In addition, the authorities in these jurisdictions could challenge our methodologies for valuing developed technology or intercompany arrangements, including our transfer pricing. The relevant taxing authorities may determine that the manner in which we operate our business does not achieve the intended tax consequences. If such a disagreement were to occur, and our position were not sustained, we could be required to pay additional taxes, interest and penalties. Such authorities could claim that various withholding requirements apply to us or our subsidiaries or assert that benefits of tax treaties are not available to us or our subsidiaries. Any increase in the amount of taxes we pay or that are imposed on us could increase our worldwide effective tax rate and adversely affect our business and operating results.
Our ability to use net operating losses and other tax attributes to offset future taxable income may be subject to certain limitations.
In general, under Sections 382 and 383 of the Internal Revenue Code of 1986, as amended (the “Internal Revenue Code”), a corporation that undergoes an “ownership change” is subject to limitations on its ability to utilize its pre-change net operating losses (“NOLs”), tax credits or other tax attributes, to offset future taxable income or taxes. For these purposes, an ownership change generally occurs where the aggregate stock ownership of one or more stockholders or groups of stockholders who owns at least 5% of a corporation’s stock increases its ownership by more than 50 percentage points over its lowest ownership percentage within a specified testing period. Our existing NOLs may be subject to substantial limitations arising from previous ownership changes, and if we undergo an ownership change in the future, our ability to utilize NOLs could be further limited by Sections 382 and 383 of the Internal Revenue Code. In addition, future changes in our stock ownership, many of which are outside of our control, could result in an ownership change under Sections 382 and 383 of the Internal Revenue Code. Our NOLs may also be impaired under state law. Accordingly, we may not be able to utilize a material portion of our NOLs. Furthermore, our ability to utilize our NOLs is conditioned upon our attaining profitability and generating U. S. federal and state taxable income.
We function as a HIPAA “business associate” for certain of our customers and, as such, are subject to strict privacy and data security requirements. If we fail to comply with any of these requirements, we could be subject to significant liability, all of which can adversely affect our business as well as our ability to attract and retain new customers.
The Health Insurance Portability Act of 1996, as amended by the Health Information Technology for Economic and Clinical Health Act (“HITECH”), and their respective implementing regulations (“HIPAA”), imposes specified requirements relating to the privacy, security and transmission of individually identifiable health information. Among other things, HITECH makes HIPAA’s security standards directly applicable to “business associates.” We function as a business associate for certain of our customers that are HIPAA covered entities and service providers and, in that context we are regulated as a business associate for the purposes of HIPAA. If we are unable to comply with our obligations as a HIPAA business associate, we could face substantial civil and even criminal liability. Modifying the already stringent penalty structure that was present under HIPAA prior to HITECH, HITECH created four new tiers of civil monetary penalties and gave state attorneys general new authority to file civil actions for damages or injunctions in federal courts to enforce the federal HIPAA laws and seek attorneys’ fees and costs associated with pursuing federal civil actions. In addition, many state laws govern the privacy and security of health information in certain circumstances, many of which differ from HIPAA and each other in significant ways and may not have the same effect.
The HIPAA covered entities and service providers to which we provide services require us to enter into HIPAA-compliant business associate agreements with them. These agreements impose stringent data security obligations on us. If we are unable to meet the requirements of any of these business associate agreements, we could face contractual liability under the applicable business associate agreement as well as possible civil and criminal liability under HIPAA, all of which can have an adverse impact on our business and generate negative publicity, which, in turn, can have an adverse impact on our ability to attract and retain new customers.
37
Risks Related to Ownership of Our Common Stock
The requirements of being a public company, including compliance with the reporting requirements of the Exchange Act, and the requirements of the Sarbanes-Oxley Act and the NYSE, may strain our resources, increase our costs and distract management, and we may be unable to comply with these requirements in a timely or cost-effective manner.
As a public company, we are subject to laws, regulations and requirements with which we were not required to comply as a private company, including compliance with reporting requirements of the Exchange Act and the requirements of the Sarbanes-Oxley Act and the NYSE. As a newly public company, complying with these statutes, regulations and requirements occupies a significant amount of time of our board of directors and management and has significantly increased our costs and expenses as compared to when we were a private company. For example, as a newly public company, we have had to institute a more comprehensive compliance function, establish new internal policies, such as those relating to insider trading, and involve and retain to a greater degree outside counsel and accountants. In addition, being a public company subject to these rules and regulations has made it more expensive for us to obtain director and officer liability insurance, and we may be required to accept reduced policy limits and coverage or incur substantially higher costs to obtain the same or similar coverage. As a result, it may be more difficult for us to attract and retain qualified individuals to serve on our board of directors or as executive officers as compared to when we were a private company.
Furthermore, while we generally must comply with Section 404 of the Sarbanes-Oxley Act for our fiscal year ending December 31, 2018, we are not required to have our independent registered public accounting firm attest to the effectiveness of our internal controls until our first annual report subsequent to our ceasing to be an emerging growth company. Accordingly, we may not be required to have our independent registered public accounting firm attest to the effectiveness of our internal controls until as late as our annual report for the fiscal year ending December 31, 2022. Once it is required to do so, our independent registered public accounting firm may issue a report that is adverse in the event it is not satisfied with the level at which our controls are documented, designed, operated or reviewed. Compliance with these requirements may strain our resources, increase our costs and distract management, and we may be unable to comply with these requirements in a timely or cost-effective manner.
The trading price of our common stock could be volatile, which could cause the value of your investment to decline.
Our initial public offering occurred in November 2017. Therefore, there has only been a public market for our common stock for a short period of time. Although our common stock is listed on the NYSE, an active trading market for our common stock may not develop or, if developed, be sustained. Technology stocks have historically experienced high levels of volatility. The trading price of our common stock may fluctuate substantially. Since shares of our common stock were sold in our initial public offering in November 2017 at a price of $12.00 per share, our stock price has fluctuated significantly. Factors that could cause fluctuations in the trading price of our common stock include the following:
|
|
• |
announcements of new products or technologies, commercial relationships, acquisitions or other events by us or our competitors; |
|
|
• |
changes in how customers perceive the benefits of our platform; |
|
|
• |
shifts in the mix of revenue attributable to perpetual licenses and to SaaS subscriptions from quarter to quarter; |
|
|
• |
departures of key personnel; |
|
|
• |
price and volume fluctuations in the overall stock market from time to time; |
|
|
• |
fluctuations in the trading volume of our shares or the size of our public float; |
|
|
• |
sales of large blocks of our common stock; |
|
|
• |
actual or anticipated changes or fluctuations in our operating results; |
|
|
• |
whether our operating results meet the expectations of securities analysts or investors; |
38
|
|
• |
litigation involving us, our industry or both; |
|
|
• |
regulatory developments in the United States, foreign countries or both; |
|
|
• |
general economic conditions and trends; |
|
|
• |
major catastrophic events in our domestic and foreign markets; and |
|
|
• |
“flash crashes,” “freeze flashes” or other glitches that disrupt trading on the securities exchange on which we are listed. |
In addition, if the market for technology stocks or the stock market in general experiences a loss of investor confidence, the trading price of our common stock could decline for reasons unrelated to our business, operating results or financial condition. The trading price of our common stock might also decline in reaction to events that affect other companies in our industry even if these events do not directly affect us. In the past, following periods of volatility in the trading price of a company’s securities, securities class action litigation has often been brought against that company. If our stock price is volatile, we may become the target of securities litigation. Securities litigation could result in substantial costs and divert our management’s attention and resources from our business. This could have an adverse effect on our business, operating results and financial condition.
In the past, following periods of volatility in the trading price of a company’s securities, securities class action litigation has often been brought against that company. If our stock price is volatile, we may become the target of securities litigation. Securities litigation could result in substantial costs and divert our management’s attention and resources from our business. This could have an adverse effect on our business, operating results and financial condition.
An active public trading market may not continue to develop or be sustained.
Prior to the completion of our initial public offering in November 2017, no public market for our common stock existed. An active public trading market for our common stock may not continue to develop or be sustained. The lack of an active market may impair your ability to sell your shares of our common stock at the time you wish to sell them or at a price that you consider reasonable. The lack of an active market may also reduce the fair value of your shares. An inactive market may also impair our ability to raise capital to continue to fund operations by selling shares and may impair our ability to acquire other companies or technologies by using our shares as consideration.
If securities analysts or industry analysts were to downgrade our stock, publish negative research or reports or fail to publish reports about our business, our competitive position could suffer, and our stock price and trading volume could decline.
The trading market for our common stock, to some extent, depends on the research and reports that securities or industry analysts publish about us or our business. We do not have any control over these analysts. If one or more of the analysts who cover us should downgrade our stock or publish negative research or reports, cease coverage of our company or fail to regularly publish reports about our business, our competitive position could suffer, and our stock price and trading volume could decline.
Sales of substantial amounts of our common stock in the public markets, or the perception that such sales could occur, could reduce the market price of our common stock.
Sales of a substantial number of shares of our common stock in the public market, or the perception that such sales could occur, could adversely affect the market price of our common stock. We are unable to predict the effect that such sales may have on the prevailing market price of our common stock.
39
As of March 15, 2018, we have outstanding 87,205,120 shares of common stock. Of these shares, the 23,000,000 shares of common stock sold in our initial public offering are freely tradable. In addition, 63,600,396 shares of our common stock will be eligible for sale in the public market on May 16, 2018 following the expiration of the 180-day lock-up period in connection with our initial public offering, subject to volume, manner of sale and other limitations of Rule 144, as applicable. Morgan Stanley & Co. LLC and Citigroup Global Markets Inc. may, in their sole discretion, permit our stockholders who are subject to these lock-up agreements to sell shares prior to the expiration of the lock- up agreements. Sales of a substantial number of such shares upon expiration of, or the perception that such sales may occur, or early release of the shares subject to, the lock-up agreements, could cause our stock price to fall.
In addition, as of March 15, 2018, there were 3,766,294 shares of common stock subject to outstanding options and 1,245,826 shares of common stock to be issued upon the vesting of outstanding restricted stock units. We have registered all of the shares of common stock issuable upon the exercise of outstanding options, upon the vesting of outstanding restricted stock units and upon exercise of settlement of any options or other equity incentives we may grant in the future, for public resale under the Securities Act of 1933, as amended (the “Securities Act”). Accordingly, these shares may be freely sold in the public market upon issuance as permitted by any applicable vesting requirements, subject to the lock-up agreements described above and compliance with applicable securities laws. Furthermore, holders of 70,115,454 shares of our common stock have certain rights with respect to the registration of such shares (and any additional shares acquired by such holders in the future) under the Securities Act.
Our issuance of additional capital stock in connection with financings, acquisitions, investments, our stock incentive plans or otherwise will dilute all other stockholders.
We may issue additional capital stock in the future that will result in dilution to all other stockholders. We may also raise capital through equity financings in the future. As part of our business strategy, we may acquire or make investments in complementary companies, products or technologies and issue equity securities to pay for any such acquisition or investment. Any such issuances of additional capital stock may cause stockholders to experience significant dilution of their ownership interests and the per share value of our common stock to decline.
Our charter and bylaws contain anti-takeover provisions that could delay or discourage takeover attempts that stockholders may consider favorable.
Our charter and bylaws contain provisions that could delay or prevent a change in control of our company. These provisions could also make it difficult for stockholders to elect directors who are not nominated by the current members of our board of directors or take other corporate actions, including effecting changes in our management. These provisions include:
|
|
• |
a classified board of directors with three-year staggered terms, which could delay the ability of stockholders to change the membership of a majority of our board of directors; |
|
|
• |
after Thoma Bravo ceases to beneficially own at least 30% of the outstanding shares of our common stock, removal of directors only for cause; |
|
|
• |
the ability of our board of directors to issue shares of preferred stock and to determine the price and other terms of those shares, including preferences and voting rights, without stockholder approval, which could be used to significantly dilute the ownership of a hostile acquirer; |
|
|
• |
allowing Thoma Bravo to fill vacancy on our board of directors for so long as affiliates of Thoma Bravo own 30% or more of our outstanding shares of common stock and thereafter, allowing only our board of directors, which prevents stockholders from being able to fill vacancies on our board of directors; |
|
|
• |
after we cease to be a controlled company, a prohibition on stockholder action by written consent, which forces stockholder action to be taken at an annual or special meeting of our stockholders; |
40
|
|
• |
after we cease to be a controlled company, the requirement for the affirmative vote of holders of at least 66 2/3% of the voting power of all of the then outstanding shares of the voting stock, voting together as a single class, to amend the provisions of our charter relating to the management of our business (including our classified board structure) or certain provisions of our bylaws, which may inhibit the ability of an acquirer to effect such amendments to facilitate an unsolicited takeover attempt; |
|
|
• |
the ability of our board of directors to amend the bylaws, which may allow our board of directors to take additional actions to prevent an unsolicited takeover and inhibit the ability of an acquirer to amend the bylaws to facilitate an unsolicited takeover attempt; |
|
|
• |
advance notice procedures with which stockholders must comply to nominate candidates to our board of directors or to propose matters to be acted upon at a stockholders’ meeting, which may discourage or deter a potential acquirer from conducting a solicitation of proxies to elect the acquirer’s own slate of directors or otherwise attempting to obtain control of us; and |
|
|
• |
a prohibition of cumulative voting in the election of our board of directors, which would otherwise allow less than a majority of stockholders to elect director candidates. |
Our charter also contains a provision that provides us with protections similar to Section 203 of the Delaware General Corporation Law (“DGCL”), and prevents us from engaging in a business combination, such as a merger, with an interested stockholder (i.e., a person or group who acquires at least 15% of our voting stock) for a period of three years from the date such person became an interested stockholder, unless (with certain exceptions) the business combination or the transaction in which the person became an interested stockholder is approved in a prescribed manner. However, our charter also provides that Thoma Bravo, including the Thoma Bravo Funds, and any persons to whom any Thoma Bravo Fund sells its common stock will be deemed not to be interested stockholders.
Thoma Bravo has a controlling influence over matters requiring stockholder approval, which could delay or prevent a change of control.
Thoma Bravo, as the ultimate general partner of the Thoma Bravo Funds, beneficially owns in the aggregate 57.7% of our common stock as of March 15, 2018 (which shares are held directly by the Thoma Bravo Funds or their affiliates). As a result, Thoma Bravo could exert significant influence over our operations and business strategy and would have sufficient voting power to effectively control the outcome of matters requiring stockholder approval. These matters may include:
|
|
• |
the composition of our board of directors, which has the authority to direct our business and to appoint and remove our officers; |
|
|
• |
approving or rejecting a merger, consolidation or other business combination; |
|
|
• |
raising future capital; and |
|
|
• |
amending our charter and bylaws, which govern the rights attached to our common stock. |
41
Additionally, for so long as Thoma Bravo beneficially owns at least (i) 30% of our outstanding shares of common stock, Thoma Bravo will have the right to designate the chairman of our board of directors and of each committee of our board of directors as well as nominate a majority of our board of directors (provided that, at such time as we cease to be a “controlled company” under the NYSE corporate governance standards, the majority of our board of directors will be “independent” directors, as defined under the rules of the NYSE, and provided further, that, the membership of each committee of our board of directors will comply with the applicable rules of the NYSE); (ii) 20% (but less than 30%) of our outstanding shares of common stock, Thoma Bravo will have the right to nominate a number of directors to our board of directors equal to the lowest whole number that is greater than 30% of the total number of directors (but in no event fewer than two directors); (iii) 10% (but less than 20%) of our outstanding shares of common stock, Thoma Bravo will have the right to nominate a number of directors to our board of directors equal to the lowest whole number that is greater than 20% of the total number of directors (but in no event fewer than one director); and (iv) at least 5% (but less than 10%) of our outstanding shares of common stock, Thoma Bravo will have the right to nominate one director to our board of directors. For so long as Thoma Bravo beneficially owns at least 30% of our outstanding shares of common stock, the directors nominated by Thoma Bravo are expected to constitute a majority of each committee of our board of directors, other than the audit committee.
This concentration of ownership of our common stock could delay or prevent proxy contests, mergers, tender offers, open-market purchase programs or other purchases of our common stock that might otherwise result in the opportunity to realize a premium over the then-prevailing market price of our common stock. This concentration of ownership may also adversely affect our share price.
Thoma Bravo may pursue corporate opportunities independent of us that could present conflicts with our and our stockholders’ interests.
Thoma Bravo is in the business of making or advising on investments in companies and holds (and may from time to time in the future acquire) interests in or provides advice to businesses that directly or indirectly compete with certain portions of our business or are suppliers or customers of ours. Thoma Bravo may also pursue acquisitions that may be complementary to our business and, as a result, those acquisition opportunities may not be available to us.
Our charter provides that no officer or director of the Company who is also an officer, director, employee, managing director or other affiliate of Thoma Bravo will be liable to us or our stockholders for breach of any fiduciary duty by reason of the fact that any such individual pursues or acquires a corporate opportunity for its own account or the account of an affiliate, as applicable, instead of us, directs a corporate opportunity to any other person, instead of us or does not communicate information regarding a corporate opportunity to us.
We may issue preferred stock whose terms could adversely affect the voting power or value of our common stock.
Our charter authorizes us to issue, without the approval of our stockholders, one or more classes or series of preferred stock having such designations, preferences, limitations and relative rights, including preferences over our common stock respecting dividends and distributions, as our board of directors may determine. The terms of one or more classes or series of preferred stock could adversely impact the voting power or value of our common stock. For example, we might grant holders of preferred stock the right to elect some number of our directors in all events or on the happening of specified events or the right to veto specified transactions. Similarly, the repurchase or redemption rights or liquidation preferences we might assign to holders of preferred stock could affect the residual value of our common stock.
42
Our charter designates the Court of Chancery of the State of Delaware as the sole and exclusive forum for certain types of actions and proceedings that may be initiated by our stockholders, which could limit our stockholders’ ability to obtain a favorable judicial forum for disputes with us or our directors, officers, employees or agents.
Our charter provides that, unless we consent in writing to the selection of an alternative forum, the Court of Chancery of the State of Delaware will, to the fullest extent permitted by applicable law, be the sole and exclusive forum for (i) any derivative action or proceeding brought on our behalf, (ii) any action asserting a claim of breach of a fiduciary duty owed by any of our directors, officers, employees or agents to us or our stockholders, (iii) any action asserting a claim arising pursuant to any provision of the DGCL, our charter or bylaws, or (iv) any action asserting a claim against us that is governed by the internal affairs doctrine, in each such case subject to such Court of Chancery of the State of Delaware having personal jurisdiction over the indispensable parties named as defendants therein. Any person or entity purchasing or otherwise acquiring any interest in shares of our capital stock will be deemed to have notice of, and consented to, the provisions of our charter described in the preceding sentence. This choice of forum provision may limit a stockholder’s ability to bring a claim in a judicial forum that it finds favorable for disputes with us or our directors, officers, employees or agents, which may discourage such lawsuits against us and such persons. Alternatively, if a court were to find these provisions of our charter inapplicable to, or unenforceable in respect of, one or more of the specified types of actions or proceedings, we may incur additional costs associated with resolving such matters in other jurisdictions, which could adversely affect our business, financial condition or operating results.
For as long as we are an emerging growth company, we will not be required to comply with certain requirements that apply to other public companies.
We are an emerging growth company, as defined in the JOBS Act. For as long as we are an emerging growth company, which may be up to five full fiscal years, unlike other public companies, we are not required to, among other things: (i) provide an auditor’s attestation report on management’s assessment of the effectiveness of our system of internal control over financial reporting pursuant to Section 404(b) of the Sarbanes-Oxley Act; (ii) comply with any new requirements adopted by the Public Company Accounting Oversight Board requiring mandatory audit firm rotation or a supplement to the auditor’s report in which the auditor would be required to provide additional information about the audit and the financial statements of the issuer; (iii) provide certain disclosures regarding executive compensation required of larger public companies; or (iv) hold nonbinding advisory votes on executive compensation and any golden parachute payments not previously approved. In addition, the JOBS Act provides that an emerging growth company can take advantage of the extended transition period provided in Section 7(a)(2)(B) of the Securities Act for adopting new or revised financial accounting standards. We have elected take advantage of the longer phase-in periods for the adoption of new or revised financial accounting standards permitted under the JOBS Act until we are no longer an emerging growth company. If we were to subsequently elect instead to comply with these public company effective dates, such election would be irrevocable pursuant to the JOBS Act.
We will remain an emerging growth company for up to five years after our initial public offering, although we will lose that status sooner if we have more than $1.07 billion of revenues in a fiscal year, have more than $700.0 million in market value of our common stock held by non-affiliates, or issue more than $1.0 billion of non-convertible debt over a three-year period.
To the extent that we rely on any of the exemptions available to emerging growth companies, you will receive less information about our executive compensation and internal control over financial reporting than issuers that are not emerging growth companies. We cannot predict if investors will find our common stock less attractive because we will rely on these exemptions. If some investors find our common stock to be less attractive as a result, there may be a less active trading market for our common stock and our stock price may be more volatile.
When we lose our emerging growth company status or if we elect to no longer take advantage of the longer phase-in periods for the adoption of new or revised financial accounting standards permitted under the JOBS Act, the emerging growth company exemptions will cease to apply and we expect we will incur additional expenses and devote increased management effort toward ensuring compliance with the non-emerging growth company requirements. We cannot predict or estimate the amount of these expenses, which may be substantial.
43
We are controlled company within the meaning of the NYSE rules and, as a result, qualify for and rely on exemptions from certain corporate governance requirements.
Thoma Bravo beneficially owns, on a combined basis, a majority of the combined voting power of all classes of our outstanding voting stock. As a result, we are a controlled company within the meaning of the NYSE corporate governance standards. Under the NYSE rules, a company of which more than 50% of the voting power is held by another person or group of persons acting together is a controlled company and may elect not to comply with certain NYSE corporate governance requirements, including the requirements that:
|
|
• |
a majority of the board of directors consist of independent directors as defined under the rules of the NYSE; |
|
|
• |
the nominating and governance committee be composed entirely of independent directors with a written charter addressing the committee’s purpose and responsibilities; and |
|
|
• |
the compensation committee be composed entirely of independent directors with a written charter addressing the committee’s purpose and responsibilities. |
These requirements will not apply to us as long as we remain a controlled company. We currently utilize some or all of these exemptions. Accordingly, our investors may not have the same protections afforded to stockholders of companies that are subject to all of the corporate governance requirements of the NYSE. See the section titled “Management—Status as a Controlled Company” below.
Item 1B. Unresolved Staff Comments.
None.
We have a lease for a new 164,818 square-feet corporate headquarters in Austin, Texas that is currently under construction. We anticipate that the lease’s term will commence during the second fiscal quarter of 2019 (but may commence earlier or later, depending on the date the construction thereof is substantially completed or when we first conduct business therein), and it expires approximately 10 years from such commencement date. Our current corporate headquarters occupy 44,633 square feet in Austin, Texas under a lease that expires 20 business days after the commencement date for the lease for our new corporate headquarters. In addition to our headquarters, we have additional office space in Austin, Texas, and office space in Pune, India and Tel Aviv, Israel. Consistent with our growth, we currently plan to consolidate our Austin offices in 2019.
We lease all of our facilities. We believe that our facilities are adequate for our current needs and anticipate that suitable additional space will be readily available to accommodate any foreseeable expansion of our operations.
We are not currently a party to, nor is our property currently subject to, any material legal proceedings. We are not aware of any inquiries or investigations into our business.
Item 4. Mine Safety Disclosures.
None
44
Item 5. Market for Registrant’s Common Equity, Related Stockholder Matters and Issuer Purchases of Equity Securities.
Market Information
Our common stock is listed and traded on the NYSE under the symbol “SAIL.” Initial trading of our common stock commenced on November 17, 2017. Accordingly, no market for our common stock existed prior to that date. The table below sets forth, for the period indicated, the high and low sales prices per share of our common stock since November 17, 2017 as regularly quoted on the NYSE.
|
Year ended December 31, 2017 |
|
|
High |
|
|
Low |
|
Fourth Quarter (from November 17, 2017) |
|
$ |
16.36 |
|
$ |
12.82 |
On March 15, 2018, the closing sale price of our common stock on the NYSE was $21.60 per share.
Holders of Record
On March 15, 2018, there were 288 holders of record of our common stock. Because many of our shares of common stock are held by brokers and other institutions on behalf of stockholders, we are unable to estimate the total number of beneficial stockholders represented by these record holders.
Dividend Policy
We have never declared or paid any cash dividends on our common stock. We currently intend to retain all our earnings for the repayment of our outstanding debt and to finance the growth and development of our business. Any further determination to pay dividends on our common stock will be at the discretion of our board of directors, subject to applicable laws, and will depend on our financial condition, results of operations, capital requirements, general business conditions and other factors that our board of directors considers relevant. In addition, our credit facility places restrictions on our ability to pay cash dividends.
Stock Performance Graph
The following is not “soliciting material,” shall not be deemed “filed” for purposes of Section 18 of the Exchange Act or incorporated by reference into any of our other filings under the Exchange Act or the Securities Act, except to the extent we specifically incorporate it by reference into such filing.
The graph assumes that $100 was invested on November 17, 2017 in the Company’s common stock, in the NYSE composite index and the S&P 600 information technology index, and that all dividends were reinvested. The stock price performance on the following graph are required by the SEC and are not necessarily intended to forecast or be indicative of future stock price performance.
45
The closing price of our common stock on December 29, 2017, the last trading day of our 2017 fiscal year, was $14.50 per share.
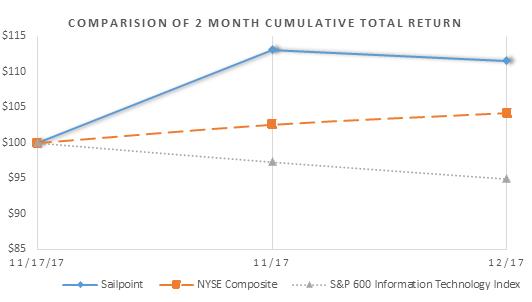
The closing price of our common stock on December 31, 2017, the last day of our 2017 fiscal year, was $14.50 per share.
|
Company /Index |
|
11/17/17 |
|
11/30/17 |
|
12/31/17 |
|||
|
SAIL |
|
$ |
100.00 |
|
$ |
113.07 |
|
$ |
111.53 |
|
NYSE Composite |
|
$ |
100.00 |
|
$ |
102.60 |
|
$ |
104.24 |
|
S&P 600 IT |
|
$ |
100.00 |
|
$ |
97.30 |
|
$ |
94.94 |
Recent Sale of Unregistered Securities
Between January 1, 2017 and November 20, 2017, we had the following sales of unregistered securities: (i) grants to certain of our employees, consultants and other service providers of options to purchase an aggregate of 1,765,420 shares of common stock at exercise prices ranging from $3.17 to $ 12.00 per share, (ii) grants to certain of our employees, consultants and other service providers of restricted stock awards for an aggregate of 897,284 shares of common stock, and (iii) issuances to certain of our employees, consultants and other service providers of an aggregate of 160,740 shares of common stock upon the exercise of options at exercise prices ranging from $1.07 to $ 2.46 per share, for a weighted-average exercise price of $ 2.23.
None of the foregoing transactions involved any underwriters, underwriting discounts or commissions, or any public offering. We believe the offers, sales and issuances of the above securities were exempt from registration under the Securities Act by virtue of Section 4(a)(2) of the Securities Act (or Regulation D or Regulation S promulgated thereunder) because the issuance of securities to the recipients did not involve a public offering, or in reliance on Rule 701 because the transactions were pursuant to compensatory benefit plans or contracts relating to compensation as provided under such rule. The recipients of the securities in each of these transactions represented their intentions to acquire the securities for investment only and not with a view to or for sale in connection with any distribution thereof, and appropriate legends were placed upon the stock certificates issued in these transactions. All recipients had adequate access, through their relationships with us, to information about us. The sales of these securities were made without any general solicitation or advertising.
46
Use of Proceeds from Initial Public Offering of Common stock
On November 16, 2017, the Registration Statement on Form S-1 (File No. 333-221036) relating to our initial public offering was declared effective by the SEC and we priced our initial public offering. Pursuant to the Registration Statement, we registered an aggregate of 23,000,000 shares of our common stock, of which 15,800,000 shares were sold by us and 7,200,000 shares were sold by certain selling stockholders named therein at a price to the public of $12.00 per share (for an aggregate offering price of $276.0 million). We received net proceeds of approximately $172.0 million, after deducting underwriting discounts and commissions of approximately $13.3 million and offering-related expenses of $4.4 million. No payments were made to our directors or officers or their associates, holders of 10% or more of any class of our equity securities or any affiliates. Morgan Stanley & Co. LLC, Citigroup Global Markets Inc., Jefferies LLC and RBC Capital Markets, LLC acted as book-running managers and KeyBanc Capital Markets Inc., Canaccord Genuity Inc. and Oppenheimer & Co. Inc. acted as co-managers (collectively, the “Underwriters”) for our initial public offering.
Our initial public offering closed in November 2017. There has been no material change in the planned use of proceeds from our initial public offering as described in our final prospectus dated November 16, 2017 and filed with the SEC on November 17, 2017 pursuant to Rule 424(b) of the Securities Act. As of December 31, 2017, we have used $90.0 million of the proceeds from our initial public offering to repay borrowings under our term loan facility and approximately $1.4 million of such proceeds to pay a related prepayment premium. As of December 31, 2017, all of the remaining net proceeds are held in cash and have not been deployed.
47
Item 6: Selected Financial Data
The following selected historical financial data has been derived from, and should be read in conjunction with, the audited Consolidated Financial Statements and the Notes to Consolidated Financial Statements and “Item 7. Management’s Discussion and Analysis of Financial Condition and Results of Operations” included elsewhere in this
Annual Report on Form 10-K. Our selected consolidated financial data may not be indicative of our future financial condition or results of operations (in thousands, except per share amounts).
Consolidated Statements of Operations Data:
|
|
|
Year Ended December 31, |
|
|||||||||
|
|
|
2017 |
|
|
2016 |
|
|
2015 |
|
|||
|
|
|
(In thousands, except share and per share data) |
|
|||||||||
|
Revenue: |
|
|
|
|
|
|
|
|
|
|
|
|
|
Licenses |
|
$ |
79,209 |
|
|
$ |
54,395 |
|
|
$ |
44,124 |
|
|
Subscription |
|
|
71,007 |
|
|
|
49,364 |
|
|
|
29,930 |
|
|
Services and other |
|
|
35,840 |
|
|
|
28,653 |
|
|
|
21,302 |
|
|
Total revenue |
|
|
186,056 |
|
|
|
132,412 |
|
|
|
95,356 |
|
|
Cost of revenue: |
|
|
|
|
|
|
|
|
|
|
|
|
|
Licenses |
|
|
4,561 |
|
|
|
4,278 |
|
|
|
4,293 |
|
|
Subscription (1) |
|
|
16,406 |
|
|
|
13,051 |
|
|
|
9,815 |
|
|
Services and other (1) |
|
|
23,623 |
|
|
|
19,709 |
|
|
|
15,151 |
|
|
Total cost of revenue |
|
|
44,590 |
|
|
|
37,038 |
|
|
|
29,259 |
|
|
Gross profit |
|
|
141,466 |
|
|
|
95,374 |
|
|
|
66,097 |
|
|
Operating expenses: |
|
|
|
|
|
|
|
|
|
|
|
|
|
Research and development (1) |
|
|
33,331 |
|
|
|
24,358 |
|
|
|
19,965 |
|
|
General and administrative (1) |
|
|
17,678 |
|
|
|
9,680 |
|
|
|
7,474 |
|
|
Sales and marketing (1) |
|
|
80,514 |
|
|
|
58,607 |
|
|
|
46,831 |
|
|
Total operating expenses |
|
|
131,523 |
|
|
|
92,645 |
|
|
|
74,270 |
|
|
Income (loss) from operations |
|
|
9,943 |
|
|
|
2,729 |
|
|
|
(8,173 |
) |
|
Other expense, net: |
|
|
|
|
|
|
|
|
|
|
|
|
|
Interest expense, net |
|
|
(14,783 |
) |
|
|
(7,277 |
) |
|
|
(3,883 |
) |
|
Other, net |
|
|
(459 |
) |
|
|
(610 |
) |
|
|
(1,365 |
) |
|
Total other expense, net |
|
|
(15,242 |
) |
|
|
(7,887 |
) |
|
|
(5,248 |
) |
|
Loss before income taxes |
|
|
(5,299 |
) |
|
|
(5,158 |
) |
|
|
(13,421 |
) |
|
Income tax (expense) benefit |
|
|
(2,293 |
) |
|
|
1,985 |
|
|
|
2,614 |
|
|
Net loss |
|
$ |
(7,592 |
) |
|
$ |
(3,173 |
) |
|
$ |
(10,807 |
) |
|
Net loss available to common shareholders |
|
$ |
(28,721 |
) |
|
$ |
(26,791 |
) |
|
$ |
(32,404 |
) |
|
Net loss per share |
|
|
|
|
|
|
|
|
|
|
|
|
|
Basic: |
|
$ |
(0.55 |
) |
|
$ |
(0.58 |
) |
|
$ |
(0.74 |
) |
|
Diluted: |
|
$ |
(0.55 |
) |
|
$ |
(0.58 |
) |
|
$ |
(0.74 |
) |
|
Weighted-average shares of common stock used in computing net loss per share attributable to common stockholders |
|
|
|
|
|
|
|
|
|
|
|
|
|
Basic: |
|
|
52,339,804 |
|
|
|
45,933,218 |
|
|
|
43,929,159 |
|
|
Diluted: |
|
|
52,339,804 |
|
|
|
45,933,218 |
|
|
|
43,929,159 |
|
48
|
|
|
Year Ended December 31, |
|
|||||||||
|
|
|
2017 |
|
|
2016 |
|
|
2015 |
|
|||
|
|
|
(In thousands) |
|
|||||||||
|
Cost of revenue - subscription |
|
$ |
133 |
|
|
$ |
34 |
|
|
$ |
12 |
|
|
Cost of revenue - services and other |
|
|
458 |
|
|
|
63 |
|
|
|
20 |
|
|
Research and development |
|
|
658 |
|
|
|
118 |
|
|
|
62 |
|
|
General and administrative |
|
|
2,062 |
|
|
|
96 |
|
|
|
28 |
|
|
Sales and marketing |
|
|
1,203 |
|
|
|
257 |
|
|
|
124 |
|
|
Total stock-based compensation |
|
$ |
4,514 |
|
|
$ |
568 |
|
|
$ |
246 |
|
Consolidated Balance Sheet data:
|
|
|
As of December 31, |
|
|||||||||
|
|
|
2017 |
|
|
2016 |
|
|
2015 |
|
|||
|
|
|
(In thousands) |
|
|||||||||
|
Cash and cash equivalents |
|
$ |
116,049 |
|
|
$ |
18,214 |
|
|
$ |
14,896 |
|
|
Working capital, excluding deferred revenue (1) |
|
$ |
172,492 |
|
|
$ |
60,047 |
|
|
$ |
27,982 |
|
|
Total assets |
|
$ |
506,433 |
|
|
$ |
387,410 |
|
|
$ |
371,504 |
|
|
Deferred revenue, current and non-current portion |
|
$ |
83,125 |
|
|
$ |
55,104 |
|
|
$ |
34,888 |
|
|
Long-term debt |
|
$ |
68,329 |
|
|
$ |
107,344 |
|
|
$ |
99,770 |
|
|
Total liabilities |
|
$ |
178,036 |
|
|
$ |
177,307 |
|
|
$ |
160,465 |
|
|
Redeemable convertible preferred stock |
|
$ |
— |
|
|
$ |
223,987 |
|
|
$ |
222,898 |
|
|
Total stockholders' equity (deficit) |
|
$ |
328,397 |
|
|
$ |
(13,884 |
) |
|
$ |
(11,859 |
) |
|
(1) |
We define working capital as current assets less current liabilities, excluding deferred revenue. |
49
Item 7. Management’s Discussion and Analysis of Financial Condition and Results of Operations.
You should read the following discussion and analysis of our financial condition and results of operations together with the section titled “Selected Consolidated Financial and Other Data” and the consolidated financial statements and related notes that are included elsewhere in this Annual Report on Form 10-K. This discussion contains forward-looking statements that involve risks and uncertainties. Our actual results may differ materially from those anticipated in these forward-looking statements as a result of various factors, including, but not limited to, those set forth in the section titled “Risk Factors” and in other parts of this Annual Report on Form 10-K. Our historical results are not necessarily indicative of the results that may be expected for any period in the future, and our interim results are not necessarily indicative of the results we expect for the full fiscal year or any other period.
Overview
SailPoint is the leading provider of enterprise identity governance solutions. Our open identity platform provides organizations with critical visibility into who currently has access to which resources, who should have access to those resources, and how that access is being used.
We offer both on-premises software and cloud-based solutions, which empower our customers to efficiently and securely govern the digital identities of employees, contractors, business partners and other users, and manage their constantly changing access rights to enterprise applications and data across hybrid IT environments, whether comprised of on-premises, cloud or mobile applications. We help customers enable their businesses with more agile and innovative IT, enhance their security posture and better meet compliance and regulatory requirements. We believe that our open identity platform is a critical, foundational layer of a modern cyber security strategy that complements and builds upon traditional perimeter- and endpoint-centric security solutions, which on their own are increasingly insufficient to secure organizations, and their applications and data. Our customers include many of the world’s largest and most complex organizations, including commercial enterprises, educational institutions and governments.
We were founded by identity industry veterans to develop a new category of identity management solutions and address emerging identity governance challenges. Since our inception, we have focused on driving innovation in the identity market, with our key milestones including:
|
|
• |
in 2007, we pioneered identity governance through our release of IdentityIQ, our on-premises identity governance solution; |
|
|
• |
in 2010, we revolutionized provisioning by integrating it with IdentityIQ into a single solution; |
|
|
• |
in 2013, we introduced our cloud-based identity governance solution, IdentityNow; |
|
|
• |
in 2015, we extended identity governance by adding our identity governance for data stored in files solution, SecurityIQ, which manages user access to unstructured data, a rapidly growing area of risk; and |
|
|
• |
in 2017, we further extended identity governance with the introduction of our advanced identity analytics solution, IdentityAI, which is designed to use machine learning technologies to enable rapid detection of security threats before they turn into security breaches. |
Our solutions address the complex needs of global enterprises and mid-market organizations. As of December 31, 2017, 933 customers across a wide variety of industries were using our products to enable and secure digital identities across the globe. No single customer represented more than 10% of our revenue for the years ended December 31, 2017, 2016 or 2015.
Our revenue grew at a compound annual growth rate of approximately 36% from the year ended December 31, 2012 to the year ended December 31, 2017. For the years ended December 31, 2017, 2016 and 2015, our revenue was $186.1 million, $132.4 million, and $95.4 million, respectively. During such periods, purchase accounting adjustments related to the Acquisition reduced our revenue by $0.1 million, $1.4 million and $5.6 million, respectively. For the years ended December 31, 2017, 2016 and 2015, our net loss was $7.6 million, $3.2 million, and $10.8 million, respectively. For the years ended December 31, 2017, 2016 and 2015, our net cash provided by operations was $21.9 million, $6.5 million, and $3.6 million, respectively.
50
Our success is principally dependent on our ability to deliver compelling solutions to attract new customers and retain existing customers. Delivering these solutions is challenging because our customers have large, complex IT environments, often rely on both legacy and innovative technologies, and deploy different business models, including on premise and cloud solutions. Rising security threats and evolving regulations and compliance standards for cyber security, data protection, privacy and internal IT controls create new opportunities for our industry and require us to adapt our solutions to be successful. Our ability to continue to maintain our historical growth rates is also challenging because our growth strategy depends in part on our ability to expand our global presence and invest in new vertical markets, while competing against much larger companies with more recognizable brands and financial resources. Although we seek to grow rapidly, we also focus on delivering positive net cash from operations while continuing to invest in our platform and to deliver innovative solutions to our customers. Additionally, our gross margins vary depending on the type of solution we sell, and a shift in the mix of our solutions could affect our performance relative to historical results.
Our Business Model
We deliver an integrated set of solutions that supports all aspects of identity governance, including provisioning, access request, compliance controls, password management and identity governance for data stored in files. Our solutions are built on an open identity platform, which offers connectivity to a variety of security and operational IT applications, extending the reach of our identity governance processes and enabling effective identity governance controls across customer environments.
Our set of solutions currently consists of (i) IdentityIQ, our on-premises identity governance solution, (ii) IdentityNow, our cloud-based, multi-tenant governance suite, which is delivered as a subscription service, and (iii) SecurityIQ, our on-premises identity governance for files solution that secures access to data stored in file servers, collaboration portals, mailboxes and cloud storage systems, and (iv) IdentityAI, our cloud-based advanced identity analytics solution. See in Part I – Item 1, the section titled “Business—Products” for more information regarding our solutions.
For our IdentityIQ and SecurityIQ solutions, our customers typically purchase a perpetual software license, which includes one year of maintenance. Our maintenance provides software maintenance as well as access to our technical support services during the maintenance term. After the initial maintenance period, customers with perpetual licenses may renew their maintenance agreement for an additional fee. For our cloud-based solutions, IdentityNow and IdentityAI, for a subscription fee, we offer customers access to this solution and infrastructure support for the duration of their subscription agreement. Our standard subscription agreement for our IdentityNow solution has a duration of three years.
Pricing for each of our solutions is dependent on the number of digital identities of employees, contractors, business partners and other users that the customer is entitled to govern with the solution. We also package and price our IdentityIQ and IdentityNow solutions into modules. Each module has unique functionalities, and our IdentityIQ and IdentityNow customers are able to purchase one or more modules, depending on their needs. We package and price SecurityIQ, our identity governance for files solution, by target storage systems. Thus, our revenue from any customer is generally determined by the number of identities that the customer is entitled to govern as well as the number of modules (for our IdentityIQ and IdentityNow solutions) or target storage systems (for our SecurityIQ solution) purchased by the customer.
Our go-to-market strategy consists of both direct sales and indirect sales through our partnership network of systems integrators, value-added resellers and adjacent technology vendors. We work closely with systems integrators, many of whom have dedicated SailPoint practices (including Accenture, Deloitte, KPMG and PwC), with some dating back more than seven years, and resellers (including value-added resellers such as Optiv) to identify potential sales opportunities and help us increase our reach, and we frequently cooperate with systems integrators to make joint sales proposals to address our mutual customers’ requirements. We also collaborate with leading access management vendors by adding our identity governance capabilities to their access management services (e.g., Microsoft, Okta and VMware). We do not have any material payment obligations to systems integrators, resellers or our technology partners; nor do they have any material payment obligations to us, except that resellers typically purchase solutions directly from us and resell to customers. See the section titled “Business—Partnerships and Strategic Relationships” for more information regarding our partnership network.
51
In addition to our solutions, we offer professional services to our customers and partners to configure and optimize the use of our solutions as well as training services related to the configuration and operation of our platform. Most of our professional services activity is in support of our partners, who perform a significant majority of all initial and follow-on implementation work for our customers. Most of our consulting services are priced on a time and materials basis; our training services are provided through multiple pricing models, including on a per-person basis (for courses provided at our headquarters and on-site at our customers’ offices) and a flat-rate basis (for our e-learning course).
We devote significant resources to acquire new customers, in both existing and new markets, in order to grow our customer base. In addition, we focus on three distinct opportunities to increase sales to existing customers: (i) expand the number of digital identities; (ii) up-sell additional modules or target storage systems, as applicable, within a single solution; and (iii) cross-sell additional solutions.
Key Factors Affecting Our Performance
Our historical financial performance has been, and we expect our financial performance in the future to be, driven by our ability to:
|
|
• |
Add New Customers Within Existing Markets. Based on data from S&P Global Market Intelligence, we believe that we have penetrated less than 2% of the approximately 65,000 companies in the countries where we have customers today and that as a result, there is significant opportunity to expand our footprint in our existing markets through new, greenfield installations and displacement of our competitors’ legacy solutions. To do so, we plan to grow our sales organization, increase and leverage our indirect channel partners and enhance our marketing efforts. |
|
|
• |
Generate Additional Sales to Existing Customers. We believe that our existing customer base provides us with a significant opportunity to drive incremental sales. In most cases, our customers initially purchase a subset of the modules or solutions we offer based on their immediate need. We focus on generating more revenue from the modules that our customers have already purchased from us as our customers grow the number of identities our solutions manage and govern and as our customers deploy our solutions across other business units or geographies within their organizations. Over time, we also identify up-selling and cross-selling opportunities and seek to sell additional modules and solutions to our existing customers. |
|
|
• |
Retain Customers. We believe that our ability to retain our customers is an important component of our growth strategy and reflects the long-term value of our customer relationships. For example, when we add a new customer, we generate new license revenue. If the customer renews, we generate incremental maintenance revenue. As we add new IdentityIQ customers, our high renewal rates result in incremental maintenance revenue. Our key strategies to maintain our high renewal rates include focusing on the quality and reliability of our solutions, customer service and support to ensure our customers receive value from our solutions, providing consistent software upgrades and having dedicated customer success teams. |
|
|
• |
Expand into New Markets. We expect to continue to invest significantly in sales, marketing and customer service, as well as our indirect channel partner network, to expand into new geographies and vertical markets. We believe that our market opportunity is large and growing and that the global cyber security market represents a significant growth opportunity for us. In 2017, we generated only 28% of our revenue outside of the United States. |
52
In addition to our GAAP financial information, we monitor the following key metrics to help us measure and evaluate the effectiveness of our operations:
|
|
|
Year Ended December 31, |
|
|||||||||
|
|
|
2017 |
|
|
2016 |
|
|
2015 |
|
|||
|
Number of customers |
|
|
933 |
|
|
|
695 |
|
|
|
520 |
|
|
Subscription revenue as a percentage of total revenue |
|
|
38 |
% |
|
|
37 |
% |
|
|
32 |
% |
|
Adjusted EBITDA (in thousands) |
|
$ |
25,501 |
|
|
$ |
15,135 |
|
|
$ |
7,464 |
|
|
|
• |
Number of Customers. We believe that the size of our customer base is an indicator of our market penetration and that our net customer additions are an indicator of the growth of our business and our future revenue opportunity. We define a customer as a distinct entity, division or business unit of an organization that receives support or has the right to use our cloud-based solutions as of the specified measurement date. |
|
|
• |
Subscription Revenue as a Percentage of Total Revenue. Subscription revenue is a portion of our total revenue and is derived from (i) IdentityNow, our cloud-based solution where customers enter into SaaS subscription agreements with us, and (ii) IdentityIQ and SecurityIQ maintenance and support agreements, but not licenses. As we generally sell our solutions on a per-identity basis, our subscription revenue for any customer is primarily determined by the number of identities that the customer is entitled to govern as part of a SaaS subscription, and the ongoing price paid per-identity under a maintenance and support agreement or SaaS subscription. Thus, we consider our subscription revenue to be the recurring portion of our revenue base and believe that its continued growth as a percentage of total revenue will lead to a more predictable revenue model and increase our visibility to future period total revenues. Because we recognize our subscription revenue ratably over the duration of those agreements, a portion of the revenue we recognize each period is derived from agreements we entered into in prior periods. In contrast, we typically recognize license revenue upon entering into the applicable license, the timing of which is less predictable and may cause significant fluctuations in our quarterly financial results. |
|
|
• |
Adjusted EBITDA. We believe that adjusted EBITDA is a measure widely used by securities analysts and investors to evaluate the financial performance of our company and other companies. We believe that adjusted EBITDA is an important measure for evaluating our performance because it facilitates comparisons of our core operating results from period to period by removing the impact of our capital structure (net interest income or expense from our outstanding debt), asset base (depreciation and amortization), tax consequences, purchase accounting adjustments, acquisition and sponsor related costs and stock-based compensation. In addition, we base certain of our forward-looking estimates and budgets on adjusted EBITDA. See the section titled “Non-GAAP Financial Measures” for more information regarding adjusted EBITDA, including the limitations of using adjusted EBITDA as a financial measure, and for a reconciliation of adjusted EBITDA to net loss, the most directly comparable financial measure calculated in accordance with GAAP. |
Non-GAAP Financial Measures
In addition to our financial information presented in accordance with GAAP, we use certain non-GAAP financial measures to clarify and enhance our understanding of past performance and future prospects. Generally, a non-GAAP financial measure is a numerical measure of a company’s operating performance, financial position or cash flow that includes or excludes amounts that are included or excluded from the most directly comparable measure calculated and presented in accordance with GAAP. As discussed below, we monitor the non-GAAP financial measures described below, and we believe they are helpful to investors.
53
Our non-GAAP financial measures may not provide information that is directly comparable to that provided by other companies in our industry because they may calculate non-GAAP financial results differently. In addition, there are limitations in using non-GAAP financial measures because they are not prepared in accordance with GAAP and exclude expenses that may have a material impact on our reported financial results. In particular, interest expense, which is excluded from adjusted EBITDA has been and will continue to be a significant recurring expense in our business for the foreseeable future. The presentation of non-GAAP financial information is not meant to be considered in isolation or as a substitute for the directly comparable financial measures prepared in accordance with GAAP. We urge you to review the reconciliations of our non-GAAP financial measures to the comparable GAAP financial measures included below, and not to rely on any single financial measure to evaluate our business.
We exclude stock-based compensation expense because it is non-cash in nature and excluding this expense provides meaningful supplemental information regarding our operational performance and allows investors the ability to make more meaningful comparisons between our operating results and those of other companies. We also exclude amortization of acquired intangible assets, acquisition-related costs, the partial release of the valuation allowance due to acquisition, facility exit costs, and make adjustments related to a financing lease obligation from our non-GAAP financial measures because these are considered by management to be outside of our core operating results. Accordingly, we believe that excluding these expenses provides investors and management with greater visibility to the underlying performance of our business operations and may also facilitate comparison with the results of other companies in our industry.
Adjusted EBITDA
Adjusted EBITDA is a non-GAAP financial measure that we calculate as net income (loss) adjusted to exclude income taxes, interest expense, net, depreciation and amortization, purchase accounting adjustments, acquisition and sponsor related costs and stock-based compensation expense.
We believe that adjusted EBITDA is a measure widely used by securities analysts and investors to evaluate the financial performance of our company and other companies. We believe that adjusted EBITDA is an important measure for evaluating our performance because it facilitates comparisons of our core operating results from period to period by removing the impact of our capital structure (net interest income or expense from our outstanding debt), asset base (depreciation and amortization), tax consequences, purchase accounting adjustments, acquisition and sponsor related costs and stock-based compensation. In addition, we base certain of our forward-looking estimates and budgets on adjusted EBITDA.
The following table reflects the reconciliation of GAAP to non-GAAP financial measures for the years ended December 31, 2017, 2016 and 2015:
|
|
|
Year Ended December 31, |
|
|||||||||
|
|
|
2017 |
|
|
2016 |
|
|
2015 |
|
|||
|
|
|
(In thousands) |
|
|||||||||
|
Net loss |
|
$ |
(7,592 |
) |
|
$ |
(3,173 |
) |
|
|
(10,807 |
) |
|
Stock-based compensation |
|
|
4,514 |
|
|
|
568 |
|
|
|
246 |
|
|
Amortization |
|
|
8,841 |
|
|
|
9,092 |
|
|
|
9,099 |
|
|
Depreciation |
|
|
1,379 |
|
|
|
890 |
|
|
|
521 |
|
|
Purchase price accounting adjustment (1) |
|
|
141 |
|
|
|
1,373 |
|
|
|
5,618 |
|
|
Acquisition and sponsor related costs |
|
|
1,142 |
|
|
|
1,093 |
|
|
|
1,518 |
|
|
Interest expense |
|
|
14,783 |
|
|
|
7,277 |
|
|
|
3,883 |
|
|
Income tax expense (benefit) |
|
|
2,293 |
|
|
|
(1,985 |
) |
|
|
(2,614 |
) |
|
Adjusted EBITDA |
|
$ |
25,501 |
|
|
$ |
15,135 |
|
|
$ |
7,464 |
|
54
The following table reflects the reconciliation of GAAP to Non-GAAP Financial Measures for our unaudited quarterly consolidated statements of operations data for each of the quarters indicated:
|
|
|
Three Months Ended |
|
|||||||||||||||||||||||||||||
|
|
|
12/31/2017 |
|
|
9/30/2017 |
|
|
6/30/2017 |
|
|
3/31/2017 |
|
|
12/31/2016 |
|
|
9/30/2016 |
|
|
6/30/2016 |
|
|
3/31/2016 |
|
||||||||
|
|
|
(In thousands) |
|
|||||||||||||||||||||||||||||
|
Net income (loss) |
|
$ |
5,382 |
|
|
$ |
(6,387 |
) |
|
$ |
(4,304 |
) |
|
$ |
(2,283 |
) |
|
$ |
3,306 |
|
|
$ |
(2,247 |
) |
|
$ |
(2,118 |
) |
|
$ |
(2,114 |
) |
|
Stock-based compensation |
|
|
3,970 |
|
|
|
201 |
|
|
|
185 |
|
|
|
158 |
|
|
|
238 |
|
|
|
116 |
|
|
|
109 |
|
|
|
105 |
|
|
Amortization |
|
|
2,206 |
|
|
|
2,207 |
|
|
|
2,207 |
|
|
|
2,211 |
|
|
|
2,229 |
|
|
|
2,130 |
|
|
|
2,258 |
|
|
|
2,475 |
|
|
Depreciation |
|
|
444 |
|
|
|
385 |
|
|
|
295 |
|
|
|
265 |
|
|
|
243 |
|
|
|
227 |
|
|
|
213 |
|
|
|
207 |
|
|
Purchase price accounting adjustment (1) |
|
|
15 |
|
|
|
16 |
|
|
|
55 |
|
|
|
55 |
|
|
|
290 |
|
|
|
292 |
|
|
|
392 |
|
|
|
399 |
|
|
Acquisition and sponsor related costs |
|
|
164 |
|
|
|
322 |
|
|
|
328 |
|
|
|
328 |
|
|
|
290 |
|
|
|
268 |
|
|
|
265 |
|
|
|
270 |
|
|
Interest expense |
|
|
5,704 |
|
|
|
3,726 |
|
|
|
2,696 |
|
|
|
2,657 |
|
|
|
2,830 |
|
|
|
2,355 |
|
|
|
1,060 |
|
|
|
1,032 |
|
|
Income tax (benefit) expense |
|
|
(769 |
) |
|
|
2,906 |
|
|
|
395 |
|
|
|
(239 |
) |
|
|
2,072 |
|
|
|
(1,407 |
) |
|
|
(1,326 |
) |
|
|
(1,324 |
) |
|
Adjusted EBITDA |
|
$ |
17,116 |
|
|
$ |
3,376 |
|
|
$ |
1,857 |
|
|
$ |
3,152 |
|
|
$ |
11,498 |
|
|
$ |
1,734 |
|
|
$ |
853 |
|
|
$ |
1,050 |
|
|
(1) |
Purchase accounting adjustment related to the fair value write down of deferred revenue from the acquisition. For more information relating to such transaction, please see Note 3 of our accompanying Notes to Consolidated Financial Statements included in Part II, Item 8 of this Annual Report on Form 10-K. |
Components of Results of Operations
Revenue
License Revenue. We generate license revenue through the sale of our on premises software license agreements. License transactions generally include an amount for first-year maintenance, which we recognize as subscription revenue. We typically recognize license revenue upon delivering the applicable license, assuming all revenue recognition criteria are satisfied. See the section titled “—Critical Accounting Policies and Estimates—Revenue Recognition” for more information. Over time, we expect license revenue to decrease as a percentage of our total revenue as we continue to focus on increasing our subscription revenue as a key strategic priority.
Subscription Revenue. Our subscription revenue consists of fees for (i) ongoing maintenance and support of our licensed solutions and (ii) subscription fees for access to, and related support for, our cloud-based solution. We typically invoice subscription fees in advance, in annual installments, and recognize subscription revenue ratably over the term of the applicable agreement, provided that all other revenue recognition criteria have been satisfied. See the section titled “—Critical Accounting Policies and Estimates—Revenue Recognition” for more information. Over time, we expect subscription revenue will increase as a percentage of total revenue as we continue to focus on increasing subscription revenue as a key strategic priority. In the years ended December 31, 2017, 2016 and 2015, our subscription revenue was impacted by purchase accounting adjustments to deferred revenue from the Acquisition. See the section titled “—Impact of Purchase Accounting.”
Services and Other Revenue. Services and other revenue consists primarily of fees from professional services provided to our customers and partners to configure and optimize the use of our solutions as well as training services related to the configuration and operation of our platform. Most of our professional services are priced on a time and materials basis, and we generally invoice customers monthly as the work is performed. We generally have standalone value for our professional services and recognize revenue as services are performed based on an estimated fair value as a separate unit of accounting. See the section titled “—Critical Accounting Policies and Estimates—Revenue Recognition” for more information. Most of our professional services activity is in support of our partners, who perform the significant majority of all initial and follow-on configuration and optimization work
55
for our customers. Over time, we expect our professional services revenue as a percentage of total revenue to decline as we increasingly rely on partners to help our customers deploy our software. In the years ended December 31, 2017, 2016, and 2015, our services and other revenue was impacted by purchase accounting adjustments to deferred revenue from the Acquisition. See the section titled “—Impact of Purchase Accounting.”
Impact of Purchase Accounting. On September 8, 2014, SailPoint Technologies Holdings, Inc. acquired all of the capital stock of SailPoint Technologies, Inc. We refer to this transaction as the Acquisition. As a result of the Acquisition, we applied purchase accounting and a new basis of accounting beginning on the date of the Acquisition. As such, we were required by GAAP to record all assets and liabilities, including deferred revenue and long-lived assets, at fair value as of the effective date of the Acquisition, which in some cases was different than their historical book values. This had the effect of reducing revenue and deferred revenue and increasing cost of revenue from that which would have otherwise been recognized, as described in more detail below.
We assessed the fair value of deferred revenue acquired in the Acquisition to be $10.2 million, representing a decrease of $12.6 million from its historical book value. Recognizing deferred revenue at fair value reduces revenue in the periods subsequent to the Acquisition. The impact of the Acquisition to revenue was $0.1 million, $1.4 million and $5.6 million for the years ended December 31, 2017, 2016 and 2015, respectively. The effect of the Acquisition on the deferred costs was not material.
Cost of Revenue
Cost of License Revenue. Cost of license revenue consists of amortization expense for developed technology acquired in business combinations and third-party royalties.
Cost of Subscription Revenue. Cost of subscription revenue consists primarily of employee compensation cost (which consists of salaries, benefits, bonuses and stock-based compensation), costs of our customer support organization, contractor costs to supplement our staff levels, allocated overhead, amortization expense for developed technology acquired in business combinations and third-party cloud-based hosting costs.
Cost of Services and Other Revenue. Cost of services and other revenue consists primarily of employee compensation costs of our professional services and training organizations, travel-related costs, contractor costs to supplement our staff levels and allocated overhead.
Gross Profit and Gross Margin
Gross profit is revenue less cost of revenue, and gross margin is gross profit as a percentage of revenue. Gross profit has been and will continue to be affected by various factors, including the mix of our license, subscription, and services and other revenue, the costs associated with third-party cloud-based hosting services for our cloud-based subscriptions, and the extent to which we expand our customer support and services organizations. We expect that our overall gross margin will fluctuate from period to period depending on the interplay of these various factors. Also, we expect our investment in technology to expand the capability of our services, enabling us to improve our gross margin over time.
License Gross Margin. License gross margin is primarily affected by the cost of third-party royalties and amortization of developed technology acquired in business combinations, neither of which are expected to fluctuate materially from period to period in the near term.
Subscription Gross Margin. Subscription gross margin is primarily affected by the growth in our subscription revenue as compared to the growth in, and timing of, cost of subscription revenue. Subscription gross margin is lower than our license gross margin due to, among other things, costs associated with our customer support organization and the costs associated with our cloud-based solution. We expect to continue to grow our subscription revenue, and the timing and rate of that growth might cause subscription gross margins to fluctuate in the near term then improve over time as we expect to see the benefits of scale in the infrastructure investments related to our cloud-based solution.
56
Services and Other Gross Margin. Services and other gross margin is impacted by the number of customers using our professional services, the hourly rate we are able to charge for our services and the mix of services provided. Services and other gross margin is lower than our license gross margin and our subscription gross margin due to, among other things, costs associated with our professional services and training organizations.
Operating Expenses
Research and Development Expenses. Research and development expenses consist primarily of employee compensation costs, allocated overhead and software and maintenance expenses, which includes cloud-based hosting costs related to the development of our cloud-based solution. We believe that continued investment in our offerings is vital to the growth of our business, and we intend to continue to invest in product development and in SailPoint Labs, our dedicated, stand-alone technology investigation and engineering group, to continue to innovate and offer our customers new solutions and to enhance our existing solutions as our business grows. See the section titled “Business—Research and Development” for more information. We expect such investment to increase on a dollar basis as our business grows.
General and Administrative Expenses. General and administrative expenses consist primarily of employee compensation costs for corporate personnel, such as those in our executive, human resource, facilities, accounting and finance and information technology departments. In addition, general and administrative expenses include third-party professional fees and sponsor-related costs, as well as all other supporting corporate expenses not allocated to other departments. We expect our general and administrative expenses to increase on a dollar basis as our business grows. Also, following the completion of our initial public offering in November 2017, we incur increased general and administrative expenses as a result of becoming a public company, including costs to comply with the rules and regulations applicable to companies listed on a national securities exchange, costs related to compliance and reporting obligations pursuant to the rules and regulations of the SEC, and increased expenses for insurance, investor relations and professional services.
Sales and Marketing Expenses. Sales and marketing expenses consist primarily of employee compensation costs, sales commissions, costs of general marketing and promotional activities, travel-related expenses and allocated overhead. Sales commissions earned by our sales force on subscription contracts are deferred and amortized over the same period that revenue is recognized for the applicable contract. We expect to continue to invest in our sales force for expansion to new geographic and vertical markets. We expect our sales and marketing expenses to increase on a dollar basis and continue to be our largest operating expense category for the foreseeable future.
Allocated Overhead. We allocate shared costs, such as facilities costs (including rent and utilities), information technology costs and recruiting costs, to all departments based on headcount. As such, allocated shared costs are reflected in each cost of revenue and operating expense category.
Other Expense, Net
Other expense, net consists primarily of interest expense and foreign currency transaction gains and losses related to the impact of transactions denominated in a foreign currency. As we have expanded our international operations, our exposure to fluctuations in foreign currencies has increased, and we expect this to continue. Interest expense, net of interest income, consists primarily of interest on our term loan facility, amortization of debt issuance costs, loss on the modification and partial extinguishment of debt and prepayment penalties.
Income Tax Expense
Provision for income taxes consists of U.S. and state income taxes and income taxes in certain foreign jurisdictions in which we conduct business. We have a full valuation allowance for net deferred tax assets, including net operating loss carryforwards, and tax credits related primarily to research and development for our operations in the United States. We expect to maintain this full valuation allowance for the foreseeable future.
57
Our income tax rate varies from the federal statutory rate due to the valuation allowances on our deferred tax assets and foreign withholding taxes; changing tax laws, regulations and interpretations in multiple jurisdictions in which we operate; changes to the financial accounting rules for income taxes; unanticipated changes in tax rates; differences in accounting and tax treatment of our stock-based compensation and the tax effects of purchase accounting for acquisitions. We expect this fluctuation in income tax rates, as well as its potential impact on our results of operations, to continue.
Results of Operations
The following table sets forth our results of operations for the periods indicated:
|
|
|
|
Year Ended December 31, |
|
|||||||||
|
|
|
|
2017 |
|
|
2016 |
|
|
2015 |
|
|||
|
|
|
|
(In thousands) |
|
|||||||||
|
Revenue: |
|
|
|
|
|
|
|
|
|
|
|
|
|
|
Licenses |
|
|
$ |
79,209 |
|
|
$ |
54,395 |
|
|
$ |
44,124 |
|
|
Subscription |
|
|
|
71,007 |
|
|
|
49,364 |
|
|
|
29,930 |
|
|
Services and other |
|
|
|
35,840 |
|
|
|
28,653 |
|
|
|
21,302 |
|
|
Total revenue |
|
|
|
186,056 |
|
|
|
132,412 |
|
|
|
95,356 |
|
|
Cost of revenue: |
|
|
|
|
|
|
|
|
|
|
|
|
|
|
Licenses |
|
|
|
4,561 |
|
|
|
4,278 |
|
|
|
4,293 |
|
|
Subscription (1) |
|
|
|
16,406 |
|
|
|
13,051 |
|
|
|
9,815 |
|
|
Services and other (1) |
|
|
|
23,623 |
|
|
|
19,709 |
|
|
|
15,151 |
|
|
Total cost of revenue |
|
|
|
44,590 |
|
|
|
37,038 |
|
|
|
29,259 |
|
|
Gross profit |
|
|
|
141,466 |
|
|
|
95,374 |
|
|
|
66,097 |
|
|
Operating expenses: |
|
|
|
|
|
|
|
|
|
|
|
|
|
|
Research and development (1) |
|
|
|
33,331 |
|
|
|
24,358 |
|
|
|
19,965 |
|
|
General and administrative (1) |
|
|
|
17,678 |
|
|
|
9,680 |
|
|
|
7,474 |
|
|
Sales and marketing (1) |
|
|
|
80,514 |
|
|
|
58,607 |
|
|
|
46,831 |
|
|
Total operating expenses |
|
|
|
131,523 |
|
|
|
92,645 |
|
|
|
74,270 |
|
|
Income (loss) from operations |
|
|
|
9,943 |
|
|
|
2,729 |
|
|
|
(8,173 |
) |
|
Other expense, net: |
|
|
|
|
|
|
|
|
|
|
|
|
|
|
Interest expense, net |
|
|
|
(14,783 |
) |
|
|
(7,277 |
) |
|
|
(3,883 |
) |
|
Other, net |
|
|
|
(459 |
) |
|
|
(610 |
) |
|
|
(1,365 |
) |
|
Total other expense, net |
|
|
|
(15,242 |
) |
|
|
(7,887 |
) |
|
|
(5,248 |
) |
|
Loss before income taxes |
|
|
|
(5,299 |
) |
|
|
(5,158 |
) |
|
|
(13,421 |
) |
|
Income tax (expense) benefit |
|
|
|
(2,293 |
) |
|
|
1,985 |
|
|
|
2,614 |
|
|
Net loss |
|
|
$ |
(7,592 |
) |
|
$ |
(3,173 |
) |
|
$ |
(10,807 |
) |
|
(1) |
Includes stock-based compensation expense as follows: |
|
|
|
Year Ended December 31, |
|
|||||||||
|
|
|
2017 |
|
|
2016 |
|
|
2015 |
|
|||
|
|
|
(In thousands) |
|
|||||||||
|
Cost of revenue - subscription |
|
$ |
133 |
|
|
$ |
34 |
|
|
$ |
12 |
|
|
Cost of revenue - services and other |
|
|
458 |
|
|
|
63 |
|
|
|
20 |
|
|
Research and development |
|
|
658 |
|
|
|
118 |
|
|
|
62 |
|
|
General and administrative |
|
|
2,062 |
|
|
|
96 |
|
|
|
28 |
|
|
Sales and marketing |
|
|
1,203 |
|
|
|
257 |
|
|
|
124 |
|
|
Total stock-based compensation |
|
$ |
4,514 |
|
|
$ |
568 |
|
|
$ |
246 |
|
58
The following table sets forth the consolidated statements of operations data for each of the periods presented as a percentage of total revenue:
|
|
|
Year Ended December 31, |
|
|||||||||
|
|
|
2017 |
|
|
2016 |
|
|
2015 |
|
|||
|
Revenue: |
|
|
|
|
|
|
|
|
|
|
|
|
|
Licenses |
|
|
43 |
% |
|
|
41 |
% |
|
|
46 |
% |
|
Subscription |
|
|
38 |
|
|
|
37 |
|
|
|
32 |
|
|
Services and other |
|
|
19 |
|
|
|
22 |
|
|
|
22 |
|
|
Total revenue |
|
|
100 |
|
|
|
100 |
|
|
|
100 |
|
|
Cost of revenue: |
|
|
|
|
|
|
|
|
|
|
|
|
|
Licenses |
|
|
2 |
|
|
|
3 |
|
|
|
5 |
|
|
Subscription |
|
|
9 |
|
|
|
10 |
|
|
|
10 |
|
|
Services and other |
|
|
13 |
|
|
|
15 |
|
|
|
16 |
|
|
Total cost of revenue |
|
|
24 |
|
|
|
28 |
|
|
|
31 |
|
|
Gross profit |
|
|
76 |
|
|
|
72 |
|
|
|
69 |
|
|
Operating expenses: |
|
|
|
|
|
|
|
|
|
|
|
|
|
Research and development |
|
|
18 |
|
|
|
18 |
|
|
|
21 |
|
|
General and administrative |
|
|
10 |
|
|
|
7 |
|
|
|
8 |
|
|
Sales and marketing |
|
|
43 |
|
|
|
45 |
|
|
|
49 |
|
|
Total operating expenses |
|
|
71 |
|
|
|
70 |
|
|
|
78 |
|
|
Income (loss) from operations |
|
|
5 |
|
|
|
2 |
|
|
|
(9 |
) |
|
Other expense, net: |
|
|
|
|
|
|
|
|
|
|
|
|
|
Interest expense, net |
|
|
(8 |
) |
|
|
(5 |
) |
|
|
(4 |
) |
|
Other, net |
|
|
(0 |
) |
|
|
(0 |
) |
|
|
(1 |
) |
|
Total other expense, net |
|
|
(8 |
) |
|
|
(5 |
) |
|
|
(5 |
) |
|
Loss before income taxes |
|
|
(3 |
) |
|
|
(3 |
) |
|
|
(14 |
) |
|
Income tax (expense) benefit |
|
|
(1 |
) |
|
|
1 |
|
|
|
3 |
|
|
Net loss |
|
|
(4 |
)% |
|
|
(2 |
)% |
|
|
(11 |
)% |
Comparison of the Year Ended December 31, 2017 and 2016
Revenue
|
|
|
Year Ended December 31, |
|
||||||||||||
|
|
|
2017 |
|
|
2016 |
|
|
variance $ |
|
|
variance % |
|
|||
|
Revenue: |
|
(In thousands, except percentages) |
|
||||||||||||
|
Licenses |
|
$ |
79,209 |
|
|
$ |
54,395 |
|
|
$ |
24,814 |
|
|
46% |
|
|
Subscription |
|
|
71,007 |
|
|
|
49,364 |
|
|
|
21,643 |
|
|
44% |
|
|
Services and other |
|
|
35,840 |
|
|
|
28,653 |
|
|
|
7,187 |
|
|
25% |
|
|
Total revenue |
|
$ |
186,056 |
|
|
$ |
132,412 |
|
|
$ |
53,644 |
|
|
41% |
|
License Revenue. License revenue increased by $24.8 million, or 46%, for the year ended December 31, 2017 compared to the year ended December 31, 2016. Although license revenue from new customers was greater than license revenue from existing customers for December 31, 2017 and 2016, the increase in total license revenue was primarily attributable to follow-on sales to our existing customers. During the year ended December 31, 2017 and 2016 revenue from new customers was $48.4 million and $42.2 million and license revenue from existing customers was $30.8 million and $12.2 million, respectively. Our revenue from any single customer is determined by the number of identities the customer is entitled to govern as well as the number of modules and solutions purchased.
59
Subscription Revenue. Subscription revenue increased by $21.6 million, or 44%, for the year ended December 31, 2017 compared to the year ended December 31, 2016. The increase was primarily a result of an increase in ongoing maintenance renewals and an increase in maintenance revenue derived from new licenses. Our customer base increased by 238, or 34%, from 695 customers at December 31, 2016 to 933 customers at December 31, 2017. Approximately $1.2 million of the increase in subscription revenue is the result of a decrease in the purchase accounting write down of deferred revenue subsequent to the Acquisition.
Services and Other Revenue. Services and other revenue increased by $7.2 million, or 25%, for the year ended December 31, 2017 compared to the year ended December 31, 2016. The increase is primarily a result of an increase in the number of customers using our consulting and training services.
Geographic Regions. Our operations in the United States were responsible for the largest portion of our revenue in each year ended December 31, 2017 and 2016 because of our larger and more established sales force and partner network in the United States as compared to our other regions. Revenue from both Europe, the Middle East and Africa (“EMEA”) and the rest of the world also increased for years ended December 31, 2017 and 2016, primarily due to our investment in increasing the size of our international sales force and strengthening partnerships with global system integrators and resellers worldwide.
The following table sets forth, for each of the periods presented, our consolidated total revenue by geography and the respective percentage of total revenue:
|
|
|
Year Ended December 31, |
|
|||||||||||
|
|
|
2017 |
|
|
2016 |
|
||||||||
|
|
|
$ |
|
|
% of revenue |
|
|
$ |
|
|
% of revenue |
|
||
|
|
|
(In thousands, except percentages) |
|
|||||||||||
|
United States |
|
$ |
134,676 |
|
|
72% |
|
|
$ |
92,116 |
|
|
70% |
|
|
EMEA (1) |
|
|
33,097 |
|
|
18% |
|
|
|
25,668 |
|
|
19% |
|
|
Rest of the World (1) |
|
|
18,283 |
|
|
10% |
|
|
|
14,628 |
|
|
11% |
|
|
Total revenue |
|
$ |
186,056 |
|
|
100% |
|
|
$ |
132,412 |
|
|
100% |
|
|
(1) |
No single country represented more than 10% of our consolidated revenue. |
Cost of Revenue
|
|
|
Year Ended December 31, |
|
|||||||||||||
|
|
|
2017 |
|
|
2016 |
|
|
variance $ |
|
|
variance % |
|
||||
|
Cost of revenue: |
|
(In thousands, except percentages) |
|
|||||||||||||
|
Licenses |
|
$ |
4,561 |
|
|
$ |
4,278 |
|
|
$ |
283 |
|
|
|
7 |
% |
|
Subscription |
|
|
16,406 |
|
|
|
13,051 |
|
|
|
3,355 |
|
|
|
26 |
% |
|
Services and other |
|
|
23,623 |
|
|
|
19,709 |
|
|
|
3,914 |
|
|
|
20 |
% |
|
Total cost of revenue |
|
$ |
44,590 |
|
|
$ |
37,038 |
|
|
$ |
7,552 |
|
|
|
20 |
% |
Cost of License Revenue. The cost of license revenue increased by $0.3 million, or 7%, for the year ended December 31, 2017 compared to the year ended December 31, 2016. During each of the years ended December 31, 2017 and 2016, cost of license revenue included $4.0 million in amortization of intangibles acquired in business combinations.
Cost of Subscription Revenue. Cost of subscription revenue increased by $3.4 million, or 26%, for the year ended December 31, 2017 compared to the year ended December 31, 2016. Approximately $1.7 million was attributable to an increase in headcount and related allocated expenses to support growth of our subscription cloud-based offering and ongoing maintenance for our expanding licensed customer base. Approximately $1.6 million was attributable to our increased cloud-based hosting costs.
60
Cost of Services and Other Revenue. Cost of services and other revenue increased by $3.9 million, or 20%, for the year ended December 31, 2017, compared to the year ended December 31, 2016. Substantially all of the increase was the result of our increased services and training headcount and related allocated overhead.
Gross Profit and Gross Margin
|
|
|
Year Ended December 31, |
|
|||||||||||||
|
|
|
2017 |
|
|
2016 |
|
|
variance $ |
|
|
variance % |
|
||||
|
|
|
(In thousands, except percentages) |
|
|||||||||||||
|
Gross profit: |
|
|
|
|
|
|
|
|
|
|
|
|
|
|
|
|
|
Licenses |
|
$ |
74,648 |
|
|
$ |
50,117 |
|
|
$ |
24,531 |
|
|
|
49 |
% |
|
Subscription |
|
|
54,601 |
|
|
|
36,313 |
|
|
|
18,288 |
|
|
|
50 |
% |
|
Services and other |
|
|
12,217 |
|
|
|
8,944 |
|
|
|
3,273 |
|
|
|
37 |
% |
|
Total gross profit |
|
$ |
141,466 |
|
|
$ |
95,374 |
|
|
$ |
46,092 |
|
|
|
48 |
% |
|
|
|
|
|
|
|
|
|
|
|
|
|
|
|
|
|
|
|
Gross Margin: |
|
|
|
|
|
|
|
|
|
|
|
|
|
|
|
|
|
Licenses |
|
|
94 |
% |
|
|
92 |
% |
|
|
|
|
|
|
|
|
|
Subscription |
|
|
77 |
% |
|
|
74 |
% |
|
|
|
|
|
|
|
|
|
Services and other |
|
|
34 |
% |
|
|
31 |
% |
|
|
|
|
|
|
|
|
|
Total gross margin |
|
|
76 |
% |
|
|
72 |
% |
|
|
|
|
|
|
|
|
Licenses. License gross profit increased by $24.5 million, or 49%, during the year ended December 31, 2017 compared to the year ended December 31, 2016. The increase was the result of increased license revenues with only minor increases in third party royalties.
Subscription. Subscription gross profit increased by $18.3 million, or 50%, during the year ended December 31, 2017, compared to the year ended December 31, 2016. The increase was the result of growth in subscription revenue, as described above, coupled with growth in costs of subscription revenue at a rate lower than our revenue growth as we continue to build economies of scale within our customer support organization and our utilization of cloud-based hosting services.
Services and Other. Services and other gross profit increased by $3.3 million, or 37%, during the year ended December 31, 2017, compared to the year ended December 31, 2016. This increase was the result of the volume and mix of services provided in the period yielding a higher price per hour as well as the headcount required to provide such professional services increasing at a slower rate as we continue to build economies of scale within our professional services and training organization.
Operating Expenses
|
|
|
Year Ended December 31, |
|
|||||||||||||
|
|
|
2017 |
|
|
2016 |
|
|
variance $ |
|
|
variance % |
|
||||
|
Operating expenses: |
|
(In thousands, except percentages) |
|
|||||||||||||
|
Research and development |
|
$ |
33,331 |
|
|
$ |
24,358 |
|
|
$ |
8,973 |
|
|
|
37 |
% |
|
General and administrative |
|
|
17,678 |
|
|
|
9,680 |
|
|
|
7,998 |
|
|
|
83 |
% |
|
Sales and marketing |
|
|
80,514 |
|
|
|
58,607 |
|
|
|
21,907 |
|
|
|
37 |
% |
|
Total operating expenses |
|
$ |
131,523 |
|
|
$ |
92,645 |
|
|
$ |
38,878 |
|
|
|
42 |
% |
61
Research and Development Expenses. Research and development expenses increased by $9.0 million, or 37%, for the year ended December 31, 2017, compared to the year ended December 31, 2016. Approximately 81% of this increase was the result of an increase in headcount, and related allocated overhead, to optimize and expand our product offerings as well as pursue innovation in identity governance. Substantially all of the remaining increase in research and development expenses was the result of increased software and maintenance expenses, primarily cloud-based hosting costs related to the development of our cloud-based offering.
General and Administrative Expenses. General and administrative expenses increased by $8.0 million, or 83%, for the year ended December 31, 2017, compared to the year ended December 31, 2016. Approximately 77% of the increase was the result of an increase in corporate headcount, and related allocated overhead, to support the growth and scale of the business. In 2017, approximately $2.0 million of increase was related to stock compensation expense compared to 2016. Additionally, general and administrative expenses increased as a result of increase in professional services expenses comprised of legal, accounting and consulting fees.
Sales and Marketing Expenses. Sales and marketing expenses increased by $21.9 million, or 37%, for the year ended December 31, 2017, compared to the year ended December 31, 2016. Approximately $17.4 million, or 80%, of the increase was the result of our increased sales and marketing headcount, and related allocated overhead, to support increased penetration into our existing customer base as well as expansion into new industry verticals and geographic markets. As our headcount increased we also experienced related increases in travel and advertising costs of $1.2 million and $1.7 million, respectively, for the year ended December 31, 2017, compared to the year ended December 31, 2016. Substantially all of the remaining increase in sales and marketing expenses was the result of increased partner commissions and consulting costs.
Interest Expense, Net
Interest expense, net of interest income, increased by $7.3 million, or 93%, for the year ended December 31, 2017, compared to the year ended December 31, 2016. These increases were the result of our entry into a new credit facility, effective in August 2016, which increased the stated interest rate from 3.7% to 9.0%, as well as our amendment in June of 2017, which increased the term loan principal by $50 million. Additionally, during the fourth quarter of 2017, we paid down $90.0 million of our debt resulting in approximately $1.4 million of cash prepayment penalties and $1.7 million in a non-cash loss on the resulting modification and partial extinguishment of our debt.
Comparison of the Years Ended December 31, 2016 and 2015
Revenue
|
|
|
|
Year Ended December 31, |
|
||||||||||||||
|
|
|
|
2016 |
|
|
2015 |
|
|
variance $ |
|
|
variance % |
|
|||||
|
Revenue: |
|
|
(In thousands, except percentages) |
|
||||||||||||||
|
Licenses |
|
|
$ |
54,395 |
|
|
$ |
44,124 |
|
|
$ |
10,271 |
|
|
|
23 |
% |
|
|
Subscription |
|
|
|
49,364 |
|
|
|
29,930 |
|
|
|
19,434 |
|
|
|
65 |
% |
|
|
Services and other |
|
|
|
28,653 |
|
|
|
21,302 |
|
|
|
7,351 |
|
|
|
35 |
% |
|
|
Total revenue |
|
|
$ |
132,412 |
|
|
$ |
95,356 |
|
|
$ |
37,056 |
|
|
|
39 |
% |
|
License Revenue. License revenue increased by $10.3 million, or 23%, for the year ended December 31, 2016 compared to the year ended December 31, 2015. The increase was primarily attributable to sales to new customers. During the years ended December 2015 and 2016, license revenue from new customers was $29.4 million and $42.2 million, respectively and license revenue from existing customers was $14.7 million and $12.2 million, respectively. Our revenue from any single customer is determined by the number of identities the customer is entitled to govern as well as the number of modules and solutions purchased.
62
Subscription Revenue. Subscription revenue increased by $19.4 million, or 65%, for the year ended December 31, 2016 compared to the year ended December 31, 2015. The increase was primarily a result of an increase in maintenance renewals and an increase in maintenance revenue derived from new licenses sales. Our customer base increased by 175, or 34%, from 520 customers at December 31, 2015 to 695 customers at December 31, 2016. Approximately $3.9 million of the increase in subscription revenue is the result of a decrease in the purchase accounting write down of deferred revenue subsequent to the Acquisition.
Services and Other Revenue. Services and other revenue increased by $7.4 million, or 35%, for the year ended December 31, 2016 compared to the year ended December 31, 2015. The increase is primarily the result of an increase in the number of customers using our consulting and training services. Approximately $0.3 million of the increase in services and other revenue is the result of a decrease in the purchase accounting write down of deferred revenue subsequent to the Acquisition.
Geographic Regions. Our operations in the United States were responsible for the largest portion of our revenue in each year ended December 31, 2016 and December 31, 2015, as well as for our revenue growth in year ended December 31, 2016, as compared to the prior year period, because of our larger and more established sales force and partner network in the United States as compared to our other regions. Revenue from both EMEA and the rest of the world also increased for the December 31, 2016 as compared to 2015, primarily due to our investment in increasing the size of our international sales force and strengthening partnerships with global system integrators and resellers worldwide.
The following table sets forth, for each of the periods presented, our consolidated total revenue by geography and the respective percentage of total revenue:
|
|
|
Year Ended December 31, |
|
|||||||||||||
|
|
|
2016 |
|
|
2015 |
|
||||||||||
|
|
|
$ |
|
|
% of revenue |
|
|
$ |
|
|
% of revenue |
|
||||
|
|
|
(In thousands, except percentages) |
|
|||||||||||||
|
United States |
|
$ |
92,116 |
|
|
|
70 |
% |
|
$ |
63,440 |
|
|
|
67 |
% |
|
EMEA (1) |
|
|
25,668 |
|
|
|
19 |
% |
|
|
20,770 |
|
|
|
22 |
% |
|
Rest of the World (1) |
|
|
14,628 |
|
|
|
11 |
% |
|
|
11,146 |
|
|
|
12 |
% |
|
Total revenue |
|
$ |
132,412 |
|
|
|
100 |
% |
|
$ |
95,356 |
|
|
|
100 |
% |
|
(1) |
No single country represented more than 10% of our consolidated revenue. |
Cost of Revenue
|
|
|
Year Ended December 31, |
|
|||||||||||||
|
|
|
2016 |
|
|
2015 |
|
|
variance $ |
|
|
variance % |
|
||||
|
Cost of revenue: |
|
(In thousands, except percentages) |
|
|||||||||||||
|
Licenses |
|
$ |
4,278 |
|
|
$ |
4,293 |
|
|
$ |
(15 |
) |
|
|
(0 |
)% |
|
Subscription |
|
|
13,051 |
|
|
|
9,815 |
|
|
|
3,236 |
|
|
|
33 |
% |
|
Services and other |
|
|
19,709 |
|
|
|
15,151 |
|
|
|
4,558 |
|
|
|
30 |
% |
|
Total cost of revenue |
|
$ |
37,038 |
|
|
$ |
29,259 |
|
|
$ |
7,779 |
|
|
|
27 |
% |
Cost of License Revenue. The cost of license revenue did not materially change in dollar amount from period to period. During the years ended December 31, 2016 and 2015, cost of license revenues included $4.0 million and $3.7 million, respectively, of amortization of intangibles acquired in business combinations.
63
Cost of Subscription Revenue. Cost of subscription revenue increased by $3.2 million, or 33%, for the year ended December 31, 2016 compared to the year ended December 31, 2015. Approximately $2.6 million of the increase was the result of our increased headcount, and related allocated overhead, to support growth of our subscription cloud-based offering and ongoing maintenance for our expanding licensed customer base. Approximately $0.6 million of the increase was the result of our increased cloud-based hosting costs for our cloud-based solution. During the years ended December 31, 2015 and 2016, cost of subscription revenue included $0.4 million and $0.4 million, respectively, of amortization of intangibles acquired in business combinations.
Cost of Services and Other Revenue. Cost of services and other revenue increased by $4.6 million, or 30%, for the year ended December 31, 2016 compared to the year ended December 31, 2015. Approximately 95% of the increase was the result of our increased services and training headcount and related allocated overhead.
Gross Profit and Gross Margin
|
|
|
Year Ended December 31, |
|
|||||||||||||
|
|
|
2016 |
|
|
2015 |
|
|
variance $ |
|
|
variance % |
|
||||
|
|
|
(In thousands, except percentages) |
|
|||||||||||||
|
Gross profit: |
|
|
|
|
|
|
|
|
|
|
|
|
|
|
|
|
|
Licenses |
|
$ |
50,117 |
|
|
$ |
39,831 |
|
|
$ |
10,286 |
|
|
|
26 |
% |
|
Subscription |
|
|
36,313 |
|
|
|
20,115 |
|
|
|
16,198 |
|
|
|
81 |
% |
|
Services and other |
|
|
8,944 |
|
|
|
6,151 |
|
|
|
2,793 |
|
|
|
45 |
% |
|
Total gross profit |
|
$ |
95,374 |
|
|
$ |
66,097 |
|
|
$ |
29,277 |
|
|
|
44 |
% |
|
Gross Margin: |
|
|
|
|
|
|
|
|
|
|
|
|
|
|
|
|
|
Licenses |
|
92% |
|
|
90% |
|
|
|
|
|
|
|
|
|
||
|
Subscription |
|
74% |
|
|
67% |
|
|
|
|
|
|
|
|
|
||
|
Services and other |
|
31% |
|
|
29% |
|
|
|
|
|
|
|
|
|
||
|
Total gross margin |
|
72% |
|
|
69% |
|
|
|
|
|
|
|
|
|
||
Licenses. License gross profit increased by $10.3 million, or 26%, during the year ended December 31, 2016 compared to the year ended December 31, 2015. The increase was the result of increased license revenue as well as decreased costs on license revenue as a result of acquiring the SecurityIQ technology in July of 2015.
Subscription. Subscription gross profit increased by $16.2 million, or 81%, during the year ended December 31, 2016 compared to the year ended December 31, 2015. The increase was the result of growth in subscription revenue, as described above, coupled with growth in costs of subscription revenue at a rate lower than our revenue growth as we continue to build economies of scale within our customer support organization and our utilization of cloud-based hosting services.
Services and Other. Services and other gross profit increased by $2.8 million, or 45%, during the year ended December 31, 2016 compared to the year ended December 31, 2015. This increase was the result of the volume and mix of services provided in the period.
Operating Expenses
|
|
|
Year Ended December 31, |
|
||||||||||||||
|
|
|
2016 |
|
|
2015 |
|
|
variance $ |
|
|
variance % |
|
|||||
|
|
|
(In thousands, except percentages) |
|
||||||||||||||
|
Research and development |
|
$ |
24,358 |
|
|
$ |
19,965 |
|
|
$ |
4,393 |
|
|
|
22 |
% |
|
|
General and administrative |
|
|
9,680 |
|
|
|
7,474 |
|
|
|
2,206 |
|
|
|
30 |
% |
|
|
Sales and marketing |
|
|
58,607 |
|
|
|
46,831 |
|
|
|
11,776 |
|
|
|
25 |
% |
|
|
Total operating expenses |
|
$ |
92,645 |
|
|
$ |
74,270 |
|
|
$ |
18,375 |
|
|
|
25 |
% |
|
64
Research and Development Expenses. Research and development expenses increased by $4.4 million, or 22%, for the year ended December 31, 2016 compared to the year ended December 31, 2015. Approximately $4.0 million of the increase was the result of our increased headcount, and related allocated overhead, to optimize and expand our product offerings as well as pursue innovation in identity governance. Approximately $0.5 million of the increase was the result of increased software and maintenance expenses, primarily cloud-based hosting costs related to the development of our cloud-based solution.
General and Administrative Expenses. General and administrative expenses increased by $2.2 million, or 30%, for the year ended December 31, 2016 compared to the year ended December 31, 2015. The increase in general and administrative expenses was primarily the result of a $0.9 million increase in corporate staff, and related allocated overhead, to support the growth and scale of the business and a $1.3 million increase in professional service expense, including sponsor-related costs and other consulting and advisory costs.
Sales and Marketing Expenses. Sales and marketing expenses increased by $11.8 million, or 25%, for the year ended December 31, 2016 compared to the year ended December 31, 2015. Approximately $10.2 million of the increase was the result of our increased sales and marketing headcount, and related allocated overhead, to support increased penetration into our existing customer base as well as expansion into new industry verticals and geographic markets. Also contributing to the increase in sales and marketing expenses was a $1.6 million increase in expenses related to advertising and marketing programs and a $1.3 million increase in travel expenses, partially offset by a $0.8 million decrease in consulting costs, and a $0.6 million decrease in amortization expense.
Other Expense, Net
Other expense, net increased by $0.8 million, or 55%, for the year ended December 31, 2016 compared to the year ended December 31, 2015. The increase was primarily a result of fluctuations in foreign currency exchange rates on sales transactions denominated in foreign currencies.
Interest Expense, Net
Interest expense, net of interest income, increased by $3.4 million, or 87%, for the year ended December 31, 2016 compared to the year ended December 31, 2015. The increase was the result of our entry into a new credit facility, effective in August of 2016, which increased the stated interest rate from 3.7% to 9.0%.
65
Quarterly Results of Operations
The following tables set forth our unaudited quarterly consolidated statements of operations data for each of the quarters indicated. The information for each quarter has been prepared on a basis consistent with our audited consolidated financial statements included, and reflect, in the opinion of management, all adjustments of a normal, recurring nature that are necessary for a fair presentation of the financial information contained in those statements. Our historical results are not necessarily indicative of the results that may be expected in the future. The following quarterly financial data should be read in conjunction with our consolidated financial statements included elsewhere in this Annual Report on Form 10-K.
|
|
|
Three Months Ended |
|
|||||||||||||||||||||||||||||
|
|
|
12/31/2017 |
|
|
9/30/2017 |
|
|
6/30/2017 |
|
|
3/31/2017 |
|
|
12/31/2016 |
|
|
9/30/2016 |
|
|
6/30/2016 |
|
|
3/31/2016 |
|
||||||||
|
|
|
(In thousands) |
|
|||||||||||||||||||||||||||||
|
Revenue: |
|
|
|
|
|
|
|
|
|
|
|
|
|
|
|
|
|
|
|
|
|
|
|
|
|
|
|
|
|
|
|
|
|
Licenses |
|
$ |
36,657 |
|
|
$ |
16,975 |
|
|
$ |
13,341 |
|
|
$ |
12,236 |
|
|
$ |
22,232 |
|
|
$ |
11,379 |
|
|
$ |
10,892 |
|
|
$ |
9,892 |
|
|
Subscription |
|
|
21,225 |
|
|
|
18,506 |
|
|
|
16,324 |
|
|
|
14,952 |
|
|
|
14,081 |
|
|
|
12,631 |
|
|
|
11,683 |
|
|
|
10,969 |
|
|
Services and other |
|
|
9,886 |
|
|
|
8,081 |
|
|
|
9,595 |
|
|
|
8,278 |
|
|
|
8,035 |
|
|
|
7,166 |
|
|
|
6,861 |
|
|
|
6,591 |
|
|
Total revenue |
|
|
67,768 |
|
|
|
43,562 |
|
|
|
39,260 |
|
|
|
35,466 |
|
|
|
44,348 |
|
|
|
31,176 |
|
|
|
29,436 |
|
|
|
27,452 |
|
|
Cost of revenue: |
|
|
|
|
|
|
|
|
|
|
|
|
|
|
|
|
|
|
|
|
|
|
|
|
|
|
|
|
|
|
|
|
|
Licenses |
|
|
1,260 |
|
|
|
1,104 |
|
|
|
1,110 |
|
|
|
1,087 |
|
|
|
1,106 |
|
|
|
1,064 |
|
|
|
1,075 |
|
|
|
1,033 |
|
|
Subscription (1) |
|
|
4,873 |
|
|
|
4,020 |
|
|
|
3,938 |
|
|
|
3,575 |
|
|
|
3,474 |
|
|
|
3,620 |
|
|
|
3,144 |
|
|
|
2,813 |
|
|
Services and other (1) |
|
|
6,549 |
|
|
|
5,954 |
|
|
|
5,647 |
|
|
|
5,473 |
|
|
|
5,363 |
|
|
|
5,353 |
|
|
|
4,770 |
|
|
|
4,223 |
|
|
Total cost of revenue |
|
|
12,682 |
|
|
|
11,078 |
|
|
|
10,695 |
|
|
|
10,135 |
|
|
|
9,943 |
|
|
|
10,037 |
|
|
|
8,989 |
|
|
|
8,069 |
|
|
Gross profit |
|
|
55,086 |
|
|
|
32,484 |
|
|
|
28,565 |
|
|
|
25,331 |
|
|
|
34,405 |
|
|
|
21,139 |
|
|
|
20,447 |
|
|
|
19,383 |
|
|
Operating expenses: |
|
|
|
|
|
|
|
|
|
|
|
|
|
|
|
|
|
|
|
|
|
|
|
|
|
|
|
|
|
|
|
|
|
Research and development (1) |
|
|
9,995 |
|
|
|
8,443 |
|
|
|
7,966 |
|
|
|
6,927 |
|
|
|
6,635 |
|
|
|
6,169 |
|
|
|
6,062 |
|
|
|
5,492 |
|
|
General and administrative (1) |
|
|
6,790 |
|
|
|
4,414 |
|
|
|
3,442 |
|
|
|
3,032 |
|
|
|
2,447 |
|
|
|
2,298 |
|
|
|
2,272 |
|
|
|
2,663 |
|
|
Sales and marketing (1) |
|
|
27,781 |
|
|
|
19,220 |
|
|
|
18,340 |
|
|
|
15,173 |
|
|
|
16,901 |
|
|
|
13,854 |
|
|
|
14,465 |
|
|
|
13,387 |
|
|
Total operating expenses |
|
|
44,566 |
|
|
|
32,077 |
|
|
|
29,748 |
|
|
|
25,132 |
|
|
|
25,983 |
|
|
|
22,321 |
|
|
|
22,799 |
|
|
|
21,542 |
|
|
Income (loss) from operations |
|
|
10,520 |
|
|
|
407 |
|
|
|
(1,183 |
) |
|
|
199 |
|
|
|
8,422 |
|
|
|
(1,182 |
) |
|
|
(2,352 |
) |
|
|
(2,159 |
) |
|
Other expense, net: |
|
|
|
|
|
|
|
|
|
|
|
|
|
|
|
|
|
|
|
|
|
|
|
|
|
|
|
|
|
|
|
|
|
Interest expense, net |
|
|
(5,704 |
) |
|
|
(3,726 |
) |
|
|
(2,696 |
) |
|
|
(2,657 |
) |
|
|
(2,830 |
) |
|
|
(2,355 |
) |
|
|
(1,060 |
) |
|
|
(1,032 |
) |
|
Other, net |
|
|
(203 |
) |
|
|
(162 |
) |
|
|
(30 |
) |
|
|
(64 |
) |
|
|
(214 |
) |
|
|
(117 |
) |
|
|
(32 |
) |
|
|
(247 |
) |
|
Total other expense, net |
|
|
(5,907 |
) |
|
|
(3,888 |
) |
|
|
(2,726 |
) |
|
|
(2,721 |
) |
|
|
(3,044 |
) |
|
|
(2,472 |
) |
|
|
(1,092 |
) |
|
|
(1,279 |
) |
|
Income (loss) before income taxes |
|
|
4,613 |
|
|
|
(3,481 |
) |
|
|
(3,909 |
) |
|
|
(2,522 |
) |
|
|
5,378 |
|
|
|
(3,654 |
) |
|
|
(3,444 |
) |
|
|
(3,438 |
) |
|
Income tax benefit (expense) |
|
|
769 |
|
|
|
(2,906 |
) |
|
|
(395 |
) |
|
|
239 |
|
|
|
(2,072 |
) |
|
|
1,407 |
|
|
|
1,326 |
|
|
|
1,324 |
|
|
Net income (loss) |
|
$ |
5,382 |
|
|
$ |
(6,387 |
) |
|
$ |
(4,304 |
) |
|
$ |
(2,283 |
) |
|
$ |
3,306 |
|
|
$ |
(2,247 |
) |
|
$ |
(2,118 |
) |
|
$ |
(2,114 |
) |
|
(1) |
Includes stock-based compensation expense as follows: |
66
|
|
|
Three Months Ended |
|
|||||||||||||||||||||||||||||
|
|
|
12/31/2017 |
|
|
9/30/2017 |
|
|
6/30/2017 |
|
|
3/31/2017 |
|
|
12/31/2016 |
|
|
9/30/2016 |
|
|
6/30/2016 |
|
|
3/31/2016 |
|
||||||||
|
|
|
(In thousands) |
|
|
|
|
|
|||||||||||||||||||||||||
|
Cost of revenue - subscription |
|
$ |
100 |
|
|
$ |
14 |
|
|
$ |
9 |
|
|
$ |
9 |
|
|
$ |
14 |
|
|
$ |
7 |
|
|
$ |
7 |
|
|
$ |
6 |
|
|
Cost of revenue - services and other |
|
|
399 |
|
|
|
23 |
|
|
|
20 |
|
|
|
18 |
|
|
|
26 |
|
|
|
13 |
|
|
|
12 |
|
|
|
12 |
|
|
Research and development |
|
|
551 |
|
|
|
41 |
|
|
|
35 |
|
|
|
30 |
|
|
|
50 |
|
|
|
24 |
|
|
|
22 |
|
|
|
22 |
|
|
General and administrative |
|
|
1,964 |
|
|
|
23 |
|
|
|
45 |
|
|
|
30 |
|
|
|
36 |
|
|
|
20 |
|
|
|
20 |
|
|
|
20 |
|
|
Sales and marketing |
|
|
956 |
|
|
|
100 |
|
|
|
76 |
|
|
|
71 |
|
|
|
112 |
|
|
|
52 |
|
|
|
48 |
|
|
|
45 |
|
|
Total stock-based compensation |
|
$ |
3,970 |
|
|
$ |
201 |
|
|
$ |
185 |
|
|
$ |
158 |
|
|
$ |
238 |
|
|
$ |
116 |
|
|
$ |
109 |
|
|
$ |
105 |
|
Quarterly Trends in Revenue
Our quarterly license revenue increased sequentially within each calendar year presented; however, we experienced a decline sequentially from the fourth quarter of each year to the first quarter of the subsequent year due to increased customer purchasing activity in each fourth quarter. We continue to experience growth in license revenue when comparing similar periods year over year as a result of our ability to attract new customers and expand our product offerings within our existing customer base.
Our quarterly subscription revenue increased in each period presented primarily due to increases in maintenance renewals as a result of our expanding licensed customer base. Sales of subscriptions to our platform also continue to grow as a result of the expanding breadth and functionality of our platform, increasing brand awareness, and the success of our sales efforts with new and existing customers. We recognize revenue from maintenance and subscription fees ratably over the term of the contract period; therefore, changes in our sales activity in a period may not be as apparent as a change to our revenue until future periods.
Our quarterly services and other revenue increased sequentially in each period presented. We have experienced increasing demand for our consulting and training services as our customer base, including both licensed and recurring, has continued to expand.
Quarterly Trends in Operating Expenses
Our operating expenses have generally increased sequentially as a result of our growth and are primarily related to increases in personnel-related costs to support our expanded operations and our continued investment in our platform infrastructure and service capabilities.
Quarterly Key Business Metrics
|
|
|
Three Months Ended |
|
|||||||||||||||||||||||||||||||||||
|
|
|
12/31/2017 |
|
|
9/30/2017 |
|
|
|
|
6/30/2017 |
|
|
|
|
3/31/2017 |
|
|
|
|
12/31/2016 |
|
|
9/30/2016 |
|
|
6/30/2016 |
|
|
3/31/2016 |
|
||||||||
|
Number of customers |
|
|
933 |
|
|
|
829 |
|
|
|
|
|
776 |
|
|
|
|
|
725 |
|
|
|
|
|
695 |
|
|
|
628 |
|
|
|
589 |
|
|
|
558 |
|
|
Subscription revenue as a percentage of total revenue |
|
|
31 |
% |
|
|
42 |
% |
|
|
|
|
42 |
% |
|
|
|
|
42 |
% |
|
|
|
|
32 |
% |
|
|
41 |
% |
|
|
40 |
% |
|
|
40 |
% |
|
Adjusted EBITDA (in thousands) |
|
$ |
17,116 |
|
|
$ |
3,376 |
|
|
|
|
$ |
1,857 |
|
|
|
|
$ |
3,152 |
|
|
|
|
$ |
11,498 |
|
|
$ |
1,734 |
|
|
$ |
853 |
|
|
$ |
1,050 |
|
67
Liquidity and Capital Resources
As of December 31, 2017, we had $116.0 million of cash and cash equivalents and $1.4 million of availability under our revolving credit facility. As of December 31, 2017, we had approximately $3.2 million of cash and cash equivalents held in our foreign subsidiaries. We do not consider the earnings of our foreign subsidiaries, with the exception of India, to be permanently reinvested in foreign jurisdictions and have consistently applied Section 956 of the Internal Revenue Code to such earnings. As a result of applying Section 956 consistently to our intercompany cash flows, the majority of the earnings in our foreign subsidiaries represent income that was previously taxed in the United States. As a result, there would be no material income tax consequences to repatriating the cash currently held in our foreign subsidiaries. In India, we continue to invest and grow our research and development activities and have no plans to repatriate undistributed earning held in India back to the U.S. parent company, and therefore consider earnings in India to be permanently reinvested.
We believe that existing cash and cash equivalents, any positive cash flows from operations and available borrowings under our revolving credit facility will be sufficient to support working capital and capital expenditure requirements for at least the next 12 months. Our future capital requirements will depend on many factors, including our growth rate, the timing and extent of spending to support research and development efforts, the continued expansion of sales and marketing activities and the introduction of new solutions and product enhancements. To the extent existing cash and cash equivalents and borrowings under our revolving credit facility are not sufficient to fund future activities, we may seek to raise additional funds through equity, equity-linked or debt financings. If we raise additional funds through the incurrence of indebtedness, such indebtedness may have rights that are senior to holders of our equity securities and could contain covenants that restrict operations. Any additional equity financing may be dilutive to our existing stockholders. Although we are not currently a party to any agreement or letter of intent with respect to potential investments in, or acquisitions of, complementary businesses, services or technologies, we may enter into these types of arrangements in the future, which could also require us to seek additional equity financing, incur indebtedness, or use cash resources. We have no present understandings, commitments or agreements to enter into any such acquisitions. Also, as of December 31, 2016 and December 31, 2017, we had no material commitments for capital expenditures.
Since inception, we have financed operations primarily through license fees, maintenance fees, subscription fees, consulting and training fees, borrowings under our credit facility and, to a lesser degree, the sale of equity securities. Our principal uses of cash are funding operations and capital expenditures. Over the past several years, revenue has increased significantly from year to year and, as a result, cash flows from customer collections have increased. However, operating expenses have also increased as we have invested in growing our business. Our operating cash requirements may increase in the future as we continue to invest in the strategic growth of our company.
Our Credit Facility
On August 16, 2016, we entered into a senior secured credit facility (our “credit facility”), consisting of a $115 million term loan facility and a $5 million revolving credit facility, pursuant to a credit and guaranty agreement by and among SailPoint Technologies, Inc., as the borrower, and SailPoint Technologies Intermediate Holdings, LLC and SailPoint International, Inc., as guarantors, the lenders party thereto from time to time and Goldman Sachs Bank USA, as administrative agent and collateral agent, which was subsequently amended and restated on November 2, 2016 to provide for a letter of credit sub-facility with an aggregate limit equal to the lesser of $5 million and the aggregate unused amount of the revolving commitments then in effect. Our credit facility was further amended on June 28, 2017 to provide for (i) an increase to the term loan facility in an additional principal amount of $50 million to partially fund a $50.4 million dividend paid to the holders of our preferred stock and (ii) an increase to the revolving credit facility in an additional principal amount of $2.5 million, and (iii) an increase in the letter of credit sub-facility aggregate limit to the lesser of $7.5 million and the aggregate unused amount of the revolving commitments then in effect. Each of the term loan facility and revolving credit facility has a maturity of five years and will mature on August 16, 2021.
68
In fourth quarter of 2017, we amended our existing credit facility in connection with the consummation of our initial public offering. Such amendment required that we use a portion of our net proceeds from our initial public offering to repay an amount of borrowings outstanding under our term loan facility to reduce the aggregate outstanding principal amount thereof to $70.0 million (which repayment was subject to a prepayment premium of 1.50%). We used a portion of our net proceeds from our initial public offering to repay $90.0 million of such borrowings and paid the related prepayment premium of approximately $1.4 million. In addition, this payment resulted in a non-cash charge of $1.7 million on the modification and partial extinguishment of debt.
As of December 31, 2017, the balance outstanding under the term loan facility was $70.0 million and is included in long term debt on our consolidated balance sheet. Our revolving line of credit has a face value of $7.5 million and was undrawn as of December 31, 2017. We had $1.4 million available under the revolving credit facility due to $6.1 million in standby letters of credit, issued primarily in connection with our new corporate headquarters lease. See Item 2 “Properties” for more information regarding our new corporate headquarters lease.
All of our obligations under our credit facility are guaranteed by our existing and future domestic subsidiaries and, subject to certain exceptions, secured by a security interest in substantially all of our tangible and intangible assets.
Summary of Cash Flows
The following table summarizes our cash flows for the periods indicated:
|
|
|
Year Ended December 31, |
|
|||||||||
|
|
|
2017 |
|
|
2016 |
|
|
2015 |
|
|||
|
|
|
(In thousands) |
|
|||||||||
|
Cash provided by operating activities |
|
$ |
21,856 |
|
|
$ |
6,540 |
|
|
$ |
3,560 |
|
|
Cash used in investing activities |
|
|
(2,521 |
) |
|
|
(1,255 |
) |
|
|
(16,308 |
) |
|
Cash provided by (used in) financing activities |
|
|
78,520 |
|
|
|
(1,962 |
) |
|
|
9,849 |
|
|
Net increase (decrease) in cash, cash equivalents and restricted cash |
|
$ |
97,855 |
|
|
$ |
3,323 |
|
|
$ |
(2,899 |
) |
Cash Flows from Operating Activities
During 2017, cash provided by operating activities was $21.9 million, which consisted of a net loss of $7.6 million, adjusted by non-cash charges of $17.2 million and a net change of $12.2 million in our net operating assets and liabilities. The non-cash charges are primarily comprised of depreciation and amortization of $10.2 million, amortization of debt issuance costs of $0.7 million, loss on modification and partial extinguishment of debt of $1.7 million and stock-based compensation of $4.5 million. The change in our net operating assets and liabilities was primarily as a result of an increase in deferred revenue of $28.0 million due to the timing of billings and cash received in advance of revenue recognition primarily for subscription and support services, an increase in accrued expenses of $10.9 million due primarily to accrual of additional commissions and bonuses, an increase in accounts payable of $1.4 million due to timing of cash disbursements, an increase in income taxes payable of $0.6 million, partially offset by an increase in prepayments and other assets of $2.2 million, and increase in other non-current assets of $2.5 million, and an increase in accounts receivable of $24.1 million due to the timing of receipts of payments from customers.
During 2016, cash provided by operating activities was $6.5 million, which consisted of a net loss of $3.2 million, adjusted by non-cash charges of $8.8 million and a net change of $0.9 million in our net operating assets and liabilities. The non-cash charges are primarily comprised of depreciation and amortization of $10.0 million, amortization of debt issuance costs of $0.7 million, and stock-based compensation of $0.6 million, partially offset by $2.5 million in deferred taxes. The change in our net operating assets and liabilities was primarily as a result of an increase in deferred revenue of $20.2 million due to the timing of billings and cash received in advance of revenue recognition primarily for subscription and support services and an increase in accrued expenses of $1.7 million related primarily to commissions on our subscription revenue, partially offset by an increase in accounts receivable of $17.2 million due to the timing of receipts of payments from customers, an increase in prepaid expenses and other assets of $3.6 million due to payments for various services to be rendered in subsequent periods and a decrease in accounts payable of $0.3 million due to timing of cash disbursements.
69
During 2015, cash provided by operating activities was $3.6 million, which consisted of a net loss of $10.8 million, adjusted by non-cash charges of $6.7 million and a change of $7.7 million in our net operating assets and liabilities. The non-cash charges are primarily comprised of depreciation and amortization of $9.6 million, amortization of debt issuance costs of $0.1 million, and stock-based compensation of $0.2 million, partially offset by $3.3 million in deferred taxes. The change in our net operating assets and liabilities, net of acquisitions, was primarily a result of an increase in deferred revenue of $11.6 million due to the timing of billings and cash received in advance of revenue recognition primarily for subscription and support services and an increase in accrued expenses of $3.1 million related primarily to commissions on our subscription revenue, partially offset by an increase in accounts receivable of $5.3 million due to the timing of receipts of payments from customers, an increase in prepayments and other assets of $1.1 million due to payments for various services to be rendered in subsequent periods, and an increase in accounts payable of $0.6 million due to timing of cash disbursements.
Cash Flows from Investing Activities
During the year ended December 31, 2017, cash used in investing activities was $2.5 million, consisting of $2.7 million in purchases of property and equipment, partially offset by $0.2 million in proceeds from sales of property and equipment.
During 2016, cash used in investing activities was $1.3 million, consisting of purchases of property and equipment.
During 2015, cash used in investing activities was $16.3 million, consisting of $15.2 million of cash paid for acquisitions and $1.2 million in purchases of property and equipment.
Cash Flows from Financing Activities
During the year ended December 31, 2017, cash provided by financing activities was $78.5 million, consisting of $172.0 million of net proceeds from the issuance of common stock after deducting underwriting discounts and commissions of approximately $13.3 million, proceeds from borrowing of $50.0 million, $0.4 million of the proceeds from exercise of stock options, partially offset by $90.0 million in repayments of debt, $1.4 million of debt issuance cost, $50.4 million for preferred dividend payments, $1.4 million in debt prepayment and $0.7 million in purchase of equity shares.
During 2016, cash used in financing activities was $2.0 million, consisting of $3.1 million in debt issuance costs and $0.2 million for the repurchase of common and preferred stock, partially offset by $1.3 million in proceeds from the issuance of common and preferred stock.
During 2015, cash provided by financing activities was $9.8 million, consisting of net proceeds of $10.0 million from a draw down on our prior credit facility and $0.3 million in proceeds from the issuance of common and preferred stock, partially offset by $0.5 million for the repurchase of common and preferred stock.
Off-Balance Sheet Arrangements
We have not entered into any off-balance sheet arrangements and do not have any holdings in variable interest entities, which includes special purposes entities and other structured finance entities.
70
The following table summarizes our non-cancellable contractual obligations as of December 31, 2017:
|
|
Payments Due by Period |
|
|||||||||||||||||
|
|
Total |
|
|
Less Than 1 Year |
|
|
1 to 3 Years |
|
|
3 to 5 Years |
|
|
More than 5 Years |
|
|||||
|
|
(In thousands) |
|
|||||||||||||||||
|
Operating lease obligations |
$ |
52,279 |
|
|
$ |
2,785 |
|
|
$ |
7,449 |
|
|
$ |
9,918 |
|
|
$ |
32,127 |
|
|
Term loan facility-principal (1) |
|
70,000 |
|
|
|
— |
|
|
|
— |
|
|
|
70,000 |
|
|
|
— |
|
|
Term loan facility-interest (2) |
|
14,438 |
|
|
|
3,850 |
|
|
|
7,700 |
|
|
|
2,888 |
|
|
|
— |
|
|
Purchase obligations |
|
21,825 |
|
|
|
6,950 |
|
|
|
14,875 |
|
|
|
— |
|
|
|
— |
|
|
Total |
$ |
158,542 |
|
|
$ |
13,585 |
|
|
$ |
30,024 |
|
|
$ |
82,806 |
|
|
$ |
32,127 |
|
|
|
|
|
|
|
|
|
|
|
|
|
|
|
|
|
|
|
|
|
|
|
(1) |
The amounts included in the table above represent principal maturities only. In 2017, we used a portion of the net proceeds from our initial public offering to repay $90.0 million of such borrowings and paid the related prepayment premium of approximately $1.4 million. |
|
(2) |
Amounts represent estimated future interest payments on borrowings under our term loan facility, which are floating rate instruments and were estimated using the interest rate effective at December 31, 2017 of approximately 5.5% multiplied by the principal outstanding on December 31, 2017. |
Critical Accounting Policies and Estimates
Our consolidated financial statements are prepared in accordance with GAAP. The preparation of these financial statements requires our management to make estimates and assumptions that affect the reported amounts of assets, liabilities, revenue, costs, and expenses and related disclosures. Our estimates are based on our historical experience and on various other factors that we believe are reasonable under the circumstances, the results of which form the basis for making judgments about the carrying value of assets and liabilities that are not readily apparent from other sources. Actual results may differ from these judgments and estimates under different assumptions or conditions and any such differences may be material. To the extent that there are differences between our estimates and actual results, our future financial statement presentation, financial condition, results of operations and cash flows will be effected.
We believe that the accounting policies associated with revenue recognition, share-based compensation and income taxes are most significant areas involving management's judgments and estimates. Therefore, these are considered to be our critical accounting policies and estimates. For further information on all of our significant accounting policies, see Note 2 of our accompanying Notes to Consolidated Financial Statements included in Part II, Item 8 of this Annual Report on Form 10-K.
Revenue Recognition
We recognize revenue from the following sources: (i) fees for licenses, (ii) ongoing maintenance of our licensed products and subscription fees for access to our cloud-based offering and related support and (iii) fees for consulting with our customers on configuring and optimizing the use of our products and subscription services and training services related to the implementation and configuration of our platform.
We recognize revenue net of sales taxes and other applicable taxes, in accordance with GAAP, when all of the following criteria are met: there is persuasive evidence of an arrangement, delivery has occurred or service has been performed, the fee is fixed or determinable, and collectability is probable.
71
When non-software arrangements involve multiple elements that qualify as separate units of accounting, we allocate revenue to each deliverable based upon its relative selling price. The estimated selling price for each element is based upon the following hierarchy: (i) vendor-specific objective evidence (“VSOE”) of selling price, if available; (ii) third-party evidence (“TPE”) of selling price, if VSOE of selling price is not available; or (iii) best estimate of selling price (“ESP”), if neither VSOE of selling price nor TPE of selling price is available. When software arrangements involve multiple elements that qualify as separate units of accounting, we allocate revenue to each element based on VSOE.
We frequently enter into sales arrangements that contain multiple elements or deliverables. For arrangements that include both software and non-software elements, we allocate revenue to the software deliverables as a group and separable non-software deliverables as a group based on their relative selling prices. In such circumstances, the accounting principles establish a hierarchy to determine the selling price used for allocating revenue to the deliverables as follows: (i) VSOE, (ii) TPE and (iii) ESP. Cloud-based services, and professional services related to cloud-based services, are considered to be non-software elements in our arrangements.
VSOE of fair value for each element is based on our standard rates charged for the product or service when such product or service is sold separately or based upon the price established by our pricing committee when that product or service is not yet being sold separately. We establish VSOE for maintenance and professional services using a “bell-shaped curve” approach. When applying the “bell-shaped curve” approach, we analyze all maintenance renewal transactions over the past 12 months for that category of license and plot those data points on a bell-shaped curve to ensure that a high percentage of the data points are within an acceptable margin of the established VSOE rate. This analysis is performed quarterly on a rolling 12-month basis.
When we are unable to establish a selling price for non-software arrangements using VSOE or TPE, we use ESP in the allocation of arrangement consideration. The objective of BESP is to determine the price at which we would transact a sale if the product or service were sold on a stand-alone basis. The determination of BESP is made through consultation with and formal approval by our management, taking into consideration the go-to-market strategy, pricing factors and analysis of historical transactions.
Revenue for software arrangements that include undelivered elements is recognized using the residual method. Under the residual method, the fair value of the undelivered elements for which we have established VSOE is deferred and recognized as delivered to the customer and the remaining portion of the agreement fee is recognized as license revenue upon delivery. The determination of fair value of each undelivered element in software arrangements is based on VSOE. If VSOE has not been established for certain undelivered elements in an agreement, revenue is deferred until those elements have been delivered or their VSOE has been determined.
Revenue from maintenance and SaaS services is recognized ratably over the relevant contract period.
Services revenue includes fees from consulting and training services. Consulting and training services are judged to not be essential to the functionality of our software and SaaS offerings, are listed separately in arrangements, are optional, and are sold separately. As a result, the Company has established VSOE or ESP for consulting and training services and they therefore qualify for separate accounting.
In order to account for deliverables in some multiple-deliverable arrangements as separate units of accounting, delivered elements must have standalone value. In determining whether professional services have standalone value, we consider the following factors for each professional services agreement: availability of the services from other vendors, the nature of the professional services, the timing of when the professional services contract was signed in comparison to the software or SaaS sale, and the contractual dependence of the sale on the customer’s satisfaction with the professional services. Professional services sold as part of SaaS arrangements generally qualify for separate accounting.
Consulting and training service revenue that qualifies for separate accounting is recognized as the services are performed using the proportional performance method for fixed fee consulting contracts, or when the right to the service expires. Many of our consulting contracts are billed on a time and materials basis.
72
Customer advances and billed amounts due from customers in excess of revenue recognized are recorded as deferred revenue.
Stock-based Compensation
We recognize compensation costs related to equity awards, including stock options and incentive units, granted based on the estimated fair value of the awards on the date of grant, net of estimated forfeitures. We estimate the grant date fair value, and the resulting stock-based compensation expense, using the Black-Scholes option-pricing model. The grant date fair value of stock-based awards is expensed on a straight-line basis over the period during which the employee is required to provide service in exchange for the award (generally the vesting period).
The Black-Scholes option-pricing model requires the input of highly subjective assumptions. Our assumptions are as follows:
|
|
• |
Expected volatility. As we have been a public company for a limited amount of time and do not have a sufficient trading history for our common stock, the expected stock price volatility for our common stock is estimated by taking the average historical price volatility for industry peers over a period equivalent to the expected term of the stock option grants. We intend to continue to consistently apply this process until a sufficient amount of historical information regarding the volatility of our own common stock share price becomes available. |
|
|
• |
Risk-free interest rate. The risk-free interest rate is based on the yields of U.S. Treasury securities with maturities similar to the expected term of the options for each option group. |
|
|
• |
Expected dividend yield. We have never declared or paid any cash dividends to common stockholders and do not presently plan to pay cash dividends in the foreseeable future. Consequently, we use an expected dividend yield of zero. |
|
|
• |
Expected term. The expected term represents the period that our stock-based awards are expected to be outstanding. As we do not have sufficient historical experience for determining the expected term of the stock option awards granted, we base our expected term for awards issued to employees or members of our board of directors on the simplified method, which represents the average period from vesting to the expiration of the stock option. |
In addition to the assumptions used in the Black-Scholes option-pricing model, we also estimate a forfeiture rate to calculate the stock-based compensation for our equity awards. We will continue to use judgment in evaluating the expected volatility, expected terms and forfeiture rates used for our stock-based compensation calculations on a prospective basis.
We analyze the facts and circumstances of each equity instrument to determine if modification accounting is required. This analysis includes a review of factors that influence the probability of vesting. If circumstances arise that have changed the probability that an equity instrument will vest, or other factors have triggered a modification, the revised fair value is calculated, and additional stock-based compensation is recognized over the remaining service period of the modified option.
Historically, for all periods prior to our initial public offering, the fair values of the shares of common stock underlying our stock-based awards were estimated on each grant date by our board of directors. In order to determine the fair value of our common stock underlying option grants, our board of directors considered, among other things, enterprise value of comparable public companies evaluated on a quarterly basis and the overall market and economic environment.
For stock awards after the completion of our initial public offering, our board of directors determines the fair value of each share of underlying common stock based on the closing price of our common stock as reported on the date of grant.
73
We are subject to federal, state and local taxes in the United States as well as in other tax jurisdictions or countries in which we conduct business. Earnings from our non-U.S. activities are subject to local country income tax and may be subject to current federal and state income tax in the United States.
We account for uncertain tax positions based on those positions taken or expected to be taken in a tax return. We determine if the amount of available support indicates that it is more likely than not that the tax position will be sustained on audit, including resolution of any related appeals or litigation processes. We then measure the tax benefit as the largest amount that is more than 50% likely to be realized upon settlement. We adjust reserves for our uncertain tax positions due to changing facts and circumstances. To the extent that the final outcome of these matters is different than the amounts recorded, such differences will impact our tax provision in our consolidated statements of operations in the period in which such determination is made.
As of December 31, 2017, we had deferred tax assets of approximately $5.6 million, primarily comprised of our net operating loss carryforwards. We have a full valuation allowance for net deferred tax assets, including net operating loss carryforwards, and tax credits related primarily to research and development for our operations in the United States. We will continue to assess the need for a valuation allowance on our deferred tax assets by evaluating both positive and negative evidence that may exist. Any adjustment to the deferred tax asset valuation allowance would be recorded in the periods in which the adjustment is determined to be required.
Goodwill
Goodwill represents the excess of acquisition cost over the fair value of net tangible and identified net assets acquired. Goodwill and intangible assets that have indefinite lives are not be amortized, but rather tested for impairment annually, or more often if and when events or circumstances indicate that the carrying value may not be recoverable. We have determined that we operate as one reporting unit and may first assess qualitative factors to determine whether the existence of events or circumstances leads to a determination that it is “more likely than not” that the fair value of the reporting unit is less than its carrying amount and whether the two-step impairment test on goodwill is required. Goodwill is tested using a two-step process. The first step of the goodwill impairment test, used to identify potential impairment, compares the fair value of a reporting unit with its carrying amount, including goodwill. If the fair value of a reporting unit exceeds its carrying amount, goodwill of the reporting unit is considered not impaired, and thus the second step of the impairment test is unnecessary. If the carrying amount of a reporting unit exceeds its fair value, the second step of the goodwill impairment test shall be performed to measure the amount of impairment loss, if any. The second step of the goodwill impairment test, used to measure the amount of impairment loss, compares the implied fair value of reporting unit goodwill with the carrying amount of that goodwill. If the carrying amount of reporting unit goodwill exceeds the implied fair value of that goodwill, an impairment loss shall be recognized in an amount equal to the excess. The loss recognized cannot exceed the carrying amount of goodwill. After a goodwill impairment loss is recognized, the adjusted carrying amount of goodwill shall be its new accounting basis. If the implied fair value of goodwill is less than the carrying value of goodwill, an impairment loss is recognized equal to the difference. There were no impairments of goodwill during the years ended December 31, 2017, 2016 and 2015, and our reporting unit is not at risk of failing step one of the goodwill impairment test.
In 2017, we elected to change the annual assessment date for goodwill and indefinite lived intangible assets from December 31st to October 31st because the change in date creates synergy and enhance the quality of our indefinite lived intangible assets impairment analysis.
74
The Jumpstart Our Business Startups Act (“JOBS”) Act Accounting Election
We are an emerging growth company, as defined in the JOBS Act. Under the JOBS Act, emerging growth companies can delay adopting new or revised accounting standards issued subsequent to the enactment of the JOBS Act until such time as those standards apply to private companies. We have elected to take advantage of all of the reduced reporting requirements and exemptions, including the longer phase-in periods for the adoption of new or revised financial accounting standards, until we are no longer an emerging growth company. Our election to use the phase-in periods permitted by this election may make it difficult to compare our financial statements to those of non-emerging growth companies and other emerging growth companies that have opted out of the longer phase-in periods under the JOBS Act and who will comply with new or revised financial accounting standards. If we were to subsequently elect to instead comply with these public company effective dates, such election would be irrevocable pursuant to the JOBS Act.
Recent Accounting Pronouncements
For a description of our recently adopted accounting pronouncements and recently issued accounting standards not yet adopted, see Note 2 of our accompanying Notes to Consolidated Financial Statements included in Part II, Item 8 of this Annual Report on Form 10-K.
Item 7A. Quantitative and Qualitative Disclosures About Market Risk.
We are exposed to market risk in the ordinary course of our business. Market risk represents the risk of loss that may impact our financial position due to adverse changes in financial market prices and rates. Our market risk exposure is primarily a result of fluctuations in foreign currency exchange rates and interest rates and inflation. We do not hold or issue financial instruments for trading purposes.
Interest Rate Risk
We had cash and cash equivalents of $116.1 million and $18.2 million as of December 31, 2017 and 2016, respectively. Our cash and cash equivalents are held in cash deposits and money market funds. Due to the short-term nature of these instruments, we do not believe that we have any material exposure to changes in the fair value of our investment portfolio as a result of changes in interest rates.
At December 31, 2017, we also had in place a $7.5 million revolving credit facility, which was undrawn but limited by $6.1 million in standby letters of credit, and a $70.0 million term loan facility, both of which bear interest based on the adjusted LIBOR rate, as defined in the credit agreement with a 1% floor, plus an applicable margin of 4.5%. A hypothetical 10% change in interest rates would not have resulted in a material impact on our consolidated financial statements.
We did not have any current investments in marketable securities as of December 31, 2017, 2016 or 2015.
Foreign Currency Exchange Risk
Our reporting currency is the U.S. dollar. Due to our international operations, we have foreign currency risks related to operating expense denominated in currencies other than the U.S. dollar, primarily the Euro, British Pound, Israeli Shekel and the Indian Rupee. As of December 31, 2017 and 2016, our cash and cash equivalents included $3.2 million and $0.9 million, respectively, held in currencies other than the U.S. dollar. Decreases in the relative value of the U.S. dollar to other currencies may negatively affect our operating results as expressed in U.S. dollars. These amounts are included in other expense, net on our consolidated statements of operations.
75
Our results of operations and cash flows are subject to fluctuations due to changes in foreign currency exchange rates because, although substantially all of our revenue is generated in U.S. dollars, our expenses are generally denominated in the currencies of the jurisdictions in which we conduct our operations, which are primarily in the United States, Europe and Asia. Our results of operations and cash flows could therefore be adversely affected in the future due to changes in foreign exchange rates. We do not believe that an immediate 10% increase or decrease in the relative value of the U.S. dollar to other currencies would have a material effect on our results of operations or cash flows, and to date, we have not engaged in any hedging strategies with respect to foreign currency transactions. As our international operations grow, we will continue to reassess our approach to manage our risk relating to fluctuations in currency rates, and we may choose to engage in the hedging of foreign currency transactions in the future.
Inflation Risk
We do not believe that inflation has had a material effect on our business, financial condition or results of operations in 2017, 2016 or 2015 because substantially all of our sales are denominated in U.S. dollars, which have not been subject to material currency inflation, and our operating expenses that are denominated in currencies other than U.S. dollars have not been subject to material currency inflation.
76
Item 8. Financial Statements and Supplementary Data.
INDEX TO CONSOLIDATED FINANCIAL STATEMENTS
77
REPORT OF INDEPENDENT REGISTERED PUBLIC ACCOUNTING FIRM
Board of Directors and Shareholders
SailPoint Technologies Holdings, Inc.
Opinion on the financial statements
We have audited the accompanying consolidated balance sheets of SailPoint Technologies Holdings, Inc. (a Delaware corporation) and subsidiaries (the “Company”) as of December 31, 2017 and 2016, the related consolidated statements of operations, redeemable convertible preferred stock and stockholders’ equity (deficit), and cash flows for each of the three years in the period ended December 31, 2017, and the related notes (collectively referred to as the “financial statements”). In our opinion, the financial statements present fairly, in all material respects, the financial position of the Company as of December 31, 2017 and 2016, and the results of its operations and its cash flows for each of the three years in the period ended December 31, 2017, in conformity with accounting principles generally accepted in the United States of America.
Basis for opinion
These financial statements are the responsibility of the Company’s management. Our responsibility is to express an opinion on the Company’s financial statements based on our audits. We are a public accounting firm registered with the Public Company Accounting Oversight Board (United States) (“PCAOB”) and are required to be independent with respect to the Company in accordance with the U.S. federal securities laws and the applicable rules and regulations of the Securities and Exchange Commission and the PCAOB.
We conducted our audits in accordance with the standards of the PCAOB. Those standards require that we plan and perform the audit to obtain reasonable assurance about whether the financial statements are free of material misstatement, whether due to error or fraud. The Company is not required to have, nor were we engaged to perform, an audit of its internal control over financial reporting. As part of our audits we are required to obtain an understanding of internal control over financial reporting but not for the purpose of expressing an opinion on the effectiveness of the Company’s internal control over financial reporting. Accordingly, we express no such opinion.
Our audits included performing procedures to assess the risks of material misstatement of the financial statements, whether due to error or fraud, and performing procedures that respond to those risks. Such procedures included examining, on a test basis, evidence supporting the amounts and disclosures in the financial statements. Our audits also included evaluating the accounting principles used and significant estimates made by management, as well as evaluating the overall presentation of the financial statements. We believe that our audits provide a reasonable basis for our opinion.
GRANT THORNTON LLP
/s/ GRANT THORNTON LLP
We have served as the Company’s auditor since 2010.
Denver, Colorado
March 19, 2018
78
Sailpoint technologies Holding, Inc. and subsidiaries
Consolidated Balance Sheets
|
|
|
As of December 31, |
|
|||||
|
|
|
2017 |
|
|
2016 |
|
||
|
|
|
(In thousands, except share data) |
|
|||||
|
Assets |
|
|
|
|
|
|
|
|
|
Current assets |
|
|
|
|
|
|
|
|
|
Cash and cash equivalents |
|
$ |
116,049 |
|
|
$ |
18,214 |
|
|
Restricted cash |
|
|
78 |
|
|
|
58 |
|
|
Accounts receivable |
|
|
72,907 |
|
|
|
48,791 |
|
|
Prepayments and other current assets |
|
|
10,013 |
|
|
|
7,694 |
|
|
Total current assets |
|
|
199,047 |
|
|
|
74,757 |
|
|
Property and equipment, net |
|
|
3,018 |
|
|
|
1,855 |
|
|
Deferred tax asset - non-current |
|
|
264 |
|
|
|
428 |
|
|
Other non-current assets |
|
|
3,542 |
|
|
|
980 |
|
|
Goodwill |
|
|
219,377 |
|
|
|
219,377 |
|
|
Intangible assets, net |
|
|
81,185 |
|
|
|
90,013 |
|
|
Total assets |
|
$ |
506,433 |
|
|
$ |
387,410 |
|
|
Liabilities, redeemable convertible preferred stock and stockholders’ equity (deficit) |
|
|
|
|
|
|
|
|
|
Current liabilities |
|
|
|
|
|
|
|
|
|
Accounts payable |
|
$ |
2,231 |
|
|
$ |
787 |
|
|
Accrued expenses and other liabilities |
|
|
22,636 |
|
|
|
13,105 |
|
|
Income taxes payable |
|
|
1,688 |
|
|
|
818 |
|
|
Deferred revenue |
|
|
73,671 |
|
|
|
49,850 |
|
|
Total current liabilities |
|
|
100,226 |
|
|
|
64,560 |
|
|
Deferred tax liability - non-current |
|
|
— |
|
|
|
95 |
|
|
Long-term debt |
|
|
68,329 |
|
|
|
107,344 |
|
|
Other long-term liabilities |
|
|
27 |
|
|
|
54 |
|
|
Deferred revenue non-current |
|
|
9,454 |
|
|
|
5,254 |
|
|
Total liabilities |
|
|
178,036 |
|
|
|
177,307 |
|
|
Commitments and contingencies (Note 7) |
|
|
|
|
|
|
|
|
|
Redeemable convertible preferred stock authorized: no shares at December 31, 2017 and 500,000 shares at December 31, 2016. Preferred, $0.0001 par value, issued and outstanding no shares at December 31, 2017 and 223,987 shares at December 31, 2016 |
|
|
— |
|
|
|
223,987 |
|
|
Stockholders’ equity (deficit) |
|
|
|
|
|
|
|
|
|
Common stock, $0.0001 par value, authorized 300,000,000 shares at December 31, 2017 and 59,500,000 shares at December 31, 2016, issued and outstanding 84,948,126 shares at December 31, 2017 and 46,397,369 shares at December 31, 2016 |
|
|
8 |
|
|
|
5 |
|
|
Preferred stock, $0.0001 par value, authorized 10,000,000 shares at December 2017 and no shares at December 31, 2016, no issued and outstanding shares at December 31, 2017 and December 31, 2016 |
|
|
— |
|
|
|
— |
|
|
Treasury stock, at cost; no shares at December 31, 2017 and December 31, 2016 |
|
|
— |
|
|
|
— |
|
|
Additional paid in capital |
|
|
353,609 |
|
|
|
3,739 |
|
|
Accumulated deficit |
|
|
(25,220 |
) |
|
|
(17,628 |
) |
|
Total stockholders' equity (deficit) |
|
|
328,397 |
|
|
|
(13,884 |
) |
|
Total redeemable convertible preferred stock and stockholders’ equity (deficit) |
|
|
328,397 |
|
|
|
210,103 |
|
|
Total liabilities, redeemable convertible preferred stock and stockholders’ equity (deficit) |
|
$ |
506,433 |
|
|
$ |
387,410 |
|
See accompanying notes to consolidated financial statements.
79
Sailpoint technologies Holding, Inc. and subsidiaries
Consolidated Statements of Operations
|
|
|
Years Ended December 31, |
|
|||||||||
|
|
|
2017 |
|
|
2016 |
|
|
2015 |
|
|||
|
|
|
(In thousands, except share data) |
|
|||||||||
|
Revenue |
|
|
|
|
|
|
|
|
|
|
|
|
|
Licenses |
|
$ |
79,209 |
|
|
$ |
54,395 |
|
|
$ |
44,124 |
|
|
Subscription |
|
|
71,007 |
|
|
|
49,364 |
|
|
|
29,930 |
|
|
Services and other |
|
|
35,840 |
|
|
|
28,653 |
|
|
|
21,302 |
|
|
Total revenue |
|
|
186,056 |
|
|
|
132,412 |
|
|
|
95,356 |
|
|
Cost of revenue |
|
|
|
|
|
|
|
|
|
|
|
|
|
Licenses |
|
|
4,561 |
|
|
|
4,278 |
|
|
|
4,293 |
|
|
Subscription |
|
|
16,406 |
|
|
|
13,051 |
|
|
|
9,815 |
|
|
Services and other |
|
|
23,623 |
|
|
|
19,709 |
|
|
|
15,151 |
|
|
Total cost of revenue |
|
|
44,590 |
|
|
|
37,038 |
|
|
|
29,259 |
|
|
Gross profit |
|
|
141,466 |
|
|
|
95,374 |
|
|
|
66,097 |
|
|
Operating expenses |
|
|
|
|
|
|
|
|
|
|
|
|
|
Research and development |
|
|
33,331 |
|
|
|
24,358 |
|
|
|
19,965 |
|
|
General and administrative |
|
|
17,678 |
|
|
|
9,680 |
|
|
|
7,474 |
|
|
Sales and marketing |
|
|
80,514 |
|
|
|
58,607 |
|
|
|
46,831 |
|
|
Total operating expenses |
|
|
131,523 |
|
|
|
92,645 |
|
|
|
74,270 |
|
|
Income (loss) from operations |
|
|
9,943 |
|
|
|
2,729 |
|
|
|
(8,173 |
) |
|
Other expense, net: |
|
|
|
|
|
|
|
|
|
|
|
|
|
Interest expense, net |
|
|
(14,783 |
) |
|
|
(7,277 |
) |
|
|
(3,883 |
) |
|
Other, net |
|
|
(459 |
) |
|
|
(610 |
) |
|
|
(1,365 |
) |
|
Total other expense, net |
|
|
(15,242 |
) |
|
|
(7,887 |
) |
|
|
(5,248 |
) |
|
Loss before income taxes |
|
|
(5,299 |
) |
|
|
(5,158 |
) |
|
|
(13,421 |
) |
|
Income tax (expense) benefit |
|
|
(2,293 |
) |
|
|
1,985 |
|
|
|
2,614 |
|
|
Net loss |
|
$ |
(7,592 |
) |
|
$ |
(3,173 |
) |
|
$ |
(10,807 |
) |
|
Net loss available to common shareholders |
|
$ |
(28,721 |
) |
|
$ |
(26,791 |
) |
|
$ |
(32,404 |
) |
|
Net loss per share |
|
|
|
|
|
|
|
|
|
|
|
|
|
Basic |
|
$ |
(0.55 |
) |
|
$ |
(0.58 |
) |
|
$ |
(0.74 |
) |
|
Diluted |
|
$ |
(0.55 |
) |
|
$ |
(0.58 |
) |
|
$ |
(0.74 |
) |
|
Weighted average shares outstanding |
|
|
|
|
|
|
|
|
|
|
|
|
|
Basic |
|
|
52,339,804 |
|
|
|
45,933,218 |
|
|
|
43,929,159 |
|
|
Diluted |
|
|
52,339,804 |
|
|
|
45,933,218 |
|
|
|
43,929,159 |
|
See accompanying notes to consolidated financial statements.
80
Sailpoint technologies Holding, Inc. and subsidiaries
Consolidated Statements of Redeemable Convertible Preferred Stock and
Stockholders’ Equity (Deficit)
|
|
Redeemable Convertible Preferred Stock |
|
|
|
Common Stock |
|
|
Treasury Stock |
|
|
Additional |
|
|
|
|
|
|
Stockholders |
|
|||||||||||||||||
|
|
Number of shares |
|
|
Amount |
|
|
|
Number of shares |
|
|
Par value |
|
|
Number of shares |
|
|
Amount |
|
|
paid-in capital |
|
|
Accumulated deficit |
|
|
equity (deficit) |
|
|||||||||
|
|
|
|
|
|
(In thousands, except share data) |
|
||||||||||||||||||||||||||||||
|
Balance at December 31, 2014 |
|
223,084 |
|
|
$ |
223,084 |
|
|
|
|
43,580,028 |
|
|
$ |
4 |
|
|
|
— |
|
|
$ |
— |
|
|
$ |
2,249 |
|
|
$ |
(3,648 |
) |
|
$ |
(1,395 |
) |
|
Issuance of preferred and common stock |
|
248 |
|
|
|
248 |
|
|
|
|
48,349 |
|
|
|
— |
|
|
|
— |
|
|
|
— |
|
|
|
59 |
|
|
|
— |
|
|
|
59 |
|
|
Repurchase of preferred and common stock |
|
(434 |
) |
|
|
(434 |
) |
|
|
|
(84,808 |
) |
|
|
— |
|
|
|
— |
|
|
|
— |
|
|
|
(24 |
) |
|
|
— |
|
|
|
(24 |
) |
|
Stock-based compensation expense, net |
|
— |
|
|
|
— |
|
|
|
|
— |
|
|
|
— |
|
|
|
— |
|
|
|
— |
|
|
|
246 |
|
|
|
— |
|
|
|
246 |
|
|
Incentive units vested |
|
— |
|
|
|
— |
|
|
|
|
1,192,731 |
|
|
|
— |
|
|
|
— |
|
|
|
— |
|
|
|
62 |
|
|
|
— |
|
|
|
62 |
|
|
Net loss |
|
— |
|
|
|
— |
|
|
|
|
— |
|
|
|
— |
|
|
|
— |
|
|
|
— |
|
|
|
— |
|
|
|
(10,807 |
) |
|
|
(10,807 |
) |
|
Balance at December 31, 2015 |
|
222,898 |
|
|
$ |
222,898 |
|
|
|
|
44,736,300 |
|
|
$ |
4 |
|
|
|
— |
|
|
$ |
— |
|
|
$ |
2,592 |
|
|
$ |
(14,455 |
) |
|
$ |
(11,859 |
) |
|
Issuance of preferred and common stock, net |
|
1,263 |
|
|
|
1,263 |
|
|
|
|
36,079 |
|
|
|
— |
|
|
|
— |
|
|
|
— |
|
|
|
66 |
|
|
|
— |
|
|
|
66 |
|
|
Repurchase of preferred and common stock |
|
(174 |
) |
|
|
(174 |
) |
|
|
|
(62,402 |
) |
|
|
— |
|
|
|
— |
|
|
|
— |
|
|
|
(52 |
) |
|
|
— |
|
|
|
(52 |
) |
|
Exercise of stock options |
|
— |
|
|
|
— |
|
|
|
|
10,568 |
|
|
|
— |
|
|
|
— |
|
|
|
— |
|
|
|
18 |
|
|
|
— |
|
|
|
18 |
|
|
Capital contribution |
|
— |
|
|
|
— |
|
|
|
|
— |
|
|
|
— |
|
|
|
— |
|
|
|
— |
|
|
|
459 |
|
|
|
— |
|
|
|
459 |
|
|
Stock-based compensation expense, net |
|
— |
|
|
|
— |
|
|
|
|
— |
|
|
|
— |
|
|
|
— |
|
|
|
— |
|
|
|
568 |
|
|
|
— |
|
|
|
568 |
|
|
Incentive units vested |
|
— |
|
|
|
— |
|
|
|
|
1,676,824 |
|
|
|
1 |
|
|
|
— |
|
|
|
— |
|
|
|
88 |
|
|
|
— |
|
|
|
89 |
|
|
Net loss |
|
— |
|
|
|
— |
|
|
|
|
— |
|
|
|
— |
|
|
|
— |
|
|
|
— |
|
|
|
— |
|
|
|
(3,173 |
) |
|
|
(3,173 |
) |
|
Balance at December 31, 2016 |
|
223,987 |
|
|
$ |
223,987 |
|
|
|
|
46,397,369 |
|
|
$ |
5 |
|
|
|
— |
|
|
$ |
— |
|
|
$ |
3,739 |
|
|
$ |
(17,628 |
) |
|
$ |
(13,884 |
) |
|
Issuance of preferred and common stock, net |
|
— |
|
|
|
— |
|
|
|
|
15,800,000 |
|
|
|
1 |
|
|
|
— |
|
|
|
— |
|
|
|
171,979 |
|
|
|
— |
|
|
|
171,980 |
|
|
Conversion of preferred stock to common stock upon initial public offering |
|
(223,816 |
) |
|
|
(173,429 |
) |
|
|
|
20,500,400 |
|
|
|
2 |
|
|
|
— |
|
|
|
— |
|
|
|
173,427 |
|
|
|
— |
|
|
|
173,429 |
|
|
Repurchase of preferred and common stock |
|
(171 |
) |
|
|
(171 |
) |
|
|
|
— |
|
|
|
— |
|
|
|
190,434 |
|
|
|
(487 |
) |
|
|
— |
|
|
|
— |
|
|
|
(487 |
) |
|
Exercise of stock options |
|
— |
|
|
|
— |
|
|
|
|
160,680 |
|
|
|
— |
|
|
|
— |
|
|
|
— |
|
|
|
359 |
|
|
|
— |
|
|
|
359 |
|
|
Preferred dividend payment |
|
— |
|
|
|
(50,387 |
) |
|
|
|
— |
|
|
|
— |
|
|
|
— |
|
|
|
— |
|
|
|
— |
|
|
|
— |
|
|
|
|
|
|
Treasury stock activity |
|
— |
|
|
|
— |
|
|
|
|
(112,772 |
) |
|
|
— |
|
|
|
(190,434 |
) |
|
|
487 |
|
|
|
(487 |
) |
|
|
— |
|
|
|
— |
|
|
Stock-based compensation expense, net |
|
— |
|
|
|
— |
|
|
|
|
— |
|
|
|
— |
|
|
|
— |
|
|
|
— |
|
|
|
4,514 |
|
|
|
— |
|
|
|
4,514 |
|
|
Incentive units vested |
|
— |
|
|
|
— |
|
|
|
|
2,202,449 |
|
|
|
— |
|
|
|
— |
|
|
|
— |
|
|
|
78 |
|
|
|
— |
|
|
|
78 |
|
|
Net loss |
|
— |
|
|
|
— |
|
|
|
|
— |
|
|
|
— |
|
|
|
— |
|
|
|
— |
|
|
|
— |
|
|
|
(7,592 |
) |
|
|
(7,592 |
) |
|
Balance at December 31, 2017 |
|
— |
|
|
$ |
— |
|
|
|
|
84,948,126 |
|
|
$ |
8 |
|
|
|
— |
|
|
$ |
— |
|
|
$ |
353,609 |
|
|
$ |
(25,220 |
) |
|
$ |
328,397 |
|
See accompanying notes to consolidated financial statements.
81
Sailpoint technologies Holding, Inc. and subsidiaries
Consolidated Statements of Cash Flows
|
|
|
Years Ended December 31, |
|
|||||||||
|
|
|
2017 |
|
|
2016 |
|
|
2015 |
|
|||
|
|
|
(In thousands) |
|
|||||||||
|
Operating activities |
|
|
|
|
|
|
|
|
|
|
|
|
|
Net loss |
|
$ |
(7,592 |
) |
|
$ |
(3,173 |
) |
|
$ |
(10,807 |
) |
|
Adjustments to reconcile net loss to net cash provided by operating activities: |
|
|
|
|
|
|
|
|
|
|
|
|
|
Depreciation and amortization expense |
|
|
10,220 |
|
|
|
9,982 |
|
|
|
9,620 |
|
|
Amortization of loan origination fees |
|
|
746 |
|
|
|
749 |
|
|
|
140 |
|
|
(Loss) gain on disposal of fixed assets |
|
|
(20 |
) |
|
|
5 |
|
|
|
15 |
|
|
Loss on modification and partial extinguishment of debt |
|
|
1,702 |
|
|
|
— |
|
|
|
— |
|
|
Stock-based compensation expense |
|
|
4,514 |
|
|
|
568 |
|
|
|
246 |
|
|
Deferred taxes |
|
|
69 |
|
|
|
(2,537 |
) |
|
|
(3,326 |
) |
|
Changes in operating assets and liabilities, net of acquisition: |
|
|
|
|
|
|
|
|
|
|
|
|
|
Accounts receivable |
|
|
(24,116 |
) |
|
|
(17,245 |
) |
|
|
(5,252 |
) |
|
Prepayments and other current assets |
|
|
(2,174 |
) |
|
|
(2,779 |
) |
|
|
(1,173 |
) |
|
Other non-current assets |
|
|
(2,453 |
) |
|
|
(857 |
) |
|
|
97 |
|
|
Accounts payable |
|
|
1,443 |
|
|
|
(262 |
) |
|
|
(640 |
) |
|
Accrued expenses and other liabilities |
|
|
10,882 |
|
|
|
1,712 |
|
|
|
3,068 |
|
|
Income taxes payable (receivable) |
|
|
614 |
|
|
|
161 |
|
|
|
(56 |
) |
|
Deferred revenue |
|
|
28,021 |
|
|
|
20,216 |
|
|
|
11,628 |
|
|
Net cash provided by operating activities |
|
|
21,856 |
|
|
|
6,540 |
|
|
|
3,560 |
|
|
Investing activities |
|
|
|
|
|
|
|
|
|
|
|
|
|
Purchase of property and equipment |
|
|
(2,711 |
) |
|
|
(1,263 |
) |
|
|
(1,232 |
) |
|
Proceeds from sale of property and equipment |
|
|
190 |
|
|
|
8 |
|
|
|
133 |
|
|
Cash paid for acquisition, net of cash acquired |
|
|
— |
|
|
|
— |
|
|
|
(15,209 |
) |
|
Net cash used in investing activities |
|
|
(2,521 |
) |
|
|
(1,255 |
) |
|
|
(16,308 |
) |
|
Financing activities |
|
|
|
|
|
|
|
|
|
|
|
|
|
Proceeds from line of credit |
|
|
— |
|
|
|
— |
|
|
|
10,000 |
|
|
Repayments of line of credit |
|
|
— |
|
|
|
(10,000 |
) |
|
|
— |
|
|
Proceeds from term loan |
|
|
50,000 |
|
|
|
115,000 |
|
|
|
— |
|
|
Repayments of term loan |
|
|
(90,000 |
) |
|
|
(105,000 |
) |
|
|
— |
|
|
Prepayment penalty and fees |
|
|
(1,390 |
) |
|
|
— |
|
|
|
— |
|
|
Dividend payments |
|
|
(50,387 |
) |
|
|
— |
|
|
|
— |
|
|
Debt issuance costs |
|
|
(1,384 |
) |
|
|
(3,083 |
) |
|
|
— |
|
|
Proceeds from issuance of equity, net |
|
|
171,980 |
|
|
|
1,329 |
|
|
|
307 |
|
|
Repurchase of equity shares |
|
|
(658 |
) |
|
|
(226 |
) |
|
|
(458 |
) |
|
Exercise of stock options |
|
|
359 |
|
|
|
18 |
|
|
|
— |
|
|
Net cash provided by (used in) financing activities |
|
|
78,520 |
|
|
|
(1,962 |
) |
|
|
9,849 |
|
|
Increase (decrease) in cash |
|
|
97,855 |
|
|
|
3,323 |
|
|
|
(2,899 |
) |
|
Cash, cash equivalents and restricted cash, beginning of period |
|
|
18,272 |
|
|
|
14,949 |
|
|
|
17,848 |
|
|
Cash, cash equivalents and restricted cash, end of period |
|
$ |
116,127 |
|
|
$ |
18,272 |
|
|
$ |
14,949 |
|
|
|
|
|
|
|
|
|
|
|
|
|
|
|
|
Supplemental disclosure of cash flow information: |
|
|
|
|
|
|
|
|
|
|
|
|
|
Cash paid for interest |
|
$ |
16,628 |
|
|
$ |
5,848 |
|
|
$ |
3,648 |
|
|
Cash paid for income taxes |
|
$ |
1,612 |
|
|
$ |
406 |
|
|
$ |
771 |
|
|
Conversion of redeemable convertible preferred stock to common stock |
|
$ |
173,429 |
|
|
$ |
— |
|
|
$ |
— |
|
|
Conversion of prepaid incentive units to common stock (Note 10) |
|
$ |
78 |
|
|
$ |
89 |
|
|
$ |
62 |
|
|
Forgiveness of liability to controlling entity |
|
$ |
— |
|
|
$ |
459 |
|
|
$ |
— |
|
See accompanying notes to consolidated financial statements
82
Sailpoint technologies Holding, Inc. and subsidiaries
Notes to Consolidated Financial Statements
1. Organization and Description of Business
SailPoint Technologies Holdings, Inc., (“we”, “our” or “the Company”) was incorporated in the state of Delaware on August 8, 2014, in preparation for the purchase of SailPoint Technologies, Inc. The purchase occurred on September 8, 2014 and our certificate of incorporation was amended and restated as of such date. SailPoint Technologies, Inc. was formed July 14, 2004 as a Delaware corporation. The Company designs, develops, and markets identity governance software that helps organizations govern user access to critical systems and data. The Company currently markets its products and services throughout North America, Europe and the Asia Pacific regions.
2. Summary of Significant Accounting Policies
Basis of Presentation
The accompanying consolidated financial statements, which include the accounts of the Company and its wholly owned subsidiaries, have been prepared in conformity with accounting principles generally accepted in the United States of America (“GAAP”). The consolidated financial statements include the accounts of SailPoint Technologies Holdings, Inc. and its subsidiaries, SailPoint Technologies Intermediate Holdings, LLC, SailPoint Technologies, Inc., SailPoint Technologies UK LTD, SailPoint Holdings, Inc., SailPoint International, Inc., SailPoint Technologies India Private LTD, SailPoint Technologies Netherlands B.V., SailPoint Technologies Israel Ltd, SailPoint Technologies SARL, SailPoint Technologies GmbH, and SailPoint Technologies Pte. Ltd. and Whitebox Security Ltd. All intercompany accounts and transactions have been eliminated in consolidation.
The Company operates as one operating segment. The Company’s chief operating decision maker is its chief executive officer, who reviews financial information presented on a consolidated basis for purposes of making operating decisions, assessing financial performance and allocating resources.
Use of Estimates
The preparation of consolidated financial statements in conformity with GAAP requires management to make estimates and assumptions that affect the reported amounts of assets and liabilities and disclosure of contingent assets and liabilities at the date of the financial statements and the reported amounts of revenue and expenses during the reporting period. Management periodically evaluates such estimates and assumptions for continued reasonableness. In particular, we make estimates with respect to the fair value allocation of multiple elements in revenue recognition, the uncollectible accounts receivable, valuation of long-lived assets, stock-based compensation expense and income taxes. Appropriate adjustments, if any, to the estimates used are made prospectively based upon such periodic evaluation. Actual results could differ from those estimates.
Cash, Cash Equivalents and Restricted Cash
We consider all highly liquid investments with an original maturity of three months or less from date of purchase to be cash equivalents. The Company is required to maintain a small amount of restricted cash to guarantee rent payments in a foreign subsidiary.
|
|
|
As of December 31, |
|
|||||
|
|
2017 |
|
|
2016 |
|
|||
|
|
|
(In thousands) |
|
|||||
|
Cash and cash equivalents per balance sheet |
|
$ |
116,049 |
|
|
$ |
18,214 |
|
|
Restricted cash per balance sheet |
|
|
78 |
|
|
|
58 |
|
|
Cash, cash equivalents and restricted cash per cash flow |
|
$ |
116,127 |
|
|
$ |
18,272 |
|
83
Fair Value of Financial Instruments
Assets and liabilities recorded at fair value in the financial statements are categorized based upon the level of judgment associated with the inputs used to measure their fair value. Hierarchical levels which are directly related to the amount of subjectivity associated with the inputs to the valuation of these assets or liabilities are as follows:
|
|
• |
Level 1: Observable inputs that reflect quoted prices (unadjusted) for identical assets or liabilities in active markets. |
|
|
• |
Level 2: Observable inputs, other than Level 1 prices, such as quoted prices for similar assets or liabilities, quoted prices in markets that are not active or other inputs that are observable or can be corroborated by observable market data for substantially the full term of the assets or liabilities. |
|
|
• |
Level 3: Unobservable inputs reflecting our own assumptions incorporated in valuation techniques used to determine fair value. These assumptions are required to be consistent with market participant assumptions that are reasonably available. |
The Company’s carrying amounts of financial instruments, including cash and cash equivalents, accounts receivable, accounts payable, accrued expenses and related party payable approximate their fair values due to their short maturities. The carrying value of the Company’s line of credit and long-term debt approximate fair value and were valued using a Level 1 input, specifically the borrowing rates available to the Company at December 31, 2017 and 2016.
Concentration of Credit and Other Risks
Financial instruments that potentially subject the Company to concentrations of credit risk consist of cash and cash equivalents and accounts receivable. The Company maintains its cash in bank deposit accounts that, at times, may exceed federally insured limits. There is no concentration of credit risk for customers as no individual entity represented more than 10% of the balance in accounts receivable as of December 31, 2017 and 2016 or 10% of revenue in the years ended December 31, 2017, 2016 and 2015. The Company does not experience concentration of credit risk in foreign countries as no foreign country represents more than 10% of the Company’s consolidated revenues or net assets.
The following tables sets forth the Company’s consolidated total revenue by geography:
|
|
|
Year Ended December 31, |
|
|||||||||
|
|
|
2017 |
|
|
2016 |
|
|
2015 |
|
|||
|
|
|
(In thousands) |
|
|||||||||
|
United States |
|
$ |
134,676 |
|
|
$ |
92,116 |
|
|
$ |
63,440 |
|
|
EMEA (1) |
|
|
33,097 |
|
|
|
25,668 |
|
|
|
20,770 |
|
|
Rest of the World (1) |
|
|
18,283 |
|
|
|
14,628 |
|
|
|
11,146 |
|
|
Total revenue |
|
$ |
186,056 |
|
|
$ |
132,412 |
|
|
$ |
95,356 |
|
|
(1) |
No single country represented more than 10% of consolidated revenue |
Accounts Receivable and Allowance for Doubtful Accounts
The Company continuously assesses the collectability of outstanding customer invoices and in doing so, the Company assesses the need to maintain an allowance for estimated losses resulting from the non-collection of customer receivables. In estimating this allowance, the Company considers factors such as: historical collection experience, a customer’s current creditworthiness, customer concentrations, age of outstanding balances, both individually and in the aggregate, and existing economic conditions. Actual customer collections could differ from the Company’s estimates. The Company determined that an allowance for doubtful accounts was not required for the periods presented.
84
Property and equipment, net, is stated at cost less accumulated depreciation. Depreciation is recorded using the straight-line method over the estimated useful lives of the respective assets, generally three to five years. Leasehold improvements are depreciated over the shorter of the useful lives of the assets or the related lease term. Repairs and maintenance costs are expensed as incurred.
Property and equipment are reviewed for impairment whenever events or circumstances indicate their carrying value may not be recoverable. When such events or circumstances arise, an estimate of future undiscounted cash flows produced by the asset, or the appropriate grouping of assets, is compared to the asset’s carrying value to determine if an impairment exists. If the asset is determined to be impaired, the impairment loss is measured based on the excess of its carrying value over its fair value. Assets to be disposed of are reported at the lower of carrying value or net realizable value. There was no impairment of property and equipment during the years ended December 31, 2017, 2016 and 2015.
Goodwill
Goodwill represents the excess of acquisition cost over the fair value of net tangible and identified net assets acquired. Goodwill and intangible assets that have indefinite lives are not be amortized, but rather tested for impairment annually, as of October 31, or more often if and when events or circumstances indicate that the carrying value may not be recoverable. Goodwill is tested using a two-step process. The first step of the goodwill impairment test, used to identify potential impairment, compares the fair value of a reporting unit with its carrying amount, including goodwill. If the fair value of a reporting unit exceeds its carrying amount, goodwill of the reporting unit is considered not impaired, thus the second step of the impairment test is unnecessary. If the carrying amount of a reporting unit exceeds its fair value, the second step of the goodwill impairment test shall be performed to measure the amount of impairment loss, if any. The second step of the goodwill impairment test, used to measure the amount of impairment loss, compares the implied fair value of reporting unit goodwill with the carrying amount of that goodwill. If the carrying amount of reporting unit goodwill exceeds the implied fair value of that goodwill, an impairment loss shall be recognized in an amount equal to the excess. The loss recognized cannot exceed the carrying amount of goodwill. After a goodwill impairment loss is recognized, the adjusted carrying amount of goodwill shall be its new accounting basis. If the implied fair value of goodwill is less than the carrying value of goodwill, an impairment loss is recognized equal to the difference. There were no impairments of goodwill during the years ended December 31, 2017, 2016 and 2015.
The Company elected to change the annual assessment date for goodwill and indefinite lived intangible assets from December 31st to October 31st because the change in date creates synergy and enhance the quality of our indefinite lived intangible assets impairment analysis. The Company conducted qualitative and quantitative assessment, for the 2017 annual impairment test, using the income, cost and market approach, using information as of October 31, 2017. The intent is to perform qualitative impairment test at least annually unless certain indicators or events suggest otherwise.
Intangible Assets
Intangible assets are amortized on a straight-line basis over their estimated useful lives. The Company periodically reviews the estimated remaining useful life of our intangible assets and whether events or changes in circumstances warrant a revision to the remaining period of amortization. Periodically, the Company evaluates the recoverability of its long-lived assets including intangible assets, for possible impairment whenever events or circumstances indicate that the carrying amount of such assets may not be recoverable. Recoverability of these assets is measured by comparison of the carrying amount of each asset, or related asset group, to the future undiscounted cash flows the asset is expected to generate. If the undiscounted cash flows used in the test for recoverability are less than the carrying amount of these assets, then the carrying amount of such assets is reduced to fair value. The Company did not record any impairments of long-lived assets including intangible assets as of December 31, 2017 and 2016.
85
Software development costs for products intended to be sold, leased or otherwise marketed are expensed as incurred until technological feasibility has been established, at which time such costs are capitalized until the product is available for general release to customers. Technological feasibility is established when a product design and working model have been completed and the completeness of the working model and its consistency with the product design have been confirmed by testing. To date, the establishment of technological feasibility of the Company’s products and general release of such software has substantially coincided. As a result, software development costs qualifying for capitalization have been insignificant. Therefore, we have not capitalized any software development costs through December 31, 2017. Such costs have been recorded as research and development expenses, as incurred, in the consolidated statements of operations.
Comprehensive income (loss)
The Company has not entered into transactions that require presentation as other comprehensive income (loss). Total comprehensive loss is equal to net loss for all periods presented.
Liquidity
The Company has sustained losses since its inception. The Company had cash, cash equivalents and restricted cash of approximately $116.1 million and an accumulated deficit of approximately $25.2 million at December 31, 2017. The Company has funded these losses through cash flows from operations, debt, issuance of common stock and other equity financings. The Company believes that working capital on hand, net operating cash flows, and increasing revenues are sufficient to sustain operations for at least the twelve months from the report issuance date.
Revenue Recognition
Revenue consists of fees for perpetual licenses for the Company’s software products, post-contract customer support (referred to as maintenance), professional services, software as a service (“SaaS”) and other revenue.
The Company recognizes revenue in accordance with the provisions of the Financial Accounting Standards Board (“FASB”) authoritative guidance on software revenue recognition and multiple element arrangements.
Revenue is recognized when:
|
|
• |
Persuasive evidence of an arrangement exists, |
|
|
• |
Delivery has occurred, or services have been rendered, |
|
|
• |
The Company’s price to the buyer is fixed or determinable, and |
|
|
• |
Collectability is probable |
The Company frequently enters into sales arrangements that contain multiple elements or deliverables. For arrangements that include both software and non-software elements, the Company allocates revenue to the software deliverables as a group and separable non-software deliverables as a group based on their relative selling prices. In such circumstances, the accounting principles establish a hierarchy to determine the selling price used for allocating revenue to the deliverables as follows: (i) Vendor Specific Objective Evidence (“VSOE”), (ii) third-party evidence of selling price (“TPE”) and (iii) the best estimate of the selling price (“ESP”). Cloud-based services, and professional services related to cloud-based services, are considered to be non-software elements in the Company’s arrangements.
VSOE of fair value for each element is based on the Company’s standard rates charged for the product or service when such product or service is sold separately or based upon the price established by the Company’s pricing committee when that product or service is not yet being sold separately. The Company establishes VSOE for maintenance and professional services using a “bell-shaped curve” approach. When applying the “bell-shaped curve” approach the Company analyzes all maintenance renewal transactions over the past twelve months for that category of license and plots those data points on a bell-shaped curve to ensure that a high percentage of the data points are within an acceptable margin of the established VSOE rate. This analysis is performed quarterly on a rolling 12-month basis.
86
When the Company is unable to establish a selling price for non-software arrangements using VSOE or TPE, the Company uses ESP in the allocation of arrangement consideration. The objective of ESP is to determine the price at which the Company would transact a sale if the product or service were sold on a stand-alone basis. The determination of ESP is made through consultation with and formal approval by the Company’s management, taking into consideration the Company’s go-to-market strategy, pricing factors, and historical transactions.
The Company recognizes revenue for software arrangements that include undelivered elements using the residual method. Under the residual method, the fair value of the undelivered elements is deferred and recognized as such elements are delivered to the customer and the remaining portion of the agreement fee is recognized as license revenue upon delivery. The determination of fair value of each undelivered element in software arrangements is based on VSOE. If VSOE has not been established for certain undelivered elements in an agreement, revenue is deferred until those elements have been delivered or their VSOE has been determined.
Revenue from maintenance and SaaS services is recognized ratably over the relevant contract period.
Service revenue includes consulting and training. The Company has determined that consulting and training services are not essential to the functionality of the Company’s software and SaaS offerings, and consulting and training services are typically listed separately in arrangements, are optional, and sold separately. As a result, the Company has established VSOE or ESP for consulting and training services and they therefore qualify for separate accounting.
In order to account for deliverables in a multiple-deliverable arrangement as separate unit of accounting, delivered elements must have standalone value. In determining whether professional services have standalone value, we consider the following factors for each professional services agreement: availability of the services from other vendors, the nature of the professional services, the timing of when the professional services contract was signed in comparison to the software or SaaS arrangement and the contractual dependence of the arrangement on the customer’s satisfaction with the professional services. Professional services sold as part of arrangements generally qualify for separate accounting.
Consulting and training service revenue that qualifies for separate accounting is recognized as the services are performed using the proportional performance method for fixed fee consulting contracts, or when the right to the service expires. The majority of the Company’s consulting contracts are billed on a time and materials basis.
Deferred Revenue
Deferred revenue represents amounts from the sale of products that have been billed for, but the transaction has not met our revenue recognition criteria. Amounts are classified between current and long-term liabilities, based upon the expected period in which the revenue will be recognized.
Customer advances and billed amounts due from customers in excess of revenue recognized are recorded as deferred revenue.
Cost of Revenue
Cost of revenue for license consists of amortization expense for developed technology acquired in business combinations and third-party royalties.
Cost of subscription revenue consists primarily of employee costs of our customer support organization (including salaries, benefits, bonuses and stock-based compensation), contractor costs to supplement our staff levels, third-party cloud-hosting costs, allocated overhead and amortization expense for developed technology acquired in business combinations.
Cost of revenue for services and other revenue consists primarily of personnel-related costs of our services and training departments, including salaries, commissions, benefits, bonuses and stock-based compensation, contractor costs to supplement our staff levels and allocated overhead.
87
Research and Development Expenses
Research and development costs are expensed as incurred. Research and development expenses consist primarily of personnel-related costs for the design and development of our platform and technologies, contractor costs to supplement our staff levels, third-party web services, consulting services, and allocated overhead.
Advertising Expenses
The Company expenses advertising costs as incurred. Advertising expenses were approximately $6.0 million and $4.2 million and $2.6 million for the years ended December 31, 2017, 2016 and 2015, respectively, and are included in sales and marketing expense.
Stock-Based Compensation
The Company measures stock-based compensation cost for equity instruments granted to employees based upon the estimated fair value of the award at the date of grant and the estimated number of shares ultimately expected to vest. The Company estimates the fair value of stock options granted using the Black-Scholes option-pricing model, which requires us to estimate expected term, fair value of common stock, expected volatility, risk-free interest rate, and dividend yield. We use the simplified method in developing an estimate of the expected term of the stock options, which is calculated as the average of the time to vesting and the contractual life of the options. The expected volatility is based upon the average historical volatility of comparable companies over a period approximately equal to the expected term of the awards. The risk-free interest rate is based on the average interest rate for U.S. Treasury instruments whose term is consistent with the expected term of the options.
Compensation cost resulting from this valuation is recognized in the consolidated statement of operations on a straight-line basis over the period during which an employee provides the requisite service in exchange for the award. The Company analyzes the facts and circumstances of each equity instrument to determine if modification accounting is required. This analysis includes a review of factors that influence the probability of vesting. If circumstances arise that have changed the probability that an equity instrument will vest, or other factors have triggered a modification, the revised fair value is calculated, and additional stock-based compensation is recognized over the remaining service period of the modified option.
The Company is required to estimate potential forfeitures of stock grants and adjust recorded compensation cost accordingly. The estimate of forfeitures is based on historical experience and is adjusted over the requisite service period to the extent that actual forfeitures differ, or are expected to differ, from the prior estimates. Changes in estimated forfeitures will be recognized in the period of change and will impact the amount of stock-based compensation expense to be recognized in future periods.
Foreign Currency Translation
The functional currency of our non-U.S. subsidiaries is the U.S. Dollar, therefore all gains and losses on currency transactions are expensed as incurred.
Income Taxes
The Company uses the liability method of accounting for income taxes. Under this method, deferred tax assets and liabilities are recognized for expected future tax consequences of temporary differences between the carrying amounts and the tax bases of assets and liabilities. Valuation allowances are provided if it is more likely than not that some or all of the deferred tax assets will not be realized.
The Company accounts for uncertainty of income taxes based on a “more-likely-than-not” threshold for the recognition and de-recognition of tax positions, which includes the accounting for interest and penalties relating to tax positions.
88
Basic net loss per share attributable to common stockholders is calculated by dividing the net loss attributable to common stockholders for the period, defined as net loss minus the accretion of dividends on redeemable convertible preferred stock, by the weighted-average number of shares of common stock outstanding during the period, without consideration of potentially dilutive securities. Diluted earnings per share includes the dilutive effect of common stock equivalents and is calculated using the weighted-average number of common stock and the common stock equivalents outstanding during the reporting period. Diluted earnings per share for the years ended December 31, 2017, 2016 and 2015 excluded common stock equivalents because their inclusion would be anti-dilutive or would decrease the reported loss per share. Our incentive stock units have the right to receive non-forfeitable dividends on an equal basis with common stock and therefore are considered participating securities that must be included in the calculation of net loss per share using the two-class method. Under the two-class method, basic and diluted net loss per share is determined by calculating net loss per share for common stock and participating securities based on the cash dividends paid and participation rights in undistributed earnings.
Recently Issued Accounting Standards Not Yet Adopted
Under the Jumpstart Our Business Startups Act (the “JOBS Act”), emerging growth companies can delay adopting new or revised accounting standards until such time as those standards apply to private companies. We have elected to take advantage of the longer phase-in periods for the adoption of new or revised financial accounting standards under the JOBS Act until we are no longer an emerging growth company.
In May 2014, the FASB issued Accounting Standards Update (ASU) No. 2014-09, Revenue from Contracts with Customers (Topic 606). This ASU will supersede the revenue recognition requirements in Topic 605, Revenue Recognition, and most industry-specific guidance, and creates guidance for when revenue should be recognized from the exchange of goods or services. ASU No. 2016-08 was issued in March 2016 to clarify the principal versus agent guidance in this new revenue recognition standard. ASU 2016-10 was issued in April 2016 to clarify the guidance on accounting for licenses of intellectual property and identifying performance obligations in the new revenue recognition standard. ASU 2016-12 was issued in May 2016 to clarify the guidance on transition, collectability, noncash consideration and the presentation of sales and other similar taxes in the new revenue recognition standard. ASU 2016-20 was issued in December 2016 to make technical corrections and improvements on narrow aspects of this guidance. ASU No. 2015-14 was issued in August 2015 to defer the effective date of ASU 2014-09 for one year. The new standard permits adoption either by using (i) a full retrospective approach for all periods presented in the period of adoption or (ii) a modified retrospective approach with the cumulative effect of initially applying the new standard recognized at the date of initial application and providing certain additional disclosures. For public companies, the new standard is effective for annual reporting periods beginning after December 15, 2017, including interim periods within that reporting period. For all other entities, this standard is effective for annual reporting periods beginning after December 15, 2018. Early adoption is permitted. The Company does not plan to early adopt, and therefore plans to adopt for the annual reporting period beginning after December 15, 2018.
The Company currently plans to adopt using the full retrospective approach; however, a final decision regarding the adoption method has not been made at this time. The Company’s final determination will depend on a number of factors such as the significance of the impact of the new standard on the Company’s financial results, system readiness, including that of software procured from third-party providers, and the Company’s ability to accumulate and analyze the information necessary to assess the impact on prior period financial statements, as necessary.
The Company is in the initial stages of its evaluation of the impact of the new standard on its accounting policies, and processes. The Company has assigned internal resources in addition to the engagement of third party service providers to assist in the evaluation. While the Company continues to assess all potential impacts under the new standard there may be the potential for significant impacts to the timing of recognition of professional services revenue, and contract acquisition costs, both with respect to the amounts that will be capitalized as well as the period of amortization.
89
In February 2016, the FASB issued ASU No. 2016-02, Leases (Topic 842). This standard requires lessees to recognize a lease liability and a lease asset for all leases, including operating leases, with a term greater than 12 months on its balance sheet. The standard also expands the required quantitative and qualitative disclosures surrounding leases. This standard is effective for annual periods beginning after December 15, 2019. Early adoption is permitted. The Company does not plan to early adopt, and therefore plans to adopt for the annual period beginning after December 15, 2019. This standard will be applied using a modified retrospective transition approach for leases existing at, or entered into after, the beginning of the earliest comparative period presented in the financial statements. Management is currently evaluating the effect of these provisions on the Company’s consolidated financial statements.
In October 2016, the FASB issued ASU No. 2016-16, Income Taxes (Topic 740): Intra-Entity Transfers of Assets Other Than Inventory. This standard requires companies to account for the income tax effects of intercompany transfers of assets other than inventory when the transfer occurs. This guidance is effective for annual periods beginning after December 15, 2018, including interim periods within that reporting period. Early adoption is permitted. The Company does not plan to early adopt and therefore plans to adopt for the annual period beginning after December 15, 2018. Management is currently evaluating the effect of these provisions on the Company’s consolidated financial statements.
In May 2017, the FASB issued ASU No. 2017-09, Compensation—Stock Compensation (Topic 718). This standard clarifies which changes to the terms and conditions of share-based payment awards require an entity to apply modification accounting under Topic 718. An entity is required to account for the effects of a modification unless all of the following conditions are met: (i) the fair value (or calculated value or intrinsic value, if such an alternative measurement method is used) of the modified award is the same as the fair value (or value using an alternative measurement method) of the original award immediately before the original award is modified. If the modification does not affect any of the inputs to the valuation technique that the entity uses to value the award, the entity is not required to estimate the value immediately before and after the modification; (ii) the vesting conditions of the modified award are the same as the vesting conditions of the original award immediately before the original award is modified; and (iii) the classification of the modified award as an equity instrument or a liability instrument is the same as the classification of the original award immediately before the original award is modified. The new standard is effective for fiscal years beginning after December 15, 2017, including interim periods within those fiscal years. Early adoption is permitted in the first period of the year this guidance is adopted and therefore plans to adopt for the annual period beginning after December 15, 2017. The Company does not plan to early adopt, and therefore plans to adopt for the annual period beginning after December 15, 2017. Management is currently evaluating the effect of these provisions on the Company’s consolidated financial statements.
In July 2017, the FASB issued ASU No. 2017-011, Earnings Per Share (Topic 260). This standard addresses the complexity of accounting for certain financial instruments with down round features. This guidance is effective for fiscal years beginning after December 15, 2019, and interim periods with fiscal years beginning after December 15, 2020. Early adoption is permitted. The Company does not plan to early adopt, and therefore plans to adopt for the annual period beginning after December 15, 2020. Management is currently evaluating the effect of these provisions on the Company’s consolidated financial statements.
Recently Adopted Accounting Pronouncements
In August 2014, the FASB issued ASU No. 2014-15, Presentation of Financial Statements—Going Concern (Subtopic 205-40). This ASU defines management’s responsibility to evaluate whether there is substantial doubt about an organization’s ability to continue as a going concern and to provide related footnote disclosures. Prior to this ASU, GAAP lacked guidance about management’s responsibility to evaluate whether there is substantial doubt about the organization’s ability to continue as a going concern or to provide related footnote disclosures and all guidance was included in generally accepted auditing standards (“GAAS”). This guidance is effective for annual periods ending after December 15, 2016. Early adoption is permitted. This standard has been adopted beginning with the reporting period ended December 31, 2016. The adoption of ASU 2014-15 did not have a material effect on the Company’s consolidated financial statements and related disclosures, although it could have an impact on disclosures in future periods.
90
In February 2015, the FASB issued ASU No. 2015-02, Consolidation (Topic 810): Amendments to the Consolidation Analysis. This standard amended guidance related to consolidation. This guidance focuses on a reporting company’s consolidation evaluation to determine whether certain legal entities should be consolidated. This guidance is effective for annual periods beginning after December 15, 2016, including interim periods within that reporting period. This standard has been adopted beginning with the reporting period ended December 31, 2017. The adoption of ASU 2015-02 did not have a material effect on the Company’s consolidated financial statements and related disclosures, although it could have an impact on disclosures in future periods.
In April 2015, the FASB issued ASU No. 2015-03, Interest—Imputation of Interest (Subtopic 835-30)— Simplifying the Presentation of Debt Issuance Costs. This standard requires debt issuance costs related to a recognized debt liability to be presented in the balance sheet as a direct deduction from the debt liability rather than as an asset. This guidance was amended by ASU No. 2015-15, which was issued in August 2015. This amendment provides additional guidance related to the presentation and subsequent measurement of debt issuance costs related to line-of-credit arrangements. These updates are effective for annual periods beginning after December 15, 2015. Early adoption is permitted. This standard has been adopted retrospectively beginning with the reporting period ended December 31, 2016. The adoption resulted in the reclassification of $0.5 million from other assets to other long-term liabilities on our consolidated financial statements and related disclosures as of December 31, 2015.
In April 2015, the FASB issued ASU No. 2015-05, Intangibles—Goodwill and Other—Internal-Use Software (Subtopic 350-40): Customer’s Accounting for Fees Paid in a Cloud Computing Arrangement. This standard clarifies whether a customer should account for a cloud computing arrangement as an acquisition of a software license or as a service arrangement by providing characteristics that a cloud computing arrangement must have in order to be accounted for as a software license acquisition. This guidance is effective for annual periods beginning after December 15, 2015. Early adoption is permitted. This standard has been adopted prospectively beginning with the reporting period ended December 31, 2016. The adoption of ASU 2015-05 did not have a material effect on the Company’s consolidated financial statements and related disclosures.
In September 2015, the FASB issued ASU No. 2015-16, Business Combinations (Topic 805): Simplifying the Accounting for Measurement-Period Adjustments. This standard eliminates the requirement that an acquirer in a business combination account for a measurement-period adjustment retrospectively. Instead, an acquirer will recognize a measurement-period adjustment during the period in which the amount of the adjustment is determined. This guidance is effective for annual periods beginning after December 15, 2016. Early adoption is permitted. The amendments should be applied prospectively to adjustments to provisional amounts that occur after the effective date. This standard has been adopted beginning with the reporting period ended December 31, 2016 and will recognize measurement-period adjustments when amounts are determined.
In November 2015, the FASB issued ASU No. 2015-17, Balance Sheet Classification of Deferred Taxes. This guidance requires that all deferred tax assets and liabilities, along with any related valuation allowance, be classified as noncurrent on the balance sheet. As a result, each jurisdiction will now only have one net noncurrent deferred tax asset or liability. This guidance is effective for annual periods beginning after December 15, 2017. Early adoption is permitted. This standard has been adopted beginning with the reporting period ended December 31, 2015 and resulted in no material reclassifications of deferred taxes.
In March 2016, the FASB issued ASU No. 2016-09, Compensation—Stock Compensation (Topic 718): Improvements to Employee Share-Based Payment Accounting. This standard changes how companies account for certain aspects of share-based payments to employees, including recognizing the income tax effects of awards, accounting for an employee’s use of shares to satisfy the employer’s statutory income tax withholding obligation, and recognizing forfeitures. The standard also adds two practical expedients for nonpublic entities related to expected term and intrinsic value. This guidance is effective for annual periods beginning after December 15, 2016. Early adoption is permitted. All of the guidance must be adopted in the same period. These standards have been adopted beginning with the interim reporting period ended March 31, 2017. The adoption of ASU 2016-09 did not have a material effect on the Company’s consolidated financial statements and related disclosures.
91
In August 2016, the FASB issued ASU No. 2016-15, Statement of Cash Flows (Topic 230): Classification of Certain Cash Receipts and Cash Payments—a consensus of the Emerging Issues Task Force. This standard promotes consistency in the presentation of certain items on the Statement of Cash Flows. In November 2016 the FASB issued ASU No. 2016-18, Statement of Cash Flows (Topic 230): Restricted Cash (a consensus of the FASB Emerging Issues Task Force). This standard clarifies restricted cash and restricted cash equivalents should be presented in the statement of cash flows. These new standards are effective for annual periods beginning after December 15, 2018. Early adoption is permitted. These standards have been adopted beginning with the reporting period ended December 31, 2016.
In January 2017, the FASB issued ASU No. 2017-04, Intangibles—Goodwill and Other (Topic 350): Simplifying the Test for Goodwill Impairment. This standard simplifies the goodwill impairment test by eliminating the Step 2 requirement to determine the fair value at the impairment testing date of its assets and liabilities. This guidance is effective for annual periods beginning after December 15, 2021. Early adoption is permitted for impairment tests performed on testing dates after January 1, 2017. These standards have been adopted beginning with the interim reporting period ended March 31, 2017.
3. Business Combination
Whitebox Security Ltd.
On July 15, 2015, Whitebox Security Ltd. was acquired in exchange for total consideration of approximately $16 million. The acquisition was funded by borrowings under the Company’s revolving loan facility and cash on hand.
Assets acquired, and liabilities assumed
The Company recorded the transaction using the acquisition method of accounting which requires that assets acquired and liabilities assumed be recognized at their fair values as of the acquisition date.
The values outlined below represent the Company’s estimates of fair value as of the acquisition date:
|
|
|
(In thousands) |
|
|
|
Cash and cash equivalents |
|
$ |
458 |
|
|
Accounts receivable |
|
|
423 |
|
|
Prepaid expenses and other assets |
|
|
34 |
|
|
Deferred revenue contracts |
|
|
162 |
|
|
Goodwill |
|
|
10,485 |
|
|
Intangible assets |
|
|
5,810 |
|
|
Total assets |
|
$ |
17,372 |
|
|
Accounts payable |
|
$ |
(91 |
) |
|
Accrued expenses |
|
|
(250 |
) |
|
Deferred tax liability |
|
|
(1,202 |
) |
|
Deferred revenue |
|
|
(162 |
) |
|
Total liabilities |
|
$ |
(1,705 |
) |
|
Total consideration |
|
$ |
15,667 |
|
|
Total consideration, net of cash acquired |
|
$ |
15,209 |
|
The fair values of the assets acquired and liabilities assumed were determined using various valuation techniques. Cash and cash equivalents, prepaid expenses, deposits, accounts payable, accrued expenses, and other liabilities were valued using a historical cost basis as this basis approximates fair value. Accounts receivable and other receivables have been recorded on a historical net basis, which approximates the fair value. Deferred revenue has been recorded based on an estimate of the fair market value of the services to be provided in connection with the associated contracts.
92
Intangible assets—the following table summarizes the fair value estimates of the identifiable intangible assets and their estimated useful lives:
|
|
|
Estimated fair value (In thousands) |
|
|
Weighted average estimated useful life (In years) |
|
|
Developed technology |
|
$ |
5,000 |
|
|
7 |
|
Non-competition agreements and related items |
|
|
810 |
|
|
4.4 |
|
Total acquired intangible assets other than goodwill |
|
$ |
5,810 |
|
|
|
The intangible assets have been valued using variations of the income approach method which the Company determined were the most appropriate approach for the individual assets and which is considered a Level 3 valuation technique. Each of the intangible assets will be amortized over its estimated useful life.
Goodwill—The Company recognized approximately $10.5 million of goodwill in connection with the acquisition transaction, calculated as the excess of the consideration transferred over the net assets recognized. Goodwill represents the future economic benefits arising from other assets acquired that could not be individually identified and separately recognized. None of the goodwill recognized is expected to be deductible for income tax purposes.
Acquisition Costs—The Company incurred acquisition costs totaling approximately $452,000 associated with the acquisition of Whitebox Security Ltd.
4. Property and Equipment, Net
The cost and accumulated depreciation and amortization of property and equipment are as follows:
|
|
|
As of December 31, |
|
|||||
|
|
|
2017 |
|
|
2016 |
|
||
|
Property and equipment, net |
|
(In thousands) |
|
|||||
|
Computer equipment |
|
$ |
4,559 |
|
|
$ |
2,618 |
|
|
Other assets |
|
|
833 |
|
|
|
528 |
|
|
Total property and equipment |
|
|
5,392 |
|
|
|
3,146 |
|
|
Less: accumulated depreciation |
|
|
(2,374 |
) |
|
|
(1,291 |
) |
|
Total property and equipment, net |
|
$ |
3,018 |
|
|
$ |
1,855 |
|
Depreciation expense was $1.4 million, $0.9 million and $0.6 million for the years ended December 31, 2017, 2016, and 2015, respectively. There were no impairments of our property and equipment for the years ended December 31, 2017, 2016 and 2015.
5. Goodwill
Goodwill represents the excess of the purchase price over the identifiable tangible and intangible assets acquired plus liabilities assumed arising from business combinations. The carrying amount of goodwill was $219.4 million at December 31, 2017 and December 31, 2016 as there has been no acquisition activity in these periods. All goodwill balances are subject to annual goodwill impairment testing. There were no impairments of goodwill during the years ended December 31, 2017, 2016 and 2015.
93
Total cost and amortization of intangible assets comprised of the following:
|
|
|
|
|
As of December 31, |
|
|||||
|
|
|
Weighted Average Useful Life |
|
2017 |
|
|
2016 |
|
||
|
Intangible assets, net |
|
(In years) |
|
(In thousands) |
|
|||||
|
Customer lists |
|
15 |
|
$ |
42,500 |
|
|
$ |
42,500 |
|
|
Developed technology |
|
9.6 |
|
|
42,000 |
|
|
|
42,000 |
|
|
Trade names and trademarks |
|
17 |
|
|
24,500 |
|
|
|
24,500 |
|
|
Order backlog |
|
1.5 |
|
|
1,100 |
|
|
|
1,100 |
|
|
Non-competition agreements and related items |
|
4.4 |
|
|
810 |
|
|
|
810 |
|
|
Total intangible assets |
|
|
|
|
110,910 |
|
|
|
110,910 |
|
|
Less: Accumulated amortization |
|
|
|
|
(29,725 |
) |
|
|
(20,897 |
) |
|
Total intangible assets, net |
|
|
|
$ |
81,185 |
|
|
$ |
90,013 |
|
The amortization expense of the intangible assets was $8.8 million, $9.1 million and $9.1 million for the years ended December 31, 2017, 2016 and 2015, respectively. Amortization expense is included in the consolidated statements of operations for the years ended December 31, 2017, 2016 and 2015, respectively, as follows: General and administrative expenses of $0, $71,000 and $64,000, research and development expenses of $0.1 million, $0.2 million and $0, sales and marketing expenses of $4.3 million, $4.4 million and $5.0 million, license cost of revenue of $4.0 million, $4.0 million and $3.7 million and subscription cost of revenue of $0.4 million, $0.4 million and $0.4 million. Periodically, the Company evaluates intangible assets for possible impairment. There were no impairments for intangible assets during the years ended December 31, 2017, 2016 and 2015.
The total estimated future amortization expense of these intangible assets as of December 31, 2017 is as follows:
|
Year ending December 31, |
|
(In thousands) |
|
|
|
2018 |
|
$ |
8,825 |
|
|
2019 |
|
|
8,825 |
|
|
2020 |
|
|
8,825 |
|
|
2021 |
|
|
8,825 |
|
|
2022 |
|
|
8,825 |
|
|
Thereafter |
|
|
37,060 |
|
|
Total amortization expense |
|
$ |
81,185 |
|
7. Commitments and Contingencies
Operating Leases
The Company leases its facilities under non-cancelable operating lease agreements. The majority of these agreements include a renewal option, and/or require the Company to pay taxes, insurance, and maintenance costs, which are not included in the table below. Certain of these facility leases contain predetermined fixed escalations of the minimum rentals, and the Company recognizes expense for these leases on a straight-line basis. The difference between the recognized rental expense and amounts payable under the lease is recorded as deferred rent on the consolidated balance sheets.
94
Future minimum annual lease payments under these non-cancelable operating leases, inclusive of sublease proceeds, as of December 31, 2017 are as follows:
|
Year ending December 31, |
|
(In thousands) |
|
|
|
2018 |
|
$ |
2,785 |
|
|
2019 |
|
|
3,004 |
|
|
2020 |
|
|
4,445 |
|
|
2021 |
|
|
4,997 |
|
|
2022 |
|
|
4,921 |
|
|
Thereafter |
|
|
32,127 |
|
|
Total minimum lease payments |
|
$ |
52,279 |
|
Rent expense under all operating leases was approximately $2.9 million, $1.8 million and $1.5 million, for the years ended December 31, 2017, 2016 and 2015, respectively. The Company had a deferred rent balance of approximately $1.4 million and $0.2 million as of December 31, 2017 and 2016, which is included in accrued expenses and other liabilities on the accompanying balance sheets.
Indemnification Arrangements
In the ordinary course of business, the Company enters into contractual arrangements under which it agrees to provide indemnification of varying scope and terms to customers, business partners and other parties with respect to certain matters, including, losses arising out of the breach of such agreements, intellectual property infringement claims made by third parties, and other liabilities with respect to our products and services and business. In these circumstances, payment may be conditional on the other party making a claim pursuant to the procedures specified in a particular contract.
The Company includes service level commitments to our cloud customers warranting certain levels of uptime reliability and performance and permitting those customers to receive credits in the event that we fail to meet those levels. To date, the Company has not incurred any material costs as a result of these commitments and we expect the time between any potential claims and issuance of the credits to be short. As a result, we have not accrued any liabilities related to these commitments in our consolidated financial statements.
Litigation Claims and Assessments
The Company is subject to claims and suits that may arise from time to time in the ordinary course of business. In addition, some legal actions, claims and governmental inquiries may be instituted or asserted in the future against us and our subsidiaries. Although the outcome of our legal proceedings cannot be predicted with certainty and no assurances can be provided, based upon current information, we do not believe the liabilities, if any, which may ultimately result from the outcome of such matters, individually or in the aggregate, will have a material adverse impact on our financial statements.
8. Line of Credit and Long-Term Debt
In 2014, the Company entered into a loan and security agreement with a financial institution in the amount of $110 million, consisting of a term loan facility of $100 million and a revolving loan facility of up to $10 million. The loan and security agreement established first security for the financial institution over all assets of the Company. Borrowings under this agreement bore interest based on LIBOR and was 3.7% per annum on the term loan and 3.5% on the revolving loan at December 31, 2015. The maturity date on the term loan was September 2019 and on the revolving loan was January 2016. The outstanding loans were repaid in full in August 2016, as discussed below.
The Company incurred debt issuance costs of $0.7 million in connection with this loan and security agreement. These costs were amortized to interest expense over the term, through the debt extinguishment in 2016.
95
In August 2016, the Company repaid in full the 2014 loan and security agreement. Concurrently, the Company entered into a senior secured credit facility with a different financial institution in the amount of $120.0 million, consisting of a term loan facility of $115.0 million and a revolving loan facility of up to $5.0 million. The credit facility established first security for the financial institution over all assets of the Company and is subject to certain financial covenants. Borrowings under this agreement bear interest based on the adjusted LIBOR rate, as defined in the agreement with a 1% floor, plus an applicable margin of 8.0%. The maturity date on the term loan is August 16, 2021, with principal payment due in full on maturity date, and interest payments due quarterly. The agreement also requires prepayments in the case of certain events including: asset sales in excess of $1 million, proceeds from an initial public offering (“IPO”), proceeds in excess of $1 million from an insurance settlement, or proceeds from a new debt agreement. Beginning with the year ended December 31, 2017, an additional prepayment may be due related to excess cash flow for the respective measurement periods.
On June 28, 2017, the Company amended and restated its loan agreement to enter into a series of transactions in which the Company incurred $50.0 million of incremental debt which expanded the current facility to $167.5 million consisting of a $160.0 million term loan and a $7.5 million revolving credit facility, undrawn at close (the “New Financing”). Proceeds from the New Financing were used to partially fund $50.4 million in accumulated preferred stock dividends for shares of preferred stock through December 15, 2016. Borrowings under the New Financing agreement will bear interest based on the adjusted LIBOR rate, as defined in the agreement with a 1% floor, plus an applicable margin of 7.0%. The rate prevalent at December 31, 2017 was 8%, consisting of the 1% floor plus 7% margin and December 31, 2016 was 9.0%, consisting of the 1% floor plus 8% margin. The maturity date on the term loan remains August 16, 2021, with principal payment due in full at maturity and interest payments due quarterly. The agreement also requires prepayments in the case of certain events including: asset sales in excess of $1.0 million, proceeds from an IPO, proceeds in excess of $1.0 million from an insurance settlement, or proceeds from a new debt agreement. Beginning with the year ended December 31, 2017, an additional prepayment may be due related to excess cash flow for the respective measurement periods.
On October 5, 2017, in connection with our new corporate headquarters lease, we executed a standby letter of credit in the amount of $6.0 million. As a result, we had $1.5 million available under our revolving credit facility as of December 31, 2017.
The outstanding balance of the term loan at December 31, 2017 and December 31, 2016 was $70 million and $110 million, respectively. There was no outstanding balance of the revolving line of credit at December 31, 2017 and 2016. The Company was in compliance with all applicable covenants as of December 31, 2017 and 2016.
In 2017, the Company amended its existing credit facility in connection with the consummation of its initial public offering. Such amendment required that the Company use a portion of its net proceeds to repay $90.0 million of borrowings outstanding under our term loan facility to reduce the aggregate outstanding principal amount thereof to $70.0 million. This repayment was subject to a prepayment premium of 1.50% approximately $1.4 million, which is recorded as interest expense. As a result of this paydown, the Company incurred a $1.7 million loss on the modification and partial extinguishment of debt which was also recorded as interest expense in the accompanying consolidated statements of operations for the years ending December 31, 2017.
The Company has incurred total debt issuance costs of $4.5 million in connection with these loan and security agreements of which $1.4 million relates to the modified agreement. These costs are being amortized to interest expense over the life of the debt on a straight-line basis, which approximates the interest method. Amortization of debt issuance costs for existing loan and security agreement for the years ended December 31, 2017, 2016 and 2015 was approximately $0.7 million, $0.7 million and $0.1 million, respectively, was recorded in interest expense in the accompanying consolidated statements of operations. As of December 31, 2017, the consolidated balance sheet includes unamortized debt issuance costs of approximately $1.8 million included in long-term debt.
96
Aggregate maturities of the Company’s debt at December 31, 2017 are as follows:
|
|
|
(In thousands) |
|
|
|
2018 |
|
|
|
|
|
2019 |
|
|
116 |
|
|
2020 |
|
|
— |
|
|
2021 |
|
|
70,000 |
|
|
2022 |
|
|
— |
|
|
Total debt |
|
$ |
70,116 |
|
|
Less: deferred financing costs |
|
|
(1,787 |
) |
|
Long-term debt, net |
|
$ |
68,329 |
|
|
Less: current portion |
|
|
— |
|
|
Long term debt |
|
$ |
68,329 |
|
9. Related Party Transactions
At December 31, 2015, in connection with the final settlement of the SailPoint Technologies, Inc. acquisition, the Company incurred a payable to its controlling entity totaling $459,401. As of December 31, 2016, the payable to its controlling entity of $459,401 had been converted to additional paid in capital.
In 2016, the Company entered into agreements totaling approximately $626,000 with certain non-executive employees related to their personal tax liabilities. These agreements will be forgiven over a three-year period, beginning in 2016, if the employees remain employed by the Company through the applicable dates. The remaining balances of these agreements as of December 31, 2017 and 2016 are included in the accompanying consolidated balance sheet as prepayments and other current assets and other non-current assets for the respective periods of $0 and $0 and $101,000 and $319,000 respectively. As of December 31, 2017, the balances for these agreements were forgiven during the fourth quarter of 2017.
Throughout 2017, 2016 and 2015 the Company engaged in ordinary sales transactions of $858,000 $37,000, $59,000 and purchase transactions of $942,000, $313,000, and $39,000 respectively, with entities affiliated with its controlling entity. At December 31, 2017 and 2016, the accompanying consolidated balance sheets included accounts payable balances of $3,400 and $5,000, as well as accounts receivable balances $516,000 and $0, respectively, associated with these transactions.
In September 2014, the Company entered into an advisory services agreement (the “Consulting Agreement”) with its controlling entity. The Consulting Agreement required quarterly payments from September 8, 2014 through December 31, 2018 for business consulting services provided by the controlling entity. Consulting fees from the Consulting Agreement totaled $1.1 million, $1.0 million and $750,000 in the years ended December 31, 2017, 2016, and 2015, respectively, and are included in general and administrative expenses on the accompanying consolidated statements of operations. Upon completion of the initial public offering, the Consulting Agreement ceased, and the Company is no longer required to make future payments.
10. Stockholders’ Equity
In November 2017, the board of directors and stockholders approved the Amended and Restated Certificate of Incorporation to increase the authorized capital stock to 310,000,000 shares, consisting of 300,000,000 shares of common stock and 10,000,000 shares of preferred stock, each with par value of $0.0001 per share.
97
The Company’s Amended and Restated Certificate of Incorporation authorizes issuance of 300,000,000 shares of common stock with a par value of $0.0001 per share. The common stock confers upon its holders the right to participate in the general meetings of the Company, to vote at such meetings (each share represents one vote), to elect board members and to participate in any distribution of dividends, payments of the Company’s debts, other payments required by law, or other property and amounts payable upon shares of preferred stock, including the distribution of surplus assets upon liquidation equally on a per share basis. The rights of the holders of common stock will be subject to, and may be adversely affected by, the rights of holders of any preferred stock that may be issued in the future.
Preferred stock
The company is authorized, subject to any limitations prescribed by law, without stockholder approval, to issue from up to an aggregate of 10,000,000 shares of preferred stock, in one or more series, each series to have such rights, preferences and limitations, including voting rights, dividend rights, conversion rights, redemption privileges and liquidation preferences as determined by the board of directors. As of December 31, 2017, the Company does not have any shares of preferred stock outstanding and currently has no plans to issue shares of preferred stock.
Redeemable Convertible Preferred Stock
Prior to the November 2017 Amended and Restated Certificate of Incorporation, the Company classified the redeemable convertible preferred stock outside of stockholders’ equity (deficit) as required by ASC 480-10-S99 since the shares possessed liquidation features which may have triggered a distribution that was not solely within the Company’s control. Pursuant to the Company’s Amended and Restated Certificate of Incorporation in effect prior to the IPO, a deemed liquidation event would have occurred upon the closing of the transfer of the Company’s securities to a person or a group of affiliated persons, in one or a series of related transactions, if immediately after such transaction, such person or group of affiliated persons would hold 50% or more of the outstanding voting stock of the Company. The holders of a majority of the outstanding preferred stock may elect to require that all or any portion of the preferred stock held by them be redeemed in connection with any of the following (each of which is defined as a “Fundamental Change”): (i) a change in control of the Company, (ii) a sale of 50% or more of the assets of the Company and its subsidiaries, and (iii) a merger or consolidation to which the Company is a party, except for a merger where the Company is the surviving corporation, the terms of the preferred stock are not changed and the preferred stock is not exchanged for cash, securities or other properties, and the holders of a majority of the voting power (with respect to election of directors) of the Company’s capital stock immediately prior to the merger shall continue to hold a majority of the voting power following the merger. Upon such election, each other holder of preferred stock may also require that all or any portion of the preferred stock held by them be redeemed in connection with such Fundamental Change.
Upon the closing of the IPO on November 17, 2017, all shares of the Company’s outstanding redeemable convertible preferred stock automatically converted into shares of common stock. As of such date, no redeemable convertible preferred stock was authorized or issued and outstanding.
Redeemable convertible preferred stock consisted of the following (in thousands, except share amounts):
|
|
|
Redeemable |
|
|
|
Original |
|
|
|
|
|
|
Shares |
|
|
|
|
|
|
Dividend |
|
|||
|
|
|
Convertible |
|
|
|
Issue |
|
|
Shares |
|
|
Issued and |
|
|
Liquidation |
|
|
Rate Per |
|
|||||
|
As of |
|
Preferred Stock: |
|
Date Issued |
|
Price |
|
|
Authorized |
|
|
Outstanding |
|
|
Preference |
|
|
Share |
|
|||||
|
December 31, 2016 |
|
Series A |
|
September 2014 |
|
$ |
1,000 |
|
|
|
500,000 |
|
|
|
223,987 |
|
|
$ |
275,463 |
|
|
|
9 |
% |
|
December 31, 2017 |
|
Series A |
|
September 2014 |
|
$ |
1,000 |
|
|
|
— |
|
|
|
— |
|
|
$ |
— |
|
|
|
0 |
% |
98
Prior to November 2017, the holders of the Company’s redeemable convertible preferred stock were entitled to dividends when and if declared by the board of directors. Dividends were payable in preference and priority to any payment of any dividend on the Company’s common stock. Dividends on redeemable convertible preferred stock were cumulative and compounded daily at a rate of 9% per annum, equivalent to $90 per share of preferred stock. On June 27, 2017, the board of directors declared, and the Company paid, an aggregate cash dividend of $50.4 million on the issued and outstanding shares of the Company’s preferred stock. The accumulated payment was made to eligible shareholders effective through December 15, 2016 and was primarily funded with the proceeds from the New Financing arrangement as noted in Note 8. Upon completing the initial public offering in November 2017, 223,816 shares of redeemable convertible preferred shares, with cumulative undeclared and unpaid dividends of $22.2 million, were converted to 20,500,400 shares of common stock.
Treasury Stock
During 2014, the Company entered into “Employee Purchase Agreements” with certain of its employees. Pursuant to the Employee Purchase Agreements, shares issued to the employee can be repurchased when the employee leaves the Company, subject to certain pricing parameters. Any shares purchased have been held in the Company’s treasury.
The Company accounts for treasury stock under the cost method and includes treasury stock as a component of stockholders’ equity (deficit). As of December 31, 2017, the Company had repurchased 190,434 shares, cumulatively, of its common stock for approximately $0.5 million, at an average cost of $2.56 per share. During the fourth quarter of 2017, all repurchased shares of treasury stock were retired.
11. Stock Option Plans and Stock-Based Compensation
2015 Stock Option Plans
In 2015, the Company adopted (i) the Amended and Restated 2015 Stock Option and Grant Plan and (ii) the 2015 Stock Incentive Plan (together the “2015 Stock Option Plans”) under which it may grant incentive stock options (“ISOs”), nonqualified stock options (“NSOs”), and restricted stock to purchase shares of common stock. The 2015 Stock Option Plans reserve 5,000,000 shares of common stock for issuance as ISOs, 500,000 shares of restricted stock and 250,000 shares for issuance under the 2015 Stock Incentive Plan. Under the 2015 Stock Option Plans ISOs may not be granted at less than fair market value on the date of the grant and generally vest over a four-year period based on continued service. Certain options are subject to vesting based on certain future performance targets. Options generally expire ten years after the grant date.
At December 31, 2017, 425,112 shares were available for issuance under the Amended and Restated 2015 Stock Option and Grant Plan. At December 31, 2017, 123,105 shares were available for issuance under the 2015 Stock Incentive Plan. The Company currently uses authorized and unissued shares to satisfy share award exercises.
2017 Long Term Incentive Plan
In November 2017, the Company’s board of directors adopted the 2017 Long Term Incentive Plan (the “2017 Plan”). As of December 31, 2017, the Company had reserved 8,856,876 shares of common stock available for issuance under the 2017 Plan to employees, directors, officers and consultants of the Company and its subsidiaries. The number of shares of common stock available for issuance under the 2017 Plan will be increased on each January 1 hereafter by 4,428,438 shares of common stock. Options granted under the 2017 Plan generally vest over four years. Common stock subject to an award that expires or is canceled, forfeited, exchanged, settled in cash or otherwise terminated without delivery of shares, and shares withheld or surrendered to pay the exercise price of, or to satisfy the withholding obligations with respect to an award, will become available for future grants under the 2017 Plan. At December 31, 2017, 6,890,082 shares were available for issuance under the 2017 Plan. The Company currently uses authorized and unissued shares to satisfy share award exercises.
99
In November 2017, the Company’s board of directors adopted the Employee Stock Purchase Plan (the "ESPP"). The ESPP became effective on in November of 2017, after the date our registration statement was declared effective by the SEC. As of December 31, 2017, the participation in the ESPP has is not effective and no shares were purchased.
The fair value for the Company’s stock options granted during the year ended December 31, 2017 was estimated at the date of grant using a Black Scholes option-pricing model with the following assumptions:
|
|
|
Time Based |
|
|
|
Performance Based |
|
||
|
Expected dividend rate |
|
|
0% |
|
|
|
|
0% |
|
|
Expected volatility |
|
40.9% - 49% |
|
|
|
40.9% - 49% |
|
||
|
Risk-free interest rate |
|
1.96% - 2.18% |
|
|
|
1.96% - 2.18% |
|
||
|
Expected term (in years) |
|
6.25 - 6.25 |
|
|
|
5.5 - 6.29 |
|
||
The fair value for the Company’s stock options granted during the year ended December 31, 2016 was estimated at the date of grant using a Black Scholes option-pricing model with the following assumptions:
|
|
|
Time Based |
|
|
Performance Based |
|
|
|||||
|
Expected dividend rate |
|
|
0% |
|
|
|
0% |
|
|
|||
|
Expected volatility |
|
49% |
|
|
49% |
|
|
|||||
|
Risk-free interest rate |
|
1.31% - 2.24% |
|
|
1.27% - 2.16% |
|
|
|||||
|
Expected term (in years) |
|
5.5 - 6.25 |
|
|
5.75 - 6.4 |
|
|
|||||
The fair value for the Company’s stock options granted during the year ended December 31, 2015 was estimated at the date of grant using a Black Scholes option-pricing model with the following assumptions:
|
|
|
Time Based |
|
|
Performance Based |
|
|
|
Expected dividend rate |
|
0% |
|
|
0% |
|
|
|
Expected volatility |
|
48.4% |
|
|
48.4% |
|
|
|
Risk-free interest rate |
|
1.55% - 1.95% |
|
|
1.68% - 1.93% |
|
|
|
Expected term (in years) |
|
|
6.25 |
|
|
5.5 - 6.25 |
|
The risk-free interest rate is based on the U.S. treasury yield curve for the term consistent with the life of the stock options as of the date of grant. The Company has elected to apply the “shortcut approach” in developing the estimate of expected term for “plain vanilla” stock options by using the mid-point between the vesting date and contractual termination date. The Company has not paid, and does not anticipate paying, cash dividends on its common stock; therefore, the expected dividend yield is assumed to be zero.
The Company has determined the volatility for stock options granted based on an analysis of reported data for a comparable peer group of companies that issued stock options with substantially similar terms. The Company did not utilize its own historic volatility because, prior to November 2017, there was no public market for the Company’s common stock, and current time in the public market was not sufficiently long. The expected volatility of stock options granted has been determined using an average of the historical volatility measures of this peer group of companies consistent with the life of the options.
The Company expects all outstanding stock options at December 31, 2017 to fully vest. The weighted average grant date fair value per share for the year ended December 31, 2017, 2016 and 2015 was $4.32, $0.83, and $1.15 respectively. Compensation expense relating to stock options was approximately $1.0 million, $508,000 and $160,000 for the years ended December 31, 2017, 2016, and 2015 respectively. The total fair value of shares vested during the years ended December 31, 2017, 2016 and 2015 was approximately $323,000, $571,000, and $50,000 respectively.
100
The following table summarizes activity for service vesting stock options during the years ended December 31, 2017, 2016 and 2015:
|
|
|
Number of Options |
|
|
Weighted Average Exercise Price (per share) |
|
|
Weighted Average Remaining Contractual Term (years) |
|
|
Aggregate Intrinsic Value |
|
||||
|
Balances at December 31, 2014 |
|
— |
|
|
$ |
— |
|
|
|
|
|
|
|
|
|
|
|
Granted |
|
1,349,782 |
|
|
$ |
2.38 |
|
|
|
|
|
|
|
|
|
|
|
Forfeited |
|
(23,333 |
) |
|
$ |
2.42 |
|
|
|
|
|
|
|
|
|
|
|
Balances at December 31, 2015 |
|
1,326,449 |
|
|
$ |
2.38 |
|
|
|
9.7 |
|
|
|
|
|
|
|
Options vested and expected to vest at December 31, 2015 |
|
1,326,449 |
|
|
$ |
2.38 |
|
|
|
9.7 |
|
|
|
|
|
|
|
Options vested and exercisable at December 31, 2015 |
|
|
10,781 |
|
|
$ |
2.42 |
|
|
|
9.7 |
|
|
|
|
|
|
Balances at December 31, 2015 |
|
1,326,449 |
|
|
$ |
2.38 |
|
|
|
9.7 |
|
|
|
|
|
|
|
Granted |
|
419,839 |
|
|
$ |
1.69 |
|
|
|
|
|
|
|
|
|
|
|
Exercised |
|
(6,568 |
) |
|
$ |
1.77 |
|
|
|
|
|
|
$ |
2,950 |
|
|
|
Forfeited |
|
(117,602 |
) |
|
$ |
2.31 |
|
|
|
|
|
|
|
|
|
|
|
Balances at December 31, 2016 |
|
1,622,118 |
|
|
$ |
2.21 |
|
|
|
8.9 |
|
|
$ |
1,546,599 |
|
|
|
Options vested and expected to vest at December 31, 2016 |
|
1,622,118 |
|
|
$ |
2.21 |
|
|
|
8.9 |
|
|
$ |
1,546,599 |
|
|
|
Options vested and exercisable at December 31, 2016 |
|
|
416,265 |
|
|
$ |
2.36 |
|
|
|
8.7 |
|
|
$ |
340,334 |
|
|
Balances at December 31, 2016 |
|
1,622,118 |
|
|
$ |
2.21 |
|
|
|
8.9 |
|
|
$ |
1,546,599 |
|
|
|
Granted |
|
1,592,370 |
|
|
$ |
9.54 |
|
|
|
|
|
|
|
|
|
|
|
Conversion of performance to service based |
|
591,892 |
|
|
$ |
2.53 |
|
|
|
|
|
|
|
|
|
|
|
Exercised |
|
(152,330 |
) |
|
$ |
2.22 |
|
|
|
|
|
|
$ |
1,871,041 |
|
|
|
Forfeited |
|
(153,975 |
) |
|
$ |
2.21 |
|
|
|
|
|
|
|
|
|
|
|
Balances at December 31, 2017 |
|
3,500,075 |
|
|
$ |
5.43 |
|
|
|
8.8 |
|
|
$ |
31,784,488 |
|
|
|
Options vested and expected to vest at December 31, 2017 |
|
3,500,075 |
|
|
$ |
5.43 |
|
|
|
8.8 |
|
|
$ |
31,784,488 |
|
|
|
Options vested and exercisable at December 31, 2017 |
|
926,614 |
|
|
$ |
2.28 |
|
|
|
7.9 |
|
|
$ |
11,324,729 |
|
|
101
The following table summarizes the status of the Company’s non-vested service vesting stock options for the years ended December 31, 2017, 2016 and 2015:
|
|
|
Number of Shares |
|
|
Weighted Average Grant Date Fair Value |
|
||
|
Non-vested at December 31, 2014 |
|
|
— |
|
|
$ |
— |
|
|
Granted |
|
|
1,349,782 |
|
|
$ |
1.16 |
|
|
Vested |
|
|
(10,781 |
) |
|
$ |
1.17 |
|
|
Forfeited |
|
|
(23,333 |
) |
|
$ |
1.17 |
|
|
Non-vested at December 31, 2015 |
|
|
1,315,668 |
|
|
$ |
1.15 |
|
|
Granted |
|
|
401,094 |
|
|
$ |
0.81 |
|
|
Vested |
|
|
(382,364 |
) |
|
$ |
1.16 |
|
|
Forfeited |
|
|
(117,602 |
) |
|
$ |
1.12 |
|
|
Non-vested at December 31, 2016 |
|
|
1,216,796 |
|
|
$ |
1.05 |
|
|
Granted |
|
|
1,592,370 |
|
|
$ |
4.13 |
|
|
Conversion of vested performance to time based |
|
|
322,988 |
|
|
$ |
11.95 |
|
|
Vested |
|
|
(437,829 |
) |
|
$ |
1.04 |
|
|
Forfeited |
|
|
(111,076 |
) |
|
$ |
1.07 |
|
|
Non-vested at December 31, 2017 |
|
|
2,583,249 |
|
|
$ |
4.32 |
|
The total unrecognized compensation expense related to non-vested service vesting stock options granted is $10.7 million and is expected to be recognized over a weighted average period of 3.14 years as of December 31, 2017.
102
The following table summarizes activity of performance vesting stock options for the years ended December 31, 2017, 2016 and 2015:
|
|
|
Number of Options |
|
|
Weighted Average Exercise Price (per share) |
|
|
Weighted Average Remaining Contractual Term (years) |
|
|
Aggregate Intrinsic Value |
|
||||
|
|
— |
|
|
$ |
— |
|
|
|
|
|
|
|
|
|
||
|
Granted |
|
322,846 |
|
|
$ |
2.32 |
|
|
|
|
|
|
|
|
|
|
|
Balances at December 31, 2015 |
|
322,846 |
|
|
$ |
2.32 |
|
|
|
9.7 |
|
|
|
|
|
|
|
Options vested and expected to vest at December 31, 2015 |
|
322,846 |
|
|
$ |
2.32 |
|
|
|
9.7 |
|
|
|
|
|
|
|
Options vested and exercisable at December 31, 2015 |
|
|
33,613 |
|
|
$ |
2.33 |
|
|
|
9.5 |
|
|
|
|
|
|
Balances at December 31, 2015 |
|
322,846 |
|
|
$ |
2.32 |
|
|
|
9.7 |
|
|
|
|
|
|
|
Granted |
|
101,427 |
|
|
$ |
1.77 |
|
|
|
|
|
|
|
|
|
|
|
Exercised |
|
(4,000 |
) |
|
$ |
1.36 |
|
|
|
|
|
|
$ |
1,942 |
|
|
|
Forfeited |
|
(7,500 |
) |
|
$ |
2.42 |
|
|
|
|
|
|
|
|
|
|
|
Balances at December 31, 2016 |
|
412,773 |
|
|
$ |
2.19 |
|
|
|
8.9 |
|
|
$ |
401,616 |
|
|
|
Options vested and expected to vest at December 31, 2016 |
|
412,773 |
|
|
$ |
2.19 |
|
|
|
8.9 |
|
|
$ |
401,616 |
|
|
|
Options vested and exercisable at December 31, 2016 |
|
|
142,391 |
|
|
$ |
2.22 |
|
|
|
8.8 |
|
|
$ |
134,871 |
|
|
Balances at December 31, 2016 |
|
412,773 |
|
|
$ |
2.19 |
|
|
|
8.9 |
|
|
$ |
401,616 |
|
|
|
Granted |
|
187,469 |
|
|
$ |
3.27 |
|
|
|
|
|
|
|
|
|
|
|
Exercised |
|
(8,350 |
) |
|
$ |
2.38 |
|
|
|
|
|
|
$ |
101,178 |
|
|
|
Conversion of shares |
|
(591,892 |
) |
|
$ |
2.53 |
|
|
|
8.5 |
|
|
|
|
|
|
|
Options vested and expected to vest at December 31, 2017 |
|
— |
|
|
$ |
— |
|
|
|
— |
|
|
$ |
— |
|
|
|
Options vested and exercisable at December 31, 2017 |
|
|
— |
|
|
$ |
— |
|
|
|
— |
|
|
$ |
— |
|
The performance vesting stock options are subject to performance requirements, determined prior to the grant date, based on the Company meeting certain annual earnings before interest, taxes, depreciation and amortization, (“EBITDA”) targets as set by the Board of Directors for the applicable years. During the years ended December 31, 2017, 2016, and 2015, the Board of Directors waived the EBITDA criteria associated with the annual tranche of performance vesting stock options resulting in a modification. These modifications impacted 34, 26 and 16 employees and resulted in incremental stock-based compensation expense of $45,000, $98,000 and $37,000 for the years ended December 31, 2017, 2016, and 2015, respectively.
During the fourth quarter of 2017, all performance vesting options were modified to become time vesting stock options, affecting approximately 40 employees. No other terms of the options were modified. This modification resulted in recognition of incremental stock compensation expense of $74,000 in 2017 and incremental future stock-based compensation expense of $3.6 million to be recognized over the remaining vesting period of these options.
103
A summary of the status of the Company’s non-vested performance vesting stock options as of December 31, 2017, and changes during the year ended December 31, 2017, 2016 and 2015 are presented below:
|
|
|
Number of Shares |
|
|
Weighted Average Grant Date Fair Value |
|
||
|
Non-vested at December 31, 2014 |
|
|
— |
|
|
|
|
|
|
Granted |
|
|
322,846 |
|
|
$ |
1.12 |
|
|
Vested |
|
|
(33,613 |
) |
|
$ |
1.12 |
|
|
Non-vested at December 31, 2015 |
|
|
289,233 |
|
|
$ |
1.11 |
|
|
Granted |
|
|
101,427 |
|
|
$ |
0.84 |
|
|
Vested |
|
|
(106,903 |
) |
|
$ |
0.99 |
|
|
Forfeited |
|
|
(6,563 |
) |
|
$ |
1.18 |
|
|
Non-vested at December 31, 2016 |
|
|
277,194 |
|
|
$ |
1.01 |
|
|
Granted |
|
|
187,469 |
|
|
$ |
1.55 |
|
|
Vested |
|
|
(141,675 |
) |
|
$ |
1.54 |
|
|
Conversion of vested performance to service based |
|
|
(322,988 |
) |
|
$ |
11.95 |
|
|
Non-vested at December 31, 2017 |
|
|
— |
|
|
$ |
— |
|
Incentive Unit Plan
In 2014 and 2015, the Company granted shares of the Company’s common stock (the “incentive units”) to certain members of management pursuant to restricted stock agreements (the “RSAs”).
Incentive units were issued subsequent to the SailPoint Technologies, Inc. acquisition discussed in Note 3 in the notes to the consolidated financial statements. The incentive units were granted with an exercise price equal to the fair market value on the date of grant, are subject to vesting, and if exercised in advance of vesting were subject to the Company’s right to repurchase. Upon vesting, the incentive units automatically convert to common stock. 50% of incentive units granted to executives vest based on performance meeting or exceeding EBITDA targets, as defined in the RSAs. Incentive units granted to non-executives and the remaining 50% of incentive units granted to executives vest 25% on the first anniversary date of the grant, and ratably over the remaining three years. The graded-vesting attribution method is used by the Company to determine the monthly stock-based compensation expense over the applicable vesting periods.
The liability for the cash paid to the Company prior to conversion of the incentive units to shares of common stock, was approximately $116,000 and $194,000 at December 31, 2017 and 2016, respectively, and is included in long term debt. During the year ended December 31, 2017, the Board of Directors waived the EBITDA criteria associated with the annual tranche of performance vesting stock options resulting in a modification. This modification impacted 32 employees and resulted in incremental stock-based compensation expense of $2.4 million. During the fourth quarter of 2017, all incentive units originally granted with performance vesting criteria were modified to vest over time, impacting approximately 32 employees and resulting in incremental stock-based compensation expense of $0.6 million. Additionally, during the fourth quarter of 2017, the Board of Directors approved accelerated vesting of restricted stock for an exiting board member that resulted in an incremental stock-based compensation expense of approximately $154,000.
104
A summary of the Company’s non-vested incentive unit activity as of December 31, 2017, changes during the year ended December 31, 2017, 2016 and 2015 are presented below:
|
|
|
Number of Shares |
|
|
|
Weighted- average exercise price |
|
||
|
|
|
(In thousands) |
|
|
|
(per share) |
|
||
|
Non-vested at December 31, 2014 |
|
|
7,080 |
|
|
|
$ |
0.0517 |
|
|
Granted |
|
|
170 |
|
|
|
$ |
0.0517 |
|
|
Vested |
|
|
(1,193 |
) |
|
|
$ |
0.0517 |
|
|
Forfeited |
|
|
(531 |
) |
|
|
$ |
0.0517 |
|
|
Non-vested at December 31, 2015 |
|
|
5,526 |
|
|
|
$ |
0.0517 |
|
|
Granted |
|
|
(1,677 |
) |
|
|
$ |
0.0517 |
|
|
Vested |
|
|
7 |
|
|
|
$ |
0.0517 |
|
|
Forfeited |
|
|
(20 |
) |
|
|
$ |
0.0517 |
|
|
Other (1) |
|
|
291 |
|
|
|
$ |
0.0517 |
|
|
Non-vested at December 31, 2016 |
|
|
4,127 |
|
|
|
$ |
0.0517 |
|
|
Vested |
|
|
(1,846 |
) |
|
|
$ |
0.0517 |
|
|
Repurchased |
|
|
— |
|
|
|
$ |
— |
|
|
Forfeited |
|
|
(39 |
) |
|
|
$ |
0.0517 |
|
|
Non-vested at December 31, 2017 |
|
|
2,242 |
|
|
|
$ |
0.0517 |
|
|
(1) |
The non-vested total from December 31, 2016 has been adjusted to include incentive units previously issued. |
The total unrecognized compensation related to non-vested incentive units granted is approximately $9.0 million and is expected to be recognized over a weighted-average period of 1.0 years as of December 31, 2017. The total intrinsic value of units unvested as of December 31, 2017, 2016 and 2015 was $32.5 million, $8.5 million and $5.7 million, respectively. Compensation expense relating to incentive units, including both service and performance vesting, was approximately $3.2 million, $60,000 and $86,000 for the years ended December 31, 2017, 2016, and 2015, respectively.
Stock-based compensation expense, which includes stock options, restricted stock units and incentive units, recognized was as follows:
|
|
|
Year Ended December 31, |
|
|||||||||
|
|
|
2017 |
|
|
2016 |
|
|
2015 |
|
|||
|
|
|
(In thousands) |
|
|||||||||
|
Cost of revenue - subscription |
|
$ |
133 |
|
|
$ |
34 |
|
|
$ |
12 |
|
|
Cost of revenue - services and other |
|
|
458 |
|
|
|
63 |
|
|
|
20 |
|
|
Research and development |
|
|
658 |
|
|
|
118 |
|
|
|
62 |
|
|
General and administrative |
|
|
2,062 |
|
|
|
96 |
|
|
|
28 |
|
|
Sales and marketing |
|
|
1,203 |
|
|
|
257 |
|
|
|
124 |
|
|
Total stock-based compensation |
|
$ |
4,514 |
|
|
$ |
568 |
|
|
$ |
246 |
|
Restricted Stock Units
During the year ended December 31, 2017, we awarded RSUs to certain employees, with a weighted-average grant date fair value of $12.18 per share. RSUs are generally subject to forfeiture if employment terminates prior to the vesting date. We expense the cost of the RSUs, which is determined to be the fair market value of the shares of common stock underlying the RSUs on the date of grant, ratably over the period during which the vesting restrictions lapse.
105
The following provides a summary of the restricted stock unit activity for the Company for the year ended December 31, 2017:
|
|
|
Number of Shares |
|
|
Weighted Average Remaining Contractual Term (years) |
|
|
Aggregate Intrinsic Value (In thousands) |
|
|||
|
Balances at December 31, 2016 |
|
— |
|
|
|
|
|
|
|
|
|
|
|
Granted |
|
897,284 |
|
|
|
|
|
|
|
|
|
|
|
Vested |
|
— |
|
|
|
|
|
|
|
|
|
|
|
Forfeited |
|
— |
|
|
|
|
|
|
|
|
|
|
|
Balances at December 31, 2017 |
|
897,284 |
|
|
|
9.9 |
|
|
$ |
186 |
|
|
|
Units vested and expected to vest at December 31, 2017 |
|
897,284 |
|
|
|
9.9 |
|
|
$ |
186 |
|
|
The total unrecognized compensation related to restricted stock units is $10.6 million for December 31, 2017 and is expected to be recognized over a weighted average period of 3.88 years.
A summary of the Company’s non-vested incentive unit activity as of December 31, 2017 is as follows:
|
|
|
Number of Shares |
|
|
Weighted Average Grant Date Fair Value |
|
||
|
Non-vested at December 31, 2016 |
|
|
— |
|
|
$ |
— |
|
|
Granted |
|
|
897,284 |
|
|
$ |
12.18 |
|
|
Vested |
|
|
— |
|
|
|
— |
|
|
Forfeited |
|
|
— |
|
|
|
— |
|
|
Non-vested at December 31, 2017 |
|
|
897,284 |
|
|
$ |
12.18 |
|
12. Accrued Expenses and Other Liabilities
Accrued expenses consisted of the following:
|
|
|
As of December 31, |
|
|||||
|
|
|
2017 |
|
|
2016 |
|
||
|
|
|
(In thousands) |
|
|||||
|
Commissions |
|
$ |
8,559 |
|
|
$ |
4,943 |
|
|
Bonus |
|
|
5,063 |
|
|
|
2,895 |
|
|
Payroll and related benefits |
|
|
2,640 |
|
|
|
988 |
|
|
Interest |
|
|
34 |
|
|
|
794 |
|
|
Partner and customer programs |
|
|
1,234 |
|
|
|
615 |
|
|
Sales and other taxes |
|
|
1,373 |
|
|
|
615 |
|
|
Employee travel expenses |
|
|
369 |
|
|
|
213 |
|
|
Consulting and professional services |
|
|
339 |
|
|
|
188 |
|
|
Other |
|
|
3,025 |
|
|
|
1,854 |
|
|
Total |
|
$ |
22,636 |
|
|
$ |
13,105 |
|
106
13. Prepayments and Other Assets
Prepayments and other assets include the balance of prepaid expenses, prepaid rent, prepaid issuance costs, and other assets. The current portion of these assets is included in prepayments and other current assets and the non-current portion is included in other non-current assets, both of which are contained within the accompanying consolidated balance sheets.
The current portion of prepayments and other current assets consisted of the following:
|
|
|
As of December 31, |
|
||||||
|
|
|
2017 |
|
|
|
2016 |
|
||
|
|
|
(In thousands) |
|
||||||
|
Prepaid expenses |
|
$ |
4,376 |
|
|
|
$ |
2,783 |
|
|
Prepaid insurance |
|
|
660 |
|
|
|
|
447 |
|
|
Prepaid commissions |
|
|
2,931 |
|
|
|
|
3,753 |
|
|
Other |
|
|
2,046 |
|
|
|
|
711 |
|
|
Total |
|
$ |
10,013 |
|
|
|
$ |
7,694 |
|
Other non-current assets consisted of the following:
|
|
|
As of December 31, |
|
||||||
|
|
|
2017 |
|
|
|
2016 |
|
||
|
|
|
(In thousands) |
|
||||||
|
Prepaid expenses |
|
$ |
3,210 |
|
|
|
$ |
546 |
|
|
Deposits |
|
|
222 |
|
|
|
|
115 |
|
|
Note receivable |
|
|
- |
|
|
|
|
319 |
|
|
Other |
|
|
110 |
|
|
|
|
- |
|
|
Total |
|
$ |
3,542 |
|
|
|
$ |
980 |
|
14. Income Taxes
Tax Reform
On December 22, 2017, the U.S. government enacted comprehensive tax legislation commonly referred to as the Tax Cuts and Jobs Act (the “TCJA”). The TCJA makes broad and complex changes to the Code. The changes include, but are not limited to, lowering the U.S. corporate income tax rates, implementing a modified territorial tax system and imposing a one-time transition tax on deemed repatriated earnings of foreign subsidiaries.
The Company has evaluated the impact of the TCJA for its year end income tax provision, the results of which are discussed below.
Rate Reduction
Deferred tax assets and liabilities are measured using enacted tax rates expected to apply to taxable income in the years in which those temporary differences are expected to reverse. The TCJA reduces the U.S. federal corporate income tax rate from 35% to 21% for tax years beginning after December 31, 2017. As a result, the Company has revalued its ending net deferred tax assets and liabilities at December 31, 2017 and recognized a $1.8 million tax benefit that was offset by a change in valuation allowance.
Deemed Repatriation Transition Tax
The TCJA provides for a one-time transition tax on the deemed repatriation of post-1986 undistributed foreign subsidiary earnings and profits (“E&P”). Substantially all of the Company’s foreign subsidiaries’ earnings and profits have previously been included in the Company’s U.S. income tax returns via Section 956. As a result, we recognized tax expense of $0 related to the transition tax.
107
While the TCJA transitions from a worldwide to a modified territorial tax system, global intangible low-taxed income (“GILTI”) provisions will be applied for tax years beginning after December 31, 2017 imposing an incremental tax on low-taxed foreign income. GILTI is the excess of the shareholder’s “net CFC tested income” over the net deemed tangible income return.
Under GAAP, the Company is permitted to make an accounting policy election to either treat taxes due on future inclusions in U.S. taxable income related to GILTI as a current-period expense when incurred (the “period cost method”) or to factor such amounts into the Company’s measurement of its deferred taxes (the “deferred method”). The Company’s selection of an accounting policy with respect to the new GILTI provisions will depend, in part, on analyzing its global income to determine whether it expects to have future U.S. inclusions in taxable income related to GILTI and, if so, what the impact is expected to be. Whether the Company expects to have future U.S. inclusions in taxable income related to GILTI depends on not only the Company’s current structure and estimated future results of global operations, but also its intent and ability to modify its structure. The Company is currently in the process of analyzing its structure and, as a result, is not yet able to reasonably estimate the effect of this provision of the TCJA.
Therefore, the Company has not made any adjustments related to potential GILTI tax in its financial statements and has not made a policy decision regarding whether it will use the period cost or deferred method.
Income Taxes
The provision for income taxes for 2017, 2016 and 2015 is related to the profits generated in certain foreign jurisdictions by our consolidated subsidiaries.
The following table presents consolidated loss before provision for income taxes as follows:
|
|
|
Year Ended December 31, |
|
|||||||||
|
|
|
2017 |
|
|
2016 |
|
|
2015 |
|
|||
|
|
|
(In thousands) |
|
|||||||||
|
Domestic |
|
$ |
(2,780 |
) |
|
$ |
(2,435 |
) |
|
$ |
(14,727 |
) |
|
Foreign |
|
|
(2,519 |
) |
|
|
(2,723 |
) |
|
|
1,306 |
|
|
Total loss before income taxes |
|
$ |
(5,299 |
) |
|
$ |
(5,158 |
) |
|
$ |
(13,421 |
) |
The provision for income taxes consisted of:
|
|
|
Year Ended December 31, |
|
|||||||||
|
|
|
2017 |
|
|
2016 |
|
|
2015 |
|
|||
|
|
|
(In thousands) |
|
|||||||||
|
Current |
|
|
|
|
|
|
|
|
|
|
|
|
|
Federal |
|
$ |
293 |
|
|
$ |
— |
|
|
$ |
— |
|
|
State |
|
|
189 |
|
|
|
21 |
|
|
|
8 |
|
|
Foreign |
|
|
1,997 |
|
|
|
531 |
|
|
|
704 |
|
|
Total current |
|
|
2,479 |
|
|
|
552 |
|
|
|
712 |
|
|
Deferred |
|
|
|
|
|
|
|
|
|
|
|
|
|
Federal |
|
|
(293 |
) |
|
|
(1,315 |
) |
|
|
(3,222 |
) |
|
State |
|
|
202 |
|
|
|
(118 |
) |
|
|
(99 |
) |
|
Foreign |
|
|
(95 |
) |
|
|
(1,104 |
) |
|
|
(5 |
) |
|
Total deferred |
|
|
(186 |
) |
|
|
(2,537 |
) |
|
|
(3,326 |
) |
|
Provision (benefit) |
|
$ |
2,293 |
|
|
$ |
(1,985 |
) |
|
$ |
(2,614 |
) |
108
Deferred income taxes reflect the net tax effects of temporary differences between the carrying amounts of assets and liabilities for financial reporting purposes and the amounts used for income tax purposes. Significant components of the Company’s deferred taxes are as follows:
|
|
|
As of December 31, |
|
|||||
|
|
|
2017 |
|
|
2016 |
|
||
|
|
|
(In thousands) |
|
|||||
|
Deferred tax assets: |
|
|
|
|
|
|
|
|
|
Research and development and other credits |
|
$ |
6,187 |
|
|
$ |
5,235 |
|
|
Net operating loss carryforward |
|
|
14,795 |
|
|
|
26,867 |
|
|
Charitable contributions |
|
|
— |
|
|
|
11 |
|
|
Deferred revenue |
|
|
1,355 |
|
|
|
1,115 |
|
|
Stock compensation |
|
|
125 |
|
|
|
17 |
|
|
Accrued expense |
|
|
1,323 |
|
|
|
1,346 |
|
|
Depreciable and amortizable assets |
|
|
29 |
|
|
|
368 |
|
|
Other |
|
|
228 |
|
|
|
— |
|
|
Total deferred tax assets |
|
|
24,042 |
|
|
|
34,959 |
|
|
Deferred tax liabilities: |
|
|
|
|
|
|
|
|
|
Prepaid expenses |
|
|
(1,249 |
) |
|
|
(1,389 |
) |
|
Intangibles |
|
|
(17,232 |
) |
|
|
(32,751 |
) |
|
Total deferred tax assets, net |
|
|
5,561 |
|
|
|
819 |
|
|
Less valuation allowance for deferred tax assets |
|
|
(5,297 |
) |
|
|
(486 |
) |
|
Net deferred tax assets |
|
$ |
264 |
|
|
$ |
333 |
|
As of December 31, 2017, 2016 and 2015, the Company had federal net operating loss carryforwards of approximately $57.8 million and $72.4 million, and $78.5 million, respectively, and research and development credits of approximately $4.2 million, $3.4 million, and $2.7 million, respectively, which will begin to expire beginning in 2024 if not utilized prior to that time. Utilization of the net operating loss and research credit carryforwards is subject to an annual limitation due to the “change in ownership” provisions of the Internal Revenue Code of 1986. However, management has determined via a formal analysis that the annual limitation will not result in the expiration of net operating losses and research credit carryforwards prior to utilization.
As of December 31, 2016, the Company’s reversing taxable temporary differences exceeded the Company’s deferred tax assets in certain foreign jurisdictions. Thus, management determined that it was more likely than not that the benefit associated with its deferred tax assets would be realized in that foreign jurisdiction. As of December 31, 2017, the Company’s deferred tax assets exceeded the Company’s reversing taxable temporary differences in that foreign jurisdiction. Given the Company’s lack of earnings history in that foreign jurisdiction, management determined it was not more likely than not that the benefit of the Company’s deferred tax assets that exceeded its reversing taxable temporary differences would be realized. Thus, a valuation allowance totaling $1.7 million was recorded as of December 31, 2017 and no valuation allowance was recorded for December 31, 2016.
Given the Company’s lack of earnings history in the U.S., management determined it was not more likely than not that the benefit of the Company’s deferred tax assets that exceeded its reversing taxable temporary differences would be realized in the U.S., except for a portion of certain state tax credits that management determined were more likely than not to be realized. Thus, a valuation allowance totaling $3.6 million and $0.5 million was recorded as of December 31, 2017 and 2016, respectively, against the Company’s U.S. deferred tax assets that exceeded its reversing taxable temporary differences and the portion of state credits that are projected to expire unutilized.
The Company’s provision for income taxes differs from the expected tax expense (benefit) amount computed by applying the statutory federal income tax rate of 34% to income before income taxes primarily due to permanent items, the research and development credit, foreign taxes and the application of a valuation allowance for the years ended December 31, 2017, 2016 and 2015.
109
The following table reconciles the Company’s effective tax rate to the federal statutory tax rate:
|
|
|
Year Ended December 31, |
|
|||||||||
|
|
|
2017 |
|
|
2016 |
|
|
2015 |
|
|||
|
U.S. federal taxes at statutory rate |
|
|
34.0 |
% |
|
|
34.0 |
% |
|
|
34.0 |
% |
|
Foreign tax rate differentials |
|
|
(9.1 |
) |
|
|
(11.8 |
) |
|
|
(0.7 |
) |
|
Research and development credit |
|
|
17.8 |
|
|
|
18.2 |
|
|
|
1.8 |
|
|
Foreign tax credit |
|
|
18.3 |
|
|
|
4.7 |
|
|
|
3.9 |
|
|
Stock options |
|
|
(23.6 |
) |
|
|
(3.8 |
) |
|
|
(1.1 |
) |
|
Permanent differences and other |
|
|
(14.4 |
) |
|
|
(7.8 |
) |
|
|
(5.3 |
) |
|
State taxes, net of federal benefit |
|
|
(4.0 |
) |
|
|
(0.1 |
) |
|
|
2.8 |
|
|
Change in state rate |
|
|
(1.9 |
) |
|
|
7.3 |
|
|
|
(11.6 |
) |
|
Change in other valuation allowance due to operations |
|
|
(58.4 |
) |
|
|
(1.9 |
) |
|
|
0.4 |
|
|
Other |
|
|
(2.0 |
) |
|
|
(0.3 |
) |
|
|
4.7 |
|
|
Total income tax (expense) benefit |
|
|
(43.3 |
)% |
|
|
38.5 |
% |
|
|
19.5 |
% |
The reconciliation of unrecognized tax benefits at the beginning and end of the year is as follows (in thousands):
|
Balance at December 31, 2014 |
|
$ |
320 |
|
|
Additions based on tax positions related to prior year |
|
|
366 |
|
|
Balance at December 31, 2015 |
|
$ |
686 |
|
|
Additions based on tax positions related to prior year |
|
|
197 |
|
|
Balance at December 31, 2016 |
|
|
883 |
|
|
Additions based on tax positions related to prior year |
|
|
507 |
|
|
Additions based on tax positions related to current year |
|
|
473 |
|
|
Balance at December 31, 2017 |
|
$ |
1,863 |
|
Beginning December 31, 2014, due to the existence of the valuation allowance, future changes in unrecognized tax benefits did not impact the Company’s effective tax rate. Included in the balance of unrecognized tax benefits as of December 31, 2017, 2016 and 2015 is $1.9 million, $0.9 million and $0.7 million, respectively, of tax benefits that, if recognized, would affect the Company’s effective tax rate.
The Company’s practice is to recognize interest and/or penalties related to income tax matters in income tax expense. During the years ended December 31, 2017, 2016, and 2015 the Company did not record any material interest or penalties.
The Company files tax returns in the U.S. federal jurisdiction, in several state jurisdictions, and in several foreign jurisdictions. The Company is no longer subject to U.S. federal income tax examinations for years before 2013 and is no longer subject to state, local and foreign income tax examinations by tax authorities for years before 2012. The Company is not currently under audit in any jurisdiction.
110
15. Net loss per share attributable to common shareholders
The following table sets forth the calculation of basic and diluted net loss per share during the periods presented:
|
|
|
Year Ended December 31, |
|
|||||||||||||
|
|
|
2017 |
|
|
|
|
2016 |
|
|
|
|
2015 |
|
|||
|
|
|
(In thousands, except share data) |
|
|||||||||||||
|
Numerator: |
|
|
|
|
|
|
|
|
|
|
|
|
|
|
|
|
|
Net loss |
|
$ |
(7,592 |
) |
|
|
|
$ |
(3,173 |
) |
|
|
|
$ |
(10,807 |
) |
|
Deemed dividends to preferred stockholders |
|
|
(21,129 |
) |
|
|
|
|
(23,618 |
) |
|
|
|
|
(21,597 |
) |
|
Net loss attributable to common shareholders |
|
$ |
(28,721 |
) |
|
|
|
$ |
(26,791 |
) |
|
|
|
$ |
(32,404 |
) |
|
|
|
|
|
|
|
|
|
|
|
|
|
|
|
|
|
|
|
Denominator |
|
|
|
|
|
|
|
|
|
|
|
|
|
|
|
|
|
Weighted average shares outstanding used in computing net loss per share |
|
|
|
|
|
|
|
|
|
|
|
|
|
|
|
|
|
Basic |
|
|
52,339,804 |
|
|
|
|
|
45,933,218 |
|
|
|
|
|
43,929,159 |
|
|
Diluted |
|
|
52,339,804 |
|
|
|
|
|
45,933,218 |
|
|
|
|
|
43,929,159 |
|
|
Net loss attributable to common shareholders |
|
|
|
|
|
|
|
|
|
|
|
|
|
|
|
|
|
Basic |
|
$ |
(0.55 |
) |
|
|
|
$ |
(0.58 |
) |
|
|
|
$ |
(0.74 |
) |
|
Diluted |
|
$ |
(0.55 |
) |
|
|
|
$ |
(0.58 |
) |
|
|
|
$ |
(0.74 |
) |
The following weighted average outstanding shares of common stock equivalents were excluded from the computation of the diluted net loss per share attributable to common stockholders for the periods presented because their effect would have been anti-dilutive, and the convertible preferred stock is not included in these calculations as it is contingently convertible based upon a future event (see Note 10):
|
|
|
Year Ended December 31, |
|
|||||||||
|
|
|
2017 |
|
|
2016 |
|
|
2015 |
|
|||
|
Convertible preferred stock on an as-if converted basis |
|
|
|
|
|
|
|
|
|
|
|
|
|
Stock options to purchase common stock |
|
|
2,402,225 |
|
|
|
1,799,632 |
|
|
|
495,315 |
|
|
RSUs issued and outstanding |
|
|
105,404 |
|
|
|
- |
|
|
|
- |
|
|
Non-vested incentive units |
|
|
2,915,228 |
|
|
|
4,931,760 |
|
|
|
7,307,787 |
|
|
Total |
|
|
5,422,857 |
|
|
|
6,731,392 |
|
|
|
7,803,102 |
|
111
16. Geographic information and major customers
ASC 280, “Segment Reporting,” establishes standards for reporting information about operating segments. Operating segments are defined as components of an enterprise about which separate financial information is available that is evaluated regularly by the chief operating decision maker in deciding how to allocate resources and in assessing performance. The Company manages its business on the basis of one reportable segment, and derives revenues from licensing of software, sale of professional services, maintenance and technical support. The following are a summary of consolidated revenues within geographic areas:
|
|
|
Year Ended December 31, |
|
|||||||||
|
|
|
2017 |
|
|
2016 |
|
|
2015 |
|
|||
|
|
|
(In thousands) |
|
|||||||||
|
United States |
|
$ |
134,676 |
|
|
$ |
92,116 |
|
|
$ |
63,440 |
|
|
EMEA (1) |
|
|
33,097 |
|
|
|
25,668 |
|
|
|
20,770 |
|
|
Rest of the World (1) |
|
|
18,283 |
|
|
|
14,628 |
|
|
|
11,146 |
|
|
Total revenue |
|
$ |
186,056 |
|
|
$ |
132,412 |
|
|
$ |
95,356 |
|
|
• |
No single country represented more than 10% of consolidated revenue |
17. Employee Benefit Plans
The Company has established a defined contribution savings plan under Section 401(k) of the Internal Revenue Code (the “401(k) Plan”). The 401(k) Plan covers substantially all employees who meet minimum age and service requirements and allows participants to defer a percentage of their annual compensation as defined in the 401(k) Plan. To date, the Company has made no contributions to the 401(k) Plan.
18. Subsequent Events
None.
Item 9. Changes in and Disagreements with Accountants on Accounting and Financial Disclosure.
None
Item 9A. Controls and Procedures.
Evaluation of Disclosure Controls and Procedures
The Company’s management, including its Chief Executive Officer and Chief Financial Officer, have evaluated the effectiveness of the Company’s disclosure controls and procedures (as such term is defined in Rules 13a-15(e) and 15d-15(e) under the Exchange Act) as of the end of the reporting period covered by this Annual Report on Form 10-K. Based on such evaluation, the Chief Executive Officer and Chief Financial Officer have concluded that, as of the end of the period covered by this Annual Report on Form 10-K, the Company’s disclosure controls and procedures are effective such that material information required to be disclosed by the Company in the reports that it files or submits under the Exchange Act is (i) recorded, processed, summarized and reported within the time periods specified in the SEC’s rules and forms, and (ii) accumulated and communicated to the Company’s management, including its Chief Executive Officer and Chief Financial Officer, as appropriate to allow timely decisions regarding required disclosures.
112
Management’s Report of Internal Control over Financial Reporting
This Annual Report on Form 10-K does not include a report of management's assessment regarding internal control over financial reporting or an attestation report of our registered public accounting firm due to a transition period established by the rules of the SEC for newly public companies.
In finalizing our financial statements for our initial public offering, our independent registered public accounting firm identified a material weakness in our internal control over financial reporting related to our accounting for certain complex, non-routine transactions affecting our presentation of amortization expense related to acquisitions, equity transactions and related disclosure and earnings per share calculations. We are taking measures to remediate the material weakness, including establishing more robust accounting policies and procedures, reviews on the adoption of new accounting positions and financial statement disclosures, and selection and engagement of consultants to assist us in determining positions and evaluating new accounting policies. We have not yet remediated this material weakness as of December 31, 2017 and we cannot assure you that these measures and any further measures that we implement will be sufficient to remediate our existing material weakness or to identify or prevent additional material weaknesses.
Changes in Internal Control over Financial Reporting
There were no changes to our internal control over financial reporting (as defined in Rules 13a‑15(f) and 15d‑15(f) under the Exchange Act) that occurred during the fourth quarter ended December 31, 2017 that have materially affected, or are reasonably likely to materially affect, our internal control over financial reporting.
Inherent Limitations on Effectiveness of Controls
The effectiveness of any system of internal control over financial reporting, including ours, is subject to inherent limitations, including the exercise of judgment in designing, implementing, operating, and evaluating the controls and procedures, and the inability to eliminate misconduct completely. Accordingly, any system of internal control over financial reporting, including ours, no matter how well designed and operated, can only provide reasonable, not absolute assurances. In addition, projections of any evaluation of effectiveness to future periods are subject to the risk that controls may become inadequate because of changes in conditions, or that the degree of compliance with the policies or procedures may deteriorate. We intend to continue to monitor and upgrade our internal controls as necessary or appropriate for our business, but cannot assure you that such improvements will be sufficient to provide us with effective internal control over financial reporting.
None
113
Item 10. Directors, Executive Officers and Corporate Governance.
Executive Officers and Directors
The following table provides information regarding the individuals who are currently serving as our executive officers and directors:
|
Name |
|
Age |
|
Position |
|
Executive Officers: |
|
|
|
|
|
Mark McClain |
|
55 |
|
Chief Executive Officer and Director |
|
Cam McMartin |
|
61 |
|
Chief Financial Officer |
|
Howard Greenfield |
|
53 |
|
Chief Revenue Officer |
|
Non-Employee Directors: |
|
|
|
|
|
Marcel Bernard |
|
79 |
|
Director |
|
William Gregory Bock |
|
67 |
|
Director |
|
Seth Boro |
|
42 |
|
Director |
|
James (Jim) Michael Pflaging |
|
55 |
|
Director |
|
Michael J. Sullivan |
|
53 |
|
Director |
|
Kenneth (Chip) J. Virnig, II |
|
34 |
|
Director |
Executive Officers
Mark McClain co-founded SailPoint in December 2005, has served as our Chief Executive Officer and on our board of directors since that time. He has almost 20 years of experience developing and leading innovative technology companies that have operated in the identity management market. In 2000, he founded Waveset Technologies, a pioneer in the identity management market. Following the acquisition of Waveset by Sun Microsystems in 2003, he served as Vice President of Software Marketing for Sun. His career also includes experience in international sales and marketing with HP (NYSE: HPQ) and IBM Tivoli Systems. Mr. McClain holds a B.A. in Economics from Point Loma Nazarene University and an M.B.A. from the University of California, Los Angeles. Our board of directors believes that Mr. McClain’s industry expertise and his daily insight into corporate matters as our Chief Executive Officer qualify him to serve as a director.
Cam McMartin has served as our Chief Financial Officer since 2011. Mr. McMartin formerly served as Managing Director and Chief Financial Officer for CenterPoint Ventures, a $425 million venture capital group. Before CenterPoint, Mr. McMartin held senior financial management positions with a number of corporations, including Chief Financial Officer at Convex Computer (NYSE: CNX) and Senior VP, Operations at Dazel. Mr. McMartin holds a B.A. in Business Administration from Trinity University and an M.B.A. from the University of Michigan.
Howard Greenfield has served as our Chief Revenue Officer since October 2017 and previously served as our Senior Vice President of Worldwide Sales from July 2014 until October 2017. From 2011 to June 2014, Mr. Greenfield served as Vice President of Worldwide Mobility Sales for Zenprise (acquired by Citrix Systems). His career also includes experience in executive sales leadership roles with Mercury Interactive (acquired by HP), Wanova (acquired by VMware) and Witness Systems (acquired by Verint Systems). Mr. Greenfield holds a B.A. in Finance from Florida Atlantic University.
114
Marcel Bernard has served on our board of directors since September 2014. Since 2003, he has been an Operating Partner of Thoma Bravo and is now a Senior Operating Partner. He has more than 40 years of operating experience with companies primarily in the technology industry. Mr. Bernard’s prior experience includes service as Corporate Vice President, Operations at Geac Computer, a performance management software company, where he was responsible for the management and overall performance of several worldwide business units; President of Motorola Canada; President and CEO of SaskTel, Saskatchewan’s largest phone company; and Senior Vice President, Ontario Division at St. Lawrence Cement, where he was responsible for the management of all Ontario business units. Mr. Bernard currently serves on the board of directors of several software and technology service companies in which certain private equity funds advised by Thoma Bravo hold an investment, including Compuware, Dynatrace, Imprivata, Kofax, Planview, Qlik Technologies and Riverbed Technology. Mr. Bernard holds a B.S. in Engineering Physics from the University of Montreal (Canada) and is a member of the Professional Engineers of Ontario (Canada). Our board of directors believes that Mr. Bernard’s extensive operating and industry experience and overall knowledge of our business qualify him to serve as a director.
William Bock has served on our board of directors since 2011. Mr. Bock has served on the board of directors of Silicon Laboratories (NASDAQ: SLAB) (“Silicon Labs”), a provider of silicon, software and solutions for the Internet of Things, internet infrastructure, industrial, consumer and automotive markets since July 2011. From June 2013 until his retirement in February 2016, Mr. Bock served as the President of Silicon Labs. He also served Silicon Labs as Interim Chief Financial Officer and Senior Vice President from February 2013 until June 2013, Senior Vice President of Finance and Administration from July 2011 through December 2011 and Chief Financial Officer from November 2006 to July 2011. Prior to joining Silicon Labs, Mr. Bock participated in the venture capital industry, principally as a partner with CenterPoint Ventures, and previously held senior executive positions with various venture-backed companies. Mr. Bock began his career with Texas Instruments (NASDAQ: TXN). Mr. Bock holds a B.S. in Computer Science from Iowa State University and an M.S. in Industrial Administration from Carnegie Mellon University. He currently serves on the board of directors of Silicon Labs. Our board of directors believes that Mr. Bock’s extensive financial and industry experience qualify him to serve as a director.
Seth Boro has served on our board of directors since September 2014. Mr. Boro has served as a Managing Partner at Thoma Bravo since 2013. He joined Thoma Bravo in 2005 and became a Partner in 2010, serving in that capacity until becoming a Managing Partner in 2013. Mr. Boro previously was with the private equity firm Summit Partners and with Credit Suisse. Mr. Boro currently serves on the board of directors of several software and technology service companies in which certain private equity funds advised by Thoma Bravo hold an investment, including Compuware, DigiCert, Dynatrace, Hyland Software, McAfee, Qlik Technologies, Riverbed Technology and SolarWinds. Mr. Boro also previously served on the board of directors of other cyber security companies, including Blue Coat Systems, Entrust, SonicWALL and Tripwire. Mr. Boro received his M.B.A. from the Stanford Graduate School of Business and is a graduate of Queen’s University School of Business (Canada), where he received a Bachelor of Commerce degree. Our board of directors believes that Mr. Boro’s board and industry experience and overall knowledge of our business qualify him to serve as a director.
Jim Pflaging has served on our board of directors since January 2015. He has been a principal at The Chertoff Group, a security advisory firm that provides risk management, business strategy and merger and acquisition advisory services, since January 2012. He currently serves as a member of its Operating Committee and is responsible for both the technology sector and strategy practice for The Chertoff Group. In addition, he serves on the board of directors of several private technology companies. Mr. Pflaging has over 30 years of Silicon Valley experience, including 15 years as CEO of cybersecurity and data management companies. Mr. Pflaging received a B.S. in Commerce with dual concentrations in Finance and Marketing from the University of Virginia. Our board of directors believes that Mr. Pflaging’s management and extensive industry experience qualify him to serve as a director.
115
Michael J. Sullivan has served on our board of directors since November 2017. Mr. Sullivan served as the Chief Financial Officer at Ping Identity, an identity security company, from March 2013 until December 2016, and his tenure there culminated in the successful sale of Ping to Vista Equity Partners. Prior to that, Mr. Sullivan served on the boards and chaired the audit committees of two private equity-backed portfolio companies: Vertafore (a SaaS company), from April 2011 until December 2013, and SNL Financial (a business information services company), from December 2011 until April 2014. Prior to that, Mr. Sullivan spent 12 years as the Executive Vice President and Chief Financial Officer of IHS Inc. (now IHS Markit Ltd.), a business information services company (NASDAQ: INFO, formerly NYSE: IHS), which he helped take public and also worked closely with the audit committee of its board of directors. Prior to that, Mr. Sullivan spent three years with the Coors Brewing Company (NYSE: TAP), a consumer packaged goods company, directing the corporate accounting function and leading corporate planning and analysis efforts. He began his career with Price Waterhouse, LLP in New York and Denver, managing the firm’s participation in more than 30 domestic and international mergers and acquisitions, working with a variety of financial and strategic buyers. Mr. Sullivan also served in Price Waterhouse’s audit practice, managing financial audits and audit committee representation for both public and private companies. Mr. Sullivan received a B.A. in Business Administration and Accounting from the University of Iowa. Our board of directors believes that Mr. Sullivan’s extensive management, financial and industry experience as well as his prior board and audit committee experience qualify him to serve as a director.
Chip Virnig has served on our board of directors since September 2014. Since July 2015, he has served as a Principal at Thoma Bravo. Mr. Virnig joined Thoma Bravo in 2008 and served as Vice President prior to his promotion to Principal. Prior to that, Mr. Virnig worked in the investment banking group at Merrill Lynch & Co. He currently serves on the board of directors of several software and technology service companies in which certain private equity funds advised by Thoma Bravo hold an investment, including Compuware, Dynatrace, Imprivata and Qlik Technologies. Mr. Virnig also previously served on the board of directors of other cyber security companies, including Blue Coat Systems. Mr. Virnig received a B.A. in Business Economics, Commerce, Organizations and Entrepreneurship from Brown University. Our board of directors believes that Mr. Virnig’s board and industry experience and overall knowledge of our business qualify him to serve as a director.
Each executive officer serves at the discretion of our board of directors and holds office until his successor is duly elected and qualified or until his earlier resignation or removal. There are no family relationships among any of our directors or executive officers.
Status as a Controlled Company
Because Thoma Bravo beneficially owns 50,317,016 shares of common stock as of March 15, 2018, representing approximately 57.7% of the voting power of our company, we are a controlled company under the Sarbanes-Oxley Act and the rules of the NYSE. A controlled company does not need its board of directors to have a majority of independent directors or to form an independent compensation or nominating and corporate governance committee. As a controlled company, we remain subject to rules of Sarbanes-Oxley Act and the NYSE, which require us to have an audit committee composed entirely of independent directors. Under these rules, we must have at least one independent director on our audit committee by the date our common stock is listed on the NYSE, at least two independent directors on our audit committee within 90 days of the listing date, and at least three independent directors on our audit committee within one year of the listing date. We currently have six independent directors, representing a majority of our board of directors.
If at any time we cease to be a controlled company, we will take all action necessary to comply with the Sarbanes-Oxley Act and rules of the NYSE, including by ensuring that our board of directors is comprised of a majority of independent directors and that we have a compensation committee and a nominating and corporate governance committee, each composed entirely of independent directors, subject to any permitted “phase-in” period.
Section 16(a) Beneficial Ownership Reporting Compliance
Section 16(a) of the Exchange Act requires the Company’s executive officers, directors, and persons who beneficially own more than ten percent of the Company’s common stock to file reports of ownership and changes in ownership of the Company’s common stock with the SEC and the NYSE. These persons are also required by SEC regulation to furnish the Company with copies of all such reports they file. To the Company’s knowledge, based solely on its review of its copies of such reports, or written representations from such persons, the Company believes that all filing requirements applicable to its Directors, executive officers, and beneficial owners of more than ten percent of the Company’s common stock were satisfied during the year ended December 31, 2017.
116
Code of Business Conduct and Ethics
We maintain a Code of Business Conduct and Ethics that incorporates our code of ethics applicable to all employees, including all officers. Our Code of Business Conduct and Ethics is published on the Investor Relations section of our website at www.sailpoint.com. We intend to disclose future amendments to certain provisions of our Code of Business Conduct and Ethics, or waivers of such provisions granted to the principal executive officer, principal financial officer, principal accounting officer or controller or persons performing similar functions on this website within four business days following the date of such amendment or waiver.
Committees of Our Board of Directors
Our board of directors has established an audit committee, a compensation committee and a nominating and corporate governance committee, and may have such other committees as the board of directors may establish from time to time. The composition and responsibilities of each of the committees of our board of directors is described below.
For so long as Thoma Bravo beneficially owns at least 30% of our outstanding shares of common stock, Thoma Bravo will have the right to designate the chairman of each committee of our board of directors and the directors nominated by Thoma Bravo constitute a majority of each committee of our board of directors (other than the audit committee), and our committee membership complies with all applicable rules of the NYSE.
Audit Committee
Our audit committee consists of Messrs. Pflaging, Sullivan and Virnig. Messrs. Pflaging and Sullivan satisfy the requirements for independence and financial literacy under the applicable rules and regulations of the SEC and listing standards of the NYSE. Mr. Sullivan, who qualifies as an “audit committee financial expert” as defined in the rules of the SEC and satisfies the financial expertise requirements under the listing standards of the NYSE, serves as the chair of our audit committee.
Our audit committee, which operates under a charter that is posted on the Investor Relations section of our website at www.sailpoint.com, is, among other things, responsible for:
|
|
• |
selecting a qualified firm to serve as the independent registered public accounting firm to audit our financial statements; |
|
|
• |
helping to ensure the independence and performance of the independent registered public accounting firm; |
|
|
• |
discussing the scope and results of the audit with the independent registered public accounting firm, and reviewing, with management and the independent registered public accounting firm, our interim and year-end operating results; |
|
|
• |
developing procedures for employees to submit concerns anonymously about questionable accounting or audit matters; |
|
|
• |
reviewing our policies on risk assessment and risk management; |
|
|
• |
reviewing related party transactions; and |
|
|
• |
approving or, as required, pre-approving, all audit and all permissible non-audit services, other than de minimis non-audit services, to be performed by the independent registered public accounting firm. |
Our audit committee operates under a written charter that satisfies the applicable rules and regulations of the SEC and the listing standards of the NYSE.
Compensation Committee
Our compensation committee consists of Messrs. Bock and Boro. Mr. Bock serves as the chair of our compensation committee. Because we are a controlled company under the Sarbanes-Oxley Act and rules of the NYSE, we are not required to have a compensation committee composed entirely of independent directors.
117
Our compensation committee, which operates under a charter that is posted on the Investor Relations section of our website at www.sailpoint.com, is, among other things, responsible for:
|
|
• |
reviewing and approving the goals and objectives relating to the compensation of our executive officers, including any long-term incentive components of our compensation programs; |
|
|
• |
evaluating the performance of our executive officers in light of the goals and objectives of our compensation programs and determining each executive officer’s compensation based on such evaluation; |
|
|
• |
overseeing, reviewing and approving our compensation programs as they relate to our employees; |
|
|
• |
reviewing the operation and efficacy of our executive compensation programs in light of their goals and objectives; |
|
|
• |
reviewing and assessing risks arising from our compensation programs; |
|
|
• |
reviewing and recommending to the board of directors the appropriate structure and amount of compensation for our directors; |
|
|
• |
reviewing and approving, subject, if applicable, to stockholder approval, material changes in our employee benefit plans; and |
|
|
• |
establishing and periodically reviewing policies for the administration of our equity compensation plans. |
Nominating and Corporate Governance Committee.
Our nominating and corporate governance committee consists of Messrs. Bernard and Bock. Mr. Bock serves as the chair of our nominating and corporate governance committee. Because we are a controlled company under the Sarbanes-Oxley Act and rules of the NYSE, we are not required to have a nominating and corporate governance committee composed entirely of independent directors.
Our nominating and corporate governance committee, which operates under a charter that is posted on the Investor Relations section of our website at www.sailpoint.com, is, among other things, responsible for:
|
|
• |
identifying, evaluating and recommending qualified nominees to serve on our board of directors; |
|
|
• |
considering and making recommendations to our board of directors regarding the composition of the committees of our board of directors; |
|
|
• |
instituting plans or programs for the continuing education of our board of directors and orientation of new directors; |
|
|
• |
developing and making recommendations to our board of directors regarding corporate governance guidelines and matters; and |
|
|
• |
overseeing periodic evaluations of our board of directors’ performance, including committees of our board of directors and management. |
Director Recommendations
The Nominating and Corporate Governance Committee, in recommending director candidates, and the Board, in nominating director candidates, will evaluate candidates in accordance with the qualification standards set forth in our Corporate Governance Guidelines. For so long as Thoma Bravo beneficially owns at least 30% of our outstanding shares of common stock, Thoma Bravo will have the right to nominate a majority of the Board.
118
The Nominating and Corporate Governance Committee will consider director candidates recommended by stockholders in the same manner it considers other candidates, but it has no obligation to recommend such candidates. A stockholder that wants to recommend a candidate for election to the Board should send a recommendation in writing to SailPoint Technologies Holdings, Inc., c/o Corporate Secretary, 11305 Four Points Drive, Building 2, Suite 100, Austin, Texas 78726. Such recommendation should describe the candidate’s qualifications and other relevant biographical information and provide confirmation of the candidate’s consent to serve as director.
Stockholders may also nominate directors at the annual meeting by adhering to the advance notice procedures described in the Company’s bylaws.
Item 11. Executive Compensation.
2017 Summary Compensation Table
The following table summarizes the compensation awarded to, earned by, or paid to our principal executive officer and our next two most highly-compensated executive officers (our “Named Executive Officers”) for the fiscal year ended December 31, 2017.
|
|
|
|
|
|
|
|
|
|
|
|
|
|
|
|
|
|
|
|
|
Non-Equity |
|
|
|
|
|
|
|
Name and Principal |
|
|
|
|
|
|
|
|
|
|
|
Stock |
|
|
Option |
|
|
Incentive Plan |
|
|
|
|
|
|||
|
Position |
|
Year |
|
Salary |
|
|
Bonus |
|
|
Awards |
|
|
Awards |
|
|
Compensation |
|
|
Total |
|
||||||
|
(a) |
|
(b) |
|
($)(c) |
|
|
($)(d)(1) |
|
|
($)(e)(2) |
|
|
($)(f)(3) |
|
|
($)(g)(4) |
|
|
($)(j) |
|
||||||
|
Mark McClain, |
|
|
|
|
|
|
|
|
|
|
|
|
|
|
|
|
|
|
|
|
|
|
|
|
|
|
|
Chief Executive Officer |
|
2017 |
|
$ |
330,000 |
|
|
$ |
— |
|
|
$ |
3,253,110 |
|
(5) |
$ |
1,076,000 |
|
|
$ |
214,914 |
|
|
$ |
4,874,024 |
|
|
|
|
2016 |
|
$ |
307,500 |
|
|
$ |
22,554 |
|
|
$ |
— |
|
|
$ |
— |
|
|
$ |
96,769 |
|
|
$ |
426,823 |
|
|
Cam McMartin, (6) |
|
|
|
|
|
|
|
|
|
|
|
|
|
|
|
|
|
|
|
|
|
|
|
|
|
|
|
Chief Financial Officer |
|
2017 |
|
$ |
287,500 |
|
|
$ |
100,000 |
|
|
$ |
1,411,694 |
|
(7) |
$ |
538,000 |
|
|
$ |
158,433 |
|
|
$ |
2,495,627 |
|
|
|
|
|
|
|
|
|
|
|
|
|
|
|
|
|
|
|
|
|
|
|
|
|
|
|
|
|
|
Howard Greenfield, |
|
|
|
|
|
|
|
|
|
|
|
|
|
|
|
|
|
|
|
|
|
|
|
|
|
|
|
Chief Revenue Officer(8) |
|
2017 |
|
$ |
300,000 |
|
|
$ |
— |
|
|
$ |
1,266,197 |
|
(9) |
$ |
600,893 |
|
(10) |
$ |
295,892 |
|
|
$ |
2,462,982 |
|
|
|
|
2016 |
|
$ |
235,000 |
|
|
$ |
25,100 |
|
|
$ |
32,656 |
|
|
$ |
32,656 |
|
|
$ |
240,223 |
|
|
$ |
565,635 |
|
|
Kevin Cunningham, |
|
|
|
|
|
|
|
|
|
|
|
|
|
|
|
|
|
|
|
|
|
|
|
|
|
|
|
President(11) |
|
2017 |
|
$ |
310,000 |
|
|
$ |
— |
|
|
$ |
2,053,110 |
|
(5) |
$ |
— |
|
|
$ |
159,464 |
|
|
$ |
2,522,574 |
|
|
|
|
2016 |
|
$ |
307,500 |
|
|
$ |
22,554 |
|
|
$ |
— |
|
|
$ |
— |
|
|
$ |
96,769 |
|
|
$ |
426,823 |
|
|
(1) |
With respect to Mr. McMartin, reflects a discretionary bonus paid in excess of the amount earned pursuant to our corporate bonus plan. This amount was paid during the first quarter of 2018. |
|
(2) |
Amounts reported reflect the aggregate grant date fair value, computed in accordance with FASB ASC Topic 718, of restricted stock units granted to our Named Executive Officers during fiscal year 2017. Pursuant to SEC rules, the amounts shown exclude the effect of estimated forfeitures. Amounts also include modifications to our outstanding restricted stock awards to convert performance vesting conditions to service based vested conditions in connection with our initial public offering. For additional information regarding the assumptions underlying this calculation please see Note 11 of our accompanying Consolidated Financial Statements included in Part II, Item 8 of this Annual Report on Form 10-K. |
|
(3) |
Amounts reported reflect the aggregate grant date fair value, computed in accordance with FASB ASC Topic 718, of stock options granted to our Named Executive Officers during fiscal year 2017. Pursuant to SEC rules, the amounts shown exclude the effect of estimated forfeitures. Amounts also include modifications to our outstanding stock options to convert performance vesting conditions to service based vested conditions in connection with our initial public offering. For additional information regarding the assumptions underlying this calculation please see Note 11 of our accompanying Consolidated Financial Statements included in Part II, Item 8 of this Annual Report on Form 10-K. |
|
(4) |
With respect to fiscal 2017 amounts, reflect amounts for services provided in fiscal 2017 pursuant to our annual cash incentive programs, which were paid to our Named Executive Officers during the first quarter of 2018. Messrs. McClain, McMartin and Cunningham participate in our corporate bonus plan. Mr. Greenfield participates in a sales incentive plan. |
119
|
(6) |
Mr. McMartin was not a named executive officer during 2016 and therefore, this table does not provide compensation data for him for 2016. |
|
(7) |
Amounts reported reflect a modification of outstanding restricted stock awards to convert performance vesting conditions to service based vested conditions in connection with our initial public offering. Pursuant to FASB ASC Topic 718 and SEC rules, the full grant date fair value of the award on the date of modification is reportable resulting in an additional $811,694 associated with equity awards previously granted in 2014. |
|
(8) |
Mr. Greenfield was promoted to Chief Revenue Officer in October 2017. Prior to that time he was SVP of Worldwide Sales. |
|
(9) |
Amounts reported reflect a modification of outstanding restricted stock awards to convert performance vesting conditions to service based vested conditions in connection with our initial public offering. Pursuant to FASB ASC Topic 718 and SEC rules, the full grant date fair value of the award on the date of modification is reportable resulting in an additional $716,201 associated with equity awards previously granted in 2014. |
|
(10) |
Amounts reported reflect a modification of outstanding stock options to convert performance vesting conditions to service based vested conditions in connection with our initial public offering. Pursuant to FASB ASC Topic 718 and SEC rules, the full grant date fair value of the award on the date of modification is reportable resulting in an additional $107,730 associated with equity awards previously granted in 2014. |
|
(11) |
Mr. Cunningham resigned from his position as our President in October 2017 and is no longer an executive officer. |
Narrative Disclosure to Summary Compensation Table
Base Salary
Each Named Executive Officer’s base salary is a fixed component of annual compensation for performing specific job duties and functions. Historically, our board of directors has established the annual base salary rate for each of the Named Executive Officers at a level necessary to retain the individual’s services, and reviews base salaries on an annual basis in consultation with the Chief Executive Officer (other than with respect to his own salary). The board of directors has historically made adjustments to the base salary rates of the Named Executive Officers upon consideration of any factors that it deems relevant, including but not limited to: (i) any increase or decrease in the executive’s responsibilities, (ii) the executive’s job performance, and (iii) the level of compensation paid to executives of other companies with which we compete for executive talent, as estimated based on publicly available information and the experience of members of our board of directors and our Chief Executive Officer.
Annual Bonus
Our annual bonus awards have historically been subject to performance targets established annually by our board of directors. Messrs. McClain, McMartin and Cunningham participate in our corporate bonus plan. In 2017, Mr. McClain had a target bonus of 40% of base salary (with a maximum of 60%) for January 1 to June 30 and a target bonus of 60% of base salary (with a maximum of 90%) for July 1 to December 31. Mr. McMartin had a target bonus of 35% of base salary (with a maximum of 52.5%) for January 1 to June 30 and a target bonus of 50% of base salary (with a maximum of 75%) for July 1 to December 31. Mr. Cunningham had a target bonus amount of 40% of base salary with a maximum bonus potential of 60% of base salary for the entire year. The performance criteria under our corporate bonus plan in 2017 were EBITDA and new bookings (whether with respect to new licenses, initial maintenance contracts or software-as-a-service subscription agreements). EBITDA and new bookings were each weighted 50% towards the total bonus that could be potentially earned; however, our board of directors established a minimum EBITDA threshold that must be achieved for any bonus to be payable. Our board of directors retained the discretion to pay a larger bonus than the amount earned pursuant to the formula established under our corporate bonus plan. The discretionary amount paid to Mr. McMartin is reported in the Summary Compensation Table above in the “Bonus” column.
In 2017, Mr. Greenfield participated in our sales incentive plan based solely upon new bookings. His target bonus was 100% of his base salary with no maximum.
120
The bonuses for 2017 were paid following a year-end review of the applicable performance criteria. The actual bonus amounts paid to each Named Executive Officer for 2017 (including the discretionary portion paid to Mr. McMartin) are as follows:
|
Name |
|
Award Payout |
|
|
|
Mark McClain |
|
$ |
214,914 |
|
|
Cam McMartin |
|
$ |
258,433 |
|
|
Howard Greenfield |
|
$ |
295,892 |
|
|
Kevin Cunningham |
|
$ |
159,464 |
|
The Named Executive Officers generally must be employed on the date the awards are actually paid in order to receive payment.
Long Term Incentive Compensation
Prior to our initial public offering we offered long-term incentives to our Named Executive Officers through stock option awards that are immediately exercisable for shares of restricted stock and through shares of restricted stock purchased by the Named Executive Officers, in each case subject to continued vesting. To the extent stock awards are reported in the Outstanding Equity Awards at 2017 Fiscal Year-End table below, for the most part, those awards were granted as stock options which were exercised for shares of restricted stock. In the event of a termination of employment prior to vesting (or a termination due to cause) the restricted shares will be repurchased by us for an amount equal to the price paid by the executive to exercise the option (or, if less, the fair market value of such shares). However, following our initial public offering we began granting restricted stock units for which no purchase price was paid. Those awards do not provide for repurchase upon forfeiture. In addition, stock options granted in connection with and following our initial public offering are only exerciseable following vesting and are not subject to later repurchase by SailPoint.
The equity awards granted to our Named Executive Officers prior to our initial public offering vest 50% based on the passage of time and continued performance of services and 50% based upon the achievement of performance conditions. The time-based portion of our equity awards vests over four years, with 25% of the award vesting on the one-year anniversary of the date of grant and the remainder of the award vesting monthly thereafter in substantially equal installments. In connection with our initial public offering, outstanding awards of stock options and shares of restricted stock (or portions thereof) subject to the achievement of performance conditions were amended to vest in annual installments on January 15 of each calendar year following the date of grant (provided the employee continues to perform services to such date) with any remaining amounts vesting on the later of (i) the 15th day of the month following the fourth anniversary of the date of grant and (ii) January 15, 2019.
The restricted stock units granted in connection with and following our initial public offering vest and will be settled in shares of our common stock in four substantially equal annual installments beginning in the year following the year of grant (the first vesting date is roughly a year following the date of grant but may be slightly longer than a year to provide for vesting on dates likely to be in an open trading window to allow for transactions in vesting awards to cover any tax withholding). Stock options also vest over a four year period. One-fourth of the stock option vests on the one year anniversary of the date of grant and the remainder of the award vests in substantially equal monthly installments over the remaining three year period.
Long Term Incentive Plan
Equity awards granted in connection with and following our initial public offering are awarded under our 2017 Long Term Incentive Plan (the “2017 LTIP”). Please see “Equity Compensation Plan Information” at Item 12 below of this Annual Report on Form 10-K for a summary of the terms of the 2017 LTIP.
121
In addition to the 2017 LTIP, our board of directors has adopted the Employee Stock Purchase Plan (the “ESPP”). Please see “Equity Compensation Plan Information” at Item 12 below of this Annual Report on Form 10-K for a summary of the terms of the ESPP.
Other Compensation Elements
We offer participation in broad-based retirement, health and welfare plans to all of our employees. We currently maintain a retirement plan intended to provide benefits under section 401(k) of the Internal Revenue Code, under which employees, including our Named Executive Officers, are allowed to contribute portions of their base compensation to a tax-qualified retirement account. See “Additional Narrative Disclosure—Retirement Benefits” for more information.
Outstanding Equity Awards at 2017 Fiscal Year-End
The following table reflects information regarding outstanding equity-based awards held by our Named Executive Officers as of December 31, 2017.
|
|
|
Option Awards |
|
|
Stock Awards |
|
||||||||||||||||||
|
Name (a) |
|
Number of Securities Underlying Unexercised Options (#) Exercisable(b)(1) |
|
|
Number of Securities Underlying Unexercised Options (#) Unexercisable (c) |
|
|
|
Option Exercise Price ($)(e) |
|
|
Option Expiration Date (f) |
|
Number of Shares or Units of Stock That Have Not Vested (#)(g)(2) |
|
|
|
Market Value of Shares or Units of Stock That Have Not Vested ($)(h)(3) |
|
|||||
|
Mark McClain |
|
— |
|
|
|
200,000 |
|
(4) |
|
$ |
12.00 |
|
|
11/16/2027 |
|
|
469,532 |
|
(5) |
|
$ |
6,808,214 |
|
|
|
Cam McMartin |
|
— |
|
|
|
100,000 |
|
(4) |
|
$ |
12.00 |
|
|
11/16/2027 |
|
|
196,094 |
|
(6) |
|
$ |
2,843,479 |
|
|
|
Howard Greenfield |
|
|
13,333 |
|
|
|
26,667 |
|
(7) |
|
$ |
1.36 |
|
|
4/29/2026 |
|
|
174,740 |
|
(8) |
|
$ |
2,533,730 |
|
|
|
|
— |
|
|
|
91,666 |
|
(4) |
|
$ |
12.00 |
|
|
11/16/2027 |
|
— |
|
|
|
— |
|
|||
|
Kevin Cunningham (9) |
|
— |
|
|
— |
|
|
|
— |
|
|
— |
|
|
369,532 |
|
|
|
$ |
5,358,214 |
|
|||
|
(1) |
Because the stock options granted to our Named Executive Officers prior to our initial public offering were immediately exercisable, this column reflects the number of options held by Mr. Greenfield that were exercisable and vested as of December 31, 2017. The treatment of these awards upon certain termination and change in control events is described below under “Additional Narrative Disclosure—Potential Payments Upon a Termination or Change in Control.” |
|
(2) |
The stock awards reported in this column are subject to time-based vesting conditions. The stock awards granted prior to our initial public offering were originally granted as shares of restricted stock subject to continued vesting conditions and a substantial risk of forfeiture. Our Named Executive Officers paid a purchase price of $0.0517 per share to purchase the shares. In the event the shares are eventually forfeited, we will repay the executive his $0.0517 per share purchase price. The restricted stock units granted in connection with our initial public offering do not have a repurchase price associated with forfeiture. The treatment of these awards upon certain termination and change in control events is described below under “Additional Narrative Disclosure—Potential Payments Upon a Termination or Change in Control.” |
|
(3) |
Calculated based on the fair market value of our common stock on December 31, 2017, which was $14.50 per share. This value includes the exercise price of $0.0517 per share previously paid by each Named Executive Officer with respect to the following number of shares for each Named Executive Officer: Mr. McClain 369,532, Mr. McMartin 146,094, Mr. Greenfield 128,907, and Mr. Cunningham 369,532. |
|
(4) |
Represents stock options granted in connection with our initial public offering. One quarter of the award will vest on November 16, 2018 and the remainder of the award will vest in substantially equal monthly installments through November 16, 2021. |
|
(5) |
100,782 shares of restricted stock will vest in substantially equal monthly installments through September 8, 2018. 268,750 shares of restricted stock vested (or will vest) in substantially equal installments on January 15, 2018 and 2019. The remaining 100,000 shares are unvested restricted stock units granted in connection with our initial public offering that will vest and be settled in four substantially equal annual installments beginning November 20, 2018. The treatment of these awards upon certain termination and change in control events is described below under “Additional Narrative Disclosure—Potential Payments Upon a Termination or Change in Control.” |
122
|
(7) |
Because all stock options granted to our Named Executive Officers prior to our initial public offering were immediately exercisable, this amount reflects the number of options subject to time-based vesting held by Mr. Greenfield that were exercisable but unvested as of December 31, 2017. 11,667 unvested options vest monthly in substantially equal installments through April 29, 2020. Of the remaining 15,000 stock options, 5,000 vested on January 15, 2018 and the remaining 10,000 vest in equal installments on January 15, 2019 and 2020. The treatment of these awards upon certain termination and change in control events is described below under “Additional Narrative Disclosure—Potential Payments Upon a Termination or Change in Control.” |
|
(8) |
35,157 shares of restricted stock will vest in substantially equal monthly installments through September 8, 2018. 93,750 shares of restricted stock vested (or will vest) in substantially equal installments on January 15, 2018 and 2019. The remaining 45,833 shares are unvested restricted stock units granted in connection with our initial public offering that will vest and be settled in four substantially equal annual installments beginning November 20, 2018. The treatment of these awards upon certain termination and change in control events is described below under “Additional Narrative Disclosure—Potential Payments Upon a Termination or Change in Control.” |
|
(9) |
Mr. Cunningham resigned from his position as President in October 2017 but has continued to have a service relationship with us. Consequently his equity awards have remained outstanding and continue to vest. |
Additional Narrative Disclosure
Retirement Benefits
We have not maintained, and do not currently maintain, a defined benefit pension plan or nonqualified deferred compensation plan. We currently maintain a retirement plan intended to provide benefits under section 401(k) of the Internal Revenue Code where employees, including our Named Executive Officers, are allowed to contribute portions of their base compensation to a tax-qualified retirement account. We do not provide matching or profit sharing contributions under the plan.
Potential Payments Upon Termination or Change in Control
We previously entered into an offer letter with each of Messrs. Greenfield and McMartin and a Senior Management and Restricted Stock Agreement with each of Messrs. McClain and Cunningham. These agreements provide for basic terms including position, starting salary and severance protections. Our Named Executive Officers are also subject to noncompetition and nonsolicitation restrictive covenants for a period of eighteen (or twelve, in the case of Mr. Greenfield) months following any termination of employment.
The offer letters for Messrs. McMartin and Greenfield also each contain a bonus target equal to a percentage of base salary (15% in the case of Mr. McMartin and 100% in the case of Mr. Greenfield) and limited severance protection for Mr. Greenfield. To the extent Mr. Greenfield is terminated without “Cause,” and subject to the execution of a release, he will receive continued payment of his base salary for a period up to 90 days following his termination of employment. To the extent he secures full-time employment within that 90-day period, the severance payments will immediately cease. To the extent Mr. Greenfield is terminated without “Cause” or resigns for “Good Reason” (as defined in his offer letter), he will receive accelerated vesting of any time based equity awards that would have vesting during the 12 month period following termination had he continued performing services. In addition, pursuant to Messrs. McMartin’s and Greenfield’s restricted stock agreements, if their employment is terminated without “Cause” or for “Good Reason” (in each case, as defined in their restricted stock agreement and restricted stock unit agreement) within twelve months following a “Sale of the Company,” then 100% of their unvested restricted stock will become vested.
123
The Senior Management and Restricted Stock Agreements entered into by Messrs. McClain and Cunningham contain, in addition to provisions governing the equity grants, certain severance provisions. The agreements were entered into in connection with the purchase of restricted stock by the executives. In the event of a termination without “Cause” or due to “Good Reason,” and subject to the execution of a release, the executive will receive the following payments and benefits (i) continued base salary for a period of 12 months ($350,000 for Mr. McClain and $310,000 for Mr. Cunningham), (ii) a lump sum payment equal to his annual target bonus (but only if he would have achieved his financial objectives for the fiscal year of his termination, based on the pro-rata results actually achieved by him prior to the date of his termination as compared to the pro-rata objectives established for his target bonus for the then-current fiscal year), (iii) monthly payments equal to his premiums for group health plan continuation under the Consolidated Omnibus Budget Reconciliation Act of 1985 (“COBRA”) for a period of 12 months, and (iv) accelerated vesting of any time based equity awards that would have vesting during the 12 month period following termination had he continued performing services. The outstanding, unvested restricted stock awards held by Messrs. McClain and Cunningham will become 100% vested upon the occurrence of a “Liquidity Event.”
“Cause” is defined in the restricted stock agreements with our Named Executive Officers as a vote of our board of directors that the executive’s employment should be terminated as a result of (i) a conviction of a felony, (ii) any other act of fraud, intentional misrepresentation, moral turpitude, misappropriation or embezzlement, illegality or unlawful harassment that would materially and adversely impact our business or reputation or expose us to material liability, (iii) the repeated willful failure of the executive to follow the reasonable directors of our board of directors in connection with our business affairs, (iv) a material breach of the agreement by the executive or (v) the willful and deliberate nonperformance by the executive of his duties. In connection with a termination described in clauses (iii), (iv) and (v), the executive will have a period of 30 days to cure the act or omission constituting “Cause.” “Cause” is defined in Messrs. McMartin’s and Greenfield’s offer letters as (i) gross negligence or willful misconduct in the performance of his duties, (ii) his failure to perform one or more of his material duties and responsibilities which has continued following written notice and reasonable opportunity to cure (which will not exceed thirty days), (iii) fraud or intentional misconduct, (iv) a conviction of a crime involving moral turpitude or a felony or entering a plea of guilty or nolo contendere or into a plea or settlement agreement to such crime, (v) his willful refusal without proper legal reason to perform his duties and responsibilities or his failure to abide by and comply with our written policies and procedures that remain uncorrected for thirty days, (vi) a material breach of his offer letter or his Propriety Information and Inventions Agreement that is not otherwise cured within thirty days following written notice of breach, (vii) alcohol abuse or illegal drug use determined in the sole discretion of the Chief Executive Officer or President or other reporting officer to impair his ability to perform his duties, or (viii) upon his becoming unable to substantially perform, with reasonable accommodation, his duties as a result of a physical or mental impairment as reasonable determined by a licensed physician selected or approved by us.
“Good Reason” is defined in the restricted stock and agreements with our Named Executive Officers (including Mr. Greenfield’s and Mr. McMartin’s) as a resignation resulting from (i) the executive’s reduction in base salary (other than an across the board salary reduction, not to exceed 10%, due to our financial performance that similarly impacts all senior management employees, or, in the case of Mr. Greenfield a material reduction in base salary), (ii) our failure to pay a material incentive compensation contemplated under the agreement, (iii) any material breach by us of the agreement, (iv) a material reduction in the executive’s responsibilities (other than a change resulting from the integration of our operations into an acquirer in a “Liquidity Event”), (v) in the case of Mr. McClain, the removal of Mr. McClain from the position of Chief Executive Officer other than in connection with a “Liquidity Event,” (vi) in the case of Mr. Cunningham, the removal of Mr. Cunningham from the position of President other than in connection with a “Liquidity Event,” or (vii) the relocation of the executive’s principal place of employment in excess of 25 miles (or, in the case of Mr. Greenfield, a material change in geographic location); in each case, without the Named Executive Officer’s consent. “Good Reason” requires written notice from the executive within 90 days of the occurrence of the condition constituting “Good Reason,” a 30-day period during which we may cure the occurrence of “Good Reason” and, if such condition persists, a termination by the executive within 60 days following the cure period. “Good Reason” in Mr. Greenfield’s offer letter is defined as (i) a reduction of more than twenty percent of the executive’s base compensation unless in connection with similar decreases in the base compensation of other executive officers of the Company, or (ii) the relocation of the executive’s primary work location out of its current metropolitan area without the executive’s written consent, provided that within the thirty day period immediately following such event we are notified the executive is electing to terminate employment if we fail to cure such event. We have a thirty day period to cure such event.
124
“Liquidity Event” is defined as (i) any transaction or series of transactions (other than certain financing transactions) resulting in an acquirer possessing sufficient voting power to elect a majority of our board of directors (ii) the sale of all or substantially all of our assets, or (iii) a “Sale of the Company.” “Sale of the Company” is defined in our stockholders agreement as a sale of our company with the approval of our board of directors and the Thoma Bravo Funds.
Director Compensation
Prior to our initial public offering, directors who also represented Thoma Bravo, the private equity firm who held a controlling interest in our equity, did not receive additional compensation for serving on the Board; following our initial public offering, such representatives are entitled to compensation for serving as our non-employee directors. For 2017, our non-employee directors were entitled to receive a cash retainer and committee and chairmanship fees payable in cash on a quarterly basis and an annual award of restricted stock units as provided below:
|
|
|
Compensation in 2017 |
|
|
|
Annual cash retainer |
|
$ |
30,000 |
|
|
Additional annual cash retainer for the Chairman of the Board |
|
$ |
20,000 |
|
|
Additional annual cash retainer for Chairman of the Audit Committee |
|
$ |
20,000 |
|
|
Additional cash retainer for members of the Audit Committee |
|
$ |
10,000 |
|
|
Additional cash retainer for the Chairman of the Compensation Committee |
|
$ |
12,000 |
|
|
Additional annual cash retainer for members of the Compensation Committee |
|
$ |
6,000 |
|
|
Additional annual cash retainer for Chairman of the Nominating & Corporate Governance Committee |
|
$ |
7,500 |
|
|
Additional cash retainer for members of the Nominating & Corporate Governance Committee |
|
$ |
3,750 |
|
|
Annual equity retainer of restricted stock units |
|
$ |
170,000 |
|
Prior to our initial public offering, our non-employee directors purchased restricted stock in connection with their appointment to the board (vesting in accordance with our standard vesting schedule of 25% on the first anniversary of grant and in substantially equal monthly increments thereafter through the fourth anniversary of grant, provided that, with respect to Mr. Lines, upon ceasing to serve on the board in October 2017, his unvested shares became fully vested). In the case of each director holding equity, the exercise price paid with respect to the restricted stock was $0.0517 per share. In the event the director’s board service ceases for any reason, we have the right to repurchase the restricted stock. We currently do not intend to exercise our repurchase right with respect to Mr. Lines’ restricted stock. The purchase price for unvested restricted stock will be equal to the lesser of the fair market value and the purchase price originally paid for the stock, and the purchase price for vested restricted stock will be equal to the fair market value of the stock, provided that if the director’s board service was terminated for “Cause,” then the purchase price for all shares of restricted stock (whether vested or unvested) will be equal to the lesser of the fair market value and the purchase price originally paid for the stock. “Cause” means (i) the commission of a felony or other crime involving moral turpitude or the commission of any other act or omission involving dishonesty, disloyalty or fraud, (ii) report to work under the influence of alcohol or illegal drugs, the use of illegal drugs or other conduct causing substantial public disgrace or material economic harm to us or our affiliates, (iii) an act or omission which in the opinion of a reasonable business person would be expected to aid or abet a competitor, supplier or customer of ours to our material disadvantage, (iv) any breach of fiduciary duty or act of gross negligence or willful misconduct, or (v) any breach of any material agreement with us.
125
Following our initial public offering, we began granting restricted stock units for which no purchase price was paid. Those awards do not provide for repurchase upon forfeiture. On November 16, 2017, Messrs. Bernard, Bock, Boro, Pflaging and Virnig received an award of 8,263 restricted stock units that vests on June 17, 2018. On November 21, 2017, Mr. Sullivan received an award of 8,263 restricted stock units that vests on June 17, 2018.
|
Name (1) |
|
Fees Earned or Paid in Cash ($) |
|
|
Unit Awards (3) |
|
|
Total ($) |
|
|||
|
Marcel Bernard (2) |
|
$ |
50,458 |
|
|
|
99,156 |
|
|
$ |
149,614 |
|
|
William Bock |
|
$ |
23,606 |
|
|
|
99,156 |
|
|
$ |
122,762 |
|
|
Seth Boro |
|
$ |
4,400 |
|
|
|
99,156 |
|
|
$ |
103,556 |
|
|
Orlando Bravo (1)(4) |
|
— |
|
|
— |
|
|
— |
|
|||
|
James Lines (2)(4) |
|
$ |
50,000 |
|
|
— |
|
|
$ |
50,000 |
|
|
|
Jim Pflaging |
|
$ |
22,444 |
|
|
|
99,156 |
|
|
$ |
121,600 |
|
|
Michael Sullivan (5) |
|
$ |
5,556 |
|
|
|
112,129 |
|
|
$ |
117,685 |
|
|
Chip Virnig |
|
$ |
4,889 |
|
|
|
99,156 |
|
|
$ |
104,045 |
|
|
(1) |
Mr. Bravo is included in the table but received no compensation for his services since he was a member of the board and a representative of Thoma Bravo prior to our initial public offering and resigned prior to our initial public offering. |
|
(2) |
Messrs. Bernard and Lines are operating partners of, but not employees of, Thoma Bravo, its affiliates or the Thoma Bravo Funds. Messrs. Bernard and Lines may be considered independent contractors of Thoma Bravo and may have business or investment activities unrelated to Thoma Bravo. |
|
(3) |
Reflects the aggregate grant date fair value of restricted stock units granted to non-employee directors, computed in accordance with FASB ASC Topic 718, determined without regard to forfeitures. See Note 11 of our accompanying Consolidated Financial Statements included in Part II, Item 8 of this Annual Report on Form 10-K, for a discussion of the assumptions used in determining the FASB ASC Topic 718 grant date fair value of these awards Messrs. This award was prorated to reflect service for a seven-month period beginning November 21, 2017. Bernard, Bock and Pflaging held 47,387, 48,955, and 27,380 unvested shares of restricted stock, respectively, as of December 31, 2017. Messrs. Bernard, Bock, Boro, Pflaging, Sullivan and Virnig each held 8,263 unvested restricted stock units as of December 31, 2017. |
|
(4) |
In October 2017, Messrs. Bravo and Lines resigned as directors. |
|
(5) |
Mr. Sullivan was appointed to the board on November 21, 2017. |
Compensation Committee Interlocks and Insider Participation
During 2017, our compensation committee was comprised of Messrs. Bock and Boro. None of the members of our compensation committee is an officer or employee of our company, nor have they ever been an officer or employee of our company. None of our executive officers currently serves, or in the past year has served, as a member of the board of directors or compensation committee of any entity that has one or more executive officers serving on our board of directors or compensation committee.
In September 2014, we entered into an advisory services agreement (the “Consulting Agreement”) with Thoma Bravo. Mr. Boro has served as a Managing Partner at Thoma Bravo since 2013. Consulting fees from the Consulting Agreement totaled $1.3 million in the year ended December 31, 2017. In 2017, we were also obligated to reimburse Thoma Bravo for reasonable legal, accounting and travel expenses and other fees and expenses incurred by Thoma Bravo in rendering the services under the Consulting Agreement and any other matter that was for our benefit. The Consulting Agreement terminated upon the completion of our initial public offering, and we are no longer required to make future payments. In addition, in 2017, we engaged in ordinary sales transactions of $858,000 and ordinary purchase transactions of $942,000 with entities affiliated with Thoma Bravo.
Item 12. Security Ownership of Certain Beneficial Owners and Management and Related Stockholder Matters.
Security Ownership of Certain Beneficial Owners and Management
The following table sets forth certain information with respect to the beneficial ownership of our common stock by those persons known by us to be the beneficial owners of more than five percent of any class of our equity securities each of the our directors, our named executive officers (the “Named Executives”) and all of our directors and executive officers as a group as of March 15, 2018. We have determined beneficial ownership in accordance
126
with the rules of the SEC, and thus it represents sole or shared voting or investment power with respect to our securities. Unless otherwise indicated below, to our knowledge, the persons and entities named in the table have sole voting and sole investment power with respect to all shares of common stock and sole voting and no investment power with respect to all shares of restricted stock that they beneficially own, subject to community property laws where applicable. The information does not necessarily indicate beneficial ownership for any other purpose, including for purposes of Sections 13(d) and 13(g) of the Securities Act.
We have based our calculation of the percentage of beneficial ownership on of our common stock outstanding as of March 15, 2018. We have deemed shares of our common stock subject to stock options that are currently exercisable or exercisable within 60 days of March 15, 2018 to be outstanding and to be beneficially owned by the person holding the stock option for the purpose of computing the percentage ownership of that person. We did not deem these shares outstanding, however, for the purpose of computing the percentage ownership of any other person. Unless otherwise indicated, the address of each beneficial owner listed in the table below is c/o SailPoint Technologies Holdings, Inc., 11305 Four Points Drive, Building 2, Suite 100, Austin, Texas 78726.
|
Name of Beneficial Owner |
|
Shares of common stock beneficially owned |
|
|
Percent of class |
|
||
|
Named Executive Officers and Directors: |
|
|
|
|
|
|
|
|
|
Mark McClain (1) |
|
|
3,468,796 |
|
|
|
4.0 |
|
|
Kevin Cunningham (2) |
|
|
2,814,370 |
|
|
3.2 |
|
|
|
Cam McMartin (3) |
|
|
539,903 |
|
|
* |
|
|
|
Howard Greenfield (4) |
|
|
395,000 |
|
|
* |
|
|
|
Marcel Bernard (5) |
|
|
252,729 |
|
|
* |
|
|
|
William Bock (6) |
|
|
101,092 |
|
|
* |
|
|
|
Seth Boro |
|
|
— |
|
|
* |
|
|
|
Jim Pflaging (7) |
|
|
175,562 |
|
|
* |
|
|
|
Michael J. Sullivan |
|
|
— |
|
|
* |
|
|
|
Chip Virnig |
|
|
— |
|
|
* |
|
|
|
All executive officers and directors as a group (9 people) |
|
|
4,933,082 |
|
|
5.7 |
|
|
|
|
|
|
|
|
|
|
|
|
|
5% Stockholders: |
|
|
|
|
|
|
|
|
|
Thoma Bravo (6) |
|
|
50,317,016 |
|
|
57.7 |
|
|
|
* |
Represents beneficial ownership of less than one percent of the outstanding shares of our common stock. |
|
(1) |
Consists of 1,571,239 shares of common stock and 201,563 shares of unvested restricted stock held directly by Mr. McClain, 1,455,994 shares of common stock held by the McClain Charitable Remainder Unitrust, 80,000 shares of common stock held by the McClain RHD 2015 Trust, 80,000 shares of common stock held by the McClain ADM 2015 Trust and 80,000 shares of common stock held by the McClain GMM 2015 Trust. Mr. McClain is a co-trustee for each of the McClain Charitable Remainder Unitrust, McClain RHD 2015 Trust, McClain ADM 2015 Trust and McClain GMM 2015 Trust. As such, Mr. McClain may be deemed to have shared voting and investment power with respect to all of the shares of common stock held by such trusts. Mr. McClain co-founded the Company in December 2005 and has served as our Chief Executive Officer and on our board of directors since that time. |
|
(2) |
Consists of 2,602,838 shares of common stock and 201,563 shares of unvested restricted stock held directly by Mr. Cunningham and 9,969 shares of common stock held by Mr. Cunningham’s spouse. Mr. Cunningham may be deemed to have shared voting and investment power with respect to the shares of common stock held by his spouse. Mr. Cunningham co-founded the Company in December 2005 and has served as our Chief Strategy Officer since October 2017. Mr. Cunningham served as our President and on our board of directors from December 2005 until October 2017. |
|
(3) |
Consists of 438,599 shares of common stock and 79,688 shares of unvested restricted stock held directly by Mr. McMartin and 21,616 shares held by the Charles Wildermuth 2016 Trust. Mr. McMartin is the trustee for the Charles Wildermuth 2016 Trust, the beneficiary of which is a member of Mr. McMartin's immediate family. As such, Mr. McMartin may be deemed to have shared voting and investment power with respect to all of the shares held by the Charles Wildermuth 2016 Trust. Mr. McMartin has served as our Chief Financial Officer since 2011. |
127
|
(5) |
Consists of 221,138 shares of common stock and 31,591 shares of unvested restricted stock held directly by Mr. Bernard. |
|
(6) |
Consists of 88,455 shares of common stock and 12,637 shares of unvested restricted stock held directly by Mr. Bock. |
|
(7) |
Consists of 154,501 shares of common stock and 21,061 shares of unvested restricted stock held by the MMJ Living Trust. Mr. Pflaging is a co-trustee of the MMJ Living Trust. As such, Mr. Pflaging may be deemed to have shared voting and investment power with respect to all of the shares of common stock and shared voting power and no investment power with respect to all of the shares of restricted stock held by the MMJ Living Trust. |
|
(8) |
Information is based on a Schedule 13G filed with the SEC on February 13, 2018 by Thoma Bravo, LLC. |
Thoma Bravo Fund XI, L.P. (“TB Fund XI”) directly holds, and may be deemed to have shared voting and investment power with respect to, 33,010,236 shares; Thoma Bravo Fund XI-A, L.P. (“TB Fund XI-A”) directly holds, and may be deemed to have shared voting and investment power with respect to, 16,578,511 shares; and Thoma Bravo Executive Fund XI, L.P. (“TB Exec Fund”) directly holds, and may be deemed to have shared voting and investment power with respect to, 728,269 shares. Thoma Bravo Partners XI, L.P. (“TB Partners XI”) is the general partner of each of TB Fund XI, TB Fund XI-A and TB Exec Fund XI. Thoma Bravo, LLC is the general partner of TB Partners XI. By virtue of the relationships described in this footnote, TB Partners XI and Thoma Bravo, LLC may be deemed to have shared voting and investment power with respect to the shares held by TB Fund XI, TB Fund XI-A and TB Exec Fund XI. The principal business address of the entities identified herein is c/o Thoma Bravo, LLC, 150 N. Riverside Plaza, Suite 2800, Chicago, Illinois 60606.
Equity Compensation Plan Information
The table below discloses information as of December 31, 2017, with respect to our equity compensation plans and outstanding stock options granted pursuant to individual compensation arrangements.
|
Plan Category |
|
Number of securities to be Issued on Exercise of Outstanding Options, Warrants and Rights |
|
|
Weighted Average Exercise Price of Outstanding Options, Warrants and Rights |
|
|
Number of securities remaining available for future issuance under Equity Compensation Plans (excluding securities reflected in the first column) |
|
|||
|
Equity compensation plans approved by security holders: |
|
|
|
|
|
|
|
|
|
|
|
|
|
Equity compensation plans not approved by security holders : |
|
|
4,412,202 |
|
|
$ |
5.31 |
|
|
|
7,311,872 |
|
|
Total |
|
|
4,412,202 |
|
|
$ |
5.31 |
|
|
|
7,311,872 |
|
We maintain the 2017 LTIP and the ESPP under which our equity securities are authorized for issuance and that were adopted by our board and approved by our stockholders prior to our initial public offering.
Long Term Incentive Plan
The 2017 LTIP provides for the grant, from time to time, at the discretion of our board of directors or a committee thereof, of stock options, stock appreciation rights (“SARs”), restricted stock, restricted stock units, stock awards, dividend equivalents, other stock-based awards, cash awards, substitute awards and performance awards. The description of the 2017 LTIP set forth below is a summary of the material features of the 2017 LTIP. This summary, however, does not purport to be a complete description of all of the provisions of the 2017 LTIP and is qualified in its entirety by reference to the 2017 LTIP, the form of which is filed as an exhibit to the registration statement of which this prospectus is a part.
128
2017 LTIP Share Limits. Subject to adjustment in the event of certain transactions or changes of capitalization in accordance with the 2017 LTIP, a total of 8,856,876 shares of our common stock was initially reserved for issuance pursuant to awards under the 2017 LTIP. On January 1 of each year, beginning January 1, 2019, the number of shares of common stock available for issuance under the 2017 LTIP will increase by 4,428,438. The total number of shares reserved for issuance under the 2017 LTIP may be issued pursuant to incentive stock options (which generally are stock options that meet the requirements of Section 422 of the Internal Revenue Code). Common stock subject to an award that expires or is canceled, forfeited, exchanged, settled in cash or otherwise terminated without delivery of shares and shares withheld or surrendered to pay the exercise price of, or to satisfy the withholding obligations with respect to, an award will again be available for delivery pursuant to other awards under the 2017 LTIP.
Individual Share Limits. The 2017 LTIP contains individual award limits intended to comply with Section 162(m) of the Internal Revenue Code applicable to “covered employees” (within the meaning of Section 162(m) of the Internal Revenue Code) who are granted awards under the 2017 LTIP intended to qualify as “performance-based compensation” (within the meaning of Section 162(m) of the Internal Revenue Code). Given changes in tax law applicable to Section 162(m) of the Internal Revenue Code, these limits are unlikely to ever be applicable. Currently, we are not subject to the deduction limitations of Section 162(m) of the Internal Revenue Code due to a transition period applicable to issuers that have recently completed an initial public offering.
Administration. The 2017 LTIP is administered by the compensation committee of our board of directors, which is referred to herein as the “committee,” except to the extent our board of directors elects to administer the 2017 LTIP. Unless otherwise determined by our board of directors, the committee will be made up of two or more individuals who are both “outside directors” as defined in Section 162(m) of the Internal Revenue Code and a “nonemployee directors” as defined in Rule 16b-3 under the Exchange Act. The committee has broad discretion to administer the 2017 LTIP, including the power to determine the eligible individuals to whom awards will be granted, the number and type of awards to be granted and the terms and conditions of awards. The committee may also accelerate the vesting or exercise of any award and make all other determinations and to take all other actions necessary or advisable for the administration of the 2017 LTIP.
Eligibility. Any individual who is our officer or employee or an officer or employee of any of our affiliates, and any other person who provides services to us or our affiliates, including members of our board of directors, is eligible to receive awards under the 2017 LTIP at the committee’s discretion.
Stock Options. The committee may grant incentive stock options and options that do not qualify as incentive stock options, except that incentive stock options may only be granted to persons who are our employees or employees of one of our subsidiaries, in accordance with Section 422 of the Internal Revenue Code. The exercise price of a stock option generally cannot be less than 100% of the fair market value of a share of our common stock on the date on which the option is granted and the option must not be exercisable for longer than ten years following the date of grant. In the case of an incentive stock option granted to an individual who owns (or is deemed to own) at least 10% of the total combined voting power of all classes of our capital stock, the exercise price of the stock option must be at least 110% of the fair market value of a share of our common stock on the date of grant and the option must not be exercisable more than five years from the date of grant.
Stock Appreciation Rights. A SAR is the right to receive an amount equal to the excess of the fair market value of one share of our common stock on the date of exercise over the grant price of the SAR. The grant price of a SAR generally cannot be less than 100% of the fair market value of a share of our common stock on the date on which the SAR is granted. The term of a SAR may not exceed ten years. SARs may be granted in connection with, or independent of, a stock option. SARs may be paid in cash, common stock or a combination of cash and common stock, as determined by the committee.
Restricted Stock. Restricted stock is a grant of shares of common stock subject to the restrictions on transferability and risk of forfeiture imposed by the committee. In the committee’s discretion, dividends distributed prior to vesting may be subject to the same restrictions and risk of forfeiture as the restricted stock with respect to which the distribution was made.
129
Restricted Stock Units. A restricted stock unit is a right to receive cash, common stock or a combination of cash and common stock at the end of a specified period equal to the fair market value of one share of our common stock on the date of vesting. Restricted stock units may be subject to restrictions, including a risk of forfeiture, imposed by the committee.
Stock Awards. A stock award is a transfer of unrestricted shares of our common stock on terms and conditions determined by the committee.
Dividend Equivalents. Dividend equivalents entitle an individual to receive cash, shares of common stock, other awards or other property equal in value to dividends or other distributions paid with respect to a specified number of shares of our common stock. Dividend equivalents may be awarded on a free-standing basis or in connection with another award (other than an award of restricted stock or a stock award). The committee may provide that dividend equivalents will be paid or distributed when accrued or at a later specified date, including at the same time and subject to the same restrictions and risk of forfeiture as the award with respect to which the dividends accrue if they are granted in tandem with another award.
Other Stock-Based Awards. Subject to limitations under applicable law and the terms of the 2017 LTIP, the committee may grant other awards related to our common stock. Such awards may include, without limitation, awards that are convertible or exchangeable debt securities, other rights convertible or exchangeable into our common stock, purchase rights for common stock, awards with value and payment contingent upon our performance or any other factors designated by the committee, and awards valued by reference to the book value of our common stock or the value of securities of, or the performance of, our affiliates.
Cash Awards. The 2017 LTIP permits the grant of awards denominated in and settled in cash as an element of or supplement to, or independent of, any award under the 2017 LTIP.
Substitute Awards. Awards may be granted in substitution or exchange for any other award granted under the 2017 LTIP or any other right of an eligible person to receive payment from us. Awards may also be granted under the 2017 LTIP in substitution for similar awards held by individuals who become eligible persons as a result of a merger, consolidation or acquisition of another entity or the assets of another entity by or with us or one of our affiliates.
Performance Awards. Performance awards represent awards with respect to which a participant’s right to receive cash, shares of our common stock, or a combination of both, is contingent upon the attainment of one or more specified performance measures during a specified period. The committee will determine the applicable performance period, the performance goals and such other conditions that apply to each performance award. The committee may use any business criteria and other measures of performance it deems appropriate in establishing the performance goals applicable to a performance award.
The grant, exercise, vesting and/or settlement of performance awards will be contingent upon achievement of one or more of the following business criteria for us, on a consolidated basis, and/or for specified subsidiaries, business or geographical units or our operating areas (except with respect to the total stockholder return and earnings per share criteria): (i) revenues, sales or other income; (ii) cash flow, discretionary cash flow, cash flows from operations, cash flows from investing activities, cash flow returns and/or cash flows from financing activities; (iii) return on net assets, return on assets, return on investment, return on capital, return on capital employed or return on equity; (iv) income, operating income, net income or net income per share; (v) earnings, operating earnings or earnings, operating or contribution margin determined before or after any one or more of: depreciation and amortization expense; impairment of inventory and other property and equipment; accretion of discount on asset retirement obligations; interest expense; net gain or loss on the disposition of assets; income or loss from discontinued operations, net of tax; noncash derivative related activity; amortization of stock-based compensation; income taxes; incentives or service fees; extraordinary, non-recurring or special items; or other items; (vi) equity; net worth; tangible net worth; book capitalization; debt; debt, net of cash and cash equivalents; capital budget or other balance sheet goals; (vii) debt or equity financings or improvement of financial ratings; (viii) absolute or per-share net asset value; (ix) fair market value of our stock, share price, share price appreciation, total stockholder return or payments of dividends; (x) bookings, increase in bookings or new bookings; (xi) achievement of savings from business improvement projects and achievement of capital projects deliverables; (xii working capital or
130
working capital changes; (xiii) operating profit or net operating profit; (xiv) internal research or development programs; (xv) geographic business expansion; (xvi) human resources management targets, including medical cost reductions, employee satisfaction or retention, workforce diversity, time to hire and completion of hiring goals; (xvii) satisfactory internal or external audits; (xviii) consummation, implementation, integration or completion of a change in control or other strategic partnerships, transactions, projects, processes or initiatives or other goals relating to acquisitions or divestitures (in whole or in part), joint ventures or strategic alliances; (xix) regulatory approvals or other regulatory milestones; (xx) legal compliance or risk reduction; (xxi) market share; (xxii) economic value added; (xxiii) cost or debt reduction targets; or (xiv) capital raises or capital efficiencies. Any of the above goals may be determined pre-tax or post-tax, on an absolute, relative or debt-adjusted basis, as compared to the performance of a published or special index deemed applicable by our compensation committee including the Standard & Poor’s 500 Stock Index or a group of comparable companies, as a ratio with other business criteria, as a ratio over a period of time (such as per day) or on a per unit of measure, on a per-share basis (basic or diluted), and on a basis of continuing operations only. The terms above may, but shall not be required to be, used as applied under GAAP, as applicable.
Recapitalization. In the event of any change in our capital structure or business or other corporate transaction or event that would be considered an equity restructuring, the committee shall or may (as required by applicable accounting rules) equitably adjust the (i) aggregate number or kind of shares that may be delivered under the 2017 LTIP, (ii) the number or kind of shares or amount of cash subject to an award, (iii) the terms and conditions of awards, including the purchase price or exercise price of awards and performance goals, and (iv) the applicable share-based limitations with respect to awards provided in the 2017 LTIP, in each case to equitably reflect such event.
Tax Withholding. We are authorized to withhold from any award granted or any payment relating to an award under the 2017 LTIP amounts of withholding and other taxes due or potentially payable in connection with any transaction involving an award, and to take such other action as the committee may deem advisable to enable us to satisfy our obligation for the payment of withholding taxes and any other tax obligations related to an award. Participants may also pay any withholding in cash including cash obtained by selling common stock previously held by the participant or subject to the award being settled (subject to applicable law and our policies). The committee will determine, in its sole discretion, the form of payment acceptable for any tax withholding obligations.
Change in Control. Except to the extent otherwise provided in any applicable award agreement, no award will vest solely upon the occurrence of a change in control. In the event of a change in control or other changes to us or our common stock, the committee may, in its discretion, (i) accelerate the time of exercisability of an award, (ii) require awards to be surrendered in exchange for a cash payment (including canceling a stock option or SAR for no consideration if it has an exercise price or the grant price less than the value paid in the transaction), or (iii) make any other adjustments to awards that the committee deems appropriate to reflect the applicable transaction or event.
No Repricing. Except in connection with (i) the issuance of substitute awards granted to new service providers in connection with a transaction or (ii) in connection with adjustments to awards granted under the 2017 LTIP as a result of a transaction or recapitalization involving us, without the approval of the stockholders of the Company, the terms of outstanding option or SAR may not be amended to reduce the exercise price or grant price or to take any similar action that would have the same economic result.
Clawback. All awards granted under the 2017 LTIP are subject to reduction, cancellation or recoupment under any written clawback policy that we may adopt and that we determine should apply to awards under the 2017 LTIP.
Amendment and Termination. The 2017 LTIP will automatically expire on the tenth anniversary of its effective date. Our board of directors may amend or terminate the 2017 LTIP at any time, subject to stockholder approval if required by applicable law, rule or regulation, including the rules of the stock exchange on which our shares of common stock are listed. The committee may amend the terms of any outstanding award granted under the 2017 LTIP at any time so long as the amendment would not materially and adversely affect the rights of a participant under a previously granted award without the participant’s consent.
131
In addition to the 2017 LTIP, our board of directors has adopted the Employee Stock Purchase Plan (the “ESPP”). The ESPP provides eligible employees with the opportunity to purchase shares of our common stock conveniently through periodic payroll deductions at a reduced price. The ESPP is generally intended to qualify as an “employee stock purchase plan” under section 423 of the Internal Revenue Code.
Term. The ESPP will terminate upon the purchase of all of the shares of common stock committed to the ESPP (unless the number of shares is increased by our board of directors and approved by our shareholders). In addition, the ESPP can be terminated by our board of directors at any time with respect to shares of common stock for which options have not been granted.
Administration. The ESPP is initially administered by the compensation committee of our board of directors; however, our compensation committee can delegate the administration of all or certain portions of the ESPP to a committee of officers and employees. The ESPP may be amended by our board of directors from time to time in any respect; provided, however, that no amendment which would materially impair the rights of an eligible participant with respect to the current Option Period (defined below) may be made without the consent of the eligible participant.
Eligible Participants. The ESPP provides that employees (including officers and employee directors) are eligible to participate with respect to an Option Period if they are employed on the first day of such period by us or any present or future parent or subsidiary corporation designated as a participating company for purposes of the ESPP. The administrative committee may elect to exclude from any offering persons employed for less than two years, persons customarily employed twenty hours or less per week or for no more than five months per year, persons who are highly compensated employees and certain residents of foreign jurisdictions. Further, any employee who would own five percent or more of the total combined voting power or value of all classes of our stock or that of any parent or subsidiary corporation, immediately after an option under the ESPP is granted, is not eligible to participate.
Securities Offered and Terms of Participation. The maximum number of shares of common stock which may be purchased by all employees under the ESPP is 1,771,375. On January 1 of each year, beginning January 1, 2019, the number of shares of common stock available for purchase under the ESPP will be increased by 885,668 pursuant to a formula in the ESPP. The share limits under the ESPP are subject to adjustments for stock splits, stock dividends and similar transactions. Shares purchased under the ESPP may be authorized but unissued shares of common stock or shares of common stock reacquired by us, including shares of common stock purchased in the open market.
Eligible employees who elect to participate in the ESPP must give instruction to withhold a specified dollar amount or percentage from their base pay during a purchase period to be established by administrator of the ESPP (which may be no longer than 27 months, each such period is referred to as an “Option Period”). The exercise price for each Option Period will be the lesser of (i) eighty-five percent of the closing price per share of the common stock on the first business day of the Option Period (or the next business day if no shares have been traded on such first day), as reported by the NYSE, and (ii) eighty-five percent of the closing price per share of the common stock on the last day of the Option Period (or the next business day if no shares have been traded on such last day), as reported by the NYSE (such lesser price, the “Option Price”). We will grant to each participant, on the first day of the Option Period, an option to purchase on the last day of the Option Period, at the Option Price, that number of shares of common stock that his or her accumulated payroll deductions on the last day of the Option Period will pay for at such price. The option is automatically deemed to be exercised if the employee is still a participant on the last day of the Option Period. Participation ends automatically upon termination of employment.
A participating employee may authorize a payroll deduction of any whole percentage up to but not more than seventy five percent (or such greater percentage as the administrator may designate) of his or her base pay received during each Option Period. Deductions from any employee’s compensation may not be changed during an Option Period. No employee will be granted an option which permits the employee’s right to purchase common stock under the ESPP to accrue at a rate that exceeds, during any calendar year, $25,000 of the fair market value of such stock (to be calculated based on the fair market value of the stock on the first business day of the Option Period) for each calendar year in which such option is outstanding at any time.
132
An employee may withdraw from participation prior to the end of any Option Period. Upon such a withdrawal, the Company will refund, without interest, the entire remaining balance of the employee’s payroll deductions.
An option granted under the ESPP is not transferable except by will or the laws of descent and distribution and shall be exercisable only by the eligible employee to whom the option is granted, except in the case of the death of the eligible participant.
The administrator of the ESPP may specify with respect to the shares purchased under a particular Option Period a period of time during which the purchased shares of common stock may not be sold or otherwise transferred, except in limited circumstances. In addition, the administrator of the ESPP may modify or limit the terms of participation of employees who are residents of a foreign jurisdiction or employees of a foreign subsidiary as necessary to comply with the legal requirements of such jurisdiction and to comply with section 423 of the Internal Revenue Code.
Item 13. Certain Relationships and Related Transactions, and Director Independence.
In addition to the compensation arrangements, including employment, termination of employment and change in control arrangements, discussed under Item 12 of this Part III, the following is a description of each transaction since January 1, 2017, and each currently proposed transaction, in which:
|
|
• |
we have been or are to be a participant; |
|
|
• |
the amount involved exceeded or is expected to exceed $120,000; and |
|
|
• |
any of our directors, executive officers or holders of more than 5% of our outstanding capital stock, or any immediate family member of, or person sharing the household with, any of these individuals or entities, had or will have a direct or indirect material interest. |
In September 2014, we entered into an advisory services agreement (the “Consulting Agreement”) with Thoma Bravo. The Consulting Agreement required quarterly payments from September 8, 2014 through December 31, 2018 for financial and management consulting services provided by Thoma Bravo. Consulting fees from the Consulting Agreement totaled $1.3 million in the year ended December 31, 2017. We were also obligated to reimburse Thoma Bravo for reasonable legal, accounting and travel expenses and other fees and expenses incurred by Thoma Bravo in rendering the services under the Consulting Agreement and any other matter that was for our benefit. The Consulting Agreement terminated upon the completion of our initial public offering, and we are no longer required to make future payments.
In 2017, we engaged in ordinary sales transactions of $858,000 and ordinary purchase transactions of $942,000 with entities affiliated with Thoma Bravo.
Registration Rights
Certain registration rights are provided for under the terms of our Registration Rights Agreement, dated as of September 8, 2014 (the “Registration Rights Agreement”), by and among (i) SailPoint Technologies Holdings, Inc., (ii) the Thoma Bravo Funds, (iii) Mr. McClain, Mr. Cunningham, McClain Charitable Remainder Unitrust, Maryanne Cunningham, Mr. McMartin, Thomas Beck, Christopher Gossett, David Crow, Jeffrey Larson, Troy Donley and Marty Frederickson, and (iv) other persons who have become signatories to the agreement subsequent to September 8, 2014. Pursuant to the Registration Rights Agreement, we have agreed to pay all registration expenses (other than underwriting discounts and commissions and subject to certain limitations set forth therein) of the holders of the shares registered pursuant to the registrations described below. The registration rights will be subject to certain conditions and limitations, including the right of the underwriters to limit the number of shares to be included in an underwritten offering and our right to delay or withdraw a registration statement under certain circumstances.
133
Pursuant to the Registration Rights Agreement, we have agreed to not publicly sell or distribute any securities during the period beginning on the date of the notice of a requested demand registration and ending 90 days after the first effective date of any underwritten registration effected pursuant to the registrations described below (except pursuant to registrations on Form S-4, Form S-8 or any successor form
Pursuant to the Registration Rights Agreement, the holders of a majority of the outstanding Investor Registrable Securities (as defined therein and which include shares of our common stock held by the Thoma Bravo Funds) (the “Initiating Holders”) are entitled to request (i) three Long-Form Registrations (as defined therein), (ii) an unlimited number of Long-Form Registrations in which the requesting parties shall pay their pro rata share of the registration expenses and (iii) an unlimited number of Short-Form Registrations (as defined therein). In addition, with the consent of the Initiating Holders, the other parties to the Registration Rights Agreement may include their Registrable Securities in a Long-Form Registration or Short-Form Registration.
If at any time we propose to register the offer and sale of shares of our common stock under the Securities Act (other than pursuant to a Long-Form Registration or Short-Form Registration under the Registration Rights Agreement, or a registration on Form S-4, Form S-8 or any successor form), then we must notify the holders of Registrable Securities of such proposal to allow them to include a specified number of their shares of our common stock in such registration, subject to certain marketing and other limitations.
Limitation of Liability and Indemnification of Officers and Directors
Our charter and bylaws contain provisions that limit the liability of our directors for monetary damages to the fullest extent permitted by Delaware law. Consequently, our directors will not be personally liable to us or our stockholders for monetary damages for any breach of fiduciary duties as directors, except liability for the following:
|
|
• |
any breach of their duty of loyalty to our company or our stockholders; |
|
|
• |
any act or omission not in good faith or that involves intentional misconduct or a knowing violation of law; |
|
|
• |
unlawful payments of dividends or unlawful stock repurchases or redemptions as provided in Section 174 of the DGCL; or |
|
|
• |
any transaction from which they derived an improper personal benefit. |
Any amendment to, or repeal of, these provisions will not eliminate or reduce the effect of these provisions in respect of any act, omission or claim that occurred or arose prior to that amendment or repeal. If the DGCL is amended to provide for further limitations on the personal liability of directors of corporations, then the personal liability of our directors will be further limited to the greatest extent permitted by the DGCL.
In addition, our bylaws provide that we will indemnify, to the fullest extent permitted by law, any person who is or was a party or is threatened to be made a party to any action, suit or proceeding by reason of the fact that he or she is or was one of our directors or officers or is or was serving at our request as a director or officer of another corporation, partnership, joint venture, trust or other enterprise. Our bylaws provide that we may indemnify to the fullest extent permitted by law any person who is or was a party or is threatened to be made a party to any action, suit or proceeding by reason of the fact that he or she is or was one of our employees or agents or is or was serving at our request as an employee or agent of another corporation, partnership, joint venture, trust or other enterprise. Our bylaws also provide that we must advance expenses incurred by or on behalf of a director or executive officer in advance of the final disposition of any action or proceeding, subject to limited exceptions.
Further, we have entered into indemnification agreements with each of our directors and executive officers that may be broader than the specific indemnification provisions contained in the DGCL. These indemnification agreements require us, among other things, to indemnify our directors and executive officers against liabilities that may arise by reason of their status or service. These indemnification agreements also require us to advance all expenses incurred by the directors and executive officers in investigating or defending any such action, suit or proceeding. We believe that these agreements are necessary to attract and retain qualified individuals to serve as directors and executive officers.
134
The limitation of liability and indemnification provisions that are included in our charter and bylaws and in indemnification agreements that we have entered into with our directors and executive officers may discourage stockholders from bringing a lawsuit against our directors and executive officers for breach of their fiduciary duties. They may also reduce the likelihood of derivative litigation against our directors and executive officers, even though an action, if successful, might benefit us and other stockholders. Further, a stockholder’s investment may be adversely affected to the extent that we pay the costs of settlement and damage awards against directors and executive officers as required by these indemnification provisions. At present, we are not aware of any pending litigation or proceeding involving any person who is or was one of our directors, officers, employees or other agents or is or was serving at our request as a director, officer, employee or agent of another corporation, partnership, joint venture, trust or other enterprise, for which indemnification is sought, and we are not aware of any threatened litigation that may result in claims for indemnification.
We have obtained insurance policies under which, subject to the limitations of the policies, coverage is provided to our directors and executive officers against loss arising from claims made by reason of breach of fiduciary duty or other wrongful acts as a director or executive officer, including claims relating to public securities matters, and to us with respect to payments that may be made by us to these directors and executive officers pursuant to our indemnification obligations or otherwise as a matter of law.
Certain of our non-employee directors may, through their relationships with their employers, be insured and/ or indemnified against certain liabilities incurred in their capacity as members of our board of directors.
Insofar as indemnification for liabilities arising under the Securities Act may be permitted to directors, executive officers or persons controlling our company pursuant to the foregoing provisions, we have been informed that, in the opinion of the SEC, such indemnification is against public policy as expressed in the Securities Act and is therefore unenforceable.
Policies and Procedures for Related Party Transactions
Our board of directors has adopted a formal written policy providing that our audit committee is responsible for reviewing “related party transactions,” which are transactions, arrangements or relationships (or any series of similar transactions, arrangements or relationships), to which we are a party, in which the aggregate amount involved exceeds or may be expected to exceed $120,000 and in which a related person has, had or will have a direct or indirect material interest. For purposes of this policy, a related person is defined as a director, executive officer, nominee for director or greater than 5% beneficial owner of our capital stock, in each case since the beginning of the most recently completed year, and any of their immediate family members. In determining whether to approve or ratify any such transaction, our audit committee will take into account, among other factors it deems appropriate, (i) whether the transaction is on terms no less favorable than terms generally available to unaffiliated third parties under the same or similar circumstances and (ii) the extent of the related party’s interest in the transaction.
Director Independence
The Board has undertaken a review of the independence of each director. Based on information provided by each director concerning his background, employment and affiliations, the Board has determined that none of our current non-employee directors (i.e., all of the directors other than Mr. McClain) have a relationship that would interfere with the exercise of independent judgment in carrying out the responsibilities of a director and that each of our non-employee directors is “independent” as that term is defined under the listing standards of the NYSE. In making these determinations, the Board considered the current and prior relationships that each non-employee director has with our company and all other facts and circumstances the Board deemed relevant in determining their independence and eligibility to serve on the committees of the Board, including the transactions involving them described in the section titled “Certain Relationships and Related Party Transactions.”
135
Item 14. Principal Accounting Fees and Services.
Audit and Related Fees
The following table sets forth the aggregate fees for various professional services rendered by Grant Thornton LLP (“Grant Thornton”), which was engaged to be the Company’s independent auditor for the years ended December 31, 2016 and 2017:
|
|
|
2017 |
|
|
2016 |
|
||
|
Audit fees (1) |
|
$ |
1,816,240 |
|
|
$ |
248,496 |
|
|
Audit-related fees |
|
|
— |
|
|
|
— |
|
|
Tax fees |
|
|
— |
|
|
|
— |
|
|
All other fees |
|
|
— |
|
|
|
— |
|
|
Total fees |
|
$ |
1,816,240 |
|
|
$ |
248,496 |
|
|
(1) |
Consists of fees for the annual audit and quarterly reviews, SEC registration statements, accounting and financial reporting consultations. |
Pre-Approval Policy
The Charter of the Company's Audit Committee requires that the Audit Committee review the estimated fees of Grant Thornton's audit, audit-related, tax and other permitted non-audit services and requires that the Audit Committee, or a member thereof with designated authority, to pre-approve any services provided to the Company by Grant Thornton. Specific Audit Committee pre-approval of audit and non-audit services is not required if the engagement for services is entered into pursuant to pre-approval policies and procedures established by the Audit Committee. The chairperson of the Audit Committee has the authority to grant pre-approvals, provided they are within the scope of a pre-approval policy adopted by the Audit Committee and the pre-approval is presented to the Audit Committee at a subsequent meeting.
136
Item 15. Exhibits, Financial Statement Schedules.
(a) The following documents are filed as part of this Annual Report on Form 10‑K:
1. Financial Statements
2. Financial Statement Schedules
All schedules have been omitted as they are either not required or not applicable or the required information is included in the Consolidated Financial Statements or notes thereto.
3. See Item 15(b)
(b) Exhibits:
137
|
Exhibit Number |
|
Description |
|
|
|
|
|
3.1* |
|
Third Amended and Restated Certificate of Incorporation of the Company. |
|
|
|
|
|
3.2* |
|
|
|
|
|
|
|
4.1 |
|
|
|
|
|
|
|
4.2 |
|
|
|
|
|
|
|
10.1 |
|
|
|
|
|
|
|
10.2 |
|
|
|
|
|
|
|
10.3* |
|
|
|
|
|
|
|
10.4 |
|
|
|
|
|
|
|
10.5 |
|
|
|
|
|
|
|
10.6 |
|
|
|
|
|
|
|
10.7 |
|
138
|
Exhibit Number |
|
Description |
|
|
|
|
|
10.8+ |
|
|
|
|
|
|
|
10.9+ |
|
|
|
|
|
|
|
10.10+ |
|
|
|
|
|
|
|
10.11+ |
|
|
|
|
|
|
|
10.12+ |
|
|
|
|
|
|
|
10.13+ |
|
|
|
|
|
|
|
10.14+ |
|
|
|
|
|
|
|
10.15+ |
|
|
|
|
|
|
|
10.16+ |
|
|
|
|
|
|
|
10.17*+ |
|
Offer Letter, dated February 21, 2011, by and between SailPoint Technologies, Inc. and Cam McMartin. |
|
|
|
|
|
10.18+ |
|
139
|
Exhibit Number |
|
Description |
|
|
|
|
|
10.19*+ |
|
|
|
|
|
|
|
10.20+ |
|
|
|
|
|
|
|
10.21+ |
|
|
|
|
|
|
|
10.22+ |
|
|
|
|
|
|
|
10.23+ |
|
|
|
|
|
|
|
10.24+ |
|
|
|
|
|
|
|
10.25+ |
|
|
|
|
|
|
|
10.26+ |
|
|
|
|
|
|
|
10.27+ |
|
|
|
|
|
|
|
10.28+ |
|
|
|
|
|
|
|
10.29+ |
|
|
|
|
|
|
|
10.30+ |
|
140
|
Exhibit Number |
|
Description |
|
|
|
|
|
10.31+ |
|
|
|
|
|
|
|
10.32+ |
|
|
|
|
|
|
|
10.33+ |
|
|
|
|
|
|
|
10.34+ |
|
|
|
|
|
|
|
10.35+ |
|
|
|
|
|
|
|
10.36*+ |
|
|
|
|
|
|
|
21.1* |
|
|
|
|
|
|
|
23.1* |
|
Consent of Grant Thornton LLP, independent registered public accounting firm |
|
|
|
|
|
31.1* |
|
|
|
|
|
|
|
31.2* |
|
|
|
|
|
|
|
32.1** |
|
|
|
|
|
|
|
32.2** |
|
|
|
|
|
|
|
* |
Filed herewith. |
|
** |
Furnished herewith (such certification shall not be deemed “filed” for purposes of Section 18 of the Securities Exchange Act of 1934, as amended, except to the extent that the Company specifically incorporates it by reference). |
|
+ |
Management contract or compensatory plan or arrangement. |
None.
141
Pursuant to the requirements of Section 13 or 15(d) of the Securities Exchange Act of 1934, as amended, the registrant has duly caused this report to be signed on its behalf by the undersigned, thereunto duly authorized.
|
|
|
SailPoint Technologies Holdings, Inc., |
|
|
|
|
|
|
|
Date: March 19, 2018 |
|
By: |
/s/ Mark McClain |
|
|
|
|
Mark McClain |
|
|
|
|
Chief Executive Officer and Director |
|
|
|
|
|
|
Date: March 19, 2018 |
|
By: |
/s/ Cam McMartin |
|
|
|
|
Cam McMartin |
|
|
|
|
Chief Financial Officer |
Pursuant to the requirements of the Securities Exchange Act of 1934, as amended, this report has been signed below by the following persons on behalf of the registrant in the capacities and on the dates indicated.
|
Name |
|
Title |
|
Date |
|
|
|
|
|
|
|
/s/ Mark McClain |
|
Chief Executive Officer and Director |
|
March 19, 2018 |
|
Mark McClain |
|
(Principal Executive Officer) |
|
|
|
|
|
|
|
|
|
/s/ Cam McMartin |
|
Chief Financial Officer |
|
March 19, 2018 |
|
Cam McMartin |
|
(Principal Financial Officer) |
|
|
|
|
|
|
|
|
|
/s/ Thomas Beck |
|
Vice President, Finance |
|
March 19, 2018 |
|
Thomas Beck |
|
(Principal Accounting Officer) |
|
|
|
|
|
|
|
|
|
/s/ Marcel Bernard |
|
Director |
|
March 19, 2018 |
|
Marcel Bernard |
|
|
|
|
|
|
|
|
|
|
|
/s/ William Gregory Bock |
|
Director |
|
March 19, 2018 |
|
William Gregory Bock |
|
|
|
|
|
|
|
|
|
|
|
/s/ Seth Boro |
|
Director |
|
March 19, 2018 |
|
Seth Boro |
|
|
|
|
|
|
|
|
|
|
|
/s/ James Michael Pflaging |
|
Director |
|
March 19, 2018 |
|
James Michael Pflaging |
|
|
|
|
|
|
|
|
|
|
|
/s/ Michael J. Sullivan |
|
Director |
|
March 19, 2018 |
|
Michael J. Sullivan |
|
|
|
|
|
/s/ Kenneth J. Virnig, II |
|
Director |
|
March 19, 2018 |
|
Kenneth J. Virnig, II |
|
|
|
|
142