Attached files
| file | filename |
|---|---|
| EX-32 - EXHIBIT 32 - ICU MEDICAL INC/DE | exhibit32123117.htm |
| EX-31.2 - EXHIBIT 31.2 - ICU MEDICAL INC/DE | exhibit312123117.htm |
| EX-31.1 - EXHIBIT 31.1 - ICU MEDICAL INC/DE | exhibit311123117.htm |
| EX-23.1 - EXHIBIT 23.1 - ICU MEDICAL INC/DE | exhibit231consentofdeloitt.htm |
| EX-21 - EXHIBIT 21 - ICU MEDICAL INC/DE | exhibit21subsidiariesofreg.htm |
| EX-10.15 - EXHIBIT 10.15 - ICU MEDICAL INC/DE | exhibit1015non-employeedir.htm |
| EX-10.14 - EXHIBIT 10.14 - ICU MEDICAL INC/DE | exhibit1014executiveoffice.htm |
UNITED STATES
SECURITIES AND EXCHANGE COMMISSION
Washington, D.C. 20549
FORM 10-K
ý ANNUAL REPORT PURSUANT TO SECTION 13 OR 15(d) OF THE SECURITIES EXCHANGE ACT OF 1934
For the fiscal year ended December 31, 2017 or
o TRANSITION REPORT PURSUANT TO SECTION 13 OR 15(d) OF THE SECURITIES EXCHANGE ACT OF 1934
For the transition period from to
Commission File No. 001-34634
ICU MEDICAL, INC.
(Exact name of Registrant as specified in its charter)
Delaware | 33-0022692 | |
(State or other jurisdiction of | (I.R.S. Employer | |
incorporation or organization) | Identification No.) | |
951 Calle Amanecer | ||
San Clemente, California | 92673 | |
(Address of principal executive offices) | (Zip Code) | |
Registrant’s Telephone Number, Including Area Code: (949) 366-2183
Securities registered pursuant to Section 12(b) of the Act:
Title of each class | Name of each exchange on which registered | |
Common stock, par value $0.10 per share | The NASDAQ Stock Market LLC (Global Select Market) | |
Securities Registered Pursuant to Section 12(g) of the Act: None
Indicate by check mark if the registrant is a well-known seasoned issuer, as defined in Rule 405 of the Securities Act. ý Yes o No
Indicate by check mark if the registrant is not required to file reports pursuant to Section 13 or Section 15(d) of the Exchange Act. o Yes ý No
Indicate by check mark whether registrant: (1) has filed all reports required to be filed by Section 13 or 15(d) of the Securities Exchange Act of 1934 during the preceding 12 months (or for such shorter period that registrant was required to file such reports), and (2) has been subject to such filing requirements for the past 90 days. ý Yes o No
Indicate by check mark whether the registrant has submitted electronically and posted on its corporate Web site, if any, every Interactive Data File required to be submitted and posted pursuant to Rule 405 of Regulation S-T (§232.405 of this chapter) during the preceding 12 months (or for such shorter period that the registrant was required to submit and post such files). Yes ý No o
Indicate by check mark if disclosure of delinquent filers pursuant to Item 405 of Regulation S-K (§229.405 of this chapter) is not contained herein, and will not be contained, to the best of registrant’s knowledge, in definitive proxy or information statements incorporated by reference in Part III of this Form 10-K or any amendment to this Form 10-K. o
Indicate by check mark whether the registrant is a large accelerated filer, an accelerated filer, a non-accelerated filer, or a smaller reporting company. See definition of “large accelerated filer”, “accelerated filer” and “smaller reporting company” in Rule 12b-2 of the Exchange Act (Check one):
Large accelerated filer x | Accelerated filer o | |
Non-accelerated filer o | Small reporting company o | |
(Do not check if a smaller reporting company) | Emerging growth company o | |
If an emerging growth company, indicate by check mark if the registrant has elected not to use the extended transition period for complying with any new or revised financial accounting standards provided pursuant to Section 13(a) of the Exchange Act. o
Indicated by check mark whether the registrant is a shell company (as defined in Rule 12b-2 of the Exchange Act). o Yes ý No
The aggregate market value of the voting stock held by non-affiliates of registrant as of June 30, 2017, the last business day of registrant’s most recently completed second fiscal quarter, was $3,127,790,010*.
The number of shares outstanding of registrant’s common stock, $.10 par value, as of January 31, 2018 was 20,239,458.
DOCUMENTS INCORPORATED BY REFERENCE
Portions of the Proxy Statement for registrant’s 2018 Annual Meeting of Stockholders filed or to be filed pursuant to Regulation 14A within 120 days following registrant’s fiscal year ended December 31, 2017, are incorporated by reference into Part III of this Report.
____________________________
* Without acknowledging that any person other than Dr. George A. Lopez is an affiliate, all directors and executive officers have been included as affiliates solely for purposes of this computation.
ICU Medical, Inc.
Form 10-K
For the Year Ended December 31, 2017
TABLE OF CONTENTS
Page | ||
Item 4 | ||
PART I
ITEM 1. BUSINESS
First person pronouns used in this Report, such as “we,” “us,” and “our,” refer to ICU Medical, Inc. ("ICU") and its subsidiaries unless context requires otherwise.
Company Background
ICU was founded in 1984 and our initial public offering was in 1992. Our headquarters are in San Clemente, California. In 1993, we launched the Clave®, an innovative one-piece needlefree intravenous ("IV") connection device. Since the late 1990's, we have expanded our product offerings by introducing internally developed products and systems. Key developments have included the MicroClave Clear connector as an update to the Clave, Tego® needlefree connector for use in hemodialysis, products for handling hazardous drugs including the ChemoClave® and ChemoLock® CSTDs (“closed-system transfer devices”, the Diana™ hazardous drug compounding system, and the Neutron®, a catheter patency device.
Starting in the mid-2000s we began to also pursue acquisitions to broaden our product portfolio and/or our distribution network.
In August 2009, we purchased all commercial rights and physical assets from Hospira Inc.'s critical care product line, which provided us control over all aspects of our critical care product line.
In October 2015, we acquired Excelsior Medical Corporation’s SwabCap® disinfecting cap for needlefree IV connectors to enhance our direct and OEM infusion therapy product offerings and to open new customer opportunities globally.
In February 2017, we acquired Pfizer Inc.'s ("Pfizer") Hospira Infusion Systems ("HIS") business. The HIS acquisition complements our legacy non-dedicated infusion sets and oncology business by expanding our product portfolio to include a complete intravenous infusion therapy product-line from solutions to pumps to non-dedicated infusion sets. Also in February 2017, we acquired Fannin (UK) Limited ("Fannin") to improve our distribution for infusion therapy consumable products to the healthcare sector in the United Kingdom and Ireland. In November 2017, we acquired Medical Australia Limited ("MLA") to improve our distribution for infusion therapy consumable products to the healthcare sector in the Australia and New Zealand.
General Overview of Business
We are one of the world's leading pure-play infusion therapy companies with global operations and a wide-ranging product portfolio that includes IV solutions, IV smart pumps with pain management and safety software technology, dedicated and non-dedicated IV sets and needlefree connectors designed to help meet clinical, safety and workflow goals.
Our primary customers are acute care hospitals, wholesalers, ambulatory clinics and alternate site facilities, such as clinics, home health care providers and long-term care facilities. We sell our products in more than 95 countries throughout the world.
Products
Our primary product offerings are listed below, which we present in four product lines as follows:
Infusion Consumables
Infusion Therapy
Infusion therapy lines, used in hospitals and ambulatory clinics, consist of a tube running from a bottle or plastic bag containing a solution to a catheter inserted in a patient’s vein. Our primary Infusion Therapy products are:
◦ | Clave needlefree products, including the MicroClave, MicroClave Clear, and NanoClave brand of connectors, accessories, extension and administration sets used for the administration of IV fluids and medications. |
◦ | Neutron Catheter Patency Connector, used to help maintain patency of central venous catheters; |
3
◦ | SwabCap Disinfecting Cap, used to protect and disinfect any needlefree connector including, including competitive brands of connectors; |
◦ | Tego Hemodialysis Connector; |
◦ | NovaCath® and SuperCath® Peripheral IV Catheters. |
Closed System Transfer Devices (CSTD)
Closed System Transfer Devices (CSTD) are used to prepare and deliver hazardous medications such as those used in chemotherapy, which, if released, can have harmful effects to the healthcare worker and environment. In 2007, we introduced the ChemoClave CSTD, which incorporates Clave technology, and in 2013, we introduced the ChemoLock CSTD.
Our primary products are:
◦ | ChemoLock CSTD, is a Pharmacy preferred CSTD used for the preparation and administration of hazardous drugs. ChemoLock limits the escape of hazardous drug or vapor concentrations, blocks the transfer of environmental contaminants into the system, and eliminates the risk of needlestick injury; |
◦ | ChemoClave CSTD, is an ISO standard and universally compatible CSTD used for the preparation and administration of hazardous drugs. ChemoClave utilizes standard ISO luer locking connections, making it compatible with all brands of needlefree connectors and pump delivery systems. ChemoClave also limits the escape of hazardous drug or vapor concentrations, blocks the transfer of environmental contaminants into the system, and eliminates the risk of needlestick injury; |
◦ | Diana hazardous drug compounding system, used for the preparation of hazardous drugs. Diana is an automated sterile compounding system that incorporates ChemoClave and ChemoLock consumables for the accurate, safe, and efficient preparation of hazardous drugs. It is a user-controlled automated system that provides repeatable accuracy of drug mixes, minimizes clinician exposure to hazardous drugs while helping to maintain the sterility of the drugs being mixed. |
The preparation of hazardous drugs typically takes place in a pharmacy location where drugs are removed from vials and prepared for delivery to a patient. Those prepared drugs are then transferred to a nursing unit where the chemotherapy is administered via an infusion pump set to a patient. Components of the ChemoClave and ChemoLock product lines are used both in Pharmacy and on the nursing floors for the preparation and administration of hazardous drugs.
IV Solutions
◦ | Sterile Solutions - IV solutions, normal saline, Ringers etc., used to replenish fluids and electrolytes by IV infusion. |
◦ | Irrigation Solutions - Used externally on open wounds to hydrate the wound, remove deep debris, assist with visual examination, to prevent infection and improve healing. |
◦ | Nutritionals - Solutions that feed vitamins, minerals and other natural therapeutic substances directly into the blood stream. We are committed to helping our customers deliver more comprehensive patient-care therapies, delivering an extensive source of nutrients for patients who cannot consume a normal diet. |
Infusion Systems
Infusion Pump Hardware - Our current pump platform includes four infusion pumps:
◦ | Plum 360™: The Plum 360™ infusion pump is an ICU Medical MedNet™ ready large volume infusion pump with an extensive drug library and wireless capability; |
◦ | LifeCare PCA™: The LifeCare PCA™ infusion pump is an ICU Medical MedNet™ ready patient-controlled analgesia pump ("PCA"); |
4
◦ | SapphirePlus™: The SapphirePlus™ infusion pump is an ICU Medical MedNet™ ready large volume infusion pump with an extensive drug library and wireless capability. The SapphirePlus is designed and manufactured by Q Core Medical Ltd ("Q Core"); |
◦ | Sapphire™: The Sapphire™ infusion pump is a compact infusion system used in ambulatory and hospital settings. The Sapphire™ infusion pump comes in multi-therapy and epidural-only configurations. The Sapphire is designed and manufactured by Q Core. |
We offer the ICU Medical MedNet™ safety software system, which is designed for hospitals to customize intravenous drug dosage limits and track drug delivery to help prevent medication errors.
Critical Care
Our critical care products are hemodynamic monitoring systems used to monitor vital signs as well as specific physiological functions of key organ systems. Our primary Critical Care products are:
◦ | Hemodynamic Monitoring Systems; |
• | Cogent® 2-in-1 Hemodynamic Monitoring System |
• | LiDCO LX1TM Noninvasive Hemodynamic Monitoring System |
• | CardioFlo® Hemodynamic Monitoring Sensor |
• | TriOx® PICC Minimally Invasive Venous Oximetry Sensor |
◦ | SafeSet® Closed Blood Sampling and Conservation System; |
◦ | Transpac® Consumable Blood Pressure Transducers; |
◦ | Q2 Plus™ CCO/SvO2 (continuous cardiac output/oximetry). |
Financial information relating to our reporting segment and primary product lines is set forth in Part I, Item 6. "Selected Financial Data" and Item 7. "Management Discussion and Analysis of Financial Condition and Results of Operations" in this Annual Report on Form 10-K, and is incorporated herein by reference.
Recent Acquisitions
On February 1, 2017, we acquired Fannin (UK) Limited ("Fannin") for total consideration of approximately $1.5 million. Fannin provides infusion therapy consumable products to the healthcare sector in the United Kingdom and Ireland.
On February 3, 2017, we completed the acquisition of Pfizer's HIS business, a leading global provider of IV infusion therapy products to hospitals and alternate site providers, such as clinics, home health care providers and long-term care facilities. Our acquisition of the HIS business was strategic and provides us with an increase in scale and product portfolio that we believe will result in a stronger competitive position within the industry. We believe the HIS business acquisition was the natural evolution for us based on a long-term successful and productive partnership with HIS for over 20 years.
On November 29, 2017, we acquired Medical Australia for total consideration of $9.0 million. Medical Australia delivers similar consumable Infusion products as our current businesses to Australia and surrounding regions.
In October 2015, we acquired Excelsior Medical Corporation’s SwabCap disinfecting cap for needlefree IV connectors to enhance our direct and OEM infusion therapy product offerings and to open new customer opportunities globally.
Manufacturing
As of December 31, 2017, we operate four primary manufacturing facilities globally, which are detailed in Part I, Item 2 of this report. We operate four main service centers globally. We also rely on certain outside manufacturers for certain product lines in IV Systems and IV Solutions.
Our four primary manufacturing sites are:
5
◦ | La Aurora de Heredia, Costa Rica, which manufactures most of our infusion pumps and dedicated disposables and well as infusion consumables products; |
◦ | Ensenada, Mexico, which manufactures infusion consumables products; |
◦ | Salt Lake City, Utah, which produces primarily our Clave family of products and sends those products to Costa Rica or Mexico; |
◦ | Austin, Texas which produces our IV Solutions products. |
We also assemble compounders in our leased facility in Ludenscheid, Germany and Salt Lake City, Utah. The Sapphire™ family of pumps are manufactured by Q Core Medical, Ltd.
During 2017, we discontinued operations at our manufacturing facilities in San Cristobal, Dominican Republic, which was part of the HIS acquisition and transferred the assets and the production of Infusion Consumables to our plants in Costa Rica and Mexico.
We have four main regional device service centers in San Jose, California; Sligo, Ireland; San Laurent, Quebec, Canada; and Botany, Australia.
As part of our 2017 HIS business acquisition, we entered into two Manufacturing and Supply Agreements ("MSAs") under which, (i) Pfizer manufactures and supplies us with certain agreed upon products for an initial five-year term with a one-time two-year option to extend and (ii) we manufacture and supply Pfizer certain agreed upon products for a term of five or ten years depending on the product, with a one-time two-year option to extend. The initial supply price will be annually updated and is in full consideration for all costs associated with the manufacture, documentation, packaging and certification of the products.
Sales, Marketing and Administration
As of December 31, 2017, we employed 703 people worldwide in sales, marketing and administration. We ship around the world with the majority of our sales denominated in U.S. dollars and Euro.
Distribution
Our products are marketed to medical product manufacturers, independent distributors and directly to end users.
The U.S. distribution of solutions, IV sets and accessories is supported by a network of three owned distribution centers acquired in the HIS business acquisition, which include King of Prussia, Pennsylvania; Los Angeles, California; and Dallas, Texas. We also acquired as part of the HIS business a number of public warehouses.
We also acquired as part of the HIS business a private fleet of tractors and trailers operated by contracted drivers that provide both over the road and local route needs.
Internationally, we manage our operations through the Netherlands, which utilizes international regional hubs and we also manage operations through independent distributors.
Government Regulation
Our products and operations are subject to extensive and rigorous regulation by the Food and Drug Administration ("FDA") and other federal, state and local authorities, as well as foreign regulatory authorities. The FDA regulates, among other things, the research, development, testing, manufacturing, approval, labeling, storage, recordkeeping, advertising, promotion and marketing, distribution, post approval monitoring and reporting and import and export of medical devices and combination drug/device products in the U.S. to assure the safety and effectiveness of medical products for their intended use. The Federal Trade Commission also regulates the advertising of our products. Further, we are subject to laws directed at preventing fraud and abuse, which subject our sales and marketing, training and other practices to government scrutiny.
U.S. Device Classification and Clearance
Unless an exemption applies, each new or significantly modified medical device we seek to commercially distribute in the U.S. will require either a premarket notification to the FDA requesting permission for commercial distribution under
6
Section 510(k) of the Federal Food, Drug and Cosmetic Act ("FDC Act") also referred to as a 510(k) clearance, or approval from the FDA of a pre-market approval ("PMA") application.
Under the 510(k) process, applicants must demonstrate to the FDA that the device is as safe and effective as, or substantially equivalent to, a legally marketed device, the “predicate” device. Applicants must submit performance data to establish substantial equivalence. In some instances, data from human clinical trials must also be submitted in support of a 510(k) premarket notification. If so, these data must be collected in a manner that conforms to the applicable Investigational Device Exemption (IDE) regulations. The FDA must issue a decision finding substantial equivalence before commercial distribution can occur. Changes to cleared devices that could not significantly affect the safety or effectiveness of the device can generally be made without additional 510(k) premarket notifications; otherwise, a new 510(k) is required.
In the PMA application process, the applicant must demonstrate to the satisfaction of the FDA that the device is safe and effective for its intended use. This approval process applies to most Class III devices, and generally requires clinical data to support the safety and effectiveness of the device, obtained in adherence with IDE requirements. The FDA will approve the PMA application if it finds that there is a reasonable assurance that the device is safe and effective for its intended purpose, and that the proposed manufacturing is in compliance with the Quality System Regulation (QSR). For novel technologies, the FDA will generally seek input from an advisory panel of medical experts and seek their views on the safety, effectiveness and benefit-risk of the device. The PMA process is generally more detailed, lengthier and more expensive than the 510(k) process, though both the 510(k) clearance and PMA processes can be expensive, and lengthy, and require payment of significant user fees, unless an exemption is available.
Drug Regulation in the U.S.
In the U.S., IV solutions are considered pharmaceutical products and subject to the same extensive pre- and post-market regulations by the FDA, as indicated above.
The pre-market approval process is a time-intensive multi-phased process. When successfully completed an application may be submitted to the FDA that includes detailed information relating to the product’s chemistry, manufacture, controls and proposed labeling, among other things. This application process may be subject to substantial fees.
FDA approval is typically required before any new drug can be marketed. A New Drug Application ("NDA"), or an Abbreviated New Drug Application ("ANDA"), is typically required to be submitted to the FDA to obtain approval of pharmaceutical products.
Before approval, the FDA typically will inspect the facility or facilities where the product is manufactured. The FDA will not approve an application unless it determines that the manufacturing processes and facilities are in compliance with cGMP requirements and are adequate to assure consistent production of the product within required specifications. Additionally, the FDA may inspect one or more clinical trial sites to assure compliance with good clinical practice, or GCP, requirements.
Post-Approval Regulation
After the FDA permits a drug or device to enter commercial distribution, numerous regulatory requirements continue to apply. The FDA actively monitors regulations through review and inspection of design and manufacturing practices, recordkeeping, reporting of adverse events, labeling and promotional practices. The FDA can ban certain medical devices; detain or seize adulterated or misbranded medical devices; order repair, replacement or refund of these devices; and require notification of health professionals and others with regard to medical devices that present unreasonable risks of substantial harm to the public health. The FDA can take action against a company that promotes "off-label" uses. The FDA may also enjoin and restrain a company for certain violations of the FDC Act and regulations pertaining to medical devices, or initiate action for criminal prosecution of such violations. Any adverse regulatory action, depending on its magnitude, may restrict a company from effectively marketing and selling its products, may limit a company's ability to obtain future premarket clearances or approvals, and could results in a substantial modification to the company's business practices and operations.
Manufacturing Regulation
We must also comply with FDA, International Organization for Standardization (“ISO”) and European Council Directive 93/42/EEC (“Medical Device Directive”) regulations governing medical device manufacturing practices. The FDA, state, foreign agencies and ISO require manufacturers to register and subject manufacturers to periodic FDA, state, foreign
7
agencies and ISO inspections of their manufacturing facilities. We are a FDA and ISO registered medical device manufacturer, and must demonstrate that we and our contract manufacturers comply with the FDA’s QSR and current Good Manufacturing Practices ("cGMPs"). The FDA and regulatory agencies outside the U.S. monitor compliance with these requirements through inspections of manufacturing facilities. If an inspector observes conditions that might be violative, the manufacturer must correct those conditions or explain them satisfactorily, or face potential regulatory action that might include physical removal of the product from the marketplace.
We believe that our products and procedures are in compliance with all applicable FDA and international regulations. There is no assurance, however, that other products we are developing or products that we may develop in the future will be cleared by the FDA and classified as Class II products, or that additional regulations restricting the sale of our present or proposed products will not be promulgated by the FDA. In addition, changes in FDA, ISO or other federal or state health, environmental or safety regulations or their applications could adversely affect our business.
To market our products in the European Community (“EC”), we must conform to additional requirements of the EC and demonstrate conformance to established quality standards and applicable directives. As a manufacturer that designs, manufactures and markets its own devices, we must comply with the quality management standards of EN ISO 13485. Those quality standards are similar to the QSR regulations.
To market our products in the European Community (“EC”), manufacturers of medical devices must also conform to EC Directives such as Council Directive 93/42/EEC and their applicable annexes. Those regulations assure that medical devices are both safe and effective and meet all applicable established standards prior to being marketed in the EC. Once a manufacturer and its devices are in conformance with the Medical Device Directive, the “CE” Mark may be affixed to its devices. The CE Mark gives devices unobstructed entry to all the member countries of the EC.
We have demonstrated conformity to the regulation of EN ISO 13485 and the Medical Device Directive and we affix the CE Mark to our device labeling for product sold in member countries of the EC.
We believe our products and systems are in compliance with all EC requirements. There can be no assurance, however, that other products we are developing or products that we may develop in the future will conform or that additional regulations restricting the sale of our present or proposed products will not be promulgated by the EC.
Other Healthcare Laws
We are subject to additional healthcare regulation and enforcement by the federal government and by authorities in the states and foreign jurisdictions in which we conduct our business. These laws include:
◦ | the federal Anti-Kickback Statute, which prohibits, among other things, persons from knowingly and willfully soliciting, receiving, offering or paying remuneration, directly or indirectly, in exchange for or to induce either the referral of an individual for, or the purchase, order or recommendation of, any good or service for which payment may be made under federal healthcare programs, such as the Medicare and Medicaid programs. A person or entity does not need to have actual knowledge of the federal Anti-Kickback Statute or specific intent to violate it to have committed a violation. In addition, the government may assert that a claim including items or services resulting from a violation of the federal Anti-Kickback Statute constitutes a false or fraudulent claim for purposes of the False Claims Act; |
◦ | federal false claims laws which prohibit, among other things, individuals or entities from knowingly presenting, or causing to be presented, claims for payment from Medicare, Medicaid or other federal third-party payors that are false or fraudulent; |
◦ | the federal Civil Monetary Penalties Law, which prohibits, among other things, offering or transferring remuneration to a federal healthcare beneficiary that a person knows or should know is likely to influence the beneficiary’s decision to order or receive items or services reimbursable by the government from a particular provider or supplier; |
◦ | federal criminal laws that prohibit executing a scheme to defraud any federal healthcare benefit program or making false statements relating to healthcare matters; |
◦ | the federal Health Insurance Portability and Accountability Act of 1996, as amended by the Health Information Technology for Economic and Clinical Health Act, which governs the conduct of certain electronic healthcare transactions and protects the security and privacy of protected health information; |
8
◦ | the federal Physician Payment Sunshine Act, which requires manufacturers of drugs, devices, biologics and medical supplies for which payment is available under Medicare, Medicaid or the Children’s Health Insurance Program (with certain exceptions) to report annually to the Centers for Medicare & Medicaid Services (“CMS”) information related to payments or other “transfers of value” made to physicians (defined to include doctors, dentists, optometrists, podiatrists and chiropractors) and teaching hospitals and ownership and investment interests held by the physicians described above and their immediate family members, and payments or other “transfers of value” to such physician owners; and |
◦ | analogous state and foreign law equivalents of each of the above federal laws, such as anti-kickback and false claims laws which may apply to items or services reimbursed by any third-party payor, including commercial insurers; state laws that require pharmaceutical and device companies to comply with the industry’s voluntary compliance guidelines and the applicable compliance guidance promulgated by the federal government or otherwise restrict payments that may be made to healthcare providers and other potential referral sources; state laws that require device manufacturers to track and report information related to payments and other “transfers of value” to physicians and other healthcare providers or pricing, marketing expenditures and information; and state laws governing the privacy and security of health information in certain circumstances, many of which differ from each other in significant ways and may not have the same effect, thus complicating compliance efforts. |
Due to the breadth of these laws, the absence of guidance in the form of regulations or court decisions, and the potential for additional legal or regulatory change in this area, it is possible that our sales and marketing practices and/or our relationships with physicians and other healthcare providers might be challenged under such laws. If our operations are found to violate any of the laws described above or any other laws and regulations that apply to us, we may be subject to penalties, including civil and criminal penalties, damages, fines, the curtailment or restructuring of our operations, the exclusion from our participation in federal and state healthcare programs and imprisonment, any of which could adversely affect our ability to market our products and materially adversely affect our business, results of operations and financial condition. Any action against us for violation of these laws, even if we successfully defend against it, could cause us to incur significant legal expenses and divert our management’s attention from the operation of our business.
Coverage and Reimbursement; Cost Containment
Our profitability and operations are subject to changes in legislative, regulatory and reimbursement policies and decisions as well as changes in private payer reimbursement coverage and payment decisions and policies. Our products are purchased by hospitals, physicians and other healthcare providers that typically bill various third-party payors, such as governmental programs, private insurance plans and managed care plans, for the healthcare services and products provided to their patients. The ability of our customers to obtain appropriate coverage and reimbursement for healthcare services and products from third-party payors is critical because it affects which products customer purchase and the prices they are willing to pay. Third-party payors are increasingly reducing coverage and reimbursement for certain healthcare services and products and challenging prices charged for healthcare services and products.
In addition, the U.S. government, state legislatures and foreign governments have continued implementing cost containment programs, including price controls, restrictions on reimbursement and coverage. Adoption of price controls and cost-containment measures, and adoption of more restrictive policies in jurisdictions with existing controls and measures, could further limit our net revenue and results. In the U.S., there has been an increase in political support for controlling significant price increases of drug products, in particular due to high-profile cases that have gained national attention and triggered Congressional inquiries. Implementation of further legislative or administrative reforms in the reimbursement system in the U.S. and abroad or adverse decisions relating to coverage or reimbursement could have an impact on acceptance of and demand for our products and the prices that our customers are willing to pay for them.
Competition
Our industry is highly competitive. We believe our ability to effectively compete in this industry will be determined by our ability to provide a wide breadth of cost-effective, high quality products. We believe the added breadth of our HIS business product portfolio has increased our competitiveness as we can now provide a one-stop shop for customers and offer more flexible competitive pricing. We believe the infusion pump will also enable us to pull through a larger volume of higher margin infusion consumables. In addition, we now have unified distribution channels after the HIS acquisition.
9
Infusion Consumables
We believe that our ability to effectively compete in the Infusion Consumables market depends upon our ability to differentiate our products based on continued innovation, safety, quality, convenience, reliability, patent protection, ease of use and the pricing of our products, in addition to access to distribution channels. We encounter significant competition in this market both from global, large, established medical device manufacturers and from smaller companies. We compete with products and systems marketed by Becton Dickinson ("BD"), Baxter International ("Baxter"), B. Braun Medical, Inc. ("B. Braun), and Fresenius Kabi a division of Fresenius Group ("Fresenius"). Although we believe that our needlefree infusion devices and custom set manufacturing capabilities have distinct advantages over competing systems, there is no assurance that they will be able to compete successfully with these products. Our CSTD used for the production and safe handling of oncology drugs, compete with similar products from BD, and B. Braun. We believe that our current CSTD product offering provides benefits over these competing systems in several areas related to safety, ease of use, quality, and cost; however, on-going innovation in this market space will be required, and there is no assurance that these innovations will be able to sustain continued growth.
IV Solutions
We participate in the IV solutions only in the United States and Canada. Our primary competitors in the United States include Baxter, B. Braun and Fresenius. Demand for IV solutions is typically high and raw materials required to produce IV solutions are readily available. Our ability to compete will depend on our ability to maximize production, develop innovations in our product line, focus on cost-effectiveness and our ability to maintain the appropriate quality infrastructure.
Infusion Systems
We face strong global competitors including BD, Baxter, B. Braun, Smiths Medical and Fresenius. These competitors benefit from greater financial, research and development and marketing resources than we have. The smart pump market in recent years has been troubled with security concerns, and product recalls. We believe our ability to effectively compete in this market segment will be determined by our ability to build our brand strength using the development of technological advancements aimed at increasing the quality, reliability and safety of our pumps while at the same time focusing on manufacturing efficiency and cost-effectiveness, which are operationally challenging with evolving product lines.
Critical Care
Our primary competitor in Critical Care is Edwards Lifesciences.
Patents
We have U.S. and/or certain foreign patents relating to the technologies found in the Clave / MicroClave Connector, MicroClave Clear Connector, Neutron Connector, CLC2000 Connector, Tego Connector, ChemoClave Technologies, ChemoLock Technologies, Click Lock Technology, SwabCaps, Custom Set Design and Manufacturing Methods, and Diana Hazardous Drug Compounding System. We have applications pending for additional U.S. and/or foreign patents on MicroClave Connector, Neutron Connector, Tego Connector, Y-Clave Connector with Integral Check Valve, ChemoClave Technologies, ChemoLock Technologies, and Diana Hazardous Drug Compounding System.
With the acquisition of HIS, we acquired rights, title and interest to a substantial number of patents and patent applications and related provisionals, divisionals, continuations, continuations-in-part, reissues, reexaminations, extensions, and substitutions of any of the foregoing (“Patent Rights”), that were primarily used or held for use by Pfizer in the HIS business. There is however, no single patent or group of patents that we acquired that we believe is material in relation to our business as a whole.
Our success may depend in part on our ability to obtain patent protection for our products and to operate without infringing the proprietary rights of third parties. While we have obtained certain patents and applied for additional U.S. and foreign patents covering certain of our products, there is no assurance that any additional patents will be issued, that the scope of any patent protection will prevent competitors from introducing similar devices or that any of our patents will be held valid if subsequently challenged. Our patents are important in preventing others from introducing competing products that are as effective as our products. The loss of patent protection on Clave/MicroClave, Neutron, ChemoClave and ChemoLock technologies, Custom Set Design and Manufacturing Systems could adversely affect our ability to exclude other manufacturers from producing effective competitive products and could have an adverse impact on our financial results.
10
The fact that a patent is issued to us does not eliminate the possibility that patents owned by others may contain claims that are infringed by our products.
There has been substantial litigation regarding patent and other intellectual property rights in the medical device industry. Litigation, which would result in substantial cost to us and in diversion of our resources, may be necessary to defend us against claimed infringement of the rights of others and to determine the scope and validity of the proprietary rights of others. Adverse determinations in such litigation could subject us to significant liabilities to third parties or could require us to seek licenses from third parties and could prevent us from manufacturing, selling or using our products, any of which could have a material adverse effect on our business. In addition, we have initiated litigation, and may continue to initiate litigation in the future, to enforce our intellectual property rights against those we believe to be infringing on our patents. Such litigation could result in substantial cost and diversion of resources.
Seasonality/Quarterly Results
There are no significant seasonal aspects to our business. We can experience fluctuations in net sales as a result of variations in the ordering patterns of our largest customers, which may be driven more by production scheduling and their inventory levels, and less by seasonality. Our expenses often do not fluctuate in the same manner as net sales, which may cause fluctuations in operating income that are disproportionate to fluctuations in our revenue.
Research and Development
Our research and development costs include personnel costs and expenses related to the development of new products. Research and development costs were $51.3 million in 2017, $13.0 million in 2016 and $15.7 million in 2015.
Employees
At December 31, 2017, we had 6,802 full-time employees, consisting of 5,817 in operations, quality control and regulatory, 703 engaged in sales, marketing and administration, and 282 in research and development.
Geographic Data
Information regarding financial data by geography is set forth in Part II, Item 8. "Financial Statements and Supplementary Data" of this Form 10-K in Note 14 to the Consolidated Financial Statements, and is incorporated herein by reference.
Available Information
Our website address is http://www.icumed.com. We make available our Annual Reports on Form 10-K, Quarterly Reports on Form 10-Q and Current Reports on Form 8-K, and amendments to those reports free of charge on our website as soon as reasonably practicable after filing them with the Securities and Exchange Commission ("SEC"). We also have our code of ethics posted on our website (http://www.icumed.com). The information on our website is not incorporated into this Annual Report.
The public may read and copy any materials we file with the SEC at the SEC’s Public Reference Room at 100 F Street, NE, Washington, DC 20549. The public may obtain information on the operation of the Public Reference Room by calling the SEC at 1-800-SEC-0330. The SEC maintains an Internet site that contains reports, proxy and information statements, and other information regarding issuers that file electronically with the SEC on its website (http://www.sec.gov).
ITEM 1A. RISK FACTORS
In evaluating an investment in our common stock, investors should consider carefully, among other things, the following risk factors, as well as the other information contained in this Annual Report and our other reports and registration statements filed with the SEC. Any of the following risks, as well as additional risks and uncertainties not currently known to us or that we currently deem immaterial, could materially and adversely affect our results of operations or financial condition.
11
Risks Related to our Strategic Transactions
We may not realize the anticipated benefits of the HIS acquisition, which could adversely impact our business and our operating results.
The HIS acquisition that closed on February 3, 2017 was a significant transaction for us and the HIS business was one in which we did not operate directly prior to the closing of the transaction. The success of our business will depend, in part, on our ability to realize our anticipated benefits, opportunities and synergies from combining the businesses of our company and the HIS business. We can provide no assurance that the anticipated benefits of the HIS transaction will be fully realized in the time frame anticipated or at all. We have limited prior history of integrating acquired companies or businesses into our operations, much less one of this size and complexity. Integrating the operations of the HIS business with that of our own is a complex, costly and time-consuming process and the nature of a carve out acquisition makes it inherently more difficult to assume operations on closing day as well as to integrate activities, as certain systems, processes and people may not all have transferred with the acquired business to support such activities. In connection with the consummation of the acquisition, we entered into a number of arrangements with Pfizer, including a transitional services agreement, pursuant to which Pfizer agreed to provide us with certain significant and essential human resource, commercial, regulatory, finance, research and development and operational services on an interim basis, for a duration generally not to exceed eighteen (18) months from the date of the closing of the transaction, with respect to our operation of the HIS business. The integration process may disrupt the businesses and, if implemented ineffectively, would restrict the realization of the full expected benefits. The failure to meet the challenges involved in integrating the two businesses could cause an interruption of, or a loss of momentum in, the activities of the combined businesses and could adversely affect the results of operations of the combined businesses. Potential difficulties that may be encountered in the integration process include the following:
◦ | challenges in preserving important strategic customer and other third-party relationships of both businesses; |
◦ | the diversion of management’s attention to integration matters; |
◦ | challenges in maintaining employee morale and retaining or attracting key employees; |
◦ | potential incompatibility of corporate cultures; |
◦ | costs, delays and other difficulties (i) consolidating corporate and administrative infrastructures and information systems, (ii) implementing common systems and procedures including, in particular, our internal controls over financial reporting, and (iii) implementing the transitional services, manufacturing and other arrangements with Pfizer entered into at the closing of the HIS transaction; and |
◦ | coordinating and integrating a geographically dispersed organization, including operations in jurisdictions we did not operate in prior to the HIS transaction. |
Any one or all of these factors may increase operating costs or lower anticipated financial performance. Additionally, any failure by Pfizer to deliver the services to be provided under our arrangements with Pfizer could have a material adverse effect on our business, financial condition and results of operations. Achieving the anticipated benefits and the potential benefits underlying our reasons for the HIS business acquisition will depend on successful integration of the businesses. Because of the significance of the HIS business acquisition to us, our failure to successfully integrate the HIS business with that of our own could have a material adverse impact on our business, financial condition and results of operations.
The HIS business acquisition has resulted in organizational change and significant growth to our business. If we fail to effectively manage this growth and change to our business in a manner that preserves our reputation with customers and the key aspects of our corporate culture, our business, financial condition and results of operations could be harmed.
The HIS business has resulted in significant growth in our personnel and operations, adding approximately 4,000 employees to our headcount, bringing our total headcount as of December 31, 2017 to approximately 6,800 employees. In addition, the acquisition process and other events prior to our acquisition put a significant strain on certain HIS business customer relationships. We will continue to incur significant expenditures and the allocation of management time to assimilate the HIS business employees in a manner that preserves the key aspects of our corporate culture, including a focus on strong customer satisfaction, but there can be no assurance that we will be successful in our efforts. If we do not effectively integrate, train and manage our combined employee base and maintain strong customer relationships, our corporate culture could be undermined, the quality of our products and customer service could suffer, and our reputation could be harmed, each of which could adversely impact our business, financial condition and results of operations.
The actual impact of the HIS acquisition on our financial results may be worse than the assumptions we have used.
We have made certain assumptions relating to the impact on our financial results of the HIS acquisition. These assumptions relate to numerous matters, including the acquisition costs, including transaction and integration costs, and other
12
financial and strategic risks of the acquisition. If one or more of these assumptions are incorrect, it could have an adverse effect on our business and operating results, and the perceived benefits from the acquisition may not be realized.
If we are unable to effectively manage our internal growth or growth through acquisitions of companies, assets or products, our financial performance may be adversely affected.
We intend to continue to expand our marketing and distribution capability, which may include external expansion through acquisitions both in the U.S. and foreign markets. We may also consider expanding our product offerings through acquisitions of companies or product lines. We can provide no assurance that we will be able to identify, acquire, develop or profitably manage additional companies or operations or successfully integrate such companies or operations into our existing operations without substantial costs, delays or other problems. We recently acquired the HIS business, which includes IV pumps, solutions, and devices in order to create a leading pure-play infusion therapy company, but we have significant integration efforts to achieve the anticipated benefits. See “-We may not realize the anticipated benefits of the HIS transaction, which could adversely impact our business and our operating results.”
We have additional production facilities outside the U.S. to reduce labor costs. The expansion of our marketing, distribution and product offerings both internally and through acquisitions or by contract may place substantial burdens on our management resources and financial controls. Decentralization of assembly and manufacturing could place further burdens on management to manage those operations and maintain efficiencies and quality control.
The increasing burdens on our management resources and financial controls resulting from internal growth and acquisitions could adversely affect our operating results. In addition, acquisitions may involve a number of special risks in addition to the difficulty of integrating cultures and operations and the diversion of management’s attention, including adverse short-term effects on our reported operating results, dependence on retention, hiring and training of key personnel, risks associated with unanticipated problems or legal liabilities and amortization of acquired intangible assets, some or all of which could materially and adversely affect our operations and financial performance.
Business and Operating Risks
We are dependent on single and limited source suppliers, which subjects our business and results of operations to risks of supplier business interruptions.
Although we have risk mitigation plans in place with key suppliers, we have materials (such as resins) that are critical to our ability to manufacture our products, the supply of which is currently from a sole supplier. We cannot be certain that our current suppliers will continue to provide us with the quantities of materials that we require or satisfy our anticipated specifications and quality requirements. Any supply interruption in limited or sole sourced raw materials could materially harm our ability to manufacture our products until a new source of supply, if any, could be identified and qualified. Although we believe there are other suppliers of these raw materials, we may be unable to find a sufficient alternative supply channel in a reasonable time or on commercially reasonable terms. Additionally, we are subject to FDA regulations, which could further delay our ability to obtain a qualified alternative supplier. Any performance failure on the part of our suppliers could delay the development and manufacture of our products, which could have a material adverse effect on our business. Due to the highly competitive nature of the healthcare industry and the cost controls of our customers and third party payors, we may be unable to pass along cost increases for any key components or raw materials increases through higher prices to our customers. If the cost of key components or raw materials increases and we are unable fully to recover those increased costs through price increases or offset these increases through other cost reductions, we could experience an adverse effect on our financial condition.
Damage to any of our manufacturing facilities could impair our ability to produce our products.
A severe weather event, other natural or man-made disaster, or any other significant disruption affecting one of our manufacturing facilities could materially and adversely impact our business, financial condition and results of operations.
We have a single manufacturing facility for our Clave products located in Salt Lake City, Utah. Our Salt Lake City facility also produces other components on which our manufacturing operations in Mexico and Costa Rica rely.
Damage to any of our facilities could render us unable to manufacture our products or require us to reduce the output of products at the damaged facility.
13
Expansion of our manufacturing facilities may result in inefficiencies that could have an adverse effect on our operations and financial results.
In the fourth quarter of 2006, we experienced significant production inefficiencies following a large increase in production volume in Mexico and the transfer of San Clemente production to Salt Lake City. In 2007, we expanded our Mexico facility and, anticipating further increases in volume at that facility, increased the workforce. An additional expansion of our Mexico facility was completed in January 2011. Turnover among new employees was unusually high in Mexico, and the additional time spent in classroom training and on the job training could create production inefficiencies in Mexico in the future. The addition of new products will require additional molding in Salt Lake City and manual assembly work in Mexico. Expansions of our production capacity will require significant management attention to avoid inefficiencies of the type experienced in 2006, and the effect of any inefficiencies can be particularly expensive in Salt Lake City because of the high fixed costs in this highly automated facility.
We may be unable to realize any benefit from our cost reduction and restructuring efforts and our profitability may be hurt or our business otherwise might be adversely affected.
We have engaged in restructuring activities in the past and may engage in other restructuring activities in the future. These types of cost reduction and restructuring activities are complex. If we do not successfully manage our current restructuring activities, or any other restructuring activities that we may take in the future, any expected efficiencies and benefits might be delayed or not realized, and our operations and business could be disrupted. In addition, the costs associated with implementing restructuring activities might exceed expectations, which could result in additional future charges.
Market and Other External Risks
Because we are dependent on Clave products for a significant portion of our sales, any decline in sales of Clave products could result in a significant reduction in our sales and profits.
We depend heavily on sales of Clave products, which have decreased in previous years. Most of our sales of Clave products are in the U.S. Future sales increases for Clave products may depend on increases in sales of infusion systems, expansion in the international markets or acquisition of new customers in the U.S. We cannot give any assurance that sales of Clave products will increase or that we can sustain current profit margins on Clave products indefinitely.
We believe that the success of the Clave has motivated, and will continue to motivate, competitors to develop one piece needleless connectors. If other manufacturers successfully develop and market effective products that are competitive with Clave products, Clave sales could decline, we could lose market share, and we could encounter sustained price and profit margin erosion.
If we are unable to compete successfully on the basis of product innovation, quality, convenience, price and rapid delivery with larger companies that have substantially greater resources and larger distribution networks than us, we may be unable to maintain market share, in which case our sales may not grow and our profitability may be adversely affected.
The consumable medical device segment of the health care industry and in particular the infusion products market is intensely competitive and is experiencing both horizontal and vertical consolidation. We believe that our ability to compete depends upon continued product innovation, the quality, convenience and reliability of our products, access to distribution channels, patent protection and pricing. The ability to compete effectively depends on our ability to differentiate our products based on safety features, product quality, cost effectiveness, ease of use and convenience, as well as our ability to perceive and respond to changing customer needs. We encounter significant competition in our markets both from large established medical device manufacturers and from smaller companies. Many of these companies have introduced competitive products with features not provided by the conventional products and methods they are intended to replace. Most of our current and prospective competitors have economic and other resources substantially greater than ours and are well established in the healthcare industry. Several large, established competitors offer broad product lines and have been successful in obtaining full-line contracts with a significant number of hospitals and group purchasing organizations to supply all of their infusion product requirements. Due to the highly competitive nature of the group purchasing organizations (“GPOs”) or integrated delivery networks (“IDNs”) contracting processes, we may not be able to obtain or maintain contract positions with major GPOs and IDNs across our products portfolio. Furthermore, the increasing leverage of organizing buy-in groups may reduce market prices for our products thereby affecting our profitability. While having a contract with a GPO or IDN can facilitate sales to members of that GPO or IDN, it is no assurance that sales volume of those products will be maintained. The members of such groups may choose to purchase from our competitors due to the price or quality offered by such competitors, which could result in a decline in our sales and profitability. In addition, distributors of our products may begin to negotiate terms of sale more
14
aggressively in an effort to increase their profitability. Failure to negotiate distribution arrangements having advantageous pricing or other terms of sale could adversely affect our results of operations and financial condition. In addition, if we fail to implement distribution arrangements successfully, it could cause us to lose market share to our competitors. Moreover, there is no assurance that our competitors will not substantially increase resources devoted to the development, manufacture and marketing of products competitive with our products. The successful implementation of such a strategy by one or more of our competitors could materially and adversely affect us.
If we do not successfully develop and commercialize enhanced or new products that remain competitive with new products or alternative technologies developed by others, we could lose revenue opportunities and customers, and our ability to grow our business would be impaired.
The medical device industry is characterized by rapid product development and technological advances, which places our products at risk of obsolescence. Our long-term success and profit margins depend upon the development and successful commercialization of new products, new or improved technologies and additional applications of our technology. The research and development process is time-consuming and costly, and may not result in products or applications that we can successfully commercialize. We can give no assurance that any such new products will be successful or that they will be accepted in the marketplace.
Product development requires substantial investment that may be difficult for us to fund and may be challenging to
recover through commercial product sales.
Innovations generally require a substantial investment in product development before we can determine their commercial viability, and we may not have the financial resources necessary to fund these innovations. Even if we succeed in creating new product candidates from these innovations, those innovations still may fail to result in commercially successful products. The success of new product offerings for device products depends on several factors, including our ability to anticipate and meet customers'/patients’ needs, obtain timely regulatory approvals or clearances, and manufacture quality products in an economic and timely manner. Even if we are able to develop successfully new products or enhancements, we may not produce sales exceeding the costs of development, and we may not avoid infringing the proprietary rights of third parties. Further, those new or enhanced products may be quickly rendered obsolete by changing customer preferences or the introduction by competitors of products embodying new technologies or features. Moreover, innovations may not be successful due to difficulties encountered in achieving positive clinical outcomes, meeting safety, efficacy or other regulatory requirements of government
agencies, or obtaining favorable pricing on those products. Finally, innovations may not be accepted quickly in the
marketplace because of, among other things, entrenched patterns of clinical practice and uncertainty over third-party
reimbursement.
If demand for our products were to decline significantly, we might not be able to recover the cost of our expensive automated molding and assembly equipment and tooling, which could have an adverse effect on our results of operations.
Our production tooling is relatively expensive, with each “module,” which consists of an automated assembly machine and the molds and molding machines that mold the components, costing several million dollars. Most of the modules are for the Clave product family. If the demand for these products changes significantly, which could happen with the loss of a customer or a change in product mix, it may be necessary for us to recognize an impairment charge for the value of the production tooling because its cost may not be recovered through production of saleable product, which could adversely affect our financial condition.
We have been and will be ordering production molds and equipment for our new products. We expect to order semi-automated or fully automated assembly machines for other new products in 2018. If we do not achieve significant sales of these new products, it might be necessary for us to recognize an impairment charge for the value of the production tooling because its costs may not be recovered through production of saleable product, which could adversely affect our financial condition.
15
Our operating results may be adversely affected by unfavorable economic conditions that affect our customers’ ability to buy our products and could affect our relationships with our suppliers.
Disruptions in financial markets worldwide and other worldwide macro-economic challenges may cause our customers and suppliers to experience cash flow concerns. If job losses and the resulting loss of health insurance and personal savings cause individuals to forgo or postpone treatment, the resulting decreased hospital use could affect the demand for our products. As a result, customers may modify, delay or cancel plans to purchase our products and suppliers may increase their prices, reduce their output or change terms of sales. Additionally, if customers’ or suppliers’ operating and financial performance deteriorates, or if they are unable to make scheduled payments or obtain credit, customers may not be able to pay, or may delay payment of, accounts receivable owed to us and suppliers may impose different payment terms. Any inability of current and/or potential customers to pay us for our products or any demands by suppliers for different payment terms may adversely affect our earnings and cash flow.
Continuing pressures to reduce healthcare costs and inadequate coverage and reimbursement may adversely affect our prices. If we cannot reduce manufacturing costs of existing and new products, our sales may not grow and our profitability may decline.
Increasing awareness of healthcare costs, public interest in healthcare reform and continuing pressure from Medicare, Medicaid, group purchasing organizations and other payers, both domestic and international, to reduce costs in the healthcare industry, as well as increasing competition from other protective products, could make it more difficult for us to sell our products at current prices. Our products are purchased by hospitals, physicians and other healthcare providers that typically bill various third-party payors, such as governmental programs, private insurance plans and managed care plans, for the healthcare services and products provided to their patients. The ability of our customers to obtain appropriate coverage and reimbursement for healthcare services and products from third-party payors is critical because it affects which products customers purchase and the prices they are willing to pay. Implementation of further legislative or administrative reforms in the reimbursement system in the U.S. and abroad or adverse decisions relating to coverage or reimbursement could have an impact on acceptance of and demand for our products and the prices that our customers are willing to pay for them. In the event that the market will not accept current prices for our products, our sales and profits could be adversely affected. We believe that our ability to increase our market share and operate profitably in the long term may depend in part on our ability to reduce manufacturing costs on a per unit basis through high volume production using highly automated molding and assembly systems. If we are unable to reduce unit manufacturing costs, we may be unable to increase our market share for Clave products or may lose market share to alternative products, including competitors’ products. Similarly, if we cannot reduce unit manufacturing costs of new products as production volumes increase, we may not be able to sell new products profitably or gain any meaningful market share. Any of these results would adversely affect our future results of operations.
Failure to protect our information systems against security breaches, service interruptions, or misappropriation of data could disrupt operations, compromise sensitive data, and expose us to liability, possibly causing our business and reputation to suffer.
We depend heavily on information technology infrastructure and systems to achieve our business objectives. Any incident that impairs or compromises this infrastructure, including security breaches, malicious attacks or more general service interruptions, could impede our ability to process orders, manufacture and ship product in a timely manner, protect sensitive data and otherwise carry on business in the normal course. Any such events could result in the loss of customers, revenue, or both, and could require us to incur significant expense to remediate, including legal claims or proceedings. Further, as cyber security related incidents continue to evolve, and regulatory focus on these issues continues to expand, additional investment in protective measures, and vulnerability remediation, may be required.
Expiring patents may affect our future sales.
Most of our products are covered by patents that, if valid, give us a degree of market exclusivity during the term of the patent. Our patents will expire at various dates through 2032. Upon patent expiration, our competitors may introduce products using the same technology. As a result of this possible increase in competition, we may need to reduce our prices to maintain sales of our products, which would make them less profitable. If we fail to develop and successfully launch new products prior to the expiration of patents for our existing products, our sales and profits with respect to those products could decline significantly. We may not be able to develop and successfully launch more advanced replacement products before these and other patents expire.
If we cannot obtain additional custom tooling and equipment on a timely basis to enable us to meet demand for our products, we might be unable to increase our sales or might lose customers, in which case our sales could decline.
16
We expanded our manufacturing capacity substantially in recent years, and we expect that continued expansion may be necessary. Molds and automated assembly machines generally have a long lead-time with vendors, often nine months or longer. Inability to secure such tooling in a timely manner, or unexpected increases in production demands, could cause us to be unable to meet customer orders. Such inability could cause customers to seek alternatives to our products.
Increases in the cost of petroleum-based and natural gas-based products or loss of supply could have an adverse effect on our profitability.
Most of the materials used in our products are resins, plastics and other material that depend upon oil or natural gas as their raw material. Crude oil markets are affected by political uncertainty in the Middle East, and there is no assurance that crude oil supplies will not be interrupted in the future. Any such interruption could have an adverse effect on our ability to produce, or the cost to produce, our products. Also, crude oil and natural gas prices have been volatile in recent years. Our suppliers have historically passed some of their cost increases on to us, and if such prices are sustained or increase further, our suppliers may pass further cost increases on to us. In addition to the effect on resin prices, transportation costs have increased because of the effect of higher crude oil prices, and we believe most of these costs have been passed on to us. Our ability to recover these increased costs may depend upon our ability to raise prices on our products. In the past, we have rarely raised prices and it is uncertain that we would be able to raise them to recover higher prices from our suppliers. Our inability to raise prices in those circumstances, or to otherwise recover these costs, could have an adverse effect on our profitability.
Our business could suffer if we lose the services of key personnel.
We are dependent upon the management and leadership of our executive team, as well as other members of our senior management team. If one or more of these individuals were unable or unwilling to continue in his or her present position, our business would be disrupted and we might not be able to find replacements on a timely basis or with the same level of skill and experience, which could have an adverse effect on our business. We do not have "key person" life insurance policies on any of our employees.
The price of our common stock has been and may continue to be highly volatile due to many factors.
The market for small and mid-market capitalization companies can be highly volatile, and we have experienced significant volatility in the price of our common stock in the past. From January 2015 through December 2017, our trading price ranged from a high of $225.38 per share to a low of $79.44 per share. We believe that factors such as quarter-to-quarter fluctuations in financial results, differences between stock analysts’ expectations and actual quarterly and annual results, new product introductions by us or our competitors, acquisitions or divestitures, changing regulatory environments, litigation, changes in healthcare reimbursement policies, sales or the perception in the market of possible sales of common stock by insiders, market rumors and substantial product orders could contribute to the volatility in the price of our common stock. General economic trends unrelated to our performance such as recessionary cycles and changing interest rates may also adversely affect the market price of our common stock; the recent macroeconomic downturn could depress our stock price for some time.
Most of our common stock is held by, or included in accounts managed by, institutional investors or managers. Several of those institutions own or manage a significant percentage of our outstanding shares, with the ten largest interests accounting for approximately 40% of our outstanding shares at the end of 2017. If one or more of the institutions or if our other large stockholders should decide to reduce or eliminate their position in our common stock, it could cause a significant decrease in the price of our common stock.
Legal, Compliance, and Regulatory Risks
Healthcare regulation and reform measures could adversely affect our revenue and financial condition.
The healthcare industry is highly regulated and in recent years, there have been numerous changes in initiatives, laws and regulations. The federal government and all states and jurisdictions in which we currently operate regulate various aspects of our business. Changes in law or new interpretation of existing laws can have a material effect on our permissible activities and the relative costs associated with doing business. The laws and regulations that may affect our ability to operate include, without limitation, anti-kickback laws that prohibit payments or other remuneration that could be considered to induce hospitals, physicians or other potential purchasers of our products either to refer patients or to purchase, lease or order, or arrange for or recommend the purchase, lease or order, of healthcare products or services for which payment may be made under federal and state healthcare programs as well as false claims laws that prohibit filing of false or improper claims for payment. Federal laws apply to federal and state healthcare programs, such as Medicare and Medicaid, and several states have
17
similar laws that may apply more broadly to all payors. Although we would not submit claims directly to government payors, manufacturers can be held liable under the federal and state false claim act if they are deemed to “cause” the submission of false or fraudulent claims by, for example, providing inaccurate billing or coding information to customers, price reporting, or promoting a product off-label. In addition, our activities relating to the reporting of wholesaler or estimated retail prices for our products, the reporting of prices used to calculate Medicaid rebate information and other information affecting federal, state, and third-party reimbursement for our products, and the sale and marketing of our products, are subject to scrutiny under this federal and state false claims laws. As a manufacturer of U.S. FDA-approved products reimbursable by federal healthcare programs, we are subject to the Physician Payments Sunshine Act, which requires us to annually report certain payments and other transfers of value we make to U.S.-licensed physicians or U.S. teaching hospitals and any ownership or investment interests held by physicians and their immediate family members. These laws may affect our sales, marketing and other promotional activities by limiting the kinds of financial arrangements we may have with hospitals, physicians and other potential purchasers of our products. These laws are broadly written and are subject to evolving interpretations, and it is often difficult to determine how these laws will be applied to specific circumstances. In addition, any action against us for violation of these laws, even if we successfully defend against it, could cause us to incur significant legal expenses and divert our management’s attention from the operation of our business. If our operations are found to be in violation of any of the laws described above or any other governmental laws or regulations that apply to us, we may be subject to penalties, including civil and criminal penalties, damages, fines, the exclusion from participation in federal and state healthcare programs, imprisonment, or the curtailment or restructuring of our operations, any of which could adversely affect our ability to operate our business and our financial results.
Our profitability and operations are subject to risks relating to changes in government and private reimbursement programs and policies and changes in legal requirements in the U.S. and in the world. There have been, and we expect there will continue to be, a number of legislative and regulatory changes to the healthcare system that could affect our future revenues and profitability in the U.S. and abroad. Federal and state lawmakers regularly propose and, at times, enact legislation that results in significant changes to the healthcare system, some of which are intended to contain or reduce the costs of medical products and services. For example, in 2010, the Patient Protection and Affordable Care Act and the Health Care and Education Reconciliation Act (“Affordable Care Act”) were signed into law introducing comprehensive health insurance and healthcare reforms in the U.S. Among the provisions of such legislation that may have an adverse impact on us is a 2.3% excise tax imposed on medical device manufacturers for the sale of certain medical devices to U.S. customers. The excise tax, which became effective January 1, 2013, resulted in additional expense of $2.0 million in 2015 recorded in Selling, General and Administrative expenses. Congress has temporarily suspended this medical device excise tax for two years commencing January 2018. Unless Congress changes the current law, we expect this tax to resume beginning in 2020.
We expect that the new Presidential Administration and U.S. Congress will seek to modify, repeal, or otherwise invalidate all, or certain provisions of, the Affordable Care Act. The House and Senate have recently passed a budget resolution that authorizes congressional committees to draft legislation to repeal all or portions of the Affordable Care Act and permits such legislation to pass with a majority vote in the Senate. President Trump has also recently issued an executive order in which he stated that it is his Administration’s policy to seek the prompt repeal of the Affordable Care Act and directed executive departments and federal agencies to waive, defer, grant exemptions from, or delay the implementation of burdensome provisions of the Affordable Care Act to the maximum extent permitted by law. There is still uncertainty with respect to the impact President Trump’s administration and the U.S. Congress may have, if any, and any changes will likely take time to unfold, and could have an impact on coverage and reimbursement for healthcare items and services covered by plans that were authorized by the Affordable Care Act. In addition, other legislative changes have been proposed and adopted in the U.S. since the Affordable Care Act was enacted that reduced payments to Medicare providers. Recently, there has also been heightened governmental scrutiny over the manner in which drug manufacturers set prices for their marketed products, which has resulted in several Congressional inquiries and proposed bills designed to, among other things, bring more transparency to product pricing, review the relationship between pricing and manufacturer patient programs, and reform government program reimbursement methodologies for drug products. The ultimate implementation of any healthcare reform legislation and any new laws and regulations, and its impact on us, is impossible to predict. Any significant reforms made to the healthcare system in the U.S., or in other jurisdictions, may have an adverse effect on our financial condition and results of operations.
Our business could be materially and adversely affected if we fail to defend and enforce our patents, if our products are found to infringe patents owned by others or if the cost of patent litigation becomes excessive or as our key patents expire.
We rely on a combination of patents, trademarks, copyrights, trade secrets, business methods, software and nondisclosure agreements to protect our proprietary intellectual property. Our efforts to protect our intellectual proprietary and proprietary rights may not be sufficient. Further, there is no assurance that patents pending will issue or that the protection from patents which have issued or may issue in the future will be broad enough to prevent competitors from introducing similar
18
devices, that such patents, if challenged, will be upheld by the courts or that we will be able to prove infringement and damages in litigation.
We generally have multiple patents covering various features of a product, and as each patent expires, the protection afforded by that patent is no longer available to us, even though protection of features that are covered by other unexpired patents may continue to be available to us. The loss of patent protection on certain features of our products may make it possible for others to manufacture and sell products with features similar to ours, which could adversely affect our business. In addition, our ability to enforce and protect our intellectual property rights may be limited in certain countries outside of the U.S., which could make it easier for competitors to obtain market position in such countries by utilizing technologies that are similar to those developed by us.
If others choose to manufacture and sell products similar to or substantially the same as our products, it could have a material adverse effect on our business through loss of unit volume or price erosion, or both, and could adversely affect our ability to secure new business.
In the past, we have faced patent infringement claims related to the Clave, the CLC2000 and Tego. We believe these claims had no merit, and all have been settled or dismissed. We may also face claims in the future. Any adverse determination on these claims related to our products, if any, could have a material adverse effect on our business.
From time to time we become aware of newly issued patents on medical devices, which we review to evaluate any infringement risk. We are aware of a number of patents for infusion connection systems that have been issued to others. While we believe these patents will not affect our ability to market our products, there is no assurance that these or other issued or pending patents might not interfere with our right or ability to manufacture and sell our products.
There has been substantial litigation regarding patent and other intellectual property rights in the medical device industry. Patent infringement litigation, which may be necessary to enforce patents issued to us or to defend ourselves against claimed infringement of the rights of others, can be expensive and may involve a substantial commitment of our resources which may divert resources from other uses. Adverse determinations in litigation or settlements could subject us to significant liabilities to third parties, could require us to seek licenses from third parties, could prevent us from manufacturing and selling our products or could fail to prevent competitors from manufacturing products similar to ours. Any of these results could materially and adversely affect our business.
Our ability to market our products in the U.S. and other countries may be adversely affected if our products fail to comply with the applicable standards of the FDA and regulatory agencies in other countries.
Government regulation is a significant factor in the development, marketing and manufacturing of our products. For example, our device products are subject to clearance by the U.S. FDA under a number of statutes including the Food Drug and Cosmetics Act (“FDC Act”). In the U.S., before we can market a new medical device, or a new use of, new claim for, or significant modification to, an existing product, we must first receive either clearance under Section 510(k) of the FDC Act or approval of a premarket approval, or PMA, application from the FDA, unless an exemption applies. Under the 510(k) process, the manufacturer must submit to the FDA a premarket notification, demonstrating that the device is "substantially equivalent," as defined in the statute, to a legally marketed predicate device. To be "substantially equivalent," the proposed device must have the same intended use as the predicate device, and either have the same technological characteristics as the predicate device or have different technological characteristics and not raise different questions of safety or effectiveness than the predicate device. If the manufacturer is unable to demonstrate substantial equivalence to FDA’s satisfaction, or if there is no available predicate device, then the manufacturer may be required to seek approval through the PMA application process, which is generally more costly and time consuming than the 510(k) process. Through the PMA application process, the applicant must submit data and information demonstrating reasonable assurance of the safety and effectiveness of the device for its intended use to the FDA's satisfaction. Accordingly, a PMA application typically includes, but is not limited to, extensive technical information regarding device design and development, pre-clinical and clinical trial data, manufacturing information, labeling and financial disclosure information for the clinical investigators in device studies.
Each of our current products has qualified, and we anticipate that any new products we are likely to market will qualify for clearance under the FDA’s expedited pre-market notification procedure pursuant to Section 510(k) of the FDC Act. However, certain of our new products may require a longer time for clearance than we have experienced in the past and there can be no assurance that a PMA application will not be required. Further, there is no assurance that other new products developed by us or any manufacturers that we might acquire will qualify for expedited clearance rather than a more time consuming pre-market approval procedure or that, in any case, they will receive clearance from the FDA. FDA regulatory
19
processes are time consuming and expensive. Uncertainties as to the time required to obtain FDA clearances or approvals could adversely affect the timing and expense of new product introductions.
The regulations to which we are subject are complex and have become more stringent over time. Regulatory changes could result in restrictions on our ability to continue or expand our operations, higher than anticipated costs, or lower than anticipated sales. Even after we have obtained the proper regulatory clearance or approval to market a product, we have ongoing responsibilities under FDA regulations and applicable foreign laws and regulations. The FDA, state and foreign regulatory authorities have broad enforcement powers. Our failure to comply with applicable regulatory requirements could result in enforcement action by the FDA, state or foreign regulatory authorities which may include any of the following sanctions:
◦ | untitled letters or warning letters; |
◦ | fines, injunctions, consent decrees and civil penalties; |
◦ | recalls, termination of distribution, administrative detention, or seizure of our products; |
◦ | customer notifications or repair, replacement or refunds; |
◦ | operating restrictions or partial suspension or total shutdown of production; |
◦ | delays in or refusal to grant our requests for future 510(k) clearances, PMA approvals or foreign regulatory approvals of new products, new intended uses, or modifications to existing products; |
◦ | withdrawals or suspensions of current 510(k) clearances or PMAs or foreign regulatory approvals, resulting in prohibitions on sales of our products; |
◦ | FDA refusal to issue certificates to foreign governments needed to export products for sale in other countries; and |
◦ | criminal prosecution. |
The FDA’s and other regulatory authorities’ policies may change and additional government regulations may be enacted that could prevent, limit or delay regulatory approval of our product candidates. We cannot predict the likelihood, nature or extent of government regulation that may arise from future legislation or administrative action, either in the U.S. or abroad. For example, certain policies of the Trump Administration may impact our business and industry. Namely, the Trump Administration has taken several executive actions, including the issuance of a number of Executive Orders, that could impose significant burdens on, or otherwise materially delay, FDA’s ability to engage in routine regulatory and oversight activities such as implementing statutes through rulemaking, issuance of guidance, and review and approval of marketing applications. It is difficult to predict how these requirement will be implemented, and the extent to which they will impact the FDA’s ability to exercise its regulatory authority. If these executive actions impose constraints on FDA’s ability to engage in oversight and implementation activities in the normal course, our business may be negatively impacted.
If we or our component manufacturers fail to comply with the FDA's Quality System Regulation or Good Manufacturing Practice regulations, our manufacturing operations could be interrupted, and our product sales and operating results could suffer.
We and some of our component manufacturers are required to comply with regulatory requirements known as the FDA's Quality System Regulation, or QSR, which covers the procedures and documentation of the design, testing, production, control, quality assurance, inspection, complaint handling, recordkeeping, management review, labeling, packaging, sterilization, storage and shipping of our device products. The FDA's current Good Manufacturing Practices, or cGMPs apply to the manufacture of medical device components and finished medical devices. The FDA audits compliance with these regulatory requirements through periodic announced and unannounced inspections of manufacturing and other facilities. The FDA may conduct inspections or audits at any time, and we and some of our component suppliers are subject to such inspections. Although we believe our manufacturing facilities and those of our critical component suppliers are in compliance with the QSR requirements, and with applicable cGMPs for our products, we cannot provide assurance that any future inspection will not result in adverse findings. If our manufacturing facilities or those of any of our component suppliers are found to be in violation of applicable laws and regulations, or we or our suppliers have significant noncompliance issues or fail to timely and adequately respond to any adverse inspectional observations or product safety issues, or if any corrective action plan that we or our suppliers propose in response to observed deficiencies is not sufficient, the FDA could take enforcement action, including any of the following sanctions:
◦ | untitled letters or warning letters; |
◦ | fines, injunctions, consent decrees and civil penalties; |
◦ | customer notifications or repair, replacement, refunds, recall, detention or seizure of our products; |
◦ | operating restrictions or partial suspension or total shutdown of production; |
◦ | refusing or delaying our requests for clearance or approval of new products or modified products; |
◦ | withdrawing clearances or approvals that have already been granted; |
20
◦ | refusal to grant export approval for our products; or |
◦ | criminal prosecution. |
Any of these sanctions could adversely affect our business, financial conditions and operating results.
To market our products in the European Community (“EC”), we must conform to additional requirements of the EC and demonstrate conformance to established quality standards and applicable directives. As a manufacturer that designs, manufactures and markets its own devices, we must comply with the quality management standards of ISO 13485 (2012). Those quality standards are similar to the FDA’s Quality System Regulations. Manufacturers of medical devices must also be in conformance with EC Directives such as Council Directive 93/42/EEC (“Medical Device Directive”) and their applicable annexes. Those regulations assure that medical devices are both safe and effective and meet all applicable established standards prior to being marketed in the EC. Once a manufacturer and its devices are in conformance with the Medical Device Directive, the “CE” Mark maybe affixed to its devices. The CE Mark gives devices an unobstructed entry to all the member countries of the EC. There is no assurance that we will continue to meet the requirements for distribution of our products in Europe.
Distribution of our products in other countries may be subject to regulation in those countries, and there is no assurance that we will obtain necessary approvals in countries in which we want to introduce our products.
Product liability claims could be costly to defend and could expose us to loss.
The use of our products exposes us to an inherent risk of product liability. Patients, healthcare workers or healthcare providers who claim that our products have resulted in injury could initiate product liability litigation seeking large damage awards against us. Costs of the defense of such litigation, even if successful, could be substantial. We maintain insurance against product liability and defense costs in the amount of $10,000,000 per occurrence. There is no assurance that we will successfully defend claims, if any, arising with respect to products or that the insurance we carry will be sufficient. A successful claim against us in excess of insurance coverage could materially and adversely affect us. Furthermore, there is no assurance that product liability insurance will continue to be available to us on acceptable terms.
We may incur costs or losses relating to other litigation.
We may from time to time be involved in litigation. Legal proceedings are inherently unpredictable, and the outcome can result in judgments that affect how we operate our business, or we may enter into settlements of claims for monetary damages that exceed our insurance coverage, if any is available. Any such proceedings, regardless of merits, may result in substantial costs, the diversion of management's attention from other business concerns and additional restrictions on our business, which could disrupt our business and have an adverse effect on our financial condition.
We may be required to implement a costly product recall.
In the event that any of our products proves to be defective, we can voluntarily recall, or the FDA or other regulatory agencies could require us to redesign or implement a recall of, any of our products. We believe that any recall could result in significant costs to us and significant adverse publicity, which could harm our ability to market our products in the future. Though it may not be possible to quantify the economic impact of a recall, it could have a material adverse effect on our business, financial condition and results of operations.
We generally offer a limited warranty for product returns which are due to defects in quality and workmanship. We attempt to estimate our potential liability for future product returns and establish reserves on our financial statements in amounts that we believe will be sufficient to address our warranty obligations; however, our actual liability for product returns may significantly exceed the amount of our reserves. If we underestimate our potential liability for future product returns, or if unanticipated events result in returns that exceed our historical experience, our financial condition and operating results could be materially and adversely affected.
Geographic Risks
We are subject to risks associated with doing business outside of the U.S.
We operate in a global market and global operations are subject to a number of risks. Sales to customers outside of the U.S. made up approximately 25% of our revenue in 2017 and as our operations and sales located in Europe and other areas
21
outside the U.S. increase, we may face new challenges and uncertainties, although we can give no assurance that such operations and sales will increase. The risks associated with our operations outside the U.S. include:
◦ | healthcare reform legislation; |
◦ | changes in medical reimbursement policies and programs; |
◦ | changes in non-U.S. government programs; |
◦ | multiple non-U.S. regulatory requirements that are subject to change and that could restrict our ability to manufacture and sell our products; |
◦ | possible failure to comply with anti-bribery laws such as the U.S. Foreign Corrupt Practices Act and similar anti-bribery laws in other jurisdictions; |
◦ | different local medical practices, product preferences and product requirements; |
◦ | possible failure to comply with trade protection and restriction measures and import or export licensing requirements; |
◦ | difficulty in establishing, staffing and managing non-U.S. operations; |
◦ | different labor regulations or work stoppages or strikes; |
◦ | changes in environmental, health and safety laws; |
◦ | potentially negative consequences from changes in or interpretations of tax laws, including changes regarding taxation of income earned outside the U.S.; |
◦ | political instability and actual or anticipated military or political conflicts; |
◦ | economic instability, including the European financial crisis or other economic instability in other parts of the world and the impact on interest rates, inflation and the credit worthiness of our customers; |
◦ | uncertainties regarding judicial systems and procedures; |
◦ | minimal or diminished protection of intellectual property in some countries; |
◦ | imposition of government controls; and |
◦ | regulatory changes that may place our products at a disadvantage. |
These risks, individually or in the aggregate, could have an adverse effect on our results of operations and financial condition. The occurrence or allegation of these types of risks may adversely affect our business, performance, prospects, value, financial condition, and results of operations.
Any significant changes in U.S trade, tax or other policies that restrict imports or increase import tariffs could have a material adverse effect on our results of operations.
A significant amount of our products are manufactured outside of the U.S. The new Presidential administration has called for substantial changes to U.S. trade and tax policies, which may include import restrictions or increased import tariffs. Restrictions on imports could prevent or make it difficult for us to obtain the components needed for new products which would affect our sales. Increased tariffs would require us to increase our prices which likely would decrease customer and consumer demand for our products. Other countries might retaliate through the imposition of their own restrictions and or increased tariffs which would affect our ability to export products and therefore adversely affect our sales. Any significant changes in current U.S. trade, tax or other policies could have a material adverse effect upon our results of operations.
International sales pose additional risks related to competition with larger international companies and established local companies and our possibly higher cost structure.
We have undertaken an initiative to increase our international sales, and have distribution arrangements in all the principal countries in Western Europe, the Pacific Rim, Middle East, Latin America, Canada and South Africa. We plan to sell in most other areas of the world. We export most of our products sold internationally from the U.S. and Mexico. Our principal competitors in international markets consist of much larger companies as well as smaller companies already established in the countries into which we sell our products. Our cost structure is often higher than that of our competitors because of the relatively high cost of transporting product to some local markets as well as our competitors’ lower local labor costs in some markets.
Our international sales are subject to higher credit risks than sales in the U.S.. Many of our distributors are small and may not be well capitalized. Payment terms are relatively long. The European hospitals tend to be significantly slower in payment which has resulted in an increase to our days sales outstanding from previous years. Our prices to our international distributors, outside of Europe, for product shipped to the customers from the U.S., Costa Rica or Mexico are generally denominated in U.S. dollars, but their resale prices are set in their local currency. A decline in the value of the local currency in relation to the U.S. dollar may adversely affect their ability to profitably sell in their market the products they buy from us, and may adversely affect their ability to make payment to us for the products they purchase. Legal recourse for non-payment of indebtedness may be uncertain. These factors all contribute to a potential for credit losses.
22
We are increasingly dependent on manufacturing in Mexico, and could be adversely affected by increased labor costs and any economic, social or political disruptions.
We continue to expand our production in Mexico. Most of the material we use in manufacturing is imported into Mexico, and substantially all of the products we manufacture in Mexico are exported.
As of December 31, 2017, we employed 1,845 people in operations and product development in our plant in Ensenada, Mexico. Business activity in the Ensenada area has expanded significantly, providing increased employment opportunities. This could have an adverse effect on our ability to hire or retain necessary personnel and result in an increase in labor rates. We continue to take steps to compete for labor through attractive employment conditions and benefits, but there is no assurance that these steps will continue to be successful or that we will not face increasing labor costs in the future.
Any political or economic disruption in Mexico or a change in the local economies could have an adverse effect on our operations. We depend on our ability to move goods across borders quickly, and any disruption in the free flow of goods across national borders could have an adverse effect on our business. Additionally, political and social instability resulting from violence in certain areas of Mexico has raised concerns about the safety of our personnel. These concerns may hinder our ability to send domestic personnel abroad and to hire and retain local personnel. Such concerns may require us to conduct more operations from the U.S. rather than Mexico, which may negatively impact our operations and result in higher costs and inefficiencies.
Our operations may be adversely impacted by our exposure to risks related to foreign currency exchange rates.
We market our products in certain foreign markets through our subsidiaries and other international distributors. The related sales agreements may provide for payments in a foreign currency. Accordingly, our operating results are subject to fluctuations in foreign currency exchange rates. When the U.S. dollar weakens against these currencies, the dollar value of foreign-currency denominated revenue and expense increases, and when the dollar strengthens against these currencies, the dollar value of foreign-currency denominated revenue and expense decreases. We are exposed to foreign currency risk on outstanding foreign currency denominated receivables and payables. Changes in exchange rates may adversely affect our results of operations. Our primary foreign currency exchange rate exposures are currently with the Euro, Mexican Peso, Costa Rican Colón, and the Canadian Dollar against the U.S. dollar.
We currently do not hedge against our foreign currency exchange rate risks, other than the Mexican Peso and therefore believe our exposure to these risks may be higher than if we entered into hedging transactions, including forward exchange contracts or similar instruments. If we decide in the future to enter into forward foreign exchange contracts to attempt to reduce the risk related to foreign currency exchange rates, these contracts may not mitigate the potential adverse impact on our financial results due to the variability of timing and amount of payments under these contracts. In addition, these types of contracts may themselves cause financial harm to us and have inherent levels of counter-party risk over which we would have no control.
We could be adversely affected by violations of the U.S. Foreign Corrupt Practices Act and other worldwide anti-bribery laws.
The Foreign Corrupt Practices Act and anti-bribery laws in other jurisdictions generally prohibit companies and their intermediaries from making improper payments for the purpose of obtaining or retaining business or other commercial advantage. Our policies mandate compliance with these anti-bribery laws, which often carry substantial penalties, including criminal and civil fines, potential loss of export licenses, possible suspension of the ability to do business with the federal government, denial of government reimbursement for products and exclusion from participation in government healthcare programs. We operate in jurisdictions that have experienced governmental and private sector corruption to some degree, and, in certain circumstances, strict compliance with anti-bribery laws may conflict with certain local customs and practices. We cannot assure that our internal control policies and procedures always will protect us from reckless or other inappropriate acts committed by our affiliates, employees, distributors or other agents. Violations of these laws, or allegations of such violations, could have a material adverse effect on our business, financial position and results of operations.
Changes in tax laws and unanticipated tax liabilities could adversely affect the Company's effective income tax rate and profitability.
The Company is subject to income taxes in the United States and numerous foreign jurisdictions. Although comprehensive U.S. tax legislation commonly referred to as the Tax Cuts and Jobs Act (“the Tax Act”) enacted in December 2017 lowered the U.S. corporate income tax rate to 21%, the Company's effective income tax rate in the future could be adversely affected by a number of factors, including: changes in the mix of earnings in countries with differing statutory tax rates, changes in the valuation
23
of deferred tax assets and liabilities, changes in tax laws, the outcome of income tax audits in various jurisdictions around the world, and any repatriation of non-US earnings for which the Company has not previously provided for U.S. taxes. The Company regularly assesses all of these matters to determine the adequacy of its tax provision, which is subject to significant discretion.
The Tax Act is unclear in certain respects and could be subject to potential amendments and technical corrections, as well as interpretations and implementing regulations by the Treasury and Internal Revenue Service (IRS), any of which could lessen or increase certain adverse impacts of the legislation. In addition, it is unclear how these U.S. federal income tax changes will affect state and local taxation, which often uses federal taxable income as a starting point for computing state and local tax liabilities. While some of the changes made by the tax legislation may adversely affect the Company in one or more reporting periods and prospectively, other changes may be beneficial on a going forward basis. The Company is still evaluating certain provisions included in the Tax Act and therefore has not completed its full assessment. As such, there may be material adverse effects resulting from the Tax Act that the Company has not yet identified.
ITEM 1B. UNRESOLVED STAFF COMMENTS
None
ITEM 2. PROPERTIES
Our corporate headquarters and the locations and uses of our principal manufacturing and other properties as of December 31, 2017, are as follows:
Location | Approximate Square Footage | Primary Use | Owned/Leased | |||
San Clemente, California, U.S. | 39,000 | Corporate Headquarters and R&D | Owned | |||
San Clemente, California, U.S. | 19,858 | Corporate Headquarters | Leased | |||
San Diego, California, U.S. | 44,779 | Corporate Offices | Leased | |||
Lake Forest, Illinois, U.S. | 137,498 | Corporate Offices | Leased | |||
Montreal, Canada | 48,065 | Corporate Offices | Leased | |||
Chennai, India | 36,879 | Corporate Offices | Leased | |||
Austin, Texas, U.S. | 594,602 | Manufacturing | Owned | |||
Ensenada, Baja California, Mexico | 308,000 sq ft building and approximately 94 acres of land | Manufacturing | Owned | |||
La Aurora, Costa Rica | 58,238 SM* | Manufacturing | Owned | |||
Salt Lake City, Utah, U.S. | 450,000 | Manufacturing | Owned | |||
San Cristobal, Dominican Republic** | 13,000 | Manufacturing | Owned | |||
Farmers Branch, Texas, U.S. | 66,060 | Distribution Warehouse | Owned | |||
King of Prussia, Pennsylvania, U.S. | 105,571 | Distribution Warehouse | Owned | |||
Round Rock, Texas, U.S. | 71,960 | Distribution Warehouse | Owned | |||
Santa Fe Springs, California, U.S. | 76,794 | Distribution Warehouse | Owned | |||
Botony, NSW Australia | 330SM* | Device service center | Leased | |||
San Jose, California, U.S. | 78,119 | Device service center | Leased | |||
Sligo, Ireland | 26,000 | Device service center | Leased | |||
________________________ *SM - Square Meters | ||||||
** We are in the process of selling our Dominican Republic manufacturing facility | ||||||
In addition to the above, we own and lease additional office and building space, research and development, and sales and support offices primarily in North America, Europe, South America, and Asia. We believe our existing facilities, both owned and leased, are in good condition and suitable for the conduct of our business.
24
ITEM 3. LEGAL PROCEEDINGS
Certain legal proceedings in which we are involved are discussed in Part II, Item 8. "Financial Statements and Supplementary Data" of this Form 10-K in Note 16. Commitments and Contingencies to the Consolidated Financial Statements, and is incorporated herein by reference.
ITEM 4. MINE SAFETY DISCLOSURES
Not applicable.
PART II
ITEM 5. MARKET FOR REGISTRANT'S COMMON EQUITY, RELATED STOCKHOLDER MATTERS, AND ISSUER PURCHASES OF EQUITY SECURITIES
Market Information for Common Stock
Our common stock has been traded on the NASDAQ Global Select Market under the symbol “ICUI” since our initial public offering on March 31, 1992. The following table sets forth, for the quarters indicated, the high and low sales price per share for our common stock quoted by NASDAQ:
2017 | High | Low | ||||||
First quarter | $ | 159.95 | $ | 127.00 | ||||
Second quarter | $ | 175.73 | $ | 144.25 | ||||
Third quarter | $ | 188.85 | $ | 164.00 | ||||
Fourth quarter | $ | 225.38 | $ | 180.45 | ||||
2016 | High | Low | ||||||
First quarter | $ | 110.89 | $ | 85.56 | ||||
Second quarter | $ | 113.24 | $ | 98.10 | ||||
Third quarter | $ | 128.93 | $ | 108.51 | ||||
Fourth quarter | $ | 154.80 | $ | 124.85 | ||||
Dividends
We have never paid dividends and do not anticipate paying dividends in the foreseeable future as the Board of Directors intends to retain future earnings for use in our business or to purchase our shares. Any future determination as to payment of dividends or purchase of our shares will depend upon our financial condition, results of operations and such other factors as the Board of Directors deems relevant.
Stockholders
As of January 31, 2018, we had 59 stockholders of record. This does not include persons whose stock is in nominee or “street name” accounts through brokers.
Securities authorized for issuance under equity compensation plans are discussed in Part III, Item 12 of this Annual Report on Form 10-K.
Issuer Repurchase of Equity Securities
The following is a summary of our stock repurchasing activity during the fourth quarter of 2017:
25
Period | Shares purchased | Average price paid per share | Shares purchased as part of a publicly announced program | Approximate dollar value that may yet be purchased under the program(1) | ||||||||||
10/01/2017 - 10/31/2017 | — | $ | — | — | $ | 7,169,000 | ||||||||
11/01/2017 - 11/30/2017 | — | $ | — | — | 7,169,000 | |||||||||
12/01/2017 - 12/31/2017 | — | $ | — | — | 7,169,000 | |||||||||
Fourth quarter 2017 total | — | $ | — | — | $ | 7,169,000 | ||||||||
____________________________
(1) | Our common stock purchase plan, which authorized the repurchase of up to $40.0 million of our common stock, was authorized by our Board of Directors and publicly announced on July 19, 2010. This plan has no expiration date. We are not obligated to make any purchases under our stock purchase program. Subject to applicable state and federal corporate and securities laws, purchases under a stock purchase program may be made at such times and in such amounts as we deem appropriate. Purchases made under our stock purchase program can be discontinued at any time we feel additional purchases are not warranted. |
26
COMPARISON OF CUMULATIVE TOTAL RETURN FROM DECEMBER 31, 2012 TO DECEMBER 31, 2017 OF ICU MEDICAL, INC., NASDAQ AND NASDAQ MEDICAL SUPPLIES INDEX
The following graph shows the total stockholder return on our common stock based on the market price of the common stock from December 31, 2012 to December 31, 2017 and the total returns of the NASDAQ U.S. Index and NASDAQ Medical Supplies Index for the same period.
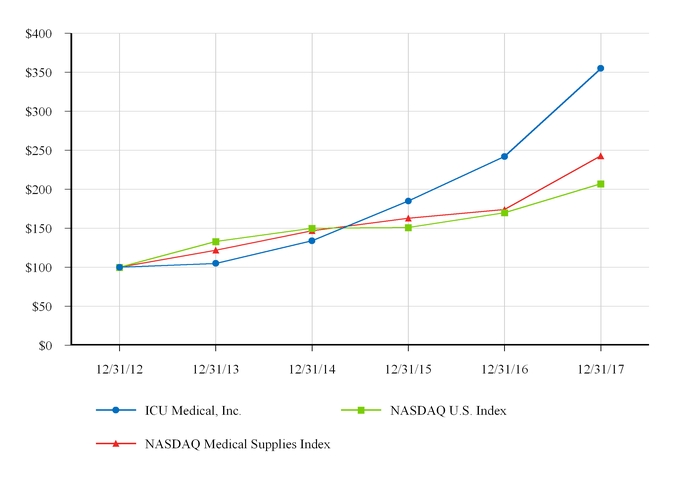
12/31/2012 | 12/31/2013 | 12/31/2014 | 12/31/2015 | 12/31/2016 | 12/31/2017 | |||||||||||||||||||
ICU Medical, Inc. | $ | 100.00 | $ | 104.56 | $ | 134.42 | $ | 185.10 | $ | 241.83 | $ | 354.51 | ||||||||||||
NASDAQ U.S. Index | $ | 100.00 | $ | 133.48 | $ | 150.12 | $ | 150.84 | $ | 170.46 | $ | 206.91 | ||||||||||||
NASDAQ Medical Supplies Index | $ | 100.00 | $ | 122.44 | $ | 147.13 | $ | 162.69 | $ | 173.78 | $ | 243.25 | ||||||||||||
Assumes $100 invested on December 31, 2012 in ICU Medical Inc.’s common stock, the NASDAQ U.S. Index and the NASDAQ Medical Supplies Index and that all dividends, if any, were reinvested.
27
ITEM 6. SELECTED FINANCIAL DATA
The following selected consolidated financial data (presented in thousands, except per share amounts) is derived from our Consolidated Financial Statements. During 2017, we acquired HIS (see Note 2 to the consolidated financial statements in Part II, Item 8 of this Form 10-K). Our historical operating results are not necessarily indicative of future operating results and should be read in conjunction with the Consolidated Financial Statements and notes thereto, and with Item 7, Management’s Discussion and Analysis of Financial Condition and Results of Operations.
Year ended December 31, | ||||||||||||||||||||
(in thousands, except per share data) | ||||||||||||||||||||
2017 | 2016 | 2015 | 2014 | 2013 | ||||||||||||||||
INCOME DATA: | ||||||||||||||||||||
REVENUE | ||||||||||||||||||||
Net sales | $ | 1,292,166 | $ | 379,339 | $ | 341,254 | $ | 308,770 | $ | 313,056 | ||||||||||
Other | 447 | 33 | 414 | 490 | 660 | |||||||||||||||
TOTAL REVENUE | 1,292,613 | 379,372 | 341,668 | 309,260 | 313,716 | |||||||||||||||
COST OF GOODS SOLD | 866,518 | 177,974 | 160,871 | 157,859 | 158,984 | |||||||||||||||
GROSS PROFIT | 426,095 | 201,398 | 180,797 | 151,401 | 154,732 | |||||||||||||||
Selling, general and administrative expenses | 303,953 | 89,426 | 83,216 | 88,939 | 89,006 | |||||||||||||||
Research and development expenses | 51,253 | 12,955 | 15,714 | 18,332 | 12,407 | |||||||||||||||
Restructuring and strategic transaction | 77,967 | 15,348 | 8,451 | 5,093 | 1,370 | |||||||||||||||
Change in fair value of contingent earn-out | 8,000 | — | — | — | — | |||||||||||||||
Gain on sale of assets | — | — | (1,086 | ) | — | — | ||||||||||||||
Legal settlements | — | — | 1,798 | — | — | |||||||||||||||
Impairment of assets held for sale | — | 728 | 4,139 | — | — | |||||||||||||||
TOTAL OPERATING EXPENSES | 441,173 | 118,457 | 112,232 | 112,364 | 102,783 | |||||||||||||||
(LOSS) INCOME FROM OPERATIONS | (15,078 | ) | 82,941 | 68,565 | 39,037 | 51,949 | ||||||||||||||
BARGAIN PURCHASE GAIN | 70,890 | 1,456 | — | — | — | |||||||||||||||
INTEREST EXPENSE | (2,047 | ) | (118 | ) | (39 | ) | — | — | ||||||||||||
OTHER (EXPENSE) INCOME, net | (2,482 | ) | 885 | 1,173 | 755 | 765 | ||||||||||||||
INCOME BEFORE INCOME TAXES | 51,283 | 85,164 | 69,699 | 39,792 | 52,714 | |||||||||||||||
BENEFIT (PROVISION) FOR INCOME TAXES | 17,361 | (22,080 | ) | (24,714 | ) | (13,457 | ) | (12,296 | ) | |||||||||||
NET INCOME | $ | 68,644 | $ | 63,084 | $ | 44,985 | $ | 26,335 | $ | 40,418 | ||||||||||
NET INCOME PER SHARE | ||||||||||||||||||||
Basic | $ | 3.50 | $ | 3.90 | $ | 2.84 | $ | 1.72 | $ | 2.75 | ||||||||||
Diluted | $ | 3.29 | $ | 3.66 | $ | 2.73 | $ | 1.68 | $ | 2.65 | ||||||||||
WEIGHTED AVERAGE NUMBER OF SHARES | ||||||||||||||||||||
Basic | 19,614 | 16,168 | 15,848 | 15,282 | 14,688 | |||||||||||||||
Diluted | 20,858 | 17,254 | 16,496 | 15,647 | 15,274 | |||||||||||||||
Cash dividends per share | $ | — | $ | — | $ | — | $ | — | $ | — | ||||||||||
CASH FLOW DATA: | ||||||||||||||||||||
Total cash flows from operations | $ | 154,423 | $ | 89,941 | $ | 64,195 | $ | 66,340 | $ | 72,692 | ||||||||||
28
As of December 31, | ||||||||||||||||||||
(in thousands) | ||||||||||||||||||||
2017 | 2016 | 2015 | 2014 | 2013 | ||||||||||||||||
BALANCE SHEET DATA: | ||||||||||||||||||||
Cash, cash equivalents and short-term investment securities | $ | 300,133 | $ | 445,082 | $ | 377,397 | $ | 346,764 | $ | 296,891 | ||||||||||
Working capital | $ | 654,370 | $ | 528,560 | $ | 462,389 | $ | 403,801 | $ | 367,410 | ||||||||||
Total assets | $ | 1,496,951 | $ | 704,688 | $ | 626,825 | $ | 541,102 | $ | 499,643 | ||||||||||
Stockholders’ equity | $ | 1,198,254 | $ | 660,155 | $ | 579,871 | $ | 508,252 | $ | 464,725 | ||||||||||
ITEM 7. MANAGEMENT'S DISCUSSION AND ANALYSIS OF FINANCIAL CONDITION AND RESULTS OF OPERATIONS
The following discussion should be read in conjunction with our Consolidated Financial Statements and Notes thereto.
Business Overview and Highlights
On February 3, 2017, we completed the acquisition of Pfizer's HIS business. See "Acquisitions" below for additional detail regarding the acquisition. HIS was a leading global provider of IV products to hospitals and alternate site providers, such as clinics, home health care providers and long-term care facilities. Our acquisition of the HIS business was strategic and provides us with an increase in scale and product portfolio that we believe will result in a stronger competitive position within the industry. We believe the HIS business acquisition was the natural evolution for us based on a long-term successful and productive partnership with HIS for over 20 years.
Following the HIS business acquisition, we are one of the world's leading pure-play infusion therapy companies with global operations and a wide-ranging product portfolio that includes IV solutions, IV smart pumps with pain management and safety software technology, dedicated and non-dedicated IV sets and needlefree connectors designed to help meet clinical, safety and workflow goals. In addition, we manufacture automated pharmacy IV compounding systems with workflow technology, closed systems transfer devices for preparing and administering hazardous IV drugs, and cardiac monitoring systems for critically ill patients.
We have restructured our product lines to integrate the HIS business product portfolio and have presented our financial results in accordance with the following four product lines with our primary products listed:
Infusion Consumables
Infusion Therapy
◦ | Clave® needlefree products, including the MicroClave, MicroClave Clear, and NanoClave brand of connectors, accessories, extension and administration sets used for the administration of IV fluids and medications. |
◦ | Neutron® Catheter Patency Connector, used to help maintain patency of central venous catheters. |
◦ | SwabCap® Disinfecting Cap, used to protect and disinfect any needlefree connector including, including competitive brands of connectors. |
◦ | Tego® Hemodialysis Connector |
◦ | NovaCath® and SuperCath® Peripheral IV Catheters |
Closed System Transfer Devices (CSTD)
◦ | ChemoLock® Closed System Transfer Device (CSTD), is a pharmacy preferred CSTD used for the preparation and administration of hazardous drugs. |
29
◦ | ChemoClave® CSTD, is an ISO standard and universally compatible CSTD used for the preparation and administration of hazardous drugs. |
◦ | Diana™ hazardous drug compounding system, used for the preparation of hazardous drugs. |
IV Solutions
• | Sterile Solutions - IV solutions, normal saline, Ringers etc., used to replenish fluids and electrolytes by IV infusion. |
• | Irrigation Solutions - Used externally on open wounds to hydrate the wound, remove deep debris, assist with visual examination, to prevent infection and improve healing. |
• | Nutritionals - Solutions that feed vitamins, minerals and other natural therapeutic substances directly into the blood stream. We are committed to helping our customers deliver more comprehensive patient-care therapies, delivering an extensive source of nutrients for patients who cannot consume a normal diet. |
Infusion Systems
Infusion Pump Hardware - Our current pump platform includes four infusion pumps:
◦ | Plum 360™: The Plum 360™ infusion pump is an ICU Medical MedNet™ ready large volume infusion pump with an extensive drug library and wireless capability. |
◦ | LifeCare PCA™: The LifeCare PCA™ infusion pump is an ICU Medical MedNet™ ready patient-controlled analgesia pump. |
◦ | SapphirePlus™: The SapphirePlus™ infusion pump is an ICU Medical MedNet™ ready large volume infusion pump with an extensive drug library and wireless capability. The SapphirePlus is designed and manufactured by Q Core. |
◦ | Sapphire™: The Sapphire™ infusion pump is a compact infusion system used in ambulatory and hospital settings. The Sapphire™ infusion pump comes in multi-therapy and epidural-only configurations. The Sapphire is designed and manufactured by Q Core. |
We offer the ICU Medical MedNet™ safety software system, which is designed for hospitals to customize intravenous drug dosage limits and track drug delivery to help prevent medication errors.
Critical Care
• | Hemodynamic Monitoring Systems. |
◦ | Cogent® 2-in-1 Hemodynamic Monitoring System |
◦ | LiDCO LX1TM Noninvasive Hemodynamic Monitoring System |
◦ | CardioFlo® Hemodynamic Monitoring Sensor |
◦ | TriOx® PICC Minimally Invasive Venous Oximetry Sensor |
• | SafeSet® Closed Blood Sampling and Conservation System. |
• | Transpac® Consumable Blood Pressure Transducers. |
• | Q2 Plus™ CCO/SvO2 (continuous cardiac output/oximetry). |
Our primary customers are acute care hospitals, wholesalers, ambulatory clinics and alternate site facilities, such as clinics, home health care providers and long-term care facilities.
30
The following table summarizes our total worldwide revenue by domestic and international markets by amount and as a percentage of total revenue (in millions, except percentages):
Year Ended December 31, | ||||||||||||||||||||
2017 | 2016 | 2015 | ||||||||||||||||||
$ | % of Revenue | $ | % of Revenue | $ | % of Revenue | |||||||||||||||
Domestic | $ | 980.0 | 76 | % | $ | 266.0 | 70 | % | $ | 241.9 | 71 | % | ||||||||
International | 312.6 | 24 | % | 113.4 | 30 | % | 99.8 | 29 | % | |||||||||||
Total Revenue | $ | 1,292.6 | 100 | % | $ | 379.4 | 100 | % | $ | 341.7 | 100 | % | ||||||||
The following table sets forth, for the periods indicated, total revenue by product line as a percentage of total revenue:
Product line | 2017 | 2016 | 2015 | ||||||
Infusion Consumables | 28 | % | 86 | % | 84 | % | |||
IV Solutions | 40 | % | — | % | — | % | |||
Infusion Systems | 23 | % | — | % | — | % | |||
Critical Care | 4 | % | 14 | % | 16 | % | |||
Other | 5 | % | — | % | — | % | |||
100 | % | 100 | % | 100 | % | ||||
We manage our product distribution in the U.S. through a network of three owned distribution facilities, as well as, through direct channels, which include independent distributors and the end users of our products, and as original equipment manufacturer suppliers. Most of our independent distributors handle the full line of our products. Internationally, we manage our operations through the Netherlands, which utilizes international regional hubs and we also manage our operations through independent distributors.
A substantial amount of our products are sold to group purchasing organization ("GPO") member hospitals. We believe that as healthcare providers continue to either consolidate or join major buying organizations, the success of our products will depend, in part, on our ability, either independently or through strategic relationships to secure long-term contracts with large healthcare providers and major buying organizations. As a result of this marketing and distribution strategy we derive most of our revenue from a relatively small number of distributors and manufacturers. Although we believe that we are not dependent on any single distributor for distribution of our products, the loss of a strategic relationship with a customer or a decline in demand for our products could have a material adverse effect on our operating results.
We believe that achievement of our growth objectives worldwide will require increased efforts by us in sales and marketing and product acquisition and development; however, there is no assurance that we will be successful in implementing our growth strategy. Product development or acquisition efforts may not succeed, and even if we do develop or acquire additional products, there is no assurance that we will achieve profitable sales of such products. Increased expenditures for sales and marketing and product acquisition and development may not yield desired results when expected, or at all. While we have taken steps to control these risks, there are certain risks that may be outside of our control, and there is no assurance that steps we have taken will succeed.
Seasonality/Quarterly Results
There are no significant seasonal aspects to our business. We can experience fluctuations in net sales as a result of variations in the ordering patterns of our largest customers, which may be driven more by production scheduling and their inventory levels, and less by seasonality. Our expenses often do not fluctuate in the same manner as net sales, which may cause fluctuations in operating income that are disproportionate to fluctuations in our revenue.
31
Recent Acquisitions
On February 1, 2017, we acquired 100% interest in Fannin (UK) Limited ("Fannin") for total consideration of approximately $1.5 million. Fannin provides infusion therapy consumable products to the healthcare sector in the United Kingdom and Ireland.
On February 3, 2017, we acquired 100% interest in Pfizer's HIS business for total consideration of approximately $260.0 million in cash (net of estimated working capital adjustments paid at closing) and the issuance of 3.2 million shares of our common stock. We partially funded the cash portion of the consideration paid with a $75 million three-year interest-only seller note. The fair value of the common shares issued to Pfizer was determined based on the closing price of our common shares on the issuance date, discounted to reflect a contractual lock-up period whereby Pfizer cannot transfer the shares, subject to certain exceptions, until the earlier of (i) the expiration of Pfizer’s services to us in the related transitional services agreement or (ii) eighteen months. Pfizer also may be entitled up to an additional $225 million in cash contingent consideration based on the achievement of performance targets for the combined company for the three years ending December 31, 2019.
On November 29, 2017, we acquired 100% interest in Medical Australia Limited for total consideration of $9.0 million. Medical Australia Limited manufactures and distributes quality medical devices and equipment for the healthcare industry.
In October 2015, we acquired Excelsior Medical Corporation’s SwabCap disinfecting cap for needlefree IV connectors to enhance our direct and OEM infusion therapy product offerings and to open new customer opportunities globally.
See Note 2 to the consolidated financial statements in Part II, Item 8 of this Form 10-K for further details of our acquisitions.
Five-year Revolving Credit Facility ("Credit Facility")
On November 8, 2017, we entered into a five-year Revolving Credit Facility ("Credit Facility") with various lenders for $150 million, with Wells Fargo Bank, N.A. as the administrative agent. The Credit Facility has an accordion feature that would enable us to increase the borrowing capacity of the credit facility by the greater of (i) $100 million and (ii) 2.00x Total Leverage (as defined in our Credit Facility). Under the terms of the facility we will be subject to certain financial covenants pertaining to leverage and fixed charge coverage ratios, see below under "Liquidity and Capital Resources" for further details. Borrowings under the Credit Facility will bear interest, at our option, based on the Base Rate plus applicable margin or LIBOR plus an applicable margin, both tied to the leverage ratio in effect. The unused portion of the Credit Facility will be subject to a per annum commitment fee which is also calculated using the leverage ratio in effect. The Credit Facility was entered into in order to provide us with flexible funding for future acquisition and operational needs.
In connection with the Credit Facility, for the year ended December 31, 2017, we incurred $1.4 million in financing costs, which will be amortized to interest expense over the remaining term of the Credit Facility.
See Note 12 to the consolidated financial statements in Part II, Item 8 of this Form 10-K for further information regarding the Credit Facility.
32
Consolidated Results of Operations
We present summarized income statement data in Item 6. Selected Financial Data. The following table shows, for the three most recent years, the percentages of each income statement caption in relation to total revenues.
Percentage of Revenues | |||||||||
2017 | 2016 | 2015 | |||||||
Revenue | |||||||||
Net sales | 100 | % | 100 | % | 100 | % | |||
Other | — | % | — | % | — | % | |||
Total revenues | 100 | % | 100 | % | 100 | % | |||
Gross margin | 33 | % | 53 | % | 53 | % | |||
Selling, general and administrative expenses | 24 | % | 24 | % | 24 | % | |||
Research and development expenses | 4 | % | 3 | % | 5 | % | |||
Restructuring and transaction expense | 6 | % | 4 | % | 2 | % | |||
Change in fair value of contingent earn-out | 1 | % | — | % | — | % | |||
Gain on sale of building | — | % | — | % | — | % | |||
Legal settlements | — | % | — | % | 1 | % | |||
Impairment of assets held for sale | — | % | — | % | 1 | % | |||
Total operating expenses | 35 | % | 31 | % | 33 | % | |||
(Loss) Income from operations | (2 | )% | 22 | % | 20 | % | |||
Bargain Purchase Gain | 5 | % | — | % | — | % | |||
Interest expense | — | % | — | % | — | % | |||
Other (expense) income, net | — | % | — | % | — | % | |||
Income before income taxes | 3 | % | 22 | % | 20 | % | |||
(Benefit) Provision For Income taxes | (1 | )% | 6 | % | 7 | % | |||
Net income | 4 | % | 16 | % | 13 | % | |||
Total revenues for 2017, 2016 and 2015 were $1.3 billion, $379.4 million and $341.7 million, respectively.
Infusion Consumables
The following table summarizes our total Infusion Consumables revenue (in millions, except percentages):
Year Ended December 31, | $ change | % change | $ change | % change | |||||||||||||||||||||
2017 | 2016 | 2015 | 2017 over 2016 | 2016 over 2015 | |||||||||||||||||||||
Infusion Consumables | $ | 365.6 | $ | 324.9 | $ | 286.2 | $ | 40.7 | 12.5 | % | $ | 38.7 | 13.5 | % | |||||||||||
In 2017, our Infusion Consumables revenue included our acquired revenue from the HIS business, which year-to-date includes approximately eleven months of revenue from the point of closing of the transaction to the end of the current year. Additionally, the Infusion Consumables market segment includes our legacy Infusion Therapy and Oncology businesses.
In 2016 and 2015, our Infusion Consumables revenue as presented above consisted of our legacy Infusion Therapy and Oncology businesses. In 2016, as compared to 2015, the increased revenue was primarily related to our Swabcap product-line, which was acquired in the last quarter of 2015, and our Clave, ChemoClave and ChemoLock products as a result of sales to new customers and an increase in sales to existing customers.
33
IV Solutions
The following table summarizes our total IV Solutions revenue (in millions, except percentages):
Year Ended December 31, | $ change | % change | $ change | % change | |||||||||||||||||||
2017 | 2016 | 2015 | 2017 over 2016 | 2016 over 2015 | |||||||||||||||||||
IV Solutions | $ | 522.0 | $ | — | $ | — | $ | 522.0 | * | $ | — | * | |||||||||||
______________________________
* Not Applicable
The IV Solutions revenue is a result of the acquisition of the HIS business and also includes $68.9 million of revenue related to contract manufacturing to Pfizer at cost in accordance with a Manufacturing and Supply Agreement. The year-to-date revenue represents approximately eleven months of revenue from the point of closing of the transaction to the end of the current year.
Infusion Systems
The following table summarizes our total Infusion Systems revenue (in millions, except percentages):
Year Ended December 31, | $ change | % change | $ change | % change | |||||||||||||||||||
2017 | 2016 | 2015 | 2017 over 2016 | 2016 over 2015 | |||||||||||||||||||
Infusion Systems | $ | 290.2 | $ | — | $ | — | $ | 290.2 | * | $ | — | * | |||||||||||
______________________________
* Not Applicable
The Infusion Systems revenue is a result of the acquisition of the HIS business. The year-to-date revenue represents approximately eleven months of revenue from the point of closing of the transaction to the end of the current year.
Critical Care
The following table summarizes our total Critical Care revenue (in millions, except percentages):
Year Ended December 31, | $ change | % change | $ change | % change | |||||||||||||||||||||
2017 | 2016 | 2015 | 2017 over 2016 | 2016 over 2015 | |||||||||||||||||||||
Critical Care | $ | 50.0 | $ | 53.6 | $ | 54.3 | $ | (3.6 | ) | (6.7 | )% | $ | (0.7 | ) | (1.3 | )% | |||||||||
In 2017, Critical Care revenue, as compared to 2016, slightly decreased due to timing of orders. In 2016, Critical Care revenue decreased, as compared to 2015, due to temporary production constraints that impacted the first part of 2016.
Revenue from Deferred Close Entities
As part of the HIS business acquisition, the closing of certain foreign jurisdictions were deferred, as such, we entered into a Net Economic Benefit agreement with Pfizer (see Note 2 to the consolidated financial statements in Part II, Item 8 of this Form 10-K for additional information). The revenue data related to these deferred closing entities is not available by product line, therefore our revenue by product line above does not include amounts related to these entities for the year ended December 31, 2017.
The following table summarizes our revenue from our deferred close entities (in millions):
Year Ended December 31, | $ change | % change | $ change | % change | |||||||||||||||||||
2017 | 2016 | 2015 | 2017 over 2016 | 2016 over 2015 | |||||||||||||||||||
Revenue from Deferred Close Entities | $ | 64.4 | $ | — | $ | — | $ | 64.4 | * | $ | — | * | |||||||||||
______________________________
* Not meaningful.
34
Gross Margins
Gross margins for 2017, 2016 and 2015 were 33.0%, 53.1%, and 52.9%, respectively.
The decrease in gross margin in 2017, as compared to 2016, was primarily due to the integration of HIS, which has historically had lower gross margins than our legacy business. Additionally, there was an impact of approximately five percentage points related to the step-up of inventory from our purchase accounting and also a temporary negative impact on absorption due to our planned inventory reduction.
The 20 basis point increase in gross margin in 2016, as compared to 2015, was primarily due to favorable foreign exchange rates on our operations expenses due to the decline in the Mexican Peso and favorable product mix partially offset by the impact of certain manufacturing constraints in the earlier part of the year.
Selling, General and Administrative ("SG&A") Expenses
The following table summarizes our SG&A expenses (in millions, except percentages):
Year Ended December 31, | $ change | % change | $ change | % change | |||||||||||||||||||||
2017 | 2016 | 2015 | 2017 over 2016 | 2016 over 2015 | |||||||||||||||||||||
SG&A | $ | 304.0 | $ | 89.4 | $ | 83.2 | $ | 214.6 | 240.0 | % | $ | 6.2 | 7.5 | % | |||||||||||
Consolidated SG&A expense increased $214.6 million in 2017, as compared to 2016, primarily due to the impact of the HIS acquisition. Compensation increased $83.7 million, accounting and information technology fees increased $72.4 million, depreciation expense increased $16.0 million, computer hardware and software increased $11.5 million, travel and related expenses increased $5.8 million and rent expense increased $3.3 million. Compensation increased primarily due to an increase in headcount related to the HIS acquisition, and from new employees hired to support the company post-acquisition. Accounting and information technology fees increased due to the expenses incurred under the transition services agreement with Pfizer. Depreciation expense increased due to the depreciation of the HIS assets acquired. Computer hardware and software increases were due to the post-acquisition needs to stand up the company. Travel and related expenses increased primarily due to the integration of the HIS acquisition and the post-acquisition operational activity. Rent expense increased due to the operating leases assumed on acquired HIS properties.
Consolidated SG&A expense increased in 2016, as compared to 2015, primarily due to an increase of $3.6 million in compensation, $1.5 million in higher dealer fees, $1.3 million in commissions and $0.7 million in depreciation and amortization partially offset by $1.9 million in lower medical device excise taxes and a $0.6 million decrease in legal fees. The increase in compensation was in part due to filling positions that were open during 2015, additional employees retained as part of the acquired SwabCap product line, the general hiring and recruitment of new employees and increases in stock-based compensation issued to attract these employees. The increases in dealer fees and commissions were related to an increase in revenue on which they are calculated. The increase in depreciation and amortization was primarily driven by amortization of acquired intangible assets related to our 2015 acquisition of EXC Holding Corp ("EXC"). The decrease in medical device excise tax expense was due to the elimination of the tax in the current period due to Congress temporarily suspending this tax for the 2016-2017 two-year period and the decrease in legal expenses were a result of fewer litigations.
Research and Development ("R&D") Expenses
The following table summarizes our total R&D Expenses (in millions, except percentages):
Year Ended December 31, | $ change | % change | $ change | % change | |||||||||||||||||||||
2017 | 2016 | 2015 | 2017 over 2016 | 2016 over 2015 | |||||||||||||||||||||
R&D | $ | 51.3 | $ | 13.0 | $ | 15.7 | $ | 38.3 | 294.6 | % | $ | (2.7 | ) | (17.2 | )% | ||||||||||
In 2017, as compared to 2016, R&D expenses increased due to the acquisition of HIS.
In 2016, as compared to 2015, R&D expenses declined primarily from decreasing R&D project expenses related to the development of our CogentTM 2-in-1 hemodynamic monitoring system, which received FDA 510(k) clearance during 2016.
35
Restructuring and Strategic Transaction Expenses
Restructuring and strategic transaction expenses were $78.0 million, $15.3 million and $8.5 million in 2017, 2016 and 2015, respectively.
Restructuring Charges
In 2017, restructuring charges were $18.8 million. These charges were related to (i) severance costs from the reduction in our workforce needed to eliminate duplicative positions created as a result of the HIS acquisition and (ii) we are also in the process of closing our Dominican Republic manufacturing facilities and have incurred expenses associated with the closure and transfer of assets and production to our Costa Rica and Mexico manufacturing facilities. We have $0.9 million in unpaid restructuring charges related to the year-ended December 31, 2017.
In 2016, restructuring charges were $1.0 million. These charges were primarily related to residual expenses for the closure of our Slovakian manufacturing facility and we incurred $0.2 million related to other restructuring activities.
In 2015, restructuring charges were $6.7 million. These charges were related to: (i) an agreement with Dr. Lopez, a member of our Board of Directors and a former employee in our research and development department, pursuant to which we bought out Dr. Lopez's right to employment under his then-existing employment agreement; (ii) the reorganization of our corporate infrastructure, resulting in one-time employee termination benefits and other associated costs; and (iii) a commitment to a plan to sell our Slovakia manufacturing facility.
Strategic Transaction and Integration Expenses
In 2017, we incurred $59.2 million in strategic transaction and integration expenses primarily related to our acquisition of the HIS business.
In 2016, we incurred $14.3 million in strategic transaction expenses related to our acquisition of the HIS business, our second quarter 2016 acquisition of Tangent and expenses related to our acquisition of EXC.
In 2015, we incurred $1.8 million in strategic transaction expenses related to the acquisition of EXC.
Change in fair value of contingent earn-out
In 2017, the fair value revaluation of our HIS contingent earn-out liability resulted in a loss of $8.0 million.
Gain on sale of building
We recognized a gain of $1.1 million in 2015 from the sale of one of our buildings in San Clemente to Dr. Lopez, a member of our Board of Directors.
Legal Settlements
During 2015, we recorded a net settlement charge of $1.8 million, less than 1% of revenues, due to the following claims:
An arbitrator ruled on a breach of contract claim between us and a service provider, awarding us a gross settlement of $8.8 million. Our legal counsel for this matter represented us under a contingency fee agreement. We recorded a settlement award, net of legal fees and costs, of $5.3 million; and
An arbitrator ruled on a breach of contract claim between us and a customer, Hospira, awarding Hospira a settlement and that we pay 75% of Hospira's legal fees and expenses, resulting in a $7.1 million legal settlement charge.
Impairment of Assets Held-for-Sale
During 2016, we completed the closure of our Slovakia manufacturing facility and sold the land and building held-for-sale for $3.3 million, net of costs to sell, resulting in an additional impairment loss of $0.7 million.
36
During 2015, our Board of Directors authorized us to close our Vrable, Slovakia manufacturing facility. The closure was to enable for greater efficiency of our Ensenada, Mexico facility. After receiving the Board of Director's authorization, we reclassified the assets related to the Slovakia facility as held-for-sale, and recorded the value of those assets at the lower of their carrying value or their estimated fair value, less costs to sell, which was based on a third party fair market valuation. As the estimated fair value, less cost to sell was lower than the carrying value of the assets held-for-sale we recorded an impairment charge of $4.1 million.
Bargain Purchase Gain
In 2017, in connection with the HIS acquisition, we recognized a bargain purchase gain of $70.9 million. The bargain purchase gain represented the excess of the estimated fair market value of the identifiable tangible and intangible assets acquired and liabilities assumed, net of deferred tax liabilities over the total purchase consideration. We determined that the bargain purchase gain was primarily attributable to expected restructuring costs as well as a reduction to the initially agreed upon transaction price caused primarily by revenue shortfalls across all market segments of the HIS business, negative manufacturing variance due to the drop in revenue and higher operating and required stand up costs, when compared to forecasts of the HIS business at the time that the purchase price was agreed upon.
In 2016, we recognized a bargain purchase gain of $1.5 million in connection with the Tangent acquisition. The bargain purchase gain represented the excess of the estimated fair market value of the identifiable tangible and intangible assets acquired and liabilities assumed, net of deferred tax assets over the total purchase consideration. The bargain purchase was driven by our ability to realize acquired deferred tax assets.
Interest Expense
Interest expense was $2.0 million, $0.1 million and $0.0 million in 2017, 2016 and 2015, respectively. In 2017, the interest expense was related to (i) the $75 million seller note from Pfizer as part of the HIS business acquisition and (ii) the per annum commitment fee charged on the unused portion of our revolver under the new five-year $150 million Credit Facility.
The three-year interest only seller note bore interest based on the London Interbank Offered Rate ("LIBOR") plus (i) 2.25% per year for the first 12 months, and (ii) 2.50% per annum thereafter. On November 8, 2017, we fully repaid the $75 million in outstanding principal under the senior note payable to Pfizer.
The per annum commitment fee is based on consolidated total leverage ratio in effect and can range between 0.15% to 0.30% on the unused portion of the Credit Facility.
Other (Expense) Income
Other (expense) income was $(2.5) million, $0.9 million and $1.2 million in 2017, 2016 and 2015, respectively.
Income taxes
Income taxes were accrued at an estimated annual effective tax rate of (34%), 26% and 35% in 2017, 2016 and 2015, respectively.
The effective tax rate for 2017 differs from the federal statutory rate of 35% principally because of the effect of the mix of U.S. and foreign incomes, state income taxes, tax credits and the impact of the gain on bargain purchase. The effective tax rate during 2017 also included a material tax benefit of $20.8 million related to the excess tax benefits recognized on stock option exercises and the vesting of restricted stock units during the period.
As of December 31, 2017, we recorded income tax expense of $3.1 million as a result of the Tax Act, which is comprised of $1.1 million of income tax expense as a result of the re-measurement of deferred tax assets and liabilities at the new lower statutory tax rate of 21%, and a net tax expense of $2.0 million as a result of the mandatory deemed repatriation on earnings and profits of U.S.-owned foreign subsidiaries. We elected to record the mandatory repatriation and re-measurement of deferred taxes as a provisional amount for the year ended December 31, 2017, which we believe is a reasonable estimate in accordance with the Tax Act. However, due to the complexity and considerable amount of changes in tax law, we will adjust our estimates and further refine our tax calculations, if necessary, as changes to interpretations and further guidance around the newly enacted provisions are issued by the Internal Revenue Service. We are still evaluating various international provisions included in the Tax Act and have therefore not completed our assessment. These provisions will be effective for us beginning
37
on January 1, 2018, and may materially impact our effective tax rate in future years. For further discussion, see Note 13 to the consolidated financial statements in Part II, Item 8 of this Form 10-K.
The effective tax rate for 2016 differs from the federal statutory rate principally because of the effect of foreign and state income taxes, tax credits, deductions for domestic production activities, and included material discrete tax benefit of $7.6 million related to the excess tax benefits recognized on stock option exercises and the vesting of restricted stock units during the period, which is treated as a discrete item when determining our annual estimated effective tax rate.
Included in the 2015 estimated annual effective tax rate are the effects of foreign and state income taxes, tax credits, deductions for domestic production activities and discrete tax items related to the conclusion of state tax examinations, one-time tax effects related to the acquisition of EXC, and tax impact related to the proposed shut down of our Slovakia plant.
Liquidity and Capital Resources
Introduction
Our primary sources of cash are cash flows from operating activities, proceeds from the exercise of employee options and available borrowings under our Credit Facility (as defined above). Our primary uses of cash are to meet working capital requirements, finance capital expenditures and acquisitions along with acquisition-related incremental transaction and integration costs.
During 2017, our cash, cash equivalents and short-term investment securities decreased by $144.9 million from $445.1 million at December 31, 2016 to $300.1 million at December 31, 2017. The decrease was due to our 2017 acquisitions and the incremental costs such as transaction and integration costs related to those acquisitions.
As of December 31, 2017, we have $153.2 million of cash and cash equivalents held in local currency by our foreign subsidiaries. We expect to permanently reinvest these funds outside of the U.S. and, based on our current plans, we do not presently anticipate a need to repatriate them to fund our U.S. operations.
Future Cash Flows
Short-term
As mentioned above, we entered into a five-year $150 million Credit Facility. The Credit Facility provides us with fast, flexible funding for future acquisition and operational needs.
Our short-term investment portfolio is invested in corporate bonds and our primary investment goal is capital preservation.
While we can provide no assurances, we estimate that our capital expenditures in 2018 will approximate $80 million to $90 million. We anticipate making additional investments in machinery and equipment in our manufacturing operations in Costa Rica, the U.S. and Mexico to support new and existing products, in infusion products that get placed with customers outside the U.S., and in IT to benefit world-wide operations. We expect to use our cash and cash equivalents to fund our capital purchases. Amounts of spending are estimates and actual spending may substantially differ from those amounts.
We believe that our existing cash, cash equivalents along with funds expected to be generated from future operations will provide us with sufficient funds to finance our current operations for the next twelve months.
Long-term
Our long-term liquidity needs include interest/commitment payments on the Credit Facility, capital expenditures related to the expansion of our business and potential acquisitions in accordance with our growth strategy.
We are unable to project with certainty whether our long-term cash flow from operations and amounts available to us under our Credit Facility will be sufficient to fund our future capital expenditures and acquisitions as they arise. In the event that we experience illiquidity in our investment securities, downturns or cyclical fluctuations in our business that are more severe or longer than anticipated or if we fail to achieve anticipated revenue and expense levels, we may need to obtain or seek alternative sources of capital or financing, and we can provide no assurances that the terms of such capital or financing will be available to us on favorable terms, if at all.
38
Credit Facility
As mentioned above, we entered into a five-year Credit Facility that includes $150 million borrowing capacity available for revolving credit loans and may also be used to borrow, on same-day notice under a swingline, the lesser of $10 million and the aggregate unused amount of the revolving credit available. As of December 31, 2017, we had no borrowings and $150 million of availability under the revolving credit facility.
All of our obligations under the Credit Facility are guaranteed by ICU Medical, Inc. and certain of our existing subsidiaries. The obligations under the Credit Facility are secured by a pledge of 100% of the capital stock of certain subsidiaries owned by us and a security interest in substantially all of our tangible and intangible assets and the tangible and intangible assets of each guarantor.
The Credit Facility contains certain financial covenants pertaining to Consolidated Fixed Charge Coverage and Consolidated Total Leverage ratios, see below under "Financial Covenants". In addition, the Credit Facility has restrictions pertaining to limitations on debt, liens, negative pledges, loans, advances, acquisitions, other investments, dividends, distributions, redemptions, repurchases of equity interests, fundamental changes and asset sales and other dispositions, prepayments, redemptions and purchases of subordinated debt and other junior debt, transactions with affiliates, dividend and payment restrictions affecting subsidiaries, changes in line of business, fiscal year and accounting practices and amendment of organizational documents and junior debt documents.
Financial Covenants
The Credit Facility contains certain negative financial covenants, including, Consolidated Total Leverage and Consolidated Fixed Charge Coverage Ratios.
The Consolidated Leverage Ratio is defined as the ratio of Consolidated Total Funded Indebtedness on such date, to Consolidated Adjusted EBITDA, as defined under the Credit Facility Agreement, for the most recently completed four fiscal quarters. The maximum Consolidated Leverage Ratio is not more than 3.00 to 1.00.
The Consolidated Fixed Charge Coverage Ratio is defined as the ratio of: (a) Consolidated Adjusted EBITDA less the sum of (i) capital expenditures, (ii) federal, state, local and foreign income taxes paid in cash and (iii) cash restricted payments made after the closing date, to (b) Consolidated Fixed Charges for the most recently completed four fiscal quarters, calculated on a pro forma basis. The minimum Consolidated Fixed Charge Coverage Ratio is 2.00 to 1.00.
We were in compliance with all financial covenants as of December 31, 2017.
Historical Cash Flows
Cash Flows from Operating Activities:
Our cash provided by operations was $154.4 million in 2017. Net income plus adjustments for non-cash net expenses contributed $98.5 million to cash provided by operations. Net cash provided by operations as a result of changes in operating assets and liabilities was $55.9 million. The changes in operating assets and liabilities included a $181.7 million decrease in inventories, a $46.6 million increase in accounts payable, and a $33.8 million increase in accrued liabilities. Offsetting these cash inflows was a $95.3 million increase in related-party receivables, a $54.5 million increase in accounts receivable, a $31.8 million increase in prepaid expenses and other assets, and a $24.6 million net change in prepaid and deferred income taxes. The decrease in inventory was due to a planned inventory reduction of our acquired inventory to manage working capital needs. The increase in accounts payable was due to the increase in expenses related to the post-acquisition operations. The increase in accrued liabilities was primarily a result of increased salary and benefits due to a larger workforce. The increase in related-party receivables was primarily due to amounts paid for transitional service arrangement fees, working capital adjustments and other HIS-related amounts. The increase in prepaid expenses and other assets was primarily due to HIS post-acquisition operations. The increase in accounts receivable is due to the increase in revenue. The net changes in income taxes was a result of the timing of payments.
Our cash provided by operations was $89.9 million in 2016. Net income plus adjustments for non-cash net expenses contributed $98.7 million to cash provided by operations. Net cash used by operations as a result of changes in operating assets and liabilities was $8.8 million. The changes in operating assets and liabilities included a $5.5 million increase in inventories, a $3.0 million increase in prepaid expenses and other assets, a $1.2 million decrease in accrued liabilities, and a $0.5 million decrease in accounts payable, partially offset by a $0.7 million decrease in accounts receivable and a $0.7 million net change in
39
prepaid and deferred income taxes. The increase in inventories was primarily due to building finished good safety stock, to support better customer deliveries, raw materials related to our Slovakia plant closure, and related transfer to our Mexico plant, and inventory associated with the acquired SwabCap product-line. The increase in prepaid expenses and other assets was primarily due to repayment of state aid and interest related to the closure of our Slovakian manufacturing facilities. The decrease in accrued liabilities was primarily due to the payment of accrued restructuring charges related to the closure of our Slovakian manufacturing facility and the payment of acquisition-related accruals from our 2015 EXC acquisition. The decrease in accounts payable was a result of the timing of disbursements. The decrease in accounts receivable was due to collection efforts on our past due accounts. The net changes in income taxes was a result of the timing of payments for cash tax purposes, which includes true-ups for 2015 overpayment and 2016 estimated taxes.
Cash Flows from Investing Activities
The following table summarizes the changes in our investing cash flows (in thousands):
For the Years Ended December 31, | Variance | ||||||||||||||||||||
2017 | 2016 | 2015 | 2017 | 2016 | |||||||||||||||||
Investing Cash Flows: | |||||||||||||||||||||
Purchases of property, plant and equipment | $ | (74,479 | ) | $ | (23,361 | ) | $ | (12,984 | ) | $ | (51,118 | ) | $ | (10,377 | ) | (1) | |||||
Proceeds from sale of assets | 2 | — | 3,592 | 2 | (3,592 | ) | (2) | ||||||||||||||
Proceeds from the disposal of assets held-for-sale, net | — | 3,268 | — | (3,268 | ) | 3,268 | (3) | ||||||||||||||
Intangible asset additions | (5,203 | ) | (1,192 | ) | (951 | ) | (4,011 | ) | (241 | ) | |||||||||||
Business acquisitions, net of cash acquired | (162,448 | ) | (2,584 | ) | (56,786 | ) | (159,864 | ) | 54,202 | (4) | |||||||||||
Proceeds from sale of assets acquired in a business combination | — | — | 28,970 | — | (28,970 | ) | (5) | ||||||||||||||
Purchases of investment securities | (24,743 | ) | (118,384 | ) | (56,137 | ) | 93,641 | (62,247 | ) | (6) | |||||||||||
Proceeds from sale of investment securities | — | 158,534 | 83,054 | (158,534 | ) | 75,480 | (7) | ||||||||||||||
Net cash (used in) provided by investing activities | $ | (266,871 | ) | $ | 16,281 | $ | (11,242 | ) | $ | (283,152 | ) | $ | 27,523 | ||||||||
______________________________
(1) Our purchases of property, plant and equipment will vary from period to period based on additional investments needed to support new and existing products and expansion of our manufacturing facilities. The purchases during 2017 primarily related to HIS entities.
(2) In 2015, we sold an office building for $3.6 million.
(3) In 2016, we sold our Slovakian manufacturing facilities for $3.3 million, net of costs to sell of $0.1 million.
(4) Our business acquisitions will vary from period to period based upon our current growth strategy and our ability to execute on desirable target companies. In 2017, we acquired HIS for $260 million in cash consideration (net of working capital adjustments), financed with existing cash balances and a three-year interest-only seller note of $75 million and we delivered 3.2 million shares of our common stock to Pfizer and we acquired Fannin for $1.5 million and MLA for $9.0 million in cash consideration. In 2016, we acquired Tangent for $2.6 million in cash. In 2015, we acquired EXC for $56.8 million in cash.
(5) In 2015, we sold certain assets from the EXC acquisition for $29.0 million in cash to Excelsior Medical, LLC.
(6) Our purchases of investment securities will vary from period to period based on current cash needs, planning for known future transactions and due to changes in our investment strategy. In 2016, we amended our investment policy to allow for the purchase of securities with final maturities in excess of one year. Accordingly, we adjusted our investment strategy to take advantage of the higher yields available on these longer term securities. Our longer term securities have maturities up to three years.
(7) The proceeds from the sale of our investment securities increased significantly during 2016, as compared to the comparable prior year periods, due to the liquidation of all of our short-term and long-term investment securities, which were used to fund the 2017 acquisition of HIS.
40
Cash Flows from Financing Activities
The following table summarizes the changes in our financing cash flows (in thousands):
For the Years Ended December 31, | Variance | ||||||||||||||||||||
2017 | 2016 | 2015 | 2017 | 2016 | |||||||||||||||||
Financing Cash Flows: | |||||||||||||||||||||
Repayment of long-term obligations | $ | (75,000 | ) | $ | — | $ | — | $ | (75,000 | ) | $ | — | (1) | ||||||||
Proceeds from exercise of stock options | 32,003 | 17,346 | 15,042 | 14,657 | 2,304 | (2) | |||||||||||||||
Proceeds from employee stock purchase plan | 2,705 | 2,361 | 2,162 | 344 | 199 | ||||||||||||||||
Purchase of treasury stock | (4,057 | ) | (17,235 | ) | (1,523 | ) | 13,178 | (15,712 | ) | (3) | |||||||||||
Net cash (used in) provided by financing activities | $ | (44,349 | ) | $ | 2,472 | $ | 15,681 | $ | (46,821 | ) | $ | (13,209 | ) | ||||||||
______________________________
(1) The repayment of long-term obligations is related to the repayment of the $75 million seller note from Pfizer.
(2) Proceeds from the exercise of stock options will vary from period to period based on the volume of options exercised and the exercise price of the specific options exercised.
(3) In 2017, our employees surrendered 27,636 shares of our common stock from vested restricted stock awards as consideration for approximately $4.1 million in minimum statutory withholding obligations paid on their behalf.
In 2016, we purchased 174,885 shares of our common stock under our share purchase plan on the open market for $15.3 million. Additionally in 2016, our employees surrendered 20,261 shares of our common stock from vested restricted stock awards as consideration for approximately $1.9 million in minimum statutory withholding obligations paid on their behalf.
In 2015, our employees surrendered 17,299 shares of our common stock from vested restricted stock awards as consideration for approximately $1.5 million in minimum statutory withholding obligations paid on their behalf.
Our common stock purchase plan, which authorized the repurchase of up to $40.0 million of our common stock, was authorized by our Board of Directors and publicly announced on July 19, 2010. To date, we have purchased a total of $32.8 million of our stock from this plan, leaving a balance of $7.2 million available for future purchases. This plan has no expiration date. We are currently limited on share purchases in accordance with the terms and conditions of our Credit Facility (see Note 12 to the consolidated financial statements in Part II, Item 8 of this Form 10-K).
New Accounting Pronouncements
See Note 1 to the consolidated financial statements in Part II, Item 8 of this Form 10-K.
Off Balance Sheet Arrangements
In the normal course of business, we have agreed to indemnify our officers and directors to the maximum extent permitted under Delaware law and to indemnify customers as to certain intellectual property matters related to sales of our products. There is no maximum limit on the indemnification that may be required under these agreements. Although we can provide no assurances, we have never incurred, nor do we expect to incur, any liability for indemnification.
41
Contractual Obligations
We have contractual obligations, at December 31, 2017, of approximately the amount set forth in the table below. This amount excludes inventory-related purchase orders for goods and services for current delivery and other open orders for purchases that support normal operations. The majority of our inventory purchase orders are blanket purchase orders that represent an estimated forecast of goods and services. We do not have a commitment liability on the blanket purchase orders. Since we do not have the ability to separate out blanket purchase orders from non-blanket purchase orders for inventory-related goods and services for current delivery, amounts related to such purchase orders are excluded from the table below. We have excluded from the table below pursuant to ASC 740-10-25 (formerly FIN 48), an interpretation of ASC 740-10 (formerly SFAS 109), a non-current income tax liability of $4.6 million due to the high degree of uncertainty regarding the timing of future cash outflows associated with the liabilities.
(in thousands) | ||||||||||||||||||||||||||||
Contractual Obligations | Total | 2018 | 2019 | 2020 | 2021 | 2022 | Thereafter | |||||||||||||||||||||
Commitment fee on Credit Facility | $ | 1,109 | $ | 229 | $ | 228 | $ | 229 | $ | 228 | $ | 195 | $ | — | ||||||||||||||
Operating leases | 31,506 | 8,775 | 5,907 | 4,059 | 3,214 | 3,105 | 6,446 | |||||||||||||||||||||
Warehouse service agreements | 3,687 | 2,384 | 1,303 | — | — | — | — | |||||||||||||||||||||
Purchase obligations(1) | 92,456 | 4,477 | 14,005 | 34,756 | 39,218 | — | — | |||||||||||||||||||||
$ | 128,758 | $ | 15,865 | $ | 21,443 | $ | 39,044 | $ | 42,660 | $ | 3,300 | $ | 6,446 | |||||||||||||||
___________________________________
(1) Purchase obligations includes agreements to purchase goods that are enforceable and legally binding. These amounts are not accrued as of December 31, 2017. It does not include milestone payments where payments may be refundable unless regulatory approval is obtained.
Critical Accounting Policies and Estimates
Our significant accounting policies are summarized in Note 1 to the Consolidated Financial Statements. In preparing our consolidated financial statements in accordance with GAAP and pursuant to the rules and regulations of the SEC, we make estimates, assumptions and judgments that affect the reported amounts of assets, liabilities, revenue and expenses, and related disclosures of contingent assets and liabilities. We base our estimates, assumptions and judgments on historical experience and other factors that we believe are reasonable. We evaluate our estimates, assumptions and judgments on a regular basis and apply our accounting policies on a consistent basis. We believe that the estimates, assumptions and judgments involved in the accounting for investment securities, revenue recognition, accounts receivable, inventories, property, plant and equipment and related depreciation, income taxes and business combinations have the most potential impact on our consolidated financial statements. Historically, our estimates, assumptions and judgments relative to our critical accounting policies have not differed materially from actual results.
Investment securities
Our investment securities consist of corporate bonds, which are classified as available-for-sale. Available-for-sale securities are recorded at fair value, and unrealized holding gains and losses are recorded, net of tax, as a component of accumulated other comprehensive income. Unrealized gains and losses on items for which the fair value option has been elected are reported in earnings at each subsequent reporting date.
Revenue recognition
We record sales and related costs when ownership of the product transfers to the customer, persuasive evidence of an arrangement exists, collectability is reasonably assured and the sales price is determinable. Under the terms of all our purchase orders, ownership transfers on shipment. If there are significant doubts at the time of shipment as to the collectability of the receivable, we defer recognition of the sale in revenue until the receivable is collected. Our customers are medical product manufacturers, distributors and end-users. Our only post-sale obligations are warranty and certain rebates. We warrant products against defects and have a policy permitting the return of defective products. We accrue for warranty and product returns based on historical experience. We accrue rebates as a reduction in revenue based on agreements and historical experience.
42
Arrangements with Multiple Deliverables
In certain circumstances, we enter into arrangements in which we provide multiple deliverables to our customers. These bundled arrangements may include infusion pumps, Mednet software, implementation services, extended warranty and consumables. We first separate the deliverables into different units of accounting and then allocate the arrangement consideration to those separate units of accounting based on their relative selling price. When applying the relative selling price method, the selling price for each deliverable shall be determined using the following hierarchy: (i) vendor-specific objective evidence of selling price; (ii) third-party evidence of selling price; or (iii) best estimate of the selling price. We record revenue related to these multiple deliverables as products are delivered and services have been performed.
Accounts receivable
Accounts receivable are stated at net realizable value. An allowance is provided for estimated collection losses based on the age of the receivable or on specific past due accounts for which we consider collection to be doubtful. We rely on prior payment trends, financial status and other factors to estimate the cash which ultimately will be received. Such amounts cannot be known with certainty at the financial statement date. We regularly review individual past due balances for collectability. Loss exposure is principally with international customers for whom normal payment terms are long in comparison to those of our other customers and, to a lesser extent, domestic distributors. Many of these distributors are relatively small and we are vulnerable to adverse developments in their businesses that can hinder our collection of amounts due. If actual collection losses exceed expectations, we could be required to accrue additional bad debt expense, which could have an adverse effect on our operating results in the period in which the accrual occurs.
Inventories
Inventories are stated at the lower of cost (first in, first out) or net realizable value. We need to carry many components to accommodate our rapid product delivery, and if we mis-estimate demand or if customer requirements change, we may have components in inventory that we may not be able to use. Most finished products are made only after we receive orders except for certain standard (non-custom) products which we will carry in inventory in expectation of future orders. For finished products in inventory, we need to estimate what may not be saleable. We regularly review inventory and reserve for slow moving items, and write off all items that we do not expect to use in manufacturing, and finished products that we do not expect to sell. If actual usage of components or sales of finished goods inventory is less than our estimates, we could be required to write off additional inventory, which could have an adverse effect on our operating results in the period in which the write-off occurs.
Property, plant and equipment/depreciation
Property, plant and equipment is carried at cost and depreciated on the straight-line method over the estimated useful lives. The estimates of useful lives are significant judgments in accounting for property, plant and equipment, particularly for molds and automated assembly machines that are custom made for us. We may retire them on an accelerated basis if we replace them with larger or more technologically advanced tooling. The remaining useful lives of all property, plant and equipment are reviewed regularly and lives are adjusted or assets written off based on current estimates of future use. As part of that review, property, plant and equipment is reviewed for other indicators of impairment. An unexpected shortening of useful lives of property, plant and equipment that significantly increases depreciation provisions, or other circumstances causing us to record an impairment loss on such assets, could have an adverse effect on our operating results in the period in which the related charges are recorded.
Income Taxes
We utilize the asset and liability method of accounting for income taxes as set forth in ASC 740. Under the liability method, deferred taxes are determined based on the temporary differences between the financial statement and tax basis of assets and liabilities using tax rates expected to be in effect during the years in which the basis differences reverse. A valuation allowance is recorded when it is more likely than not that some of the deferred tax assets will not be realized. In determining the need for valuation allowances we consider projected future taxable income and the availability of tax planning strategies. If in the future we determine that we would not be able to realize our recorded deferred tax assets, an increase in the valuation allowance would be recorded, decreasing earnings in the period in which such determination is made.
We are subject to income taxes throughout the U.S. and in numerous foreign jurisdictions. We recognize the financial statement benefits for uncertain tax positions as set forth in ASC 740 only if it is more-likely-than-not to be sustained in the event of challenges by relevant taxing authorities based on the technical merit of each tax position. The amounts of uncertain
43
tax positions recognized are the largest benefits that have a greater than 50 percent likelihood of being realized upon settlement with the relevant tax authorities.
On December 22, 2017, the U.S. government enacted comprehensive tax legislation referred to as the Tax Cuts and Jobs Act (the “Tax Act”). Shortly after the Tax Act was enacted, the SEC issued Staff Accounting Bulletin No. 118, Income Tax Accounting Implications of the Tax Cuts and Jobs Act ("SAB 118"), which provides guidance on accounting for the Tax Act’s impact. SAB 118 provides a measurement period, which should not extend beyond one year from the Tax Act enactment date, during which a company acting in good faith may complete the accounting for the impacts of the Tax Act under ASC Topic 740. In accordance with SAB 118, we must reflect the income tax effects of the Tax Act in the reporting period in which the accounting under ASC Topic 740 is complete.
To the extent that our accounting for certain income tax effects of the Tax Act is incomplete, we can determine a reasonable estimate for those effects and record a provisional estimate in the consolidated financial statements in the first reporting period in which a reasonable estimate can be determined. If we cannot determine a provisional estimate to be included in the consolidated financial statements, we should continue to apply ASC Topic 740 based on the provisions of the tax laws that were in effect immediately prior to the Tax Act being enacted. If we are unable to provide a reasonable estimate of the impacts of the Tax Act in a reporting period, a provisional amount must be recorded in the first reporting period in which a reasonable estimate can be determined. For further information, see Note 13 to the consolidated financial statements in Part II, Item 8 of this Form 10-K.
Business Combinations
The application of the acquisition method of accounting for business combinations requires the use of significant estimates, assumptions and judgments in the determination of the estimated fair value of assets acquired and liabilities assumed in order to properly allocate the purchase price at the acquisition date.
Although we believe the estimates, assumptions and judgments we have made are reasonable, they are based in part on historical experience, industry data, information obtained from the management of the acquired companies and assistance from independent third-party appraisal firms, and are inherently uncertain.
Examples of critical estimates in valuing certain of the tangible and intangible assets we have acquired, and certain liabilities assumed include but are not limited to:
• | Inventories - we used the comparative sales method, which estimates the selling price of finished goods and work-in-progress inventory, reduced by estimated costs expected to be incurred in selling the inventory and a profit on those costs. The fair value of inventory is recognized in our statements of operations as the inventory is sold. Based on internal forecasts and estimates of inventory turnover, acquisition date inventory is sold and recognized in cost of goods sold over an estimated period of six months after the acquisition date. |
• | Property, Plant and Equipment - the fair value estimate of acquired property, plant and equipment is determined based upon the nature of the asset using either the cost approach, the sales comparison approach or the income capitalization approach. The cost approach measures the value of an asset by estimating the cost to acquire or reproduce comparable assets. The sales comparison approach measures the value of an asset through an analysis of comparable property sales. The income approach values the asset based on its earnings potential. The fair value of land was estimated using a sales comparison approach. Land and building improvements were valued using the cost approach. Personal property assets, such as, leasehold improvements, tooling, laboratory equipment, furniture and fixtures, and equipment, computer hardware, computer software, dies and molds were all valued using the cost approach. Transportation equipment and major manufacturing and equipment were valued using the sales comparison method. Construction-in-progress assets were valued based on the cost approach less adjustments for the nature of the assets. The fair value of property, plant and equipment will be recognized in our statements of operations over the expected useful life of the individual depreciable assets. |
• | Identifiable Intangible Assets - The fair value of the significant acquired identifiable intangible assets generally is determined using varying methods under the income approach. This method starts with a forecast of all of the expected future net cash flows associated with the asset and then adjusts the forecast to present value by applying an appropriate discount rate that reflects the risk factors associated with the cash flow streams. |
• | Earnout Liability - The fair value of the earnout was valued using a Monte Carlo simulation (see Note 9 to the consolidated financial statements in Part II, Item 8 of this Form 10-K for details). |
44
Unanticipated events and circumstances may occur which may affect the accuracy or validity of such assumptions, estimates or actual results.
Forward Looking Statements
Various portions of this Annual Report on Form 10-K, including this Management’s Discussion and Analysis of Financial Condition and Results of Operations, and documents referenced herein, describe trends in our business and finances that we perceive and state some of our expectations and beliefs about our future. These statements about the future are “forward looking statements,” within the meaning of Section 27A of the Securities Act of 1933, as amended, and Section 21E of the Securities Exchange Act of 1934, as amended, and we may identify them by using words such as "anticipate," "believe," "expect," "estimate," "intend," "plan," "will," "continue," "could," "may," and by similar expressions and statements about aims, goals and plans. The forward looking statements are based on the best information currently available to us and assumptions that we believe are reasonable, but we do not intend the statements to be representations as to future results. They include, without limitation, statements about:
◦ | future growth; future operating results and various elements of operating results, including future expenditures and effects with respect to sales and marketing and product development and acquisition efforts; future sales and unit volumes of products; expected increases and decreases in sales; deferred revenue; accruals for restructuring charges, future license, royalty and revenue share income; production costs; gross margins; litigation expense; future SG&A and R&D expenses; manufacturing expenses; future costs of expanding our business; income; losses; cash flow; amortization; source of funds for capital purchases and operations; future tax rates; alternative sources of capital or financing; changes in working capital items such as receivables and inventory; selling prices; and income taxes; |
◦ | factors affecting operating results, such as shipments to specific customers; reduced dependence on current proprietary products; loss of a strategic relationship; change in demand; domestic and international sales; expansion in international markets, selling prices; future increases or decreases in sales of certain products and in certain markets and distribution channels; maintaining strategic relationships and securing long-term and multi-product contracts with large healthcare providers and major buying organizations; increases in systems capabilities; introduction, development and sales of new products, acquisition and integration of businesses and product lines, including the HIS business, SwabCap (EXC) and Tangent; benefits of our products over competing systems; qualification of our new products for the expedited Section 510(k) clearance procedure; possibility of lengthier clearance process for new products; planned increases in marketing; warranty claims; rebates; product returns; bad debt expense; amortization expense; inventory requirements; lives of property, plant and equipment; manufacturing efficiencies and cost savings; unit manufacturing costs; establishment or expansion of production facilities inside or outside of the U.S.; planned new orders for semi-automated or fully automated assembly machines for new products; adequacy of production capacity; results of R&D; our plans to repurchase shares of our common stock; asset impairment losses; relocation of manufacturing facilities and personnel; effect of expansion of manufacturing facilities on production efficiencies and resolution of production inefficiencies; the effect of costs to customers and delivery times; business seasonality and fluctuations in quarterly results; customer ordering patterns and the effects of new accounting pronouncements; and |
◦ | new or extended contracts with manufacturers and buying organizations; dependence on a small number of customers; loss of larger distributors and the ability to locate other distributors; the impact of our acquisition of the HIS business; growth of our Clave products in future years; design features of Clave products; the outcome of our strategic initiatives; regulatory approvals and compliance; outcome of litigation; patent protection and intellectual property landscape; patent infringement claims and the impact of newly issued patents on other medical devices; competitive and market factors, including continuing development of competing products by other manufacturers; improved production processes and higher volume production; innovation requirements; consolidation of the healthcare provider market and downward pressure on selling prices; distribution or financial capabilities of competitors; healthcare reform legislation; use of treasury stock; working capital requirements; liquidity and realizable value of our investment securities; future investment alternatives; foreign currency denominated financial instruments; foreign exchange risk; commodity price risk; our expectations regarding liquidity and capital resources over the next twelve months; capital expenditures; plans to convert existing space; acquisitions of other businesses or product lines, indemnification liabilities and contractual liabilities. |
45
Forward-looking statements involve certain risks and uncertainties, which may cause actual results to differ materially from those discussed in each such statement. First, one should consider the factors and risks described in the statements themselves or otherwise discussed herein. Those factors are uncertain, and if one or more of them turn out differently than we currently expect, our operating results may differ materially from our current expectations.
Second, investors should read the forward looking statements in conjunction with the Risk Factors discussed in Item 1A of this Annual Report on Form 10-K. Also, actual future operating results are subject to other important factors and risks that we cannot predict or control, including without limitation, the following:
◦ | general economic and business conditions, both in the U.S. and internationally; |
◦ | unexpected changes in our arrangements with our large customers; |
◦ | outcome of litigation; |
◦ | fluctuations in foreign exchange rates and other risks of doing business internationally; |
◦ | increases in labor costs or competition for skilled workers; |
◦ | increases in costs or availability of the raw materials need to manufacture our products; |
◦ | the effect of price and safety considerations on the healthcare industry; |
◦ | competitive factors, such as product innovation, new technologies, marketing and distribution strength and price erosion; |
◦ | the successful development and marketing of new products; |
◦ | unanticipated market shifts and trends; |
◦ | the impact of legislation affecting government reimbursement of healthcare costs; |
◦ | changes by our major customers and independent distributors in their strategies that might affect their efforts to market our products; |
◦ | the effects of additional governmental regulations; |
◦ | unanticipated production problems; and |
◦ | the availability of patent protection and the cost of enforcing and of defending patent claims. |
The forward looking statements in this report are subject to additional risks and uncertainties, including those detailed from time to time in our other filings with the Securities and Exchange Commission. These forward-looking statements are made only as of the date hereof and, except as required by law, we undertake no obligation to update or revise any of them, whether as a result of new information, future events or otherwise.
ITEM 7A. QUANTITATIVE AND QUALITATIVE DISCLOSURES ABOUT MARKET RISK
Foreign Exchange Risk
We have foreign currency exchange risk related to foreign-denominated cash, accounts receivable and accounts payable. In our European operations, our net Euro asset position at December 31, 2017 was approximately €72.7 million. A 10% change in the conversion of the Euro to the U.S. dollar for our cash, accounts receivable, accounts payable and accrued liabilities from the December 31, 2017 spot rate would impact our consolidated amounts on these balance sheet items by approximately $8.7 million, or 4.5% of these net assets. We currently do not hedge our Euro foreign currency exposures.
46
ITEM 8. FINANCIAL STATEMENTS AND SUPPLEMENTARY DATA
INDEX TO CONSOLIDATED FINANCIAL STATEMENTS AND SCHEDULE | |
Page No. | |
Consolidated Statements of Operations for the Years Ended December 31, 2017, 2016 and 2015 | |
Consolidated Statements of Comprehensive Income for the Years Ended December 31, 2017, 2016 and 2015 | |
Consolidated Statements of Stockholders’ Equity for the Years Ended December 31, 2017, 2016 and 2015 | |
Consolidated Statements of Cash Flows for the Years Ended December 31, 2017, 2016 and 2015 | |
47
REPORT OF INDEPENDENT REGISTERED PUBLIC ACCOUNTING FIRM
To the stockholders and the Board of Directors of ICU Medical, Inc.
Opinion on the Financial Statements
We have audited the accompanying consolidated balance sheets of ICU Medical, Inc. and subsidiaries (the "Company") as of December 31, 2017 and 2016, and the related consolidated statements of operations, comprehensive income, stockholders' equity, and cash flows, for each of the three years in the period ended December 31, 2017, and the related notes and the financial statement schedule listed in the Index at Item 15 (collectively referred to as the "financial statements"). In our opinion, the financial statements present fairly, in all material respects, the financial position of the Company as of December 31, 2017 and 2016, and the results of its operations and its cash flows for each of the three years in the period ended December 31, 2017, in conformity with accounting principles generally accepted in the United States of America.
We have also audited, in accordance with the standards of the Public Company Accounting Oversight Board (United States) (PCAOB), the Company's internal control over financial reporting as of December 31, 2017, based on criteria established in Internal Control - Integrated Framework (2013) issued by the Committee of Sponsoring Organizations of the Treadway Commission and our report dated March 16, 2018, expressed an unqualified opinion on the Company's internal control over financial reporting.
Basis for Opinion
These financial statements are the responsibility of the Company's management. Our responsibility is to express an opinion on the Company's financial statements based on our audits. We are a public accounting firm registered with the PCAOB and are required to be independent with respect to the Company in accordance with the U.S. federal securities laws and the applicable rules and regulations of the Securities and Exchange Commission and the PCAOB.
We conducted our audits in accordance with the standards of the PCAOB. Those standards require that we plan and perform the audit to obtain reasonable assurance about whether the financial statements are free of material misstatement, whether due to error or fraud. Our audits included performing procedures to assess the risks of material misstatement of the financial statements, whether due to error or fraud, and performing procedures that respond to those risks. Such procedures included examining, on a test basis, evidence regarding the amounts and disclosures in the financial statements. Our audits also included evaluating the accounting principles used and significant estimates made by management, as well as evaluating the overall presentation of the financial statements. We believe that our audits provide a reasonable basis for our opinion.
/s/ Deloitte & Touche LLP | |
Costa Mesa, California | |
March 16, 2018 | |
We have served as the Company's auditor since 2008 | |
48
ICU MEDICAL, INC. AND SUBSIDIARIES
CONSOLIDATED BALANCE SHEETS
(Amounts in thousands, except par value data)
December 31, | |||||||
2017 | 2016 | ||||||
ASSETS | |||||||
CURRENT ASSETS: | |||||||
Cash and cash equivalents | $ | 290,072 | $ | 445,082 | |||
Short-term investment securities | 10,061 | — | |||||
TOTAL CASH, CASH EQUIVALENTS AND SHORT-TERM INVESTMENT SECURITIES | 300,133 | 445,082 | |||||
Accounts receivable, net of allowance for doubtful accounts of $3,311 and $1,073 at December 31, 2017 and 2016, respectively | 112,696 | 56,161 | |||||
Inventories | 288,657 | 49,264 | |||||
Prepaid income taxes | 10,594 | 11,235 | |||||
Prepaid expenses and other current assets | 41,286 | 7,355 | |||||
Related-party receivable | 98,807 | — | |||||
Assets held-for-sale | 12,489 | — | |||||
TOTAL CURRENT ASSETS | 864,662 | 569,097 | |||||
PROPERTY, PLANT AND EQUIPMENT, net | 398,684 | 85,696 | |||||
LONG-TERM INVESTMENT SECURITIES | 14,579 | — | |||||
GOODWILL | 12,357 | 5,577 | |||||
INTANGIBLE ASSETS, net | 143,753 | 22,383 | |||||
DEFERRED INCOME TAXES | 24,775 | 21,935 | |||||
OTHER ASSETS | 38,141 | — | |||||
TOTAL ASSETS | $ | 1,496,951 | $ | 704,688 | |||
LIABILITIES AND STOCKHOLDERS’ EQUITY | |||||||
CURRENT LIABILITIES: | |||||||
Accounts payable | $ | 78,228 | $ | 14,641 | |||
Accrued liabilities | 132,064 | 25,896 | |||||
TOTAL CURRENT LIABILITIES | 210,292 | 40,537 | |||||
CONTINGENT EARN-OUT LIABILITY | 27,000 | — | |||||
OTHER LONG-TERM LIABILITIES | 55,326 | 1,107 | |||||
DEFERRED INCOME TAXES | 1,487 | 1,370 | |||||
INCOME TAX LIABILITY | 4,592 | 1,519 | |||||
COMMITMENTS AND CONTINGENCIES | — | — | |||||
STOCKHOLDERS’ EQUITY: | |||||||
Convertible preferred stock, $1.00 par value Authorized—500 shares; Issued and outstanding— none | — | — | |||||
Common stock, $0.10 par value — Authorized—80,000 shares; Issued and outstanding, 20,210 shares at December 31, 2017 and 16,338 shares at December 31, 2016 | 2,021 | 1,633 | |||||
Additional paid-in capital | 625,568 | 162,828 | |||||
Treasury stock, at cost | — | (14 | ) | ||||
Retained earnings | 585,624 | 516,980 | |||||
Accumulated other comprehensive loss | (14,959 | ) | (21,272 | ) | |||
TOTAL STOCKHOLDERS' EQUITY | 1,198,254 | 660,155 | |||||
TOTAL LIABILITIES AND STOCKHOLDERS' EQUITY | $ | 1,496,951 | $ | 704,688 | |||
The accompanying notes are an integral part of these consolidated financial statements.
49
ICU MEDICAL, INC. AND SUBSIDIARIES
CONSOLIDATED STATEMENTS OF OPERATIONS
(Amounts in thousands, except per share data)
Year ended December 31, | |||||||||||
2017 | 2016 | 2015 | |||||||||
REVENUES: | |||||||||||
Net sales | $ | 1,292,166 | $ | 379,339 | $ | 341,254 | |||||
Other | 447 | 33 | 414 | ||||||||
TOTAL REVENUE | 1,292,613 | 379,372 | 341,668 | ||||||||
COST OF GOODS SOLD | 866,518 | 177,974 | 160,871 | ||||||||
GROSS PROFIT | 426,095 | 201,398 | 180,797 | ||||||||
OPERATING EXPENSES: | |||||||||||
Selling, general and administrative | 303,953 | 89,426 | 83,216 | ||||||||
Research and development | 51,253 | 12,955 | 15,714 | ||||||||
Restructuring, strategic transaction and integration expense | 77,967 | 15,348 | 8,451 | ||||||||
Change in fair value of contingent earn-out | 8,000 | — | — | ||||||||
Gain on sale of building | — | — | (1,086 | ) | |||||||
Legal settlements, net | — | — | 1,798 | ||||||||
Impairment of assets held for sale | — | 728 | 4,139 | ||||||||
TOTAL OPERATING EXPENSES | 441,173 | 118,457 | 112,232 | ||||||||
(LOSS) INCOME FROM OPERATIONS | (15,078 | ) | 82,941 | 68,565 | |||||||
BARGAIN PURCHASE GAIN | 70,890 | 1,456 | — | ||||||||
INTEREST EXPENSE | (2,047 | ) | (118 | ) | (39 | ) | |||||
OTHER (EXPENSE) INCOME, NET | (2,482 | ) | 885 | 1,173 | |||||||
INCOME BEFORE INCOME TAXES | 51,283 | 85,164 | 69,699 | ||||||||
BENEFIT (PROVISION) FOR INCOME TAXES | 17,361 | (22,080 | ) | (24,714 | ) | ||||||
NET INCOME | $ | 68,644 | $ | 63,084 | $ | 44,985 | |||||
NET INCOME PER SHARE | |||||||||||
Basic | $ | 3.50 | $ | 3.90 | $ | 2.84 | |||||
Diluted | $ | 3.29 | $ | 3.66 | $ | 2.73 | |||||
WEIGHTED AVERAGE NUMBER OF SHARES | |||||||||||
Basic | 19,614 | 16,168 | 15,848 | ||||||||
Diluted | 20,858 | 17,254 | 16,496 | ||||||||
The accompanying notes are an integral part of these consolidated financial statements.
50
ICU MEDICAL, INC. AND SUBSIDIARIES
CONSOLIDATED STATEMENTS OF COMPREHENSIVE INCOME
(Amounts in thousands)
Year ended December 31, | |||||||||||
2017 | 2016 | 2015 | |||||||||
Net income | $ | 68,644 | $ | 63,084 | $ | 44,985 | |||||
Other comprehensive (loss) income, net of tax: | |||||||||||
Cash flow hedge adjustments, net of tax of $224 for the year ended December 31, 2017 | (365 | ) | — | — | |||||||
Foreign currency translation adjustment, net of taxes of $56, $185 and ($2,680) for the years ended December 31, 2017, 2016 and 2015, respectively | 6,694 | (514 | ) | (11,204 | ) | ||||||
Other adjustments, net of tax of $0 for the year ended December 31, 2017 | (16 | ) | — | — | |||||||
Other comprehensive income (loss), net of tax | 6,313 | (514 | ) | (11,204 | ) | ||||||
Comprehensive income | $ | 74,957 | $ | 62,570 | $ | 33,781 | |||||
The accompanying notes are an integral part of these consolidated financial statements.
51
ICU MEDICAL, INC. AND SUBSIDIARIES
CONSOLIDATED STATEMENTS OF STOCKHOLDERS’ EQUITY
(Amounts in thousands)
Common Stock | Accumulated | ||||||||||||||||||||||||||
Additional | Other | ||||||||||||||||||||||||||
Shares | Amount | Paid-In Capital | Treasury Stock | Retained Earnings | Comprehensive Income (Loss) | Total | |||||||||||||||||||||
Balance, December 31, 2014 | 15,595 | $ | 1,559 | $ | 107,336 | $ | — | $ | 408,911 | $ | (9,554 | ) | $ | 508,252 | |||||||||||||
Issuance of restricted stock and exercise of stock options, including excess income tax benefits of $9,330 | 475 | 46 | 22,715 | 1,611 | — | — | 24,372 | ||||||||||||||||||||
Purchase of treasury stock, treasury stock acquired in lieu of cash payment on stock option exercises and income tax withholding obligations | (18 | ) | — | 88 | (1,611 | ) | (1,523 | ) | |||||||||||||||||||
Proceeds from employee stock purchase plan | 34 | 3 | 2,159 | — | — | — | 2,162 | ||||||||||||||||||||
Stock compensation | — | — | 12,827 | — | — | — | 12,827 | ||||||||||||||||||||
Foreign currency translation adjustment | — | — | — | — | — | (11,204 | ) | (11,204 | ) | ||||||||||||||||||
Net income | — | — | — | — | 44,985 | — | 44,985 | ||||||||||||||||||||
Balance, December 31, 2015 | 16,086 | 1,608 | 145,125 | — | 453,896 | (20,758 | ) | 579,871 | |||||||||||||||||||
Issuance of restricted stock and exercise of stock options | 416 | 22 | 103 | 17,221 | — | — | 17,346 | ||||||||||||||||||||
Purchase of treasury stock, treasury stock acquired in lieu of cash payment on stock option exercises and income tax withholding obligations | (195 | ) | — | — | (17,235 | ) | (17,235 | ) | |||||||||||||||||||
Proceeds from employee stock purchase plan | 31 | 3 | 2,358 | — | — | — | 2,361 | ||||||||||||||||||||
Stock compensation | — | — | 15,242 | — | — | — | 15,242 | ||||||||||||||||||||
Foreign currency translation adjustment | — | — | — | — | — | (514 | ) | (514 | ) | ||||||||||||||||||
Net income | — | — | — | — | 63,084 | — | 63,084 | ||||||||||||||||||||
Balance, December 31, 2016 | 16,338 | 1,633 | 162,828 | (14 | ) | 516,980 | (21,272 | ) | 660,155 | ||||||||||||||||||
Issuance of restricted stock and exercise of stock options | 676 | 66 | 27,866 | 4,071 | — | — | 32,003 | ||||||||||||||||||||
Purchase of treasury stock, treasury stock acquired in lieu of cash payment on stock option exercises and income tax withholding obligations | (27 | ) | — | — | (4,057 | ) | (4,057 | ) | |||||||||||||||||||
Issuance of common stock for acquisitions | 3,200 | 320 | 412,819 | — | — | — | 413,139 | ||||||||||||||||||||
Proceeds from employee stock purchase plan | 23 | 2 | 2,703 | — | — | — | 2,705 | ||||||||||||||||||||
Stock compensation | — | — | 19,352 | — | — | — | 19,352 | ||||||||||||||||||||
Other comprehensive income, net of tax | — | — | — | — | — | 6,313 | 6,313 | ||||||||||||||||||||
Net income | — | — | — | — | 68,644 | — | 68,644 | ||||||||||||||||||||
Balance, December 31, 2017 | 20,210 | $ | 2,021 | $ | 625,568 | $ | — | $ | 585,624 | $ | (14,959 | ) | $ | 1,198,254 | |||||||||||||
The accompanying notes are an integral part of these consolidated financial statements.
52
ICU MEDICAL, INC. AND SUBSIDIARIES
CONSOLIDATED STATEMENTS OF CASH FLOWS
(Amounts in thousands)
Year ended December 31, | |||||||||||
2017 | 2016 | 2015 | |||||||||
CASH FLOWS FROM OPERATING ACTIVITIES: | |||||||||||
Net income | $ | 68,644 | $ | 63,084 | $ | 44,985 | |||||
Adjustments to reconcile net income to net cash provided by operating activities: | |||||||||||
Depreciation and amortization | 66,569 | 19,050 | 18,073 | ||||||||
Provision for doubtful accounts | 2,308 | — | 54 | ||||||||
Provision for warranty and returns | 845 | 559 | 52 | ||||||||
Stock compensation | 19,352 | 15,242 | 12,827 | ||||||||
Loss (gain) on disposal of property, plant and equipment | 3,778 | 59 | (1,106 | ) | |||||||
Bond premium amortization | 103 | 1,355 | 1,670 | ||||||||
Debt issuance cost amortization | 48 | — | — | ||||||||
Impairment of assets held-for-sale | — | 728 | 4,139 | ||||||||
Bargain purchase gain | (70,890 | ) | (1,456 | ) | — | ||||||
Change in fair value of contingent earn-out | 8,000 | — | — | ||||||||
Other | (220 | ) | 75 | — | |||||||
Changes in operating assets and liabilities, net of amounts acquired: | |||||||||||
Accounts receivable | (54,533 | ) | 744 | (20,515 | ) | ||||||
Inventories | 181,699 | (5,501 | ) | (8,337 | ) | ||||||
Prepaid expenses and other assets | (31,807 | ) | (3,028 | ) | (1,832 | ) | |||||
Related-party receivables | (95,309 | ) | — | — | |||||||
Accounts payable | 46,648 | (463 | ) | 3,118 | |||||||
Accrued liabilities | 33,813 | (1,221 | ) | 9,454 | |||||||
Income taxes, including excess tax benefits and deferred income taxes | (24,625 | ) | 714 | 1,613 | |||||||
Net cash provided by operating activities | 154,423 | 89,941 | 64,195 | ||||||||
CASH FLOWS FROM INVESTING ACTIVITIES: | |||||||||||
Purchases of property, plant and equipment | (74,479 | ) | (23,361 | ) | (12,984 | ) | |||||
Proceeds from sale of assets | 2 | — | 3,592 | ||||||||
Proceeds from the disposal of assets held-for-sale, net | — | 3,268 | — | ||||||||
Intangible asset additions | (5,203 | ) | (1,192 | ) | (951 | ) | |||||
Business acquisitions, net of cash acquired | (162,448 | ) | (2,584 | ) | (56,786 | ) | |||||
Proceeds from sale of assets acquired in a business acquisition | — | — | 28,970 | ||||||||
Purchases of investment securities | (24,743 | ) | (118,384 | ) | (56,137 | ) | |||||
Proceeds from sale of investment securities | — | 158,534 | 83,054 | ||||||||
Net cash (used in) provided by investing activities | (266,871 | ) | 16,281 | (11,242 | ) | ||||||
CASH FLOWS FROM FINANCING ACTIVITIES: | |||||||||||
Repayment of long-term obligations | (75,000 | ) | — | — | |||||||
Proceeds from exercise of stock options | 32,003 | 17,346 | 15,042 | ||||||||
Proceeds from employee stock purchase plan | 2,705 | 2,361 | 2,162 | ||||||||
Purchase of treasury stock | (4,057 | ) | (17,235 | ) | (1,523 | ) | |||||
Net cash (used in) provided by financing activities | (44,349 | ) | 2,472 | 15,681 | |||||||
Effect of exchange rate changes on cash | 1,787 | 224 | (8,282 | ) | |||||||
NET (DECREASE) INCREASE IN CASH AND CASH EQUIVALENTS | (155,010 | ) | 108,918 | 60,352 | |||||||
CASH AND CASH EQUIVALENTS, beginning of period | 445,082 | 336,164 | 275,812 | ||||||||
CASH AND CASH EQUIVALENTS, end of period | $ | 290,072 | $ | 445,082 | $ | 336,164 | |||||
The accompanying notes are an integral part of these consolidated financial statements.
53
ICU MEDICAL, INC. AND SUBSIDIARIES
CONSOLIDATED STATEMENTS OF CASH FLOWS - CONTINUED
(Amounts in thousands)
Year ended December 31, | |||||||||||
2017 | 2016 | 2015 | |||||||||
SUPPLEMENTAL DISCLOSURE OF CASH FLOW INFORMATION | |||||||||||
Cash paid during the year for income taxes | $ | 5,109 | $ | 21,101 | $ | 22,998 | |||||
Cash paid during the year for interest | $ | 2,047 | $ | 118 | $ | 39 | |||||
SUPPLEMENTAL DISCLOSURE OF NON-CASH INVESTING AND FINANCING ACTIVITIES: | |||||||||||
Accounts payable for property, plant and equipment | $ | 5,376 | $ | 1,566 | $ | 182 | |||||
Detail of assets acquired and liabilities assumed in acquisitions: | |||||||||||
Fair value of assets acquired | $ | 886,569 | $ | 3,306 | $ | 60,693 | |||||
Cash paid for acquisitions, net of cash acquired | (162,448 | ) | (2,584 | ) | (56,786 | ) | |||||
Non-cash seller note | (75,000 | ) | — | — | |||||||
Estimated working capital adjustment | 4,253 | — | — | ||||||||
Contingent consideration | (19,000 | ) | — | — | |||||||
Issuance of common stock for acquisitions | (413,139 | ) | — | — | |||||||
Bargain purchase gain | (70,890 | ) | (1,456 | ) | — | ||||||
Goodwill, acquired during period | 6,536 | — | — | ||||||||
Liabilities assumed/Adjustments to liabilities assumed | $ | (156,881 | ) | $ | 734 | $ | (3,907 | ) | |||
The accompanying notes are an integral part of these consolidated financial statements.
54
NOTE 1. BASIS OF PRESENTATION AND SIGNIFICANT ACCOUNTING POLICIES
Basis of Presentation and Preparation
ICU Medical, Inc. ("ICU"), a Delaware corporation, operates in one business segment engaged in the development, manufacturing and sale of innovative medical devices used in vascular therapy, and critical care applications. ICU's product portfolio includes intravenous smart pumps, sets, connectors, closed transfer devices for hazardous drugs, cardiac monitoring systems, along with pain management and safety software technology. We sell the majority of our products through our direct sales force and through independent distributors throughout the U. S. and internationally. Additionally, we sell our products on an original equipment manufacturer basis to other medical device manufacturers. The manufacturing for all product groups occurs in Salt Lake City, Utah, Austin, Texas, Mexico and Costa Rica.
All subsidiaries are wholly owned and are included in the consolidated financial statements. All intercompany accounts and transactions have been eliminated. Results of operations of companies purchased are included from the dates of acquisition.
In our opinion, the consolidated financial statements reflect all adjustments, which are normal and recurring in nature, necessary for fair financial statement presentation. These consolidated financial statements were prepared in accordance with accounting principles generally accepted in the United States of America ("GAAP"). Preparing financial statements in conformity with GAAP requires management to make estimates and assumptions that affect the reported amount of assets and liabilities and disclosure of contingent assets and liabilities at the date of the financial statements and the reported amounts of revenues and expenses during the reporting period. Actual results could differ from those estimates.
Cash, Cash Equivalents
Cash equivalents are short-term, highly liquid investments that are readily convertible to known amounts of cash and have original maturities of three months or less from the date of purchase as cash equivalents.
Accounts Receivable
Accounts receivable are stated at net realizable value. An allowance is provided for estimated collection losses based on an assessment of various factors. We consider prior payment trends, the age of the accounts receivable balances, financial status and other factors to estimate the cash which ultimately will be received. Such amounts cannot be known with certainty at the financial statement date. We regularly review individual past due balances for collectability.
Inventories
Inventories are stated at the lower of cost or net realizable value with cost determined using the first-in, first-out method. Inventory costs include material, labor and overhead related to the manufacturing of medical devices.
Inventories consist of the following at December 31 (in thousands):
2017 | 2016 | ||||||
Raw material | $ | 82,397 | $ | 28,435 | |||
Work in process | 42,304 | 4,415 | |||||
Finished goods | 163,956 | 16,414 | |||||
Total | $ | 288,657 | $ | 49,264 | |||
55
ICU MEDICAL, INC. AND SUBSIDIARIES
NOTES TO CONSOLIDATED FINANCIAL STATEMENTS (Continued)
Property, Plant and Equipment
Property, plant and equipment consist of the following at December 31 (in thousands):
2017 | 2016 | ||||||
Machinery and equipment | $ | 220,999 | $ | 96,536 | |||
Land, building and building improvements | 206,846 | 63,524 | |||||
Molds | 56,253 | 39,014 | |||||
Computer equipment and software | 44,408 | 26,458 | |||||
Furniture and fixtures | 7,361 | 3,243 | |||||
Instruments placed with customers* | 15,812 | — | |||||
Construction in progress | 57,144 | 15,180 | |||||
Total property, plant and equipment, cost | 608,823 | 243,955 | |||||
Accumulated depreciation | (210,139 | ) | (158,259 | ) | |||
Net property, plant and equipment | $ | 398,684 | $ | 85,696 | |||
______________________________
*Instruments placed with customers consist of drug-delivery and monitoring systems placed with customer under operating leases.
All property, plant and equipment are stated at cost. We use the straight-line method for depreciating property, plant and equipment over their estimated useful lives. Estimated useful lives are:
Buildings | 15 - 30 years |
Building improvements | 15 years |
Machinery and equipment | 2 - 10 years |
Furniture, fixtures and molds | 2 - 5 years |
Computer equipment and software | 3 - 5 years |
Instruments placed with customers* | 3 - 7 years |
We capitalize expenditures that materially increase the life of the related assets; maintenance and repairs are expensed as incurred. The costs and related accumulated depreciation applicable to property, plant and equipment sold or retired are removed from the accounts and any gain or loss is reflected in the statements of income at the time of disposal. Depreciation expense was $51.6 million, $16.3 million and $15.9 million in the years ended December 31, 2017, 2016 and 2015, respectively.
Goodwill
We test goodwill for impairment on an annual basis in the month of November. If the carrying amount of goodwill exceeds the implied estimated fair value, an impairment charge to current operations is recorded to reduce the carrying value to the implied estimated fair value. There were no accumulated impairment losses as of December 31, 2017 and 2016.
The following table presents the changes in the carrying amount of our goodwill for 2017 and 2016 (in thousands):
Total | ||||
Balance as of December 31, 2015 | $ | 6,463 | ||
Other(1) | (886 | ) | ||
Balance as of December 31, 2016 | 5,577 | |||
Goodwill acquired(2) | 6,536 | |||
Other (3) | 244 | |||
Balance as of December 31, 2017 | $ | 12,357 | ||
______________________________
56
ICU MEDICAL, INC. AND SUBSIDIARIES
NOTES TO CONSOLIDATED FINANCIAL STATEMENTS (Continued)
(1) In 2016, "other" relates to measurement period adjustments on the net assets of our 2015 acquisition of EXC Holding Corp. ("EXC").
(2) In 2017, our Fannin (UK) Limited ("Fannin") acquisition resulted in $1.0 million of goodwill and our Medical Australia Limited ("MLA") acquisition resulted in $5.5 million of goodwill. The goodwill related to MLA is preliminary and subject to adjustment.
(3) In 2017, "other" relates to foreign currency translation.
Intangible Assets
Intangible assets, carried at cost less accumulated amortization and amortized on a straight-lined basis, were as follows (in thousands):
Weighted Average Amortization Life in Years | December 31, 2017 | |||||||||||||
Cost | Accumulated Amortization | Net | ||||||||||||
Patents | 10 | $ | 17,064 | $ | 10,970 | $ | 6,094 | |||||||
Customer contracts | 9 | 5,319 | 4,892 | 427 | ||||||||||
Non-contractual customer relationships | 9 | 55,080 | 6,562 | 48,518 | ||||||||||
Trademarks | 4 | 425 | 425 | — | ||||||||||
Trade name | 15 | 7,310 | 1,096 | 6,214 | ||||||||||
Developed technology | 11 | 81,846 | 7,571 | 74,275 | ||||||||||
Total amortized intangible assets | $ | 167,044 | $ | 31,516 | $ | 135,528 | ||||||||
IPR&D | $ | 8,225 | $ | 8,225 | ||||||||||
Total intangible assets | $ | 175,269 | $ | 31,516 | $ | 143,753 | ||||||||
Weighted Average | December 31, 2016 | |||||||||||||
Amortization Life in Years | Cost | Accumulated Amortization | Net | |||||||||||
Patents | 10 | $ | 14,423 | $ | 9,326 | $ | 5,097 | |||||||
MCDA contract * | 10 | 8,571 | 8,571 | — | ||||||||||
Customer contracts | 9 | 5,319 | 4,512 | 807 | ||||||||||
Non-contractual customer relationships | 15 | 7,080 | 590 | 6,490 | ||||||||||
Trademarks | 4 | 425 | 425 | — | ||||||||||
Trade name | 15 | 7,310 | 609 | 6,701 | ||||||||||
Developed technology | 10 | 3,797 | 509 | 3,288 | ||||||||||
Total | $ | 46,925 | $ | 24,542 | $ | 22,383 | ||||||||
*MCDA contract: Manufacturing, Commercialization and Development Agreement with Hospira, Inc., dated May 1, 2005 (the "MCDA”). The MCDA was terminated in connection with the acquisition of the HIS business on February 3, 2017.
Amortization expense in 2017, 2016 and 2015 was $15.0 million, $2.8 million and $2.2 million, respectively.
As of December 31, 2017 estimated annual amortization for our intangible assets for each of the next five years is approximately (in thousands):
57
ICU MEDICAL, INC. AND SUBSIDIARIES
NOTES TO CONSOLIDATED FINANCIAL STATEMENTS (Continued)
2018 | $ | 15,996 | ||
2019 | 15,582 | |||
2020 | 15,444 | |||
2021 | 15,361 | |||
2022 | 15,242 | |||
Thereafter | 57,903 | |||
Total | $ | 135,528 | ||
Long-Lived Assets
We periodically evaluate the recoverability of long-lived assets whenever events and changes in circumstances indicate that the carrying amount of an asset may not be fully recoverable. When indicators of impairment are present, the carrying values of the assets are evaluated in relation to the operating performance and future undiscounted cash flows of the underlying business. The net book value of the underlying asset is adjusted to fair value if the sum of the expected discounted cash flows is less than book value. Fair values are based on estimates of market prices and assumptions concerning the amount and timing of estimated future cash flows and discount rates, reflecting varying degrees of perceived risk.
Investment Securities
Short-term investments, exclusive of cash equivalents, are marketable securities intended to be sold within one year and may include trading securities, available-for-sale securities, and held-to-maturity securities (if maturing within one year). Long-term investments are marketable securities intended to be sold after one year and may include trading securities, available-for-sale securities, and held-to-maturity securities.
Our investment securities are considered available-for-sale and are “investment grade” and carried at fair value. Our investments currently consist of corporate bonds. Available-for-sale securities are recorded at fair value, and unrealized holding gains and losses are recorded, net of tax, as a component of accumulated other comprehensive income (loss). Unrealized losses on available-for-sale securities are charged against net earnings when a decline in fair value is determined to be other than temporary. Our management reviews several factors to determine whether a loss is other than temporary, such as the length and extent of the fair value decline, the financial condition and near term prospects of the issuer, and for equity investments, our intent and ability to hold the security for a period of time sufficient to allow for any anticipated recovery in fair value. For debt securities, management also evaluates whether we have the intent to sell or will likely be required to sell before its anticipated recovery. Realized gains and losses are accounted for on the specific identification method. There have been no realized gains or losses on their disposal. The scheduled maturities of the equity securities are between 2018 and 2020. All short-term investment securities are all callable within one year.
As of December 31, 2017, our investment securities consist of the following (in thousands):
December 31, 2017 | |||||||||||
Amortized Cost | Unrealized Holding Gains (Losses) | Fair Value | |||||||||
Short-term corporate bonds | $ | 10,061 | $ | — | $ | 10,061 | |||||
Long-term corporate bonds | 14,579 | — | 14,579 | ||||||||
Total investment securities | $ | 24,640 | $ | — | $ | 24,640 | |||||
Income Taxes
Deferred taxes are determined based on the differences between the financial statements and the tax bases using rates as enacted in the laws. A valuation allowance is established if it is “more likely than not” that all or a portion of the deferred tax assets will not be realized.
58
ICU MEDICAL, INC. AND SUBSIDIARIES
NOTES TO CONSOLIDATED FINANCIAL STATEMENTS (Continued)
We recognize interest and penalties related to unrecognized tax benefits in the tax provision. We recognize liabilities for uncertain tax positions when it is more likely than not that a tax position will not be sustained upon examination and settlement with various taxing authorities. Liabilities for uncertain tax positions are measured based upon the largest amount of benefit that is greater than 50% likely of being realized upon ultimate settlement. We have not recorded any material interest or penalties during any of the years presented.
Foreign Currency
Generally, the functional currency of our international subsidiaries is the local currency. Generally, we translate the financial statements of these subsidiaries to U.S. dollars at the exchange rate in effect at the balance sheet date and revenues and expenses are translated at the average monthly exchange rates during the year. Certain of our international subsidiaries consolidate first with another subsidiary that utilizes a functional currency other than U.S. dollars. In those cases, we follow a step by step translation process utilizing the same sequence as the consolidation process. Translation adjustments are recorded as a component of accumulated other comprehensive income, a separate component of stockholders' equity on our consolidated balance sheets and the effect of exchange rate changes on cash and cash equivalents are reflected on our consolidated statements of cash flows. Gains and losses for transactions denominated in a currency other than the functional currency of the entity are included in our statements of operations in other (expense) income, net. Foreign currency transaction losses, net were $1.8 million in 2017, $0.3 million in 2016 and less than $0.2 million in 2015.
Revenue Recognition
Most of our product sales are free on board shipping point and ownership of the product transfers to the customer on shipment. We record sales and related costs when ownership of the product transfers to the customer, persuasive evidence of an arrangement exists, collectability is reasonably assured and the sales price is determinable. Our customers are distributors, medical product manufacturers and end-users. Our only post-sale obligations are warranty and certain rebates. We warrant products against defects and have a policy permitting the return of defective products. We reserve for warranty and returns based on historical experience. We accrue rebates based on agreements and on historical experience as a reduction in revenue at the time of sale.
Other revenue consists of license, royalty and revenue sharing payments. Payments expected to be received are estimated and recorded in the period earned and adjusted to actual amounts when reports are received from payers; if there is insufficient data to make such estimates, payments are not recorded until reported by the payers.
Arrangements with Multiple Deliverables
In certain circumstances, we enter into arrangements in which we provide multiple deliverables to our customers. These bundled arrangements may include infusion pumps, Mednet software, implementation services, extended warranty and consumables. We first separate the deliverables into different units of accounting and then allocate the arrangement consideration to those separate units of accounting based on their relative selling price. When applying the relative selling price method, the selling price for each deliverable shall be determined using the following hierarchy: (i) vendor-specific objective evidence of selling price; (ii) third-part evidence of selling price; or (iii) best estimate of the selling price. We record revenue related to these multiple deliverables as products are delivered and services have been performed.
Shipping Costs
Costs to ship finished goods to our customers are included in cost of goods sold on the consolidated statements of operations.
Advertising Expenses
Advertising expenses are expensed as incurred and reflected in selling, general and administrative expenses in our consolidated statements of operations and were $0.2 million in 2017, $0.1 million in 2016 and $0.2 million in 2015.
Post-retirement and Post-employment Benefits
59
ICU MEDICAL, INC. AND SUBSIDIARIES
NOTES TO CONSOLIDATED FINANCIAL STATEMENTS (Continued)
We sponsor a Section 401(k) retirement plan ("plan") for employees. Our contributions to our 401(k) plan were approximately $2.0 million in 2017, $1.5 million in 2016 and $1.3 million in 2015. As a result of the HIS acquisition, we assumed certain post-retirement and post-employment obligations related to employees located in certain international countries. These obligations are immaterial to our financial statements taken as a whole.
Research and Development
Research and development costs are expensed as incurred. Research and development costs include salaries and related benefits, consulting fees, production supplies, samples, travel costs, utilities and other miscellaneous administrative costs.
Net Income Per Share
Net income per share is computed by dividing net income by the weighted average number of common shares outstanding. Diluted net income per share is computed by dividing net income by the weighted average number of common shares outstanding plus dilutive securities. Dilutive securities include outstanding common stock options and unvested restricted stock units, less the number of shares that could have been purchased with the proceeds from the exercise of the options, using the treasury stock method. Options that are anti-dilutive, where their exercise price exceeds the average market price of the common stock are not included in the treasury stock method calculation. There were 337 anti-dilutive shares in 2017. There were no anti-dilutive shares in 2016 or 2015.
The following table presents the calculation of net earnings per common share (“EPS”) — basic and diluted (in thousands except per share data):
Year ended December 31, (in thousands, except per share data) | ||||||||||||
2017 | 2016 | 2015 | ||||||||||
Net income | $ | 68,644 | $ | 63,084 | $ | 44,985 | ||||||
Weighted average number of common shares outstanding (basic) | 19,614 | 16,168 | 15,848 | |||||||||
Dilutive securities (1) | 1,244 | 1,086 | 648 | |||||||||
Weighted average common and common equivalent shares outstanding (diluted) | 20,858 | 17,254 | 16,496 | |||||||||
EPS - basic | $ | 3.50 | $ | 3.90 | $ | 2.84 | ||||||
EPS - diluted | $ | 3.29 | $ | 3.66 | $ | 2.73 | ||||||
______________________________
(1) During the second quarter of 2016, we early adopted ASU 2016-09, Compensation - Stock Compensation (Topic 718): Improvements to Employee Share-Based Payment Accounting. Under this ASU, the change to the treasury stock method impacted weighted average common and common equivalent shares outstanding by 413,000 shares for the year ended December 31, 2016.
On February 3, 2017, as part of the purchase price for the acquisition of Pfizer Inc.'s ("Pfizer") Hospira Infusion Systems ("HIS") business, we delivered to Pfizer 3.2 million newly issued common shares (see Note 2: Acquisitions, Strategic Transaction and Integration Expenses).
60
ICU MEDICAL, INC. AND SUBSIDIARIES
NOTES TO CONSOLIDATED FINANCIAL STATEMENTS (Continued)
New Accounting Pronouncements
Recently Adopted Accounting Standards
In July 2015, the Financial Accounting Standards Board ("FASB") issued Accounting Standard Update ("ASU") No. 2015-11 Inventory (Topic 330): Simplifying the Measurement of Inventory. ASU 2015-11 changes the measurement of inventory within the scope of the ASU (e.g. FIFO or average cost) from lower of cost or market to lower of cost and net realizable value ("NRV"). NRV is defined as estimated selling prices in the ordinary course of business, less reasonably predictable costs of completion, disposal, and transportation. Prior to the ASU, U.S. generally accepted accounting principles required an entity to measure inventory at the lower of cost or market. Market is measured using replacement cost unless it is above NRV (commonly referred to as “ceiling”) or below NRV less an approximately normal profit margin (commonly referred to as “floor”). For inventory within its scope, the ASU eliminates the notions of replacement cost and NRV less a normal profit margin, which is intended to simplify the accounting for inventory. The amendments are effective prospectively for the fiscal years, and interim reporting periods within those years, beginning on or after December 15, 2016. We adopted this ASU on January 1, 2017. This ASU did not have a material impact on our consolidated financial statements.
Recently Issued Accounting Standards
In August, 2017, the FASB issued ASU No. 2017-12, Derivatives and Hedging (Topic 815): Targeted Improvements to Accounting for Hedging Activities. The amendments in this update change both the designation and measurement guidance for qualifying hedging relationships and the presentation of hedge results to facilitate financial reporting that more closely reflects an entity's risk management activities. The amendments in this update also make certain targeted improvements to simplify the application of hedge accounting guidance and ease the administrative burden of hedge documentation requirements and assessing hedge effectiveness. The amendments are effective for the fiscal years, and interim reporting periods within those years, beginning on or after December 15, 2018. For cash flow and net investment hedges existing at the date of adoption, an entity should apply a cumulative-effect adjustment related to eliminating the separate measurement of ineffectiveness to accumulated other comprehensive income with a corresponding adjustment to the opening balance of retained earnings as of the beginning of the fiscal year that an entity adopts the update. We early-adopted this ASU on January 1, 2018. The adoption of this ASU will not materially impact our first quarter 2018 consolidated financial statements or related footnotes.
In May 2017, the FASB issued ASU No. 2017-09, Compensation-Stock Compensation (Topic 718): Scope of Modification Accounting. The amendments in this update provide guidance about which changes to the terms or conditions of a share-based payment award require an entity to apply modification accounting. Under the ASU, an entity will account for the effects of a modification unless (i) the fair value of the modified award is the same as the fair value of the original award immediately before the original award is modified, (ii) the vesting conditions of the modified award are the same vesting conditions as the original award immediately before the original award is modified, and (iii) the classification of the modified award as an equity instrument or a liability instrument is the same as the classification of the original award immediately before the original award is modified. The amendments in this ASU are effective prospectively for annual periods, and interim periods within those annual periods, beginning December 15, 2017. This adoption of this ASU is not expected to have a material impact on our consolidated financial statements or related footnote disclosures.
In January 2017, the FASB issued ASU No. 2017-04, Intangibles-Goodwill and Other (Topic 350): Simplifying the Test for Goodwill Impairment. The amendments in this update remove the second step of the impairment test. An entity will apply a one-step quantitative test and record the amount of goodwill impairment as the excess of a reporting unit's carrying amount over its fair value, not to exceed the total amount of goodwill allocated to the reporting unit. The new guidance does not amend the optional qualitative assessment of goodwill impairment. The amendments in ASU 2017-04 are effective for the annual or interim impairment test in fiscal years beginning after December 15, 2019. Early adoption is permitted for interim or annual goodwill impairment tests performed on testing dates after January 1, 2017. This ASU is not expected to have a material impact on our consolidated financial statements or related footnote disclosures.
In January 2017, the FASB issued ASU No. 2017-01, Business Combinations (Topic 805): Clarifying the Definition of a Business. The amendments in this update clarify the definition of a business with the objective of adding guidance to assist entities with evaluating whether transactions should be accounted for as acquisitions (or disposals) of assets or businesses. The amendments in this update provide a screen to determine when a set (integrated set of assets and activities) is not a business. If the screen is not met, it (1) requires that to be considered a business, a set must include, at a minimum, an input and a
61
ICU MEDICAL, INC. AND SUBSIDIARIES
NOTES TO CONSOLIDATED FINANCIAL STATEMENTS (Continued)
substantive process that together significantly contribute to the ability to create output and (2) removes the evaluation of whether a market participant could replace the missing elements. The amendments in ASU 2017-01 are effective for annual periods and interim periods within those annual periods beginning after December 15, 2017. The amendments in this ASU should be applied prospectively on or after the effective date. This adoption of this ASU is not expected to have a material impact on our consolidated financial statements or related disclosures.
In October 2016, the FASB issued No. ASU 2016-16, Income Taxes (Topic 740): Intra-Entity Transfers of Assets Other Than Inventory. Current generally accepted accounting principles prohibits the recognition of current and deferred income taxes for an intra-entity asset transfer until after the asset has been sold to an outside party. The amendments in ASU 2016-16 eliminates this prohibition. Accordingly, an entity should recognize the income tax consequences of an intra-entity transfer of an asset other than inventory when the transfer occurs. Amendments in this update are effective for annual reporting periods beginning after December 15, 2017. The adoption of this ASU is not expected to have a material impact on our consolidated financial statements or related disclosures.
In August 2016, the FASB issued No. ASU 2016-15, Statement of Cash Flows (Topic 230): Classification of Certain Cash Receipts and Cash Payments. ASU 2016-15 provides specific guidance on eight cash flow issues where current guidance is unclear or does not include any specifics on classification. The eight specific cash flow issues are: debt prepayment or debt extinguishment costs; settlement of zero-coupon debt instruments or other debt instruments with zero coupon interest rates that are insignificant in relation to the effective interest rate of the borrowing; contingent consideration payments made after a business combination; proceeds from the settlement of insurance claims; proceeds from the settlement of corporate-owned life insurance policies, including bank-owned policies; distributions received from equity method investees; beneficial interests in securitization transactions; and separately identifiable cash flows and application of the predominance principle. The amendments in ASU 2016-15 are effective for annual periods and interim periods within those annual periods beginning after December 15, 2017. Early adoption is permitted. If adopted in an interim period, any adjustments should be reflected as of the beginning of the fiscal year that includes the interim period. Amendments should be applied using a retrospective transition method to each period presented. The adoption of this ASU is not expected to have a material impact on the consolidated financial statements and related disclosures.
In June 2016, the FASB issued No. ASU 2016-13, Financial Instruments-Credit Losses (Topic 326): Measurement of Credit Losses on Financial Instruments. This update amends the FASB's guidance on the impairment of financial instruments by requiring timelier recording of credit losses on loans and other financial instruments. The ASU adds an impairment model that is based on expected losses rather than incurred losses. The ASU also amends the accounting for credit losses on available-
for-sale debt securities and purchased financial assets with credit deterioration. The amendments in this update will be effective for fiscal years beginning after December 15, 2019. Early adoption is permitted as of the fiscal years beginning after December
15, 2018. The updated guidance requires a modified retrospective adoption. We are currently evaluating the impact of this ASU on the consolidated financial statements and related disclosures.
In February 2016, the FASB issued No. ASU 2016-02, Leases (Topic 842). The amendments in this update require an entity to recognize a right-of-use asset and lease liability for all leases with terms of more than 12 months. Recognition, measurement and presentation of expenses will depend on classification as finance or operating lease. The amendments also require certain quantitative and qualitative disclosures about leasing arrangements. The amendments in this update will be effective for fiscal years beginning after December 15, 2019. Early adoption is permitted. The updated guidance requires a modified retrospective adoption. We are currently evaluating the impact of this ASU on the consolidated financial statements and related disclosures.
In January 2016, the FASB issued No. ASU 2016-01, Financial Instruments – Overall (Subtopic 825-10): Recognition and Measurement of Financial Assets and Financial Liabilities, which amends certain aspects of recognition, measurement, presentation and disclosure of financial instruments. This amendment requires all equity investments to be measured at fair value with changes in the fair value recognized through net income (other than those accounted for under the equity method of accounting or those that result in the consolidation of the investee). The amendments in this update will be effective for fiscal years beginning after December 15, 2017. Early adoption of the amendments is not permitted with the exception of the provision requiring the recognition in other comprehensive income the fair value change from instrument-specific credit risk measured using the fair value option for financial instruments. The adoption of this ASU is not expected to have a material impact on the consolidated financial statements and related disclosures.
62
ICU MEDICAL, INC. AND SUBSIDIARIES
NOTES TO CONSOLIDATED FINANCIAL STATEMENTS (Continued)
In May 2014, the FASB issued ASU No. 2014-09, Revenue from Contracts with Customers (Topic 606). ASU 2014-09 removes inconsistencies and weaknesses in revenue requirements; provides a more robust framework for addressing revenue issues; improves comparability of revenue recognition practices across entities, industries, jurisdictions and capital markets; provides more useful information to users of financial statements through improved disclosure requirements; and simplifies the preparation of financial statements by reducing the number of requirements to which an entity must refer. This guidance requires that an entity depict the consideration by applying a five-step analysis in determining when and how revenue is recognized. The new model will require revenue recognition to depict the transfer of promised goods or services to customers in an amount that reflects the consideration a company expects to receive in exchange for those goods or services. On April 1, 2015, the FASB voted for a one-year deferral of the effective date of the new revenue recognition standard, ASU 2014-09. On July 15, 2015, the FASB affirmed these changes, which requires public entities to apply the amendments in ASU 2014-09 for annual reporting beginning after December 15, 2017. Early adoption is permitted beginning after December 31, 2016, the original effective date in ASU 2014-09. Subsequent to the issuance of this ASU, the FASB issued three amendments: ASU No. 2016-08 which clarifies principal versus agent considerations; ASU 2016-10 which clarifies guidance related to identifying performance obligations and licensing implementation; and ASU 2016-12 which provides narrow-scope improvements and practical expedients. All of the amendments have the same effective dates mentioned above.
We adopted the standard effective January 1, 2018 using the modified retrospective method applied to those contracts that were not completed as of January 1, 2018. Results for reporting beginning after January 1, 2018 are presented under ASC 606, while prior period amounts are not adjusted and will continue to be reported in accordance with our historic accounting under ASC 605. Due to the cumulative impact of adopting ASC 606, we will record a net increase of $9.0 million to opening retained earnings as of January 1, 2018. The impact is primarily related to our bundled arrangements where we sell software licenses and implementation services, in addition to equipment and other consumables and solutions.
We evaluated the effect ASU 2014-09 on our consolidated financial statements by reviewing each of the significant revenue streams. The following is the result of that evaluation:
• | Bundled arrangements - The timing of revenue recognition changed under ASC 606 for arrangements that include the sale of equipment, software and related software implementation services, for which revenue is recognized over time, as the related implementation services are delivered. This results in a delay in the recognition of related revenue over the implementation period, and an acceleration of software related revenue when compared to ASC 605. |
• | Software renewals - The timing of revenue recognition for software license renewals changed under ASC 606. As functional IP, the license is transferred to the customer at a point in time, at the start of each annual renewal period. As a result, under ASC 606, revenue related to our annual software license renewals is accelerated compared to ASC 605. |
In addition to the impact as mentioned above, we expect to have enhanced disclosures in our 2018 first quarter report on Form 10-Q.
NOTE 2. ACQUISITIONS, STRATEGIC TRANSACTION AND INTEGRATION EXPENSES
2017 Acquisitions
On February 1, 2017, we acquired 100% interest in Fannin for total consideration of approximately $1.5 million. Fannin provides infusion therapy consumable products to the healthcare sector in the United Kingdom and Ireland.
On February 3, 2017, we acquired 100% interest in Pfizer's HIS business for total cash consideration of approximately $260.0 million (net of estimated working capital adjustments paid at closing), which was financed with existing cash balances and a $75 million three-year interest-only seller note. We also issued 3.2 million shares of our common stock. The fair value of the common shares issued to Pfizer was determined based on the closing price of our common shares on the closing date, discounted to reflect a contractual lock-up period whereby Pfizer cannot transfer the shares, subject to certain exceptions, until the earlier of (i) the expiration of Pfizer’s services to us in the related transitional services agreement or (ii) eighteen months from the closing date. Additionally, Pfizer also may be entitled up to an additional $225 million in cash contingent consideration based on the achievement of performance targets for the combined company for the three years ending December 31, 2019 ("Earnout Period"). In the event that the sum of our Adjusted EBITDA as defined in the Amended and Restated Stock
63
ICU MEDICAL, INC. AND SUBSIDIARIES
NOTES TO CONSOLIDATED FINANCIAL STATEMENTS (Continued)
and Asset Purchase Agreement between us and Pfizer (the “HIS Purchase Agreement”) for the three years in the Earnout Period (the "Cumulative Adjusted EBITDA") is equal to or exceeds approximately $1 billion ("the "Earnout Target"), then Pfizer will be entitled to receive the full amount of the earnout. In the event that the Cumulative Adjusted EBITDA is equal to or greater than 85% of the Earnout Target (but less than the Earnout Target), Pfizer will be entitled to receive the corresponding percentage of the earnout. In the event that the Cumulative Adjusted EBITDA is less than 85% of the Earnout Target, then no earnout amount will be earned by Pfizer. The initial fair value of the earn-out was determined by employing a Monte Carlo simulation in a risk neutral framework. The underlying simulated variable was adjusted EBITDA. The adjusted EBITDA volatility estimate was based on a study of historical asset volatility for a set of comparable public companies. The model includes other assumptions including the market price of risk, which was calculated as the weighted average cost of capital ("WACC") less the long term risk free rate. We believe that the acquisition of the HIS business, which includes IV pumps, solutions and consumable devices complements our pre-existing business by creating a company that has a complete infusion therapy product portfolio. We believe that the acquisition significantly enhances our global footprint and platform for continued competitiveness and growth.
With the acquisition of HIS, pre-existing long-term supply and distribution contracts between ICU and HIS were effectively terminated.
Deferred Closings
In the HIS Purchase Agreement, we agreed with Pfizer to defer the local closing of the HIS business in certain foreign jurisdictions (the “Deferred Closing Businesses”) for periods ranging by jurisdiction from 3 to 12 months after the February 3, 2017 closing date (the "Deferred Closing Period"). The net assets in these jurisdictions represent an immaterial portion of the total HIS business net assets.
At the February 3, 2017 HIS business transaction closing, we entered into a Net Economic Benefit Agreement with Pfizer under which we agreed that (i) during the Deferred Closing Period, the economic benefits and burdens of the Deferred Closing Businesses are for our account, and we are to be treated as the beneficial owner of the Deferred Closing Businesses and (ii) Pfizer would continue to operate the Deferred Closing Businesses under our direction.
As of December 31, 2017, all of the deferred closing businesses were effectively closed.
64
ICU MEDICAL, INC. AND SUBSIDIARIES
NOTES TO CONSOLIDATED FINANCIAL STATEMENTS (Continued)
Purchase Price
The following table summarizes the final purchase price and the final allocation of the purchase price related to the assets and liabilities purchased (in thousands, except per share data):
Cash consideration for acquired assets | $ | 180,785 | ||
Fair value of Seller Note | 75,000 | |||
Fair value of contingent consideration payable to Pfizer (long-term) | 19,000 | |||
Issuance of ICU Medical, Inc. common shares: | ||||
Number of shares issued to Pfizer | 3,200 | |||
Price per share (ICU's trading closing share price on the Closing Date) | $ | 140.75 | ||
Market price of ICU shares issued to Pfizer | $ | 450,400 | ||
Less: Discount due to lack of marketability of 8.3% | (37,261 | ) | ||
Equity portion of purchase price | 413,139 | |||
Total Consideration | $ | 687,924 | ||
Purchase Price Allocation: | ||||
Cash and cash equivalents | $ | 31,082 | ||
Trade receivables | 362 | |||
Inventories | 417,622 | |||
Prepaid expenses and other assets | 13,911 | |||
Property, plant and equipment | 288,134 | |||
Intangible assets(1) | 131,000 | |||
Other assets | 29,270 | |||
Accounts payable | (12,381 | ) | ||
Accrued liabilities | (47,936 | ) | ||
Long-term liabilities(2) | (67,170 | ) | ||
Total identifiable net assets acquired | $ | 783,894 | ||
Deferred tax, net | (25,080 | ) | ||
Estimated Gain on Bargain Purchase | (70,890 | ) | ||
Estimated Purchase Consideration | $ | 687,924 | ||
______________________________
(1) Identifiable intangible assets includes $48 million of customer relationships, $44 million of developed technology - pumps and dedicated sets, $34 million of developed technology - consumables, and $5 million of in-process research and development ("IPR&D"). The weighted amortization period for the total identifiable assets is approximately nine years, for customer relationships the weighted amortization period is eight years, for the developed technology - pumps and dedicated sets the weighted amortization period is ten years and for the developed technology - consumables the weighted amortization period is twelve years. The IPR&D is non-amortizing until the associated research and development efforts are complete.
(2) Long-term liabilities primarily consisted of contract liabilities, product liabilities and long-term employee benefits.
The fair value of the assets acquired and liabilities assumed exceeded the fair value of the consideration to be paid resulting in a bargain purchase gain. Before recognizing a gain on a bargain purchase, we reassessed the methods used in the purchase accounting and verified that we had identified all of the assets acquired and all of the liabilities assumed, and that there were no additional assets or liabilities to be considered. We also reevaluated the fair value of the contingent consideration transferred to determine that it was appropriate. We determined that the bargain purchase gain was primarily attributable to
65
ICU MEDICAL, INC. AND SUBSIDIARIES
NOTES TO CONSOLIDATED FINANCIAL STATEMENTS (Continued)
expected restructuring costs as well as a reduction to the initially agreed upon transaction price caused primarily by revenue shortfalls across all market segments of the HIS business, negative manufacturing variance due to the drop in revenue and higher operating and required stand up costs, when compared to forecasts of the HIS business at the time that the purchase price was agreed upon. After the continuing review of the product demand and operations of the HIS Business, including the resulting expected restructuring activities, we forecasted our estimated Adjusted EBITDA from the HIS business in 2017 to be $35 million - $40 million, which was considerably lower than the forecast contemplated in initial negotiations with Pfizer, which resulted in an estimated fair value of $19 million related to the $225 million earn out. Restructuring costs, if incurred, will be expensed in future periods (see Note 3: Restructuring Charges). The bargain purchase gain is separately stated below income from operations in the accompanying consolidated statements of operations for the year ended December 31, 2017.
The identifiable intangible assets and other long-lived assets acquired have been valued as Level 3 assets at fair market value. The estimated fair value of identifiable intangible assets were developed using the income approach and are based on critical estimates, judgments and assumptions derived from: analysis of market conditions; discount rate; discounted cash flows; royalty rates; customer retention rates; and estimated useful lives. Fixed assets were valued with the consideration of remaining economic lives. The raw materials inventory was valued at historical cost and adjusted for any obsolescence, the work in process was valued at estimated sales proceeds less costs to complete and costs to sell, and finished goods inventory was valued at estimated sales proceeds less a nominal profit and costs to sell. The prepaid expenses and other current assets and assumed liabilities were recorded at their carrying values as of the date of the acquisition, as their carrying values approximated their fair values due to their short-term nature.
The pro forma financial information in the table below summarizes the combined results of operations for ICU and HIS as though the companies were combined as of the beginning of fiscal 2016. The pro forma financial information for all periods presented also includes the business combination accounting effects resulting from this acquisition including our amortization charges from acquired intangible assets, nonrecurring expense related to the fair value adjustment to acquisition-date inventory, acquisition and integration-related costs, interest expense on the Pfizer seller note and the related tax effects as though the aforementioned companies were combined as of the beginning of fiscal 2016. The pro forma financial information as presented below is for informational purposes only and is not indicative of the results of operations that would have been achieved if the acquisitions had taken place at the beginning of fiscal 2016.
(In millions) | Revenue | Earnings | ||||||
Actual from 2/3/2017 - 12/31/2017(3) | $ | 1,062 | * | |||||
2017 supplemental pro forma from 1/1/2017 - 12/31/2017(1)(2) | $ | 1,293 | $ | 180 | ||||
2016 supplemental pro forma from 1/1/2016 - 12/31/2016(1)(2) | $ | 1,418 | $ | 22 | ||||
______________________________
* Impracticable to calculate.
(1) 2017 supplemental pro forma earnings were adjusted to exclude $66.3 million of nonrecurring expense related to the fair value adjustment to acquisition-date inventory and $69.5 million of acquisition and integration-related costs. 2016 supplemental pro forma earnings were adjusted to include these charges.
(2) Unaudited.
(3) Amount represents activity of HIS from the date of the acquisition.
On November 29, 2017, we acquired all of the outstanding shares of MLA. Total cash consideration paid was approximately $9.0 million. MLA delivers similar consumable Infusion products as our current businesses to Australia and surrounding regions. The purchase price allocation is preliminary and subject to future revision as the acquired assets and liabilities assumed are dependent upon the finalization of the related valuations.
2016 Acquisitions
On April 4, 2016, we acquired all of the outstanding shares of Tangent Medical Technologies, Inc. ("Tangent") for $2.6 million in cash. Tangent designs, develops, and commercializes intravenous catheters and associated products for the improvement of infusion therapy. Tangent's products enhance our infusion therapy product offering. For the year ended December 31, 2016, we recognized a $1.5 million bargain purchase gain related to the acquisition, which is separately stated in our consolidated statements of income. The bargain purchase gain represents the excess of the estimated fair market value of
66
ICU MEDICAL, INC. AND SUBSIDIARIES
NOTES TO CONSOLIDATED FINANCIAL STATEMENTS (Continued)
the identifiable tangible and intangible assets acquired, liabilities assumed and deferred tax assets over the total purchase consideration. The bargain purchase was driven by our ability to realize acquired deferred tax assets. The purchase price allocation is final.
2015 Acquisitions
On October 6, 2015, we acquired 100% of the outstanding shares of EXC, for approximately $59.5 million in cash. Immediately following the completion of the acquisition of EXC, we sold certain assets to Excelsior Medical, LLC for a final purchase price including working capital adjustments of $29.0 million in cash. We retained all of the assets related to the business of manufacturing and selling the needleless connector disinfection cap. The acquisition of EXC's SwabCap business enhances our infusion therapy product offering across our existing direct and original equipment manufacturer business lines. The goodwill recognized for this acquisition is attributable to the benefits expected to be derived from product line expansion, new customers and operational synergies. The goodwill is nondeductible for income tax purposes. The following table summarizes the final purchase price and the allocation of the purchase price related to the assets and liabilities retained (in thousands):
Fair Value of Consideration: | |||
Cash, net of cash acquired | $ | 56,786 | |
Allocation of the Purchase Price: | |||
Net assets sold to Excelsior Medical, LLC | $ | 28,970 | |
Prepaid expenses and other current assets | 254 | ||
Deferred tax asset/liabilities | 4,426 | ||
Property, plant and equipment | 3,982 | ||
Identifiable intangible assets(1) | 18,076 | ||
Goodwill | 4,985 | ||
Assumed liabilities | (3,907 | ) | |
Net Assets Acquired | $ | 56,786 | |
______________________________
(1) Identifiable intangible assets included $7.1 million of non-contractual customer relationships, $3.7 million of developed technology and $7.3 million of trade name. The weighted-average amortization period for the total identifiable intangible assets is approximately fourteen years. The weighted-average amortization period for customer relationships and trade name is fifteen years and the weighted-average amortization period for the developed technology is ten years.
The identifiable intangible assets and other long-lived assets acquired have been valued as Level 3 assets at fair market The estimated fair value of identifiable intangible assets was developed using the income approach and is based on critical estimates, judgments and assumptions derived from: analysis of market conditions; discount rate; discounted cash flows; royalty rates; customer retention rates; and estimated useful lives. The prepaid expenses and other current assets and assumed liabilities were recorded at their carrying values as of the date of the acquisition, as their carrying values approximated their fair values due to their short-term nature.
Strategic Transaction and Integration Expenses
In 2017, we incurred $59.2 million in transaction and integration costs primarily related to our acquisition of HIS. In 2016, we incurred $14.3 million in transaction costs related to our 2017 acquisition of HIS, our acquisition of Tangent and our acquisition of EXC. In 2015, we incurred $1.8 million in charges primarily associated with the acquisition of EXC. Transaction expenses are presented on a separate line item on our statements of income and are combined with restructuring charges.
67
ICU MEDICAL, INC. AND SUBSIDIARIES
NOTES TO CONSOLIDATED FINANCIAL STATEMENTS (Continued)
NOTE 3. RESTRUCTURING CHARGES
In 2017, we incurred restructuring charges related to the acquisition of the HIS business (see Note 2: Acquisitions, Strategic Transaction and Integration Expenses). The restructuring charges were incurred as a result of integrating the acquired operations into our business and include severance costs related to involuntary employee terminations and facility exit costs related to the closure of the Dominican Republic manufacturing facilities acquired from Pfizer. All material charges in regard to these restructuring activities have been paid as of December 31, 2017.
In 2016, we incurred an additional $0.8 million related to the closure of the Slovakian manufacturing facility, described below. Additionally, we incurred $0.2 million related to a one-time charge unrelated to the events disclosed in the table below.
In 2015, we incurred $6.7 million in total restructuring charges related to: (i) a commitment to a plan to sell our Slovakia manufacturing facility, which was sold during 2016. The plan to sell the facility resulted in a pre-tax restructuring charge of $4.2 million for employee termination benefits, government incentive repayments and other associated costs; (ii) an
agreement with Dr. Lopez, a member of our Board of Directors and a former employee in our research and development department, pursuant to which we bought out Dr. Lopez's right to employment under his then-existing employment agreement-the $1.9 million buy-out, including payroll taxes, will be paid in equal monthly installments until December 2020 and payments that will exceed one year have been accrued under long-term liabilities in our consolidated balance sheet; and (iii) the reorganization of our corporate infrastructure, resulting in one-time employee termination benefits and other associated costs and corporate restructuring actions resulted in a total charge of $0.6 million.
The following table summarizes the activity for the restructuring-related charges discussed above and related accrual (in thousands):
Accrued Balance December 31, 2015 | Charges incurred | Payments | Currency Translation | Other Adjustments | Accrued Balance December 31, 2016 | Charges incurred | Payments | Other Adjustments | Accrued Balance December 31, 2017 | ||||||||||||||||||||||||||||||
Severance pay and benefits | $ | 2,505 | $ | 25 | $ | (2,683 | ) | $ | 77 | $ | 129 | $ | 53 | $ | 15,983 | $ | (15,104 | ) | $ | (17 | ) | $ | 915 | ||||||||||||||||
Government incentive repayment | 1,884 | — | (1,769 | ) | 57 | (172 | ) | — | — | — | — | — | |||||||||||||||||||||||||||
Employment agreement buyout | 1,845 | — | (368 | ) | — | — | 1,477 | — | (363 | ) | — | 1,114 | |||||||||||||||||||||||||||
Other corporate restructuring | 305 | 168 | (468 | ) | — | (5 | ) | — | — | — | — | — | |||||||||||||||||||||||||||
Retention and facility closure expenses | — | 581 | (581 | ) | — | — | — | 2,789 | (2,789 | ) | — | — | |||||||||||||||||||||||||||
$ | 6,539 | $ | 774 | $ | (5,869 | ) | $ | 134 | $ | (48 | ) | $ | 1,530 | $ | 18,772 | $ | (18,256 | ) | $ | (17 | ) | $ | 2,029 | ||||||||||||||||
NOTE 4. GAIN ON SALE OF BUILDING
During 2015, we sold an office building in our San Clemente location to George A. Lopez, M.D., a member of our Board of Directors. The building was sold for $3.6 million, its fair market value as determined by a third party. The net book value of the land and building was $2.5 million resulting in a gain on the sale of the land and building of $1.1 million.
NOTE 5. LEGAL SETTLEMENTS
During 2015, we recorded a net settlement charge of $1.8 million due to the following claims:
An arbitrator ruled on a breach of contract claim between us and a service provider, awarding us a gross settlement of $8.8 million. Our legal counsel for this matter represented us under a contingency fee agreement. We recorded a settlement award, net of legal fees and costs, of $5.3 million; and
68
An arbitrator ruled on a breach of contract claim between us and a customer, Hospira, Inc., awarding Hospira $8.2 million Canadian dollars ($6.5 million U.S. dollars). The arbitrator also ruled that we pay 75% of Hospira's legal fees and expenses, which were $0.7 million U.S. dollars. We made a $7.5 million U.S. dollars settlement payment during 2015, which includes a foreign exchange transaction adjustment to Canadian dollars at the time of payment.
NOTE 6. IMPAIRMENT OF ASSETS HELD FOR SALE
During 2015, our Board of Directors authorized us to close our Vrable, Slovakia manufacturing facility. The closure was to enable for greater efficiency of our Ensenada, Mexico facility. After receiving the Board of Director's authorization, we reclassified the land and building related to the Slovakia facility as held-for-sale, and recorded the value of those assets at the lower of their carrying value or their estimated fair value less costs to sell, which was based on a third party fair market valuation. As the estimated fair value less cost to sell was lower than the carrying value of the assets held-for-sale, we recorded an impairment charge of $4.1 million in 2015.
During 2016, we completed the closure of our Slovakia manufacturing facility and sold the land and building held-for- sale for $3.3 million, net of costs to sell, resulting in an additional $0.7 million impairment charge on those assets.
The impairment charges are separately stated in our consolidated statements of operations above income from operations.
NOTE 7. SHARE BASED AWARDS
We have a stock incentive plan for employees and directors and an employee stock purchase plan. Shares to be issued under these plans will be issued either from authorized but unissued shares or from treasury shares.
We incur stock compensation expense for stock options, restricted stock units ("RSU"), performance restricted stock units ("PRSU") and stock purchased under our employee stock purchase plan ("ESPP"). We receive a tax benefit on stock compensation expense and direct tax benefits from the exercise of stock options. We also have indirect tax benefits upon exercise of stock options related to research and development tax credits which are recorded as a reduction of income tax expense. The table below summarizes compensation costs and related tax benefits (in thousands):
Year ended December 31, | ||||||||||||
(In thousands) | 2017 | 2016 | 2015 | |||||||||
Stock compensation expense | $ | 19,352 | $ | 15,242 | $ | 12,827 | ||||||
Tax benefit from stock-based compensation cost | $ | 7,247 | $ | 5,682 | $ | 4,922 | ||||||
Indirect tax benefit | $ | 1,374 | $ | — | $ | 1,997 | ||||||
As of December 31, 2017, we had $23.3 million of unamortized stock compensation cost which we will recognize as an expense over approximately 0.8 years.
Stock Incentive and Stock Option Plans
Our 2011 Stock Incentive Plan ("2011 Plan") replaced our 2003 Stock Option Plan (“2003 Plan”). Our 2011 Plan initially had 650,000 shares available for issuance, plus the remaining available shares for grant from the 2003 Plan. In 2012, 2014 and 2017, our stockholders approved amendments to the 2011 plan that increased the shares available for issuance by 3,275,000, bringing the initial shares available for issuance to 3,925,000, plus the remaining 248,700 shares that remained available for grant from the 2003 Plan. In addition, any forfeited, terminated or expired shares that would otherwise return to the 2003 Plan are available under the 2011 Plan. As of December 31, 2017, the 2011 Plan has 4,188,300 shares of common stock reserved for issuance to employees, which includes 263,300 shares that transferred from the 2003 Plan. Shares issued as options or stock appreciation rights ("SARs") are charged against the 2011 Plan's share reserve as one share for one share issued. Shares subject to awards other than options and SARs are charged against the 2011 Plan's share reserve as 2.09 shares for 1 share issued. Options may be granted with exercise prices at no less than fair market value at date of grant. Options granted under the 2011 Plan may be “non-statutory stock options” which expire no more than ten years from date of grant or “incentive stock options” as defined in Section 422 of the Internal Revenue Code of 1986, as amended. Upon exercise of non-statutory stock options, we are generally entitled to a tax deduction on the exercise of the option for an amount equal to the
69
ICU MEDICAL, INC. AND SUBSIDIARIES
NOTES TO CONSOLIDATED FINANCIAL STATEMENTS (Continued)
excess over the exercise price of the fair market value of the shares at the date of exercise; we are generally not entitled to any tax deduction on the exercise of an incentive stock option. The 2011 Plan includes conditions whereby unvested options are cancelled if employment is terminated.
In 2014, our Compensation Committee of the Board of Directors awarded our then new Chief Executive Officer an employment inducement option to purchase 182,366 shares of our common stock and an employment inducement grant of restricted stock units with respect to 68,039 shares of our common stock. The inducement grants were made out of our 2014 Inducement Incentive Plan ("2014 Plan").
Our 2001 Directors’ Stock Option Plan (the “Directors’ Plan”), initially had 750,000 shares reserved for issuance to members of our Board of Directors, expired in November 2011. Although no new grants may be made under the Director's Plan, grants made under the Director's Plan prior to its expiration continue to remain outstanding. Options not vested terminate if the directorship is terminated.
Time-based Stock Options
To date, all options granted under the 2014 Plan, 2011 Plan, 2003 Plan and Directors' Plan have been non-statutory stock options. The majority of the time-based outstanding employee option grants vest 25% after one year from the grant date and the balance vests ratably on a monthly basis over 36 months. The majority of the outstanding options granted to non-employee directors vest one year from the grant date. The options generally expire 10 years from the grant date.
The fair value of time-based option grants is calculated using the Black-Scholes option valuation model. The expected term for the option grants was based on historical experience and expected future employee behavior. We estimate the volatility of our common stock at the date of grant based on the historical volatility of our common stock, based on the average expected exercise term. The table below summarizes the total time-based stock options granted, total valuation and the weighted average assumptions (dollars in thousands):
Year ended December 31, | ||||||||||||
2017 | 2016 | 2015 | ||||||||||
Number of time-based options granted | 8,825 | 13,405 | 22,816 | |||||||||
Grant date fair value of options granted (in thousands) | $ | 375 | $ | 413 | $ | 590 | ||||||
Weighted average assumptions for stock option valuation: | ||||||||||||
Expected term (years) | 5.5 | 5.5 | 5.6 | |||||||||
Expected stock price volatility | 27.0 | % | 31.8 | % | 25.9 | % | ||||||
Risk-free interest rate | 1.1 | % | 0.7 | % | 1.7 | % | ||||||
Expected dividend yield | — | % | — | % | — | % | ||||||
Weighted average grant price per option | $ | 158.20 | $ | 101.32 | $ | 93.30 | ||||||
Weighted average grant date fair value per option | $ | 42.51 | $ | 30.78 | $ | 25.86 | ||||||
Performance Stock Options
In 2015, we granted performance stock option grants which are exercisable if the common stock price condition and the time-based vesting have been met. The 2015 performance based stock option grants vest ratably at 33% per year over three years. For the 2015 grants, the vested performance stock options became exercisable when the closing price of our common stock was equal to or more than 130% of the exercise price for 30 consecutive trading days during the term of the grant. All of the 2015 performance stock option grant's common stock price conditions have been met.
The fair value of performance option grants is calculated using the Monte Carlo Simulation. The expected term of the performance option grants is based on the expected number of years to achieve the exercisable goal trigger and assumes that the vested option will be immediately exercised or cancelled, if underwater. We estimate the volatility of our common stock at the date of grant based on the historical volatility of our common stock over a 10-year period.
The table below summarizes the performance stock options granted, the total valuation and the weighted average assumptions (dollars in thousands). There were no performance option grants in 2017 or 2016.
70
ICU MEDICAL, INC. AND SUBSIDIARIES
NOTES TO CONSOLIDATED FINANCIAL STATEMENTS (Continued)
Year ended December 31, | |||||||||
2017 | 2016 | 2015 | |||||||
Number of performance options granted | 244,825 | ||||||||
Number of performance options earned | 244,825 | 349,812 | |||||||
Grant date fair value of options granted (in thousands) | $ | 6,087 | |||||||
Weighted average assumptions for stock option valuation: | |||||||||
Expected term (years) | 3.0 | ||||||||
Expected stock price volatility | 30.86 | % | |||||||
Risk-free interest rate | 2.3 | % | |||||||
Expected dividend yield | — | % | |||||||
Weighted average grant price per option | $ | 91.88 | |||||||
Weighted average grant date fair value per option | $ | 24.86 | |||||||
A summary of our stock option activity as of and for the year ended December 31, 2017 is as follows:
Shares | Weighted Average Exercise Price Per Share | Weighted Average Contractual Life (Years) | Aggregate Intrinsic Value (in thousands) | ||||||||||
Outstanding at December 31, 2016 | 2,018,290 | $ | 58.90 | ||||||||||
Granted | 8,825 | $ | 158.20 | ||||||||||
Exercised | (610,316 | ) | $ | 52.43 | |||||||||
Forfeited or expired | (72 | ) | $ | 58.79 | |||||||||
Outstanding at December 31, 2017 | 1,416,727 | $ | 62.30 | 5.8 | $ | 217,749 | |||||||
Exercisable at December 31, 2017 | 1,133,734 | $ | 60.13 | 5.6 | $ | 176,721 | |||||||
Vested and expected to vest, December 31, 2017 | 1,416,727 | $ | 62.30 | 5.8 | $ | 217,749 | |||||||
The intrinsic values for options exercisable, outstanding and vested or expected to vest at December 31, 2017 is based on our closing stock price of $216.00 at December 31, 2017 and are before applicable taxes.
Year ended December 31, | ||||||||||||
(In thousands) | 2017 | 2016 | 2015 | |||||||||
Intrinsic value of options exercised | $ | 71,283 | $ | 25,065 | $ | 28,071 | ||||||
Cash received from exercise of stock options | $ | 32,003 | $ | 17,346 | $ | 15,042 | ||||||
Tax benefit from stock option exercises | $ | 20,004 | $ | 7,556 | $ | 9,330 | ||||||
Stock Awards
In 2017, we granted performance restricted stock units ("PRSU") to our executive officers. The PRSUs will vest, if at all, upon the achievement of a minimum Cumulative Adjusted EBITDA, subject to a three-year cliff vesting ending on December 31, 2019. If at that date, our Cumulative Adjusted EBITDA is at least $600 million but less than $650 million, 100% of the awarded units will vest. If our Cumulative Adjusted EBITDA is at least $650 million but less than $700 million, 200% of the awarded units will vest. If our Cumulative Adjusted EBITDA is at least $700 million, 300% of the awarded units will vest.
In 2016, we granted PRSUs to our executive officers, which will vest, if at all, upon the achievement of a minimum specified compound annual growth rate ("CAGR") in adjusted EBITDA per share, subject to a three-year cliff vesting ending on December 31, 2018. If at that date, our adjusted EBITDA per share CAGR is at least 8% but less than 10%, 100% of the awarded units will vest. If our adjusted EBITDA per share CAGR is at least 10% but less than 12%, 200% of the awarded
71
ICU MEDICAL, INC. AND SUBSIDIARIES
NOTES TO CONSOLIDATED FINANCIAL STATEMENTS (Continued)
units will vest. If our adjusted EBITDA per share CAGR is greater than 12%, 300% of the awarded units will vest. As of October 1, 2017 we expect our adjusted EBITDA per share CAGR to be greater than 12% at December 31, 2018.
Restricted stock units ("RSU") are granted annually to our Board of Directors and vest on the first anniversary of the grant date.
In 2017, 2016 and 2015, we granted RSUs to certain employees that vest ratably on the anniversary of the grant over three years. Additionally in 2015, we granted RSUs to certain new hire employees that vest ratably on the anniversary of the grant over two years.
The table below summarizes our restricted stock award activity (dollars in thousands):
Year ended December 31, | ||||||||||||
(In thousands except shares and per share amounts) | 2017 | 2016 | 2015 | |||||||||
PRSU | ||||||||||||
Shares granted | 20,686 | 36,370 | — | |||||||||
Shares earned | — | — | — | |||||||||
Grant date fair value per share | $ | 154.75 | $ | 86.47 | $ | — | ||||||
Grant date fair value | $ | 3,201 | $ | 3,145 | $ | — | ||||||
Intrinsic value vested | $ | — | $ | — | $ | 787 | ||||||
RSU | ||||||||||||
Shares granted | 107,678 | 60,377 | 67,745 | |||||||||
Grant date fair value per share | $ | 156.49 | $ | 87.47 | $ | 93.52 | ||||||
Grant date fair value | $ | 16,851 | $ | 5,281 | $ | 6,336 | ||||||
Intrinsic value vested | $ | 9,813 | $ | 4,680 | $ | 2,754 | ||||||
The table below provides a summary of our PRSU and RSU activity as of and for the year ended December 31, 2017.
Number of Units | Grant Date Fair Value Per Share | Weighted Average Contractual Life (Years) | Aggregate Intrinsic Value | ||||||||||
Non-vested at December 31, 2016 | 159,439 | $ | 84.68 | ||||||||||
Change in units due to performance expectations (a) | 72,740 | $ | 86.47 | ||||||||||
Granted | 128,364 | $ | 156.21 | ||||||||||
Vested | (66,278 | ) | $ | 80.61 | |||||||||
Forfeited | (8,762 | ) | $ | 148.76 | |||||||||
Non-vested and expected to vest at December 31, 2017 | 285,503 | $ | 116.28 | 1.0 | $ | 33,197 | |||||||
(a) Relates to the 2016 PRSUs, assumes attainment of maximum payout rate as set forth in performance criteria.
ESPP
We have an ESPP under which U.S. employees may purchase up to $25,000 annually of common stock at 85% of its fair market value at the beginning or the end of a six-month offering period, whichever is lower. There are 750,000 shares of common stock reserved for issuance under the ESPP, which is subject to an annual increase of the least of 300,000 shares, two percent of the shares outstanding or such a number as determined by the Board. To date, there have been no increases. As of December 31, 2017, there were 133,487 shares available for future issuance. The ESPP is intended to constitute an “employee stock purchase plan” within the meaning of Section 423 of the Internal Revenue Code. During 2017, we suspended our ESPP.
72
ICU MEDICAL, INC. AND SUBSIDIARIES
NOTES TO CONSOLIDATED FINANCIAL STATEMENTS (Continued)
The fair value of rights to purchase shares under the ESPP is calculated using the Black-Scholes option valuation model. The table below summarizes the number and intrinsic value of ESPP share purchases and the weighted average valuation assumptions for the 2017, 2016 and 2015 purchase periods.
Year ended December 31, | ||||||||||||
2017 | 2016 | 2015 | ||||||||||
ESPP shares purchased by employees | 23,426 | 31,227 | 34,299 | |||||||||
Intrinsic value of ESPP purchases (in thousands) | $ | 986 | $ | 955 | $ | 1,382 | ||||||
Weighted average assumptions for ESPP valuation: | ||||||||||||
Expected term (in years) | 0.5 | 0.5 | 0.5 | |||||||||
Expected stock price volatility | 28.1 | % | 32.5 | % | 27.0 | % | ||||||
Risk-free interest rate | 0.6 | % | 0.3 | % | 0.6 | % | ||||||
Expected dividend yield | — | % | — | % | — | % | ||||||
NOTE 8. DERIVATIVES AND HEDGING ACTIVITIES
Hedge Accounting and Hedging Program
During the second quarter of 2017, we implemented a cash flow hedging program. The purpose of our hedging program is to manage the foreign currency exchange rate risk on forecasted expenses denominated in currencies other than the functional currency of the operating unit. We do not issue derivatives for trading or speculative purposes.
In May 2017, we entered into a two-year cross-currency par forward contract to hedge a portion of our Mexico forecasted expenses denominated in Pesos ("MXN"). To receive hedge accounting treatment, all hedging relationships are formally documented at the inception of the hedge, and the hedges must be highly effective in offsetting changes to future cash flows on hedged transactions. The par forward contract is designated and qualifies as a cash flow hedge. Our derivative instrument is recorded at fair value on the Consolidated Balance Sheets and is classified based on the instrument's maturity date. We record changes in the intrinsic value of the effective portion of the gain or loss on the derivative instrument as a component of Other Comprehensive (Loss) Income and we reclassify that gain or loss into earnings in the same line item associated with the forecasted transaction and in the same period during which the hedged transaction affects earnings. Any gain or loss on the derivative instrument due to ineffectiveness of the hedge will be recognized in the Consolidated Statements of Operations during the current period. The total notional amount of our outstanding derivative as of December 31, 2017 was approximately 510.3 million MXN. The term of our currency forward contract is May 1, 2017 to May 1, 2019. The derivative instrument matures in equal monthly amounts at a fixed forward rate of 20.01MXN/USD over the term of the two-year contract.
The following table presents the fair values of our derivative instrument included within the Consolidated Balance Sheet as of December 31, 2017 (in thousands):
Derivatives | |||||
Consolidated Balance Sheet Location | December 31, 2017 | ||||
Derivatives designated as cash flow hedging instruments | |||||
Foreign exchange forward contract: | Accrued liabilities | $ | 187 | ||
Other long-term liabilities | 402 | ||||
Total derivatives designated as cash flow hedging instruments | $ | 589 | |||
The following table presents the amounts affecting the Consolidated Statements of Operations for the year ended December 31, 2017 (in thousands):
73
ICU MEDICAL, INC. AND SUBSIDIARIES
NOTES TO CONSOLIDATED FINANCIAL STATEMENTS (Continued)
Line Item in the Consolidated Statements of Operations | Year Ended December 31, 2017 | ||||
Derivatives designated as cash flow hedging instruments | |||||
Foreign exchange forward contracts | Cost of goods sold | $ | 885 | ||
We recognized the following gains on our foreign exchange contract designated as a cash flow hedge (in thousands):
Amount of Gain Recognized in Other Comprehensive Income on Derivatives | Amount of Gain Reclassified From Accumulated Other Comprehensive Income into Income | ||||||||||
Year Ended December 31, 2017 | Location of Gain Reclassified From Accumulated Other Comprehensive Income into Income | Year Ended December 31, 2017 | |||||||||
Derivatives designated as cash flow hedges: | |||||||||||
Foreign exchange forward contract | $ | 296 | Cost of goods sold | $ | 885 | ||||||
Total derivatives designated as cash flow hedging instruments | $ | 296 | $ | 885 | |||||||
As of December 31, 2017, we expect approximately $0.2 million of the deferred losses on the outstanding derivatives in accumulated other comprehensive income to be reclassified to net income during the next 12 months concurrent with the underlying hedged transactions also being reported in net income.
NOTE 9. FAIR VALUE MEASUREMENTS
Fair value is the price that would be received from selling an asset or paid to transfer a liability in an orderly transaction between market participants at the measurement date. Fair value is estimated by applying the following hierarchy, which prioritizes the inputs used to measure fair value into three levels and bases the categorization within the hierarchy upon the lowest level of input that is available and significant to the fair value measurement:
• | Level 1: quoted prices in active markets for identical assets or liabilities; |
• | Level 2: inputs other than Level 1 that are observable, either directly or indirectly, such as quoted prices in active markets for similar assets or liabilities, quoted prices for identical or similar assets or liabilities in markets that are not active or other inputs that are observable or can be corroborated by observable market data for substantially the full term of the assets or liabilities; or |
• | Level 3: unobservable inputs that are supported by little or no market activity and that are significant to the fair values of the assets or liabilities. |
During the first quarter of 2017, we recognized an earn-out liability upon the acquisition of HIS from Pfizer. Pfizer may be entitled up to $225 million in cash if certain performance targets for the combined company for the three years ending December 31, 2019 are achieved. The initial fair value of the earn-out was determined by employing a Monte Carlo simulation in a risk neutral framework. The underlying simulated variable was adjusted EBITDA. The adjusted EBITDA volatility estimate was based on a study of historical asset volatility for a set of comparable public companies. The model includes other assumptions including the market price of risk, which was calculated as the weighted average cost of capital ("WACC") less the long term risk free rate. The initial value assigned to the contingent consideration was a result of forecasted product demand of our HIS business, as discussed further in Note 2: Acquisition, Strategic Transaction and Integration Expenses. At each reporting date subsequent to the acquisition we remeasure the earn-out using the same methodology above and recognize any changes in value. If the probability of achieving the performance target significantly changes from what we initially anticipated, the change could have a significant impact on our financial statements in the period recognized. Our contingent earn-out liability is separately stated in our consolidated balance sheets.
The following table provides a reconciliation of the Level 3 earn-out liability measured at estimated fair value based on an initial valuation and updated quarterly for the year ended December 31, 2017 (in thousands):
74
ICU MEDICAL, INC. AND SUBSIDIARIES
NOTES TO CONSOLIDATED FINANCIAL STATEMENTS (Continued)
Earn-out Liability | ||||
Contingent earn-out liability, December 31, 2016 | $ | — | ||
Acquisition date fair value estimate of earn-out | 19,000 | |||
Change in fair value of contingent earn-out (included in income from operations as a separate line item) | 8,000 | |||
Contingent earn-out liability, December 31, 2017 | $ | 27,000 | ||
The fair value of the earn-out at December 31, 2017 changed from the fair value calculated at acquisition due to a change in the forecast of the underlying target, adjusted EBITDA, and due to changes in other assumptions used in the Monte Carlo simulation, as detailed in the below table.
The following table provides quantitative information about Level 3 inputs for fair value measurement of our earn-out liability as of the acquisition date and December 31, 2017. Significant increases or decreases in these inputs in isolation could result in a significant impact on our fair value measurement:
Simulation Input | As of December 31, 2017 | At Acquisition February 3, 2017 | ||||
Adjusted EBITDA Volatility | 26.00 | % | 29.00 | % | ||
WACC | 8.75 | % | 10.00 | % | ||
20-year risk free rate | 2.58 | % | 2.82 | % | ||
Market price of risk | 5.99 | % | 6.93 | % | ||
Cost of debt | 4.08 | % | 4.16 | % | ||
The fair value of our investments, which consisted of corporate bonds, is estimated using observable market based inputs such as quoted prices, interest rates and yield curves or Level 2 inputs.
The fair value of our Level 2 forward currency contract is estimated using observable market inputs such as known notional value amounts, spot and forward exchange rates. These inputs relate to liquid, heavily traded currencies with active markets which are available for the full term of the derivative.
The assets related to our Dominican Republic manufacturing facilities are classified as assets held-for-sale. These assets are separately stated in our consolidated balance sheet. The fair value of these Level 3 assets was determined as part of the HIS business valuation and was based on a market approach using comparable building and land sales data and the analysis of market conditions.
There were no transfers between levels in 2017.
Our assets and liabilities measured at fair value on a recurring basis consisted of the following (Level 1, 2 and 3 inputs as defined above) (in thousands):
75
ICU MEDICAL, INC. AND SUBSIDIARIES
NOTES TO CONSOLIDATED FINANCIAL STATEMENTS (Continued)
Fair value measurements at December 31, 2017 | |||||||||||||||
Total carrying value | Quoted prices in active markets for identical assets (level 1) | Significant other observable inputs (level 2) | Significant unobservable inputs (level 3) | ||||||||||||
Assets: | |||||||||||||||
Available for sale securities: | |||||||||||||||
Short-term | $ | 10,061 | $ | — | $ | 10,061 | $ | — | |||||||
Long-term | 14,579 | — | 14,579 | — | |||||||||||
Total Assets | $ | 24,640 | $ | — | $ | 24,640 | $ | — | |||||||
Liabilities: | |||||||||||||||
Earn-out liability | $ | 27,000 | $ | — | $ | — | $ | 27,000 | |||||||
Foreign exchange forwards: | |||||||||||||||
Accrued liabilities | 187 | — | 187 | — | |||||||||||
Other long-term liabilities | 402 | — | 402 | — | |||||||||||
Total Liabilities | $ | 27,589 | $ | — | $ | 589 | $ | 27,000 | |||||||
Our assets measured at fair value on a nonrecurring basis consisted of the following (Level 1, 2 and 3 inputs as defined above (in thousands):
Fair value measurements at December 31, 2017 using | |||||||||||||||
Total carrying value | Quoted prices in active markets for identical assets (level 1) | Significant other observable inputs (level 2) | Significant unobservable inputs (level 3) | ||||||||||||
Assets: | |||||||||||||||
Assets held-for-sale | $ | 12,489 | $ | — | $ | — | $ | 12,489 | |||||||
Total Assets | $ | 12,489 | $ | — | $ | — | $ | 12,489 | |||||||
76
ICU MEDICAL, INC. AND SUBSIDIARIES
NOTES TO CONSOLIDATED FINANCIAL STATEMENTS (Continued)
NOTE 10. PREPAID EXPENSES, OTHER CURRENT ASSETS AND RELATED-PARTY RECEIVABLES
Prepaid expenses and other current assets consist of the following (in thousands):
2017 | 2016 | |||||||
Deposits | $ | 21,940 | $ | — | ||||
Other prepaid expenses and receivables | 4,208 | 2,948 | ||||||
Prepaid insurance and property taxes | 2,580 | 1,649 | ||||||
VAT/GST receivable | 8,097 | 1,018 | ||||||
Deferred tax charge | 1,326 | — | ||||||
Other | 3,135 | 1,740 | ||||||
$ | 41,286 | $ | 7,355 | |||||
Related-party receivables consist of the following (in thousands):
2017 | 2016 | |||||||
Third-party receivables due from Pfizer | $ | 36,425 | $ | — | ||||
HIS business acquisition related | 62,382 | — | ||||||
$ | 98,807 | $ | — | |||||
Third-party receivables due from Pfizer relates to trade accounts receivable that has already been collected from customers by Pfizer on our behalf. HIS business acquisition related receivables include amounts due from Pfizer related to the manufacturing and supply agreements and deferred close entities and amounts we prepaid to Pfizer for operational expenses under the transition services agreement.
Pfizer became a related party to us when we issued 3.2 million shares of our common stock as partial consideration for the acquisition of HIS. On February 3, 2017, we entered into a transitional services agreement and two Manufacturing and Supply Agreements ("MSA's") with Pfizer, (see Note 17, Collaborative and Other Arrangements). During 2017, the revenue for goods manufactured for Pfizer was $72.4 million and the cost of product manufactured by Pfizer for us was $70.2 million.
77
NOTE 11. ACCRUED LIABILITIES AND OTHER LONG-TERM LIABILITIES
Accrued liabilities consist of the following (in thousands):
December 31, | ||||||||
2017 | 2016 | |||||||
Salaries and benefits | $ | 20,745 | $ | 5,702 | ||||
Incentive compensation | 40,682 | 7,912 | ||||||
Accrued professional fees | 13,319 | — | ||||||
Accrued product field action | 11,810 | — | ||||||
Consigned inventory | 5,210 | — | ||||||
Third-party inventory | 4,284 | — | ||||||
Legal accrual | 3,538 | 4,177 | ||||||
Accrued sales taxes | 6,291 | 1,472 | ||||||
Warranties and Returns | 3,360 | — | ||||||
Deferred revenue | 3,326 | 18 | ||||||
Accrued other taxes | 2,771 | — | ||||||
Outside commissions | 725 | 1,141 | ||||||
Accrued freight | 5,696 | — | ||||||
Restructuring accrual | 1,290 | 423 | ||||||
Acquisition-related accrual | — | 2,750 | ||||||
Other | 9,017 | 2,301 | ||||||
$ | 132,064 | $ | 25,896 | |||||
Other long-term liabilities consist of the following (in thousands):
December 31, | ||||||||
2017 | 2016 | |||||||
Contract liabilities(1) | $ | 40,148 | $ | — | ||||
Deferred revenue | 7,099 | — | ||||||
Benefits | 2,104 | 1,107 | ||||||
Other | 5,975 | — | ||||||
$ | 55,326 | $ | 1,107 | |||||
__________________________________________
(1) Consists of multiple contracts with customers and suppliers that were valued at below market at the time of the HIS acquisition.
78
NOTE 12. LONG-TERM OBLIGATIONS
Five-year Revolving Credit Facility ("Credit Facility")
On November 8, 2017, we entered into a five-year Revolving Credit Facility ("Credit Facility") with various lenders for $150 million, with Wells Fargo Bank, N.A. as the administrative agent, swingline lender and issuing lender. As of December 31, 2017, we had no borrowings and $150 million of availability under the Credit Facility. The Credit Facility matures on November 8, 2022.
The Credit Facility has an accordion feature that would enable us to increase the borrowing capacity of the Credit Facility by the greater of (i) $100 million and (ii) 2.00x Total Leverage.
In connection with the Credit Facility, for the year ended December 31, 2017, we incurred $1.4 million in financing costs, which were capitalized and are included in prepaid expenses and other current assets and other assets in our consolidated balance sheets, in accordance with the appropriate short-term or long-term classification. These fees will be amortized to interest expense over the remaining term of the Credit Facility.
Principal payments
Principal payments, when drawn on the Credit Facility, are made at our discretion with the entire unpaid amount due at maturity.
Interest rate
In general, borrowing under the Credit Facility (other than Swingline loans) bears interest, at our option, based on the Base Rate plus applicable margin or the London Interbank Offered Rate ("LIBOR") rate plus applicable margin, as defined below:
(A) Base Rate is defined as the highest of: (a) the Prime Rate; (b) the Federal Funds Rate plus 0.50%; and (c) the daily LIBOR (as defined below) for a one month Interest Period plus 1%.
(B) LIBOR Rate, as determined by the Administrative Agent, is defined as the rate per annum obtained by dividing (1) LIBOR by (2) 1.00 - Eurodollar Reserve Percentage.
Swingline loans will bear interest at the Base Rate plus the applicable Interest Margin. The Credit Facility has a per annum commitment fee (see table below) that will accrue on the unused amounts of the commitments under the Credit Facility.
The applicable interest margins and the commitment fee with respect to the Credit Facility shall be based on the Total Leverage Ratio pursuant to the following pricing grid:
Level | Consolidated Total Leverage Ratio | Commitment Fee | LIBOR + | Base Rate + |
I | Less than 1.00 to 1.00 | 0.15% | 1.25% | 0.25% |
II | Greater than or equal to 1.00 to 1.00 but less than 2.00 to 1.00 | 0.20% | 1.50% | 0.50% |
III | Greater than or equal to 2.00 to 1.00 but less than 2.50 to 1.00 | 0.25% | 1.75% | 0.75% |
IV | Greater than or equal to 2.50 to 1.00 | 0.30% | 2.00% | 1.00% |
Guarantors and Collateral
Our obligations under the Credit Facility are unconditionally guaranteed, on a joint and several basis, by ICU Medical, Inc. and certain of our existing subsidiaries. Our obligations are secured by: (i) 100% of the equity interests of our guarantor subsidiaries; and (ii) all of the tangible and intangible personal property and assets related to us and our guarantor subsidiaries
79
(including, without limitation, all accounts, equipment, inventory and other goods, all instruments, intellectual property and other general intangibles, deposit accounts, securities accounts and other investment property and cash), and (iii) all products, profits and proceeds of the foregoing. Notwithstanding the foregoing, the collateral shall not include certain excluded property.
Debt Covenants
The Credit Facility contains certain financial covenants pertaining to Consolidated Fixed Charge Coverage and Consolidated Total Leverage Ratios. In addition, the Credit Facility has restrictions pertaining to limitations on debt, liens, negative pledges, loans, advances, acquisitions, other investments, dividends, distributions, redemptions, repurchases of equity interests, fundamental changes and asset sales and other dispositions, prepayments, redemptions and purchases of subordinated debt and other junior debt, transactions with affiliates, dividend and payment restrictions affecting subsidiaries, changes in line of business, fiscal year and accounting practices and amendment of organizational documents and junior debt documents.
The Consolidated Leverage Ratio is defined as the ratio of Consolidated Total Funded Indebtedness on such date, to Consolidated Adjusted EBITDA, as defined under the Credit Facility Agreement, for the most recently completed four fiscal quarters. The maximum Consolidated Leverage Ratio is not more than 3.00 to 1.00.
The Consolidated Fixed Charge Coverage Ratio is defined as the ratio of: (a) Consolidated Adjusted EBITDA less the sum of (i) capital expenditures, (ii) federal, state, local and foreign income taxes paid in cash and (iii) cash restricted payments made after the closing date, to (b) Consolidated Fixed Charges for the most recently completed four fiscal quarters, calculated on a pro forma basis. The minimum Consolidated Fixed Charge Coverage Ratio is 2.00 to 1.00.
We were in compliance with all financial covenants as of December 31, 2017.
Three-Year Interest-Only Senior Note
On February 3, 2017, we partially funded the acquisition of the HIS business from Pfizer with a $75 million Seller Note issued by Pfizer contemporaneous with the acquisition. We had fully repaid the seller note as of December 31, 2017.
NOTE 13. INCOME TAXES
Income from continuing operations before taxes consisted of the following (in thousands):
Year Ended December 31, | ||||||||||||
2017 | 2016 | 2015 | ||||||||||
United States | $ | 59,872 | $ | 80,714 | $ | 74,288 | ||||||
Foreign | (8,589 | ) | 4,450 | (4,589 | ) | |||||||
$ | 51,283 | $ | 85,164 | $ | 69,699 | |||||||
80
ICU MEDICAL, INC. AND SUBSIDIARIES
NOTES TO CONSOLIDATED FINANCIAL STATEMENTS (Continued)
The (benefit) provision for income taxes consisted of the following (in thousands):
Year Ended December 31, | ||||||||||||
2017 | 2016 | 2015 | ||||||||||
Current: | ||||||||||||
Federal | $ | 2,774 | $ | 21,123 | $ | 18,601 | ||||||
State | 2,263 | 2,347 | 745 | |||||||||
Foreign | 3,170 | 1,118 | 1,426 | |||||||||
8,207 | 24,588 | 20,772 | ||||||||||
Deferred: | ||||||||||||
Federal | $ | (20,878 | ) | $ | (2,045 | ) | $ | 4,524 | ||||
State | (4,619 | ) | (767 | ) | (960 | ) | ||||||
Foreign | (71 | ) | 304 | 378 | ||||||||
(25,568 | ) | (2,508 | ) | 3,942 | ||||||||
$ | (17,361 | ) | $ | 22,080 | $ | 24,714 | ||||||
Current income taxes payable were reduced from the amounts in the above table by $9.3 million in 2015, equal to the direct tax benefit that we receive upon exercise of stock options and the vesting of restricted stock units by employees and directors. We have accrued for tax contingencies for potential tax assessments, and in 2017 we recognized a $3.0 million net increase, most of which related to various federal and state tax reserves.
On December 22, 2017, the Tax Cuts and Jobs Act (the “Tax Act”) was enacted into legislation, which includes a broad range of provisions affecting businesses. The Tax Act significantly revises how companies compute their U.S. corporate tax liability by, among other provisions, reducing the corporate tax rate from 35% to 21% for tax years beginning after December 31, 2017, implementing a territorial tax system, and requiring a mandatory one-time tax on U.S. owned undistributed foreign earnings and profits known as the toll charge or transition tax.
Pursuant to the SEC Staff Accounting Bulletin ("SAB") No. 118, "Income Tax Accounting Implications of the Tax Cuts and Jobs Act" ("SAB 118"), a company selects between one of three scenarios to reflect the impact of the Tax Act in its financial statements within a measurement period. Those scenarios are (i) a final estimate which effectively closes the measurement period; (ii) a reasonable estimate leaving the measurement period open for future revisions; and (iii) no estimate as the law is still being analyzed in which case a company continues to apply its accounting on the basis of the provisions of the tax laws that were in effect immediately before the enactment of the Tax Act. SAB 118 allows for the reporting provisional amounts for certain income tax effects in scenario (ii) and (iii). The measurement period begins in the reporting period that includes the Act’s enactment date and ends when an entity has obtained, prepared, and analyzed the information that was needed in order to complete the accounting requirements under ASC Topic 740. We were able to provide a reasonable estimate for the revaluation of deferred taxes and the effects of the toll charge on undistributed foreign earnings and profits, with our measurement period open for future revisions. As such, we recorded a provisional tax expense in the amount of $1.1 million and a provisional tax expense in the amount of $2.0 million related to the revaluation of deferred taxes and the toll charge, respectively. We are still evaluating various international provisions included in the Tax Act and have therefore not completed our assessment. These provisions include, but are not limited to, the anti-base-erosion and anti-abuse tax regime (BEAT), the global intangible low-taxed income (GILTI) provisions, the foreign derived intangible income (FDII) provisions, and the changes to the deductibility of interest. These provisions will be effective for us beginning on January 1, 2018, and may materially impact our effective tax rate in future years.
81
ICU MEDICAL, INC. AND SUBSIDIARIES
NOTES TO CONSOLIDATED FINANCIAL STATEMENTS (Continued)
A reconciliation of the provision for income taxes at the statutory rate to our effective tax rate is as follows (dollars in thousands):
Year Ended December 31, | |||||||||||||||||||||
2017 | 2016 | 2015 | |||||||||||||||||||
Amount | Percent | Amount | Percent | Amount | Percent | ||||||||||||||||
Federal tax at the expected statutory rate | $ | 17,950 | 35.0 | % | $ | 29,807 | 35.0 | % | $ | 24,395 | 35.0 | % | |||||||||
State income tax, net of federal effect | (403 | ) | (0.8 | )% | 1,795 | 2.1 | % | 2,661 | 3.9 | % | |||||||||||
Tax credits | (2,783 | ) | (5.4 | )% | (1,014 | ) | (1.2 | )% | (5,861 | ) | (8.4 | )% | |||||||||
Foreign income tax differential | 3,481 | 6.8 | % | (135 | ) | (0.1 | )% | 3,412 | 4.9 | % | |||||||||||
Stock based compensation | (18,958 | ) | (37.0 | )% | (7,720 | ) | (9.1 | )% | — | — | % | ||||||||||
Impact of the Tax Act | 3,076 | 6.0 | % | — | — | % | — | — | % | ||||||||||||
IP installment sale | 3,367 | 6.6 | % | — | — | % | — | — | % | ||||||||||||
Bargain purchase gain | (24,811 | ) | (48.4 | )% | — | — | % | — | — | % | |||||||||||
Other | 1,720 | 3.4 | % | (653 | ) | (0.8 | )% | 107 | 0.1 | % | |||||||||||
$ | (17,361 | ) | (33.8 | )% | $ | 22,080 | 25.9 | % | $ | 24,714 | 35.5 | % | |||||||||
Tax credits in 2017, 2016 and 2015 consist principally of research and developmental tax credits.
The components of our deferred income tax assets (liabilities) are as follows (in thousands):
December 31, | ||||||||
2017 | 2016 | |||||||
Deferred tax asset: | ||||||||
Foreign | $ | — | $ | 1,223 | ||||
Accruals/other | 8,368 | 857 | ||||||
Acquired future tax deductions | 10,580 | 6,473 | ||||||
Stock-based compensation | 8,633 | 11,089 | ||||||
Foreign currency translation adjustments | 3,425 | 5,175 | ||||||
Tax credits state | 8,471 | 6,764 | ||||||
Foreign tax credits | 2,749 | — | ||||||
Inventory reserves | 10,658 | 1,938 | ||||||
Allowance for doubtful accounts | 636 | 151 | ||||||
Valuation allowance | (7,385 | ) | — | |||||
$ | 46,135 | $ | 33,670 | |||||
Deferred tax liability: | ||||||||
State income taxes | $ | 1,640 | $ | 1,708 | ||||
Foreign | 202 | 1,370 | ||||||
Depreciation and amortization | 21,005 | 10,027 | ||||||
$ | 22,847 | $ | 13,105 | |||||
Deferred tax asset, net | $ | 23,288 | $ | 20,565 | ||||
Tax Holidays and Carryforwards
Acquired future tax deductions consist of: (a) the net tax benefit of items expensed for financial statement purposes but capitalized and amortized for tax purposes, (b) the total tax benefited portion of the federal net operating loss ("NOL") carry-forwards of $4.9 million which will expire at various dates from 2020 to 2035 and (c) the net tax benefited portion of the foreign NOLs of $1.1 million, consisting of a NOL of $6.6 million with a valuation allowance of $5.5 million. Under
82
ICU MEDICAL, INC. AND SUBSIDIARIES
NOTES TO CONSOLIDATED FINANCIAL STATEMENTS (Continued)
Section 382 of the Internal Revenue Code, certain ownership changes limit the utilization of the NOL carry-forwards, and the amount of federal NOL carry-forwards recorded is the net federal benefit available.
Other carryforwards include research and development (“R&D”) state tax credit carryforwards of $9.5 million and $0.3 million for California and Utah, respectively, and a foreign tax credit carryforward of $2.7 million.
A substantial portion of our manufacturing operations in Costa Rica operate under various tax holidays and tax incentive programs which will expire in whole or in part in 2027. Certain of the holidays and may be extended if specific conditions are met. The net impact of these tax holidays and tax incentives was an increase to our net earnings by $5.7 million or $0.27 per diluted share in 2017.
Foreign currency translation adjustments, and related tax effects, are an element of “other comprehensive income” and are not included in net income other than the revaluation of the associated deferred tax asset due to the Tax Act.
As of December 31, 2017, we had estimated $24 million of undistributed foreign earnings and profits. Pursuant to the Tax Act, our undistributed foreign earnings and profits were deemed repatriated as of December 31, 2017. We have not provided deferred tax liabilities for foreign withholding taxes and certain state income taxes on the undistributed earnings and profits from certain non-U.S. subsidiaries that will be permanently reinvested outside the United States.
Upon the distribution of foreign earnings and profits, certain foreign countries impose withholding taxes, subject to certain limitations, for use as credits against our U.S. tax liability, if any. If the foreign earnings and profits were distributed, we would need to accrue an additional income tax liability. However, we may also be allowed a credit against substantially all our U.S. tax liability for the taxes paid in foreign jurisdictions.
We are subject to taxation in the United States and various states and foreign jurisdictions. Our United States federal income tax returns for tax years 2014 and forward are subject to examination by the Internal Revenue Service. Our principal state income tax returns for tax years 2012 and forward are subject to examination by the state tax authorities. The total gross amount of unrecognized tax benefits as of December 31, 2017 was $6.5 million which, if recognized, would impact the effective tax rate. We believe that adequate provision has been made for any adjustments that may result from tax examinations. However, the outcome of tax examinations cannot be predicted with certainty. As of December 31, 2017, it is not possible to estimate the amount of change, if any, in the unrecognized tax benefits that is reasonably possible within the next twelve months. We recognize accrued interest and penalties related to unrecognized tax benefits as a component of income tax expense. We have not accrued any penalties or interest as of December 31, 2017 or December 31, 2016
The following table summarizes our cumulative gross unrecognized tax benefits (in thousands):
Year Ended December 31, | ||||||||||||
2017 | 2016 | 2015 | ||||||||||
Beginning balance | $ | 2,000 | $ | 1,772 | $ | 4,115 | ||||||
Increases to prior year tax positions | 77 | 77 | 25 | |||||||||
Increases due to acquisitions | 640 | — | — | |||||||||
Increases to current year tax positions | 3,992 | 345 | 345 | |||||||||
Decreases to prior year tax positions | (12 | ) | (46 | ) | (2,399 | ) | ||||||
Decrease related to settlements | — | — | (314 | ) | ||||||||
Decrease related to lapse of statute of limitations | (170 | ) | (148 | ) | — | |||||||
Ending balance | $ | 6,527 | $ | 2,000 | $ | 1,772 | ||||||
NOTE 14. PRODUCT LINES, GEOGRAPHIC INFORMATION AND SIGNIFICANT CUSTOMERS
Our primary product lines are Infusion Consumables, IV Solutions, Infusion Systems and Critical Care. The following table sets forth for the periods indicated, total revenue by product line as a percentage of total revenue:
83
ICU MEDICAL, INC. AND SUBSIDIARIES
NOTES TO CONSOLIDATED FINANCIAL STATEMENTS (Continued)
Year Ended December 31, | |||||||
Product line | 2017 | 2016 | 2015 | ||||
Infusion Consumables | 28 | % | 86 | % | 84 | % | |
IV Solutions | 40 | % | — | % | — | % | |
Infusion Systems | 23 | % | — | % | — | % | |
Critical Care | 4 | % | 14 | % | 16 | % | |
Other | 5 | % | — | % | — | % | |
100 | % | 100 | % | 100 | % | ||
We sell products worldwide, on credit terms on an unsecured basis, as an OEM supplier, to independent medical supply distributors and directly to the end customer. The manufacturers and distributors, in turn, sell our products to healthcare providers. For the years ended December 31, 2016 and 2015, we had worldwide sales to one manufacturer, Pfizer, of 30% and 36%, respectively, of consolidated revenue and as of December 31, 2016, accounts receivable from Pfizer was 23% of consolidated accounts receivable.
In February 2017, we completed the acquisition of Pfizer's HIS business, which we acquired in part to protect against the significant earnings exposure indicated above (see Note 2: Acquisitions and Strategic Transaction Expenses).
We report revenue on a “where-sold” basis, which reflects the revenue within the country or region in which the ultimate sale is made to our external customer.
The table below presents total company revenues, by major country or region (in thousands):
As of December 31, | |||||||||||
2017 | 2016 | 2015 | |||||||||
Europe | $ | 100,423 | $ | 50,105 | $ | 45,062 | |||||
Canada | 69,753 | 16,266 | 12,494 | ||||||||
LATAM | 57,851 | 29,920 | 27,780 | ||||||||
APAC | 54,465 | 10,304 | 7,047 | ||||||||
Other | 30,184 | 11,083 | 10,622 | ||||||||
Total foreign | $ | 312,676 | $ | 117,678 | $ | 103,005 | |||||
United States | 979,937 | 261,694 | 238,663 | ||||||||
Worldwide total | $ | 1,292,613 | $ | 379,372 | $ | 341,668 | |||||
Domestic sales accounted for 76%, 70% and 71% of total revenue in 2017, 2016 and 2015, respectively. International sales accounted for 24%, 30% and 29% of total revenue in 2017, 2016 and 2015, respectively.
84
ICU MEDICAL, INC. AND SUBSIDIARIES
NOTES TO CONSOLIDATED FINANCIAL STATEMENTS (Continued)
The table below presents our gross long-lived assets, consisting of property, plant and equipment, by country or region (in thousands):
As of December 31, | ||||||||
2017 | 2016 | |||||||
Costa Rica | $ | 80,956 | $ | — | ||||
Mexico | 61,008 | 57,971 | ||||||
Other LATAM | 19,432 | — | ||||||
Canada | 4,362 | — | ||||||
Italy | 6,860 | 4,320 | ||||||
Spain | 5,601 | — | ||||||
Other Europe | 2,625 | 966 | ||||||
APAC | 5,169 | 41 | ||||||
Total foreign | $ | 186,013 | $ | 63,298 | ||||
United States | 422,810 | 180,657 | ||||||
Worldwide total | $ | 608,823 | $ | 243,955 | ||||
NOTE 15. Stockholders' Equity
Treasury Stock
In July 2010, our Board of Directors approved a common stock purchase plan to purchase up to $40.0 million of our common stock. This plan has no expiration date and we have $7.2 million remaining on this purchase plan. During 2016, we purchased $15.4 million of our common stock. We did not purchase any of our common stock under our purchase plan in 2017 or 2015. We used the treasury stock to issue shares for stock option exercises, restricted stock grants and employee stock purchase plan stock purchases. We are currently limited on share purchases in accordance with the terms and conditions of our Credit Facility, (see Note 12: Long-Term Obligations).
In 2017, we withheld 27,636 shares of our common stock from employee vested restricted stock units in consideration for $4.1 million in payments for the employee's share award income tax withholding obligations. We have no shares remaining in treasury at December 31, 2017.
In 2016, we withheld 20,261 shares of our common stock from employee vested restricted stock units in consideration for $1.9 million in payments for the employee's share award income tax withholding obligations. We had 93 shares remaining in treasury at December 31, 2016.
Accumulated Other Comprehensive Income (Loss)
The components of AOCI, net of tax, were as follows (in thousands):
Foreign Currency Translation Adjustments | Unrealized Gains on Cash Flow Hedges | Other Adjustments | Total | |||||||||||||
Balance as of December 31, 2016 | $ | (21,272 | ) | $ | — | $ | — | $ | (21,272 | ) | ||||||
Other comprehensive income (loss) before reclassifications | 6,694 | 184 | (16 | ) | 6,862 | |||||||||||
Amounts reclassified from AOCI | — | (549 | ) | — | (549 | ) | ||||||||||
Other comprehensive income (loss) | 6,694 | (365 | ) | (16 | ) | 6,313 | ||||||||||
Balance as of December 31, 2017 | $ | (14,578 | ) | $ | (365 | ) | $ | (16 | ) | $ | (14,959 | ) | ||||
85
NOTE 16. COMMITMENTS AND CONTINGENCIES
Lease Commitments
We have entered into various non-cancellable operating lease agreements for certain of our offices and facilities throughout the world with original lease periods expiring primarily between 2018 and 2024. Some of these agreements have escalating rent payment provisions. We recognize rent expense under such agreements on a straight-line basis.
Our rent expense under operating leases was $7.9 million in 2017, $0.6 million in 2016 and $0.4 million in 2015.
As of December 31, 2017, future minimum lease payments under our non-cancelable operating leases are as follows over each of the next five years and thereafter (in millions):
2018 | $ | 8,775 | ||
2019 | 5,907 | |||
2020 | 4,059 | |||
2021 | 3,214 | |||
2022 | 3,105 | |||
Thereafter | 6,446 | |||
Total | $ | 31,506 | ||
Legal Proceedings
Beginning in November 2016, purported class actions were filed in the U.S. District Court for the Northern District of Illinois against Pfizer subsidiaries, Hospira, Inc., Hospira Worldwide, Inc. and certain other defendants relating to the intravenous saline solutions part of the HIS business. Plaintiffs seek to represent classes consisting of all persons and entities in the U.S. who directly purchased intravenous saline solution sold by any of the defendants from January 1, 2013 until the time the defendants’ allegedly unlawful conduct ceases. Plaintiffs allege that the defendants’ conduct restricts output and artificially fixes, raises, maintains and/or stabilizes the prices of intravenous saline solution sold throughout the U.S. in violation of federal antitrust laws. Plaintiffs seek treble damages (for themselves and on behalf of the putative classes) and an injunction against defendants for alleged price overcharges for intravenous saline solution in the U.S. since January 1, 2013. On February 3, 2017, we completed the acquisition of the HIS business from Pfizer. This litigation is the subject of a claim for indemnification against us by Pfizer and a cross-claim for indemnification against Pfizer by us under the HIS stock and asset purchase agreement ("SAPA").
In addition, in August 2015, the New York Attorney General issued a subpoena to Hospira, Inc. requesting that the company provide information regarding certain business practices in the intravenous solutions part of the HIS business. Separately, in April 2017, we received a grand jury subpoena issued by the United States District Court for the Eastern District of Pennsylvania, in connection with an investigation by the U.S. Department of Justice, Antitrust Division. The subpoena calls for production of documents related to the manufacturing, selling, pricing and shortages of intravenous solutions, including saline, as well as communications among market participants regarding these issues. The Department of Justice investigation is the subject of cross-claims for indemnification by both us and Pfizer under the SAPA. We will coordinate with Pfizer to produce records to the New York Attorney General and the Department of Justice.
We have an ongoing dispute with a product partner that may result in a redefinition of our contractual arrangement or in the rights or remedies determined under such arrangement. We do not expect this dispute to have a material adverse effect on our financial position or results of operations.
In addition to the legal matters described above, we are from time to time involved in various legal proceedings, either as a defendant or plaintiff, most of which are routine litigation in the normal course of business. We believe that the resolution of the legal proceedings in which we are involved will not have a material adverse effect on our financial position or results of operations.
86
Off Balance Sheet Arrangements
In the normal course of business, we have agreed to indemnify our officers and directors to the maximum extent permitted under Delaware law and to indemnify customers as to certain intellectual property matters related to sales of our products. There is no maximum limit on the indemnification that may be required under these agreements. We have never incurred, nor do we expect to incur, any liability for indemnification.
Contingencies
We have a contractual earn-out arrangement in connection with our acquisition of the HIS business, whereby Pfizer may be entitled up to an additional $225 million in cash upon achievement of performance targets for the company for the three years ending December 31, 2019, see (Note 2: Acquisitions and Strategic Transaction Expenses). The amount to be paid cannot be determined until the earn-out period has expired.
NOTE 17. COLLABORATIVE AND OTHER ARRANGEMENTS
On February 3, 2017, we entered into two MSA's, (i) whereby Pfizer will manufacture and supply us with certain agreed upon products for an initial five-year term with a one-time two-year option to extend and (ii) whereby we will manufacture and supply Pfizer certain agreed upon products for a term of five or ten years depending on the product, also with a one-time two-year option to extend. The MSA's provide each party with mutually beneficial interests and both of the MSA's are to be jointly managed by both Pfizer and ICU. The initial supply price, which will be annually updated, is in full consideration for all costs associated with the manufacture, documentation, packaging and certification of the products.
On February 3, 2017, as part of the HIS business acquisition, we entered into an agreement with Pfizer, whereby Pfizer will provide certain transitional services to us for finance, business technology, regulatory, human resources, global operations, procurement, quality and global commercial operation services ("Enabling Function Services"). We pay a monthly service fee for each service provided, and share equally with Pfizer in certain set-up costs and, as applicable, service exit costs. Our share of the set-up costs and service exit costs, in the aggregate, are not to exceed $22.0 million. The service fees are subject to a fee cap of (i) $62.5 million during the initial twelve month period and (ii) $31.3 million during the subsequent six month period. Only the Enabling Function Services are subject to the fee cap, any services provided after expiration of the agreement or services that are not Enabling Function Services may result in service fees outside the fee cap. The service fees are intended to reasonably approximate Pfizer’s cost of providing the Enabling Function Services. We may terminate, in whole only, any particular service and the fee cap would be reduced proportionate to the services terminated. Partial reduction in the provision of any specific service may be made but only with the prior written consent of Pfizer.
On February 3, 2017, as part of the HIS business acquisition, we also entered into a reverse transitional services agreement, where we will provide to Pfizer certain transitional services ranging in term from three to eighteen months. Services include support for real estate, research and development, infrastructure, logistics, quality, site operations, safety, commercial and finance, and regulatory support services.
87
ICU MEDICAL, INC. AND SUBSIDIARIES
NOTES TO CONSOLIDATED FINANCIAL STATEMENTS (Continued)
NOTE 18. SELECTED QUARTERLY FINANCIAL DATA - UNAUDITED
Quarter Ended | ||||||||||||||||
Mar. 31 | Jun. 30 | Sept. 30 | Dec. 31 | |||||||||||||
(in thousands except per share data) | ||||||||||||||||
2017 | ||||||||||||||||
Total revenue | $ | 247,739 | $ | 331,514 | $ | 343,236 | $ | 370,124 | ||||||||
Gross profit | $ | 88,945 | $ | 88,062 | $ | 111,598 | $ | 137,490 | ||||||||
Net income (loss) | $ | 55,863 | $ | (37,060 | ) | $ | 136 | $ | 49,705 | |||||||
Net income (loss) per share: | ||||||||||||||||
Basic | $ | 3.03 | $ | (1.87 | ) | $ | 0.01 | $ | 2.47 | |||||||
Diluted | $ | 2.86 | $ | (1.87 | ) | $ | 0.01 | $ | 2.33 | |||||||
2016 | ||||||||||||||||
Total revenue | $ | 89,855 | $ | 96,721 | $ | 97,108 | $ | 95,688 | ||||||||
Gross profit | $ | 49,233 | $ | 50,132 | $ | 51,273 | $ | 50,760 | ||||||||
Net income | $ | 18,160 | $ | 16,606 | $ | 18,806 | $ | 9,512 | ||||||||
Net income per share: | ||||||||||||||||
Basic | $ | 1.13 | $ | 1.03 | $ | 1.16 | $ | 0.58 | ||||||||
Diluted | $ | 1.08 | $ | 0.98 | $ | 1.09 | $ | 0.54 | ||||||||
______________________________________
On February 3, 2017, we acquired HIS, see Note 2, Acquisitions, Strategic Transaction and Integration Costs.
ITEM 9. CHANGES IN AND DISAGREEMENTS WITH ACCOUNTANTS ON ACCOUNTING AND FINANCIAL DISCLOSURE
None.
88
ITEM 9A. CONTROLS AND PROCEDURES
Disclosure Controls and Procedures
Our principal executive officer and principal financial officer have concluded, based on their evaluation of our disclosure controls and procedures (as defined in Regulations 13a-15(e) and 15(d)-15(e) under the Securities Exchange Act of 1934) as of the end of the period covered by this Report, that our disclosure controls and procedures are effective to ensure that the information we are required to disclose in the reports that we file or submit under the Exchange Act is accumulated and communicated to our management, including our principal executive officer and principal financial officer, as appropriate to allow timely decisions regarding required disclosure and that such information is recorded, processed, summarized and reported within the time periods specified in the rules and forms of the Securities Exchange Commission.
Changes in Internal Control Over Financial Reporting
On February 3, 2017, we completed our acquisition of HIS. As the acquisition occurred in the first quarter of 2017, the scope of our evaluation of the effectiveness of internal control over financial reporting does not include HIS. This exclusion is in accordance with the SEC's general guidance that an assessment of a recently acquired business may be omitted from our scope for a period not to exceed one year from the date of the acquisition.
There was no change in our internal control over financial reporting that occurred during our most recent fiscal quarter that has materially affected or is reasonably likely to materially affect our internal control over financial reporting, other than changes resulting from the acquisition and integration of HIS.
Management’s Annual Report on Internal Control over Financial Reporting
Management of the Company is responsible for establishing and maintaining adequate control over the Company’s financial reporting.
Management has used the criteria in Internal Control — Integrated Framework (2013) issued by the Committee of Sponsoring Organizations of the Treadway Commission to evaluate the effectiveness of its internal control over financial reporting.
Based on this evaluation, management of the Company has concluded that the Company has maintained effective internal control over its financial reporting as of December 31, 2017 based on the criteria in Internal Control — Integrated Framework (2013) issued by the Committee of Sponsoring Organizations of the Treadway Commission.
The Company acquired HIS on February 3, 2017. In accordance with SEC Staff guidance permitting a company to exclude an acquired business from management's assessment of the effectiveness of internal control over financial reporting for the year in which the acquisition was completed, management has excluded from its assessment of the effectiveness of the Company's internal control over financial reporting as of December 31, 2017, HIS's, internal control over financial reporting whose financial statements constitute 49% of total assets and 82% of total revenues of the consolidated financial statement amounts as of and for the year ended December 31, 2017.
Our independent registered public accounting firm that audited the December 31, 2017 financial statements included in this Annual Report on Form 10-K has independently assessed the effectiveness of our internal control over financial reporting and its report is below.
89
REPORT OF INDEPENDENT REGISTERED PUBLIC ACCOUNTING FIRM
To the stockholders and the Board of Directors of ICU Medical, Inc.
Opinion on Internal Control over Financial Reporting
We have audited the internal control over financial reporting of ICU Medical, Inc. and subsidiaries (the "Company") as of December 31, 2017, based on criteria established in Internal Control-Integrated Framework (2013) issued by the Committee of Sponsoring Organizations of the Treadway Commission (COSO). In our opinion, the Company maintained, in all material respects, effective internal control over financial reporting as of December 31, 2017, based on criteria established in Internal Control - Integrated Framework (2013) issued by COSO.
We have also audited, in accordance with the standards of the Public Company Accounting Oversight Board (United States) (PCAOB), the consolidated financial statements as of and for the year ended December 31, 2017, of the Company and our report dated March 16, 2018, expressed an unqualified opinion on those financial statements.
As described in Management’s Annual Report on Internal Control over Financial Reporting, management excluded from its assessment the internal control over financial reporting at HIS, which was acquired on February 3, 2017 and whose financial statements constitute 49% of total assets and 82% of total revenues of the consolidated financial statement amounts as of and for the year ended December 31, 2017. Accordingly, our audit did not include the internal control over financial reporting at HIS.
Basis for Opinion
The Company’s management is responsible for maintaining effective internal control over financial reporting and for its assessment of the effectiveness of internal control over financial reporting, included in the accompanying Management’s Annual Report on Internal Control over Financial Reporting. Our responsibility is to express an opinion on the Company’s internal control over financial reporting based on our audit. We are a public accounting firm registered with the PCAOB and are required to be independent with respect to the Company in accordance with the U.S. federal securities laws and the applicable rules and regulations of the Securities and Exchange Commission and the PCAOB.
We conducted our audit in accordance with the standards of the PCAOB. Those standards require that we plan and perform the audit to obtain reasonable assurance about whether effective internal control over financial reporting was maintained in all material respects. Our audit included obtaining an understanding of internal control over financial reporting, assessing the risk that a material weakness exists, testing and evaluating the design and operating effectiveness of internal control based on the assessed risk, and performing such other procedures as we considered necessary in the circumstances. We believe that our audit provides a reasonable basis for our opinion.
Definition and Limitations of Internal Control over Financial Reporting
A company’s internal control over financial reporting is a process designed to provide reasonable assurance regarding the reliability of financial reporting and the preparation of financial statements for external purposes in accordance with generally accepted accounting principles. A company’s internal control over financial reporting includes those policies and procedures that (1) pertain to the maintenance of records that, in reasonable detail, accurately and fairly reflect the transactions and dispositions of the assets of the company; (2) provide reasonable assurance that transactions are recorded as necessary to permit preparation of financial statements in accordance with generally accepted accounting principles, and that receipts and expenditures of the company are being made only in accordance with authorizations of management and directors of the company; and (3) provide reasonable assurance regarding prevention or timely detection of unauthorized acquisition, use, or disposition of the company’s assets that could have a material effect on the financial statements.
Because of its inherent limitations, internal control over financial reporting may not prevent or detect misstatements. Also, projections of any evaluation of effectiveness to future periods are subject to the risk that controls may become inadequate because of changes in conditions, or that the degree of compliance with the policies or procedures may deteriorate.
/s/ DELOITTE & TOUCHE LLP
Costa Mesa, California
March 16, 2018
90
ITEM 9B. OTHER INFORMATION
None
PART III
ITEM 10. DIRECTORS, EXECUTIVE OFFICERS AND CORPORATE GOVERNANCE
The information required by this Item 10 of Form 10-K is set forth under the captions Executive Officers, Election of Directors, Audit Committee and Compliance with Section 16(a) Beneficial Ownership Reporting Compliance in our definitive
Proxy Statement to be filed in connection with our 2018 Annual Meeting of Stockholders, and such information is incorporated herein by reference.
We have a Code of Business Conduct and Ethics for Directors and Officers. A copy is available on our website, www.icumed.com. We will disclose any future amendments to, or waivers from, the Code of Business Conduct and Ethics for Directors and Officers on our website.
ITEM 11. EXECUTIVE COMPENSATION
The information required by this Item 11 of Form 10-K is set forth under the caption Executive Officer and Director Compensation, Compensation Committee and Compensation Committee Interlocks and Insider Participation in our definitive Proxy Statement to be filed in connection with our 2018 Annual Meeting of Stockholders, and such information is incorporated herein by reference.
ITEM 12. SECURITY OWNERSHIP OF CERTAIN BENEFICIAL OWNERS AND MANAGEMENT AND RELATED STOCKHOLDER MATTERS
The information required by this Item 12 of Form 10-K is set forth under the caption Security Ownership of Certain Beneficial Owners and Management and Equity Compensation Plan Information in our definitive Proxy Statement to be filed in connection with our 2018 Annual Meeting of Stockholders, and such information is incorporated herein by reference.
ITEM 13. CERTAIN RELATIONSHIPS AND RELATED TRANSACTIONS, AND DIRECTOR INDEPENDENCE
The information required by this Item 13 of Form 10-K is set forth under the caption Transactions with Related Persons, Policies and Procedures Regarding Transactions with Related Persons and Director Independence in our definitive Proxy Statement to be filed in connection with our 2018 Annual Meeting of Stockholders, and such information is incorporated herein by reference.
ITEM 14. PRINCIPAL ACCOUNTING FEES AND SERVICES
The information required by this Item 14 of Form 10-K is set forth under the caption Ratification of Auditors in our definitive Proxy Statement to be filed in connection with our 2018 Annual Meeting of Stockholders, and such information is incorporated herein by reference.
91
PART IV
ITEM 15. EXHIBITS, FINANCIAL STATEMENT SCHEDULES
Form 10-K Page No. | |||
The following documents are filed as part of this report: | |||
1. | Consolidated Financial Statements. See Index to Consolidated Financial Statements in Part II, Item 8 of this Form 10-K. | ||
2. | Exhibits. The exhibits listed in the accompanying Exhibit Index are filed or incorporated by reference as part of this Form 10-K. | ||
3. | Financial Statement Schedules. The Financial Statement Schedules required to be filed as a part of this Report are: | ||
EXHIBIT INDEX
Exhibit Number | Exhibit Description | |
Stock Purchase Agreement dated as of October 5, 2015, by and among Registrant, Medline Industries, Inc., Roundtable Healthcare Partners, L.P., Roundtable Healthcare Investors, L.P. and certain other sellers party thereto. Filed as Exhibit 2.1 to Registrant's Current Report on Form 8-K filed October 6, 2015, and incorporated herein by reference. | ||
Asset Purchase Agreement made as of October 5, 2015, by and among Registrant, Excelsior Medical, LLC and Medline Industries, Inc. Filed as Exhibit 2.2 to Registrant's Current Report on Form 8-K filed October 6, 2015, and incorporated herein by reference. | ||
Amended and Restated Stock and Asset Purchase Agreement, dated as of January 5, 2017, by and between Pfizer Inc., a Delaware corporation, and ICU Medical, Inc., a Delaware corporation. Filed as Exhibit 2.1 to Registrant’s Current Report on Form 8-K filed January 5, 2017, and incorporated herein by reference. | ||
Registrant's Certificate of Incorporation, as amended and restated. Filed as an exhibit to Registrant's Current Report on Form 8-K filed on June 10, 2014, and incorporated herein by reference. | ||
Registrant's Bylaws, as amended and restated. Filed as an Exhibit to Registrant's Current Report on Form 8-K filed August 3, 2016, and incorporated herein by reference. | ||
Form of Indemnification Agreement with Directors and Executive Officers. Filed as an Exhibit to Registrant's Quarterly Report on Form 10-Q for the Quarter ended September 30, 2010, and incorporated herein by reference. | ||
10.2 | Manufacture and Supply Agreement dated September 13, 1993 between Registrant and B. Braun, Inc. relating to the Protected Needle product. Filed as an Exhibit to Registrant's Quarterly Report on Form 10-Q for the Quarter ended September 30, 1993, and incorporated herein by reference. | |
10.3 | Supply and Distribution Agreement dated April 3, 1995 between Registrant and Abbott Laboratories, Inc. relating to the Clave product. Filed as an Exhibit to Registrant's Quarterly Report on Form 10-Q for the Quarter ended March 31, 1995, and incorporated herein by reference. | |
92
Amended and Restated Rights Agreement dated October 18, 2007 between Registrant and American Stock Transfer & Trust Company as Rights Agent. Filed as an Exhibit to Registrant's Registration Statement on Form 8-A/A dated October 18, 2007, and incorporated herein by reference. | ||
SafeLine Agreement effective October 1, 1997 by and between Registrant and B. Braun Medical, Inc. Filed as an Exhibit to Registrant's Current Report on Form 8-K filed June 18, 1998, and incorporated herein by reference. | ||
Amendment to April 3, 1995 Supply and Distribution Agreement, dated January 1, 1999, between Registrant and Abbott Laboratories. Filed as an Exhibit to Registrant's Current Report on Form 8-K filed February 23, 1999, and incorporated herein by reference. | ||
Co-Promotion and Distribution Agreement, dated February 27, 2001 between Registrant and Abbott Laboratories. Filed as an Exhibit to Registrant's Current Report on Form 8-K filed March 7, 2001, and incorporated herein by reference. | ||
Registrant's 2001 Directors' Stock Option Plan.* Filed as an Exhibit to Registrant's definitive Proxy Statement filed pursuant to Regulation 14A on April 3, 2002, and incorporated herein by reference. | ||
Registrant's 2002 Employee Stock Purchase Plan.* Filed as an Exhibit to Registrant's definitive Proxy Statement filed pursuant to Regulation 14A on April 3, 2002, and incorporated herein by reference. | ||
Registrant's 2003 Stock Option Plan.* Filed as an Exhibit to Registrant's definitive Proxy Statement filed pursuant to Regulation 14A on April 25, 2003, and incorporated herein by reference. | ||
Amendment to April 3, 1995 Supply and Distribution Agreement, dated as of January 14, 2004, between Registrant and Abbott Laboratories. Filed as an Exhibit to Registrant's Current Report on Form 8-K dated January 15, 2004, and incorporated herein by reference. | ||
Amendment to February 27, 2001 Co-Promotion and Distribution Agreement, dated as of January 14, 2004, between Registrant and Abbott Laboratories. Filed as an Exhibit to Registrant's Current Report on Form 8-K dated January 15, 2004, and incorporated herein by reference. | ||
Settlement and Release Agreement dated as of January 2, 2007 between ICU Medical, Inc. and Fulwider Patton Lee & Utecht, LLP. Filed as an Exhibit to Registrant's Annual Report on Form 10-K for the year ended December 31, 2006, and incorporated herein by reference. | ||
Executive officer compensation* | ||
Non-employee director compensation* | ||
2008 Performance-Based Incentive Plan, as amended.* Filed as Annex A to Registrant's proxy statement filed April 3, 2013, and incorporated herein by reference. | ||
Amendment No. 1 to 2001 Directors' Stock Option Plan.* Filed as an Exhibit to Registrant's Quarterly Report on Form 10-Q for the Quarter ended September 30, 2009, and incorporated herein by reference. | ||
Amendment No. 2 to 2001 Directors' Stock Option Plan.* Filed as an Exhibit to Registrant's Quarterly Report on Form 10-Q for the Quarter ended September 30, 2009, and incorporated herein by reference. | ||
Amendment No. 3 to 2001 Directors' Stock Option Plan.* Filed as an Exhibit to Registrant's Quarterly Report on Form 10-Q for the Quarter ended September 30, 2009, and incorporated herein by reference. | ||
93
ICU Medical, Inc. Amended 2011 Stock Incentive Plan.* Filed as an Exhibit to Registrant's Quarterly Report on Form 10-Q for the Quarter ended June 30, 2012, and incorporated herein by reference. | ||
2014 Inducement Stock Incentive Plan.* Filed as an Exhibit to Registrant's Current Report on Form 8-K filed February 26, 2014 and incorporated herein by reference. | ||
Executive Employment Agreement, dated as of February 7, 2014, by and between ICU Medical, Inc. and Vivek Jain.* Filed as an Exhibit to Registrant's Current Report on Form 8-K filed February 12, 2014, and incorporated herein by reference. | ||
Amendment to Executive Employment Agreement, dated as of February 12, 2014, by and between ICU Medical, Inc. and Vivek Jain.* Filed as an Exhibit to Registrant's Current Report on Form 8-K filed February 12, 2014, and incorporated herein by reference. | ||
Buy-Out Agreement between Registrant and George A. Lopez, M.D. effective September 30, 2015.* Filed as an Exhibit to Registrant's Current Report on Form 8-K filed October 1, 2015, and incorporated herein by reference. | ||
Form of Shareholder Agreement, by and between a subsidiary of Pfizer Inc. and ICU Medical Inc dated February 3, 2017. Filed as an Exhibit to Registrant’s Current Report on Form 8-K filed October 13, 2016, and incorporated herein by reference. | ||
ICU Medical, Inc. Executive Severance Plan.* Filed as an Exhibit to Registrant’s Current Report on Form 8-K filed January 6, 2017, and incorporated herein by reference. | ||
Senior Note issued by ICU Medical, Inc. in favor of Pfizer Inc., dated as of February 3, 2017. Filed as an Exhibit to Registrant’s Current Report on Form 8-K filed February 9, 2017, and incorporated herein by reference. | ||
Revolving Credit Agreement, dated as of November 8, 2017, among ICU Medical, Inc., as borrower, certain lenders party thereto and Wells Fargo Bank, N.A., as administrative agent and swingline lender. Filed as an Exhibit to Registrant's Quarterly Report on Form 10-Q for the Quarter ended September 30, 2017, and incorporated herein by reference. | ||
Transitional Services Agreement, between ICU Medical, Inc. and Pfizer Inc., dated as of February 3, 2017. Filed as an Exhibit to Registrant’s Current Report on Form 8-K filed February 9, 2017, and incorporated herein by reference. | ||
Amended and Restated Executive Employment Agreement, dated as of May 8, 2017, by and between ICU Medical, Inc. and Vivek Jain.* Filed as Exhibit 10.1 to Registrant's Current Report on Form 8-K filed on May 8, 2017, and incorporated herein by reference. | ||
Code of Business Conduct and Ethics for Directors and Officers. Filed as an Exhibit to Registrant's Current Report on Form 8-K filed February 5, 2009, and incorporated herein by reference. | ||
Subsidiaries of Registrant. | ||
Consent of Deloitte & Touche LLP | ||
Certification of Chief Executive Officer pursuant to Section 302 of the Sarbanes-Oxley Act of 2002 | ||
Certification of Chief Financial Officer pursuant to Section 302 of the Sarbanes-Oxley Act of 2002 | ||
Certifications of Chief Executive Officer and Chief Financial Officer pursuant to Section 906 of the Sarbanes-Oxley Act of 2002 | ||
94
Exhibit 101.INS | XBRL Instance Document | |
Exhibit 101.SCH | XBRL Taxonomy Extension Schema Document | |
Exhibit 101.CAL | XBRL Taxonomy Extension Calculation Linkbase Document | |
Exhibit 101.LAB | XBRL Taxonomy Extension Label Linkbase Document | |
Exhibit 101.PRE | XBRL Taxonomy Extension Presentation Linkbase Document | |
Exhibit 101.DEF | XBRL Taxonomy Extension Definition Linkbase Document | |
__________________________________________
*Executive compensation plan or other arrangement
95
SCHEDULE II
ICU MEDICAL, INC.
VALUATION AND QUALIFYING ACCOUNTS
Additions | ||||||||||||||||||||
(Amounts in thousands) Description | Balance at Beginning of Period | Charged to Costs and Expenses | Charged to Other Accounts | Write-off/ Disposals | Balance at End of Period | |||||||||||||||
For the year ended December 31, 2015: | ||||||||||||||||||||
Allowance for doubtful accounts | $ | 1,127 | $ | 54 | $ | 55 | $ | (135 | ) | $ | 1,101 | |||||||||
Warranty and return reserve - accounts receivable | $ | 481 | $ | 102 | $ | — | $ | — | $ | 583 | ||||||||||
Deferred tax asset valuation allowance | $ | — | $ | 2,354 | $ | — | $ | — | $ | 2,354 | ||||||||||
For the year ended December 31, 2016: | ||||||||||||||||||||
Allowance for doubtful accounts | $ | 1,101 | $ | — | $ | (24 | ) | $ | (4 | ) | $ | 1,073 | ||||||||
Warranty and return reserve - accounts receivable | $ | 583 | $ | 539 | $ | — | $ | — | $ | 1,122 | ||||||||||
Deferred tax asset valuation allowance | $ | 2,354 | $ | — | $ | — | $ | (2,354 | ) | $ | — | |||||||||
For the year ended December 31, 2017: | ||||||||||||||||||||
Allowance for doubtful accounts | $ | 1,073 | $ | 2,308 | $ | 90 | $ | (160 | ) | $ | 3,311 | |||||||||
Warranty and return reserve - accounts receivable | $ | 1,122 | $ | 604 | $ | — | $ | — | $ | 1,726 | ||||||||||
Deferred tax asset valuation allowance | $ | — | $ | 7,385 | $ | — | $ | — | $ | 7,385 | ||||||||||
96
SIGNATURE
Pursuant to the requirements of Section 13 or 15(d) of the Securities Exchange Act of 1934, Registrant has duly caused this report to be signed on its behalf by the undersigned, thereunto duly authorized.
ICU MEDICAL, INC. | ||
By: | /s/ Vivek Jain | |
Vivek Jain | ||
Chairman of the Board and Chief Executive Officer | ||
Dated: | March 16, 2018 | |
SIGNATURES
Pursuant to the requirements of the Securities Exchange Act of 1934, this report has been signed below by the following persons on behalf of Registrant and in the capacities and on the dates indicated.
Signature | Title | Date | ||
/s/ Vivek Jain | Chairman of the Board and | March 16, 2018 | ||
Vivek Jain | Chief Executive Officer | |||
(Principal Executive Officer) | ||||
/s/ Scott E. Lamb | Chief Financial Officer | March 16, 2018 | ||
Scott E. Lamb | (Principal Financial Officer) | |||
/s/ Kevin J. McGrody | Controller | March 16, 2018 | ||
Kevin J. McGrody | (Principal Accounting Officer) | |||
/s/ George A. Lopez, M.D. | Director | March 16, 2018 | ||
George A. Lopez, M.D. | ||||
/s/ Joseph R. Saucedo | Director | March 16, 2018 | ||
Joseph R. Saucedo | ||||
/s/ Robert S. Swinney, M.D. | Director | March 16, 2018 | ||
Robert S. Swinney, M.D. | ||||
/s/ David C. Greenberg | Director | March 16, 2018 | ||
David C. Greenberg | ||||
/s/ Elisha W. Finney | Director | March 16, 2018 | ||
Elisha W. Finney | ||||
/s/ Douglas E. Giordano | Director | March 16, 2018 | ||
Douglas E. Giordano | ||||
/s/ David F. Hoffmeister | Director | March 16, 2018 | ||
David F. Hoffmeister | ||||
/s/ Donald M. Abbey | Director | March 16, 2018 | ||
Donald M. Abbey | ||||
97