Attached files
| file | filename |
|---|---|
| EX-10.16 - EX-10.16 THIRD AMENDMENT TO CREDIT AGREEMENT - ICHOR HOLDINGS, LTD. | ichr-ex1016_297.htm |
| EX-32.2 - EX-32.2 SECTION 906 CFO CERTIFICATION - ICHOR HOLDINGS, LTD. | ichr-ex322_6.htm |
| EX-32.1 - EX-32.1 SECTION 906 CEO CERTIFICATION - ICHOR HOLDINGS, LTD. | ichr-ex321_7.htm |
| EX-31.2 - EX-31.2 SECTION 302 CFO CERTIFICATION - ICHOR HOLDINGS, LTD. | ichr-ex312_8.htm |
| EX-31.1 - EX-31.1 SECTION 302 CEO CERTIFICATION - ICHOR HOLDINGS, LTD. | ichr-ex311_9.htm |
| EX-23.1 - EX-23.1 CONSENT OF KPMG LLP - ICHOR HOLDINGS, LTD. | ichr-ex231_74.htm |
| EX-21.1 - EX-21.1 LIST OF SUBSIDIARIES - ICHOR HOLDINGS, LTD. | ichr-ex211_73.htm |
| EX-10.15 - EX-10.15 OFFER LETTER DATED NOVEMBER 9, 2017 - ICHOR HOLDINGS, LTD. | ichr-ex1015_100.htm |
| EX-10.14 - EX-10.14 OFFER LETTER DATED JULY 20, 2017 - ICHOR HOLDINGS, LTD. | ichr-ex1014_99.htm |
| EX-2.2 - EX-2.2 STOCK PURCHASE AGREEMENT, DATED AS OF DECEMBER 11, 201 - ICHOR HOLDINGS, LTD. | ichr-ex22_448.htm |
UNITED STATES
SECURITIES AND EXCHANGE COMMISSION
WASHINGTON, D. C. 20549
FORM 10‑K
(Mark One)
☒ ANNUAL REPORT PURSUANT TO SECTION 13 OR 15(d) OF THE SECURITIES EXCHANGE ACT OF 1934
For the fiscal year ended December 29, 2017
or
☐ TRANSITION REPORT PURSUANT TO SECTION 13 OR 15(d) OF THE SECURITIES EXCHANGE ACT OF 1934
For the transition period from to
Commission File Number 001‑37961
ICHOR HOLDINGS, LTD.
(Exact name of registrant as specified in its charter)
|
Cayman Islands |
|
001-37961 |
|
Not Applicable |
|
(State or other jurisdiction of incorporation) |
|
(Commission File Number) |
|
(IRS Employer Identification No.) |
3185 Laurelview Ct.
Fremont, California 94538
(Address of principal executive offices, including Zip Code)
(510) 897-5200
(Registrant's telephone number, including area code)
Not Applicable
(Former name or former address, if changed since last report)
|
Title of each class |
|
Name of exchange on which registered |
|
Ordinary Shares, $0.0001 par value |
|
The NASDAQ Stock Market, LLC |
Securities registered pursuant to Section 12(g) of the Act:
None
Indicate by check mark if the registrant is a well‑known seasoned issuer, as defined in Rule 405 of the Securities Act. Yes ☐ No ☒
Indicate by check mark if the registrant is not required to file reports pursuant to Section 13 or Section 15(d) of the Act. Yes ☐ No ☒
Indicate by check mark whether the registrant (1) has filed all reports required to be filed by Section 13 or 15(d) of the Securities Exchange Act of 1934 during the preceding 12 months (or for such shorter period that the registrant was required to file such reports), and (2) has been subject to such filing requirements for the past 90 days. Yes ☒ No ☐
Indicate by check mark whether the registrant has submitted electronically and posted on its corporate Web site, if any, every Interactive Data File required to be submitted and posted pursuant to Rule 405 of Regulation S‑T (§232.405 of this chapter) during the preceding 12 months (or for such shorter period that the registrant was required to submit and post such files). Yes ☒ No ☐
Indicate by check mark if disclosure of delinquent filers pursuant to Item 405 of Regulation S‑K (§229.405 of this chapter) is not contained herein, and will not be contained, to the best of registrant’s knowledge, in definitive proxy or information statements incorporated by reference in Part III of this Form 10‑K or any amendment to this Form 10‑K. ☐
Indicate by check mark whether the registrant is a large accelerated filer, an accelerated filer, a non‑accelerated filer, or a smaller reporting company. See the definitions of “large accelerated filer,” “accelerated filer” and “smaller reporting company” in Rule 12b‑2 of the Exchange Act.
|
Large accelerated filer |
☐ |
|
Accelerated filer |
☒ |
|
Non-accelerated filer |
☐ |
(Do not check if a smaller reporting company) |
Smaller reporting company |
☐ |
|
Emerging Growth Company |
☒ |
|
|
|
If an emerging growth company, indicate by check mark if the registrant has elected not to use the extended transition period for complying with any new or revised financial accounting standards provided pursuant to Section 13(a) of the Exchange Act. ☒
Indicate by check mark whether the registrant is a shell company (as defined in Rule 12b‑2 of the Act). Yes ☐ No ☒
There were 26,254,862 ordinary shares, $0.0001 par value, outstanding as of March 6, 2018. The aggregate market value of ordinary shares held by non-affiliates was $260,085,228 as of March 6, 2018.
DOCUMENTS INCORPORATED BY REFERENCE
The information required by Part III of Form 10‑K is incorporated herein by reference to the registrant’s definitive Proxy Statement relating to its 2018 General Meeting, which will be filed with the Securities and Exchange Commission within 120 days after the end of the registrant’s fiscal year.
|
|
Page |
|
|
PART I |
|
|
|
ITEM 1. |
1 |
|
|
ITEM 1A. |
9 |
|
|
ITEM 1B. |
25 |
|
|
ITEM 2. |
25 |
|
|
ITEM 3. |
25 |
|
|
ITEM 4. |
25 |
|
|
|
|
|
|
PART II |
|
|
|
ITEM 5. |
26 |
|
|
ITEM 6. |
28 |
|
|
ITEM 7. |
MANAGEMENT’S DISCUSSION AND ANALYSIS OF FINANCIAL CONDITION AND RESULTS OF OPERATIONS |
29 |
|
ITEM 7A. |
46 |
|
|
ITEM 8. |
47 |
|
|
ITEM 9. |
CHANGES IN AND DISAGREEMENTS WITH ACCOUNTANTS ON ACCOUNTING AND FINANCIAL DISCLOSURE |
47 |
|
ITEM 9A. |
47 |
|
|
ITEM 9B. |
48 |
|
|
|
|
|
|
PART III |
|
|
|
ITEM 10. |
48 |
|
|
ITEM 11. |
48 |
|
|
ITEM 12. |
SECURITY OWNERSHIP OF CERTAIN BENEFICIAL OWNERS AND MANAGEMENT AND RELATED SHAREHOLDER MATTERS |
48 |
|
ITEM 13. |
CERTAIN RELATIONSHIPS AND RELATED TRANSACTIONS, AND DIRECTOR INDEPENDENCE |
49 |
|
ITEM 14. |
49 |
|
|
|
|
|
|
PART IV |
|
|
|
ITEM 15. |
49 |
|
|
ITEM 16. |
49 |
|
|
EXHIBIT INDEX |
|
|
SIGNATURES |
|
|
|
|
CAUTIONARY STATEMENT CONCERNING FORWARD‑LOOKING STATEMENTS
This report contains forward-looking statements within the meaning of the federal securities laws. All statements other than statements of historical fact included in this report are forward-looking statements. These statements relate to analyses and other information, which are based on forecasts of future results and estimates of amounts not yet determinable. These statements also relate to our future prospects, developments and business strategies. These forward-looking statements are identified by the use of terms and phrases such as “anticipate,” “believe,” “could,” “estimate,” “expect,” “intend,” “may,” “plan,” “predict,” “project,” “will” and similar terms and phrases, including references to assumptions. However, these words are not the exclusive means of identifying such statements. These statements are contained in many sections of this report, including those entitled “Business” and “Management’s Discussion and Analysis of Financial Condition and Results of Operations.” Although we believe that our plans, intentions and expectations reflected in or suggested by such forward-looking statements are reasonable, we cannot assure you that we will achieve those plans, intentions or expectations. All forward-looking statements are subject to risks and uncertainties that may cause actual results to differ materially from those that we expected.
Important factors that could cause actual results to differ materially from our expectations, or cautionary statements, are disclosed under the sections entitled “Risk Factors” and “Management’s Discussion and Analysis of Financial Condition and Results of Operations” in this report. All written and oral forward-looking statements attributable to us, or persons acting on our behalf, are expressly qualified in their entirety by the cautionary statements contained in this report under the heading “Risk Factors,” as well as other cautionary statements that are made from time to time in our other filings with the Securities and Exchange Commission and public communications. You should evaluate all forward-looking statements made in this report in the context of these risks and uncertainties.
We caution you that the important factors referenced above may not contain all of the factors that are important to you. In addition, we cannot assure you that we will realize the results or developments we expect or anticipate or, even if substantially realized, that they will result in the consequences or affect us or our operations in the way we expect. The forward-looking statements included in this report are made only as of the date hereof. We undertake no obligation to publicly update or revise any forward-looking statement as a result of new information, future events or otherwise, except as otherwise required by law.
Unless expressly indicated or the context requires otherwise, the terms “Ichor,” “Company,” “we,” “us,” “our,” and similar terms in this report refer to Ichor Holdings, Ltd. and its consolidated subsidiaries.
We use a 52 or 53 week fiscal year ending on the last Friday in December. The years ended December 29, 2017, December 30, 2016, and December 25, 2015 were 52 weeks, 53 weeks, and 52 weeks, respectively. All references to 2017, 2016, and 2015 are references to fiscal years unless explicitly stated otherwise.
Company Overview
We are a leader in the design, engineering and manufacturing of critical fluid delivery subsystems and components for semiconductor capital equipment. Our product offerings include gas and chemical delivery subsystems, collectively known as fluid delivery subsystems, which are key elements of the process tools used in the manufacturing of semiconductor devices. Our gas delivery subsystems deliver, monitor and control precise quantities of the specialized gases used in semiconductor manufacturing processes such as etch and deposition. Our chemical delivery subsystems precisely blend and dispense the reactive liquid chemistries used in semiconductor manufacturing processes such as chemical-mechanical planarization, electroplating, and cleaning. We also manufacture precision machined components, weldments, and proprietary products for use in fluid delivery systems for direct sales to our customers. This vertically integrated portion of our business is primarily focused on metal and plastic parts that are used in gas and chemical systems, respectively.
Fluid delivery subsystems ensure accurate measurement and uniform delivery of specialty gases and chemicals at critical steps in the semiconductor manufacturing processes. Any malfunction or material degradation in fluid delivery reduces yields and increases the likelihood of manufacturing defects in these processes. Historically, semiconductor original equipment manufacturers, or OEMs, internally designed and manufactured the fluid delivery subsystems used in their process tools. Currently, most OEMs outsource all or a portion of the design, engineering and manufacturing of their gas delivery subsystems to a few specialized suppliers, including us. Additionally, many OEMs are also increasingly outsourcing the design, engineering and manufacturing of their chemical delivery subsystems due to the increased fluid expertise required to manufacture these subsystems. Outsourcing these subsystems has allowed OEMs to leverage the suppliers’ highly specialized engineering, design and production skills while focusing their internal resources on their own value-added processes. We believe that this outsourcing trend has enabled OEMs to reduce their fixed costs and development time, as well as provided significant growth opportunities for specialized subsystems suppliers like us.
Our goal is to be a leading supplier of outsourced fluid delivery subsystems and components to OEMs engaged in manufacturing capital equipment to produce semiconductors and to leverage our technology to expand our addressable markets. To achieve this goal, we engage with our customers early in their design and development processes and utilize our deep engineering resources and operating expertise to jointly create innovative and advanced solutions that meet the current and future needs of our customers. These collaborations frequently involve our engineers working at our customers’ sites and serving as an extension of our customers’ product design teams. We employ this approach with two of the largest manufacturers of semiconductor capital equipment in the world. We believe this approach enables us to design subsystems that meet the precise specifications our customers demand, allows us to often be the sole supplier of these subsystems during the initial production ramp and positions us to be the preferred supplier for the full five to ten-year lifespan of the process tool.
The broad technical expertise of our engineering team, coupled with our early customer engagement approach, enables us to offer innovative and reliable solutions to complex fluid delivery challenges. With two decades of experience developing complex fluid delivery subsystems and meeting the constantly changing production requirements of leading semiconductor OEMs, we have developed expertise in fluid delivery that we offer to our OEM customers. In addition, our capital efficient model and the integration of our business systems with those of our customers provides us the flexibility to fulfill increased demand and meet changing customer requirements with relatively low levels of capital expenditures. With an aim to superior customer service, we have a global footprint with many facilities strategically located in close proximity to our customers. We have long standing relationships with top tier OEM customers, including Lam Research and Applied Materials, which were our two largest customers by sales in 2017.
1
We grew our revenue from continuing operations by 62% to $655.9 million in 2017 from $405.7 million in 2016 (hereinafter, all references to “sales” or “revenue” relates to sales from continuing operations, unless explicitly stated otherwise). We generated net income from continuing operations of $56.9 million in 2017 and $20.8 million in 2016. We generated adjusted net income from continuing operations of $65.1 million in 2017 and $31.6 million in 2016. See Item 7 – Management's Discussion and Analysis of Financial Condition and Results of Operations, Non-GAAP Results for a discussion of adjusted net income from continuing operations, an accompanying presentation of the most directly comparable financial measure calculated in accordance with generally accepted accounting principles in the United States, net income from continuing operations, and a reconciliation of the differences between adjusted net income from continuing operations and net income from continuing operations.
Our Competitive Strengths
As a leader in the fluid delivery industry, we believe that our key competitive strengths include the following:
Deep Fluids Engineering Expertise
We believe that our engineering team, comprised of chemical engineers, mechanical engineers and software and systems engineers, has positioned us to expand the scope of our solutions, provide innovative subsystems and strengthen our incumbent position at our OEM customers. Many of our engineers are industry veterans and have spent a significant portion of their careers at our customers, bringing first-hand expertise and a heightened understanding of our customers’ needs. Our engineering team acts as an extension of our customers’ product development teams, providing our customers with technical expertise that is outside of their core competencies.
Early Engagement with Customers on Product Development
We seek to engage with our customers and potential customers very early in their process for new product development. We believe this approach enables us to collaborate on product design, qualification, manufacturing and testing in order to provide a comprehensive, customized solution. Through early engagement during the complex design stages, our engineering team gains early insight into our customers’ technology roadmaps which enables us to pioneer innovative and advanced solutions. In many cases our early engagement with our customers enables us to be the sole source supplier when the product is initially introduced.
Long History and Strong Relationships with Top Tier Customers
We have established deep relationships with top tier OEMs such as Lam Research and Applied Materials, which were our two largest customers by sales in 2017. Our customers are global leaders by sales in the increasingly concentrated semiconductor capital equipment industry. Our existing relationships with our customers have enabled us to effectively compete for new fluid delivery subsystems for our customers’ next generation products in development. We leverage our deep rooted existing customer relationships with these market leaders to penetrate new business opportunities created through industry consolidation. Our close collaboration with them has contributed to our established market position and several key supplier awards.
Operational Excellence with Scale to Support the Largest Customers
Over our 18 year history of designing and building gas delivery systems, we have developed deep capabilities in operations. We have strategically located our manufacturing facilities near our customers’ locations in order to provide fast and efficient responses to new product introductions, and accommodate configuration or design changes late in the manufacturing process. We also added significant capacity in our Singapore facility to support high volume products and will continue to add capacity as needed to support future growth. In addition to providing high quality and reliable fluid delivery subsystems, one of our principal strategies is delivering the lead-times that provide our customers the required flexibility needed in their production processes. We have accomplished this by investing in manufacturing systems and processes and an efficient supply chain. Our focus on operational efficiency and flexibility allows us to reduce manufacturing cycle times in order to respond quickly to customer requests and lead-times that are often less than four weeks.
2
Capital Efficient and Scalable Business Model
In general, our business is not capital intensive and we are able to grow sales with a low investment in property, plant and equipment. In 2017, 2016, and 2015, our total capital expenditures were $8.2 million, $4.3 million, and $1.4 million, respectively. The semiconductor capital equipment market has historically been cyclical. We have structured our business to minimize fixed manufacturing overhead and operating expenses to enable us to grow net income at a higher rate than sales during periods of growth. Conversely, our low fixed cost approach allows us to minimize the impact of cyclical downturns on our net income, but results in a lower level of gross margin leverage or improvement as a percentage of sales in times of increased demand. For example, from 2014 to 2017, sales grew at a compound annual growth rate, or CAGR, of 38% while adjusted net income from continuing operations grew at a CAGR of 77%. Conversely, our low fixed cost approach allows us to minimize the impact of cyclical downturns on our net income, but results in a smaller increase in gross margin as a percentage of sales in times of increased demand.
Our Growth Strategy
Our objective is to enhance our position as a leader in providing fluid delivery solutions, including subsystems, components, and tool refurbishment, to our customers by leveraging our core strengths. The key elements of our growth strategy are:
Grow Our Market Share within Existing Customer Base
We intend to grow our position with existing customers by continuing to leverage our specialized engineering talent and early collaboration approach with OEMs to foster long-term relationships. Each of our customers produces many different process tools for various process steps. At each customer, we are an outsourced supplier of fluid delivery subsystems for a subset of their entire process tool offerings. We are constantly looking to expand our market share at our existing customers. We believe that our early collaborative approach with customers positions us to deliver innovative and dynamic solutions, offer timely deployment and meet competitive cost targets, further enhancing our brand reputation. Through our recent acquisitions of a weldment company and a precision machining company completed in July and December 2017, respectively, as well as our 2016 acquisition of a plastic machining & fabrication company, we expanded our served market and entered the market for chemical delivery subsystems for wet process tools where we had only limited engagement in the past. Using this and our existing engineering capability, we developed a liquid delivery module and were qualified on a wet process equipment system at one of our two largest customers who is a market leader in this space.
Grow Our Total Available Market at Existing Customers with Expanded Product Offerings
We continue to work with our existing core customers on additional opportunities, including chemical delivery, one of our important potential growth areas. We believe that wet processes, clean and electro chemical deposition, or ECD, that require precise chemical delivery are currently an underpenetrated market opportunity for us. By leveraging our existing customer relationships and strong reputation in fluid mechanics, we intend to increase our chemical delivery module market share and introduce additional related products. Through our recent acquisitions of a weldment company and a precision machining company completed in July and December 2017, respectively, as well as our 2016 acquisition of a plastic machining & fabrication company, we expanded our served market and entered the market for chemical delivery subsystems. The acquisitions allow us to manufacture and assemble the complex plastic and metal products and precision machined components for the semiconductor equipment, aerospace, and general-industrial industries.
Expand Our Total Customer Base within Fluid Delivery Market
We have expanded our customer base and are currently a supplier for of gas delivery systems for a leading lithography system manufacturer in addition to a leading ALD system manufacturer. We continue to actively engage with new customers that are considering outsourcing their gas and chemical delivery needs.
Continue to Improve Our Manufacturing Process Efficiency
We continually strive to improve our processes to reduce our manufacturing process cycle time, improve our ability to respond to short lead-time and last minute configuration changes, reduce our manufacturing costs, and improve our inventory efficiency requirements in order to improve profitability and make our product offerings more attractive to new and existing customers.
3
We are a leader in the design, engineering and manufacturing of critical fluid delivery subsystems. Our product and service offerings are classified in the following categories:
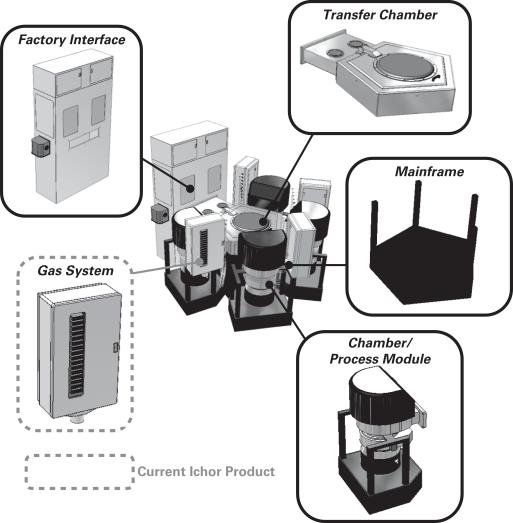
Gas Delivery Subsystems
Gas delivery is among the most technologically complex functions in semiconductor capital equipment and is used to deliver, monitor and control precise quantities of the vapors and gases critical to the manufacturing process. Our gas delivery systems consist of a number of gas lines, each controlled by a series of mass flow controllers, regulators, pressure transducers and valves, and an integrated electronic control system. Our gas delivery subsystems are primarily used in equipment for “dry” manufacturing processes, such as etch, chemical vapor deposition, physical vapor deposition, epitaxy and strip.
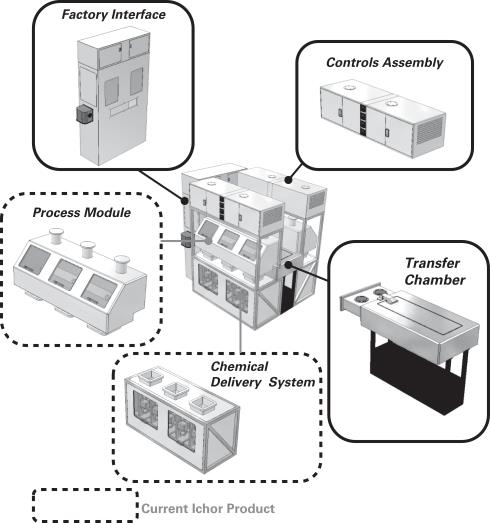
Chemical Delivery Subsystems
Our chemical delivery subsystems are used to precisely blend and dispense reactive chemistries and colloidal slurries critical to the specific “wet” front-end process, such as wet clean, electro chemical deposition (“ECD”), and chemical-mechanical planarization (“CMP”). In addition to the chemical delivery subsystem, we also develop the process modules that apply the various chemicals directly to the wafer in a process and application-unique manner to create the desired chemical reaction.
4
The image below shows a typical wet-process front end semiconductor tool, with a chemical delivery subsystem and corresponding application process module highlighted:
Weldments
Our complete offering of weldments support the delivery of fluids through the process tool. We have developed both automated and manual welding process to support world class workmanship on all types of metals needed to support fluid delivery within the semiconductor market. The welded assemblies are used in both wet and dry processes.
Precision Machining
Precision machining provides the ability to supply our customers with components used in our gas delivery systems and weldments, while also providing custom machined solutions throughout customers’ equipment. Many of these items are used downstream of the gas system and in process critical applications. Our precision machined products can be used in both wet and dry applications.
5
We were originally incorporated as Celerity, Inc. (“Celerity”) in 1999. Our business of designing and manufacturing critical systems for semiconductor capital equipment manufacturers operated as a stand-alone business until 2009 when Celerity sold the business to a private equity fund. Francisco Partners acquired the business in December 2011 and formed Ichor Holdings, Ltd., an exempt company incorporated in the Cayman Islands, in March 2012 to serve as the parent company as part of a restructuring to accommodate the expansion of our business in Singapore and Malaysia. In April 2012, we acquired Semi Scenic UK Limited to provide refurbishment services for legacy tools. In April 2016, we purchased Ajax for $17.6 million to add chemical delivery subsystem capabilities with existing customers. We completed the initial public offering of our ordinary shares in December 2016. In July 2017 we acquired Cal‑Weld, Inc. (“Cal‑Weld”) for $56.9 million to add to our gas delivery subsystem and weldment capabilities. In December 2017 we acquired Talon Innovations Corporation (“Talon”) for $137.0 million to add to our gas delivery subsystem, precision machining, and component manufacturing capabilities. We intend to continue to evaluate opportunistic acquisitions to supplement our organic growth.
Customers, Sales and Marketing
We market and sell our products directly to equipment OEMs in the semiconductor equipment market. We are dependent upon a small number of customers, as the semiconductor equipment manufacturer market is highly concentrated with four companies accounting for over 80% of all process tool revenues. For 2017, our two largest customers were Lam Research and Applied Materials, which accounted for 53% and 40% of sales, respectively. We do not have long-term contracts that require customers to place orders with us in fixed or minimum volumes, and we generally operate on a purchase order basis with customers.
Our sales and marketing efforts focus on fostering close business relationships with our customers. As a result, we locate many of our account managers near the customer they support. Our sales process involves close collaboration between our account managers and engineering and operations teams. Account managers and engineers work together with customers and in many cases provide on-site support, including attending customers’ internal meetings related to production and engineering design. Each customer project is supported by our account managers and customer support team, who ensure we are aligned with all of the customer’s quality, cost and delivery expectations.
Operations, Manufacturing and Supply Chain Management
We have developed a highly flexible manufacturing model with cost-effective locations situated nearby the manufacturing facilities of our largest customers. We have facilities in the United States, Singapore, Malaysia, and the United Kingdom.
Operations
Our product cycle engagements begin by working closely with our customers to outline the solution specifications before design and prototyping even begin. Our design and manufacturing process is highly flexible, enabling our customers to make alterations to their final requirements throughout the design, engineering and manufacturing process. This flexibility results in significantly decreased order-to-delivery cycle times for our customers. For instance, it can take as little as 20 to 30 days for us to manufacture a gas delivery system with fully evaluated performance metrics after receiving an order.
Manufacturing
We are ISO 9001 qualified at each of our manufacturing locations, and our manufactured subsystems and modules adhere to strict design tolerances and specifications. We operate Class 100 and Class 10,000 clean room facilities for customer-specified testing, assembly and integration of high-purity gas and chemical delivery systems at our locations in Singapore; Tualatin, Oregon; and Austin, Texas. We operate a facility in Malaysia; Tualatin, Oregon; and Fremont, California for weldments and related components used in our gas delivery subsystems and a facility in Union City, California for critical components used in our chemical delivery subsystems. We operate a facility in Sauk Rapids, Minnesota for precision machining of components for sale to our customers and internal use. Our facilities are located in close proximity to our largest customers to allow us to collaborate with them on a regular basis and to enable us to deliver our products on a just-in-time basis, regardless of order size or the degree of changes in the applicable configuration or specifications.
6
We qualify and test key components that are integrated into our subsystems, and test our fluid delivery subsystems during the design process and again prior to shipping. Our quality management system allows us to access real-time corrective action reports, non-conformance reports, customer complaints and controlled documentation. In addition, our senior management conducts quarterly reviews of our quality control system to evaluate effectiveness. Our customers also complete quarterly surveys which allow us to measure satisfaction.
Supply Chain Management
We use a wide range of components and materials in the production of our gas and chemical delivery systems, including filters, mass flow controllers, regulators, pressure transducers and valves. We obtain components and materials from a large number or sources, including single source and sole source suppliers. We use consignment material and just-in-time stocking programs to better manage our component inventories and better respond to changing customer requirements. These approaches enable us to significantly reduce our inventory levels and maintain flexibility in responding to changes in product demand.
In addition, a key part of our strategy is to identify multiple suppliers with a strong global reach that are located within close proximity to our manufacturing locations.
Technology Development and Engineering
We have a long history of engineering innovation and development. Over time, we have transitioned from being simply an integration engineering and components company into a gas and chemical delivery subsystem leader with complete system engineering and integration expertise. Our industry continues to experience rapid technological change, requiring us to continuously invest in technology and product development and to regularly introduce new products and features that meet our customers’ evolving requirements.
We have built a team of gas delivery experts, many of whom have previously worked for certain of our customers. As of December 29, 2017, our engineering team consisted of approximately 65 engineers and designers with mechanical, electrical, chemical, systems and software expertise. Our engineers are closely connected with our customers and typically work at our customers’ sites and operate as an extension of our customers’ design team. We engineer within our customers’ processes, design vaults, drawing standards and part numbering systems. These development efforts are designed to meet specific customer requirements in the areas of subsystem design, materials, component selection and functionality. The majority of our sales are generated from projects during which our engineers cooperated with our customer early in the design cycle. Through this early collaborative process, we become an integral part of our customers’ design and development processes, and we are able to quickly anticipate and respond to our customers’ changing requirements.
Our engineering team also works directly with our suppliers to help them identify new component technologies and make necessary changes in, and enhancements to, the components that we integrate into our products. Our analytical and testing capabilities enable us to evaluate multiple supplier component technologies and provide customers with a wide range of appropriate component and design choices for their gas and chemical delivery systems and other critical subsystems. Our analytical and testing capabilities also help us anticipate technological changes and the requirements in component features for next-generation gas delivery systems and other critical subsystems.
Competition
The markets for our products are very competitive. When we compete for new business, we face competition from other suppliers of gas or chemical delivery subsystems, as well as the internal manufacturing groups of OEMs. While many OEMs have outsourced the design and manufacture of their gas and chemical delivery systems, we would face additional competition if in the future these OEMs elected to develop these systems internally.
The gas delivery subsystem market is highly concentrated and we face competition primarily from Ultra Clean Technology, with limited competition from regional or specialized suppliers. The chemical delivery subsystem industry is fragmented and we face competition from numerous suppliers. In addition, the market for tool refurbishment is fragmented and we compete with many regional competitors. The primary competitive factors we emphasize include:
|
|
• |
early engagement with customers; |
|
|
• |
size and experience of engineering staff; |
7
|
|
• |
flexible manufacturing capabilities; and |
|
|
• |
customer relationships. |
We expect our competitors to continue to improve the performance of their current products and to introduce new products or new technologies that could adversely affect sales of our current and future products. In addition, the limited number of potential customers in our industry further intensifies competition. We anticipate that increased competitive pressures will cause intensified price-based competition and we may have to reduce the prices of our products. In addition, we expect to face new competitors as we enter new markets.
Intellectual Property
Our success depends, in part, upon our ability to maintain and protect our technology and products and to conduct our business without infringing the proprietary rights of others. We continue to invest in securing intellectual property protection for our technology and products and protect our technology by, among other things, filing patent applications. We also rely on a combination of trade secrets and confidentiality provisions, and to a much lesser extent, copyrights and trademarks, to protect our proprietary rights. We have historically focused our patent protection efforts in the United States. As of December 29, 2017, we held 33 patents, 16 of which were U.S. patents. While we consider our patents to be valuable assets, we do not believe the success of our business or our overall operations are dependent upon any single patent or group of related patents. In addition, we do not believe that the loss or expiration of any single patent or group of related patents would materially affect our business.
Intellectual property that we develop on behalf of our customers is generally owned exclusively by those customers. In addition, we have agreed to indemnify certain of our customers against claims of infringement of the intellectual property rights of others with respect to our products. Historically, we have not paid any claims under these indemnification obligations, and we do not have any pending indemnification claims against us.
Employees and Labor Relations
As of December 29, 2017, we had approximately 1,420 full‑time employees, 320 contract or temporary workers , and 20 part‑time employees, which allow flexibility as business conditions and geographic demand change. Of our total employees, approximately 65 are engineers, 60 are engaged in sales and marketing, 1,530 are engaged in manufacturing, and 100 perform executive and administrative functions. None of our employees are unionized, but in various countries, local law requires our participation in works councils. We have not experienced any material work stoppages at any of our facilities. We consider our relationship with our employees to be good.
Environmental, Health, and Safety Regulations
Our operations and facilities are subject to federal, state and local regulatory requirements and foreign laws and regulations, relating to environmental, waste management and health and safety matters, including those relating to the release, use, storage, treatment, transportation, discharge, disposal and remediation of contaminants, hazardous substances and wastes, as well as practices and procedures applicable to the construction and operation of our facilities. We believe that our business is operated in substantial compliance with applicable regulations. However, in the future we could incur substantial costs, including cleanup costs, fines or civil or criminal sanctions, or third-party property damage or personal injury claims, in the event of violations or liabilities under these laws and regulations, or non-compliance with the environmental permits required at our facilities. Potentially significant expenditures could be required in order to comply with environmental laws that may be adopted or imposed in the future. We are not aware of any threatened or pending environmental investigations, lawsuits or claims involving us, our operations or our current or former facilities.
Available Information
Our internet address is www.ichorsystems.com. We make a variety of information available, free of charge, at our Investor Relations website, ir.ichorsystems.com. This information includes our Annual Reports on Form 10‑K, our Quarterly Reports on Form 10‑Q, our Current Reports on Form 8‑K, and any amendments to those reports as soon as reasonably practicable after we electronically file those reports with or furnish them to the Securities and Exchange Commission (“SEC”), as well as our Code of Business Ethics and Conduct and other governance documents.
8
The public may read and copy materials filed by us with the Securities and Exchange Commission, or the SEC, at the SEC’s Public Reference Room at 100 F Street, NE Washington, DC 20549. The public may obtain information on the operation of the Public Reference Room by calling the SEC at 1‑800‑SEC‑0330. The SEC maintains an internet site that contains reports, proxy and information statements and other information regarding issuers that file documents electronically with the SEC at www.sec.gov.
The contents of these websites, or the information connected to those websites, are not incorporated into this report. References to websites in this report are provided as a convenience and do not constitute, and should not be viewed as, incorporation by reference of the information contained on, or available through, the website.
There are many factors that affect our business and the results of operations, some of which are beyond our control. The following is a description of some important factors that may cause the actual results of operations in future periods to differ materially from those currently expected or desired.
Risks Related to Our Business
Our business depends significantly on expenditures by manufacturers in the semiconductor capital equipment industry, which, in turn, is dependent upon the semiconductor device industry. When that industry experiences cyclical downturns, demand for our products and services is likely to decrease, which would likely result in decreased sales. We may also be forced to reduce our prices during cyclical downturns without being able to proportionally reduce costs.
Our business, financial condition and results of operations depend significantly on expenditures by manufacturers in the semiconductor capital equipment industry. In turn, the semiconductor capital equipment industry depends upon the current and anticipated market demand for semiconductor devices. The semiconductor device industry is subject to cyclical and volatile fluctuations in supply and demand and in the past has periodically experienced significant downturns, which often occur in connection with declines in general economic conditions, and which have resulted in significant volatility in the semiconductor capital equipment industry. The semiconductor device industry has also experienced recurring periods of over-supply of products that have had a severe negative effect on the demand for capital equipment used to manufacture such products. We have experienced, and anticipate that we will continue to experience, significant fluctuations in customer orders for our products and services as a result of such fluctuations and cycles. Any downturns in the semiconductor device industry could have a material adverse effect on our business, financial condition and results of operations.
In addition, we must be able to appropriately align our cost structure with prevailing market conditions, effectively manage our supply chain and motivate and retain employees, particularly during periods of decreasing demand for our products. We may be forced to reduce our prices during periods of decreasing demand. While we operate under a low fixed cost model, we may not be able to proportionally reduce all of our costs if we are required to reduce our prices. If we are not able to timely and appropriately adapt to the changes in our business environment, our business, financial condition and results of operations will be materially adversely affected. The cyclical and volatile nature of the semiconductor device industry and the absence of long-term fixed or minimum volume contracts make any effort to project a material reduction in future sales volume difficult.
We rely on a very small number of OEM customers for a significant portion of our sales. Any adverse change in our relationships with these customers could materially adversely affect our business, financial condition and results of operations.
The semiconductor capital equipment industry is highly concentrated and has experienced significant consolidation in recent years. As a result, a relatively small number of OEM customers have historically accounted for a significant portion of our sales, and we expect this trend to continue for the foreseeable future. For 2017, our top two customers accounted for approximately 53% and 40%, respectively, of sales, and we expect that our sales will continue to be concentrated among a very small number of customers. We do not have any long-term contracts that require customers to place orders with us in fixed or minimum volumes. Accordingly, the success of our business depends on the success of our customers and those customers and other OEMs continuing to outsource the manufacturing of critical subsystems and process solutions to us. Because of the small number of OEMs in the markets we serve, a number of which are already our customers, it would be difficult to replace lost sales resulting from the loss of, or the reduction, cancellation or delay in purchase orders by, any one of these customers, whether due to a reduction in the amount of outsourcing they do, their giving orders to our competitors, their acquisition by an OEM who is not a customer or with whom we do less business, or otherwise. We have in the past lost business from customers for a number of these reasons. If we are unable to replace sales from customers who reduce the volume of products and services they purchase from us or terminate their relationship with us entirely, such events could have a material adverse impact on our business, financial condition and results of operations.
9
Additionally, if one or more of the largest OEMs were to decide to single- or sole-source all or a significant portion of manufacturing and assembly work to a single equipment manufacturer, such a development would heighten the risks discussed above.
Our customers exert a significant amount of negotiating leverage over us, which may require us to accept lower prices and gross margins or increased liability risk in order to retain or expand our market share with them.
By virtue of our largest customers’ size and the significant portion of our sales that is derived from them, as well as the competitive landscape, our customers are able to exert significant influence and pricing pressure in the negotiation of our commercial arrangements and the conduct of our business with them. Our customers often require reduced prices or other pricing, quality or delivery commitments as a condition to their purchasing from us in any given period or increasing their purchase volume, which can, among other things, result in reduced gross margins in order to maintain or expand our market share. Our customers’ negotiating leverage also can result in customer arrangements that may contain significant liability risk to us. For example, some of our customers require that we provide them indemnification against certain liabilities in our arrangements with them, including claims of losses by their customers caused by our products. Any increase in our customers’ negotiating leverage may expose us to increased liability risk in our arrangements with them, which, if realized, may have a material adverse effect on our business, financial condition and results of operations. In addition, new products often carry lower gross margins than existing products for several quarters following their introduction. If we are unable to retain and expand our business with our customers on favorable terms, or if we are unable to achieve gross margins on new products that are similar to or more favorable than the gross margins we have historically achieved, our business, financial condition and results of operations may be materially adversely affected.
The industries in which we participate are highly competitive and rapidly evolving, and if we are unable to compete effectively, our business, financial condition and results of operations could be materially adversely affected.
We face intense competition from other suppliers of gas or chemical delivery subsystems, as well as the internal manufacturing groups of OEMs. Increased competition has in the past resulted, and could in the future result, in price reductions, reduced gross margins or loss of market share, any of which would materially adversely affect our business, financial condition and results of operations. We are subject to significant pricing pressure as we attempt to maintain and increase market share with our existing customers. Our competitors may offer reduced prices or introduce new products or services for the markets currently served by our products and services. These products may have better performance, lower prices and achieve broader market acceptance than our products. OEMs also typically own the design rights to their products. Further, if our competitors obtain proprietary rights to these designs such that we are unable to obtain the designs necessary to manufacture products for our OEM customers, our business, financial condition and results of operations could be materially adversely affected.
Certain of our competitors may have or may develop greater financial, technical, manufacturing and marketing resources than we do. As a result, they may be able to respond more quickly to new or emerging technologies and changes in customer requirements, devote greater resources to the development, promotion, sale and support of their products and services, and reduce prices to increase market share. In addition to organic growth by our competitors, there may be merger and acquisition activity among our competitors and potential competitors that may provide our competitors and potential competitors with an advantage over us by enabling them to expand their product offerings and service capabilities to meet a broader range of customer needs. The introduction of new technologies and new market entrants may also increase competitive pressures.
10
We are exposed to risks associated with weakness in the global economy and geopolitical instability.
Our business is dependent upon manufacturers of semiconductor capital equipment, whose businesses in turn ultimately depend largely on consumer spending on semiconductor devices. Continuing uncertainty regarding the global economy continues to pose challenges to our business. Economic uncertainty and related factors, including current unemployment levels, uncertainty in European debt markets, geopolitical instability in various parts of the world, fiscal uncertainty in the U.S. economy, market volatility and the slow rate of recovery of many countries from recent recessions, exacerbate negative trends in business and consumer spending and may cause certain of our customers to push out, cancel or refrain from placing orders for products or services, which may reduce sales and materially adversely affect our business, financial condition and results of operations. Difficulties in obtaining capital, uncertain market conditions or reduced profitability may also cause some customers to scale back operations, exit businesses, merge with other manufacturers, or file for bankruptcy protection and potentially cease operations, leading to customers’ reduced research and development funding and/or capital expenditures and, in turn, lower orders from our customers and/or additional slow moving or obsolete inventory or bad debt expense for us. These conditions may also similarly affect our key suppliers, which could impair their ability to deliver parts and result in delays for our products or require us to either procure products from higher-cost suppliers, or if no additional suppliers exist, to reconfigure the design and manufacture of our products, and we may be unable to fulfill some customer orders. Any of these conditions or events could have a material adverse effect on our business, financial condition and results of operations.
If we do not keep pace with developments in the industries we serve and with technological innovation generally, our products and services may not be competitive.
Rapid technological innovation in the markets we serve requires us to anticipate and respond quickly to evolving customer requirements and could render our current product offerings, services and technologies obsolete. In particular, the design and manufacturing of semiconductors is constantly evolving and becoming more complex in order to achieve greater power, performance and efficiency with smaller devices. Capital equipment manufacturers need to keep pace with these changes by refining their existing products and developing new products.
We believe that our future success will depend upon our ability to design, engineer and manufacture products that meet the changing needs of our customers. This requires that we successfully anticipate and respond to technological changes in design, engineering and manufacturing processes in a cost-effective and timely manner. If we are unable to integrate new technical specifications into competitive product designs, develop the technical capabilities necessary to manufacture new products or make necessary modifications or enhancements to existing products, our business, financial condition and results of operations could be materially adversely affected.
The timely development of new or enhanced products is a complex and uncertain process which requires that we:
|
|
• |
design innovative and performance-enhancing features that differentiate our products from those of our competitors; |
|
|
• |
identify emerging technological trends in the industries we serve, including new standards for our products; |
|
|
• |
accurately identify and design new products to meet market needs; |
|
|
• |
collaborate with OEMs to design and develop products on a timely and cost-effective basis; |
|
|
• |
ramp-up production of new products, especially new subsystems, in a timely manner and with acceptable yields; |
|
|
• |
manage our costs of product development and the costs of producing the products that we sell; |
|
|
• |
successfully manage development production cycles; and |
|
|
• |
respond quickly and effectively to technological changes or product announcements by others. |
If we are unsuccessful in keeping pace with technological developments for the reasons above or other reasons, our business, financial condition and results of operations could be materially adversely affected.
11
We must design, develop and introduce new products that are accepted by OEMs in order to retain our existing customers and obtain new customers.
The introduction of new products is inherently risky because it is difficult to foresee the adoption of new standards, coordinate our technical personnel and strategic relationships and win acceptance of new products by OEMs. We attempt to mitigate this risk by collaborating with our customers during their design and development processes. We cannot, however, assure you that we will be able to successfully introduce, market and cost-effectively manufacture new products, or that we will be able to develop new or enhanced products and processes that satisfy customer needs. In addition, new capital equipment typically has a lifespan of five to ten years, and OEMs frequently specify which systems, subsystems, components and instruments are to be used in their equipment. Once a specific system, subsystem, component or instrument is incorporated into a piece of capital equipment, it will often continue to be purchased for that piece of equipment on an exclusive basis for 18 to 24 months before the OEM generates enough sales volume to consider adding alternative suppliers. Accordingly, it is important that our products are designed into the new systems introduced by the OEMs. If any of the new products we develop are not launched or successful in the market, our business, financial condition and results of operations could be materially adversely affected.
The manufacturing of our products is highly complex, and if we are not able to manage our manufacturing and procurement process effectively, our business, financial condition and results of operations may be materially adversely affected.
The manufacturing of our products is a highly complex process that involves the integration of multiple components and requires effective management of our supply chain while meeting our customers’ design-to-delivery cycle time requirements. Through the course of the manufacturing process, our customers may modify design and system configurations in response to changes in their own customers’ requirements. In order to rapidly respond to these modifications and deliver our products to our customers in a timely manner, we must effectively manage our manufacturing and procurement process. If we fail to manage this process effectively, we risk losing customers and damaging our reputation. We may also be subject to liability under our agreements with our customers if we or our suppliers fail to re- configure manufacturing processes or components in response to these modifications. In addition, if we acquire inventory in excess of demand or that does not meet customer specifications, we could incur excess or obsolete inventory charges. We have from time to time experienced bottlenecks and production difficulties that have caused delivery delays and quality control problems. These risks are even greater as we seek to expand our business into new subsystems. In addition, certain of our suppliers have been, and may in the future be, forced out of business as a result of the economic environment. In such cases, we may be required to procure products from higher-cost suppliers or, if no additional suppliers exist, reconfigure the design and manufacture of our products. This could materially limit our growth, adversely impact our ability to win future business and have a material adverse effect on our business, financial condition and results of operations.
Defects in our products could damage our reputation, decrease market acceptance of our products and result in potentially costly litigation.
A number of factors, including design flaws, material and component failures, contamination in the manufacturing environment, impurities in the materials used and unknown sensitivities to process conditions, such as temperature and humidity, as well as equipment failures, may cause our products to contain undetected errors or defects. Errors, defects or other problems with our products may:
|
|
• |
cause delays in product introductions and shipments; |
|
|
• |
result in increased costs and diversion of development resources; |
|
|
• |
cause us to incur increased charges due to unusable inventory; |
|
|
• |
require design modifications; |
|
|
• |
result in liability for the unintended release of hazardous materials; |
|
|
• |
create claims for rework, replacement and/or damages under our contracts with customers, as well as indemnification claims from customers; |
|
|
• |
decrease market acceptance of, or customer satisfaction with, our products, which could result in decreased sales and increased product returns; or |
|
|
• |
result in lower yields for semiconductor manufacturers. |
12
If any of our products contain defects or have reliability, quality or compatibility problems, our reputation may be damaged and customers may be reluctant to buy our products. We may also face a higher rate of product defects as we increase our production levels in periods of significant growth. Product defects could result in warranty and indemnification liability or the loss of existing customers or impair our ability to attract new customers. In addition, we may not find defects or failures in our products until after they are installed in a manufacturer’s fabrication facility. We may have to invest significant capital and other resources to correct these problems. Our current or potential customers also might seek to recover from us any losses resulting from defects or failures in our products. In addition, hazardous materials flow through and are controlled by certain of our products and an unintended release of these materials could result in serious injury or death. Liability claims could require us to spend significant time and money in litigation or pay significant damages.
We may incur unexpected warranty and performance guarantee claims that could materially adversely affect our business, financial condition and results of operations.
In connection with our products and services, we provide various product warranties, performance guarantees and indemnification rights. Warranty or other performance guarantee or indemnification claims against us could cause us to incur significant expense to repair or replace defective products or indemnify the affected customer for losses. In addition, quality issues can have various other ramifications, including delays in the recognition of sales, loss of sales, loss of future sales opportunities, increased costs associated with repairing or replacing products, and a negative impact on our reputation, all of which could materially adversely affect our business, financial condition and results of operations.
Our dependence on a limited number of suppliers may harm our production output and increase our costs, and may prevent us from delivering acceptable products on a timely basis.
Our ability to meet our customers’ demand for our products depends upon obtaining adequate supplies of quality components and other raw materials on a timely basis. In addition, our customers often specify components from particular suppliers that we must incorporate into our products. We also use consignment and just-in-time stocking programs, which means we carry very little inventory of components or other raw materials, and we rely on our suppliers to deliver necessary components and raw materials in a timely manner. However, our suppliers are under no obligation to provide us with components or other raw materials. As a result, the loss of or failure to perform by any of our key suppliers could materially adversely affect our ability to deliver products on a timely basis. In addition, if a supplier was unable to provide the volume of components we require on a timely basis and at acceptable prices and quality, we would have to identify and qualify replacements from alternative sources of supply. However, the process of qualifying new suppliers for complex components is also lengthy and could delay our production. We may also experience difficulty in obtaining sufficient supplies of components and raw materials in times of significant growth in our business. If we are unable to procure sufficient quantities of components or raw materials from suppliers, our customers may elect to delay or cancel existing orders or not place future orders, which could have a material adverse effect on our business, financial condition and results of operations.
We are subject to order and shipment uncertainties, and any significant reductions, cancellations or delays in customer orders could have a material adverse effect on our business, financial condition and results of operations.
Our sales are difficult to forecast because we generally do not have a material backlog of unfilled orders and because of the short time frame within which we are often required to manufacture and deliver products to our customers. Most of our sales for a particular quarter depend on customer orders placed during that quarter or shortly before it commences. Our contracts generally do not require our customers to commit to minimum purchase volumes. While most of our customers provide periodic rolling forecasts for product orders, those forecasts do not become binding until a formal purchase order is submitted, which generally occurs only a short time prior to shipment. As a result of the foregoing and the cyclicality and volatility of the industries we serve, it is difficult to predict future orders with precision. Occasionally, we order component inventory and build products in advance of the receipt of actual customer orders. Customers may cancel order forecasts, change production quantities from forecasted volumes or delay production for reasons beyond our control. Furthermore, reductions, cancellations or delays in customer order forecasts usually occur without penalty to, or compensation from, the customer. Reductions, cancellations or delays in forecasted orders could cause us to hold inventory longer than anticipated, which could reduce our gross profit, restrict our ability to fund our operations and result in unanticipated reductions or delays in sales. If we do not obtain orders as we anticipate, we could have excess components for a specific product and/or finished goods inventory that we would not be able to sell to another customer, likely resulting in inventory write-offs, which could have a material adverse effect on our business, financial condition and results of operations.
13
Because our customers generally require that they qualify our engineering, documentation, manufacturing and quality control procedures, our ability to add new customers quickly is limited.
We are generally required to qualify and maintain our status as a supplier for each of our customers. This is a time-consuming process that involves the inspection and approval by a customer of our engineering, documentation, manufacturing and quality control procedures before that customer will place orders with us. Our ability to lessen the adverse effect of any loss of, or reduction in sales to, an existing customer through the rapid addition of one or more new customers is limited in part because of these qualification requirements. Consequently, the risk that our business, financial condition and results of operations would be materially adversely affected by the loss of, or any reduction in orders by, any of our significant customers is increased. Moreover, if we lost our existing status as a qualified supplier to any of our customers, such customer could cancel its orders from us or otherwise terminate its relationship with us, which could have a material adverse effect on our business, financial condition and results of operations.
We may be subject to interruptions or failures in our information technology systems.
We rely on our information technology systems to process transactions, summarize our operating results and manage our business. Our information technology systems are subject to damage or interruption from power outages, computer and telecommunications failures, computer viruses, cyber-attack or other security breaches, catastrophic events, such as fires, floods, earthquakes, tornadoes, hurricanes, acts of war or terrorism, and usage errors by our employees. If our information technology systems are damaged or cease to function properly, we may have to make a significant investment to fix or replace them, and we may suffer loss of critical data and interruptions or delays in our operations.
We may be the target of attempted cyber attacks, computer viruses, malicious code, phishing attacks, denial of service attacks and other information security threats. To date, cyber attacks have not had a material impact on our financial condition, results or business; however, we could suffer material financial or other losses in the future and we are not able to predict the severity of these attacks. Our risk and exposure to these matters remains heightened because of, among other things, the evolving nature of these threats, the current global economic and political environment, our prominent size and scale and our role in the financial services industry, the outsourcing of some of our business operations, the ongoing shortage of qualified cyber security professionals, and the interconnectivity and interdependence of third parties to our systems. The occurrence of a cyber attack, breach, unauthorized access, misuse, computer virus or other malicious code or other cyber security event could jeopardize or result in the unauthorized disclosure, gathering, monitoring, misuse, corruption, loss or destruction of confidential and other information that belongs to us, our customers, our counterparties, third-party service providers or borrowers that is processed and stored in, and transmitted through, our computer systems and networks. The occurrence of such an event could also result in damage to our software, computers or systems, or otherwise cause interruptions or malfunctions in our, our customers’, our counterparties’ or third parties’ operations. This could result in significant losses, loss of customers and business opportunities, reputational damage, litigation, regulatory fines, penalties or intervention, reimbursement or other compensatory costs, or otherwise adversely affect our business, financial condition or results of operations.
The reliability and capacity of our information technology systems is critical to our operations and the implementation of our growth initiatives. Any material disruption in our information technology systems, or delays or difficulties in implementing or integrating new systems or enhancing current systems, could have an adverse effect on our business, and results of operations.
Restrictive covenants under our Credit Facilities may limit our current and future operations. If we fail to comply with those covenants, the lenders could cause outstanding amounts, which are currently substantial, to become immediately due and payable, and we might not have sufficient funds and assets to pay such loans.
As of December 29, 2017, we had $179.5 million of indebtedness outstanding under our term loan facility, or our Term Loan Facility, and $10.0 million of indebtedness outstanding under our revolving credit facility, or our Revolving Credit Facility, and together with our Term Loan Facility, our Credit Facilities. The outstanding amount of our Credit Facilities reflected in our consolidated financial statements included elsewhere in this report on Form 10-K is net of $2.8 million of debt issuance costs. On February 14, 2018, we amended and restated the credit agreement governing our Credit Facilities resulting in a $175.0 million Term Loan Facility and a Revolving Credit Facility enabling borrowing up to $125.0 million. We may incur additional indebtedness in the future. Our Credit Facilities contain certain restrictive covenants and conditions, including limitations on our ability to, among other things:
|
|
• |
incur additional indebtedness or contingent obligations; |
|
|
• |
create or incur liens, negative pledges or guarantees; |
|
|
• |
make investments; |
|
|
• |
make loans; |
14
|
|
• |
merge, consolidate or sell substantially all of our assets; |
|
|
• |
make certain payments on indebtedness; |
|
|
• |
pay dividends on or make distributions in respect of capital stock or make certain other restricted payments or investments; |
|
|
• |
enter into certain agreements that restrict distributions from restricted subsidiaries; |
|
|
• |
enter into transactions with affiliates; |
|
|
• |
change the nature of our business; and |
|
|
• |
amend the terms of our organizational documents. |
As a result of these covenants, we may be restricted in our ability to pursue new business opportunities or strategies or to respond quickly to changes in the industries that we serve. A violation of any of these covenants would be deemed an event of default under our Credit Facilities. In such event, upon the election of the lenders, the loan commitments under our Credit Facilities would terminate and the principal amount of the loans and accrued interest then outstanding would be due and payable immediately. A default may also result in the acceleration of any other debt to which a cross-acceleration or cross-default provision applies. In the event our lenders accelerate the repayment of our borrowings, we cannot assure you that we and our subsidiaries would have sufficient funds to repay such indebtedness or be able to obtain replacement financing on a timely basis or at all. These events could force us into bankruptcy or liquidation, which could have a material adverse effect on our business, financial condition and results of operations.
We also may need to negotiate changes to the covenants in the agreements governing our Credit Facilities in the future if there are material changes in our business, financial condition or results of operations, but we cannot assure you that we will be able to do so on terms favorable to us or at all.
Certain of our customers require that we consult with them in connection with specified fundamental changes in our business, and address any concerns or requests such customer may have in connection with a fundamental change. While those customers do not have contractual approval or veto rights with respect to fundamental changes, our failure to consult with such customers or to satisfactorily respond to their requests in connection with any such fundamental change could constitute a breach of contract or otherwise be detrimental to our relationships with such customers.
Certain of our key customers require that we consult with them in connection with specified fundamental changes in our business, including, among other things:
|
|
• |
entering into any new line of business; |
|
|
• |
amending or modifying our organizational documents; |
|
|
• |
selling all or substantially all of our assets, or merging or amalgamating with a third party; |
|
|
• |
incur borrowings in excess of a specific amount; |
|
|
• |
making senior management changes; |
|
|
• |
entering into any joint venture arrangement; and |
|
|
• |
effecting an initial public offering. |
These customers do not have contractual approval or veto rights with respect to any fundamental changes in our business. However, our failure to consult with such customers or to satisfactorily respond to their requests in connection with any such fundamental change could constitute a breach of contract or otherwise be detrimental to our relationships with such customers, which could have a material adverse effect on our business, financial condition and results of operations.
15
We may not be able to generate sufficient cash to service all of our indebtedness, including under our Credit Facilities, and may be forced to take other actions to satisfy our obligations under our indebtedness, which may not be successful.
Our ability to make scheduled payments on or to refinance our indebtedness, including under our Credit Facilities, depends on our financial condition and results of operations, which are subject to prevailing economic and competitive conditions and other factors beyond our control. We may be unable to maintain a level of cash flows from operating activities sufficient to permit us to fund our day-to-day operations or to pay the principal, premium, if any, and interest on our indebtedness. If our cash flows and capital resources are insufficient to fund our debt service obligations, we could face substantial liquidity problems and could be forced to reduce or delay investments and capital expenditures or to sell assets or operations, seek additional capital or restructure or refinance our indebtedness. If we cannot make scheduled payments on our debt, we will be in default and, as a result, the lenders under our Credit Facilities could terminate their commitments to loan money, or foreclose against the assets securing such borrowings, and we could be forced into bankruptcy or liquidation, in each case, which would have a material adverse effect on our business, financial condition and results of operations.
Our business is largely dependent on the know-how of our employees, and we generally do not have an intellectual property position that is protected by patents.
We believe that the success of our business depends in part on our proprietary technology, information, processes and know-how and on our ability to operate without infringing on the proprietary rights of third parties. We rely on a combination of trade secrets and contractual confidentiality provisions and, to a much lesser extent, patents, copyrights and trademarks to protect our proprietary rights. Accordingly, our intellectual property position is more vulnerable than it would be if it were protected primarily by patents. We cannot assure you that we have adequately protected or will be able to adequately protect our technology, that our competitors will not be able to utilize our existing technology or develop similar technology independently, that the claims allowed with respect to any patents held by us will be broad enough to protect our technology or that foreign intellectual property laws will adequately protect our intellectual property rights. If we fail to protect our proprietary rights successfully, our competitive position could suffer. Any future litigation to enforce patents issued to us, to protect trade secrets or know-how possessed by us or to defend ourselves or to indemnify others against claimed infringement of the rights of others could have a material adverse effect on our business, financial condition and results of operations.
Third parties have claimed and may in the future claim we are infringing their intellectual property, which could subject us to litigation or licensing expenses, and we may be prevented from selling our products if any such claims prove successful.
We may in the future receive claims that our products, processes or technologies infringe the patents or other proprietary rights of third parties. In addition, we may be unaware of intellectual property rights of others that may be applicable to our products. Any litigation regarding our patents or other intellectual property could be costly and time-consuming and divert our management and key personnel from our business operations, any of which could have a material adverse effect on our business, financial condition and results of operations. The complexity of the technology involved in our products and the uncertainty of intellectual property litigation increase these risks. Claims of intellectual property infringement may also require us to enter into costly license agreements. However, we may not be able to obtain licenses on terms acceptable to us, or at all. We also may be subject to significant damages or injunctions against the development, manufacture and sale of certain of our products if any such claims prove successful. We also rely on design specifications and other intellectual property of our customers in the manufacture of products for such customers. While our customer agreements generally provide for indemnification of us by a customer if we are subjected to litigation for third-party claims of infringement of such customer’s intellectual property, such indemnification provisions may not be sufficient to fully protect us from such claims, or our customers may breach such indemnification obligations to us, which could result in costly litigation to defend against such claims or enforce our contractual rights to such indemnification.
From time to time, we may become involved in other litigation and regulatory proceedings, which could require significant attention from our management and result in significant expense to us and disruptions in our business.
In addition to any litigation related to our intellectual property rights, we may in the future be named as a defendant from time to time in other lawsuits and regulatory actions relating to our business, such as commercial contract claims, employment claims and tax examinations, some of which may claim significant damages or cause us reputational harm. Due to the inherent uncertainties of litigation and regulatory proceedings, we cannot predict the ultimate outcome of any such proceeding. An unfavorable outcome could have a material adverse effect on our business, financial condition and results of operations or limit our ability to engage in certain of our business activities. In addition, regardless of the outcome of any litigation or regulatory proceeding, such proceedings are often expensive, time-consuming and disruptive to normal business operations and require significant attention from our management. As a result, any such lawsuits or proceedings could materially adversely affect our business, financial condition and results of operations.
16
The technology labor market is very competitive, and our business will suffer if we are unable to hire and retain key personnel.
Our future success depends in part on the continued service of our key executive officers, as well as our research, engineering, sales and manufacturing personnel, most of whom are not subject to employment or non-competition agreements. Competition for qualified personnel in the technology industry is particularly intense, and we operate in geographic locations in which labor markets are competitive. Our management team has significant industry experience and deep customer relationships, and therefore would be difficult to replace. In addition, our business is dependent to a significant degree on the expertise and relationships which only a limited number of engineers possess. Many of these engineers often work at our customers’ sites and serve as an extension of our customers’ product design teams. The loss of any of our key executive officers or key engineers and other personnel, including our engineers working at our customers’ sites, or the failure to attract additional personnel as needed, could have a material adverse effect on our business, financial condition and results of operations and could lead to higher labor costs, the use of less-qualified personnel and the loss of customers. In addition, if any of our key executive officers or other key employees were to join a competitor or form a competing company, we could lose customers, suppliers, know-how and key personnel.
We do not maintain key-man life insurance with respect to any of our employees. Our business will suffer if we are unable to attract, employ and retain highly skilled personnel.
Future acquisitions may present integration challenges, and if the goodwill, indefinite-lived intangible assets and other long-term assets recorded in connection with such acquisitions become impaired, we would be required to record impairment charges, which may be significant.
We have acquired strategic businesses in the past and if we find appropriate opportunities in the future, we may acquire businesses, products or technologies that we believe are strategic. The process of integrating an acquired business, product or technology may produce unforeseen operating difficulties and expenditures, fail to result in expected synergies or other benefits and absorb significant attention of our management that would otherwise be available for the ongoing development of our business. In addition, we may record a portion of the assets we acquire as goodwill, other indefinite-lived intangible assets or finite-lived intangible assets. We do not amortize goodwill and indefinite-lived intangible assets, but rather review them for impairment on an annual basis or whenever events or changes in circumstances indicate that their carrying value may not be recoverable. The recoverability of goodwill and indefinite-lived intangible assets is dependent on our ability to generate sufficient future earnings and cash flows. Changes in estimates, circumstances or conditions, resulting from both internal and external factors, could have a significant impact on our fair valuation determination, which could then have a material adverse effect on our business, financial condition and results of operations.
Our quarterly sales and operating results fluctuate significantly from period to period, and this may cause volatility in our share price.
Our quarterly sales and operating results have fluctuated significantly in the past, and we expect them to continue to fluctuate in the future for a variety of reasons, including the following:
|
|
• |
demand for and market acceptance of our products as a result of the cyclical nature of the industries we serve or otherwise, often resulting in reduced sales during industry downturns and increased sales during periods of industry recovery or growth; |
|
|
• |
overall economic conditions; |
|
|
• |
changes in the timing and size of orders by our customers; |
|
|
• |
strategic decisions by our customers to terminate their outsourcing relationship with us or give market share to our competitors; |
|
|
• |
consolidation by our customers; |
|
|
• |
cancellations and postponements of previously placed orders; |
|
|
• |
pricing pressure from either our competitors or our customers, resulting in the reduction of our product prices or loss of market share; |
|
|
• |
disruptions or delays in the manufacturing of our products or in the supply of components or raw materials that are incorporated into or used to manufacture our products, thereby causing us to delay the shipment of products; |
|
|
• |
decreased margins for several or more quarters following the introduction of new products, especially as we introduce new subsystems or other products or services; |
17
|
|
• |
inability to reduce our costs quickly in step with reductions in our prices or in response to decreased demand for our products; |
|
|
• |
changes in our mix of products sold; |
|
|
• |
write-offs of excess or obsolete inventory; |
|
|
• |
one-time expenses or charges; and |
|
|
• |
announcements by our competitors of new products, services or technological innovations, which may, among other things, render our products less competitive. |
As a result of the foregoing, we believe that quarter-to-quarter comparisons of our sales and results of operations may not be meaningful and that these comparisons may not be an accurate indicator of our future performance. Changes in the timing or terms of a small number of transactions could disproportionately affect our results of operations in any particular quarter. Moreover, our results of operations in one or more future quarters may fail to meet our guidance or the expectations of securities analysts or investors. If this occurs, we would expect to experience an immediate and significant decline in the trading price of our ordinary shares.
Labor disruptions could materially adversely affect our business, financial condition and results of operations.
As of December 29, 2017, we had approximately 1,420 full time employees, 320 contract or temporary workers, and 20 part‑time employees worldwide. None of our employees are unionized, but in various countries, local law requires our participation in works councils. While we have not experienced any material work stoppages at any of our facilities, any stoppage or slowdown could cause material interruptions in manufacturing, and we cannot assure you that alternate qualified capacity would be available on a timely basis, or at all. As a result, labor disruptions at any of our facilities could materially adversely affect our business, financial condition and results of operations.
As a global company, we are subject to the risks of doing business internationally, including periodic foreign economic downturns and political instability, which may adversely affect our sales and cost of doing business in those regions of the world.
Foreign economic downturns have adversely affected our business and results of operations in the past and could adversely affect our business and results of operations in the future. In addition, other factors relating to the operation of our business outside of the United States may have a material adverse effect on our business, financial condition and results of operations in the future, including:
|
|
• |
the imposition of governmental controls or changes in government regulations, including tax regulations; |
|
|
• |
difficulties in enforcing our intellectual property rights; |
|
|
• |
difficulties in developing relationships with local suppliers; |
|
|
• |
difficulties in attracting new international customers; |
|
|
• |
difficulties in complying with foreign and international laws and treaties; |
|
|
• |
restrictions on the export of technology; |
|
|
• |
compliance with U.S. and international laws involving international operations, including the Foreign Corrupt Practices Act, export control laws and export license requirements; |
|
|
• |
difficulties in achieving headcount reductions due to unionized labor and works councils; |
|
|
• |
restrictions on transfers of funds and assets between jurisdictions; |
|
|
• |
geo-political instability; and |
|
|
• |
trade restrictions and changes in taxes and tariffs. |
18
In the future, we may seek to expand our presence in certain foreign markets or enter emerging markets. Evaluating or entering into an emerging market may require considerable management time, as well as start-up expenses for market development before any significant sales and earnings are generated. Operations in new foreign markets may achieve low margins or may be unprofitable, and expansion in existing markets may be affected by local political, economic and market conditions. As we continue to operate our business globally, our success will depend, in part, on our ability to anticipate and effectively manage these and the other risks noted above. The impact of any one or more of these factors could materially adversely affect our business, financial condition and results of operations.
We are subject to fluctuations in foreign currency exchange rates which could cause operating results and reported financial results to vary significantly from period to period.
The vast majority of our sales are denominated in U.S. Dollars. Many of the costs and expenses associated with our Singapore, Malaysian and U.K. operations are paid in Singapore Dollars, Malaysian Ringgit or British Pounds (or Euros), respectively, and we expect our exposure to these currencies to increase as we increase our operations in those countries. As a result, our risk exposure from transactions denominated in non-U.S. currencies is primarily related to the Singapore Dollar, Malaysian Ringgit, British Pound and Euro. In addition, because the majority of our sales are denominated in the U.S. Dollar, if one or more of our competitors sells to our customers in a different currency than the U.S. Dollar, we are subject to the risk that the competitors’ products will be relatively less expensive than our products due to exchange rate effects. We have not historically established transaction-based hedging programs. Foreign currency exchange risks inherent in doing business in foreign countries could have a material adverse effect on our business, financial condition and results of operations.
We are subject to numerous environmental laws and regulations, which could require us to incur environmental liabilities, increase our manufacturing and related compliance costs or otherwise adversely affect our business.
We are subject to a variety of federal, state, local and foreign laws and regulations governing the protection of the environment. These environmental laws and regulations include those relating to the use, storage, handling, discharge, emission, disposal and reporting of toxic, volatile or otherwise hazardous materials used in our manufacturing processes. These materials may have been or could be released into the environment at properties currently or previously owned or operated by us, at other locations during the transport of materials or at properties to which we send substances for treatment or disposal. In addition, we may not be aware of all environmental laws or regulations that could subject us to liability in the United States or internationally. If we were to violate or become liable under environmental laws and regulations or become non-compliant with permits required at some of our facilities, we could be held financially responsible and incur substantial costs, including cleanup costs, fines and civil or criminal sanctions, third-party property damage or personal injury claims.
Failure to maintain effective internal controls in accordance with Section 404 of the Sarbanes-Oxley Act could have a material adverse effect on our business and stock price.
As a publicly traded company, we are required to comply with the SEC’s rules implementing Section 302 and 404 of the Sarbanes-Oxley Act, which require management to certify financial and other information in our quarterly and annual reports and provide an annual management report on the effectiveness of controls over financial reporting. Pursuant to the JOBS Act, our independent registered public accounting firm will not be required to attest to the effectiveness of our internal control over financial reporting until the later of the year following our first annual report required to be filed with the SEC or the date we are no longer an emerging growth company, which may be up to five full fiscal years following our initial public offering in December 2016.
If we identify weaknesses in our internal control over financial reporting, are unable to comply with the requirements of Section 404 in a timely manner or to assert that our internal control over financial reporting is effective, or if our independent registered public accounting firm is unable to express an opinion as to the effectiveness of our internal control over financial reporting, investors may lose confidence in the accuracy and completeness of our financial reports and the market price of our common stock could be negatively affected, and we could become subject to investigations by NASDAQ, the SEC or other regulatory authorities, which could require additional financial and management resources.
19
In the second quarter of 2017, we identified material weaknesses in our internal control over financial reporting and may identify additional material weaknesses in the future that may cause us to fail to meet our reporting obligations or result in material misstatements of our financial statements. If our internal control over financial reporting or our disclosure controls and procedures are not effective, we may not be able to accurately report our financial results, prevent fraud or file our periodic reports in a timely manner, which may cause investors to lose confidence in our reported financial information and may lead to a decline in our share price.
During the second quarter of 2017, we identified a material weakness in our internal control over financial reporting related to ineffective periodic risk assessment over control activities that ensure the ending inventory balances of our Malaysia and Singapore subsidiaries were recorded at the appropriate U.S. Dollar functional currency rate. During our previous consolidation process, we had a manual process that translated these inventory balances into the U.S. Dollar functional currency at incorrect rates for these subsidiaries due to system limitations, and we did not implement a control to reconcile the ending inventory balance at our Malaysia and Singapore subsidiaries to the final inventory balance reported in our consolidated financial statements. This material weakness resulted in an accumulated overstatement of inventory as of March 31, 2017 of approximately $1.75 million. We corrected this overstatement in the second quarter of 2017 with a charge to cost of sales of $1.75 million. Additionally, we re‑implemented our Oracle system, which allows for a systems‑based calculation of inventory purchases and ending inventory at the proper U.S. Dollar functional currency rates, and implemented a control to reconcile the final Malaysia and Singapore inventory sub‑ledger balances to the final balances recorded in consolidation. These improvements to our internal controls, implemented during 2017, were in place and demonstrated a sustained period of effective operation during 2017 to enable management of the Company to conclude the material weakness has been remediated as of December 29, 2017.
If our internal control over financial reporting or our disclosure controls and procedures are not effective, we may not be able to accurately report our financial results, prevent fraud or file our periodic reports in a timely manner, which may cause investors to lose confidence in our reported financial information and may lead to a decline in our stock price.
There are limitations on the effectiveness of controls, and the failure of our control systems may materially and adversely impact us.
We do not expect that disclosure controls or internal controls over financial reporting will prevent all errors and all fraud. A control system, no matter how well designed and operated, can provide only reasonable, not absolute, assurance that the control system’s objectives will be met. Further, the design of a control system must reflect the fact that there are resource constraints and the benefits of controls must be considered relative to their costs. Because of the inherent limitations in all control systems, no evaluation of controls can provide absolute assurance that all control issues and instances of fraud, if any, have been detected. Failure of our control systems to prevent error or fraud could have a material adverse effect on our business, financial condition and results of operations.
Compliance with recently adopted rules of the SEC relating to “conflict minerals” may require us and our suppliers to incur substantial expense and may result in disclosure by us that certain minerals used in products we manufacture are not “DRC conflict free.”
Section 1502 of the Dodd-Frank Wall Street Reform and Consumer Protection Act, or the Dodd-Frank Act, required the SEC to promulgate rules requiring disclosure by a public company of any “conflict minerals” (tin, tungsten, tantalum and gold) necessary to the functionality or production of a product manufactured or contracted to be manufactured by such company. The SEC adopted final rules in 2012 which took effect at the end of January 2013. Because we manufacture products which may contain tin, tungsten, tantalum or gold, we will be required under these rules to determine whether those minerals are necessary to the functionality or production of our products and, if so, conduct a country of origin inquiry with respect to all such minerals. If any such minerals may have originated in the Democratic Republic of the Congo, or the DRC, or any of its adjoining countries, or the “covered countries,” then we and our suppliers must conduct diligence on the source and chain of custody of the conflict minerals to determine if they did originate in one of the covered countries and, if so, whether they financed or benefited armed groups in the covered countries. Disclosures relating to the products which may contain conflict minerals, the country of origin of those minerals and whether they are “DRC conflict free” must be provided in a Form SD (and accompanying conflict minerals report if one is required to disclose the diligence undertaken by us in sourcing the minerals and our conclusions relating to such diligence). If we are required to submit a conflict minerals report, that report must be audited by an independent auditor pursuant to existing government auditing standards, unless (for the first two years) we are unable to determine whether the minerals are “DRC conflict free.” Compliance with this new disclosure rule may be very time consuming for management and our supply chain personnel (as well as time consuming for our suppliers) and could involve the expenditure of significant amounts of money and resources by us and them. Disclosures by us mandated by the new rules which are perceived by the market to be “negative” may cause customers to refuse to purchase our products. We are currently unable to assess the cost of compliance with this rule, and we cannot assure you that such cost will not have a material adverse effect on our business, financial condition and results of operations.
20
Our business is subject to the risks of earthquakes, fire, power outages, floods, and other catastrophic events, and to interruption by man-made disruptions, such as terrorism.
Our facilities could be subject to a catastrophic loss caused by natural disasters, including fires and earthquakes. If any of our facilities were to experience a catastrophic loss, it could disrupt our operations, delay production and shipments, reduce sales and result in large expenses to repair or replace the facility. In addition, we may experience extended power outages at our facilities. Disruption in supply resulting from natural disasters or other causalities or catastrophic events may result in certain of our suppliers being unable to deliver sufficient quantities of components or raw materials at all or in a timely manner, disruptions in our operations or disruptions in our customers’ operations. To the extent that natural disasters or other calamities or causalities should result in delays or cancellations of customer orders, or the delay in the manufacture or shipment of our products, our business, financial condition and results of operations would be adversely affected.
Changes in tax laws, tax rates or tax assets and liabilities could materially adversely affect our financial condition and results of operations.
As a global company, we are subject to taxation in the United States and various other countries. Significant judgment is required to determine and estimate worldwide tax liabilities. Our future annual and quarterly tax rates could be affected by numerous factors, including changes in applicable tax laws, the amount and composition of pre-tax income in countries with differing tax rates or valuation of our deferred tax assets and liabilities. We have significant operations in the United States and our holding company structure includes entities organized in the Cayman Islands, Netherlands, Singapore and Scotland. As a result, changes in applicable tax laws in these jurisdictions could have a material adverse effect on our financial condition and results of operations.
On December 22, 2017, Congress passed the Tax Cuts and Jobs Act (the “Tax Act”). Among a number of significant changes to the U.S. federal income tax rules, the Tax Act reduces the marginal U.S. corporate income tax rate from 35% to 21%, limits the deduction for net interest expense, limits the deduction for net operating losses and eliminates net operating loss carrybacks, modifies or repeals many business deductions and credits, shifts the United States toward a more territorial tax system, and imposes new taxes to combat erosion of the U.S. federal income tax base. Our net deferred tax assets and liabilities will be revalued at the newly enacted U.S. corporate rate, and the impact will be recognized in our tax expense in the year of enactment. We continue to examine the impact this tax reform legislation may have on our business. However, the effect of the Tax Act on us and our affiliates, whether adverse or favorable, is uncertain, and may not become evident for some period of time.
We are also subject to regular examination by the Internal Revenue Service and other tax authorities, and from time to time we initiate amendments to previously filed tax returns. We regularly assess the likelihood of favorable or unfavorable outcomes resulting from these examinations and amendments to determine the adequacy of our provision for income taxes, which requires estimates and judgments. Although we believe our tax estimates are reasonable, we cannot assure you that the tax authorities will agree with such estimates. We may have to engage in litigation to achieve the results reflected in the estimates, which may be time- consuming and expensive. We cannot assure you that we will be successful or that any final determination will not be materially different from the treatment reflected in our historical income tax provisions and accruals, which could materially and adversely affect our financial condition and results of operations.
Risks Related to Ownership of Our Ordinary Shares
The price of our ordinary shares may fluctuate substantially.
You should consider an investment in our ordinary shares to be risky, and you should invest in our ordinary shares only if you can withstand a significant loss and wide fluctuations in the market value of your investment. Some factors that may cause the market price of our ordinary shares to fluctuate, in addition to the other risks mentioned in this report, are:
|
|
• |
our announcements or our competitors’ announcements regarding new products or services, enhancements, significant contracts, acquisitions or strategic investments; |
|
|
• |
changes in earnings estimates or recommendations by securities analysts, if any, who cover our ordinary shares; |
|
|
• |
speculation about our business in the press or investment community; |
|
|
• |
failures to meet external expectations or management guidance; |
|
|
• |
fluctuations in our quarterly financial results or the quarterly financial results of companies perceived to be similar to us; |
21
|
|
• |
our decision to enter new markets; |
|
|
• |
reputational issues; |
|
|
• |
changes in general economic and market conditions in any of the regions in which we conduct our business; |
|
|
• |
material litigation or government investigations; |
|
|
• |
changes in industry conditions or perceptions; and |
|
|
• |
changes in applicable laws, rules or regulations. |
In addition, if the market for stocks in our industry or industries related to our industry, or the stock market in general, experiences a loss of investor confidence, the trading price of our ordinary shares could decline for reasons unrelated to our business, financial condition and results of operations. If any of the foregoing occurs, it could cause our share price to fall and may expose us to lawsuits that, even if unsuccessful, could be costly to defend and a distraction to management.
Francisco Partners owns a significant portion of our outstanding equity, and its interests may not always coincide with the interests of other holders.
As of December 29, 2017, Francisco Partners owned approximately 15.0% of our ordinary shares. As a result, Francisco Partners could have significant influence over all matters presented to our shareholders for approval, including election and removal of our directors, change in control transactions and the outcome of all actions requiring a majority shareholder approval.
In addition, persons associated with Francisco Partners currently serve on our Board. The interests of Francisco Partners may not always coincide with the interests of the other holders of our ordinary shares, and the concentration of control in Francisco Partners will limit other shareholders’ ability to influence corporate matters. The concentration of ownership and voting power of Francisco Partners may also delay, defer or even prevent an acquisition by a third party or other change of control of our Company and may make some transactions more difficult or impossible without their support, even if such events are in the best interests of our other shareholders. Therefore, the concentration of voting power of Francisco Partners may have an adverse effect on the price of our ordinary shares. We may also take actions that our other shareholders do not view as beneficial, which may adversely affect our results of operations and financial condition and cause the value of your investment to decline.
Future sales of our ordinary shares, or the perception in the public markets that these sales may occur, may depress our share price.
Sales of substantial amounts of our ordinary shares in the public market, or the perception that these sales could occur, could adversely affect the price of our ordinary shares and could impair our ability to raise capital through the sale of additional shares. As of December 29, 2017, we had 25,892,162 shares outstanding, of which 3,880,513 were beneficially owned by Francisco Partners. Francisco Partners has the right to require us to register the sales of their shares under the Securities Act of 1933, as amended, or the Securities Act, under the terms of an agreement between us and Francisco Partners. Future sales by Francisco Partners, or a distribution of shares by Francisco Partners to its limited partners and subsequent sale of such shares in the public market, could cause the trading price of our ordinary shares to decline.
22
We are an “emerging growth company” and may elect to comply with reduced public company reporting requirements, which could make our ordinary shares less attractive to investors.
We are an emerging growth company, as defined in the JOBS Act. For as long as we continue to be an emerging growth company, we may choose to take advantage of exemptions from various public company reporting requirements. These exemptions include, but are not limited to, (i) not being required to comply with the auditor attestation requirements of Section 404 of the Sarbanes‑Oxley Act, (ii) reduced disclosure obligations regarding executive compensation in our periodic reports, proxy statements and registration statements, and (iii) exemptions from the requirements of holding a nonbinding advisory vote on executive compensation and shareholder approval of any golden parachute payments not previously approved. We could be an emerging growth company for up to five years after the first sale of our ordinary shares pursuant to an effective registration statement under the Securities Act, which fifth anniversary will occur in December 2021. However, if certain events occur prior to the end of such five‑year period, including if we become a “large accelerated filer,” our annual gross revenue exceeds $1.0 billion or we issue more than $1.0 billion of non‑convertible debt in any three‑year period, we would cease to be an emerging growth company prior to the end of such five‑year period. We have taken advantage of certain of the reduced disclosure obligations regarding executive compensation and may elect to take advantage of other reduced disclosure obligations in our SEC filings. As a result, the information that we provide to holders of our ordinary shares may be different than you might receive from other public reporting companies in which you hold equity interests. We cannot predict if investors will find our ordinary shares less attractive as a result of our reliance on these exemptions. If some investors find our ordinary shares less attractive as a result of any choice we make to reduce disclosure, there may be a less active trading market for our ordinary shares and the price for our ordinary shares may be more volatile.
Under the JOBS Act, emerging growth companies may also elect to delay adoption of new or revised accounting standards until such time as those standards apply to private companies. We have elected not to avail ourselves of this extended transition period for complying with new or revised accounting standards and, therefore, we will be subject to the same new or revised accounting standards as other public companies.
We do not expect to pay any cash dividends for the foreseeable future.
On August 11, 2015, our board of directors approved and we declared a one-time approximately $22.1 million cash dividend on our outstanding preferred shares using proceeds from borrowings under our Credit Facilities and cash on hand. However, we do not anticipate that we will pay any cash dividends on our ordinary shares for the foreseeable future. Any determination to pay dividends in the future will be at the discretion of our board of directors and will depend upon our financial condition, results of operations, contractual restrictions (including those under our Credit Facilities and any potential indebtedness we may incur in the future), restrictions imposed by applicable law, tax considerations and other factors our board of directors deems relevant. There can be no assurance that we will pay a dividend in the future or continue to pay any dividend if we do commence paying dividends. Accordingly, realization of a gain on an investment in our ordinary shares will depend on the appreciation of the price of our ordinary shares, which may never occur. Investors seeking cash dividends in the foreseeable future should not purchase our ordinary shares.
Our articles of association contain anti-takeover provisions that could adversely affect the rights of our shareholders.
Our articles of association contain provisions to limit the ability of others to acquire control of our company or cause us to engage in change-of control transactions, including, among other things:
|
|
• |
provisions that authorize our board of directors, without action by our shareholders, to issue additional ordinary shares and preferred shares with preferential rights determined by our board of directors; |
|
|
• |
provisions that permit only a majority of our board of directors or the chairman of our board of directors to call shareholder meetings and therefore do not permit shareholders to call shareholder meetings; |
|
|
• |
provisions that impose advance notice requirements, minimum shareholding periods and ownership thresholds, and other requirements and limitations on the ability of shareholders to propose matters for consideration at shareholder meetings; provided, however, at any time when Francisco Partners beneficially owns, in the aggregate, at least 5% of our ordinary shares, such advance notice procedure will not apply to it; and |
|
|
• |
a staggered board whereby our directors are divided into three classes, with each class subject to re-election once every three years on a rotating basis. |
23
These provisions could have the effect of depriving our shareholders of an opportunity to sell their shares at a premium over prevailing market prices by discouraging third parties from seeking to obtain control of our company in a tender offer or similar transaction. With our staggered board of directors, at least two annual meetings of shareholders are generally required in order to effect a change in a majority of our directors. Our staggered board of directors can discourage proxy contests for the election of our directors and purchases of substantial blocks of our shares by making it more difficult for a potential acquirer to gain control of our board of directors in a relatively short period of time.
The issuance of preferred shares could adversely affect holders of ordinary shares.
Our board of directors is authorized to issue preferred shares without any action on the part of holders of our ordinary shares. Our board of directors also has the power, without shareholder approval, to set the terms of any such preferred shares that may be issued, including voting rights, dividend rights, and preferences over our ordinary shares with respect to dividends or if we liquidate, dissolve or wind up our business and other terms. If we issue preferred shares in the future that have preference over our ordinary shares with respect to the payment of dividends or upon our liquidation, dissolution or winding up, or if we issue preferred shares with voting rights that dilute the voting power of our ordinary shares, the rights of holders of our ordinary shares or the price of our ordinary shares could be adversely affected.
You may face difficulties in protecting your interests as a shareholder, as Cayman Islands law provides substantially less protection when compared to the laws of the United States.
Our corporate affairs are governed by our amended and restated memorandum and articles of association and by the Companies Law (2013 Revision) and common law of the Cayman Islands. The rights of shareholders to take legal action against our directors and us, actions by minority shareholders and the fiduciary responsibilities of our directors to us under Cayman Islands law are to a large extent governed by the common law of the Cayman Islands. The common law of the Cayman Islands is derived in part from comparatively limited judicial precedent in the Cayman Islands as well as from English common law, which has persuasive, but not binding, authority on a court in the Cayman Islands. The rights of our shareholders and the fiduciary responsibilities of our directors under Cayman Islands law are not as clearly established as they would be under statutes or judicial precedents in the United States. In particular, the Cayman Islands have a less exhaustive body of securities laws as compared to the United States. In addition, Cayman Islands companies may not have standing to initiate a shareholder derivative action before the United States federal courts.
As a result of all of the above, our shareholders may have more difficulty in protecting their interests through actions against us or our officers, directors or major shareholders than would shareholders of a corporation incorporated in a jurisdiction in the United States.
Certain judgments obtained against us by our shareholders may not be enforceable.
We are a Cayman Islands company and a portion our assets are located outside of the United States. As a result, it may be difficult or impossible for you to bring an action against us in the United States in the event that you believe that your rights have been infringed under U.S. federal securities laws or otherwise. Even if you are successful in bringing an action of this kind, the laws of the Cayman Islands may render you unable to enforce a judgment against our assets. There is no statutory recognition in the Cayman Islands of judgments obtained in the United States, although the courts of the Cayman Islands will generally recognize and enforce a non-penal judgment of a foreign court of competent jurisdiction without retrial on the merits.
There can be no assurance that we will not be a passive foreign investment company for any taxable year, which could result in adverse U.S. federal income tax consequences to U.S. Holders of our ordinary shares.
A non-U.S. corporation will be a passive foreign investment company, or PFIC, for any taxable year if either (i) at least 75% of its gross income for such year is passive income or (ii) at least 50% of the value of its assets (based on an average of the quarterly values of the assets) during such year is attributable to assets that produce or are held for the production of passive income. Our PFIC status for any taxable year can be determined only after the close of that year.
Based on the current and anticipated value of our assets and the composition of our income and assets, we do not believe we were treated as a PFIC for U.S. federal income purposes for our taxable year ending December 29, 2017. However, the determination of PFIC status is based on an annual determination that cannot be made until the close of a taxable year, involves extensive factual investigation, including ascertaining the fair market value of all of our assets on a quarterly basis and the character of each item of income that we earn, and is subject to uncertainty in several respects. Accordingly, we cannot assure you that we were not treated as a PFIC for our taxable year ending December 29, 2017, or will not be treated as a PFIC for any future taxable year or that the IRS will not take a contrary position.
24
If we are a PFIC for any taxable year during which a U.S. person holds ordinary shares, certain adverse U.S. federal income tax consequences could apply to such U.S. person. You are strongly urged to consult your tax advisors as to whether or not we will be a PFIC.
ITEM 1B. UNRESOLVED STAFF COMMENTS
None.
Our principal executive office is located at 3185 Laurelview Ct., Fremont, California 94538. As of December 29, 2017, our principal manufacturing and administrative facilities, including our executive offices, comprises approximately 604,100 square feet. All of our facilities are leased, which allows for flexibility as business conditions and geographic demand change. The table below sets forth the approximate square footage of each of our facilities.
|
Location |
|
Approximate Square Footage |
|
|
|
Austin, Texas |
|
|
25,700 |
|
|
East Blantyre, Scotland |
|
|
37,700 |
|
|
Fremont, California |
|
|
55,000 |
|
|
Kingston, New York (1) |
|
|
71,800 |
|
|
Seoul, Korea |
|
|
600 |
|
|
Osakis, Minnesota |
|
|
22,300 |
|
|
Sauk Rapids, Minnesota |
|
|
58,600 |
|
|
Selangor, Malaysia |
|
|
31,900 |
|
|
Singapore |
|
|
76,900 |
|
|
Tampa, Florida |
|
|
32,600 |
|
|
Tualatin, Oregon |
|
|
138,200 |
|
|
Union City, California |
|
|
52,800 |
|
|
|
(1) |
Operations ceased as of May 27, 2016. The facility is leased through February 28, 2018. |
|
We believe that our existing facilities and equipment are well maintained, in good operating condition and are adequate to meet our currently anticipated requirements.
We are currently not a party to any material legal proceedings. However, in the future we may be subject to various legal claims and proceedings which arise in the ordinary course of our business involving claims incidental to our business, including employment-related claims.
ITEM 4. MINE SAFETY DISCLOSURES
Not applicable.
25
ITEM 5. MARKET FOR THE REGISTRANT’S COMMON EQUITY, RELATED SHAREHOLDER MATTERS AND ISSUER PURCHASES OF EQUITY SECURITIES
Market Information for Ordinary Shares
On December 9, 2016, our ordinary shares began trading on NASDAQ under the symbol “ICHR”. Prior to that time, there was no public market for our ordinary shares. Shares sold in our initial public offering were priced at $9.00 per share on December 8, 2016. The following table sets forth the high and low closing prices per share of our ordinary shares as reported by the NASDAQ for the period indicated.
|
|
|
High |
|
|
Low |
|
||
|
2017 |
|
|
|
|
|
|
|
|
|
Fourth Quarter |
|
$ |
34.28 |
|
|
$ |
23.61 |
|
|
Third Quarter |
|
$ |
26.80 |
|
|
$ |
18.03 |
|
|
Second Quarter |
|
$ |
27.88 |
|
|
$ |
17.14 |
|
|
First Quarter |
|
$ |
19.83 |
|
|
$ |
11.55 |
|
|
2016 |
|
|
|
|
|
|
|
|
|
Fourth Quarter (from December 9, 2016) |
|
$ |
11.12 |
|
|
$ |
9.77 |
|
Holders of Record
On March 6, 2018, there were 5 holders of record of our ordinary shares. This number does not include shareholders for whom shares are held in “nominee” or “street” name.
Dividends
We do not anticipate that we will pay any cash dividends on our ordinary shares for the foreseeable future. Any determination to pay dividends in the future will be at the discretion of our board of directors and will depend upon our financial condition, results of operations, contractual restrictions (including those under our Credit Facilities and any potential indebtedness we may incur in the future), restrictions imposed by applicable law, tax considerations and other factors our board of directors deems relevant.
Recent Sales of Unregistered Securities
None.
Stock Performance Graph
The information included under the heading “Stock Performance Graph” is “furnished” and not “filed” for purposes of Section 18 of the Securities Exchange Act of 1934, as amended, or the Exchange Act, or otherwise subject to the liabilities of that section, nor shall it be deemed to be “soliciting material” subject to Regulation 14A or incorporated by reference in any filing under the Securities Act or the Exchange Act.
26
Our ordinary shares are listed for trading on the NASDAQ under the symbol “ICHR.” The Stock Price Performance Graph set forth below plots the cumulative total shareholder return on a monthly basis of our ordinary shares from December 9, 2016, the date on which our shares began trading, through December 29, 2017, with the cumulative total return of the Nasdaq Composite Index and the PHLX Semiconductor Sector Index over the same period. The comparison assumes $100 was invested on December 9, 2016 in the ordinary shares of Ichor Holdings, Ltd., in the Nasdaq Composite Index, and in the PHLX Semiconductor Sector Index and assumes reinvestment of dividends, if any.
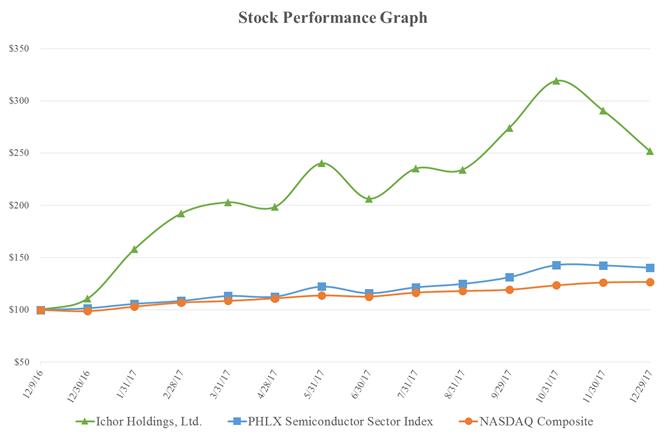
The stock price performance shown on the graph above is not necessarily indicative of future price performance. Information used in the graph was obtained from the Nasdaq Stock Market, a source believed to be reliable, but we are not responsible for any errors or omissions in such information.
27
ITEM 6. SELECTED FINANCIAL DATA
The following tables present our historical selected consolidated financial data. The selected consolidated statement of operations data for fiscal years 2017, 2016, and 2015, and the selected balance sheet data as of December 29, 2017 and December 30, 2016, are derived from our audited consolidated financial statements that are included elsewhere in this report. The selected balance sheet data as of December 25, 2015 is derived from our audited consolidated balance sheet as of such date not included in this report.
Our historical results are not necessarily indicative of the results that may be expected in the future and interim results are not necessarily indicative of results to be expected for the full year. You should read the selected historical financial data below in conjunction with the section titled “Management’s Discussion and Analysis of Financial Condition and Results of Operations” and the financial statements and related notes included elsewhere in this report.
|
|
|
Year Ended |
|
|||||||||
|
|
|
December 29, 2017 |
|
|
December 30, 2016 |
|
|
December 25, 2015 |
|
|||
|
|
|
(in thousands, except share and per share amounts) |
|
|||||||||
|
Consolidated Statement of Operations Data: |
|
|
|
|
|
|
|
|
|
|
|
|
|
Net sales |
|
$ |
655,892 |
|
|
$ |
405,747 |
|
|
$ |
290,641 |
|
|
Cost of sales (1) |
|
|
555,131 |
|
|
|
340,352 |
|
|
|
242,087 |
|
|
Gross profit |
|
|
100,761 |
|
|
|
65,395 |
|
|
|
48,554 |
|
|
Operating expenses: |
|
|
|
|
|
|
|
|
|
|
|
|
|
Research and development (1) |
|
|
7,899 |
|
|
|
6,383 |
|
|
|
4,813 |
|
|
Selling, general and administrative (1) |
|
|
37,802 |
|
|
|
28,126 |
|
|
|
24,729 |
|
|
Amortization of intangible assets |
|
|
8,880 |
|
|
|
7,015 |
|
|
|
6,411 |
|
|
Total operating expenses |
|
|
54,581 |
|
|
|
41,524 |
|
|
|
35,953 |
|
|
Operating income |
|
|
46,180 |
|
|
|
23,871 |
|
|
|
12,601 |
|
|
Interest expense |
|
|
3,277 |
|
|
|
4,370 |
|
|
|
3,831 |
|
|
Other income, net |
|
|
(126 |
) |
|
|
(629 |
) |
|
|
(46 |
) |
|
Income from continuing operations before income taxes |
|
|
43,029 |
|
|
|
20,130 |
|
|
|
8,816 |
|
|
Income tax benefit from continuing operations (2) |
|
|
(13,886 |
) |
|
|
(649 |
) |
|
|
(3,991 |
) |
|
Net income from continuing operations |
|
|
56,915 |
|
|
|
20,779 |
|
|
|
12,807 |
|
|
Discontinued operations: |
|
|
|
|
|
|
|
|
|
|
|
|
|
Loss from discontinued operations before taxes |
|
|
(722 |
) |
|
|
(4,077 |
) |
|
|
(7,406 |
) |
|
Income tax expense (benefit) from discontinued operations |
|
|
(261 |
) |
|
|
40 |
|
|
|
(225 |
) |
|
Net loss from discontinued operations |
|
|
(461 |
) |
|
|
(4,117 |
) |
|
|
(7,181 |
) |
|
Net income |
|
|
56,454 |
|
|
|
16,662 |
|
|
|
5,626 |
|
|
Less: Preferred share dividend |
|
|
— |
|
|
|
— |
|
|
|
(22,127 |
) |
|
Less: Undistributed earnings attributable to preferred shareholders |
|
|
— |
|
|
|
(15,284 |
) |
|
|
— |
|
|
Net income (loss) attributable to ordinary shareholders |
|
$ |
56,454 |
|
|
$ |
1,378 |
|
|
$ |
(16,501 |
) |
|
Net income (loss) per share from continuing operations attributable to ordinary shareholders: (3) |
|
|
|
|
|
|
|
|
|
|
|
|
|
Basic |
|
$ |
2.27 |
|
|
$ |
1.14 |
|
|
$ |
(292.39 |
) |
|
Diluted |
|
$ |
2.17 |
|
|
$ |
0.87 |
|
|
$ |
(292.39 |
) |
|
Net income (loss) per share attributable to ordinary shareholders: (3) |
|
|
|
|
|
|
|
|
|
|
|
|
|
Basic |
|
$ |
2.25 |
|
|
$ |
0.92 |
|
|
$ |
(517.68 |
) |
|
Diluted |
|
$ |
2.15 |
|
|
$ |
0.70 |
|
|
$ |
(517.68 |
) |
|
Shares used to compute net income (loss) from continuing operations per share attributable to ordinary shareholders: (3) |
|
|
|
|
|
|
|
|
|
|
|
|
|
Basic |
|
|
25,118,031 |
|
|
|
1,503,296 |
|
|
|
31,875 |
|
|
Diluted |
|
|
26,218,424 |
|
|
|
1,967,926 |
|
|
|
31,875 |
|
|
Shares used to compute net income (loss) per share attributable to ordinary shareholders: (3) |
|
|
|
|
|
|
|
|
|
|
|
|
|
Basic |
|
|
25,118,031 |
|
|
|
1,503,296 |
|
|
|
31,875 |
|
|
Diluted |
|
|
26,218,424 |
|
|
|
1,967,926 |
|
|
|
31,875 |
|
28
|
|
|
Year Ended |
|
|||||||||
|
|
|
December 29, 2017 |
|
|
December 30, 2016 |
|
|
December 25, 2015 |
|
|||
|
|
|
(in thousands) |
|
|||||||||
|
Consolidated Balance Sheet Data: |
|
|
|
|
|
|
|
|
|
|
|
|
|
Cash and restricted cash |
|
$ |
69,304 |
|
|
$ |
52,648 |
|
|
$ |
24,188 |
|
|
Working capital |
|
$ |
131,233 |
|
|
$ |
56,020 |
|
|
$ |
24,860 |
|
|
Total assets |
|
$ |
557,684 |
|
|
$ |
282,491 |
|
|
$ |
198,023 |
|
|
Total long-term debt (4) |
|
$ |
189,535 |
|
|
$ |
39,830 |
|
|
$ |
65,000 |
|
|
Preferred shares |
|
$ |
— |
|
|
$ |
— |
|
|
$ |
142,728 |
|
|
Total shareholders’ equity |
|
$ |
216,762 |
|
|
$ |
141,659 |
|
|
$ |
74,678 |
|
|
|
(1) |
Share-based compensation included in the consolidated statement of operations data above was as follows: |
|
|
|
|
Year Ended |
|
|||||||||
|
|
|
December 29, 2017 |
|
|
December 30, 2016 |
|
|
December 25, 2015 |
|
|||
|
|
|
(in thousands) |
|
|||||||||
|
Share-Based Compensation Expense: |
|
|
|
|
|
|
|
|
|
|
|
|
|
Cost of sales |
|
$ |
118 |
|
|
$ |
20 |
|
|
$ |
105 |
|
|
Research and development |
|
|
141 |
|
|
|
35 |
|
|
|
46 |
|
|
Selling general and administrative |
|
|
1,971 |
|
|
|
3,161 |
|
|
|
967 |
|
|
Total share-based compensation expense |
|
$ |
2,230 |
|
|
$ |
3,216 |
|
|
$ |
1,118 |
|
|
|
(2) |
During 2017, income tax benefit from continuing operations consists primarily of the impact of foreign operations, including withholding taxes, offset by a $7.6 million tax benefit as a result of our acquisitions (see Note 2 – Acquisitions of our consolidated financial statements included elsewhere in this report), a $5.9 million tax benefit from revaluing our deferred taxes from 35% to 21% due to the Tax Cuts and Jobs Act, and a $1.6 million benefit from re-characterizing intercompany debt to equity between our U.S. and Singapore entities related to the reversal of previously accrued withholding taxes. During 2016 and 2015, income tax benefit from continuing operations consisted primarily of the impact of foreign operations, including withholding taxes, offset by a tax benefit in 2016 as a result of our acquisition (see Note 2 – Acquisitions of our consolidated financial statements included elsewhere in this report). |
|
|
|
(3) |
Please see Note 14 – Earnings per Share of our consolidated financial statements included elsewhere in this report for an explanation of the calculations of our actual basic and diluted net income per share and our pro forma unaudited basic and diluted net income per share. |
|
|
|
(4) |
Does not include debt issuance costs of $2.8 million, $1.9 million, and $2.4 million as of December 29, 2017, December 30, 2016, and December 25, 2015, respectively. |
|
ITEM 7. MANAGEMENT’S DISCUSSION AND ANALYSIS OF FINANCIAL CONDITION AND RESULTS OF OPERATIONS
You should read the following discussion and analysis of our financial condition and results of operations in conjunction with our consolidated financial statements and related notes included elsewhere in this report. The following discussion contains forward-looking statements based upon our current plans, expectations and beliefs that involve risks and uncertainties. Our actual results may differ materially from those anticipated in these forward-looking statements. Factors that could cause or contribute to these differences include those discussed below and elsewhere in this report, particularly in “Risk Factors”.
We use a 52 or 53 week fiscal year ending on the last Friday in December. The years ended December 29, 2017, December 30, 2016, and December 25, 2015 were 52 weeks, 53 weeks, and 52 weeks, respectively. All references to 2017, 2016, and 2015 are references to fiscal years unless explicitly stated otherwise.
29
We are a leader in the design, engineering and manufacturing of critical fluid delivery subsystems for semiconductor capital equipment. Our primary offerings include gas and chemical delivery subsystems, collectively known as fluid delivery subsystems, which are key elements of the process tools used in the manufacturing of semiconductor devices. Our gas delivery subsystems deliver, monitor and control precise quantities of the specialized gases used in semiconductor manufacturing processes such as etch and deposition. Our chemical delivery subsystems precisely blend and dispense the reactive liquid chemistries used in semiconductor manufacturing processes such as electroplating and cleaning. We also manufacture certain components such as weldments and precision machined components for use in fluid delivery systems for direct sales to our customers. This vertically integrated portion of our business is primarily focused on metal and plastic parts that are used in gas and chemical systems, respectively.
Fluid delivery subsystems ensure accurate measurement and uniform delivery of specialty gases and chemicals at critical steps in the semiconductor manufacturing process. Any malfunction or material degradation in fluid delivery reduces yields and increases the likelihood of manufacturing defects in these processes. Historically, semiconductor OEMs internally designed and manufactured the fluid delivery subsystems used in their process tools. Currently, most OEMs outsource the design, engineering and manufacturing of their gas delivery subsystems to a few specialized suppliers, including us. Additionally, many OEMs are also increasingly outsourcing the design, engineering and manufacturing of their chemical delivery subsystems due to the increased fluid expertise required to manufacture these subsystems. Outsourcing these subsystems has allowed OEMs to leverage the suppliers’ highly specialized engineering, design and production skills while focusing their internal resources on their own value-added processes. We believe that this outsourcing trend has enabled OEMs to reduce their fixed costs and development time, as well as provided significant growth opportunities for specialized subsystems suppliers like us.
We have a global footprint with volume production facilities in Malaysia; Singapore; and Tualatin, Oregon; Austin, Texas; Union City, California; Fremont, California; and Sauk Rapids, Minnesota. In 2017, 2016, and 2015, our two largest customers by revenue were Lam Research and Applied Materials. During 2017, 2016, and 2015, respectively, we generated revenue of $655.9 million, $405.7 million, and $290.6 million, gross profit of $100.8 million, $65.4 million, and $48.6 million, net income from continuing operations of $56.9 million, $20.8 million, and $12.8 million, and adjusted net income from continuing operations of $65.1 million, $31.6 million, and $20.2 million. Adjusted net income from continuing operations is a financial measure that is not calculated in accordance with GAAP. See “Non‑GAAP Results” for a discussion of adjusted net income from continuing operations, an accompanying presentation of the most directly comparable financial measure calculated in accordance with generally accepted accounting principles in the United States, net income from continuing operations, and a reconciliation of the differences between adjusted net income from continuing operations and net income from continuing operations.
Key Factors Affecting Our Business
Investment in Semiconductor Manufacturing Equipment
The design and manufacturing of semiconductor devices is constantly evolving and becoming more complex in order to achieve greater performance and efficiency. To keep pace with these changes, OEMs need to refine their existing products and invest in developing new products. In addition, semiconductor device manufacturers will continue to invest in new wafer fabrication equipment to expand their production capacity and to support new manufacturing processes.
Outsourcing of Subsystems by Semiconductor OEMs
Faced with increasing manufacturing complexities, more complex subsystems, shorter product lead times, shorter industry spend cycles, and significant capital requirements, outsourcing of subsystems and components by OEMs has continued to grow. In the past two decades, OEMs have outsourced most of their gas delivery systems to suppliers such as us. OEMs have also started to outsource their chemical delivery systems in recent years. Our results will be affected by the degree to which outsourcing of these fluid delivery systems by OEMs continues to grow.
Cyclicality of Semiconductor Device Industry
Our business is indirectly subject to the cyclicality of the semiconductor device industry. In 2017, we derived approximately 93% of our sales from the semiconductor device industry. Demand for semiconductor devices can fluctuate significantly based on changes in general economic conditions, including consumer spending, demand for the products that include these devices and other factors. These fluctuations have in the past resulted in significant variations in our results of operations. The cyclicality of the semiconductor device industries will continue to impact our results of operations in the future.
30
The number of capital equipment manufacturers for the semiconductor device industry has undergone significant consolidation in recent years, resulting in a small number of large manufacturers. Our customers have led much of this consolidation, resulting in our sales being concentrated in a few customers. In 2017, our two largest customers were Lam Research and Applied Materials, which accounted for approximately 53% and 40% of sales, respectively. The sales we generated from these customers in 2017 were spread across 35 different product lines utilized in 13 unique manufacturing process steps. We believe the diversity of products that we provide to these customers, combined with the fact that our customers use our products on numerous types of process equipment, lessens the impact of the inherent concentration in the industry. Our customers often require reduced prices or other pricing, quality or delivery commitments as a condition to their purchasing from us in any given period or increasing their purchase volume, which can, among other things, result in reduced gross margins in order to maintain or expand our market share. Although we do not have any long-term contracts that require customers to place orders with us, Lam Research and Applied Materials have been our customers for over 10 years.
Acquisitions
We acquired Cal‑Weld, a California-based leader in the design and fabrication of precision, high purity industrial components, subsystems, and systems, in July 2017 for $56.9 million. We also acquired Talon, a Minnesota-based leader in the design and manufacturing of high precision machined parts used in leading edge semiconductor tools, in December 2017 for $137.0 million. On a combined basis, these acquisitions contributed approximately $57.5 million to sales in 2017. We intend to continue to evaluate opportunistic acquisitions to supplement our organic growth, and any such acquisitions could have a material impact on our business and results of operations.
Discontinued Operations
Discontinued operations consist of the results of operations for our systems integration business with the primary purpose of building modules and tools (metal organic chemical vapor deposition or ion implant) for Veeco Instruments, Inc. In January 2016, our management and the board of directors decided to discontinue this business because it consumed a significant amount of resources while generating low gross margins and contributing only a small amount to our net income. We completed our final builds of these products at the end of May 2016.
Components of Our Results of Operations
The following discussion sets forth certain components of our statements of operations as well as significant factors that impact those items.
Sales
We generate sales primarily from the design, manufacture and sale of subsystems and components for semiconductor capital equipment. Sales are recognized when persuasive evidence of an arrangement exists, transfer of title has occurred, the fee is fixed or determinable, and collectability is reasonably assured. Our shipping terms are FOB shipping point or FOB destination, or equivalent terms, and accordingly, sales are recognized when legal title has passed to the customer upon shipment or delivery.
Cost of Sales and Gross Profit
Cost of sales consists primarily of purchased materials, direct labor, indirect labor, factory overhead cost and depreciation expense for our manufacturing facilities and equipment, as well as certain engineering costs that are related to non-recurring engineering services that we provide to, and for which we invoice, our customers in connection with their product development activities. Our business has a highly variable cost structure with a low fixed overhead structure as a percentage of cost of sales. In addition, our existing global manufacturing plant capacity is scalable and we are able to adjust to increased customer demand for our products without significant additional capital investment. We operate our business in this manner in order to avoid having excessive fixed costs during a cyclical downturn while retaining flexibility to expand our production volumes during periods of growth. However, this approach results in a smaller increase in gross margin as a percentage of sales in times of increased demand.
Since the gross margin on each of our products differs, our overall gross margin as a percentage of our sales changes based on the mix of products we sell in any period.
31
Our operating expenses primarily include research and development and sales, general and administrative expenses. Personnel costs are the most significant component of operating expenses and consist of salaries, benefits, bonuses, share-based compensation and, with regard to sales and marketing expense, sales commissions. Operating expenses also include overhead costs for facilities, IT and depreciation. In addition, our operating expenses include costs related to the impairment of goodwill and intangible assets, amortization of intangible assets and restructuring costs.
Research and development – Research and development expense consists primarily of activities related to product design and other development activities, new component testing and evaluation, and test equipment and fixture development. Research and development expense does not include engineering costs that are related to non-recurring engineering services that we provide to and for which we invoice our customers as part of sales, which are reflected as cost of sales. We expect research and development expense will increase in absolute dollars as our customers continue to increase their demand for new product designs and as we invest in our research and product development efforts to enhance our product capabilities and access new customer markets.
Selling, general and administrative – Selling expense consists primarily of salaries and commissions paid to our sales and sales support employees and other costs related to the sales of our products. General and administrative expense consists primarily of salaries and overhead associated with our administrative staff, professional fees and depreciation and other allocated facility related costs. We expect selling expenses to increase in absolute dollars as we continue to invest in expanding our markets and as we expand our international operations. We expect general and administrative expenses to also increase in absolute dollars due to an increase in costs related to being a public company, including higher legal, corporate insurance and accounting expenses.
Amortization of intangibles – Amortization of intangible assets is related to our finite-lived intangible assets and is computed using the straight-line method over the estimated economic life of the asset.
Interest Expense, net
Interest expense, net consists of interest on our outstanding debt under our Credit Facilities and any other indebtedness we may incur in the future.
Other Expense (Income), Net
The functional currency of our international subsidiaries located in the United Kingdom, Singapore and Malaysia is the U.S. dollar. Transactions denominated in currencies other than the functional currency generate foreign exchange gains and losses that are included in other expense, net on the accompanying consolidated statements of operations. Substantially all of our sales and agreements with third party suppliers provide for pricing and payments in U.S. dollars and, therefore, are not subject to material exchange rate fluctuations.
Income Tax Benefit
During 2017, income tax benefit from continuing operations consists primarily of the impact of foreign operations, including withholding taxes, offset by a $7.6 million tax benefit as a result of our acquisitions (see Note 2 – Acquisitions of our consolidated financial statements included elsewhere in this report), a $5.9 million tax benefit from revaluing our deferred taxes from 35% to 21% due to the Tax Cuts and Jobs Act, and a $1.6 million benefit from re-characterizing intercompany debt to equity between our U.S. and Singapore entities related to the reversal of previously accrued withholding taxes. During 2016 and 2015, income tax benefit from continuing operations consisted primarily of the impact of foreign operations, including withholding taxes, offset by a tax benefit in 2016 as a result of our acquisition.
32
The following table sets forth our results of operations for the periods presented. The period-to-period comparison of results is not necessarily indicative of results for future periods.
|
|
|
Year Ended |
|
|||||||||
|
|
|
December 29, 2017 |
|
|
December 30, 2016 |
|
|
December 25, 2015 |
|
|||
|
|
|
(in thousands) |
|
|||||||||
|
Consolidated Statements of Operations Data: |
|
|
|
|
|
|
|
|
|
|
|
|
|
Sales |
|
$ |
655,892 |
|
|
$ |
405,747 |
|
|
$ |
290,641 |
|
|
Cost of sales |
|
|
555,131 |
|
|
|
340,352 |
|
|
|
242,087 |
|
|
Gross profit |
|
|
100,761 |
|
|
|
65,395 |
|
|
|
48,554 |
|
|
Operating expenses: |
|
|
|
|
|
|
|
|
|
|
|
|
|
Research and development |
|
|
7,899 |
|
|
|
6,383 |
|
|
|
4,813 |
|
|
Selling, general, and administrative |
|
|
37,802 |
|
|
|
28,126 |
|
|
|
24,729 |
|
|
Amortization of intangible assets |
|
|
8,880 |
|
|
|
7,015 |
|
|
|
6,411 |
|
|
Total operating expenses |
|
|
54,581 |
|
|
|
41,524 |
|
|
|
35,953 |
|
|
Operating income |
|
|
46,180 |
|
|
|
23,871 |
|
|
|
12,601 |
|
|
Interest expense |
|
|
3,277 |
|
|
|
4,370 |
|
|
|
3,831 |
|
|
Other income, net |
|
|
(126 |
) |
|
|
(629 |
) |
|
|
(46 |
) |
|
Income from continuing operations before income taxes |
|
|
43,029 |
|
|
|
20,130 |
|
|
|
8,816 |
|
|
Income tax benefit from continuing operations |
|
|
(13,886 |
) |
|
|
(649 |
) |
|
|
(3,991 |
) |
|
Net income from continuing operations |
|
|
56,915 |
|
|
|
20,779 |
|
|
|
12,807 |
|
|
Discontinued operations: |
|
|
|
|
|
|
|
|
|
|
|
|
|
Loss from discontinued operations before taxes |
|
|
(722 |
) |
|
|
(4,077 |
) |
|
|
(7,406 |
) |
|
Income tax expense (benefit) from discontinued operations |
|
|
(261 |
) |
|
|
40 |
|
|
|
(225 |
) |
|
Net loss from discontinued operations |
|
|
(461 |
) |
|
|
(4,117 |
) |
|
|
(7,181 |
) |
|
Net income |
|
$ |
56,454 |
|
|
$ |
16,662 |
|
|
$ |
5,626 |
|
The following table sets forth our results of operations as a percentage of our total sales for the periods presented.
|
|
|
Year Ended |
|
|||||||||
|
|
|
December 29, 2017 |
|
|
December 30, 2016 |
|
|
December 25, 2015 |
|
|||
|
|
|
|
|
|||||||||
|
Consolidated Statements of Operations Data: |
|
|
|
|
|
|
|
|
|
|
|
|
|
Sales |
|
|
100.0 |
|
|
|
100.0 |
|
|
|
100.0 |
|
|
Cost of sales |
|
|
84.6 |
|
|
|
83.9 |
|
|
|
83.3 |
|
|
Gross profit |
|
|
15.4 |
|
|
|
16.1 |
|
|
|
16.7 |
|
|
Operating expenses: |
|
|
|
|
|
|
|
|
|
|
|
|
|
Research and development |
|
|
1.2 |
|
|
|
1.6 |
|
|
|
1.7 |
|
|
Selling, general, and administrative |
|
|
5.8 |
|
|
|
6.9 |
|
|
|
8.5 |
|
|
Amortization of intangible assets |
|
|
1.4 |
|
|
|
1.7 |
|
|
|
2.2 |
|
|
Total operating expenses |
|
|
8.3 |
|
|
|
10.2 |
|
|
|
12.4 |
|
|
Operating income |
|
|
7.0 |
|
|
|
5.9 |
|
|
|
4.3 |
|
|
Interest expense |
|
|
0.5 |
|
|
|
1.1 |
|
|
|
1.3 |
|
|
Other income, net |
|
|
0.0 |
|
|
|
(0.2 |
) |
|
|
0.0 |
|
|
Income from continuing operations before income taxes |
|
|
6.6 |
|
|
|
5.0 |
|
|
|
3.0 |
|
|
Income tax benefit from continuing operations |
|
|
(2.1 |
) |
|
|
(0.2 |
) |
|
|
(1.4 |
) |
|
Net income from continuing operations |
|
|
8.7 |
|
|
|
5.1 |
|
|
|
4.4 |
|
|
Discontinued operations: |
|
|
|
|
|
|
|
|
|
|
|
|
|
Loss from discontinued operations before taxes |
|
|
(0.1 |
) |
|
|
(1.0 |
) |
|
|
(2.5 |
) |
|
Income tax expense (benefit) from discontinued operations |
|
|
0.0 |
|
|
|
0.0 |
|
|
|
(0.1 |
) |
|
Net loss from discontinued operations |
|
|
(0.1 |
) |
|
|
(1.0 |
) |
|
|
(2.5 |
) |
|
Net income |
|
|
8.6 |
|
|
|
4.1 |
|
|
|
1.9 |
|
33
Comparison of Fiscal Years 2017 and 2016
Sales
|
|
|
Year Ended |
|
|
Change |
|
||||||||||
|
|
|
December 29, 2017 |
|
|
December 30, 2016 |
|
|
Amount |
|
|
% |
|
||||
|
|
|
(dollars in thousands) |
|
|||||||||||||
|
Sales |
|
$ |
655,892 |
|
|
$ |
405,747 |
|
|
$ |
250,145 |
|
|
|
61.7 |
% |
The increase in sales from 2016 to 2017 was primarily related to an increase in volume resulting from industry growth, our acquisitions of Cal‑Weld and Talon, and market share gains. The volume increase was due to an approximate 6.1%, or approximately $77.8 million, increase in our market share at our two largest customers, which includes the acquisitions of Cal‑Weld and Talon, and an approximately $172.3 million increase in the volume of purchases primarily by our two largest customers driven by overall industry growth. We refer to the volume of purchases from us by a customer of ours relative to its other suppliers as our market share of that customer. On a geographic basis, sales in the U.S. increased by $169.9 million in 2017 to $386.6 million. Foreign sales increased by $80.2 million in 2017 to $269.3 million.
Cost of Sales and Gross Margin
|
|
|
Year Ended |
|
|
Change |
|
||||||||||
|
|
|
December 29, 2017 |
|
|
December 30, 2016 |
|
|
Amount |
|
|
% |
|
||||
|
|
|
(dollars in thousands) |
|
|||||||||||||
|
Cost of sales |
|
$ |
555,131 |
|
|
$ |
340,352 |
|
|
$ |
214,779 |
|
|
|
63.1 |
% |
|
Gross profit |
|
$ |
100,761 |
|
|
$ |
65,395 |
|
|
$ |
35,366 |
|
|
|
54.1 |
% |
|
Gross margin |
|
|
15.4 |
% |
|
|
16.1 |
% |
|
|
|
|
|
- 70 bps |
|
|
The increase in cost of sales from 2016 to 2017 was primarily due to the increase in sales volume. The increase in absolute dollars of gross profit was driven primarily by an increase in sales volume.
As part of our purchase of Talon and Cal‑Weld, we recorded opening inventory at fair value which included a fair value adjustment to inventory of $6.2 million and $3.6 million, respectively. We released a combined $5.2 million of the fair value adjustment to cost of sales based on the sale of inventory during 2017. The impact of this charge accounts for a decrease to reported gross margin of 80 basis points for 2017.
As discussed in Note 1 – Basis of Presentation to the consolidated financial statements, we recorded a charge to cost of sales of $1.75 million in the second quarter of 2017 due to the correction of an error related to translating inventory balances at our Singapore and Malaysia subsidiaries. The impact of this charge accounts for a decrease to reported gross margin of 30 basis points in 2017.
Additionally, our gross margins for 2017 were favorably impacted by our acquisitions of Cal‑Weld and Talon, with margins that were accretive to our historical business.
Research and Development
|
|
|
Year Ended |
|
|
Change |
|
||||||||||
|
|
|
December 29, 2017 |
|
|
December 30, 2016 |
|
|
Amount |
|
|
% |
|
||||
|
|
|
(dollars in thousands) |
|
|||||||||||||
|
Research and development |
|
$ |
7,899 |
|
|
$ |
6,383 |
|
|
$ |
1,516 |
|
|
|
23.8 |
% |
The increase in research and development expenses from 2016 to 2017 was due to an increase in headcount and consulting expense to support additional projects and development programs.
34
Selling, General and Administrative
|
|
|
Year Ended |
|
|
Change |
|
||||||||||
|
|
|
December 29, 2017 |
|
|
December 30, 2016 |
|
|
Amount |
|
|
% |
|
||||
|
|
|
(dollars in thousands) |
|
|||||||||||||
|
Selling, general, and administrative |
|
$ |
37,802 |
|
|
$ |
28,126 |
|
|
$ |
9,676 |
|
|
|
34.4 |
% |
The increase in selling, general, and administrative expense from 2016 to 2017 was primarily due to increased acquisition‑related expenses from our acquisitions of Cal‑Weld and Talon, incremental Cal‑Weld and Talon operating expenses incurred subsequent to the acquisition, increased expenses resulting from the secondary offerings of our ordinary shares by Francisco Partners, increased public company costs, increased incentive compensation on improved performance to operating targets, and increased headcount expense to support increased sales volume.
Selling, general, and administrative expense also increased during 2017 due to a charge of approximately $1.0 million as a result of the final arbitration ruling on our working capital claim with the sellers of Ajax. The ruling was outside of the one year measurement period and not considered to be an adjustment to goodwill, resulting in a charge to selling, general, and administrative expense.
Amortization of Intangible Assets
|
|
|
Year Ended |
|
|
Change |
|
||||||||||
|
|
|
December 29, 2017 |
|
|
December 30, 2016 |
|
|
Amount |
|
|
% |
|
||||
|
|
|
(dollars in thousands) |
|
|||||||||||||
|
Amortization of intangibles assets |
|
$ |
8,880 |
|
|
$ |
7,015 |
|
|
$ |
1,865 |
|
|
|
26.6 |
% |
The increase in amortization expense from 2016 to 2017 was due to incremental amortization expense from intangible assets acquired in connection with our acquisition of Ajax in the second quarter of 2016, and our acquisitions of Talon and Cal‑Weld in the fourth and third quarters of 2017, respectively.
The fair value assigned to intangible assets acquired in connection with our acquisitions of Cal‑Weld and Talon is still preliminary. Amortization of intangible assets may change in future periods depending on the final fair value assigned to the assets.
Interest Expense, Net
|
|
|
Year Ended |
|
|
Change |
|
||||||||||
|
|
|
December 29, 2017 |
|
|
December 30, 2016 |
|
|
Amount |
|
|
% |
|
||||
|
|
|
(dollars in thousands) |
|
|||||||||||||
|
Interest expense, net |
|
$ |
3,277 |
|
|
$ |
4,370 |
|
|
$ |
(1,093 |
) |
|
|
-25.0 |
% |
The decrease in interest expense, net from 2016 to 2017 was due to a decrease in the average amount borrowed during 2017 as a result of the pay down of debt in December 2016 using proceeds from our IPO and a 70 basis point decrease in our average interest rate during 2017 primarily from an amendment to our Credit Facilities in connection with our acquisition of Cal‑Weld, partially offset by an additional $30.0 million in borrowings to fund our acquisition of Cal‑Weld. The additional $120.0 million in borrowings to fund our acquisition of Talon and the related impact on our average interest rate was not significant to 2017 results due to the short period of time the additional borrowing were outstanding during 2017.
Total borrowings outstanding at December 29, 2017, net of debt issuance costs, was $186.7 million, compared to $37.9 million at December 30, 2016.
35
|
|
|
Year Ended |
|
|
Change |
|
||||||||||
|
|
|
December 29, 2017 |
|
|
December 30, 2016 |
|
|
Amount |
|
|
% |
|
||||
|
|
|
(dollars in thousands) |
|
|||||||||||||
|
Other expense (income), net |
|
$ |
(126 |
) |
|
$ |
(629 |
) |
|
$ |
503 |
|
|
|
-80.0 |
% |
The decrease in other income, net from 2016 to 2017 was primarily due to exchange rate fluctuations on transactions denominated in the local currencies of our foreign operations, principally the Singapore Dollar, Malaysian Ringgit, and British Pound, partially offset by a gain on the sale of our cost method investment, CHawk Technology International, Inc. (“CHawk”) of $0.2 million that occurred in the first quarter of 2017.
Income Tax Benefit from Continuing Operations
|
|
|
Year Ended |
|
|
Change |
|
||||||||||
|
|
|
December 29, 2017 |
|
|
December 30, 2016 |
|
|
Amount |
|
|
% |
|
||||
|
|
|
(dollars in thousands) |
|
|||||||||||||
|
Income tax benefit from continuing operations |
|
$ |
(13,886 |
) |
|
$ |
(649 |
) |
|
$ |
(13,237 |
) |
|
|
2039.6 |
% |
During 2017, income tax benefit from continuing operations consists primarily of the impact of foreign operations, including withholding taxes, offset by a $7.6 million tax benefit as a result of our acquisitions of Talon and Cal‑Weld, a $5.9 million tax benefit from revaluing our deferred taxes from 35% to 21% due to the Tax Cuts and Jobs Act, and a $1.6 million benefit from re-characterizing intercompany debt to equity between our U.S. and Singapore entities related to the reversal of previously accrued withholding taxes. This compares to a discrete tax benefit of only $2.3 million in 2016 in connection with our acquisition of Ajax.
Comparison of Fiscal Years 2016 and 2015
Sales
|
|
|
Year Ended |
|
|
Change |
|
||||||||||
|
|
|
December 30, 2016 |
|
|
December 25, 2015 |
|
|
Amount |
|
|
% |
|
||||
|
|
|
(dollars in thousands) |
|
|||||||||||||
|
Sales |
|
$ |
405,747 |
|
|
$ |
290,641 |
|
|
$ |
115,106 |
|
|
|
39.6 |
% |
The increase in sales from 2015 to 2016 was primarily related to an increase in sales volume. The sales volume increase was due to an approximate 7%, or approximately $48.1 million, increase in our market share at our two largest customers, and an approximately $47.0 million increase in the volume of purchases by our two largest customers driven by overall industry growth. We refer to the volume of purchases from us by a customer of ours relative to its other suppliers as our market share of that customer. Ajax contributed $20.0 million to our sales during 2016. On a geographic basis, sales in the United States increased by $58.9 million in 2016 to $216.6 million. Foreign sales increased by $56.2 million in 2016 to $189.1 million.
Cost of Sales and Gross Margin
|
|
|
Year Ended |
|
|
Change |
|
||||||||||
|
|
|
December 30, 2016 |
|
|
December 25, 2015 |
|
|
Amount |
|
|
% |
|
||||
|
|
|
(dollars in thousands) |
|
|||||||||||||
|
Cost of sales |
|
$ |
340,352 |
|
|
$ |
242,087 |
|
|
$ |
98,265 |
|
|
|
40.6 |
% |
|
Gross profit |
|
$ |
65,395 |
|
|
$ |
48,554 |
|
|
$ |
16,841 |
|
|
|
34.7 |
% |
|
Gross margin |
|
|
16.1 |
% |
|
|
16.7 |
% |
|
|
|
|
|
- 60 bps |
|
|
The increase in cost of sales from 2015 to 2016 was primarily due to the increase in sales.
The increase in absolute dollars of gross profit from 2015 to 2016 was driven primarily by an increase in sales volume.
36
The decline in gross margin percentage from 2015 to 2016 was primarily due to a decline in margin at individual customers and a shift in customer mix during 2016.
Research and Development
|
|
|
Year Ended |
|
|
Change |
|
||||||||||
|
|
|
December 30, 2016 |
|
|
December 25, 2015 |
|
|
Amount |
|
|
% |
|
||||
|
|
|
(dollars in thousands) |
|
|||||||||||||
|
Research and development |
|
$ |
6,383 |
|
|
$ |
4,813 |
|
|
$ |
1,570 |
|
|
|
32.6 |
% |
The increase in research and development expenses from 2015 to 2016 was due to an increase in headcount and consulting expense to support additional projects.
Selling, General and Administrative
|
|
|
Year Ended |
|
|
Change |
|
||||||||||
|
|
|
December 30, 2016 |
|
|
December 25, 2015 |
|
|
Amount |
|
|
% |
|
||||
|
|
|
(dollars in thousands) |
|
|||||||||||||
|
Selling, general and administrative |
|
$ |
28,126 |
|
|
$ |
24,729 |
|
|
$ |
3,397 |
|
|
|
13.7 |
% |
The increase in selling, general, and administrative expenses from 2015 to 2016 was due to a $2.1 million increase in share-based compensation expenses, $1.5 million in incremental operating expenses from Ajax, and $1.3 million in acquisition-related transaction costs, partially offset by a $1.4 million decrease in initial public offering expenses. Initial public offering expenses incurred in 2015 were expensed, while those costs incurred in 2016 in relation to our December IPO were offset against proceeds.
Interest Expense, Net
|
|
|
Year Ended |
|
|
Change |
|
||||||||||
|
|
|
December 30, 2016 |
|
|
December 25, 2015 |
|
|
Amount |
|
|
% |
|
||||
|
|
|
(dollars in thousands) |
|
|||||||||||||
|
Interest expense, net |
|
$ |
4,370 |
|
|
$ |
3,831 |
|
|
$ |
539 |
|
|
|
14.1 |
% |
The increase in interest expense, net from 2015 to 2016 was due to a $12.9 million increase in the average amount borrowed in 2016 as a result of additional borrowings used to fund the Ajax acquisition. Prevailing interest rates were comparable during those periods.
We paid down $40.0 million of borrowings in December 2016 using proceeds from our IPO. Total borrowings outstanding at December 25, 2015, net of debt issuance costs, was $62.6 million, compared to $37.9 million at December 30, 2016.
Other Expense (Income), Net
|
|
|
Year Ended |
|
|
Change |
|
||||||||||
|
|
|
December 30, 2016 |
|
|
December 25, 2015 |
|
|
Amount |
|
|
% |
|
||||
|
|
|
(dollars in thousands) |
|
|||||||||||||
|
Other expense (income), net |
|
$ |
(629 |
) |
|
$ |
(46 |
) |
|
$ |
(583 |
) |
|
|
1267.4 |
% |
The change in other expense (income), net from 2015 to 2016 was due to exchange rate fluctuations on transactions denominated in the local currencies of our foreign operations, principally the Singapore Dollar, Malaysian Ringgit, and British Pound. Additionally, we recorded $0.2 million in investment income in 2016 related to our equity method investment.
37
Income Tax Benefit from Continuing Operations
|
|
|
Year Ended |
|
|
Change |
|
||||||||||
|
|
|
December 30, 2016 |
|
|
December 25, 2015 |
|
|
Amount |
|
|
% |
|
||||
|
|
|
(dollars in thousands) |
|
|||||||||||||
|
Income tax benefit from continuing operations |
|
$ |
(649 |
) |
|
$ |
(3,991 |
) |
|
$ |
3,342 |
|
|
|
-83.7 |
% |
The decrease in the income tax benefit from continuing operations from 2015 to 2016 was primarily due to the valuation allowance against substantially all U.S. federal and state net deferred tax assets which was originally recorded during the fourth quarter of 2015. During the fourth quarter of 2015, we determined that it is more likely than not that our U.S. entities will not generate sufficient taxable income to offset reversing deductible temporary differences and to fully utilize tax attribute carryforwards. As a result, we recorded a valuation allowance to reduce our U.S. federal and state deferred tax assets to the amount that is more likely than not to be realized.
Non-GAAP Results
Management uses non-GAAP adjusted net income from continuing operations to evaluate Ichor’s operating and financial results. Ichor believes the presentation of non-GAAP results is useful to investors for analyzing business trends and comparing performance to prior periods, along with enhancing investors’ ability to view Ichor’s results from management’s perspective. Non-GAAP adjusted net income from continuing operations is defined as: (1) net income from continuing operations; (2) excluding amortization of intangible assets, share-based compensation expense, non-recurring expenses including adjustments to the cost of goods sold and a loss on the Ajax acquisition arbitration settlement, and the tax adjustments related to those non-GAAP adjustments; and (3) non-recurring discrete tax items including tax benefits from acquisitions, the tax benefit from re-characterizing intercompany debt to equity, and the tax impact from enactment of the Tax Act. Non-GAAP adjusted diluted EPS is defined as non-GAAP adjusted net income from continuing operations divided by adjusted diluted ordinary shares, which assumes the IPO shares sold, conversion of preferred shares into ordinary shares, and vesting of restricted shares and options that vested at the IPO occurred at the beginning of the measurement period. No adjustment to GAAP diluted ordinary shares was necessary for 2017.
The following table presents our non-GAAP adjusted net income from continuing operations and a reconciliation from net income from continuing operations, the most comparable GAAP measure, for the periods indicated:
|
|
|
Year Ended |
|
|||||||||
|
|
|
December 29, 2017 |
|
|
December 30, 2016 |
|
|
December 25, 2015 |
|
|||
|
|
|
(in thousands, except share and per share amounts) |
|
|||||||||
|
Non-GAAP Data: |
|
|
|
|
|
|
|
|
|
|
|
|
|
Net income from continuing operations |
|
$ |
56,915 |
|
|
$ |
20,779 |
|
|
$ |
12,807 |
|
|
Non-GAAP adjustments: |
|
|
|
|
|
|
|
|
|
|
|
|
|
Amortization of intangible assets |
|
|
8,880 |
|
|
|
7,015 |
|
|
|
6,411 |
|
|
Share-based compensation |
|
|
2,230 |
|
|
|
3,216 |
|
|
|
1,118 |
|
|
Other non-recurring expenses, net (1) |
|
|
4,767 |
|
|
|
2,988 |
|
|
|
4,154 |
|
|
Tax adjustments related to non-GAAP adjustments |
|
|
(626 |
) |
|
|
(131 |
) |
|
|
(4,241 |
) |
|
Tax benefit from acquisitions (2) |
|
|
(7,582 |
) |
|
|
(2,271 |
) |
|
|
— |
|
|
Tax benefit from re-characterizing intercompany debt to equity (3) |
|
|
(1,627 |
) |
|
|
— |
|
|
|
— |
|
|
Tax impact from tax law change (4) |
|
|
(5,911 |
) |
|
|
— |
|
|
|
— |
|
|
Adjustments to cost of goods sold (5) |
|
|
1,752 |
|
|
|
— |
|
|
|
— |
|
|
Fair value adjustment to inventory from acquisitions (6) |
|
|
5,230 |
|
|
|
— |
|
|
|
— |
|
|
Loss on Ajax acquisition arbitration settlement (7) |
|
|
1,032 |
|
|
|
— |
|
|
|
— |
|
|
Non-GAAP adjusted net income from continuing operations |
|
$ |
65,060 |
|
|
$ |
31,596 |
|
|
$ |
20,249 |
|
|
Non-GAAP adjusted diluted EPS |
|
$ |
2.48 |
|
|
$ |
1.31 |
|
|
$ |
0.85 |
|
|
Shares used to compute diluted EPS (8) |
|
|
26,218,424 |
|
|
|
24,188,881 |
|
|
|
23,779,908 |
|
38
|
|
(i) acquisition-related expenses, (ii) bonuses paid to members of our management in connection with the cash dividend paid by us in August 2015, (iii) consulting fees paid to FPC, and (iv) IPO preparation expenses. |
|
|
|
(2) |
We recorded $7.6 million in tax benefits during 2017 in connection with our acquisitions of Talon and Cal-Weld. We recorded $2.3 million in tax benefits in 2016 in connection with its acquisition of Ajax. |
|
|
|
(3) |
In the third quarter of 2017 we re-characterized intercompany debt to equity between our U.S. and Singapore entities resulting in a tax benefit of $1.6 million related to the reversal of previously accrued withholding taxes. |
|
|
|
(4) |
This adjustment represents the impact of the Tax Cuts and Jobs Act, including revaluing our deferred tax assets from 35% to 21%. |
|
|
|
(5) |
During the second quarter of 2017, we corrected an error related to translating the inventory balances at our Malaysia and Singapore subsidiaries at an incorrect foreign currency rate. The error arose in prior period financial statements beginning in periods prior to 2014 and through 2016. The correction resulted in a $1.75 million increase in cost of sales and a corresponding decrease in gross profit in our consolidated statement of operations and a decrease to inventories in our consolidated balance sheet during the second quarter of 2017. |
|
|
|
(6) |
As part of our purchase price allocation for our acquisition of Talon and Cal‑Weld, we recorded inventory at fair value, resulting in a fair value step‑up to acquired inventory of $6.2 million and $3.6 million, respectively. As the related inventory was sold during 2017, we released $1.6 million and $3.6 million of Talon and Cal‑Weld’s step‑up, respectively, to cost of sales. |
|
|
|
(7) |
During the third quarter of 2017, we received a final arbitration ruling on our working capital claim with the sellers of Ajax. The ruling was outside the one year measurement period and therefore could not be considered an adjustment to goodwill, resulting in a charge to selling, general, and administrative expense. |
|
|
|
(8) |
For 2016 and 2015, assumes the shares sold, the conversion of preferred shares into ordinary shares, and vesting of restricted shares and options in connection with our December 2016 IPO occurred at the beginning of each period, for comparability between periods. No adjustment to GAAP diluted ordinary shares was necessary for 2017. |
|
Non-GAAP adjusted net income from continuing operations has limitations as an analytical tool, and you should not consider it in isolation or as a substitute for net income or any of our other operating results reported under GAAP. Other companies may calculate adjusted net income differently or may use other measures to evaluate their performance, both of which could reduce the usefulness of our adjusted net income as a tool for comparison.
Because of these limitations, you should consider non-GAAP adjusted net income from continuing operations alongside other financial performance measures, including net income from continuing operations and other financial results presented in accordance with GAAP. In addition, in evaluating non-GAAP adjusted net income, you should be aware that in the future we will incur expenses such as those that are the subject of adjustments in deriving adjusted net income and you should not infer from our presentation of adjusted net income that our future results will not be affected by these expenses or any unusual or non-recurring items.
39
Unaudited Quarterly Financial Results
The following table set forth statement of operations data for the periods indicated. The information for each of these periods is unaudited and has been prepared on the same basis as our audited consolidated financial statements included herein and includes all adjustments, consisting only of normal recurring adjustments that we consider necessary for a fair presentation of our unaudited operations data for the periods presented. Historical results are not necessarily indicative of the results to be expected in the future.
|
|
|
Three Months Ended |
|
|||||||||||||||||||||||||||||
|
|
|
December 29, 2017 |
|
|
September 29, 2017 |
|
|
June 30, 2017 |
|
|
March 31, 2017 |
|
|
December 30, 2016 |
|
|
September 23, 2016 |
|
|
June 24, 2016 |
|
|
March 25, 2016 |
|
||||||||
|
|
|
(in thousands, except share and per share amounts) |
|
|||||||||||||||||||||||||||||
|
Sales |
|
$ |
182,936 |
|
|
$ |
164,519 |
|
|
$ |
159,733 |
|
|
$ |
148,704 |
|
|
$ |
131,408 |
|
|
$ |
105,687 |
|
|
$ |
95,365 |
|
|
$ |
73,287 |
|
|
Cost of sales |
|
|
153,892 |
|
|
|
140,323 |
|
|
|
136,227 |
|
|
|
124,689 |
|
|
|
110,003 |
|
|
|
88,802 |
|
|
|
80,185 |
|
|
|
61,362 |
|
|
Gross profit |
|
|
29,044 |
|
|
|
24,196 |
|
|
|
23,506 |
|
|
|
24,015 |
|
|
|
21,405 |
|
|
|
16,885 |
|
|
|
15,180 |
|
|
|
11,925 |
|
|
Operating expenses: |
|
|
|
|
|
|
|
|
|
|
|
|
|
|
|
|
|
|
|
|
|
|
|
|
|
|
|
|
|
|
|
|
|
Research and development |
|
|
2,213 |
|
|
|
1,992 |
|
|
|
1,950 |
|
|
|
1,744 |
|
|
|
2,154 |
|
|
|
1,564 |
|
|
|
1,290 |
|
|
|
1,375 |
|
|
Selling, general and administrative |
|
|
11,530 |
|
|
|
11,430 |
|
|
|
7,984 |
|
|
|
6,858 |
|
|
|
7,797 |
|
|
|
6,782 |
|
|
|
7,183 |
|
|
|
6,364 |
|
|
Amortization of intangible assets |
|
|
3,062 |
|
|
|
2,220 |
|
|
|
1,803 |
|
|
|
1,795 |
|
|
|
1,805 |
|
|
|
1,804 |
|
|
|
1,803 |
|
|
|
1,603 |
|
|
Total operating expenses |
|
|
16,805 |
|
|
|
15,642 |
|
|
|
11,737 |
|
|
|
10,397 |
|
|
|
11,756 |
|
|
|
10,150 |
|
|
|
10,276 |
|
|
|
9,342 |
|
|
Operating income |
|
|
12,239 |
|
|
|
8,554 |
|
|
|
11,769 |
|
|
|
13,618 |
|
|
|
9,649 |
|
|
|
6,735 |
|
|
|
4,904 |
|
|
|
2,583 |
|
|
Interest expense |
|
|
1,173 |
|
|
|
739 |
|
|
|
675 |
|
|
|
690 |
|
|
|
1,125 |
|
|
|
1,183 |
|
|
|
1,160 |
|
|
|
902 |
|
|
Other expense (income), net |
|
|
199 |
|
|
|
73 |
|
|
|
151 |
|
|
|
(549 |
) |
|
|
(245 |
) |
|
|
(241 |
) |
|
|
244 |
|
|
|
(387 |
) |
|
Income (loss) from continuing operations before income taxes |
|
|
10,867 |
|
|
|
7,742 |
|
|
|
10,943 |
|
|
|
13,477 |
|
|
|
8,769 |
|
|
|
5,793 |
|
|
|
3,500 |
|
|
|
2,068 |
|
|
Income tax expense (benefit) from continuing operations |
|
|
(8,328 |
) |
|
|
(6,556 |
) |
|
|
473 |
|
|
|
525 |
|
|
|
778 |
|
|
|
(1,888 |
) |
|
|
225 |
|
|
|
236 |
|
|
Net income from continuing operations |
|
|
19,195 |
|
|
|
14,298 |
|
|
|
10,470 |
|
|
|
12,952 |
|
|
|
7,991 |
|
|
|
7,681 |
|
|
|
3,275 |
|
|
|
1,832 |
|
|
Discontinued operations: |
|
|
|
|
|
|
|
|
|
|
|
|
|
|
|
|
|
|
|
|
|
|
|
|
|
|
|
|
|
|
|
|
|
Income (loss) from discontinued operations before taxes |
|
|
(1 |
) |
|
|
— |
|
|
|
(610 |
) |
|
|
(111 |
) |
|
|
(64 |
) |
|
|
16 |
|
|
|
(2,305 |
) |
|
|
(1,724 |
) |
|
Income tax expense (benefit) from discontinued operations |
|
|
(270 |
) |
|
|
8 |
|
|
|
— |
|
|
|
1 |
|
|
|
14 |
|
|
|
23 |
|
|
|
2 |
|
|
|
1 |
|
|
Net loss from discontinued operations |
|
|
269 |
|
|
|
(8 |
) |
|
|
(610 |
) |
|
|
(112 |
) |
|
|
(78 |
) |
|
|
(7 |
) |
|
|
(2,307 |
) |
|
|
(1,725 |
) |
|
Net income |
|
|
19,464 |
|
|
|
14,290 |
|
|
|
9,860 |
|
|
|
12,840 |
|
|
|
7,913 |
|
|
|
7,674 |
|
|
|
968 |
|
|
|
107 |
|
|
Less: Preferred share dividend |
|
|
— |
|
|
|
— |
|
|
|
— |
|
|
|
— |
|
|
|
— |
|
|
|
— |
|
|
|
— |
|
|
|
— |
|
|
Less: Undistributed earnings attributable to preferred shareholders |
|
|
— |
|
|
|
— |
|
|
|
— |
|
|
|
— |
|
|
|
(5,666 |
) |
|
|
(7,628 |
) |
|
|
(963 |
) |
|
|
(107 |
) |
|
Net income attributable to ordinary shareholders |
|
$ |
19,464 |
|
|
$ |
14,290 |
|
|
$ |
9,860 |
|
|
$ |
12,840 |
|
|
$ |
2,247 |
|
|
$ |
46 |
|
|
$ |
5 |
|
|
$ |
— |
|
|
Diluted net income per share from continuing operations attributable to ordinary shareholders: (1) |
|
$ |
0.72 |
|
|
$ |
0.54 |
|
|
$ |
0.40 |
|
|
$ |
0.51 |
|
|
$ |
0.39 |
|
|
$ |
0.08 |
|
|
$ |
0.06 |
|
|
$ |
0.03 |
|
|
Diluted net income per share attributable to ordinary shareholders: (1) |
|
$ |
0.73 |
|
|
$ |
0.54 |
|
|
$ |
0.38 |
|
|
$ |
0.50 |
|
|
$ |
0.38 |
|
|
$ |
0.08 |
|
|
$ |
0.02 |
|
|
$ |
— |
|
|
Shares used to compute diluted net income (loss) per share from continuing operations attributable to ordinary shareholders: |
|
|
26,656,065 |
|
|
|
26,278,147 |
|
|
|
26,063,527 |
|
|
|
25,640,089 |
|
|
|
5,870,331 |
|
|
|
542,949 |
|
|
|
277,554 |
|
|
|
249,889 |
|
|
Shares used to compute diluted net income (loss) per share attributable to ordinary shareholders: |
|
|
26,656,065 |
|
|
|
26,278,147 |
|
|
|
26,063,527 |
|
|
|
25,640,089 |
|
|
|
5,870,331 |
|
|
|
542,949 |
|
|
|
277,554 |
|
|
|
65,673 |
|
|
|
(1) |
See Note 14 – Earnings per Share of our consolidated financial statements included elsewhere in this report for a description of net income per share attributable to ordinary shareholders presented in conformity with the two-class method, required for participating securities. |
|
40
The following table sets forth our unaudited quarterly consolidated statement of operations data as a percentage of sales for each of the last eight quarters in the period ended December 29, 2017.
|
|
|
Three Months Ended |
|
|||||||||||||||||||||||||||||
|
|
|
December 29, 2017 |
|
|
September 29, 2017 |
|
|
June 30, 2017 |
|
|
March 31, 2017 |
|
|
December 30, 2016 |
|
|
September 23, 2016 |
|
|
June 24, 2016 |
|
|
March 25, 2016 |
|
||||||||
|
|
|
|
|
|||||||||||||||||||||||||||||
|
Sales |
|
|
100.0 |
|
|
|
100.0 |
|
|
|
100.0 |
|
|
|
100.0 |
|
|
|
100.0 |
|
|
|
100.0 |
|
|
|
100.0 |
|
|
|
100.0 |
|
|
Cost of sales |
|
|
84.1 |
|
|
|
85.3 |
|
|
|
85.3 |
|
|
|
83.9 |
|
|
|
83.7 |
|
|
|
84.0 |
|
|
|
84.1 |
|
|
|
83.7 |
|
|
Gross profit |
|
|
15.9 |
|
|
|
14.7 |
|
|
|
14.7 |
|
|
|
16.1 |
|
|
|
16.3 |
|
|
|
16.0 |
|
|
|
15.9 |
|
|
|
16.3 |
|
|
Operating expenses: |
|
|
|
|
|
|
|
|
|
|
|
|
|
|
|
|
|
|
|
|
|
|
|
|
|
|
|
|
|
|
|
|
|
Research and development |
|
|
1.2 |
|
|
|
1.2 |
|
|
|
1.2 |
|
|
|
1.2 |
|
|
|
1.6 |
|
|
|
1.5 |
|
|
|
1.4 |
|
|
|
1.9 |
|
|
Selling, general and administrative |
|
|
6.3 |
|
|
|
6.9 |
|
|
|
5.0 |
|
|
|
4.6 |
|
|
|
5.9 |
|
|
|
6.4 |
|
|
|
7.5 |
|
|
|
8.7 |
|
|
Amortization of intangible assets |
|
|
1.7 |
|
|
|
1.3 |
|
|
|
1.1 |
|
|
|
1.2 |
|
|
|
1.4 |
|
|
|
1.7 |
|
|
|
1.9 |
|
|
|
2.2 |
|
|
Total operating expenses |
|
|
9.2 |
|
|
|
9.5 |
|
|
|
7.3 |
|
|
|
7.0 |
|
|
|
8.9 |
|
|
|
9.6 |
|
|
|
10.8 |
|
|
|
12.7 |
|
|
Operating income |
|
|
6.7 |
|
|
|
5.2 |
|
|
|
7.4 |
|
|
|
9.2 |
|
|
|
7.3 |
|
|
|
6.4 |
|
|
|
5.1 |
|
|
|
3.5 |
|
|
Interest expense |
|
|
0.6 |
|
|
|
0.4 |
|
|
|
0.4 |
|
|
|
0.5 |
|
|
|
0.9 |
|
|
|
1.1 |
|
|
|
1.2 |
|
|
|
1.2 |
|
|
Other expense (income), net |
|
|
0.1 |
|
|
|
0.0 |
|
|
|
0.1 |
|
|
|
(0.4 |
) |
|
|
(0.2 |
) |
|
|
(0.2 |
) |
|
|
0.3 |
|
|
|
(0.5 |
) |
|
Income (loss) from continuing operations before income taxes |
|
|
5.9 |
|
|
|
4.7 |
|
|
|
6.9 |
|
|
|
9.1 |
|
|
|
6.7 |
|
|
|
5.5 |
|
|
|
3.7 |
|
|
|
2.8 |
|
|
Income tax expense (benefit) from continuing operations |
|
|
(4.6 |
) |
|
|
(4.0 |
) |
|
|
0.3 |
|
|
|
0.4 |
|
|
|
0.6 |
|
|
|
(1.8 |
) |
|
|
0.2 |
|
|
|
0.3 |
|
|
Net income from continuing operations |
|
|
10.5 |
|
|
|
8.7 |
|
|
|
6.6 |
|
|
|
8.7 |
|
|
|
6.1 |
|
|
|
7.3 |
|
|
|
3.4 |
|
|
|
2.5 |
|
|
Discontinued operations: |
|
|
|
|
|
|
|
|
|
|
|
|
|
|
|
|
|
|
|
|
|
|
|
|
|
|
|
|
|
|
|
|
|
Income (loss) from discontinued operations before taxes |
|
|
0.0 |
|
|
|
0.0 |
|
|
|
(0.4 |
) |
|
|
(0.1 |
) |
|
|
0.0 |
|
|
|
0.0 |
|
|
|
(2.4 |
) |
|
|
(2.4 |
) |
|
Income tax expense (benefit) from discontinued operations |
|
|
(0.1 |
) |
|
|
0.0 |
|
|
|
0.0 |
|
|
|
0.0 |
|
|
|
0.0 |
|
|
|
0.0 |
|
|
|
0.0 |
|
|
|
0.0 |
|
|
Net loss from discontinued operations |
|
|
0.1 |
|
|
|
0.0 |
|
|
|
(0.4 |
) |
|
|
(0.1 |
) |
|
|
(0.1 |
) |
|
|
0.0 |
|
|
|
(2.4 |
) |
|
|
(2.4 |
) |
|
Net income |
|
|
10.6 |
|
|
|
8.7 |
|
|
|
6.2 |
|
|
|
8.6 |
|
|
|
6.0 |
|
|
|
7.3 |
|
|
|
1.0 |
|
|
|
0.1 |
|
Seasonality
We have not historically experienced meaningful seasonality with respect to our business or results of operations.
Liquidity and Capital Resources
We had cash and restricted cash of $69.3 million as of December 29, 2017, compared to $52.6 million as of December 30, 2016. Our principal uses of liquidity are to fund our working capital needs, satisfy our debt obligations, and purchase new capital equipment. The increase in cash is primarily due to proceeds from the issuance of $150.0 million in long-term debt and cash from operations of $38.8 million, partially offset by cash paid for our acquisitions of Cal‑Weld and Talon of $181.0 million and capital expenditures of $8.2 million.
We believe that our cash, the amounts available under our Credit Facilities and our cash flows from operations, together with the net proceeds from our IPO, will be sufficient to meet our anticipated cash needs for working capital and capital expenditures for at least the next 12 months.
41
The following table sets forth a summary of operating, investing, and financing activities for the periods presented:
|
|
|
Year Ended |
|
|||||||||
|
|
|
December 29, 2017 |
|
|
December 30, 2016 |
|
|
December 25, 2015 |
|
|||
|
|
|
(in thousands) |
|
|||||||||
|
Cash provided by operating activities |
|
$ |
38,803 |
|
|
$ |
27,730 |
|
|
$ |
26,690 |
|
|
Cash used in investing activities |
|
|
(186,751 |
) |
|
|
(21,202 |
) |
|
|
(1,367 |
) |
|
Cash provided by (used in) financing activities |
|
|
164,604 |
|
|
|
21,932 |
|
|
|
(15,508 |
) |
|
Net increase in cash and restricted cash |
|
$ |
16,656 |
|
|
$ |
28,460 |
|
|
$ |
9,815 |
|
Operating Activities
We generated $38.8 million of cash from operating activities during 2017 due to net income of $56.5 million, partially offset by net non‑cash charges of $(0.2) million and an increase in our net operating assets and liabilities of $17.4 million. Non‑cash charges primarily related to $12.5 million in depreciation and amortization, $2.2 million in share-based compensation, and $0.6 million in amortization of debt issuance cost, offset by $15.3 million in deferred tax benefit and a gain on the sale of our investment in CHawk of $0.2 million. The increase in net operating assets and liabilities was primarily due to an increase in inventories of $43.4 million in order to meet sales demand in the first quarter of 2018, partially offset by an increase in accounts payable of $22.6 million and prepaid expenses and other assets of $3.4 million.
We generated $27.7 million of cash from operating activities during 2016 due to net income of $16.7 million, non-cash charges of $10.8 million, and a net decrease of $0.2 million in our net operating assets and liabilities. Non-cash charges primarily related to $9.5 million in depreciation and amortization, $3.2 million in share-based compensation, and $0.5 million in amortization of debt issuance cost, offset in part by $2.4 million in deferred tax benefit. The decrease in net operating assets and liabilities was primarily due to an increase in accounts payable of $36.8 million resulting from increased materials purchased to support higher sales volumes. The decrease in our net operating assets and liabilities was partially offset by an increase of $9.0 million in accounts receivable due to increased sales and timing of customer payments, an increase in inventory of $23.7 million due to anticipated sales in the first quarter of 2017, and a decrease in customer deposits of $4.2 million arising from a reduction in customer orders associated with discontinued operations.
We generated $26.7 million of cash from operating activities during 2015 due to net income of $5.6 million and non-cash charges of $10.1 million, and a net increase of $10.9 million in our net operating assets and liabilities. Non-cash charges primarily related to $9.9 million in depreciation and amortization, $1.1 million in share-based compensation, $3.2 million related to the impairment of intangible and fixed assets and $0.5 million write-off of debt issuance costs, partially offset by $4.9 million in deferred tax benefit. The net change in our operating assets and liabilities was primarily the result of a $9.1 million decrease in inventory due to our initiative to reduce our inventory in the fourth quarter of 2015, a decrease in accounts receivable of $6.3 million due to the timing of customer payments, partially offset by the decrease, in customer deposit of $3.5 million and accounts payable of $1.7 million.
Investing Activities
Cash used in investing activities during 2017 was $186.8 million. We used approximately $137.0 million and $56.9 million to acquire Talon and Cal‑Weld, respectively, and $8.2 million to fund capital expenditures to purchase test fixtures and leasehold improvements primarily related to our plant expansions in the United States and Malaysia. These outflows were partially offset by proceeds from the sale of our investments in Ajax Foresight Global Manufacturing Sdn. Bhd. (“AFGM”) and CHawk and the settlement of a note receivable from AFGM of $2.4 million.
Cash used in investing activities during 2016 was $21.2 million. We used $17.4 million, net of cash acquired, to acquire Ajax and $4.3 million from capital expenditures to purchase test fixtures and leasehold improvements primarily related to our plant expansions in the United States and Malaysia, partially offset by proceeds from sales of certain intangible and fixed assets totaling $0.5 million.
Cash used in investing activities during 2015 was $1.4 million from capital expenditures for the purchase of property and equipment relating to our manufacturing footprint in our Oregon, Texas, and corporate facilities.
42
We generated $164.6 million of cash from financing activities during 2017, which primarily consisted of $150.0 million in proceeds from the issuance of long-term debt to fund our acquisitions of Talon and Cal‑Weld, $9.1 million in proceeds from employees’ and directors’ exercise of stock options, and $7.3 million of proceeds from the exercise of the underwriters’ over‑allotment option in January 2017 in connection with our December 2016 IPO, partially offset by $1.5 million in financing costs associated with the issuance of long-term debt.
We generated $21.9 million of cash from financing during 2016, which consisted of net proceeds from our IPO of $47.1 million and $27.0 million of proceeds from borrowings under our Credit Facilities, partially offset by $52.2 million used to partially repay amounts owed under our Credit Facilities.
We used $15.5 million of cash in financing activities during 2015, which consisted of $69.8 million for the repayment of bank borrowings offset in part by $79.0 million in proceeds from new bank borrowings. We also paid cash dividends to our shareholders of $22.1 million and $2.6 million in fees related to the refinancing of our indebtedness, including the entry into our Credit Facilities.
Subsequent Events
Subsequent events are events or transactions that occur after the balance sheet date but before financial statements are issued. For a description of subsequent events, please review the information provided in Note 16 – Subsequent Events of our consolidated financial statements in Part IV, Item 15 of this report on Form 10‑K.
Credit Facilities
For a description of our Credit Facilities, please review the information provided in Note 9 – Credit Facilities of our consolidated financial statements included in Part IV, Item 15 of this report on Form 10‑K.
Share Repurchase Program
In February 2018, our board of directors authorized a share repurchase program up to $50.0 million under which we may repurchase our ordinary shares in the open market or through privately negotiated transactions, depending on market conditions and other factors. We expect to fund share repurchases with cash on hand or borrowings under our Revolving Credit Facility. As of the date of this report, the Company has repurchased approximately $5.0 million of its ordinary shares.
Contractual Obligations and Commitments
The following summarizes our contractual obligations and commitments as of December 29, 2017:
|
|
|
Payments Due by Period |
|
|||||||||||||||||
|
|
|
Total |
|
|
Less Than 1 Year |
|
|
1-3 Years |
|
|
3-5 Years |
|
|
More Than 5 Years |
|
|||||
|
|
|
(in thousands) |
|
|||||||||||||||||
|
Operating leases |
|
$ |
11,668 |
|
|
$ |
3,516 |
|
|
$ |
4,775 |
|
|
$ |
3,003 |
|
|
$ |
374 |
|
|
Long-term debt obligations, principal (1) |
|
|
189,535 |
|
|
|
6,490 |
|
|
|
183,045 |
|
|
|
— |
|
|
|
— |
|
|
Long-term debt obligations, interest (2) |
|
|
21,943 |
|
|
|
7,842 |
|
|
|
14,101 |
|
|
|
— |
|
|
|
— |
|
|
Total |
|
$ |
223,146 |
|
|
$ |
17,848 |
|
|
$ |
201,921 |
|
|
$ |
3,003 |
|
|
$ |
374 |
|
|
|
(1) |
Represents the contractually required principal payments under our Credit Facilities in accordance with the required principal payment schedule. |
|
|
|
(2) |
Represents the contractually required interest payments under our Credit Facilities in accordance with the required interest payment schedule. Interest costs have been estimated based on interest rates in effect for such indebtedness as of December 29, 2017. |
|
43
Critical Accounting Policies and Estimates
Our consolidated financial statements have been prepared in accordance with U.S. generally accepted accounting principles. The preparation of these consolidated financial statements requires us to make estimates and assumptions that affect the reported amounts of assets, liabilities, sales, expenses, and related disclosures. We base our estimates on historical experience and on various other assumptions that we believe are reasonable under the circumstances. We evaluate our estimates and assumptions on an ongoing basis. Actual results may differ from these estimates. To the extent that there are material differences between these estimates and our actual results, our future financial statements will be affected.
The critical accounting policies requiring estimates, assumptions, and judgments that we believe have the most significant impact on our consolidated financial statements are described below.
Revenue Recognition
Product sales are recognized when there is persuasive evidence of an arrangement, product delivery has occurred, the sales price is fixed or determinable, and collectability is reasonably assured. Our shipping terms are FOB shipping point or FOB destination, or equivalent terms, and accordingly, sales are recognized when legal title has passed to the customer upon shipment or delivery. Title and risk of loss generally pass to the customer at the time of delivery of the product to a common carrier. All amounts billed to a customer related to shipping and handling are classified as sales, while all costs incurred by us for shipping and handling are classified as cost of sales.
Sales are recognized when all of the following criteria are met:
|
|
• |
we enter into a legally binding arrangement with a customer; |
|
|
• |
we ship the product; |
|
|
• |
we determine the fee is fixed or determinable based on the payment terms associated with the transaction and free of contingencies or significant uncertainties; and |
|
|
• |
collectability is reasonably assured. We assess collectability based on credit analysis and payment history. We require collateral, typically cash, in the normal course of business if customers do not meet its criteria established for offering credit. |
Inventory Valuation
We write down the carrying value of our inventory to net realizable value for estimated obsolescence or unmarketable inventory in an amount equal to the difference between the cost of inventory and its estimated realizable value based upon assumptions about future demand and market conditions. We assess the valuation of all inventories, including raw materials, work-in-process, finished goods and spare parts on a periodic basis. Obsolete inventory or inventory in excess of our estimated usage is written down to its estimated market value less costs to sell, if less than its cost. Inherent in our estimates of demand and market value in determining inventory valuation are estimates related to economic trends, future demand for our products and technological obsolescence of our products. If actual demand and market conditions are less favorable than our projections, additional inventory write-downs may be required. If the inventory value is written down to its net realizable value, and subsequently there is an increased demand for the inventory at a higher value, the increased value of the inventory is not realized until the inventory is sold either as a component of a subsystem or as separate inventory. During 2017, 2016, and 2015, we wrote down $0.9 million, $3.9 million, and $3.0 million, respectively, in inventory determined to be obsolete.
Goodwill, Intangibles Assets, and Long-lived Assets
Goodwill is measured as the excess of the cost of an acquisition over the sum of the amounts assigned to identifiable assets acquired less liabilities assumed. We evaluate our goodwill and indefinite life trade name for impairment on an annual basis, and whenever events or changes in circumstances indicate that the carrying value may not be fully recoverable. We operate as a single segment and reporting unit. In addition, we evaluate our identifiable intangible assets and other long-lived assets for impairment whenever events or changes in circumstances indicate that the carrying amount of an asset may not be recoverable. Factors we consider important which could trigger an impairment review include significant changes in the manner of our use of the acquired assets or the strategy of our overall business; significant decreases in the market price of the asset; significant negative changes in sales of specific products or services; and significant negative industry or economic trends.
44
We continually apply judgment when performing these evaluations and continuously monitor for events and circumstances that could negatively impact the key assumptions in determining fair value, including long-term sales growth projections, undiscounted net cash flows, discount rates, recent market valuations from transactions by comparable companies, volatility in our market capitalization and general industry, market and macroeconomic conditions. It is possible that changes in such circumstances, or in the variables associated with the judgments, assumptions and estimates used in assessing fair value, would require us to record a non-cash impairment charge.
At December 29, 2017, the date of our last impairment analysis, the fair value of the reporting unit was substantially in excess of its carrying value.
Share-Based Compensation
Our share-based compensation was $2.2 million, $3.2 million, and $1.1 million during 2017, 2016, and 2015, respectively. Compensation expense related to share-based transactions, including employee and non-employee stock options, is measured and recognized in the financial statements based on the fair value of the awards granted. The fair value of each option award is estimated on the grant date using the Black-Scholes option-pricing model and a single option award approach. Share-based compensation expense is recognized, net of forfeitures, over the requisite service periods of the awards, which is generally four years.
Our use of the Black-Scholes option-pricing model requires the input of subjective assumptions, including the fair value of the underlying ordinary shares, the expected term of the option, and the expected volatility of the price of our ordinary shares, risk-free interest rates, and the expected dividend yield of our ordinary shares. The assumptions used in our option-pricing model represent management’s best estimates. These estimates involve inherent uncertainties and the application of management’s judgment. If factors change and different assumptions are used, our share-based compensation expense could be materially different in the future.
These assumptions and estimates are as follows:
|
|
• |
Fair Value of Ordinary Shares. Because there was no public market for our ordinary shares prior to our initial public offering, our board of directors determined the fair value of our ordinary shares by considering a number of objective and subjective factors, including valuations of comparable companies, operating and financial performance, lack of liquidity of our ordinary shares and general and industry-specific economic outlook, among other factors. In addition, we periodically obtained third party valuations to support the determination by our board of directors of the fair value of our ordinary shares. |
|
|
• |
Risk-Free Interest Rate. We base the risk-free interest rate used in the Black-Scholes option-pricing model based on the U.S. Treasury rates in effect during the corresponding period of grant. |
|
|
• |
Expected Term. We use the simplified method to estimate the expected term of option awards, as the Company does not have sufficient history to estimate the weighted average expected term. |
|
|
• |
Volatility. We determine the price volatility factor based on the historical volatilities of our publicly traded peer group as we did not have a trading history for our ordinary shares prior to our initial public offering. Industry peers consist of several public companies in the industries that are similar to us in size, stage of life cycle, and financial leverage. We intend to continue to consistently apply this process using the same or similar public companies until a sufficient amount of historical information regarding the volatility of the price of our own ordinary shares share price becomes available, or unless circumstances change such that the identified companies are no longer similar to us, in which case, more suitable companies whose share prices are publicly available would be utilized in the calculation. |
|
|
• |
Dividend Yield. The expected dividend assumption is based on our current expectations about our anticipated dividend policy. Consequently, we used an expected dividend yield of zero. |
Since our initial public offering, our board of directors determines the fair value of each underlying ordinary share based on the closing price of our ordinary shares as reported on the date of grant.
Income Taxes
The determination of our tax provision is highly dependent upon the geographic composition of worldwide earnings and tax regulations governing each region and is subject to judgments and estimates. Management carefully monitors the changes in many factors and adjusts the effective tax rate as required.
45
The calculation of tax liabilities involves significant judgment in estimating the impact of uncertainties in the application of complex tax laws. Resolution of these uncertainties in a manner inconsistent with our expectations could have a material impact on our business, results of operations and financial position. We believe we have adequately reserved for our uncertain tax positions, however, no assurance can be given that the final tax outcome of these matters will not be different than what we expect. We adjust these reserves in light of changing facts and circumstances, such as the closing of a tax audit or the refinement of an estimate. To the extent that the final tax outcome for these matters is different than the amounts recorded, such differences will impact the provision for income taxes in the period in which such determination is made. The provision for income taxes includes the impact of reserve positions and changes to reserves that are considered appropriate, as well as the related net interest and penalties.
We file income tax returns in the U.S. federal jurisdiction, various states and various foreign jurisdictions. We are no longer subject to U.S. federal examination for tax years ending before 2014, to state examinations before 2013 or to foreign examinations before 2012. However, to the extent allowed by law, the tax authorities may have the right to examine prior periods where net operating losses or tax credits were generated and carried forward, and make adjustments up to the amount of the net operating losses or credit carryforward. We are currently enjoying a zero rate tax holiday in Singapore that is scheduled to expire at the end of 2021. This tax rate is subject to maintaining certain commitments agreed to with the Economic Development Board of Singapore including investment and employment thresholds. Our tax rate could be significantly affected if we do not maintain these commitments or if we are unable to favorably renegotiate the commitment requirements.
Recent Accounting Pronouncements
From time to time, the Financial Accounting Standards Board (“FASB”) or other standards setting bodies issue new accounting pronouncements. Updates to the FASB Accounting Standards Codification are communicated through issuance of an Accounting Standards Update (“ASU”). Unless otherwise discussed, we believe that the impact of recently issued guidance, whether adopted or to be adopted in the future, is not expected to have a material impact on our Consolidated Financial Statements upon adoption.
To understand the impact of recently issued guidance, whether adopted or to be adopted, please review the information provided in Note 1 – Organization and Summary of Significant Accounting Policies of our consolidated financial statements in Part IV, Item 15 of this report on Form 10‑K.
Off-Balance Sheet Arrangements
As of December 29, 2017, we did not have any relationships with unconsolidated entities or financial partnerships, such as structured finance or special purpose entities, which were established for the purpose of facilitating off-balance sheet arrangements or other purposes.
ITEM 7A. QUANTITATIVE AND QUALITATIVE DISCLOSURES ABOUT MARKET RISK
We are exposed to financial market risks, including changes in currency exchange rates and interest rates.
Foreign Currency Exchange Risk
Currently, substantially all of our sales and arrangements with third-party suppliers provide for pricing and payment in U.S. dollars and, therefore, are not subject to material exchange rate fluctuations. As a result, we do not expect foreign currency exchange rate fluctuations to have a material effect on our results of operations. However, increases in the value of the U.S. dollar relative to other currencies would make our products more expensive relative to competing products priced in such other currencies, which could negatively impact our ability to compete. Conversely, decreases in the value of the U.S. dollar relative to other currencies could result in our foreign suppliers raising their prices in order to continue doing business with us.
While not currently significant, we do have certain operating expenses that are denominated in currencies of the countries in which our operations are located, and may be subject to fluctuations due to foreign currency exchange rates, particularly the Singapore dollar, Malaysian Ringgit, British Pound and Euro. Fluctuations in foreign currency exchange rates may cause us to recognize transaction gains and losses in our statement of operations. To date, foreign currency transaction gains and losses have not been material to our financial statements, and we have not engaged in any foreign currency hedging transactions.
Interest Rate Risk
We had total indebtedness of $189.5 million as of December 29, 2017, exclusive of unamortized debt issuance costs.
46
We do not enter into investments for trading or speculative purposes and have not used any derivative financial instruments to manage our interest rate risk exposure. We have not been exposed to, nor do we anticipate being exposed to, material risks due to changes in interest rates. The interest rate on a significant majority of our outstanding debt is variable, which also reduces our exposure to these interest rate risks. A hypothetical 10% change in interest rates during any of the periods presented would not have had a material impact on our financial statements.
ITEM 8. FINANCIAL STATEMENTS AND SUPPLEMENTARY DATA
The financial statements and supplementary financial information required to be filed under this Item 8 are presented beginning on page F‑1 in Part IV, Item 15 of this annual report on Form 10‑K and are incorporated herein by reference.
ITEM 9. CHANGES IN AND DISAGREEMENTS WITH ACCOUNTANTS ON ACCOUNTING AND FINANCIAL DISCLOSURE
None.
ITEM 9A. CONTROLS AND PROCEDURES
Evaluation of Disclosure Controls and Procedures
As required by Rule 13a‑15(b) under the Exchange Act, we carried out an evaluation under the supervision and with the participation of our management, including our Chief Executive Officer and Chief Financial Officer, of the effectiveness of the design and operation of our disclosure controls and procedures (as defined in Rules 13a‑15(e) and 15d‑15(e) under the Exchange Act) as of the end of the period covered by this report. There are inherent limitations to the effectiveness of any system of disclosure controls and procedures, including the possibility of human error and the circumvention or overriding of the controls and procedures. Accordingly, even effective disclosure controls and procedures can only provide reasonable assurance of achieving their control objectives. We evaluated the effectiveness of our disclosure controls and procedures as of December 29, 2017, with the participation of our CEO and CFO. Based on this evaluation, our CEO and CFO concluded that our disclosure controls and procedures were effective as of December 29, 2017.
Management’s Report on Internal Control Over Financial Reporting
Our management is responsible for establishing and maintaining adequate internal control over financial reporting (as defined in Rules 13a‑15(f) and 15d‑15(f) under the Exchange Act). With the participation of our Chief Executive Officer and Chief Financial Officer, our management evaluated the effectiveness of our internal control over financial reporting based on the framework issued by the Committee of Sponsoring Organizations of the Treadway Commission (“COSO”) in Internal Control—Integrated Framework (2013). Because of its inherent limitations, internal control over financial reporting is not intended to provide absolute assurance that a misstatement of our financial statements would be prevented or detected. Based on that assessment, management has concluded that its internal control over financial reporting was effective as of December 29, 2017 to provide reasonable assurance regarding the reliability of financial reporting and the preparation of financial statements in accordance with GAAP.
We have not engaged an independent registered accounting firm to perform an audit of our internal control over financial reporting as of any balance sheet date or for any period reported in our financial statements. Our independent public registered accounting firm will first be required to attest to the effectiveness of our internal control over financial reporting for our Annual Report on Form 10-K for the first year we are no longer an “emerging growth company” as defined by the JOBS Act.
Remediation of Previously Identified Material Weakness
A company’s internal control over financial reporting is a process designed by, or under the supervision of, a company’s principal executive and principal financial officers, or persons performing similar functions, to provide reasonable assurance regarding the reliability of financial reporting and the preparation of financial statements in accordance with GAAP. Because of its inherent limitations, internal control over financial reporting may not prevent or detect misstatements. In addition, projections of any evaluation of effectiveness to future periods are subject to the risk that controls may become inadequate because of changes in conditions, or that the degree of compliance with policies or procedures may deteriorate. If we cannot provide reliable financial information, our business, operating results and share price could be negatively impacted.
47
During the second quarter of 2017, we identified a material weakness in our internal control over financial reporting related to ineffective periodic risk assessment over control activities that ensure the ending inventory balances of our Malaysia and Singapore subsidiaries were recorded at the appropriate U.S. Dollar functional currency rate. During our previous consolidation process, we had a manual process that translated these inventory balances into the U.S. Dollar functional currency at incorrect rates for these subsidiaries due to system limitations, and we did not implement a control to reconcile the ending inventory balance at our Malaysia and Singapore subsidiaries to the final inventory balance reported in our consolidated financial statements. This material weakness resulted in an accumulated overstatement of inventory as of March 31, 2017 of approximately $1.75 million. We corrected this overstatement in the second quarter of 2017 with a charge to cost of sales of $1.75 million. Additionally, we re‑implemented our our Oracle system, which allows for a systems‑based calculation of inventory purchases and ending inventory at the proper U.S. Dollar functional currency rates, and implemented a control to reconcile the final Malaysia and Singapore inventory sub‑ledger balances to the final balances recorded in consolidation. These improvements to our internal controls, implemented during 2017, were in place and demonstrated a sustained period of effective operation during 2017 to enable management of the Company to conclude the material weakness has been remediated as of December 29, 2017.
Changes in Internal Control Over Financial Reporting
Except as set forth above, there have been no changes in our internal control over financial reporting during the quarter ended December 29, 2017 that have materially affected or are reasonably likely to materially affect, our internal control over financial reporting.
None.
ITEM 10. DIRECTORS, EXECUTIVE OFFICERS AND CORPORATE GOVERNANCE
The information required by this item is incorporated by reference to our Proxy Statement for our 2018 General Meeting to be filed with the SEC within 120 days after the close of the year ended December 29, 2017.
Code of Conduct
The Company has adopted a code of business ethics and conduct (the “Code of Conduct”) that applies to all employees, officers and directors, including the principal executive officer, principal financial officer and principal accounting officer. The Code of Conduct is available on the Company’s website at www.ichorsystems.com under the Investor Relations tab. The Company intends to post on its website all disclosures that are required by law or NASDAQ listing rules regarding any amendment to, or a waiver of, any provision of the Code of Conduct for the principal executive officer, principal financial officer, principal accounting officer or controller, or persons performing similar functions.
ITEM 11. EXECUTIVE COMPENSATION
The information required by this item is incorporated by reference to our Proxy Statement for our 2018 General Meeting to be filed with the SEC within 120 days after the close of the year ended December 29, 2017.
ITEM 12. SECURITY OWNERSHIP OF CERTAIN BENEFICIAL OWNERS AND MANAGEMENT AND RELATED SHAREHOLDER MATTERS
The information required by this item is incorporated by reference to our Proxy Statement for our 2018 General Meeting to be filed with the SEC within 120 days after the close of the year ended December 29, 2017.
48
ITEM 13. CERTAIN RELATIONSHIPS AND RELATED TRANSACTIONS, AND DIRECTOR INDEPENDENCE
The information required by this item is incorporated by reference to our Proxy Statement for our 2018 General Meeting to be filed with the SEC within 120 days after the close of the year ended December 29, 2017.
ITEM 14. PRINCIPAL ACCOUNTING FEES AND SERVICES
The information required by this item is incorporated by reference to our Proxy Statement for our 2018 General Meeting to be filed with the SEC within 120 days after the close of the year ended December 29, 2017.
ITEM 15. EXHIBITS AND FINANCIAL STATEMENT SCHEDULES
|
|
(a) |
The following documents are filed as a part of this report: |
|
|
(1) |
Financial Statements. |
The following Consolidated Financial Statements are filed as part of this report under Item 8 “Financial Statements and Supplementary Data.”
|
F‑1 |
|
|
F‑2 |
|
|
F‑3 |
|
|
F‑4 |
|
|
F‑5 |
|
|
F‑6 |
|
|
(2) |
Exhibits. Exhibits are listed on the Exhibit Index at the end of this report. |
Not applicable.
49
Report of Independent Registered Public Accounting Firm
To the Shareholders and Board of Directors
Ichor Holdings, Ltd.:
Opinion on the Consolidated Financial Statements
We have audited the accompanying consolidated balance sheets of Ichor Holdings, Ltd. and subsidiaries (the Company) as of December 29, 2017 and December 30, 2016, and the related consolidated statements of operations, shareholders’ equity, and cash flows for each of the years in the three year period ended December 29, 2017, and the related notes (collectively, the consolidated financial statements). In our opinion, the consolidated financial statements present fairly, in all material respects, the financial position of the Company as of December 29, 2017 and December 30, 2016, and the results of its operations and its cash flows for each of the years in the three year period ended December 29, 2017, in conformity with U.S. generally accepted accounting principles.
Basis for Opinion
These consolidated financial statements are the responsibility of the Company’s management. Our responsibility is to express an opinion on these consolidated financial statements based on our audits. We are a public accounting firm registered with the Public Company Accounting Oversight Board (United States) (PCAOB) and are required to be independent with respect to the Company in accordance with the U.S. federal securities laws and the applicable rules and regulations of the Securities and Exchange Commission and the PCAOB.
We conducted our audits in accordance with the standards of the PCAOB. Those standards require that we plan and perform the audit to obtain reasonable assurance about whether the consolidated financial statements are free of material misstatement, whether due to error or fraud. The Company is not required to have, nor were we engaged to perform, an audit of its internal control over financial reporting. As part of our audits, we are required to obtain an understanding of internal control over financial reporting but not for the purpose of expressing an opinion on the effectiveness of the Company’s internal control over financial reporting. Accordingly, we express no such opinion.
Our audits included performing procedures to assess the risks of material misstatement of the consolidated financial statements, whether due to error or fraud, and performing procedures that respond to those risks. Such procedures included examining, on a test basis, evidence regarding the amounts and disclosures in the consolidated financial statements. Our audits also included evaluating the accounting principles used and significant estimates made by management, as well as evaluating the overall presentation of the consolidated financial statements. We believe that our audits provide a reasonable basis for our opinion.
/s/ KPMG LLP
We have served as the Company’s auditor since 2011.
Portland, Oregon
March 13, 2018
F-1
(in thousands, except share and per share data)
|
|
|
December 29, 2017 |
|
|
December 30, 2016 |
|
||
|
Assets |
|
|
|
|
|
|
|
|
|
Current assets: |
|
|
|
|
|
|
|
|
|
Cash |
|
$ |
68,794 |
|
|
$ |
50,854 |
|
|
Restricted cash |
|
|
510 |
|
|
|
1,794 |
|
|
Accounts receivable, net |
|
|
49,249 |
|
|
|
26,401 |
|
|
Inventories, net |
|
|
154,541 |
|
|
|
70,881 |
|
|
Prepaid expenses and other current assets |
|
|
5,357 |
|
|
|
7,061 |
|
|
Current assets from discontinued operations |
|
|
3 |
|
|
|
99 |
|
|
Total current assets |
|
|
278,454 |
|
|
|
157,090 |
|
|
Property and equipment, net |
|
|
34,380 |
|
|
|
12,018 |
|
|
Other noncurrent assets |
|
|
1,052 |
|
|
|
3,574 |
|
|
Deferred tax assets |
|
|
994 |
|
|
|
570 |
|
|
Intangible assets, net |
|
|
73,405 |
|
|
|
32,146 |
|
|
Goodwill |
|
|
169,399 |
|
|
|
77,093 |
|
|
Total assets |
|
$ |
557,684 |
|
|
$ |
282,491 |
|
|
Liabilities and Shareholders’ Equity |
|
|
|
|
|
|
|
|
|
Current liabilities: |
|
|
|
|
|
|
|
|
|
Accounts payable |
|
$ |
121,405 |
|
|
$ |
88,531 |
|
|
Accrued liabilities |
|
|
12,211 |
|
|
|
6,554 |
|
|
Other current liabilities |
|
|
6,715 |
|
|
|
5,421 |
|
|
Current portion of long-term debt |
|
|
6,490 |
|
|
|
— |
|
|
Current liabilities from discontinued operations |
|
|
400 |
|
|
|
564 |
|
|
Total current liabilities |
|
|
147,221 |
|
|
|
101,070 |
|
|
Long-term debt, less current portion, net |
|
|
180,247 |
|
|
|
37,944 |
|
|
Deferred tax liabilities |
|
|
10,558 |
|
|
|
606 |
|
|
Other non-current liabilities |
|
|
2,896 |
|
|
|
1,173 |
|
|
Non-current liabilities from discontinued operations |
|
|
— |
|
|
|
39 |
|
|
Total liabilities |
|
|
340,922 |
|
|
|
140,832 |
|
|
Shareholders’ equity |
|
|
|
|
|
|
|
|
|
Preferred shares ($0.0001 par value; 20,000,000 shares authorized; no shares issued and outstanding) |
|
|
— |
|
|
|
— |
|
|
Ordinary shares ($0.0001 par value; 200,000,000 shares authorized; 25,892,162 and 23,857,381 shares issued and outstanding, respectively) |
|
|
3 |
|
|
|
2 |
|
|
Additional paid in capital |
|
|
214,697 |
|
|
|
196,049 |
|
|
Retained earnings (accumulated deficit) |
|
|
2,062 |
|
|
|
(54,392 |
) |
|
Total shareholders’ equity |
|
|
216,762 |
|
|
|
141,659 |
|
|
Total liabilities and shareholders’ equity |
|
$ |
557,684 |
|
|
$ |
282,491 |
|
F-2
Consolidated Statements of Operations
(in thousands, except share and per share data)
|
|
|
Year Ended |
|
|||||||||
|
|
|
December 29, 2017 |
|
|
December 30, 2016 |
|
|
December 25, 2015 |
|
|||
|
Net sales |
|
$ |
655,892 |
|
|
$ |
405,747 |
|
|
$ |
290,641 |
|
|
Cost of sales |
|
|
555,131 |
|
|
|
340,352 |
|
|
|
242,087 |
|
|
Gross profit |
|
|
100,761 |
|
|
|
65,395 |
|
|
|
48,554 |
|
|
Operating expenses: |
|
|
|
|
|
|
|
|
|
|
|
|
|
Research and development |
|
|
7,899 |
|
|
|
6,383 |
|
|
|
4,813 |
|
|
Selling, general, and administrative |
|
|
37,802 |
|
|
|
28,126 |
|
|
|
24,729 |
|
|
Amortization of intangible assets |
|
|
8,880 |
|
|
|
7,015 |
|
|
|
6,411 |
|
|
Total operating expenses |
|
|
54,581 |
|
|
|
41,524 |
|
|
|
35,953 |
|
|
Operating income |
|
|
46,180 |
|
|
|
23,871 |
|
|
|
12,601 |
|
|
Interest expense, net |
|
|
3,277 |
|
|
|
4,370 |
|
|
|
3,831 |
|
|
Other income, net |
|
|
(126 |
) |
|
|
(629 |
) |
|
|
(46 |
) |
|
Income from continuing operations before income taxes |
|
|
43,029 |
|
|
|
20,130 |
|
|
|
8,816 |
|
|
Income tax benefit from continuing operations |
|
|
(13,886 |
) |
|
|
(649 |
) |
|
|
(3,991 |
) |
|
Net income from continuing operations |
|
|
56,915 |
|
|
|
20,779 |
|
|
|
12,807 |
|
|
Discontinued operations: |
|
|
|
|
|
|
|
|
|
|
|
|
|
Loss from discontinued operations before taxes |
|
|
(722 |
) |
|
|
(4,077 |
) |
|
|
(7,406 |
) |
|
Income tax expense (benefit) from discontinued operations |
|
|
(261 |
) |
|
|
40 |
|
|
|
(225 |
) |
|
Net loss from discontinued operations |
|
|
(461 |
) |
|
|
(4,117 |
) |
|
|
(7,181 |
) |
|
Net income |
|
|
56,454 |
|
|
|
16,662 |
|
|
|
5,626 |
|
|
Less: Preferred share dividend |
|
|
— |
|
|
|
— |
|
|
|
(22,127 |
) |
|
Less: Undistributed earnings attributable to preferred shareholders |
|
|
— |
|
|
|
(15,284 |
) |
|
|
— |
|
|
Net income (loss) attributable to ordinary shareholders |
|
$ |
56,454 |
|
|
$ |
1,378 |
|
|
$ |
(16,501 |
) |
|
Net income (loss) per share from continuing operations attributable to ordinary shareholders: |
|
|
|
|
|
|
|
|
|
|
|
|
|
Basic |
|
$ |
2.27 |
|
|
$ |
1.14 |
|
|
$ |
(292.39 |
) |
|
Diluted |
|
$ |
2.17 |
|
|
$ |
0.87 |
|
|
$ |
(292.39 |
) |
|
Net income (loss) per share attributable to ordinary shareholders: |
|
|
|
|
|
|
|
|
|
|
|
|
|
Basic |
|
$ |
2.25 |
|
|
$ |
0.92 |
|
|
$ |
(517.68 |
) |
|
Diluted |
|
$ |
2.15 |
|
|
$ |
0.70 |
|
|
$ |
(517.68 |
) |
|
Shares used to compute net income (loss) from continuing operations per share attributable to ordinary shareholders: |
|
|
|
|
|
|
|
|
|
|
|
|
|
Basic |
|
|
25,118,031 |
|
|
|
1,503,296 |
|
|
|
31,875 |
|
|
Diluted |
|
|
26,218,424 |
|
|
|
1,967,926 |
|
|
|
31,875 |
|
|
Shares used to compute net income (loss) per share attributable to ordinary shareholders: |
|
|
|
|
|
|
|
|
|
|
|
|
|
Basic |
|
|
25,118,031 |
|
|
|
1,503,296 |
|
|
|
31,875 |
|
|
Diluted |
|
|
26,218,424 |
|
|
|
1,967,926 |
|
|
|
31,875 |
|
F-3
Consolidated Statements of Shareholders’ Equity
(in thousands, except share data)
|
|
|
|
|
|
|
|
|
|
|
|
|
|
|
|
|
|
|
|
|
|
|
Retained |
|
|
|
|
|
|
|
|
|
|
|
|
|
|
|
|
|
|
|
|
|
|
|
|
|
Additional |
|
|
Earnings |
|
|
Total |
|
|||
|
|
|
Preferred Shares |
|
|
Ordinary Shares |
|
|
Paid-In |
|
|
(Accumulated |
|
|
Shareholders' |
|
|||||||||||||
|
|
|
Shares |
|
|
Amount |
|
|
Shares |
|
|
Amount |
|
|
Capital |
|
|
Deficit) |
|
|
Equity |
|
|||||||
|
Balance at December 26, 2014 |
|
|
17,722,808 |
|
|
$ |
142,728 |
|
|
|
22,377 |
|
|
$ |
— |
|
|
$ |
1,886 |
|
|
$ |
(54,553 |
) |
|
$ |
90,061 |
|
|
Share-based compensation expense |
|
|
— |
|
|
|
— |
|
|
|
— |
|
|
|
— |
|
|
|
1,118 |
|
|
|
— |
|
|
|
1,118 |
|
|
Vesting of restricted shares |
|
|
— |
|
|
|
— |
|
|
|
43,032 |
|
|
|
— |
|
|
|
— |
|
|
|
— |
|
|
|
— |
|
|
Dividend to shareholders |
|
|
— |
|
|
|
— |
|
|
|
— |
|
|
|
— |
|
|
|
— |
|
|
|
(22,127 |
) |
|
|
(22,127 |
) |
|
Net income |
|
|
— |
|
|
|
— |
|
|
|
— |
|
|
|
— |
|
|
|
— |
|
|
|
5,626 |
|
|
|
5,626 |
|
|
Balance at December 25, 2015 |
|
|
17,722,808 |
|
|
|
142,728 |
|
|
|
65,409 |
|
|
|
— |
|
|
|
3,004 |
|
|
|
(71,054 |
) |
|
|
74,678 |
|
|
Ordinary shares issued, net of transaction costs |
|
|
— |
|
|
|
— |
|
|
|
5,877,778 |
|
|
|
— |
|
|
|
47,103 |
|
|
|
— |
|
|
|
47,103 |
|
|
Conversion of preferred shares to ordinary shares |
|
|
(17,722,808 |
) |
|
|
(142,728 |
) |
|
|
17,722,808 |
|
|
|
2 |
|
|
|
142,726 |
|
|
|
— |
|
|
|
— |
|
|
Share-based compensation expense |
|
|
— |
|
|
|
— |
|
|
|
— |
|
|
|
— |
|
|
|
3,216 |
|
|
|
— |
|
|
|
3,216 |
|
|
Vesting of restricted shares |
|
|
— |
|
|
|
— |
|
|
|
191,386 |
|
|
|
— |
|
|
|
— |
|
|
|
— |
|
|
|
— |
|
|
Net income |
|
|
— |
|
|
|
— |
|
|
|
— |
|
|
|
— |
|
|
|
— |
|
|
|
16,662 |
|
|
|
16,662 |
|
|
Balance at December 30, 2016 |
|
|
— |
|
|
|
— |
|
|
|
23,857,381 |
|
|
|
2 |
|
|
|
196,049 |
|
|
|
(54,392 |
) |
|
|
141,659 |
|
|
Ordinary shares issued from initial public offering, net of transaction costs |
|
|
— |
|
|
|
— |
|
|
|
881,667 |
|
|
|
1 |
|
|
|
7,277 |
|
|
|
— |
|
|
|
7,278 |
|
|
Ordinary shares issued from exercise of stock options |
|
|
|
|
|
|
|
|
|
|
1,078,182 |
|
|
|
— |
|
|
|
9,141 |
|
|
|
— |
|
|
|
9,141 |
|
|
Ordinary shares issued from vesting of restricted share units |
|
|
— |
|
|
|
— |
|
|
|
74,932 |
|
|
|
— |
|
|
|
— |
|
|
|
— |
|
|
|
— |
|
|
Share-based compensation expense |
|
|
— |
|
|
|
— |
|
|
|
— |
|
|
|
— |
|
|
|
2,230 |
|
|
|
— |
|
|
|
2,230 |
|
|
Net income |
|
|
— |
|
|
|
— |
|
|
|
— |
|
|
|
— |
|
|
|
— |
|
|
|
56,454 |
|
|
|
56,454 |
|
|
Balance at December 29, 2017 |
|
|
— |
|
|
$ |
— |
|
|
|
25,892,162 |
|
|
$ |
3 |
|
|
$ |
214,697 |
|
|
$ |
2,062 |
|
|
$ |
216,762 |
|
F-4
Consolidated Statements of Cash Flows
(in thousands)
|
|
|
Year Ended |
|
|||||||||
|
|
|
December 29, 2017 |
|
|
December 30, 2016 |
|
|
December 25, 2015 |
|
|||
|
Cash flows from operating activities: |
|
|
|
|
|
|
|
|
|
|
|
|
|
Net income |
|
$ |
56,454 |
|
|
$ |
16,662 |
|
|
$ |
5,626 |
|
|
Adjustments to reconcile net income to net cash provided by operating activities: |
|
|
|
|
|
|
|
|
|
|
|
|
|
Depreciation and amortization |
|
|
12,509 |
|
|
|
9,497 |
|
|
|
9,936 |
|
|
Gain on sale of investments and settlement of note receivable |
|
|
(241 |
) |
|
|
— |
|
|
|
— |
|
|
Share-based compensation |
|
|
2,230 |
|
|
|
3,216 |
|
|
|
1,118 |
|
|
Deferred income taxes |
|
|
(15,347 |
) |
|
|
(2,429 |
) |
|
|
(4,927 |
) |
|
Amortization of debt issuance costs |
|
|
608 |
|
|
|
527 |
|
|
|
834 |
|
|
Changes in operating assets and liabilities, net of assets acquired: |
|
|
|
|
|
|
|
|
|
|
|
|
|
Accounts receivable, net |
|
|
(1,059 |
) |
|
|
(9,007 |
) |
|
|
6,333 |
|
|
Inventories |
|
|
(43,425 |
) |
|
|
(23,719 |
) |
|
|
9,110 |
|
|
Prepaid expenses and other assets |
|
|
3,386 |
|
|
|
(3,381 |
) |
|
|
403 |
|
|
Accounts payable |
|
|
22,612 |
|
|
|
36,761 |
|
|
|
(1,676 |
) |
|
Accrued liabilities |
|
|
848 |
|
|
|
1,612 |
|
|
|
169 |
|
|
Other liabilities |
|
|
228 |
|
|
|
(2,009 |
) |
|
|
(3,396 |
) |
|
Net cash provided by operating activities |
|
|
38,803 |
|
|
|
27,730 |
|
|
|
26,690 |
|
|
Cash flows from investing activities: |
|
|
|
|
|
|
|
|
|
|
|
|
|
Capital expenditures |
|
|
(8,226 |
) |
|
|
(4,268 |
) |
|
|
(1,367 |
) |
|
Cash paid for acquisitions, net of cash acquired |
|
|
(180,955 |
) |
|
|
(17,407 |
) |
|
|
— |
|
|
Proceeds from sale of intangible assets |
|
|
— |
|
|
|
230 |
|
|
|
— |
|
|
Proceeds from sale of property, plant, and equipment |
|
|
— |
|
|
|
243 |
|
|
|
— |
|
|
Proceeds from sale of investments and settlement note receivable |
|
|
2,430 |
|
|
|
— |
|
|
|
— |
|
|
Net cash used in investing activities |
|
|
(186,751 |
) |
|
|
(21,202 |
) |
|
|
(1,367 |
) |
|
Cash flows from financing activities: |
|
|
|
|
|
|
|
|
|
|
|
|
|
Issuance of ordinary shares, net of fees |
|
|
7,278 |
|
|
|
47,103 |
|
|
|
— |
|
|
Proceeds from exercise of stock options |
|
|
9,141 |
|
|
|
— |
|
|
|
— |
|
|
Dividends to shareholders |
|
|
— |
|
|
|
— |
|
|
|
(22,127 |
) |
|
Debt issuance and modification costs |
|
|
(1,520 |
) |
|
|
— |
|
|
|
(2,631 |
) |
|
Borrowings under revolving commitment |
|
|
10,000 |
|
|
|
12,000 |
|
|
|
24,000 |
|
|
Repayments on revolving commitment |
|
|
— |
|
|
|
(22,000 |
) |
|
|
(26,000 |
) |
|
Borrowing on long-term debt |
|
|
140,000 |
|
|
|
15,000 |
|
|
|
55,000 |
|
|
Repayments on long-term debt |
|
|
(295 |
) |
|
|
(30,171 |
) |
|
|
(43,750 |
) |
|
Net cash provided by (used in) financing activities |
|
|
164,604 |
|
|
|
21,932 |
|
|
|
(15,508 |
) |
|
Net increase in cash |
|
|
16,656 |
|
|
|
28,460 |
|
|
|
9,815 |
|
|
Cash and restricted cash at beginning of year |
|
|
52,648 |
|
|
|
24,188 |
|
|
|
14,373 |
|
|
Cash and restricted cash at end of quarter |
|
$ |
69,304 |
|
|
$ |
52,648 |
|
|
$ |
24,188 |
|
|
Supplemental disclosures of cash flow information: |
|
|
|
|
|
|
|
|
|
|
|
|
|
Cash paid during the period for interest |
|
$ |
3,436 |
|
|
$ |
3,686 |
|
|
$ |
2,632 |
|
|
Cash paid during the period for taxes |
|
$ |
1,068 |
|
|
$ |
103 |
|
|
$ |
496 |
|
|
Supplemental disclosures of non-cash activities: |
|
|
|
|
|
|
|
|
|
|
|
|
|
Capital expenditures included in accounts payable |
|
$ |
723 |
|
|
$ |
1,174 |
|
|
$ |
10 |
|
F-5
Notes to Financial Statements
(dollar figures in tables in thousands, except share and per share amounts and percentages)
Note 1 – Organization and Summary of Significant Accounting Policies
Organization and Operations of the Company
Ichor Holdings, Ltd. and Subsidiaries (the “Company”) designs, develops, manufactures and distributes gas and liquid delivery subsystems and components purchased by capital equipment manufacturers for use in the semiconductor markets. The Company is headquartered in Fremont, California and has operations in the United States, United Kingdom, Singapore, Malaysia, and South Korea.
On December 30, 2011, Ichor Systems Holdings, LLC consummated a sales transaction with Icicle Acquisition Holdings, LLC, a Delaware limited liability company. Shortly after consummation of the sale transaction, Icicle Acquisition Holdings, LLC changed its name to Ichor Holdings, LLC.
In March 2012, Ichor Holdings, LLC completed a reorganization of its legal structure, forming Ichor Holdings, Ltd., a Cayman Islands entity. Ichor Holdings, Ltd. is now the reporting entity and the ultimate parent company of the operating entities.
In January 2016, the Company decided to shut its Kingston, New York facility which was the primary facility for the Precision Flow Technologies, Inc. subsidiary. In May 2016, the Company ceased operations in this facility and ended the relationship with the customer it served in this location. The Company’s consolidated financial statements and accompanying notes for current and prior periods have been retroactively adjusted to present the results of operations of the Precision Flow Technologies, Inc. subsidiary as discontinued operations. In addition, the assets and liabilities to be disposed of have been treated and classified as discontinued operations. For more information on discontinued operations see Note 15 – Discontinued Operations.
Basis of Presentation
These consolidated financial statements have been prepared in accordance with generally accepted accounting principles in the United States (“GAAP”). All intercompany balances and transactions have been eliminated upon consolidation. All financial figures presented in the notes to consolidated financial statements are in thousands, except share, per share, and percentage figures.
These consolidated financial statements include the following wholly owned subsidiaries of Ichor Holdings, Ltd.:
|
|
▪ |
FP-Ichor Ltd. (Cayman) |
|
|
▪ |
Icicle Acquisition Holding Coöperatief U.A. |
|
|
▪ |
Icicle Acquisition Holding B.V. |
|
|
▪ |
Ichor Holdings Ltd (Scotland). |
|
|
▪ |
Ichor Systems Ltd. (Scotland) |
|
|
▪ |
Ichor Holdings, LLC |
|
|
▪ |
Ichor Systems, Inc. |
|
|
▪ |
Ichor Systems Malaysia Sdn Bhd |
|
|
▪ |
Ichor Systems Singapore Pte. Ltd. |
|
|
▪ |
Precision Flow Technologies, Inc. |
|
|
▪ |
Ajax-United Patterns & Molds, Inc. |
|
|
▪ |
Cal-Weld, Inc. |
|
|
▪ |
Talon Innovations Corporation |
|
|
▪ |
Talon Innovations (FL) Corporation |
F-6
Public Offering and Reverse Stock Split
On December 14, 2016, the Company completed an initial public offering (“IPO”) of 5,877,778 ordinary shares at a price to the public of $9.00 per share. The Company received net proceeds from the offering of $47.1 million after offering fees and expenses. The net proceeds were used to repay $40.0 million of the Company’s loans outstanding under the Company’s Credit Facilities. In January 2017, the Company received $7.3 million, net of fees and expenses, from the exercise of the underwriters’ over‑allotment option to sell an additional 881,667 ordinary shares.
Immediately prior to the IPO, the Company amended and restated its memorandum of association to reflect the conversion of all outstanding preferred shares to 17,722,808 ordinary shares. As part of the IPO, the Company authorized 200,000,000 ordinary shares at $0.0001 par value per share. The Company also authorized the issuance of 20,000,000 preferred shares at $0.0001 par value per share, with no shares outstanding.
In connection with the IPO, the Company amended its memorandum of association to effect an 8.053363 for 1 reverse stock split of its common stock. Concurrent with the reverse stock split, the Company adjusted the number of shares subject to, and the exercise price of, its outstanding stock options and restricted shares under the Company’s 2012 Amended Management Incentive Plan (the “2012 Plan”) so that the holders of the options were in the same economic position both before and after the stock split. As a result of the reverse stock split, all previously reported share and per share amounts, including options in these consolidated financial statements and accompanying notes, have been retrospectively restated to reflect the reverse stock split.
Year End
We use a 52 or 53 week fiscal year ending on the last Friday in December. The years ended December 29, 2017, December 30, 2016, and December 25, 2015 were 52 weeks, 53 weeks, and 52 weeks, respectively. All references to 2017, 2016, and 2015 are references to fiscal years unless explicitly stated otherwise.
Use of Estimates
The preparation of consolidated financial statements in conformity with accounting principles generally accepted in the U.S. requires management to make estimates and assumptions that affect the reported amounts of assets and liabilities and disclosure of contingent assets and liabilities at the date of the financial statements and the reported amounts of revenue and expenses during the reporting periods presented. The Company bases its estimates and judgments on historical experience and on various other assumptions that it believes are reasonable under the circumstances. Actual results could differ from the estimates made by management. Significant estimates include the fair value of assets and liabilities acquired in acquisitions, estimated useful lives for long-lived assets, allowance for doubtful accounts, inventory valuation, uncertain tax positions, fair value assigned to stock options granted, and impairment analysis for both definite-lived intangible assets and goodwill.
Correction of Immaterial Error
During the second quarter of 2017, we corrected an error related to translating the inventory balances at our Malaysia and Singapore subsidiaries at an incorrect foreign currency rate. The error arose in prior period financial statements beginning in periods prior to 2014 and through 2016. The correction resulted in a $1.8 million increase in cost of sales and a corresponding decrease in gross profit in our consolidated statements of operations and a decrease to inventories in our consolidated balances sheet during the second quarter of 2017. We evaluated the error on both a quantitative and qualitative basis and determined that the error was not material and did not affect the trend of net income or cash flows in previously issued financial statements. Additionally, we determined that correcting the error in the second quarter of 2017 did not have a material impact to our consolidated financial statements for 2017.
Revenue Recognition
The Company recognizes revenue in accordance with Accounting Standards Codification (ASC) Topic 605, Revenue Recognition. Product sales are recognized when there is persuasive evidence of an arrangement, product delivery has occurred, the sales price is fixed or determinable, and collectability is reasonably assured. Product sales typically are recognized at the time of shipment or when the customer takes title of the goods. All amounts billed to a customer related to shipping and handling are classified as net sales, while all costs incurred by the Company for shipping and handling are classified as cost of goods sold.
Concentration of Credit Risk
Financial instruments that subject the Company to credit risk consist of accounts receivable, accounts payable and long-term debt.
F-7
The Company derived approximately 93%, 97%, and 95% of its revenue from continuing operations from two customers during 2017, 2016, and 2015, respectively. At December 29, 2017 and December 30, 2016, those customers represented, in the aggregate, approximately 61% and 83%, respectively, of the accounts receivable balance.
Accounts receivable are carried at invoice price less an estimate for doubtful accounts and estimated payment discounts. Payment terms vary by customer, but generally are due within 15‑60 days. The Company reviews a customer’s credit history before extending credit. The Company establishes an allowance for doubtful accounts based upon the credit risk of specific customers, historical trends, and other information. Activity and balances related to the Company’s allowance for doubtful accounts is as follows:
|
|
|
Allowance for doubtful accounts |
|
|
|
Balance at December 26, 2014 |
|
$ |
385 |
|
|
Charges to costs and expenses |
|
|
(6 |
) |
|
Write-offs |
|
|
(256 |
) |
|
Balance at December 25, 2015 |
|
|
123 |
|
|
Charges to costs and expenses |
|
|
71 |
|
|
Write-offs |
|
|
— |
|
|
Balance at December 30, 2016 |
|
|
194 |
|
|
Charges to costs and expenses |
|
|
62 |
|
|
Write-offs |
|
|
— |
|
|
Balance at December 29, 2017 |
|
$ |
256 |
|
The Company requires collateral, typically cash, in the normal course of business if customers do not meet its criteria established for offering credit. If the financial condition of the Company’s customers were to deteriorate and result in an impaired ability to make payments, additions to the allowance may be required. Accounts receivable are written off when deemed uncollectible. Recoveries of accounts receivable previously written off are recorded to income when received.
The Company uses qualified manufacturers to supply many components and subassemblies of its products. The Company obtains the majority of its components from a limited group of suppliers. A majority of the purchased components used in the Company’s products are customer specified. An interruption in the supply of a particular component would have a temporary adverse impact on the Company’s operating results.
The Company maintains cash balances at both United States-based and foreign-based commercial banks. At various times during the year, cash balances in the United States will exceed amounts that are insured by the Federal Deposit Insurance Corporation (FDIC). The majority of the cash maintained in foreign-based commercial banks is insured by the government where the foreign banking institutions are based. Cash held in foreign-based commercial banks totaled $36.4 million and $14.7 million at December 29, 2017 and December 30, 2016, respectively. No losses have been incurred at December 29, 2017 and December 30, 2016 for the amounts exceeding the insured limits.
Fair Value Measurements
The Company estimates the fair value of its financial assets and liabilities based upon comparison of such assets and liabilities to the current market values for instruments of a similar nature and degree of risk. The Company utilizes valuation techniques that maximize the use of observable inputs and minimize the use of unobservable inputs to the extent possible. The Company determines fair value based on assumptions that market participants would use in pricing an asset or liability in the principal or most advantageous market. When considering market participant assumptions in fair value measurements, the following fair value hierarchy distinguishes between observable and unobservable inputs, which are categorized in one of the following levels:
|
|
▪ |
Level 1 Inputs: Unadjusted quoted prices in active markets for identical assets or liabilities accessible to the reporting entity at the measurement date |
|
|
▪ |
Level 2 Inputs: Other than quoted prices included in Level 1 inputs that are observable for the asset or liability, either directly or indirectly, for substantially the full term of the asset or liability |
|
|
▪ |
Level 3 Inputs: Unobservable inputs for the asset or liability used to measure fair value to the extent that observable inputs are not available, thereby allowing for situations in which there is little, if any, market activity for the asset or liability at the measurement date |
There were no changes to the Company’s valuation techniques during 2017. The Company estimates that the recorded value of its financial assets and liabilities approximates fair value at December 29, 2017 and December 30, 2016.
F-8
The Company estimates the value of intangible assets on a nonrecurring basis based on an income approach utilizing discounted cash flows. Under this approach, the Company estimates the future cash flows from its asset groups and discounts the income stream to its present value to arrive at fair value. Future cash flows are based on recently prepared operating forecasts. Operating forecasts and cash flows include, among other things, revenue growth rates that are calculated based on management’s forecasted sales projections. A discount rate is utilized to convert the forecasted cash flows to their present value equivalent. The discount rate applied to the future cash flows includes a subject-company risk premium, an equity market risk premium, a beta, and a risk-free rate. As this approach contains unobservable inputs, the measurement of fair value for intangible assets is classified as Level 3.
At December 29, 2017 and December 30, 2016, intangible assets passed the recoverability test resulting in no impairment. At December 25, 2015, certain intangibles assets associated with our Kingston facility did not pass the recoverability test, and the Company recorded an impairment charge of $1.8 million. See Note 15 – Discontinued Operations for additional details on the closure of the Kingston, New York location.
Inventories
Inventories are stated at the lower of cost or market. The majority of inventory values are based upon standard costs that approximate average costs. The Company analyzes its inventory levels and records a write-down for inventory that has become obsolete, inventory that has a cost basis in excess of its expected net realizable value, and inventory in excess of expected customer demand. Various factors are considered in making this determination, including recent sales history and predicted trends, industry market conditions, and general economic conditions.
Property and Equipment
Property, plant and equipment are stated at cost, less accumulated depreciation. Depreciation is computed using the straight-line method over the following estimated useful lives:
|
|
|
Estimated useful lives of PP&E |
|
Machinery |
|
5-10 years |
|
Leasehold improvements |
|
Lesser of 10 years or lease term |
|
Computer software, hardware, and equipment |
|
3-5 years |
|
Office furniture, fixtures, and equipment |
|
5-7 years |
|
Vehicles |
|
5 years |
Maintenance and repairs that neither add materially to the value of the asset nor appreciably prolong its useful life are charged to expense as incurred. Gains or losses on the disposal of property and equipment are included in selling, general and administrative expenses on the consolidated statements of operations.
Long-Lived Assets
Long-lived assets are reviewed for impairment whenever events or changes in circumstances indicate, in management’s judgment, that the carrying amount of an asset (or asset group) may not be recoverable. In analyzing potential impairments, projections of future cash flows from the asset group are used to estimate fair value. If the sum of the expected future undiscounted cash flows is less than the carrying amount of the asset group, a loss is recognized for the difference between the estimated fair value and the carrying value of the asset group. The projections are based on assumptions, judgments and estimates of revenue growth rates for the related business, anticipated future economic, regulatory and political conditions, the assignment of discount rates relative to risk, and estimates of terminal values.
F-9
In connection with the acquisition of Ajax in 2016, the Company acquired two investments and a note receivable that were recorded at fair value on the date of acquisition: (i) a cost method investment in CHawk Technology International, Inc. (“CHawk”), (ii) an equity method investment in Ajax Foresight Global Manufacturing Sdn. Bhd. (“AFGM”), and (iii) a note receivable from AFGM. The Company accounted for the investments on the cost and equity method, respectively, as the Company did not control either entity. During 2016, the Company recorded equity in earnings of AFGM of $0.2 million, which is included in other expense (income), net. At December 30, 2016, the investment in CHawk and AFGM and the note receivable from AFGM had carrying balances of $1.5 million, $0.7 million, and $0.9 million, respectively. The Company sold its investments in CHawk and AFGM and settled its note from AFGM in January 2017, resulting in a net gain of $0.2 million.
Intangible Assets
The Company accounts for its intangible assets that have a definite life and are amortized on a basis consistent with their expected cash flows over the following estimated useful lives:
|
|
|
Estimated useful lives of intangibles |
|
Trademarks |
|
10 years |
|
Customer relationships |
|
6-10 years |
|
Developed technology |
|
7-10 years |
Goodwill
Goodwill represents the future economic benefits arising from other assets acquired in a business combination that are not individually identified and separately recognized. The Company reviews goodwill for impairment annually and whenever events or changes in circumstances indicate the carrying value of goodwill may not be recoverable. We first make a qualitative assessment of whether it is more likely than not that a reporting unit’s fair value is less than its carrying amount before applying a quantitative goodwill impairment test. Under the quantitative test, the fair value of the reporting unit is compared to its carrying value and an impairment loss is recognized for any excess of carrying amount over the reporting unit’s fair value. Fair value of the reporting unit is determined using a discounted cash flow analysis. For purposes of testing goodwill for impairment, the Company has concluded it operates in one reporting unit.
The Company performed a qualitative goodwill assessment in the fourth quarter of 2017 and 2016. Our goodwill assessment performed in 2017 and 2016 indicated that it was more likely than not the reporting unit’s fair value exceeded its carrying value.
Research and Development Costs
Research and development costs are expensed as incurred.
Warranty Costs
The Company’s product warranties vary by customer, but generally extend for a period of one to two years from the date of sale. Provisions for warranties are determined primarily based on historical warranty cost as a percentage of sales, adjusted for specific problems that may arise. Historical product warranty expense has not been significant.
Advertising Costs
The Company charges advertising costs to operations as incurred. Advertising costs were not significant and are included in selling, general and administrative expenses in the accompanying consolidated statements of operations.
Self-Insurance
The Company sponsors a self-insured medical plan for employees and their dependents. A third party is engaged to assist in estimating the loss exposure related to the self-retained portion of the risk associated with this insurance.
F-10
On August 11, 2015, the Board of Directors instituted a special bonus to certain members of management totaling $3.1 million, of which $1.8 million, $0.2 million, and $0.1 million was earned and recorded as a component of selling, general, and administrative, research and development, and cost of sales, respectively, in 2015. The remaining $1.0 million could be earned by certain members of management through the fourth quarter of 2018 based on their continued employment. In December 2016 the Board of Directors approved that all remaining special bonus was earned and to be paid in December 2016. During 2016, the Company expensed $0.6 million related to the special bonus, including the amount earned in the fourth quarter of 2016. The remaining amount of the bonus was forfeited due to employee terminations. Management does not expect to pay bonuses of this nature in future periods.
Share-Based Payments
The Company uses the Black-Scholes option-pricing model to value the awards on the date of grant. The Company uses the simplified method to estimate the expected term of its share-based awards for all periods, as the Company did not have sufficient history to estimate the weighted average expected term. The risk-free interest rate is based on the U.S. Treasury rates in effect during the corresponding period of grant. Estimated volatility is based on historical volatility of the Company and similar entities whose share prices are publicly traded.
Income Taxes
The Company recognizes deferred income taxes using the asset and liability method of accounting for income taxes. Under the asset and liability method, deferred income taxes are recognized for differences between the financial reporting and tax bases of assets and liabilities at enacted statutory tax rates in effect for the years in which the differences are expected to reverse. The effect on deferred taxes of a change in tax rates is recognized in income in the period that includes the enactment date. Valuation allowances are established when necessary to reduce deferred tax assets to the amount expected to be realized. Income tax benefit for the current year differs from the statutory rate primarily as a result of revaluing our deferred taxes from 35% to 21% due to the Tax Cuts and Jobs Act, the impact of foreign operations, discrete tax benefits recorded in connection with the Company’s acquisitions of Talon and Cal‑Weld in 2017 and Ajax in 2016 (see Note 2 – Acquisitions), and the impact of re-characterizing intercompany debt to equity between our U.S. and Singapore entities related to the reversal of previously accrued withholding taxes (see Note 7 – Income Taxes).
The Company files federal income tax returns, foreign income tax returns, as well as multiple state and local tax returns. The Company is no longer subject to US Federal examination for tax years ending before 2014, to state examinations before 2013, or to foreign examinations before 2012. However, to the extent allowed by law, the tax authorities may have the right to examine prior periods where net operating losses or tax credits were generated and carried forward, and make adjustments up to the amount of the net operating losses or credit carryforward.
When tax returns are filed, it is highly certain that some positions taken would be sustained upon examination by the taxing authorities, while others may be subject to uncertainty about the merits of the position taken or the amount of the position that would be ultimately sustained. The benefit of a tax position is recognized in the consolidated financial statements in the period during which, based on all available evidence, management believes it is more likely than not that the position will be sustained upon examination, including the resolution of appeals or litigation processes, if any. Tax positions taken are not offset or aggregated with other positions. Tax positions that meet the more-likely than-not recognition threshold are measured as the largest amount of tax benefit that is more than 50% likely of being realized upon settlement with the applicable taxing authority. The portion of the benefits associated with tax positions taken that exceeds the amount measured as described above is reflected as a liability for unrecognized tax benefits in the Company’s consolidated balance sheets along with any associated interest and penalties that would be payable to the taxing authorities upon examination. The Company recognizes interest and penalties as a component of income tax benefit.
Foreign Operations
The functional currency of the Company’s international subsidiaries located in the United Kingdom, Singapore, and Malaysia, is the U.S. dollar. Transactions denominated in currencies other than the functional currency generate foreign exchange gains and losses that are included in other expense (income), net on the accompanying consolidated statements of operations. Substantially, all of the Company’s sales and agreements with third-party suppliers provide for pricing and payments in U.S. dollars and, therefore, are not subject to material exchange rate fluctuations. Foreign operations consist of revenue of $346.0 million, $241.7 million, and $173.7 million during 2017, 2016, and 2015, respectively. Assets of foreign operations totaled $127.2 million and $90.4 million at December 29, 2017 and December 30, 2016, respectively.
F-11
Accounting Pronouncements Recently Adopted
In January 2017, the FASB issued Accounting Standards Update (“ASU”) 2017‑04, Intangibles–Goodwill and Other (Topic 350): Simplifying the Test for Goodwill Impairment (“ASU 2017‑04”), which eliminates Step 2 from the goodwill impairment test. Under Step 2, an entity had to perform procedures to determine the fair value at the impairment testing date of its assets and liabilities (including unrecognized assets and liabilities) following the procedure that would be required in determining the fair value of assets acquired and liabilities assumed in a business combination. Instead, under the amendments in ASU 2017 04, an entity should perform its annual, or interim, goodwill impairment test by comparing the fair value of a reporting unit with its carrying amount. An entity should recognize an impairment charge for the amount by which the carrying amount exceeds the reporting unit’s fair value; however, the loss recognized should not exceed the total amount of goodwill allocated to that reporting unit. An entity still has the option to perform the qualitative assessment for a reporting unit to determine if the quantitative impairment test is necessary. ASU 2017‑04 is effective for goodwill impairment tests in fiscal years beginning after December 15, 2020, with early adoption permitted for goodwill impairment tests performed after January 1, 2017. The Company tests goodwill for impairment in the fourth quarter of its fiscal year. The Company adopted ASU 2017‑04 in the fourth quarter of 2017. The adoption did not have an impact on the Company’s financial position or results of operations.
Accounting Pronouncements Recently Issued
In May 2014, the FASB issued ASU No. 2014‑09, Revenue from Contracts with Customers (Topic 606) (“ASU 2014‑09”) and, in August 2015, the FASB issued ASU No. 2015‑14, Revenue from Contracts with Customers (Topic 606): Deferral of the Effective Date, which defers the effective date of ASU 2014‑09 by one year. ASU 2014‑09 requires an entity to recognize revenue to depict the transfer of goods or services to customers in an amount that reflects the consideration to which an entity expects to be entitled in exchange for those goods or services. The guidance also requires expanded disclosures relating to the nature, amount, timing, and uncertainty of revenue and cash flows arising from contracts with customers. Additionally, qualitative and quantitative disclosures are required about customer contracts, significant judgments and changes in judgments, and assets recognized from the costs to obtain or fulfill a contract. The standard permits the use of either the retrospective or modified retrospective transition methods. This guidance replaces most of the existing revenue recognition guidance in U.S. GAAP when it becomes effective, which for us will be at the beginning of the first quarter of fiscal year 2018. In April 2016, the FASB issued ASU No. 2016‑10, Revenue from Contracts with Customers (Topic 606): Identifying Performance Obligations and Licensing (“ASU 2016‑10”), which was issued to clarify ASC Topic 606, Revenue from Contracts with Customers, related to (i) identifying performance obligations; and (ii) the licensing implementation guidance. The effective date and transition of ASU 2016-10 is the same as the effective date and transition of ASU 2014‑09, Revenue from Contracts with Customers (Topic 606), which for us will be the beginning of the first quarter of fiscal year 2018.
We plan to adopt Topic 606 using the modified retrospective method through a cumulative effect adjustment being recognized in retained earnings at December 30, 2017, the date of adoption. Under this approach, we will not restate the prior period financial statements.
We are currently completing the assessment phase of the implementation project and are finalizing our review of the impact of adoption. We are currently in the process of developing, implementing and testing our internal systems, processes and controls necessary to adopt Topic 606, and are in process of making the necessary changes to our accounting policies and disclosures.
Based on our current assessment, we do not anticipate that the adoption of Topic 606 will result in a material cumulative effect adjustment to accumulated deficit nor have a material impact on our financial position, results of operations, or cash flows, as it is not expected to materially change the manner or timing of recognizing revenue. We are currently evaluating the impact of the expanded disclosures to our consolidated financial statements.
In February 2016, the FASB issued ASU No. 2016-02, Leases (Topic 842) (“ASU 2016-02”). This update establishes a comprehensive lease standard for all industries. The new standard requires lessees to recognize a right of use asset and a lease liability for virtually all leases, other than leases that meet the definition of short term leases. The standard is effective for interim and annual reporting periods beginning after December 15, 2018. The Company is currently evaluating the impact of this accounting standard.
In November 2016, the FASB issued ASU No. 2016-18, Statement of Cash Flows (Topic 230): Restricted Cash ("ASU 2016‑18"). This update clarifies guidance on the classification and presentation of restricted cash in the statement of cash flows. The amendment requires restricted cash be included in an entity's cash and cash-equivalent balances in the statement of cash flows and also requires an entity to disclose information about the nature of the restrictions. Further, a reconciliation between the statement of financial position and the statement of cash flows must be disclosed when the statement of financial position includes more than one line item for cash, cash equivalents, restricted cash, and restricted cash equivalents. ASU 2016-18 should be applied on a retrospective basis and is effective for interim and annual reporting periods beginning after December 15, 2017. The Company intends to adopt ASU 2016‑18 at the beginning of 2018, and does not expect the adoption to have a material impact on its consolidated financial statements.
F-12
In January 2017, the FASB issued ASU No. 2017‑01, Business Combinations (Topic 805): Clarifying the Definition of a Business ("ASU 2017‑01"). The amendments in this update clarify the definition of a business with the objective of adding guidance to assist entities with evaluating whether transactions should be accounted for as acquisitions (or disposals) of assets or businesses. ASU 2017‑01 is effective for interim and annual reporting periods beginning after December 15, 2017. The Company intends to adopt ASU 2017‑01 at the beginning of 2018, and does not expect the adoption to have a material impact on its consolidated financial statements.
Note 2 – Acquisitions
Talon Innovations Corporation
On December 11, 2017, the Company completed the acquisition of Talon Innovations Corporation (“Talon”), a Minnesota-based leader in the design and manufacturing of high precision machined parts used in leading edge semiconductor tools, for $137.0 million. Talon expands the Company’s capacity and capabilities in the area of component manufacturing for gas and chemical delivery tools used in semiconductor manufacturing and other industrial applications.
The following table presents the preliminary purchase price allocation as of December 11, 2017:
|
|
|
Preliminary Allocation December 11, 2017 |
|
|
|
Cash acquired |
|
$ |
5,586 |
|
|
Accounts receivable, net |
|
|
11,471 |
|
|
Inventories |
|
|
19,399 |
|
|
Prepaid expenses and other current assets |
|
|
182 |
|
|
Property and equipment, net |
|
|
16,655 |
|
|
Other noncurrent assets |
|
|
76 |
|
|
Intangible assets, net |
|
|
38,000 |
|
|
Goodwill |
|
|
74,594 |
|
|
Accounts payable |
|
|
(4,706 |
) |
|
Accrued liabilities |
|
|
(2,767 |
) |
|
Other current liabilities |
|
|
(1,838 |
) |
|
Deferred tax liabilities |
|
|
(19,652 |
) |
|
Total acquisition consideration |
|
$ |
137,000 |
|
The Company preliminarily allocated $32.4 million to customer relationships and $5.6 million to intellectual property with weighted average amortization periods of 6 years and 10 years, respectively. Goodwill recognized from the acquisition was primarily attributed to an assembled workforce and expected synergies and is not tax deductible. The allocation of acquisition consideration for Talon is preliminary as we have not obtained all of the information to finalize our procedures on the opening balance sheet or the allocation between goodwill and intangible assets. Management has recorded allocations based on information currently available. The Company incurred transaction costs of $1.5 million in connection with the acquisition during 2017. The preliminary inventory fair value adjustment resulted in a $1.6 million charge to cost of sales during 2017.
The Company’s consolidated statement of operations for 2017 includes approximately 3 weeks of Talon operating activity, which is not material to the Company’s 2017 results of operations.
F-13
The following unaudited pro forma consolidated results of operations assume the acquisition was completed on December 26, 2015, the beginning of the earliest period presented. Pro forma adjustments are mainly comprised of preliminary estimates of amortization expense related to acquired intangible assets, acquisition-related costs, incremental interest expense from increased borrowings to fund the acquisition, acquired inventory fair value charges, and the related income tax effects. The pro forma results of operations are presented for informational purposes only and are not indicative of the results of operations that would have been achieved or of results that may occur in the future:
|
|
|
Year Ended |
|
|||||
|
|
|
December 29, 2017 |
|
|
December 30, 2016 |
|
||
|
Net sales |
|
$ |
719,264 |
|
|
$ |
452,195 |
|
|
Net income from continuing operations |
|
$ |
58,436 |
|
|
$ |
25,498 |
|
|
Net income per share from continuing operations attributable to ordinary shareholders: |
|
|
|
|
|
|
|
|
|
Basic |
|
$ |
2.33 |
|
|
$ |
1.40 |
|
|
Diluted |
|
$ |
2.23 |
|
|
$ |
1.07 |
|
Cal‑Weld, Inc.
On July 27, 2017, the Company completed the acquisition of Cal‑Weld, Inc. (“Cal‑Weld”), a California-based leader in the design and fabrication of precision, high purity industrial components, subsystems, and systems, for $56.9 million. Cal‑Weld expands the Company’s capacity and capabilities in the area of component manufacturing for gas delivery tools used in semiconductor manufacturing.
The following table presents the preliminary purchase price allocation as of July 27, 2017 and December 29, 2017 and measurement period adjustments. Measurement period adjustments are due to finalizing our procedures on the opening balance sheet and preliminary estimates of fair value of Cal‑Weld:
|
|
|
Preliminary Allocation July 27, 2017 |
|
|
Measurement Period Adjustment |
|
|
Preliminary Allocation December 29, 2017 |
|
|||
|
Cash acquired |
|
$ |
7,337 |
|
|
$ |
— |
|
|
$ |
7,337 |
|
|
Accounts receivable, net |
|
|
10,318 |
|
|
|
— |
|
|
|
10,318 |
|
|
Inventories |
|
|
20,836 |
|
|
|
— |
|
|
|
20,836 |
|
|
Prepaid expenses and other current assets |
|
|
287 |
|
|
|
113 |
|
|
|
400 |
|
|
Property and equipment, net |
|
|
1,639 |
|
|
|
— |
|
|
|
1,639 |
|
|
Other noncurrent assets |
|
|
587 |
|
|
|
— |
|
|
|
587 |
|
|
Intangible assets, net |
|
|
12,140 |
|
|
|
— |
|
|
|
12,140 |
|
|
Goodwill |
|
|
17,957 |
|
|
|
(223 |
) |
|
|
17,734 |
|
|
Accounts payable |
|
|
(5,991 |
) |
|
|
|
|
|
|
(5,991 |
) |
|
Accrued liabilities |
|
|
(2,016 |
) |
|
|
79 |
|
|
|
(1,937 |
) |
|
Other non-current liabilities |
|
|
(908 |
) |
|
|
— |
|
|
|
(908 |
) |
|
Deferred tax liabilities |
|
|
(5,307 |
) |
|
|
31 |
|
|
|
(5,276 |
) |
|
Total acquisition consideration |
|
$ |
56,879 |
|
|
$ |
— |
|
|
$ |
56,879 |
|
The Company preliminarily allocated $11.5 million to customer relationships and $0.7 million to order backlog with weighted average amortization periods of 6 years and 6 months, respectively. Goodwill recognized from the acquisition was primarily attributed to an assembled workforce and expected synergies and is not tax deductible. The allocation of acquisition consideration for Cal‑Weld is preliminary as we have not obtained all of the information to finalize our procedures on the opening balance sheet or the allocation between goodwill and intangible assets. Management has recorded allocations based on information currently available. The Company incurred transaction costs of $1.9 million in connection with the acquisition during 2017. The inventory fair value adjustment resulted in a $3.6 million charge to cost of sales during 2017.
The Company’s consolidated statement of operations for 2017 includes approximately 5 months of Cal‑Weld operating activity, including revenue of $53.0 million and net income from continuing operations of $6.7 million.
F-14
The following unaudited pro forma consolidated results of operations assume the acquisition was completed on December 26, 2015, the beginning of the earliest period presented. Pro forma adjustments are mainly comprised of amortization expense related to acquired intangible assets, compensation-related costs attributed to non-retained previous ownership, acquisition-related costs, incremental interest expense from increased borrowings to fund the acquisition, acquired inventory fair value charges, and the related income tax effects. The pro forma results of operations are presented for informational purposes only and are not indicative of the results of operations that would have been achieved or of results that may occur in the future:
|
|
|
Year Ended |
|
|||||
|
|
|
December 29, 2017 |
|
|
December 30, 2016 |
|
||
|
Net sales |
|
$ |
725,081 |
|
|
$ |
486,918 |
|
|
Net income from continuing operations |
|
$ |
62,540 |
|
|
$ |
29,462 |
|
|
Net income per share from continuing operations attributable to ordinary shareholders: |
|
|
|
|
|
|
|
|
|
Basic |
|
$ |
2.49 |
|
|
$ |
1.62 |
|
|
Diluted |
|
$ |
2.39 |
|
|
$ |
1.24 |
|
Ajax-United Patterns & Molds, Inc.
On April 12, 2016, the Company completed a stock purchase agreement of Ajax-United Patterns & Molds, Inc. (“Ajax”), a California-based manufacturer of complex plastic and metal products used in the medical, biomedical, semiconductor, data communication and food processing equipment industries, for $17.6 million. The acquisition allows us to manufacture and assemble the complex plastic and metal products required by the medical, biomedical, semiconductor and data communication equipment industries.
The following table presents the preliminary purchase price allocation as of April 12, 2016 and December 30, 2016, measurement period adjustments, and the final purchase price allocation on April 12, 2017, the end of the measurement period. Measurement period adjustments are primarily related to finalization of the valuation of deferred tax liabilities and net identifiable assets and liabilities:
|
|
|
Preliminary Allocation April 12, 2016 |
|
|
Measurement Period Adjustment |
|
|
Preliminary Allocation December 30, 2016 |
|
|
Measurement Period Adjustment |
|
|
Final Allocation April 12, 2017 |
|
|||||
|
Cash acquired |
|
$ |
187 |
|
|
$ |
— |
|
|
$ |
187 |
|
|
$ |
— |
|
|
$ |
187 |
|
|
Accounts receivable, net |
|
|
1,245 |
|
|
|
5 |
|
|
|
1,250 |
|
|
|
— |
|
|
|
1,250 |
|
|
Inventories |
|
|
3,236 |
|
|
|
— |
|
|
|
3,236 |
|
|
|
— |
|
|
|
3,236 |
|
|
Prepaid expenses and other current assets |
|
|
77 |
|
|
|
— |
|
|
|
77 |
|
|
|
8 |
|
|
|
85 |
|
|
Property and equipment, net |
|
|
1,545 |
|
|
|
— |
|
|
|
1,545 |
|
|
|
(78 |
) |
|
|
1,467 |
|
|
Other noncurrent assets |
|
|
2,948 |
|
|
|
— |
|
|
|
2,948 |
|
|
|
— |
|
|
|
2,948 |
|
|
Intangible assets, net |
|
|
8,130 |
|
|
|
(100 |
) |
|
|
8,030 |
|
|
|
— |
|
|
|
8,030 |
|
|
Goodwill |
|
|
4,629 |
|
|
|
2,449 |
|
|
|
7,078 |
|
|
|
(22 |
) |
|
|
7,056 |
|
|
Accounts payable and accrued liabilities |
|
|
(4,403 |
) |
|
|
(83 |
) |
|
|
(4,486 |
) |
|
|
9 |
|
|
|
(4,477 |
) |
|
Deferred tax liabilities |
|
|
— |
|
|
|
(2,271 |
) |
|
|
(2,271 |
) |
|
|
83 |
|
|
|
(2,188 |
) |
|
Total acquisition consideration |
|
$ |
17,594 |
|
|
$ |
— |
|
|
$ |
17,594 |
|
|
$ |
— |
|
|
$ |
17,594 |
|
The Company allocated $8.0 million to customer relationships with a weighted average amortization periods of 10 years. Goodwill recognized from the acquisition was primarily attributed to an assembled workforce and expected synergies and is not tax deductible. The Company incurred transaction costs of $1.5 million in 2016 in connection with the acquisition.
The Company’s consolidated statement of operations for 2016 includes approximately 8 months of Ajax operating activity, including revenue of $20.0 million and operating income of $0.6 million.
Pro forma financial information has not been provided for the acquisition of Ajax as it was not material to the Company’s current year operations and overall financial position.
F-15
Inventory consists of the following:
|
|
|
December 29, 2017 |
|
|
December 30, 2016 |
|
||
|
Raw materials |
|
$ |
91,109 |
|
|
$ |
46,889 |
|
|
Work in process |
|
|
42,186 |
|
|
|
22,649 |
|
|
Finished goods |
|
|
27,268 |
|
|
|
9,423 |
|
|
Excess and obsolete adjustment |
|
|
(6,022 |
) |
|
|
(8,080 |
) |
|
Total inventories, net |
|
$ |
154,541 |
|
|
$ |
70,881 |
|
The following table presents changes to the Company’s excess and obsolete adjustment:
|
|
|
Excess and obsolete adjustment |
|
|
|
Balance at December 26, 2014 |
|
$ |
(4,067 |
) |
|
Charge to cost of sales |
|
|
(3,000 |
) |
|
Disposition of inventory |
|
|
935 |
|
|
Balance at December 25, 2015 |
|
|
(6,132 |
) |
|
Charge to cost of sales |
|
|
(3,921 |
) |
|
Disposition of inventory |
|
|
1,973 |
|
|
Balance at December 30, 2016 |
|
|
(8,080 |
) |
|
Charge to cost of sales |
|
|
(909 |
) |
|
Disposition of inventory |
|
|
2,967 |
|
|
Balance at December 29, 2017 |
|
$ |
(6,022 |
) |
Note 4 – Property and Equipment
Property and equipment consist of the following:
|
|
|
December 29, 2017 |
|
|
December 30, 2016 |
|
||
|
Machinery |
|
$ |
23,464 |
|
|
$ |
5,243 |
|
|
Leasehold improvements |
|
|
15,329 |
|
|
|
11,276 |
|
|
Computer software, hardware and equipment |
|
|
4,551 |
|
|
|
2,848 |
|
|
Office furniture, fixtures and equipment |
|
|
868 |
|
|
|
220 |
|
|
Vehicles |
|
|
51 |
|
|
|
10 |
|
|
Construction-in-process |
|
|
2,771 |
|
|
|
2,069 |
|
|
|
|
|
47,034 |
|
|
|
21,666 |
|
|
Less accumulated depreciation |
|
|
(12,654 |
) |
|
|
(9,648 |
) |
|
Total property and equipment, net |
|
$ |
34,380 |
|
|
$ |
12,018 |
|
Depreciation expense for 2017, 2016, and 2015 was $3.6 million, $2.5 million, and $3.1 million, respectively.
F-16
Note 5 – Intangible Assets and Goodwill
Definite-lived intangible assets consist of the following:
|
|
|
December 29, 2017 |
||||||||||||||||
|
|
|
Gross value |
|
|
Accumulated amortization |
|
|
Accumulated impairment charges |
|
|
Carrying amount |
|
|
Weighted average useful life |
||||
|
Trademarks |
|
$ |
9,690 |
|
|
$ |
(5,814 |
) |
|
$ |
— |
|
|
$ |
3,876 |
|
|
10.0 years |
|
Customer relationships |
|
|
81,427 |
|
|
|
(20,060 |
) |
|
|
— |
|
|
|
61,367 |
|
|
7.8 years |
|
Developed technology |
|
|
22,990 |
|
|
|
(14,938 |
) |
|
|
— |
|
|
|
8,052 |
|
|
7.7 years |
|
Backlog |
|
|
660 |
|
|
|
(550 |
) |
|
|
— |
|
|
|
110 |
|
|
0.5 years |
|
Total intangible assets |
|
$ |
114,767 |
|
|
$ |
(41,362 |
) |
|
$ |
— |
|
|
$ |
73,405 |
|
|
|
|
|
|
December 30, 2016 |
||||||||||||||||
|
|
|
Gross value |
|
|
Accumulated amortization |
|
|
Accumulated impairment charges |
|
|
Carrying amount |
|
|
Weighted average useful life |
||||
|
Trademarks |
|
$ |
9,690 |
|
|
$ |
(4,845 |
) |
|
$ |
— |
|
|
$ |
4,845 |
|
|
10.0 years |
|
Customer relationships |
|
|
50,557 |
|
|
|
(17,150 |
) |
|
|
(11,076 |
) |
|
|
22,331 |
|
|
10.0 years |
|
Developed technology |
|
|
28,100 |
|
|
|
(14,975 |
) |
|
|
(8,155 |
) |
|
|
4,970 |
|
|
6.9 years |
|
Backlog |
|
|
30 |
|
|
|
(30 |
) |
|
|
— |
|
|
|
— |
|
|
0.5 years |
|
Total intangible assets |
|
$ |
88,377 |
|
|
$ |
(37,000 |
) |
|
$ |
(19,231 |
) |
|
$ |
32,146 |
|
|
|
Amortization expense totaled $8.9 million, $7.0 million, and $6.9 million during 2017, 2016, and 2015, respectively.
Future projected annual amortization expense consists of the following:
|
|
|
Future amortization expense |
|
|
|
2018 |
|
$ |
15,198 |
|
|
2019 |
|
|
12,604 |
|
|
2020 |
|
|
12,604 |
|
|
2021 |
|
|
12,570 |
|
|
2022 |
|
|
8,792 |
|
|
Thereafter |
|
|
11,637 |
|
|
|
|
$ |
73,405 |
|
The following tables present the changes to goodwill:
|
|
|
Goodwill |
|
|
|
Balance at December 26, 2014 |
|
$ |
70,015 |
|
|
Acquisitions |
|
|
— |
|
|
Impairment |
|
|
— |
|
|
Balance at December 25, 2015 |
|
|
70,015 |
|
|
Acquisitions |
|
|
7,078 |
|
|
Impairment |
|
|
— |
|
|
Balance at December 30, 2016 |
|
|
77,093 |
|
|
Acquisitions |
|
|
92,306 |
|
|
Impairment |
|
|
— |
|
|
Balance at December 29, 2017 |
|
$ |
169,399 |
|
F-17
Note 6 – Commitments and Contingencies
Operating Leases
The Company leases offices under various operating leases expiring through 2024. The Company is responsible for utilities and its proportionate share of operating expenses under the facilities’ leases. The Company recognizes escalating lease payments on a straight-line basis over the lease term. Rent expense for 2017, 2016, and 2015 was $3.6 million, $2.9 million, and $3.0 million, respectively. Future minimum lease payments for non-cancelable operating leases as of December 29, 2017 are as follows:
|
|
|
Future minimum lease payments |
|
|
|
2018 |
|
$ |
3,516 |
|
|
2019 |
|
|
2,467 |
|
|
2020 |
|
|
2,308 |
|
|
2021 |
|
|
1,788 |
|
|
2022 |
|
|
1,215 |
|
|
Thereafter |
|
|
374 |
|
|
|
|
$ |
11,668 |
|
Litigation
The Company is periodically involved in legal actions and claims that arise as a result of events that occur in the normal course of operations. The ultimate resolution of these actions is not expected to have a material adverse effect on the Company’s financial position or results of operations.
Note 7 – Income Taxes
In December 2017, the Tax Cuts and Jobs Act (the “2017 Tax Act”) was enacted. The 2017 Tax Act includes a number of changes to existing U.S. tax laws that impact the company, most notably a reduction of the U.S. corporate income tax rate from 35% to 21% for tax years beginning after December 31, 2017. The 2017 Tax Act also provides for a one‑time transition tax on certain foreign earnings and the acceleration of depreciation for certain assets placed into service after September 27, 2017, as well as prospective changes beginning in 2018, including repeal of the domestic manufacturing deduction, acceleration of tax revenue recognition, capitalization of research and development expenditures, additional limitations on executive compensation, and limitations on the deductibility of interest.
The Company recognized the income tax effects of the 2017 Tax Act in its 2017 financial statements in accordance with Staff Accounting Bulletin (“SAB”) No. 118, which provides SEC staff guidance for the application of ASC Topic 740, Income Taxes, in the reporting period in which the 2017 Tax Act was signed into law. SAB No. 118 allows registrants to record provisional amounts during a one year “measurement period” similar to that used when accounting for business combinations. However, the measurement period is deemed to have ended earlier when the registrant has obtained, prepared and analyzed the information necessary to finalize its accounting. During the measurement period, impacts of the law are expected to be recorded at the time a reasonable estimate for all or a portion of the effects can be made, and provisional amounts can be recognized and adjusted as information becomes available, prepared or analyzed. The Company’s financial results reflect the income tax effects of the 2017 Tax Act for which provisional amounts have been made based on a reasonable estimate.
The changes to existing U.S. tax laws as a result of the 2017 Tax Act, which we believe have the most significant impact on the Company’s federal income taxes are as follows:
Reduction of the U.S. Corporate Income Tax Rate
The Company measures deferred tax assets and liabilities using enacted tax rates that will apply in the years in which the temporary differences are expected to be recovered or paid. Accordingly, the Company’s deferred tax assets and liabilities were re‑measured to reflect the reduction in the U.S. corporate income tax rate from 35% to 21%, resulting in a $5.9 million increase in income tax benefit for 2017 and a corresponding $5.9 million decrease in net deferred tax liabilities at December 29, 2017.
F-18
Transition Tax on Foreign Earnings
The Company recognized a provisional income tax expense of $0.7 million for 2017 related to the one-time transition tax on certain foreign earnings. This resulted in a corresponding decrease in deferred tax assets due to the utilization of net operating loss carryforwards. The determination of the transition tax requires further analysis regarding the amount and composition of the Company’s historical foreign earnings, which is expected to be completed in 2018.
Income from continuing operations before tax was as follows:
|
|
|
Year Ended |
|
|||||||||
|
|
|
December 29, 2017 |
|
|
December 30, 2016 |
|
|
December 25, 2015 |
|
|||
|
United States |
|
$ |
370 |
|
|
$ |
(12,553 |
) |
|
$ |
(15,319 |
) |
|
Foreign |
|
|
42,659 |
|
|
|
32,683 |
|
|
|
24,135 |
|
|
Income from continuing operations before tax |
|
$ |
43,029 |
|
|
$ |
20,130 |
|
|
$ |
8,816 |
|
Significant components of income tax benefit from continuing operations consist of the following:
|
|
|
Year Ended |
|
|||||||||
|
|
|
December 29, 2017 |
|
|
December 30, 2016 |
|
|
December 25, 2015 |
|
|||
|
Current: |
|
|
|
|
|
|
|
|
|
|
|
|
|
Federal |
|
$ |
809 |
|
|
$ |
— |
|
|
$ |
(1,001 |
) |
|
State |
|
|
249 |
|
|
|
(73 |
) |
|
|
65 |
|
|
Foreign |
|
|
397 |
|
|
|
1,858 |
|
|
|
1,816 |
|
|
Total current tax expense |
|
|
1,455 |
|
|
|
1,785 |
|
|
|
880 |
|
|
Deferred: |
|
|
|
|
|
|
|
|
|
|
|
|
|
Federal |
|
|
(13,251 |
) |
|
|
(2,213 |
) |
|
|
(4,296 |
) |
|
State |
|
|
(1,553 |
) |
|
|
— |
|
|
|
(203 |
) |
|
Foreign |
|
|
(537 |
) |
|
|
(221 |
) |
|
|
(372 |
) |
|
Total deferred tax benefit |
|
|
(15,341 |
) |
|
|
(2,434 |
) |
|
|
(4,871 |
) |
|
Income tax benefit from continuing operations |
|
$ |
(13,886 |
) |
|
$ |
(649 |
) |
|
$ |
(3,991 |
) |
The reconciliation of income tax computed at the U.S. federal statutory tax rates to income tax benefit from continuing operations consist of the following:
|
|
|
Year Ended |
|
|||||||||
|
|
|
December 29, 2017 |
|
|
December 30, 2016 |
|
|
December 25, 2015 |
|
|||
|
Effective rate reconciliation: |
|
|
|
|
|
|
|
|
|
|
|
|
|
U.S. federal tax expense |
|
$ |
15,060 |
|
|
$ |
7,046 |
|
|
$ |
3,084 |
|
|
State income taxes, net |
|
|
(373 |
) |
|
|
(324 |
) |
|
|
(383 |
) |
|
Permanent items |
|
|
2,141 |
|
|
|
303 |
|
|
|
92 |
|
|
Foreign rate differential |
|
|
(7,498 |
) |
|
|
(5,907 |
) |
|
|
(4,259 |
) |
|
Tax holiday |
|
|
(7,437 |
) |
|
|
(5,714 |
) |
|
|
(3,872 |
) |
|
Credits |
|
|
(1,818 |
) |
|
|
(794 |
) |
|
|
(691 |
) |
|
Tax contingencies |
|
|
335 |
|
|
|
86 |
|
|
|
(835 |
) |
|
Share-based compensation |
|
|
(5,438 |
) |
|
|
185 |
|
|
|
22 |
|
|
Withholding tax |
|
|
840 |
|
|
|
1,435 |
|
|
|
925 |
|
|
Impact of re-characterizing intercompany debt to equity |
|
|
1,409 |
|
|
|
— |
|
|
|
— |
|
|
Impact of Tax Cuts and Jobs Act |
|
|
(6,188 |
) |
|
|
— |
|
|
|
— |
|
|
Other, net |
|
|
(248 |
) |
|
|
168 |
|
|
|
(71 |
) |
|
Valuation allowance |
|
|
(4,671 |
) |
|
|
2,867 |
|
|
|
1,997 |
|
|
Income tax benefit from continuing operations |
|
$ |
(13,886 |
) |
|
$ |
(649 |
) |
|
$ |
(3,991 |
) |
F-19
Deferred income tax assets and liabilities from continuing operations consist of the following as of:
|
|
|
December 29, 2017 |
|
|
December 30, 2016 |
|
||
|
Deferred tax assets: |
|
|
|
|
|
|
|
|
|
Inventory |
|
$ |
2,825 |
|
|
$ |
2,159 |
|
|
Share-based compensation |
|
|
866 |
|
|
|
1,521 |
|
|
Accrued payroll |
|
|
1,202 |
|
|
|
903 |
|
|
Net operating loss carryforwards |
|
|
4,020 |
|
|
|
5,274 |
|
|
Transaction costs |
|
|
63 |
|
|
|
191 |
|
|
Tax credits |
|
|
5,851 |
|
|
|
3,600 |
|
|
Other assets |
|
|
1,956 |
|
|
|
2,337 |
|
|
Deferred tax assets |
|
|
16,783 |
|
|
|
15,985 |
|
|
Valuation allowance |
|
|
(4,252 |
) |
|
|
(4,888 |
) |
|
Total deferred tax assets |
|
|
12,531 |
|
|
|
11,097 |
|
|
Deferred tax liabilities: |
|
|
|
|
|
|
|
|
|
Intangible assets |
|
|
(18,283 |
) |
|
|
(10,830 |
) |
|
Property, plant and equipment |
|
|
(3,069 |
) |
|
|
— |
|
|
Other liabilities |
|
|
(743 |
) |
|
|
(303 |
) |
|
Total deferred tax liabilities |
|
|
(22,095 |
) |
|
|
(11,133 |
) |
|
Net deferred tax liability |
|
$ |
(9,564 |
) |
|
$ |
(36 |
) |
At December 29, 2017, the Company had federal and state net operating loss carryforwards of $16.4 million and $13.6 million, respectively. The federal and state net operating loss carryforwards, if not utilized, will begin to expire in 2031 and 2026, respectively. At December 29, 2017, the Company had federal and state research and development credits of $1.3 million and $0.5 million, respectively. The federal and state research and development credits, if not utilized, will begin to expire in 2032 and 2018, respectively. Additionally, the Company had foreign tax credits of $1.3 million, which if not utilized, will begin to expire in 2022.
We have determined the amount of our valuation allowance based on our estimates of taxable income by jurisdiction in which we operate over the periods in which the related deferred tax assets will be recoverable. During 2017, the Company completed the acquisitions of Cal‑Weld and Talon, resulting in a release of valuation allowance against the Company’s net deferred tax assets. During the third quarter of 2017, the Company re‑characterized intercompany debt to equity between its U.S. and Singapore entities resulting in a discrete tax benefit of $1.6 million related to the reversal of previously accrued withholding taxes. As of December 29, 2017, the Company had determined it was more-likely-than-not to realize its U.S. deferred tax assets and had released all of its valuation allowance against its net deferred tax assets, with the exception of foreign tax credits and certain state and foreign net operating loss carryforwards the Company believes are not likely to be realized within the carryforward period.
The Company was granted a tax holiday for its Singapore operations effective 2011 through 2021. The net impact of the tax holiday in Singapore as compared to the Singapore statutory rate was a benefit of $7.4 million, $5.7 million, and $3.9 million during 2017, 2016, and 2015, respectively.
As of December 29, 2017, the Company has recognized $1.6 million of unrecognized tax benefits in long-term liabilities and $0.3 million of unrecognized tax benefits in noncurrent deferred tax liabilities on the accompanying consolidated balance sheet. If recognized, $1.8 million of this amount would impact the Company’s effective tax rate. The Company does not expect a significant decrease to the total amount of unrecognized tax benefits within the next twelve months.
The Company's ongoing practice is to recognize potential accrued interest and penalties related to unrecognized tax benefits within its global operations in income tax expense (benefit). During 2017, the Company recognized a net increase of approximately $0.1 million in potential interest and penalties associated with uncertain tax positions in the consolidated statements of operations. At December 29, 2017, the Company had approximately $0.1 million and $0.4 million of interest and penalties, respectively, associated with uncertain tax positions, which are excluded from the unrecognized tax benefits table below.
F-20
The following table summarizes the activity related to the Company’s unrecognized tax benefits:
|
|
|
Unrecognized tax benefits |
|
|
|
Balance at December 26, 2014 |
|
$ |
1,385 |
|
|
Increase in tax positions for current year |
|
|
85 |
|
|
Decrease in tax positions for prior period |
|
|
(912 |
) |
|
Balance at December 25, 2015 |
|
|
558 |
|
|
Increase in tax positions for current year |
|
|
118 |
|
|
Decrease in tax positions for prior period |
|
|
(100 |
) |
|
Balance at December 30, 2016 |
|
|
576 |
|
|
Increase in tax positions for current year |
|
|
458 |
|
|
Increase in tax positions for prior period |
|
|
214 |
|
|
Increase in tax positions due to acquisitions |
|
|
710 |
|
|
Decrease in tax positions for prior period |
|
|
— |
|
|
Impact of Tax Cuts and Jobs Act |
|
|
(48 |
) |
|
Balance at December 29, 2017 |
|
$ |
1,910 |
|
The Company’s three major filing jurisdictions are the United States, Singapore and Malaysia. The Company is no longer subject to US Federal examination for tax years ending before 2014, to state examinations before 2013, or to foreign examinations before 2012. However, to the extent allowed by law, the tax authorities may have the right to examine prior periods where net operating losses or tax credits were generated and carried forward, and make adjustments up to the amount of the net operating losses or credit carryforward.
Note 8 – Employee Benefit Programs
401(k) Plan
The Company sponsors a 401(k) plan available to employees of its United States-based subsidiaries. Participants may make salary deferral contributions not to exceed 50% of a participant’s compensation in a plan year or the maximum amount otherwise allowed by law. Eligible employees receive a discretionary matching contribution equal to 50% of each participant’s deferral, up to an annual maximum of two thousand five hundred dollars. For 2017, 2016, and 2015, matching contributions were $0.7 million, $0.3 million, and $0.4 million, respectively.
Medical Insurance
The Company sponsors a self-insured group medical insurance plan for its U.S. employees and their dependents. The self-insured plan is designed to provide a specified level of coverage, with stop-loss coverage provided by a commercial insurer, in order to limit the Company’s exposure. For 2017, 2016, and 2015, expense incurred related to this plan was $4.1 million, $2.2 million, and $2.8 million, respectively.
Note 9 – Credit Facilities
Long-term debt consists of the following:
|
|
|
December 29, 2017 |
|
|
December 30, 2016 |
|
||
|
Term loan facility |
|
$ |
179,535 |
|
|
$ |
39,830 |
|
|
Revolving credit facility |
|
|
10,000 |
|
|
|
— |
|
|
Total principal amount of long-term debt |
|
|
189,535 |
|
|
|
39,830 |
|
|
Less unamortized debt issuance costs |
|
|
(2,798 |
) |
|
|
(1,886 |
) |
|
Total long-term debt, net |
|
|
186,737 |
|
|
|
37,944 |
|
|
Less current portion |
|
|
(6,490 |
) |
|
|
— |
|
|
Total long-term debt, less current portion, net |
|
$ |
180,247 |
|
|
$ |
37,944 |
|
F-21
Maturities of long-term debt consist of the following:
|
|
|
Future maturities of long-term debt |
|
|
|
2018 |
|
$ |
6,490 |
|
|
2019 |
|
|
8,260 |
|
|
2020 |
|
|
174,785 |
|
|
|
|
$ |
189,535 |
|
The weighted average interest rate across all credit facilities was 4.30%, 5.04%, and 4.86% during 2017, 2016, and 2015, respectively.
2015 Credit Facility
On August 11, 2015, the Company and its subsidiaries entered into a $55.0 million term loan facility and $20.0 million revolving credit facility (collectively, the “2015 Credit Facility”) with a syndicate of lenders and repaid all outstanding indebtedness under the 2011 Credit Facility discussed below. The 2015 Credit Facility also includes a letter of credit subfacility under the revolving credit facility. The Company recorded $2.6 million in debt issuance costs associated with the 2015 Credit Facility and is amortizing this balance over the term of the facility to interest expense. The Company wrote off previously existing debt issuance costs related to the 2011 Credit Facility resulting in an extinguishment loss of $0.5 million, which is included within interest expense in the accompanying financial statements for 2015.
In December 2017, the Company acquired Talon. To fund the acquisition, the Company amended the 2015 Credit Facility to increase the term loan facility by $120.0 million. The amendment did not meet the definition of an extinguishment and was accounted for as a modification.
In July 2017, the Company acquired Cal‑Weld. To fund the acquisition, the Company amended the 2015 Credit Facility to increase the term loan facility by $20.0 million, add an additional $20.0 million of borrowing capacity under its revolving credit facility, and reduce its interest rate. The amendment did not meet the definition of an extinguishment and was accounted for as a modification.
In April 2016, the Company acquired Ajax. To fund the acquisition, the Company amended the 2015 Credit Facility and increased the term loan facility by $15.0 million and drew an additional $4.0 million on the revolving credit facility. The amendment did not meet the definition of an extinguishment and was accounted for as a modification.
The 2015 Credit Facility is secured by all tangible and intangible assets of the Company and includes customary representations, warranties, and covenants. Additionally, the Company is required to maintain a minimum fixed charge coverage ratio of 1.25 : 1 measured quarterly, and a maximum consolidated leverage ratio 2.25 : 1.
Interest is charged at either the Base Rate or the Eurodollar rate (as such terms are defined in the agreement governing the 2015 Credit Facility) at the option of the Company, plus an applicable margin. The Base Rate is equal to the higher of i) the Prime Rate, ii) the Federal Funds Effective rate plus 0.5%, or iii) the Eurodollar Rate plus 1.00%. The Eurodollar rate is equal to LIBOR. The applicable margin on Base Rate and Eurodollar Rate loans is 1.00‑1.50% and 2.00‑2.50% per annum, respectively, depending on the Company’s leverage ratio. Interest payments are due quarterly if loans are made under the Base Rate. Interest payments are due on the last day of the applicable interest period under Eurodollar Rate loans. As of December 29, 2017, $59.5 million of the term loan facility and the revolving credit facility bore interest at the Eurodollar rate option of 4.15%, and the remaining $120.0 million of the term loan facility bore interest at the Base Rate option of 6.00%.
Principal payments are due on a quarterly basis, however, the $25.0 million payment made using proceeds from our IPO in December 2016 was treated as a pre-payment, and therefore the Company is only required to make quarterly principal payments of $2.1 million on the additional $140.0 million borrowed in connection with the July and December 2017 amendments. The 2015 Credit Facility matures in August 2020.
Under the revolving credit facility, the Company is able to borrow an amount equal to the lesser of i) $5.0 million and ii) the revolving credit facility under a swingline loan. The borrowing availability under the swingline loan is a sublimit to the revolving commitment.
F-22
Note 10 – Shareholders’ Equity
Preferred Shares
Prior to the December 2016 IPO, the Company’s preferred shares had the following characteristics:
Conversion—The holders of preferred shares may convert to common stock at any time at the option of the holder, and the preferred shares will automatically convert to common stock upon a majority vote of the holders of preferred stock. The conversion price is equal to the ratio of the original issuance price divided by the conversion price.
Liquidation preference—In the event of any voluntary or involuntary liquidation, dissolution, or winding up of the Company, the preferred shareholders are entitled to receive an amount per share equal to the greater of (i) The original issuance price plus any dividends declared but unpaid or (ii) an amount per share that would have been payable assuming conversion to common stock immediately prior to a liquidation event. Any remaining assets of the Company after the initial liquidation preference will be made to the common stock holders on a pro rata basis. If the assets of the Company are not sufficient for the full liquidation preference, the holders will share in any distribution on a pro rata basis.
Voting—Preferred shareholders have voting rights based on the number of shares of common stock into which the preferred shares can convert.
Dividends—Preferred shareholders are entitled to receive dividends when and if declared by the Board of Directors. In August 2015, the Board of Directors approved and paid a cash dividend totaling $22.1 million to the preferred shareholders.
At the IPO, all outstanding preferred shares were converted into 17,722,808 ordinary shares.
Note 11 – Related Party Transactions
The Company purchased certain parts from Ajax Foresight Global Manufacturing Sdn. Bhd. (“AFGM”), an investment acquired in conjunction with the acquisition of Ajax. Total purchases from AFGM were $0.2 million and $0.7 million in 2017 and 2016, respectively. Outstanding accounts payable to AFGM totaled $0.3 million December 30, 2016. During February 2017, the Company sold its investment in AFGM, and therefore no related party relationship exists on a go‑forward basis.
The Company received advisory services from Francisco Partners Management, L.P. (“FPM”), an entity affiliated with certain of the Company’s principal shareholders through our December 2016 IPO, at which time the Company’s advisory agreement with FPM was terminated. Under the advisory agreement, the Company was obligated to pay FPM an annual advisory fee equal to $1.5 million per year. Such advisory fee was waived for all periods presented in which the advisory agreement was effective.
The Company also received consulting services from Francisco Partners Consulting, LLC (“FPC”), an entity that provides consulting services to the private equity funds managed by FPM and their portfolio companies on a dedicated basis, through our December 2016 IPO, at which time the Company’s agreement with FPC was terminated and such services ceased. FPC is not an affiliate of the Company, FPM, or any of the Company’s principal shareholders, and none of the Company’s principal shareholders hold an in interest in FPC. During 2017, the Company received from FPC a refund of previously paid consulting fees of $0.3 million. During 2016 and 2015, the Company paid $0.5 million and $0.3 million, respectively, to FPC for consulting services.
On January 10, 2011, PFT entered into a sublease agreement with Precision Flow Inc., which was majority owned by a member of the board of directors of the Company. During 2016 and 2015, PFT paid $1.0 million and $1.2 million, respectively, in sublease rent to Precision Flow Inc. The sublease agreement between PFT and Precision Flow Inc. expires February 28, 2018. The Company has ceased operations in this facility as of May 2016 but has not completed a lease termination agreement with Precision Flow Inc. This board member resigned in 2016, and therefore no related party relationship exists going forward.
The Company had purchases totaling $0.1 million and $0.8 million from Ceres, an entity owned by a member of the board of directors of the Company, during 2016 and 2015, respectively. The Company had sales totaling $0.2 million and $0 during 2016 and 2015. This board member resigned in 2016, and therefore no related party relationship exists going forward.
F-23
Note 12 – Share-Based Compensation
2016 Plan
In December 2016, the Company adopted the 2016 Omnibus Incentive Plan (“the 2016 Plan”). Under the 2016 Plan, 1,888,000 ordinary shares are reserved for issuance. The number of shares reserved for issuance under the 2016 Plan increases annually beginning in fiscal year 2018 by the lesser of (i) 2% of the ordinary shares outstanding on the last day of the immediately preceding fiscal year or (ii) such amount determined by the Board. Awards may be in the form of options, tandem and non-tandem stock appreciation rights, restricted shares, performance awards, and other share based awards and can be issued to employees, directors, and consultants. Canceled or expired awards under the 2016 Plan are returned to the incentive plan pool for future grants.
Awards granted under the 2016 Plan generally have a term of 7 years. Vesting generally occurs 25% on the first anniversary of the date of grant, and quarterly thereafter over the remaining 3 years.
2012 Plan
In March 2012, the Company adopted the Ichor Holdings Ltd. 2012 Equity Incentive Plan (the “2012 Plan”). Under the 2012 Plan, the Company can grant either restricted shares or stock options to employees, directors and consultants. The Board of Directors initially authorized the issuance of 21,000,000 stock options or restricted shares under the 2012 Plan. On October 25, 2013, the Board of Directors authorized the issuance of an additional 4,000,000 stock options or restricted shares under the 2012 Plan. Canceled or expired stock options or restricted shares are returned to the incentive plan pool for future grants.
Stock options granted under the 2012 Plan generally have a term of 7 years. Vesting generally occurs 25% on the first anniversary of the date of grant, and quarterly thereafter over the remaining 3 years.
There have been no issuances of equity-based awards under the 2012 Plan since the adoption of the 2016 Plan.
Stock Options
The table below sets forth the weighted average assumptions used to measure the fair value of options granted:
|
|
|
Year Ended |
|
|||||||||
|
|
|
December 29, 2017 |
|
|
December 30, 2016 |
|
|
December 25, 2015 |
|
|||
|
Weighted average expected term |
|
5 years |
|
|
5 years |
|
|
5 years |
|
|||
|
Risk-free interest rate |
|
|
1.9 |
% |
|
|
1.3 |
% |
|
|
1.4 |
% |
|
Dividend yield |
|
|
0.0 |
% |
|
|
0.0 |
% |
|
|
0.0 |
% |
|
Volatility |
|
|
47.7 |
% |
|
|
50.0 |
% |
|
|
50.0 |
% |
The following table summarizes the Company’s stock option activity during 2017:
|
|
|
Number of Stock Options |
|
|
|
|
|
|
|
|
|
|
|
|||||
|
|
|
Time vesting |
|
|
Performance vesting |
|
|
Weighted average exercise price per share |
|
|
Weighted average remaining contractual term |
|
Aggregate intrinsic value (in thousands) |
|
||||
|
Outstanding, December 30, 2016 |
|
|
1,948,307 |
|
|
|
215,908 |
|
|
$ |
8.87 |
|
|
|
|
|
|
|
|
Granted |
|
|
604,700 |
|
|
|
— |
|
|
$ |
19.57 |
|
|
|
|
|
|
|
|
Exercised |
|
|
(1,078,182 |
) |
|
|
— |
|
|
$ |
8.48 |
|
|
|
|
|
|
|
|
Forfeited |
|
|
(22,000 |
) |
|
|
— |
|
|
$ |
18.69 |
|
|
|
|
|
|
|
|
Expired |
|
|
— |
|
|
|
— |
|
|
$ |
— |
|
|
|
|
|
|
|
|
Outstanding, December 29, 2017 |
|
|
1,452,825 |
|
|
|
215,908 |
|
|
$ |
12.87 |
|
|
4.2 years |
|
$ |
19,662 |
|
|
Exercisable, December 29, 2017 |
|
|
682,560 |
|
|
|
215,908 |
|
|
$ |
9.29 |
|
|
2.7 years |
|
$ |
13,754 |
|
F-24
Fair value information for options granted and the intrinsic value of options exercised are as follows:
|
|
|
Year Ended |
|
|||||||||
|
|
|
December 29, 2017 |
|
|
December 30, 2016 |
|
|
December 25, 2015 |
|
|||
|
Weighted average grant-date fair value of options granted |
|
$ |
8.52 |
|
|
$ |
4.18 |
|
|
$ |
4.18 |
|
|
Total intrinsic value of options exercised |
|
$ |
16,423 |
|
|
N/A |
|
|
N/A |
|
||
At December 29, 2017, total unrecognized share-based compensation expense relating to stock options was $5.0 million, with a weighted average remaining service period of 3.3 years.
Restricted Shares
The following table summarizes the Company’s restricted share activity during 2017:
|
|
|
Number of Restricted Ordinary Shares |
|
|
|
|
|
|
|
|
|
Time vesting |
|
|
Weighted average grant date fair value |
|
||
|
Unvested, December 30, 2016 |
|
|
103,055 |
|
|
$ |
8.39 |
|
|
Granted |
|
|
125,158 |
|
|
$ |
19.63 |
|
|
Vested |
|
|
(74,932 |
) |
|
$ |
8.46 |
|
|
Forfeited |
|
|
— |
|
|
$ |
— |
|
|
Unvested, December 29, 2017 |
|
|
153,281 |
|
|
$ |
17.53 |
|
Fair value information for restricted shares granted and vested during is as follows:
|
|
|
Year Ended |
|
|||||||||
|
|
|
December 29, 2017 |
|
|
December 30, 2016 |
|
|
December 25, 2015 |
|
|||
|
Weighted average grant-date fair value of shares granted |
|
$ |
19.63 |
|
|
$ |
9.42 |
|
|
N/A |
|
|
|
Total fair value of shares vested |
|
$ |
634 |
|
|
$ |
1,484 |
|
|
$ |
296 |
|
At December 29, 2017, total unrecognized share-based compensation expense relating to restricted shares was $2.3 million, with a weighted average remaining service period of 3.4 years.
During 2017, 2016, and 2015, share-based compensation expense for stock options and restricted shares across all plans totaled $2.2 million, $3.2 million, and $1.1 million, respectively.
2017 ESPP
In May 2017, the Company adopted the 2017 Employee Stock Purchase Plan (the “2017 ESPP”), which provides employees the ability to designate a portion of their base-pay to purchase ordinary shares at a price equal to 85% of the fair market value of ordinary shares on the first or last day of each 6 month purchase period. Purchase periods begin on January 1 or July 1 and end on June 30 or December 31, or next business day if such date is not a business day. Shares are purchased on the last day of the purchase period. 2,500,000 ordinary shares are reserved for issuance under the 2017 ESPP. The current purchase period began on August 7, 2017 and ends on January 2, 2018. No shares were issued under the 2017 ESPP during 2017.
The table below sets forth the weighted average assumptions used to measure the fair value of 2017 ESPP rights:
|
|
|
Year Ended |
||||||
|
|
|
December 29, 2017 |
|
|
December 30, 2016 |
|
December 25, 2015 |
|
|
Weighted average expected term |
|
0.4 years |
|
|
N/A |
|
N/A |
|
|
Risk-free interest rate |
|
|
1.1 |
% |
|
N/A |
|
N/A |
|
Dividend yield |
|
|
0.0 |
% |
|
N/A |
|
N/A |
|
Volatility |
|
|
47.8 |
% |
|
N/A |
|
N/A |
F-25
The Company recognizes share-based compensation expense associated with the 2017 ESPP over the duration of the purchase period. The Company recognized an insignificant amount of share-based compensation expense associated with the 2017 ESPP during 2017. At December 29, 2017, there was no unrecognized share-based compensation expense.
Note 13 – Segment Information
The Company’s Chief Operating Decision Maker (CODM), the Chief Executive Officer, reviews the Company’s results of operations on a consolidated level and executive staff is structured by function rather than by product category. Therefore, the Company operates in one operating segment. Key resources, decisions, and assessment of performance are also analyzed on a company-wide level.
The Company’s foreign operations are conducted primarily through its wholly owned subsidiaries in Singapore and Malaysia. The Company’s principal markets include North America, Asia and, to a lesser degree, Europe. Sales by geographic area represent sales to unaffiliated customers.
All information on sales by geographic area is based upon the location to which the products were shipped. The following table sets forth sales by geographic area (including sales from discontinued operations):
|
|
|
Year Ended |
|
|||||||||
|
|
|
December 29, 2017 |
|
|
December 30, 2016 |
|
|
December 25, 2015 |
|
|||
|
United States of America |
|
$ |
386,645 |
|
|
$ |
243,237 |
|
|
$ |
238,470 |
|
|
Singapore |
|
|
223,277 |
|
|
|
163,515 |
|
|
|
96,141 |
|
|
Europe |
|
|
27,555 |
|
|
|
16,353 |
|
|
|
22,938 |
|
|
Other |
|
|
18,415 |
|
|
|
9,218 |
|
|
|
13,840 |
|
|
Total net sales |
|
$ |
655,892 |
|
|
$ |
432,323 |
|
|
$ |
371,389 |
|
The following table sets forth the Company’s two major customers, which comprised 93%, 97%, and 95% of sales from continuing operations in 2017, 2016, and 2015, respectively:
|
|
|
Year Ended |
|
|||||||||
|
|
|
December 29, 2017 |
|
|
December 30, 2016 |
|
|
December 25, 2015 |
|
|||
|
Lam Research |
|
$ |
350,372 |
|
|
$ |
207,230 |
|
|
$ |
165,133 |
|
|
Applied Materials |
|
$ |
259,234 |
|
|
$ |
185,465 |
|
|
$ |
111,661 |
|
Note 14 – Earnings per Share
Basic and diluted net income per share attributable to ordinary shareholders was presented in conformity with the two-class method during 2016 and 2015, required for participating securities, as the Company had two classes of stock until its December 2016 IPO. The Company considered its convertible preferred shares to be a participating security as the convertible preferred shares participated in dividends with ordinary shareholders, when and if declared by the board of directors. In the event a dividend was paid on ordinary shares, the holders of preferred shares were entitled to a proportionate share of any such dividend as if they were holders of ordinary shares (on an as-if converted basis). The convertible preferred shares did not participate in losses incurred by the Company. In accordance with the two-class method, earnings allocated to these participating securities and the related number of outstanding shares of the participating securities, which include contractual participation rights in undistributed earnings, have been excluded from the computation of basic and diluted net income per share attributable to ordinary shareholders.
Under the two-class method, net income attributable to ordinary shareholders after deduction of preferred share dividends, if any, is determined by allocating undistributed earnings between the ordinary shares and the participating securities based on their respective rights to receive dividends. Basic net income (loss) per share attributable to ordinary shareholders is computed by dividing net income (loss) attributable to ordinary shareholders by the weighted-average number of ordinary shares outstanding during the period. All participating securities are excluded from basic weighted-average ordinary shares outstanding. Diluted net income (loss) per share attributable to ordinary shareholders is computed by dividing net income (loss) attributable to ordinary shareholders by the weighted average number of ordinary shares outstanding, including all potentially dilutive ordinary shares, if the effect of each class of potential shares of ordinary shares is dilutive.
F-26
For purposes of calculating EPS under the two-class method, an accounting policy election has been made to treat each income statement line item (net income from continuing operations, net income (loss) from discontinued operations, and net income) as an independent calculation and only allocate earnings to participating securities for those line items for which income is reported, as the participating securities do not have a contractual obligation to participate in losses. There is therefore no allocation of losses to participating securities for those line items for which a loss is reported. Under this method, the sum of the individual EPS income statement line items will not reconcile to the total net income (loss) per share.
Net income per share was not presented in conformity with the two‑class method during 2017, as the Company had only one class of stock outstanding.
F-27
The following table sets forth the computation of the Company’s basic and diluted net income (loss) per share attributable to ordinary shareholders and a reconciliation of the numerator and denominator used in the calculation:
|
|
|
Year Ended |
|
|||||||||
|
|
|
December 29, 2017 |
|
|
December 30, 2016 |
|
|
December 25, 2015 |
|
|||
|
Numerator: |
|
|
|
|
|
|
|
|
|
|
|
|
|
Net income from continuing operations |
|
$ |
56,915 |
|
|
$ |
20,779 |
|
|
$ |
12,807 |
|
|
Preferred share dividend |
|
|
— |
|
|
|
— |
|
|
|
(22,127 |
) |
|
Undistributed earnings attributed to preferred shareholders |
|
|
— |
|
|
|
(19,060 |
) |
|
|
— |
|
|
Net income (loss) from continuing operations, attributable to ordinary shareholders |
|
$ |
56,915 |
|
|
$ |
1,719 |
|
|
$ |
(9,320 |
) |
|
Net loss from discontinued operations |
|
$ |
(461 |
) |
|
$ |
(4,117 |
) |
|
$ |
(7,181 |
) |
|
Undistributed earnings attributed to preferred shareholders |
|
|
— |
|
|
|
— |
|
|
|
— |
|
|
Preferred share dividend |
|
|
— |
|
|
|
— |
|
|
|
— |
|
|
Net loss from discontinued operations, attributable to ordinary shareholders |
|
$ |
(461 |
) |
|
$ |
(4,117 |
) |
|
$ |
(7,181 |
) |
|
Net income |
|
$ |
56,454 |
|
|
$ |
16,662 |
|
|
$ |
5,626 |
|
|
Preferred share dividend |
|
|
— |
|
|
|
— |
|
|
|
(22,127 |
) |
|
Undistributed earnings attributed to preferred shareholders |
|
|
— |
|
|
|
(15,284 |
) |
|
|
— |
|
|
Net income (loss), attributable to ordinary shareholders |
|
$ |
56,454 |
|
|
$ |
1,378 |
|
|
$ |
(16,501 |
) |
|
Denominator: |
|
|
|
|
|
|
|
|
|
|
|
|
|
Weighted average ordinary shares outstanding |
|
|
25,118,031 |
|
|
|
1,503,296 |
|
|
|
31,875 |
|
|
Dilutive effect of stock options |
|
|
1,030,793 |
|
|
|
306,871 |
|
|
|
— |
|
|
Dilutive effect of restricted shares |
|
|
68,184 |
|
|
|
157,759 |
|
|
|
— |
|
|
Dilutive effect of employee share purchase plan |
|
|
1,416 |
|
|
|
— |
|
|
|
— |
|
|
Weighted average number of shares used in diluted per share calculation for net income (loss) from continuing operations |
|
|
26,218,424 |
|
|
|
1,967,926 |
|
|
|
31,875 |
|
|
Weighted average ordinary shares outstanding |
|
|
25,118,031 |
|
|
|
1,503,296 |
|
|
|
31,875 |
|
|
Dilutive effect of stock options |
|
|
— |
|
|
|
— |
|
|
|
— |
|
|
Dilutive effect of restricted shares |
|
|
— |
|
|
|
— |
|
|
|
— |
|
|
Dilutive effect of employee share purchase plan |
|
|
— |
|
|
|
— |
|
|
|
— |
|
|
Weighted average number of shares used in diluted per share calculation for net loss from discontinued operations |
|
|
25,118,031 |
|
|
|
1,503,296 |
|
|
|
31,875 |
|
|
Weighted average ordinary shares outstanding |
|
|
25,118,031 |
|
|
|
1,503,296 |
|
|
|
31,875 |
|
|
Dilutive effect of stock options |
|
|
1,030,793 |
|
|
|
306,871 |
|
|
|
— |
|
|
Dilutive effect of restricted shares |
|
|
68,184 |
|
|
|
157,759 |
|
|
|
— |
|
|
Dilutive effect of employee share purchase plan |
|
|
1,416 |
|
|
|
— |
|
|
|
— |
|
|
Weighted average number of shares used in diluted per share calculation for net income (loss) |
|
|
26,218,424 |
|
|
|
1,967,926 |
|
|
|
31,875 |
|
|
Net income (loss) per share attributable to ordinary shareholders: |
|
|
|
|
|
|
|
|
|
|
|
|
|
Continuing operations: |
|
|
|
|
|
|
|
|
|
|
|
|
|
Basic |
|
$ |
2.27 |
|
|
$ |
1.14 |
|
|
$ |
(292.39 |
) |
|
Diluted |
|
$ |
2.17 |
|
|
$ |
0.87 |
|
|
$ |
(292.39 |
) |
|
Discontinued operations: |
|
|
|
|
|
|
|
|
|
|
|
|
|
Basic |
|
$ |
(0.02 |
) |
|
$ |
(2.74 |
) |
|
$ |
(225.29 |
) |
|
Diluted |
|
$ |
(0.02 |
) |
|
$ |
(2.74 |
) |
|
$ |
(225.29 |
) |
|
Total: |
|
|
|
|
|
|
|
|
|
|
|
|
|
Basic |
|
$ |
2.25 |
|
|
$ |
0.92 |
|
|
$ |
(517.68 |
) |
|
Diluted |
|
$ |
2.15 |
|
|
$ |
0.70 |
|
|
$ |
(517.68 |
) |
F-28
An aggregated total of 72,321, 165,275, and 519,576 potential ordinary shares have been excluded from the computation of diluted net income (loss) per share attributable to ordinary shareholders for 2017, 2016, and 2015, respectively, because including them would have been antidilutive.
Note 15 – Discontinued Operations
In January 2016, we made the decision to shut down our Kingston, New York facility as this location consumed a significant amount of resources while contributing very little income. We completed the shutdown of the operations of the New York facility in May 2016 through abandonment as a buyer for the facility and operation was not found. We recognized additional expense consisting of fixed asset and long-lived asset impairments totaling $3.2 million in the fourth quarter of 2015 related to this decision. The impairments related to fixed assets and long lived assets were based on the estimated fair value of such assets over their remaining expected lives through May 2016. No further sales are being generated from the customer that this location serviced after May 2016.
The Company ceased operations at this facility in May 2016. As this was our cease use date, the Company recorded lease abandonment and inventory charges of approximately $0.6 million and $2.0 million, respectively, in the second quarter of 2016. At December 29, 2017, future minimum lease payments of $0.3 million are reflected in accrued liabilities of discontinued operations.
The carrying amounts of the major classes of assets and liabilities of the Kingston, New York facility are reflected in the following table:
|
|
|
December 29, 2017 |
|
|
December 30, 2016 |
|
||
|
Assets |
|
|
|
|
|
|
|
|
|
Current assets: |
|
|
|
|
|
|
|
|
|
Prepaid expenses and other current assets |
|
$ |
3 |
|
|
$ |
99 |
|
|
Total current assets |
|
|
3 |
|
|
|
99 |
|
|
Total assets |
|
$ |
3 |
|
|
$ |
99 |
|
|
Liabilities |
|
|
|
|
|
|
|
|
|
Current liabilities: |
|
|
|
|
|
|
|
|
|
Accounts payable |
|
$ |
136 |
|
|
$ |
152 |
|
|
Accrued liabilities |
|
|
255 |
|
|
|
360 |
|
|
Other current liabilities |
|
|
9 |
|
|
|
52 |
|
|
Total current liabilities |
|
|
400 |
|
|
|
564 |
|
|
Deferred tax liabilities |
|
|
— |
|
|
|
30 |
|
|
Other long-term liabilities |
|
|
— |
|
|
|
9 |
|
|
Total liabilities |
|
$ |
400 |
|
|
$ |
603 |
|
The results of the discontinued operation were as follows:
|
|
|
Year Ended |
|
|||||||||
|
|
|
December 29, 2017 |
|
|
December 30, 2016 |
|
|
December 25, 2015 |
|
|||
|
Net sales |
|
$ |
— |
|
|
$ |
26,576 |
|
|
$ |
80,748 |
|
|
Cost of sales |
|
|
— |
|
|
|
28,077 |
|
|
|
80,840 |
|
|
Operating expenses: |
|
|
|
|
|
|
|
|
|
|
|
|
|
Research and development |
|
|
— |
|
|
|
262 |
|
|
|
954 |
|
|
Selling, general, and administrative |
|
|
722 |
|
|
|
2,315 |
|
|
|
2,765 |
|
|
Amortization of intangible assets |
|
|
— |
|
|
|
— |
|
|
|
475 |
|
|
Total operating expenses |
|
|
722 |
|
|
|
2,577 |
|
|
|
4,194 |
|
|
Operating income (loss) |
|
|
(722 |
) |
|
|
(4,078 |
) |
|
|
(4,286 |
) |
|
Interest income, net |
|
|
— |
|
|
|
— |
|
|
|
(16 |
) |
|
Other expense, net |
|
|
— |
|
|
|
(1 |
) |
|
|
3,136 |
|
|
Income (loss) from discontinued operations before income taxes |
|
|
(722 |
) |
|
|
(4,077 |
) |
|
|
(7,406 |
) |
|
Income tax expense |
|
|
(261 |
) |
|
|
40 |
|
|
|
(225 |
) |
|
Loss from discontinued operations |
|
$ |
(461 |
) |
|
$ |
(4,117 |
) |
|
$ |
(7,181 |
) |
F-29
Supplemental information related to the discontinued operation is as follows for the periods presented:
|
|
|
Year Ended |
|
|||||||||
|
|
|
December 29, 2017 |
|
|
December 30, 2016 |
|
|
December 25, 2015 |
|
|||
|
Depreciation and amortization |
|
$ |
— |
|
|
$ |
— |
|
|
$ |
1,143 |
|
|
Capital expenditures |
|
$ |
— |
|
|
$ |
— |
|
|
$ |
427 |
|
|
Impairment of property and equipment |
|
$ |
— |
|
|
$ |
— |
|
|
$ |
1,335 |
|
|
Impairment of intangible assets |
|
$ |
— |
|
|
$ |
— |
|
|
$ |
1,825 |
|
|
Write-down of inventory |
|
$ |
— |
|
|
$ |
1,999 |
|
|
$ |
1,506 |
|
Note 16 – Subsequent Events (unaudited)
Subsequent events are events or transactions that occur after the balance sheet date but before financial statements are issued. The Company recognizes in the consolidated financial statements the effects of all subsequent events that provide additional evidence about conditions that existed at the date of the balance sheet, including the estimates inherent in the process of preparing the financial statements. The Company's consolidated financial statements do not recognize subsequent events that provide evidence about conditions that did not exist at the date of the balance sheet but arose after the balance sheet date and before financial statements are issued. In preparing these consolidated financial statements, the Company has evaluated events and transactions for potential recognition or disclosure through March 13, 2018, the date the consolidated financial statements were issued.
Modification of Equity Awards
On January 18, 2018, in connection with the separation of our previous Chief Financial Officer (“previous CFO”) from the Company, the General Release of All Claims (the “General Release”) became effective. Pursuant to our previous CFO’s Transition Agreement, separation benefits begin on the date the General Release becomes effective. Included in the separation benefits is a vesting acceleration of all outstanding and unvested stock options and restricted shares. Consequently, 88,445 stock options and 39,175 restricted shares vested on January 18, 2018. This was accounted for as a modification under ASC Topic 718 and resulted in approximately $2.9 million in share-based compensation expense. All 88,445 modified stock options were exercised on February 12, 2018.
Refinance of Long-Term Debt
On February 15, 2018, the Company entered into an Amended and Restated Credit Agreement (the “Credit Agreement”) to refinance all outstanding indebtedness under the 2015 Credit Facility. The agreement features a $175.0 million term loan facility and a revolving facility allowing for borrowings up to $125.0 million. The Credit Agreement decreases the applicable interest rate for borrowings under the term loan facility and revolving facility by 25 basis points and extends the maturity from August 2020 to February 2023. Additionally, the Credit Agreement (i) increases the maximum leverage ratio to 3.0x and (ii) changes the leverage ratios such that the Company is not required to use excess cash flow to prepay amounts owed under the credit facility when its leverage ratio is less than 2.0x. The effect of this debt refinance has not been recognized in these consolidated financial statements.
Share Repurchase Program
In February 2018, our board of directors authorized a share repurchase program up to $50.0 million under which we may repurchase our ordinary shares in the open market or through privately negotiated transactions, depending on market conditions and other factors. We expect to fund share repurchases, if any, with cash on hand or borrowings under our Revolving Credit Facility. As of the date of this report, the Company has repurchased approximately $5.0 million in ordinary shares.
F-30
The following exhibits are filed with this Form 10‑K or are incorporated herein by reference:
|
Exhibit Number |
|
Description of Exhibit |
|
|
|
|
|
2.1 |
|
|
|
|
|
|
|
2.2* |
|
|
|
|
|
|
|
3.1 |
|
|
|
|
|
|
|
10.1 |
|
|
|
|
|
|
|
10.2 |
|
|
|
|
|
|
|
10.3 |
|
|
|
|
|
|
|
10.4+ |
|
|
|
|
|
|
|
10.5+ |
|
|
|
|
|
|
|
10.6+ |
|
|
|
|
|
|
|
10.7+ |
|
|
|
|
|
|
|
10.8+ |
|
|
|
|
|
|
|
10.9+ |
|
|
|
|
|
|
|
|
||
|
|
|
|
|
10.11+ |
|
|
|
|
|
|
|
10.12 |
|
|
|
|
|
|
|
10.13 |
|
|
|
|
|
|
|
10.14*+ |
|
Offer Letter, dated as of July 20, 2017, between Ichor Systems, Inc. and Kevin Canty |
|
|
|
|
|
10.15*+ |
|
Offer Letter, dated as of November 9, 2017, between Ichor Systems, Inc. and Jeffrey Andreson |
|
|
|
|
|
10.16* |
|
|
|
|
|
|
|
21.1* |
|
|
|
|
|
|
|
23.1* |
|
|
|
|
|
|
|
31.1* |
|
|
|
|
|
|
|
31.2* |
|
|
|
|
|
|
|
32.1* |
|
|
|
|
|
|
|
32.2* |
|
|
|
* |
Filed herewith |
|
+ |
A management contract or compensatory arrangement required to be filed as an exhibit pursuant to Item 601 of Regulation S‑K |
Pursuant to the requirements of Section 13 or 15(d) of the Securities Exchange Act of 1934, the registrant has duly caused this report to be signed on its behalf by the undersigned, thereunto duly authorized.
|
Dated: March 13, 2018 |
ICHOR HOLDINGS, LTD. |
||
|
|
|
|
|
|
|
By: |
|
/s/ Thomas M. Rohrs |
|
|
|
|
Thomas M. Rohrs |
Pursuant to the requirements of the Securities Exchange Act of 1934, this report has been signed below by the following persons on behalf of the registrant and in the capacities and on the dates indicated.
|
|
Signature |
|
|
|
Name and Title |
|
|
|
Date |
|
|
|
|
|
|
|
||||||
|
/s/ Thomas M. Rohrs Thomas M. Rohrs |
|
Executive Chairman, Director and Chief Executive Officer (Principal Executive Officer) |
|
March 13, 2018 |
||||||
|
|
|
|
|
|
||||||
|
/s/ Jeffrey Andreson Jeffrey Andreson |
|
Chief Financial Officer (Principal Accounting and Financial Officer) |
|
March 13, 2018 |
||||||
|
|
|
|
|
|
||||||
|
/s/ John Chenault John Chenault |
|
Director |
|
March 13, 2018 |
||||||
|
|
|
|
|
|
||||||
|
/s/ Dipanjan Deb Dipanjan Deb |
|
Director |
|
March 13, 2018 |
||||||
|
|
|
|
|
|
||||||
|
/s/ Andrew Kowal Andrew Kowal |
|
Director |
|
March 13, 2018 |
||||||
|
|
|
|
|
|
||||||
|
/s/ Iain MacKenzie Iain MacKenzie |
|
Director |
|
March 13, 2018 |
||||||
|
|
|
|
|
|
||||||
|
/s/ Marc Haugen |
|
Director |
|
March 13, 2018 |
||||||
|
Marc Haugen |
|
|
||||||||
|
|
|
|
|
|
||||||