Attached files
| file | filename |
|---|---|
| EX-32.2 - CERTIFICATION OF CHIEF FINANCIAL OFFICER PURSUANT TO SECTION 906 - KBS Real Estate Investment Trust II, Inc. | kbsriiq42017exhibit322.htm |
| EX-32.1 - CERTIFICATION OF CHIEF EXECUTIVE OFFICER PURSUANT TO SECTION 906 - KBS Real Estate Investment Trust II, Inc. | kbsriiq42017exhibit321.htm |
| EX-31.2 - CERTIFICATION OF CHIEF FINANCIAL OFFICER PURSUANT TO SECTION 302 - KBS Real Estate Investment Trust II, Inc. | kbsriiq42017exhibit312.htm |
| EX-31.1 - CERTIFICATION OF CHIEF EXECUTIVE OFFICER PURSUANT TO SECTION 302 - KBS Real Estate Investment Trust II, Inc. | kbsriiq42017exhibit311.htm |
| EX-21.1 - SUBSIDIARIES OF THE COMPANY - KBS Real Estate Investment Trust II, Inc. | kbsriiq42017exhibit211.htm |
| EX-10.2 - LETTER AGREEMENT -UNION BANK MORTGAGE LOAN - KBS Real Estate Investment Trust II, Inc. | kbsriiq42017exhibit102.htm |
UNITED STATES
SECURITIES AND EXCHANGE COMMISSION
Washington, D.C. 20549
______________________________________________________
FORM 10-K
______________________________________________________
(Mark One)
x | ANNUAL REPORT PURSUANT TO SECTION 13 OR 15(d) OF THE SECURITIES EXCHANGE ACT OF 1934 |
For the fiscal year ended December 31, 2017
OR
¨ | TRANSITION REPORT PURSUANT TO SECTION 13 OR 15(d) OF THE SECURITIES EXCHANGE ACT OF 1934 |
For the transition period from to
Commission file number 000-53649
______________________________________________________
KBS REAL ESTATE INVESTMENT TRUST II, INC.
(Exact Name of Registrant as Specified in Its Charter)
______________________________________________________
Maryland | 26-0658752 | |
(State or Other Jurisdiction of Incorporation or Organization) | (I.R.S. Employer Identification No.) | |
800 Newport Center Drive, Suite 700 Newport Beach, California | 92660 | |
(Address of Principal Executive Offices) | (Zip Code) | |
(949) 417-6500
(Registrant’s Telephone Number, Including Area Code)
______________________________________________________
Securities registered pursuant to Section 12(b) of the Act:
Title of Each Class | Name of Each Exchange on Which Registered | |
None | None | |
Securities registered pursuant to Section 12(g) of the Act:
Common Stock, $0.01 par value per share
______________________________________________________
Indicate by check mark if the registrant is a well‑known seasoned issuer, as defined in Rule 405 of the Securities Act. Yes o No x
Indicate by check mark if the registrant is not required to file reports pursuant to Section 13 or Section 15(d) of the Act. Yes o No x
Indicate by check mark whether the registrant (1) has filed all reports required to be filed by Section 13 or 15(d) of the Securities Exchange Act of 1934 during the preceding 12 months (or for such shorter period that the registrant was required to file such reports) and (2) has been subject to such filing requirements for the past 90 days. Yes x No o
Indicate by check mark whether the registrant has submitted electronically and posted on its corporate website, if any, every Interactive Data File required to be submitted and posted pursuant to Rule 405 of Regulation S-T (§232.405 of this chapter) during the preceding 12 months (or for such shorter period that the registrant was required to submit and post such files). Yes x No o
Indicate by check mark if disclosure of delinquent filers pursuant to Item 405 of Regulation S-K is not contained herein, and will not be contained, to the best of Registrant’s knowledge, in definitive proxy or information statements incorporated by reference in Part III of the Form 10-K or any amendment of this Form 10-K. x
Indicate by check mark whether the registrant is a large accelerated filer, an accelerated filer, a non-accelerated filer, a smaller reporting company or an emerging growth company. See definitions of “large accelerated filer”, “accelerated filer”, “smaller reporting company” and “emerging growth company” in Rule 12b-2 of the Exchange Act. (Check one):
Large Accelerated Filer | ¨ | Accelerated Filer | ¨ | |||
Non-Accelerated Filer | x (Do not check if a smaller reporting company) | Smaller reporting company | ¨ | |||
Emerging growth company | ¨ | |||||
If an emerging growth company, indicate by check mark if the registrant has elected not to use the extended transition period for complying with any new or revised financial accounting standards provided pursuant to Section 13(a) of the Exchange Act. ¨
Indicate by check mark whether the registrant is a shell company (as defined in Rule 12b-2 of the Securities Exchange Act). Yes o No x
There is no established market for the Registrant’s shares of common stock. On December 14, 2016, the board of directors of the Registrant approved an estimated value per share of the Registrant’s common stock of $5.49 (unaudited) based on the estimated value of the Registrant’s assets less the estimated value of the Registrant’s liabilities, divided by the number of shares outstanding, all as of September 30, 2016. For a full description of the methodologies used to value the Registrant’s assets and liabilities in connection with the calculation of the estimated value per share as of December 14, 2016, see Part II, Item 5, “Market for Registrant’s Common Equity, Related Stockholder Matters and Issuer Purchases of Equity Securities - Market Information” of the Registrant’s Annual Report on Form 10-K for the year ended December 31, 2016. On December 8, 2017, the board of directors of the Registrant approved an estimated value per share of the Registrant’s common stock of $4.89 (unaudited) based on the estimated value of the Registrant’s assets less the estimated value of the Registrant’s liabilities, divided by the number of shares outstanding, all as of September 30, 2017. For a full description of the methodologies used to value the Registrant’s assets and liabilities in connection with the calculation of the estimated value per share as of December 8, 2017, see Part II, Item 5, “Market for Registrant’s Common Equity, Related Stockholder Matters and Issuer Purchases of Equity Securities - Market Information” in this Annual Report on Form 10-K.
There were approximately 188,182,867 shares of common stock held by non-affiliates as of June 30, 2017, the last business day of the Registrant’s most recently completed second fiscal quarter.
As of March 5, 2018, there were 187,513,906 outstanding shares of common stock of the Registrant.
TABLE OF CONTENTS
ITEM 1. | |||
ITEM 1A. | |||
ITEM 1B. | |||
ITEM 2. | |||
ITEM 3. | |||
ITEM 4. | |||
ITEM 5. | |||
ITEM 6. | |||
ITEM 7. | |||
ITEM 7A. | |||
ITEM 8. | |||
ITEM 9. | |||
ITEM 9A. | |||
ITEM 9B. | |||
ITEM 10. | |||
ITEM 11. | |||
ITEM 12. | |||
ITEM 13. | |||
ITEM14. | |||
ITEM 15. | |||
1
FORWARD-LOOKING STATEMENTS
Certain statements included in this Annual Report on Form 10-K are forward-looking statements. Those statements include statements regarding the intent, belief or current expectations of KBS Real Estate Investment Trust II, Inc. and members of our management team, as well as the assumptions on which such statements are based, and generally are identified by the use of words such as “may,” “will,” “seeks,” “anticipates,” “believes,” “estimates,” “expects,” “plans,” “intends,” “should” or similar expressions. Actual results may differ materially from those contemplated by such forward-looking statements. Further, forward-looking statements speak only as of the date they are made, and we undertake no obligation to update or revise forward-looking statements to reflect changed assumptions, the occurrence of unanticipated events or changes to future operating results over time, unless required by law.
The following are some of the risks and uncertainties, although not all of the risks and uncertainties, that could cause our actual results to differ materially from those presented in our forward-looking statements:
• | All of our executive officers and some of our directors and other key real estate and debt finance professionals are also officers, directors, managers, key professionals and/or holders of a direct or indirect controlling interest in our advisor, the entity that acted as our dealer manager and/or other KBS-affiliated entities. As a result, they face conflicts of interest, including significant conflicts created by our advisor’s compensation arrangements with us and other KBS-sponsored programs and KBS-advised investors and conflicts in allocating time among us and these other programs and investors. These conflicts could result in unanticipated actions. |
• | We pay substantial fees to and expenses of our advisor and its affiliates. These payments increase the risk that our stockholders will not earn a profit on their investment in us and increase the risk of loss to our stockholders. |
• | We have used proceeds from financings, when necessary, to fund a portion of our distributions during our operational stage. We currently expect that our distributions will generally be paid from cash flow from operations and funds from operations from current or prior periods. We also expect to fund other distributions from the net proceeds from the sale of real estate and from the receipt of principal payments from, or the sale of, our real estate-related loan receivable. We can give no assurance regarding the timing, amount or source of future distributions. |
• | We depend on tenants for the revenue generated by our real estate investments and, accordingly, the revenue generated by our real estate investments is dependent upon the success and economic viability of our tenants. Revenues from our properties could decrease due to a reduction in occupancy (caused by factors including, but not limited to, tenant defaults, tenant insolvency, early termination of tenant leases and non-renewal of existing tenant leases) and/or lower rental rates, making it more difficult for us to meet our debt service obligations and limiting our ability to pay distributions to our stockholders. |
• | Our investments in real estate and our mortgage loan investment may be affected by unfavorable real estate market and general economic conditions, which could decrease the value of those assets and reduce the investment return to our stockholders. Revenues from our properties and the property and other assets directly securing our loan investment could decrease. Such events would make it more difficult for the borrower under our loan investment to meet its payment obligations to us. It could also make it more difficult for us to meet our debt service obligations and limit our ability to pay distributions to our stockholders. |
• | Disruptions in the financial markets and uncertain economic conditions could adversely affect our ability to implement our business strategy and generate returns to our stockholders. |
• | Certain of our debt obligations have variable interest rates and related payments that vary with the movement of LIBOR or other indexes. Increases in these indexes could increase the amount of our debt payments and limit our ability to pay distributions to our stockholders. |
• | Our share redemption program provides only for redemptions sought upon a stockholder’s death, “qualifying disability” or “determination of incompetence” (each as defined in the share redemption program document, and, together with redemptions sought in connection with a stockholder’s death, “Special Redemptions”). The dollar amounts available for such redemptions are determined by the board of directors and may be reviewed and adjusted from time to time. Additionally, redemptions are further subject to limitations described in our share redemption program. We currently do not expect to have funds available for ordinary redemptions in the future. |
• | Since we have terminated our dividend reinvestment plan, we may have to use a greater proportion of our cash flow from operations to meet cash requirements for general corporate purposes, including, but not limited to, capital expenditures, tenant improvement costs and leasing costs related to our real estate properties; reserves required by financings of our real estate properties; the repayment of debt; and Special Redemptions under our share redemption program. This may reduce cash available for distributions. |
2
• | During the year ended December 31, 2017, we sold two office properties. During the year ended December 31, 2016, we sold one office/flex property. During the year ended December 31, 2015, we sold one office property and received the repayment of one of our real estate loans receivable. As a result of our disposition activity, our general and administrative expenses, which are not directly related to the size of our portfolio, have increased as a percentage of our cash flow from operations and will continue to increase to the extent we sell additional assets. |
• | Although the Special Committee (defined below) engaged a financial advisor to assist us and the Special Committee with the exploration of strategic alternatives for us, we are not obligated to enter into any particular transaction or any transaction at all. Further, although we are exploring strategic alternatives and are marketing some of our assets for sale, there is no assurance that this process will result in stockholder liquidity, or provide a return to stockholders that equals or exceeds our estimated value per share. We do not expect to provide additional updates regarding our review of strategic alternatives until such time, if any, that we are prepared to announce a material transaction or to conclude the strategic review. |
All forward-looking statements should be read in light of the risks identified in Part I, Item 1A of this Annual Report on Form 10-K.
3
PART I
ITEM 1. BUSINESS
Overview
KBS Real Estate Investment Trust II, Inc. (the “Company”) was formed on July 12, 2007 as a Maryland corporation that elected to be taxed as a real estate investment trust (“REIT”) beginning with the taxable year ended December 31, 2008 and it intends to continue to operate in such a manner. The Company invested in a diverse portfolio of real estate and real estate-related investments. As used herein, the terms “we,” “our” and “us” refer to the Company and as required by context, KBS Limited Partnership II, a Delaware limited partnership (the “Operating Partnership”), and their subsidiaries. We conduct our business primarily through our Operating Partnership, of which we are the sole general partner. Subject to certain restrictions and limitations, our business is managed by KBS Capital Advisors LLC (“KBS Capital Advisors”), our external advisor, pursuant to an advisory agreement. KBS Capital Advisors conducts our operations and manages our portfolio of real estate and real estate-related investments. Our advisor owns 20,000 shares of our common stock. We have no paid employees.
On September 27, 2007, we filed a registration statement on Form S-11 with the Securities and Exchange Commission (the “SEC”) to offer a maximum of 280,000,000 shares of common stock for sale to the public, of which 200,000,000 shares were registered in our primary offering and 80,000,000 shares were registered under our dividend reinvestment plan. We ceased offering shares of common stock in our primary offering on December 31, 2010. We sold 182,681,633 shares of common stock in the primary offering for gross offering proceeds of $1.8 billion. We terminated the offering under our dividend reinvestment plan effective May 29, 2014. We sold 30,903,504 shares of common stock under our dividend reinvestment plan for gross offering proceeds of $298.2 million. Also as of December 31, 2017, we had redeemed 25,938,835 of the shares sold in our offering for $245.8 million.
As of December 31, 2017, we owned nine real estate properties (consisting of eight office properties and an office campus consisting of eight office buildings) and one real estate loan receivable.
On January 27, 2016, our board of directors formed a special committee (the “Special Committee”) composed of all of our independent directors to explore the availability of strategic alternatives involving us. As part of the process of exploring strategic alternatives, on February 23, 2016, the Special Committee engaged Evercore Group L.L.C. (“Evercore”) to act as our financial advisor and to assist us and the Special Committee with this process. Under the terms of the engagement, Evercore provided various financial advisory services, as requested by the Special Committee as customary for an engagement in connection with exploring strategic alternatives. Although the Special Committee engaged Evercore to assist us and the Special Committee with the exploration of strategic alternatives for us, we are not obligated to enter into any particular transaction or any transaction at all.
The Special Committee determined that it would be in our best interest and the best interest of our stockholders to market some of our assets for sale while it continues to explore strategic alternatives for us. Based on the results of this sales effort, the board of directors may conclude that it would be in our best interest and the best interest of our stockholders to sell additional assets and, depending on the scope of the proposed asset sales, thereafter to adopt a plan of liquidation that would involve the sale of our remaining assets. In the event of such a determination, the proposed plan of liquidation would be presented to our stockholders for approval. Our board of directors anticipates reaching a decision regarding strategic alternatives during 2018. Although we are exploring strategic alternatives and are marketing some of our assets for sale, there is no assurance that this process will result in stockholder liquidity, or provide a return to stockholders that equals or exceeds our estimated value per share.
Our charter requires that we seek stockholder approval of our liquidation if our shares of common stock are not listed on a national securities exchange by March 31, 2018, unless a majority of our independent directors determines that liquidation is not then in the best interest of our stockholders. On March 7, 2018, the conflicts committee unanimously determined to postpone approval of our liquidation while the Special Committee continues to explore strategic alternatives for us. Our charter requires that the conflicts committee revisit the issue of liquidation at least annually.
Our focus in 2018 is to: continue to strategically sell assets and consider special distributions to stockholders; negotiate lease renewals or new leases that facilitate the sales process and enhance property stability for prospective buyers; complete capital projects, such as renovations or amenity enhancements, to attract quality buyers; and finalize the strategic alternatives assessment and decide on a course of action.
Objectives and Strategies
Our primary investment objectives are:
• | to provide our stockholders with attractive and stable cash distributions; and |
• | to preserve and return our stockholders’ capital contributions. |
4
We have sought and will seek to achieve these objectives by managing our portfolio of real estate and real estate-related investments, which we acquired using a combination of equity raised in our initial public offering and debt financing.
Real Estate Portfolio
Real Estate Investments
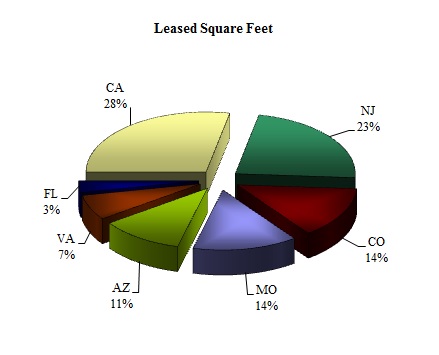
We made investments in core properties, which are generally lower risk, existing properties with at least 80% occupancy and minimal near-term lease rollover. We diversified our portfolio by investment size, investment type, investment risk and geographic region. As of December 31, 2017, our portfolio of real estate properties was composed of eight office properties and an office campus consisting of eight office buildings encompassing 4.7 million rentable square feet.
We originally intended to hold our core properties for four to seven years. However, economic and market conditions have influenced and may continue to influence us to hold our investments for different periods of time, and, as discussed above, the Special Committee is currently exploring the availability of strategic alternatives for us.
KBS Capital Advisors periodically performs a hold-sell analysis on each asset in our portfolio in order to determine a reasonable time to sell the asset and generate a strong return for our stockholders. Periodic reviews of each asset focus on the remaining available value enhancement opportunities for the asset, the demand for the asset in the marketplace, market conditions and our overall portfolio objectives to determine if the sale of the asset, whether via an individual sale or as part of a portfolio sale or merger, would generate a favorable return to our stockholders. We may sell an asset before the end of the expected holding period if we believe that market conditions and asset positioning have maximized its value to us or the sale of the asset would otherwise be in the best interests of our stockholders.
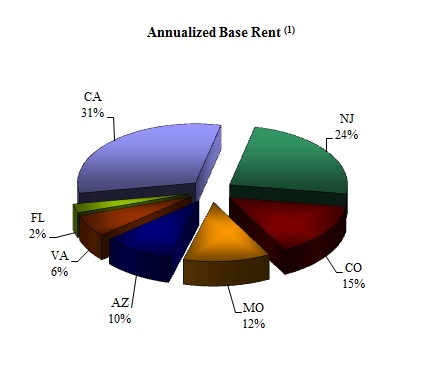
The following charts illustrate the geographic diversification of our real estate investments based on total leased square feet and total annualized base rent as of December 31, 2017:
_____________________
(1) Annualized base rent represents annualized contractual base rental income as of December 31, 2017, adjusted to straight-line any contractual tenant concessions (including free rent), rent increases and rent decreases from the lease’s inception through the balance of the lease term.
5
We have a stable tenant base and we have tried to diversify our tenant base in order to limit exposure to any one tenant or industry. As of December 31, 2017, our portfolio of real estate properties was 85% occupied. One tenant leasing space in our portfolio of real estate properties represented more than 10% of our total annualized base rent. See Item 2, “Properties — Concentration of Credit Risks.”
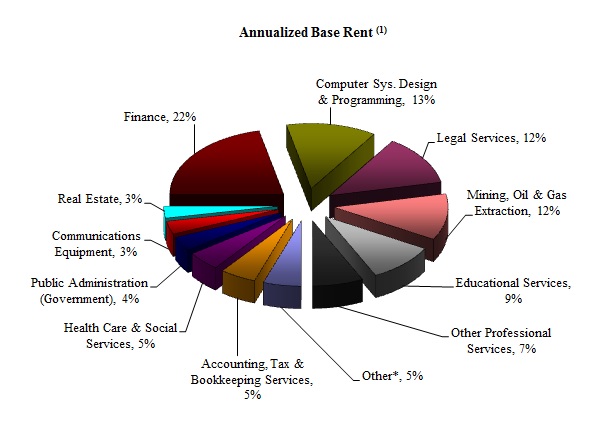
Our top ten tenants leasing space in our portfolio of real estate properties represented approximately 54.0% of our total annualized base rent as of December 31, 2017. The chart below illustrates the diversity of tenant industries in our portfolio of real estate properties based on total annualized base rent as of December 31, 2017:
_____________________
(1) Annualized base rent represents annualized contractual base rental income as of December 31, 2017, adjusted to straight-line any contractual tenant concessions (including free rent), rent increases and rent decreases from the lease’s inception through the balance of the lease term.
* “Other” includes any industry less than 3% of total.
As of December 31, 2017, our highest tenant industry concentrations (greater than 10% of annualized base rent) of our real estate portfolio were as follows:
Industry | Number of Tenants | Annualized Base Rent (1) (in thousands) | Percentage of Annualized Base Rent | ||||||
Finance | 32 | $ | 26,281 | 21.5 | % | ||||
Computer System Design & Programming | 5 | 15,638 | 12.8 | % | |||||
Legal Services | 33 | 15,159 | 12.4 | % | |||||
Mining, Oil & Gas Extraction | 4 | 14,004 | 11.5 | % | |||||
$ | 71,082 | 58.2 | % | ||||||
_____________________
(1) Annualized base rent represents annualized contractual base rental income as of December 31, 2017, adjusted to straight-line any contractual tenant concessions (including free rent), rent increases and rent decreases from the lease’s inception through the balance of the lease term. No other tenant industries accounted for more than 10% of annualized base rent.
The total cost of our real estate portfolio as of December 31, 2017 was $1.5 billion. Our real estate portfolio accounted for 99%, 99% and 97% of our total revenues for the years ended December 31, 2017, 2016 and 2015, respectively.
Real Estate-Related Investment
As of December 31, 2017, we owned one fixed-rate mortgage loan. We intend to hold our real estate-related investment until maturity in August 2018.
6
The total cost and book value of our real estate-related investment as of December 31, 2017 were $13.9 million and $13.9 million, respectively. Our real estate-related investments accounted for 1%, 1% and 3% of our total revenues for the years ended December 31, 2017, 2016 and 2015, respectively. The annualized effective interest rate on our real estate-related investment was 7.6% as of December 31, 2017.
Financing Objectives
We financed the majority of our real estate and real estate-related investments with a combination of the proceeds we received from our initial public offering and debt. We used debt financing to increase the amount available for investment and to increase overall investment yields to us and our stockholders. As of December 31, 2017, the weighted-average interest rate on our debt was 3.3%.
We borrow funds at both fixed and variable rates; as of December 31, 2017, we had $138.2 million and $364.4 million of fixed and variable rate debt outstanding, respectively. As of December 31, 2017, the interest rate of our fixed debt was 3.5% and the weighted-average interest rate of our variable debt was 3.2%. The interest rate and weighted-average interest rate represent the actual interest rate in effect as of December 31, 2017, using interest rate indices as of December 31, 2017, where applicable.
The following is a schedule of maturities, including principal amortization payments, for all of our notes payable outstanding as of December 31, 2017 (in thousands):
2018 | $ | 367,164 | ||
2019 | 2,848 | |||
2020 | 132,621 | |||
$ | 502,633 | |||
We plan to exercise our extension options available under our loan agreements, if applicable, or pay off or refinance the related notes payable prior to their maturity dates.
We limit our total liabilities to 75% of the cost (before deducting depreciation and other noncash reserves) of all of our tangible assets; however, we may exceed that limit if the majority of the conflicts committee approves each borrowing in excess of this limitation and we disclose such borrowings to our stockholders in our next quarterly report with an explanation from the conflicts committee of the justification for the excess borrowing. We did not exceed this limitation on borrowings during any quarter of 2017. As of December 31, 2017, our borrowings and other liabilities were approximately 34% of both the cost (before deducting depreciation and other noncash reserves) and book value (before deducting depreciation) of our tangible assets, respectively.
Economic Dependency
We are dependent on our advisor for certain services that are essential to us, including the management of the daily operations of our real estate and real estate-related investment portfolio; the disposition of real estate and real estate-related investments; and other general and administrative responsibilities. In the event that our advisor is unable to provide any of these services, we will be required to obtain such services from other sources.
Competitive Market Factors
We face competition from various entities for prospective tenants and to retain our current tenants, including other REITs, pension funds, insurance companies, investment funds and companies, partnerships and developers. Many of these entities have substantially greater financial resources than we do and may be able to accept more risk than we can prudently manage, including risks with respect to the creditworthiness of a tenant. As a result of their greater resources, those entities may have more flexibility than we do in their ability to offer rental concessions to attract and retain tenants. This could put pressure on our ability to maintain or raise rents and could adversely affect our ability to attract or retain tenants. As a result, our financial condition, results of operations, cash flow, ability to satisfy our debt service obligations and ability to pay distributions to our stockholders may be adversely affected.
7
We also face competition from many of the types of entities referenced above regarding the disposition of properties. These entities may possess properties in similar locations and/or of the same property types as ours and may be attempting to dispose of these properties at the same time we are attempting to dispose of some of our properties, providing potential purchasers with a larger number of properties from which to choose and potentially decreasing the sales price for such properties. Additionally, these entities may be willing to accept a lower return on their individual investments, which could further reduce the sales price of such properties. This competition could decrease the sales proceeds we receive for properties that we sell, assuming we are able to sell such properties, which could adversely affect our cash flows and the overall return for our stockholders.
Although we believe that we are well-positioned to compete effectively in each facet of our business, there is enormous competition in our market sector and there can be no assurance that we will compete effectively or that we will not encounter increased competition in the future that could limit our ability to conduct our business effectively.
Compliance with Federal, State and Local Environmental Law
Under various federal, state and local environmental laws, ordinances and regulations, a current or previous real property owner or operator may be liable for the cost of removing or remediating hazardous or toxic substances on, under or in such property. These costs could be substantial. Such laws often impose liability whether or not the owner or operator knew of, or was responsible for, the presence of such hazardous or toxic substances. Environmental laws also may impose liens on properties or restrictions on the manner in which properties may be used or businesses may be operated, and these restrictions may require substantial expenditures or prevent us from entering into leases with prospective tenants that may be impacted by such laws. Environmental laws provide for sanctions for noncompliance and may be enforced by governmental agencies or, in certain circumstances, by private parties. Certain environmental laws and common law principles could be used to impose liability for the release of and exposure to hazardous substances, including asbestos-containing materials and lead-based paint. Third parties may seek recovery from real property owners or operators for personal injury or property damage associated with exposure to released hazardous substances and governments may seek recovery for natural resource damage. The cost of defending against claims of environmental liability, of complying with environmental regulatory requirements, of remediating any contaminated property, or of paying personal injury, property damage or natural resource damage claims could reduce our cash available for distribution to our stockholders.
All of our properties were subject to Phase I environmental assessments prior to the time they were acquired. Some of our properties are subject to potential environmental liabilities arising primarily from historic activities at or in the vicinity of the properties. Based on our environmental diligence and assessments of our properties and our purchase of pollution and remediation legal liability insurance with respect to some of our properties, we do not believe that environmental conditions at our properties are likely to have a material adverse effect on our operations.
Industry Segments
As of December 31, 2017, we aggregated our investments into one reportable business segment. We considered both quantitative and qualitative thresholds and determined that our investment in a real estate loan receivable does not constitute a reportable segment. Prior to the reporting period commencing on January 1, 2016, we had identified two reportable business segments based on our investment types: real estate and real estate-related. However, based on our current investment portfolio, we do not believe that our investment in a real estate-related investment is a reportable segment.
Employees
We have no paid employees. The employees of our advisor and its affiliates provide management, disposition, advisory and certain administrative services for us.
Principal Executive Office
Our principal executive offices are located at 800 Newport Center Drive, Suite 700, Newport Beach, CA 92660. Our telephone number, general facsimile number and website address are (949) 417-6500, (949) 417-6501 and www.kbsreitii.com, respectively.
Available Information
Access to copies of our annual reports on Form 10-K, quarterly reports on Form 10-Q, current reports on Form 8-K, proxy statements and other filings with the SEC, including amendments to such filings, may be obtained free of charge from the following website, www.kbsreitii.com, or through the SEC’s website, www.sec.gov. These filings are available promptly after we file them with, or furnish them to, the SEC.
8
ITEM 1A. | RISK FACTORS |
The following are some of the risks and uncertainties that could cause our actual results to differ materially from those presented in our forward-looking statements. The risks and uncertainties described below are not the only ones we face but do represent those risks and uncertainties that we believe are material to us. Additional risks and uncertainties not presently known to us or that we currently deem immaterial may also harm our business.
Risks Related to an Investment in Us
Because no public trading market for our shares currently exists, it will be difficult for our stockholders to sell their shares and, if they are able to sell their shares, they will likely sell them at a substantial discount to the estimated value per share.
Our charter does not require our directors to seek stockholder approval to liquidate our assets by a specified date, nor does our charter require our directors to list our shares for trading on a national securities exchange by a specified date. There is no public market for our shares and we currently have no plans to list our shares on a national securities exchange. Until our shares are listed, if ever, our stockholders may not sell their shares unless the buyer meets the applicable suitability and minimum purchase standards. Any sale must comply with applicable state and federal securities laws. Our charter prohibits the ownership of more than 9.8% of our stock by any person, unless exempted by our board of directors, which may inhibit large investors from purchasing our shares.
On May 15, 2014, our board of directors amended and restated our share redemption program to provide only for redemptions sought in connection with a Special Redemption. Such Special Redemptions are subject to an annual dollar limitation. On December 6, 2017, our board of directors approved an annual dollar limitation of $10.0 million in the aggregate for the calendar year 2018 (subject to review and adjustment during the year by the board of directors), and further subject to the limitations described in the share redemption program.
We do not currently expect to have funds available for ordinary redemptions in the future. Thus, until further notice, and except with respect to Special Redemptions, stockholders will not be able to sell any of their shares back to us pursuant to our share redemption program. In addition, even if we were to resume ordinary redemptions, our share redemption program includes numerous restrictions that would limit a stockholder’s ability to sell his or her shares. In its sole discretion, our board of directors may amend, suspend or terminate our share redemption program upon 30 days’ notice, provided that we may increase or decrease the funding available for the redemption of shares under the program upon ten business days’ notice to stockholders.
Therefore, it will be difficult for our stockholders to sell their shares promptly or at all. If a stockholder is able to sell his or her shares, it would likely be at a substantial discount to the estimated value per share. It is also likely that our shares would not be accepted as the primary collateral for a loan.
We face significant competition for tenants and in the disposition of our assets, which may limit our ability pay distributions to stockholders or reduce the value of an investment in us.
We face competition from various entities for prospective tenants and to retain our current tenants, including other REITs, pension funds, insurance companies, investment funds and companies, partnerships and developers. Many of these entities have substantially greater financial resources than we do and may be able to accept more risk than we can prudently manage, including risks with respect to the creditworthiness of a tenant. As a result of their greater resources, those entities may have more flexibility than we do in their ability to offer rental concessions to attract and retain tenants. This could put pressure on our ability to maintain or raise rents and could adversely affect our ability to attract or retain tenants. As a result, our financial condition, results of operations, cash flow, ability to satisfy our debt service obligations and ability to pay distributions to our stockholders may be adversely affected.
We also face competition from many of the types of entities referenced above regarding the disposition of properties. These entities may possess properties in similar locations and/or of the same property types as ours and may be attempting to dispose of these properties at the same time we are attempting to dispose of some of our properties, providing potential purchasers with a larger number of properties from which to choose and potentially decreasing the sales price for such properties. Additionally, these entities may be willing to accept a lower return on their individual investments, which could further reduce the sales price of such properties. This competition could decrease the sales proceeds we receive for properties that we sell, assuming we are able to sell such properties, which could adversely affect our cash flows and the overall return for our stockholders.
9
Disruptions in the financial markets and uncertain economic conditions could adversely affect market rental rates and commercial real estate values and our ability to refinance or secure debt financing, service future debt obligations, or pay distributions to our stockholders.
We relied on debt financing to finance our real estate properties and we may have difficulty refinancing some of our debt obligations prior to or at maturity or we may not be able to refinance these obligations at terms as favorable as the terms of our existing indebtedness. We also may be unable to obtain additional debt financing on attractive terms or at all. If we are not able to refinance our existing indebtedness on attractive terms at the various maturity dates, we may be forced to dispose of some of our assets. Volatile market conditions and a challenging global macro-economic environment may interfere with the implementation of our business strategy and/or force us to modify it.
Disruptions in the financial markets and uncertain economic conditions could adversely affect the values of our investments. Any disruption to the debt and capital markets could result in fewer buyers seeking to acquire commercial properties and possible increases in capitalization rates and lower property values. Furthermore, any decline in economic conditions could negatively impact commercial real estate fundamentals and result in lower occupancy, lower rental rates and declining values in our real estate portfolio and in the collateral securing our loan investment, which could have the following negative effects on us:
• | the values of our investments in commercial properties could decrease below the amounts paid for such investments; |
• | the value of collateral securing our loan investment could decrease below the outstanding principal amount of the loan; |
• | revenues from our properties could decrease due to fewer tenants and/or lower rental rates, making it more difficult for us to pay distributions or meet our debt service obligations on debt financing; and/or |
• | revenues generated by the property and other assets underlying our loan investment could decrease, making it more difficult for the borrower to meet its payment obligations to us, which could in turn make it more difficult for us to pay distributions or meet our debt service obligations on debt financing. |
All of these factors could reduce our stockholders’ return and decrease the value of an investment in us.
Because we depend upon our advisor and its affiliates to conduct our operations, any adverse changes in the financial health of our advisor or its affiliates or our relationship with them could hinder our operating performance.
We depend on our advisor to manage our operations and our portfolio of assets. Our advisor depends upon the fees and other compensation that it receives from us, KBS Real Estate Investment Trust III, Inc. (“KBS REIT III”), KBS Strategic Opportunity REIT, Inc. (“KBS Strategic Opportunity REIT”), KBS Legacy Partners Apartment REIT, Inc. (“KBS Legacy Partners Apartment REIT”), KBS Strategic Opportunity REIT II, Inc. (“KBS Strategic Opportunity REIT II”), KBS Growth & Income REIT, Inc. (“KBS Growth & Income REIT”) and any future KBS-sponsored programs that it advises in connection with the purchase, management and sale of assets to conduct its operations. Any adverse changes to our relationship with, or the financial condition of, our advisor and its affiliates, could hinder their ability to successfully manage our operations and our portfolio of investments.
To the extent distributions exceed cash flow from operations, a stockholder’s basis in our stock will be reduced and, to the extent distributions exceed a stockholder’s basis, the stockholder may recognize capital gain.
Our organizational documents permit us, to the extent permitted by Maryland law, to pay distributions from any source. If we fund distributions from financings or sources other than our cash flow from operations, the overall return to our stockholders may be reduced. To date, we have funded total distributions paid, which includes net cash distributions and distributions reinvested by stockholders, with cash flow from operations, debt financing, proceeds from the payoff or sale of our real estate loans receivable and proceeds from the sales of real estate properties. Other than distributions paid from the sale of assets and the maturity, payoff or settlement of our debt investment, we currently expect that our distributions will generally be paid from cash flow from operations and funds from operations from current or prior periods. If we fund distributions from borrowings, our interest expense and other financing costs, as well as the repayment of such borrowings, will reduce our earnings and cash flow from operations available for distribution in future periods. If we fund distributions from the sale of assets or the maturity, payoff or settlement of our debt investment, this will affect our ability to generate cash flow from operations in future periods. In addition, to the extent distributions exceed cash flow from operations, a stockholder’s basis in our stock will be reduced and, to the extent distributions exceed a stockholder’s basis, the stockholder may recognize capital gain. There is no limit on the amount of distributions we may fund from sources other than from cash flow from operations. We can give no assurance regarding the timing, amount or source of future distributions. For the year ended December 31, 2017, we paid aggregate distributions of $51.8 million, all of which were paid in cash.
10
Funds from operations and cash flow from operations during the year ended December 31, 2017 were $61.7 million and $52.8 million, respectively. We funded our total distributions paid with $51.3 million of current period cash flow from operations and $0.5 million of cash on hand. For a reconciliation of funds from operations to net income, see Part II, Item 7, “Management’s Discussion and Analysis of Financial Condition and Results of Operations — Funds from Operations and Modified Funds from Operations.”
During the year ended December 31, 2017, we sold two office properties. During the year ended December 31, 2016, we sold one office/flex property. During the year ended December 31, 2015, we sold one office property and received the repayment of one of our real estate loans receivable. As a result, our general and administrative expenses as a percentage of our cash flow from operations has increased.
Our real estate properties generate cash flow in the form of rental revenues and tenant reimbursements and our real estate-related investment generates cash flow in the form of interest income. As a result of our recent dispositions, our cash flow from operations has decreased. Our general and administrative expenses are not directly related to the size of our portfolio and thus will not decrease proportionately. As a result, our general and administrative expenses as a percentage of cash flow from operations has increased and, depending on the amount of assets we sell in the future, this increase could become more significant.
The loss of or the inability to retain or obtain key real estate and debt finance professionals at our advisor could delay or hinder implementation of our investment management and disposition strategies, which could limit our ability to pay distributions and decrease the value of an investment in our shares.
Our success depends to a significant degree upon the contributions of Peter M. Bren, Keith D. Hall, Peter McMillan III and Charles J. Schreiber, Jr., each of whom would be difficult to replace. Neither we nor our advisor nor its affiliates have employment agreements with these individuals and they may not remain associated with us, our advisor or its affiliates. If any of these persons were to cease their association with us, our advisor or its affiliates, we may be unable to find suitable replacements and our operating results could suffer as a result. We do not intend to maintain key person life insurance on any person. We believe that our future success depends, in large part, upon our advisor’s and its affiliates’ ability to attract and retain highly skilled managerial, operational and marketing professionals. Competition for such professionals is intense, and our advisor and its affiliates may be unsuccessful in attracting and retaining such skilled individuals. Further, we have established strategic relationships with firms that have special expertise in certain services or detailed knowledge regarding real properties in certain geographic regions. Maintaining such relationships will be important for us to effectively compete with other investors for tenants in such regions. We may be unsuccessful in maintaining such relationships. If we lose or are unable to obtain the services of highly skilled professionals or do not establish or maintain appropriate strategic relationships, our ability to implement our investment management and disposition strategies could be delayed or hindered, and the value of our stockholders’ investments may decline.
Our rights and the rights of our stockholders to recover claims against our independent directors are limited, which could reduce our stockholders’ and our recovery against our independent directors if they negligently cause us to incur losses.
Maryland law provides that a director has no liability in that capacity if he or she performs his or her duties in good faith, in a manner he or she reasonably believes to be in the company’s best interests and with the care that an ordinarily prudent person in a like position would use under similar circumstances. Our charter provides that none of our independent directors shall be liable to us or our stockholders for monetary damages and that we will generally indemnify them for losses unless they are grossly negligent or engage in willful misconduct. As a result, our stockholders and we may have more limited rights against our independent directors than might otherwise exist under common law, which could reduce our stockholders’ and our recovery from these persons if they act in a negligent manner. In addition, we may be obligated to fund the defense costs incurred by our independent directors (as well as by our other directors, officers, employees (if we ever have employees) and agents) in some cases, which would decrease the cash otherwise available for distribution to our stockholders.
11
We face risks associated with security breaches through cyber-attacks, cyber intrusions or otherwise, as well as other significant disruptions of our information technology (IT) networks and related systems.
We face risks associated with security breaches, whether through cyber-attacks or cyber intrusions over the Internet, malware, computer viruses, attachments to e-mails, persons inside our organization or persons with access to systems inside our organization, and other significant disruptions of our IT networks and related systems. The risk of a security breach or disruption, particularly through cyber-attack or cyber intrusion, including by computer hackers, foreign governments and cyber terrorists, has generally increased as the number, intensity and sophistication of attempted attacks and intrusions from around the world have increased. Our IT networks and related systems are essential to the operation of our business and our ability to perform day-to-day operations. Although we make efforts to maintain the security and integrity of these types of IT networks and related systems, and we have implemented various measures to manage the risk of a security breach or disruption, there can be no assurance that our security efforts and measures will be effective or that attempted security breaches or disruptions would not be successful or damaging. Even the most well protected information, networks, systems and facilities remain potentially vulnerable because the techniques used in such attempted security breaches evolve and generally are not recognized until launched against a target, and in some cases are designed not to be detected and, in fact, may not be detected. Accordingly, we may be unable to anticipate these techniques or to implement adequate security barriers or other preventative measures, and thus it is impossible for us to entirely mitigate this risk.
A security breach or other significant disruption involving our IT networks and related systems could:
• | disrupt the proper functioning of our networks and systems and therefore our operations; |
• | result in misstated financial reports, violations of loan covenants and/or missed reporting deadlines; |
• | result in our inability to properly monitor our compliance with the rules and regulations regarding our qualification as a REIT; |
• | result in the unauthorized access to, and destruction, loss, theft, misappropriation or release of, proprietary, confidential, sensitive or otherwise valuable information of ours or others, which others could use to compete against us or which could expose us to damage claims by third-parties for disruptive, destructive or otherwise harmful purposes and outcomes; |
• | require significant management attention and resources to remedy any damages that result; |
• | subject us to claims for breach of contract, damages, credits, penalties or termination of leases or other agreements; or |
• | damage our reputation among our stockholders. |
Any or all of the foregoing could have a material adverse effect on our results of operations, financial condition and cash flows.
We can give no assurances regarding any particular transaction in connection with the exploration of strategic alternatives and the marketing of some of our assets for sale.
Although the Special Committee engaged Evercore to assist us and the Special Committee with the exploration of strategic alternatives for us, we are not obligated to enter into any particular transaction or any transaction at all. The Special Committee determined that it would be in our best interest and the best interest of our stockholders to market some of our assets for sale while it continues to explore strategic alternatives for us. Based on the results of this sales effort, the board of directors may conclude that it would be in our best interest and the best interest of our stockholders to sell additional assets and, depending on the scope of the proposed asset sales, thereafter to adopt a plan of liquidation that would involve the sale of our remaining assets. In the event of such a determination, the proposed plan of liquidation would be presented to our stockholders for approval. Alternatively, based on the results of the initial sales effort, the board of directors may conclude that it would be in our best interest and the best interest of our stockholders for us to engage in a limited number of asset sales and continue to operate as a going concern, but with a portfolio that is smaller than the present portfolio. Although we are exploring strategic alternatives and are marketing some of our remaining assets for sale, there is no assurance that this process will result in stockholder liquidity, or provide a return to stockholders that equals or exceeds our estimated value per share.
12
Risks Related to Conflicts of Interest
KBS Capital Advisors and its affiliates, including all of our executive officers and some of our directors and other key real estate and debt finance professionals, face conflicts of interest caused by their compensation arrangements with us and with other KBS-sponsored programs, which could result in actions that are not in the long-term best interests of our stockholders.
All of our executive officers and some of our directors and other key real estate and debt finance professionals are also officers, directors, managers, key professionals and/or holders of a direct or indirect controlling interest in KBS Capital Advisors, our advisor, KBS Capital Markets Group LLC (“KBS Capital Markets Group”), the entity that acted as the dealer manager for our primary offering, and/or other KBS-affiliated entities. KBS Capital Advisors and its affiliates receive substantial fees from us. These fees could influence our advisor’s advice to us as well as the judgment of its affiliates. Among other matters, these compensation arrangements could affect their judgment with respect to:
• | the continuation, renewal or enforcement of our agreements with KBS Capital Advisors and its affiliates, including the advisory agreement; |
• | public offerings of equity by us, which would entitle KBS Capital Markets Group to dealer-manager fees and would likely entitle KBS Capital Advisors to increased acquisition, origination and asset-management fees; |
• | sales of properties and other investments, which entitle KBS Capital Advisors to disposition fees and possible subordinated incentive fees; and |
• | whether and when we seek to sell the company or its assets, which sale could entitle KBS Capital Advisors to a subordinated incentive fee and would terminate the asset management fee. |
In addition, the fees our advisor receives in connection with the management of our assets are based on the cost of the investment, and not based on the quality of the investment or the quality of the services rendered to us.
KBS Capital Advisors faces conflicts of interest relating to the leasing and disposition of properties and such conflicts may not be resolved in our favor, which could limit our ability to pay distributions to our stockholders and reduce our stockholders’ overall investment return.
We and other KBS-sponsored programs and KBS-advised investors rely on our sponsor, KBS Holdings LLC, and other key real estate professionals at our advisor, including Messrs. Bren, Hall, McMillan and Schreiber, to supervise the property management and leasing of properties. If the KBS team of real estate professionals directs creditworthy prospective tenants to properties owned by another KBS-sponsored program or KBS-advised investor when it could direct such tenants to our properties, our tenant base may have more inherent risk and our properties’ occupancy may be lower than might otherwise be the case.
In addition, we and other KBS-sponsored programs and KBS-advised investors rely on our sponsor and other key real estate professionals at our advisor to sell our properties. These KBS-sponsored programs and KBS-advised investors may possess properties in similar locations and/or of the same property types as ours and may be attempting to sell these properties at the same time we are attempting to sell some of our properties. If our advisor directs potential purchasers to properties owned by another KBS-sponsored program or KBS-advised investor when it could direct such purchasers to our properties, we may be unable to sell some or all of our properties at the time or at the price we otherwise would, which could limit our ability to pay distributions and reduce our stockholders’ overall investment return.
13
Our sponsor, our officers, our advisor and the real estate, debt finance, management and accounting professionals assembled by our advisor face competing demands on their time and this may cause our operations and our stockholders’ investment to suffer.
We rely on our sponsor, our officers, our advisor and the real estate, debt finance, management and accounting professionals that our advisor retains, including Messrs. Bren, Hall, McMillan, Schreiber and Jeffrey K. Waldvogel and Ms. Stacie K. Yamane, to provide services to us for the day-to-day operation of our business. KBS REIT III, KBS Strategic Opportunity REIT, KBS Legacy Partners Apartment REIT, KBS Strategic Opportunity REIT II and KBS Growth & Income REIT are also advised by KBS Capital Advisors and rely on our sponsor and many of the same real estate, debt finance, management and accounting professionals, as will future KBS–sponsored programs and KBS-advised investors. Further, our officers and directors are also officers and/or directors of some or all of the other public KBS–sponsored programs. Messrs. Bren, Hall, McMillan, Schreiber and Waldvogel and Ms. Yamane are executive officers of KBS REIT I and KBS REIT III. Messrs. Bren, Schreiber and Waldvogel and Ms. Yamane are also executive officers of KBS Growth & Income REIT. Messrs. Hall, McMillan and Waldvogel and Ms. Yamane are also executive officers of KBS Strategic Opportunity REIT and KBS Strategic Opportunity REIT II, and Messrs. Bren, McMillan and Waldvogel and Ms. Yamane are also executive officers of KBS Legacy Partners Apartment REIT. Messrs. Bren and Schreiber and Ms. Yamane are executive officers of KBS Realty Advisors and its affiliates, the advisors of private KBS–sponsored programs and the investment advisors to KBS-advised investors. In addition, KBS Legacy Partners Apartment REIT has announced the passage by its stockholders of a plan of complete liquidation and dissolution and is implementing the plan. KBS Strategic Opportunity REIT has announced that its board of directors and management believe that pursuing a perpetual life daily NAV REIT strategy provides the best opportunity for it to achieve its objectives of maximizing the return to its stockholders and providing additional liquidity for its stockholders and has filed a definitive proxy statement containing certain measures to be voted on at its annual meeting of stockholders in furtherance of those objectives. The pursuit of each of these courses of action would create further demands on the time of our advisor’s real estate, debt finance, management and accounting professionals.
As a result of their interests in other KBS-sponsored programs, their obligations to KBS-advised investors and the fact that they engage in and will continue to engage in other business activities on behalf of themselves and others, Messrs. Bren, Hall, McMillan, Schreiber and Waldvogel and Ms. Yamane face conflicts of interest in allocating their time among us, KBS REIT III, KBS Strategic Opportunity REIT, KBS Legacy Partners Apartment REIT, KBS Strategic Opportunity REIT II, KBS Growth & Income REIT, KBS Capital Advisors, other KBS-sponsored programs and KBS-advised investors, as well as other business activities in which they are involved. In addition, our advisor and KBS Realty Advisors and their affiliates share many of the same key real estate, management and accounting professionals. During times of intense activity in other programs and ventures, these individuals may devote less time and fewer resources to our business than are necessary or appropriate to manage our business. Furthermore, some or all of these individuals may become employees of another KBS–sponsored program in an internalization transaction or, if we internalize our advisor, may not become our employees as a result of their relationship with other KBS-sponsored programs. If these events occur, the returns on our investments, and the value of our stockholders’ investment, may decline.
All of our executive officers and some of our directors and the key real estate and debt finance professionals assembled by our advisor face conflicts of interest related to their positions and/or interests in KBS Capital Advisors and its affiliates, which could hinder our ability to implement our business strategy and to generate returns to our stockholders.
All of our executive officers and some of our directors and the key real estate and debt finance professionals assembled by our advisor are also executive officers, directors, managers, key professionals and/or holders of a direct or indirect controlling interest in our advisor and other KBS-affiliated entities. Through KBS-affiliated entities, some of these persons also serve as the investment advisors to KBS-advised investors and, through KBS Capital Advisors and KBS Realty Advisors, these persons serve as the advisor to KBS Strategic Opportunity REIT, KBS Legacy Partners Apartment REIT, KBS REIT III, KBS Strategic Opportunity REIT II, KBS Growth & Income REIT and other KBS-sponsored programs. As a result, they owe fiduciary duties to each of these entities, their stockholders, members and limited partners and their investors, which fiduciary duties may from time to time conflict with the fiduciary duties that they owe to us and our stockholders. Their loyalties to these other entities and investors could result in action or inaction that is detrimental to our business, which could harm the implementation of our business strategy and our leasing opportunities. Further, Messrs. Bren, Hall, McMillan and Schreiber and existing and future KBS-sponsored programs and KBS-advised investors generally are not and will not be prohibited from engaging, directly or indirectly, in any business or from possessing interests in any other business venture or ventures, including businesses and ventures involved in the acquisition, development, ownership, leasing or sale of real estate investments. If we do not successfully implement our business strategy, we may be unable to generate the cash needed to pay distributions to our stockholders and to maintain or increase the value of our assets.
14
Our board of directors’ loyalties to KBS REIT III, KBS Strategic Opportunity REIT, KBS Strategic Opportunity REIT II, KBS Growth & Income REIT and possibly to future KBS-sponsored programs could influence its judgment, resulting in actions that may not be in our stockholders’ best interest or that result in a disproportionate benefit to another KBS-sponsored program at our expense.
All of our directors are also directors of KBS REIT III and one of our directors is also a director of KBS Growth & Income REIT. One of our directors is also a director of KBS Strategic Opportunity REIT and KBS Strategic Opportunity REIT II. The loyalties of our directors serving on the boards of directors of KBS REIT III, KBS Strategic Opportunity REIT, KBS Strategic Opportunity REIT II, and KBS Growth & Income REIT or possibly on the boards of directors of future KBS-sponsored programs, may influence the judgment of our board of directors when considering issues for us that also may affect other KBS-sponsored programs, such as the following:
• | We could enter into transactions with other KBS-sponsored programs, such as property sales or financing arrangements. Such transactions might entitle our advisor or its affiliates to fees and other compensation from both parties to the transaction. For example, property sales to other KBS-sponsored programs might entitle our advisor or its affiliates to acquisition fees in connection with its services to the purchaser in addition to disposition and other fees that we might pay to our advisor in connection with such transaction. Decisions of our board, the conflicts committee or the Special Committee regarding the terms of those transactions may be influenced by our board’s or the conflicts committee’s loyalties to such other KBS-sponsored programs. |
• | A decision of the board or the conflicts committee regarding the timing of a debt or equity offering could be influenced by concerns that the offering would compete with offerings of other KBS-sponsored programs. |
• | A decision of the board, the conflicts committee or the Special Committee regarding the timing of property sales could be influenced by concerns that the sales would compete with those of other KBS-sponsored programs. |
Through October 30, 2017, like us, KBS REIT III compensated each independent director with an annual retainer of $40,000 as well as compensation for attending meetings as follows: (i) $2,500 for each board of directors meeting attended, (ii) $2,500 for each audit or conflicts committee meeting attended (except that the committee chairman was paid $3,000 for each audit or conflicts committee meeting attended), (iii) $2,000 for each teleconference board of directors meeting attended, and (iv) $2,000 for each teleconference audit or conflicts committee meeting attended (except that the committee chairman was paid $3,000 for each teleconference audit or conflicts committee meeting attended). In addition, we paid our independent directors for attending Special Committee meetings as follows: $2,000 for each in-person and teleconference Special Committee meeting attended (except that the committee chairman was paid $3,000 for each in-person and teleconference Special Committee meeting attended).
Like us, KBS REIT III reimbursed directors for reasonable out-of-pocket expenses incurred in connection with attendance at board of directors meetings and committee meetings.
On October 31, 2017, our conflicts committee and KBS REIT III’s conflicts committee each approved a revised compensation structure for the respective independent directors of each REIT. Commencing on October 31, 2017, like us, KBS REIT III, will compensate each independent director with an annual retainer of $135,000, as well as compensation for attending meetings as follows: (i) each member of the audit committee and conflicts committee will be paid $10,000 annually for service on such committees (except that the chair of each of the audit committee and conflicts committee will be paid $20,000 annually for service as the chair of such committees), (ii) after the tenth board of directors meeting of each calendar year, each independent director will be paid (a) $2,500 in cash for each in-person board of directors meeting attended for the remainder of the calendar year and (b) $2,000 in cash for each teleconference board of directors meeting attended for the remainder of the calendar year, (iii) after the tenth audit committee meeting of each calendar year, each member of the audit committee will be paid (a) $2,500 in cash for each in-person audit committee meeting attended for the remainder of the calendar year and (b) $2,000 in cash for each teleconference audit committee meeting attended for the remainder of the calendar year (except that the audit committee chair will be paid $3,000 for each in-person and teleconference audit committee meeting attended after the tenth audit committee meeting of each calendar year, for the remainder of each calendar year), and (iv) after the tenth conflicts committee meeting of each calendar year, each member of the conflicts committee will be paid (a) $2,500 in cash for each in-person conflicts committee meeting attended for the remainder of the calendar year and (b) $2,000 in cash for each teleconference conflicts committee meeting attended for the remainder of the calendar year (except that the conflicts committee chair will be paid $3,000 for each in-person and teleconference conflicts committee meeting attended after the tenth conflicts committee meeting of each calendar year, for the remainder of each calendar year).
In addition, we will pay our independent directors for attending Special Committee meetings as follows: each member of the Special Committee will be paid $2,000 in cash for each in-person and teleconference Special Committee meeting attended (except that the Special Committee chair will be paid $3,000 for each in-person and teleconference Special Committee meeting attended).
15
In addition, like us, KBS REIT III reimburses directors for reasonable out-of-pocket expenses incurred in connection with attendance at board of directors meetings and committee meetings.
Risks Related to Our Corporate Structure
Ownership limitations may restrict change of control or business combination opportunities in which our stockholders might receive a premium for their shares.
In order for us to qualify as a REIT for each taxable year, no more than 50% in value of our outstanding capital stock may be owned, directly or indirectly, by five or fewer individuals during the last half of any calendar year. “Individuals” for this purpose include natural persons, and some entities such as private foundations. To preserve our REIT qualification, our charter generally prohibits any person from directly or indirectly owning more than 9.8% in value of our capital stock. This ownership limitation could have the effect of delaying, deferring or preventing a takeover or other transaction including an extraordinary transaction (such as a merger, tender offer or sale of all or substantially all of our assets), in which holders of our common stock might receive a premium for their shares over the then prevailing market price or which holders might believe to be otherwise in their best interests.
Our charter permits our board of directors to issue stock with terms that may subordinate the rights of our common stockholders or discourage a third party from acquiring us in a manner that could result in a premium price to our stockholders.
Our board of directors may classify or reclassify any unissued common stock or preferred stock and establish the preferences, conversion or other rights, voting powers, restrictions, limitations as to dividends and other distributions, qualifications and terms or conditions of redemption of any such stock. Thus, our board of directors could authorize the issuance of preferred stock with priority as to distributions and amounts payable upon liquidation over the rights of the holders of our common stock. Such preferred stock could also have the effect of delaying, deferring or preventing a change in control of us, including an extraordinary transaction (such as a merger, tender offer or sale of all or substantially all of our assets) that might provide a premium price to holders of our common stock.
Our stockholders will have limited control over changes in our policies and operations, which increases the uncertainty and risks our stockholders face.
Our board of directors determines our major policies, including our policies regarding financing, debt capitalization, REIT qualification and distributions. Our board of directors may amend or revise these and other policies without a vote of the stockholders. Under Maryland General Corporation Law and our charter, our stockholders have a right to vote only on limited matters. Our board’s broad discretion in setting policies and our stockholders’ inability to exert control over those policies increases the uncertainty and risks our stockholders face.
Our share redemption program only provides for Special Redemptions. We currently do not expect to have funds available for ordinary redemptions in the future.
Our share redemption program only provides for Special Redemptions. Such Special Redemptions are subject to an annual dollar limitation. On December 6, 2017, our board of directors approved an annual dollar limitation of $10.0 million in the aggregate for the calendar year 2018 (subject to review and adjustment during the year by the board of directors), and further subject to the limitations described in the share redemption program. Based on historical redemption activity, we believe the $10.0 million redemption limitation for the calendar year 2018 will be sufficient for these Special Redemptions. During each calendar year, the annual dollar limitation for the share redemption program will be reviewed and may be adjusted from time to time.
We currently do not expect to have funds available for ordinary redemptions in the future. Thus, until further notice, and except with respect to Special Redemptions, stockholders will not be able to sell any of their shares back to us pursuant to our share redemption program. In addition, even if we were to resume ordinary redemptions, our share redemption program includes numerous restrictions that would limit a stockholder’s ability to sell his or her shares, including that we have no obligation to redeem shares if the redemption would violate the restrictions on distributions under Maryland law, which prohibits distributions that would cause a corporation to fail to meet statutory tests of solvency. In its sole discretion, our board of directors may amend, suspend or terminate our share redemption program upon 30 days’ notice, provided that we may increase or decrease the funding available for the redemption of shares under the program upon ten business days’ notice to stockholders.
16
Pursuant to our share redemption program, the redemption price per share for eligible redemptions is equal to the estimated value per share. On December 8, 2017, our board of directors approved an estimated value per share of our common stock of $4.89 (unaudited) based on the estimated value of our assets less the estimated value of our liabilities divided by the number of shares outstanding, all as of September 30, 2017. Therefore, commencing with the December 29, 2017 redemption date, the redemption price for all shares eligible for redemption is $4.89 (unaudited) per share. For a full description of the methodologies and assumptions used to value our assets and liabilities in connection with the calculation of the estimated value per share, see Part II, Item 5, “Market for Registrant’s Common Equity, Related Stockholder Matters and Issuer Purchases of Equity Securities — Market Information.”
The estimated value per share of our common stock may not reflect the value that stockholders will receive for their investment and does not take into account how developments subsequent to the valuation date related to individual assets, the financial or real estate markets or other events may have increased or decreased the value of our portfolio.
On December 8, 2017, our board of directors approved an estimated value per share of our common stock of $4.89 (unaudited) based on the estimated value of our assets less the estimated value of our liabilities divided by the number of shares outstanding, all as of September 30, 2017. We provided this estimated value per share to assist broker-dealers that participated in our initial public offering in meeting their customer account statement reporting obligations under National Association of Securities Dealers (“NASD”) Conduct Rule 2340, as required by the Financial Industry Regulatory Authority (“FINRA”). This valuation was performed in accordance with the provisions of and also to comply with Practice Guideline 2013-01, Valuations of Publicly Registered Non-Listed REITs, issued by the Investment Program Association (“IPA”) in April 2013 (the “IPA Valuation Guidelines”). The estimated value per share was based on the recommendation and valuation performed by our advisor. We engaged CBRE, Inc. (“CBRE”) an independent, third-party valuation firm, to provide appraisals for nine of our real estate properties (the “Appraised Properties”).
As with any valuation methodology, the methodologies used are based upon a number of estimates and assumptions that may not be accurate or complete. Different parties using different assumptions and estimates could derive a different estimated value per share of our common stock, and this difference could be significant. The estimated value per share is not audited and does not represent the fair value of our assets less the fair value of our liabilities according to U.S. generally accepted accounting principles (“GAAP”), nor does it represent a liquidation value of our assets and liabilities or the price at which our shares of common stock would trade on a national securities exchange. The estimated value per share does not reflect a discount for the fact that we are externally managed, nor does it reflect a real estate portfolio premium/discount versus the sum of the individual property values. The estimated value per share also did not take into account estimated disposition costs and fees for real estate properties that were not under contract to sell, debt prepayment penalties that could apply upon the prepayment of certain of our debt obligations or the impact of restrictions on the assumption of debt. We have generally incurred disposition costs and fees related to the sale of each real estate property since inception of 1.7% to 4.4% of the gross sales price less concessions and credits, with the weighted average being approximately 2.3%. If this range of disposition costs and fees was applied to the estimated value of our real estate properties, which does not include these costs and fees in the appraised values, the resulting impact on the estimated value per share would be a decrease of $0.12 to $0.31 per share. Accordingly, with respect to the estimated value per share, we can give no assurance that:
• | a stockholder would be able to resell his or her shares at this estimated value per share; |
• | a stockholder would ultimately realize distributions per share equal to our estimated value per share upon liquidation of our assets and settlement of our liabilities or a sale of our company; |
• | our shares of common stock would trade at the estimated value per share on a national securities exchange; |
• | an independent third-party appraiser or other third-party valuation firm would agree with our estimated value per share; or |
• | the methodology used to calculate our estimated value per share would be acceptable to FINRA or for compliance with ERISA reporting requirements. |
For a full description of the methodologies and assumptions used to value our assets and liabilities in connection with the calculation of the estimated value per share, see Part II, Item 5, “Market for Registrant’s Common Equity, Related Stockholder Matters and Issuer Purchases of Equity Securities — Market Information.” We currently expect to utilize our advisor and/or an independent valuation firm to update the estimated value per share no later than December 2018.
17
In addition, the value of our shares will fluctuate over time in response to developments related to individual assets in our portfolio and the management of those assets, in response to the real estate and finance markets and due to other factors. As such, the estimated value per share does not take into account developments in our portfolio since December 8, 2017, including:
• | potential future asset sales at values different from those used in the determination of estimated value per share as well as any impairment charges related to these or other assets as a result of changes in the expected hold period, or the estimated cash flows for or future expenses related to these assets; |
• | any impairments we may recognize with respect to our real estate-related investment; |
• | any increases or decreases in value of any of our real estate or real estate-related investments; |
• | any disruptions in the real estate and financial markets or general economic conditions; |
• | any unforeseen capital expenditure requirements; or |
• | any inability to meet our existing debt service obligations, or to repay or refinance such obligations on attractive terms or at all at or prior to maturity. |
Our stockholders’ interest in us will be diluted if we issue additional shares, which could reduce the overall value of their investment.
Our common stockholders do not have preemptive rights to any shares we issue in the future. Our charter authorizes us to issue 1,010,000,000 shares of capital stock, of which 1,000,000,000 shares are designated as common stock and 10,000,000 shares are designated as preferred stock. Our board of directors may increase the number of authorized shares of capital stock without stockholder approval. Our board may elect to (i) sell additional shares in future public offerings, (ii) issue equity interests in private offerings, or (iii) issue shares to our advisor, or its successors or assigns, in payment of an outstanding obligation. To the extent we issue additional equity interests, our stockholders’ percentage ownership interest in us will be diluted. In addition, depending upon the terms and pricing of any additional offerings, the use of the proceeds and the value of our real estate investments, our stockholders may also experience dilution in the book value and fair value of their shares and in the earnings and distributions per share.
Payment of fees to KBS Capital Advisors and its affiliates reduces cash available for distribution to stockholders and increases the risk that our stockholders will not be able to recover the amount of their investment in our shares.
KBS Capital Advisors and its affiliates performed services for us in connection with the selection and acquisition or origination of our investments, and continue to perform services for us in connection with the management, leasing and disposition of our properties and the management, administration and disposition of our real estate-related investment. We pay them substantial fees for these services, which results in immediate dilution of the value of our stockholders’ investment in us and reduces the amount of cash available for distribution to our stockholders.
In addition to disposition fees we may pay to our advisor in connection with the disposition of our assets, we may also pay other significant fees during our liquidation stage. Although most of the fees expected to be paid during our liquidation stage are contingent on our stockholders first receiving agreed-upon investment returns, the investment-return thresholds may be reduced with the approval of our conflicts committee and subject to the other limitations in our charter.
Therefore, these fees increase the risk that the cash available for distribution to common stockholders upon a liquidation of our portfolio would be less than stockholders paid for our shares, after taking into account any special distributions or liquidating distributions received by our stockholders. These substantial fees and other payments also increase the risk that our stockholders will not be able to resell their shares at a profit.
If we are unable to obtain funding for future capital needs, cash distributions to our stockholders and the value of our investments could decline.
When tenants do not renew their leases or otherwise vacate their space, we will often need to expend substantial funds for improvements to the vacated space in order to attract replacement tenants. Even when tenants do renew their leases we may agree to make improvements to their space as part of our negotiations. If we need additional capital in the future to improve or maintain our properties or for any other reason, we may have to obtain funding from sources other than our cash flow from operations, such as borrowings, asset sales or future equity offerings. These sources of funding may not be available on attractive terms or at all. If we cannot procure additional funding for capital improvements, our investments may generate lower cash flow or decline in value, or both, which would limit our ability to pay distributions to our stockholders and could reduce the value of our stockholders’ investment in us.
18
Although we are not currently afforded the protection of the Maryland General Corporation Law relating to deterring or defending hostile takeovers, our board of directors could opt into these provisions of Maryland law in the future, which may discourage others from trying to acquire control of us and may prevent our stockholders from receiving a premium price for their stock in connection with a business combination.
Under Maryland law, “business combinations” between a Maryland corporation and certain interested stockholders or affiliates of interested stockholders are prohibited for five years after the most recent date on which the interested stockholder becomes an interested stockholder. These business combinations include a merger, consolidation, share exchange or, in circumstances specified in the statute, an asset transfer or issuance or reclassification of equity securities. Also under Maryland law, control shares of a Maryland corporation acquired in a control share acquisition have no voting rights except to the extent approved by a vote of two-thirds of the votes entitled to be cast on the matter. Shares owned by the acquirer, an officer of the corporation or an employee of the corporation who is also a director of the corporation are excluded from the vote on whether to accord voting rights to the control shares. Should our board opt into these provisions of Maryland law, it may discourage others from trying to acquire control of us and increase the difficulty of consummating any offer. Similarly, provisions of Title 3, Subtitle 8 of the Maryland General Corporation Law could provide similar anti-takeover protection.
General Risks Related to Investments in Real Estate
Economic, market and regulatory changes that impact the real estate market generally may decrease the value of our investments and weaken our operating results.
Our operating results and the performance of our properties are subject to the risks typically associated with real estate, any of which could decrease the value of our investments and could weaken our operating results, including:
• | downturns in national, regional and local economic conditions; |
• | competition from other office buildings; |
• | adverse local conditions, such as oversupply or reduction in demand for office buildings and changes in real estate zoning laws that may reduce the desirability of real estate in an area; |
• | vacancies, changes in market rental rates and the need to periodically repair, renovate and re-let space; |
• | changes in interest rates and the availability of permanent mortgage financing, which may render the sale of a property or loan difficult or unattractive; |
• | changes in tax (including real and personal property tax), real estate, environmental and zoning laws; |
• | natural disasters such as hurricanes, earthquakes and floods; |
• | acts of war or terrorism, including the consequences of terrorist attacks, such as those that occurred on September 11, 2001; |
• | the potential for uninsured or underinsured property losses; and |
• | periods of high interest rates and tight money supply. |
Any of the above factors, or a combination thereof, could result in a decrease in our cash flow from operations and a decrease in the value of our investments, which would have an adverse effect on our operations, on our ability to pay distributions to our stockholders and on the value of our stockholders’ investment in us.
If our assets fail to perform as expected, cash distributions to our stockholders may decline.
Since breaking escrow in June 2008, we made acquisitions of real estate and real estate-related assets based on an underwriting analysis with respect to each asset and how the asset fits into our portfolio. If our assets do not perform as expected we may have less cash flow from operations available to fund distributions and stockholders’ returns may be reduced.
19
A significant percentage of our assets is invested in the 100 & 200 Campus Drive Buildings, the 300-600 Campus Drive Buildings, Union Bank Plaza and Corporate Technology Center and the value of our stockholders’ investment in us will fluctuate with the performance of these investments.
The 100 & 200 Campus Drive Buildings represented 11.0% of our total assets and represented approximately 9.3% of our total annualized base rent as of December 31, 2017. The 300-600 Campus Drive Buildings represented 11.9% of our total assets and represented approximately 14.7% of our total annualized base rent as of December 31, 2017. Union Bank Plaza represented approximately 13.4% of our total assets and represented approximately 16.0% of our total annualized base rent as of December 31, 2017. Corporate Technology Center represented approximately 15.7% of our total assets and represented approximately 15.3% of our total annualized base rent as of December 31, 2017. As a result, the geographic concentration of our portfolio makes us particularly susceptible to adverse economic developments in the Florham Park, New Jersey, Los Angeles and San Jose real estate markets, respectively. Any adverse economic or real estate developments in these markets, such as business layoffs or downsizing, industry slowdowns, relocations of businesses, changing demographics and other factors, or any decrease in demand for office space resulting from the local business climate, could adversely affect our operating results and our ability to pay distributions to our stockholders.
Because of the concentration of a significant portion of our assets in two geographic areas, any adverse economic, real estate or business conditions in these areas could affect our operating results and our ability to make distributions to our stockholders.
As of December 31, 2017, our real estate properties in California and New Jersey represented 29.1% and 22.9% of our total assets, respectively. As a result, the geographic concentration of our portfolio makes it particularly susceptible to adverse economic developments in the California and New Jersey real estate markets. Any adverse economic or real estate developments in these markets, such as business layoffs or downsizing, industry slowdowns, relocations of businesses, changing demographics and other factors, or any decrease in demand for office space resulting from the local business climate, could adversely affect our operating results and our ability to pay distributions to stockholders.
Properties that have significant vacancies could be difficult to sell, which could diminish the return on these properties and adversely affect our cash flow and ability to pay distributions to our stockholders.
A property may incur vacancies either by the expiration and non-renewal of tenant leases or the continued default of tenants under their leases. If vacancies continue for a long period of time, we may suffer reduced revenues, resulting in less cash available for distribution to our stockholders. In addition, the resale value of the property could be diminished because the market value of a particular property depends principally upon the value of the cash flow generated by the leases associated with that property. Such a reduction in the resale value of a property could also reduce the value of our stockholders’ investment in us.
We depend on tenants for our revenue generated by our real estate investments and, accordingly, our ability to pay distributions to our stockholders is partially dependent upon the success and economic viability of our tenants and our ability to retain and attract tenants. Non-renewals, terminations or lease defaults could reduce our net income and limit our ability to pay distributions to our stockholders.
The success of our real estate investments materially depends upon the financial stability of the tenants leasing the properties we own. The inability of a single major tenant or a significant number of smaller tenants to meet their rental obligations would significantly lower our net income. A non-renewal after the expiration of a lease term, termination or default by a tenant on its lease payments to us would cause us to lose the revenue associated with such lease and require us to find an alternative source of revenue to meet mortgage payments and prevent a foreclosure, if the property is subject to a mortgage. In the event of a tenant default or bankruptcy, we may experience delays in enforcing our rights as landlord of a property and may incur substantial costs in protecting our investment and re-leasing the property. Tenants may have the right to terminate their leases upon the occurrence of certain customary events of default and, in other circumstances, may not renew their leases or, because of market conditions, may only be able to renew their leases on terms that are less favorable to us than the terms of their initial leases. When tenants exercise early termination rights, our cash flow and earnings will be adversely affected to the extent that we are unable to generate an equivalent amount of net rental income by leasing the vacated space to new third party tenants.
Further, some of our properties may be outfitted to suit the particular needs of the tenants. We may have difficulty replacing the tenants of these properties if the outfitted space limits the types of businesses that could lease that space without major renovation. If a tenant does not renew a lease or terminates or defaults on a lease, we may be unable to lease the property for the rent previously received or sell the property without incurring a loss.
20
The bankruptcy or insolvency of our tenants or delays by our tenants in making rental payments could seriously harm our operating results and financial condition.
Any bankruptcy filings by or relating to any of our tenants could bar us from collecting pre-bankruptcy debts from that tenant, unless we receive an order permitting us to do so from the bankruptcy court. A tenant bankruptcy could delay our efforts to collect past due balances under the relevant leases, and could ultimately preclude full collection of these sums. If a lease is rejected by a tenant in bankruptcy, we would have only a general unsecured claim for damages. Any unsecured claim we hold against a bankrupt entity may be paid only to the extent that funds are available and only in the same percentage as is paid to all other holders of unsecured claims. We may recover substantially less than the full value of any unsecured claims, which would harm our financial condition.
Our inability to sell a property at the time and on the terms we want could limit our ability to pay cash distributions to our stockholders and could reduce the value of our stockholders’ investment in us.
Many factors that are beyond our control affect the real estate market and could affect our ability to sell properties for the price, on the terms or within the time frame that we desire. These factors include general economic conditions, the availability of financing, interest rates and other factors, including supply and demand. Because real estate investments are relatively illiquid, we have a limited ability to vary our portfolio in response to changes in economic or other conditions. Further, before we can sell a property on the terms we want, it may be necessary to expend funds to correct defects or to make improvements. However, we can give no assurance that we will have the funds available to correct such defects or to make such improvements. We may be unable to sell our properties at a profit. Our inability to sell properties at the time and on the terms we want could reduce our cash flow, limit our ability to pay distributions to our stockholders and reduce the value of our stockholders’ investment in us.
Costs imposed pursuant to laws and governmental regulations may reduce our net income and our cash available for distribution to our stockholders.
Real property and the operations conducted on real property are subject to federal, state and local laws and regulations relating to protection of the environment and human health. We could be subject to liability in the form of fines, penalties or damages for noncompliance with these laws and regulations. These laws and regulations generally govern wastewater discharges, air emissions, the operation and removal of underground and above-ground storage tanks, the use, storage, treatment, transportation and disposal of solid and hazardous materials, the remediation of contamination associated with the release or disposal of solid and hazardous materials, the presence of toxic building materials and other health and safety-related concerns.
Some of these laws and regulations may impose joint and several liability on the tenants, owners or operators of real property for the costs to investigate or remediate contaminated properties, regardless of fault, whether the contamination occurred prior to purchase, or whether the acts causing the contamination were legal. Our tenants’ operations, the condition of properties at the time we buy them, operations in the vicinity of our properties, such as the presence of underground storage tanks, or activities of unrelated third parties may affect our properties.
The presence of hazardous substances, or the failure to properly manage or remediate these substances, may hinder our ability to sell, rent or pledge such property as collateral for future borrowings. Any material expenditures, fines, penalties or damages we must pay will reduce our ability to pay distributions to our stockholders and may reduce the value of our stockholders’ investment.
21
The costs of defending against claims of environmental liability, of complying with environmental regulatory requirements, of remediating any contaminated property, or of paying personal injury or other damage claims could reduce our cash available for distribution to our stockholders.
Under various federal, state and local environmental laws, ordinances and regulations, a current or previous real property owner or operator may be liable for the cost of removing or remediating hazardous or toxic substances on, under or in such property. These costs could be substantial. Such laws often impose liability whether or not the owner or operator knew of, or was responsible for, the presence of such hazardous or toxic substances. Environmental laws also may impose liens on property or restrictions on the manner in which property may be used or businesses may be operated, and these restrictions may require substantial expenditures or prevent us from entering into leases with prospective tenants that may be impacted by such laws. Environmental laws provide for sanctions for noncompliance and may be enforced by governmental agencies or, in certain circumstances, by private parties. Certain environmental laws and common law principles could be used to impose liability for the release of and exposure to hazardous substances, including asbestos-containing materials and lead-based paint. Third parties may seek recovery from real property owners or operators for personal injury or property damage associated with exposure to released hazardous substances and governments may seek recovery for natural resource damage. The costs of defending against claims of environmental liability, of complying with environmental regulatory requirements, of remediating any contaminated property, or of paying personal injury, property damage or natural resource damage claims could reduce our cash available for distribution to our stockholders. All of our properties were subject to Phase I environmental assessments prior to the time they were acquired.
Costs associated with complying with the Americans with Disabilities Act may decrease our cash available for distribution.
Our properties may be subject to the Americans with Disabilities Act of 1990, as amended (the “Disabilities Act”). Under the Disabilities Act, all places of public accommodation are required to comply with federal requirements related to access and use by disabled persons. The Disabilities Act has separate compliance requirements for “public accommodations” and “commercial facilities” that generally require that buildings and services be made accessible and available to people with disabilities. The Disabilities Act’s requirements could require removal of access barriers and could result in the imposition of injunctive relief, monetary penalties or, in some cases, an award of damages. Any funds used for Disabilities Act compliance will reduce our net income and the amount of cash available for distribution to our stockholders.
Uninsured losses relating to real property or excessively expensive premiums for insurance coverage could reduce our cash flow from operations and the return on our stockholders’ investment in us.
There are types of losses, generally catastrophic in nature, such as losses due to wars, acts of terrorism, earthquakes, floods, hurricanes, pollution or environmental matters, that are uninsurable or not economically insurable, or may be insured subject to limitations, such as large deductibles or co-payments. Insurance policies relating to such events may not be available at reasonable costs, if at all, which could inhibit our ability to finance or refinance our properties. In such instances, we may be required to provide other financial support, either through financial assurances or self-insurance, to cover potential losses. We may not have adequate coverage for such losses. If any of our properties incurs a casualty loss that is not fully insured, the value of our assets will be reduced by any such uninsured loss, which will reduce the value of our stockholders’ investment. In addition, other than any working capital reserve or other reserves we may establish, we have limited sources of funding to repair or reconstruct any uninsured property. Also, to the extent we must pay unexpectedly large amounts for insurance, we could suffer reduced earnings that would result in lower distributions to our stockholders.
Terrorist attacks and other acts of violence or war may affect the markets in which we operate, which could delay or hinder our ability to meet our investment objectives and reduce our stockholders’ overall return.
Terrorist attacks or armed conflicts may directly impact the value of our properties through damage, destruction, loss or increased security costs. We have invested in major metropolitan markets. Insurance risks associated with potential acts of terrorism could sharply increase the premiums we pay for coverage against property and casualty claims or we may not be able to obtain insurance against the risk of terrorism because it may not be available or may not be available on terms that are economically feasible. The terrorism insurance that we obtain may not be sufficient to cover loss for damages to our properties as a result of terrorist attacks. The inability to obtain sufficient terrorism insurance or any terrorism insurance at all could limit our refinancing options as some mortgage lenders have begun to insist that specific coverage against terrorism be purchased by commercial owners as a condition of providing loans.
22
Risks Related to Real Estate-Related Investments
Our real estate-related investment is and will be subject to the risks typically associated with real estate.
Our mortgage loan investment is secured by a lien on real property that, upon the occurrence of a default on the loan, could result in our taking ownership of the property. The value of this property may have changed since we originated the loan and if it has dropped, our risk will increase because of the lower value of the security associated with the loan. In this manner, real estate values could impact the value of our loan investment. Therefore, our real estate-related investment is subject to the risks typically associated with real estate, which are described above under the heading “—General Risks Related to Investments in Real Estate.”
Our mortgage loan investment is and will be subject to interest rate fluctuations that affect our return as compared to market interest rates; accordingly, the value of our stockholders’ investment in us is subject to fluctuations in interest rates.
With respect to our fixed rate, long-term loan receivable, if interest rates rise, the loan could yield a return that is lower than then-current market rates. If interest rates decrease, we will be adversely affected to the extent that the loan is prepaid because we would no longer receive the revenue generated by the loan. For this reason, our return on this loan and the value of our stockholders’ investment in us are and will be subject to fluctuations in interest rates.
Our mortgage loan investment is subject to delinquency, foreclosure and loss, which could result in losses to us.
Commercial real estate loans are secured by commercial real estate properties that are subject to risks of delinquency and foreclosure. The ability of a borrower to repay a loan secured by an income-producing property typically is dependent primarily upon the successful operation of such property rather than upon the existence of independent income or assets of the borrower. If the net operating income of the property is reduced, the borrower’s ability to repay the loan may be impaired. Net operating income of an income-producing property can be affected by, among other things: tenant mix, success of tenant businesses, occupancy rates, property management decisions, property location and condition, competition from comparable types of properties, changes in laws that increase operating expenses or limit rents that may be charged, any need to address environmental contamination at the property, the occurrence of any uninsured casualty at the property, changes in national, regional or local economic conditions and/or specific industry segments, declines in regional or local real estate values, declines in regional or local rental or occupancy rates, increases in interest rates, real estate tax rates and other operating expenses, changes in governmental rules, fiscal policies and regulations (including environmental legislation), natural disasters, terrorism, social unrest and civil disturbances.
In the event of any default under our mortgage loan, we will bear a risk of loss of principal and accrued interest to the extent of any deficiency between the value of the collateral and the principal and accrued interest of the mortgage loan, which could have a material adverse effect on our cash flow from operations. Foreclosure on a property securing a mortgage loan can be an expensive and lengthy process that could have a substantial negative effect on our anticipated return on the investment. In the event of the bankruptcy of our mortgage loan borrower, the mortgage loan will be deemed to be secured only to the extent of the value of the underlying collateral at the time of bankruptcy (as determined by the bankruptcy court), and the lien securing the mortgage loan will be subject to the avoidance powers of the bankruptcy trustee or debtor-in-possession to the extent the lien is unenforceable under state law.
In addition, if there is a default under our mortgage loan, we may not be able to repossess and sell the underlying property quickly. The resulting time delay could reduce the value of our investment in the defaulted mortgage loan. An action to foreclose on a property securing a mortgage loan is regulated by state statutes and regulations and is subject to many of the delays and expenses of other lawsuits if the borrower raises defenses or counterclaims. In the event of default by a borrower, these restrictions, among other things, may impede our ability to foreclose on or sell the mortgaged property or to obtain proceeds sufficient to repay all amounts due to us on the mortgage loan.
Our real estate loan investment is illiquid and we may not be able to adjust this portion of our portfolio in response to changes in economic and other conditions.
Our real estate loan investment is illiquid. As a result, our ability to vary this portion of our portfolio in response to changes in economic and other conditions may be relatively limited.
23
We depend on the borrower for the revenue generated by our real estate-related investment and, accordingly, our revenue and our ability to pay distributions to our stockholders are partially dependent upon the success and economic viability of such borrower.
The success of our real estate-related investment materially depends on the financial stability of the borrower under the investment. The inability of the borrower to meet its payment obligations could result in reduced revenue or losses for us. In the event of the default or bankruptcy of the borrower, we may experience delays in enforcing our rights as a creditor, and such rights may be subordinated to the rights of other creditors. These events could negatively affect the cash available for distribution to our stockholders and the value of their investment in us.
Risks Associated with Debt Financing
We obtain mortgage indebtedness, lines of credit and other borrowings, which increases our risk of loss due to potential foreclosure.
We obtain lines of credit and long-term financing secured by our properties and other assets. We have acquired many of our real properties by financing a portion of the price of the properties and mortgaging or pledging some or all of the properties purchased as security for that debt. We may also incur mortgage debt on properties that we already own in order to fund property improvements and other capital expenditures, to pay distributions and for other purposes. In addition, we may borrow as necessary or advisable to ensure that we maintain our qualification as a REIT for federal income tax purposes, including borrowings to satisfy the REIT requirement that we distribute at least 90% of our annual REIT taxable income to our stockholders (computed without regard to the dividends-paid deduction and excluding net capital gain). However, we can give our stockholders no assurance that we will be able to obtain such borrowings on satisfactory terms or at all.
If there is a shortfall between the cash flow generated by a mortgaged property and the cash flow needed to service mortgage debt on that property, then the amount of cash available for distribution to our stockholders may be reduced. In addition, incurring mortgage debt increases the risk of loss of a property since defaults on indebtedness secured by a property may result in lenders initiating foreclosure actions. In that case, we could lose the property securing the loan that is in default, reducing the value of our stockholders’ investment. For tax purposes, a foreclosure of any of our properties would be treated as a sale of the property for a purchase price equal to the outstanding balance of the debt secured by the mortgage. If the outstanding balance of the debt secured by the mortgage exceeds our tax basis in the property, we would recognize taxable income on foreclosure even though we would not necessarily receive any cash proceeds. We have given and may give full or partial guarantees to lenders of mortgage or other debt on behalf of the entities that own our properties. When we give a guaranty on behalf of an entity that owns one of our properties, we will be responsible to the lender for satisfaction of all or a part of the debt or other amounts related to the debt if it is not paid by such entity. If any mortgages contain cross-collateralization or cross-default provisions, a default on a mortgage secured by a single property could affect mortgages secured by other properties.
High mortgage rates or changes in underwriting standards may make it difficult for us to refinance properties, which could reduce our cash flow from operations and the amount of cash available for distribution to our stockholders.
We may be unable to refinance part or all of our mortgage debt when it becomes due or we may be unable to refinance mortgage debt on favorable terms. If interest rates are higher when we refinance properties, our income could be reduced. We may be unable to refinance or may only be able to partly refinance properties if underwriting standards, including loan to value ratios and yield requirements, among other requirements, are more strict than when we originally financed the properties. If any of these events occurs, our cash flow could be reduced and/or we might have to pay down existing mortgages. This, in turn, would reduce cash available for distribution to our stockholders, could cause us to require additional capital and may hinder our ability to raise capital by issuing more stock or by borrowing more money.
Lenders may require us to enter into restrictive covenants relating to our operations, which could limit our ability to pay distributions to our stockholders.
When providing financing, a lender may impose restrictions on us that affect our distribution and operating policies and our ability to incur additional debt. Loan agreements into which we enter may contain covenants that limit our ability to further mortgage a property or that prohibit us from discontinuing insurance coverage or replacing our advisor. These or other limitations would decrease our operating flexibility and our ability to achieve our operating objectives and limit our ability to pay distributions to our stockholders.
24
Increases in interest rates would increase the amount of our debt payments and limit our ability to pay distributions to our stockholders.
We have incurred variable rate debt and we may incur additional debt or refinance existing debt in the future. Increases in interest rates will increase the cost of that debt, which could reduce our cash flow from operations and the cash we have available for distribution to our stockholders. In addition, if we need to repay existing debt during periods of rising interest rates, we could be required to liquidate one or more of our investments at times that may not permit realization of the maximum return on such investments.
We have broad authority to incur debt and high debt levels could hinder our ability to pay distributions and decrease the value of our stockholders’ investment.
We limit our total liabilities to 75% of the cost (before deducting depreciation and other noncash reserves) of our tangible assets; however, we may exceed this limit if the majority of the conflicts committee approves each borrowing in excess of this limitation and we disclose such borrowings to our stockholders in our next quarterly report with an explanation from the conflicts committee of the justification for the excess borrowing. As of December 31, 2017, our borrowings and other liabilities were approximately 34% of both the cost (before deducting depreciation and other noncash reserves) and book value (before deducting depreciation) of our tangible assets, respectively. High debt levels would cause us to incur higher interest charges and higher debt service payments and may also be accompanied by restrictive covenants. These factors could limit the amount of cash we have available to distribute to our stockholders and could result in a decline in the value of our stockholders’ investment in us.
Federal Income Tax Risks
Failure to qualify as a REIT would reduce our net earnings available for distribution.
Our qualification as a REIT will depend upon our ability to meet requirements regarding our organization and ownership, distributions of our income, the nature and diversification of our income and assets and other tests imposed by the Internal Revenue Code. If we fail to qualify as a REIT for any taxable year after electing REIT status, we will be subject to federal income tax on our taxable income at corporate rates (a maximum rate of 35% applies through 2017 and 21% for subsequent years). In addition, we would generally be disqualified from treatment as a REIT for the four taxable years following the year in which we lost our REIT status. Losing our REIT status would reduce our net earnings available for distribution to stockholders because of the additional tax liability. In addition, distributions to stockholders would no longer qualify for the dividends-paid deduction and we would no longer be required to pay distributions. If this occurs, we might be required to borrow funds or liquidate some investments in order to pay the applicable tax.
Failure to qualify as a REIT would subject us to federal income tax, which would reduce the cash available for distribution to our stockholders.
We believe that we have operated and will continue to operate in a manner that will allow us to continue to qualify as a REIT for federal income tax purposes commencing with the taxable year ended December 31, 2008. However, the federal income tax laws governing REITs are extremely complex, and interpretations of the federal income tax laws governing qualification as a REIT are limited. Qualifying as a REIT requires us to meet various tests regarding the nature of our assets and our income, the ownership of our outstanding stock, and the amount of our distributions on an ongoing basis. Accordingly, we cannot be certain that we will be successful in operating so we can remain qualified as a REIT. While we intend to continue to operate so that we will qualify as a REIT, given the highly complex nature of the rules governing REITs, the ongoing importance of factual determinations, and the possibility of future changes in our circumstances, no assurance can be given that we will so qualify for any particular year. If we fail to qualify as a REIT in any calendar year and we do not qualify for certain statutory relief provisions, we would be required to pay federal income tax on our taxable income. We might need to borrow money or sell assets to pay that tax. Our payment of income tax would decrease the amount of our income available for distribution to our stockholders. Furthermore, if we fail to maintain our qualification as a REIT and we do not qualify for certain statutory relief provisions, we no longer would be required to distribute substantially all of our REIT taxable income to our stockholders. Unless our failure to qualify as a REIT were excused under federal tax laws, we would be disqualified from taxation as a REIT for the four taxable years following the year during which qualification was lost.
25
Even if we qualify as a REIT for federal income tax purposes, we may be subject to federal, state, local or other tax liabilities that reduce our cash flow and our ability to pay distributions to our stockholders.
Even if we qualify as a REIT for federal income tax purposes, we may be subject to some federal, state and local taxes on our income or property. For example:
• | In order to qualify as a REIT, we must distribute annually at least 90% of our REIT taxable income to our stockholders (which is determined without regard to the dividends-paid deduction or net capital gain). To the extent that we satisfy the distribution requirement but distribute less than 100% of our REIT taxable income, we will be subject to federal corporate income tax on the undistributed income. |
• | We will be subject to a 4% nondeductible excise tax on the amount, if any, by which distributions we pay in any calendar year are less than the sum of 85% of our ordinary income, 95% of our capital gain net income and 100% of our undistributed income from prior years. |
• | If we elect to treat property that we acquire in connection with a foreclosure of a mortgage loan or certain leasehold terminations as “foreclosure property,” we may avoid the 100% tax on the gain from a resale of that property, but the income from the sale or operation of that property may be subject to corporate income tax at the highest applicable rate. |
• | If we sell an asset, other than foreclosure property, that we hold primarily for sale to customers in the ordinary course of business, our gain would be subject to the 100% “prohibited transaction” tax unless such sale were made by one of our taxable REIT subsidiaries. |
REIT distribution requirements could adversely affect our ability to execute our business plan.
We generally must distribute annually at least 90% of our REIT taxable income, subject to certain adjustments and excluding any net capital gain, in order for federal corporate income tax not to apply to earnings that we distribute. To the extent that we satisfy this distribution requirement, but distribute less than 100% of our REIT taxable income, we will be subject to federal corporate income tax on our undistributed REIT taxable income. In addition, we will be subject to a 4% nondeductible excise tax if the actual amount that we pay out to our stockholders in a calendar year is less than a minimum amount specified under federal tax laws. We also may decide to retain net capital gain we earn from the sale or other disposition of our property and pay U.S. federal income tax directly on such income. In that event, our stockholders would be treated as if they earned that income and paid the tax on it directly. However, stockholders that are tax-exempt, such as charities or qualified pension plans, would have no benefit from their deemed payment of such tax liability unless they file U.S. federal income tax returns and thereon seek a refund of such tax. We also will be subject to corporate tax on any undistributed taxable income. We intend to pay distributions to our stockholders to comply with the REIT requirements of the Internal Revenue Code.
From time to time, we may generate taxable income greater than our income for financial reporting purposes, or our taxable income may be greater than our cash flow available for distribution to stockholders (for example, where a borrower defers the payment of interest in cash pursuant to a contractual right or otherwise). If we do not have other funds available in these situations we could be required to borrow funds, sell investments at disadvantageous prices or find another alternative source of funds to pay distributions sufficient to enable us to pay out enough of our taxable income to satisfy the REIT distribution requirements and to avoid corporate income tax and the 4% excise tax in a particular year. These alternatives could increase our costs or reduce our equity. Thus, compliance with the REIT requirements may hinder our ability to operate solely on the basis of maximizing profits.
To maintain our REIT status, we may be forced to forego otherwise attractive business opportunities, which may delay or hinder our ability to meet our investment objectives and reduce our stockholders’ overall return.
To qualify as a REIT, we must satisfy certain tests on an ongoing basis concerning, among other things, the sources of our income, nature of our assets and the amounts we distribute to our stockholders. We may be required to pay distributions to stockholders at times when it would be more advantageous to reinvest cash in our business or when we do not have funds readily available for distribution. Compliance with the REIT requirements may hinder our ability to operate solely on the basis of maximizing profits and reduce the value of our stockholders’ investment.
26
If our operating partnership fails to maintain its status as a partnership for federal income tax purposes, its income would be subject to taxation and our REIT status would be terminated.
We intend to maintain the status of our operating partnership as a partnership for federal income tax purposes. However, if the IRS were to successfully challenge the status of our operating partnership as a partnership, it would be taxable as a corporation. In such event, this would reduce the amount of distributions that our operating partnership could make to us. This would also result in our losing REIT status and becoming subject to a corporate level tax on our own income. This would substantially reduce our cash available to pay distributions and the return on your investment. In addition, if any of the entities through which our operating partnership owns its properties, in whole or in part, loses its characterization as a partnership for federal income tax purposes, the underlying entity would become subject to taxation as a corporation, thereby reducing distributions to our operating partnership and jeopardizing our ability to maintain REIT status.
Potential characterization of distributions or gain on sale may be treated as unrelated business taxable income to tax-exempt investors.
If (i) all or a portion of our assets are subject to the rules relating to taxable mortgage pools, (ii) we are a “pension-held REIT,” (iii) a tax-exempt stockholder has incurred debt to purchase or hold our common stock, or (iv) the residual Real Estate Mortgage Investment Conduit interests, or REMICs, we buy (if any) generate “excess inclusion income,” then a portion of the distributions to and, in the case of a stockholder described in clause (iii), gains realized on the sale of common stock by such tax-exempt stockholder may be subject to federal income tax as unrelated business taxable income under the Internal Revenue Code.
The tax on prohibited transactions will limit our ability to engage in transactions that would be treated as sales for federal income tax purposes.
A REIT’s net income from prohibited transactions is subject to a 100% tax. In general, prohibited transactions are sales or other dispositions of assets, other than foreclosure property, deemed held primarily for sale to customers in the ordinary course of business. We might be subject to this tax if we were to dispose of loans in a manner that was treated as a sale of the loans for federal income tax purposes. Therefore, in order to avoid the prohibited transactions tax, we may choose not to engage in certain sales of loans at the REIT level, even though the sales might otherwise be beneficial to us.
It may be possible to reduce the impact of the prohibited transaction tax by conducting certain activities through taxable REIT subsidiaries. However, to the extent that we engage in such activities through taxable REIT subsidiaries, the income associated with such activities may be subject to full corporate income tax.
Complying with REIT requirements may force us to liquidate otherwise attractive investments.
To qualify as a REIT, we must ensure that at the end of each calendar quarter, at least 75% of the value of our assets consists of cash, cash items, government securities and qualified REIT real estate assets, including certain mortgage loans and residential and commercial mortgage-backed securities. The remainder of our investment in securities (other than government securities and qualified real estate assets) generally cannot include more than 10% of the outstanding voting securities of any one issuer or more than 10% of the total value of the outstanding securities of any one issuer. In addition, in general, no more than 5% of the value of our assets (other than government securities and qualified real estate assets) can consist of the securities of any one issuer, and 20% of the value of our total assets can be represented by securities of one or more taxable REIT subsidiaries. If we fail to comply with these requirements at the end of any calendar quarter, we must correct the failure within 30 days after the end of the calendar quarter or qualify for certain statutory relief provisions to avoid losing our REIT qualification and suffering adverse tax consequences. As a result, we may be required to liquidate from our portfolio otherwise attractive investments. These actions could have the effect of reducing our income and amounts available for distribution to our stockholders.
Liquidation of assets may jeopardize our REIT qualification.
To qualify as a REIT, we must comply with requirements regarding our assets and our sources of income. If we are compelled to liquidate our investments to repay obligations to our lenders, we may be unable to comply with these requirements, ultimately jeopardizing our qualification as a REIT, or we may be subject to a 100% tax on any resultant gain if we sell assets that are treated as dealer property or inventory.
27
The ability of our board of directors to revoke our REIT qualification without stockholder approval may subject us to U.S. federal income tax and reduce distributions to our stockholders.
Our charter provides that our board of directors may revoke or otherwise terminate our REIT election, without the approval of our stockholders, if it determines that it is no longer in our best interest to continue to qualify as a REIT. While we intend to elect and qualify to be taxed as a REIT, we may not elect to be treated as a REIT or may terminate our REIT election if we determine that qualifying as a REIT is no longer in our best interests. If we cease to be a REIT, we would become subject to U.S. federal income tax on our taxable income and would no longer be required to distribute most of our taxable income to our stockholders, which may have adverse consequences on our total return to our stockholders and on the market price of our common stock.
Changes recently made to the U.S. tax laws could have a negative impact on our business.
The President signed a tax reform bill into law on December 22, 2017 (the “Tax Cuts and Jobs Act”). Among other things, the Tax Cuts and Jobs Act:
• | Reduces the corporate income tax rate from 35% to 21% (including with respect to our taxable REIT subsidiary); |
• | Reduces the rate of U.S. federal withholding tax on distributions made to non-U.S. stockholders by a REIT that are attributable to gains from the sale or exchange of U.S. real property interests from 35% to 21%; |
• | Allows an immediate 100% deduction of the cost of certain capital asset investments (generally excluding real estate assets), subject to a phase-down of the deduction percentage over time; |
• | Changes the recovery periods for certain real property and building improvements (for example, to 15 years for qualified improvement property under the modified accelerated cost recovery system, and to 30 years (previously 40 years) for residential real property and 20 years (previously 40 years) for qualified improvement property under the alternative depreciation system); |
• | Restricts the deductibility of interest expense by businesses (generally, to 30% of the business’ adjusted taxable income) except, among others, real property businesses electing out of such restriction; we have not yet determined whether we and/or our subsidiaries can and/or will make such an election; |
• | Requires the use of the less favorable alternative depreciation system to depreciate real property in the event a real property business elects to avoid the interest deduction restriction above; |
• | Restricts the benefits of like-kind exchanges that defer capital gains for tax purposes to exchanges of real property; |
• | Permanently repeals the “technical termination” rule for partnerships, meaning sales or exchanges of the interests in a partnership will be less likely to, among other things, terminate the taxable year of, and restart the depreciable lives of assets held by, such partnership for tax purposes; |
• | Requires accrual method taxpayers to take certain amounts in income no later than the taxable year in which such income is taken into account as revenue in an applicable financial statement prepared under GAAP, which, with respect to certain leases, could accelerate the inclusion of rental income; |
• | Eliminates the federal corporate alternative minimum tax; |
• | Reduces the highest marginal income tax rate for individuals to 37% from 39.6% (excluding, in each case, the 3.8% Medicare tax on net investment income); |
• | Generally allows a deduction for individuals equal to 20% of certain income from pass-through entities, including ordinary dividends distributed by a REIT (excluding capital gain dividends and qualified dividend income), generally resulting in a maximum effective federal income tax rate applicable to such dividends of 29.6% compared to 37% (excluding, in each case, the 3.8% Medicare tax on net investment income); and |
• | Limits certain deductions for individuals, including deductions for state and local income taxes, and eliminates deductions for miscellaneous itemized deductions (including certain investment expenses). |
Many of the provisions in the Tax Cuts and Jobs Act, in particular those affecting individual taxpayers, expire at the end of 2025.
As a result of the changes to U.S. federal tax laws implemented by the Tax Cuts and Jobs Act, our taxable income and the amount of distributions to our stockholders required in order to maintain our REIT status, and our relative tax advantage as a REIT, could change. As a REIT, we are required to distribute at least 90% of our taxable income to our stockholders annually.
28
The Tax Cuts and Jobs Act is a complex revision to the U.S. federal income tax laws with various impacts on different categories of taxpayers and industries, and will require subsequent rulemaking and interpretation in a number of areas. The long-term impact of the Tax Cuts and Jobs Act on the overall economy, government revenues, our tenants, us, and the real estate industry cannot be reliably predicted at this time. Furthermore, the Tax Cuts and Jobs Act may negatively impact certain of our tenants’ operating results, financial condition, and future business plans. The Tax Cuts and Jobs Act may also result in reduced government revenues, and therefore reduced government spending, which may negatively impact some of our tenants that rely on government funding. There can be no assurance that the Tax Cuts and Jobs Act will not negatively impact our operating results, financial condition, and future business operations.
Dividends payable by REITs do not qualify for the reduced tax rates.
In general, the maximum tax rate for dividends payable to domestic stockholders that are individuals, trusts and estates is 20%. Dividends payable by REITs, however, are generally not eligible for this reduced rate; provided individuals may be able to deduct 20% of income received as ordinary REIT dividends, thus reducing the maximum effective federal income tax rate on such dividend. While this tax treatment does not adversely affect the taxation of REITs or dividends paid by REITs, the more favorable rates applicable to regular corporate dividends could cause investors who are individuals, trusts or estates to perceive investments in REITs to be relatively less attractive than investments in stock of non‑REIT corporations that pay dividends, which could adversely affect the value of the stock of REITs, including our common stock.
Qualifying as a REIT involves highly technical and complex provisions of the Internal Revenue Code.
Qualification as a REIT involves the application of highly technical and complex Internal Revenue Code provisions for which only limited judicial and administrative authorities exist. Even a technical or inadvertent violation could jeopardize our REIT qualification. Our continued qualification as a REIT will depend on our satisfaction of certain asset, income, organizational, distribution, stockholder ownership and other requirements on a continuing basis. In addition, our ability to satisfy the requirements to qualify as a REIT depends in part on the actions of third parties over which we have no control or only limited influence, including in cases where we own an equity interest in an entity that is classified as a partnership for U.S. federal income tax purposes.
The taxation of distributions to our stockholders can be complex; however, distributions that we make to our stockholders generally will be taxable as ordinary income, which may reduce your anticipated return from an investment in us.
Distributions that we make to our taxable stockholders to the extent of our current and accumulated earnings and profits (and not designated as capital gain dividends or qualified dividend income) generally will be taxable as ordinary income. However, a portion of our distributions may (i) be designated by us as capital gain dividends generally taxable as long-term capital gain to the extent that they are attributable to net capital gain recognized by us, (ii) be designated by us as qualified dividend income generally to the extent they are attributable to dividends we receive from non-REIT corporations, if any, or (iii) constitute a return of capital generally to the extent that they exceed our current and accumulated earnings and profits as determined for U.S. federal income tax purposes. A return of capital distribution is not taxable, but has the effect of reducing the basis of a stockholder’s investment in our common stock.
Non-U.S. stockholders will be subject to U.S. federal withholding tax and may be subject to U.S. federal income tax on distributions received from us and upon the disposition of our shares.
Subject to certain exceptions, distributions received from us will be treated as dividends of ordinary income to the extent of our current or accumulated earnings and profits. Such dividends ordinarily will be subject to U.S. withholding tax at a 30% rate, or such lower rate as may be specified by an applicable income tax treaty, unless the distributions are treated as “effectively connected” with the conduct by the non-U.S. stockholder of a U.S. trade or business. Pursuant to the Foreign Investment in Real Property Tax Act of 1980, or FIRPTA, capital gain distributions attributable to sales or exchanges of “U.S. real property interests,” or USRPIs, generally (subject to certain exceptions for “qualified foreign pension funds” and certain “qualified shareholders”) will be taxed to a non-U.S. stockholder (other than a qualified foreign pension plan, entities wholly owned by a qualified foreign pension plan and certain publicly traded foreign entities) as if such gain were effectively connected with a U.S. trade or business unless FIRPTA provides an exemption. However, a capital gain dividend will not be treated as effectively connected income if (i) the distribution is received with respect to a class of stock that is regularly traded on an established securities market located in the United States and (ii) the non-U.S. stockholder does not own more than 10% of the class of our stock at any time during the one-year period ending on the date the distribution is received. We do not anticipate that our shares will be “regularly traded” on an established securities market for the foreseeable future, and therefore, this exception is not expected to apply.
29
Gain recognized by a non-U.S. stockholder upon the sale or exchange of our common stock generally will not be subject to U.S. federal income taxation unless such stock constitutes a USRPI under FIRPTA (subject to specific FIRPTA exemptions for certain non-U.S. stockholders). Our common stock will not constitute a USRPI so long as we are a “domestically-controlled qualified investment entity.” A domestically-controlled qualified investment entity includes a REIT if at all times during a specified testing period, less than 50% in value of such REIT’s stock is held directly or indirectly by non-U.S. stockholders. We believe, but cannot assure you, that we will be a domestically-controlled qualified investment entity.
Even if we do not qualify as a domestically-controlled qualified investment entity at the time a non-U.S. stockholder sells or exchanges our common stock, gain arising from such a sale or exchange would not be subject to U.S. taxation under FIRPTA as a sale of a USRPI if: (a) our common stock is “regularly traded,” as defined by applicable Treasury Regulations, on an established securities market, and (b) such non-U.S. stockholder owned, actually and constructively, 10% or less of our common stock at any time during the five-year period ending on the date of the sale. However, it is not anticipated that our common stock will be “regularly traded” on an established market. We encourage you to consult your tax advisor to determine the tax consequences applicable to you if you are a non-U.S. stockholder.
Retirement Plan Risks
If the fiduciary of an employee benefit plan subject to ERISA (such as a profit sharing, Section 401(k) or pension plan) or an owner of a retirement arrangement subject to Section 4975 of the Internal Revenue Code (such as an individual retirement account (“IRA”)) fails to meet the fiduciary and other standards under ERISA or the Internal Revenue Code as a result of an investment in our stock, the fiduciary could be subject to penalties and other sanctions.
There are special considerations that apply to employee benefit plans subject to the Employee Retirement Income Security Act (“ERISA”) (such as profit sharing, Section 401(k) or pension plans) and other retirement plans or accounts subject to Section 4975 of the Internal Revenue Code (such as an IRA) that have invested in our shares. Fiduciaries and IRA owners that have invested the assets of such a plan or account in our common stock should satisfy themselves that:
• | the investment is consistent with their fiduciary and other obligations under ERISA and the Internal Revenue Code; |
• | the investment is made in accordance with the documents and instruments governing the plan or IRA, including the plan’s or account’s investment policy; |
• | the investment satisfies the prudence and diversification requirements of Sections 404(a)(1)(B) and 404(a)(1)(C) of ERISA and other applicable provisions of ERISA and the Internal Revenue Code; |
• | the investment in our shares, for which no public market currently exists, is consistent with the liquidity needs of the plan or IRA; |
• | the investment will not produce an unacceptable amount of “unrelated business taxable income” for the plan or IRA; |
• | our stockholders will be able to comply with the requirements under ERISA and the Internal Revenue Code to value the assets of the plan or IRA annually; and |
• | the investment will not constitute a prohibited transaction under Section 406 of ERISA or Section 4975 of the Internal Revenue Code. |
With respect to the annual valuation requirements described above, we will provide an estimated value per share for our common stock annually. We can make no claim whether such estimated value will or will not satisfy the applicable annual valuation requirements under ERISA and the Internal Revenue Code. The Department of Labor or the Internal Revenue Service may determine that a plan fiduciary or an IRA custodian is required to take further steps to determine the value of our common stock. In the absence of an appropriate determination of value, a plan fiduciary or an IRA custodian may be subject to damages, penalties or other sanctions. For information regarding our estimated value per share, see Part II, Item 5, “Market for Registrant’s Common Equity, Related Stockholder Matters, and Issuer Purchases of Equity Securities - Market Information” of this Annual Report on Form 10-K.
Failure to satisfy the fiduciary standards of conduct and other applicable requirements of ERISA and the Internal Revenue Code may result in the imposition of civil and criminal penalties and could subject the fiduciary to claims for damages or for equitable remedies, including liability for investment losses. In addition, if an investment in our shares constitutes a prohibited transaction under ERISA or the Internal Revenue Code, the fiduciary or IRA owner who authorized or directed the investment may be subject to the imposition of excise taxes with respect to the amount invested. In addition, the investment transaction must be undone. In the case of a prohibited transaction involving an IRA owner, the IRA may be disqualified as a tax-exempt account and all of the assets of the IRA may be deemed distributed and subjected to tax. ERISA plan fiduciaries and IRA owners should consult with counsel before making an investment in our common stock.
30
If our assets are deemed to be plan assets, we and our advisor may be exposed to liabilities under Title I of ERISA and the Internal Revenue Code.
In some circumstances where an ERISA plan holds an interest in an entity, the assets of the entity are deemed to be ERISA plan assets unless an exception applies. This is known as the “look-through rule.” Under those circumstances, the obligations and other responsibilities of plan sponsors, plan fiduciaries and plan administrators, and of parties in interest and disqualified persons, under Title I of ERISA or Section 4975 of the Internal Revenue Code, may be applicable, and there may be liability under these and other provisions of ERISA and the Internal Revenue Code. We believe that our assets should not be treated as plan assets because the shares should qualify as “publicly-offered securities” that are exempt from the look-through rules under applicable Treasury Regulations. We note, however, that because certain limitations are imposed upon the transferability of shares so that we may qualify as a REIT, and perhaps for other reasons, it is possible that this exemption may not apply. If that is the case, and if we or our advisor are exposed to liability under ERISA or the Internal Revenue Code, our performance and results of operations could be adversely affected. Stockholders should consult with their legal and other advisors concerning the impact of ERISA and the Internal Revenue Code on their investment and our performance.
ITEM 1B. | UNRESOLVED STAFF COMMENTS |
We have no unresolved staff comments.
ITEM 2. | PROPERTIES |
As of December 31, 2017, our portfolio of real estate consisted of eight office properties and an office campus consisting of eight office buildings, encompassing in the aggregate 4.7 million rentable square feet. The total cost of our portfolio of real estate was $1.5 billion. As of December 31, 2017, our portfolio of real estate was approximately 85% occupied, the annualized base rent was $122.2 million and the average annualized base rent per square foot of our portfolio of real estate was $30.62. The weighted-average remaining lease term of our portfolio of real estate (excluding options to extend) was 5.0 years.
As of December 31, 2017, four properties represented more than 10% of our total assets:
Property | Location | Rentable Square Feet | Total Real Estate, Net (in thousands) | Percentage of Total Assets | Annualized Base Rent (in thousands) (1) | Average Annualized Base Rent per sq. ft. (2) | Occupancy | Weighted Average Remaining Lease Term | |||||||||||||||||
Corporate Technology Centre | San Jose, CA | 610,083 | $ | 192,629 | 15.7 | % | $ | 18,635 | $ | 30.54 | 100 | % | 1.7 years | ||||||||||||
Union Bank Plaza | Los Angeles, CA | 627,334 | 163,960 | 13.4 | % | 19,548 | 38.00 | 82 | % | 3.7 years | |||||||||||||||
300-600 Campus Drive Buildings | Florham Park, NJ | 578,424 | 145,929 | 11.9 | % | 17,923 | 33.63 | 92 | % | 10.3 years | |||||||||||||||
100 & 200 Campus Drive Buildings | Florham Park, NJ | 589,625 | 135,102 | 11.0 | % | 11,408 | 30.00 | 64 | % | 6.3 years | |||||||||||||||
_____________________
(1) Annualized base rent represents annualized contractual base rental income as of December 31, 2017, adjusted to straight-line any contractual tenant concessions (including free rent), rent increases and rent decreases from the lease’s inception through the balance of the lease term.
(2) Average annualized base rent per square foot is calculated as the annualized base rent divided by the leased square feet.
For a discussion of our real estate portfolio, see Part I, Item 1, “Business” of this Annual Report on Form 10-K.
31
Portfolio Lease Expirations
The following table sets forth a schedule of expiring leases for our portfolio of real estate by rentable square footage and by annualized base rent as of December 31, 2017:
Year of Expiration | Number of Leases Expiring | Annualized Base Rent (1) (in thousands) | % of Portfolio Annualized Base Rent | Leased Rentable Square Feet Expiring | % of Portfolio Rentable Square Feet Expiring | |||||||||||
Month to Month | 57 | $ | 2,757 | 2.3 | % | 146,130 | 3.7 | % | ||||||||
2018 | 69 | 17,993 | 14.7 | % | 635,618 | 15.9 | % | |||||||||
2019 | 45 | 7,907 | 6.5 | % | 267,588 | 6.7 | % | |||||||||
2020 | 45 | 6,166 | 5.0 | % | 201,920 | 5.1 | % | |||||||||
2021 | 34 | 14,045 | 11.5 | % | 445,186 | 11.2 | % | |||||||||
2022 | 59 | 22,528 | 18.4 | % | 618,376 | 15.5 | % | |||||||||
2023 | 38 | 15,126 | 12.4 | % | 579,361 | 14.5 | % | |||||||||
2024 | 17 | 5,759 | 4.7 | % | 173,445 | 4.3 | % | |||||||||
2025 | 16 | 7,216 | 5.9 | % | 208,607 | 5.2 | % | |||||||||
2026 | 9 | 3,400 | 2.8 | % | 101,244 | 2.5 | % | |||||||||
2027 | 11 | 3,437 | 2.8 | % | 105,863 | 2.7 | % | |||||||||
Thereafter (2) | 28 | 15,858 | 13.0 | % | 507,890 | 12.7 | % | |||||||||
Total | 428 | $ | 122,192 | 100.0 | % | 3,991,228 | 100.0 | % | ||||||||
_____________________
(1) Annualized base rent represents annualized contractual base rental income as of December 31, 2017, adjusted to straight‑line any contractual tenant concessions (including free rent), rent increases and rent decreases from the lease’s inception through the balance of the lease term.
(2) Represents leases expiring from 2028 through 2031.
For more information with respect to our tenants, see Part I, Item 1, “Business” of this Annual Report on Form 10-K.
Concentration of Credit Risks
As of December 31, 2017, we had a concentration of credit risk related to the following tenant lease that represented more than 10% of our annualized base rent:
Annualized Base Rent Statistics | |||||||||||||||||||||
Tenant | Property | Tenant Industry | Square Feet | % of Portfolio (Net Rentable Sq. Ft.) | Annualized Base Rent (in thousands) (1) | % of Portfolio Annualized Base Rent | Annualized Base Rent per Sq. Ft. | Lease Expiration(2)(3) | |||||||||||||
Union Bank | Union Bank Plaza | Finance | 342,712 | 8.6% | $ | 13,020 | 10.7% | $ | 37.99 | 01/31/2022 | |||||||||||
_____________________
(1) Annualized base rent represents annualized contractual base rental income as of December 31, 2017, adjusted to straight-line any contractual tenant concessions (including free rent), rent increases and rent decreases from the lease’s inception through the balance of the lease term.
(2) Represents the expiration date of the lease as of December 31, 2017 and does not take into account any tenant renewal or termination options. On December 31, 2017, we entered into a lease amendment with Union Bank pursuant to which Union Bank will surrender 15,829 rentable square feet and 31,320 rentable square feet of its total rentable square footage by March 31, 2018 and June 30, 2018, respectively, and will surrender 321 parking area passes by March 31, 2018. As a result, we expect to receive a total of $11.4 million in termination fees from Union Bank payable in 2018.
(3) Union Bank has two options to extend the term of this lease for three, four, five, six or seven years per option term, provided that the combined renewal option terms do not exceed 10 years. If Union Bank elects to exercise its extension options, it must extend the lease on (i) the entire office premises or (ii) no less than 200,000 rentable square feet consisting of full floors only plus either all or none of both the retail and vault space.
No other tenant accounted for more than 10% of annualized base rent.
ITEM 3. | LEGAL PROCEEDINGS |
From time to time, we are party to legal proceedings that arise in the ordinary course of our business. Management is not aware of any legal proceedings of which the outcome is reasonably likely to have a material adverse effect on our results of operations or financial condition. Nor are we aware of any such legal proceedings contemplated by government authorities.
ITEM 4. | MINE SAFETY DISCLOSURES |
Not applicable.
32
PART II
ITEM 5. | MARKET FOR REGISTRANT’S COMMON EQUITY, RELATED STOCKHOLDER MATTERS AND ISSUER PURCHASES OF EQUITY SECURITIES |
Stockholder Information
As of March 5, 2018, we had approximately 187.5 million shares of common stock outstanding held by a total of approximately 47,300 stockholders. The number of stockholders is based on the records of DST Systems, Inc., which serves as our transfer agent.
Market Information
No public market currently exists for our shares of common stock, and we currently have no plans to list our shares on a national securities exchange. Until our shares are listed, if ever, our stockholders may not sell their shares unless the buyer meets the applicable suitability and minimum purchase requirements. Any sale must comply with applicable state and federal securities laws. In addition, our charter prohibits the ownership of more than 9.8% of our stock by a single person, unless exempted by our board of directors. Consequently, there is the risk that our stockholders may not be able to sell their shares at a time or price acceptable to them.
We provide an estimated value per share to assist broker-dealers that participated in our initial public offering in meeting their customer account statement reporting obligations under NASD Conduct Rule 2340 as required by FINRA. This valuation was performed in accordance with the provisions of and also to comply with the IPA Valuation Guidelines. For this purpose, we estimated the value of the shares of our common stock as $4.89 (unaudited) per share as of December 31, 2017. This estimated value per share is based on our board of directors’ approval on December 8, 2017 of an estimated value per share of our common stock of $4.89 (unaudited) based on the estimated value of our assets less the estimated value of our liabilities, or net asset value, divided by the number of shares outstanding, all as of September 30, 2017. There were no material changes between September 30, 2017 and December 8, 2017 that impacted the overall estimated value per share.
The conflicts committee, composed solely of all of our independent directors, is responsible for the oversight of the valuation process used to determine the estimated value per share of our common stock, including the review and approval of the valuation and appraisal processes and methodologies used to determine our estimated value per share, the consistency of the valuation and appraisal methodologies with real estate industry standards and practices and the reasonableness of the assumptions used in the valuations and appraisals. The estimated value per share was based upon the recommendation and valuation prepared by our advisor. Our advisor’s valuation of our ten real estate properties held as of September 30, 2017 was based on (i) appraisals of the Appraised Properties performed by CBRE, an independent third-party valuation firm, and (ii) the sales price less disposition costs and fees of one property sold subsequent to September 30, 2017. CBRE prepared appraisal reports, summarizing key inputs and assumptions, for each of the Appraised Properties. Our advisor performed valuations with respect to our real estate-related investment, cash, other assets, mortgage debt and other liabilities. The methodologies and assumptions used to determine the estimated value of our assets and the estimated value of our liabilities are described further below.
Our advisor used the appraised values of the Appraised Properties and the sales price less disposition costs and fees of the property sold subsequent to September 30, 2017, together with our advisor’s estimated value of each of our other assets and our liabilities, to calculate and recommend an estimated value per share of our common stock. Based on (i) the conflicts committee’s receipt and review of our advisor’s valuation report, including our advisor’s summary of the appraisal reports for the Appraised Properties prepared by CBRE and our advisor’s estimated value of each of our other assets and our liabilities, (ii) the conflicts committee’s review of the reasonableness of our estimated value per share resulting from our advisor’s valuation process, and (iii) other factors considered by the conflicts committee and the conflicts committee’s own extensive knowledge of our assets and liabilities, the conflicts committee concluded that the estimated value per share proposed by our advisor was reasonable and recommended to our board of directors that it adopt $4.89 (unaudited) as the estimated value per share of our common stock. The board of directors unanimously agreed to accept the recommendation of the conflicts committee and approved $4.89 (unaudited) as the estimated value per share of our common stock, which determination is ultimately and solely the responsibility of the board of directors.
33
The table below sets forth the calculation of our estimated value per share as of December 8, 2017, as well as the calculation of our prior estimated value per share as of December 14, 2016:
December 8, 2017 Estimated Value per Share | December 14, 2016 Estimated Value per Share (1) | Change in Estimated Value per Share | ||||||||||
Real estate properties (2) | $ | 7.28 | $ | 8.00 | $ | (0.72 | ) | |||||
Real estate-related investment | 0.07 | 0.07 | — | |||||||||
Cash | 0.40 | 0.31 | 0.09 | |||||||||
Other assets | 0.04 | 0.02 | 0.02 | |||||||||
Mortgage debt | (2.76 | ) | (2.79 | ) | 0.03 | |||||||
Other liabilities | (0.14 | ) | (0.12 | ) | (0.02 | ) | ||||||
Estimated value per share | $ | 4.89 | $ | 5.49 | $ | (0.60 | ) | |||||
Estimated enterprise value premium | None assumed | None assumed | None assumed | |||||||||
Total estimated value per share | $ | 4.89 | $ | 5.49 | $ | (0.60 | ) | |||||
_____________________
(1) The December 14, 2016 estimated value per share was based upon the recommendation and valuation of our advisor. Our advisor’s valuation of our real estate properties was based on appraisals of our 11 real estate properties held as of September 30, 2016 performed by CBRE. Our advisor performed valuations of our real estate-related investment, cash, other assets, mortgage debt and other liabilities. For more information relating to the December 14, 2016 estimated value per share and the assumptions and methodologies used by CBRE and our advisor, see our Current Report on Form 8-K filed with the SEC on December 15, 2016.
(2) The decrease in the estimated value of real estate properties per share was primarily due to decreases in the appraised values of the real estate properties and the sale of one real estate property, partially offset by capital expenditures subsequent to September 30, 2016.
The decrease in our estimated value per share from the previous estimate was primarily due to the items noted in the table below, which reflect the significant contributors to the decrease in the estimated value per share from $5.49 (unaudited) to $4.89 (unaudited). The changes are not equal to the change in values of each asset and liability group presented in the table above due to the sale of one real estate property, debt repayments and other factors, which caused the value of certain asset or liability groups to change with no impact to our fair value of equity or the overall estimated value per share.
Calculation of Estimated Value per Share | ||||
December 14, 2016 estimated value per share | $ | 5.49 | ||
Changes to estimated value per share | ||||
Real estate | ||||
Real estate properties | (0.52 | ) | ||
Selling costs related to property sold | (0.01 | ) | ||
Capital expenditures on real estate | (0.14 | ) | ||
Total change related to real estate | (0.67 | ) | ||
Operating cash flows in excess of monthly distributions declared (1) | 0.05 | |||
Notes payable | 0.02 | |||
Total change in estimated value per share | $ | (0.60 | ) | |
December 8, 2017 estimated value per share | $ | 4.89 | ||
_____________________
(1) Operating cash flow reflects modified funds from operations (“MFFO”) adjusted to add back the amortization of deferred financing costs. We compute MFFO in accordance with the definition included in the practice guideline issued by the IPA in November 2010.
34
As with any valuation methodology, the methodologies used are based upon a number of estimates and assumptions that may not be accurate or complete. Different parties using different assumptions and estimates could derive a different estimated value per share of our common stock, and this difference could be significant. The estimated value per share is not audited and does not represent the fair value of our assets less the fair value of our liabilities according to U.S. generally accepted accounting principles (“GAAP”), nor does it represent a liquidation value of our assets and liabilities or the price at which our shares of common stock would trade on a national securities exchange. The estimated value per share does not reflect a discount for the fact that we are externally managed, nor does it reflect a real estate portfolio premium/discount versus the sum of the individual property values. The estimated value per share also did not take into account estimated disposition costs and fees for real estate properties that were not under contract to sell, debt prepayment penalties that could apply upon the prepayment of certain of our debt obligations or the impact of restrictions on the assumption of debt. We have generally incurred disposition costs and fees related to the sale of each real estate property since inception of 1.7% to 4.4% of the gross sales price less concessions and credits, with the weighted average being approximately 2.3%. If this range of disposition costs and fees was applied to the estimated value of our real estate properties, which does not include these costs and fees in the appraised values, the resulting impact on the estimated value per share would be a decrease of $0.12 to $0.31 per share.
Our estimated value per share takes into consideration any potential liability related to a subordinated participation in cash flows our advisor is entitled to upon meeting certain stockholder return thresholds in accordance with the advisory agreement. For purposes of determining the estimated value per share, our advisor calculated the potential liability related to this incentive fee based on a hypothetical liquidation of the assets and liabilities at their estimated fair values, after considering the impact of any potential closing costs and fees related to the disposition of real estate properties, and determined that there would be no liability related to the subordinated participation in cash flows.
As of December 8, 2017, we had no potentially dilutive securities outstanding that would impact the estimated value per share of our common stock.
Methodology
Our goal for the valuation was to arrive at a reasonable and supportable estimated value per share, using a process that was designed to be in compliance with the IPA Valuation Guidelines and using what we and our advisor deemed to be appropriate valuation methodologies and assumptions. The following is a summary of the valuation and appraisal methodologies, assumptions and estimates used to value our assets and liabilities:
Real Estate
Independent Valuation Firm: CBRE(1) was selected by our advisor and approved by our conflicts committee and board of directors to appraise the Appraised Properties. CBRE is not affiliated with us or our advisor. The compensation we paid to CBRE was based on the scope of work and not on the appraised values of the Appraised Properties. The appraisals were performed in accordance with the Code of Ethics and the Uniform Standards of Professional Appraisal Practice, or USPAP, the real estate appraisal industry standards created by The Appraisal Foundation, as well as the requirements of the state where each real property is located. Each appraisal was reviewed, approved and signed by an individual with the professional designation of MAI (Member of the Appraisal Institute). The use of the reports is subject to the requirements of the Appraisal Institute relating to review by its duly authorized representatives.
CBRE collected all reasonably available material information that it deemed relevant in appraising the Appraised Properties. CBRE obtained property-level information from our advisor, including (i) property historical and projected operating revenues and expenses; (ii) property lease agreements; and (iii) information regarding recent or planned capital expenditures. CBRE reviewed and relied in part on the property-level information provided by our advisor and considered this information in light of its knowledge of each property’s specific market conditions.
_____________________
(1) CBRE is actively engaged in the business of appraising commercial real estate properties similar to those we own in connection with public securities offerings, private placements, business combinations and similar transactions. We engaged CBRE to deliver appraisal reports relating to the Appraised Properties and CBRE received fees upon the delivery of such reports. In addition, we have agreed to indemnify CBRE against certain liabilities arising out of this engagement. CBRE is an affiliate of CBRE Group, Inc., a parent holding company of affiliated companies that are engaged in the ordinary course of business in many areas related to commercial real estate and related services. In the two years prior to December 8, 2017, CBRE and its affiliates provided a number of commercial real estate, appraisal, valuation and financial advisory services for us and our affiliates and have received fees in connection with such services. CBRE and its affiliates may from time to time in the future perform other commercial real estate, appraisal, valuation and financial advisory services for us and our affiliates in transactions related to the properties that are the subjects of the appraisals, so long as such other services do not adversely affect the independence of the applicable CBRE appraiser as certified in the applicable appraisal report.
In the ordinary course of its business, CBRE and its affiliates, directors and officers may structure and effect transactions for their own accounts or for the accounts of their customers in commercial real estate assets of the same kind and in the same markets as our assets.
35
In conducting its investigation and analyses, CBRE took into account customary and accepted financial and commercial procedures and considerations as it deemed relevant. Although CBRE reviewed information supplied or otherwise made available by us or our advisor for reasonableness, it assumed and relied upon the accuracy and completeness of all such information and of all information supplied or otherwise made available to it by any other party and did not independently verify any such information. With respect to operating or financial forecasts and other information and data provided to or otherwise reviewed by or discussed with CBRE, CBRE assumed that such forecasts and other information and data were reasonably prepared in good faith on bases reflecting the best currently available estimates and judgments of our management and/or our advisor. CBRE relied on us to advise it promptly if any information previously provided became inaccurate or was required to be updated during the period of its review.
In performing its analyses, CBRE made numerous other assumptions as of various points in time with respect to industry performance, general business, economic and regulatory conditions and other matters, many of which are beyond its and our control, as well as certain factual matters. For example, unless specifically informed to the contrary, CBRE assumed that we had clear and marketable title to the Appraised Properties, that no title defects existed, that any improvements were made in accordance with law, that no hazardous materials were present or had been present previously, that no deed restrictions existed, and that no changes to zoning ordinances or regulations governing use, density or shape were pending or being considered. Furthermore, CBRE’s analyses, opinions and conclusions were necessarily based upon market, economic, financial and other circumstances and conditions existing as of or prior to the date of the appraisal, and any material change in such circumstances and conditions may affect CBRE’s analyses and conclusions. CBRE’s appraisal reports contain other assumptions, qualifications and limitations that qualify the analyses, opinions and conclusions set forth therein. Furthermore, the prices at which the Appraised Properties may actually be sold could differ from their appraised values.
Although CBRE considered any comments to its appraisal reports received from us or our advisor, the final appraised values of the Appraised Properties were determined by CBRE. The appraisal reports for the Appraised Properties are addressed solely to us to assist our advisor in calculating and recommending an updated estimated value per share of our common stock. The appraisal reports are not addressed to the public and may not be relied upon by any other person to establish an estimated value per share of our common stock and do not constitute a recommendation to any person to purchase or sell any shares of our common stock. In preparing its appraisal reports, CBRE did not solicit third-party indications of interest for the Appraised Properties. In preparing its appraisal reports, CBRE also did not, and was not requested to, solicit third-party indications of interest for our common stock in connection with possible purchases thereof or the acquisition of all or any part of us. While CBRE was responsible for providing appraisals for the Appraised Properties, CBRE was not responsible for, did not calculate, and did not participate in, the determination of the estimated value per share of our common stock.
The foregoing is a summary of the standard assumptions, qualifications and limitations that generally apply to CBRE’s appraisal reports. All of the CBRE appraisal reports, including the analyses, opinions and conclusions set forth in such reports, are qualified by the assumptions, qualifications and limitations set forth in the respective appraisal reports.
Real Estate Valuation
As of September 30, 2017, we owned ten real estate properties (consisting of nine office properties and an office campus consisting of eight office buildings). CBRE appraised each of the Appraised Properties and the property sold subsequent to September 30, 2017 was valued at the sales price less disposition costs and fees. CBRE appraised the Appraised Properties using various methodologies including the direct capitalization approach, discounted cash flow analyses and sales comparison approach and relied primarily on 10-year discounted cash flow analyses for the final appraisal of each of the Appraised Properties. CBRE calculated the discounted cash flow value of the Appraised Properties using property-level cash flow estimates, terminal capitalization rates and discount rates that fall within ranges it believes would be used by similar investors to value the Appraised Properties based on recent comparable market transactions adjusted for unique property and market-specific factors.
The total appraised value of the Appraised Properties as of September 30, 2017 was $1.329 billion. The estimated value for our real estate property sold subsequent to September 30, 2017 was $37.8 million. Based on the appraisal and valuation methodologies described above, the estimated value of our ten real estate properties as of September 30, 2017 was $1.366 billion. The total cost basis of these properties as of September 30, 2017 was $1.577 billion. This amount includes the purchase price of $1.360 billion, $198.5 million in capital expenditures, leasing commissions and tenant improvements since inception and $18.1 million of acquisition fees and expenses. The estimated value of our ten real estate properties as of September 30, 2017 compared to the total acquisition cost of these properties plus subsequent capital expenditures, leasing commissions and tenant improvements and acquisition fees and expenses through September 30, 2017, results in an overall decrease in the real estate value of the properties of approximately 13.34%.
36
The following table summarizes the key assumptions that CBRE used in the 10-year discounted cash flow models to arrive at the appraised values for the Appraised Properties:
Range in Values | Weighted-Average Basis | ||
Terminal capitalization rate | 6.50% to 8.25% | 7.06% | |
Discount rate | 7.50% to 9.50% | 8.17% | |
Net operating income compounded annual growth rate (1) | (2.09)% to 18.66% | 4.15% | |
_____________________
(1) The net operating income compounded annual growth rates (“CAGRs”) reflect both the contractual and market rents and reimbursements (in cases where the contractual lease period is less than the hold period of the property) net of expenses over the holding period. The range of CAGRs shown is the constant annual rate at which the net operating income is projected to grow to reach the net operating income in the final year of the hold period for each of the properties. The high-end range in values reflects the lease up of a property with significant vacancy and that was 46% leased as of September 30, 2017.
While we believe that CBRE’s assumptions and inputs are reasonable, a change in these assumptions and inputs would significantly impact the appraised value of the Appraised Properties and thus, our estimated value per share. The table below illustrates the impact on the estimated value per share if the terminal capitalization rates or discount rates CBRE used to appraise the Appraised Properties were adjusted by 25 basis points, assuming all other factors remain unchanged. Additionally, the table below illustrates the impact on our estimated value per share if the terminal capitalization rates or discount rates were adjusted by 5% in accordance with the IPA Valuation Guidelines, assuming all other factors remain unchanged:
Increase (Decrease) on the Estimated Value per Share due to | ||||||||||||||||
Decrease of 25 basis points | Increase of 25 basis points | Decrease of 5% | Increase of 5% | |||||||||||||
Terminal capitalization rates | $ | 0.16 | $ | (0.15 | ) | $ | 0.23 | $ | (0.21 | ) | ||||||
Discount rates | 0.14 | (0.14 | ) | 0.23 | (0.22 | ) | ||||||||||
Finally, each 1% change in the appraised value of the Appraised Properties would result in a change of $0.07 to the estimated value per share, assuming all other factors remain unchanged.
Real Estate Loan Receivable
As of September 30, 2017, we owned one real estate loan receivable. The estimated value for our real estate loan receivable is equal to the GAAP fair value disclosed in our Quarterly Report on Form 10-Q for the period ended September 30, 2017, but does not equal the book value of the loan in accordance with GAAP. The value of the real estate loan receivable was estimated by applying a discounted cash flow analysis over the remaining expected life of the investment, excluding any potential transaction costs. The cash flow estimate used in the analysis during the term of the investment was based on the investment’s contractual cash flow, which we anticipate we will receive. The expected cash flow for the loan was discounted at a rate that we expect a market participant would require for an instrument with similar characteristics, including remaining loan term, loan-to-value ratio, type of collateral, current performance, credit enhancements and other factors.
The cost of our real estate loan receivable was $14.0 million, including $23,000 of origination fees and costs and $0.5 million of principal repayments. As of September 30, 2017, the fair value of our real estate loan receivable was $13.9 million and the outstanding principal balance was $14.0 million. The discount rate applied to the cash flow from the real estate loan receivable, which has a remaining term of 0.8 years, was approximately 7.75%. Similar to the valuation for real estate, a change in the assumptions and inputs would change the fair value of our real estate loan receivable and thus, our estimated value per share. Assuming all other factors remain unchanged, a decrease or increase in the discount rates of 25 basis points would have no impact on the estimated value per share and, additionally, a 5% decrease or increase in the discount rates would have no impact on the estimated value per share.
Notes Payable
The estimated values of our notes payable are equal to the GAAP fair values disclosed in our Quarterly Report on Form 10-Q for the period ended September 30, 2017. The estimated value of our notes payable does not equal the book value of the loans in accordance with GAAP. The GAAP fair values of our notes payable were determined using a discounted cash flow analysis. The discounted cash flow analysis was based on projected cash flow over the remaining loan terms, including extensions we expect to exercise, and on management’s estimates of current market interest rates for instruments with similar characteristics, including remaining loan term, loan-to-value ratio and type of collateral.
37
As of September 30, 2017, the GAAP fair value and carrying value of our notes payable were $519.1 million and $521.3 million, respectively. The weighted-average discount rate applied to the future estimated debt payments was approximately 3.75%. Our notes payable have a weighted-average remaining term of one year. The table below illustrates the impact on our estimated value per share if the discount rates were adjusted by 25 basis points, assuming all other factors remain unchanged, with respect to our notes payable. Additionally, the table below illustrates the impact on the estimated value per share if the discount rates were adjusted by 5% in accordance with the IPA Valuation Guidelines, assuming all other factors remain unchanged:
Increase (Decrease) on the Estimated Value per Share due to | ||||||||||||||||
Decrease of 25 basis points | Increase of 25 basis points | Decrease of 5% | Increase of 5% | |||||||||||||
Discount rates | $ | (0.01 | ) | $ | 0.01 | $ | — | $ | — | |||||||
Other Assets and Liabilities
The carrying values of a majority of our other assets and liabilities are considered to equal their fair value due to their short maturities or liquid nature. Certain balances, such as straight-line rent receivables, lease intangible assets and liabilities, capital expenditures payable, deferred financing costs, unamortized lease commissions and unamortized lease incentives, have been eliminated for the purpose of the valuation due to the fact that the values of those balances were already considered in the valuation of the related asset or liability. Our advisor has also excluded redeemable common stock, as temporary equity does not represent a true liability to us and the shares that this amount represents are included in our total outstanding shares of common stock for purposes of calculating the estimated value per share of our common stock.
Limitations of the Estimated Value Per Share
As mentioned above, we are providing this estimated value per share to assist broker dealers that participated in our initial public offering in meeting their customer account statement reporting obligations. This valuation was performed in accordance with the provisions of and also to comply with the IPA Valuation Guidelines. The estimated value per share set forth above first appeared on the December 31, 2017 customer account statements that were mailed in January 2018. As with any valuation methodology, the methodologies used are based upon a number of estimates and assumptions that may not be accurate or complete. Different parties with different assumptions and estimates could derive a different estimated value per share of our common stock, and this difference could be significant. The estimated value per share is not audited and does not represent the fair value of our assets less the fair value of our liabilities according to GAAP.
Accordingly, with respect to the estimated value per share, we can give no assurance that:
• | a stockholder would be able to resell his or her shares at this estimated value per share; |
• | a stockholder would ultimately realize distributions per share equal to our estimated value per share upon liquidation of our assets and settlement of our liabilities or a sale of our company; |
• | our shares of common stock would trade at the estimated value per share on a national securities exchange; |
• | an independent third-party appraiser or other third-party valuation firm would agree with our estimated value per share; or |
• | the methodology used to calculate our estimated value per share would be acceptable to FINRA or for compliance with ERISA reporting requirements. |
Further, the estimated value per share as of December 8, 2017 is based on the estimated value of our assets less the estimated value of our liabilities divided by the number of shares outstanding, all as of September 30, 2017. The value of our shares will fluctuate over time in response to developments related to individual assets in our portfolio and the management of those assets, in response to the real estate and finance markets and due to other factors. The estimated value per share does not reflect a discount for the fact that we are externally managed, nor does it reflect a real estate portfolio premium/discount versus the sum of the individual property values. The estimated value per share did not take into account estimated disposition costs and fees for real estate properties that were not under contract to sell, debt prepayment penalties that could apply upon the prepayment of certain of our debt obligations or the impact of restrictions on the assumption of debt. We have generally incurred disposition costs and fees related to the sale of each real estate property since inception of 1.7% to 4.4% of the gross sales price less concessions and credits, with the weighted average being approximately 2.3%. If this range of disposition costs and fees was applied to the estimated value of our real estate properties, which does not include these costs and fees in the appraised values, the resulting impact on the estimated value per share would be a decrease of $0.12 to $0.31 per share. We currently expect to utilize our advisor and/or an independent valuation firm to update the estimated value per share no later than December 2018.
38
Historical Estimated Values per Share
The historical reported estimated values per share of our common stock approved by our board of directors are set forth below:
Estimated Value per Share | Effective Date of Valuation | Filing with the Securities and Exchange Commission | ||
$5.49 | December 14, 2016 | Current Report on Form 8-K, filed December 15, 2016 | ||
$5.62 | December 8, 2015 | Current Report on Form 8-K, filed December 9, 2015 | ||
$5.86 | December 4, 2014 | Current Report on Form 8-K, filed December 4, 2014 | ||
$6.05 (1) | September 22, 2014 | Current Report on Form 8-K, filed September 23, 2014 | ||
$10.29 | December 18, 2013 | Current Report on Form 8-K, filed December 19, 2013 | ||
$10.29 | December 18, 2012 | Current Report on Form 8-K, filed December 19, 2012 | ||
$10.11 | December 19, 2011 | Current Report on Form 8-K, filed December 21, 2011 | ||
_____________________
(1) The estimated value per share of $6.05 resulted, in part, from the payment of a special distribution of $4.50 per share of common stock to stockholders of record as of September 15, 2014. Excluding the impact of the special distribution, our estimated value per share of common stock would have been $10.55 as of September 22, 2014. Our board of directors declared special distributions in the amount of $3.75, $0.30 and $0.45 per share on the outstanding shares of our common stock on July 8, 2014, August 5, 2014 and August 29, 2014, respectively, for an aggregate amount of $4.50 per share of common stock, to all stockholders of record as of the close of business on September 15, 2014. These special distributions were paid on September 23, 2014 and were funded from our proceeds from the disposition of nine real estate properties between May 2014 and August 2014 as well as cash on hand resulting primarily from the repayment or sale of five real estate loans receivable during 2013 and 2014.
Distribution Information
Over the long term, we expect that our distributions will generally be paid from cash flow from operations and FFO from current or prior periods (except with respect to distributions related to sales of our real estate properties and distributions related to the repayment of principal under our mortgage loan investment).
During the year ended December 31, 2017, we sold two office properties. During the year ended December 31, 2016, we sold one office/flex property, and during the year ended December 31, 2015, we sold one office property and received the repayment of one of our real estate loans receivable. Our cash flow from operations has decreased and will continue to decrease as a result of our disposition activity, and we have adjusted our distribution policy with respect to the amount of monthly distribution payments to take into account our disposition activity and current real estate investments. We may continue to make additional strategic asset sales as opportunities become available in the market and may further adjust our distribution policy as a result. Our focus in 2018 is to: continue to strategically sell assets and consider paying special distributions to stockholders; negotiate lease renewals or new leases that facilitate the sales process and enhance property stability for prospective buyers; complete capital projects, such as renovations or amenity enhancements, to attract quality buyers; and finalize the strategic alternatives assessment and decide on a course of action. Any future special distributions we make from the proceeds of future dispositions will reduce our estimated value per share and this reduction will be reflected in our updated estimated value per share, which we expect to update no later than December 2018.
Our operating performance and ability to pay distributions from our cash flow from operations and/or the disposition of our assets cannot be accurately predicted and may deteriorate in the future due to numerous factors, including those discussed under “Forward-Looking Statements,” Part I, Item 1A, “Risk Factors,” Part II, Item 7, “Management’s Discussion and Analysis of Financial Condition and Results of Operations — Liquidity and Capital Resources” and “ — Results of Operations” herein. Those factors include: the future operating performance of our investments in the existing real estate and financial environment; the success and economic viability of our tenants; the ability of our borrower to continue to make debt service payments and/or to repay its loan upon maturity; our ability to refinance existing indebtedness at comparable terms; changes in interest rates on our variable rate debt obligations; our ability to successfully dispose of additional assets; and the sources and amounts of cash we have available for distributions.
Our board has the authority under our organizational documents, to the extent permitted by Maryland law, to pay distributions from any source. Our board of directors has not pre-established a percentage range of return for distributions to stockholders or a minimum distribution level, and our charter does not require that we pay distributions to our stockholders. The rate will be determined by our board of directors based on our financial condition and such other factors as our board of directors deems relevant.
39
We have elected to be taxed as a REIT under the Internal Revenue Code and have operated as such beginning with our taxable year ended December 31, 2008. To maintain our qualification as a REIT, we must meet certain organizational and operational requirements, including a requirement to distribute at least 90% of our REIT taxable income (computed without regard to the dividends-paid deduction or net capital gain and which does not necessarily equal net income as calculated in accordance with GAAP). Our board of directors may authorize distributions in excess of those required for us to maintain REIT status depending on our financial condition and such other factors as our board of directors deems relevant.
Distributions declared per common share were $0.274 and $0.281 in the aggregate for the years ended December 31, 2017 and 2016, respectively. Distributions per common share were based on a monthly record date for each month during the period commencing January 2016 through December 2017.
Distributions declared during 2016 and 2017, aggregated by quarter, are as follows (dollars in thousands, except per share amounts):
2017 | |||||||||||||||||||
1st Quarter | 2nd Quarter | 3rd Quarter | 4th Quarter | Total | |||||||||||||||
Total Distributions Declared | $ | 12,770 | $ | 12,896 | $ | 13,013 | $ | 12,993 | $ | 51,672 | |||||||||
Total Per Share Distribution | $ | 0.068 | $ | 0.068 | $ | 0.069 | $ | 0.069 | $ | 0.274 | |||||||||
2016 | |||||||||||||||||||
1st Quarter | 2nd Quarter | 3rd Quarter | 4th Quarter | Total | |||||||||||||||
Total Distributions Declared | $ | 13,235 | $ | 13,218 | $ | 13,350 | $ | 13,337 | $ | 53,140 | |||||||||
Total Per Share Distribution | $ | 0.070 | $ | 0.070 | $ | 0.070 | $ | 0.071 | $ | 0.281 | |||||||||
The tax composition of our distributions declared for the years ended December 31, 2017 and 2016 was as follows:
2017 | 2016 | |||||
Ordinary Income | 36 | % | 38 | % | ||
Capital Gain | 4 | % | 15 | % | ||
Return of Capital | 60 | % | 47 | % | ||
Total | 100 | % | 100 | % | ||
For more information with respect to our distributions paid, see Part II, Item 7, “Management’s Discussion and Analysis of Financial Condition and Results of Operations — Distributions.”
On December 6, 2017, our board of directors authorized a January 2018 distribution in the amount of $0.02076575 per share of common stock to stockholders of record as of the close of business on January 19, 2018, which we paid on February 1, 2018. On January 30, 2018, our board of directors authorized a February 2018 distribution in the amount of $0.01875616 per share of common stock to stockholders of record as of the close of business on February 20, 2018, which we paid on March 1, 2018, and a March 2018 distribution in the amount of $0.02076575 per share of common stock to stockholders of record as of the close of business on March 20, 2018, which we expect to pay in April 2018. On March 7, 2018, our board of directors authorized an April 2018 distribution in the amount of $0.02009589 per share of common stock to stockholders of record as of the close of business on April 20, 2018, which we expect to pay in May 2018, and a May 2018 distribution in the amount of $0.02076575 per share of common stock to stockholders of record as of the close of business on May 18, 2018, which we expect to pay in June 2018. Other than special distributions, distributions are generally paid on or about the first business day of the following month.
Unregistered Sales of Equity Securities
During the fiscal year ended December 31, 2017, we did not sell any equity securities that were not registered under the Securities Act of 1933.
40
Share Redemption Program
Our share redemption program provides only for redemptions sought upon a stockholder’s death, “qualifying disability” or “determination of incompetence” (each as defined in the share redemption program document, and together with redemptions sought in connection with a stockholder’s death, “Special Redemptions”). Such redemptions are subject to the limitations described in the share redemption program document, including:
• | During each calendar year, Special Redemptions are limited to an annual dollar amount determined by the board of directors, which may be reviewed during the year and increased or decreased upon ten business days’ notice to our stockholders. We may provide notice by including such information (a) in a Current Report on Form 8-K or in our annual or quarterly reports, all publicly filed with the Securities and Exchange Commission or (b) in a separate mailing to the stockholders. On December 9, 2016, the board of directors approved the dollar amount limitation for Special Redemptions for calendar year 2017 of $10.0 million in the aggregate. On December 6, 2017, our board of directors approved the same annual dollar limitation of $10.0 million in the aggregate for the calendar year 2018 (subject to review and adjustment during the year by the board of directors), and further subject to the limitations described in the share redemption program. |
• | During any calendar year, we may redeem no more than 5% of the weighted-average number of shares outstanding during the prior calendar year. |
• | We have no obligation to redeem shares if the redemption would violate the restrictions on distributions under Maryland General Corporation Law, as amended from time to time, which prohibits distributions that would cause a corporation to fail to meet statutory tests of solvency. |
If we cannot repurchase all shares presented for redemption in any month because of the limitations on redemptions set forth in our share redemption program, then we will honor redemption requests on a pro rata basis, except that if a pro rata redemption would result in a stockholder owning less than the minimum purchase requirement described in our currently effective, or our most recently effective, registration statement as such registration statement has been amended or supplemented, then we would redeem all of such stockholder’s shares.
Upon a transfer of shares, any pending redemption requests with respect to such transferred shares will be canceled as of the date the transfer is accepted by us. Stockholders wishing to continue to have a redemption request related to any transferred shares considered by us must resubmit their redemption request.
Pursuant to the share redemption program, redemptions made in connection with Special Redemptions are made at a price per share equal to the most recent estimated value per share of our common stock as of the applicable redemption date. We do not currently expect to have funds available for ordinary redemptions in the future.
On December 14, 2016, our board of directors approved an estimated value per share of our common stock of $5.49 (unaudited) based on the estimated value of our assets less the estimated value of our liabilities, divided by the number of shares outstanding, all as of September 30, 2016. The change in the redemption price became effective for the December 2016 redemption date, which was December 30, 2016, and was effective through the November 2017 redemption date. For a full description of the methodologies used to value our assets and liabilities in connection with the calculation of the December 2016 estimated value per share, see our Current Report on Form 8-K, filed with the SEC on December 15, 2016.
On December 8, 2017, our board of directors approved an estimated value per share of our common stock of $4.89 (unaudited) based on the estimated value of our assets less the estimated value of our liabilities, divided by the number of shares outstanding, all as of September 30, 2017. The change in the redemption price became effective for the December 2017 redemption date, which was December 29, 2017, and will be effective until the estimated value per share is updated. We expect to utilize our advisor and/or an independent valuation firm to update the estimated value per share no later than December 2018. For a full description of the methodologies used to value our assets and liabilities in connection with the calculation of the estimated value per share, see Part II, Item 5, “Market for Registrant’s Common Equity, Related Stockholder Matters and Issuer Purchases of Equity Securities — Market Information.”
We may amend, suspend or terminate our share redemption program upon 30 days’ notice to our stockholders, provided that we may increase or decrease the funding available for the redemption of shares under the program upon ten business days’ notice to our stockholders. We may provide this notice by including such information (a) in a Current Report on Form 8-K or in our annual or quarterly reports, all publicly filed with the SEC or (b) in a separate mailing to our stockholders.
41
The only redemptions we made under our share redemption program during the year ended December 31, 2017 were those that qualified as, and met the requirements for, Special Redemptions under our share redemption program, and we fulfilled all redemption requests that qualified as Special Redemptions under our share redemption program. We funded redemptions during the year ended December 31, 2017 with existing cash on hand. During the year ended December 31, 2017, we redeemed shares pursuant to our share redemption program as follows:
Month | Total Number of Shares Redeemed (1) | Average Price Paid Per Share (2) | Approximate Dollar Value of Shares Available That May Yet Be Redeemed Under the Program | ||||||
January 2017 | 54,480 | $ | 5.49 | (3) | |||||
February 2017 | 79,674 | $ | 5.49 | (3) | |||||
March 2017 | 55,953 | $ | 5.49 | (3) | |||||
April 2017 | 88,642 | $ | 5.49 | (3) | |||||
May 2017 | 82,827 | $ | 5.49 | (3) | |||||
June 2017 | 152,829 | $ | 5.49 | (3) | |||||
July 2017 | 125,633 | $ | 5.49 | (3) | |||||
August 2017 | 99,892 | $ | 5.49 | (3) | |||||
September 2017 | 97,910 | $ | 5.49 | (3) | |||||
October 2017 | 122,981 | $ | 5.49 | (3) | |||||
November 2017 | 64,959 | $ | 5.49 | (3) | |||||
December 2017 | 27,870 | $ | 4.89 | (3) | |||||
Total | 1,053,650 | ||||||||
_____________________
(1) We announced the adoption and commencement of the program on April 8, 2008. We announced amendments to the program on May 13, 2009 (which amendment became effective on June 12, 2009), on March 11, 2011 (which amendment became effective on April 10, 2011), on May 18, 2012 (which amendment became effective on June 17, 2012), on June 29, 2012 (which amendment became effective on July 29, 2012), on October 18, 2012 (which amendment became effective on November 17, 2012), on March 8, 2013 (which amendment became effective on April 7, 2013), on October 17, 2013 (which amendment became effective on November 16, 2013) and on May 19, 2014 (which amendment became effective on June 18, 2014).
(2) During the year ended December 31, 2017, shares eligible for redemption were redeemed at the prices set forth above.
(3) We limit the dollar value of shares that may be redeemed under the share redemption program as described above. During the year ended December 31, 2017, we redeemed $5.8 million of shares of common stock. For the year ended December 31, 2017, we fulfilled all redemption requests received in good order and eligible for redemption through the December 2017 redemption date. On December 6, 2017, our board of directors approved an annual dollar limitation for Special Redemptions of $10.0 million in the aggregate for the calendar year 2018. Based on the redemption limitations described above in our share redemption program and redemptions through February 28, 2018, we may redeem up to $9.3 million of shares in connection with Special Redemptions for the remainder of 2018.
42
ITEM 6. | SELECTED FINANCIAL DATA |
The following selected financial data as of and for the years ended December 31, 2017, 2016, 2015, 2014 and 2013 should be read in conjunction with the accompanying consolidated financial statements and related notes thereto and Part II, Item 7, “Management’s Discussion and Analysis of Financial Condition and Results of Operations” (in thousands, except share and per share amounts):
As of December 31, | ||||||||||||||||||||
2017 | 2016 | 2015 | 2014 | 2013 | ||||||||||||||||
Balance Sheet Data | ||||||||||||||||||||
Total real estate and real estate-related investments, net | $ | 1,044,792 | $ | 1,139,815 | $ | 1,192,512 | $ | 1,389,608 | $ | 2,620,088 | ||||||||||
Total assets | 1,225,110 | 1,286,780 | 1,364,530 | 1,654,323 | 2,946,499 | |||||||||||||||
Total notes payable, net | 502,299 | 523,771 | 546,077 | 787,418 | 1,513,551 | |||||||||||||||
Total liabilities | 530,528 | 559,873 | 596,600 | 844,796 | 1,606,455 | |||||||||||||||
Redeemable common stock | 10,000 | 10,000 | 10,000 | 10,000 | 70,562 | |||||||||||||||
Total stockholders’ equity | 684,582 | 716,907 | 757,930 | 799,527 | 1,269,482 | |||||||||||||||
For the Years Ended December 31, | ||||||||||||||||||||
2017 | 2016 | 2015 | 2014 | 2013 | ||||||||||||||||
Operating Data | ||||||||||||||||||||
Total revenues | $ | 149,459 | $ | 155,456 | $ | 165,295 | $ | 279,400 | $ | 360,634 | ||||||||||
Income from continuing operations (1) | 25,114 | 16,747 | 18,377 | 445,507 | 55,779 | |||||||||||||||
Income from continuing operations per common share - basic and diluted (1) | 0.13 | 0.09 | 0.10 | 2.33 | 0.29 | |||||||||||||||
Net income | 25,114 | 16,747 | 18,377 | 445,507 | 55,779 | |||||||||||||||
Net income per common share, basic and diluted | 0.13 | 0.09 | 0.10 | 2.33 | 0.29 | |||||||||||||||
Other Data | ||||||||||||||||||||
Cash flows provided by operations | 52,845 | 54,392 | 42,189 | 67,226 | 133,146 | |||||||||||||||
Cash flows provided by (used in) investing activities | 65,923 | 2,940 | 157,128 | 1,657,313 | (71,706 | ) | ||||||||||||||
Cash flows (used in) provided by financing activities | (80,134 | ) | (82,116 | ) | (306,598 | ) | (1,719,670 | ) | 65,212 | |||||||||||
Distributions declared | 51,672 | 53,140 | 55,737 | 966,916 | 135,384 | |||||||||||||||
Distributions declared per common share (2) | 0.274 | 0.281 | 0.293 | 5.066 | 0.704 | |||||||||||||||
Weighted -average number of common shares outstanding, basic and diluted | 188,235,450 | 189,111,086 | 190,227,577 | 191,346,949 | 192,370,985 | |||||||||||||||
Reconciliation of funds from operations (3) | ||||||||||||||||||||
Net income | $ | 25,114 | $ | 16,747 | $ | 18,377 | $ | 445,507 | $ | 55,779 | ||||||||||
Depreciation of real estate assets | 36,271 | 36,770 | 33,235 | 40,408 | 58,157 | |||||||||||||||
Amortization of lease-related costs | 17,776 | 21,998 | 23,036 | 37,580 | 62,621 | |||||||||||||||
Impairment charge on real estate | — | — | 23,082 | 15,601 | — | |||||||||||||||
Gain on payoff or sale of real estate loans receivable | — | — | — | — | (29,073 | ) | ||||||||||||||
Gain on sales of real estate, net | (17,486 | ) | (9,093 | ) | (27,421 | ) | (441,640 | ) | — | |||||||||||
Loss on sale of marketable securities | — | — | — | 331 | — | |||||||||||||||
FFO | $ | 61,675 | $ | 66,422 | $ | 70,309 | $ | 97,787 | $ | 147,484 | ||||||||||
_____________________
(1) Amounts include certain properties in continuing operations that were sold as of December 31, 2017 in accordance with ASU No. 2014-08, Presentation of Financial Statements (Topic 205) and Property, Plant and Equipment (Topic 360). See Note 6. “Real Estate Sales,” for more information on the Company's real estate sold as of December 31, 2017.
(2) For more information related to distributions declared per common share for the years ended December 31, 2017 and 2016, see Part II, Item 5, “Market for Registrant’s Common Equity, Related Stockholder Matters and Issuer Purchases of Equity Securities - Distribution Information.”
(3) We believe that funds from operations (“FFO”) is a beneficial indicator of the performance of an equity REIT. We compute FFO in accordance with the current National Association of Real Estate Investment Trusts (“NAREIT”) definition. FFO represents net income, excluding gains and losses from sales of operating real estate assets (which can vary among owners of identical assets in similar conditions based on historical cost accounting and useful-life estimates), impairment losses on real estate assets, depreciation and amortization of real estate assets, and adjustments for unconsolidated partnerships and joint ventures. We believe FFO facilitates comparisons of operating performance between periods and among other REITs. However, our computation of FFO may not be comparable to other REITs that do not define FFO in accordance with the NAREIT definition or that interpret the current NAREIT definition differently than we do. Our management believes that historical cost accounting for real estate assets in accordance with U.S. generally accepted accounting principles (“GAAP”) implicitly assumes that the value of real estate assets diminishes predictably over time. Since real estate values have historically risen or fallen with market conditions, many industry investors and analysts have considered the presentation of operating results for real estate companies that use historical cost accounting to be insufficient by themselves. As a result, we believe that the use of FFO, together with the required GAAP presentations, provides a more complete understanding of our performance relative to our competitors and a more informed and appropriate basis on which to make decisions involving operating, financing, and investing activities.
FFO is a non-GAAP financial measure and does not represent net income as defined by GAAP. Net income as defined by GAAP is the most relevant measure in determining our operating performance because FFO includes adjustments that investors may deem subjective, such as adding back expenses such as depreciation and amortization. Accordingly, FFO should not be considered as an alternative to net income as an indicator of our operating performance.
43
ITEM 7. | MANAGEMENT’S DISCUSSION AND ANALYSIS OF FINANCIAL CONDITION AND RESULTS OF OPERATIONS |
The following discussion and analysis should be read in conjunction with the “Selected Financial Data” above and our accompanying consolidated financial statements and the notes thereto. Also see “Forward-Looking Statements” preceding Part I and Part I, Item 1A, “Risk Factors.”
Overview
We were formed on July 12, 2007 as a Maryland corporation that elected to be taxed as a real estate investment trust (“REIT”) beginning with the taxable year ended December 31, 2008 and we intend to continue to operate in such a manner. We conduct our business primarily through our Operating Partnership, of which we are the sole general partner. Subject to certain restrictions and limitations, our business is managed by our advisor, KBS Capital Advisors LLC, pursuant to an advisory agreement. KBS Capital Advisors conducts our operations and manages our portfolio of real estate and real estate-related investments. Our advisor owns 20,000 shares of our common stock. We have no paid employees.
We invested in a diverse portfolio of real estate and real estate-related investments. As of December 31, 2017, we owned nine real estate properties (consisting of eight office properties and an office campus consisting of eight office buildings) and one real estate loan receivable.
On September 27, 2007, we filed a registration statement on Form S-11 with the SEC to offer a maximum of 280,000,000 shares of common stock for sale to the public, of which 200,000,000 shares were registered in our primary offering and 80,000,000 shares were registered under our dividend reinvestment plan. We ceased offering shares of common stock in our primary offering on December 31, 2010. We sold 182,681,633 shares of common stock in our primary offering for gross offering proceeds of $1.8 billion. We terminated the offering under our dividend reinvestment plan effective May 29, 2014. We sold 30,903,504 shares of common stock under our dividend reinvestment plan for gross offering proceeds of $298.2 million. Also as of December 31, 2017, we had redeemed 25,938,835 shares sold in our offering for $245.8 million.
On January 27, 2016, our board of directors formed the Special Committee composed of all of our independent directors to explore the availability of strategic alternatives involving us. As part of the process of exploring strategic alternatives, on February 23, 2016, the Special Committee engaged Evercore to act as our financial advisor and to assist us and the Special Committee with this process. Under the terms of the engagement, Evercore provided various financial advisory services, as requested by the Special Committee as customary for an engagement in connection with exploring strategic alternatives. Although the Special Committee engaged Evercore to assist us and the Special Committee with the exploration of strategic alternatives for us, we are not obligated to enter into any particular transaction or any transaction at all.
The Special Committee determined that it would be in our best interest and the best interest of our stockholders to market some of our assets for sale while it continues to explore strategic alternatives for us. Based on the results of this sales effort, the board of directors may conclude that it would be in our best interest and the best interest of our stockholders to sell additional assets and, depending on the scope of the proposed asset sales, thereafter to adopt a plan of liquidation that would involve the sale of our remaining assets. In the event of such a determination, the proposed plan of liquidation would be presented to our stockholders for approval. The board of directors anticipates reaching a decision regarding strategic alternatives during 2018. Although we are exploring strategic alternatives and are marketing some of our assets for sale, there is no assurance that this process will result in stockholder liquidity, or provide a return to stockholders that equals or exceeds our estimated value per share.
Our charter requires that we seek stockholder approval of our liquidation if our shares of common stock are not listed on a national securities exchange by March 31, 2018, unless a majority of our independent directors determines that liquidation is not then in the best interest of our stockholders. On March 7, 2018, the conflicts committee unanimously determined to postpone approval of our liquidation while the Special Committee continues to explore strategic alternatives for us. Our charter requires that the conflicts committee revisit the issue of liquidation at least annually.
Our focus in 2018 is to: continue to strategically sell assets and consider special distributions to stockholders; negotiate lease renewals or new leases that facilitate the sales process and enhance property stability for prospective buyers; complete capital projects, such as renovations or amenity enhancements, to attract quality buyers; and finalize the strategic alternatives assessment and decide on a course of action.
Liquidity and Capital Resources
Our principal demands for funds during the short- and long-term are and will be for: the payment of operating expenses, capital expenditures and general and administrative expenses; payments under debt obligations; Special Redemptions of common stock pursuant to our share redemption program; and payments of distributions to stockholders.
44
We intend to use our cash on hand, cash flow generated by our real estate properties and real estate-related investment, proceeds from debt financing, proceeds from the sale of real estate properties and possibly the principal repayment on or sale of our real estate loan receivable as our primary sources of immediate and long-term liquidity. As of December 31, 2017, we had an aggregate of $25.0 million available for future disbursements under one credit facility, subject to certain conditions and restrictions set forth in the loan agreement.
Our share redemption program provides only for Special Redemptions. During each calendar year, such Special Redemptions are limited to an annual dollar amount determined by the board of directors, which may be reviewed during the year and increased or decreased upon ten business days’ notice to our stockholders. Special Redemptions are made at a price per share equal to the most recent estimated value per share of our common stock as of the applicable redemption date. We currently do not expect to make ordinary redemptions in the future. On December 6, 2017, our board of directors approved an annual dollar limitation of $10.0 million in the aggregate for the calendar year 2018 (subject to review and adjustment during the year by the board of directors), and further subject to the limitations described in the share redemption program.
Our investments in real estate generate cash flow in the form of rental revenues and tenant reimbursements, which are reduced by operating expenditures, debt service payments, the payment of asset management fees and corporate general and administrative expenses. Cash flow from operations from our real estate investments is primarily dependent upon the occupancy level of our portfolio, the net effective rental rates on our leases, the collectibility of rent and operating recoveries from our tenants and how well we manage our expenditures. As of December 31, 2017, our real estate properties were 85% occupied and our bad debt reserve was less than 1% of annualized base rent.
Our real estate-related investment generates cash flow in the form of interest income, which is reduced by the payment of asset management fees and corporate general and administrative expenses. Cash flow from operations from our real estate-related investment is primarily dependent on the operating performance of the underlying collateral and the borrower’s ability to make debt service payments. As of December 31, 2017, the borrower under our real estate loan receivable was current on its debt service payments to us.
For the year ended December 31, 2017, our cash needs for capital expenditures and the payment of debt obligations were met with the proceeds from the payoff or sale of real estate loans receivable and proceeds from the sales of real estate properties. Operating cash needs during the same period were met with cash flow generated by our real estate and real estate-related investments. We made distributions to our stockholders during the year ended December 31, 2017 using cash flows from operations and cash on hand. We believe that our cash on hand, cash flow from operations, availability under our credit facility, proceeds from the sales of real estate properties and the repayment of or sale of our real estate loan receivable will be sufficient to meet our liquidity needs for the foreseeable future. As of December 31, 2017, we had a total of $364.4 million of debt obligations scheduled to mature within 12 months of that date. We plan to exercise our extension options available under our loan agreements, if applicable, or pay down or refinance the related notes payable prior to their maturity dates.
On December 8, 2017, our board of directors approved an estimated value per share of our common stock of $4.89 (unaudited) based on the estimated value of our assets less the estimated value of our liabilities, divided by the number of shares outstanding, all as of September 30, 2017. For a full description of the assumptions, methodologies and limitations used to value our assets and liabilities in connection with the calculation of our estimated value per share, see Part II, Item 5, “Market for Registrant’s Common Equity, Related Stockholder Matters and Issuer Purchases of Equity Securities — Market Information.”
Our cash flow from operations has decreased and will continue to decrease as a result of our disposition activity, and we have adjusted our distribution policy with respect to the amount of monthly distribution payments to take into account our disposition activity and current real estate investments. We may continue to make additional strategic asset sales as opportunities become available in the market and may further adjust our distribution policy as a result. Any future special distributions we make from the proceeds of future dispositions will reduce our estimated value per share and this reduction will be reflected in our updated estimated value per share, which we expect to update no later than December 2018.
Volatility in global financial markets and changing political environments can cause fluctuations in the performance of the U.S. commercial real estate markets. Possible future declines in rental rates, slower or potentially negative net absorption of leased space and expectations of future rental concessions, including free rent to renew tenants early, to retain tenants who are up for renewal or to attract new tenants, may result in decreases in cash flows from investment properties. Increases in the cost of financing due to higher interest rates may cause difficulty in refinancing debt obligations prior to or at maturity or at terms not as favorable as the terms of existing indebtedness. Market conditions can change quickly, potentially negatively impacting the value of real estate investments. Management continuously reviews our investment and debt financing strategies to optimize our portfolio and the cost of our debt exposure.
45
Cash Flows from Operating Activities
As of December 31, 2017, we owned nine real estate properties (consisting of eight office properties and an office campus consisting of eight office buildings). In addition, as of December 31, 2017, we owned one real estate loan receivable.
During the year ended December 31, 2017, net cash provided by operating activities was $52.8 million, compared to $54.4 million during the year ended December 31, 2016. The decrease in net cash provided by operating activities was primarily due to the disposition of three real estate properties subsequent to January 1, 2016, the timing of rent collection and payments of lease incentives. We anticipate cash flows from operating activities to decrease as a result of the properties sold during the year ended December 31, 2017 and to the extent we make additional asset sales.
Cash Flows from Investing Activities
Net cash provided by investing activities was $65.9 million for the year ended December 31, 2017, and primarily consisted of the following:
• | $83.4 million of proceeds from the sale of two office properties; and |
• | $17.6 million used for improvements to real estate. |
Cash Flows from Financing Activities
During the year ended December 31, 2017, net cash used in financing activities was $80.1 million and consisted of the following:
• | $51.8 million of cash used for distributions; |
• | $21.7 million of principal payments on notes payable; |
• | $5.8 million of cash used for redemptions of common stock; and |
• | $0.9 million of payments of deferred financing costs. |
In addition to using our capital resources to meet our debt service obligations, for capital expenditures and for operating costs, we use our capital resources to make certain payments to our advisor. We paid our advisor fees in connection with the acquisition and origination of our assets and pay our advisor fees in connection with the management and disposition of our assets and for certain costs incurred by our advisor in providing services to us. Among the fees payable to our advisor is an asset management fee. With respect to investments in real estate, we pay our advisor a monthly asset management fee equal to one-twelfth of 0.75% of the amount paid or allocated to acquire the investment, plus the cost of any subsequent development, construction or improvements to the property. This amount includes any portion of the investment that was debt financed and is inclusive of acquisition fees and expenses related thereto. With respect to investments in loans and any investments other than real estate, we pay our advisor a monthly asset management fee calculated, each month, as one-twelfth of 0.75% of the lesser of (i) the amount paid or allocated to acquire or fund the loan or other investment (which amount includes any portion of the investment that was debt financed and is inclusive of acquisition or origination fees and expenses related thereto) and (ii) the outstanding principal amount of such loan or other investment, plus the acquisition or origination fees and expenses related to the acquisition or funding of such investment, as of the time of calculation. We also continue to reimburse our advisor and our dealer manager for certain stockholder services.
As of December 31, 2017, we had $81.0 million of cash and cash equivalents and up to $25.0 million available for future disbursements under one credit facility, subject to certain conditions and restrictions set forth in the loan agreement, to meet our operational and capital needs.
In order to execute our investment strategy, we primarily utilized secured debt to finance a portion of our investment portfolio. Management remains vigilant in monitoring the risks inherent with the use of debt in our portfolio and is taking actions to ensure that these risks, including refinance and interest rate risks, are properly balanced with the benefit of using leverage. We limit our total liabilities to 75% of the cost (before deducting depreciation and other noncash reserves) of our tangible assets; however, we may exceed that limit if the majority of the conflicts committee approves each borrowing in excess of such limitation and we disclose such borrowings to our stockholders in our next quarterly report with an explanation from the conflicts committee of the justification for the excess borrowing. As of December 31, 2017, our borrowings and other liabilities were approximately 34% of both the cost (before deducting depreciation and other noncash reserves) and book value (before deducting depreciation) of our tangible assets, respectively.
46
Contractual Commitments and Contingencies
The following is a summary of our contractual obligations as of December 31, 2017 (in thousands):
Payments Due During the Years Ending December 31, | ||||||||||||||||
Contractual Obligations | Total | 2018 | 2019 | 2020 | ||||||||||||
Outstanding debt obligations (1) | $ | 502,633 | $ | 367,164 | $ | 2,848 | $ | 132,621 | ||||||||
Interest payments on outstanding debt obligations (2) | 14,143 | 7,904 | 4,696 | 1,543 | ||||||||||||
(1) Amounts include principal payments only.
(2) Projected interest payments are based on the outstanding principal amounts, maturity dates and interest rates in effect as of December 31, 2017 (consisting of the contractual interest rate). We incurred interest expense of $16.5 million, excluding net unrealized gains on interest rate swap agreements of $0.1 million and amortization of deferred financing costs totaling $1.1 million during the year ended December 31, 2017.
Results of Operations
Overview
As of December 31, 2016, we owned 10 office properties, an office campus consisting of eight office buildings and one real estate loan receivable. Subsequent to December 31, 2016, we sold two office properties. As a result, as of December 31, 2017, we owned eight office properties, an office campus consisting of eight office buildings and one real estate loan receivable. The results of operations presented for the years ended December 31, 2017 and 2016 are not directly comparable due to the dispositions of three real estate properties. In general, we expect income and expenses to decrease in future periods due to disposition activity.
Comparison of the year ended December 31, 2017 versus the year ended December 31, 2016
The following table provides summary information about our results of operations for the years ended December 31, 2017 and 2016 (dollar amounts in thousands):
Years Ended December 31, | Increase (Decrease) | Percentage Change | $ Change Due to Dispositions (1) | $ Change Due to Properties or Loans Held Throughout Both Periods (2) | |||||||||||||||||||
2017 | 2016 | ||||||||||||||||||||||
Rental income | $ | 127,521 | $ | 133,408 | $ | (5,887 | ) | (4 | )% | $ | (4,722 | ) | $ | (1,165 | ) | ||||||||
Tenant reimbursements | 13,641 | 14,108 | (467 | ) | (3 | )% | (692 | ) | 225 | ||||||||||||||
Interest income from real estate loans receivable | 1,060 | 1,075 | (15 | ) | (1 | )% | — | (15 | ) | ||||||||||||||
Other operating income | 7,237 | 6,865 | 372 | 5 | % | 3 | 369 | ||||||||||||||||
Operating, maintenance, and management costs | 34,719 | 34,603 | 116 | — | % | (718 | ) | 834 | |||||||||||||||
Real estate taxes and insurance | 19,816 | 20,128 | (312 | ) | (2 | )% | (704 | ) | 392 | ||||||||||||||
Asset management fees to affiliate | 11,617 | 11,811 | (194 | ) | (2 | )% | (354 | ) | 160 | ||||||||||||||
General and administrative expenses | 4,541 | 6,370 | (1,829 | ) | (29 | )% | n/a | n/a | |||||||||||||||
Depreciation and amortization | 54,047 | 58,768 | (4,721 | ) | (8 | )% | (3,078 | ) | (1,643 | ) | |||||||||||||
Interest expense | 17,466 | 16,651 | 815 | 5 | % | (783 | ) | 1,598 | |||||||||||||||
Other interest income | 375 | 529 | (154 | ) | (29 | )% | n/a | n/a | |||||||||||||||
Gain on sale of real estate, net | 17,486 | 9,093 | 8,393 | 92 | % | 8,393 | — | ||||||||||||||||
(1) Represents the dollar amount increase (decrease) for the year ended December 31, 2017 compared to the year ended December 31, 2016 related to real estate and real estate-related investments disposed of on or after January 1, 2016.
(2) Represents the dollar amount increase (decrease) for the year ended December 31, 2017 compared to the year ended December 31, 2016 related to real estate and real estate-related investments owned by us throughout both periods presented.
47
Rental income and tenant reimbursements decreased from $147.5 million for the year ended December 31, 2016 to $141.2 million for the year ended December 31, 2017, primarily due to the sale of three real estate properties subsequent to January 1, 2016 and an early lease termination during the year ended December 31, 2016 in a property held throughout both periods, partially offset by an aggregate increase in average annualized base rent per square foot of 0.5% related to real estate held for investment and an increase in tenant reimbursements related to a property held throughout both periods. Overall, we expect rental income and tenant reimbursements to decrease in future periods due to the sale of two real estate properties during the year ended December 31, 2017 and anticipated dispositions of real estate properties. For the years ended December 31, 2017 and 2016, rental income and tenant reimbursements from our real estate properties sold were $5.2 million and $10.6 million, respectively.
Interest income from our real estate loan receivable, recognized using the interest method, remained consistent at $1.1 million during the years ended December 31, 2017 and 2016. Interest income from our real estate loan receivable in future periods compared to historical periods will decrease as a result of the anticipated payoff of our real estate loan receivable, which matures in August 2018.
Other operating income increased from $6.9 million for the year ended December 31, 2016 to $7.2 million for the year ended December 31, 2017, primarily due to an increase in parking revenues for properties held throughout both periods. Overall, we expect other operating income to decrease in future periods due to anticipated dispositions of real estate properties. For the years ended December 31, 2017 and 2016, other operating income from our real estate properties sold was $18,000 and $15,000, respectively.
Operating, maintenance and management costs increased slightly from $34.6 million for the year ended December 31, 2016 to $34.7 million for the year ended December 31, 2017 primarily due to an increase in contract security, on-site wages and benefits and reimbursable parking expenses for properties held throughout both periods, partially offset by a decrease in operating, maintenance and management costs due to the sale of three real estate properties subsequent to January 1, 2016. We expect operating, maintenance and management costs to decrease in future periods due to the sale of two real estate properties during the year ended December 31, 2017 and anticipated dispositions of real estate properties, offset by inflation. For the years ended December 31, 2017 and 2016, operating, maintenance and management costs from our real estate properties sold were $1.5 million and $2.3 million, respectively.
Real estate taxes and insurance decreased from $20.1 million for the year ended December 31, 2016 to $19.8 million for the year ended December 31, 2017. This decrease was primarily due to the sale of three real estate properties subsequent to January 1, 2016, partially offset by higher property tax assessed values for properties held throughout both periods. We expect real estate taxes and insurance to decrease in future periods due to the sale of two real estate properties during the year ended December 31, 2017 and anticipated dispositions of real estate properties. For the years ended December 31, 2017 and 2016, real estate taxes and insurance from our real estate properties sold were $0.9 million and $1.6 million, respectively.
Asset management fees with respect to our real estate and real estate-related investments decreased from $11.8 million for the year ended December 31, 2016 to $11.6 million for the year ended December 31, 2017, primarily due to the sale of three real estate properties subsequent to January 1, 2016 offset by higher asset management fees as a result of improvements made to properties held throughout both periods. All asset management fees incurred as of December 31, 2017 have been paid. We expect asset management fees to decrease in future periods due to the sale of two real estate properties during the year ended December 31, 2017 and anticipated dispositions of real estate properties. For the years ended December 31, 2017 and 2016, asset management fees from our real estate properties sold were $0.5 million and $0.8 million, respectively.
General and administrative expenses decreased from $6.4 million for the year ended December 31, 2016 to $4.5 million for the year ended December 31, 2017. This decrease was primarily due to professional fees incurred related to the Special Committee’s engagement of Evercore to act as our financial advisor and legal fees related to the assessment of strategic alternatives during the year ended December 31, 2016. We did not incur such costs during the year ended December 31, 2017. See “—Liquidity and Capital Resources” for our discussion on the engagement of Evercore and assessment of strategic alternatives.
Depreciation and amortization decreased from $58.8 million for the year ended December 31, 2016 to $54.0 million for the year ended December 31, 2017 due to the sale of three real estate properties subsequent to January 1, 2016 and as a result of lease terminations and lease expirations related to properties held throughout both periods. We expect depreciation and amortization to decrease in future periods due to anticipated dispositions of real estate properties and an overall decrease in amortization of tenant origination costs related to lease expirations. For the years ended December 31, 2017 and 2016, depreciation and amortization from our real estate properties sold were $0.9 million and $4.0 million, respectively.
48
Interest expense increased from $16.7 million for the year ended December 31, 2016 to $17.5 million for the year ended December 31, 2017. The increase in interest expense is primarily due to higher one-month LIBOR related to our existing notes payable for properties held throughout both periods, partially offset by an overall decrease in our total debt outstanding due to loan repayments in connection with the sale of three real estate properties subsequent to January 1, 2016. Included in interest expense is the amortization of deferred financing costs of $1.8 million and $1.1 million for the years ended December 31, 2016 and 2017, respectively. Also included in interest expense during the year ended December 31, 2016 was $0.2 million of termination fees related to the payoff of a loan secured by one office/flex property sold during the year ended December 31, 2016. During the years ended December 31, 2017 and 2016, we recorded $0.1 million and $0.5 million of unrealized gain on interest rate swaps, respectively. In general, we expect interest expense to decrease in future periods due to debt repayments related to assets sold and anticipated asset sales, which may be offset by certain fees and costs that may be incurred due to the prepayment and refinancing of certain loans. Our interest expense in future periods will also vary based on fluctuations in one-month LIBOR (for our variable rate debt) and our level of future borrowings, which will depend on the availability and cost of debt financing, draws on our credit facility and any debt repayments we make. For the years ended December 31, 2017 and 2016, interest expense from the loans secured by our real estate properties sold was $0.6 million and $1.4 million, respectively.
We recognized a gain on sale of real estate of $17.5 million related to the sale of two real estate properties during the year ended December 31, 2017. During the year ended December 31, 2016, we recognized a gain on sale of real estate of $9.1 million related to the disposition of one office/flex property.
Comparison of the year ended December 31, 2016 versus the year ended December 31, 2015
The following table provides summary information about our results of operations for the years ended December 31, 2016 and 2015 (dollar amounts in thousands):
Years Ended December 31, | Increase (Decrease) | Percentage Change | $ Change Due to Dispositions (1) | $ Change Due to Properties or Loans Held Throughout Both Periods (2) | |||||||||||||||||||
2016 | 2015 | ||||||||||||||||||||||
Rental income | $ | 133,408 | $ | 138,745 | $ | (5,337 | ) | (4 | )% | $ | (3,918 | ) | $ | (1,419 | ) | ||||||||
Tenant reimbursements | 14,108 | 14,749 | (641 | ) | (4 | )% | (688 | ) | 47 | ||||||||||||||
Interest income from real estate loans receivable | 1,075 | 4,552 | (3,477 | ) | (76 | )% | (3,470 | ) | (7 | ) | |||||||||||||
Other operating income | 6,865 | 7,249 | (384 | ) | (5 | )% | (125 | ) | (259 | ) | |||||||||||||
Operating, maintenance, and management costs | 34,603 | 36,069 | (1,466 | ) | (4 | )% | (733 | ) | (733 | ) | |||||||||||||
Real estate taxes and insurance | 20,128 | 20,528 | (400 | ) | (2 | )% | (590 | ) | 190 | ||||||||||||||
Asset management fees to affiliate | 11,811 | 12,082 | (271 | ) | (2 | )% | (527 | ) | 256 | ||||||||||||||
General and administrative expenses | 6,370 | 4,485 | 1,885 | 42 | % | n/a | n/a | ||||||||||||||||
Depreciation and amortization | 58,768 | 56,271 | 2,497 | 4 | % | (757 | ) | 3,254 | |||||||||||||||
Interest expense | 16,651 | 22,115 | (5,464 | ) | (25 | )% | (610 | ) | (4,854 | ) | |||||||||||||
Impairment charge on real estate | — | 23,082 | (23,082 | ) | (100 | )% | — | (23,082 | ) | ||||||||||||||
Other interest income | 529 | 293 | 236 | 81 | % | n/a | n/a | ||||||||||||||||
Gain on sale of real estate, net | 9,093 | 27,421 | (18,328 | ) | (67 | )% | (18,328 | ) | — | ||||||||||||||
(1) Represents the dollar amount increase (decrease) for the year ended December 31, 2016 compared to the year ended December 31, 2015 related to real estate and real estate-related investments disposed of on or after January 1, 2015.
(2) Represents the dollar amount increase (decrease) for the year ended December 31, 2016 compared to the year ended December 31, 2015 related to real estate and real estate-related investments owned by us throughout both periods presented.
Rental income and tenant reimbursements decreased from $153.5 million for the year ended December 31, 2015 to $147.5 million for the year ended December 31, 2016, primarily due to the dispositions of two real estate properties subsequent to January 1, 2015, and a net decrease in rental income from properties held throughout both periods. Rental income related to properties held throughout both periods decreased primarily due to an overall decrease in occupancy in such properties of 1% and an aggregate decrease in average annualized base rent per square foot in such properties of 0.4%. For the years ended December 31, 2016 and 2015, rental income and tenant reimbursements from our real estate properties sold were $1.4 million and $6.0 million, respectively.
Interest income from our real estate loans receivable, recognized using the interest method, decreased from $4.6 million for the year ended December 31, 2015 to $1.1 million for the year ended December 31, 2016, primarily as a result of the payoff of a real estate loan receivable in August 2015.
49
Other operating income decreased from $7.2 million for the year ended December 31, 2015 to $6.9 million for the year ended December 31, 2016, primarily due to the dispositions of two real estate properties subsequent to January 1, 2015 and a decrease in parking revenues for properties held throughout both periods. For the years ended December 31, 2016 and 2015, other operating income from our real estate properties sold was $0 and $0.1 million, respectively.
Operating, maintenance and management costs decreased from $36.1 million for the year ended December 31, 2015 to $34.6 million for the year ended December 31, 2016. The decrease was primarily due to the dispositions of two real estate properties subsequent to January 1, 2015 and a decrease in snow removal costs and utility costs for properties held throughout both periods. For the years ended December 31, 2016 and 2015, operating, maintenance and management costs from our real estate properties sold were $37,000 and $0.8 million, respectively.
Real estate taxes and insurance decreased from $20.5 million for the year ended December 31, 2015 to $20.1 million for the year ended December 31, 2016. This decrease was primarily due to the dispositions of two real estate properties subsequent to January 1, 2015, partially offset by a net increase in real estate taxes and insurance for properties held throughout both periods. For the years ended December 31, 2016 and 2015, real estate taxes and insurance from our real estate properties sold were $0.3 million and $0.9 million, respectively.
Asset management fees with respect to our real estate and real estate-related investments decreased from $12.1 million for the year ended December 31, 2015 to $11.8 million for the year ended December 31, 2016, due to the disposition of two real estate properties and the payoff of a real estate loan receivable subsequent to January 1, 2015, partially offset by an increase in asset management fees due to an overall increase in the average total real estate balance for properties held throughout both periods. For the years ended December 31, 2016 and 2015, asset management fees from our real estate and real estate-related investments sold or otherwise disposed of were $0.1 million and $0.6 million, respectively.
General and administrative expenses increased from $4.5 million for the year ended December 31, 2015 to $6.4 million for the year ended December 31, 2016. This increase was primarily due to professional fees related to the Special Committee’s engagement of Evercore to act as our financial advisor and legal fees related to the anticipated dispositions of our real estate properties. See “—Liquidity and Capital Resources” for our discussion on the engagement of Evercore.
Depreciation and amortization increased from $56.3 million for the year ended December 31, 2015 to $58.8 million for the year ended December 31, 2016, primarily due to the reclassification of two real estate properties from held for sale to held for investment, which resulted in a portion of the depreciation and amortization expense being classified as an impairment charge during the year ended December 31, 2015. This increase was offset by a decrease in depreciation and amortization due to the disposition of two real estate properties subsequent to January 1, 2015. For the years ended December 31, 2016 and 2015, depreciation and amortization from our real estate properties sold or held for sale was $0.4 million and $1.1 million, respectively.
Interest expense decreased from $22.1 million for the year ended December 31, 2015 to $16.7 million for the year ended December 31, 2016. The decrease in interest expense is primarily due to an overall decrease to our total debt outstanding due to loan repayments in connection with dispositions of two real estate properties subsequent to January 1, 2015, and an overall decrease in the average loan balance of our existing notes payable related to properties held throughout both periods. Included in interest expense is the amortization of deferred financing costs of $2.0 million and $1.8 million for the years ended December 31, 2015 and 2016, respectively. Also included in interest expense during the years ended December 31, 2016 and 2015 were $0.2 million and $0.2 million of termination fees related to the payoff of loans secured by the real estate properties sold subsequent to January 1, 2015. During the years ended December 31, 2016 and 2015, we recorded $0.5 million and $2.4 million of unrealized gain on interest rate swaps, respectively. For the years ended December 31, 2016 and 2015, interest expense from our real estate properties sold was $0.5 million and $1.1 million, respectively.
During the year ended December 31, 2015, we recognized aggregate impairment charges of $23.1 million, including an impairment charge of $18.6 million to write-down the carrying value of the 100 & 200 Campus Drive Buildings, an office property located in Florham Park, New Jersey, to its estimated fair value as a result of changes in cash flow estimates. The decrease in cash flow projections was primarily due to (i) the lack of demand in the Florham Park office rental market resulting in slower rent growth and longer lease up periods and (ii) an increase in projected vacancy related to a tenant occupying 199,024 rentable square feet, or approximately 34% of the 100 & 200 Campus Drive Buildings. This tenant’s lease expired in November 2016. As a result, we revised our cash flow projections for longer lease up periods and additional tenant improvement costs and leasing concessions required to attract new tenants. In addition, during the year ended December 31, 2015, we recorded aggregate impairment charges of $4.5 million with respect to two real estate properties that were reclassified from held for sale to held for investment. The impairment charge was recorded to adjust the carrying values of the properties for any depreciation and amortization expense that would have been recognized if the properties had always been classified as held for investment, which otherwise would have been recorded through depreciation and amortization expense. We did not recognize any impairment charge during the year ended December 31, 2016.
50
We recognized a gain on sale of real estate of $9.1 million related to the disposition of one office/flex property during the year ended December 31, 2016. During the year ended December 31, 2015, we recognized a gain on sale of real estate of $27.4 million related to the disposition of one office property.
Funds from Operations and Modified Funds from Operations
We believe that FFO is a beneficial indicator of the performance of an equity REIT. We compute FFO in accordance with the current NAREIT definition. FFO represents net income, excluding gains and losses from sales of operating real estate assets (which can vary among owners of identical assets in similar conditions based on historical cost accounting and useful-life estimates), impairment losses on real estate assets, depreciation and amortization of real estate assets, and adjustments for unconsolidated partnerships and joint ventures. We believe FFO facilitates comparisons of operating performance between periods and among other REITs. However, our computation of FFO may not be comparable to other REITs that do not define FFO in accordance with the NAREIT definition or that interpret the current NAREIT definition differently than we do. Our management believes that historical cost accounting for real estate assets in accordance with GAAP implicitly assumes that the value of real estate assets diminishes predictably over time. Since real estate values have historically risen or fallen with market conditions, many industry investors and analysts have considered the presentation of operating results for real estate companies that use historical cost accounting to be insufficient by themselves. As a result, we believe that the use of FFO, together with the required GAAP presentations, provides a more complete understanding of our performance relative to our competitors and provides a more informed and appropriate basis on which to make decisions involving operating, financing, and investing activities.
Changes in accounting rules have resulted in a substantial increase in the number of non-operating and non-cash items included in the calculation of FFO. As a result, our management also uses modified funds from operations (“MFFO”) as an indicator of our ongoing performance as well as our dividend sustainability. MFFO excludes from FFO: acquisition fees and expenses (to the extent that such fees and expenses have been recorded as operating expenses); adjustments related to contingent purchase price obligations; amounts relating to straight-line rents and amortization of above and below market intangible lease assets and liabilities; accretion of discounts and amortization of premiums on debt investments; amortization of closing costs relating to debt investments; impairments of real estate-related investments; mark-to-market adjustments included in net income; and gains or losses included in net income for the extinguishment or sale of debt or hedges. We compute MFFO in accordance with the definition of MFFO included in the practice guideline issued by the IPA in November 2010 as interpreted by management. Our computation of MFFO may not be comparable to other REITs that do not compute MFFO in accordance with the current IPA definition or that interpret the current IPA definition differently than we do.
We believe that MFFO is helpful as a measure of ongoing operating performance because it excludes non-operating items included in FFO. MFFO excludes non-cash items such as straight-line rental revenue. Additionally, we believe that MFFO provides investors with supplemental performance information that is consistent with the performance indicators and analysis used by management, in addition to net income and cash flows from operating activities as defined by GAAP, to evaluate the sustainability of our operating performance. MFFO provides comparability in evaluating the operating performance of our portfolio with other non-traded REITs which typically have limited lives with short and defined acquisition periods and targeted exit strategies. MFFO, or an equivalent measure, is routinely reported by non-traded REITs, and we believe often used by analysts and investors for comparison purposes.
FFO and MFFO are non-GAAP financial measures and do not represent net income as defined by GAAP. Net income as defined by GAAP is the most relevant measure in determining our operating performance because FFO and MFFO include adjustments that investors may deem subjective, such as adding back expenses such as depreciation and amortization and the other items described above. Accordingly, FFO and MFFO should not be considered as alternatives to net income as an indicator of our current and historical operating performance. In addition, FFO and MFFO do not represent cash flows from operating activities determined in accordance with GAAP and should not be considered an indication of our liquidity. We believe FFO and MFFO, in addition to net income and cash flows from operating activities as defined by GAAP, are meaningful supplemental performance measures; however, neither FFO nor MFFO reflects adjustments for the operations of properties and real estate-related investments sold or held for sale during the periods presented. During periods of significant disposition activity, FFO and MFFO are much more limited measures of future performance and dividend sustainability. In connection with our presentation of FFO and MFFO, we are providing information related to the proportion of MFFO related to properties sold and real estate-related investments sold or repaid as of December 31, 2017.
51
Although MFFO includes other adjustments, the exclusion of straight-line rent, the amortization of above- and below-market leases, the amortization of discounts and closing costs, prepayment fees received on notes receivable, termination fees on derivative instruments and unrealized gains and losses on derivative instruments are the most significant adjustments for the periods presented. We have excluded these items based on the following economic considerations:
• | Adjustments for straight-line rent. These are adjustments to rental revenue as required by GAAP to recognize contractual lease payments on a straight-line basis over the life of the respective lease. We have excluded these adjustments in our calculation of MFFO to more appropriately reflect the current economic impact of our in-place leases, while also providing investors with a useful supplemental metric that addresses core operating performance by removing rent we expect to receive in a future period or rent that was received in a prior period; |
• | Amortization of above- and below-market leases. Similar to depreciation and amortization of real estate assets and lease related costs that are excluded from FFO, GAAP implicitly assumes that the value of intangible lease assets and liabilities diminishes predictably over time and requires that these charges be recognized currently in revenue. Since real estate values and market lease rates in the aggregate have historically risen or fallen with local market conditions, management believes that by excluding these charges, MFFO provides useful supplemental information on the realized economics of the real estate; |
• | Amortization of discounts and closing costs. Discounts and closing costs related to debt investments are amortized over the term of the loan as an adjustment to interest income. This application results in income recognition that is different than the underlying contractual terms of the debt investments. We have excluded the amortization of discounts and closing costs related to our debt investments in our calculation of MFFO to more appropriately reflect the economic impact of our debt investments, as discounts will not be economically recognized until the loan is repaid and closing costs are essentially the same as acquisition fees and expenses on real estate. We believe excluding these items provides investors with a useful supplemental metric that directly addresses core operating performance; |
• | Prepayment fees received on notes receivable. Prepayment fees related to notes receivable are included in interest income from real estate loans receivable. Although these amounts increase net income, we exclude them from MFFO to more appropriately present the ongoing operating performance of our real estate-related investments on a comparative basis; |
• | Termination fees on derivative instruments. Termination fees on derivative instruments are included in interest expense. Although these amounts reduce net income, we exclude them from MFFO to more appropriately reflect the ongoing impact of our interest rate swap agreements; and |
• | Unrealized gains and losses on derivative instruments. These adjustments include unrealized gains (losses) from mark-to-market adjustments on interest rate swaps and losses due to hedge ineffectiveness. The change in fair value of interest rate swaps not designated as a hedge and the change in fair value of the ineffective portion of interest rate swaps are non-cash adjustments recognized directly in earnings and are included in interest expense. We have excluded these adjustments in our calculation of MFFO to more appropriately reflect the economic impact of our interest rate swap agreements. |
52
Our calculation of FFO, which we believe is consistent with the calculation of FFO as defined by NAREIT, is presented in the following table, along with our calculation of MFFO, for the years ended December 31, 2017, 2016 and 2015, respectively (in thousands). No conclusions or comparisons should be made from the presentation of these periods.
For the Years Ended December 31, | ||||||||||||
2017 | 2016 | 2015 | ||||||||||
Net income | $ | 25,114 | $ | 16,747 | $ | 18,377 | ||||||
Depreciation of real estate assets | 36,271 | 36,770 | 33,235 | |||||||||
Amortization of lease-related costs | 17,776 | 21,998 | 23,036 | |||||||||
Impairment charge on real estate | — | — | 23,082 | |||||||||
Gain on sale of real estate, net | (17,486 | ) | (9,093 | ) | (27,421 | ) | ||||||
FFO | 61,675 | 66,422 | 70,309 | |||||||||
Straight-line rent and amortization of above- and below-market leases | (102 | ) | (6,075 | ) | (7,372 | ) | ||||||
Amortization of discounts and closing costs | 4 | 3 | 23 | |||||||||
Prepayment fees received on notes receivable | — | — | (874 | ) | ||||||||
Termination fees on derivative instruments | — | 156 | 179 | |||||||||
Unrealized gains on derivative instruments | (101 | ) | (478 | ) | (2,410 | ) | ||||||
MFFO | $ | 61,476 | $ | 60,028 | $ | 59,855 | ||||||
Our calculation of MFFO above includes amounts related to the operations of four real estate properties sold and one real estate loan receivable paid off between January 1, 2015 and December 31, 2017. Please refer to the table below with respect to the proportion of MFFO related to real estate properties sold or the real estate-related investment paid off as of December 31, 2017 (in thousands).
For the Years Ended December 31, | ||||||||||||
2017 | 2016 | 2015 | ||||||||||
MFFO by component: | ||||||||||||
Assets held for investment | $ | 59,984 | $ | 54,752 | $ | 56,670 | ||||||
Real estate properties sold | 1,492 | 5,276 | 833 | |||||||||
Real estate loans receivable sold or paid off | — | — | 2,352 | |||||||||
MFFO | $ | 61,476 | $ | 60,028 | $ | 59,855 | ||||||
FFO and MFFO may also be used to fund all or a portion of certain capitalizable items that are excluded from FFO and MFFO, such as tenant improvements, building improvements and deferred leasing costs.
Distributions
Distributions declared, distributions paid and cash flow from operations were as follows during 2017 (in thousands, except per share amounts):
Period | Distributions Declared (1) | Distributions Declared Per Share (1) | Distributions Paid (2) | Cash Flow From Operations | ||||||||||||
First Quarter 2017 | $ | 12,770 | $ | 0.068 | $ | 12,866 | $ | 12,404 | ||||||||
Second Quarter 2017 | 12,896 | 0.068 | 13,043 | 17,492 | ||||||||||||
Third Quarter 2017 | 13,013 | 0.069 | 13,022 | 13,007 | ||||||||||||
Fourth Quarter 2017 | 12,993 | 0.069 | 12,858 | 9,942 | ||||||||||||
$ | 51,672 | $ | 0.274 | $ | 51,789 | $ | 52,845 | |||||||||
(1) Assumes each share was issued and outstanding each day that was a record date for distributions during the periods presented.
(2) Other than special distributions, distributions generally are paid on a monthly basis, on or about the first business day of the following month.
53
For the year ended December 31, 2017, we paid aggregate distributions of $51.8 million, all of which were paid in cash. FFO and cash flow from operations for the year ended December 31, 2017 were $61.7 million and $52.8 million, respectively. We funded our total distributions paid with $51.3 million of current period cash flow from operations and $0.5 million of cash on hand. For purposes of determining the source of our distributions paid, we assume first that we use cash flow from operations from the relevant periods to fund distribution payments. See the reconciliation of FFO to net income above.
Over the long term, we expect that our distributions will generally be paid from cash flow from operations and FFO from current or prior periods (except with respect to distributions related to sales of our real estate properties and distributions related to the repayment of principal under our mortgage loan investment).
During the year ended December 31, 2017, we sold two office properties. During the year ended December 31, 2016, we sold one office/flex property, and during the year ended December 31, 2015, we sold one real estate property and received the repayment of one of our real estate loans receivable. Our cash flow from operations has decreased and will continue to decrease as a result of our disposition activity, and we have adjusted our distribution policy with respect to the amount of monthly distribution payments to take into account our disposition activity and current real estate investments. We may continue to make additional strategic asset sales as opportunities become available in the market and may further adjust our distribution policy as a result. Any future special distributions we make from the proceeds of future dispositions will reduce our estimated value per share and this reduction will be reflected in our updated estimated value per share, which we expect to update no later than December 2018.
Our operating performance and ability to pay distributions from our cash flow from operations and/or the disposition of our assets cannot be accurately predicted and may deteriorate in the future due to numerous factors, including those discussed under “Forward-Looking Statements,” Part I, Item 1A, “Risk Factors,” Part II, Item 7, “Management’s Discussion and Analysis of Financial Condition and Results of Operations — Liquidity and Capital Resources” and “Management’s Discussion and Analysis of Financial Condition and Results of Operations — Results of Operations.” Those factors include: the future operating performance of our investments in the existing real estate and financial environment; the success and economic viability of our tenants; the ability of our borrower to continue to make debt service payments and/or to repay its loan upon maturity; our ability to refinance existing indebtedness at comparable terms; changes in interest rates on our variable rate debt obligations; our ability to successfully dispose of additional assets; and the sources and amounts of cash we have available for distributions.
Critical Accounting Policies
Below is a discussion of the accounting policies that management considers critical in that they involve significant management judgments and assumptions, require estimates about matters that are inherently uncertain and because they are important for understanding and evaluating our reported financial results. These judgments affect the reported amounts of assets and liabilities and our disclosure of contingent assets and liabilities at the dates of the financial statements and the reported amounts of revenue and expenses during the reporting periods. With different estimates or assumptions, materially different amounts could be reported in our financial statements. Additionally, other companies may utilize different estimates that may impact the comparability of our results of operations to those of companies in similar businesses.
Revenue Recognition
Real Estate
We recognize minimum rent, including rental abatements, lease incentives and contractual fixed increases attributable to operating leases, on a straight-line basis over the term of the related leases when collectibility is reasonably assured and record amounts expected to be received in later years as deferred rent receivable. If the lease provides for tenant improvements, we determine whether the tenant improvements, for accounting purposes, are owned by the tenant or by us. When we are the owner of the tenant improvements, the tenant is not considered to have taken physical possession or have control of the physical use of the leased asset until the tenant improvements are substantially completed. When the tenant is the owner of the tenant improvements, any tenant improvement allowance (including amounts that a tenant can take in the form of cash or a credit against its rent) that is funded is treated as a lease incentive and amortized as a reduction of revenue over the lease term. Tenant improvement ownership is determined based on various factors including, but not limited to:
• | whether the lease stipulates how a tenant improvement allowance may be spent; |
• | whether the amount of a tenant improvement allowance is in excess of market rates; |
• | whether the tenant or landlord retains legal title to the improvements at the end of the lease term; |
• | whether the tenant improvements are unique to the tenant or general-purpose in nature; and |
• | whether the tenant improvements are expected to have any residual value at the end of the lease. |
54
We record property operating expense reimbursements due from tenants for common area maintenance, real estate taxes, and other recoverable costs in the period the related expenses are incurred.
We make estimates of the collectibility of our tenant receivables related to base rents, including deferred rent receivable, expense reimbursements and other revenue or income. We specifically analyze accounts receivable, deferred rent receivable, historical bad debts, customer creditworthiness, current economic trends and changes in customer payment terms when evaluating the adequacy of the allowance for doubtful accounts. In addition, with respect to tenants in bankruptcy, we make estimates of the expected recovery of pre-petition and post-petition claims in assessing the estimated collectibility of the related receivable. In some cases, the ultimate resolution of these claims can exceed one year. When a tenant is in bankruptcy, we will record a bad debt reserve for the tenant’s receivable balance and generally will not recognize subsequent rental revenue until cash is received or until the tenant is no longer in bankruptcy and has the ability to make rental payments.
We recognize a gain on sales of real estate upon the closing of a transaction with the purchaser. Gains on real estate sold are recognized using the full accrual method when collectibility of the sales price is reasonably assured, we are not obligated to perform additional activities that may be considered significant, the initial investment from the buyer is sufficient and other profit recognition criteria have been satisfied. Gain on sales of real estate may be deferred in whole or in part until the requirements for gain recognition have been met.
Real Estate Loan Receivable
Interest income on our real estate loan receivable is recognized on an accrual basis over the life of the investment using the interest method. Direct loan origination fees and origination or acquisition costs, as well as acquisition premiums or discounts, are amortized over the term of the loan as an adjustment to interest income. We will place a loan on nonaccrual status when any portion of principal or interest is 90 days past due, or earlier when concern exists as to the ultimate collection of principal or interest. When a loan is placed on nonaccrual status, we will reserve for any unpaid accrued interest and generally will not recognize subsequent interest income until the cash is received, or the loan returns to accrual status. We will resume the accrual of interest if we determine the collection of interest, according to the contractual terms of the loan, is probable.
Real Estate
Depreciation and Amortization
Real estate costs related to the acquisition and improvement of properties are capitalized and amortized over the expected useful life of the asset on a straight-line basis. Repair and maintenance costs are charged to expense as incurred and significant replacements and betterments are capitalized. Repair and maintenance costs include all costs that do not extend the useful life of the real estate asset. We consider the period of future benefit of an asset to determine its appropriate useful life. Expenditures for tenant improvements are capitalized and amortized over the shorter of the tenant’s lease term or expected useful life. We anticipate the estimated useful lives of our assets by class to be generally as follows:
Buildings | 25-40 years |
Building improvements | 10-25 years |
Tenant improvements | Shorter of lease term or expected useful life |
Tenant origination and absorption costs | Remaining term of related leases, including below-market renewal periods |
Impairment of Real Estate and Related Intangible Assets and Liabilities
We continually monitor events and changes in circumstances that could indicate that the carrying amounts of our real estate and related intangible assets and liabilities may not be recoverable or realized. When indicators of potential impairment suggest that the carrying value of real estate and related intangible assets and liabilities may not be recoverable, we assess the recoverability by estimating whether we will recover the carrying value of the real estate and related intangible assets and liabilities through its undiscounted future cash flows and its eventual disposition. If, based on this analysis, we do not believe that we will be able to recover the carrying value of the real estate and related intangible assets and liabilities, we would record an impairment loss to the extent that the carrying value exceeds the estimated fair value of the real estate and related intangible assets and liabilities.
Projecting future cash flows involves estimating expected future operating income and expenses related to the real estate and its related intangible assets and liabilities as well as market and other trends. Using inappropriate assumptions to estimate cash flows could result in incorrect fair values of the real estate and its related intangible assets and liabilities and could result in the overstatement of the carrying values of our real estate and related intangible assets and liabilities and an overstatement of our net income.
55
Real Estate Held for Sale
We generally consider real estate to be “held for sale” when the following criteria are met: (i) management commits to a plan to sell the property, (ii) the property is available for sale immediately, (iii) the property is actively being marketed for sale at a price that is reasonable in relation to its current fair value, (iv) the sale of the property within one year is considered probable and (v) significant changes to the plan to sell are not expected. Real estate that is held for sale and its related assets are classified as “real estate held for sale” and “assets related to real estate held for sale,” respectively, for all periods presented in the accompanying consolidated financial statements. Notes payable and other liabilities related to real estate held for sale are classified as “notes payable related to real estate held for sale” and “liabilities related to real estate held for sale,” respectively, for all periods presented in the accompanying consolidated financial statements. Real estate classified as held for sale is no longer depreciated and is reported at the lower of its carrying value or its estimated fair value less estimated costs to sell.
Change in a Plan to Sell
When real estate is initially considered “held for sale” it is measured at the lower of its depreciated book value, or estimated fair value less estimated costs to sell. Changes in the market may compel us to decide to reclassify a property that was designated as held for sale to held for investment. A property that is reclassified from held for sale to held for investment is measured and recorded at the lower of (i) its carrying amount before the property was classified as held for sale, adjusted for any depreciation and amortization expense that would have been recognized had the property been continuously classified as held and used, or (ii) its fair value at the date of the subsequent decision not to sell. Any adjustment to the carrying amount of the property as a result of the reclassification is included in income from continuing operations as an impairment charge on real estate held for investment.
Real Estate Loan Receivable
Our real estate loan receivable is recorded at amortized cost, net of loan loss reserves (if any), and evaluated for impairment at each balance sheet date. The amortized cost of a real estate loan receivable is the outstanding unpaid principal balance, net of unamortized acquisition premiums or discounts and unamortized costs and fees directly associated with the origination or acquisition of the loan.
As of December 31, 2017, we did not have a loan loss reserve and we did not record any impairment losses related to our real estate loan receivable during the years ended December 31, 2017, 2016 and 2015. However in the future, we may experience losses from our loan receivable requiring us to record loan loss reserves. Realized losses on individual loans could be material and significantly exceed any recorded reserves.
We consider a loan to be impaired when, based upon current information and events, we believe that it is probable that we will be unable to collect all amounts due under the contractual terms of the loan agreement. We also consider a loan to be impaired if we grant the borrower a concession through a modification of the loan terms or if we expect to receive assets (including equity interests in the borrower) with fair values that are less than the carrying value of our loan in satisfaction of the loan. A reserve is established when the present value of payments expected to be received, observable market prices, the estimated fair value of the collateral (for loans that are dependent on the collateral for repayment) or amounts expected to be received in satisfaction of a loan are lower than the carrying value of that loan.
Failure to recognize impairments would result in the overstatement of earnings and the carrying value of our real estate loan held for investment. Actual losses, if any, could differ significantly from estimated amounts.
Fair Value Measurements
Under GAAP, we are required to measure certain financial instruments at fair value on a recurring basis. In addition, we are required to measure other non-financial and financial assets at fair value on a non-recurring basis (e.g., carrying value of impaired real estate loans receivable and long-lived assets). Fair value is defined as the price that would be received upon the sale of an asset or paid to transfer a liability in an orderly transaction between market participants at the measurement date. The GAAP fair value framework uses a three-tiered approach. Fair value measurements are classified and disclosed in one of the following three categories:
• | Level 1: unadjusted quoted prices in active markets that are accessible at the measurement date for identical assets or liabilities; |
• | Level 2: quoted prices for similar instruments in active markets, quoted prices for identical or similar instruments in markets that are not active, and model-derived valuations in which significant inputs and significant value drivers are observable in active markets; and |
• | Level 3: prices or valuation techniques where little or no market data is available that requires inputs that are both significant to the fair value measurement and unobservable. |
56
When available, we utilize quoted market prices from independent third-party sources to determine fair value and classify such items in Level 1 or Level 2. In instances where the market for a financial instrument is not active, regardless of the availability of a nonbinding quoted market price, observable inputs might not be relevant and could require us to make a significant adjustment to derive a fair value measurement. Additionally, in an inactive market, a market price quoted from an independent third party may rely more on models with inputs based on information available only to that independent third party. When we determine the market for a financial instrument owned by us to be illiquid or when market transactions for similar instruments do not appear orderly, we use several valuation sources (including internal valuations, discounted cash flow analysis and quoted market prices) and establish a fair value by assigning weights to the various valuation sources. Additionally, when determining the fair value of liabilities in circumstances in which a quoted price in an active market for an identical liability is not available, we measure fair value using (i) a valuation technique that uses the quoted price of the identical liability when traded as an asset or quoted prices for similar liabilities when traded as assets or (ii) another valuation technique that is consistent with the principles of fair value measurement, such as the income approach or the market approach.
Changes in assumptions or estimation methodologies can have a material effect on these estimated fair values. In this regard, the derived fair value estimates cannot be substantiated by comparison to independent markets and, in many cases, may not be realized in an immediate settlement of the instrument.
We consider the following factors to be indicators of an inactive market: (i) there are few recent transactions, (ii) price quotations are not based on current information, (iii) price quotations vary substantially either over time or among market makers (for example, some brokered markets), (iv) indexes that previously were highly correlated with the fair values of the asset or liability are demonstrably uncorrelated with recent indications of fair value for that asset or liability, (v) there is a significant increase in implied liquidity risk premiums, yields, or performance indicators (such as delinquency rates or loss severities) for observed transactions or quoted prices when compared with our estimate of expected cash flows, considering all available market data about credit and other nonperformance risk for the asset or liability, (vi) there is a wide bid-ask spread or significant increase in the bid-ask spread, (vii) there is a significant decline or absence of a market for new issuances (that is, a primary market) for the asset or liability or similar assets or liabilities, and (viii) little information is released publicly (for example, a principal-to-principal market).
We consider the following factors to be indicators of non-orderly transactions: (i) there was not adequate exposure to the market for a period before the measurement date to allow for marketing activities that are usual and customary for transactions involving such assets or liabilities under current market conditions, (ii) there was a usual and customary marketing period, but the seller marketed the asset or liability to a single market participant, (iii) the seller is in or near bankruptcy or receivership (that is, distressed), or the seller was required to sell to meet regulatory or legal requirements (that is, forced), and (iv) the transaction price is an outlier when compared with other recent transactions for the same or similar assets or liabilities.
Income Taxes
We have elected to be taxed as a REIT under the Internal Revenue Code. To continue to qualify as a REIT, we must meet certain organizational and operational requirements, including a requirement to distribute at least 90% of our annual REIT taxable income to stockholders (which is computed without regard to the dividends-paid deduction or net capital gain and which does not necessarily equal net income as calculated in accordance with GAAP). As a REIT, we generally will not be subject to federal income tax on income that we distribute as dividends to our stockholders. If we fail to qualify as a REIT in any taxable year, we will be subject to federal income tax on our taxable income at regular corporate income tax rates and generally will not be permitted to qualify for treatment as a REIT for federal income tax purposes for the four taxable years following the year during which qualification is lost, unless the Internal Revenue Service grants us relief under certain statutory provisions. Such an event could materially and adversely affect our net income and net cash available for distribution to stockholders. However, we believe that we are organized and operate in such a manner as to qualify for treatment as a REIT.
Subsequent Events
We evaluate subsequent events up until the date the consolidated financial statements are issued.
Distributions Paid
On January 2, 2018, we paid distributions of $4.4 million, which related to distributions declared for December 2017 in the amount of $0.02331370 per share of common stock to stockholders of record as of the close of business on December 20, 2017. On February 1, 2018, we paid distributions of $3.9 million, which related to distributions declared for January 2018 in the amount of $0.02076575 per share of common stock to stockholders of record as of the close of business on January 19, 2018. On March 1, 2018, we paid distributions of $3.5 million, which related to distributions declared for February 2018 in the amount of $0.01875616 per share of common stock to stockholders of record as of the close of business on February 20, 2018.
57
Distributions Authorized
On January 30, 2018, our board of directors authorized a March 2018 distribution in the amount of $0.02076575 per share of common stock to stockholders of record as of the close of business on March 20, 2018, which we expect to pay in April 2018, and on March 7, 2018, our board of directors authorized an April 2018 distribution in the amount of $0.02009589 per share of common stock to stockholders of record as of the close of business on April 20, 2018, which we expect to pay in May 2018, and a May 2018 distribution in the amount of $0.02076575 per share of common stock to stockholders of record as of the close of business on May 18, 2018, which we expect to pay in June 2018.
ITEM 7A. | QUANTITATIVE AND QUALITATIVE DISCLOSURES ABOUT MARKET RISK |
We are exposed to the effects of interest rate changes as a result of borrowings used to maintain liquidity, to fund the financing and refinancing of our real estate and real estate-related investment portfolio, and to fund our operations. Our profitability and the value of our investment portfolio may be adversely affected during any period as a result of interest rate changes. Our interest rate risk management objectives are to limit the impact of interest rate changes on earnings, prepayment penalties and cash flows and to lower overall borrowing costs. We have managed and will continue to manage interest rate risk by maintaining a ratio of fixed rate, long-term debt such that variable rate exposure is kept at an acceptable level. In addition, we may utilize a variety of financial instruments, including interest rate caps, floors, and swap agreements, in order to limit the effects of changes in interest rates on our operations. When we use these types of derivatives to hedge the risk of interest-earning assets or interest-bearing liabilities, we may be subject to certain risks, including the risk that losses on a hedge position will reduce the funds available for payments of distributions to our stockholders and that the losses may exceed the amount we invested in the instruments.
The table below summarizes the book value, the annual effective interest rate and fair value of our real estate loan receivable based on the maturity date; and the outstanding principal balance, the interest rate or weighted-average interest rate and fair value of our notes payable based on the maturity dates, all as of December 31, 2017 (dollars in thousands):
Maturity Date | Total Value or Notional Amount | |||||||||||||||||||
2018 | 2019 | 2020 | Fair Value | |||||||||||||||||
Assets | ||||||||||||||||||||
Loan Receivable, book value | ||||||||||||||||||||
Fixed Rate | $ | 13,923 | $ | — | $ | — | $ | 13,923 | $ | 13,960 | ||||||||||
Annual effective interest rate (1) | 7.6 | % | — | — | 7.6 | % | ||||||||||||||
Liabilities | ||||||||||||||||||||
Notes payable, principal outstanding | ||||||||||||||||||||
Fixed Rate | $ | — | $ | — | $ | 138,219 | $ | 138,219 | $ | 136,082 | ||||||||||
Interest rate | — | — | 3.5 | % | 3.5 | % | ||||||||||||||
Variable Rate | $ | 364,414 | $ | — | $ | — | $ | 364,414 | $ | 364,601 | ||||||||||
Weighted-average interest rate (2) | 3.2 | % | — | — | 3.2 | % | ||||||||||||||
_____________________
(1) The annual effective interest rate represents the effective interest rate as of December 31, 2017 using the interest method, which we use to recognize interest income on our real estate loan receivable.
(2) The weighted-average interest rate represents the actual interest rate in effect as of December 31, 2017, using interest rate indices as of December 31, 2017, where applicable.
58
We borrow funds and made real estate-related investments at a combination of fixed and variable rates. Interest rate fluctuations will generally not affect our future earnings or cash flows on our fixed rate debt or our fixed rate real estate loan receivable unless such instruments mature or are otherwise terminated. However, interest rate changes will affect the fair value of our fixed rate instruments. As of December 31, 2017, the fair value and carrying value of our fixed rate real estate loan receivable were $14.0 million and $13.9 million, respectively. The fair value estimate of our real estate loan receivable is calculated using an internal valuation model that considers the expected cash flows for the loan, underlying collateral value (for collateral-dependent loans) and the estimated yield requirements of institutional investors for loans with similar characteristics, including remaining loan term, loan-to-value, type of collateral and other credit enhancements. As of December 31, 2017, the fair value of our fixed rate debt was $136.1 million and the outstanding principal balance of our fixed rate debt was $138.2 million. The fair value estimate of our fixed rate debt is calculated using a discounted cash flow analysis utilizing rates we would expect to pay for debt of a similar type and remaining maturity if the loans were originated as of December 31, 2017. With respect to our fixed rate instruments, we do not expect that fluctuations in interest rates, and the resulting change in fair value of our fixed rate instruments, would have a significant impact on our ongoing operations.
Conversely, movements in interest rates on our variable rate debt would change our future earnings and cash flows, but not significantly affect the fair value of those instruments. However, changes in required risk premiums would result in changes in the fair value of variable rate instruments. As of December 31, 2017, we were exposed to market risks related to fluctuations in interest rates on $364.4 million of variable rate debt outstanding. Based on interest rates as of December 31, 2017, if interest rates were 100 basis points higher or lower during the 12 months ending December 31, 2018, interest expense on our variable rate debt would increase or decrease by $3.6 million. As of December 31, 2017, all of our variable rate debt obligations were scheduled to mature within 12 months of that date. We plan to exercise our extension options available under our loan agreements, if applicable, or pay off or refinance the related notes payable prior to their maturity dates.
For a discussion of the interest rate risks related to the current capital and credit markets, see Part I, Item 1A, “Risk Factors.”
ITEM 8. | FINANCIAL STATEMENTS AND SUPPLEMENTARY DATA |
See the Index to Financial Statements at page F-1 of this report.
ITEM 9. | CHANGES IN AND DISAGREEMENTS WITH ACCOUNTANTS ON ACCOUNTING AND FINANCIAL DISCLOSURE |
None.
ITEM 9A. | CONTROLS AND PROCEDURES |
Disclosure Controls and Procedures
As of the end of the period covered by this report, management, including our principal executive officer and principal financial officer, evaluated the effectiveness of the design and operation of our disclosure controls and procedures. Based upon, and as of the date of, the evaluation, our principal executive officer and principal financial officer concluded that the disclosure controls and procedures were effective as of the end of the period covered by this report to ensure that information required to be disclosed in the reports we file and submit under the Exchange Act is recorded, processed, summarized and reported as and when required. Disclosure controls and procedures include, without limitation, controls and procedures designed to ensure that information required to be disclosed by us in the reports we file and submit under the Exchange Act is accumulated and communicated to our management, including our principal executive officer and our principal financial officer, as appropriate to allow timely decisions regarding required disclosure.
Management’s Report on Internal Control Over Financial Reporting
Our management is responsible for establishing and maintaining adequate internal control over financial reporting, as such term is defined in Rule 13a-15(f) or 15d-15(f) promulgated under the Securities Exchange Act of 1934, as amended.
In connection with the preparation of our Form 10-K, our management assessed the effectiveness of our internal control over financial reporting as of December 31, 2017. In making that assessment, management used the criteria set forth by the Committee of Sponsoring Organizations of the Treadway Commission (COSO) in Internal Control-Integrated Framework (2013).
59
Based on its assessment, our management believes that, as of December 31, 2017, our internal control over financial reporting was effective based on those criteria. There have been no changes in our internal control over financial reporting that occurred during the quarter ended December 31, 2017 that have materially affected, or are reasonably likely to materially affect, our internal control over financial reporting.
ITEM 9B. | OTHER INFORMATION |
On December 21, 2017, we entered into a letter agreement with Wells Fargo Bank, National Association and People’s United Bank, National Association, the lenders under the Union Bank Plaza Mortgage Loan, to extended the maturity date of the loan to April 12, 2018. No other changes were made to the terms of the loan as they previously existed.
60
PART III
ITEM 10. DIRECTORS, EXECUTIVE OFFICERS AND CORPORATE GOVERNANCE
Directors and Executive Officers
We have provided below certain information about our directors and executive officers.
Name | Position(s) | Age * | ||
Peter M. Bren | President | 84 | ||
Charles J. Schreiber, Jr. | Chairman of the Board, Chief Executive Officer and Director | 66 | ||
Peter McMillan III | Executive Vice President, Treasurer, Secretary, and Director | 60 | ||
Keith D. Hall | Executive Vice President | 59 | ||
Jeffrey K. Waldvogel | Chief Financial Officer | 40 | ||
Stacie K. Yamane | Chief Accounting Officer | 53 | ||
Barbara R. Cambon | Independent Director | 64 | ||
Jeffrey A. Dritley | Independent Director | 61 | ||
Stuart A. Gabriel, Ph.D. | Independent Director | 64 | ||
_____________________
* As of March 1, 2018.
Peter M. Bren is our President, a position he has held since August 2007. He is also Chairman and President of our advisor, President of KBS REIT I and President of KBS REIT III, positions he has held for these entities since October 2004, June 2005 and January 2010, respectively. Mr. Bren is President and a director of KBS Growth & Income REIT, Inc., positions he has held since January 2015 and July 2017, respectively. Mr. Bren is President and a director of KBS Growth & Income Venture Fund, Inc. (“KBS Growth & Income Venture Fund”), positions he has held since July 2017. Mr. Bren is President and a director of KBS Legacy Partners Apartment REIT, positions he has held since August 2009 and July 2009, respectively. Other than de minimis amounts owned by family members or family trusts, Mr. Bren indirectly owns and controls a 33 1/3% interest in KBS Holdings LLC, which is the sole owner of our advisor and the entity that acted as our dealer manager. KBS Holdings is a sponsor of our company and is a sponsor of KBS REIT I, KBS REIT III, KBS Strategic Opportunity REIT, KBS Legacy Partners Apartment REIT, KBS Strategic Opportunity REIT II, KBS Growth & Income REIT and KBS Growth & Income Venture Fund, which were formed in 2007, 2005, 2009, 2008, 2009, 2013, 2015 and 2017, respectively. Each of Messrs. Bren, Hall, McMillan and Schreiber, actively participate in the management and operations of our advisor.
Mr. Bren is Chairman and President of KBS Realty Advisors LLC and is a principal of Koll Bren Schreiber Realty Advisors, Inc., each an active and nationally recognized real estate investment advisor. These entities are registered as investment advisers with the SEC. The first investment advisor affiliated with Messrs. Bren and Schreiber was formed in 1992. As of December 31, 2017, KBS Realty Advisors, together with KBS affiliates, including our advisor, had been involved in the investment in or management of approximately $24 billion of real estate investments on behalf of institutional investors, including public and private pension plans, endowments and foundations, institutional and sovereign wealth funds, and the investors in us, KBS REIT I, KBS REIT III, KBS Strategic Opportunity REIT, KBS Legacy Partners Apartment REIT, KBS Strategic Opportunity REIT II and KBS Growth & Income REIT.
Mr. Bren oversees all aspects of our advisor’s and KBS Realty Advisors’ operations, including the acquisition, management and disposition of individual investments and portfolios of investments for KBS-sponsored programs and KBS-advised investors. He also directs all facets of our advisor’s and KBS Realty Advisors’ business activities and is responsible for investor relationships.
Mr. Bren has been involved in real estate development, management, acquisition, disposition and financing for more than 40 years and with the acquisition, origination, management, disposition and financing of real estate-related debt investments for more than 30 years. Prior to taking his current positions as Chairman and President of our advisor and KBS Realty Advisors, he served as the President of The Bren Company, was a Senior Partner of Lincoln Property Company and was President of Lincoln Property Company, Europe. Mr. Bren is a member of the UCLA Anderson School of Management Board of Advisors and is a founding member of the Richard S. Ziman Center for Real Estate at the UCLA Anderson School of Management.
61
Charles J. Schreiber, Jr. is our Chairman of the Board, our Chief Executive Officer and one of our directors, positions he has held since August 2007, August 2007 and July 2007, respectively. He is also the Chief Executive Officer of our advisor and Chairman of the Board, Chief Executive Officer and a director of KBS REIT I and KBS Growth & Income REIT, positions he has held for these entities since October 2004, June 2005 and January 2015, respectively. Mr. Schreiber is Chairman of the Board, Chief Executive Officer and a director of KBS REIT III, positions he has held since January 2010, January 2010 and December 2009, respectively, and is Chairman of the Board, Chief Executive Officer and a director of KBS Growth & Income Venture Fund, positions he has held since July 2017. Other than de minimis amounts owned by family members or family trusts, Mr. Schreiber indirectly owns and controls a 33 1/3% interest in KBS Holdings LLC, which is the sole owner of our advisor and the entity that acted as our dealer manager. KBS Holdings is a sponsor of our company and is a sponsor of KBS REIT I, KBS REIT III, KBS Strategic Opportunity REIT, KBS Legacy Partners Apartment REIT, KBS Strategic Opportunity REIT II, KBS Growth & Income REIT and KBS Growth & Income Venture Fund which were formed in 2007, 2005, 2009, 2008, 2009, 2013, 2015 and 2017, respectively. Each of Messrs. Bren, Hall, McMillan and Schreiber, actively participate in the management and operations of our advisor.
Mr. Schreiber is the Chief Executive Officer of KBS Realty Advisors LLC and is a principal of Koll Bren Schreiber Realty Advisors, Inc., each an active and nationally recognized real estate investment advisor. These entities are registered as investment advisers with the SEC. The first investment advisor affiliated with Messrs. Bren and Schreiber was formed in 1992. As of December 31, 2017, KBS Realty Advisors, together with KBS affiliates, including our advisor, had been involved in the investment in or management of approximately $24 billion of real estate investments on behalf of institutional investors, including public and private pension plans, endowments and foundations, institutional and sovereign wealth funds, and the investors in us, KBS REIT I, KBS REIT III, KBS Strategic Opportunity REIT, KBS Legacy Partners Apartment REIT, KBS Strategic Opportunity REIT II and KBS Growth & Income REIT.
Mr. Schreiber oversees all aspects of our advisor’s and KBS Realty Advisors’ operations, including the acquisition, management and disposition of individual investments and portfolios of investments for KBS-sponsored programs and KBS-advised investors. He also directs all facets of our advisor’s and KBS Realty Advisors’ business activities and is responsible for investor relationships.
Mr. Schreiber has been involved in real estate development, management, acquisition, disposition and financing for more than 40 years and with the acquisition, origination, management, disposition and financing of real estate-related debt investments for more than 30 years. Prior to teaming with Mr. Bren in 1992, he served as the Executive Vice President of Koll Investment Management Services and Executive Vice President of Acquisitions/Dispositions for The Koll Company. During the mid-1970s through the 1980s, he was Founder and President of Pacific Development Company and was previously Senior Vice President/Southern California Regional Manager of Ashwill-Burke Commercial Brokerage.
Mr. Schreiber graduated from the University of Southern California with a Bachelor’s Degree in Finance with an emphasis in Real Estate. During his four years at USC, he did graduate work in the then newly formed Real Estate Department in the USC Graduate School of Business. He is currently an Executive Board Member for the USC Lusk Center for Real Estate at the University of Southern California Marshall School of Business/School of Policy, Planning and Development. Mr. Schreiber also serves as a member of the Executive Committee for the Public Non-Listed REIT Council for the National Association of Real Estate Investment Trusts. He is also a member of the National Council of Real Estate Investment Fiduciaries. Mr. Schreiber has served as a member of the board of directors and executive committee of The Irvine Company since August 2016, and since December 2016, Mr. Schreiber has served on the Board of Trustees of The Irvine Company.
The board of directors has concluded that Mr. Schreiber is qualified to serve as a director, Chairman of the Board and as our Chief Executive Officer for reasons including his extensive industry and leadership experience. Since the formation of the first investment advisor affiliated with Messrs. Bren and Schreiber in 1992, and through December 31, 2017, Mr. Schreiber had been involved in the investment in or management of over $24 billion of real estate investments through KBS affiliates. With more than 40 years of experience in real estate development, management, acquisition and disposition and more than 30 years of experience with the acquisition, origination, management, disposition and financing of real estate-related debt investments, he has the depth and breadth of experience to implement our business strategy. He gained his understanding of the real estate and real estate-finance markets through hands-on experience with acquisitions, asset and portfolio management, asset repositioning and dispositions. As our Chief Executive Officer and a principal of our advisor, Mr. Schreiber is best-positioned to provide the board of directors with insights and perspectives on the execution of our business strategy, our operations and other internal matters. Further, as a principal of KBS-affiliated investment advisors, as Chief Executive Officer, Chairman of the Board and a director of KBS REIT I, KBS REIT III and KBS Growth & Income REIT, and as a director and trustee of The Irvine Company, Mr. Schreiber brings to the board of directors demonstrated management and leadership ability.
62
Peter McMillan III is one of our Executive Vice Presidents, our Treasurer and Secretary, and one of our directors, positions he has held since August 2007. He is also an Executive Vice President, the Treasurer and Secretary and a director of KBS REIT I and KBS REIT III, positions he has held for these entities since June 2005 and January 2010, respectively. He is President, Chairman of the Board and a director of KBS Strategic Opportunity REIT and KBS Strategic Opportunity REIT II, positions he has held for these entities since December 2008 and February 2013, respectively. He is also an Executive Vice President of KBS Legacy Partners Apartment REIT, which position he has held since August 2009. From January 2015 through February 2017, Mr. McMillan was an Executive Vice President, the Treasurer and Secretary and a director of KBS Growth & Income REIT. Mr. McMillan owns and controls a 50% interest in GKP Holding LLC. GKP Holding owns a 33 1/3% interest in KBS Holdings LLC, which is the sole owner of our advisor and the entity that acted as our dealer manager. KBS Holdings is a sponsor of our company and is a sponsor of KBS REIT I, KBS REIT III, KBS Strategic Opportunity REIT, KBS Legacy Partners Apartment REIT, KBS Strategic Opportunity REIT II, KBS Growth & Income REIT and KBS Growth & Income Venture Fund, which were formed in 2007, 2005, 2009, 2008, 2009, 2013, 2015 and 2017, respectively. Each of Messrs. Bren, Hall, McMillan and Schreiber, actively participate in the management and operations of our advisor.
Mr. McMillan is a Partner and co-owner of Temescal Canyon Partners LP, an investment advisor formed in 2013 to manage a multi-strategy hedge fund on behalf of investors. Mr. McMillan is also a co-founder and the Managing Partner of Willowbrook Capital Group, LLC, an asset management company. In addition, since November 2017, Mr. McMillan has served as Chairman and a director for Keppel-KBS US REIT Management Pte. Ltd., which is the manager of Keppel-KBS US REIT. Prior to forming Willowbrook in 2000, Mr. McMillan served as an Executive Vice President and Chief Investment Officer of SunAmerica Investments, Inc., which was later acquired by AIG. As Chief Investment Officer, he was responsible for over $75.0 billion in assets, including residential and commercial mortgage-backed securities, public and private investment grade and non-investment grade corporate bonds and commercial mortgage loans and real estate investments. Before joining SunAmerica in 1989, he served as Assistant Vice President for Aetna Life Insurance and Annuity Company with responsibility for the company’s $6.0 billion fixed income portfolios. Mr. McMillan received his Master of Business Administration in Finance from the Wharton Graduate School of Business at the University of Pennsylvania and his Bachelor of Arts Degree with honors in Economics from Clark University. Mr. McMillan is a member of the board of directors of TCW Funds, Inc. and TCW Strategic Income Fund, Inc., is chairman of the board of trustees of TCW Alternative Funds and is a member of the board of trustees of Metropolitan West Funds.
The board of directors has concluded that Mr. McMillan is qualified to serve as one of our directors for reasons including his expertise in real estate finance and with real estate-related investments. With over 30 years of experience investing in and managing real estate-related debt investments, Mr. McMillan offers insights and perspective with respect to our real estate-related investment portfolio as well as our real estate portfolio. As one of our executive officers and a principal of our advisor, Mr. McMillan is also able to direct the board of directors to the critical issues facing our company. Further, his experiences as a director of KBS REIT I, KBS REIT III, KBS Strategic Opportunity REIT and KBS Strategic Opportunity REIT II, as a member of the board of directors of TCW Funds, Inc. and TCW Strategic Income Fund, Inc., as chairman of the board of trustees of TCW Alternative Funds, as a member of the board of trustees of Metropolitan West Funds and as a former director of KBS Growth & Income REIT, provide him with an understanding of the requirements of serving on a public company board.
Keith D. Hall is one of our Executive Vice Presidents, a position he has held since August 2007. He is an Executive Vice President of KBS REIT I and KBS REIT III, positions he has held for these entities since June 2005 and January 2010, respectively. He is also the Chief Executive Officer and a director of KBS Strategic Opportunity REIT, positions he has held since December 2008 and October 2008, respectively, and is the Chief Executive Officer and a director of KBS Strategic Opportunity REIT II, positions he has held since February 2013. From January 2015 through July 2017, Mr. Hall was an Executive Vice President of KBS Growth & Income REIT. Mr. Hall owns and controls a 50% interest in GKP Holding LLC. GKP Holding owns a 33 1/3% interest in KBS Holdings LLC, which is the sole owner of our advisor and the entity that acted as our dealer manager. KBS Holdings is a sponsor of our company and is a sponsor of KBS REIT I, KBS REIT III, KBS Strategic Opportunity REIT, KBS Legacy Partners Apartment REIT, KBS Strategic Opportunity REIT II, KBS Growth & Income REIT and KBS Growth & Income Venture Fund, which were formed in 2007, 2005, 2009, 2008, 2009, 2013, 2015 and 2017, respectively. Each of Messrs. Bren, Hall, McMillan and Schreiber, actively participate in the management and operations of our advisor.
63
Mr. Hall is affiliated with Willowbrook Capital Group, LLC, an asset management company. Prior to commencing his affiliation with Willowbrook in 2000, Mr. Hall was a Managing Director at CS First Boston, where he managed the distribution strategy and business development for the Principal Transaction Group’s $18.0 billion real estate securities portfolio. Mr. Hall’s two primary business unit responsibilities were Mezzanine Lending and Commercial Real Estate Development. Before joining CS First Boston in 1996, he served as a Director in the Real Estate Products Group at Nomura Securities, with responsibility for the company’s $6.0 billion annual pipeline of fixed-income, commercial mortgage-backed securities. During the 1980s, Mr. Hall was a Senior Vice President in the High Yield Department of Drexel Burnham Lambert’s Beverly Hills office, where he was responsible for distribution of the group’s high-yield real estate securities. Mr. Hall received a Bachelor of Arts Degree with honors in Finance from California State University, Sacramento.
Jeffrey K. Waldvogel is our Chief Financial Officer and Assistant Secretary, positions he has held since June 2015. He is also the Chief Financial Officer of our advisor, and Chief Financial Officer and Assistant Secretary of KBS REIT I and KBS REIT III, positions he has held for each of these entities since June 2015. He is also the Chief Financial Officer, Treasurer and Secretary of KBS Growth & Income REIT, positions he has held since June 2015, April 2017 and April 2017, respectively. Mr. Waldvogel also is Chief Financial Officer, Treasurer and Secretary of KBS Growth & Income Venture Fund, positions he has held since July 2017. He is also the Chief Financial Officer, Treasurer and Secretary of KBS Strategic Opportunity REIT, KBS Legacy Partners Apartment REIT and KBS Strategic Opportunity REIT II, positions he has held for these entities since June 2015.
Mr. Waldvogel has been employed by an affiliate of our advisor since November 2010. With respect to the KBS-sponsored REITs advised by our advisor, he served as the Director of Finance and Reporting from July 2012 to June 2015 and as the VP Controller Technical Accounting from November 2010 to July 2012. In these roles Mr. Waldvogel was responsible for overseeing internal and external financial reporting, valuation analysis, financial analysis, REIT compliance, debt compliance and reporting, and technical accounting.
Prior to joining an affiliate of our advisor in 2010, Mr. Waldvogel was an audit senior manager at Ernst & Young LLP. During his eight years at Ernst & Young LLP, where he worked from October 2002 to October 2010, Mr. Waldvogel performed or supervised various auditing engagements, including the audit of financial statements presented in accordance with GAAP, as well as financial statements prepared on a tax basis. These auditing engagements were for clients in a variety of industries, with a significant focus on clients in the real estate industry.
In April 2002, Mr. Waldvogel received a Master of Accountancy Degree and Bachelor of Science from Brigham Young University in Provo, Utah. Mr. Waldvogel is a Certified Public Accountant (California).
Stacie K. Yamane is our Chief Accounting Officer, a position she has held since October 2008. From July 2007 to December 2008, Ms. Yamane served as our Chief Financial Officer and from July 2007 to October 2008, she served as our Controller. Ms. Yamane is also the Chief Accounting Officer, Portfolio Accounting of our advisor and Chief Accounting Officer of KBS REIT I, KBS REIT III, KBS Strategic Opportunity REIT, KBS Legacy Partners Apartment REIT, KBS Strategic Opportunity REIT II, KBS Growth & Income REIT and KBS Growth & Income Venture Fund, positions she has held for these entities since October 2008, October 2008, January 2010, August 2009, August 2009, February 2013, January 2015 and July 2017, respectively. From October 2004 to October 2008, Ms. Yamane served as Fund Controller of our advisor; from June 2005 to December 2008, she served as Chief Financial Officer of KBS REIT I and from June 2005 to October 2008, she served as Controller of KBS REIT I.
Ms. Yamane also serves as Senior Vice President/Controller, Portfolio Accounting for KBS Realty Advisors LLC, a position she has held since 2004. She served as a Vice President/Portfolio Accounting with KBS-affiliated investment advisors from 1995 to 2004. At KBS Realty Advisors, from 2004 through 2015, Ms. Yamane was responsible for client accounting/reporting for two real estate portfolios. These portfolios consisted of industrial, office and retail properties as well as land parcels. Ms. Yamane worked closely with portfolio managers, asset managers, property managers and clients to ensure the completion of timely and accurate accounting, budgeting and financial reporting. In addition, she assisted in the supervision and management of KBS Realty Advisors’ accounting department.
Prior to joining an affiliate of KBS Realty Advisors in 1995, Ms. Yamane was an audit manager at Kenneth Leventhal & Company, a CPA firm specializing in real estate. During her eight years at Kenneth Leventhal & Company, Ms. Yamane performed or supervised a variety of auditing, accounting and consulting engagements including the audit of financial statements presented in accordance with GAAP, as well as financial statements presented on a cash and tax basis, the valuation of asset portfolios and the review and analysis of internal control systems. Her experiences with various KBS-affiliated entities and Kenneth Leventhal & Company give her almost 30 years of real estate experience.
64
Ms. Yamane received a Bachelor of Arts Degree in Business Administration with a dual concentration in Accounting and Management Information Systems from California State University, Fullerton. She is a Certified Public Accountant (inactive California).
Barbara R. Cambon is one of our independent directors and is the chair of the conflicts committee and the chair of the Special Committee, positions she has held since March 2008, March 2008 and January 2016, respectively. Ms. Cambon is also an independent director, chair of the conflicts committee and chair of the special committee of KBS REIT I, positions she has held for this entity since June 2005, June 2005 and January 2016, respectively, and she is an independent director and chair of the conflicts committee of KBS REIT III, positions she has held for this entity since September 2010. From April 2009 to December 2010, she served as Chief Operating Officer of Premium One Asset Management LLC, a company whose business focuses on providing investment management services to investors. From October 2003 to October 2009, she also served as a Managing Member of Snowcreek Management LLC, a real estate asset management company whose business activities focus on residential development projects for institutional investors. As Managing Member, Ms. Cambon provided asset management services to an institutional partnership investment in residential real estate development. She has been involved in the real estate investment business for over 30 years, principally working with institutional capital sources and investment programs. From November 1999 until October 2002, she served as a Principal of Los Angeles-based Colony Capital, LLC, a private real estate investment firm, and from April 2000 until October 2002, she also served as its Chief Operating Officer. Prior to joining Colony Capital in 1999, Ms. Cambon was President and founder of Institutional Property Consultants, Inc., a real estate consulting company. She is a past director and chairman of the board of the Pension Real Estate Association and past director of the National Council of Real Estate Investment Fiduciaries. Ms. Cambon serves on the Policy Advisory Board of the University of San Diego Burnham-Moores Center for Real Estate. Ms. Cambon previously served on the board of directors of Neighborhood National Bancorp, Amstar Advisers and BioMed Realty Trust, Inc. Ms. Cambon received a Master of Business Administration from Southern Methodist University and a Bachelor of Science Degree in Education from the University of Delaware.
The board of directors has concluded that Ms. Cambon is qualified to serve as an independent director and as the chair of the conflicts committee for reasons including her expertise in real estate investment and management. Ms. Cambon’s over 30 years of experience investing in, managing and disposing of real estate on behalf of investors give her a wealth of knowledge and experiences from which to draw in advising our company. As former Managing Member of her own real estate asset management company, Ms. Cambon is acutely aware of the operational challenges facing companies such as ours. Further, her service as a director and chair of the conflicts committee of KBS REIT I and KBS REIT III, both public REITs, and as a former director of Neighborhood National Bancorp, Amstar Advisers and BioMed Realty Trust, Inc., gives her additional perspective and insight into large public companies such as ours.
Jeffrey A. Dritley is one of our independent directors, a position he has held since October 2017. He is also an independent director of KBS REIT III, a position he has held since October 2017. Mr. Dritley is Founder and Managing Partner of Kearny Real Estate Company. Kearny, headquartered in Los Angeles, is a partnership of experienced real estate professionals active in the acquisition, entitlement, repositioning, development, leasing, management and disposition of large, complex commercial projects in Southern California. Since 1993, Kearny has been involved in approximately $4.4 billion of projects including the acquisition and work-out of approximately $2.3 billion of distressed real estate debt.
From 1993 to 2001, Mr. Dritley served as a Managing Director of Morgan Stanley, where he was responsible for the Morgan Stanley Real Estate Fund’s (“MSREF”) West Coast operations and was a member of the global investment committee. During his tenure, MSREF was involved in over $3 billion of transactions, including significant acquisitions, refinancings and work-outs. From 1986 to 1993, Mr. Dritley was employed by The Koll Company, a major real estate development company in the western United States. From 1979 to 1984, Mr. Dritley was employed by Peat, Marwick, Mitchell in Kansas City and New York City.
Mr. Dritley has 30 years of experience in the real estate industry. His experience has ranged from the acquisition, entitlement, development and redevelopment of over 14 million square feet of properties in Southern California, to creating and managing an organization with over 100 employees in the United States, Europe and Asia focused on buying and restructuring non-performing loans.
65
From 2009 to 2016 Mr. Dritley served as a director, chairman of the compensation committee and member of the investment committee of Bixby Land Company, a private REIT with assets exceeding $1 billion, and from 2008 to 2016, he served as a Senior Advisor to Trigate Property Partners, a real estate private equity firm that manages a partnership with CalSTRS. He also has been active in several professional organizations, including the Los Angeles County Economic Development Corporation, for which he served on the Executive Committee, the Urban Land Institute and the Los Angeles Chapter of NAIOP, of which he is a past president. His community involvement included serving on the board of the Neighborhood Youth Association in Venice, California and volunteering his time for youth sports and Boy Scouts. Mr. Dritley is a Certified Public Accountant and holds a Bachelor’s Degree in Business Administration from the University of Missouri and an MBA from Harvard Business School.
The board of directors has concluded that Mr. Dritley is qualified to serve as an independent director for reasons including his expertise in real estate acquisition, restructuring and disposition. His over 30 years of experience in the real estate industry gives him significant experience that will be of great benefit to our company and make him well-positioned to advise the board of directors with respect to potential investment, restructuring and disposition opportunities. As Founder and Managing Partner of Kearny Real Estate Company, Mr. Dritley has encountered the myriad of practical, operational and other challenges that face large real estate companies like ours. Further, in the course of serving on the board of directors of Bixby Land Company and as a Senior Advisor to Trigate Property Partners, Mr. Dritley has developed strong leadership and consensus building skills that are a valuable asset to the board of directors. In addition, as a Certified Public Accountant, he possesses valuable expertise in evaluating the financial and operational results of companies such as ours.
Stuart A. Gabriel, Ph.D. is one of our independent directors, a position he has held since March 2008. Professor Gabriel is also an independent director of KBS REIT I and KBS REIT III, positions he has held for these entities since June 2005 and September 2010, respectively. Since June 2007, Professor Gabriel has served as Director of the Richard S. Ziman Center for Real Estate and Professor of Finance and Arden Realty Chair at the UCLA Anderson School of Management. Prior to joining UCLA he was Director and Lusk Chair in Real Estate at the USC Lusk Center for Real Estate, a position he held from 1999 to 2007. Professor Gabriel also served as Professor of Finance and Business Economics in the Marshall School of Business at the University of Southern California, a position he held from 1990 to 2007. He received a number of awards at UCLA and USC for outstanding graduate teaching. In 2004, he was elected President of the American Real Estate and Urban Economics Association. Professor Gabriel serves on the editorial boards of seven academic journals. He is also a Fellow of the Homer Hoyt Institute for Advanced Real Estate Studies. Since March 2016, Professor Gabriel has served on the board of directors of KB Home and is a member of its audit committee. Professor Gabriel has published extensively on the topics of real estate finance and urban and regional economics. His teaching and academic research experience include analysis of real estate and real estate capital markets performance as well as structured finance products, including credit default swaps, commercial mortgage-backed securities and collateralized debt obligations. Professor Gabriel serves as a consultant to numerous corporate and governmental entities. From 1986 through 1990, Professor Gabriel served on the economics staff of the Federal Reserve Board in Washington, D.C. He also has been a Visiting Scholar at the Federal Reserve Bank of San Francisco. Professor Gabriel holds a Ph.D. in Economics from the University of California, Berkeley.
The board of directors has concluded that Professor Gabriel is qualified to serve as an independent director for reasons including his extensive knowledge and understanding of the real estate and finance markets and real estate finance products. As a professor of real estate finance and economics, Professor Gabriel brings unique perspective to the board of directors. His years of research and analysis of the real estate and finance markets make Professor Gabriel well-positioned to advise us with respect to our investment and financing strategy. This expertise also makes him an invaluable resource for assessing and managing risks facing our company. Through his experience as a director of KBS REIT I, KBS REIT III and KB Home, he also has an understanding of the requirements of serving on a public company board.
Corporate Governance
The Audit Committee
Our board of directors has established an audit committee. The audit committee’s function is to assist the board of directors in fulfilling its responsibilities by overseeing (i) our accounting and financial reporting processes, (ii) the integrity of our financial statements, (iii) our independent registered public accounting firm’s qualifications, performance and independence, and (iv) the performance of our internal audit function. The audit committee fulfills these responsibilities primarily by carrying out the activities enumerated in the audit committee charter. The audit committee updated and revised the audit committee charter in August 2016. The audit committee charter is available on our website at www.kbsreitii.com.
66
The members of the audit committee are Barbara R. Cambon, Jeffrey A. Dritley and Stuart A. Gabriel, Ph.D. The members of the audit committee appointed Mr. Gabriel as interim audit committee chair, and he will continue to serve in that role until the audit committee appoints a new audit committee chair. The board of directors has determined that all of the members of the audit committee are “independent” as defined by the New York Stock Exchange. All of the members of the audit committee have significant financial and/or accounting experience, and the board of directors has determined that all of the members of the audit committee satisfy the SEC’s requirements for an “audit committee financial expert.”
Code of Conduct and Ethics
We have adopted a Code of Conduct and Ethics that applies to all of our executive officers and directors, including but not limited to, our principal executive officer, principal financial officer and principal accounting officer. Our Code of Conduct and Ethics can be found at www.kbsreitii.com.
ITEM 11. | EXECUTIVE COMPENSATION |
Compensation of Executive Officers
Our conflicts committee, which is composed of all of our independent directors, discharges our board of directors’ responsibilities relating to the compensation of our executives. However, we currently do not have any paid employees and our executive officers do not receive any compensation directly from us for services rendered to us. Our executive officers are officers and/or employees of, or hold an indirect ownership interest in, our advisor and/or its affiliates, and our executive officers are compensated by these entities, in part, for their services to us or our subsidiaries. See Part III, Item 13, “Certain Relationships and Related Transactions, and Director Independence — Report of the Conflicts Committee — Certain Transactions with Related Persons” for a discussion of the fees paid to our advisor and its affiliates.
Compensation of Directors
If a director is also one of our executive officers, we do not pay any compensation to that person for services rendered as a director. The amount and form of compensation payable to our independent directors for their service to us is determined by the conflicts committee, based upon recommendations from our advisor. Four of our executive officers, Messrs. Bren, Hall, McMillan and Schreiber, manage and control our advisor, and through our advisor, they are involved in recommending and setting the compensation to be paid to our independent directors.
We have provided below certain information regarding compensation earned by or paid to our directors during fiscal year 2017.
Name | Fees Earned or Paid in Cash in 2017(1) | All Other Compensation | Total | |||||||||
Hank Adler (2) | $ | 39,832 | $ | — | $ | 39,832 | ||||||
Barbara R. Cambon | 138,675 | — | 138,675 | |||||||||
Jeffrey A. Dritley | 25,869 | — | 25,869 | |||||||||
Stuart A. Gabriel, Ph.D. | 124,675 | — | 124,675 | |||||||||
Peter McMillan III (3) | — | — | — | |||||||||
Charles J. Schreiber, Jr. (3) | — | — | — | |||||||||
(1) Fees Earned or Paid in Cash in 2017 include meeting fees earned in 2016 but paid or reimbursed in the first quarter of 2017 as follows: Professor Adler $11,333, Ms. Cambon $14,333, and Professor Gabriel $11,333.
(2) Mr. Adler resigned as a member of our board of directors effective March 27, 2017.
(3) Directors who are also our executive officers do not receive compensation for services rendered as a director.
67
Cash Compensation
Through October 30, 2017, we compensated each of our independent directors with an annual retainer of $40,000. In addition, we paid our independent directors for attending board of directors, audit committee, conflicts committee and Special Committee meetings, as follows:
• | $2,500 for each board of directors meeting attended; |
• | $2,500 for each audit or conflicts committee meeting attended (except that the committee chairman was paid $3,000 for each audit or conflicts committee meeting attended); |
• | $2,000 for each Special Committee meeting attended (except that the committee chairman was paid $3,000 for each Special Committee meeting attended); |
• | $2,000 for each teleconference board of directors meeting attended; |
• | $2,000 for each teleconference audit or conflicts committee meeting attended (except that the committee chairman was paid $3,000 for each teleconference audit or conflicts committee meeting attended); and |
• | $2,000 for each teleconference Special Committee meeting attended (except that the committee chairman was paid $3,000 for each Special Committee teleconference meeting attended). |
All directors received reimbursement of reasonable out-of-pocket expenses incurred in connection with attendance at board of directors meetings and committee meetings.
On October 31, 2017, the conflicts committee approved a revised compensation structure for our independent directors. Commencing on October 31, 2017, we compensate each of our independent directors with an annual retainer of $135,000. In addition, we pay our independent directors for attending board of directors, audit committee, conflicts committee and Special Committee meetings as follows:
• | each member of the audit committee and conflicts committee is paid $10,000 annually for service on such committees (except that the chair of each of the audit committee and conflicts committee is paid $20,000 annually for service as the chair of such committees); |
• | after the tenth board of directors meeting of each calendar year, each independent director is paid (i) $2,500 in cash for each in-person board of directors meeting attended for the remainder of the calendar year and (ii) $2,000 in cash for each teleconference board of directors meeting attended for the remainder of the calendar year; |
• | after the tenth audit committee meeting of each calendar year, each member of the audit committee is paid (i) $2,500 in cash for each in-person audit committee meeting attended for the remainder of the calendar year and (ii) $2,000 in cash for each teleconference audit committee meeting attended for the remainder of the calendar year (except that the audit committee chair is paid $3,000 for each in-person and teleconference audit committee meeting attended after the tenth audit committee meeting of each calendar year, for the remainder of each calendar year); |
• | after the tenth conflicts committee meeting of each calendar year, each member of the conflicts committee is paid (i) $2,500 in cash for each in-person conflicts committee meeting attended for the remainder of the calendar year and (ii) $2,000 in cash for each teleconference conflicts committee meeting attended for the remainder of the calendar year (except that the conflicts committee chair is paid $3,000 for each in-person and teleconference conflicts committee meeting attended after the tenth conflicts committee meeting of each calendar year, for the remainder of each calendar year); and |
• | each member of the Special Committee is paid $2,000 in cash for each in-person and teleconference Special Committee meeting attended (except that the Special Committee chair is paid $3,000 for each in-person and teleconference Special Committee meeting attended). |
All directors receive reimbursement of reasonable out-of-pocket expenses incurred in connection with attendance at board of directors meetings and committee meetings.
68
ITEM 12. | SECURITY OWNERSHIP OF CERTAIN BENEFICIAL OWNERS AND MANAGEMENT AND RELATED STOCKHOLDER MATTERS |
Stock Ownership
The following table shows, as of March 1, 2018, the amount of our common stock beneficially owned (unless otherwise indicated) by (1) any person who is known by us to be the beneficial owner of more than 5% of the outstanding shares of our common stock, (2) our directors, (3) our executive officers, and (4) all of our directors and executive officers as a group.
Name and Address of Beneficial Owner (1) | Amount and Nature of Beneficial Ownership (2) | Percentage of all Outstanding Shares | ||
KBS Capital Advisors LLC | 20,000 (3) | * | ||
Peter M. Bren, President | 20,000 (3) | * | ||
Keith D. Hall, Executive Vice President | 20,000 (3) | * | ||
Peter McMillan III, Executive Vice President, Treasurer, Secretary and Director | 20,000 (3) | * | ||
Charles J. Schreiber, Jr., Chairman of the Board, Chief Executive Officer and Director | 20,000 (3) | * | ||
Jeffrey K. Waldvogel, Chief Financial Officer | — | — | ||
Stacie K. Yamane, Chief Accounting Officer | — | — | ||
Barbara R. Cambon, Independent Director | — | — | ||
Jeffrey A. Dritley, Independent Director | — | — | ||
Stuart A. Gabriel, Ph.D., Independent Director | 2,680 | — | ||
All executive officers and directors as a group | 22,680 (3) | * | ||
_____________________
* Less than 1% of the outstanding common stock.
(1) The address of each named beneficial owner is 800 Newport Center Drive, Suite 700, Newport Beach, California 92660.
(2) None of the shares is pledged as security.
(3) Includes 20,000 shares owned by KBS Capital Advisors, which is indirectly owned and controlled by Peter M. Bren, Keith D. Hall, Peter McMillan III and Charles J. Schreiber, Jr.
ITEM 13. | CERTAIN RELATIONSHIPS AND RELATED TRANSACTIONS AND DIRECTOR INDEPENDENCE |
Director Independence
Although our shares are not listed for trading on any national securities exchange, a majority of the directors, and all of the members of the audit committee, the conflicts committee and the Special Committee, are “independent” as defined by the New York Stock Exchange. The board of directors has affirmatively determined that Barbara R. Cambon, Jeffrey A. Dritley and Stuart A. Gabriel, Ph.D. each satisfies the New York Stock Exchange independence standards.
In determining that Professor Gabriel is independent under the New York Stock Exchange independence standards, the board of directors considered that (i) Peter M. Bren, one of our executive officers, is a member of the UCLA Anderson School of Management Board of Advisors and is a founding member of the Richard S. Ziman Center for Real Estate at the UCLA Anderson School of Management, (ii) that Professor Gabriel is a Director of the Richard S. Ziman Center for Real Estate and Professor of Finance and Arden Realty Chair at the UCLA Anderson School of Management and (iii) that in March 2012, Mr. Bren pledged a gift of $1.25 million to the Richard S. Ziman Center for Real Estate at the UCLA Anderson School of Management. The contribution by Mr. Bren was made over five years in the amount of $250,000 per year. In addition, the board of directors considered that in 2017 Mr. Bren made an additional contribution to the Richard S. Ziman Center for Real Estate at the UCLA Anderson School of Management in the amount of $250,000. Because these contributions were made to a tax exempt entity and the contributions did not exceed $250,000 in any year, the board of directors determined that these contributions were not material and Professor Gabriel met the New York Stock Exchange independence standards.
Report of the Conflicts Committee
Review of Our Policies
The conflicts committee has reviewed our policies and determined that they are in the best interest of our stockholders. Set forth below is a discussion of the basis for that determination.
69
Portfolio Management, Disposition and Distribution Policies. On January 27, 2016, our board of directors formed the Special Committee composed of all of our independent directors to explore the availability of strategic alternatives involving us. As part of the process of exploring strategic alternatives, on February 23, 2016, the Special Committee engaged Evercore to act as our financial advisor and to assist us and the Special Committee with this process. Under the terms of the engagement, Evercore provided various financial advisory services, as requested by the Special Committee as customary for an engagement in connection with exploring strategic alternatives. Although the Special Committee engaged Evercore to assist us and the Special Committee with the exploration of strategic alternatives for us, we are not obligated to enter into any particular transaction or any transaction at all.
The Special Committee determined that it would be in our best interest and the best interest of our stockholders to market some of our assets for sale while it continues to explore strategic alternatives for us. Based on the results of this sales effort, the board of directors may conclude that it would be in our best interest and the best interest of our stockholders to sell additional assets and, depending on the scope of the proposed asset sales, thereafter to adopt a plan of liquidation that would involve the sale of our remaining assets. In the event of such a determination, the proposed plan of liquidation would be presented to our stockholders for approval. The board of directors anticipates reaching a decision regarding strategic alternatives during 2018. Although we are exploring strategic alternatives and are marketing some of our assets for sale, there is no assurance that this process will result in stockholder liquidity, or provide a return to stockholders that equals or exceeds our estimated value per share.
Our charter requires that we seek stockholder approval of our liquidation if our shares of common stock are not listed on a national securities exchange by March 31, 2018, unless a majority of our independent directors determines that liquidation is not then in the best interest of our stockholders. On March 7, 2018, the conflicts committee unanimously determined to postpone approval of our liquidation while the Special Committee continues to explore strategic alternatives for us. Our charter requires that the conflicts committee revisit the issue of liquidation at least annually.
Our focus in 2018 is to: continue to strategically sell assets and consider special distributions to stockholders; negotiate lease renewals or new leases that facilitate the sales process and enhance property stability for prospective buyers; complete capital projects, such as renovations or amenity enhancements, to attract quality buyers; and finalize the strategic alternatives assessment and decide on a course of action.
We originally intended to hold our core properties for four to seven years. However, economic and market conditions have influenced and may continue to influence us to hold our investments for different periods of time and, as discussed above, the Special Committee is currently exploring the availability of strategic alternatives for us. We intend to hold our real estate-related investment until maturity in August 2018.
KBS Capital Advisors periodically performs a hold-sell analysis on each asset in our portfolio in order to determine a reasonable time to sell the asset and generate a strong return for our stockholders. Periodic reviews of each asset focus on the remaining available value enhancement opportunities for the asset, the demand for the asset in the marketplace, market conditions and our overall portfolio objectives to determine if the sale of the asset, whether via an individual sale or as part of a portfolio sale or merger, would generate a favorable return to our stockholders. We may sell an asset before the end of the expected holding period if we believe that market conditions and asset positioning have maximized its value to us or the sale of the asset would otherwise be in the best interests of our stockholders.
During the year ended December 31, 2017, we sold two office properties. Since inception, we have sold 20 properties and we have sold or received principal repayments on seven real estate loans receivable.
As discussed above, we may continue to make additional strategic asset sales as opportunities become available in the market and, from time to time, may declare special distributions to our stockholders that would be funded with the net proceeds from those asset sales or from cash flow from other sources. Any future special distributions we make from the proceeds of future dispositions will reduce our estimated value per share and this reduction will be reflected in our updated estimated value per share, which we expect to update no later than December 2018.
Over the long term, we expect that our distributions will generally be paid from cash flow from operations and FFO from current or prior periods (except with respect to distributions related to sales of our assets and distributions related to the repayment of principal under our mortgage loan investment). Our cash flow from operations has decreased and will continue to decrease as a result of our disposition activity, and we have adjusted, and may further adjust, our distribution policy with respect to the amount of monthly distribution payments to take into account our disposition activity and current real estate investments.
70
Our operating performance and ability to pay distributions from our cash flow from operations and/or the disposition of our assets cannot be accurately predicted and may deteriorate in the future due to numerous factors, including: the future operating performance of our investments in the existing real estate and the financial environment; the success and economic viability of our tenants; the ability of our borrower to continue to make its debt service payments and/or to repay the loan upon maturity; our ability to refinance existing indebtedness at comparable terms; changes in interest rates on our variable rate debt obligations; our ability to successfully dispose of additional assets; and the sources and amounts of cash we have available for distributions.
Distributions declared per common share were $0.274 in the aggregate for the year ended December 31, 2017. Distributions declared per common share assumes each share was issued and outstanding at each record date for distributions. Distributions per common share were based on a monthly record date for each month during the period commencing January 2017 through December 2017.
Acquisition and Investment Policies. We do not expect to make new acquisitions of real estate or real estate-related investments in the future. We invested in and manage a diverse portfolio of real estate and real estate-related investments. As of January 31, 2018, we owned nine real estate properties (consisting of eight office properties and an office campus consisting of eight office buildings) and one real estate loan receivable. See “ —Portfolio Management, Disposition and Distribution Policies” above.
Borrowing Policies. In order to execute our investment strategy, we primarily utilized secured debt to finance a portion of our investment portfolio. Management remains vigilant in monitoring the risks inherent with the use of debt in our portfolio and is taking actions to ensure that these risks, including refinance and interest rate risks, are properly balanced with the benefit of using leverage. We limit our total liabilities to 75% of the cost (before deducting depreciation and other noncash reserves) of our tangible assets; however, we may exceed that limit if the majority of the conflicts committee approves each borrowing in excess of this limitation and we disclose such borrowings to our stockholders in our next quarterly report with an explanation from the conflicts committee of the justification for the excess borrowing. As of January 31, 2018, our borrowings and other liabilities were approximately 34% of both the cost (before deducting depreciation and other noncash reserves) and book value (before deducting depreciation) of our tangible assets, respectively.
Policy Regarding Working Capital Reserves. We establish an annual budget for capital requirements and working capital reserves that we update periodically during the year. We may use cash on hand, proceeds from asset sales or loan receivable repayments, debt proceeds and cash flow from operations to meet our needs for working capital for the upcoming year and to build a moderate level of cash reserves.
Policies Regarding Operating Expenses. Under our charter, we are required to limit our total operating expenses to the greater of 2% of our average invested assets or 25% of our net income for the four most recently completed fiscal quarters, as these terms are defined in our charter, unless the conflicts committee has determined that such excess expenses were justified based on unusual and non-recurring factors. Operating expenses for the four fiscal quarters ended December 31, 2017 did not exceed the charter-imposed limitation. For the four consecutive quarters ended December 31, 2017, total operating expenses represented approximately 1.1% of our average invested assets and approximately 26.0% of net income.
Policy Regarding Transactions with Related Persons. Our charter requires the conflicts committee to review and approve all transactions between us and our advisor, any of our officers or directors or any of their affiliates. Prior to entering into a transaction with a related party, a majority of the conflicts committee must conclude that the transaction is fair and reasonable to us. In addition, our Code of Conduct and Ethics lists examples of types of transactions with related parties that would create prohibited conflicts of interest and requires our officers and directors to be conscientious of actual and potential conflicts of interest with respect to our interests and to seek to avoid such conflicts or handle such conflicts in an ethical manner at all times consistent with applicable law. Our executive officers and directors are required to report potential and actual conflicts to the Compliance Officer, currently our advisor’s Chief Audit Executive, via the Ethics Hotline or directly to the audit committee chair, as appropriate. Until the audit committee appoints a new chair, any potential or actual conflicts that would otherwise have been reported to the audit committee chair will be reported to Professor Gabriel, the interim chair of the audit committee.
Certain Transactions with Related Persons. The conflicts committee has reviewed the material transactions between our affiliates and us since the beginning of 2017 as well as any such currently proposed transactions. Set forth below is a description of such transactions and the conflicts committee’s report on their fairness.
71
We have entered into agreements with certain affiliates pursuant to which they provide services to us. Peter M. Bren, Keith D. Hall, Peter McMillan III and Charles J. Schreiber, Jr. control and indirectly own KBS Capital Advisors and KBS Capital Markets Group, the entity that acted as our dealer manager. They are also some of our executive officers. Each of Messrs. Bren, Hall, McMillan and Schreiber actively participate in the management and operations of our advisor. Our advisor has three managers: an entity owned and controlled by Mr. Bren; an entity owned and controlled by Messrs. Hall and McMillan; and an entity owned and controlled by Mr. Schreiber.
Our Relationship with KBS Capital Advisors. Since our inception, our advisor has provided day-to-day management of our business. Among the services that are provided or have been provided by our advisor under the terms of the advisory agreement are the following:
• | finding, presenting and recommending to us real estate and real estate-related investment opportunities consistent with our investment policies and objectives; |
• | structuring the terms and conditions of our investments, sales and joint ventures; |
• | acquiring properties and other investments on our behalf in compliance with our investment objectives and policies; |
• | sourcing and structuring our loan originations and acquisitions; |
• | arranging for financing and refinancing of our properties and our other investments; |
• | entering into leases and service contracts for our properties; |
• | supervising and evaluating each property manager’s performance; |
• | reviewing and analyzing the properties’ operating and capital budgets; |
• | assisting us in obtaining insurance; |
• | generating an annual budget for us; |
• | reviewing and analyzing financial information for each of our assets and our overall portfolio; |
• | formulating and overseeing the implementation of strategies for the administration, promotion, management, operation, maintenance, improvement, financing and refinancing, marketing, leasing and disposition of our properties and other investments; |
• | performing investor-relations services; |
• | maintaining our accounting and other records and assisting us in filing all reports required to be filed with the SEC, the IRS and other regulatory agencies; |
• | engaging in and supervising the performance of our agents, including our registrar and transfer agent; and |
• | performing any other services reasonably requested by us. |
Our advisor is subject to the supervision of the board of directors and only has such authority as we may delegate to it as our agent. The advisory agreement has a one-year term expiring May 21, 2018, subject to an unlimited number of successive one-year renewals upon the mutual consent of the parties. From January 1, 2017 through the most recent date practicable, which was January 31, 2018, we compensated our advisor as set forth below.
With respect to investments in real estate, we pay our advisor a monthly asset management fee equal to one-twelfth of 0.75% of the amount paid or allocated to acquire the investment, plus the cost of any subsequent development, construction or improvements to the property. This amount includes any portion of the investment that was debt financed and is inclusive of acquisition fees and expenses related thereto. In the case of investments made through joint ventures, the asset management fee is determined based on our proportionate share of the underlying investment. With respect to investments in loans and any investments other than real estate, we pay our advisor a monthly asset management fee calculated, each month, as one-twelfth of 0.75% of the lesser of (i) the amount paid or allocated to acquire or fund the loan or other investment (which amount includes any portion of the investment that was debt financed and is inclusive of acquisition or origination fees and expenses related thereto) and (ii) the outstanding principal amount of such loan or other investment, plus the acquisition or origination fees and expenses related to the acquisition or funding of such investment, as of the time of calculation. Asset management fees from January 1, 2017 through January 31, 2018 totaled approximately $12.6 million, all of which had been paid as of January 31, 2018.
72
Under the advisory agreement, our advisor and its affiliates have the right to seek reimbursement from us for all costs and expenses they incur in connection with their provision of services to us, including our allocable share of our advisor’s overhead, such as rent, employee costs, utilities, accounting software and cybersecurity costs. We reimburse our advisor for our allocable portion of the salaries, benefits and overhead of internal audit department personnel providing services to us. In the future, our advisor may seek reimbursement for additional employee costs. However, we will not reimburse our advisor or its affiliates for employee costs in connection with services for which our advisor earns acquisition, origination or disposition fees (other than reimbursement of travel and communication expenses) or for the salaries and benefits our advisor or its affiliates may pay to our executive officers. From January 1, 2017 through January 31, 2018, we reimbursed our advisor for $257,000 of operating expenses, including $232,000 of employee costs. We also reimburse our advisor for certain of our direct costs incurred from third parties that were initially paid by our advisor on our behalf.
For substantial assistance in connection with the sale of properties or other investments, we pay our advisor or its affiliates 1.0% of the contract sales price of each property or other investment sold; provided, however, in no event may aggregate disposition fees paid to our advisor, its affiliates and unaffiliated third parties exceed 6.0% of the contract sales price. From January 1, 2017 through January 31, 2018, we incurred $0.9 million of disposition fees, all of which had been paid as of January 31, 2018.
From January 1, 2017 through January 31, 2018, our advisor paid us a $0.1 million property insurance rebate.
The conflicts committee considers our relationship with our advisor during 2017 to be fair. The conflicts committee believes that the amounts payable to our advisor under the advisory agreement are similar to those paid by other publicly offered, unlisted, externally advised REITs and that this compensation is necessary in order for our advisor to provide the desired level of services to us and our stockholders.
Our Relationship with KBS Capital Markets Group. We have entered into a fee reimbursement agreement (the “AIP Reimbursement Agreement”) with our dealer manager pursuant to which we agreed to reimburse our dealer manager for certain fees and expenses it incurs for administering our participation in the DTCC Alternative Investment Product Platform with respect to certain accounts of our stockholders serviced through the platform. From January 1, 2017 through January 31, 2018, we incurred and paid $92,000 of costs and expenses related to the AIP Reimbursement Agreement.
The conflicts committee believes that this arrangement with KBS Capital Markets Group is fair.
Our Relationship with other KBS-Affiliated Entities. On January 6, 2014, we, together with KBS REIT I, KBS REIT III, KBS Strategic Opportunity REIT, KBS Legacy Partners Apartment REIT, KBS Strategic Opportunity REIT II, our dealer manager, our advisor and other KBS-affiliated entities, entered into an errors and omissions and directors and officers liability insurance program where the lower tiers of such insurance coverage are shared. The cost of these lower tiers is allocated by our advisor and its insurance broker among each of the various entities covered by the program, and is billed directly to each entity. The allocation of these shared coverage costs is proportionate to the pricing by the insurance marketplace for the first tiers of directors and officers liability coverage purchased individually by each REIT. Our advisor’s and our dealer manager’s portion of the shared lower tiers’ cost is proportionate to the respective entities’ prior cost for the errors and omissions insurance. In June 2015, KBS Growth & Income REIT was added to the insurance program at terms similar to those described above. In June 2017, we renewed our participation in the program, and the program is effective through June 30, 2018. As KBS REIT I was implementing its plan of liquidation, at renewal in June 2017, KBS REIT I elected to cease participation in the program and obtain separate insurance coverage.
The conflicts committee believes this arrangement is fair.
During the year ended December 31, 2017 and from January 1, 2018 through January 31, 2018, no other transactions occurred between us and KBS REIT I, KBS REIT III, KBS Strategic Opportunity REIT, KBS Legacy Partners Apartment REIT, KBS Strategic Opportunity REIT II, KBS Growth & Income REIT, our advisor, our dealer manager or other KBS-affiliated entities.
The conflicts committee has determined that the policies set forth in this Report of the Conflicts Committee are in the best interests of our stockholders because they provide us with the highest likelihood of achieving our investment objectives.
March 7, 2018 | The Conflicts Committee of the Board of Directors: Barbara R. Cambon (chair), Jeffrey A. Dritley and Stuart A. Gabriel, Ph.D. | |
73
ITEM 14. | PRINCIPAL ACCOUNTING FEES AND SERVICES |
Independent Registered Public Accounting Firm
During the year ended December 31, 2017, Ernst & Young LLP served as our independent registered public accounting firm and provided certain tax and other services. Ernst & Young has served as our independent registered public accounting firm since our formation.
Pre-Approval Policies
In order to ensure that the provision of such services does not impair the independent registered public accounting firm’s independence, the audit committee charter imposes a duty on the audit committee to pre-approve all auditing services performed for us by our independent registered public accounting firm, as well as all permitted non-audit services. In determining whether or not to pre-approve services, the audit committee considers whether the service is a permissible service under the rules and regulations promulgated by the SEC. The audit committee may, in its discretion, delegate to one or more of its members the authority to pre-approve any audit or non-audit services to be performed by our independent registered public accounting firm, provided any such approval is presented to and approved by the full audit committee at its next scheduled meeting.
For the years ended December 31, 2017 and 2016, all services rendered by Ernst & Young were pre-approved in accordance with the policies and procedures described above.
Principal Independent Registered Public Accounting Firm Fees
The audit committee reviewed the audit and non-audit services performed by Ernst & Young, as well as the fees charged by Ernst & Young for such services. In its review of the non-audit service fees, the audit committee considered whether the provision of such services is compatible with maintaining the independence of Ernst & Young. The aggregate fees billed to us for professional accounting services, including the audit of our annual financial statements by Ernst & Young for the years ended December 31, 2017 and 2016, are set forth in the table below.
2017 | 2016 | ||||||
Audit fees | $ | 519,500 | $ | 480,000 | |||
Audit-related fees | — | — | |||||
Tax fees | 102,120 | 105,865 | |||||
All other fees | 570 | 285 | |||||
Total | $ | 622,190 | $ | 586,150 | |||
For purposes of the preceding table, Ernst & Young’s professional fees are classified as follows:
• | Audit fees - These are fees for professional services performed for the audit of our annual financial statements and the required review of quarterly financial statements and other procedures performed by Ernst & Young in order for them to be able to form an opinion on our consolidated financial statements. These fees also cover services that are normally provided by independent registered public accounting firms in connection with statutory and regulatory filings or engagements. |
• | Audit-related fees - These are fees for assurance and related services that traditionally are performed by independent registered public accounting firms that are reasonably related to the performance of the audit or review of our financial statements, such as due diligence related to acquisitions and dispositions, attestation services that are not required by statute or regulation, internal control reviews and consultation concerning financial accounting and reporting standards. |
• | Tax fees - These are fees for all professional services performed by professional staff in our independent registered public accounting firm’s tax division, except those services related to the audit of our financial statements. These include fees for tax compliance, tax planning and tax advice, including federal, state and local issues. Services may also include assistance with tax audits and appeals before the IRS and similar state and local agencies, as well as federal, state and local tax issues related to due diligence. |
• | All other fees - These are fees for any services not included in the above-described categories. |
74
PART IV
ITEM 15. | EXHIBITS, FINANCIAL STATEMENT SCHEDULES |
(a) Financial Statement Schedules
See the Index to Financial Statements at page F-1 of this report.
The following financial statement schedule is included herein at pages F-32 through F-33 of this report:
Schedule III - Real Estate Assets and Accumulated Depreciation and Amortization
(b) Exhibits
Ex. | Description | |
3.1 | ||
3.2 | ||
4.1 | ||
10.1 | ||
10.2 | ||
21.1 | ||
31.1 | ||
31.2 | ||
32.1 | ||
32.2 | ||
99.1 | ||
101.INS | XBRL Instance Document | |
101.SCH | XBRL Taxonomy Extension Schema | |
101.CAL | XBRL Taxonomy Extension Calculation Linkbase | |
101.DEF | XBRL Taxonomy Extension Definition Linkbase | |
101.LAB | XBRL Taxonomy Extension Label Linkbase | |
101.PRE | XBRL Taxonomy Extension Presentation Linkbase | |
75
INDEX TO CONSOLIDATED FINANCIAL STATEMENTS
Consolidated Financial Statements | |
Financial Statement Schedule | |
All other schedules are omitted because they are not applicable or the required information is shown in the financial statements or notes thereto.
F-1
REPORT OF INDEPENDENT REGISTERED PUBLIC ACCOUNTING FIRM
To the Stockholders and the Board of Directors of
KBS Real Estate Investment Trust II, Inc.
Opinion on the Financial Statements
We have audited the accompanying consolidated balance sheets of KBS Real Estate Investment Trust II, Inc. (the Company) as of December 31, 2017 and 2016, the related consolidated statements of operations, comprehensive income, stockholders’ equity and cash flows for each of the three years in the period ended December 31, 2017, and the related notes and financial statement schedule listed in the Index at Item 15(a), Schedule III - Real Estate Assets and Accumulated Depreciation and Amortization (collectively referred to as the “consolidated financial statements”). In our opinion, the consolidated financial statements present fairly, in all material respects, the consolidated financial position of the Company at December 31, 2017 and 2016, and the consolidated results of its operations and its cash flows for each of the three years in the period ended December 31, 2017, in conformity with U.S. generally accepted accounting principles.
Basis for Opinion
These financial statements are the responsibility of the Company's management. Our responsibility is to express an opinion on the Company’s financial statements based on our audits. We are a public accounting firm registered with the Public Company Accounting Oversight Board (United States) (PCAOB) and are required to be independent with respect to the Company in accordance with the U.S. federal securities laws and the applicable rules and regulations of the Securities and Exchange Commission and the PCAOB.
We conducted our audits in accordance with the standards of the PCAOB. Those standards require that we plan and perform the audit to obtain reasonable assurance about whether the financial statements are free of material misstatement, whether due to error or fraud. The Company is not required to have, nor were we engaged to perform, an audit of its internal control over financial reporting. As part of our audits we are required to obtain an understanding of internal control over financial reporting but not for the purpose of expressing an opinion on the effectiveness of the Company's internal control over financial reporting. Accordingly, we express no such opinion.
Our audits included performing procedures to assess the risks of material misstatement of the financial statements, whether due to error or fraud, and performing procedures that respond to those risks. Such procedures included examining, on a test basis, evidence regarding the amounts and disclosures in the financial statements. Our audits also included evaluating the accounting principles used and significant estimates made by management, as well as evaluating the overall presentation of the financial statements. We believe that our audits provide a reasonable basis for our opinion.
/s/ Ernst & Young LLP
We have served as the Company’s auditor since 2007.
Irvine, California
March 8, 2018
F-2
KBS REAL ESTATE INVESTMENT TRUST II, INC.
CONSOLIDATED BALANCE SHEETS
(in thousands, except share and per share amounts)
December 31, | ||||||||
2017 | 2016 | |||||||
Assets | ||||||||
Real estate: | ||||||||
Land | $ | 180,692 | $ | 180,692 | ||||
Buildings and improvements | 969,732 | 959,222 | ||||||
Tenant origination and absorption costs | 57,021 | 64,117 | ||||||
Total real estate held for investment, cost | 1,207,445 | 1,204,031 | ||||||
Less accumulated depreciation and amortization | (176,576 | ) | (140,346 | ) | ||||
Total real estate held for investment, net | 1,030,869 | 1,063,685 | ||||||
Real estate held for sale, net | — | 62,051 | ||||||
Total real estate, net | 1,030,869 | 1,125,736 | ||||||
Real estate loan receivable, net | 13,923 | 14,079 | ||||||
Total real estate and real estate-related investments, net | 1,044,792 | 1,139,815 | ||||||
Cash and cash equivalents | 81,017 | 48,009 | ||||||
Restricted cash | 5,626 | — | ||||||
Rents and other receivables, net | 61,443 | 58,602 | ||||||
Above-market leases, net | 2,118 | 4,466 | ||||||
Assets related to real estate held for sale | — | 4,429 | ||||||
Prepaid expenses and other assets | 30,114 | 31,459 | ||||||
Total assets | $ | 1,225,110 | $ | 1,286,780 | ||||
Liabilities and stockholders’ equity | ||||||||
Notes payable: | ||||||||
Notes payable, net | $ | 502,299 | $ | 505,347 | ||||
Notes payable related to real estate held for sale, net | — | 18,424 | ||||||
Total notes payable, net | 502,299 | 523,771 | ||||||
Accounts payable and accrued liabilities | 13,166 | 18,422 | ||||||
Due to affiliate | 84 | 41 | ||||||
Distributions payable | 4,376 | 4,493 | ||||||
Below-market leases, net | 1,304 | 2,876 | ||||||
Liabilities related to real estate held for sale | — | 17 | ||||||
Other liabilities | 9,299 | 10,253 | ||||||
Total liabilities | 530,528 | 559,873 | ||||||
Commitments and contingencies (Note 12) | ||||||||
Redeemable common stock | 10,000 | 10,000 | ||||||
Stockholders’ equity: | ||||||||
Preferred stock, $.01 par value; 10,000,000 shares authorized, no shares issued and outstanding | — | — | ||||||
Common stock, $.01 par value; 1,000,000,000 shares authorized, 187,666,302 and 188,719,952 shares issued and outstanding as of December 31, 2017 and December 31, 2016, respectively | 1,877 | 1,887 | ||||||
Additional paid-in capital | 1,673,767 | 1,679,524 | ||||||
Cumulative distributions in excess of net income | (991,062 | ) | (964,504 | ) | ||||
Total stockholders’ equity | 684,582 | 716,907 | ||||||
Total liabilities and stockholders’ equity | $ | 1,225,110 | $ | 1,286,780 | ||||
See accompanying notes to consolidated financial statements.
F-3
KBS REAL ESTATE INVESTMENT TRUST II, INC.
CONSOLIDATED STATEMENTS OF OPERATIONS
(in thousands, except share and per share amounts)
Years Ended December 31, | ||||||||||||
2017 | 2016 | 2015 | ||||||||||
Revenues: | ||||||||||||
Rental income | $ | 127,521 | $ | 133,408 | $ | 138,745 | ||||||
Tenant reimbursements | 13,641 | 14,108 | 14,749 | |||||||||
Interest income from real estate loans receivable | 1,060 | 1,075 | 4,552 | |||||||||
Other operating income | 7,237 | 6,865 | 7,249 | |||||||||
Total revenues | 149,459 | 155,456 | 165,295 | |||||||||
Expenses: | ||||||||||||
Operating, maintenance, and management | 34,719 | 34,603 | 36,069 | |||||||||
Real estate taxes and insurance | 19,816 | 20,128 | 20,528 | |||||||||
Asset management fees to affiliate | 11,617 | 11,811 | 12,082 | |||||||||
General and administrative expenses | 4,541 | 6,370 | 4,485 | |||||||||
Depreciation and amortization | 54,047 | 58,768 | 56,271 | |||||||||
Interest expense | 17,466 | 16,651 | 22,115 | |||||||||
Impairment charge on real estate | — | — | 23,082 | |||||||||
Total expenses | 142,206 | 148,331 | 174,632 | |||||||||
Other income: | ||||||||||||
Other interest income | 375 | 529 | 293 | |||||||||
Gain on sales of real estate | 17,486 | 9,093 | 27,421 | |||||||||
Total other income | 17,861 | 9,622 | 27,714 | |||||||||
Net income | $ | 25,114 | $ | 16,747 | $ | 18,377 | ||||||
Net income per common share | $ | 0.13 | $ | 0.09 | $ | 0.10 | ||||||
Weighted-average number of common shares outstanding, basic and diluted | 188,235,450 | 189,111,086 | 190,227,577 | |||||||||
See accompanying notes to consolidated financial statements.
F-4
KBS REAL ESTATE INVESTMENT TRUST II, INC.
CONSOLIDATED STATEMENTS OF COMPREHENSIVE INCOME
(in thousands)
Years Ended December 31, | |||||||||||
2017 | 2016 | 2015 | |||||||||
Net income | $ | 25,114 | $ | 16,747 | $ | 18,377 | |||||
Other comprehensive income: | |||||||||||
Reclassification of realized losses recognized on interest rate swaps (effective portion) | — | 60 | 1,577 | ||||||||
Total other comprehensive income | — | 60 | 1,577 | ||||||||
Total comprehensive income | $ | 25,114 | $ | 16,807 | $ | 19,954 | |||||
See accompanying notes to consolidated financial statements.
F-5
KBS REAL ESTATE INVESTMENT TRUST II, INC.
CONSOLIDATED STATEMENTS OF STOCKHOLDERS’ EQUITY
(dollars in thousands)
Additional Paid-in Capital | Cumulative Distributions in Excess of Net Income (Loss) | Accumulated Other Comprehensive Income (Loss) | Total Stockholders’ Equity | ||||||||||||||||||||
Common Stock | |||||||||||||||||||||||
Shares | Amounts | ||||||||||||||||||||||
Balance, December 31, 2014 | 190,561,603 | $ | 1,905 | $ | 1,690,010 | $ | (890,751 | ) | $ | (1,637 | ) | $ | 799,527 | ||||||||||
Net income | — | — | — | 18,377 | — | 18,377 | |||||||||||||||||
Other comprehensive income | — | — | — | — | 1,577 | 1,577 | |||||||||||||||||
Redemptions of common stock | (1,005,418 | ) | (10 | ) | (5,804 | ) | — | — | (5,814 | ) | |||||||||||||
Distributions declared | — | — | — | (55,737 | ) | — | (55,737 | ) | |||||||||||||||
Balance, December 31, 2015 | 189,556,185 | $ | 1,895 | $ | 1,684,206 | $ | (928,111 | ) | $ | (60 | ) | $ | 757,930 | ||||||||||
Net income | — | — | — | 16,747 | — | 16,747 | |||||||||||||||||
Other comprehensive income | — | — | — | — | 60 | 60 | |||||||||||||||||
Redemptions of common stock | (836,233 | ) | (8 | ) | (4,682 | ) | — | — | (4,690 | ) | |||||||||||||
Distributions declared | — | — | — | (53,140 | ) | — | (53,140 | ) | |||||||||||||||
Balance, December 31, 2016 | 188,719,952 | $ | 1,887 | $ | 1,679,524 | $ | (964,504 | ) | $ | — | $ | 716,907 | |||||||||||
Net income | — | — | — | 25,114 | — | 25,114 | |||||||||||||||||
Redemptions of common stock | (1,053,650 | ) | (10 | ) | (5,757 | ) | — | — | (5,767 | ) | |||||||||||||
Distributions declared | — | — | — | (51,672 | ) | — | (51,672 | ) | |||||||||||||||
Balance, December 31, 2017 | 187,666,302 | $ | 1,877 | $ | 1,673,767 | $ | (991,062 | ) | $ | — | $ | 684,582 | |||||||||||
See accompanying notes to consolidated financial statements.
F-6
KBS REAL ESTATE INVESTMENT TRUST II, INC.
CONSOLIDATED STATEMENTS OF CASH FLOWS
(in thousands)
Years Ended December 31, | ||||||||||||
2017 | 2016 | 2015 | ||||||||||
Cash Flows from Operating Activities: | ||||||||||||
Net income | $ | 25,114 | $ | 16,747 | $ | 18,377 | ||||||
Adjustments to reconcile net income to net cash provided by operating activities: | ||||||||||||
Depreciation and amortization | 54,047 | 58,768 | 56,271 | |||||||||
Impairment charge on real estate | — | — | 23,082 | |||||||||
Noncash interest income on real estate-related investments | 4 | 3 | 23 | |||||||||
Deferred rent | (864 | ) | (6,528 | ) | (6,692 | ) | ||||||
Bad debt expense | 515 | 258 | 156 | |||||||||
Amortization of above- and below-market leases, net | 762 | 453 | (680 | ) | ||||||||
Amortization of deferred financing costs | 1,106 | 1,748 | 1,975 | |||||||||
Unrealized gain on derivative instruments | (101 | ) | (478 | ) | (2,410 | ) | ||||||
Gain on sale of real estate, net | (17,486 | ) | (9,093 | ) | (27,421 | ) | ||||||
Changes in operating assets and liabilities: | ||||||||||||
Rents and other receivables | (2,610 | ) | (2,441 | ) | (2,843 | ) | ||||||
Prepaid expenses and other assets | (2,635 | ) | (5,837 | ) | (14,424 | ) | ||||||
Accounts payable and accrued liabilities | (4,203 | ) | (154 | ) | (1,403 | ) | ||||||
Due to affiliate | 43 | (8 | ) | 11 | ||||||||
Other liabilities | (847 | ) | 954 | (1,833 | ) | |||||||
Net cash provided by operating activities | 52,845 | 54,392 | 42,189 | |||||||||
Cash Flows from Investing Activities: | ||||||||||||
Proceeds from sale of real estate | 83,410 | 41,210 | 121,923 | |||||||||
Improvements to real estate | (17,639 | ) | (38,398 | ) | (23,502 | ) | ||||||
Principal repayments on real estate loans receivable | 152 | 128 | 435 | |||||||||
Proceeds from payoff or sale of real estate loans receivable | — | — | 58,272 | |||||||||
Net cash provided by investing activities | 65,923 | 2,940 | 157,128 | |||||||||
Cash Flows from Financing Activities: | ||||||||||||
Proceeds from notes payable | — | 17,000 | — | |||||||||
Principal payments on notes payable | (21,663 | ) | (40,175 | ) | (243,140 | ) | ||||||
Payments of deferred financing costs | (915 | ) | (879 | ) | (176 | ) | ||||||
Payments to redeem common stock | (5,767 | ) | (4,690 | ) | (5,814 | ) | ||||||
Distributions paid to common stockholders | (51,789 | ) | (53,372 | ) | (57,468 | ) | ||||||
Net cash used in financing activities | (80,134 | ) | (82,116 | ) | (306,598 | ) | ||||||
Net increase (decrease) in cash, cash equivalents and restricted cash | 38,634 | (24,784 | ) | (107,281 | ) | |||||||
Cash, cash equivalents and restricted cash, beginning of period | 48,009 | 72,793 | 180,074 | |||||||||
Cash, cash equivalents and restricted cash, end of period | $ | 86,643 | $ | 48,009 | $ | 72,793 | ||||||
Supplemental Disclosure of Cash Flow Information: | ||||||||||||
Interest paid | $ | 16,314 | $ | 15,411 | $ | 23,076 | ||||||
Supplemental Disclosure of Noncash Investing and Financing Activities: | ||||||||||||
Increase in accrued improvements to real estate | $ | — | $ | — | $ | 6,938 | ||||||
See accompanying notes to consolidated financial statements.
F-7
KBS REAL ESTATE INVESTMENT TRUST II, INC.
NOTES TO CONSOLIDATED FINANCIAL STATEMENTS
December 31, 2017
1. | ORGANIZATION |
KBS Real Estate Investment Trust II, Inc. (the “Company”) was formed on July 12, 2007 as a Maryland corporation that elected to be taxed as a real estate investment trust (“REIT”) beginning with the taxable year ended December 31, 2008. The Company conducts its business primarily through KBS Limited Partnership II, a Delaware limited partnership formed on August 23, 2007 (the “Operating Partnership”), and its subsidiaries. The Company is the sole general partner of and directly owns a 0.1% partnership interest in the Operating Partnership. The Company’s wholly-owned subsidiary, KBS REIT Holdings II LLC, a Delaware limited liability company formed on August 23, 2007 (“KBS REIT Holdings II”), owns the remaining 99.9% partnership interest in the Operating Partnership and is its sole limited partner.
The Company invested in a diverse portfolio of real estate and real estate-related investments. As of December 31, 2017, the Company owned nine real estate properties (consisting of eight office properties and an office campus consisting of eight office buildings). In addition, as of December 31, 2017, the Company owned one real estate loan receivable.
Subject to certain restrictions and limitations, the business of the Company is managed by KBS Capital Advisors LLC (the “Advisor”), an affiliate of the Company, pursuant to an advisory agreement the Company renewed with the Advisor on May 21, 2017 (the “Advisory Agreement”). The Advisory Agreement may be renewed for an unlimited number of one-year periods upon the mutual consent of the Advisor and the Company. Either party may terminate the Advisory Agreement upon 60 days’ written notice. The Advisor owns 20,000 shares of the Company’s common stock.
Upon commencing its initial public offering (the “Offering”), the Company retained KBS Capital Markets Group LLC (the “Dealer Manager”), an affiliate of the Advisor, to serve as the dealer manager of the Offering. The Company ceased offering shares of common stock in its primary offering on December 31, 2010 and terminated its primary offering on March 22, 2011. The Company terminated its dividend reinvestment plan effective May 29, 2014.
The Company sold 182,681,633 shares of common stock in its primary offering for gross offering proceeds of $1.8 billion. The Company sold 30,903,504 shares of common stock under its dividend reinvestment plan for gross offering proceeds of $298.2 million. Also as of December 31, 2017, the Company had redeemed 25,938,835 shares sold in the Offering for $245.8 million.
2. | SUMMARY OF SIGNIFICANT ACCOUNTING POLICIES |
Principles of Consolidation and Basis of Presentation
The consolidated financial statements include the accounts of the Company, KBS REIT Holdings II, the Operating Partnership, and their direct and indirect wholly owned subsidiaries. All significant intercompany balances and transactions are eliminated in consolidation.
The consolidated financial statements are prepared in accordance with U.S. generally accepted accounting principles (“GAAP”) as contained within the Financial Accounting Standards Board (“FASB”) Accounting Standards Codification (“ASC”) and the rules and regulations of the Securities and Exchange Commission (“SEC”).
Use of Estimates
The preparation of the consolidated financial statements and the accompanying notes thereto in conformity with GAAP requires management to make estimates and assumptions that affect the amounts reported in the consolidated financial statements and accompanying notes. Actual results could materially differ from those estimates.
Reclassifications
Certain amounts in the Company’s prior period consolidated financial statements have been reclassified to conform to the current period presentation. These reclassifications have not changed the results of operations of prior periods. During the year ended December 31, 2017, the Company sold two office properties. As a result, certain assets and liabilities were reclassified to held for sale on the consolidated balance sheets for all periods presented.
F-8
KBS REAL ESTATE INVESTMENT TRUST II, INC.
NOTES TO CONSOLIDATED FINANCIAL STATEMENTS (CONTINUED)
December 31, 2017
Revenue Recognition
Real Estate
The Company recognizes minimum rent, including rental abatements, lease incentives and contractual fixed increases attributable to operating leases, on a straight-line basis over the term of the related leases when collectibility is reasonably assured and records amounts expected to be received in later years as deferred rent receivable. If the lease provides for tenant improvements, the Company determines whether the tenant improvements, for accounting purposes, are owned by the tenant or the Company. When the Company is the owner of the tenant improvements, the tenant is not considered to have taken physical possession or have control of the physical use of the leased asset until the tenant improvements are substantially completed. When the tenant is the owner of the tenant improvements, any tenant improvement allowance (including amounts that a tenant can take in the form of cash or a credit against its rent) that is funded is treated as a lease incentive and amortized as a reduction of revenue over the lease term. Tenant improvement ownership is determined based on various factors including, but not limited to:
• | whether the lease stipulates how a tenant improvement allowance may be spent; |
• | whether the amount of a tenant improvement allowance is in excess of market rates; |
• | whether the tenant or landlord retains legal title to the improvements at the end of the lease term; |
• | whether the tenant improvements are unique to the tenant or general-purpose in nature; and |
• | whether the tenant improvements are expected to have any residual value at the end of the lease. |
The Company records property operating expense reimbursements due from tenants for common area maintenance, real estate taxes, and other recoverable costs in the period the related expenses are incurred.
The Company makes estimates of the collectibility of its tenant receivables related to base rents, including deferred rent receivable, expense reimbursements and other revenue or income. Management specifically analyzes accounts receivable, deferred rent receivable, historical bad debts, customer creditworthiness, current economic trends and changes in customer payment terms when evaluating the adequacy of the allowance for doubtful accounts. In addition, with respect to tenants in bankruptcy, management makes estimates of the expected recovery of pre-petition and post-petition claims in assessing the estimated collectibility of the related receivable. In some cases, the ultimate resolution of these claims can exceed one year. When a tenant is in bankruptcy, the Company will record a bad debt reserve for the tenant’s receivable balance and generally will not recognize subsequent rental revenue until cash is received or until the tenant is no longer in bankruptcy and has the ability to make rental payments.
The Company recognizes a gain on sales of real estate upon the closing of a transaction with the purchaser. Gains on real estate sold are recognized using the full accrual method when collectibility of the sales price is reasonably assured, the Company is not obligated to perform additional activities that may be considered significant, the initial investment from the buyer is sufficient and other profit recognition criteria have been satisfied. Gain on sales of real estate may be deferred in whole or in part until the requirements for gain recognition have been met.
Real Estate Loan Receivable
Interest income on the Company’s real estate loan receivable is recognized on an accrual basis over the life of the investment using the interest method. Direct loan origination fees and origination or acquisition costs, as well as acquisition premiums or discounts, are amortized over the term of the loan as an adjustment to interest income. The Company will place a loan on nonaccrual status when any portion of principal or interest is 90 days past due, or earlier when concern exists as to the ultimate collection of principal or interest. When a loan is placed on nonaccrual status, the Company will reserve for any unpaid accrued interest and generally will not recognize subsequent interest income until the cash is received, or the loan returns to accrual status. The Company will resume the accrual of interest if it determines the collection of interest, according to the contractual terms of the loan, is probable.
Cash and Cash Equivalents
The Company recognizes interest income on its cash and cash equivalents as it is earned and classifies such amounts as other interest income.
F-9
KBS REAL ESTATE INVESTMENT TRUST II, INC.
NOTES TO CONSOLIDATED FINANCIAL STATEMENTS (CONTINUED)
December 31, 2017
Real Estate
Depreciation and Amortization
Real estate costs related to the acquisition and improvement of properties are capitalized and amortized over the expected useful life of the asset on a straight-line basis. Repair and maintenance costs are charged to expense as incurred and significant replacements and betterments are capitalized. Repair and maintenance costs include all costs that do not extend the useful life of the real estate asset. The Company considers the period of future benefit of an asset to determine its appropriate useful life. Expenditures for tenant improvements are capitalized and amortized over the shorter of the tenant’s lease term or expected useful life. The Company anticipates the estimated useful lives of its assets by class to be generally as follows:
Buildings | 25-40 years |
Building improvements | 10-25 years |
Tenant improvements | Shorter of lease term or expected useful life |
Tenant origination and absorption costs | Remaining term of related leases, including below-market renewal periods |
Impairment of Real Estate and Related Intangible Assets and Liabilities
The Company continually monitors events and changes in circumstances that could indicate that the carrying amounts of its real estate and related intangible assets and liabilities may not be recoverable or realized. When indicators of potential impairment suggest that the carrying value of real estate and related intangible assets and liabilities may not be recoverable, the Company assesses the recoverability by estimating whether the Company will recover the carrying value of the real estate and related intangible assets and liabilities through its undiscounted future cash flows and its eventual disposition. If, based on this analysis, the Company does not believe that it will be able to recover the carrying value of the real estate and related intangible assets and liabilities, the Company would record an impairment loss to the extent that the carrying value exceeds the estimated fair value of the real estate and related intangible assets and liabilities.
Projecting future cash flows involves estimating expected future operating income and expenses related to the real estate and its related intangible assets and liabilities as well as market and other trends. Using inappropriate assumptions to estimate cash flows could result in incorrect fair values of the real estate and its related intangible assets and liabilities and could result in the overstatement of the carrying values of the Company’s real estate and related intangible assets and liabilities and an overstatement of the Company’s net income.
Real Estate Held for Sale
The Company generally considers real estate to be “held for sale” when the following criteria are met: (i) management commits to a plan to sell the property, (ii) the property is available for sale immediately, (iii) the property is actively being marketed for sale at a price that is reasonable in relation to its current fair value, (iv) the sale of the property within one year is considered probable and (v) significant changes to the plan to sell are not expected. Real estate that is held for sale and its related assets are classified as “real estate held for sale” and “assets related to real estate held for sale,” respectively, for all periods presented in the accompanying consolidated financial statements. Notes payable and other liabilities related to real estate held for sale are classified as “notes payable related to real estate held for sale” and “liabilities related to real estate held for sale,” respectively, for all periods presented in the accompanying consolidated financial statements. Real estate classified as held for sale is no longer depreciated and is reported at the lower of its carrying value or its estimated fair value less estimated costs to sell.
Change in a Plan to Sell
When real estate is initially considered “held for sale” it is measured at the lower of its depreciated book value or estimated fair value less estimated costs to sell. Changes in the market may compel the Company to decide to reclassify a property that was designated as held for sale to held for investment. A property that is reclassified from held for sale to held for investment is measured and recorded at the lower of (i) its carrying amount before the property was classified as held for sale, adjusted for any depreciation and amortization expense that would have been recognized had the property been continuously classified as held and used, or (ii) its fair value at the date of the subsequent decision not to sell. Any adjustment to the carrying amount of the property as a result of the reclassification is included in income from continuing operations as an impairment charge on real estate held for investment.
F-10
KBS REAL ESTATE INVESTMENT TRUST II, INC.
NOTES TO CONSOLIDATED FINANCIAL STATEMENTS (CONTINUED)
December 31, 2017
Real Estate Loan Receivable
The Company’s real estate loan receivable is recorded at amortized cost, net of loan loss reserves (if any), and evaluated for impairment at each balance sheet date. The amortized cost of a real estate loan receivable is the outstanding unpaid principal balance, net of unamortized acquisition premiums or discounts and unamortized costs and fees directly associated with the origination or acquisition of the loan.
As of December 31, 2017, there was no loan loss reserve and the Company did not record any impairment losses related to the real estate loan receivable during the years ended December 31, 2017, 2016 and 2015. However, in the future, the Company may experience losses from its loan receivable requiring the Company to record loan loss reserves. Realized losses on individual loans could be material and significantly exceed any recorded reserves.
The Company considers a loan to be impaired when, based upon current information and events, it believes that it is probable that the Company will be unable to collect all amounts due under the contractual terms of the loan agreement. The Company also considers a loan to be impaired if it grants the borrower a concession through a modification of the loan terms or if it expects to receive assets (including equity interests in the borrower) with fair values that are less than the carrying value of the loan in satisfaction of the loan. A reserve is established when the present value of payments expected to be received, observable market prices, the estimated fair value of the collateral (for loans that are dependent on the collateral for repayment) or amounts expected to be received in satisfaction of a loan are lower than the carrying value of that loan.
Failure to recognize impairments would result in the overstatement of earnings and the carrying value of the Company’s real estate loan held for investment. Actual losses, if any, could differ significantly from estimated amounts.
Cash and Cash Equivalents
The Company considers all short-term (with an original maturity of three months or less), highly-liquid investments utilized as part of the Company’s cash-management activities to be cash equivalents. Cash equivalents may include cash and short-term investments. Short-term investments are stated at cost, which approximates fair value.
The Company’s cash and cash equivalents balance exceeds federally insurable limits as of December 31, 2017. The Company monitors the cash balances in its operating accounts and adjusts the cash balances as appropriate; however, these cash balances could be impacted if the underlying financial institutions fail or are subject to other adverse conditions in the financial markets. To date, the Company has experienced no loss or lack of access to cash in its operating accounts.
Restricted Cash
Restricted cash is comprised of lender impound reserve accounts on the Company’s borrowings for capital improvements and replacements.
Rents and Other Receivables
The Company periodically evaluates the collectibility of amounts due from tenants and maintains an allowance for doubtful accounts for estimated losses resulting from the inability of tenants to make required payments under lease agreements. In addition, the Company maintains an allowance for deferred rent receivable that arises from the straight-lining of rents. The Company exercises judgment in establishing these allowances and considers payment history and current credit status of its tenants in developing these estimates.
Derivative Instruments
The Company enters into derivative instruments for risk management purposes to hedge its exposure to cash flow variability caused by changing interest rates on its variable rate notes payable. The Company records these derivative instruments at fair value on the accompanying consolidated balance sheets. Derivative instruments designated and qualifying as a hedge of the exposure to variability in expected future cash flows or other types of forecasted transactions are considered cash flow hedges. The change in fair value of the effective portion of a derivative instrument that is designated as a cash flow hedge is recorded as other comprehensive income (loss) in the accompanying consolidated statements of comprehensive income (loss) and consolidated statements of stockholders’ equity. The changes in fair value for derivative instruments that are not designated as a hedge or that do not meet the hedge accounting criteria are recorded as a component of interest expense in the accompanying consolidated statements of operations.
F-11
KBS REAL ESTATE INVESTMENT TRUST II, INC.
NOTES TO CONSOLIDATED FINANCIAL STATEMENTS (CONTINUED)
December 31, 2017
The Company formally documents all relationships between hedging instruments and hedged items, as well as its risk-management objectives and strategy for undertaking various hedge transactions. This process includes designating all derivative instruments that are part of a hedging relationship to specific forecasted transactions or recognized obligations on the consolidated balance sheets. The Company also assesses and documents, both at the hedging instrument’s inception and on a quarterly basis thereafter, whether the derivative instruments that are used in hedging transactions are highly effective in offsetting changes in cash flows associated with the respective hedged items. When the Company determines that a derivative instrument ceases to be highly effective as a hedge, or that it is probable the underlying forecasted transaction will not occur, the Company discontinues hedge accounting prospectively and reclassifies amounts recorded in accumulated other comprehensive income (loss) to earnings.
Deferred Financing Costs
Deferred financing costs represent commitment fees, loan fees, legal fees and other third-party costs associated with obtaining financing and are presented on the balance sheet as a direct deduction from the carrying value of the associated debt liability. These costs are amortized over the terms of the respective financing agreements using the effective interest method. Unamortized deferred financing costs are generally expensed when the associated debt is refinanced or repaid before maturity unless specific rules are met that would allow for the carryover of such costs to the refinanced debt. Deferred financing costs incurred before an associated debt liability is recognized are included in prepaid and other assets on the balance sheet. Costs incurred in seeking financing transactions that do not close are expensed in the period in which it is determined that the financing will not close.
Fair Value Measurements
Under GAAP, the Company is required to measure certain financial instruments at fair value on a recurring basis. In addition, the Company is required to measure other non-financial and financial assets at fair value on a non-recurring basis (e.g., carrying value of impaired real estate loans receivable and long-lived assets). Fair value is defined as the price that would be received upon the sale of an asset or paid to transfer a liability in an orderly transaction between market participants at the measurement date. The GAAP fair value framework uses a three-tiered approach. Fair value measurements are classified and disclosed in one of the following three categories:
• | Level 1: unadjusted quoted prices in active markets that are accessible at the measurement date for identical assets or liabilities; |
• | Level 2: quoted prices for similar instruments in active markets, quoted prices for identical or similar instruments in markets that are not active, and model-derived valuations in which significant inputs and significant value drivers are observable in active markets; and |
• | Level 3: prices or valuation techniques where little or no market data is available that requires inputs that are both significant to the fair value measurement and unobservable. |
When available, the Company utilizes quoted market prices from independent third-party sources to determine fair value and classifies such items in Level 1 or Level 2. In instances where the market for a financial instrument is not active, regardless of the availability of a nonbinding quoted market price, observable inputs might not be relevant and could require the Company to make a significant adjustment to derive a fair value measurement. Additionally, in an inactive market, a market price quoted from an independent third party may rely more on models with inputs based on information available only to that independent third party. When the Company determines the market for a financial instrument owned by the Company to be illiquid or when market transactions for similar instruments do not appear orderly, the Company uses several valuation sources (including internal valuations, discounted cash flow analysis and quoted market prices) and establishes a fair value by assigning weights to the various valuation sources. Additionally, when determining the fair value of liabilities in circumstances in which a quoted price in an active market for an identical liability is not available, the Company measures fair value using (i) a valuation technique that uses the quoted price of the identical liability when traded as an asset or quoted prices for similar liabilities when traded as assets or (ii) another valuation technique that is consistent with the principles of fair value measurement, such as the income approach or the market approach.
Changes in assumptions or estimation methodologies can have a material effect on these estimated fair values. In this regard, the derived fair value estimates cannot be substantiated by comparison to independent markets and, in many cases, may not be realized in an immediate settlement of the instrument.
F-12
KBS REAL ESTATE INVESTMENT TRUST II, INC.
NOTES TO CONSOLIDATED FINANCIAL STATEMENTS (CONTINUED)
December 31, 2017
The Company considers the following factors to be indicators of an inactive market: (i) there are few recent transactions, (ii) price quotations are not based on current information, (iii) price quotations vary substantially either over time or among market makers (for example, some brokered markets), (iv) indexes that previously were highly correlated with the fair values of the asset or liability are demonstrably uncorrelated with recent indications of fair value for that asset or liability, (v) there is a significant increase in implied liquidity risk premiums, yields, or performance indicators (such as delinquency rates or loss severities) for observed transactions or quoted prices when compared with the Company’s estimate of expected cash flows, considering all available market data about credit and other nonperformance risk for the asset or liability, (vi) there is a wide bid-ask spread or significant increase in the bid-ask spread, (vii) there is a significant decline or absence of a market for new issuances (that is, a primary market) for the asset or liability or similar assets or liabilities, and (viii) little information is released publicly (for example, a principal-to-principal market).
The Company considers the following factors to be indicators of non-orderly transactions: (i) there was not adequate exposure to the market for a period before the measurement date to allow for marketing activities that are usual and customary for transactions involving such assets or liabilities under current market conditions, (ii) there was a usual and customary marketing period, but the seller marketed the asset or liability to a single market participant, (iii) the seller is in or near bankruptcy or receivership (that is, distressed), or the seller was required to sell to meet regulatory or legal requirements (that is, forced), and (iv) the transaction price is an outlier when compared with other recent transactions for the same or similar assets or liabilities.
Redeemable Common Stock
The Company has a share redemption program pursuant to which stockholders may sell their shares to the Company only in connection with a stockholder’s death, “qualifying disability” or “determination of incompetence” (each as defined in the share redemption program and, together with redemptions sought in connection with a stockholder’s death, “Special Redemptions”). Such redemptions are subject to the limitations described in the share redemption program document, including:
• | During each calendar year, Special Redemptions are limited to an annual dollar amount determined by the board of directors, which may be reviewed during the year and increased or decreased upon ten business days’ notice to the Company’s stockholders. The Company may provide notice by including such information (a) in a Current Report on Form 8-K or in its annual or quarterly reports, all publicly filed with the SEC or (b) in a separate mailing to its stockholders. The dollar limitation for calendar year 2017 was $10.0 million. On December 6, 2017, the Company’s board of directors approved the dollar amount limitation for Special Redemptions for calendar year 2018 of $10.0 million in the aggregate, as may be reviewed and adjusted from time to time by the board of directors. |
• | During any calendar year, the Company may redeem no more than 5% of the weighted-average number of shares outstanding during the prior calendar year. |
• | The Company has no obligation to redeem shares if the redemption would violate the restrictions on distributions under Maryland General Corporation Law, as amended from time to time, which prohibits distributions that would cause a corporation to fail to meet statutory tests of solvency. |
If the Company cannot repurchase all shares presented for redemption in any month because of the limitations on redemptions set forth in the Company’s share redemption program, then it will honor redemption requests on a pro rata basis, except that if a pro rata redemption would result in a stockholder owning less than the minimum purchase requirement described in the Company’s currently effective, or its most recently effective, registration statement as such registration statement has been amended or supplemented, then the Company would redeem all of such stockholder’s shares.
Pursuant to the share redemption program, redemptions made in connection with Special Redemptions are made at a price per share equal to the most recent estimated value per share of the Company’s common stock as of the applicable redemption date. The Company does not currently expect to have funds available for ordinary redemptions in the future.
On December 14, 2016, the Company’s board of directors approved an estimated value per share of the Company’s common stock of $5.49 (unaudited) based on the estimated value of the Company’s assets less the estimated value of the Company’s liabilities, divided by the number of shares outstanding, all as of September 30, 2016. The change in the redemption price became effective for the December 2016 redemption date, which was December 30, 2016, and was effective through the November 2017 redemption date.
F-13
KBS REAL ESTATE INVESTMENT TRUST II, INC.
NOTES TO CONSOLIDATED FINANCIAL STATEMENTS (CONTINUED)
December 31, 2017
On December 8, 2017, the Company’s board of directors approved an estimated value per share of the Company’s common stock of $4.89 (unaudited) based on the estimated value of the Company’s assets less the estimated value of the Company’s liabilities, divided by the number of shares outstanding, all as of September 30, 2017. The change in the redemption price became effective for the December 2017 redemption date, which was December 29, 2017, and will be effective until the estimated value per share is updated.
The Company’s board of directors may amend, suspend or terminate the share redemption program upon 30 days’ notice to its stockholders, provided that the Company may increase or decrease the funding available for the redemption of shares under the program upon ten business days’ notice to stockholders. The Company may provide this notice by including such information in a (a) Current Report on Form 8-K or in the Company’s annual or quarterly reports, all publicly filed with the SEC or (b) separate mailing to its stockholders.
The Company records amounts that are redeemable under the share redemption program as redeemable common stock in the accompanying consolidated balance sheets because the shares are mandatorily redeemable at the option of the holder and therefore their redemption is outside the control of the Company. Pursuant to the share redemption program, effective for redemptions on or after June 18, 2014, the maximum amount redeemable under the Company’s share redemption program is limited to an annual dollar amount determined by Company’s board of directors, as described above. However, because the amounts that can be redeemed in future periods are determinable and only contingent on an event that is likely to occur (e.g., the passage of time), the Company presents the amounts available for future redemptions in future periods as redeemable common stock in the accompanying consolidated balance sheets.
The Company classifies financial instruments that represent a mandatory obligation of the Company to redeem shares as liabilities. The Company’s redeemable common shares are contingently redeemable at the option of the holder. When the Company determines it has a mandatory obligation to redeem shares under the share redemption program, it will reclassify such obligations from temporary equity to a liability based upon their respective settlement values.
For the year ended December 31, 2017, the Company redeemed 1,053,650 shares sold in the Offering for $5.8 million, which represented all redemption requests received in good order and eligible for redemption as Special Redemptions under the share redemption program through the December 2017 redemption date.
Related Party Transactions
The Company has entered into the Advisory Agreement with the Advisor. This agreement entitles the Advisor to specified fees upon the provision of certain services with regard to the management of the Company’s investments, among other services, and the disposition of investments, as well as reimbursement of certain costs incurred by the Advisor in providing services to the Company. In addition, the Advisor is entitled to certain other fees, including an incentive fee upon achieving certain performance goals, as detailed in the Advisory Agreement. The Company has entered into a fee reimbursement agreement (the “AIP Reimbursement Agreement”) with the Dealer Manager pursuant to which the Company agreed to reimburse the Dealer Manager for certain fees and expenses it incurs for administering the Company’s participation in the DTCC Alternative Investment Product Platform (“AIP Platform”) with respect to certain accounts of the Company’s investors serviced through the platform. The Advisor and Dealer Manager also serve or served as the advisor and dealer manager, respectively, for KBS Real Estate Investment Trust, Inc. (“KBS REIT I”), KBS Real Estate Investment Trust III, Inc. (“KBS REIT III”), KBS Strategic Opportunity REIT, Inc. (“KBS Strategic Opportunity REIT”), KBS Legacy Partners Apartment REIT, Inc. (“KBS Legacy Partners Apartment REIT”), KBS Strategic Opportunity REIT II, Inc. (“KBS Strategic Opportunity REIT II”) and KBS Growth & Income REIT, Inc. (“KBS Growth & Income REIT”).
The Company records all related party fees as incurred, subject to any limitations described in the Advisory Agreement.
F-14
KBS REAL ESTATE INVESTMENT TRUST II, INC.
NOTES TO CONSOLIDATED FINANCIAL STATEMENTS (CONTINUED)
December 31, 2017
Operating Expenses
Under the Advisory Agreement, the Advisor has the right to seek reimbursement from the Company for all costs and expenses it incurs in connection with the provision of services to the Company, including the Company’s allocable share of the Advisor’s overhead, such as rent, employee costs, accounting software and cybersecurity costs. Commencing July 1, 2010, the Company has reimbursed the Advisor for the Company’s allocable portion of the salaries, benefits and overhead of internal audit department personnel providing services to the Company. In the future, the Advisor may seek reimbursement for additional employee costs. The Company will not reimburse the Advisor for employee costs in connection with services for which the Advisor earns acquisition, origination or disposition fees (other than reimbursement of travel and communication expenses) or for the salaries and benefits the Advisor or its affiliates may pay to the Company’s executive officers. In addition, the Company reimburses the Advisor for certain of the Company’s direct costs incurred from third parties that were initially paid by the Advisor on the Company’s behalf.
Asset Management Fee
With respect to investments in real estate, the Company pays the Advisor a monthly asset management fee equal to one-twelfth of 0.75% of the amount paid or allocated to acquire the investment, plus the cost of any subsequent development, construction or improvements to the property. This amount includes any portion of the investment that was debt financed and is inclusive of acquisition fees and expenses related thereto. In the case of investments made through joint ventures, the asset management fee will be determined based on the Company’s proportionate share of the underlying investment.
With respect to investments in loans and any investments other than real estate, the Company pays the Advisor a monthly fee calculated, each month, as one-twelfth of 0.75% of the lesser of (i) the amount paid or allocated to acquire or fund the loan or other investment (which amount includes any portion of the investment that was debt financed and is inclusive of acquisition or origination fees and expenses related thereto) and (ii) the outstanding principal amount of such loan or other investment, plus the acquisition or origination fees and expenses related to the acquisition or funding of such investment, as of the time of calculation.
With respect to an investment that has suffered an impairment in value, reduction in cash flow or other negative circumstances, such investment may either be excluded from the calculation of the asset management fee described above or included in such calculation at a reduced value that is recommended by the Advisor and the Company’s management and then approved by a majority of the Company’s independent directors, and this change in the fee will be applicable to an investment upon the earlier to occur of the date on which (i) such investment is sold, (ii) such investment is surrendered to a person other than the Company, its direct or indirect wholly owned subsidiary or a joint venture or partnership in which the Company has an interest, (iii) the Advisor determines that it will no longer pursue collection or other remedies related to such investment, or (iv) the Advisor recommends a revised fee arrangement with respect to such investment. As of December 31, 2017, the Company has not determined to calculate the asset management fee at an adjusted value for any investments or to exclude any investments from the calculation of the asset management fee.
Disposition Fee
For substantial assistance in connection with the sale of properties or other investments, the Company pays the Advisor or its affiliates 1.0% of the contract sales price of each property or other investment sold; provided, however, in no event may the disposition fees paid to Advisor, its affiliates and unaffiliated third parties exceed 6.0% of the contract sales price.
Income Taxes
The Company has elected to be taxed as a REIT under the Internal Revenue Code of 1986, as amended. To continue to qualify as a REIT, the Company must meet certain organizational and operational requirements, including a requirement to distribute at least 90% of the Company’s annual REIT taxable income to stockholders (which is computed without regard to the dividends-paid deduction or net capital gain and which does not necessarily equal net income as calculated in accordance with GAAP). As a REIT, the Company generally will not be subject to federal income tax on income that it distributes as dividends to its stockholders. If the Company fails to qualify as a REIT in any taxable year, it will be subject to federal income tax on its taxable income at regular corporate income tax rates and generally will not be permitted to qualify for treatment as a REIT for federal income tax purposes for the four taxable years following the year during which qualification is lost, unless the Internal Revenue Service grants the Company relief under certain statutory provisions. Such an event could materially and adversely affect the Company’s net income and net cash available for distribution to stockholders. However, the Company believes that it is organized and operates in such a manner as to qualify for treatment as a REIT.
F-15
KBS REAL ESTATE INVESTMENT TRUST II, INC.
NOTES TO CONSOLIDATED FINANCIAL STATEMENTS (CONTINUED)
December 31, 2017
The Company has concluded that there are no significant uncertain tax positions requiring recognition in its financial statements. Neither the Company nor its subsidiaries have been assessed interest or penalties by any major tax jurisdictions. The Company’s evaluations were performed for all open tax years through December 31, 2017. As of December 31, 2017, returns for the calendar years 2012 through 2016 remain subject to examination by major tax jurisdictions.
Per Share Data
Basic net income (loss) per share of common stock is calculated by dividing net income (loss) by the weighted-average number of shares of common stock issued and outstanding during such period. Diluted net income (loss) per share of common stock equals basic net income (loss) per share of common stock as there were no potentially dilutive securities outstanding during the years ended December 31, 2017, 2016 and 2015, respectively.
Distributions declared per common share were $0.274, $0.281 and $0.293 in the aggregate for the years ended December 31, 2017, 2016 and 2015, respectively. Distributions per common share were based on a monthly record date for each month during the period commencing January 2015 through December 2017. Distributions declared per common share assumes each share was issued and outstanding each day that was a record date for distributions during this period.
Segments
The Company invested in core real estate properties and real estate-related investments with the goal of acquiring a portfolio of income-producing investments. The Company’s real estate properties exhibit similar long-term financial performance and have similar economic characteristics to each other. Beginning with the reporting period commencing on January 1, 2016, the Company aggregated its investments into one reportable business segment. The Company considered both quantitative and qualitative thresholds and determined that its investment in a real estate loan receivable does not constitute a reportable segment. Prior to the reporting period commencing on January 1, 2016, the Company had identified two reportable business segments based on its investment types: real estate and real estate-related. However, based on the Company’s current investment portfolio, the Company does not believe that its investment in a real estate-related investment is a reportable segment.
Square Footage, Occupancy and Other Measures
Square footage, occupancy, number of tenants and other similar measures, including annualized base rent and annualized base rent per square foot, used to describe real estate and real estate-related investments included in these Notes to Consolidated Financial Statements are presented on an unaudited basis.
Recently Issued Accounting Standards Update
In May 2014, the FASB issued ASU No. 2014-09, Revenue from Contracts with Customers (Topic 606) (“ASU No. 2014-09”). ASU No. 2014-09 requires an entity to recognize the revenue to depict the transfer of promised goods or services to customers in an amount that reflects the consideration to which the entity expects to be entitled in exchange for those goods and services. In addition, the standard provided guidance for recognizing gains and losses from the transfer of nonfinancial assets in contracts with noncustomers upon transfer of control. ASU No. 2014-09 supersedes the revenue requirements in Revenue Recognition (Topic 605) and most industry-specific guidance throughout the Industry Topics of the Codification. ASU No. 2014-09 does not apply to lease contracts within the scope of Leases (Topic 840). ASU No. 2014-09 was to be effective for fiscal years, and interim periods within those years, beginning after December 15, 2016, and is to be applied retrospectively, with early application not permitted. In August 2015, the FASB issued ASU No. 2015-14, Revenue from Contracts with Customers (Topic 606): Deferral of the Effective Date (“ASU No. 2015-14”), which deferred the effective date of ASU No. 2014-09 by one year. Early adoption is permitted but not before the original effective date. The Company elected to adopt the standard using the modified retrospective approach, which requires a cumulative effect adjustment as of the date of the Company’s adoption, January 1, 2018. Under the modified retrospective approach, an entity may also elect to apply this standard to either (i) all contracts as of January 1, 2018 or (ii) only to contracts that are not completed as of January 1, 2018. A completed contract is a contract for which all (or substantially all) of the revenue was recognized under legacy GAAP that was in effect before the date of initial application. The Company elected to apply this standard only to contracts that are not completed as of January 1, 2018.
F-16
KBS REAL ESTATE INVESTMENT TRUST II, INC.
NOTES TO CONSOLIDATED FINANCIAL STATEMENTS (CONTINUED)
December 31, 2017
The primary source of revenue for the Company is generated through leasing arrangements, which are excluded from this standard. Based on the Company’s evaluation of contracts within the scope of ASU No. 2014-09, revenue that may be impacted by the new standard includes sales of real estate, other operating income and tenant reimbursements for substantial services earned at its properties.
The Company evaluated all of its real estate sales contracts through December 31, 2017 and determined they qualified as sales to noncustomers. The gains on sales of real estate for the 20 properties sold through December 31, 2017 were recognized on the full accrual method based on the existing accounting standards and were determined to be completed contracts as of January 1, 2018, therefore the adoption of the ASU No. 2014-09 did not have an impact on the Company’s real estate sale contracts.
For the year ended December 31, 2017, other operating income including parking revenues and tenant reimbursements for substantial services and other ancillary income in the scope of ASC 606 were approximately 6% of consolidated revenue. Under current accounting standards, the Company typically recognizes other operating income when the amounts are fixed or determinable, collectability is reasonably assured, and services have been rendered. Under the new revenue recognition ASU, the recognition of such revenue will occur when the services are provided and the performance obligations are satisfied. These services are normally provided at a point in time or over a specified period of time with respect to monthly parking revenue; therefore, revenue recognition under the new revenue recognition ASU is expected to be substantially similar to the recognition pattern under existing accounting standards.
Based on the Company’s evaluation of its contracts within the scope of ASU No. 2014-19, the adoption of the new revenue recognition standard is not expected to have a material impact on the Company’s financial statements on January 1, 2018.
In January 2016, the FASB issued ASU No. 2016-01, Financial Instruments - Overall (Subtopic 825-10): Recognition and Measurement of Financial Assets and Financial Liabilities (“ASU No. 2016-01”). The amendments in ASU No. 2016-01 address certain aspects of recognition, measurement, presentation and disclosure of financial instruments. ASU No. 2016-01 primarily affects accounting for equity investments and financial liabilities where the fair value option has been elected. ASU No. 2016-01 also requires entities to present financial assets and financial liabilities separately, grouped by measurement category and form of financial asset in the balance sheet or in the accompanying notes to the financial statements. ASU No. 2016-01 is effective for annual periods beginning after December 15, 2017, including interim periods within those fiscal years. Early application of certain provisions of the standard is permitted for financial statements that have not been previously issued. The Company does not expect the adoption of ASU No. 2016-01 to have a significant impact on its financial statements.
In February 2016, the FASB issued ASU No. 2016-02, Leases (Topic 842) (“ASU No. 2016-02”). The amendments in ASU No. 2016-02 change the existing accounting standards for lease accounting, including requiring lessees to recognize most leases on their balance sheets and making targeted changes to lessor accounting. The standard requires lessors to identify lease and non-lease components under their leasing arrangements and allocate the total consideration in the lease agreement to these lease and non-lease components based on their relative standalone selling prices. Non-lease components will be subject to the new revenue recognition standard upon the Company’s adoption of the new leasing standard on January 1, 2019. ASU No. 2016-02 is effective for annual periods beginning after December 15, 2018, including interim periods within those fiscal years. Early adoption of ASU No. 2016-02 as of its issuance is permitted. The new leases standard requires a modified retrospective transition approach for all leases existing at, or entered into after, the date of initial application, with an option to use certain transition relief. In January 2018, the FASB issued a proposed amendment to the leases ASU, which would add a transition option to the new leases standard that would allow entities to apply the transition provisions of the new standard at its adoption date instead of the earliest comparative periods presented in its financial statements. The FASB also proposed a practical expedient that would permit lessors to not separate lease and non-lease components if certain conditions are met. The Company is currently evaluating the impact of adopting the new leases standard on its consolidated financial statements and if adopted by the FASB, applying the transition option and electing the practical expedient of the proposed amendment.
F-17
KBS REAL ESTATE INVESTMENT TRUST II, INC.
NOTES TO CONSOLIDATED FINANCIAL STATEMENTS (CONTINUED)
December 31, 2017
In June 2016, the FASB issued ASU No. 2016-13, Financial Instruments - Credit Losses (Topic 326): Measurement of Credit Losses of Financial Instruments (“ASU No. 2016-13”). ASU No. 2016-13 affects entities holding financial assets and net investments in leases that are not accounted for at fair value through net income. The amendments in ASU No. 2016-13 require a financial asset (or a group of financial assets) measured at amortized cost basis to be presented at the net amount expected to be collected. The allowance for credit losses is a valuation account that is deducted from the amortized cost basis of the financial asset(s) to present the net carrying value at the amount expected to be collected on the financial asset. ASU No. 2016-13 also amends the impairment model for available-for-sale securities. An entity will recognize an allowance for credit losses on available-for-sale debt securities as a contra-account to the amortized cost basis rather than as a direct reduction of the amortized cost basis of the investment, as is currently required. ASU No. 2016-13 also requires new disclosures. For financial assets measured at amortized cost, an entity will be required to disclose information about how it developed its allowance for credit losses, including changes in the factors that influenced management’s estimate of expected credit losses and the reasons for those changes. For financing receivables and net investments in leases measured at amortized cost, an entity will be required to further disaggregate the information it currently discloses about the credit quality of these assets by year of the asset’s origination for as many as five annual periods. For available for sale securities, an entity will be required to provide a roll-forward of the allowance for credit losses and an aging analysis for securities that are past due. ASU No. 2016-13 is effective for annual periods beginning after December 15, 2019, including interim periods within those fiscal years. Early adoption is permitted for fiscal years beginning after December 15, 2018, including interim periods within those fiscal years. The Company is still evaluating the impact of adopting ASU No. 2016-13 on its financial statements, but does not expect the adoption of ASU No. 2016-13 to have a material impact on its financial statements.
In August 2016, the FASB issued ASU No. 2016-15, Statement of Cash Flows (Topic 230): Classification of Certain Cash Receipts and Cash Payments (“ASU No. 2016-15”). ASU No. 2016-15 is intended to reduce diversity in practice in how certain transactions are classified in the statement of cash flows. The amendments in ASU No. 2016-15 provide guidance on eight specific cash flow issues, including the following that are or may be relevant to the Company: (a) Cash payments for debt prepayment or debt extinguishment costs should be classified as cash outflows for financing activities; (b) Cash payments relating to contingent consideration made soon after an acquisition’s consummation date (i.e., approximately three months or less) should be classified as cash outflows for investing activities. Payments made thereafter should be classified as cash outflows for financing activities up to the amount of the original contingent consideration liability. Payments made in excess of the amount of the original contingent consideration liability should be classified as cash outflows for operating activities; (c) Cash payments received from the settlement of insurance claims should be classified on the basis of the nature of the loss (or each component loss, if an entity receives a lump-sum settlement); and (d) In the absence of specific guidance, an entity should classify each separately identifiable cash source and use on the basis of the nature of the underlying cash flows. For cash flows with aspects of more than one class that cannot be separated, the classification should be based on the activity that is likely to be the predominant source or use of cash flow. ASU No. 2016-15 is effective for fiscal years beginning after December 15, 2017, and interim periods within those fiscal years. Early adoption is permitted, including adoption in an interim period. The Company is still evaluating the impact of adopting ASU No. 2016-15 on its financial statements, but does not expect the adoption of ASU No. 2016-15 to have a material impact on its financial statements.
In November 2016, the FASB issued ASU No. 2016-18, Statement of Cash Flows (Topic 230): Restricted Cash (“ASU No. 2016-18”). ASU No. 2016-18 requires that a statement of cash flows explain the change during the period in the total of cash, cash equivalents, restricted cash and restricted cash equivalents. Therefore, amounts generally described as restricted cash should be included with cash and cash equivalents when reconciling the beginning of period and end of period total amounts shown on the statement of cash flows. ASU No. 2016-18 is effective for annual periods beginning after December 15, 2017, including interim periods within those fiscal years. The Company elected to early adopt ASU No. 2016-18 for the reporting period ended December 31, 2016 and it was applied retrospectively. As a result of the adoption of ASU No. 2016-18, the Company no longer presents the changes within restricted cash in the consolidated statements of cash flows.
F-18
KBS REAL ESTATE INVESTMENT TRUST II, INC.
NOTES TO CONSOLIDATED FINANCIAL STATEMENTS (CONTINUED)
December 31, 2017
3. | REAL ESTATE |
As of December 31, 2017, the Company’s portfolio of real estate was composed of eight office properties and an office campus consisting of eight office buildings, encompassing in the aggregate approximately 4.7 million rentable square feet. As of December 31, 2017, the Company’s real estate portfolio was 85% occupied. The following table summarizes the Company’s real estate portfolio as of December 31, 2017 (in thousands):
Property | Date Acquired | City | State | Property Type | Total Real Estate at Cost | Accumulated Depreciation and Amortization | Total Real Estate, Net | |||||||||||||
100 & 200 Campus Drive Buildings | 09/09/2008 | Florham Park | NJ | Office | $ | 146,140 | $ | (11,038 | ) | $ | 135,102 | |||||||||
300-600 Campus Drive Buildings | 10/10/2008 | Florham Park | NJ | Office | 162,359 | (16,430 | ) | 145,929 | ||||||||||||
Willow Oaks Corporate Center | 08/26/2009 | Fairfax | VA | Office | 104,159 | (18,974 | ) | 85,185 | ||||||||||||
Pierre Laclede Center | 02/04/2010 | Clayton | MO | Office | 80,371 | (9,901 | ) | 70,470 | ||||||||||||
Union Bank Plaza | 09/15/2010 | Los Angeles | CA | Office | 186,119 | (22,159 | ) | 163,960 | ||||||||||||
Emerald View at Vista Center | 12/09/2010 | West Palm Beach | FL | Office | 31,060 | (6,829 | ) | 24,231 | ||||||||||||
Granite Tower | 12/16/2010 | Denver | CO | Office | 154,963 | (43,202 | ) | 111,761 | ||||||||||||
Fountainhead Plaza | 09/13/2011 | Tempe | AZ | Office | 119,384 | (17,782 | ) | 101,602 | ||||||||||||
Corporate Technology Centre | 03/28/2013 | San Jose | CA | Office | 222,890 | (30,261 | ) | 192,629 | ||||||||||||
$ | 1,207,445 | $ | (176,576 | ) | $ | 1,030,869 | ||||||||||||||
As of December 31, 2017, the following properties represented more than 10% of the Company’s total assets:
Property | Location | Rentable Square Feet | Total Real Estate, Net (in thousands) | Percentage of Total Assets | Annualized Base Rent (in thousands) (1) | Average Annualized Base Rent per sq. ft. | Occupancy | ||||||||||||||||
Corporate Technology Centre | San Jose, CA | 610,083 | $ | 192,629 | 15.7 | % | $ | 18,635 | $ | 30.54 | 100 | % | |||||||||||
Union Bank Plaza | Los Angeles, CA | 627,334 | 163,960 | 13.4 | % | 19,548 | 38.00 | 82 | % | ||||||||||||||
300-600 Campus Drive Buildings | Florham Park, NJ | 578,424 | 145,929 | 11.9 | % | 17,923 | 33.63 | 92 | % | ||||||||||||||
100 & 200 Campus Drive Buildings | Florham Park, NJ | 589,625 | 135,102 | 11.0 | % | 11,408 | 30.00 | 64 | % | ||||||||||||||
_____________________
(1) Annualized base rent represents annualized contractual base rental income as of December 31, 2017, adjusted to straight-line any contractual tenant concessions (including free rent), rent increases and rent decreases from the lease’s inception through the balance of the lease term.
Operating Leases
The Company’s real estate properties are leased to tenants under operating leases for which the terms and expirations vary. As of December 31, 2017, the leases had remaining terms, excluding options to extend, of up to 13.8 years with a weighted-average remaining term of 5.0 years. Some of the leases have provisions to extend the term of the leases, options for early termination for all or part of the leased premises after paying a specified penalty, rights of first refusal to purchase the property at competitive market rates, and other terms and conditions as negotiated. The Company retains substantially all of the risks and benefits of ownership of the real estate assets leased to tenants. Generally, upon the execution of a lease, the Company requires a security deposit from the tenant in the form of a cash deposit and/or a letter of credit. The amount required as a security deposit varies depending upon the terms of the respective lease and the creditworthiness of the tenant, but generally is not a significant amount. Therefore, exposure to credit risk exists to the extent that a receivable from a tenant exceeds the amount of its security deposit. Security deposits received in cash related to tenant leases are included in other liabilities in the accompanying consolidated balance sheets and totaled $2.6 million and $2.5 million as of December 31, 2017 and 2016, respectively.
F-19
KBS REAL ESTATE INVESTMENT TRUST II, INC.
NOTES TO CONSOLIDATED FINANCIAL STATEMENTS (CONTINUED)
December 31, 2017
During the years ended December 31, 2017, 2016 and 2015, the Company recognized deferred rent from tenants, net of lease incentive amortization, of $0.9 million, $6.5 million and $6.7 million, respectively. As of December 31, 2017 and 2016, the cumulative deferred rent balance was $59.1 million and $57.4 million, respectively, and is included in rents and other receivables on the accompanying balance sheets. The cumulative deferred rent balance included $9.5 million and $10.5 million of unamortized lease incentives as of December 31, 2017 and 2016, respectively.
As of December 31, 2017, the future minimum rental income from the Company’s properties under non-cancelable operating leases was as follows (in thousands):
2018 | $ | 118,557 | |
2019 | 105,797 | ||
2020 | 99,917 | ||
2021 | 88,690 | ||
2022 | 66,670 | ||
Thereafter | 217,513 | ||
$ | 697,144 | ||
As of December 31, 2017, the Company had approximately 190 tenants over a diverse range of industries and geographic areas. The Company’s highest tenant industry concentrations (greater than 10% of annualized base rent) were as follows:
Industry | Number of Tenants | Annualized Base Rent (1) (in thousands) | Percentage of Annualized Base Rent | ||||||
Finance | 32 | $ | 26,281 | 21.5 | % | ||||
Computer System Design & Programming | 5 | 15,638 | 12.8 | % | |||||
Legal Services | 33 | 15,159 | 12.4 | % | |||||
Mining, Oil & Gas Extraction | 4 | 14,004 | 11.5 | % | |||||
$ | 71,082 | 58.2 | % | ||||||
(1) Annualized base rent represents annualized contractual base rental income as of December 31, 2017, adjusted to straight-line any contractual tenant concessions (including free rent), rent increases and rent decreases from the lease’s inception through the balance of the lease term.
No other tenant industries accounted for more than 10% of annualized base rent. The Company had not identified any material tenant credit issues as of December 31, 2017. During the years ended December 31, 2017, 2016 and 2015, the Company recorded bad debt expense of $0.5 million, $0.3 million and $0.2 million, respectively. As of December 31, 2017, the Company had a bad debt expense reserve of approximately $0.4 million, which represented less than 1% of its annualized base rent.
F-20
KBS REAL ESTATE INVESTMENT TRUST II, INC.
NOTES TO CONSOLIDATED FINANCIAL STATEMENTS (CONTINUED)
December 31, 2017
As of December 31, 2017, the Company had a concentration of credit risk related to the following tenant lease that represented more than 10% of the Company’s annualized base rent:
Annualized Base Rent Statistics | |||||||||||||||||||||
Tenant | Property | Tenant Industry | Square Feet | % of Portfolio (Net Rentable Sq. Ft.) | Annualized Base Rent (in thousands) (1) | % of Portfolio Annualized Base Rent | Annualized Base Rent per Sq. Ft. | Lease Expiration(2)(3) | |||||||||||||
Union Bank | Union Bank Plaza | Finance | 342,712 | 8.6% | $ | 13,020 | 10.7% | $ | 37.99 | 01/31/2022 | |||||||||||
_____________________
(1) Annualized base rent represents annualized contractual base rental income as of December 31, 2017, adjusted to straight-line any contractual tenant concessions (including free rent), rent increases and rent decreases from the lease’s inception through the balance of the lease term.
(2) Represents the expiration date of the lease as of December 31, 2017 and does not take into account any tenant renewal or termination options. On December 31, 2017, the Company entered into a lease amendment with Union Bank pursuant to which Union Bank will surrender 15,829 rentable square feet and 31,320 rentable square feet of its total rentable square footage by March 31, 2018 and June 30, 2018, respectively, and will surrender 321 parking area passes by March 31, 2018. As a result, the Company expects to receive a total of $11.4 million in termination fees from Union Bank payable in 2018.
(3) Union Bank has two options to extend the term of this lease for three, four, five, six or seven years per option term, provided that the combined renewal option terms do not exceed 10 years. If Union Bank elects to exercise its extension options, it must extend the lease on (i) the entire office premises or (ii) no less than 200,000 rentable square feet consisting of full floors only plus either all or none of both the retail and vault space.
No other tenant accounted for more than 10% of annualized base rent.
Geographic Concentration Risk
As of December 31, 2017, the Company’s net investments in real estate in California and New Jersey represented 29.1% and 22.9% of the Company’s total assets, respectively. As a result, the geographic concentration of the Company’s portfolio makes it particularly susceptible to adverse economic developments in the California and New Jersey real estate markets. Any adverse economic or real estate developments in these markets, such as business layoffs or downsizing, industry slowdowns, relocations of businesses, changing demographics and other factors, or any decrease in demand for office space resulting from the local business climate, could adversely affect the Company’s operating results and its ability to make distributions to stockholders.
Impairment of Real Estate
The Company did not recognize any impairment charges during the years ended December 31, 2017 and 2016.
During the year ended December 31, 2015, the Company recorded impairment charges of $23.1 million, including an impairment charge of $18.6 million to write-down the carrying value of the 100 & 200 Campus Drive Buildings, an office property located in Florham Park, New Jersey, to its estimated fair value as a result of changes in cash flow estimates. The decrease in cash flow projections was primarily due to (i) the lack of demand in the Florham Park office rental market resulting in slower rent growth and longer lease up periods and (ii) an increase in projected vacancy related to a tenant occupying 199,024 rentable square feet, or approximately 34% of the 100 & 200 Campus Drive Buildings. This tenant’s lease expired in November 2016. The Company is currently concentrating its efforts to re-lease the vacated space. As a result, the Company revised its cash flow projections for longer lease up periods and additional tenant improvement costs and leasing concessions required to attract new tenants.
In addition, during the year ended December 31, 2015, the Company recorded impairment charges of $4.5 million with respect to two real estate properties that were reclassified from held for sale to held for investment. The impairment charges were recorded to adjust the carrying values of the properties for any depreciation and amortization expense that would have been recognized if the properties had always been classified as held for investment, which otherwise would have been recorded through depreciation and amortization expense.
F-21
KBS REAL ESTATE INVESTMENT TRUST II, INC.
NOTES TO CONSOLIDATED FINANCIAL STATEMENTS (CONTINUED)
December 31, 2017
4. | TENANT ORIGINATION AND ABSORPTION COSTS, ABOVE-MARKET LEASE ASSETS AND BELOW-MARKET LEASE LIABILITIES |
As of December 31, 2017 and 2016, the Company’s tenant origination and absorption costs, above-market lease assets and below-market lease liabilities (excluding fully amortized assets and liabilities and accumulated amortization) were as follows (in thousands):
Tenant Origination and Absorption Costs | Above-Market Lease Assets | Below-Market Lease Liabilities | ||||||||||||||||||||||
2017 | 2016 | 2017 | 2016 | 2017 | 2016 | |||||||||||||||||||
Cost | $ | 57,021 | $ | 64,117 | $ | 13,650 | $ | 13,740 | $ | (10,060 | ) | $ | (11,249 | ) | ||||||||||
Accumulated amortization | (35,865 | ) | (33,577 | ) | (11,532 | ) | (9,274 | ) | 8,756 | 8,373 | ||||||||||||||
Net amount | $ | 21,156 | $ | 30,540 | $ | 2,118 | $ | 4,466 | $ | (1,304 | ) | $ | (2,876 | ) | ||||||||||
Increases (decreases) in net income as a result of amortization of the Company’s tenant origination and absorption costs, above-market lease assets and below-market lease liabilities for the years ended December 31, 2017, 2016 and 2015 were as follows (in thousands):
Tenant Origination and Absorption Costs | Above-Market Lease Assets | Below-Market Lease Liabilities | ||||||||||||||||||||||||||||||||||
For the Years Ended December 31, | For the Years Ended December 31, | For the Years Ended December 31, | ||||||||||||||||||||||||||||||||||
2017 | 2016 | 2015 | 2017 | 2016 | 2015 | 2017 | 2016 | 2015 | ||||||||||||||||||||||||||||
Amortization | $ | (9,412 | ) | $ | (12,499 | ) | $ | (13,808 | ) | $ | (2,348 | ) | $ | (3,129 | ) | $ | (2,722 | ) | $ | 1,586 | $ | 2,676 | $ | 3,402 | ||||||||||||
The remaining unamortized balance for these outstanding intangible assets and liabilities as of December 31, 2017 will be amortized for the years ending December 31 as follows (in thousands):
Tenant Origination and Absorption Costs | Above-Market Lease Assets | Below-Market Lease Liabilities | ||||||||||
2018 | $ | (6,314 | ) | $ | (1,893 | ) | $ | 939 | ||||
2019 | (3,888 | ) | (74 | ) | 167 | |||||||
2020 | (3,694 | ) | (74 | ) | 99 | |||||||
2021 | (3,690 | ) | (74 | ) | 95 | |||||||
2022 | (2,191 | ) | (3 | ) | 4 | |||||||
Thereafter | (1,379 | ) | — | — | ||||||||
$ | (21,156 | ) | $ | (2,118 | ) | $ | 1,304 | |||||
Weighted-Average Remaining Amortization Period | 4.5 years | 1.2 years | 1.8 years | |||||||||
F-22
KBS REAL ESTATE INVESTMENT TRUST II, INC.
NOTES TO CONSOLIDATED FINANCIAL STATEMENTS (CONTINUED)
December 31, 2017
5. | REAL ESTATE LOAN RECEIVABLE |
As of December 31, 2017 and 2016, the Company, through an indirect wholly owned subsidiary, had originated the following real estate loan receivable (dollars in thousands):
Loan Name Location of Related Property or Collateral | Date Acquired/ Originated | Property Type | Loan Type | Outstanding Principal Balance as of December 31, 2017 (1) | Book Value as of December 31, 2017 (2) | Book Value as of December 31, 2016 (2) | Contractual Interest Rate (3) | Annualized Effective Interest Rate (3) | Maturity Date | |||||||||||||||
Sheraton Charlotte Airport Hotel First Mortgage Charlotte, North Carolina | 07/11/2011 | Hotel | Mortgage | $ | 13,921 | $ | 13,923 | $ | 14,079 | 7.5% | 7.6% | 08/01/2018 | ||||||||||||
(1) Outstanding principal balance as of December 31, 2017 represents original principal balance outstanding under the loan, increased for any subsequent fundings and reduced for any principal paydowns.
(2) Book value represents outstanding principal balance, adjusted for unamortized acquisition discounts, origination fees and direct origination and acquisition costs.
(3) Contractual interest rate is the stated interest rate on the face of the loan. Annualized effective interest rate is calculated as the actual interest income recognized in 2017, using the interest method, annualized and divided by the average amortized cost basis of the investment during 2017. The contractual interest rate and annualized effective interest rate presented are as of December 31, 2017.
The following summarizes the activity related to the real estate loan receivable for the year ended December 31, 2017 (in thousands):
Real estate loan receivable - December 31, 2016 | $ | 14,079 | |
Principal repayments received on the real estate loan receivable | (152 | ) | |
Amortization of closing costs and origination fees on the real estate loan receivable | (4 | ) | |
Real estate loan receivable - December 31, 2017 | $ | 13,923 | |
For the years ended December 31, 2017, 2016 and 2015, interest income from real estate loans receivable consisted of the following (in thousands):
For the Years Ended December 31, | ||||||||||||
2017 | 2016 | 2015 | ||||||||||
Contractual interest income | $ | 1,064 | $ | 1,078 | $ | 3,701 | ||||||
Prepayment fee received on real estate loan receivable | — | — | 874 | |||||||||
Amortization of closing costs and origination fees | (4 | ) | (3 | ) | (23 | ) | ||||||
Interest income from real estate loan receivable | $ | 1,060 | $ | 1,075 | $ | 4,552 | ||||||
As of December 31, 2017 and 2016, the borrower under the Company’s real estate loan receivable was current on its debt obligations.
F-23
KBS REAL ESTATE INVESTMENT TRUST II, INC.
NOTES TO CONSOLIDATED FINANCIAL STATEMENTS (CONTINUED)
December 31, 2017
6. | REAL ESTATE SALES |
In accordance with ASU No. 2014-08, Presentation of Financial Statements (Topic 205) and Property, Plant, and Equipment (Topic 360): Reporting Discontinued Operations and Disclosures of Disposals of Components of an Entity (“ASU No. 2014-08”), results of operations from properties that are classified as held for sale in the ordinary course of business on or subsequent to January 1, 2014 would generally be included in continuing operations on the Company’s consolidated statements of operations.
During the year ended December 31, 2017, the Company disposed of two office properties. During the year ended December 31, 2016, the Company disposed of one office/flex property. During the year ended December 31, 2015, the Company disposed of one office property. The results of operations for the properties sold during the years ended December 31, 2017, 2016 and 2015 are included in continuing operations on the Company’s consolidated statements of operations. As of December 31, 2017, the Company did not have any real estate properties held for sale. The following table summarizes certain revenue and expenses related to the Company’s real estate properties that were sold during the years ended December 31, 2017, 2016 and 2015, which were included in continuing operations (in thousands):
Years Ended December 31, | ||||||||||||
2017 | 2016 | 2015 | ||||||||||
Revenues | ||||||||||||
Rental income | $ | 4,249 | $ | 8,971 | $ | 13,145 | ||||||
Tenant reimbursements | 919 | 1,611 | 2,059 | |||||||||
Other operating income | 18 | 15 | 125 | |||||||||
Total revenues | 5,186 | 10,597 | 15,329 | |||||||||
Expenses | ||||||||||||
Operating, maintenance, and management | 1,543 | 2,261 | 3,093 | |||||||||
Real estate taxes and insurance | 888 | 1,592 | 2,111 | |||||||||
Asset management fees to affiliate | 452 | 806 | 1,061 | |||||||||
General and administrative expenses | 30 | 105 | 35 | |||||||||
Depreciation and amortization | 884 | 3,962 | 4,458 | |||||||||
Interest expense | 630 | 1,413 | 3,581 | |||||||||
Total expenses | $ | 4,427 | $ | 10,139 | $ | 14,339 | ||||||
The following summary presents the major components of assets and liabilities related to real estate held for sale as of December 31, 2016 (in thousands). No real estate properties were held for sale as of December 31, 2017:
December 31, 2017 | December 31, 2016 | ||||||
Assets related to real estate held for sale | |||||||
Total real estate, at cost | $ | — | $ | 71,816 | |||
Accumulated depreciation and amortization | — | (9,765 | ) | ||||
Real estate held for sale, net | — | 62,051 | |||||
Other assets | — | 4,429 | |||||
Total assets related to real estate held for sale | $ | — | $ | 66,480 | |||
Liabilities related to real estate held for sale | |||||||
Total notes payable, net | — | 18,424 | |||||
Other liabilities | — | 17 | |||||
Total liabilities related to real estate held for sale | $ | — | $ | 18,441 | |||
F-24
KBS REAL ESTATE INVESTMENT TRUST II, INC.
NOTES TO CONSOLIDATED FINANCIAL STATEMENTS (CONTINUED)
December 31, 2017
7. | NOTES PAYABLE |
As of December 31, 2017 and 2016, the Company’s notes payable, including notes payable related to real estate sold, consisted of the following (dollars in thousands):
Book Value as of December 31, 2017 | Book Value as of December 31, 2016 | Contractual Interest Rate as of December 31, 2017 (1) | Effective Interest Rate as of December 31, 2017 (1) | Payment Type | Maturity Date (2) | |||||||||||
Amended and Restated Portfolio Revolving Loan Facility (3) | $ | 52,638 | $ | 52,638 | One-month LIBOR + 1.80% | 3.2% | Interest Only | 06/21/2018 | ||||||||
Union Bank Plaza Mortgage Loan (4) | 105,000 | 105,000 | One-month LIBOR + 1.65% | 3.0% | Interest Only | 04/12/2018 | ||||||||||
Portfolio Mortgage Loan #1 (5) | 59,651 | 78,033 | One-month LIBOR + 2.15% | 3.5% | Interest Only | 04/20/2018 | ||||||||||
Portfolio Mortgage Loan #3 (6) | 54,000 | 54,000 | One-month LIBOR + 1.75% - 1.85% | 3.1% | Interest Only | 03/01/2018 | ||||||||||
Corporate Technology Centre Mortgage Loan (7) | 138,219 | 140,000 | 3.50% | 3.5% | (7) | 04/01/2020 | ||||||||||
300-600 Campus Drive Revolving Loan (8) | 93,125 | 94,625 | One-month LIBOR + 2.05% | 3.4% | (8) | 02/01/2018 | ||||||||||
Total notes payable principal outstanding | $ | 502,633 | $ | 524,296 | ||||||||||||
Deferred financing costs, net | (334 | ) | (525 | ) | ||||||||||||
Total notes payable, net | $ | 502,299 | $ | 523,771 | ||||||||||||
(1) Contractual interest rate represents the interest rate in effect under the loan as of December 31, 2017. Effective interest rate is calculated as the actual interest rate in effect as of December 31, 2017, using interest rate indices as of December 31, 2017, where applicable. For further information regarding the Company’s derivative instruments, see Note 8, “Derivative Instruments.”
(2) Represents the initial maturity date or the maturity date as extended as of December 31, 2017; subject to certain conditions, the maturity dates of certain loans may be extended beyond the maturity date shown.
(3) As of December 31, 2017, the Amended and Restated Portfolio Revolving Loan Facility was secured by Pierre Laclede Center.
(4) On December 21, 2017, the Company extended the maturity date of the Union Bank Plaza Mortgage Loan to April 12, 2018. As of December 31, 2017, $105.0 million of the Union Bank Plaza Mortgage Loan had been disbursed to the Company with the remaining loan balance of $14.3 million available for future disbursements, subject to certain conditions set forth in the loan agreement.
(5) On November 21, 2017, in connection with the disposition of Horizon Tech Center, the Company repaid $18.0 million of principal due under this loan and Horizon Tech Center was released as security from the Portfolio Mortgage Loan #1. As of December 31, 2017, Portfolio Mortgage Loan #1 was secured by Granite Tower.
(6) As of December 31, 2017, the principal balance under Portfolio Mortgage Loan #3 consisted of the $32.4 million non-revolving portion and $21.6 million revolving portion. As of December 31, 2017, Portfolio Mortgage Loan #3 was secured by the 100 & 200 Campus Drive Buildings and Willow Oaks Corporate Center. On February 23, 2018, the Company extended the maturity date of Portfolio Mortgage Loan #3 to May 30, 2018.
(7) Monthly payments were initially interest-only. On May 1, 2017, monthly payments for the Corporate Technology Centre Mortgage Loan began to include principal and interest with principal payments calculated using an amortization schedule of 30 years for the balance of the loan term, with the remaining principal balance, all accrued and unpaid interest and any other amounts due at maturity.
(8) As of December 31, 2017, the principal balance of the 300-600 Campus Drive Revolving Loan consisted of the $93.1 million non-revolving portion. The revolving portion of $25.0 million remained available for future disbursements, subject to certain terms and conditions contained in the loan documents. On the first day of each calendar quarter, commencing on October 1, 2016, and each succeeding January 1, April 1, July 1 and October 1 thereafter, the Company repays principal outstanding under the 300-600 Campus Drive Revolving Loan in equal installments of $375,000. On January 16, 2018, the Company extended the maturity date of the 300-600 Campus Drive Revolving Loan to August 1, 2018.
During the years ended December 31, 2017, 2016 and 2015, the Company incurred $17.5 million, $16.7 million and $22.1 million of interest expense, respectively. As of December 31, 2017 and 2016, $1.4 million and $1.3 million, respectively, of interest expense were payable. Included in interest expense for the years ended December 31, 2017, 2016 and 2015 were $1.1 million, $1.8 million and $2.0 million of amortization of deferred financing costs, respectively. During the year ended December 31, 2017, the Company recorded a reduction to interest expense of $10,000 as a result of the Company’s interest rate swap agreements. Interest expense incurred as a result of the Company’s interest rate swap agreements was $0.5 million and $3.3 million for the years ended December 31, 2016 and 2015, respectively.
F-25
KBS REAL ESTATE INVESTMENT TRUST II, INC.
NOTES TO CONSOLIDATED FINANCIAL STATEMENTS (CONTINUED)
December 31, 2017
The following is a schedule of maturities, including principal amortization payments, for all notes payable outstanding as of December 31, 2017 (in thousands):
2018 | $ | 367,164 | ||
2019 | 2,848 | |||
2020 | 132,621 | |||
$ | 502,633 | |||
The Company plans to exercise its extension options available under its loan agreements, if applicable, or pay off or refinance the related notes payable prior to their maturity dates.
Certain of the Company’s notes payable contain financial debt covenants. As of December 31, 2017, the Company was in compliance with these debt covenants.
8. | DERIVATIVE INSTRUMENTS |
The Company enters into derivative instruments for risk management purposes to hedge its exposure to cash flow variability caused by changing interest rates. The primary goal of the Company’s risk management practices related to interest rate risk is to prevent changes in interest rates from adversely impacting the Company’s ability to achieve its investment return objectives. The Company does not enter into derivatives for speculative purposes.
The Company enters into interest rate swaps as a fixed rate payer to mitigate its exposure to rising interest rates on its variable rate notes payable. The value of interest rate swaps is primarily impacted by interest rates, market expectations about interest rates, and the remaining life of the instrument. In general, increases in interest rates, or anticipated increases in interest rates, will increase the value of the fixed rate payer position and decrease the value of the variable rate payer position. As the remaining life of the interest rate swap decreases, the value of both positions will generally move towards zero.
The following table summarizes the notional amount and other information related to the Company’s interest rate swaps as of December 31, 2017 and 2016. The notional amount is an indication of the extent of the Company’s involvement in each instrument at that time, but does not represent exposure to credit, interest rate or market risks (dollars in thousands):
December 31, 2017 | December 31, 2016 | Fix Pay Rate | Remaining Term in Years | |||||||||||||
Derivative Instruments | Number of Instruments | Notional Amount | Number of Instruments | Notional Amount | Reference Rate as of December 31, 2017 | |||||||||||
Interest Rate Swaps (1) | — | $ | — | 3 | $106,638 | (1) | (1) | (1) | ||||||||
_____________________
(1) As of June 1, 2017, all of the Company’s remaining interest rate swaps had expired. As of December 31, 2016, none of the Company’s interest rate swaps were designated as cash flow hedges.
The following table sets forth the fair value of the Company’s derivative instruments as well as their classification on the consolidated balance sheets as of December 31, 2017 and 2016 (dollars in thousands):
December 31, 2017 | December 31, 2016 | |||||||||||||
Derivative Instruments | Balance Sheet Location | Number of Instruments (1) | Fair Value | Number of Instruments | Fair Value | |||||||||
Interest Rate Swaps | Prepaid expenses and other assets, at fair value | — | $ | — | 2 | $ | 6 | |||||||
Interest Rate Swaps | Other liabilities, at fair value | — | $ | — | 1 | $ | (107 | ) | ||||||
(1) As of June 1, 2017, all of the Company’s remaining interest rate swaps had expired.
F-26
KBS REAL ESTATE INVESTMENT TRUST II, INC.
NOTES TO CONSOLIDATED FINANCIAL STATEMENTS (CONTINUED)
December 31, 2017
The change in fair value of the effective portion of a derivative instrument that is designated as a cash flow hedge is recorded as other comprehensive income (loss) in the accompanying consolidated statements of comprehensive income (loss) and as other comprehensive income in the accompanying consolidated statements of stockholders’ equity. Amounts in other comprehensive income (loss) will be reclassified into earnings in the periods in which earnings are affected by the hedged cash flow. The change in fair value of the ineffective portion is recognized directly in earnings. With respect to swap agreements that were terminated for which it remains probable that the original hedged forecasted transactions (i.e., LIBOR-based debt service payments) will occur, the loss related to the termination of these swap agreements is included in accumulated other comprehensive income (loss) and is reclassified into earnings over the period of the original forecasted hedged transaction. The change in fair value of a derivative instrument that is not designated as a cash flow hedge is recorded as interest expense in the accompanying consolidated statements of operations. The following table summarizes the effects of derivative instruments on the Company’s consolidated statements of operations (in thousands):
For the Years Ended December 31, | ||||||||||||
2017 | 2016 | 2015 | ||||||||||
Derivatives designated as hedging instruments (1) (2) | ||||||||||||
Amount of loss recognized on interest rate swaps (effective portion) | $ | — | $ | 60 | $ | 1,577 | ||||||
— | 60 | 1,577 | ||||||||||
Derivatives not designated as hedging instruments (2) | ||||||||||||
Realized loss recognized on interest rate swaps | 91 | 791 | 3,980 | |||||||||
Unrealized gain on interest rate swaps | (101 | ) | (478 | ) | (2,410 | ) | ||||||
Losses related to swap terminations | — | 156 | 179 | |||||||||
(10 | ) | 469 | 1,749 | |||||||||
Increase (decrease) in interest expense as a result of derivatives | $ | (10 | ) | $ | 529 | $ | 3,326 | |||||
(1) All of the Company’s interest rate swap agreements were initially designated as cash flow hedges. During 2014, the Company dedesignated all of its interest rate swap instruments due to the anticipated early repayment of debt in connection with asset sales, and therefore, certain hedged forecasted transactions were no longer probable beyond the projected asset sale date.
(2) As of June 1, 2017, all of the Company’s remaining interest rate swaps had expired.
9. | FAIR VALUE DISCLOSURES |
Under GAAP, the Company is required to measure certain financial instruments at fair value on a recurring basis. In addition, the Company is required to measure other non-financial and financial assets at fair value on a non-recurring basis (e.g., carrying value of impaired real estate loans receivable and long-lived assets). Fair value is defined as the price that would be received upon the sale of an asset or paid to transfer a liability in an orderly transaction between market participants at the measurement date. The GAAP fair value framework uses a three-tiered approach. Fair value measurements are classified and disclosed in one of the following three categories:
• | Level 1: unadjusted quoted prices in active markets that are accessible at the measurement date for identical assets or liabilities; |
• | Level 2: quoted prices for similar instruments in active markets, quoted prices for identical or similar instruments in markets that are not active, and model-derived valuations in which significant inputs and significant value drivers are observable in active markets; and |
• | Level 3: prices or valuation techniques where little or no market data is available that requires inputs that are both significant to the fair value measurement and unobservable. |
F-27
KBS REAL ESTATE INVESTMENT TRUST II, INC.
NOTES TO CONSOLIDATED FINANCIAL STATEMENTS (CONTINUED)
December 31, 2017
The fair value for certain financial instruments is derived using a combination of market quotes, pricing models and other valuation techniques that involve significant management judgment. The price transparency of financial instruments is a key determinant of the degree of judgment involved in determining the fair value of the Company’s financial instruments. Financial instruments for which actively quoted prices or pricing parameters are available and for which markets contain orderly transactions will generally have a higher degree of price transparency than financial instruments for which markets are inactive or consist of non-orderly trades. The Company evaluates several factors when determining if a market is inactive or when market transactions are not orderly. The following is a summary of the methods and assumptions used by management in estimating the fair value of each class of assets and liabilities for which it is practicable to estimate the fair value:
Cash and cash equivalents, restricted cash, rent and other receivables, and accounts payable and accrued liabilities: These balances approximate their fair values due to the short maturities of these items.
Real estate loan receivable: The Company’s real estate loan receivable is presented in the accompanying consolidated balance sheets at its amortized cost net of recorded loan loss reserves (if applicable) and not at fair value. The fair value of the real estate loan receivable was estimated using an internal valuation model that considered the expected cash flows for the loan, underlying collateral value (for collateral-dependent loans) and estimated yield requirements of institutional investors for loans with similar characteristics, including remaining loan term, loan-to-value, type of collateral and other credit enhancements. The Company classifies these inputs as Level 3 inputs.
Notes payable: The fair value of the Company’s notes payable is estimated using a discounted cash flow analysis based on management’s estimates of current market interest rates for instruments with similar characteristics, including remaining loan term, loan-to-value ratio, type of collateral and other credit enhancements. Additionally, when determining the fair value of liabilities in circumstances in which a quoted price in an active market for an identical liability is not available, the Company measures fair value using (i) a valuation technique that uses the quoted price of the identical liability when traded as an asset or quoted prices for similar liabilities when traded as assets or (ii) another valuation technique that is consistent with the principles of fair value measurement, such as the income approach or the market approach. The Company classifies these inputs as Level 3 inputs.
The following were the face values, carrying amounts and fair values of the Company’s real estate loan receivable and notes payable as of December 31, 2017 and 2016, which carrying amounts do not generally approximate the fair values (in thousands):
December 31, 2017 | December 31, 2016 | |||||||||||||||||||||||
Face Value | Carrying Amount | Fair Value | Face Value | Carrying Amount | Fair Value | |||||||||||||||||||
Financial assets: | ||||||||||||||||||||||||
Real estate loan receivable | $ | 13,921 | $ | 13,923 | $ | 13,960 | $ | 14,073 | $ | 14,079 | $ | 14,089 | ||||||||||||
Financial liabilities: | ||||||||||||||||||||||||
Notes payable | $ | 502,633 | $ | 502,299 | $ | 500,683 | $ | 524,296 | $ | 523,771 | $ | 522,296 | ||||||||||||
Disclosure of the fair values of financial instruments is based on pertinent information available to the Company as of the period end and requires a significant amount of judgment. Low levels of transaction volume for certain financial instruments have made the estimation of fair values difficult and, therefore, both the actual results and the Company’s estimate of value at a future date could be materially different.
F-28
KBS REAL ESTATE INVESTMENT TRUST II, INC.
NOTES TO CONSOLIDATED FINANCIAL STATEMENTS (CONTINUED)
December 31, 2017
10. | RELATED PARTY TRANSACTIONS |
The Company has entered into the Advisory Agreement with the Advisor. This agreement entitles the Advisor to specified fees upon the provision of certain services with regard to the management of the Company’s investments, among other services, and the disposition of investments, as well as reimbursement of certain costs incurred by the Advisor in providing services to the Company. In addition, the Advisor is entitled to certain other fees, including an incentive fee upon achieving certain performance goals, as detailed in the Advisory Agreement. The Company has also entered into a fee reimbursement agreement with the Dealer Manager pursuant to which the Company agreed to reimburse the Dealer Manager for certain fees and expenses it incurs for administering the Company’s participation in the Depository Trust & Clearing Corporation Alternative Investment Product Platform with respect to certain accounts of the Company’s investors serviced through the platform. The Advisor and Dealer Manager also serve or served as the advisor and dealer manager, respectively, for KBS REIT I, KBS REIT III, KBS Strategic Opportunity REIT, KBS Legacy Partners Apartment REIT, KBS Strategic Opportunity REIT II and KBS Growth & Income REIT.
On January 6, 2014, the Company, together with KBS REIT I, KBS REIT III, KBS Strategic Opportunity REIT, KBS Legacy Partners Apartment REIT and KBS Strategic Opportunity REIT II, the Dealer Manager, the Advisor and other KBS-affiliated entities, entered into an errors and omissions and directors and officers liability insurance program where the lower tiers of such insurance coverage are shared. The cost of these lower tiers is allocated by the Advisor and its insurance broker among each of the various entities covered by the program, and is billed directly to each entity. The allocation of these shared coverage costs is proportionate to the pricing by the insurance marketplace for the first tiers of directors and officers liability coverage purchased individually by each REIT. The Advisor’s and the Dealer Manager’s portion of the shared lower tiers’ cost is proportionate to the respective entities’ prior cost for the errors and omissions insurance. In June 2015, KBS Growth & Income REIT was added to the insurance program at terms similar to those described above. In June 2017, the Company renewed its participation in the program, and the program is effective through June 30, 2018. As KBS REIT I was implementing its plan of of liquidation, at renewal in June 2017, KBS REIT I elected to cease participation in the program and obtain separate insurance coverage.
During the years ended December 31, 2017, 2016 and 2015, no other business transactions occurred between the Company and KBS REIT I, KBS REIT III, KBS Strategic Opportunity REIT, KBS Legacy Partners Apartment REIT, KBS Strategic Opportunity REIT II, KBS Growth & Income REIT, the Advisor, the Dealer Manager or other KBS-affiliated entities.
Pursuant to the terms of these agreements, summarized below are the related-party costs incurred by the Company for the years ended December 31, 2017, 2016 and 2015, respectively, and any related amounts payable as of December 31, 2017 and 2016 (in thousands):
Incurred Years Ended December 31, | Payable as of December 31, | |||||||||||||||||||
2017 | 2016 | 2015 | 2017 | 2016 | ||||||||||||||||
Expensed | ||||||||||||||||||||
Asset management fees | $ | 11,617 | $ | 11,811 | $ | 12,082 | $ | — | $ | — | ||||||||||
Reimbursement of operating expenses (1) | 238 | 288 | 197 | 84 | 41 | |||||||||||||||
Disposition fees (2) | 865 | 423 | 1,239 | — | — | |||||||||||||||
$ | 12,720 | $ | 12,522 | $ | 13,518 | $ | 84 | $ | 41 | |||||||||||
(1) Reimbursable operating expenses primarily consists of internal audit personnel costs, accounting software and cybersecurity related expenses incurred by the Advisor under the Advisory Agreement. The Company has reimbursed the Advisor for the Company’s allocable portion of the salaries, benefits and overhead of internal audit department personnel providing services to the Company. These amounts totaled $213,000, $204,000 and $157,000 for the years ended December 31, 2017, 2016 and 2015, respectively, and were the only type of employee costs reimbursed under the Advisory Agreement for the years ended December 31, 2017, 2016 and 2015. The Company will not reimburse for employee costs in connection with services for which the Advisor earns acquisition, origination or disposition fees (other than reimbursement of travel and communication expenses) or for the salaries or benefits the Advisor or its affiliates may pay to the Company’s executive officers. In addition to the amounts above, the Company reimburses the Advisor for certain of the Company’s direct costs incurred from third parties that were initially paid by the Advisor on behalf of the Company.
(2) Disposition fees with respect to real estate sold are included in the gain on sale of real estate, net, in the accompanying consolidated statements of operations. Disposition fees with respect to real estate loans receivable sold are included in the gain on payoff or sale of real estate loans receivable in the accompanying consolidated statements of operations.
F-29
KBS REAL ESTATE INVESTMENT TRUST II, INC.
NOTES TO CONSOLIDATED FINANCIAL STATEMENTS (CONTINUED)
December 31, 2017
During the year ended December 31, 2017, the Advisor paid the Company a $0.1 million property insurance rebate.
11. | SELECTED QUARTERLY FINANCIAL DATA (UNAUDITED) |
Presented below is a summary of the unaudited quarterly financial information for the years ended December 31, 2017 and 2016 (in thousands, except per share amounts):
2017 | ||||||||||||||||
First Quarter | Second Quarter | Third Quarter | Fourth Quarter | |||||||||||||
Revenues | $ | 38,351 | $ | 37,968 | $ | 36,144 | $ | 36,996 | ||||||||
Net income | 2,778 | 10,354 | 899 | 11,083 | ||||||||||||
Net income per common share, basic and diluted | 0.01 | 0.05 | — | 0.07 | ||||||||||||
Distributions declared per common share | 0.068 | 0.068 | 0.069 | 0.069 | ||||||||||||
2016 | ||||||||||||||||
First Quarter | Second Quarter | Third Quarter | Fourth Quarter | |||||||||||||
Revenues | $ | 40,994 | $ | 39,189 | $ | 38,602 | $ | 36,671 | ||||||||
Net income (loss) | 2,920 | 11,936 | 2,445 | (554 | ) | |||||||||||
Net income per common share, basic and diluted | 0.02 | 0.06 | 0.01 | — | ||||||||||||
Distributions declared per common share | 0.070 | 0.070 | 0.070 | 0.071 | ||||||||||||
12. | COMMITMENTS AND CONTINGENCIES |
Economic Dependency
The Company is dependent on the Advisor for certain services that are essential to the Company, including the disposition of real estate and real estate-related investments; management of the daily operations of the Company’s real estate and real estate-related investment portfolio; and other general and administrative responsibilities. In the event the Advisor is unable to provide any of these services, the Company will be required to obtain such services from other sources.
Environmental
As an owner of real estate, the Company is subject to various environmental laws of federal, state and local governments. Compliance with existing environmental laws is not expected to have a material adverse effect on the Company’s financial condition and results of operations as of December 31, 2017.
Legal Matters
From time to time, the Company is party to legal proceedings that arise in the ordinary course of its business. Management is not aware of any legal proceedings of which the outcome is probable or reasonably possible to have a material adverse effect on the Company’s results of operations or financial condition, which would require accrual or disclosure of the contingency and possible range of loss. Additionally, the Company has not recorded any loss contingencies related to legal proceedings in which the potential loss is deemed to be remote.
F-30
KBS REAL ESTATE INVESTMENT TRUST II, INC.
NOTES TO CONSOLIDATED FINANCIAL STATEMENTS (CONTINUED)
December 31, 2017
13. | SUBSEQUENT EVENTS |
The Company evaluates subsequent events up until the date the consolidated financial statements are issued.
Distributions Paid
On January 2, 2018, the Company paid distributions of $4.4 million, which related to distributions declared for December 2017 in the amount of $0.02331370 per share of common stock to stockholders of record as of the close of business on December 20, 2017. On February 1, 2018, the Company paid distributions of $3.9 million, which related to distributions declared for January 2018 in the amount of $0.02076575 per share of common stock to stockholders of record as of the close of business on January 19, 2018. On March 1, 2018, the Company paid distributions of $3.5 million, which related to distributions declared for February 2018 in the amount of $0.01875616 per share of common stock to stockholders of record as of the close of business on February 20, 2018.
Distributions Authorized
On January 30, 2018, the Company’s board of directors authorized a March 2018 distribution in the amount of $0.02076575 per share of common stock to stockholders of record as of the close of business on March 20, 2018, which the Company expects to pay in April 2018, and on March 7, 2018, the Company’s board of directors authorized an April 2018 distribution in the amount of $0.02009589 per share of common stock to stockholders of record as of the close of business on April 20, 2018, which the Company expects to pay in May 2018, and a May 2018 distribution in the amount of $0.02076575 per share of common stock to stockholders of record as of the close of business on May 18, 2018, which the Company expects to pay in June 2018.
F-31
KBS REAL ESTATE INVESTMENT TRUST II, INC.
SCHEDULE III
REAL ESTATE ASSETS AND ACCUMULATED DEPRECIATION AND AMORTIZATION
December 31, 2017
(dollar amounts in thousands)
Initial Cost to Company | Gross Amount at which Carried at Close of Period | ||||||||||||||||||||||||||||||||||||||||||
Description | Location | Ownership Percent | Encumbrances | Land | Building and Improvements (1) | Total | Cost Capitalized Subsequent to Acquisition (2) | Land | Building and Improvements (1) | Total (3) | Accumulated Depreciation and Amortization | Original Date of Construction | Date Acquired | ||||||||||||||||||||||||||||||
100 & 200 Campus Drive Buildings | Florham Park, NJ | 100% | (4) | $ | 10,700 | $ | 188,509 | $ | 199,209 | $ | (53,069 | ) | $ | 9,461 | $ | 136,679 | $ | 146,140 | $ | (11,038 | ) | 1988/1989 | 09/09/2008 | ||||||||||||||||||||
300-600 Campus Drive Buildings | Florham Park, NJ | 100% | 93,125 | 9,717 | 185,445 | 195,162 | (32,803 | ) | 9,121 | 153,238 | 162,359 | (16,430 | ) | 1997/1999 | 10/10/2008 | ||||||||||||||||||||||||||||
Willow Oaks Corporate Center | Fairfax, VA | 100% | (4) | 25,300 | 87,802 | 113,102 | (8,943 | ) | 25,300 | 78,859 | 104,159 | (18,974 | ) | 1986/1989/2003 | 08/26/2009 | ||||||||||||||||||||||||||||
Pierre Laclede Center | Clayton, MO | 100% | 52,638 | 15,200 | 61,507 | 76,707 | 3,664 | 15,200 | 65,171 | 80,371 | (9,901 | ) | 1964/1970 | 02/04/2010 | |||||||||||||||||||||||||||||
Union Bank Plaza | Los Angeles, CA | 100% | 105,000 | 24,000 | 190,232 | 214,232 | (28,113 | ) | 24,000 | 162,119 | 186,119 | (22,159 | ) | 1967 | 09/15/2010 | ||||||||||||||||||||||||||||
Emerald View at Vista Center | West Palm Beach, FL | 100% | — | 5,300 | 28,455 | 33,755 | (2,695 | ) | 5,300 | 25,760 | 31,060 | (6,829 | ) | 2007 | 12/09/2010 | ||||||||||||||||||||||||||||
Granite Tower | Denver, CO | 100% | 59,651 | 8,850 | 141,438 | 150,288 | 4,675 | 8,850 | 146,113 | 154,963 | (43,202 | ) | 1983 | 12/16/2010 | |||||||||||||||||||||||||||||
Fountainhead Plaza | Tempe, AZ | 100% | — | 12,300 | 123,700 | 136,000 | (16,616 | ) | 12,300 | 107,084 | 119,384 | (17,782 | ) | 2011 | 09/13/2011 | ||||||||||||||||||||||||||||
Corporate Technology Centre | San Jose, CA | 100% | 138,219 | 71,160 | 159,712 | 230,872 | (7,982 | ) | 71,160 | 151,730 | 222,890 | (30,261 | ) | 1999/2001 | 03/28/2013 | ||||||||||||||||||||||||||||
TOTAL | $ | 182,527 | $ | 1,166,800 | $ | 1,349,327 | $ | (141,882 | ) | $ | 180,692 | $ | 1,026,753 | $ | 1,207,445 | $ | (176,576 | ) | |||||||||||||||||||||||||
____________________
(1) Building and improvements includes tenant origination and absorption costs.
(2) Costs capitalized subsequent to acquisition is net of impairments and write-offs of fully depreciated/amortized assets.
(3) The aggregate cost of real estate for federal income tax purposes was $1.5 billion (unaudited) as of December 31, 2017.
(4) These properties are security for the Portfolio Mortgage Loan #3, which had an outstanding principal balance of $54.0 million as of December 31, 2017.
F-32
KBS REAL ESTATE INVESTMENT TRUST II, INC.
SCHEDULE III
REAL ESTATE ASSETS AND ACCUMULATED DEPRECIATION AND AMORTIZATION (CONTINUED)
December 31, 2017
(in thousands)
2017 | 2016 | 2015 | ||||||||||
Real Estate | ||||||||||||
Balance at the beginning of the year | $ | 1,275,847 | $ | 1,291,762 | $ | 1,507,291 | ||||||
Improvements | 16,616 | 30,664 | 30,440 | |||||||||
Write-off of fully depreciated and fully amortized assets | (13,095 | ) | (9,862 | ) | (15,670 | ) | ||||||
Impairments | — | — | (114,128 | ) | ||||||||
Sales | (71,923 | ) | (36,717 | ) | (116,171 | ) | ||||||
Balance at the end of the year | $ | 1,207,445 | $ | 1,275,847 | $ | 1,291,762 | ||||||
Accumulated depreciation and amortization | ||||||||||||
Balance at the beginning of the year | $ | 150,111 | $ | 113,460 | $ | 190,624 | ||||||
Depreciation and amortization expense | 50,079 | 54,831 | 53,429 | |||||||||
Write-off of fully depreciated and fully amortized assets | (13,095 | ) | (9,862 | ) | (15,670 | ) | ||||||
Impairments | — | — | (92,341 | ) | ||||||||
Sales | (10,519 | ) | (8,318 | ) | (22,582 | ) | ||||||
Balance at the end of the year | $ | 176,576 | $ | 150,111 | $ | 113,460 | ||||||
F-33
SIGNATURES
Pursuant to the requirements of Section 13 or 15(d) of the Securities Exchange Act of 1934, the registrant has duly caused this report to be signed on its behalf by the undersigned, thereunto duly authorized, in the City of Newport Beach, State of California, on March 8, 2018.
KBS REAL ESTATE INVESTMENT TRUST II, INC. | ||
By: | /s/ Charles J. Schreiber, Jr. | |
Charles J. Schreiber, Jr. | ||
Chairman of the Board, Chief Executive Officer and Director | ||
(principal executive officer) | ||
Pursuant to the requirements of the Securities Exchange Act of 1934, this report has been signed below by the following persons on behalf of the registrant and in the capacities and on the dates indicated:
Name | Title | Date | ||
/s/ CHARLES J. SCHREIBER, JR. | Chairman of the Board, Chief Executive Officer and Director (principal executive officer) | March 8, 2018 | ||
Charles J. Schreiber, Jr. | ||||
/s/ JEFFREY K. WALDVOGEL | Chief Financial Officer (principal financial officer) | March 8, 2018 | ||
Jeffrey K. Waldvogel | ||||
/s/ PETER MCMILLAN III | Executive Vice President, Treasurer, Secretary and Director | March 8, 2018 | ||
Peter McMillan III | ||||
/s/ STACIE K. YAMANE | Chief Accounting Officer (principal accounting officer) | March 8, 2018 | ||
Stacie K. Yamane | ||||
/s/ BARBARA R. CAMBON | Director | March 8, 2018 | ||
Barbara R. Cambon | ||||
/s/ JEFFREY A. DRITLEY | Director | March 8, 2018 | ||
Jeffrey A. Dritley | ||||
/s/ STUART A. GABRIEL, PH.D. | Director | March 8, 2018 | ||
Stuart A. Gabriel, Ph.D. | ||||