Attached files
| file | filename |
|---|---|
| 8-K - 8-K - LABORATORY CORP OF AMERICA HOLDINGS | form8-k3618raymondjamespre.htm |

RAYMOND JAMES
INSTITUTIONAL INVESTORS CONFERENCE
MARCH 6, 2018 | ORLANDO, FL
1
FORWARD LOOKING STATEMENT AND USE OF ADJUSTED MEASURES
This presentation contains forward-looking statements including but not limited to statements with respect to estimated 2018
guidance and the related assumptions, the impact of various factors on operating and financial results, expected savings and
synergies (including from the LaunchPad initiative and as a result of acquisitions), and the opportunities for future growth.
This presentation contains forward-looking statements which are subject to change based on various important factors,
including without limitation, competitive actions and other unforeseen changes and general uncertainties in the marketplace,
changes in government regulations, including health care reform, customer purchasing decisions, including changes in payer
regulations or policies, other adverse actions of governmental and third-party payers, changes in testing guidelines or
recommendations, adverse results in material litigation matters, the impact of changes in tax laws and regulations, failure to
maintain or develop customer relationships, our ability to develop or acquire new products and adapt to technological
changes, failures in information technology systems or data security, challenges in implementing business process changes,
employee relations, and the effect of exchange rate fluctuations on international operations.
Actual results could differ materially from those suggested by these forward-looking statements. The Company has no
obligation to provide any updates to these forward-looking statements even if its expectations change. Further information on
potential factors, risks and uncertainties that could affect the operating and financial results of Laboratory Corporation of
America Holdings (the “Company”) is included in the Company’s Form 10-K for the year ended December 31, 2017, and Forms
10-Q, including in each case under the heading risk factors, and in the Company’s other filings with the SEC.
This presentation contains “adjusted” financial information that has not been prepared in accordance with GAAP, including
Adjusted EPS, and Free Cash Flow, and certain segment information. The Company believes these adjusted measures are
useful to investors as a supplement to, but not as a substitute for, GAAP measures, in evaluating the Company’s operational
performance. The Company further believes that the use of these non-GAAP financial measures provides an additional tool for
investors in evaluating operating results and trends, and growth and shareholder returns, as well as in comparing the
Company’s financial results with the financial results of other companies. However, the Company notes that these adjusted
measures may be different from and not directly comparable to the measures presented by other companies. Reconciliations
of these non-GAAP measures to the most comparable GAAP measures are included in this presentation.
2
AGENDA
Company Overview
2018 Priorities
Long-term Strategic Initiatives
Financial Strength

3
WHO WE ARE
Our Mission
is to
improve health
and improve lives
LabCorp is
a leading global
life sciences company
that is deeply integrated
in guiding patient care
Our Strategic Objectives are to:
Deliver World-Class Diagnostics
Bring Innovative Medicines to Patients Faster
Use Technology to Improve the Delivery of Care
4
LABCORP OVERVIEW
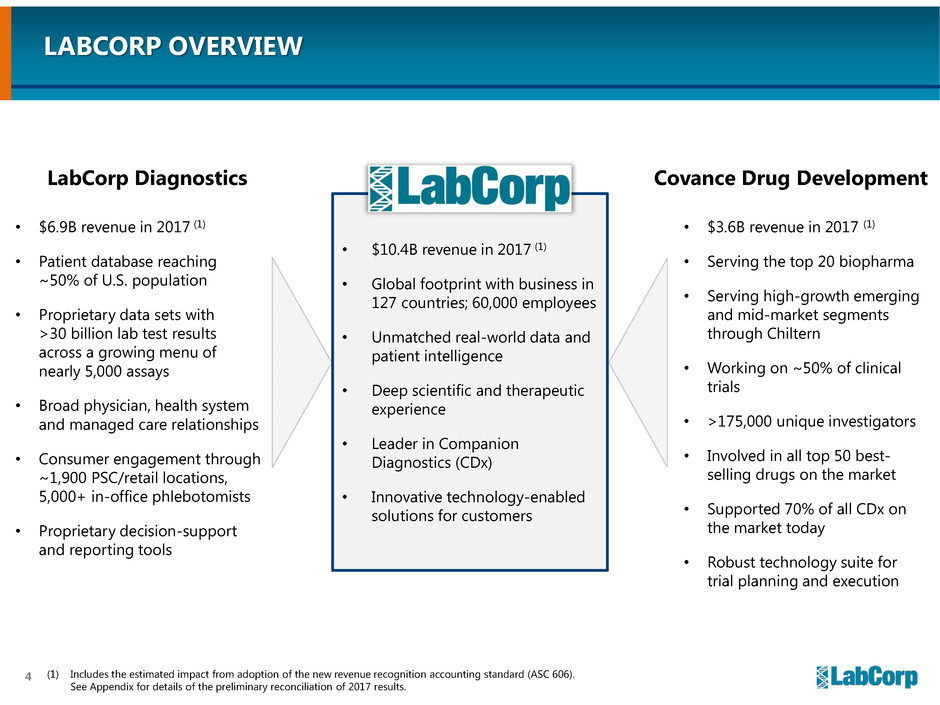
• $6.9B revenue in 2017 (1)
• Patient database reaching
~50% of U.S. population
• Proprietary data sets with
>30 billion lab test results
across a growing menu of
nearly 5,000 assays
• Broad physician, health system
and managed care relationships
• Consumer engagement through
~1,900 PSC/retail locations,
5,000+ in-office phlebotomists
• Proprietary decision-support
and reporting tools
• $3.6B revenue in 2017 (1)
• Serving the top 20 biopharma
• Serving high-growth emerging
and mid-market segments
through Chiltern
• Working on ~50% of clinical
trials
• >175,000 unique investigators
• Involved in all top 50 best-
selling drugs on the market
• Supported 70% of all CDx on
the market today
• Robust technology suite for
trial planning and execution
• $10.4B revenue in 2017 (1)
• Global footprint with business in
127 countries; 60,000 employees
• Unmatched real-world data and
patient intelligence
• Deep scientific and therapeutic
experience
• Leader in Companion
Diagnostics (CDx)
• Innovative technology-enabled
solutions for customers
LabCorp Diagnostics Covance Drug Development
(1) Includes the estimated impact from adoption of the new revenue recognition accounting standard (ASC 606).
See Appendix for details of the preliminary reconciliation of 2017 results.

5
30%
23%
11%
31%
3% 3%
29%
23% 11%
32%
3%3%
Pharma & Biotech
Other Payers
Medicare & Medicaid
Managed Care (Fee for Service)
Patient
Managed Care (Capitated)
(2)
Attractive Customer Mix and Geographic Presence(1)
EXPANDED REVENUE BASE
1. Based on full year 2017 results, which include results from Chiltern as of September 1, 2017. Does not tie due to rounding.
2. Includes physicians and hospitals, occupational testing services, non-U.S. clinical diagnostic laboratory operations, nutritional
chemistry and food safety operations, and Beacon LBS.
29%
23% 11%
32%
3%3%
Pharma & Biotech
Other Payers
Medicare & Medicaid
Managed Care (Fee for Service)
Patient
Managed Care (Capit ted)
(2)
USA Rest of World
81%
19%
Managed Care (Fee for Service)
Patient
Managed Care (Capitated)
Pharma & Biotech
Other Payers (2)
edicare & Medicaid

6
AGENDA
Company Overview
2018 Priorities
Long-term Strategic Initiatives
Financial Strength

7
OUR 2018 PRIORITIES
Drive Profitable
Growth
Optimize
Enterprise
Margins
Integrate Key
Acquisitions

8
DRIVING PROFITABLE GROWTH
Diagnostics: Capitalize on Growth Opportunities
• Health systems, large physician
groups and managed care
partnerships
• Expand 23andMe collaboration
• Mitigate pricing impact of PAMA
Drug Development: Build on Existing
Momentum to Exceed Historical Growth Rates
• Convert backlog into profitable revenue growth
• Maintain broad-based strength in net orders
• Capitalize on strategic investments in leadership,
sales force and technology
• Women’s health, genetics and
medical drug monitoring
portfolio and capabilities
• Pursue accretive acquisitions
• Continue focus on quality,
service and innovation
3.2%
1.2%
2.2%
2015 2016 2017
Year Over Year
Organic Volume Growth
$4.9
$7.1
Dec. 31, 2016 Dec. 31, 2017
Backlog ($B)
1.11x
1.15x
1.23x
1.33x
1.36x
Q4 '16 Q1 '17 Q2 '17 Q3 '17 Q4 '17
Trailing Twelve Month
Net Book to Bill
(1)
(1) Beginning with the fourth quarter of 2016, the Company began reporting net orders, net book-to-bill and backlog based upon fully-executed
contracted awards. The Company believes this methodology is a more conservative and objective practice, providing greater visibility into its
revenue conversion from the backlog. Results shown include the impact from cancellations and foreign currency translation.
(2) Includes backlog from the acquisition of Chiltern.
(3) Includes results from Chiltern following the closing of the acquisition on September 1, 2017.
(1)
(3) (3) (2)

9
• Generates approximately
$500 million in profitable
revenue growth in 2018 from
Chiltern, PAML, and Mount
Sinai transactions
• Successful “Best of the Best”
approach to selecting and
retaining talent
• Dedicated and experienced
integration teams, focused on
customer retention and
synergies
Maximize Value Through Flawless Integration
INTEGRATING KEY ACQUISITIONS
Mount Sinai
Clinical Outreach
Lab Assets

10
OPTIMIZING ENTERPRISE MARGINS
Continue Value Creation Through the
LaunchPad Business Process Improvement Initiative
Covance LaunchPad
• Applying LaunchPad principles to
Drug Development
• Rightsizing implemented in mid-2017
generating $20 million in savings
• Expect $130 million in additional net savings
over the three-year period ending in 2020
• Aided by Chiltern capabilities and expertise
Diagnostics LaunchPad
• Ongoing benefit from reengineering projects
• Additional opportunities, including
streamlining delivery of services
Opportunities for Productivity Gains
Automation Global Service
Delivery Model
Procurement
New Tools
and Technology

11
AGENDA
Company Overview
2018 Priorities
Long-term Strategic Initiatives
Financial Strength

12
HEALTHCARE IS UNDERGOING
A PERIOD OF UNPRECEDENTED CHANGE
Transition to
Value-Based Care
Enhance
Drug Development
Process
Role of the
Consumer
• Improve efficiency in care
delivery
• Reduce the overall cost of
patient care
• Utilize advanced tools and
analytics to deliver better
outcomes via personalized
medicine and population
health
• Address increased trial
complexity, and competition
for patients and investigators
• Greater need for scalable tools
and processes to initiate and
manage trials
• Increased sponsor demand for
data-driven study design and
execution, as well as access to
relevant analytes, biomarkers
and tests
• Increased interest in and
influence over healthcare
decision-making
• Technology advances driving
expectation of convenience
• Consumer satisfaction
increasingly important to
other healthcare stakeholders

13
EXPANDING LABCORP’S ROLE
IN THE HEALTHCARE SYSTEM OF THE FUTURE
• National access
• Comprehensive test menu
• Sales and service organization
• Scientific innovation
• Power of scale
Clinical Decision Support
• Programs on key disease states
• Lab reports support care guidelines
• Developed by physicians
• Data monitoring drives
cost-effective care management
Leading Laboratory Services
Payer and Provider Collaboration
• Help stakeholders achieve total cost of
care metrics in value-based care contracts
• Actionable lab results
• Global patient results data
• MACRA, HEDIS, and ACO quality metrics
• Care Intelligence® population health
Drug Development Solutions
Value-Based Care Solutions
• Companion diagnostics leadership
• Potential provider revenue stream from
increased participation in clinical trials
• Cost savings to patients and payers
• “Real World” data

14
EXPANDING LABCORP’S ROLE
IN THE HEALTHCARE SYSTEM OF THE FUTURE
Reduces the time,
cost and risk of
specimen based
research.
Increases value of
existing assets
with advanced
analytics,
visualizations, and
first-to-market
patient consent
mapping.
Most modern,
end-to-end clinical
trial solution.
Decreases risk,
increases patient
safety and data
quality.
Includes advanced
clinical data
management, risk-
based monitoring,
and dashboards.
Best-in-class
interactive
response systems.
Continuous
innovation and
investment
including new
high-value
physical sample
management
solutions.
Providing insights
into site selection,
patient recruitment
and resource
allocation.
Using custom
analytics to
leverage the power
of Covance’s
unparalleled
patient and
investigator
databases.
Leverages
proprietary and
public data
providing insights
and guiding
decisions;
optimizes trial
planning.
Includes metrics
benchmarking,
trial forecasting,
and protocol
optimization.
Voice of patient
insights from
industry leading
patient panel.
Understand patient
view of trial
participation,
enhance protocol
design and
recruiting tactics.
Creates patient-
centric development
approach.
Maximizing Drug Development Tools and Technologies
for Innovative Solutions Focused on Client Needs
Contributed to $1B+ of Revenue
Across Clinical Development in 2017

15
Real World Data
• Not biased and represents
people as they live with
their disease
• Patient data is granular and
identifiable
Vast Test Menu
• 30+ billion test results across
thousands of diagnostic assays
• >2.5 million samples collected
(>30% by LabCorp
phlebotomists) and processed
weekly across many diseases
and therapeutic areas
Population Level
Disease Analysis
• Surveillance of disease spread
to enable just in time
recruitment
• Unlike other types of real
world data, lab data can be
easily accessed near real time
Power of the LabCorp Data for Trial Design, Site Selection,
and Patient Recruitment
EXPANDING LABCORP’S ROLE
IN THE HEALTHCARE SYSTEM OF THE FUTURE

16
Covance supports
~50%
of all clinical trials
Number of Patients
Date of First Patient In
Quality
Lab Cancellations and Queries
Standardized Site Rank
> 175,000 unique investigators
> 15,000 unique protocols
Investigator Performance
Database
Power of the Xcellerate Investigator Database
EXPANDING LABCORP’S ROLE
IN THE HEALTHCARE SYSTEM OF THE FUTURE

17
On pace to
significantly exceed $100 million
in cumulative new CDx-related revenue from
the acquisition of Covance through 2018
• Dedicated CDx organization with capabilities
across development, validation, testing,
regulatory support, commercialization and
market access
• Opened purpose built, state of the art CDx
laboratory, with focus on genomics and
molecular pathology
• Supported ~70% of CDx on the market(1)
• Customizable offering -- in vitro diagnostic
(IVD) partnerships and single site pathway
• Collaborated with over 40 clients on more
than 165 CDx projects in 2017
• ~$135M in CDx-related enterprise revenue in
2017; 3-year CAGR of ~20%
EXPANDING LABCORP’S ROLE
IN THE HEALTHCARE SYSTEM OF THE FUTURE
Increasing Our Leadership in
Companion and Complementary Diagnostics (CDx)
1. As of January 1, 2018.
$114
$153
$300
2015 2016 2017
CDx-Related Backlog ($M)
18
EXPANDING LABCORP’S ROLE
IN THE HEALTHCARE SYSTEM OF THE FUTURE
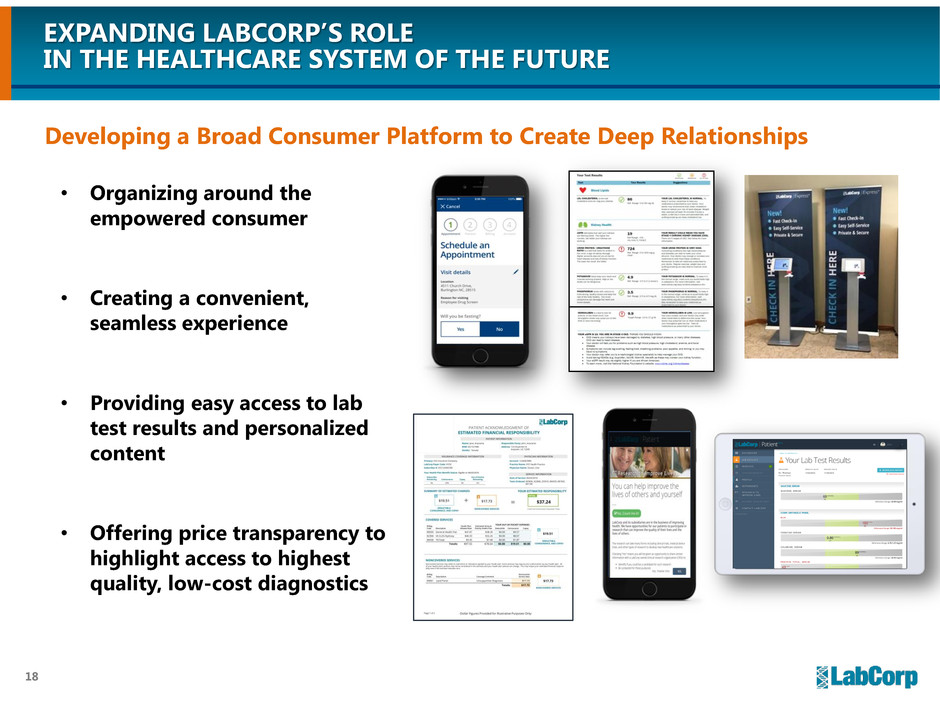
Developing a Broad Consumer Platform to Create Deep Relationships
• Organizing around the
empowered consumer
• Creating a convenient,
seamless experience
• Providing easy access to lab
test results and personalized
content
• Offering price transparency to
highlight access to highest
quality, low-cost diagnostics
19
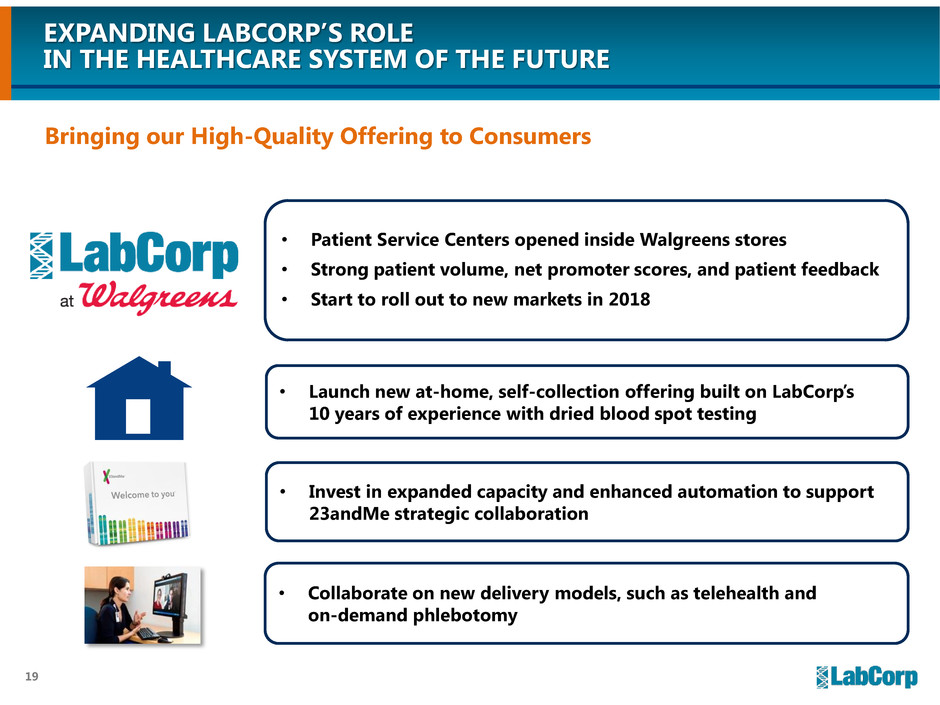
• Patient Service Centers opened inside Walgreens stores
• Strong patient volume, net promoter scores, and patient feedback
• Start to roll out to new markets in 2018
• Launch new at-home, self-collection offering built on LabCorp’s
10 years of experience with dried blood spot testing
• Invest in expanded capacity and enhanced automation to support
23andMe strategic collaboration
• Collaborate on new delivery models, such as telehealth and
on-demand phlebotomy
Bringing our High-Quality Offering to Consumers
EXPANDING LABCORP’S ROLE
IN THE HEALTHCARE SYSTEM OF THE FUTURE

20
2016
>$200 million
2017
~$500 million
OUR DIFFERENTIATED SOLUTIONS ARE
RESONATING WITH CUSTOMERS
Value-Based Care
Solutions
Streamlining
Clinical Studies
Consumer Platform
Completed
3 marquee transactions
in 2017
Cumulative new orders won
through the combination of
LabCorp patient data and
Covance capabilities:
On track to deliver
$150 million
in cumulative new revenue
from the acquisition of Covance
through 2018
LabCorp PSCs in
Walgreens stores are
attracting new patients
28%
18%
0%
10%
20%
30%
LabCorp at
Walgreens
PSCs
%
o
f
p
a
ti
e
n
ts
s
e
e
n
n
ew
to
L
a
b
C
or
p
Comparable
LabCorp
PSCs

21
AGENDA
Company Overview
2018 Priorities
Long-term Strategic Initiatives
Financial Strength

22
$4.5
$4.7
$5.0
$5.5 $5.7
$5.8
$6.0
$6.2
$0.0
$2.0
$4.0
$6.0
$8.0
$10.0
$12.0
2008 2009 2010 2011 2012 2013 2014 2015 2016 2017 2018
$8.5
$9.4
$11.5
$6.6
$6.9
$2.3
$2.8
$7.1
$10.4 $4.3
$3.6
$3.6
REVENUE(1) GROWTH (DOLLARS IN BILLIONS)
(1) 2008-2014 revenues excludes Covance results. 2008 revenue includes a $7.5 million adjustment relating to certain historic overpayments made
by Medicare for claims submitted by a subsidiary of the Company.
(2) Guidance issued on February 6, 2018.
(3) Includes the estimated impact from adoption of the new revenue recognition accounting standard (ASC 606). See Appendix for details of the preliminary
reconciliation of 2017 results.
2018 Guidance(2)
Midpoint 10.5%
Drug
Development
Diagnostics
10-Year CAGR: 10%
(3) (3)

23
ADJUSTED EPS(1)(2) GROWTH
(1) EPS, as presented, represents adjusted, non-GAAP financial measures (excludes amortization, restructuring and other special charges).
See Appendix for non-GAAP reconciliation.
(2) 2008-2014 figures exclude Covance results.
(3) Guidance issued on February 6, 2018.
2018 Guidance(3)
Midpoint 19.8%
$4.91
$5.24
$5.98
$6.37
$6.82 $6.95 $6.80
$7.91
$8.83
$9.60
$11.50
$0.00
$2.00
$4.00
$6.00
$8.00
$10.00
$12.00
2008 2009 2010 2011 2012 2013 2014 2015 2016 2017 2018
10-Year CAGR: 9%
24
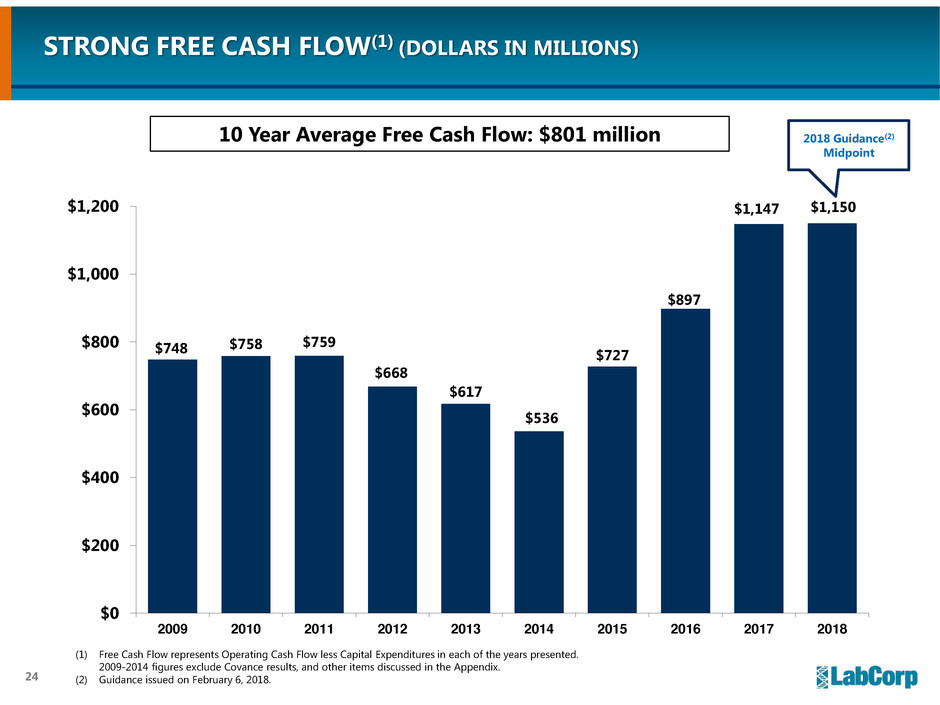
STRONG FREE CASH FLOW(1) (DOLLARS IN MILLIONS)
(1) Free Cash Flow represents Operating Cash Flow less Capital Expenditures in each of the years presented.
2009-2014 figures exclude Covance results, and other items discussed in the Appendix.
(2) Guidance issued on February 6, 2018.
10 Year Average Free Cash Flow: $801 million 2018 Guidance(2)
Midpoint
$748 $758 $759
$668
$617
$536
$727
$897
$1,147 $1,150
$0
$200
$400
$600
$800
$1,000
$1,200
2009 2010 2011 2012 2013 2014 2015 2016 2017 2018

25
TRACK RECORD OF EFFECTIVE AND BALANCED
CAPITAL DEPLOYMENT TO BUILD SHAREHOLDER VALUE
Approximately $2.5 Billion in
Capital Deployment in 2017
2018 Free Cash Flow
M&A Priorities
• Diagnostics “tuck-in” transactions
Return of Capital to Shareholders
• Continue share repurchases
Debt Reduction
• Pay down debt to reduce leverage
Chiltern Acquisition
$1.2 Billion (47%)
Other
Acquisitions
$0.7 Billion (27%)

26
OUR MARKET OPPORTUNITY AND DIFFERENTIATED CAPABILITIES
POSITION US TO DELIVER UNPARALLELED VALUE
Beyond CRO Beyond Lab
• Engage consumers through clinical study
participation and care management tools
• Provide health systems, physicians, and
ACOs with greater access to cutting-edge
care through clinical trials
• Expand our leadership in companion
diagnostics development and
commercialization
• Engage consumers directly with
>115 million patient encounters per year
in LabCorp Diagnostics
• Apply insights from rich patient database
of granular, timely, real world evidence
to clinical study planning and execution
• Utilize patient service center footprint
for virtual real world evidence studies
Value of the Enterprise
Actionable data for everyone
Leading proprietary IT solutions and analytics
Positioned to outperform in the healthcare system of the future

RAYMOND JAMES
INSTITUTIONAL INVESTORS CONFERENCE
MARCH 6, 2018 | ORLANDO, FL

28
Appendix
29
29
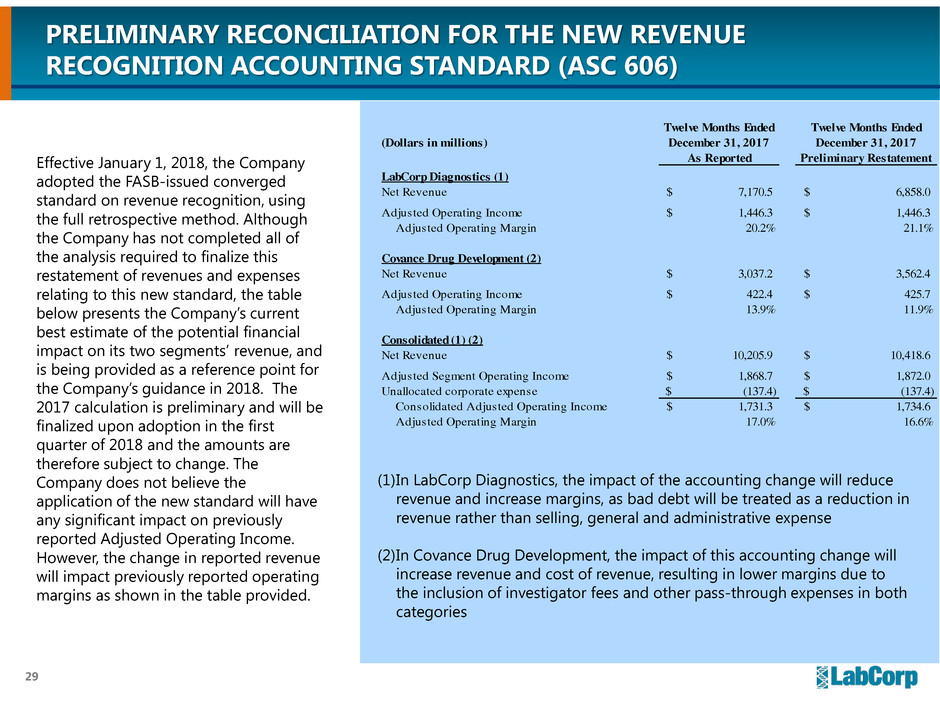
PRELIMINARY RECONCILIATION FOR THE NEW REVENUE
RECOGNITION ACCOUNTING STANDARD (ASC 606)
Effective January 1, 2018, the Company
adopted the FASB-issued converged
standard on revenue recognition, using
the full retrospective method. Although
the Company has not completed all of
the analysis required to finalize this
restatement of revenues and expenses
relating to this new standard, the table
below presents the Company’s current
best estimate of the potential financial
impact on its two segments’ revenue, and
is being provided as a reference point for
the Company’s guidance in 2018. The
2017 calculation is preliminary and will be
finalized upon adoption in the first
quarter of 2018 and the amounts are
therefore subject to change. The
Company does not believe the
application of the new standard will have
any significant impact on previously
reported Adjusted Operating Income.
However, the change in reported revenue
will impact previously reported operating
margins as shown in the table provided.
(1)In LabCorp Diagnostics, the impact of the accounting change will reduce
revenue and increase margins, as bad debt will be treated as a reduction in
revenue rather than selling, general and administrative expense
(2)In Covance Drug Development, the impact of this accounting change will
increase revenue and cost of revenue, resulting in lower margins due to
the inclusion of investigator fees and other pass-through expenses in both
categories
(Dollars in millions)
As Reported Preliminary Restatement
LabCorp Diagnostics (1)
Net Revenue 7,170.5$ 6,858.0$
Adjusted Operating Income 1,446.3$ 1,446.3$
Adjusted Operating Margin 20.2% 21.1%
Covance Drug Development (2)
Net Revenue 3,037.2$ 3,562.4$
Adjusted Operating Income 422.4$ 425.7$
Adjusted Operating Margin 13.9% 11.9%
Consolidated (1) (2)
Net Revenue 10,205.9$ 10,418.6$
Adjusted Segment Operating Income 1,868.7$ 1,872.0$
Unallocated corporate expense (137.4)$ (137.4)$
Consolidated Adjusted Operating Income 1,731.3$ 1,734.6$
Adjusted Operating Margin 17.0% 16.6%
Twelve Months Ended
December 31, 2017
Twelve Months Ended
December 31, 2017
30
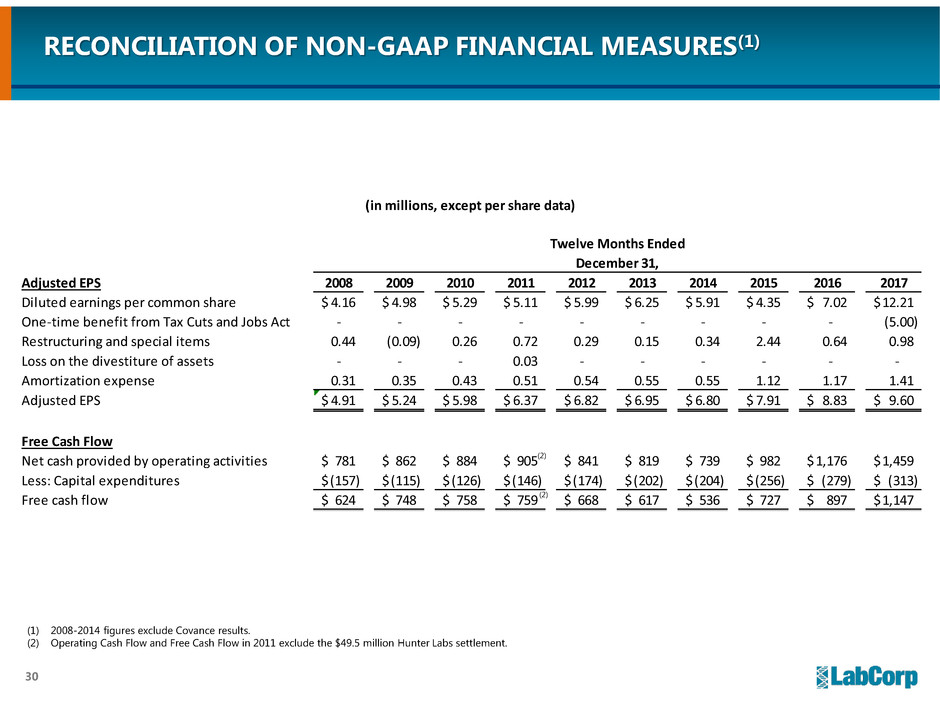
(in millions, except per share data)
Twelve Months Ended
December 31,
Adjusted EPS 2008 2009 2010 2011 2012 2013 2014 2015 2016 2017
Diluted earnings per common share 4.16$ 4.98$ 5.29$ 5.11$ 5.99$ 6.25$ 5.91$ 4.35$ 7.02$ 12.21$
One-time benefit from Tax Cuts and Jobs Act - - - - - - - - - (5.00)
Restructuring and special items 0.44 (0.09) 0.26 0.72 0.29 0.15 0.34 2.44 0.64 0.98
Loss on the divestiture of assets - - - 0.03 - - - - - -
Amortization expense 0.31 0.35 0.43 0.51 0.54 0.55 0.55 1.12 1.17 1.41
Adjusted EPS 4.91$ 5.24$ 5.98$ 6.37$ 6.82$ 6.95$ 6.80$ 7.91$ 8.83$ 9.60$
Free Cash Flow
Net cash provided by operating activities 781$ 862$ 884$ 905$ 841$ 819$ 739$ 982$ 1,176$ 1,459$
Less: Capital expenditures (157)$ (115)$ (126)$ (146)$ (174)$ (202)$ (204)$ (256)$ (279)$ (313)$
Free cash flow 624$ 748$ 758$ 759$ 668$ 617$ 536$ 727$ 897$ 1,147$
RECONCILIATION OF NON-GAAP FINANCIAL MEASURES(1)
(1) 2008-2014 figures exclude Covance results.
(2) Operating Cash Flow and Free Cash Flow in 2011 exclude the $49.5 million Hunter Labs settlement.
(2)
(2)
