Attached files
| file | filename |
|---|---|
| EX-31.2 - EXHIBIT 31.2 - Telaria, Inc. | tlra10k2017exhibit312.htm |
| EX-32.22 - EXHIBIT 32.22 - Telaria, Inc. | tlra10k2017exhibit322.htm |
| EX-32.1 - EXHIBIT 32.1 - Telaria, Inc. | tlra10k2017exhibit321.htm |
| EX-31.1 - EXHIBIT 31.1 - Telaria, Inc. | tlra10k2017exhibit311.htm |
| EX-23.1 - EXHIBIT 23.1 - Telaria, Inc. | tlra10k2017exhibit231.htm |
| EX-21.1 - EXHIBIT 21.1 - Telaria, Inc. | tlra10k2017exhibit211.htm |
| EX-10.33 - EXHIBIT 10.33 - Telaria, Inc. | tlra10k2017exhibit1033.htm |
| EX-10.32 - EXHIBIT 10.32 - Telaria, Inc. | tlra10k2017exhibit1032.htm |
| EX-10.26 - EXHIBIT 10 - Telaria, Inc. | tlra10k2017exhibit1026.htm |
UNITED STATES
SECURITIES AND EXCHANGE COMMISSION
Washington, D.C. 20549
FORM 10-K
x ANNUAL REPORT PURSUANT TO SECTION 13 OR 15(d) OF THE SECURITIES EXCHANGE ACT OF 1934
For the fiscal year ended December 31, 2017
o TRANSITION REPORT PURSUANT TO SECTION 13 OR 15(d) OF THE SECURITIES EXCHANGE ACT OF 1934
Commission File No. 001-35982
TELARIA, INC. |
(Name of registrant as specified in its Charter) |
Delaware | 20-5480343 | |
(State or other jurisdiction of incorporation or organization) | (I.R.S Employer Identification No.) | |
1501 Broadway, Suite 801
New York, New York 10036
(Address of Principal Executive Offices)
(646) 723-5300
(Registrant’s Telephone Number, including area code)
Securities registered pursuant to Section 12(b) of the Act:
Title of each class | Name of each exchange on which registered | |
Common Stock, par value $0.0001 per share | New York Stock Exchange | |
Securities Registered Pursuant to Section 12(g) of the Act: None
Indicate by check mark if the Registrant is a well-known seasoned issuer, as defined in Rule 405 of the Securities Act. Yes No x
Indicate by check mark if the Registrant is not required to file reports pursuant to Section 13 or 15(d) of the Exchange Act. Yes o No x
Indicate by check mark if the Registrant (1) has filed all reports required to be filed by Section 13 or 15(d) of the Exchange Act during the preceding 12 months (or for such shorter period that the Registrant was required to file such reports), and (2) has been subject to such filing requirements for the past 90 days. Yes x No o
Indicate by check mark whether the Registrant has submitted electronically and posted on its corporate Web site, if any, every Interactive Data File required to be submitted and posted pursuant to Rule 405 of Regulation S-T (§232.405 of this chapter) during the preceding 12 months (or for such shorter period that the Registrant was required to submit and post such files). Yes x No o
Indicate by check mark if disclosure of delinquent filers pursuant to item 405 of Regulation S-K is not contained herein, and will not be contained, to the best of Registrant’s knowledge, in definitive proxy or information statements incorporated by reference in Part III of this Form 10-K or any amendment to this Form 10-K.o
Indicate by check mark whether the Registrant is a large accelerated filer, an accelerated filer, a non-accelerated filer, a smaller reporting company or an emerging growth company. See the definitions of "large accelerated filer", "accelerated filer", "smaller reporting company" and "emerging growth company" in Rule 12b-2 of the Exchange Act.
Large accelerated filer | o | Accelerated filer | x |
Non-accelerated filer | o | Smaller reporting company | o |
Emerging growth company | x | ||
If an emerging growth company, indicate by check mark if the registrant has elected not to use the extended transition period for complying with any new or revised financial accounting standards provided pursuant to Section 13(a) of the Exchange Act. x
Indicate by check mark whether the Registrant is a shell company (as defined in Rule 12b-2 of the Exchange Act). Yes o No x
The aggregate market value of the voting and non-voting common stock held by non-affiliates computed by reference to the price at which the common stock was last sold, or the average bid and asked price of such common stock, as of the last business day of the Registrant’s most recently completed second quarter was approximately $104.3 million.
As of February 26, 2018, there were 52,017,481 shares of the Registrant's common stock, par value $0.0001 per share, outstanding.
Telaria, Inc.
Form 10-K
For the Fiscal Year Ended December 31, 2017
Page | ||
Unless the context otherwise requires, we use the terms "Telaria," the "Company," "we," "us" and "our" in this Annual Report on Form 10-K, or this Annual Report, to refer to Telaria, Inc. and, where appropriate, its consolidated subsidiaries.
The Telaria logo, name and other trademarks or service marks of Telaria, Inc. appearing in this report are the property of Telaria, Inc. and its consolidated subsidiaries. This Annual Report contains additional trade names, trademarks and service marks of others, which are the property of their respective owners.
2
SPECIAL NOTE REGARDING FORWARD-LOOKING STATEMENTS
This Annual Report contains forward-looking statements that involve substantial risks and uncertainties. In some cases, you can identify forward-looking statements by the words “anticipate,” “believe,” “continue,” “could,” “estimate,” “expect,” “intend,” “may,” “might,” “objective,” “ongoing,” “plan,” “predict,” “project,” “potential,” “should,” “will,” or “would,” and or the negative of these terms, or other comparable terminology intended to identify statements about the future. These statements involve known and unknown risks, uncertainties and other factors that may cause our actual results, levels of activity, performance or achievements to be materially different from the information expressed or implied by these forward-looking statements. These statements are inherently uncertain and investors are cautioned not to unduly rely upon these statements. In addition, statements that “we believe” and similar statements reflect our beliefs and opinions on the relevant subject. The forward-looking statements and opinions contained in this prospectus are based upon information available to us as of the date of this Annual Report and, while we believe such information forms a reasonable basis for such statements, such information may be limited or incomplete, and our statements should not be read to indicate that we have conducted an exhaustive inquiry into, or review of, all potentially available relevant information. Forward-looking statements include statements about:
• | the expansion of the online video advertising market; |
• | the adoption of our seller platform by premium publishers and our ability to increase the amount of video advertising inventory made available through our seller platform; |
• | our ability to increase the amount of advertising spend and revenue transacted through our seller platform by buyers, including third party demand side platforms, or DSPs; |
•our ability to develop and maintain relationships with premium video publishers on terms that are favorable to us;
•the effects of increased competition as well as innovations by new and existing competitors in our market;
• | our ability to effectively innovate and scale our technology and to continue to address the rapidly evolving requirements of our clients; |
•our ability to effectively manage our growth;
• | the shift in video consumption from linear TV to digital mediums such as connected TV, or CTV, and over-the-top, or OTT; |
•our ability to protect viewers’ information and adequately address privacy concerns;
• | our ability to ensure a high level of brand safety for our clients and to detect “bot” traffic and other fraudulent or malicious activity; |
•the effect of regulatory developments and industry standards regarding internet privacy and other matters;
• our ability to maintain, protect and enhance our intellectual property;
•costs associated with defending intellectual property infringement, securities and other claims;
•potential acquisitions and integrations of complementary business and technologies;
•expected investments or expenditures;
•our ability to attract and retain qualified employees and key personnel; and
• | statements regarding future revenue or the sources of such revenue, gross margins, net income, hiring plans, expenses, capital expenditures, capital requirements and stock performance; |
We caution you that the foregoing list may not contain all of the forward-looking statements made in this Annual Report.
You should refer to the section titled Part I, Item 1A. “Risk Factors” of this Annual Report for a discussion of important factors that may cause our actual results to differ materially from those expressed or implied by our forward-looking statements. As a result of these factors, we cannot assure you that the forward-looking statements in this report will prove to be accurate. Furthermore, if our forward-looking statements prove to be inaccurate, the inaccuracy may be material. In light of the significant uncertainties in these forward-looking statements, you should not regard these statements as a representation or warranty by us or any other person that we will achieve our objectives and plans in any specified time frame or at all.
In addition, statements that “we believe” and similar statements reflect our beliefs and opinions on the relevant subject. These statements are based upon information available to us as of the date of this Annual Report and while we believe such information forms a reasonable basis for such statements, such information may be limited or incomplete, and our statements should not be read to indicate that we have conducted an exhaustive inquiry into, or review of, all potentially available relevant information. These statements are inherently uncertain and investors are cautioned not to unduly rely upon these statements.
We undertake no obligation to publicly update any forward-looking statements, whether as a result of new information, future events or otherwise, except as required by law. You should read this report and the documents that we reference in this report and have filed or incorporated by reference as exhibits to this report completely and with the understanding that our actual future results may be materially different from what we expect. We qualify all of our forward-looking statements by these cautionary statements.
3
PART I
ITEM 1. BUSINESS
Overview
Telaria, Inc. (formerly Tremor Video, Inc.) is a software company providing a fully programmatic, self-service, seller platform to monetize and manage premium video content across all internet-connected screens and devices.
We automate the sales process for publishers of premium video content by allowing them to efficiently identify, package and deliver their advertising inventory to advertisers, agencies and other buyers, while protecting the integrity of their brand and the consumer viewing experience. Our seller platform connects publishers to buyers via direct integrations with leading third-party demand-side platforms, or DSPs. This allows publishers to efficiently monetize their advertising inventory however they want to transact, whether through open auctions or private marketplaces. Private marketplaces can be transacted through invite only auctions, where select buyers are given the opportunity to bid on a curated set of inventory, or through direct connections that allow publishers to programmatically transact with a specific buyer. Integrations with DSPs are done through server-to-server connections and, as a result, we are able to significantly reduce latency and response time for our clients’ ad campaigns.
Our technology provides publishers with the real-time control and insights they require to optimize and automate their video advertising sales and manage their inventory across sales channels, devices and platforms. Our seller platform was built specifically for digital video and to support the unique requirements of mobile, over-the-top, or OTT, and connected TV, or CTV, platforms. We enable publishers to exercise complete control over their monetization strategy by defining supply hierarchies and demand tiers, minimum price floors, and advertiser and category-level black and white lists to manage potential sales channel conflicts. We offer publishers a full suite of tools to ensure the integrity of their brand and the consumer viewing experience, including the ability to review and block specific ad creative units, manage ad frequency, and control for factors such as the volume of an ad. Our seller platform provides publishers with up-to-the-second reporting, which allows them to effectively monitor buying patterns and make real-time changes to take advantage of market dynamics and extensive analytics that leverage billions of historical data points to drive long term monetization strategy. We also offer innovative diagnostic capabilities and transparency to our publishers so that they have a complete picture of how their inventory is represented in the marketplace. This allows publishers to immediately identify and act to resolve any issues impacting revenue generation. In addition, DSPs that connect through our seller platform have access to real-time bidding data, insights and analytics enabling them to more effectively manage buying.
We have built long-standing relationships with premium video publishers, and we believe the scale and quality of our client base makes us an important partner to video ad buyers. We provide our platform to publishers outside the United States through our international operations in Europe, Latin America, and the Asia Pacific regions. Buyers on our seller platform include some of the largest brand advertisers in the world and our platform is integrated with the leading video volume buyers in digital advertising.
We generate revenue each time a transaction occurs on our platform based on a simple and transparent fee structure established with our publisher partners. We do not purchase and re-sell inventory from publishers and do not collect any fees directly from buyers. We act as an agent on behalf of publishers and revenue is recognized, net of any inventory costs that we remit to publishers, when a buyer purchases inventory from a publisher on our platform.
Historically, we operated a buyer platform business in addition to offering our seller platform. The buyer platform enabled advertisers, agencies and other buyers of advertising to discover, buy, optimize and measure the effectiveness of their video ad campaigns across digital screens. We recently made the strategic decision to focus our business exclusively on offering our seller platform, and on August 7, 2017, we announced that we had completed the sale of our buyer platform to an affiliate of Taptica International Ltd. for total consideration of $50 million in cash, subject to adjustment for working capital. Following the sale, we no longer provide a buyer platform solution. As a result, we are able to fully concentrate our resources on expanding our seller platform, while avoiding the inherent conflicts of interest that exist when serving both buy and sell-side clients.
On September 11, 2017, we changed our name from “Tremor Video, Inc.” to “Telaria, Inc.” In connection with the name change, our NYSE ticker symbol was changed to “TLRA” and our corporate website address was changed to www.telaria.com. Information on or accessible through our website is not incorporated by reference to this report.
4
Our Industry
Online video is among the fastest growing advertising formats worldwide. Several factors, including the availability of high-speed broadband and mobile network infrastructure, penetration of internet-connected devices, a proliferation of online content publishers and a behavioral shift towards online and non-linear video viewing, are driving robust growth in online video consumption.
Consumers are rapidly shifting their viewing habits towards digital mediums and expect to be able to consume content seamlessly across multiple devices, including computers, tablets, smartphones, and CTVs. The rapid adoption of OTT viewing and CTV has disrupted the traditional linear TV distribution model, creating new options for consumers and new economic opportunities for content publishers and advertisers.
The continued growth of online video consumption is resulting in a corresponding increase in the amount of advertising dollars being spent by brands through digital video channels. According to estimates from eMarketer, the global online video advertising market is expected to grow from $17.1 billion in 2016 to $42 billion in 2020, representing a compound annual growth rate of 25%. Online video advertising provides a number of advantages over traditional television advertising for both publishers and buyers. For publishers, digital advertising enables content owners to realize the greatest value of their video content by providing tools to maximize advertising yield and manage inventory allocation, while providing advanced real-time reporting and analytics that can inform the sales process. For buyers, online video advertising combines the rich “sight, sound and motion” of television with the advanced optimization, targeting and analytics of digital.
As online video advertising continues to scale and evolve, the need for software solutions that automate the process for planning, buying, selling and measuring video advertising across screens has become more pronounced. As a result, the amount of online video advertising being bought and sold programmatically has increased. Programmatic buying refers to the automated purchase and sale of digital advertising through technology, including the use of real-time bidding technology that allows for the dynamic purchase and sale of advertising inventory on an impression-by-impression basis. We believe that programmatic buying will continue to grow as a percentage of video advertising spend. A report from eMarketer estimates that programmatic digital video ad spending will represent 74% of total U.S. digital video ad spending by the end of 2018.
Despite the tremendous growth opportunity in the online video advertising market, publishers of video advertising face a number of challenges that require sophisticated technology to solve. Publishers face a complex advertising landscape with an increasing number of buyers and technology intermediaries and multiple channels for content consumption for consumers. Furthermore, for content providers to increase their audience, they must focus on the high expectations those audiences have for the end user experience. For instance, publishers must ensure that ads load properly and do not cause delays, are brand safe, match the quality of the premium content that is being viewed, are played at the appropriate volume, and are not overly repetitive. Publishers also need tools to ensure proper management of sales channel and advertiser conflicts. All of these requirements must be executed in real-time and at scale, across multiple channels and devices, while continuously monitoring and controlling their inventory to maximize yield.
Our Platform
Our software platform features:
• | Yield optimization. Our seller platform is integrated with the leading video volume buyers in digital advertising, creating a robust marketplace through which publishers are able to efficiently monetize their advertising inventory through multiple channels and transaction types, including open auction, private auction and private direct. We provide tools that enable publishers to define supply hierarchies and demand tiers, minimum price floors, and advertiser and category level black and white lists to manage potential sales channel conflicts and ensure that our seller platform complements their direct selling efforts. |
• | Advanced brand safety controls. We provide publishers with essential tools and controls to ensure the integrity of their brand and the consumer viewing experience. For instance, our creative review tool lets publishers review the specific creative ad unit that is being served to their inventory, including the volume of the ad relative to their content. If the creative ad unit does not align with the publisher’s brand parameters or content guidelines, they can easily block the ad from serving. We recently introduced an ad-pod feature, which provides long-form video publishers with a tool analogous to commercial breaks in traditional linear television, so that they can request several ads at once. Using this tool, publishers can establish business rules within the ad-pod to increase their value, such as competitive separation of advertisers within an ad-pod and the ability to filter out repetitive ads. |
5
• | Real time reporting, analytics and diagnostics. Our platform provides publishers with access to up-to-the-second reporting, which allows them to effectively monitor buying patterns and make real-time changes to take advantage of market dynamics and maximize their yield. We also provide access to extensive analytics that leverage billions of historical data points derived through our platform to drive long-term monetization strategy for publishers. Our real-time diagnostic tools enable publishers to discover and resolve any revenue impacting issues within seconds. |
Our Competitive Strengths
• | Built exclusively for video. Our seller platform is focused exclusively on managing and monetizing digital video inventory. Unlike other platforms that were originally built to monetize display advertising, our platform was built from day one to address the special requirements of online video, in particular applications running on mobile or CTV devices. Online video poses a number of unique challenges compared to display such as the ability to dynamically inserts ads into live streams, control for ad volume, ensure ad formats play across devices and best match the viewer’s environment, and accommodate spikes in video consumption around landmark events. Any failure to address these challenges could significantly impair the user experience, which is of utmost importance to premium publishers. |
• | Fully agnostic platform for publishers. We are fully aligned with the interests of our publisher partners. Because we do not offer a buyer solution, we are able to avoid inherent conflicts of interest that exist when serving both the buy- and sell-side. In addition, because we do not own or publish content we are agnostic and have no preference towards delivering demand to any specific publisher. As a result, we are able to build trust with clients, many of whom incorporate their proprietary data into our platform. This trust provides us the benefit of long-term and stable relationships with our clients. |
• | Scalability and continuous innovation. Our seller platform is built with a flexible architecture and an adaptable data pipeline at its center, so that we can easily expand the platform as well as integrate with ecosystem partners, enabling our clients to use our platform as a full-suite solution to serve all of their needs. Our open architecture allows us to implement rapid product cycles so that we are continuously innovating to enhance our platform for our clients and stay ahead of the curve in a rapidly evolving industry. For example, we believe that we were the first sell-side solution to deliver programmatic ads into live streaming content and first in market with features optimized for CTV inventory. |
• | Self-service model. We offer a self-service model that lets publishers direct their own sale and management of video ad inventory without extensive involvement by our personnel. This model allows us to scale efficiently and grow our business at a faster pace than the growth of our sales and support organization. As a result, we are able to achieve a high degree of operating leverage, which positions our business for growing profitability. |
• | Transparent pricing. We generate revenue each time a transaction occurs on our platform based on a simple and transparent fee structure established with our publisher partners. We do not purchase and re-sell inventory from publishers and do not collect any fees directly from buyers. This allows publishers to get a true measure of the value of their inventory. |
• | Premium unique inventory. We believe the scale and quality of our client base makes us an important partner to video ad buyers. We have expanded significant time and resources cultivating and building long-term relationships with premium content providers that offer a high-quality TV-like production and viewing experience, in particular in the OTT and CTV space. This inventory is highly sought after by advertisers looking to capitalize on the shift in video consumption from linear TV to digital. |
Clients and Sales
As of December 31, 2017, we had total sales and marketing staff of 89 employees. For 2017, 2016 and 2015 our total sales and marketing expenses were $28.1 million, $22.3 million and $13.8 million, respectively.
Our sales strategy is focused on serving the following core client constituencies: publishers that use our seller platform to manage and monetize their video inventory and buyers that transact on our seller platform, including DSPs that directly purchase inventory on behalf of their clients as well as brand advertiser and advertising agencies who ultimately control and direct advertising spend through DSPs.
6
Our publisher sales team is responsible for increasing the number of premium content providers using our seller platform as well as the amount of ad inventory being monetized through our platform. Our buyer sales team is responsible for increasing the amount of spend and bidding activity being transacted by buyers on our platform.
Publishers
Publishers own or operate websites and applications through which video advertisements can be delivered to consumers as they navigate across screens. Publishers use our seller platform as a yield-optimization and supply management tool to improve their selling efforts.
We are focused on establishing direct relationships with premium content providers that offer high- quality production and viewing experiences, in particular in the OTT and CTV space. This inventory is highly sought after by advertisers looking to capitalize on the shift from linear TV to digital, as it combines a TV-like viewing experience with the significant advantages of online advertising, including the ability to target engaged viewers that have actively opted-into the content.
Our publisher focused sales initiatives use a full-service development and support strategy. Sales executives and account managers are assigned to specific publishers to ensure that they are receiving the maximum benefits offered by our seller platform, and are supported by engineers with deep technical expertise.
We have invested significant resources in identifying and cultivating relationships with publishers to ensure they understand the potential benefits of using our seller platform. Because we seek to build long term direct relationships with premium content providers, the sales process can be time consuming and resource intensive.
Buyers
DSPs are technological intermediaries through which advertisers and agencies transact on our seller platform. DSPs provide ad delivery and related technology solutions for advertisers and agencies and purchase video inventory on behalf of those advertisers and agencies. These DSPs are directly connected to our technology through server-to-server integrations and are responsible for bidding on and purchasing advertising inventory on our seller platform pursuant to a master service agreement.
We maintain close relationships with DSPs to maximize the amount of spend being transacted through our platform. For instance, our sales team collaborates with DSPs to create custom private marketplaces that fit specific targeting criteria for inventory being sought by the DSP. Our team of technical account managers continually monitors DSP bidding activities and provides recommendations that inform their trading practices, including insights around bidding behaviors and forecasting tools that assist in media planning.
While each DSP is responsible for bidding decisions, the overall direction of an advertising campaign is typically determined by the advertiser or advertising agency that has engaged the DSP. Accordingly, in order to increase the amount of spend transacted on our seller platform, we also maintain close relationships directly with brand advertisers and agencies. Our brand-focused sales strategy is to target most “video ready” brand advertisers, including large traditional TV advertising spenders, who are looking to capitalize on the shift in video consumption from linear-TV to online. Our agency sales team is focused on establishing relationships with key decision makers within the largest advertising agencies and agency trading desks.
Technology and Development
We have incurred substantial technology and development expenses developing, maintaining and improving the technology that underlies our seller platform. We believe that technology innovation is key to our success and we intend to continue to invest in the development of new feature sets and functionalities as well as enhancements to our existing product suite. As of December 31, 2017, we had a total of 20 employees engaged in technology and development functions. The majority of our technology and development team is located in Mountain View, California. For 2017, 2016, and 2015, our total technology and development expenses were $8.6 million, $7.0 million and $4.8 million, respectively.
Competition
We operate in a dynamic and competitive market, influenced by trends in both the overall advertising market as well as the online video advertising industry. The competitive dynamics of our market are unpredictable because our market is in an early stage of development, rapidly evolving, fragmented and subject to potential disruption by new technological innovations. We compete with large internet and media companies such as Alphabet, Inc., Facebook, Inc. and Comcast, Inc. that offer video
7
advertising services and sell video advertising inventory as part of a larger solution, as well as advertising technology companies, advertising networks, and supply side platforms that represent publishers. Publishers that use our seller platform may also use other technology partners to sell their inventory or may sell a significant portion of their inventory through their own sales organizations without use of our seller platform. Many of our competitors have significant client relationships, much larger financial resources and longer operating histories than we have.
We believe that we compete on the basis of our ability to technologically innovate, the speed, reliability, scale and ease of use of our self-service platform, our ability to bring demand to publishers at scale, the quality of tools that we provide to publishers to manage their inventory and our real-time reporting and analytics. We believe that we compete favorably with respect to all of these factors. Other competitive strengths include our video-only focus, first mover advantage in OTT and CTV, independent business model that allows us to fully align with our publisher partners, and our emphasis on transparency in pricing and inventory quality.
Intellectual Property
Our ability to protect our intellectual property and our technology will be an important factor in the success and continued growth of our business. We rely on a combination of trade secrets, copyrights, and trademarks, as well as contractual protections, to establish and protect our intellectual property and protect our proprietary technology. We register certain domain names, trademarks and service marks in the United States and in certain locations outside the United States. We also rely upon common law protection for certain marks. We generally enter into confidentiality and invention assignment agreements with our employees and contractors, and confidentiality agreements with parties, with whom we conduct business in order to limit access to, and disclosure and use of, our proprietary information. We also use measures designed to control access to our technology and proprietary information. We view our trade secrets and know-how as a significant component of our intellectual property assets, which we believe differentiate us from our competitors.
Our efforts to preserve and protect our intellectual property, may not prevent the misappropriation of such intellectual property or technology, or deter independent development of similar intellectual property or technology by others. Policing unauthorized use of our technology and intellectual property is difficult. Third-parties may attempt to copy, reverse engineer or otherwise obtain our proprietary technology, or otherwise violate our intellectual property rights. Unauthorized disclosure by our employees, contractors or other third-parties could also occur. Effective intellectual property protection may not be available in the United States or other jurisdictions in which we operate and the efforts we have taken to protect our proprietary rights may not be sufficient or effective. Any impairment or loss of our intellectual property, or any inability to enforce our intellectual property rights effectively, could harm our business or our ability to compete. Also, protecting our technology and intellectual property is costly and time-consuming. Any unauthorized disclosure or use of our intellectual property or technology could make it more expensive for us to do business and could harm our operating results.
Additionally, we expect that products in our industry may be subject to third-party infringement lawsuits as the number of competitors grows and the functionality of products in different industry segments overlaps. From time to time, we may face claims by third-parties that we infringe upon or misappropriate their intellectual property rights, and we may be found to be infringing upon or to have misappropriated such rights. We cannot assure you that we are not infringing on or violating any third-party intellectual property rights.
Governmental Regulation; Industry Alliances
We are subject to numerous U.S. and foreign laws and regulations that are applicable to companies engaged in the online video advertising business. In addition, many areas of law that apply to our business are still evolving, and could potentially affect our business to the extent they restrict our business practices or impose a greater risk of liability. We are aware of several ongoing lawsuits filed against companies in our industry alleging various violations of privacy or data security related laws.
Privacy and Data Protection
We are subject to or affected by federal, state and foreign laws and regulations, as well as regulatory guidance, governing the collection, use, disclosure, retention, and security of personal data, such as the use of personal data for online analytics, use of online tracking technologies, or collection or precise geo-location of mobile devices. The global data protection landscape is rapidly evolving, and implementation standards and enforcement practices are likely to remain uncertain for the foreseeable future. Changes to these laws, regulations and guidelines may affect our ability to collect, use, and share personal data, and to provide services to customers that rely upon our ability to leverage data. The use of personal data for online and digital advertising is a topic of active interest among federal, state, and foreign regulatory bodies. Proposed legislation, regulations and guidelines could, if enacted or implemented, prohibit or limit our ability to use certain technologies that track individuals’
8
activities on web pages, in emails or on the Internet. We also participate in industry self-regulatory programs that set standards for privacy and security of personal data, such as the Payment Card Industry Data Security Standard, or PCI DSS, or standards governing online advertising, or mobile carriers’ rules governing interactions with mobile devices that operate on the carriers’ networks. We may be required by comply with these standards by our partners, vendors, or clients. Evolving global privacy and data protection requirements may create uncertainty in our business, result in liability or impose additional costs on us. As a result of any continuing legislative initiatives and customer demands, we may have to modify our operations to enable us to continue to leverage personal data and other content. The cost of compliance with these laws, regulations and standards is high and is likely to increase in the future. Any failure or perceived failure by us to comply with federal, state, or foreign laws or self-regulatory standards could result in negative publicity, diversion of management time and effort and proceedings against us by governmental entities or others. In many jurisdictions, enforcement actions and consequences for noncompliance are rising. Additionally, if we fail to follow the commitments we make in public privacy notices or applicable self-regulatory security standards, such as those set forth in the PCI DSS, even if no customer information is compromised, we may incur significant fines or experience a significant increase in costs
Our solutions reach devices and users throughout the world, including in Australia, North America, South America, Europe and Asia. Our operations abroad may also be subject to increased scrutiny or attention from data protection authorities. Many countries in these regions have established or are in the process of establishing privacy and data security legal frameworks with which we, our customers, or our vendors must comply. For example, the EU has adopted the General Data Protection Regulation, or GDPR, which is scheduled to go into effect in May 2018 and introduces strict requirements for processing personal data. The GDPR is likely to increase compliance burden on us, including by mandating potentially burdensome documentation requirements, granting certain rights to individuals to control how we collect, use, disclose, retain and leverage information about them. In addition, the GDPR provides for breach reporting requirements, more robust regulatory enforcement and fines of up to 20 million euros or up to 4% of annual global revenue. As we continue to expand into other foreign countries and jurisdictions, we may be subject to additional laws and regulations that may affect how we conduct business.
Information security risks have generally increased in recent years, in part because of the proliferation of new technologies and the use of the Internet, and the increased sophistication and activity of organized crime, hackers, terrorists, activists, and other external parties, some of which may be linked to terrorist organizations or hostile foreign governments. Any person who circumvents our security measures could steal proprietary or confidential customer information or cause interruptions in our operations. Numerous state, federal and foreign laws and regulations impose requirements regarding the security and protection of personal data, as well as notification to persons whose personal data is affected by a breach. Breaches we may experience could significantly harm our reputation and business and financial results.
Industry Alliances
Given the developmental stage of video advertising, industry practices are rapidly evolving. We participate in a wide range of Interactive Advertising Bureau committees, councils and working groups, as well as other industry groups that are focused on establishing best practices for the online video advertising industry.
Employees
As of December 31, 2017, we had 136 employees, of which 20 were primarily engaged in technology and development functions, 89 were engaged in sales and marketing functions, and 27 were engaged in general and administrative functions. Substantially all of these employees are located in the United States. None of our employees are represented by a labor union or covered by a collective bargaining agreement. We consider our relationship with our employees to be favorable.
Facilities
Our principal office occupies approximately 26,000 square feet of leased office space in New York, New York pursuant to a lease agreement that expires in 2029. We also lease offices in San Francisco, California; Santa Monica, California; Mountain View, California; London, England; Sydney, Australia; Melbourne, Australia; New Zealand; Malaysia; and Singapore. We believe our facilities are adequate for our current and near-term needs.
Information about Segment and Geographic Revenue; Seasonal Variations
Information about segment and geographic revenue is set forth in “Note 19 - Segment and Geographic Information” in the notes to the consolidated financial statements included in Part II, Item 8 of this Annual Report, and information regarding seasonality is set forth in Part II, Item 7. “Management’s Discussion and Analysis of Financial Condition and Results of Operations-Results of Operations-Seasonality.”
9
Corporate Information
On September 11, 2017, we changed our name from “Tremor Video, Inc.” to “Telaria, Inc.” We were originally organized as Tremor Media, LLC under the laws of the State of Delaware in November 2005 and converted into a corporation in September 2006. We changed our name to Tremor Video, Inc. in June 2011.
Available Information
Our website is located at www.telaria.com, and our investor relations website is located at http://investor.telaria.com. The contents of our website are not intended to be incorporated by reference into this Annual Report or in any other report or document we file with the U.S. Securities and Exchange Commission, or SEC, and any references to our websites are intended to be inactive textual references only. The following filings are available for download free of charge through our investor relations website as soon as reasonably practicable after we file them with the SEC: Annual Reports on Form 10-K, Quarterly Reports on Form 10-Q, Current Reports on Form 8-K, as well as any amendments to such reports and all other filings pursuant to Section 13(a) or 15(d) of the Securities Act. Additionally, copies of materials filed by us with the SEC may be accessed at the SEC’s Public Reference Room at 100 F Street, N.E., Washington, D.C. 20549 or at www.sec.gov. For information about the SEC’s Public Reference Room, contact 1-800-SEC-0330.
ITEM 1A. RISK FACTORS
The following is a summary description of some of the material risks and uncertainties that may affect our business, including our future financial and operational results. In addition to the other information in this Annual Report, the following statements should be carefully considered in evaluating us.
Risks Relating to Our Business and Industry
We have incurred significant net losses in recent periods, and we expect our operating expenses to increase in the foreseeable future. Accordingly, we may never achieve or sustain profitability.
Our seller platform was introduced in 2015. We incurred net income of $2.2 million for the year ended December 31, 2017, and net losses for the fiscal years 2016 and 2015 of $20.9 million and $43.2 million, respectively. We have an accumulated deficit of $196.5 million and $198.6 million as of December 31, 2017 and 2016, respectively. We do not know if we will be able to achieve profitability or maintain profitability on a continued basis. Although our revenue has grown significantly since the introduction of our seller platform, we may not be able to maintain our historical rate of growth as our business continues to mature. Furthermore, the amount of revenue we generate on our seller platform as a percentage of the spend transacted varies across clients and depending on the type of transaction being executed, which makes it more difficult to predict the revenue that may result from any anticipated level of spend being transacted through our seller platform. We anticipate that our operating expenses in respect of our seller platform will continue to increase in absolute dollars as we scale our business and expand our operations. In particular, we plan to continue to invest in our technology and development efforts and sales and marketing efforts. Our ability to achieve or sustain profitability is based on numerous factors, many of which are beyond our control and we may never be able to generate sufficient revenue to achieve or sustain profitability.
Because our business model has substantially changed and is continuing to develop, our past operating results may not be indicative of future performance.
Historically, we operated a buyer platform business, which enabled advertisers, agencies and other buyers of advertising to discover, buy, optimize and measure the effectiveness of their video ad campaigns across digital screens. Our business model has substantially changed with the sale of our buyer platform in August 2017 and is continuing to develop. Accordingly, it may be difficult to assess our future prospects based on our historical performance and operating history.
In particular, as a result of the sale of the buyer platform we are smaller and less diversified. This may result in the loss of synergies between the buyer platform and our seller platform, cause our cash flow and growth prospects to be more volatile and make us more vulnerable to focused competition.
The success of our business faces a number of challenges, including:
· developing market acceptance for our self-service programmatic seller platform;
· continuing to innovate and improve the technology that underlies our seller platform;
10
· maintaining and expanding our existing relationships, and developing new relationships with publishers and buyers on our seller platform;
· increasing the amount of advertising inventory made available and bid on through our seller platform;
· the growth, evolution and rate of adoption of industry standards;
· ensuring that our business complies with evolving industry standards;
· offering competitive rates to publishers;
· providing publishers with increased yield and monetization, and access to unique data and feature sets, compared to competitors;
· competing effectively to increase our share of brand advertising spend;
· ensuring that we have access to premium advertising inventory in brand-safe environments and effectively combating fraudulent activities;
· maintaining and increasing the value of our brand and goodwill with buyers and publishers;
· effectively controlling our costs as we grow our business;
· responding to evolving government regulations relating to the internet, telecommunications, privacy, marketing and advertising aspects of our business; and
· identifying, attracting, retaining and motivating qualified personnel.
Our ability to meet these challenges will help determine whether we can successfully leverage our business model to achieve profitability and growth in the future. We cannot assure our ability to achieve this goal, to generate consistent and improving operating results, or even to maintain the same level of success that we have had to date.
Unfavorable conditions in the global economy could limit our ability to grow our business and negatively affect our operating results.
Instability in general worldwide economic and political conditions make it extremely difficult for advertisers and us to accurately forecast and plan future business activities, and unfavorable conditions could cause buyers to reduce or delay their advertising spending. Historically, economic downturns have resulted in overall reductions in advertising spending. If macroeconomic conditions deteriorate, buyers may curtail or freeze spending on advertising in general, which would impact the amount of spend transacted through our seller platform. Furthermore, our contracts and relationships with demand side partners generally do not include long-term obligations requiring them to purchase advertising on our seller platform and are cancelable upon short or no notice and without penalty. Any reduction in advertising spending could limit our ability to grow our business and negatively affect our operating results.
We cannot predict the timing, strength or duration of any economic slowdown or recovery. In addition, even if the overall economy improves, we cannot assure you that the market for online video advertising solutions will experience growth or that we will experience growth.
If we fail to adapt and respond effectively to rapidly changing technology and client needs, our solutions may become less competitive or obsolete.
Our future success will depend on our ability to adapt and innovate. To attract new clients and increase spend transacted through our seller platform, we will need to expand and enhance our solutions to meet client needs, add functionality and address technological advancements, including with respect to the sale of video advertising through new and developing mediums and platforms such as CTV and OTT. If we fail to develop new solutions that address our client’s needs, or enhance and improve our solutions in a timely manner or conform to industry standards, we may not be able to achieve or maintain adequate market acceptance of our solutions, and our solutions may become less competitive or obsolete.
11
Our ability to grow is also subject to the risk of future disruptive technologies. If new technologies emerge that are able to deliver to publishers increased yield and monetization more efficiently or effectively than our solutions, such technologies could adversely impact our ability to compete. Programmatic technologies are continuously evolving; for instance, some publishers of digital advertising, in particular with respect to display advertising, have begun to embrace so-called header bidding, a programmatic technique that enables publishers to offer inventory to multiple demand sources simultaneously through a tag in the header of the publisher’s website. We do not currently offer a header bidding solution.
The market in which we participate is intensely competitive and fragmented, and we may not be able to compete successfully with our current or future competitors.
We operate in a dynamic and competitive market, influenced by trends in both the overall advertising market as well as the online video advertising industry. The competitive dynamics of our market are unpredictable because our market is in an early stage of development, rapidly evolving, fragmented and subject to potential disruption by new technological innovations. We compete with large internet companies such as Google, Inc. and Facebook, Inc. that offer video advertising services and sell video advertising inventory as part of a larger solution, as well as advertising technology companies, advertising networks, and supply side platforms that represent publishers. Publishers that utilize our seller platform may also use other technology partners to sell their inventory or may sell a significant portion of their inventory through their own sales organizations without use of our seller platform.
Many of our competitors and potential competitors have significant client relationships, much larger financial resources and longer operating histories than we have and may be less severely affected by changes in consumer preferences, regulations or other developments that may impact the online video advertising industry as a whole. They, or other companies that offer competing advertising solutions, may establish or strengthen cooperative relationships with buyers or publishers, thereby limiting our ability to promote our solutions and generate revenue. Many of these companies are also providers of content, and have access to large amounts of first party data, which are not available to us.
Our business may suffer to the extent that buyers and publishers purchase and sell online video advertising directly from each other without the use of technological intermediaries. New technologies and methods of buying advertising present a dynamic competitive challenge, as market participants offer multiple new products and services aimed at capturing advertising spend such as analytics and bundled offline and online video advertising. If the market shifts towards such new technologies and we are unable to either provide such solutions in a compelling manner or otherwise compete with such shift in ad spending, we may incur increased pricing pressure, reduced profit margins, increased sales and marketing expenses or the loss of market share.
We believe that we compete primarily on the basis of the speed, reliability, scale and ease of use of our self-service platform, the quality of tools that we provide to publishers to control their inventory, our real-time reporting and analytics, our ability to continuously innovate and our ability to provide and attract demand to publishers at scale. Historically, our buyer platform was a source of demand for our seller platform and we cannot predict how the sale of our buyer platform will impact our ability to provide demand at scale to our publisher clients. If we are unable to compete favorably with respect to any of these factors our business could suffer.
Our competitors or potential competitors may adopt certain aspects of our business model, which could reduce our ability to differentiate our solutions. As market dynamics change, or as new and existing competitors introduce more competitive pricing or new or disruptive technologies, we may be unable to maintain or attract new buyers or publishers or increase spend transacted through our platform. As a result, we may be required to change our business model and incur additional expenses in response to competitive pressures, which could harm our revenue, profitability and operating results. For all of these reasons, we may not be able to compete successfully against our current and future competitors.
We operate in a new and rapidly evolving industry. If the online video advertising industry, or programmatic solutions in particular, do not develop or develop more slowly than we expect, our operating results and growth prospects could be harmed.
Online video advertising is an emerging industry, and future demand and market acceptance for online video advertising is uncertain. For example, the online video advertising industry is in the midst of shifting, in part, towards programmatic solutions that automate the sales process and allow for the purchase of inventory through dynamic marketplaces. Many buyers and publishers of advertising have limited experience with online video advertising, and in particular programmatic buying and
12
selling of inventory. Our seller platform is fully-programmatic self-service solution. Accordingly, if buyers and publishers of video inventory are slow to adopt programmatic solutions our operating results and growth prospects could be harmed.
We recently made the strategic decision to focus our business exclusively on our seller platform. If we fail to manage our evolving business effectively, our financial performance may suffer.
We recently made the strategic decision to dispose of our buyer platform and focus our business exclusively on our seller platform. The strategic shift in our business has placed and will continue to place, a significant strain on our managerial, operational, product development, sales and marketing, administrative, financial and other resources. In addition, the sale of the buyer platform may negatively impact market perception of our prospects, result in the loss of key employees or generate post-closing disputes with the purchaser. If we do not manage these changes effectively, successfully forecast demand for our seller platform or manage our expected expenses accordingly, our operating results will be harmed. If we fail to manage our evolving business effectively, our financial performance may suffer.
The sale of assets relating to our buyer platform may expose us to certain post-closing liabilities.
Under the terms of the purchase agreement pursuant to which we sold our buyer platform business, we remain responsible for certain pre-closing liabilities relating to the buyer platform, including certain liabilities which may be contingent or unknown, and are subject to certain indemnification obligations in favor of the purchaser for, among other things, breaches of representations, warranties and covenants under the purchase agreement. In addition, we may be subject to liabilities and obligations under and with respect to contracts and assets relating to the buyer platform that were not transferred to or assumed by the buyer.
If the market for our seller platform develops more slowly than we expect then our operating results and growth prospects may be adversely affected.
Our seller platform is still developing, and the future demand and acceptance for it is uncertain and will likely depend on its perceived effectiveness by publishers. The growth of our seller platform is, in part, dependent on the continued proliferation of digital video content, including the pace of adoption of CTV and OTT as a substitute for traditional cable and broadcast TV. If the market for our seller platform develops more slowly than we expect, or fails to develop, our operating results and growth prospects could be harmed.
Our business depends in part on the success of our strategic relationships with third parties.
Our business depends in part on our ability to continue to successfully manage and enter into successful strategic relationships with third parties. We currently have and are seeking to establish new relationships with third parties, including with respect to the development of integrations with complementary technologies and data vendors.
Our results are dependent, in part, on our ability to integrate our technology with third party demand side platforms, or DSPs. These DSPs bid on and purchase ad inventory on our seller platform on behalf of their advertiser and agency clients. Accordingly, we are reliant on third party DSPs, including the Tremor Video DSP which we divested in the sale of our buyer platform, to access buyer demand and increase the amount of spend that is transacted through our seller platform. We do not have exclusive relationships with DSPs and they are generally free to stop transacting on our seller platform with little or no notice. Moreover, a DSP may reduce its spending on our seller platform for reasons outside of our control, including a loss of their clients or adjustment in strategy. As a result, we may have limited visibility as to our future advertising revenue streams from our buyers. DSPs often control significant amounts of advertising spend across a broad spectrum of buyers; therefore, any material reduction in spending on our platform by a DSP could materially impair our operating results. As of December 31, 2017, three of our DSPs accounted for an aggregate of 48.4% of our outstanding accounts receivables. In some instances, the DSPs that transact on our seller platform are also our competitors. As a result, they may be more likely to decrease or eliminate their spending on our seller platform.
Integrations with third parties are often costly and time consuming, and can present technological challenges. If there are delays in our integration efforts or we are unable to attract new strategic third parties with whom to integrate our technology, it could impact the efficacy of our solutions and hurt our ability to compete in the marketplace. Furthermore, if we experience connectivity or other technical problems with our integrations with DSPs they may be unable to transact on our platform, and any such technical difficulties could lead to a negative perception of our product that could impact future spend decisions.
We may be unable to maintain or expand our relationships with key advertisers and agencies, or attract new advertisers and agencies.
13
Advertisers and agencies generally transact on our seller platform through third party DSPs that are integrated with our platform. While the DSP is responsible for bidding decisions and purchasing ad inventory, the overall direction of the advertising spend is typically determined by the advertiser or advertising agency. Accordingly, our ability to increase spend transacted through our seller platform requires us to maintain and expand our relationships with brand advertisers, including the ad agencies that represent them, in addition to servicing DSPs directly. A buyer’s willingness to purchase inventory through our seller platform depends on a number of factors, including our ability to secure sought after high performing inventory, our access to inventory across multiple screens and devices, our client support and sales efforts, seasonal pattern in buyers’ spending, and reductions in spending levels or changes in strategies. In addition, an advertiser or agency may direct its advertising campaigns through a DSP that is not integrated with our technology, in which case we would not be able to attract such spend through our platform. We cannot assure that buyers will continue to transact through our seller platform or that we will be able to replace departing buyers with new buyers from whom we generate comparable revenue.
We may be unable to provide access to inventory in a brand safe environment, which could harm our reputation and cause our business to suffer.
It is important to buyers that advertisements not be placed in or near content that is unlawful or would be deemed offensive or inappropriate by their customers. Unlike advertising on other mediums, online content can be more unpredictable, and we cannot guarantee that advertisements will appear in a brand safe environment. If we are not successful in providing inventory in a brand environment, our reputation could suffer and our ability to attract potential buyers and retain and expand business with existing buyers could be harmed, or our customers may seek to avoid payment or demand refunds, any of which could harm our business and operating results.
If we fail to detect fraud or other actions that impact video ad campaign performance, we could lose the confidence of buyers, which would cause our business to suffer.
The success of our seller platform depends in part on our ability to assure buyers access to quality, high performing inventory. We have in the past, and may in the future, be subject to fraudulent and malicious activities with respect to publisher inventory offered through our seller platform. An example of such activities would be the use of bots, non-human traffic delivered by machines that are designed to simulate human users and artificially inflate user traffic on websites. These activities could overstate the performance of any given video ad campaign and could harm our reputation. It may be difficult to detect fraudulent or malicious activity because we do not own content and rely in part on our publisher partners for controls with respect to such activity. These risks become more pronounced when programmatic buying is in place. If fraudulent or other malicious activity is perpetrated by others, and we fail to detect or prevent it, the affected buyers may experience or perceive a reduced return on their investment and our reputation may be harmed. Fraudulent or malicious activity could lead to dissatisfaction with our solutions, refusals to pay, refund demands or withdrawal of future business. If we fail to detect fraud or other actions that impact the performance of our video ad campaigns, we could lose the confidence of our buyers, which could cause our business to suffer.
Activities of our publisher clients with which we do business could damage our reputation or give rise to legal claims against us.
Failure of our seller platform clients to comply with federal, state, local or foreign laws or our policies could damage our reputation and expose us to liability under these laws. We may also be liable to third-parties with respect to the content of the video inventory in which an ad is served if the content violates intellectual property rights of third-parties or if the content is in violation of applicable laws. A third-party or regulatory authority may file a claim against us even if our client has represented that its use of the content is lawful and that they have the right to use the intellectual property. In addition, we rely on publishers to provide us with accurate information regarding the details of their inventory and any inaccuracy may subject us to third party claims. Any of these claims could be costly and time-consuming to defend and could also hurt our reputation. Further, if we are exposed to legal liability, we could be required to pay substantial fines or penalties, redesign our business methods, discontinue some of our solutions or otherwise expend significant resources.
If we fail to maintain or increase our access to premium advertising inventory, our operating results may be harmed.
Our success requires us to maintain and expand our access to premium video advertising inventory. We do not own or control the video ad inventory upon which our business depends. Publishers are generally not required to offer a specified level of inventory on our seller platform, and we cannot be assured that any publisher will continue to make their ad inventory available on our seller platform. Publishers may seek to change the terms on which they offer inventory on our platform,
14
including with respect to pricing, or may elect to make advertising inventory available to our competitors who offer more favorable economic terms. Furthermore, publishers may enter into exclusive relationships with our competitors, which preclude us from offering their inventory. In addition, we review our publishers on an on-going basis and have ceased, and may in the future cease, doing business with publishers based on the quality of their inventory. As a result of these factors, we may have limited visibility as to our future access to inventory from publishers or the terms on which such inventory will be made available.
Publishers have a variety of channels in which to sell their video ad inventory, including direct sales forces. Any increase in a publisher’s direct sales efforts may negatively impact our access to that inventory.
If we are unable to maintain or increase our access to premium video ad inventory or if publishers seek to change the terms on which they offer such inventory, our operating results may be harmed.
We may not be able to provide publishers with sufficient access to buyer demand with respect to inventory they make available through our seller platform
Publishers use our seller platform, in part, in order access demand generated by DSPs and other buyers that are integrated with our seller platform. One of the primary factors by which a publisher judges our seller platform is the ability to increase their yield and monetization opportunities. We do not have exclusive relationships with buyers and they are generally free to stop transacting, or reduce their spending, on our seller platform with little or no notice. Moreover, we do not control the bid price for any inventory submitted by a buyer, or the floor price that a publisher sets for such inventory. If we are unable to fill ad inventory that publishers make available through our seller platform with suitable bids from buyers, publishers may negatively view our seller platform compared to competitive offerings and our results may be harmed.
Our sales efforts with buyers and publishers require significant time and expense.
Attracting new buyers and publishers to our seller platform requires significant time and expense, and we may not be successful in establishing new relationships or in maintaining or advancing our current relationships. Our technology and online video brand advertising are relatively new and often require us to spend substantial time and effort educating potential clients about our solutions, including providing demonstrations and comparisons against other available services. Some clients undertake a significant evaluation process that frequently involves not only our platform but also the offerings of our competitors. This process can be costly and time-consuming. As a result, it is difficult to predict when we will obtain new customers and begin generating revenue from these new customers. As part of our sales cycle, we may incur significant expenses. We have no assurance that the substantial time and money spent on our sales efforts will generate significant revenue.
We are focused on increasing adoption by publishers of our seller platform. As a result, we invest significant time in cultivating relationships with our publishers to ensure they understand the potential benefits of our platform and monetization of their inventory with us rather than with third-party media networks, exchanges and other supply side platforms. The relationship building process can take many months and may not result in us winning an opportunity with any given publisher.
Because of competitive market conditions and the negotiating leverage enjoyed by large publishers, we are sometimes forced to choose between losing the opportunity or contracting on terms that allocate more risk to us than or are otherwise less favorable than we prefer to accept.
If we are not successful in streamlining our sales processes with buyers and publishers, our ability to grow our business may be adversely affected.
We have experienced and may continue to experience fluctuations in our operating results due to a number of factors, which make our future results difficult to predict and could cause our operating results to fall below expectations.
Our operating results have historically fluctuated and our future operating results may vary significantly from quarter to quarter due to a variety of factors, including our recent sale of our buyer platform. Period-to-period comparisons of our operating results should not be relied upon as an indication of our future performance. Given our relatively short operating history, the rapidly evolving online video advertising industry and our recent sale of the buyer platform, our historical operating results may not be useful in predicting our future operating results.
Factors that may affect our operating results include the following:
· changes in demand for our seller platform from publishers or buyers of video advertising;
15
· changes in the amount and quality of available video advertising inventory from publishers;
· the timing and amount of sales and marketing expenses incurred to attract new clients;
· changes in the economic prospects of buyers or the economy generally, which could reduce current or prospective buyers’ spend for online video advertising;
· changes in our pricing policies, the pricing policies of our competitors or the pricing of online video advertising inventory generally; and
· costs related to acquisitions of other businesses or dispositions of assets.
Our operating results may fall below the expectations of market analysts and investors in some future periods. If this happens, even just temporarily, the market price of our common stock may fall.
Our revenue tends to be seasonal in nature.
Our revenue and the spend transacted through our seller platform tends to be seasonal in nature and varies from quarter to quarter. During the first quarter, advertisers generally devote less of their budgets to ad spending, which impacts the amount of revenue we generate through our seller platform. Our operating cash flows could also fluctuate materially from period to period as a result of these seasonal fluctuations.
Our take rates may be difficult to forecast and any decrease in our take rates may result in a decrease in our revenue notwithstanding an increase in the amount of spend transacted through our seller platform.
Revenue on our seller platform is booked net of inventory costs. Our take rate, or our revenue as a percentage of the total spend transacted by buyers on our platform, varies by publisher and transaction type. For instance, we may receive a different take rate with respect to a transaction executed via open auction compared to a private marketplace transaction. Our take rate may also be negatively impacted by competitive pricing pressures and the negotiating leverage enjoyed by large publishers. Even if we are able to accurately forecast the anticipated total ad spend transacted by buyers across our seller platform, we may have limited visibility regarding our overall take rate and the revenue we will generate. Decreases in our take rate could cause our revenue and earnings to decrease notwithstanding an increase in the total spend transacted through our seller platform.
Acquisitions or dispositions could entail significant execution, integration and operational risks.
As part of our business strategy, we may acquire or dispose of certain businesses, assets or technologies. For example, we recently disposed of our buyer platform. Acquisitions and dispositions involve numerous risks, any of which could harm our business, including:
· difficulties in integrating the technologies, solutions, operations, existing contracts and personnel of a target company or business unit;
· difficulties in supporting and transitioning clients, if any, of a target company or business unit;
· diversion of financial and management resources from existing operations or alternative opportunities;
· failure to realize the anticipated benefits or synergies of a transaction;
· potential loss of synergies resulting from a disposition;
· failure to identify all of the problems, liabilities or other shortcomings or challenges of an acquired company, technology, or solution, including issues related to intellectual property, solution quality or architecture, regulatory compliance practices, revenue recognition or other accounting practices or employee or client issues;
· risks of entering new markets, including international markets, in which we have limited or no experience;
· potential loss of key employees, customers or suppliers;
16
· increased potential for litigation;
· inability to generate sufficient revenue to offset acquisition or divestiture costs; and
· possible write-offs or impairment charges relating to acquired or divested businesses.
In addition, we may incur indebtedness to complete an acquisition, which may impose operational limitations, or issue equity securities, which would dilute our stockholders’ ownership. We may also unknowingly inherit liabilities from acquired businesses or assets that arise after the acquisition and are not adequately covered by indemnities. Additionally, acquisitions also frequently result in the recording of goodwill and other intangible assets which are subject to potential impairments in the future that could harm our financial results and dispositions may result in an immediate impairment of goodwill.
Foreign acquisitions involve unique risks in addition to those mentioned above, including those related to integration of operations across different cultures and languages, currency risks and the particular economic political and regulatory risks associated with specific countries. The failure to successfully evaluate and execute acquisitions, divestitures or investments or otherwise adequately address the risks described above could materially harm our business and financial results.
Our international operations and any future international expansion may expose us to several risks, such as difficulty adapting our solutions for international markets.
During each of fiscal years 2017, 2016, 2015 and 2014, a substantial majority of our revenue was generated in the United States. While we have offices outside of North America in Australia, Brazil, and the United Kingdom, a substantial majority of our operations are located in the United States.
Our current international operations and any future international expansion of our business will involve a variety of risks, including:
· localization of our solutions, including translation into foreign languages and adaptation for local practices;
· unexpected changes in regulatory requirements, taxes, trade laws, tariffs, export quotas, custom duties or other trade restrictions;
· differing labor regulations where labor laws may be more advantageous to employees as compared to the United States;
· more stringent regulations relating to data security and the unauthorized use of, or access to, commercial and personal information, particularly in the European Union;
· reluctance to allow personally identifiable data related to non-U.S. citizens to be stored in databases within the United States;
· changes in a specific country’s or region’s political or economic conditions;
· challenges inherent in efficiently managing an increased number of employees over large geographic distances, including the need to implement appropriate systems, policies, benefits and compliance programs;
· risks resulting from changes in currency exchange rates;
· limitations on our ability to reinvest earnings from operations in one country to fund the capital needs of our operations in other countries;
· different or lesser intellectual property protection; and
· exposure to liabilities under anti-corruption and anti-money laundering laws, including the U.S. Foreign Corrupt Practices Act and similar laws and regulations in other jurisdictions.
Operating internationally requires significant management attention and financial resources. We cannot be certain that the investment and additional resources required in establishing and expanding our international operations will produce desired
17
levels of revenue or profitability. If we invest substantial time and resources to establish and expand our international operations and are unable to do so successfully and in a timely manner, our business and operating results will suffer.
We have not engaged in currency hedging activities to limit risk of exchange rate fluctuations. Changes in exchange rates affect our costs and earnings, and may also affect the book value of our assets located outside the United States and the amount of our stockholders’ equity.
Failure to comply with anti-bribery, anti-corruption, and anti-money laundering laws could subject us to penalties and other adverse consequences.
We are subject to the U.S. Foreign Corrupt Practices Act of 1977, as amended, or FCPA, the U.K. Bribery Act of 2010, and other anti-corruption, anti-bribery, and anti-money laundering laws in various jurisdictions both domestic and abroad. Anti-corruption and anti-bribery laws have been enforced aggressively in recent years and are interpreted broadly and generally prohibit companies and their employees and agents from promising, authorizing, making or offering improper payments or other benefits to government officials and others in the private sector. While we have policies and procedure to address compliance with such laws, we cannot assure you that all of our employees and agents will not take actions in violation of our policies and applicable law, for which we may be ultimately held responsible. Any violation of the FCPA or other applicable anti-bribery, anti-corruption laws, and anti-money laundering laws could result in whistleblower complaints, adverse media coverage, investigations, significant diversion of management’s resource’s attention, loss of export privileges, severe criminal or civil sanctions, or suspension, or debarment, any of which may have a material adverse effect on our reputation, business, results of operations, and financial condition.
Our ability to raise capital in the future may be limited, and our failure to raise capital when needed could prevent us from growing.
Our business and operations may consume resources faster than we anticipate. In the future, we may need to raise additional funds to expand our marketing and sales and technology development efforts or to make acquisitions. Additional financing may not be available on favorable terms, if at all. Our credit facility matures in January 2020, and we may be unable to renew the credit facility on terms that are acceptable to us. If adequate funds are not available on acceptable terms, we may be unable to fund the expansion of our marketing and sales and technology development efforts or take advantage of acquisition or other opportunities, which could harm our business and results of operations. Furthermore, if we issue additional equity securities, stockholders will experience dilution, and the new equity securities could have rights senior to those of our common stock. Because our decision to issue securities in any future offering will depend on market conditions and other factors beyond our control, we cannot predict or estimate the amount, timing or nature of our future offerings. As a result, our stockholders bear the risk of our future securities offerings reducing the market price of our common stock and diluting their interest.
Provisions of our credit facility and any future debt instruments may restrict our ability to pursue our business strategies.
Our credit facility requires us, and any future debt instruments we may enter into in the future may require us, to comply with various covenants that limit our ability to, among other things:
· dispose of assets;
· complete mergers or acquisitions;
· incur indebtedness;
· encumber assets;
· pay dividends or make other distributions to holders of our capital stock;
· make specified investments; and
· engage in transactions with our affiliates.
These restrictions could inhibit our ability to pursue our business strategies. We are also subject to a financial covenant with respect to a minimum quick ratio, tested monthly, and Adjusted EBITDA for trailing periods which vary from three to twelve months, tested quarterly. If we default under our credit facility, and such event of default is not cured or waived, the
18
lender could cause all amounts outstanding with respect to the debt to be due and payable immediately, which in turn could result in cross defaults under other debt instruments.
Our assets and cash flow may not be sufficient to fully repay borrowings under all of our outstanding debt instruments if some or all of these instruments are accelerated upon a default. We may incur additional indebtedness in the future. The debt instruments governing such indebtedness could contain provisions that are as, or more, restrictive than our existing debt instruments. If we are unable to repay, refinance or restructure our indebtedness when payment is due, the lenders could proceed against the collateral granted to them to secure such indebtedness or force us into bankruptcy or liquidation.
Forecasts of market growth may prove to be inaccurate, and even if the market in which we compete achieves the forecasted growth, our business may not grow at similar rates, if at all.
We have in the past provided, and may continue to provide, forecasts related to the market in which we operate. Market forecasts are subject to significant uncertainty and are based on assumptions and estimates that may prove to be inaccurate. Even if these forecasts prove to be correct, we may not be successful in maintaining or increasing our share of any relevant market.
We depend on key personnel to operate our business, and if we are unable to retain, attract and integrate qualified personnel, our ability to develop and successfully grow our business could be harmed.
We believe that our future success is highly dependent on the contributions of our senior management, as well as our ability to attract and retain additional senior management and highly skilled and experienced technical and other personnel in the United States and abroad. All of our employees, including our senior management, are free to terminate their employment relationship with us at any time, and their knowledge of our business, technology and industry may be difficult to replace. Qualified technical personnel are in high demand, particularly in the digital media industry, and we may incur significant costs to attract them. Many of the companies with which we compete for experienced personnel also have greater resources than us. Additionally, volatility or lack of performance in our stock price may also affect our ability to attract employees and retain our key employees. If we are unable to attract and retain our senior management and key employees, our ability to develop and successfully grow our business could be harmed.
Defects or errors in our solutions could harm our reputation and result in significant costs to us.
The technology underlying our solutions, including our proprietary technology and technology provided by third-parties, may contain material defects or errors that can adversely affect our ability to operate our business and cause significant harm to our reputation. This risk is compounded by the complexity of the technology underlying our solutions and the large amounts of data we utilize. Errors, defects, disruptions in service or other performance problems in our solutions could result in the failure of an ad campaign. Any such failure, malfunction, or disruption in service could harm our reputation and result in significant costs to us.
System failures could significantly disrupt our operations and cause us to lose clients.
Our success depends on the continuing and uninterrupted performance of our solutions. Sustained or repeated system failures that interrupt our ability to provide our solutions, including technological failures affecting our ability to process publisher ad requests or bids for inventory, could significantly reduce the attractiveness of our solutions and reduce our revenue. Our systems are vulnerable to damage from a variety of sources, including telecommunications failures, power outages, malicious human acts and natural disasters. In addition, any steps we take to increase the reliability and redundancy of our systems may be expensive and may not be successful in preventing system failures. Any such system failures could significantly disrupt our operations and cause us to lose clients.
Security breaches, computer viruses and computer hacking attacks could harm our business and results of operations.
We collect, store and transmit information in the provision of our services. We take steps to protect the security, integrity and confidentiality of the information we collect, store or transmit, but there is no guarantee that inadvertent or unauthorized use or disclosure will not occur or that third-parties will not gain unauthorized access to this information despite our efforts. Security breaches, computer malware and computer hacking attacks have become more prevalent in our industry and may occur on our systems or those of our information technology vendors in the future. Any security breach caused by hacking, which involves efforts to gain unauthorized access to information or systems, or to cause intentional malfunctions or loss or
19
corruption of data, software, hardware or other computer equipment, or the inadvertent transmission of computer viruses or other harmful software code could result in the unauthorized disclosure, misuse, or loss of information, legal claims and litigation, indemnity obligations, regulatory fines and penalties, contractual obligations and liabilities, and other liabilities. In addition, if our security measures or those of our vendors are breached or unauthorized access to consumer data otherwise occurs our solutions may be perceived as not being secure, and our clients may reduce the use of or stop using our solutions.
While we have security measures in place, these systems and networks are subject to ongoing threats and, therefore, these security measures may be breached as a result of employee error, failure to implement appropriate processes and procedures, malfeasance, third-party action, including cyber-attacks or other international misconduct by computer hackers or otherwise. This could result in one or more third-parties obtaining unauthorized access to our client data or our data, including personally identifiable information or other viewer data, intellectual property and other confidential business information. Third-parties may also attempt to fraudulently induce employees into disclosing sensitive information such as user names, passwords or other information in order to gain access to client data or our data, including intellectual property and other confidential business information.
Because techniques used to obtain unauthorized access or sabotage systems change frequently and generally are not identified until they are launched against a target, we may be unable to anticipate these techniques or to implement adequate preventative or mitigation measures. Though it is difficult to determine what harm may directly result from any specific interruption or breach, any failure to maintain performance, reliability, security and availability of our network infrastructure or otherwise to maintain the confidentiality, security, and integrity of data that we store or otherwise maintain on behalf of third-parties may harm our reputation and our relationships or harm our ability to retain existing clients and attract new clients. Any of these could harm our business, financial condition and results of operations.
If such unauthorized disclosure or access does occur, we may be required to notify our clients or those persons whose information was improperly used, disclosed or accessed. We may also be subject to claims of breach of contract for such use or disclosure, investigation and penalties by regulatory authorities and potential claims by persons whose information was improperly used or disclosed. The unauthorized use or disclosure of information may result in the termination of one or more of our commercial relationships or a reduction in confidence and usage of our solutions. We may also be subject to litigation and regulatory action alleging the improper use, transmission or storage of confidential information, which could damage our reputation among our current and potential clients, require significant expenditures of capital and other resources and cause us to lose business and revenue.
Even if we do not suffer a data security breach, the increase in the number and the scope of data security incidents has increased regulatory and industry focus on security requirements and heightened data security industry practices. New regulation, evolving industry standards, and the interpretation of both, may cause us to incur additional expense in complying with any new data security requirements. Further, any actual or perceived threats to the security of computers and computer networks, especially mobile devices and mobile networks, could lead existing and potential users to refrain from responding to online video advertising.
Interruptions or delays in service from our third-party data centers or other third-party hosting services could impair the delivery of our solutions and harm our business.
We utilize data center hosting facilities as well Amazon Web Services to deliver our solutions. We also rely on multiple bandwidth providers, multiple internet service providers, as well as content delivery network, or CDN providers, and domain name systems, or DNS providers, and mobile networks to deliver video ads. Any damage to, or failure of, these systems could result in interruptions to the availability or functionality of our service. If for any reason our arrangements with our data center hosting facilities or third-party providers are terminated, we could experience additional expense in arranging for new facilities, technology services and support. In addition, the failure of our data center hosting facilities or any other third-party providers to meet our capacity requirements could result in interruptions in the availability or functionality of our solutions or impede our ability to scale our operations.
The occurrence of a natural disaster, an act of terrorism, vandalism or sabotage, a decision to close our third-party data center hosting facilities or the facilities of any third-party provider without adequate notice, or other unanticipated problems at these facilities could result in lengthy interruptions in the availability of our solutions. While we have disaster recovery arrangements in place, they have not been tested under actual disasters or similar events and may not effectively permit us to continue to provide our solutions in the event of any problems with respect to our data center hosting facilities or any other third-party facilities. To date, we have not experienced these types of events, but we cannot provide any assurances that they will not occur in the future. If any such event were to occur to our business, the delivery of our solutions could be impaired and our business harmed.
20
We intend to relocate our headquarters and we could experience unanticipated costs and disruption to our operations in connection with our relocation.
In October of 2017 we entered into a lease for our new corporate headquarters at 222 Broadway, New York, New York. We intend to relocate to this new office in the second quarter of 2018. In connection with this relocation we could experience unexpected costs or disruptions to our operations and diversion of management attention. Additionally, we are in the process of identifying a subtenant for our existing principal executive offices. We may be unable to identify a subtenant for this office space on acceptable terms. Even if we do identify a subtenant, if the subtenant is unable to meet its obligations under the sublease, we may remain responsible for the obligations under the lease.
Our net operating loss carryforwards may expire unutilized or underutilized, which could prevent us from offsetting future taxable income.
We may be limited in the portion of net operating loss carry-forwards, or NOLs, that we can use in the future to offset taxable income for U.S. federal income tax purposes. As of December 31, 2017, we had U.S. Federal and State NOLs of $100.8 million and $56.9 million, respectively and foreign NOLs of $14.5 million related to our operations in United Kingdom, Germany and Brazil. Our U.S. federal NOLs will expire in various years beginning in 2025 through 2036. Our foreign NOLs can be carried forward without limitation in each respective country. While we expect to be able to use a portion of our available NOL’s to offset gain in respect of the sale of our buyer platform, a lack of future taxable income would adversely affect our ability to utilize the remaining NOLs. In addition, under Section 382 of the Internal Revenue Code, a corporation that undergoes an “ownership change” is subject to limitations on its ability to utilize its NOLs to offset future taxable income. We believe that we experienced an ownership change under Section 382 of the Internal Revenue Code in prior years that may limit our ability to utilize a portion of the NOLs in the future. In addition, future changes in our stock ownership, including as a result of this and future offerings, as well as other changes that may be outside of our control, could result in additional ownership changes under Section 382 of the Internal Revenue Code. Our NOLs may also be impaired under similar provisions of state law. We have recorded a full valuation allowance related to substantially all of our NOLs and other deferred tax assets due to the uncertainty of the ultimate realization of the future benefits of those assets, a portion of which is expected to be reversed in connection with the sale of our buyer platform. Our NOLs may expire unutilized or underutilized, which could prevent us from offsetting future taxable income.
We may experience fluctuations in our tax obligations and effective tax rate.
We are subject to taxation in the United States and in numerous other jurisdictions. We record tax expense based on current tax payments and our estimates of future tax payments, which may include reserves for estimates of probable settlements of tax audits. At any one time, multiple tax years could be subject to audit by various taxing jurisdictions. As a result, we could be subject to higher than anticipated tax liabilities as well as ongoing variability in our quarterly tax rates as audits close and exposures are re-evaluated. Further, our effective tax rate in a given financial statement period may be adversely impacted by changes in tax laws, changes in the mix of revenue among different jurisdictions, changes to accounting rules and changes to our ownership or capital structure. Fluctuations in our tax obligations and effective tax rate could adversely affect our business.
On December 22, 2017, President Trump signed into law the “Tax Cuts and Jobs Act,” or the TCJA, which significantly amends the Internal Revenue Code of 1986. The TCJA, among other things, reduces the corporate tax rate from a top marginal rate of 35% to a flat rate of 21%, limits the tax deduction for interest expense to 30% of adjusted earnings, eliminates net operating loss carrybacks, imposes a one-time tax on offshore earnings at reduced rates regardless of whether they are repatriated, allows immediate deductions for certain new investments instead of deductions for depreciation expense over time, and modifies or repeals many business deductions and credits. We continue to examine the impact these changes may have on our business. Notwithstanding the reduction in the corporate income tax rate, the overall impact of the TCJA is uncertain and our business and financial condition could be adversely affected.
Taxing authorities may successfully assert that we should have collected or in the future should collect sales and use, value added or similar taxes, and we could be subject to liability with respect to past or future sales, which could adversely affect our results of operations.
We do not collect sales and use, value added or similar taxes in all jurisdictions in which we have sales based on our belief that such taxes are not applicable. Sales and use, value added and similar tax laws and rates vary greatly by jurisdiction. Certain jurisdictions in which we do not collect such taxes may assert that such taxes are applicable, which could result in tax assessments, penalties and interest and we may be required to collect such taxes in the future. Such tax assessments, penalties and interest or future requirements may adversely affect our business and operating results.
21
Risks Relating to Our Data Collection and Intellectual Property
We collect and use significant amounts of data to provide our seller platform, and any limitations on the collection and use of such data could significantly diminish the value of our solutions.
Our ability to increase adoption of our seller platform depends, in part, on our ability to collect and lawfully use data, including data that we receive from third parties, such as our publishers, buyers and third-party data providers. Any limitation on our ability to collect user data could make it more difficult for us to optimize sales of inventory and meet the demands of our publishers.
Our technology collects data about an online user in order to operate and enhance our seller platform (that is, to enable the placement of video ads on publisher inventory). We, and our third-party data providers, employ various tracking technologies to collect such data.
Internet users can, with increasing ease, implement practices or technologies that may limit our ability, or that of our third-party data providers, to collect data. For example, users may delete or block the use of the cookies used to collect data, including through their browser or mobile device settings. Internet users may also download “ad blocking” software that prevents certain cookies from being stored on a user’s computer or mobile device, including to prevent the display of targeted advertisements. Additionally, many applications and other online services allow users to avoid receiving advertisements by paying for subscriptions or services.
In addition, current versions of the most widely used web browsers allow users to send “Do Not Track” signals, to indicate that they do not wish to have their web usage tracked. There is currently no definition of “tracking” and no standards regarding how to respond to a “Do Not Track” preference that are accepted or standardized in the industry. Any such standard, law, or regulation could limit our ability to use online user data, which may diminish our ability to optimize inventory, and the value of our services, and place us at a competitive disadvantage to first-party data owners, such as large website operators, many of whom own or are developing or acquiring capabilities that compete with our solutions.
Finally, network carriers, providers of mobile device operating systems, and device manufacturers may also affect our ability to collect data on internet-connected devices, as they are increasingly promoting features that allow users to impair or disable the collection of data.
If consumer sentiment regarding privacy issues or the development and deployment of new browser solutions or other mechanisms that limit the use of tracking technologies or data collected through the use of such technologies results in a material increase in the number of consumers who block our collection of data, our ability to collect valuable and actionable data would be impaired. Consumers may become increasingly resistant to the collection, use, and sharing of data for targeted advertising and may take steps to prevent such collection and use.
Internet users also have the ability to block the ads that we deliver. Technologies have emerged that block the display of an online advertisement. Estimates of the use of such ad-blocking technologies vary by user population, type of media content, geography, and other factors, and the ultimate prevalence and effect of ad-blocking technologies are not certain, but they could have an adverse effect on our business if they reduce the volume of advertising we are able to deliver. Even if ad-blocking technologies do not have a material impact on our business, investor concerns about such technologies could cause our stock price to decline.
In order to effectively operate our services, and in addition to the data we may collect directly from online users, we collect data from buyers, publishers, and other third parties. If we are not able to obtain sufficient rights to data from these third parties, we may not be able to utilize the data in our solutions. Although our arrangements with publishers generally permit us to collect data from advertising campaigns on their sites, some of our publishers do not allow us to collect some or all of this data or limit our use of this data, and future publishers may do the same.
We and/or many of our publishers and buyers voluntarily participate in trade associations and industry self-regulatory groups that promulgate best practice guidelines or codes of conduct in connection with the delivery of online targeted advertising. We could be adversely affected by changes to these guidelines and codes that are inconsistent with our practices If we are perceived as not operating in accordance with industry best practices or codes, either because of our practices, or those of our third-party data providers, our reputation may suffer, we could lose relationships with publishers and buyers, and we could be subject to proceedings or actions by governmental entities or others as described below.
22
Our business is subject to a variety of domestic and international laws, rules, and other obligations regarding data protection.
We are subject to a complex array of federal, state, and international laws relating to the collection, use, retention, disclosure, security, and transfer of personal data. Many jurisdictions have passed laws in this area, and other jurisdictions are considering imposing additional restrictions, including regulating the level of notice and consent required to use cookies or other tools to collect data from online users. The European General Data Protection Regulation, or (“GDPR”), will be in effect as of May 2018. Complying with the GDPR and other emerging and changing laws and requirements, including as we expand our operations globally, may cause us to incur substantial costs or require us to change our business practices. Noncompliance could result in penalties or significant legal liability and could affect our ability to retain and attract customers.
Any failure by us, our customers, our data suppliers, or other parties with whom we do business to comply with federal, state, or international privacy-related or data protection laws and regulations could result in proceedings against us by governmental entities or others. Any alleged or actual failure to comply with applicable privacy laws and regulations may:
• | cause our customers to lose confidence in our solutions; |
• | harm our reputation; |
• | expose us to litigation and liability; and |
• | require us to incur significant expenses for remediation. |
If web, smartphones, tablet and CTV devices, their operating systems or content distribution channels, including those controlled by our competitors, develop in ways that prevent our solutions from working effectively, our ability to grow our business could be impaired.
Our business model depends upon the continued compatibility of our solutions with most internet-connected devices across online, mobile, tablet, CTV and OTT distribution channels, as well as the major operating systems that run on them. The design of these devices and operating systems are controlled by third-parties with whom we do not have any formal relationships. These parties frequently introduce new devices, and from time to time they may introduce new operating systems or modify existing ones. In some cases, the parties that control the development of internet-connected devices and operating systems include companies that we regard as our competitors, including some of our most significant competitors. If our solutions were unable to work or we were unable to collect data on these devices or operating systems, either because of technological constraints or because a maker of these devices or developer of these operating systems wished to impair our ability to sell video ads on them, our ability to grow our business could be impaired.
Any failure to protect our intellectual property rights could negatively impact our business.
We regard the protection of our intellectual property, which includes trade secrets, copyrights, trademarks and domain names as critical to our success. We strive to protect our intellectual property rights by relying on federal, state and common law rights, as well as contractual restrictions. We generally enter into confidentiality and invention assignment agreements with our employees and contractors, and confidentiality agreements with parties, with whom we conduct business in order to limit access to, and disclosure and use of, our proprietary information. However, we may not be successful in executing these agreements with every party who has access to our confidential information or contributes to the development of our intellectual property.
Those agreements that we do execute may be breached, and we may not have adequate remedies for any such breach. These contractual arrangements and the other steps we have taken to protect our intellectual property may not prevent the misappropriation of our intellectual property, or deter independent development of similar intellectual property by others. Breaches of the security of our solutions, databases or other resources could expose us to a risk of loss or unauthorized disclosure of information collected, stored, or transmitted for or on behalf of publishers, or of cookies, data stored in cookies, other user information, or other proprietary or confidential information.
We register certain domain names, trademarks and service marks in the United States and in certain locations outside the United States. Any of our trademarks or other intellectual property rights may be challenged by others or invalidated through administrative process or litigation. Any patents that may be issued in the future may not adequately protect our intellectual property or provide us with competitive advantages, or may be successfully challenged by third-parties. Our competitors and others could attempt to capitalize on our brand recognition by using domain names or business names similar to ours. Domain names similar to ours have been registered in the United States and elsewhere. We may be unable to prevent third-parties from acquiring or using domain names and other trademarks that infringe on, are similar to, or otherwise decrease the value of our brands, trademarks or service marks. Effective trade secret, copyright, trademark, domain name and patent protection are expensive to develop and maintain, both in terms of initial and ongoing registration requirements and the costs of defending our
23
rights. We may be required to protect our intellectual property in an increasing number of jurisdictions, a process that is expensive and may not be successful or which we may not pursue in every location. We may, over time, increase our investment in protecting our intellectual property through patent filings that could be expensive and time-consuming.
Additionally, the Leahy-Smith America Invents Act, or AIA, among other things, switched U.S. patent rights from the former “first-to-invent” system to a “first inventor-to-file” system. This may result in inventors and companies having to file patent applications more frequently to preserve rights in their inventions. This may favor larger competitors that have the resources to file more patent applications.
Monitoring unauthorized use of our intellectual property is difficult and costly. Our efforts to protect our proprietary rights and intellectual property may not be adequate to prevent their misappropriation or misuse. Further, we may not be able to detect unauthorized use of, or take appropriate steps to enforce, our intellectual property rights. Our competitors may also independently develop similar technology, which avoids infringing on our intellectual property rights. The laws of some foreign countries may not be as protective of intellectual property rights as those in the United States, and mechanisms for enforcement of intellectual property rights may be inadequate. Effective patent, trademark, copyright and trade secret protection may not be available to us in every country in which our solutions or technology are hosted or available. Further, legal standards relating to the validity, enforceability and scope of protection of intellectual property rights are uncertain. The laws in the United States and elsewhere change rapidly, and any future changes could adversely affect us and our intellectual property. Our failure to meaningfully protect our intellectual property could result in competitors offering solutions that incorporate our most technologically advanced features, which could seriously reduce demand for our solutions. In addition, we may in the future find it necessary or appropriate to initiate infringement claims or litigation, whether to protect our intellectual property or to determine the enforceability, scope and validity of the intellectual property rights of others. Litigation, whether we are a plaintiff or a defendant, can be expensive, time-consuming and may divert the efforts of our technical staff and managerial personnel, which could harm our business, whether or not such litigation results in a determination that is unfavorable to us. In addition, litigation is inherently uncertain. Accordingly, despite our efforts, we may be unable to prevent third-parties from infringing upon or misappropriating our intellectual property.
Our business may suffer if it is alleged or determined that our solutions or another aspect of our business infringes the intellectual property rights of others.
The online advertising industry is characterized by the existence of large numbers of patents, copyrights, trademarks, trade secrets and other intellectual property and proprietary rights. Companies in this industry are often required to defend against litigation claims that are based on allegations of infringement or other violations of intellectual property rights. Our technologies may not be able to withstand any third-party claims or rights against their use.
Our success depends, in part, upon non-infringement of intellectual property rights owned by others and being able to resolve claims of intellectual property infringement or misappropriation without major financial expenditures or adverse consequences. From time to time we face claims by third-parties that we infringe upon or misappropriate their intellectual property rights, and we may be found to be infringing upon or to have misappropriated such rights. Such claims may be made by competitors or other parties. We cannot assure you that we are not infringing or violating any third-party intellectual property rights. From time to time, we or our clients may be subject to legal proceedings relating to our solutions or underlying technology and the intellectual property rights of others, particularly as we expand the complexity and scope of our business. As a result of disclosure of information in filings required of a public company, our business and financial condition will become more visible, which we believe may result in threatened or actual litigation, including by competitors and other third-parties.
Regardless of whether claims that we are infringing patents or infringing or misappropriating other intellectual property rights have any merit, these claims are time-consuming and costly to evaluate and defend, and can impose a significant burden on management and employees. The outcome of any litigation is inherently uncertain, and we may receive unfavorable interim or preliminary rulings in the course of litigation. There can be no assurances that favorable final outcomes will be obtained in all cases. We may decide to settle lawsuits and disputes on terms that are unfavorable to us. Some of our competitors have substantially greater resources than we do and are able to sustain the costs of complex intellectual property litigation to a greater degree and for longer periods of time than we could. Claims that we are infringing patents or other intellectual property rights could:
· subject us to significant liabilities for monetary damages, which may be tripled in certain instances, and the attorney’s fees of others;
24
· prohibit us from developing, commercializing or continuing to provide some or all of our solutions unless we obtain licenses from, and pay royalties to, the holders of the patents or other intellectual property rights, which may not be available on commercially favorable terms, or at all;
· subject us to indemnification obligations or obligations to refund fees to, and adversely affect our relationships with, our current or future publishers;
· result in injunctive relief against us, or otherwise result in delays or stoppages in providing all or certain aspects of our solutions;
· cause publishers to avoid working with us;
· divert the attention and resources of management and technical personnel; and
· require technology or branding changes to our solutions that would cause us to incur substantial cost and that we may be unable to execute effectively or at all.
We use open source software in our solutions that may subject our technology to general release or require us to re-engineer our solutions, which may cause harm to our business.
Our technology incorporates or is distributed with software or data licensed from third-parties, including some software distributed under so-called “open source” licenses, which we use without charge. Some of these licenses contain requirements that we make available source code for modifications or derivative works we create based upon the open source software, and that we license such modifications or derivative works under the terms of a particular open source license or other license granting third-parties certain rights of further use. By the terms of certain open source licenses, we could be required to release the source code of our proprietary software, and to make our proprietary software available under open source licenses, if we combine and/or distribute our proprietary software with open source software in certain manners. Although we monitor our use of open source software, we cannot be sure that all open source software is reviewed prior to use in our proprietary software, that our programmers have not incorporated open source software into our proprietary software, or that they will not do so in the future. Additionally, the terms of many open source licenses to which we are subject have not been interpreted by U.S. or foreign courts. There is a risk that open source software licenses could be construed in a manner that imposes unanticipated conditions or restrictions on our ability to provide our solutions to our clients. In addition, the terms of open source software licenses may require us to provide software that we develop, using such open source software, to others, including our competitors, on unfavorable license terms. As a result of our current or future use of open source software, we may face claims or litigation, be required to release our proprietary source code, pay damages for breach of contract, re-engineer our technology, discontinue sales in the event re-engineering cannot be accomplished on a timely basis, or take other remedial action that may divert resources away from our development efforts, any of which could adversely affect our business, financial condition or operating results.
We rely on data, other technology, and intellectual property licensed from other parties, the failure or loss of which could increase our costs and delay or prevent the delivery of our solutions.
We utilize various types of data, other technology, and intellectual property licensed from unaffiliated third-parties in order to provide certain elements of our solutions. Any errors or defects in any third-party data or other technology could result in errors in our solutions that could harm our business and damage our reputation and losses in revenue, and we could be required to spend significant amounts of additional research and development resources to fix any problems. In addition, licensed technology, data, and intellectual property may not continue to be available on commercially reasonable terms, or at all. Any loss of the right to use any of these on commercially reasonable terms, or at all, could result in delays in producing or delivering our solutions until equivalent data, other technology, or intellectual property is identified and integrated, which delays could harm our business. In this situation we would be required to either redesign our solutions to function with technology, data or intellectual property available from other parties or to develop these components ourselves, which would result in increased costs. Furthermore, we might be forced to limit the features available in our current or future solutions. If we fail to maintain or renegotiate any of these technology or intellectual property licenses, we could face significant delays and diversion of resources in attempting to develop similar or replacement technology, or to license and integrate a functional equivalent of the technology or intellectual property. The occurrence of any of these events may have an adverse effect on our business, financial condition and operating results.
Risks Related to Being a Public Company and Public Company Financial Reporting
25
We have identified in the past a material weakness in our internal control over financial reporting. If we fail to maintain proper and effective internal and disclosure controls, our ability to produce accurate financial statements and other disclosures on a timely basis could be impaired.
The Sarbanes-Oxley Act of 2002, or the Sarbanes-Oxley Act, requires, among other things, that we maintain effective disclosure controls and procedures and internal control over financial reporting, that meet the applicable standards. We may err in the design or operation of our controls. In addition, a control system, no matter how well designed and operated, can provide only reasonable, not absolute, assurance that the control system’s objectives will be met. Because of the inherent limitations in all control systems, no evaluation of controls can provide absolute assurance that misstatements due to error or fraud will not occur or that all control issues and instances of fraud will be detected.
We are required to perform system and process evaluation and testing of our internal controls over financial reporting to allow management to report on the effectiveness of our internal controls over financial reporting. During the fiscal year ended December 31, 2015 management identified a material weakness in our internal control over financial reporting related to principal-agent considerations around revenue recognition. A material weakness is defined as a deficiency, or combination of deficiencies, in internal control over financial reporting, such that there is a reasonable possibility that a material misstatement of our annual or interim financial statements will not be prevented or detected on a timely basis. As a result of the material weakness, our management concluded that our internal control over financial reporting was not effective for fiscal year 2015 and engaged in implementing a remediation plan designed to address the material weakness. While we have remediated the material weakness we identified, we may in the future discover areas of our internal controls over financial reporting that need improvement. If additional material weaknesses or significant deficiencies in our internal control are discovered or occur in the future, our consolidated financial statements may contain material misstatements and we could be required to restate our financial results. In addition, the market price of our stock could decline and we could be subject to sanctions or investigations by the SEC or other regulatory authorities, which would require additional financial and management resources and could lead to substantial additional costs for accounting and legal fees.
The Sarbanes-Oxley Act also generally requires an attestation from an independent registered public accounting firm on the effectiveness of our internal control over financial reporting. As an “emerging growth company” under the Jumpstart Our Business Startups, or JOBS Act, we have in the past availed ourselves of the exemption from that requirement[, including in this Annual Report. However, when we cease to be an “emerging growth company” at the end of the fiscal year ending December 31, 2018, we will no longer be able to avail ourselves of this exemption. At such time, our independent registered public accounting firm may issue a report that is adverse in the event it is not satisfied with the level at which our controls are documented, designed or operating.
This may require us to incur substantial additional professional fees and internal costs to expand our accounting and finance functions and to expend significant management efforts to remediate the concerns expressed by our independent registered public accounting firm. We may not be able to remediate any future material weaknesses, or to complete our evaluation, testing and any required remediation in a timely fashion.
If we identify new or additional material weaknesses in our internal controls, or we are not able to conclude that our internal control over financial reporting is effective, or if our auditors are unable to express an opinion that our internal controls over financial reporting are effective when they are required to issue such opinion, investors could lose confidence in the accuracy and completeness of our financial reports, which could harm our stock price, and we could be subject to sanctions or investigations by the New York Stock Exchange, or NYSE, the SEC or other regulatory authorities. Failure to remediate any material weakness in our internal control over financial reporting, or to implement or maintain other effective control systems required of public companies, could also restrict our future access to the capital markets.
Our accounting is becoming more complex, and relies upon estimates or judgments relating to our critical accounting policies. If our accounting is erroneous or based on assumptions that change or prove to be incorrect, our operating results could fall below the expectations of securities analysts and investors, resulting in a decline in our stock price.
The preparation of financial statements in conformity with generally accepted accounting principles in the United States, or U.S. GAAP, requires management to make estimates and assumptions that affect the amounts reported in the consolidated financial statements and accompanying notes, and also to comply with many complex requirements and standards. We devote substantial resources to compliance with accounting requirements and we base our estimates on our best judgment, historical experience, information derived from third parties, and on various other assumptions that we believe to be reasonable under the circumstances, the results of which form the basis for making judgments about the carrying values of assets, liabilities, equity, revenue and expenses that are not readily apparent from other sources. However, various factors, including the recent sale of our buyer platform, are causing our accounting to become complex. Ongoing evolution of our business, and any future
26
acquisitions or dispositions, will compound these complexities. Our operating results may be adversely affected if we make accounting errors or our judgments prove to be wrong, assumptions change or actual circumstances differ from those in our assumptions, which could cause our operating results to fall below the expectations of securities analysts and investors or guidance we may have provided, resulting in a decline in our stock price and potential legal claims. Significant judgments, assumptions and estimates used in preparing our consolidated financial statements include those related to revenue recognition, stock-based compensation, business combinations, and income taxes.
Risks associated with being a public company.
As a public company, and particularly after we cease to be an “emerging growth company” at the end of the fiscal year ending December 31, 2018, we will incur significant legal, accounting and other expenses that we did not incur as a private company. In addition, the Sarbanes-Oxley Act of 2002 and rules subsequently implemented by the SEC and NYSE impose numerous requirements on public companies, including requiring changes in corporate governance practices. Our management and other personnel will need to devote a substantial amount of time to compliance with these laws and regulations. These requirements have increased and will continue to increase our legal, accounting, and financial compliance costs and have made and will continue to make some activities more time consuming and costly. For example, these rules and regulations make it more difficult and more expensive for us to obtain director and officer liability insurance compared to when we were a private company. These rules and regulations could also make it more difficult for us to attract and retain qualified persons to serve on our board of directors or our board committees or as executive officers.
Risks Related to Ownership of Our Common Stock
The market price of our common stock may be volatile, which could result in substantial losses for investors.
The trading price of our common stock has been, and is likely to continue to be, volatile and could be subject to wide fluctuations in response to various factors, some of which are beyond our control. Between January 1, 2017 and February 26, 2018, our stock price has ranged from $1.90 per share to $5.27 per share. In addition, the trading prices of the securities of advertising technology companies in general have been highly volatile, and the volatility in market price and trading volume of securities is often unrelated or disproportionate to the financial performance of the companies issuing the securities. In addition to the factors discussed in this “Risk Factors” section and elsewhere in our public filings with the SEC, factors affecting the market price of our common stock include:
· price and volume fluctuations in the overall stock market, or in the market for the stock of comparable companies, from time to time;
· adverse changes in the regulatory environment;
· actual or anticipated changes in our earnings or fluctuations in our operating results or the results of our competitors;
· changes in the market perception of online video advertising platforms generally or in the effectiveness of our solutions in particular;
· a lack of trading volume in our common stock;
·announcements of technological innovations, new solutions, strategic alliances or significant agreements by us or by our competitors;
· issuance of new or changed securities analysts’ reports or recommendations for our or our competitors’ stock;
· litigation involving us;
· changes in general economic, industry and market conditions and trends;
· recruitment or departure of key personnel;
· announcements of acquisitions or dispositions, including the sale of the Company’s buyer platform; and
27
· the other factors described in this section of the report titled “Risk Factors.”
In the past, following periods of volatility in the market price of a company’s securities, securities class action or derivative litigation has often been brought against that company and its officers and directors. In November 2013, a class action lawsuit was filed against us, alleging certain misrepresentations in connection with our initial public offering. The claim was dismissed in March 2015. Because of the potential volatility of our stock price, we may become the target of additional securities litigation in the future. Securities litigation could result in substantial costs and divert management’s attention and resources from our business.
Sales of substantial amounts of our common stock in the public markets, or the perception that they might occur, could reduce the price that our common stock might otherwise attain and may dilute your voting power and your ownership interest in us.
Sales of a substantial number of shares of our common stock, or the perception that a substantial number of shares could be sold, including under our shelf registration statement filed with the SEC on November 6, 2017, could reduce the market price of our common stock. As of February 26, 2018, we had 52,017,481 shares of common stock outstanding.
In addition, an aggregate of 5,100,068 shares of common stock issuable upon exercise of options outstanding as of December 31, 2017 will become available for sale immediately upon the exercise of such option awards.
We have also registered for offer and sale all shares of common stock that we may issue under our stock-based compensation plans, including our employee stock purchase plan. These shares can be freely sold in the public market upon issuance. Sales of common stock by existing stockholders in the public market, whether as part of an underwritten public offering or pursuant to exemptions from registration, the availability of these shares for sale, our issuance of securities or the perception that any of these events might occur could materially and adversely affect the market price of our common stock. In addition, the sale of these securities could impair our ability to raise capital through the sale of additional stock.
In addition, in the future, we may issue additional shares of common stock or other equity or debt securities convertible into common stock in connection with a financing, acquisition, litigation settlement, and employee arrangements or otherwise. Any such issuance could result in substantial dilution to our existing stockholders and could cause our stock price to decline.
Concentration of ownership of our common stock among our existing executive officers, directors and principal stockholders may prevent new investors from influencing significant corporate decisions.
Our executive officers, directors and principal stockholders and their respective affiliates beneficially owned, in the aggregate, a significant percentage of our outstanding common stock as of December 31, 2017. These persons, acting together, are able to significantly influence all matters requiring stockholder approval, including the election and removal of directors and any merger or other significant corporate transactions. The interests of this group of stockholders may not coincide with our interests or the interests of other stockholders.
If securities or industry analysts do not publish, or cease publishing, research or reports about us, our business or our market, if they publish negative evaluations of our stock, or if we fail to meet the expectations of analysts, the price of our stock and trading volume could decline.
The trading market for our common stock will be influenced by the research and reports that industry or securities analysts may publish about us, our business, our market or our competitors. We do not have any control over these analysts, and their reports or analyst consensus may not reflect our guidance, plans or expectations. If one or more of the analysts covering our business issues an adverse opinion of our company because we fail to meet their expectations or otherwise, the price of our stock could decline. If one or more of these analysts cease to cover our stock, we could lose visibility in the market for our stock, which in turn could cause our stock price to decline.
Anti-takeover provisions in our certificate of incorporation and bylaws as well as provisions of Delaware law might discourage, delay or prevent a change in control of our company or changes in our board of directors or management and, therefore, depress the price of our common stock.
28
Our certificate of incorporation and bylaws and Delaware law contain provisions that may discourage, delay or prevent a merger, acquisition or other change in control that stockholders may consider favorable, including transactions in which you might otherwise receive a premium for your shares of our common stock or transactions that our stockholders might otherwise deem to be in their best interests. These provisions may also prevent or frustrate attempts by our stockholders to replace or remove members of our board of directors or our management. Therefore, these provisions could adversely affect the price of our stock. Our corporate governance documents include provisions:
· establishing a classified board of directors with staggered three-year terms so that not all members of our board of directors are elected at one time;
· providing that directors may be removed by stockholders only for cause;
· preventing the ability of our stockholders to call and bring business before special meetings and to take action by written consent in lieu of a meeting;
· requiring advance notice of stockholder proposals for business to be conducted at meetings of our stockholders and for nominations of candidates for election to our board of directors;
· permitting the board of directors to issue up to 10,000,000 shares of preferred stock with any rights, preferences and privileges as they may designate;
· limiting the liability of, and providing indemnification to, our directors and officers;
· providing that vacancies may be filled by remaining directors;
· preventing cumulative voting; and
· providing for a supermajority requirement to amend our bylaws.
As a Delaware corporation, we are also subject to provisions of Delaware law, including Section 203 of the General Corporation Law of the State of Delaware, which prohibits a Delaware corporation from engaging in a broad range of business combinations with any “interested” stockholder for a period of three years following the date on which the stockholder became an “interested” stockholder. Any provision of our certificate of incorporation or bylaws or Delaware law that has the effect of delaying or deterring a change in control could limit the opportunity for our stockholders to receive a premium for their shares of our common stock and could also affect the price that some investors are willing to pay for our common stock.
ITEM 1B. UNRESOLVED STAFF COMMENTS
None.
ITEM 2. PROPERTIES
In October 2017, we entered into a sublease for our new corporate headquarters at 222 Broadway, New York, New York for approximately 26,664 square feet of office space. The initial 10 year term of the lease commenced January 16, 2018 and we intend to relocate to this new office in the second quarter of 2018.
We are seeking a subtenant with respect to our current headquarters at 1501 Broadway, New York, New York. Our lease for this space commenced in January 2015 and has a term of 10 years.
We also lease offices in Mountain View, California; San Francisco, California; Santa Monica, California; Melbourne, Australia; Sydney, Australia; London, England; Kuala Lumpur, Malaysia; São Paulo, Brazil; and Auckland, New Zealand. In addition, we utilize a third-party data center hosting facility located in New York, New York. We believe our facilities are adequate for our current and near-term needs.
ITEM 3. LEGAL PROCEEDINGS
29
From time to time we may be involved in legal proceedings or subject to claims arising in the ordinary course of our business. We do not believe we are a party to any legal proceedings that, if determined adversely to us, would individually or taken together have a material adverse effect on our business, operating results, financial condition or cash flows. Regardless of the outcome, litigation can have an adverse impact on us because of defense and settlement costs, diversion of management resources and other factors.
ITEM 4. MINE SAFETY DISCLOSURES
Not applicable.
30
Part II
ITEM 5. MARKET FOR REGISTRANT’S COMMON EQUITY, RELATED STOCKHOLDER MATTERS AND ISSUER PURCHASES OF EQUITY SECURITIES
Market Information
Our common stock has been listed on the NYSE under the symbol "TLRA" since September 27, 2017 and was initially under the symbol “TRMR” from June 27, 2013 (the date of our initial listing) through September 27, 2017. Prior to June 27, 2013 there was no public market for our stock.
The following table sets forth for the indicated periods the intraday high and low sales prices per share for our common stock on the NYSE.
2017 | |||||||||||||||
First Quarter | Second Quarter | Third Quarter | Fourth Quarter | ||||||||||||
High | $ | 2.52 | $ | 2.57 | $ | 4.36 | $ | 5.00 | |||||||
Low | 1.90 | 2.00 | 2.05 | 3.57 | |||||||||||
2016 | |||||||||||||||
First Quarter | Second Quarter | Third Quarter | Fourth Quarter | ||||||||||||
High | $ | 2.04 | $ | 2.13 | $ | 2.10 | $ | 2.76 | |||||||
Low | 1.29 | 1.63 | 1.45 | 1.59 | |||||||||||
Holders of Record
As of February 26, 2018, there were approximately 59 holders of record of our common stock. Because many of our shares of common stock are held by brokers and other institutions on behalf of stockholders, we are unable to estimate the total number of stockholders represented by these record holders.
Stock Price Performance Graph
This performance graph shall not be deemed “filed” for purposes of Section 18 of the Securities Exchange Act of 1934, as amended, or the Exchange Act, or incorporated by reference into any filing of Telaria, Inc. under the Securities Act of 1933, as amended, or the Exchange Act, except as shall be expressly set forth by specific reference in such filing.
The following graph compares, for the period from June 26, 2013 through December 31, 2017, the cumulative total return on our common stock, the NYSE Composite Index and the Powershares S&P SmallCap Information Technology Portfolio Index. The graph assumes $100 was invested on June 26, 2013, in the common stock of Telaria, Inc., the NYSE Composite Index and the Powershares S&P SmallCap Information Technology Portfolio Index, and assumes the reinvestment of any dividends. The stock price performance on the following graph is not necessarily indicative of future stock price performance.
The comparisons shown in the graph below are based upon historical data. We caution that the stock price performance shown in the graph below is not necessarily indicative of, nor is it intended to forecast, the potential future performance of our common stock.
31
Relative Price Performance
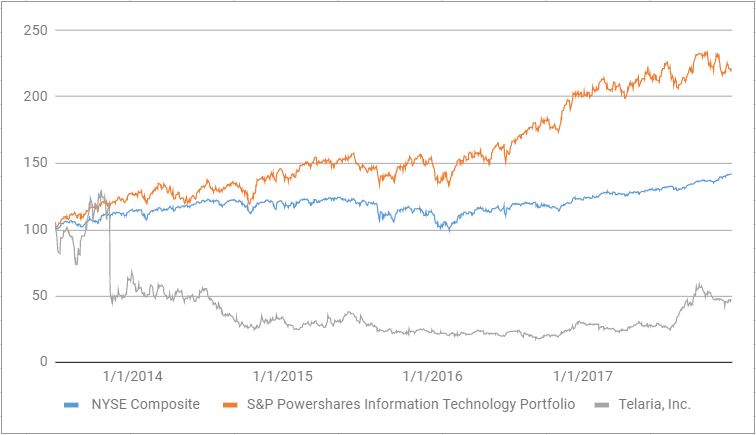
Dividend Policy
We have never declared or paid any dividends on our common stock or any other securities. We anticipate that we will retain all of our future earnings, if any, for use in the operation and expansion of our business and do not anticipate paying cash dividends in the foreseeable future. Additionally, our ability to pay dividends on our common stock is limited by restrictions under the terms of the agreements governing our credit facility. Payment of future cash dividends, if any, will be at the discretion of the board of directors after taking into account various factors, including our financial condition, operating results, current and anticipated cash needs, the requirements of current or then-existing debt instruments and other factors the board of directors deems relevant.
Purchases of Equity Securities by the Issuer
On March 29, 2016, we announced that our board of directors had approved a share repurchase program, under which the we were authorized to purchase up to $15.0 million of common stock over an 18-month period commencing March 25, 2016. The share repurchase program expired on September 30, 2017. For accounting purposes, common stock repurchased under our stock repurchase program is recorded based upon the purchase date of the applicable trade. Such repurchased shares are held in treasury and are presented using the cost method.
During the years ended December 31, 2017 and 2016, we repurchased 983,864 and 2,861,632 shares of our common stock, respectively, in open market purchases under our share repurchase program for a total of approximately $2.4 million and $6.0 million (at an average of $2.45 and $2.11 per share), respectively.
Recent Sales of Unregistered Securities
On June 30, 2017, Venture Lending & Leasing IV, LLC net exercised, in full, warrants to acquire 31,130 shares of common stock at an exercise price of $2.46 per share and we issued 406 shares of common stock to Venture Lending & Leasing IV, LLC. The offer, sale and issuance of such securities were deemed to be exempt from registration under the Securities Act in reliance on Regulation D promulgated thereunder.
On September 8, 2015, we granted John Rego, our Chief Financial Officer, options to purchase 570,000 shares of our common stock at an exercise price of $1.94 per share, the closing price of our common stock on the date of grant. On October 20, 2015, we granted John Walsh, our former Chief Technology Officer, options to purchase 350,000 shares of our
32
common stock at an exercise price of $1.90 per share, the closing price of our common stock on the date of grant. On September 26, 2016, we granted Jennifer Catto, our Chief Marketing Officer, options to purchase 125,000 shares of our common stock at an exercise price of $1.58 per share, the closing price of our common stock on the date of grant. On July 10, 2017, we granted Mark Zagorski, our Chief Executive Officer, options to purchase 900,000 shares of our common stock at an exercise price of $2.36 per share, the closing price of our common stock on the date of grant and 186,400 restricted stock units. These option grants were made as employment inducement awards, outside of our stockholder approved equity compensation plans in reliance on Section 303A.08 of the NYSE Listed Company Manual. The grants are generally subject to the same terms and conditions as grants under our 2013 Equity Incentive Plan, or 2013 Plan. A description of our 2013 Plan is set forth in Note 15 - Stock-Based Compensation in the notes to the consolidated financial statements included in Part II, Item 8 of this Annual Report. The offers, sales and issuances of the securities described in this paragraph were exempt from registration under Regulation D promulgated under the Securities Act.
Securities Authorized for Issuance under Equity Compensation Plans
Information about securities authorized for issuance under equity compensation plans is set forth in Part III, Item 12. “Security Ownership of Certain Beneficial Owners and Management and Related Stockholder Matters-Equity Compensation Plan Information.”
33
ITEM 6. SELECTED CONSOLIDATED FINANCIAL DATA
The following tables set forth our selected consolidated financial data. The following selected consolidated financial data for the years ended December 31, 2017, 2016, and 2015 and the selected consolidated balance sheet data as of December 31, 2017 and 2016 are derived from our audited consolidated financial statements that are included in Part II, Item 8 of this Annual Report, which have been audited by Ernst & Young LLP, our independent registered public accounting firm. The selected consolidated financial data for the years ended December 31, 2014 and 2013 and the selected consolidated balance sheet data as of December 31, 2015, 2014 and 2013 are derived from audited consolidated financial statements that are not included in this Annual Report. Our historical results are not necessarily indicative of the results to be expected in the future.
The following data should be read together with the information set forth in Item II, Part 7, “Management’s Discussion and Analysis of Financial Condition and Results of Operations” and in conjunction with the consolidated financial statements, related notes, and other financial information included elsewhere in this Annual Report.
34
Years Ended December 31, | |||||||||||||||||||
2017(1) | 2016(1) | 2015(1) | 2014(1) | 2013(1) | |||||||||||||||
(dollars in thousands, except per share data) | |||||||||||||||||||
Revenue | $ | 43,799 | $ | 29,121 | $ | 9,611 | $ | — | $ | — | |||||||||
Cost of revenue | 3,448 | 2,211 | 945 | — | — | ||||||||||||||
Gross profit | 40,351 | 26,910 | 8,666 | — | — | ||||||||||||||
Operating expenses: | |||||||||||||||||||
Technology and development(2) | 8,586 | 6,961 | 4,762 | 3,281 | 707 | ||||||||||||||
Sales and marketing(2) | 28,073 | 22,297 | 13,841 | 5,324 | 2,811 | ||||||||||||||
General and administrative(2) | 20,197 | 16,069 | 16,883 | 14,472 | 10,804 | ||||||||||||||
Depreciation and amortization | 4,586 | 3,754 | 2,176 | 839 | 703 | ||||||||||||||
Mark-to-market | 148 | 1,263 | — | — | — | ||||||||||||||
Total operating expenses | 61,590 | 50,344 | 37,662 | 23,916 | 15,025 | ||||||||||||||
Loss from continuing operations | (21,239 | ) | (23,434 | ) | (28,996 | ) | (23,916 | ) | (15,025 | ) | |||||||||
Interest and other income (expense): | |||||||||||||||||||
Interest expense, net | (268 | ) | (129 | ) | (10 | ) | (4) | (127) | |||||||||||
Other income (expense), net | 1,460 | (123 | ) | 30 | 46 | 339 | |||||||||||||
Total interest and other income (expense), net | 1,192 | (252 | ) | 20 | 42 | 212 | |||||||||||||
Loss from continuing operations before income taxes | (20,047 | ) | (23,686 | ) | (28,976 | ) | (23,874 | ) | (14,813 | ) | |||||||||
Provision for income taxes | (347 | ) | 164 | 200 | 1 | 206 | |||||||||||||
Loss from continuing operations, net of income taxes | (19,700 | ) | (23,850 | ) | (29,176 | ) | (23,875 | ) | (15,019 | ) | |||||||||
Gain on sale of discontinued operations, net of income taxes | 14,626 | — | — | — | — | ||||||||||||||
Income (loss) from discontinued operations, net of income taxes(3) | 7,301 | 2,903 | (14,054 | ) | 386 | 1,503 | |||||||||||||
Total income (loss) from discontinued operations, net of income taxes | 21,927 | 2,903 | (14,054 | ) | 386 | 1,503 | |||||||||||||
Net income (loss) | 2,227 | (20,947 | ) | (43,230 | ) | (23,489 | ) | (13,516 | ) | ||||||||||
Series F preferred stock deemed dividend | — | — | — | — | 15,849 | ||||||||||||||
Net loss attributable to common shareholders | $ | 2,227 | $ | (20,947 | ) | $ | (43,230 | ) | $ | (23,489 | ) | $ | (29,365 | ) | |||||
Net earnings (loss) per share - basic and diluted(4)(5) | |||||||||||||||||||
Loss from continuing operations, net of income taxes | $ | (0.39 | ) | $ | (0.46 | ) | $ | (0.57 | ) | $ | (0.47 | ) | $ | (0.52 | ) | ||||
Discontinued operations, net of income taxes | 0.43 | 0.06 | (0.27 | ) | 0.01 | 0.05 | |||||||||||||
Series F preferred stock deemed dividend | — | — | — | — | (0.55 | ) | |||||||||||||
Net income (loss) | $ | 0.04 | $ | (0.40 | ) | $ | (0.84 | ) | $ | (0.46 | ) | $ | (1.02 | ) | |||||
Basic and diluted weighted-average number of shares outstanding(5) | 50,511,366 | 52,279,738 | 51,684,397 | 50,637,541 | 28,761,700 | ||||||||||||||
Other Financial Data (unaudited): | |||||||||||||||||||
Adjusted EBITDA(6) | $ | (6,517 | ) | $ | (11,829 | ) | $ | (22,565 | ) | $ | (20,043 | ) | $ | (12,140 | ) | ||||
35
As of December 31, | |||||||||||||||||||
2017 | 2016 | 2015 | 2014 | 2013 | |||||||||||||||
(dollars in thousands) | |||||||||||||||||||
Cash, cash equivalents and short-term investments | $ | 76,320 | $ | 43,160 | $ | 59,887 | $ | 77,787 | $ | 92,691 | |||||||||
Working capital | 77,153 | 56,168 | 74,148 | 89,024 | 103,464 | ||||||||||||||
Total assets | 150,428 | 154,225 | 168,124 | 178,005 | 190,560 | ||||||||||||||
Total liabilities | 67,289 | 75,703 | 66,692 | 38,232 | 33,528 | ||||||||||||||
Total stockholders’ equity | $ | 83,139 | $ | 78,522 | $ | 101,432 | $ | 139,773 | $ | 157,032 | |||||||||
(1) | Financial statements have been adjusted to reflect the sale of our buy side business, which was sold on August 7, 2017 as discontinued operations. |
(2) | Includes stock-based compensation expense as follows: |
Years Ended December 31, | |||||||||||||||||||
2017 | 2016 | 2015 | 2014 | 2013 | |||||||||||||||
(dollars in thousands) | |||||||||||||||||||
Technology and development | 615 | 459 | 301 | 113 | 262 | ||||||||||||||
Sales and marketing | 2,062 | 476 | 472 | 538 | 201 | ||||||||||||||
General and administrative | 2,044 | 1,551 | 1,683 | 2,189 | 1,637 | ||||||||||||||
Total stock-based compensation expense | $ | 4,721 | $ | 2,486 | $ | 2,456 | $ | 2,840 | $ | 2,100 | |||||||||
(3) | Includes impairment charges incurred during the year ended December 31, 2015 of (i) $20.9 million related to goodwill, (ii) $1.2 million related to certain intangible assets, and (iii) $0.6 million related to certain property and equipment. |
(4) | For the year ended December 31, 2013, basic and diluted net loss per share attributable to common stockholders includes $15.8 million deemed dividend from the conversion of our Series F preferred stock on July 2, 2013. |
(5) | As a result of our operating losses incurred for the years ended December 31, 2017, 2016, 2015, 2014 and 2013, all potentially dilutive securities are anti-dilutive and, accordingly, basic and diluted weighted-average number of shares of common stock outstanding is equal for the years presented. |
(6) | Adjusted EBITDA represents our loss from continuing operations, net of income taxes, before depreciation and amortization expense, total interest and other expense (income), net, provision for income taxes, and as adjusted to eliminate the impact of non-cash stock-based compensation expense, acquisition-related expenses, mark-to-market expense, executive severance, retention and recruiting costs, disposition-related costs, expenses for transitional services, litigation costs and other adjustments. Adjusted EBITDA is a key measure used by management to evaluate operating performance, generate future operating plans and make strategic decisions regarding the allocation of capital. In particular, the exclusion of certain expenses we do not consider to be indicative of our core operating performance in calculating adjusted EBITDA facilitates operating performance comparisons on a period-to-period basis. |
Adjusted EBITDA is a non-GAAP financial measure. Our use of adjusted EBITDA has limitations as an analytical tool, and you should not consider it in isolation or as a substitute for analysis of our financial results as reported under U.S. GAAP. Some of these limitations are: (a) although depreciation and amortization expense are non-cash charges, the assets being depreciated and amortized may have to be replaced in the future, and adjusted EBITDA does not reflect cash and capital expenditure requirements for such replacements or for new capital expenditure requirements; (b) Adjusted EBITDA does not reflect changes in, or cash requirements for, our working capital needs;(c) Adjusted EBITDA does not reflect tax payments that may represent a reduction in cash available to us; (d) Adjusted EBITDA does not reflect the potentially dilutive impact of equity-based compensation; (e) Adjusted EBITDA does not reflect acquisition-related costs; (f) Adjusted EBITDA does not reflect executive severance, retention and recruiting costs; (g) Adjusted EBITDA does not reflect disposition-related costs; (h) Adjusted EBITDA does not reflect expenses for transitional services; (i) Adjusted EBITDA does not reflect litigation costs associated with class action securities litigation; ) and other adjustments; and (i) other companies, including companies in our industry, may calculate adjusted EBITDA or similarly titled measures differently, which reduces its usefulness as a comparative measure. Because of these and other limitations, you should consider adjusted EBITDA alongside our other U.S. GAAP-based financial performance measures, net loss and our other U.S. GAAP financial results. The following table presents a reconciliation of adjusted EBITDA to loss from continuing operations, net of income taxes, the most directly comparable U.S. GAAP measure, for each of the periods indicated:
36
Years Ended December 31, | |||||||||||||||||||
2017 | 2016 | 2015 | 2014 | 2013 | |||||||||||||||
(dollars in thousands) | |||||||||||||||||||
Loss from continuing operations, net of income taxes | $ | (19,700 | ) | $ | (23,850 | ) | $ | (29,176 | ) | (23,875 | ) | (15,019 | ) | ||||||
Adjustments | |||||||||||||||||||
Depreciation and amortization expense | 4,586 | 3,754 | 2176 | 839 | 703 | ||||||||||||||
Total interest and other income (expense), net | (1,192 | ) | 252 | (20 | ) | (42 | ) | (212 | ) | ||||||||||
(Benefit) provision for income taxes | (347 | ) | 164 | 200 | 1 | 206 | |||||||||||||
Stock-based compensation expense | 4,721 | 2,486 | 2456 | 2,840 | 2,100 | ||||||||||||||
Acquisition-related expenses(a) | 1,810 | 3,583 | 892 | — | — | ||||||||||||||
Mark-to market expense(b) | 148 | 1,263 | — | — | — | ||||||||||||||
Executive severance, retention and recruiting costs | 1,421 | 59 | 579 | — | — | ||||||||||||||
Disposition related costs(c) | 1,029 | — | — | — | — | ||||||||||||||
Expenses for transitional services(d) | 905 | — | — | — | — | ||||||||||||||
Litigation costs | — | 194 | 328 | 279 | 82 | ||||||||||||||
Other adjustments(e) | 102 | 266 | — | — | — | ||||||||||||||
Total net adjustments | 13,183 | 12,021 | 6,611 | 3,917 | 2,879 | ||||||||||||||
Adjusted EBITDA | $ | (6,517 | ) | $ | (11,829 | ) | $ | (22,565 | ) | $ | (19,958 | ) | $ | (12,140 | ) | ||||
(a) | Reflects acquisition-related costs incurred in connection with our acquisition of The Video Network Pty, Ltd, an Australian proprietary limited company ("TVN"). Includes compensation-related expenses related to contingent consideration payments that were paid to certain TVN sellers that were subject to continued employment. Refer to Note 4 - Fair Value Measurements and Note 7 - Acquisition, in the notes to the consolidated financial statements included in Part II, Item 8 of this Form 10-K. |
(b) | Reflects expense incurred based on the re-measurement of the estimated fair value of earn-out payments that were paid in connection with the acquisition of TVN and which were not conditioned on continued employment. Refer to Note 4 - Fair Value Measurements and Note 7 - Acquisition in the notes to the consolidated financial statements included in Part II, Item 8 of this Form 10-K.and 7 in notes to consolidated financial statements. |
(c) | Professional fees incurred in connection with the sale of the buyer platform in August 2017. Refer to Note 3 - Disposition of Buyer Platform in the notes to the consolidated financial statements included in Part II, Item 8 of this Form 10-K |
(d) | Reflects costs incurred providing transitional services to acquirer following the sale of our buyer platform. |
(e) | Reflects amounts accrued in connection with a one-time change in our employee vacation policy. |
ITEM 7. MANAGEMENT’S DISCUSSION AND ANALYSIS OF FINANCIAL CONDITION AND RESULTS OF OPERATIONS
You should read the following discussion of our financial condition and results of operations in conjunction with the information set forth in Part II, Item 6. “Selected Consolidated Financial Data” and the consolidated financial statements and the related notes included elsewhere in this Annual Report. The following discussion contains forward-looking statements that reflect our plans, estimates and beliefs. Our actual results could differ materially from those discussed in the forward-looking statements. Factors that could cause or contribute to these differences include those discussed below and elsewhere in this Annual Report, particularly in “Special Note Regarding Forward-Looking Statements” and “Risk Factors.”
Telaria, Inc. (formerly Tremor Video, Inc.) is a software company providing a fully programmatic, self-service, seller platform to monetize and manage premium video content across all internet-connected screens and devices.
37
We automate the sales process for publishers of premium video content by allowing them to efficiently identify, package and deliver their advertising inventory to advertisers, agencies and other buyers, while protecting the integrity of their brand and the consumer viewing experience. Our seller platform connects publishers to buyers via direct integrations with leading third-party demand-side platforms, or DSPs. This allows publishers to efficiently monetize their advertising inventory however they want to transact, whether through open auctions or private marketplaces. Private marketplaces can be transacted through invite only auctions, where select buyers are given the opportunity to bid on a curated set of inventory, or through direct connections that allow publishers to programmatically transact with a specific buyer. Integrations with DSPs are done through server-to-server connections and, as a result, we are able to significantly reduce latency and response time for our clients’ ad campaigns.
Our technology provides publishers with the real-time control and insights they require to optimize and automate their video advertising sales and manage their inventory across sales channels, devices and platforms. Our seller platform was built specifically for digital video and to support the unique requirements of mobile, over-the-top, or OTT, and connected TV, or CTV, platforms. We enable publishers to exercise complete control over their monetization strategy by defining supply hierarchies and demand tiers, minimum price floors, and advertiser and category-level black and white lists to manage potential sales channel conflicts. We offer publishers a full suite of tools to ensure the integrity of their brand and the consumer viewing experience, including the ability to review and block specific ad creative units, manage ad frequency, and control for factors such as the volume of an ad. Our seller platform provides publishers with up-to-the-second reporting, which allows them to effectively monitor buying patterns and make real-time changes to take advantage of market dynamics and extensive analytics that leverage billions of historical data points to drive long term monetization strategy. We also offer innovative diagnostic capabilities and transparency to our publishers so that they have a complete picture of how their inventory is represented in the marketplace. This allows publishers to immediately identify and act to resolve any issues impacting revenue generation. In addition, DSPs that connect through our seller platform have access to real-time bidding data, insights and analytics enabling them to more effectively manage buying.
We have built long-standing relationships with premium video publishers, and we believe the scale and quality of our client base makes us an important partner to video ad buyers. We provide our platform to publishers outside the United States through our international operations in Europe, Latin America, and the Asia Pacific regions. Buyers on our seller platform include some of the largest brand advertisers in the world and our platform is integrated with the leading video volume buyers in digital advertising.
We generate revenue each time a transaction occurs on our platform based on a simple and transparent fee structure established with our publisher partners. We do not purchase and re-sell inventory from publishers and do not collect any fees directly from buyers. We act as an agent on behalf of publishers and revenue is recognized, net of any inventory costs that we remit to publishers, when a buyer purchases inventory from a publisher on our platform.
Historically, we operated a buyer platform business in addition to offering our seller platform. The buyer platform enabled advertisers, agencies and other buyers of advertising to discover, buy, optimize and measure the effectiveness of their video ad campaigns across digital screens, and included our “Tremor Video DSP” programmatic buying solution. We recently made the strategic decision to focus our business exclusively on offering our seller platform, and on August 7, 2017, we announced that we had completed the sale of the assets and liabilities primarily related to our buyer platform to an affiliate of Taptica International Ltd. or Taptica, for total consideration of $50 million, subject to adjustment for working capital. As a result of the sale, we no longer provide a buyer platform solution. Accordingly, the results of operations for the buyer platform are reflected as discontinued operations in our financial statements for all periods presented herein.
On September 27, 2017, we changed our name from “Tremor Video, Inc.” to “Telaria, Inc.” In connection with the name change, our NYSE ticker symbol was changed to “TLRA” and our corporate website address was changed to www.telaria.com.
For the year ended December 31, 2017, our revenue from continuing operations increased to $43.8 million, compared to $29.1 million for the year ended December 31, 2016, an increase of 50.4%. Over the same period, our gross margin remained relatively flat at approximately 92.1% and 92.4% for the year ended December 31, 2017 and December 31, 2016, respectively. Our loss from continuing operations, net of income taxes decreased from a loss of $23.9 million for the year ended December 31, 2016 to a loss of $19.7 million for the year ended December 31, 2017, and our Adjusted EBITDA (refer to “Key Metrics-Adjusted EBITDA”) increased from a loss of $11.8 million to a loss of $6.5 million for the same respective periods. Our results exclude the impact of our buyer platform, which is recorded in discontinued operations.
Key Metrics
We monitor the key metrics set forth in the table below to help us evaluate growth trends, establish budgets, measure the effectiveness of our sales and marketing efforts and assess our operational efficiencies. Revenue, gross margin and net loss are
38
discussed under the headings “Components of our Results of Operations.” Adjusted EBITDA is discussed immediately following the table below.
Years Ended December 31, | |||||||||||
2017 | 2016 | 2015 | |||||||||
(dollars in thousands) | |||||||||||
Revenue | $ | 43,799 | $ | 29,121 | $ | 9,611 | |||||
Gross margin | 92.1 | % | 92.4 | % | 90.2 | % | |||||
Net loss from continuing operations | (19,700 | ) | (23,850 | ) | (29,176 | ) | |||||
Adjusted EBITDA | $ | (6,517 | ) | $ | (11,829 | ) | $ | (22,565 | ) | ||
Adjusted EBITDA
Adjusted EBITDA represents our loss from continuing operations, net of income taxes, before depreciation and amortization expense, total interest and other income (expense), net and (Benefit) provision for income taxes, and as adjusted to eliminate the impact of non-cash stock-based compensation expense, acquisition-related expenses, mark-to-market expense, executive severance, retention and recruiting costs, disposition-related costs, expenses for transitional services, litigation costs and other adjustments. Adjusted EBITDA is a key measure used by management to evaluate operating performance, generate future operating plans and make strategic decisions regarding the allocation of capital. In particular, the exclusion of certain expenses we do not consider to be indicative of our core operating performance in calculating adjusted EBITDA facilitates operating performance comparisons on a period-to-period basis.
Adjusted EBITDA is not a measure calculated in accordance with U.S. GAAP. See footnote 8 to the table in Part II, Item 6. “Selected Consolidated Financial Data” in this Annual Report for a discussion of the limitations of adjusted EBITDA and a reconciliation of adjusted EBITDA to loss from continuing operations, net of income taxes, the most comparable U.S. GAAP measurement, for the years ended December 31, 2017, 2016 and 2015.
Components of Operating Results
We operate in one segment, online video advertising services. The key elements of our operating results include:
Revenue
We generate revenue each time a transaction occurs on our seller platform based on a simple and transparent fee structure established with our publisher partners. We do not purchase and re-sell inventory from publishers and do not collect any fees directly from buyers. We act as an agent on behalf of publishers and revenue is recognized, net of any inventory costs that we remit to publishers, when a buyer purchases inventory from a publisher on our platform.
Our revenue recognition policies are discussed in more detail in the section below titled “—Critical Accounting Policies and Estimates.”
Cost of Revenue, Gross Profit and Gross Margin
Our cost of revenue primarily consists of third party hosting fees and licensing fees for third party data. Costs owed to publishers but not yet paid are recorded in our consolidated balance sheets and included as part of accounts payable and accrued expenses.
Gross margin is our gross profit expressed as a percentage of our total revenue. Because we book campaigns from our seller platform net of inventory costs, our seller platform has historically generated gross margins in excess of 90%.
Operating Expenses
Operating expenses consist of technology and development, sales and marketing, general and administrative, depreciation and amortization and mark-to-market expenses. Salaries, incentive compensation, stock-based compensation and other personnel-related costs are the most significant components of each of technology and development, sales and marketing and general and administrative expenses. We include stock-based compensation expense in connection with the grant of stock option awards or restricted stock unit awards in the applicable operating expense category based on the respective equity award recipient’s function. Our employee head count increased from 129 employees at December 31, 2016, to 136 at December 31, 2017. We expect our operating expenses to continue to increase in future periods, to support our continued growth.
39
Technology and Development Expense. Technology and development expense primarily consists of salaries, incentive compensation, stock-based compensation and other personnel-related costs for product development and engineering personnel. Additional expenses in this category include other related overhead. Due to the rapid development and changes in our business, we have expensed all technology and development expenses in the same period that the costs were incurred. The number of employees in technology and development functions increased from 17 employees at December 31, 2016 to 20 employees at December 31,2017. We intend to continue to invest in our technology and development efforts, by strategically hiring additional personnel. We believe continuing to invest in technology and development efforts is essential to maintaining our competitive position.
Sales and Marketing Expense. Sales and marketing expense primarily consists of salaries, incentive compensation, stock-based compensation and other personnel-related costs for our marketing and sales and sales support employees. Additional expenses in this category include marketing programs, travel and other related overhead. The number of employees in sales and marketing functions increased from 83 employees at December 31, 2016 compared to 89 employees at December 31, 2017. We expect our sales and marketing expense to increase in the foreseeable future to support our continued revenue growth.
General and Administrative Expense. General and administrative expense primarily consists of salaries, incentive compensation, stock-based compensation and other personnel-related costs for business operations, administration, finance and accounting, legal, information systems and human resources employees. Included in general and administrative expenses are consulting and professional fees, including legal, accounting and investor relations fees, insurance, and costs associated with becoming compliant with the Sarbanes-Oxley Act and other public company corporate expenses, costs associated with the recent transaction, travel and other related overhead. The number of employees in general and administrative functions declined from 29 employees at December 31, 2016 to 27 employees at December 31, 2017. We expect our general and administrative expenses to increase in absolute dollars in future periods, including as a result of incurring additional expenses becoming compliant with the Sarbanes-Oxley Act.
Depreciation and Amortization Expense. Depreciation and amortization expense primarily consists of our depreciation expense related to investments in property, equipment and software as well as the amortization of certain intangible assets.
Mark-to-market. Mark-to-market expense consists primarily of expense related to contingent consideration incurred in connection with our acquisition of The Video Network Pty Ltd, or TVN, in August 2015. (refer to notes 4 and 7 in notes to consolidated financial statements).
Interest and Other Income (Expense), Net
Interest and other income (expense), net consist primarily of interest income, interest expense, and foreign exchange transaction gains and losses. Interest income is derived from interest received on our cash and cash equivalents. Interest expense is primarily attributable to interest paid on capital leases and taxes and fees to local jurisdictions. As of December 31, 2017, and 2016, we did not have any outstanding borrowings under our credit facility.
Provision for Income Taxes
Provision for income taxes consists of minimum U.S. federal, state and local taxes, income taxes in foreign jurisdictions in which we conduct business and deferred income taxes.
40
Results of Operations
The following table is a summary of our consolidated statement of operations data for each of the periods indicated. The period-to-period comparisons of the results are not necessarily indicative of our results for future periods.
Years Ended December 31, | ||||||||||||||||||||
2017 | 2016 | 2015 | ||||||||||||||||||
Amount | Percentage of Revenue | Amount | Percentage of Revenue | Amount | Percentage of Revenue | |||||||||||||||
(dollars in thousands) | ||||||||||||||||||||
Revenue | 43,799 | 100.0 | % | 29,121 | 100.0 | % | 9,611 | 100.0 | % | |||||||||||
Cost of revenue | 3,448 | 7.9 | % | 2,211 | 7.6 | % | 945 | 9.8 | % | |||||||||||
Gross profit | 40,351 | 92.1 | % | 26,910 | 92.4 | % | 8,666 | 90.2 | % | |||||||||||
Operating expenses: | ||||||||||||||||||||
Technology and development | 8,586 | 19.6 | % | 6,961 | 23.9 | % | 4,762 | 49.5 | % | |||||||||||
Sales and marketing | 28,073 | 64.1 | % | 22,297 | 76.6 | % | 13,841 | 144.0 | % | |||||||||||
General and administrative | 20,197 | 46.1 | % | 16,069 | 55.2 | % | 16,883 | 175.7 | % | |||||||||||
Depreciation and amortization | 4,586 | 10.5 | % | 3,754 | 12.9 | % | 2,176 | 22.6 | % | |||||||||||
Mark-to-market | 148 | 0.3 | % | 1,263 | 4.3 | % | — | — | % | |||||||||||
Total operating expenses | 61,590 | 140.6 | % | 50,344 | 172.9 | % | 37,662 | 391.9 | % | |||||||||||
Loss from continuing operations | (21,239 | ) | (48.5 | )% | (23,434 | ) | (80.5 | )% | (28,996 | ) | (301.7 | )% | ||||||||
Total interest and other income (expense), net | 1,192 | 2.7 | % | (252 | ) | (0.9 | )% | 20 | 0.2 | % | ||||||||||
Loss from continuing operations before income taxes | (20,047 | ) | (45.8 | )% | (23,686 | ) | (81.3 | )% | (28,976 | ) | (301.5 | )% | ||||||||
(Benefit) provision for income taxes | (347 | ) | (0.8 | )% | 164 | 0.6 | % | 200 | 2.1 | % | ||||||||||
Loss from continuing operations, net of income taxes | $ | (19,700 | ) | (45.0 | )% | $ | (23,850 | ) | (81.9 | )% | $ | (29,176 | ) | (303.6 | )% | |||||
Total income (loss) from discontinued operations, net of income taxes | 21,927 | 50.1 | % | 2,903 | 10.0 | % | (14,054 | ) | (146.2 | )% | ||||||||||
Net income (loss) | $ | 2,227 | 5.5 | % | $ | (20,947 | ) | (71.9 | )% | $ | (43,230 | ) | (449.8 | )% | ||||||
Comparison of Years Ended December 31, 2017 and 2016
Years Ended December 31, | Change Increase / (Decrease) | |||||||||||
2017 | 2016 | Amount | Percentage | |||||||||
(dollars in thousands) | ||||||||||||
Revenue | 43,799 | 29,121 | $ | 14,678 | 50.4 | % | ||||||
Revenue. Our revenue during the year ended December 31, 2017 increased to $43.8 million from $29.1 million in the prior year period, representing a 50.4% increase year-over-year. Our revenue is generally a function of the number of ads purchased and sold on our platform and the fee collected on each transaction. The year-over-year increase in our revenue was primarily attributable to a significant increase in the number of ads purchased and sold through our platform, including as a result of spend transacted by our former buyer platform following its sale to Taptica in August 2017.
Years Ended December 31, | Change Increase / (Decrease) | |||||||||||
2017 | 2016 | Amount | Percentage | |||||||||
(dollars in thousands) | ||||||||||||
Cost of revenue | 3,448 | 2,211 | $ | 1,237 | 55.9 | % | ||||||
Gross profit | 40,351 | 26,910 | 13,441 | 49.9 | % | |||||||
Gross margin | 92.1 | % | 92.4 | % | ||||||||
41
Cost of Revenue, Gross Profit and Gross Margin. Our cost of revenue during the year ended December 31, 2017 increased to $3.4 million from $2.2 million in the prior year period. The increase in cost of revenue is attributable to an increase in hosting fees resulting from an increase in the total number of transactions being processed through our seller platform.
Our gross profit during the year ended December 31, 2017 increased to $40.4 million from $26.9 million in the prior year period, reflecting an increase in our revenue of $14.7 million year-over-year, which was partially offset by a $1.2 million increase in our cost of revenue year-over-year.
Our gross margin remained relatively flat at 92.1% for the year ended December 31, 2017 compared to 92.4% for the year ended December 31, 2016.
Years Ended December 31, | Change Increase / (Decrease) | |||||||||||
2017 | 2016 | Amount | Percentage | |||||||||
(dollars in thousands) | ||||||||||||
Technology and development expense | 8,586 | 6,961 | $ | 1,625 | 23.3 | % | ||||||
% of total revenue | 19.6 | % | 23.9 | % | ||||||||
Technology and Development. The increase in technology and development expense in 2017 compared to 2016 was primarily attributable to a $2.2 million increase in salaries, incentive compensation, stock-based compensation and other personnel-related costs, which were partially offset by a $0.5 million decrease in other overhead costs.
Years Ended December 31, | Change Increase / (Decrease) | |||||||||||
2017 | 2016 | Amount | Percentage | |||||||||
(dollars in thousands) | ||||||||||||
Sales and marketing expense | 28,073 | 22,297 | $ | 5,776 | 25.9 | % | ||||||
% of total revenue | 64.1 | % | 76.6 | % | ||||||||
Sales and Marketing. The increase in sales and marketing expense in 2017 compared to 2016 was primarily attributable to a $4.4 million increase in salaries, incentive compensation, stock-based compensation and other personnel-related costs, $1.6 million increase in marketing costs, professional development costs, software costs, and bad debt expense and a $0.2 million increase in other overhead related costs, which were partially offset by a $0.5 million decrease in consulting fees and travel and entertainment expenses.
Years Ended December 31, | Change Increase / (Decrease) | |||||||||||
2017 | 2016 | Amount | Percentage | |||||||||
(dollars in thousands) | ||||||||||||
General and administrative expense | 20,197 | 16,069 | $ | 4,128 | 25.7 | % | ||||||
% of total revenue | 46.1 | % | 55.2 | % | ||||||||
General and Administrative. The increase in general and administrative expense in 2017 compared to 2016 was primarily attributable to a $2.9 million increase in salaries, incentive compensation, stock-based compensation and other personnel-related costs, $1.0 million in costs related to the sale of our buyer platform in August of 2017, a $0.9 million increase in consulting fees and accounting fees and a $0.4 million increase in other taxes and overhead costs. These costs were partially offset by a $0.9 million decrease in professional development and recruitment costs and a $0.3 million decrease in legal fees.
Years Ended December 31, | Change Increase / (Decrease) | |||||||||||||
2017 | 2016 | Amount | Percentage | |||||||||||
(dollars in thousands) | ||||||||||||||
Depreciation and amortization expense | $ | 4,586 | $ | 3,754 | $ | 832 | 22.2 | % | ||||||
% of total revenue | 10.5 | % | 12.9 | % | ||||||||||
Depreciation and Amortization. The increase in depreciation and amortization expense in 2017 compared to 2016 was primarily attributable to accelerated depreciation on our current corporate office leasehold improvements due to our anticipated relocation of our corporate office during 2018.
42
Years Ended December 31, | Change Increase / (Decrease) | |||||||||||||
2017 | 2016 | Amount | Percentage | |||||||||||
(dollars in thousands) | ||||||||||||||
Mark-to-market expense | $ | 148 | $ | 1,263 | $ | (1,115 | ) | (88.3 | )% | |||||
% of total revenue | 0.3 | % | 4.3 | % | ||||||||||
Mark-to-market expense. The decrease in mark-to-market expense 2017 compared to 2016 was attributable to reduction in expense related to the Company’s re-measurement of the estimated fair value of contingent consideration that was due in connection with the acquisition of TVN (refer to notes 4 and 7 in the notes to consolidated financial statements).
Years Ended December 31, | Change Increase / (Decrease) | ||||||||||||
2017 | 2016 | Amount | Percentage | ||||||||||
(dollars in thousands) | |||||||||||||
Total interest and other income (expense), net | $ | 1,192 | $ | (252 | ) | $ | 1,444 | NM | |||||
% of total revenue | 2.7 | % | (0.9 | )% | |||||||||
Total Interest and Other Income (Expense), Net. The increase in total interest and other income (expense), net in 2017 compared to 2016 was primarily attributable to $1.0 million in transitional services income related to services provided to the acquirer following the sale of our buyer platform, a $0.5 million increase in sublease income net of sublease loss in 2016 and trademark license income of $0.4 million , which were partially offset by a $0.4 million loss on the disposition of assets.
Years Ended December 31, | Change Increase / (Decrease) | ||||||||||
2017 | 2016 | Amount | Percentage | ||||||||
(dollars in thousands) | |||||||||||
(Benefit) provision for income taxes | (347 | ) | 164 | $ | (511 | ) | NM | ||||
% of total revenue | (0.8 | )% | 0.6 | % | |||||||
(Benefit) Provision for Income Taxes. The decrease in provision for income taxes in 2017 compared to 2016 was primarily attributable to decreases in taxes incurred in foreign jurisdictions as well as U.S. tax benefit recorded for the federal AMT credit.
Income (Loss) from Discontinued Operations, Net of Income Taxes
In August 2017, we completed the sale of our buyer platform to Taptica. The consideration received was $50 million, subject to adjustment for working capital (refer to Note 3 in the consolidated financial statements). The results of our buyer platform have been recast as discontinued operations.
For the year ended December 31, 2017, income from discontinued operations consisted of operating income, net of income taxes, attributable to our buyer platform of $7.3 million as well as a gain on sale of $14.6 million, net of income taxes, related to the sale of our buyer platform. For the year ended December 31, 2016, income from discontinued operations consisted of operating income net of income taxes, attributable to our buyer platform of $2.9 million (refer to Note 3 in the consolidated financial statements).
Comparison of Years Ended December 31, 2016 and 2015
Years Ended December 31, | Change Increase / (Decrease) | |||||||||||
2016 | 2015 | Amount | Percentage | |||||||||
(dollars in thousands) | ||||||||||||
Revenue | 29,121 | 9,611 | $ | 19,510 | 203.0 | % | ||||||
Revenue. Our revenue during the year ended December 31, 2016, increased to $29.1 million from $9.6 million in the prior year period, representing a 203.0% increase year-over-year.
43
The year-over-year increase in our revenue, was primarily attributable to a significant increase in the number of ads purchased and sold through our platform.
Years Ended December 31, | Change Increase / (Decrease) | |||||||||||
2016 | 2015 | Amount | Percentage | |||||||||
(dollars in thousands) | ||||||||||||
Cost of revenue | 2,211 | 945 | $ | 1,266 | 134.0 | % | ||||||
Gross profit | 26,910 | 8,666 | 18,244 | 210.5 | % | |||||||
Gross margin | 92.4 | % | 90.2 | % | ||||||||
Cost of Revenue, Gross Profit and Gross Margin. Our cost of revenue during the year ended December 31, 2016 increased to $2.2 million from $0.9 million for the same period in 2015. The increase in cost of revenue is attributable to an increase in hosting fees associated with an increase in the total number of transactions being processed through our seller platform.
Our gross profit during the year ended December 31, 2016 increased to $26.9 million from $8.7 million in the prior year period, reflecting an increase in our revenue of $19.5 million which was partially offset by a $1.3 million increase in our cost of revenue year-over-year.
Our gross margin increased to 92.4% for the year ended December 31, 2016 compared to 90.2% for the year ended December 31, 2015.
Years Ended December 31, | Change Increase / (Decrease) | |||||||||||
2016 | 2015 | Amount | Percentage | |||||||||
(dollars in thousands) | ||||||||||||
Technology and development expense | 6,961 | 4,762 | $ | 2,199 | 46.2 | % | ||||||
% of total revenue | 23.9 | % | 49.5 | % | ||||||||
Technology and Development. The increase in technology and development expense in 2016 compared to 2015 was primarily attributable to a $1.5 million increase in salaries, incentive compensation, stock-based compensation and other personnel-related costs, a $0.4 million increase in rent and utilities, and a $0.3 million increase in software and internet costs.
Years Ended December 31, | Change Increase / (Decrease) | |||||||||||
2016 | 2015 | Amount | Percentage | |||||||||
(dollars in thousands) | ||||||||||||
Sales and marketing expense | 22,297 | 13,841 | $ | 8,456 | 61.1 | % | ||||||
% of total revenue | 76.6 | % | 144.0 | % | ||||||||
Sales and Marketing. The increase in sales and marketing expense in 2016 compared to 2015 was primarily attributable to a $6.6 million increase in salaries, severance costs, incentive compensation, stock-based compensation, and other personnel-related costs, a $0.5 million increase in software and internet access fees, a $0.4 million increase in travel and entertainment, a $0.4 million increase in consulting and professional development fees, a $0.3 million increase in trade shows and public relation events and $0.3 million increase in rent and utilities.
Years Ended December 31, | Change Increase / (Decrease) | |||||||||||
2016 | 2015 | Amount | Percentage | |||||||||
(dollars in thousands) | ||||||||||||
General and administrative expense | 16,069 | 16,883 | $ | (814 | ) | (4.8 | )% | |||||
% of total revenue | 55.2 | % | 175.7 | % | ||||||||
General and Administrative. The decrease in general and administrative expense in 2016 compared to 2015 was primarily attributable to a $1.0 million decrease in salaries, incentive compensation, stock-based compensation and other personnel-related costs a decrease of $0.5 million in legal and consulting costs and a decrease of $0.1 million in overhead related costs, which were partially offset by a $0.4 million increase in accounting fees and $0.3 million increase in recruitment and professional development costs.
44
Years Ended December 31, | Change Increase / (Decrease) | |||||||||||
2016 | 2015 | Amount | Percentage | |||||||||
(dollars in thousands) | ||||||||||||
Depreciation and amortization expense | 3,754 | 2,176 | $ | 1,578 | 72.5 | % | ||||||
% of total revenue | 12.9 | % | 22.6 | % | ||||||||
Depreciation and Amortization. The increase in depreciation and amortization expense in 2016 compared to 2015 was primarily attributable to increases in depreciation related to additional leasehold improvements related to new office spaces.
Years Ended December 31, | Change Increase / (Decrease) | ||||||||||
2016 | 2015 | Amount | Percentage | ||||||||
(dollars in thousands) | |||||||||||
Total interest and other income (expense), net | (252 | ) | 20 | $ | (272 | ) | NM | ||||
% of total revenue | (0.9 | )% | 0.2 | % | |||||||
Total Interest and Other Income (Expense), Net. The decrease in total interest and other income (expense), net in 2016 compared to 2015 was primarily attributable to a $0.3 loss on the sublease of office space, partially offset by an increase in other expense related to subletting of our former headquarters.
Years Ended December 31, | Change Increase / (Decrease) | |||||||||||
2016 | 2015 | Amount | Percentage | |||||||||
(dollars in thousands) | ||||||||||||
Provision for income taxes | 164 | 200 | $ | (36 | ) | (18.0 | )% | |||||
% of total revenue | 0.6 | % | 2.1 | % | ||||||||
Provision for Income Taxes. The decrease in provision for income taxes in 2016 compared to 2015 was primarily attributable to decreases in taxes incurred in our foreign jurisdictions as well as US local taxes.
Years Ended December 31, | Change Increase / (Decrease) | |||||||||||
2016 | 2015 | Amount | Percentage | |||||||||
(dollars in thousands) | ||||||||||||
Mark-to-market expense | 1,263 | — | $ | 1,263 | 100.0 | % | ||||||
% of total revenue | 4.3 | % | — | % | ||||||||
Mark-to-Market Expense.
The increase in mark-to-market expense in 2016 compared to 2015 was attributable to reduction in consists of the change in market value of our contingent consideration in connection with the acquisition of TVN (refer to notes 4 and 7 in the notes to consolidated financial statements).
Total Income (Loss) from Discontinued Operations, Net of Income Taxes
In August 2017, we completed the sale of our buyer platform to Taptica. The consideration received was $50 million, subject to adjustment for working capital (refer to Note 3 in the consolidated financial statements). As a result, the results of our buyer platform have been recast as discontinued operations.
For the year ended December 31, 2016, income from discontinued operations consisted of operating income, net of income taxes, attributable to our buyer platform of $2.9 million and for the year ended December 31, 2015, discontinued operations consisted of operating loss, net of income taxes, attributable to our buyer platform of $14.1 million, respectively (refer to Note 3 in the consolidated financial statements).
Seasonality
45
Our revenue tends to be seasonal in nature and varies from quarter to quarter. During the first quarter, advertisers generally devote less of their budgets to ad spending and as a result we tend to generate less revenue during the first quarter of each calendar year. The fourth quarter of each calendar year tends to be our strongest revenue quarter, as advertising spend generally increases during the holiday season.
Liquidity and Capital Resources
Working Capital
The following table summarizes our cash, cash equivalents and short-term investments, accounts receivable and working capital for the periods indicated:
As of December 31, | |||||||||
2017 | 2016 | 2015 | |||||||
(dollars in thousands) | |||||||||
Cash, cash equivalents and short-term investments | 76,320 | 43,160 | $ | 59,887 | |||||
Accounts receivable, net of allowance for doubtful accounts | 59,288 | 29,429 | 14,715 | ||||||
Working capital | 77,153 | 56,168 | 74,148 | ||||||
Our cash and cash equivalents at December 31, 2017 were held for working capital purposes. We do not enter into investments for trading or speculative purposes. Our policy is to invest any cash in excess of our immediate requirements in investments designed to preserve the principal balance and provide liquidity. Accordingly, our cash and cash equivalents are invested primarily in demand deposit accounts and money market funds that are currently providing only a minimal return.
Sources of Liquidity
Our principal sources of liquidity are our cash and cash equivalents. Cash and cash equivalents consist primarily of cash on deposit with banks and investments in money market funds. Cash and cash equivalents were $76.3 million, $43.2 million and $59.9 million as of December 31, 2017, 2016 and 2015, respectively.
We are party to a loan and security agreement, which we refer to as our credit facility, with Silicon Valley Bank, which we refer to as our lender. Pursuant to the credit facility we can incur revolver borrowings up to the lesser of $25.0 million and a borrowing base equal to 80.0% of eligible accounts receivable. Any outstanding principal amounts borrowed under the credit facility must be paid at maturity. Interest accrues at a floating rate equal to the lender’s prime rate and is payable monthly. We are charged a fee of 0.35% of any unused borrowing capacity, which is payable quarterly. The credit facility also includes a letter of credit, foreign exchange and cash management facility up to the full amount of available credit. The credit facility matures in January 2020. While we had no outstanding borrowings under the credit facility as of December 31, 2017 and 2016, our lender has issued standby letters of credit in favor of the landlord of our headquarters totaling $2.3 million, which can be drawn down from amounts available under the credit facility.
The credit facility contains customary conditions to borrowings, events of default and negative covenants, including covenants that restrict our ability to dispose of assets, merge with or acquire other entities, incur indebtedness, incur encumbrances, make distributions to holders of our capital stock, make investments or engage in transactions with our affiliates. We are also subject to a financial covenant with respect to a minimum quick ratio, tested monthly, and Adjusted EBITDA for trailing periods which vary from three to twelve months, tested quarterly. Our obligations under the credit facility are secured by substantially all of our assets other than our intellectual property, although we have agreed not to encumber any of our intellectual property without the lender’s prior written consent. Subject to certain exceptions, we are also required to maintain all of our cash and cash equivalents at accounts with the lender. We were in compliance with all covenants as of December 31, 2017 and through the date of this filing.
Operating and Capital Expenditure Requirements
We believe our existing cash balances will be sufficient to meet our anticipated cash requirements from issuance date of this Annual Report through at least the next 12 months. If our available cash balances and available borrowings under our credit facility are insufficient to satisfy our liquidity requirements, we will need to raise additional funds to support our operations, and such funding may not be available to us on acceptable terms, or at all. If we are unable to raise additional funds when needed, our operations and ability to execute our business strategy could be adversely affected. We may seek to raise additional funds through equity, equity-linked or debt financings. If we raise additional funds through the incurrence of indebtedness, such indebtedness would have rights that are senior to holders of our equity securities and could contain covenants that restrict our operations. Any additional equity financing may be dilutive to our stockholders.
46
Share repurchase program
On March 29, 2016, we announced that our board of directors had approved a share repurchase program, under which we were authorized to purchase up to $15.0 million of our common stock over the eighteen-month period commencing March 25, 2016. During the year ended December 31, 2017, we made open-market purchases totaling 983,864 shares of our common stock for an aggregate purchase price of $2.4 million, and for the year ended December 31, 2016 we made open-market purchases totaling 2,861,632 of our common stock for an aggregate purchase price of $6.0 million. All share repurchases were funded from cash on hand.
The share repurchase program expired on September 30, 2017.
Historical Cash Flows
The following table summarizes our historical cash flows for the periods indicated:
December 31, | |||||||||||
2017 | 2016 | 2015 | |||||||||
(dollars in thousands) | |||||||||||
Net cash (used in) provided by: | |||||||||||
Operating activities | $ | (9,861 | ) | $ | (7,070 | ) | $ | (7,959 | ) | ||
Investing activities | 45,933 | (2,933 | ) | (9,404 | ) | ||||||
Financing activities | $ | (3,317 | ) | $ | (6,332 | ) | $ | (386 | ) | ||
Operating Activities
Net cash used in operating activities is primarily influenced by the revenue our business generates, our costs of revenue, and amounts of cash we invest in personnel and infrastructure to support our business. Net cash used in operating activities has been used to fund operations through changes in working capital, particularly in the areas of accounts receivable, accounts payable and accrued expenses, adjusted for non-cash expense items such as depreciation, amortization and stock-based compensation expenses.
In 2017, our net cash used in operating activities was $9.9 million and consisted of a loss from continuing operations of $19.7 million, partially offset by net income from discontinued operations of $21.9 million, gain on sale of discontinued operations of $15.0 million and cash used in working capital of $12.7 million, which was offset by adjustments for non-cash items of $15.5 million. Adjustments for non-cash items primarily consisted of depreciation and amortization expense of $7.8 million, non-cash stock-based compensation expense of $5.4 million, compensation expense related to acquisition contingent consideration of $1.8 million and loss from disposal, mark to market expense and bad debt recovery of $0.9 million. The cash used in working capital of $12.7 million primarily consisted of an increase in accounts receivable of $19.9 million, a decrease in contingent consideration of acquisition of $4.8 million, an increase in prepaid expenses of $3.2 million and an increase in other current liabilities of $0.1 million, which was partially offset by an increase in accounts payable and accrued expenses of $13.8 million and an increase in deferred income of $1.4 million.
In 2016, our net cash used in operating activities was $7.1 million and consisted of a loss from continuing operations of $23.9 million, partially offset by net income from discontinued operations of $2.9 million, cash used in working capital of $3.8 million, which was partially offset by adjustments for non-cash items of $17.7 million. Adjustments for non-cash items primarily consisted of depreciation and amortization expense of $9.2 million, non-cash stock-based compensation expense of $3.9 million, compensation expense related to acquisition contingent consideration of $3.6 million and mark to market expense of $1.3 million. The cash used in working capital of $3.8 million, primarily consisted of an increase in accounts receivable of $8.3 million and a decrease in contingent consideration of $3.4 million, which was partially offset by an increase in accounts payable of $6.7 million and an increase in prepaid expenses and other current assets and an increase in deferred rent and security deposits payable of $1.2 million.
In 2015, our net cash used in operating activities was $8.0 million and consisted of a loss from continuing operations of $29.2 million, a loss from discontinued operations of $14.1 million and cash used in working capital of $0.1 million, partially offset by adjustments for non-cash items of $35.4 million. The use of cash in working capital adjustments of $0.1 million primarily consisted of an increase in accounts receivable of $22.7 million, partially offset by an increase in accounts payable and accrued expenses of $20.2 million and an increase in deferred rent and security deposits payable of $5.6 million.
47
Adjustments for non-cash items primarily consisted of impairment charge related to the sale of our buyer platform of $22.7 million, depreciation and amortization expense of $8.3 million, non-cash stock-based compensation expense of $4.0 million and non-cash stock-based long-term incentive compensation expense of $0.4 million.
Investing Activities
In 2017, our net cash provided by investing activities was $45.9 million, and consisted of the sale of our buyer platform for cash proceeds of $49.0 million, offset by $2.0 million of expenses paid with respect to the sale of the buyer platform, and $1.1 million used to purchase property and equipment.
In 2016, our net cash used in investing activities was $2.9 million and consisted of $2.9 million used to purchase property and equipment.
In 2015, our net cash used in investing activities was $9.4 million and consisted of $7.7 million used primarily to purchase computer hardware and software related to our third-party data hosting facilities and $1.7 million used for the acquisition of TVN, net of cash received.
Financing Activities
In 2017, our net cash used in financing activities was $3.3 million and consisted of $2.4 million of purchases of common stock pursuant to our share repurchase program, $1.8 million used to pay tax withholdings on behalf of employees related to net share settlements of restricted stock unit awards and $0.2 million of principal payments related to capital leases, partially offset by $1.1 million in proceeds received from the issuance of common stock in connection with shares purchased under our ESPP and the exercise of stock option awards.
In 2016, our net cash used in financing activities was $6.3 million and consisted of $6.0 million of purchases of common stock pursuant to our share repurchase program, $0.5 million used to pay tax withholdings on behalf of employees related to net share settlements of restricted stock unit awards and $0.4 million used to pay contingent consideration related to the purchase of TVN, partially offset by $0.7 million in proceeds received from the issuance of common stock in connection with shares purchased under out ESPP and the exercise of stock option awards.
In 2015, our net cash used by financing activities was $0.4 million and consisted of $0.5 million used to pay tax withholdings on behalf of employees related to net share settlements of restricted stock unit awards, partially offset by $0.1 million in proceeds received from the exercise of stock option awards.
Off-Balance Sheet Arrangements
As of December 31, 2017, we did not have any off-balance sheet arrangements, as defined in Item 303(a)(4)(ii) of SEC Regulation S-K, such as the use of unconsolidated subsidiaries, structured finance, special purpose entities or variable interest entities.
Contractual Obligations
The following table discloses aggregate information about material contractual obligations and periods in which payments were due as of December 31, 2017. Future events could cause actual payments to differ from these estimates.
Payments Due by Period | |||||||||||||||||||
Total | Less Than 1 Year | 1 - 3 Years | 3 - 5 Years | More Than 5 Years | |||||||||||||||
(dollars in thousands) | |||||||||||||||||||
Operating lease obligations(1) | $ | 47,088 | $ | 5,743 | $ | 12,896 | $ | 10,322 | $ | 18,127 | |||||||||
Third-party licenses and services | 91 | 51 | 40 | — | — | ||||||||||||||
Total contractual obligations | $ | 47,179 | $ | 5,794 | $ | 12,936 | $ | 10,322 | $ | 18,127 | |||||||||
(1) Operating lease obligations includes those contractual obligations related to our non-cancellable office space lease agreements and co-location agreements.
The amounts in the table above are associated with agreements that are enforceable and legally binding, which specify significant terms including payment terms related to services and the approximate timing of the transaction. Obligations under the contract that we can cancel without a significant penalty are not included in the table.
48
Critical Accounting Policies and Estimates
We prepare our audited consolidated financial statements in accordance with U.S. GAAP. The preparation of audited consolidated financial statements also requires us to make estimates and assumptions that affect the reported amounts of assets, liabilities, revenue, costs and expenses and related disclosures. We base our estimates on historical experience and on various other assumptions that we believe to be reasonable under the circumstances. Actual results could differ significantly from the estimates made by our management. To the extent that there are differences between our estimates and actual results, our future financial statement presentation, financial condition, results of operations and cash flows will be affected. We believe the estimates, assumptions and judgments involved in revenue recognition and deferred revenue, stock-based compensation expense, and accounting for income taxes have the greatest potential impact on our consolidated financial statements, and consider these to be our critical accounting policies and estimates.
Critical accounting policies and estimates are those we consider to be the most important to the portrayal of our financial condition and results of operations because they require the most difficult, subjective or complex judgments, often as a result of the need to make estimates about the effect of matters that are inherently uncertain. Our critical accounting policies and estimates include those related to the following:
Revenue Recognition
We generate revenue each time a transaction occurs on our seller platform based on a simple and transparent fee structure established with our publisher partners. We do not purchase and re-sell inventory from publishers and do not collect any fees directly from buyers. We act as an agent on behalf of publishers and revenue is recognized net of any inventory costs that we remit to publishers, when a buyer purchases inventory from a publisher on our platform. The determination of whether revenue should be reported on a gross or net basis is based on an assessment of whether we are acting as the principal or an agent in the transaction. In determining whether we are acting as the principal or an agent, we followed the accounting guidance for principal-agent considerations. The determination of whether we are acting as a principal or an agent in a transaction involves judgment and is based on an evaluation of the terms of each arrangement, none of which are considered presumptive or determinative. Revenue generated, and costs incurred, related to our seller platform are reported on a net basis as we are not the primary obligor in our seller platform transactions as: (1) the determination of whether to purchase inventory, and the price for such inventory, is generally determined by third party buyers; and (2) we do not generally take on inventory risk.
Accounts Receivable, Net of Allowances for Doubtful Accounts
We carry our accounts receivable at net realizable value. On a periodic basis, our management evaluates our accounts receivable and determines whether to provide an allowance or if any accounts should be written down and charged to expense as a bad debt. The evaluation is based on a past history of collections, current credit conditions, the length of time the account is past due and a past history of write-downs. A receivable is considered past due if we have not received payments based on agreed-upon terms. We generally do not require any security or collateral to support our receivables.
We extend credit to customers and generally do not require any security or collateral. Accounts receivable are recorded at the invoiced amount. We carry our accounts receivable balances at net realizable value. We evaluate the collectability of our accounts receivable balances on a periodic basis and determine whether to provide an allowance or if any accounts should be written down and charged to expense as a bad debt. The evaluation is based on a past history of collections, current credit conditions, the length of time the account is past due and a past history of write-downs. A receivable balance is considered past due if we have not received payments based on agreed-upon terms.
Goodwill and Intangible Assets
Goodwill represents the excess of the aggregate purchase price paid over the fair value of the net tangible and intangible assets acquired. Intangible assets that are not considered to have an indefinite useful life are amortized over their useful lives. We evaluate the estimated remaining useful lives of purchased intangible assets and whether events or changes in circumstances warrant a revision to the remaining period of amortization. Goodwill is not amortized, but rather is subject to an impairment test.
We evaluate goodwill and other intangible assets with indefinite lives for impairment annually, or more frequently if an event occurs or circumstances change that would more likely than not reduce the fair value of a reporting unit below its carrying value. We adopted FASB Accounting Standards Update (“ASU”) 2011-08, “Testing Goodwill for Impairment,” which gives companies the option to qualitatively assess whether it is more likely than not that the fair value of a reporting unit is less than its carrying value.
49
We operate as one operating and reporting segment and, therefore, we assess goodwill for impairment annually as one singular reporting unit, using a two-step approach. The first step is to compare the fair value of the reporting unit to the carrying value of the net assets assigned to the reporting unit. If the fair value of the reporting unit is greater than the carrying value of the net assets assigned to the reporting unit, the assigned goodwill is not considered impaired. If the fair value is less than the reporting unit’s carrying value, step two is performed to measure the amount of the impairment, if any.
We also review identifiable intangible assets for impairment whenever events or changes in circumstances indicate the carrying amount of an asset may not be recoverable. Recoverability of intangible assets are measured by a comparison of the carrying amount of the asset or asset group, using an income approach, to future undiscounted net cash flows expected to be generated by the asset or asset group. If such assets are not recoverable, the impairment to be recognized, if any, is measured by the amount which the carrying amount of the assets exceeds the estimated fair value of the assets or asset group. As we operate as one business unit and our long-lived assets do not have identifiable cash flows that are independent of the other assets and liabilities of this business unit, the impairment testing on intangible assets is performed at the entity-level.
During the year ended December 31, 2015, we determined that an impairment indicator was present that required us to perform an interim goodwill impairment analysis prior to October 1st for the reporting unit. This impairment indicator was a decrease in market capitalization below the carrying value of our net assets. During the three months ended September 30, 2015, we conducted an interim impairment test on its goodwill, based on which the Company determined that the implied fair value of goodwill was less than the reporting unit’s carrying value. As a result, we recorded a goodwill impairment loss of $20,890 to reduce the carrying value of goodwill to its implied fair value. Due to the sale of the Company's buyer platform, the impairment loss of $20,890 related to the buyer's platform decline in fair value is included in our discontinued operations for the year ended December 31, 2015.
We did not identify any impairment of our goodwill at December 31, 2017 and 2016 and therefore, for the years ended December 31, 2017 and 2016, no impairment losses related to goodwill were recorded.
Stock-Based Compensation
We include stock-based compensation expense as part of operating expenses in connection with the grant or modification of stock option awards, restricted stock unit awards, employee stock purchase plan awards, and other equity awards to our directors, employees and consultants. We account for stock-based compensation in accordance with the authoritative accounting guidance on stock-based payment awards. Pursuant to the fair value recognition provisions of such guidance, stock-based payment awards are measured at the grant date based on the fair value of the award and is recognized as compensation expense, net of estimated forfeitures, over the requisite service period, which is generally the vesting period of the respective award. During the years ended December 31, 2017, 2016 and 2015, we recorded stock-based compensation expense of $4.7 million, $2.5 million and $2.5 million, respectively. Information about the assumptions used in the calculation of stock-based compensation expense is set forth in “Note 15 — Stock-Based Compensation” in the notes to the consolidated financial statements included in Part II, Item 8 of this Annual Report.
Income Taxes
Our income tax expense represents amounts paid or payable (or received or receivable) for the current year and includes any changes in deferred taxes during the year. Deferred tax assets and liabilities are recognized for future tax consequences attributable to differences between the financial statement carrying amounts of existing assets and liabilities and their respective tax bases. We recognize deferred tax assets and liabilities for the future tax consequences attributable to differences between the financial statement carrying amounts of existing assets and liabilities and their respective tax basis, as well as for operating loss and tax credit carry-forwards. We measure deferred tax assets and liabilities using enacted tax rates expected to apply to taxable income in the years in which we expect to recover or settle those temporary differences. We recognize the effect of a change in tax rates on deferred tax assets and liabilities in the results of operations in the period that includes the enactment date.
Our deferred income tax expense represents the change during the period in deferred tax assets and deferred tax liabilities. The components of the deferred tax assets and liabilities are non-current under ASU 2015-17. We reduce the measurement of a deferred tax asset, if necessary, by a valuation allowance if it is more likely than not that we will not realize some or all of the deferred tax asset. As a result of our historical operating performance and the cumulative net losses incurred to date, we do not have sufficient objective evidence to support the recovery of the deferred tax assets. Accordingly, we have established a valuation allowance against substantially all deferred tax assets for financial reporting purposes because we believe it is more likely than not that these deferred tax assets will not be realized.
50
We account for uncertain tax positions by recognizing the financial statement effects of a tax position only when, based upon technical merits, it is “more-likely-than-not” that the position will be sustained upon examination. Potential interest and penalties associated with unrecognized tax positions are recognized in our provision for income taxes.
At December 31, 2017, we had U.S. federal and state net operating loss carryforwards, or NOLs, of $100.8 million and $56.9 million, respectively, and foreign net operating loss carryforwards of $7.6 million, $6.8 million and $0.2 million related to our international subsidiaries in United Kingdom, Germany and Brazil, respectively. The U.S. federal net operating losses will expire in various years beginning in 2028. Our foreign net operating loss carry-forwards can be carried forward without limitation in each respective country. A lack of future taxable income would adversely affect our ability to utilize these NOLs. In addition, under Section 382 of the Internal Revenue Code, a corporation that undergoes an “ownership change” is subject to limitations on its ability to utilize its NOLs to offset future taxable income. We believe that we experienced an ownership change under Section 382 of the Internal Revenue Code in prior years that may limit our ability to utilize a portion of the NOLs in the future.
Recent Issued and Adopted Accounting Pronouncements
For information with respect to recent accounting pronouncements and the impact of these pronouncements on our consolidated financial statements, refer to “Note 2 — Summary of Significant Accounting Policies” in the notes to the consolidated financial statements included in Part II, Item 8 of this Annual Report.
ITEM 7A. QUANTITATIVE AND QUALITATIVE DISCLOSURE ABOUT MARKET RISK
We are exposed to market risk primarily related to changes in interest rates and foreign currency exchange rates. We do not use derivative financial instruments for speculative, hedging or trading purposes, although in the future we may enter into hedging arrangements to manage the risks described below.
Interest Rate Risk
We maintain cash and a short-term investment portfolio consisting mainly of highly liquid, short-term money market funds, which we consider to be cash and cash equivalents, respectively. The primary objective of our investment activities is to preserve principal while maximizing income without significantly increasing risk. Because our cash and cash equivalents have a relatively short maturity, our portfolio’s fair value is relatively insensitive to interest rate changes. These investments earn interest at variable rates and, as a result, decreases in market interest rates would generally result in decreased interest income. A 10% increase or decrease in interest rates occurring January 1, 2017 and sustained through the period ended December 31, 2017, would not have been material. We do not enter into investments for trading or speculative purposes. In future periods, we will continue to evaluate our investment policy relative to our overall objectives.
We were exposed to market risks related to fluctuations in interest rates related to our $25.0 million credit facility where an increase in interest rates may result in higher borrowing costs. Since we currently do not have any outstanding borrowings under our credit facility, the effect of a hypothetical 10% change in interest rates would not have any impact on our interest expense.
Foreign Currency Exchange Risk
Due to our international operations, we are exposed to foreign exchange risk related to foreign denominated revenues and costs, which must be translated into U.S. dollars. Our primary exposures are related to non-U.S. dollar denominated sales and operating expenses primarily in Australia, Brazil, Europe and the United Kingdom. The effect of a 10% increase or decrease in exchange rates on foreign denominated cash, receivables and payables would not have been material for the periods presented. Substantially all of our advertiser contracts are currently denominated in U.S. dollars. Therefore, we have minimal foreign currency exchange risk with respect to our revenue. These exposures may change over time as our business practices evolve and if our exposure increases, adverse movements in foreign currency exchanges rates could have a material adverse impact on our financial results.
Inflation Risk
We do not believe that inflation has had a material effect on our business, financial condition or results of operations. We continue to monitor the impact of inflation in order to minimize its effects through pricing strategies, productivity improvements and cost reductions. If our costs were to become subject to significant inflationary pressures, we may not be able to fully offset such higher costs through price increases. Our inability or failure to do so could harm our business, financial condition and results of operations.
51
ITEM 8. FINANCIAL STATEMENTS AND SUPPLEMENTARY DATA
TELARIA, INC.
INDEX TO CONSOLIDATED FINANCIAL STATEMENTS
Page Number | |
CONSOLIDATED FINANCIAL STATEMENTS: | |
52
REPORT OF INDEPENDENT REGISTERED PUBLIC ACCOUNTING FIRM
To the Shareholders and the Board of Directors of Telaria, Inc.
Opinion on the Financial Statements
We have audited the accompanying consolidated balance sheets of Telaria, Inc. (the “Company“) as of December 31, 2017 and 2016, the related consolidated statements of operations, comprehensive income (loss), stockholders‘ equity, and cash flows, for each of the three years in the period ended December 31, 2017, and the related notes (collectively referred to as the “ consolidated financial statements“). In our opinion, the consolidated financial statements present fairly, in all material respects, the financial position of the Company at December 31, 2017 and 2016, and the results of its operations and its cash flows for each of the three years in the period ended December 31, 2017, in conformity with U.S. generally accepted accounting principles.
Basis for Opinion
These financial statements are the responsibility of the Company‘s management. Our responsibility is to express an opinion on the Company‘s financial statements based on our audits. We are a public accounting firm registered with the Public Company Accounting Oversight Board (United States) (PCAOB) and are required to be independent with respect to the Company in accordance with the U.S. federal securities laws and the applicable rules and regulations of the Securities and Exchange Commission and the PCAOB.
We conducted our audits in accordance with the standards of the PCAOB. Those standards require that we plan and perform the audit to obtain reasonable assurance about whether the financial statements are free of material misstatement, whether due to error or fraud. The Company is not required to have, nor were we engaged to perform, an audit of its internal control over financial reporting. As part of our audits we are required to obtain an understanding of internal control over financial reporting but not for the purpose of expressing an opinion on the effectiveness of the Company’s internal control over financial reporting. Accordingly, we express no opinion.
Our audits included performing procedures to assess the risks of material misstatement of the financial statements, whether due to error or fraud, and performing procedures that respond to those risks. Such procedures included examining, on a test basis, evidence regarding the amounts and disclosures in the financial statements. Our audits also included evaluating the accounting principles used and significant estimates made by management, as well as evaluating the overall presentation of the financial statements. We believe that our audits provide a reasonable basis for our opinion.
We have served as the Company's auditor since 2012.
/S/ ERNST & YOUNG LLP | |
New York, New York | |
March 1, 2018 | |
53
Telaria, Inc.
Consolidated Balance Sheets
(in thousands, except share and per share data)
December 31, | ||||||||
2017 | 2016 | |||||||
Assets | ||||||||
Current assets: | ||||||||
Cash and cash equivalents | $ | 76,320 | $ | 43,160 | ||||
Accounts receivable, net | 59,288 | 29,429 | ||||||
Prepaid expenses and other current assets | 2,499 | 1,833 | ||||||
Current assets of discontinued operations | — | 50,170 | ||||||
Total current assets | 138,107 | 124,592 | ||||||
Long-term assets: | ||||||||
Restricted cash | — | 770 | ||||||
Property and equipment, net | 3,194 | 7,141 | ||||||
Intangible assets, net | 1,307 | 1,544 | ||||||
Goodwill | 6,320 | 6,228 | ||||||
Deferred tax asset | 332 | — | ||||||
Other assets | 1,168 | 1,251 | ||||||
Non-current assets of discontinued operations | — | 12,699 | ||||||
Total long-term assets | 12,321 | 29,633 | ||||||
Total assets | $ | 150,428 | $ | 154,225 | ||||
Liabilities and stockholders’ equity | ||||||||
Current liabilities: | ||||||||
Accounts payable and accrued expenses | $ | 59,419 | $ | 32,998 | ||||
Deferred rent, short-term | 808 | 704 | ||||||
Contingent consideration on acquisition, short-term | — | 2,483 | ||||||
Deferred income | 674 | — | ||||||
Other current liabilities | 53 | 179 | ||||||
Current liabilities of discontinued operations | — | 32,060 | ||||||
Total current liabilities | 60,954 | 68,424 | ||||||
Long-term liabilities: | ||||||||
Deferred rent | 5,260 | 5,996 | ||||||
Deferred tax liabilities | 338 | 447 | ||||||
Other liabilities | 737 | — | ||||||
Non-current liabilities of discontinued operations | — | 836 | ||||||
Total liabilities | 67,289 | 75,703 | ||||||
Commitments and contingencies | ||||||||
Stockholders’ equity: | ||||||||
Common stock, $0.0001 par value: 250,000,000 shares authorized as of December 31, 2017 and 2016, respectively; 55,136,038 and 53,292,956 shares issued and 51,290,542 and 50,431,324 shares outstanding as of December 31, 2017 and 2016, respectively | 5 | 5 | ||||||
Treasury stock, 3,845,496 and 2,861,632 shares at cost as of December 31, 2017 and 2016, respectively | (8,443 | ) | (6,037 | ) | ||||
Additional paid-in capital | 288,277 | 283,486 | ||||||
Accumulated other comprehensive loss | (232 | ) | (331 | ) | ||||
Accumulated deficit | (196,468 | ) | (198,601 | ) | ||||
Total stockholders’ equity | 83,139 | 78,522 | ||||||
Total liabilities and stockholders’ equity | $ | 150,428 | $ | 154,225 | ||||
The accompanying notes are an integral part of these consolidated financial statements.
54
Telaria, Inc.
Consolidated Statements of Operations
(in thousands, except share and per share data)
Years Ended December 31, | ||||||||||||
2017 | 2016 | 2015 | ||||||||||
Revenue | $ | 43,799 | $ | 29,121 | $ | 9,611 | ||||||
Cost of revenue | 3,448 | 2,211 | 945 | |||||||||
Gross profit | 40,351 | 26,910 | 8,666 | |||||||||
Operating expenses: | ||||||||||||
Technology and development | 8,586 | 6,961 | 4,762 | |||||||||
Sales and marketing | 28,073 | 22,297 | 13,841 | |||||||||
General and administrative | 20,197 | 16,069 | 16,883 | |||||||||
Depreciation and amortization | 4,586 | 3,754 | 2,176 | |||||||||
Mark-to-market | 148 | 1,263 | — | |||||||||
Total operating expenses | 61,590 | 50,344 | 37,662 | |||||||||
Loss from continuing operations | (21,239 | ) | (23,434 | ) | (28,996 | ) | ||||||
Interest and other income (expense), net: | ||||||||||||
Interest expense | (268 | ) | (129 | ) | (10 | ) | ||||||
Other income (expense), net | 1,460 | (123 | ) | 30 | ||||||||
Total interest and other income (expense), net | 1,192 | (252 | ) | 20 | ||||||||
Loss from continuing operations before income taxes | (20,047 | ) | (23,686 | ) | (28,976 | ) | ||||||
(Benefit) provision for income taxes | (347 | ) | 164 | 200 | ||||||||
Loss from continuing operations, net of income taxes | $ | (19,700 | ) | $ | (23,850 | ) | $ | (29,176 | ) | |||
Gain on sale of discontinued operations, net of income taxes | 14,626 | — | — | |||||||||
Income (loss) from discontinued operations, net of income taxes | 7,301 | 2,903 | (14,054 | ) | ||||||||
Total income (loss) from discontinued operations, net of income taxes | $ | 21,927 | $ | 2,903 | $ | (14,054 | ) | |||||
Net income (loss) | $ | 2,227 | $ | (20,947 | ) | $ | (43,230 | ) | ||||
Net income (loss) per share - basic and diluted | ||||||||||||
Loss from continuing operations, net of income taxes | $ | (0.39 | ) | $ | (0.46 | ) | $ | (0.57 | ) | |||
Income (loss) from discontinued operations, net of income taxes | 0.43 | 0.06 | (0.27 | ) | ||||||||
Net income (loss) | $ | 0.04 | $ | (0.40 | ) | $ | (0.84 | ) | ||||
Weighted-average number of shares of common stock outstanding: | ||||||||||||
Basic and diluted | 50,511,366 | 52,279,738 | 51,684,397 | |||||||||
The accompanying notes are an integral part of these consolidated financial statements.
55
Telaria, Inc.
Consolidated Statements of Comprehensive Income (Loss)
(in thousands)
Years Ended December 31, | ||||||||||||
2017 | 2016 | 2015 | ||||||||||
Net income (loss) | $ | 2,227 | $ | (20,947 | ) | $ | (43,230 | ) | ||||
Other comprehensive income (loss) | ||||||||||||
Foreign currency translation adjustments | 99 | (276 | ) | (153 | ) | |||||||
Comprehensive income (loss) attributable to common stockholders | $ | 2,326 | $ | (21,223 | ) | $ | (43,383 | ) | ||||
The accompanying notes are an integral part of these consolidated financial statements.
56
Telaria, Inc.
Consolidated Statements of Changes in Stockholders’ Equity
(in thousands, except share data)
Additional Paid-In Capital | Accumulated Other Comprehensive Income (Loss) | Accumulated Deficit | Total Stockholders’ Equity (Deficit) | ||||||||||||||||||||||||||
Common Stock | Treasury Stock | ||||||||||||||||||||||||||||
Share | Capital | Share | Capital | ||||||||||||||||||||||||||
Balance as of December 31, 2015 | 52,214,384 | $ | 5 | — | $ | — | $ | 279,136 | $ | (55 | ) | $ | (177,654 | ) | $ | 101,432 | |||||||||||||
Exercise of stock options awards | 167,367 | — | — | 161 | — | — | 161 | ||||||||||||||||||||||
Stock-based compensation expense | — | — | — | — | 3,895 | — | — | 3,895 | |||||||||||||||||||||
Common stock issued for settlement of restricted stock units net of 210,029 shares withheld to satisfy income tax withholding obligations | 560,922 | — | — | — | (205 | ) | — | — | (205 | ) | |||||||||||||||||||
Common stock issuance in connection with employee stock purchase plan | 350,283 | — | — | — | 499 | — | — | 499 | |||||||||||||||||||||
Treasury stock - repurchase of stock | — | — | (2,861,632 | ) | (6,037 | ) | — | — | — | (6,037 | ) | ||||||||||||||||||
Net loss | — | — | — | — | — | — | (20,947 | ) | (20,947 | ) | |||||||||||||||||||
Foreign currency translation adjustment | — | — | — | — | — | (276 | ) | — | (276 | ) | |||||||||||||||||||
Balance as of December 31, 2016 | 53,292,956 | 5 | (2,861,632 | ) | (6,037 | ) | 283,486 | (331 | ) | (198,601 | ) | 78,522 | |||||||||||||||||
Exercise of warrants and stock options awards | 439,791 | — | — | — | 699 | — | — | 699 | |||||||||||||||||||||
Stock-based compensation expense | — | — | — | — | 5,394 | — | — | 5,394 | |||||||||||||||||||||
Common stock issued for settlement of restricted stock units net of 625,704 shares withheld to satisfy income tax withholding obligations | 1,124,380 | — | — | — | (1,842 | ) | — | — | (1,842 | ) | |||||||||||||||||||
Common stock issuance in connection with employee stock purchase plan | 278,911 | — | — | — | 446 | — | — | 446 | |||||||||||||||||||||
Treasury stock — repurchase of stock | — | — | (983,864 | ) | (2,406 | ) | — | — | — | (2,406 | ) | ||||||||||||||||||
Retroactive application of ASU 2016-09 | — | — | — | — | 94 | — | (94 | ) | — | ||||||||||||||||||||
Net income | — | — | — | — | — | — | 2,227 | 2,227 | |||||||||||||||||||||
Foreign currency translation adjustment | — | — | — | — | — | 99 | — | 99 | |||||||||||||||||||||
Balance as of December 31, 2017 | 55,136,038 | $ | 5 | (3,845,496 | ) | (8,443 | ) | $ | 288,277 | $ | (232 | ) | $ | (196,468 | ) | $ | 83,139 | ||||||||||||
The accompanying notes are an integral part of these consolidated financial statements.
57
Telaria, Inc.
Consolidated Statements of Cash Flows
(in thousands)
Years Ended December 31, | ||||||||||||
2017 | 2016 | 2015 | ||||||||||
Cash flows from operating activities: | ||||||||||||
Net loss from continuing operations | $ | (19,700 | ) | $ | (23,850 | ) | $ | (29,176 | ) | |||
Net income (loss) from discontinued operations | 21,927 | 2,903 | (14,054 | ) | ||||||||
Adjustments required to reconcile net loss to net cash used in operating activities: | ||||||||||||
Impairment charges | — | — | 22,665 | |||||||||
Depreciation and amortization expense | 7,760 | 9,173 | 8,344 | |||||||||
Gain on sale of discontinued operations, before income taxes | (14,958 | ) | — | — | ||||||||
Loss from sublease | — | 246 | — | |||||||||
Bad debt expense (recovery) | 356 | (66 | ) | (87 | ) | |||||||
Mark-to-market expense | 148 | 1,263 | 113 | |||||||||
Compensation expense related to the acquisition-contingent consideration | 1,810 | 3,568 | — | |||||||||
Deferred tax benefit | (332 | ) | (92 | ) | (61 | ) | ||||||
Loss on disposal of property and equipment | 392 | 23 | — | |||||||||
Stock based compensation expense | 5,394 | 3,900 | 4,007 | |||||||||
Stock-based long-term incentive compensation expense | — | (300 | ) | 436 | ||||||||
Net change in operating assets and liabilities: | ||||||||||||
Increase in accounts receivable | (19,891 | ) | (8,277 | ) | (22,675 | ) | ||||||
Decrease in contingent consideration on acquisition | (4,753 | ) | (3,406 | ) | — | |||||||
(Increase)/decrease in prepaid expenses, other current assets and other long-term assets | (3,157 | ) | 583 | (3,381 | ) | |||||||
Increase in accounts payable and accrued expenses | 13,831 | 6,728 | 20,178 | |||||||||
(Decrease) increase in other current liabilities | (126 | ) | 179 | — | ||||||||
Decrease in deferred tax liability | (110 | ) | — | — | ||||||||
(Decrease)/increase in deferred rent and security deposits payable | (629 | ) | 628 | 5,639 | ||||||||
Decrease/(increase) in restricted cash | 770 | (170 | ) | — | ||||||||
Increase/(decrease) in deferred income and other liabilities | 1,407 | (103 | ) | 93 | ||||||||
Net cash used in operating activities | (9,861 | ) | (7,070 | ) | (7,959 | ) | ||||||
Cash flows from investing activities: | ||||||||||||
Purchase of property and equipment | (1,113 | ) | (2,933 | ) | (7,732 | ) | ||||||
Acquisition, net of cash acquired | — | — | (1,672 | ) | ||||||||
Cash received from sale of discontinued operations | 49,000 | — | — | |||||||||
Expenses paid with respect to sale of discontinued operations | (1,954 | ) | — | — | ||||||||
Net cash provided by (used in) investing activities | 45,933 | (2,933 | ) | (9,404 | ) | |||||||
Cash flows from financing activities: | ||||||||||||
Proceeds from issuance of common stock under employee stock purchase plan | 446 | 499 | — | |||||||||
Decrease in contingent consideration on acquisition | — | (431 | ) | — | ||||||||
Proceeds from the exercise of stock option awards | 699 | 161 | 108 | |||||||||
Principal portion of capital lease payments | (214 | ) | (19 | ) | — | |||||||
Treasury stock — repurchase of stock | (2,406 | ) | (6,037 | ) | — | |||||||
Tax withholdings related to net share settlements of restricted stock units | (1,842 | ) | (505 | ) | (494 | ) | ||||||
Net cash used in financing activities | (3,317 | ) | (6,332 | ) | (386 | ) | ||||||
Net increase (decrease) in cash and cash equivalents | 32,755 | (16,335 | ) | (17,749 | ) | |||||||
Effect of exchange rate changes in cash and cash equivalents | 405 | (392 | ) | (151 | ) | |||||||
Cash and cash equivalents at beginning of year | 43,160 | 59,887 | 77,787 | |||||||||
Cash and cash equivalents at end of year | $ | 76,320 | $ | 43,160 | $ | 59,887 | ||||||
The accompanying notes are an integral part of these consolidated financial statements.
58
1. Organization and Description of Business
Telaria, Inc. (the “Company”), formerly Tremor Video, Inc., is a software company that enables premium video publishers and content owners to maximize advertising return and fully realize the value of their video content wherever and however audiences are watching. The Company’s proprietary seller platform is a fully programmatic, self-service solution, built to monetize and manage premium video inventory with the greatest speed, control and transparency across all screens.
On September 11, 2017, the Company filed an amendment to its Amended and Restated Certificate of Incorporation with the Secretary of State of the State of Delaware to change its name from “Tremor Video, Inc.” to “Telaria, Inc.” In connection with the name change, the Company’s common stock began trading under a new NYSE ticker symbol, “TLRA,” and the corporate website address was changed to www.telaria.com.
On August 7, 2017, the Company announced the sale of its buyer platform to an affiliate of Taptica International Ltd. (“Taptica”) for total consideration of $50,000, subject to adjustment for working capital. Refer to Note 3 in notes to consolidated financial statements. The buyer platform enabled advertisers, agencies and other buyers of advertising to discover, buy, optimize and measure the effectiveness of their video ad campaigns across all digital screens. Following the strategic decision to sell the buyer platform, the Company is focused exclusively on offering a seller platform solution.
On August 3, 2015 (the “TVN Acquisition Date”), the Company acquired all of the outstanding shares of The Video Network Pty Ltd., an Australian proprietary limited company (“TVN”). Refer to Note 7 for further discussion.
The Company is headquartered in the State of New York.
2. Summary of Significant Accounting Policies
Basis of Presentation
The accompanying consolidated financial statements and footnotes have been prepared in accordance with generally accepted accounting principles in the United States of America (“U.S. GAAP”).
Principles of Consolidation
The consolidated financial statements include the accounts of Telaria, Inc. and its wholly-owned subsidiaries. All significant inter-company transactions and balances have been eliminated in consolidation.
The operating results of TVN have been included in the consolidated financial statements since the date of acquisition on August 3, 2015.
Use of Estimates
The preparation of the consolidated financial statements in conformity with U.S. GAAP requires management to make estimates, judgments and assumptions. The Company’s management believes that the estimates, judgments and assumptions used are reasonable based upon information available at the time they are made. These estimates, judgments and assumptions can affect the reported amounts of assets and liabilities and disclosure of contingent assets and liabilities at the dates of the financial statements, and the reported amounts of revenue and expenses during the reporting period. Actual results could differ from those estimates. On an ongoing basis, the Company’s management evaluates estimates, including those related to fair values and useful lives of intangible assets, fair values of stock-based awards, income taxes, and contingent liabilities. Such estimates are based on historical experience and on various other assumptions that are believed to be reasonable, the results of which form the basis for making judgments about the carrying values of assets and liabilities.
Concentrations of Credit Risk
Financial instruments that subject the Company to significant concentrations of credit risk consist primarily of cash and cash equivalents and accounts receivable.
All of the Company’s cash and cash equivalents are held at financial institutions that management believes to be of high credit quality. The Company’s cash and cash equivalents may exceed federally insured limits at times. The Company has not experienced any losses on cash and cash equivalents to date.
The Company determines collectability of its accounts receivable by performing ongoing credit evaluations and monitoring its customers’ accounts receivable balances. For new customers and their agents, which may be advertising agencies or other third-parties, the Company performs a credit check with an independent credit agency and may check credit references to determine creditworthiness. The Company only recognizes revenue when, among other factors, collection is reasonably assured.
59
Telaria, Inc.
Notes to Consolidated Financial Statements
(in thousands, except share and per share data)
2. Summary of Significant Accounting Policies (Continued)
During the years ended December 31, 2017 and 2016 there were no publishers that accounted for more than 10% of revenue, and one publisher that accounted for 11.5% of revenue for the year ended December 31, 2015. At December 31, 2017 there were three DSPs that accounted for more than 10% of accounts receivable, which in total is 48.4% of outstanding accounts receivable. At December 31, 2016, there was two DSP that accounted for more than 38.2% of outstanding accounts receivables.
Cash and Cash Equivalents
The Company considers cash deposits and all highly liquid investments with an original maturity of three months or less to be cash equivalents. The fair value of the Company’s cash and cash equivalents approximates their cost plus accrued interest because of the short-term nature of the instruments.
Fair Value of Financial Instruments
The Company utilizes fair value measurements when required. The carrying amounts of cash and cash equivalents, accounts receivable, prepaid expenses and other current assets, restricted cash, accounts payable and accrued expenses approximate fair values as of December 31, 2017 and 2016 due to the short-term nature of those instruments.
Restricted Cash
At December 31, 2017 and 2016, the Company had total restricted cash outstanding of $0 and $770, respectively, which was used to collateralize standby letters of credit for its former headquarters in New York, New York. In 2016, the restricted cash was used to collateralize standby letters of credit for the Company's former headquarters in New York, New York and additional space in Mountain View, California. In 2017, the standby letters of credit were collateralized by offering the available credit facility with Silicon Valley Bank.
Accounts Receivable, Net
The Company extends credit to customers and generally does not require any security or collateral. Accounts receivable are recorded at the invoiced amount. The Company carries its accounts receivable balances at net realizable value. Management evaluates the collectability of its accounts receivable balances on a periodic basis and determines whether to provide an allowance or if any accounts should be written down and charged to expense as bad debt. The evaluation is based on a past history of collections, current credit conditions, the length of time the account is past due and a past history of write-downs. An accounts receivable balance is considered past due if the Company has not received payments based on agreed-upon terms.
The following table presents the changes in the allowance for doubtful accounts:
Years Ended December 31, | ||||||||||||
2017 | 2016 | 2015 | ||||||||||
Allowance for doubtful accounts: | ||||||||||||
Beginning balance | $ | — | $ | — | $ | — | ||||||
Less: write-offs and other adjustments | 359 | — | — | |||||||||
Ending balance | $ | 359 | $ | — | $ | — | ||||||
Property and Equipment, Net
Property and equipment are stated at cost, less accumulated depreciation. Depreciation expense on property and equipment is calculated using the straight-line method over the following estimated useful lives:
Computer hardware | 3 years | |
Furniture and fixtures | 7 years | |
Computer software | 3 years | |
Office equipment | 3 years | |
60
Telaria, Inc.
Notes to Consolidated Financial Statements
(in thousands, except share and per share data)
2. Summary of Significant Accounting Policies (Continued)
Leasehold improvements are amortized over the shorter of the remaining life of the lease or the life of the asset. The cost of additions and expenditures that extend the useful lives of existing assets, are capitalized, while repairs and maintenance costs are charged to operations as incurred.
Impairment of Long-Lived Assets
The Company periodically reviews long-lived assets, which consists of its property and equipment and intangible assets, for impairment in accordance with Financial Accounting Standards Board (“FASB”) Accounting Standards Codification (“ASC”) 360, “Accounting for the Impairment or Disposal of Long-Lived Assets,” whenever events or changes in circumstances indicate that the carrying amount of an asset is impaired or the estimated useful lives are no longer appropriate. If indicators of impairment exist and the undiscounted projected cash flows associated with such assets are less than the carrying amount of the asset, an impairment loss is recorded to write the assets down to their estimated fair values. Fair value is estimated based on discounted future cash flows.
The Company did not identify any impairment losses in continuing operations related to the Company's long-lived assets during the years ended December 31, 2017, 2016 and 2015.
Goodwill and Intangible Assets, Net
Goodwill represents the excess of the aggregate purchase price paid over the fair value of the net tangible and intangible assets acquired. Intangible assets that are not considered to have an indefinite useful life are amortized over their useful lives. The Company evaluates the estimated remaining useful lives of purchased intangible assets and whether events or changes in circumstances warrant a revision to the remaining period of amortization. Goodwill is not amortized, but rather is subject to an impairment test.
The Company evaluates goodwill and other intangible assets with indefinite lives for impairment annually as of October 1st, or more frequently if an event occurs or circumstances change that would more likely than not reduce the fair value of a reporting unit below its carrying value. The Company adopted FASB Accounting Standards Update (“ASU”) 2011-08, “Testing Goodwill for Impairment,” which gives companies the option to qualitatively assess whether it is more likely than not that the fair value of a reporting unit is less than its carrying value.
The Company operates as one operating and reporting segment and, therefore, the Company assesses goodwill for impairment annually as one singular reporting unit, using a two-step approach. The first step is to compare the fair value of the reporting unit to the carrying value of the net assets assigned to the reporting unit. If the fair value of the reporting unit is greater than the carrying value of the net assets assigned to the reporting unit, the assigned goodwill is not considered impaired. If the fair value is less than the reporting unit’s carrying value, step two is performed to measure the amount of the impairment, if any.
During the year ended December 31, 2015, the Company determined that an impairment indicator was present that required us to perform an interim goodwill impairment analysis prior to October 1st for the reporting unit. This impairment indicator was a decrease in market capitalization below the carrying value of the Company’s net assets. During the three months ended September 30, 2015, the Company conducted an interim impairment test on its goodwill, based on which the Company determined that the implied fair value of goodwill was less than the reporting unit’s carrying value. As a result, the Company recorded a goodwill impairment loss of $20,890 to reduce the carrying value of goodwill to its implied fair value. Due to the sale of the Company's buyer platform, the impairment loss of $20,890 related to the buyer's platform decline in fair value is included in the Company's discontinued operations for the year ended December 31, 2015.
The Company did not identify any impairment of its goodwill at December 31, 2017 and 2016 and therefore, for the years ended December 31, 2017 and 2016, no impairment losses related to goodwill were recorded.
The Company also reviews certain identifiable intangible assets for impairment whenever events or changes in circumstances indicate the carrying amount of an asset may not be recoverable. Recoverability of intangible assets are measured by a comparison of the carrying amount of the asset or asset group, using an income approach, to future undiscounted net cash flows expected to be generated by the asset or asset group. If such assets are not recoverable, the impairment to be recognized, if any, is measured by the amount which the carrying amount of the assets exceeds the estimated fair value of the assets or asset group. As the Company operates as one business unit and our long-lived assets do not have identifiable cash
61
Telaria, Inc.
Notes to Consolidated Financial Statements
(in thousands, except share and per share data)
2. Summary of Significant Accounting Policies (Continued)
flows that are independent of the other assets and liabilities of this business unit, the impairment testing on intangible assets is performed at the entity-level.
Intangible assets that are not considered to have an indefinite useful life are amortized over their estimated useful lives on a straight-line method as follows:
Customer relationships | 5 to 10 years | |
Deferred rent liability
The Company recognizes and records rent expense related to its lease agreements, which include rent holidays, rent escalation provisions and renewal options, on a straight-line basis beginning on the commencement date over the term of the lease. The term of the lease begins on the date of possession, which is generally when the Company enters the leased premises. The Company does not assume renewal option terms in its determination of the lease term unless such renewal option is reasonably expected to be exercised upon lease inception. Any lease incentives, which may be in the form of reduced rent payments, rent holidays or landlord incentives, are considered in determining the straight-line rent expense to be recorded over the lease term.
Differences between straight-line rent expense and actual rent payments are recorded as a deferred rent liability and presented as either a current or long-term liability in the consolidated balance sheets based on the term of the respective lease agreements.
Revenue Recognition
The Company generates revenue each time a transaction occurs on our seller platform based on a simple and transparent fee structure established with our publisher partners. The Company does not purchase and re-sell inventory from publishers and does not collect any fees directly from buyers. The Company acts as an agent on behalf of publishers and revenue is recognized net of any inventory costs that we remit to publishers, when a buyer purchases inventory from a publisher on our platform. The determination of whether revenue should be reported on a gross or net basis is based on an assessment of whether we are acting as the principal or an agent in the transaction. In determining whether the Company is acting as the principal or an agent, management followed the accounting guidance for principal-agent considerations. The determination of whether the Company is acting as a principal or an agent in a transaction involves judgment and is based on an evaluation of the terms of each arrangement, none of which are considered presumptive or determinative. Revenue generated, and costs incurred, related to our seller platform are reported on a net basis as we are not the primary obligor in our seller platform transactions as: (1) the determination of whether to purchase inventory, and the price for such inventory, is generally determined by third party buyers; and (2) we do not generally take on inventory risk.
Cost of Revenue
The Company's cost of revenue primarily consists of third party hosting fees and licensing fees for third party data. Costs owed to third-party vendors but not yet paid are recorded in the consolidated balance sheets and included as part of accounts payable and accrued expenses.
Technology and Development Expenses
Technology and development costs primarily consist of salaries, incentive compensation, stock-based compensation and other personnel-related costs for development and engineering personnel. Additional expenses in this category include costs related to development, quality assurance and testing of new technology, maintenance and enhancement of the Company's existing technology and infrastructure as well as consulting, travel and other related overhead. Due to the rapid development and changes in the Company’s business and underlying technology to date, the Company has expensed development costs in the same period that those costs were incurred.
Sales and Marketing Expenses
Sales and marketing expenses primarily consist of salaries, incentive compensation, stock-based compensation and other personnel-related costs for our marketing and sales and sales support employees. Additional expenses in this category include
62
Telaria, Inc.
Notes to Consolidated Financial Statements
(in thousands, except share and per share data)
2. Summary of Significant Accounting Policies (Continued)
marketing programs, travel and other related overhead. These costs are expensed when incurred and are included in sales and marketing expenses.
Advertising costs, which are comprised of print and internet advertising, were $183, $17, and $0 for the years ended December 31, 2017, 2016 and 2015, respectively.
Stock-Based Compensation Expenses
The Company accounts for stock-based compensation expense under FASB ASC 718, “Compensation—Stock Compensation,” which requires the measurement and recognition of stock-based compensation expense based on estimated fair values, for all stock-based payment awards made to employees, and FASB ASC 505-50, “Equity-Based Payments to Non-Employees,” which requires the measurement and recognition of stock-based compensation expense based on the estimated fair value of services or goods being received, for all stock-based payment awards made to other service providers and non-employees.
The Company measures its stock-based payment awards based on its estimate of the fair value of such award using an option-pricing model, for stock option awards, and the fair value of the Company’s common stock on the date of grant, for restricted stock unit awards. The value of the portion of the award that is ultimately expected to vest is recognized as an expense over the requisite service periods in the Company’s consolidated statements of operations.
The Company recognizes compensation expenses for the value of its stock-based payment awards, which have graded vesting criteria based on service and market conditions, using the straight-line method, over the requisite service period of each of the awards, net of actual forfeitures.
In the event of modification of the conditions on which stock-based payment awards were granted, an additional expense is recognized for any modification that increases the total fair value of the stock-based payment arrangement or is otherwise beneficial to the employee, other service provider or non-employee at the modification date.
Income Taxes
Income taxes represents amounts paid or payable (or received or receivable) for the current year and includes any changes in deferred taxes during the year. The Company recognizes deferred tax assets and liabilities for the future tax consequences attributable to differences between the financial statement carrying amounts of existing assets and liabilities and their respective tax bases, as well as for operating loss and tax credit carry-forwards. The Company measures deferred tax assets and liabilities using enacted tax rates expected to apply to taxable income in the years in which the Company expects to recover or settle those temporary differences. The Company recognizes the effect of a change in tax rates on deferred tax assets and liabilities in the results of operations in the period that includes the enactment date. Deferred income tax expense represents the change during the period in deferred tax assets and deferred tax liabilities. The components of the deferred tax assets and liabilities are individually classified as non-current. The Company reduces the measurement of a deferred tax asset, if necessary, by a valuation allowance if it is more likely than not that the Company will not realize some or all of the deferred tax asset. As a result of the Company’s historical operating performance and the cumulative net losses incurred to date, the Company does not have sufficient objective evidence to support the recovery of the deferred tax assets. Accordingly, the Company has established a valuation allowance against substantially all of its deferred tax assets for financial reporting purposes because the Company believes it is more likely than not that these deferred tax assets will not be realized. The Company accounts for uncertain tax positions by recognizing the financial statement effects of a tax position only when, based upon technical merits, it is “more-likely-than-not” that the position will be sustained upon examination. Potential interest and penalties associated with unrecognized tax positions are recognized in its provision for income taxes in the consolidated statements of operations.
Net Income (Loss) Per Share Attributable to Common Stockholders
Basic net income (loss) per share attributable to common stockholders is computed by dividing net income (loss) attributable to common stockholders by the weighted-average number of shares of common stock outstanding for the period.
Diluted net income (loss) per share attributable to common stockholders is computed by dividing net income (loss) attributable to common stockholders by the weighted-average number of shares of common stock outstanding for the period, adjusted to reflect potentially dilutive securities using the treasury stock method for warrants to purchase common stock, stock option awards and restricted stock unit awards. Due to the Company’s loss from continuing operations, net of income taxes: (i)
63
Telaria, Inc.
Notes to Consolidated Financial Statements
(in thousands, except share and per share data)
2. Summary of Significant Accounting Policies (Continued)
warrants to purchase common stock; (ii) stock option awards; and (iii) restricted stock unit awards were not included in the computation of diluted net loss per share attributable to common stockholders, as the effects would be anti-dilutive. Accordingly, basic and diluted net loss per share attributable to common stockholders is equal for the years presented.
Comprehensive Income (Loss)
Comprehensive income (loss) consists of foreign currency translation adjustments. Total comprehensive income (loss) and its components are presented in the accompanying consolidated statements of comprehensive income (loss).
Foreign Currency Translation Adjustments
The functional currency of the Company’s international subsidiaries is their local currency. The Company translates the financial statements of these subsidiaries to U.S. dollars using period-end exchange rates for assets and liabilities, and average exchange rates for revenue and expenses. Translation gains and losses are recorded in accumulated other comprehensive (loss) income as a component of stockholders’ equity. During the years ended December 31, 2017, 2016 and 2015, foreign currency translation adjustment gain and losses of $99, $(276), and $(153) respectively, were recorded as a component of comprehensive income (loss) in the consolidated financial statements. Realized and unrealized transaction gains and losses are included in the consolidated statements of operations in the period in which they occur, except on inter-company balances considered to be long-term. Transaction gains and losses on inter-company balances which are considered to be long-term are recorded in accumulated other comprehensive (loss) income. The Company considers its inter-company balances to be long-term in nature. Net (losses) gain resulting from transactions denominated in foreign currencies were accounted for in the Company’s consolidated statements of operations and totaled $44, $(21), and $(4) during the years ended December 31, 2017, 2016 and 2015, respectively.
Recently Issued Accounting Pronouncements
FASB Accounting Standards Update No. 2017-09 - Compensation - Stock Compensation (Topic 718)
In September 2017, Financial Accounting Standards Board, ("FASB") issued an Accounting Standards Update, ("ASU") No. 2017 - 09 Compensation - Stock Compensation (Topic 718): Scope of Modification Accounting. This ASU clarifies and eliminates the diversity of practice as to when a Company must account for the effects of a stock modification. In accordance with the guidance an entity should account for the effects of a modification unless all the following criteria are met: 1. The fair value of the modified award is the same as the fair value of the original award immediately before the original award is modified. If the modification does not affect any of the inputs to the valuation technique that the entity uses to value the award, the entity is not required to estimate the value immediately before and after the modification. 2. The vesting conditions of the modified award are the same as the vesting conditions of the original award immediately before the original award is modified. 3. The classification of the modified award as an equity instrument or a liability instrument is the same as the classification of the original award immediately before the original award is modified. The requirement is for public business entities to apply the guidance prospectively to annual reporting periods beginning after December 15, 2017 with early adoption permitted, including in the interim periods. The Company does not believe the adoption of this ASU will have a material impact prospectively, to the Company’s consolidated financial statements.
FASB Accounting Standards Update No. 2017-04 - Intangibles and Other (Topic 350)
In January 2017, FASB issued ASU No. 2017-04, Intangibles and Other (Topic 350): Simplifying the Test for Goodwill Impairment. The pronouncement eliminates Step 2 from the goodwill impairment test. In computing the implied fair value of goodwill under Step 2, an entity had to perform procedures to determine the fair value at the impairment testing date of its assets and liabilities (including unrecognized assets and liabilities). Now the entity compares the fair value of the reporting unit with its carrying amount. The requirement is for public business entities to apply the guidance to annual reporting periods beginning after December 15, 2019. Early adoption is permitted for interim or annual impairment tests after January 1, 2017. The Company does not believe the adoption of this ASU will have a material impact prospectively, to the Company’s consolidated financial statements.
FASB Accounting Standards Update No. 2017-01 - Business Combinations (Topic 805)
64
Telaria, Inc.
Notes to Consolidated Financial Statements
(in thousands, except share and per share data)
2. Summary of Significant Accounting Policies (Continued)
In January 2017, FASB issued ASU No. 2017-01, “Business Combinations (Topic 805): Clarifying the Definition of a Business”. The amendment was issued to clarify the definition of a business with the objective of adding guidance to assist entities with evaluating whether transactions should be accounted for as acquisitions (or disposals) of assets or businesses. The amendments in this ASU provide a screen to determine when a set (inputs and processes that produce an output) is not a business. The screen requires that when substantially all of the fair value of the gross assets acquired (or disposed of) is concentrated in a single identifiable asset or a group of similar identifiable assets, the set is not a business. This screen reduces the number of transactions that need to be further evaluated. The requirement is for public business entities to apply the guidance to annual reporting periods beginning after December 15, 2017. The Company does not believe the adoption of this ASU will have a material impact prospectively, to the Company’s consolidated financial statements.
FASB Accounting Standards Update No. 2016-18 - Statement of Cash Flows (Topic 230)
In November 2016, FASB issued Accounting Standards Update ASU No. 2016-18, “Statement of Cash Flows (Topic 230): Restricted Cash. This update requires that a Statement of Cash Flow explain the change during the period in the total cash, cash equivalents and amounts generally described as restricted cash or restricted cash equivalents. Therefore, amounts generally described as restricted cash should be included with cash & cash equivalents when reconciling the beginning-of-period and end-of-period total amounts shown on the Statement of Cash Flows. Public business entities should apply the guidance to annual reporting periods beginning after December 15, 2017 with early adoption permitted. The Company is currently evaluating the effects, if any, that adoption of this ASU will have on the Company's consolidated financial statements.
FASB Accounting Standards Update No. 2016-15 — Classification of Certain Cash Receipts and Cash Payments
In August 2016, the FASB issued ASU No. 2016-15, Classification of Certain Cash Receipts and Cash Payments, which clarifies how entities should classify certain cash receipts and cash payments on the statement of cash flows. The new guidance also clarifies how the predominance principle should be applied when cash receipts and cash payments have aspects of more than one class of cash flows. This update is effective for public business entities for fiscal years beginning after December 15, 2017, and interim periods within those fiscal years. Early adoption is permitted, including adoption in an interim period. The Company is currently evaluating the impact that the update will have on its consolidated financial statements and related disclosures.
FASB Accounting Standards Update No. 2016-09 — Compensation — Stock Compensation (Topic 718)
In March 2016, the FASB issued an ASU No. 2016-09, Compensation -Stock Compensation, which identifies areas for simplification involving several aspects of accounting for share-based payment transactions, including the income tax consequences, classification of awards as either equity or liabilities, an option to recognize gross stock compensation expense with actual forfeitures recognized as they occur, as well as certain classifications on the statement of cash flows. This update is effective for fiscal years beginning after December 15, 2016 including interim periods within that reporting period, with early adoption permitted. The Company has adopted the provisions of ASU 2016-09 in the first quarter of 2017. The guidance requires the recognition in the income statement of the income tax effects of vested or settled awards. Further, the guidance requires that the recognition of anticipated tax windfalls/shortfalls be excluded in the calculation of assumed proceeds when applying the treasury stock method. The guidance also allows for the employer to repurchase more of an employee’s shares for tax withholding purposes and not classify the award as a liability that requires valuation on a mark-to-market basis. In addition, the guidance allows for a policy election to account for forfeitures as they occur rather than on an estimated basis. As a result of the adoption, the impact to the financial statements resulted in an increase in the accumulated deficit and a corresponding increase in additional paid-in capital of $94 during the year ended December 31, 2017.
FASB Accounting Standards Update No. 2016-02 — Leases (Topic 842)
In February 2016, the FASB issued ASU No. 2016-02, Leases, which clarifies and improves existing authoritative guidance related to leasing transactions. This update will require the recognition of lease assets and lease liabilities on the balance sheet and disclosing information about material leasing arrangements. This update is effective for fiscal years beginning after December 15, 2018, with early adoption permitted. The Company is currently evaluating the impact that the update will have on its consolidated financial statements and related disclosures.
65
Telaria, Inc.
Notes to Consolidated Financial Statements
(in thousands, except share and per share data)
2. Summary of Significant Accounting Policies (Continued)
FASB Accounting Standards Update No. 2015-16 — Business Combinations (“Topic 805”): Simplifying the Accounting for Measurement-Period Adjustments
In September 2015, the FASB issued ASU No. 2015-16, Business Combinations, which eliminates the requirement for an acquirer in a business combination to account for measurement-period adjustments retrospectively. Pursuant to this update, acquirers must recognize measurement-period adjustments in the period in which they determine the amounts, including the effect on earnings of any amounts they would have recorded in previous periods if the accounting had been completed at the acquisition date. This guidance is effective for fiscal years beginning after December 15, 2016, with early adoption permitted. The Company adopted this update in the first quarter of 2017 with no impact on its consolidated financial statements and related disclosures.
FASB Accounting Standards Update No. 2014-09 — Revenue from Contracts with Customers
In May 2014, the FASB issued ASU No. 2014-09, Revenue from Contracts with Customers that provides a comprehensive model for recognizing revenue with customers. This update clarifies and replaces all existing revenue recognition guidance within U.S. GAAP and may be adopted retrospectively for all periods presented or adopted using a modified retrospective approach. In August 2015, The FASB issued ASU No. 2015-14, Revenue from Contracts with Customers, Deferral of the Effective Date, which deferred the effective date by one year to December 15, 2017 (beginning with the Company’s first quarter in 2018) and permitting early adoption of the standard, but not before the original effective date of December 15, 2016. In March 2016, the FASB issued ASU 2016-08, Revenue from Contracts with Customers, Principal vs. Agent Consideration (Reporting Gross versus Net), which clarifies the implementation guidance on principal versus agent considerations. The guidance includes indicators to assist an entity in determining whether it controls a specified good or service before it is transferred to the customers. The Company will adopt the new standard in the first quarter of 2018 and expects to apply the modified retrospective approach.
The Company has assigned internal resources in addition to the engagement of a third-party service provider to assist in evaluating the impact of the new standard on its accounting policies, processes and system requirements. The Company finalized our analysis and the adoption of this guidance will not have a material impact on our consolidated financial statements.
3. Disposition of Buyer Platform
On August 7, 2017, the Company announced the sale of its buyer platform to Taptica for total consideration of $50,000, subject to adjustment for working capital. The proceeds include $1,000 for the right to use the name, “Tremor Video, DSP,” for a period of 18 months following the closing. The Company will recognize the $1,000 in other income within the Consolidated Statements of Operations ratably over the 18-month period. The sale of the buyer platform represented a strategic change to shift the focus of the Company’s business exclusively on offering its seller platform. Accordingly, the results of the buyer platform have been classified as a discontinued operation in the consolidated financial statements for all periods presented. Following the disposition, the Company entered into an arms-length commercial agreement with Taptica pursuant to which they may purchase video inventory on the seller platform. In connection with the transaction, we entered into a transition services agreement, pursuant to which we agreed to provide certain services to Taptica through December 31, 2017. The transaction services agreement was amended to extend certain of the services through April 30, 2018.
In connection with the closing of the transaction, the Company recognized a gain on sale of discontinued operations, net of tax of $14,626. Included in the measurement of the gain were estimates for the income taxes due on the gain and the additional cash consideration expected from the buyer related to a closing date net working capital sales price adjustment. The Company is finalizing such net working capital sales price adjustment with the buyer as provided for in the sales agreement. The Company has included its estimated amount due from the buyer for the closing date net working capital sales price adjustment in accounts receivable as of December 31, 2017. The final net working capital sales price adjustment, as determined through the established process outlined in the sales agreement, may be materially different from the Company’s estimates. The impact of any probable changes in the net working capital adjustment will be recorded as an adjustment to the gain on sale from discontinued operations in the period such change occurs. Additionally, the income taxes associated with the gain will be impacted by the final allocation of the sales price, which must be agreed to with the buyer as required in the sales agreement and may be materially different from the Company’s estimates. The impact of any changes in estimated income taxes on the gain will be recorded as an adjustment to the gain on sale from discontinued operations in the period such change in estimate
66
Telaria, Inc.
Notes to Consolidated Financial Statements
(in thousands, except share and per share data
3. Disposition of Buyer Platform (Continued)
occurs. The Company expects the net working capital sales price adjustment and the income tax on the gain to be finalized by the end of first quarter 2018.
The following table presents a reconciliation of the carrying amounts of major classes of assets and liabilities of the discontinued operation to the amounts presented separately in the Company’s Consolidated Balance Sheet:
December 31, | ||||
2016 | ||||
Accounts receivable, net of allowance for doubtful accounts | $ | 49,598 | ||
Prepaid expenses and other current assets | 572 | |||
Current assets of discontinued operations | $ | 50,170 | ||
Property & equipment, net of accumulated depreciation | $ | 2,515 | ||
Intangible assets, net of accumulated amortization | 5,378 | |||
Goodwill | 4,530 | |||
Other assets | 276 | |||
Non-current assets of discontinued operations | $ | 12,699 | ||
Accounts payable and accrued expenses | $ | 31,693 | ||
Other current liabilities | 5 | |||
Capital leases, short-term | 362 | |||
Current liabilities of discontinued operations | $ | 32,060 | ||
Deferred rent, long-term | 76 | |||
Capital leases | 760 | |||
Non-current liabilities of discontinued operations | $ | 836 | ||
The following table presents a reconciliation of the major financial lines constituting the results of operations for discontinued operations to the income (loss) from discontinued operations, net of income taxes, presented separately in the Consolidated Statements of Operations:
67
Telaria, Inc.
Notes to Consolidated Financial Statements
(in thousands, except share and per share data
3. Disposition of Buyer Platform (Continued)
Years Ended | ||||||||||
2017 | 2016 | 2015 | ||||||||
Revenue | $ | 88,255 | $ | 137,640 | $ | 164,226 | ||||
Cost of revenue | 53,486 | 88,277 | 98,321 | |||||||
Gross profit | 34,769 | 49,363 | 65,905 | |||||||
Operating expenses: | ||||||||||
Technology and development | 7,594 | 14,084 | 15,409 | |||||||
Sales and marketing | 16,149 | 26,064 | 35,038 | |||||||
General administrative | 547 | 941 | 396 | |||||||
Depreciation and amortization | 3,174 | 5,419 | 6,168 | |||||||
Impairment charges | — | — | 22,665 | |||||||
Total operating expenses | 27,464 | 46,508 | 79,676 | |||||||
Income (loss) from discontinued operations | 7,305 | 2,855 | (13,771 | ) | ||||||
Interest and other (expense), net | — | — | — | |||||||
Income (loss) from discontinued operations before income taxes | 7,305 | 2,855 | (13,771 | ) | ||||||
Provision (benefit) for income taxes | 4 | (48 | ) | 283 | ||||||
Income (loss) from discontinued operations, net of income taxes | 7,301 | 2,903 | (14,054 | ) | ||||||
Gain on sale of discontinued operation before income taxes | 14,958 | — | — | |||||||
Provision for income taxes | 332 | — | — | |||||||
Gain on sale of discontinued operation, net of income taxes | 14,626 | — | — | |||||||
Income (loss) from discontinued operations, net of income taxes | $ | 21,927 | $ | 2,903 | $ | (14,054 | ) | |||
The following table presents supplemental cash flow information of the discontinued operations:
Years Ended | ||||||||||
2017 | 2016 | 2015 | ||||||||
Non-cash adjustments to net cash from operating activities: | ||||||||||
Depreciation and amortization | $ | 3,174 | $ | 5,419 | $ | 6,168 | ||||
Stock based compensation expense | 673 | 1,414 | 1,551 | |||||||
Cash used in investing activities: | ||||||||||
Capital expenditures | $ | 475 | $ | — | $ | — | ||||
68
Telaria, Inc.
Notes to Consolidated Financial Statements
(in thousands, except share and per share data)
4. Fair Value Measurements
Fair value is defined as the exchange price that would be received for an asset or paid to transfer a liability (an exit price) in the principal or most advantageous market for the asset or liability in an orderly transaction between market participants on the measurement date. The Company uses a three-tier fair value hierarchy to classify and disclose all assets and liabilities measured at fair value on a recurring basis, as well as assets and liabilities measured at fair value on a non-recurring basis, in periods subsequent to their initial measurement. The hierarchy requires the Company to use observable inputs when available, and to minimize the use of unobservable inputs when determining fair value. If a financial instrument uses inputs that fall in different levels of the hierarchy, the instrument will be categorized based upon the lowest level of input that is significant to the fair value calculation. The three-tiers are defined as follows:
• | Level 1. Observable inputs based on unadjusted quoted prices in active markets for identical assets or liabilities; |
• | Level 2. Inputs, other than quoted prices in active markets, that are observable either directly or indirectly; and |
• | Level 3. Unobservable inputs for which there is little or no market data requiring the Company to develop its own assumptions. |
Assets and Liabilities Measured at Fair Value on a Recurring Basis
December 31, 2017 | December 31, 2016 | ||||||||||||||||||||||||||||||
Level 1 | Level 2 | Level 3 | Total | Level 1 | Level 2 | Level 3 | Total | ||||||||||||||||||||||||
Assets: | |||||||||||||||||||||||||||||||
Money market funds(1) | $ | 53,853 | — | — | 53,853 | $ | 33,710 | $ | — | $ | — | $ | 33,710 | ||||||||||||||||||
Total assets | $ | 53,853 | — | — | 53,853 | $ | 33,710 | $ | — | $ | — | $ | 33,710 | ||||||||||||||||||
Liabilities: | |||||||||||||||||||||||||||||||
Contingent consideration on acquisition liability(2) | — | — | — | — | $ | — | $ | — | $ | 2,483 | $ | 2,483 | |||||||||||||||||||
Total liabilities | $ | — | $ | — | $ | — | $ | — | $ | — | $ | — | $ | 2,483 | $ | 2,483 | |||||||||||||||
(1) Money market funds are included within cash and cash equivalents in the Company’s consolidated balance sheets. As short-term, highly liquid investments readily convertible to known amounts of cash, the Company’s money market funds have carrying values that approximates its fair value. Amounts above do not include $22,467 and $9,450 of operating cash balances as of December 31, 2017 and 2016, respectively.
(2) In connection with the acquisition of TVN in August 2015, the former stockholders of TVN (“TVN Sellers”) were eligible to receive cash payments over a term of two years contingent on the operating performance of TVN in reaching certain financial milestones in each of the periods from July 1, 2015 to June 30, 2016 (the “Year 1 Earn-Out Period”) and the period from July 1, 2016 to June 30, 2017 (the “Year 2 Earn-Out Period”), a portion of which was also contingent on continued employment of certain TVN Sellers (the “TVN Employee Sellers”). In estimating the fair value of the contingent consideration, the Company used a Monte-Carlo valuation model based on future expectations on reaching financial milestones, other management assumptions (including operating results, business plans, anticipated future cash flows, and marketplace data), and the weighted-probabilities of possible payments. These assumptions were based on significant inputs not observed in the market and, therefore, represent a Level 3 measurement. Subsequent to the date of acquisition, the Company re-measured the estimated fair value of the contingent consideration at each reporting date with any changes in fair value recorded in the Company’s statements of operations. Any changes in the unobservable inputs could significantly impact the estimated fair value of the contingent consideration.
69
Telaria, Inc.
Notes to Consolidated Financial Statements
(in thousands, except share and per share data)
4. Fair Value Measurements (Continued)
Liabilities Measured at Fair Value on a Recurring Basis Using Significant Unobservable Inputs (Level 3)
The following table represents the changes in the Company’s Level 3 instruments measured at fair value on a recurring basis for the years ended December 31, 2017 and December 31, 2016:
2017 | 2016 | ||||||
Beginning balance at January 1, | $ | 2,483 | $ | 1,430 | |||
Compensation expense(1) | 1,810 | 3,568 | |||||
Mark-to-market expense(2) | 148 | 1,263 | |||||
Contingent consideration payments(3) | (4,753 | ) | (3,837 | ) | |||
Foreign currency translation adjustment | 312 | 59 | |||||
Ending balance at December 31, | $ | — | $ | 2,483 | |||
(1) Represents contingent consideration attributable to the TVN Employee Sellers that has been recorded during the years ended December 31, 2017 and 2016, respectively. Refer to the table above regarding assumptions used for Level 3 instruments, and note 7 for further discussion of contingent consideration payments paid in connection with the Company’s acquisition of TVN.
(2) Reflects expense incurred based on the Company’s re-measurement, at June 30, 2017, and December 31, 2016, respectively, of the estimated fair value of the contingent consideration relating to the TVN Sellers that are not required to remain employed with the Company. Amounts recorded as mark-to-market expense relating to Level 3 instruments are recorded in operating expense. Refer to the table above regarding assumptions used for Level 3 instruments, and note 7 for further discussion of contingent consideration payments paid in connection with the Company’s acquisition of TVN.
(3) The Company paid the TVN Sellers, earn-out payments of $3,837 and $4,753 for each the Year - 1 and Year - 2 Earn out Periods, respectively.
5. Prepaid Expenses and Other Current Assets
Prepaid expenses and other current assets consisted of:
December 31, | ||||||||
2017 | 2016 | |||||||
Prepaid expenses and other current assets | $ | 2,231 | $ | 1,687 | ||||
Prepaid rent | 127 | — | ||||||
Leasehold improvement incentives | — | 55 | ||||||
Deferred rental income | 141 | 91 | ||||||
Total prepaid expenses and other current assets | $ | 2,499 | $ | 1,833 | ||||
70
Telaria, Inc.
Notes to Consolidated Financial Statements
(in thousands, except share and per share data)
6. Property and Equipment, Net
Property and equipment, net consisted of:
December 31, | ||||||||
2017 | 2016 | |||||||
Leasehold improvements | $ | 8,324 | $ | 8,313 | ||||
Computer hardware | 884 | 3,330 | ||||||
Furniture and fixtures | 1,523 | 1,516 | ||||||
Computer software | 1,389 | 1,387 | ||||||
Office equipment | 184 | 158 | ||||||
Total | 12,304 | 14,704 | ||||||
Less: accumulated depreciation | (9,110 | ) | (7,563 | ) | ||||
Total property and equipment, net | $ | 3,194 | $ | 7,141 | ||||
The depreciation expense related to property and equipment was $4,228, $3,417, and $2,014 for the years ended December 31, 2017, 2016 and 2015, respectively. The Company disposed of assets with a cost basis of $3,085 and accumulated depreciation of $2,693 during the year ended December 31, 2017. For the year ended December 31, 2016 the Company disposed of assets with a cost basis of $107 and accumulated depreciation of $84.
7. Acquisition
On the TVN Acquisition Date, the Company acquired all of the outstanding shares of TVN. As consideration for the acquisition, the Company made an initial payment to the TVN Sellers of $3,040 Australian dollars ($2,217 U.S. dollars based on the currency exchange rate on the Acquisition Date), subject to certain adjustments as set forth in the acquisition agreement, and made payments of $380 Australian dollars ($277 U.S. dollars based on the currency exchange rate on the Acquisition Date) on each of the first and second anniversary of the closing, respectively. Subsequent to the Acquisition Date, the Company paid an additional $661 Australian dollars ($482 U.S. dollars based on the currency exchange rate on the payment date) to the TVN Sellers for certain working capital adjustments.
In addition, the TVN Sellers were eligible to receive future cash payments over a term of two years contingent on the operating performance of TVN in reaching certain financial milestones for the Year 1 Earn-Out Period and Year 2 Earn-Out Period, a portion of which is also contingent on continued employment of certain TVN Employee Sellers. Subsequent to the Acquisition Date, the Company and TVN Sellers agreed to modify certain financial milestones.
On August 16, 2016, the Company made a payment to TVN Sellers of $4,990 Australian Dollars ($3,837 U.S. Dollars based on the currency exchange rate on the date of payment), based on the performance of TVN during the Year 1 Earn-Out Period. On August 16, 2017, the Company made the final payment to the TVN Sellers of $6,032 Australian Dollars ($4,753 U.S. Dollars based on the currency exchange rate on the date of payment), based on the performance of TVN during the Year 2 Earn-Out Period.
As of the Acquisition Date, the Company estimated the fair value of the contingent consideration to be $3,870 Australian dollars ($2,822 U.S. dollars based on the currency exchange rate on the Acquisition Date), of which the Company recorded $1,122 Australian dollars ($818 U.S. dollars based on the currency exchange rate on the Acquisition Date) as purchase consideration related to TVN Sellers that are not subject to continued employment. This amount was included within total liabilities in the Company’s consolidated balance sheet. Subsequent to the date of acquisition, the Company re-measured the estimate fair value of the contingent consideration at each reporting date. Refer to Note 4 for further discussion on assumptions used to estimate the fair value of the contingent consideration.
For the TVN Employee Sellers, who were required to maintain continued employment in order to earn contingent consideration, the estimated fair value of the contingent consideration relating to such TVN Employee Sellers was excluded from the purchase consideration and recorded as compensation expense over the Year 1 Earn-Out Period and Year 2 Earn-Out Period. For the years ended December 31, 2017 and December 31, 2016, the Company recorded $1,810 and $3,568 in compensation-related expenses, respectively, in connection with the continued employment of the TVN Employee Sellers within sales and marketing expenses in its consolidated statements of operations.
71
Telaria, Inc.
Notes to Consolidated Financial Statements
(in thousands, except share and per share data)
7. Acquisition (Continued)
For the TVN Sellers that were not TVN Employees, for the years ended December 31, 2017 and December 31, 2016, the Company recorded $148 and $1,263 in mark-to-market expense, respectively, in the Company's consolidated statements of operations as a result of the Company's re-measurement of the estimate fair value of the contingent consideration at each reporting date.
The total consideration transferred in the acquisition was allocated to the tangible and intangible assets acquired and liabilities assumed at the Acquisition Date. Goodwill recognized in the TVN acquisition is not deductible for tax purposes.
The results of operations of TVN have been included in the Company’s consolidated statements of operations since the Acquisition Date.
8. Goodwill and Intangible Assets, Net
Goodwill is tested annually for impairment or more frequently if impairment indicators are present. The Company operates as one operating and reporting segment and, therefore, the Company assesses goodwill for impairment annually as one singular reporting unit, using a two-step approach. The first step is to compare the fair value of the reporting unit to the carrying value of the net assets assigned to the reporting unit. If the fair value of the reporting unit is greater than the carrying value of the net assets assigned to the reporting unit, the assigned goodwill is not considered impaired. If the fair value is less than the reporting unit’s carrying value, step two is performed to measure the amount of the impairment, if any.
During the year ended December 31, 2015, the Company determined that an impairment indicator was present that required us to perform an interim goodwill impairment analysis prior to October 1st for the reporting unit. This impairment indicator was a decrease in market capitalization below the carrying value of the Company’s net assets. During the three months ended September 30, 2015, the Company conducted an interim impairment test on its goodwill, based on which the Company determined that the implied fair value of goodwill was less than the reporting unit’s carrying value. As a result, the Company recorded a goodwill impairment loss of $20,890 to reduce the carrying value of goodwill to its implied fair value. Due to the sale of the Company's buyer platform, the impairment loss of $20,890 related to the buyer's platform decline in fair value is included in the Company's discontinued operations for the year ended December 31, 2015.
The Company did not identify any impairment in continuing operations of goodwill at December 31, 2017 and 2016, and therefore, for the years ended December 31, 2017 and 2016, no impairment losses related to goodwill were recorded.
The changes in the carrying amount of goodwill as of December 31, 2017 and 2016 were as follows:
2017 | 2016 | |||||||
Beginning balance as of January 1, | $ | 6,228 | $ | 6,242 | ||||
Foreign exchange impact | 92 | (14 | ) | |||||
Ending balance as of December 31, | $ | 6,320 | $ | 6,228 | ||||
The Company also reviews certain identifiable intangible assets for impairment whenever events or changes in circumstances indicate the carrying amount of an asset may not be recoverable. Recoverability of intangible assets are measured by a comparison of the carrying amount of the asset or asset group, using an income approach, to future undiscounted net cash flows expected to be generated by the asset or asset group. If such assets are not recoverable, the impairment to be recognized, if any, is measured by the amount which the carrying amount of the assets exceeds the estimated fair value of the assets or asset group. As the Company operates as one business unit and the Company’s long-lived assets do not have identifiable cash flows that are independent of the other assets and liabilities of this business unit, the impairment testing on intangible assets is performed at the entity-level.
The Company did not identify any impairment of intangible assets at December 31, 2017, 2016 and 2015.
Information regarding the Company’s acquisition-related intangible assets, net is as follows:
72
Telaria, Inc.
Notes to Consolidated Financial Statements
(in thousands, except share and per share data)
8. Goodwill and Intangible Assets, Net (Continued)
December 31, 2017 | |||||||||
Gross Carrying Amount | Accumulated Amortization | Net Carrying Amount | |||||||
Customer relationships(1) | 2,188 | (881 | ) | 1,307 | |||||
December 31, 2016 | ||||||||||||
Gross Carrying Amount | Accumulated Amortization | Net Carrying Amount | ||||||||||
Customer relationships | $ | 2,022 | $ | (478 | ) | $ | 1,544 | |||||
(1) The increase of $166 on the gross carrying amount and $45 on accumulated amortization from December 31, 2016 to December 31, 2017 results from the foreign exchange impact.
Amortization expense amounted to $358, $337 and $162 for the years ended December 31, 2017, 2016 and 2015, respectively. The estimated future amortization expense of customer relationships for the next five years and thereafter are as follows:
2018 | 365 | ||
2019 | 365 | ||
2020 | 365 | ||
2021 | 212 | ||
2022 | — | ||
Total | $ | 1,307 | |
9. Income Taxes
The components of the Company’s loss before income tax provision for the years ended December 31, 2017, 2016 and 2015 are as follows:
Years Ended December 31, | ||||||||||||
2017 | 2016 | 2015 | ||||||||||
Loss from continuing operations before income taxes: | ||||||||||||
Domestic | $ | (18,147 | ) | $ | (17,365 | ) | $ | (28,027 | ) | |||
Foreign | (1,900 | ) | (6,321 | ) | (949 | ) | ||||||
Total loss from continuing operations before income taxes | $ | (20,047 | ) | $ | (23,686 | ) | $ | (28,976 | ) | |||
The Company’s income tax provision, which is comprised of minimum U.S. federal, state and local taxes and taxes from foreign jurisdictions, consists of the following:
73
Telaria, Inc.
Notes to Consolidated Financial Statements
(in thousands, except share and per share data)
9. Income Taxes (Continued)
Years Ended December 31, | ||||||||||||
2017 | 2016 | 2015 | ||||||||||
Provision for current income taxes: | ||||||||||||
U.S. federal | $ | — | $ | — | $ | — | ||||||
U.S. state and local | (2 | ) | 22 | 90 | ||||||||
Foreign | 154 | 234 | 172 | |||||||||
Total provision for current income taxes | 152 | 256 | 262 | |||||||||
Benefit for deferred income taxes: | ||||||||||||
U.S. federal | (332 | ) | — | — | ||||||||
U.S. state and local | — | — | — | |||||||||
Foreign | (167 | ) | (92 | ) | (62 | ) | ||||||
Total benefit for deferred income taxes | (499 | ) | (92 | ) | (62 | ) | ||||||
Total (benefit) provision for income taxes | $ | (347 | ) | $ | 164 | $ | 200 | |||||
A reconciliation between the U.S. federal statutory income tax rate to the effective tax rate, by applying such rates to loss before income tax provision, for the years ended December 31, 2017, 2016 and 2015 are as follows:
Years Ended December 31, | |||||||||
2017 | 2016 | 2015 | |||||||
U.S. federal statutory income tax rate | (34.00 | )% | (34.00 | )% | (34.00 | )% | |||
State income tax rate, net of U.S. federal tax benefit | (0.01 | ) | 0.06 | 0.21 | |||||
Stock-based compensation expense | — | 1.23 | 1.56 | ||||||
Acquisition related costs | 3.11 | 5.08 | — | ||||||
Mark-to-market expense | 0.25 | 1.80 | — | ||||||
Change in income tax rates | (1.03 | ) | 2.89 | 0.70 | |||||
Change in deferred tax asset valuation | 29.03 | 22.52 | 5.74 | ||||||
Goodwill impairment charge | 1.46 | — | 24.51 | ||||||
AMT credit | (1.65 | ) | — | — | |||||
Meals and Entertainment | 1.10 | — | — | ||||||
Other | 0.01 | 1.11 | 1.98 | ||||||
Effective tax rate | (1.73 | )% | 0.69 | % | 0.70 | % | |||
74
Telaria, Inc.
Notes to Consolidated Financial Statements
(in thousands, except share and per share data)
9. Income Taxes (Continued)
Significant components of the Company’s deferred tax assets and liabilities reported on a net cross jurisdictional basis are summarized as follows:
December 31, | ||||||||
2017 | 2016 | |||||||
Deferred tax assets: | ||||||||
Net operating losses and tax credits | $ | 27,474 | $ | 46,336 | ||||
Stock-based compensation expense | 2,440 | 3,883 | ||||||
Deferred rent | 881 | 1,483 | ||||||
Depreciation and amortization expense | 672 | 61 | ||||||
Accrued expenses | 316 | 192 | ||||||
Intangible assets | 294 | — | ||||||
Deferred revenue | 166 | 2 | ||||||
Allowance for doubtful accounts | 89 | 1 | ||||||
Unrealized gains and losses | 88 | 94 | ||||||
Total deferred tax assets before valuation allowance | 32,420 | 52,052 | ||||||
Less: valuation allowance | (32,028 | ) | (50,211 | ) | ||||
Total deferred tax assets, net of valuation allowance | 392 | 1,841 | ||||||
Deferred tax liabilities: | ||||||||
Intangible assets | (392 | ) | (2,277 | ) | ||||
Other | (6 | ) | (11 | ) | ||||
Total deferred tax liabilities | (398 | ) | (2,288 | ) | ||||
Total deferred tax liabilities, net | $ | (6 | ) | $ | (447 | ) | ||
For financial and tax reporting purposes, the Company incurred net operating losses in each period since its inception, except for 2017 and, therefore, a significant portion of the deferred tax assets recognized relate to such net operating losses. In determining whether the Company may realize the benefits from these deferred tax assets, the Company considers all available objective and subjective evidence, both positive and negative. Based on the weight of such evidence, a valuation allowance on a jurisdiction by jurisdiction basis is necessary for some portion, or all, of the deferred tax assets since the Company cannot be assured that, more likely than not, such amounts will be realized. Based on the available objective and subjective evidence, including the Company’s history of net operating losses, management believes it is more likely than not that the deferred tax assets will not be fully realizable at December 31, 2017 and 2016. Accordingly, the Company provided a valuation allowance on substantially all of its deferred tax asset balance to reflect the uncertainty regarding the realizability of these assets for the periods presented, with the exception of a deferred tax asset related to AMT credits.
Impact of U.S. Tax Reform
On December 22, 2017, the U.S. President signed the Tax Cuts and Jobs Act (the “Act”) into law. Effective January 1, 2018, among other changes, the Act (1) reduces the U.S. federal corporate tax rate from 35 percent to 21 percent, (2) changes the rules relating to net operating loss ("NOL") carryforwards and carrybacks, (3) eliminates the corporate alternative minimum tax ("AMT") and changes how existing AMT credits can be realized; and (4) requires companies to pay a one-time transition tax on certain unrepatriated earnings of foreign subsidiaries. The impact on the Company's financial statements for the period ended December 31, 2017 is immaterial, primarily because the Company has a valuation allowance on deferred tax assets in the U.S. In addition, the Act makes the AMT credit refundable in tax years beginning after 2017. As a result of this change, the Company does not have a valuation allowance on its AMT credit.
The SEC staff issued Staff Accounting Bulletin ("SAB") 118, which provides guidance on accounting for the tax effects of the Tax Act. SAB 118 provides a measurement period that should not extend beyond one year from the Tax Act enactment date for companies to complete the accounting under Accounting Standards Codification (ASC) 740. In accordance
75
Telaria, Inc.
Notes to Consolidated Financial Statements
(in thousands, except share and per share data)
9. Income Taxes (Continued)
with SAB 118, a company must reflect the income tax effects of those aspects of the Tax Act for which the accounting under ASC 740 is complete. To the extent that a company’s accounting for certain income tax effects of the Tax Act is incomplete but it is able to determine a reasonable estimate, it must record a provisional estimate in the financial statements. If a company cannot determine a provisional estimate to be included in the financial statements, it should continue to apply ASC 740 on the basis of the provisions of the tax laws that were in effect immediately before the enactment of the Tax Act.
The Tax Act did not have a material impact on our financial statements since our deferred temporary differences in the United States are fully offset by a valuation allowance and we do not have any significant off shore earnings from which to record the mandatory transition tax.
For the year ended December 31, 2017, the Company’s valuation allowance has decreased to $32,028 compared to $50,211 as of December 31, 2016, largely due to the change in federal corporate tax rate of 21% as a result of the Tax Act.
As of December 31, 2017, the Company has U.S. federal and state net operating loss carry-forwards of approximately $100,840 and $56,876, respectively, and foreign net operating loss carry-forwards of $7,590, $6,787 and $158 related to its international subsidiaries in the United Kingdom, Germany and Brazil respectively, which are available to reduce future taxable income in those jurisdictions. The U.S. federal net operating losses will expire in various years beginning in 2028 through 2036. The Company’s foreign net operating loss carry-forwards can be carried forward without limitation in each respective country. The U.S. federal net operating losses includes acquired tax loss carry-forwards of Transpera, Inc. (“Transpera”) and ScanScout, Inc. (“ScanScout”), and net operating losses from Telaria, Inc. ("Telaria") which experienced an ownership change in 2010 which are subject to limitation on future utilization under Section 382 of the Internal Revenue Code of 1986 (“Section 382”). Section 382 imposes limitations on the availability of a company’s net operating losses after a more than 50 percentage point ownership change occurs. It is estimated that the effect of Section 382 will generally limit the amount of the net operating loss carry-forwards of Transpera, ScanScout and Telaria that are available to offset future taxable income to approximately $161, $2,060 and $7,550, respectively, annually.
Telaria’s U.S. federal and U.S. state net operating loss carryforwards include approximately $3,885 of excess tax benefits related to tax deductions from stock-based compensation. As a result of the adoption of ASU 2016-09, the Company will no longer exclude excess tax benefits in its U.S. federal and U.S. state net operating loss carryforwards. There was no net impact on our opening accumulated deficit upon application of this guidance using the modified retrospective transition method as the total cumulative-effect adjustment for previously deferred excess tax benefits was offset by a related change in the valuation allowance.
The Company did not record any amounts related to uncertain tax positions or tax contingencies at December 31, 2017 and 2016. As of December 31, 2017 and 2016, the primary tax jurisdictions in which the Company is subject to tax were the U.S. federal and state jurisdictions, Australia, Canada, Singapore, Malaysia, New Zealand, Brazil and United Kingdom. Since the Company is in an overall net operating loss position, the Company is generally subject to U.S. federal and state income tax examinations by tax authorities for all years for which a net operating loss carry-forward is available. The Company’s open tax years extend back to 2005. In the event that the Company concludes that it is subject to interest or penalties arising from uncertain tax positions, the Company will record interest and penalties as a component of provision for income taxes. No amounts of interest or penalties were recognized in the consolidated statements of operations for the years ended December 31, 2017, 2016 and 2015.
10. Accounts Payable and Accrued Expenses
Accounts payable and accrued expenses consisted of:
December 31, | ||||||||
2017 | 2016 | |||||||
Trade accounts payable | $ | 48,736 | $ | 24,526 | ||||
Accrued compensation, benefits and payroll taxes | 4,288 | 3,742 | ||||||
Accrued cost of revenue | 5,576 | 3,671 | ||||||
Other payables and accrued expenses | 819 | 1,059 | ||||||
Total accounts payable and accrued expenses | $ | 59,419 | $ | 32,998 | ||||
76
Telaria, Inc.
Notes to Consolidated Financial Statements
(in thousands, except share and per share data)
11. Credit Facility
The Company is party to a Loan and Security Agreement (“Loan Agreement”) with Silicon Valley Bank (“SVB”), dated as of June 7, 2007, which was amended and restated by the parties on January 27, 2017, and then amended again on January 26, 2018 (the “Restated Loan Agreement”).
Under the Restated Loan Agreement, the Company can incur revolver borrowings up to the lesser of $25,000 and a borrowing base equal to 80% of eligible accounts receivable. Any outstanding principal amounts borrowed under the Restated Loan Agreement must be paid at maturity. Interest accrues at a floating rate equal to SVB’s prime rate and is payable monthly. In addition, the Company is required to pay a fee of 0.35% of any unused borrowing capacity, which is payable quarterly. The Restated Loan Agreement also includes a letter of credit, foreign exchange and cash management facility up to the full amount of available credit. The credit facility matures in January 2020.
The Restated Loan Agreement contains customary conditions to borrowings, events of default and negative covenants, including covenants that restrict the Company’s ability to dispose of assets, merge with or acquire other entities, incur indebtedness, incur encumbrances, make distributions to holders of capital stock, make investments or engage in transactions with affiliates. The Company is also subject to a financial covenant with respect to minimum quick ratio, tested monthly, and trailing twelve-month Adjusted EBITDA, tested quarterly. The Company’s obligations under the credit facility are secured by substantially all of its assets other than its intellectual property, although the Company has agreed not to encumber any of its intellectual property without the lender’s prior written consent. Subject to certain exceptions, the Company is required to maintain all of its cash and cash equivalents at accounts with the Lender. As of December 31, 2017, the Company is in compliance with all financial covenants applicable to the agreement.
As of December 31, 2016, December 31, 2017, and the date of this filing, the Company had no outstanding borrowings under the credit facility; however, the SVB has issued irrevocable standby letters of credit totaling $3,102 in favor of landlords as additional collateral pursuant to the terms of the Company’s office spaces, which can be drawn down from amounts available under the facility.
12. Commitments and Contingencies
Operating Commitments
The Company leases office space under non-cancellable operating lease agreements that expire at various dates and have contracts for other marketing services under various non-cancellable agreements that expire in 2019.
In October 2017, the Company entered into a sublease for its future headquarters. The commencement date for the sublease is January 2018, and it expires in July 2029.
As of December 31, 2017, future minimum payment commitments required under the Company’s non-cancellable office space leases, including the lease for its future headquarters, (which the Company intends to relocate to during the second quarter of 2018), its current headquarters (which the Company intends to sublease) and for its former headquarters (which the Company subleases), co-location agreements and third-party licenses, net of aggregate future sublease income, for the next five years and thereafter are as follows:
2018 | $ | 5,794 | |
2019 | 6,444 | ||
2020 | 6,492 | ||
2021 | 5,400 | ||
2022 | 4,922 | ||
Thereafter | 18,127 | ||
Total minimum operating commitments | 47,179 | ||
Less: non-cancelable sublease income | (5,526 | ) | |
Total operating commitments | $ | 41,653 | |
77
Total rent expense recorded within operating income in the consolidated statements of operations for the years ended December 31, 2017, 2016 and 2015 were $3,033, $3,008, and $2,849, respectively. In addition, the Company recorded expense of $1,908 and $1,292 and income of $2,107 and $1,686 related to subleases for the years ended December 2017 and 2016, respectively, within other income, net in the consolidated statements of operations.
Letters of Credit
At December 31, 2017 and 2016, the Company had the following outstanding letters of credit:
•$450 related to its former headquarters in New York, New York
• | $320 related to new office space in Mountain View, California |
• | $2,332 related to its headquarters in New York, New York |
Legal Contingencies
The Company is occasionally involved with various claims and litigation during the normal course of business. Reserves are established in connection with such matters when a loss is probable and the amount of such loss can be reasonably estimated. As of December 31, 2017 and 2016, no reserves were recorded. The determination of probability and the estimation of the actual amount of any such loss are inherently unpredictable, and it is therefore possible that the eventual outcome of such claims and litigation could exceed the estimated reserves, if any. Based upon the Company’s experience, current information and applicable law, it generally does not believe it is reasonably probable that any proceedings or possible related claims will have a material effect on its financial statements. Regardless of the outcome, litigation can have an adverse impact on the Company because of defense and settlement costs, diversion of management resources and other factors.
13. Stockholders’ Equity
Stock Repurchases
On March 29, 2016 the Company announced that the Company’s Board of Directors had approved a share repurchase program, under which the Company was authorized to purchase up to $15,000 of common stock over an eighteen month period commencing March 25, 2016. As of September 30, 2017, the share repurchase program expired with $6,557 remaining of our authorized $15,000. For accounting purposes, common stock repurchased under our stock repurchase program is recorded based upon the purchase date of the applicable trade. Such repurchased shares are held in treasury and are presented using the cost method.
The Company repurchased the following shares of common stock under the above-described repurchase program during the years ended December 31, 2017 and 2016.
Year Ended December 31, 2017 | Year Ended December 31, 2016 | |||||||||||||
Shares | Amount(1) | Shares | Amount(1) | |||||||||||
First Quarter | 983,864 | $ | 2,406 | — | $ | — | ||||||||
Second Quarter | — | — | 177,980 | 339 | ||||||||||
Third Quarter | — | — | 621,528 | 1,183 | ||||||||||
Fourth Quarter | — | — | 2,062,124 | 4,515 | ||||||||||
Total | 983,864 | $ | 2,406 | 2,861,632 | $ | 6,037 | ||||||||
(1) | Amounts include broker commissions |
For accounting purposes, common stock repurchased under the stock repurchase program is recorded based upon the purchase date of the applicable trade. Such repurchased shares are held in treasury and are presented using the cost method.
Warrants to Purchase Common Stock
Prior to the Company’s IPO in 2013, the Company issued certain warrants to purchase preferred stock in connection with its financing arrangements. These warrants to purchase preferred stock were exercisable at any time prior to expiration. The Company concluded that freestanding warrants and other similar instruments on shares that are redeemable (either put-able or
78
Telaria, Inc.
Notes to Consolidated Financial Statements
(in thousands, except share and per share data)
13. Stockholders' Equity (Continued)
12. Stockholders' Equity (Continued)
mandatorily redeemable) were accounted for as liabilities, regardless of the timing of the redemption feature or price, even though the underlying shares may be classified as equity.
On July 2, 2013, in connection with the closing of the Company’s IPO, all of the Company’s outstanding warrants to purchase preferred stock were converted into warrants to purchase common stock in the aggregate of 142,534 shares of common stock. This conversion resulted in the warrants to purchase common stock being reclassified to additional paid-in capital.
Mark-to-market income related to the fair value measurement of these warrants to purchase preferred stock was $313 for the year ended December 31, 2013 (through July 2, 2013).
On July 25, 2013, SVB exercised, in full, the following warrants to acquire common stock pursuant to a cashless net exercise: (i) warrants to acquire 17,607 shares of common stock, net of 14,052 shares of common stock tendered to the Company, at an exercise price of $3.79 per share, with an expiration date of February 8, 2020, (ii) warrants to acquire 16,210 shares of common stock, net of 19,321 shares of common stock tendered to the Company, at an exercise price of $4.64 per share, with an expiration date of December 7, 2018 and (iii) warrants to acquire 30,250 shares of common stock, net of 5,270 shares of common stock tendered to the Company, at an exercise price of $1.27 per share, with an expiration date of June 7, 2017. The number of shares tendered to the Company to satisfy the exercise price for the warrants was based on the closing price of the Company’s common stock on July 24, 2013. In aggregate, the Company issued 64,067 shares of common stock to SVB in connection with these exercises.
On June 26, 2016, 8,694 warrants at an exercise price of $5.76 per share expired.
On June 30, 2017, Venture Lending & Leasing IV, LLC exercised, in full, warrants to acquire 31,130 shares of common stock at an exercise price of $2.46 per share, pursuant to a cashless net exercise. In connection with the exercise, the Company issued 406 shares of common stock. As of December 31, 2017, there were no warrants outstanding to purchase the Company's common stock.
14. Changes in Accumulated Other Comprehensive (Loss) Income
The following table provides the components of accumulated other comprehensive (loss) income from continuing operations:
Foreign Currency Translation Adjustment | Total | |||||||
Beginning balance at January 1, 2017 | $ | (331 | ) | $ | (331 | ) | ||
Other comprehensive income(1) | 99 | 99 | ||||||
Ending balance at December 31, 2017 | $ | (232 | ) | $ | (232 | ) | ||
Foreign Currency Translation Adjustment | Total | |||||||
Beginning balance at January 1, 2016 | $ | (55 | ) | $ | (55 | ) | ||
Other comprehensive loss(1) | (276 | ) | (276 | ) | ||||
Ending balance at December 31, 2016 | $ | (331 | ) | $ | (331 | ) | ||
(1) | For the year ended December 31, 2017, $119 of foreign currency translation adjustments was reclassified from accumulated other comprehensive (loss) to the Company's Consolidated Statements of Operations as a result of the sale of the buyer platform. For the year-ended December 31, 2016, there were no reclassifications to or from accumulated other comprehensive (loss) income. |
79
Telaria, Inc.
Notes to Consolidated Financial Statements
(in thousands, except share and per share data)
15. Stock-Based Compensation
The Company included stock-based compensation expense related to all of the Company’s stock-based payments awards in various operating expense categories for the years ended December 31, 2017, 2016 and 2015 as follows:
Years Ended December 31, | ||||||||||||
2017 | 2016 | 2015 | ||||||||||
Stock-based compensation expense: | ||||||||||||
Technology and development | $ | 615 | $ | 459 | $ | 301 | ||||||
Sales and marketing | 2,062 | 476 | 472 | |||||||||
General and administrative | 2,044 | 1,551 | 1,683 | |||||||||
Total in continuing operations | $ | 4,721 | $ | 2,486 | $ | 2,456 | ||||||
Discontinued operations | 673 | 1,414 | 1,551 | |||||||||
Total stock-based compensation expense | $ | 5,394 | $ | 3,900 | $ | 4,007 | ||||||
In August 2017, in connection with the consummation of the sale of the Company’s buyer platform, the Company modified certain restricted stock unit awards held by employees of the buyer platform to provide for pro-rated vesting of such awards for the current year vesting cycle, based on the number of days elapsed from the last vesting date through the date of the transaction. The incremental expense arising from this modification was $45. Additionally, as a result of the sale of the buyer platform, the Company reclassified stock-based compensation expense relating to the employees of the buyer platform of $673 for the year-ended December 31, 2017, $1,414 during the year-ended December 31, 2016, and $1,551 during the year-ended December 31. 2015, which was recorded in Net Income from discontinued operations in the Consolidated Statement of Operations.
On September 20, 2017, the Company entered into an agreement with the Company’s President, Publisher Platforms that resulted in a separation date of October 6, 2017. The agreement provided acceleration of 100% of the unvested shares subject to any stock option or restricted stock unit award issued to him by the Company. The expense arising from this modification was $729.
Stock-Based Incentive Plans
On June 26, 2013, the Company adopted the 2013 Equity Incentive Plan (the “2013 Plan”). The Company has stock option awards outstanding under five stock-based incentive plans as of December 31, 2017, including two plans that were assumed as part of the acquisition of ScanScout. The Company has restricted stock unit awards outstanding, under its 2013 Plan, as of December 31, 2017.
The Company’s initial share reserve under the 2013 Plan upon adoption was 1,333,333 shares of common stock. The number of shares reserved for issuance under the 2013 Plan increases automatically on the first day of January of each year, for a period of ten years, continuing through and including January 1, 2023, by the lesser of 4% of the total number of shares of common stock on the immediately preceding December 31st, or a lesser number of shares determined by the Company’s board of directors. The maximum term for stock option awards granted under the 2013 Plan may not exceed ten years from the date of grant. The 2013 Plan will terminate ten years from the date of approval unless it is terminated earlier by the compensation committee of the board of directors.
Stock Option Awards Outstanding
The following table presents summary information of the Company’s stock option awards outstanding and exercisable under all plans as of December 31, 2017:
80
Telaria, Inc.
Notes to Consolidated Financial Statements
(in thousands, except share and per share data)
15. Stock-Based Compensation (Continued)
Options Outstanding | Options Exercisable | |||||||||||||||||
Options | Weighted Average Remaining Contractual Life | Weighted Average Exercise Price | Options | Weighted Average Remaining Contractual Life | Weighted Average Exercise Price | |||||||||||||
Range of Exercise Prices | Outstanding | (Years) | Per Share | Exercisable | (Years) | Per Share | ||||||||||||
$0.84 – $1.11 | 375,692 | 1.27 | $ | 1.10 | 375,692 | 1.27 | $ | 1.10 | ||||||||||
$1.43 – $1.49 | 341,365 | 0.45 | 1.49 | 341,365 | 0.45 | 1.49 | ||||||||||||
$1.59 – $2.69 | 1,956,048 | 8.2 | 2.22 | 745,735 | 6.74 | 2.19 | ||||||||||||
$4.27 – $5.90 | 3,352,350 | 1.63 | 4.56 | 3,351,672 | 1.63 | 4.56 | ||||||||||||
$8.15 – $9.64 | 285,604 | 3.44 | 8.29 | 285,604 | 3.44 | 8.29 | ||||||||||||
6,311,059 | 3.66 | $ | 3.63 | 5,100,068 | 2.37 | $ | 3.96 | |||||||||||
The following table presents summary information of the Company’s stock option awards outstanding and exercisable under all plans as of December 31, 2017:
Number of Stock Option Awards Outstanding | Weighted Average Exercise Price Per Share | ||||||
December 31, 2016(1) | 6,425,832 | $ | 3.65 | ||||
Stock option awards granted(2) | 1,100,000 | 2.39 | |||||
Stock option awards forfeited | (775,388 | ) | 3.17 | ||||
Stock option awards exercised | (439,385 | ) | 1.58 | ||||
Stock option awards outstanding as of December 31, 2017 | 6,311,059 | $ | 3.63 | ||||
December 31, 2017(3) | 5,100,068 | $ | 3.96 | ||||
(1) | Includes certain employment inducement stock option awards granted outside of the Company’s stockholder approved equity compensation plans. These grants are generally subject to the same terms and conditions as applied to awards granted under the Company’s 2013 Plan. Stock option awards are generally granted at the fair market value of the Company’s common stock on the date of grant, generally vest over periods up to four years, have a one year cliff with monthly vesting thereafter, and have terms not to exceed 10 years. |
(2) | Includes employment inducement stock option awards granted to the Company’s Chief Executive Officer (“CEO”) outside of the Company’s stockholder approved equity compensation plans including the Performance Option (as defined below). These awards were comprised of stock options for purchase 450,000 shares of the Company’s common stock at an exercise price of $2.36 and the Performance Option (as defined below) of stock options for purchase 450,000 shares of the Company’s common stock at an exercise price of $2.36. The exercise price represents the closing price of the Company’s common stock on the date of the grant. These grants are generally subject to the same terms and conditions as applied to awards granted under the Company’s 2013 Plan. |
(3) | Includes the vested portion of each employment inducement stock option award. |
81
Telaria, Inc.
Notes to Consolidated Financial Statements
(in thousands, except share and per share data)
15. Stock-Based Compensation (Continued)
Other selected information is as follows:
Years Ended December 31, | ||||||||||||
2017 | 2016 | 2015 | ||||||||||
Aggregate fair value of stock option awards vested | $ | 644 | $ | 1,418 | $ | 1,869 | ||||||
Aggregate intrinsic value of outstanding stock option awards | 5,503 | 1,969 | 1,100 | |||||||||
Aggregate intrinsic value of stock option awards exercised | 748 | 155 | 311 | |||||||||
Weighted-average grant-date fair value per share of stock option awards granted | 1.13 | 0.57 | 0.80 | |||||||||
Cash proceeds received from stock option awards exercised | $ | 699 | $ | 161 | $ | 108 | ||||||
The fair value for stock option awards was estimated at the date of grant using a Black-Scholes option pricing model (other than with respect to the Performance Option (as defined below)). Calculating the fair value of the stock option awards requires subjective assumptions, including, but not limited to, the expected term of the stock option awards and stock price volatility. The Company estimates the expected life of stock option awards granted based on the simplified method, which the Company believes, is representative of the actual characteristics of the awards. The Company estimates the volatility of its common stock on the date of grant based on the historic volatility of the Company. Risk-free interest rates are based on yields from United States Treasury zero-coupon issues with a term consistent with the expected term of the awards in effect at the time of grant. Forfeitures are based on actual forfeitures in the given period. The Company has never declared or paid any cash dividends and has no current plan to do so. Consequently, it used an expected dividend yield of zero.
The following table presents the assumptions for stock option awards granted during the years ended December 31, 2017, 2016 and 2015:
2017 | 2016 | 2015 | |||||||
Volatility | 49% - 50% | 32% - 33% | 34% - 43% | ||||||
Risk-free interest rate | 1.85% to 2.02% | 1.24% - 1.57% | 1.60% - 1.73% | ||||||
Expected life (in years) | 5.65 - 5.67 | 5.80 - 6.03 | 6.00 - 6.06 | ||||||
Dividend yield | 0.00 | % | 0.00 | % | 0.00 | % | |||
There was $1,042 of total unrecognized compensation cost related to non-vested stock option awards granted under the Company’s equity incentive plans as of December 31, 2017. This cost is expected to be recognized over a weighted-average period of 2.70 years.
Non-vested Restricted Stock Unit (RSU) Awards Outstanding
The following table presents a summary of the Company’s non-vested restricted stock unit award activity under all plans and related information for the year ended December 31, 2017:
Number of Restricted Stock Awards Outstanding | Weighted Average Grant Date Fair Value Per Share | ||||||
Non-vested restricted stock unit awards outstanding as of December 31, 2016 | 3,750,292 | $ | 2.07 | ||||
Restricted stock unit awards granted(1) | 2,569,039 | 2.23 | |||||
Restricted stock unit awards forfeited | (2,050,872 | ) | 2.08 | ||||
Restricted stock unit awards vested | (1,750,084 | ) | 2.11 | ||||
Non-vested restricted stock unit awards outstanding as of December 31, 2017 | 2,518,375 | 2.19 | |||||
82
Telaria, Inc.
Notes to Consolidated Financial Statements
(in thousands, except share and per share data)
15. Stock-Based Compensation (Continued)
(1) | Includes employment inducement restricted stock unit awards granted to the Company's CEO outside of the Company’s stockholder approved equity compensation plans. The award comprised of 186,440 restricted stock units. The award is generally subject to the same terms and conditions as applied to awards granted under the Company's 2013 Plan. |
Years Ended December 31, | ||||||||||||
2017 | 2016 | 2015 | ||||||||||
Aggregate grant date fair value of restricted stock unit awards outstanding | $ | 5,515 | $ | 7,763 | $ | 6,306 | ||||||
Restricted stock unit awards are generally granted at the fair market value of the Company’s common stock on the date of grant and vest on an annual basis over periods up to four years. Forfeitures are based on actual forfeitures in the given period.
As restricted stock unit awards vest, they are settled on a net-share basis. Upon settlement, certain shares underlying each restricted stock unit award are withheld to satisfy income tax withholding obligations, which is based on the value of the restricted stock unit award on the settlement date as determined by the closing fair market value of the Company’s common stock, relating to the employees’ minimum statutory obligation.
There were $3,879 of total unrecognized compensation cost related to non-vested restricted stock unit awards granted under the Company’s equity incentive plans as of December 31, 2017. This cost is expected to be recognized over a weighted-average period of 2.85 years.
Employee Stock Purchase Plan
On April 22, 2014, the Company’s board of directors adopted the 2014 Employee Stock Purchase Plan (“2014 ESPP”), which was approved by the Company’s stockholders at the 2014 annual meeting of stockholders on June 16, 2014. The 2014 ESPP allows eligible participants to purchase shares of the Company’s common stock generally at six-month intervals, or offering periods, at a price equal to 85% of the lower of (i) the fair market value at the beginning of the offering period or (ii) the fair market value at the end of the offering period, or the purchase date.
Employees purchase shares of common stock through payroll deductions, which may not exceed 15% of their total base salary. The 2014 ESPP imposes certain limitations upon an employee’s right to purchase shares, including the following: (1) no employee may purchase more than 5,000 shares on any one purchase date and (2) no employee may purchase shares with a fair market value in excess of $25 in any calendar year.
No more than 2,000,000 shares of common stock are reserved for future issuance under the 2014 ESPP. As of December 31, 2017, the Company had 1,001,658 shares of common stock reserved for future issuance under the 2014 ESPP.
The fair value for each award under the 2014 ESPP was estimated at the date of grant, at the beginning of the offering period, using a Black-Scholes option pricing model. Calculating the fair value of the ESPP awards requires subjective assumptions, including, but not limited to, the expected term of the ESPP award and stock price volatility. The Company estimates the expected life of the awards granted under the 2014 ESPP based on the duration of the offering periods, which is six months. The Company estimates the volatility of its common stock on the date of grant based on the historic volatility of comparable companies in its industry. Risk-free interest rates are based on yields from United States Treasury zero-coupon issues with a term consistent with the expected term of the awards in effect at the time of grant. Forfeitures are estimated at the beginning of the offering period based on actual historical pre-vesting forfeitures and revised, if necessary in subsequent periods, if actual forfeitures differ from those initial estimates to derive the Company’s best estimate of shares that are expected to be purchased. The Company has never declared or paid any cash dividends and has no current plan to do so. Consequently, it used an expected dividend yield of zero.
For the years ended December 31, 2017 and 2016, the following assumptions were used for awards issued under the 2014 ESPP:
83
Telaria, Inc.
Notes to Consolidated Financial Statements
(in thousands, except share and per share data)
15. Stock-Based Compensation (Continued)
2017 | 2016 | 2015 | |||||||
Volatility | 42% - 52% | 32% - 35% | 28% - 35% | ||||||
Risk-free interest rate | 0.70% - 1.1% | 0.46% - 0.49% | 0.07% - 0.22% | ||||||
Expected life (in years) | 0.50 | 0.50 | 0.50 | ||||||
Dividend yield | 0.00 | % | 0.00 | % | 0.00 | % | |||
There was $34 of total unrecognized compensation cost related to awards under the 2014 ESPP as of December 31, 2017. This cost is expected to be recognized over a weighted-average period of less than one year.
Stock-Option Compensation Award with Market Conditions:
On July 10, 2017, the Company granted certain employment inducement awards to its newly appointed CEO. This grant included a performance option award for 450,000 shares of the Company’s common stock, which provides that 50% of the shares subject to the option will vest as of the date on which the 30-day moving average of Company’s common stock exceeds $4.00 per share (as adjusted to account for any stock splits or other adjustments), and 50% of the shares subject to the option will vest as of the date on which the 30-day moving average of Company’s common stock exceeds $5.00 per share (as adjusted to account for any stock splits or other adjustments), provided, in each case that he continues to provide services to the Company on each such vesting date.
With respect to this performance option award, stock-option expense will be recorded over the vesting period for each tranche’s vesting period based on the expected achievement of the vesting condition. For these purposes, the vesting period for the $4.00 stock-option market condition 1.27 years and the vesting period for the $5.00 market condition is 1.75 years.
Fair value of the stock option award was calculated using the Monte-Carlo Simulation with the following assumptions:
2017 | ||||
Exercise price | $ | 2.36 | ||
Volatility | 50 | % | ||
Risk-free interest rate | 2.38 | % | ||
Maturity | 10.00 | |||
Milestone 1 | $ | 4.00 | ||
Milestone 2 | $ | 5.00 | ||
Cost of equity | 17 | % | ||
Dividend yield | — | % | ||
Fair value of the 450,000 stock options is $501, with $331 in stock compensation expense recorded for the year-ended December 31, 2017.
16. Net Income (Loss) Per Share Attributable to Common Stockholders
The following table presents the calculation of basic and diluted net loss per share attributable to common stockholders:
84
Telaria, Inc.
Notes to Consolidated Financial Statements
(in thousands, except share and per share data)
Years Ended December 31, | ||||||||||||
2017 | 2016 | 2015 | ||||||||||
Numerator: | ||||||||||||
Loss from continuing operations, net of income taxes | $ | (19,700 | ) | $ | (23,850 | ) | $ | (29,176 | ) | |||
Total income (loss) from discontinued operations, net of income taxes | 21,927 | 2,903 | (14,054 | ) | ||||||||
Net income (loss) | 2,227 | (20,947 | ) | (43,230 | ) | |||||||
Denominator: | ||||||||||||
Weighted-average number of shares of common stock outstanding for basic and diluted net loss per share attributable to common stockholders | 50,511,366 | 52,279,738 | 51,684,397 | |||||||||
Basic and diluted net income (loss) per share: | ||||||||||||
Loss from continuing operations | $ | (0.39 | ) | $ | (0.46 | ) | $ | (0.57 | ) | |||
Income (loss) from discontinued operations | 0.43 | 0.06 | (0.27 | ) | ||||||||
Net income (loss) | $ | 0.04 | $ | (0.40 | ) | $ | (0.84 | ) | ||||
The following securities were outstanding during the years presented below and have been excluded from the calculation of diluted net loss per share attributable to common stockholders per share because the effect is anti-dilutive:
Years Ended December 31, | |||||||||
2017 | 2016 | 2015 | |||||||
Warrants to purchase common stock | — | 31,130 | 39,824 | ||||||
Stock option awards | 6,311,059 | 6,425,832 | 7,006,472 | ||||||
Restricted stock unit awards | 2,518,375 | 3,750,292 | 2,370,803 | ||||||
Total anti-dilutive securities outstanding | 8,829,434 | 10,207,254 | 9,417,099 | ||||||
17. Employee Benefit Plan
The Company maintains a defined contribution retirement plan available to all eligible U.S. employees pursuant to Section 401(k) of the U.S. Internal Revenue Code (the “401(k) Plan”). Pursuant to the Company’s 401(k) Plan, participating U.S. employees may defer a portion of their pre-tax earnings, subject to annual IRS contribution limits. The Company began a discretionary contribution matching of employee’s contributions in February 2014. The Company matched 50% of each participant’s eligible contributions, up to a maximum employer matching contribution of 3% of each participant’s eligible base salary. Participants will vest in such discretionary employer matching contributions over a 3-year graded vesting period.
Total employer matching contributions to the Company’s 401(k) Plan for the year ended December 31, 2017, 2016 and 2015 were $250, $211, and $199, respectively.
85
Telaria, Inc.
Notes to Consolidated Financial Statements
(in thousands, except share and per share data)
18. Supplemental Disclosure of Cash Flow Information
Years Ended December 31, | ||||||||||||
2017 | 2016 | 2015 | ||||||||||
Supplemental disclosure of cash flow activities: | ||||||||||||
Cash paid for income taxes | $ | 416 | $ | 941 | $ | 505 | ||||||
Cash paid for interest expense | $ | 101 | $ | 12 | $ | 10 | ||||||
Supplemental disclosure of non-cash investing and financing activities: | ||||||||||||
Common stock issued for settlement of restricted stock unit awards | $ | 3,206 | $ | 1,020 | $ | 1,308 | ||||||
Purchase of property and equipment in accounts payable and accrued expenses | $ | 13 | $ | 158 | $ | 1,093 | ||||||
Contingent consideration on acquisition | $ | — | $ | — | $ | 926 | ||||||
19. Segment and Geographic Information
Operating segments are defined as components of an enterprise about which separate financial information is available that is evaluated regularly by the chief operating decision maker, in deciding how to allocate resources and assess performance. The Company’s chief operating decision maker is its Chief Executive Officer (“CEO”). The Chief Executive Officer reviews financial information presented on a consolidated basis for purposes of allocating resources and evaluating financial performance. As such, the Company has concluded that its operations constitute one operating and reportable segment.
Substantially all assets were held in the United States as of each December 31, 2017 and 2016, and substantially all revenue was generated through sales personnel in the United States for the years ended December 31, 2017, 2016 and 2015.
20. Quarterly Results of Operations
Unaudited | Three Months Ended | |||||||||||||||
2017 | March 31, | June 30, | September 30, | December 31, | ||||||||||||
Revenue | $ | 6,139 | $ | 9,934 | $ | 12,715 | $ | 15,011 | ||||||||
Gross profit | 5,375 | 9,017 | 11,951 | 14,008 | ||||||||||||
Loss from continuing operations, net of income taxes | (9,561 | ) | (6,803 | ) | (3,273 | ) | (63 | ) | ||||||||
Total income (loss) from discontinued operations, net of income taxes | 2,701 | 4,503 | 15,567 | (844 | ) | |||||||||||
Net income (loss) | $ | (6,860 | ) | $ | (2,300 | ) | $ | 12,294 | $ | (907 | ) | |||||
Net earnings (loss) per share - basic and diluted: | ||||||||||||||||
Loss from continuing operations, net of income taxes(1) | $ | (0.19 | ) | $ | (0.14 | ) | $ | (0.06 | ) | $ | — | |||||
Income (loss) from discontinued operations, net of income taxes(1) | 0.05 | 0.09 | 0.30 | (0.02 | ) | |||||||||||
Net income (loss)(1) | $ | (0.14 | ) | $ | (0.05 | ) | $ | 0.24 | $ | (0.02 | ) | |||||
Basic and diluted weighted-average number of shares outstanding(2) | 49,998,547 | 50,205,913 | 50,642,344 | 51,195,402 | ||||||||||||
86
Telaria, Inc.
Notes to Consolidated Financial Statements
(in thousands, except share and per share data)
20. Quarterly Results of Operations (Continued)
Unaudited | Three Months Ended | |||||||||||||||
2016 | March 31, | June 30, | September 30, | December 31, | ||||||||||||
Revenue | $ | 5,409 | $ | 5,702 | $ | 7,633 | $ | 10,377 | ||||||||
Gross profit | 4,883 | 5,296 | 7,123 | 9,608 | ||||||||||||
Loss from continuing operations, net of income taxes | (9,944 | ) | (6,698 | ) | (4,114 | ) | (3,094 | ) | ||||||||
Total income (loss) from discontinued operations, net of income taxes | (1,130 | ) | 843 | 497 | 2,693 | |||||||||||
Net loss | (11,074 | ) | (5,855 | ) | (3,617 | ) | (401 | ) | ||||||||
Net earnings (loss) per share - basic and diluted: | ||||||||||||||||
Loss from continuing operations, net of income taxes(1) | (0.19 | ) | (0.13 | ) | (0.08 | ) | (0.06 | ) | ||||||||
Income (loss) from discontinued operations, net of income taxes(1) | (0.02 | ) | 0.02 | 0.01 | 0.05 | |||||||||||
Net loss(1) | $ | (0.21 | ) | $ | (0.11 | ) | $ | (0.07 | ) | $ | (0.01 | ) | ||||
Basic and diluted weighted-average number of shares outstanding(2) | 52,372,857 | 52,633,054 | 52,473,601 | 51,644,295 | ||||||||||||
(1) | Basic and diluted loss from continuing operations, net of income taxes; income (loss) from discontinued operations, net of income taxes and net income (loss) is computed independently for each of the quarters presented. Therefore, the sum of all quarterly basic and diluted loss from continuing operations, net of income taxes; income (loss) discontinued operations, net of income taxes and net income (loss) per share may not equal the annual basic and diluted earnings (loss) per share calculations. |
(2) | Due to the Company’s losses from loss from continuing operations, net of income taxes, all potentially dilutive securities are anti-dilutive and, therefore, basic and diluted weighted average common shares outstanding are equal for all periods presented. |
87
ITEM 9. CHANGES IN AND DISAGREEMENTS WITH ACCOUNTANTS ON ACCOUNTING AND FINANCIAL DISCLOSURE
None.
ITEM 9A. CONTROLS AND PROCEDURES
Evaluation of Disclosure Controls and Procedures
We maintain “disclosure controls and procedures,” as defined in Rules 13a-15(e) and 15d-15(e) under the Exchange Act, that are designed to ensure that information required to be disclosed by a company in the reports that it files or submits under the Exchange Act is recorded, processed, summarized and reported, within the time periods specified in the SEC rules and forms. Disclosure controls and procedures include, without limitation, controls and procedures designed to ensure that information required to be disclosed by a company in the reports that it files or submits under the Exchange Act is accumulated and communicated to our management, including its principal executive and principal financial officers, as appropriate to allow timely decisions regarding required disclosure.
Our management, with the participation of our Chief Executive Officer and our Chief Financial Officer, evaluated the effectiveness of our disclosure controls and procedures as of December 31, 2017. Based on the evaluation of our disclosure controls and procedures as of December 31, 2017, our Chief Executive Officer and Chief Financial Officer concluded that, as of such date, our disclosure controls and procedures were effective at a reasonable assurance level.
Management’s Report on Internal Control over Financial Reporting
Our management is responsible for establishing and maintaining effective internal control over financial reporting, as defined in Rule 13a-15(f) under the Exchange Act. Our internal controls over financial reporting are designed to provide reasonable assurance to our management and board of directors regarding the preparation and fair presentation of published financial statements in accordance with the U.S. GAAP, including those policies and procedures that (i) pertain to the maintenance of records that, in reasonable detail, accurately and fairly reflect the transactions and disposition of our assets, (ii) provide reasonable assurance that transactions are recorded as necessary to permit preparation of financial statements in accordance with U.S. GAAP and that receipts and expenditures are being made only in accordance with authorizations of our management and directors, and (iii) provide reasonable assurance regarding prevention or timely detection of unauthorized acquisition, use or disposition of our assets that could have a material effect on the financial statements. Because of its inherent limitations, internal control over financial reporting may not prevent or detect misstatements. Therefore, even those systems determined to be effective can provide only reasonable assurance with respect to financial statement preparation and presentation.
Our Chief Executive Officer and Chief Financial Officer evaluated the effectiveness of our internal control over financial reporting as of December 31, 2017, based on criteria established in Internal Control - Integrated Framework (2013 Framework) issued by the Committee of Sponsoring Organizations of the Treadway Commission, or the COSO Framework. The assessment included an evaluation of the design of our internal control over financial reporting and testing of the operational effectiveness of those controls. Based on these assessments, we concluded that our internal control over financial reporting was effective as of December 31, 2017.
This annual report does not include an audit or attestation report from our registered public accounting firm regarding our internal control over financial reporting. Our management’s report was not subject to audit or attestation by our registered public accounting firm pursuant to rules of the SEC that permit us to provide only management’s report in this annual report for so long as we remain an “emerging growth company” under the JOBS Act.
Changes in Internal Control over Financial Reporting
There were no changes in our internal control over financial reporting identified in management’s evaluation pursuant to Rules 13a-15(d) or 15d-15(d) of the Exchange Act during the quarter ended December 31, 2017 that materially affected, or are reasonably likely to materially affect, our internal control over financial reporting.
Inherent Limitations on Effectiveness of Controls
While our management, including our Chief Executive Officer and Chief Financial Officer, designs our disclosure controls and procedures and internal control over financial reporting to provide reasonable assurance of achieving their objectives at a reasonable assurance level, our management does not expect that our disclosure controls and procedures or our internal control over financial reporting will prevent all errors and all fraud. A control system, no matter how well conceived and operated, can provide only reasonable, not absolute, assurance that the objectives of the control system are met. Further, the design of a
88
control system must reflect the fact that there are resource constraints, and the benefits of controls must be considered relative to their costs. Because of the inherent limitations in all control systems, no evaluation of controls can provide absolute assurance that all control issues and instances of fraud, if any, have been detected. These inherent limitations include the realities that judgments in decision making can be faulty, and that breakdowns can occur because of a simple error or mistake. Additionally, controls can be circumvented by the individual acts of some persons, by collusion of two or more people or by management override of the controls. The design of any system of controls also is based in part upon certain assumptions about the likelihood of future events, and there can be no assurance that any design will succeed in achieving its stated goals under all potential future conditions; over time, controls may become inadequate because of changes in conditions, or the degree of compliance with policies or procedures may deteriorate. Because of the inherent limitations in a cost-effective control system, misstatements due to error or fraud may occur and not be detected.
ITEM 9B. OTHER INFORMATION
None.
PART III
ITEM 10. DIRECTORS, EXECUTIVE OFFICERS AND CORPORATE GOVERNANCE
Executive Officers
The following table sets forth information concerning our executive officers, including their ages, as of February 21, 2018.
Name | Age | Position | ||||
Mark Zagorski | 49 | Chief Executive Officer and Director | ||||
John Rego | 56 | Senior Vice President and Chief Financial Officer | ||||
Katie Evans | 32 | Senior Vice President and Chief Operating Officer | ||||
Richard Song | 49 | Senior Vice President and Chief Revenue Officer | ||||
Paul Caine | 53 | Executive Chairman of the Board of Directors | ||||
Mark Zagorski has served as our Chief Executive Officer and a member of our Board since July 2017. From December 2010 until its acquisition by the Nielsen Company in March 2015, he served as Chief Executive Officer of eXelate Inc., a leading data management and analytics platform, and continued to manage the eXelate business as Executive Vice President, Nielsen Marketing Cloud through June 2017. Mr. Zagorski served as the Chief Revenue Officer of eXelate from April 2008 to 2010. Prior to that, from January 2005 to April 2008, he served as Chief Marketing Officer of MediaSpan, a provider of digital content management and online marketing and advertising solutions for media companies. In 1999, Mr. Zagorski helped launch WorldNow, a media platform enabling TV broadcasters to distribute and manage online content across digital platforms, and served as its President from February 2002 to December 2004. Mr. Zagorski holds a B.S. in finance from Gannon University and an M.B.A. from the University of Rochester’s Simon School of Business. The Board believes that Mr. Zagorski should serve on our Board due to his extensive knowledge of our business and industry, his experience in building technology and media companies as well as his operational expertise and strategic vision, which provide guidance to our Board.
John Rego has served as a Senior Vice President and our Chief Financial Officer since September 2015. From February 2014 to September 2015, he served as Chief Financial Officer of Virgin Galactic, LLC, a leading commercial spaceline. From November 2011 to April 2013, he served as the Chief Financial Officer of AppSense, Ltd., an enterprise software company. Mr. Rego served as the Chief Financial Officer and Treasurer of Petra Solar, Inc., a clean energy technology company that provides solar and smart grid solutions, from May 2010 to November 2011. Prior to that, he served as Executive Vice President, Chief Financial Officer and Treasurer of Vonage Holdings Corp., a leading provider of cloud communication services, from July 2002 to March 2010. Mr. Rego served on the board and as the chairman of the audit committee for Comverge, Inc., a provider of energy management solutions for utilities, from 2010 to 2012. Mr. Rego received a B.A. in accounting and finance from Rutgers University.
Katie Evans has served as a Senior Vice President and our Chief Operating Officer since March 2017. From November 2015 to March 2017, she served as our Senior Vice President, Strategy & Operations. Ms. Evans served as our Vice President, Strategy & Operations, from January 2014 to October 2015, and as our Senior Director, Sales Strategy & Product
89
Marketing, from January 2012 to December 2013. Ms. Evans received a B.S. in Business Administration from the University of Richmond.
Richard Song has served as a Senior Vice President and our Chief Revenue Officer since December 2017. From July 2016 through December 2017, Mr. Song served as the Chief Revenue Officer of Rocket Fuel, Inc., a predictive marketing software company that was acquired by Sizmek Inc. in September 2017. Mr. Song served as executive vice president and global head of sales at ZEFR, Inc., a video ad technology company, from April 2014 to July 2016. Prior to ZEFR, Mr. Song served as executive vice president at iHeartMedia, Inc. from July 2012 to April 2014 and as General Manager of Eastern US Sales at Microsoft Corporation from January 2006 to June 2012. Mr. Song holds a B.A. degree from Carnegie Mellon University.
Paul Caine has served as our Executive Chairman since July 2017 and as a member of our Board since June 2014. He served as our Interim Chief Executive Officer from February 2017 to July 2017 and as the Non-executive Chairman of the Board from July 2016 to February 2017. Mr. Caine has served as the Executive Director of the Board of Engine Group, a global marketing company, since January 2018, and as CEO and Founder of PC Ventures, LLC, an investment and advisory firm since August 2017. Mr. Caine served as the Chief Global Revenue Officer for Bloomberg Media from June 2014 to July 2016. From April 2013 to January 2014 he served as Chief Executive Officer and a member of the board of directors of WestwoodOne, Inc., the largest independent national audio media company in the U.S. From 1989 to 2013, Mr. Caine served in various capacities at Time Inc., including Executive Vice President, Chief Revenue Officer and Group President from January 2011 until April 2013, Executive Vice President, President and Group Publisher, Style & Entertainment Group from January 2010 to January 2011, and President, Style & Entertainment Group from January 2008 to January 2010. From 2007 to 2011, Mr. Caine served on the board of directors of Nexcen Brands, Inc., a strategic brand management company with a focus on retail franchising, where he served as a member of the audit and governance committees. Mr. Caine received a B.A. in Telecommunications with a minor in Business from Indiana University. The Board believes that Mr. Caine’s senior management experience and expertise in branding and multi-media advertising sales and marketing, his extensive knowledge of our business, as well as his past service on the boards of directors of public and private companies, allows him to make valuable contributions to our Board.
Non-Executive Directors
The following table sets forth information concerning our non-executive officers, including their ages, as of February 23, 2018.
Name | Age | Position | ||||
Warren Lee | 48 | Director | ||||
Rachel Lam | 50 | Director | ||||
James Rossman | 52 | Director | ||||
Robert Schechter | 68 | Director | ||||
Kevin Thompson | 53 | Director | ||||
Rachel Lam has served as a member of our Board since May 2013. Ms. Lam is the Co-Founder and Managing Partner of Imagination Capital LLC, an early stage venture capital firm founded in 2017. From 2003 to 2017, Ms. Lam served as Group Managing Director of the Time Warner Investments Group, the strategic investing arm of Time Warner Inc. Ms. Lam currently serves on the board of directors of The Center for Reproductive Rights. Ms. Lam received a B.S in industrial engineering and operations research from U.C. Berkeley and an M.B.A. from Harvard Business School. The Board believes that Ms. Lam’s experience with digital media and technology companies allows her to make valuable contributions to our Board.
Warren Lee has served as a member of our Board since September 2006. From June 2011 to December 2017 he served as a General Partner of Canaan Partners, a venture capital firm. From July 2005 until June 2011, he served in various capacities at Canaan Partners including Principal then Partner. He currently also serves on the boards of directors of several private technology companies. Mr. Lee received a B.S. in computer science and a B.A. in economics from Stanford University and an M.B.A. from The Wharton School of the University of Pennsylvania. The Board believes that Mr. Lee's experience in digital media and internet investments allows him to make valuable contributions to our Board.
James Rossman has served as a member of our Board since January 2011, and served as Chairman of the Board from August 2012 to May 2013. Mr. Rossman currently serves as Special Advisor to General Atlantic LLC, a global investment firm. From April 2009 to June 2012, he served in various roles, including President and Chief Operating Officer, at AKQA Inc., a
90
digital services company. From April 2001 to March 2009, Mr. Rossman served in several roles at Digitas, Inc., an integrated advertising agency and a member of the Publicis Groupe, S.A. (as of 2007), including as Chief Operating Officer. Mr. Rossman received a B.A. in economics from Trinity College and an M.M.M. from the Kellogg School of Management at Northwestern University. The Board believes that Mr. Rossman's experience in marketing and advertising allows him to make valuable contributions to our Board.
Robert Schechter has served as a member of our Board since June 2013. From 1995 to 2008, he served as the Chief Executive Officer of NMS Communications Corporation, a global provider of hardware and software solutions for the communications industry, and served as the chairman of its board of directors from 1996 to 2008. He currently serves on the board of directors of PTC Inc., a provider of software solutions and related services for product development, where he is board chair and a member of the compensation committee. He also currently serves on the board of directors of EXA Corp, a developer of computational fluid dynamics solutions, as well as other privately held companies. Mr. Schechter received a B.S. from Rensselaer Polytechnic Institute and an M.B.A. from the Wharton School of the University of Pennsylvania. The Board believes that Mr. Schechter’s prior management, international operating, financial and sales and marketing experience as a senior executive at publicly traded companies as well as his current and past service on the board of directors of a range of public and private companies allows him to make valuable contributions to our Board.
Kevin Thompson has served as a member of our Board since January 2017. Since January 2017, Mr. Thompson has served as Vice President of Marketplace Engineering at Uber Inc. He held a variety of engineering roles within Google Inc.’s ads organization from May 2004 through November 2016, including, most recently, as Vice President Engineering leading the YouTube and Video Ads engineering team from 2012 to November 2016. Mr. Thompson received a M.S. in computer science from University of California Irvine and a B.A in Arts and Sciences from University of Virginia. The Board believes that Mr. Thompson’s senior management experience as well as his deep product and engineering expertise, particularly in the area of online and video ads, allow him to make valuable contributions to our Board.
Audit Committee
The Audit Committee of the Board was established by the Board in accordance with Section 3(a)(58)(A) of the Securities Exchange Act of 1934, as amended, or the Exchange Act, to oversee our corporate accounting and financial reporting processes and audits of its financial statements. For this purpose, the Audit Committee performs several functions. The Audit Committee evaluates the performance of and assesses the qualifications of the independent auditors; determines and approves the engagement of the independent auditors; determines whether to retain or terminate the existing independent auditors or to appoint and engage new independent auditors; reviews and approves the retention of the independent auditors to perform any proposed permissible non-audit services; monitors the rotation of partners of the independent auditors on our audit engagement team as required by law; review and approves or rejects transactions between the company and any related persons; confers with management and the independent auditors regarding the effectiveness of internal controls over financial reporting; establishes procedures, as required under applicable law, for the receipt, retention and treatment of complaints received by us regarding accounting, internal accounting controls or auditing matters and the confidential and anonymous submission by employees of concerns regarding questionable accounting or auditing matters; and meets to review our annual audited financial statements and quarterly financial statements with management and the independent auditor, including a review of our disclosures under “Management’s Discussion and Analysis of Financial Condition and Results of Operations.”
The Audit Committee is currently composed of three directors: Mr. Rossman, Ms. Lam and Mr. Schechter. Mr. Rossman was appointed to the Audit Committee in February 2017 to replace Mr. Caine, who resigned from the Audit Committee in connection with his appointment our Interim Chief Executive Officer. The Board has adopted a written Audit Committee charter that is available to stockholders on our website at http://investor.tremorvideo.com/corporate-governance.
The Board reviews the NYSE listing standards definition of independence for Audit Committee members annually and has determined that all members of our Audit Committee are independent (as independence is currently defined in Section 303A.07(a) of the NYSE Listed Company Manual).
The Board has also determined that Mr. Schechter qualifies as an “audit committee financial expert,” as defined in applicable SEC rules. The Board made a qualitative assessment of Mr. Schechter’s level of knowledge and experience based on a number of factors, including his formal education and experience as a chief financial officer for public reporting companies. In addition to our Audit Committee, Mr. Schechter also serves on the board of directors of PTC Inc. The Board has determined that this simultaneous service does not impair Mr. Schechter’s ability to effectively serve on our Audit Committee.
Code of Ethics
We have adopted a Code of Business Conduct and Ethics that applies to all officers, directors and employees. The Code of Business Conduct and Ethics is available on our website at http://investor.tremorvideo.com/corporate-governance. If
91
we make any substantive amendments to the Code of Business Conduct and Ethics or grants any waiver from a provision of the Code to any executive officer or director, we will promptly disclose the nature of the amendment or waiver on its website.
Section 16(a) Beneficial Ownership Reporting Compliance
Section 16(a) of the Exchange Act requires our directors and executive officers, and persons who own more than ten percent of a registered class of the Company’s equity securities, to file with the SEC initial reports of ownership and reports of changes in ownership of our common stock and other equity securities. Officers, directors and greater than ten percent stockholders are required by SEC regulation to furnish us with copies of all Section 16(a) forms they file.
To our knowledge, based solely on a review of the copies of such reports furnished to us, during the fiscal year ended December 31, 2017, all Section 16(a) filing requirements applicable to its officers, directors and greater than ten percent beneficial owners were complied with, except that a report covering the sale of 4,166 shares by Katie Evans was filed late.
ITEM 11. EXECUTIVE COMPENSATION
We are an “emerging growth company,” as defined in Section 101(a)(19)(C) of the JOBS Act. As an emerging growth company, under SEC rules, we are not required to include a Compensation Discussion and Analysis section in this Item 11 and have elected to comply with reduced compensation disclosure requirements, as permitted under the JOBS Act.
2017 Summary Compensation Table
The following table shows for the fiscal years ended December 31, 2017 and 2016 the compensation of (i) the Company’s Chief Executive Officer, (ii) its two other most highly compensated executive officers who served at December 31, 2017 and (iii) two additional individuals who would have been identified in clause (ii) except for the fact they were not serving as executive officers at December 31, 2017. We refer to these individuals as our named executive officers. Mark Zagorski, our Chief Executive Officer, was appointed in July 2017. Lauren Wiener, our former President, Buyer Platform, served with the Company through August 2017. Adam Lichstein, our former President, Seller Platform, served with the Company through October 2017.
Name and Principal Position | Year | Salary ($) | Bonus ($) | Stock Awards(1) ($) | Option Awards(1) ($) | Non-Equity Incentive Plan Compensation(2) ($) | Other Income ($) | Total ($) | |||||||
Mark Zagorski Chief Executive Officer | 2017 | 227,604 | 606,250(3) | 439,998 | 1,007,125 | — | — | 2,280,978 | |||||||
2016 | — | — | — | — | — | — | — | ||||||||
John Rego SVP & Chief Financial Officer | 2017 | 456,667 | 40,000(4) | 428,000 | — | 214,729 | — | 1,139,396 | |||||||
2016 | 365,000 | 20,000 | 35,200 | — | 114,826 | — | 535,026 | ||||||||
Katie Evans SVP & Chief Operating Officer | 2017 | 327,500 | 115,000(5) | 342,498 | — | 230,833 | — | 1,015,832 | |||||||
2016 | 286,667 | — | 153,300 | — | 135,926 | — | 575,893 | ||||||||
Lauren Weiner President, Buyer Platforms | 2017 | 300,000 | 331,448(6) | 374,500 | — | — | 179,178(7) | 1,185,126 | |||||||
2016 | 500,000 | — | 352,000 | — | 118,552 | — | 970,552 | ||||||||
Adam Lichstein President, Seller Platforms | 2017 | 325,590 | — | 374,500 | — | — | 653,493(8) | 1,353,583 | |||||||
2016 | 400,000 | 47,305 | 352,000 | — | 155,195 | — | 954,500 | ||||||||
92
______________
(1) | This column reflects the full grant date fair value for stock awards and options granted during the year as measured pursuant to ASC Topic 718 as stock-based compensation in our consolidated financial statements. The assumptions we used in valuing options are described in note 14 to our consolidated financial statements included in this Annual Report on Form 10-K. |
(2) | These amounts represent non-equity incentive plan compensation pursuant to our 2017 and 2016 bonus plans. For additional information with respect to our 2017 and 2016 bonus plans see " Bonus Plans." |
(3) | In connection with Mr. Zagorski’s appointment as our Chief Executive Officer he received a one-time bonus of $250,000. Per the terms of his offer letter, Mr. Zagorski also received a guaranteed 2017 annual bonus in the amount of $356,250. |
(4) | Mr. Rego received a one-time bonus of $40,000 in connection with the achievement of certain strategic objectives. |
(5) | Ms. Evans received a one-time bonus of $40,000 in connection with the achievement of certain strategic objectives and a one-time bonus of $70,000 contingent on her remaining employed through a specified date. |
(6) | Ms. Wiener received a one-time bonus of $150,000 in connection with the achievement of certain strategic objectives, a one-time bonus of $100,000 contingent on her remaining employed through a specified date and a one-time spot bonus of $81,448. |
(7) | Represents payment of pro-rated 2017 annual bonus payment in connection with termination of employment. |
(8) | Represents cash payments made in connection with Mr. Lichstein’s termination of employment. See “Employment Arrangements” below. |
Outstanding Equity Awards at December 31, 2017
The following table shows for the fiscal year ended December 31, 2017, certain information regarding outstanding equity awards at fiscal year-end for the named executive officers.
93
Number of Shares or Units of Stock That Have Not Vested | |||||||||||||||
Number of | Number of | Market Value | |||||||||||||
Securities | Securities | of Shares or | |||||||||||||
Underlying | Underlying | Options | Units of Stock | ||||||||||||
Unexercised | Unexercised | Exercise | Option | That Have Not | |||||||||||
Options | Options | Price | Expiration | Vested | |||||||||||
Name | Exercisable | Unexercisable | ($) | Date | (#) | ($) | |||||||||
Mark Zagorski | -- | 450,000 | $ | 2.36 | 7/9/2027 | (1) | 186,840 | (3) | $ | 752,965 | |||||
-- | 450,000 | $ | 2.36 | 7/9/2027 | (2) | ||||||||||
John Rego | 320,625 | 249,375 | $ | 1.94 | 9/7/2025 | (4) | 15,000 | (5) | $ | 60,450 | |||||
200,000 | (6) | $ | 806,000 | ||||||||||||
Katie Evans | 488 | -- | $ | 1.11 | 6/23/2020 | (7) | 20,000 | (8) | $ | 80,600 | |||||
1,333 | -- | $ | 4.28 | 2/2/2021 | (7) | 50,000 | (9) | $ | 201,500 | ||||||
1,333 | -- | $ | 4.28 | 6/7/2021 | (7) | 22,500 | (10) | $ | 90,675 | ||||||
2,666 | -- | $ | 5.01 | 7/18/2022 | (7) | 37,500 | (11) | $ | 151,125 | ||||||
2,666 | -- | $ | 5.01 | 7/25/2022 | (7) | 35,046 | (12) | $ | 141,235 | ||||||
6,666 | -- | $ | 5.90 | 3/4/2023 | (7) | 125,000 | (13) | $ | 503,750 | ||||||
5,000 | -- | $ | 8.37 | 7/30/2023 | (7) | ||||||||||
21,231 | -- | $ | 4.27 | 12/4/2023 | (7) | ||||||||||
Lauren Wiener | 340,000 | -- | $ | 5.60 | (14) | ||||||||||
56,691 | -- | $ | 4.29 | (15) | |||||||||||
24,467 | -- | $ | 2.69 | (15) | |||||||||||
Adam Lichstein | 48,831 | -- | $ | 1.11 | (16) | ||||||||||
158,366 | -- | $ | 4.28 | 2/2/2021 | (17) | ||||||||||
33,333 | -- | $ | 5.01 | (16) | |||||||||||
100,000 | -- | $ | 8.15 | (17) | |||||||||||
66,371 | -- | $ | 4.29 | (18) | |||||||||||
27,000 | -- | $ | 2.47 | (18) | |||||||||||
27,000 | -- | $ | 2.69 | (18) | |||||||||||
______________________________________________________________
(1) | The shares subject to this option vest as follows (a) 50% of the shares subject to the option will vest as of the date on which the 30-day moving average of our common stock exceeds $4.00 per share (as adjusted to account for any stock splits or other adjustments) (the “$4.00 Hurdle”) and (b) 50% of the shares subject to the option will vest as of the date on which the 30-day moving average of our common stock exceeds $5.00 per share (as adjusted to account for any stock splits or other adjustments) (the “$5.00 Hurdle”), subject to continued service to us through each vesting date. If any portion of the option becomes vested, Mr. Zagorski will not be entitled to exercise the vested portion until the date that is 18-months from the applicable vesting date. The $4.00 Hurdle was achieved as of December 31, 2017; accordingly 225,000 of the shares underlying the option have vested. In the event of a change in control pursuant to which our common stock is acquired at a price per share greater than $5.00 per share (as adjusted to account for any stock splits or other adjustments), then the $5.00 Hurdle will be deemed to have been achieved. In the event that (a) the $5.00 hurdle has not been achieved on the date which is four years from the date of grant, or (b) we consummates a change in control pursuant to which our common stock is acquired at a price per share (as adjusted to account for any stock splits or other adjustments) below $5.00, the unvested portion of the option shall be cancelled and terminated as of such date. In the event that the recipient is terminated without cause, the recipient will have a one year period from the date of termination to exercise any vested options |
(2) | 25% of the total shares underlying this option vest on July 10, 2018, and thereafter vest at a rate of 1/48 per month, subject to continued service to us through each vesting date. In the event that the recipient is terminated without cause, the recipient will have a one year period from the date of termination to exercise any vested options. |
(3) | 25% of the total shares underlying the restricted stock unit vest on July 10, 2018. 25% of the total shares underlying the restricted stock unit vest on each anniversary date thereafter, subject to continued service to us through each vesting date. |
94
(4) | 25% of the total shares underlying this option vested on September 8, 2016, and thereafter vest at a rate of 1/48 per month, subject to continued service to us through each vesting date. In the event that the recipient is terminated without cause, the recipient will have a one year period from the date of termination to exercise any vested options. |
(5) | 25% of the total shares underlying the restricted stock unit vested on February 14, 2017. 25% of the total shares underlying the restricted stock unit vest on each anniversary date thereafter, subject to continued service to us through each vesting date. |
(6) | 25% of the total shares underlying the restricted stock unit vested on February 14, 2018. 25% of the total shares underlying the restricted stock unit vest on each anniversary date thereafter, subject to continued service to us through each vesting date. |
(7) | The shares subject to this option were full vested as of December 31, 2017. |
(8) | 25% of the total shares underlying the restricted stock unit vested on February 16, 2016. 25% of the total shares underlying the restricted stock unit vest on each anniversary date thereafter, subject to continued service to us through each vesting date. |
(9) | 25% of the total shares underlying the restricted stock unit vested on December 3, 2016. 25% of the total shares underlying the restricted stock unit vest on each anniversary date thereafter, subject to continued service to us through each vesting date. |
(10) | 25% of the total shares underlying the restricted stock unit vested on February 14, 2017. 25% of the total shares underlying the restricted stock unit vest on each anniversary date thereafter, subject to continued service to us through each vesting date. |
(11) | 25% of the total shares underlying the restricted stock unit vested on April 29, 2017. 25% of the total shares underlying the restricted stock unit vest on each anniversary date thereafter, subject to continued service to us through each vesting date. |
(12) | 50% of the total shares underlying the restricted stock unit vested on February 14, 2018. 50% of the total shares underlying the restricted stock unit vest on February 14, 2019. |
(13) | 25% of the total shares underlying the restricted stock unit vest on February 14, 2018. 25% of the total shares underlying the restricted stock unit vest on each anniversary date thereafter, subject to continued service to us through each vesting date. |
(14) | Ms. Wiener’s employment terminated on August 6, 2017. Ms. Wiener has a period of five-years from the date of termination to exercise vested options, at which time any unexercised options will expire. |
(15) | Ms. Wiener’s employment terminated on August 6, 2017. Ms. Wiener has a period of six-months from the date of termination to exercise vested options, at which time any unexercised options will expire. |
(16) | Mr. Lichstein’s employment terminated on October 6, 2017. Mr. Lichstein has a period of three months from the date of termination to exercise vested options, at which time any unexercised options will expire. |
(17) | Mr. Lichstein’s employment terminated on October 6, 2017. Mr. Lichstein has a period of five-years from the date of termination (not to exceed the expiration date for the grant) to exercise vested options, at which time any unexercised options will expire. |
(18) | Mr. Lichstein’s employment terminated on October 6, 2017. Mr. Lichstein has a period of one-year from the date of termination to exercise vested options, at which time any unexercised options will expire. |
Employment Arrangements
The terms and conditions of employment for each of our named executive officers are set forth in employee offer letters. These offer letters generally provide for payment of continued salary and health insurance premiums for certain periods following either a termination without cause or resignation for good reason (as defined in the applicable offer letter), in exchange for a release of claims. These offer letters also provide for accelerated vesting of specified equity awards and increased severance in the event the executive is terminated without cause or resigns for good reason within a specified period of time prior to or following a change in control transaction. Each of our named executive officers is an at will employee.
The amount and terms of these benefits reflect the negotiations of each of our named executive officers with us. We consider these severance and change in control benefits critical to attracting and retaining high caliber executives. We believe that appropriately structured severance benefits, including accelerated vesting provisions, minimize the distractions and reduce the risk that an executive voluntarily terminates his or her employment with us during times of uncertainty, such as before an acquisition is completed. We believe that our existing arrangements allow each named executive officer to focus on continuing normal business operations and, for change in control benefits, on the success of a potential business combination, rather than on how business decisions that may be in the best interest of our stockholders will impact his or her own financial security.
The amount and terms of these benefits reflect the negotiations of each of our named executive officers with us.
On September 20, 2017, we entered into a transition agreement with Adam Lichstein, our former President, Publisher Platforms. Pursuant to the transition agreement, Mr. Lichstein continued to serve in his role through October 6, 2017, at which time his employment terminated. The transition agreement provided, in accordance with the terms of the employment offer letter entered into between Mr. Lichstein and us, that Mr. Lichstein would receive the following post-termination benefits: (1) payment of his base salary for a period of 12 months from the termination date; (2) a pro-rated portion of his 2017 target bonus; and (3) paid COBRA coverage for up to 12 months from the termination date. Additionally, Mr. Lichstein was entitled to acceleration of 100% of the unvested shares subject to any stock option or restricted stock unit awards issued to him by us.
On August 7, 2017, in connection with the sale of our buyer platform, Lauren Wiener, our President, Buyer Platform, resigned her employment with us and entered into an employment agreement with the acquirer. Per the terms of her offer letter with us, we paid Ms. Wiener a one-time bonus of $150,000 upon closing of the transaction and a $100,000 retention bonus. In addition, we paid Ms. Wiener a pro-rated portion of her 2017 annual bonus target, in the amount of $179,178, and agreed to pro-rated vesting of restricted stock units held by her, for the current year vesting cycle, based on the number of days elapsed from the last vesting date.
95
The following table sets forth the current base salaries, 2018 bonus target, and a summary of the material severance and change in control arrangements with our named executive officers, other than Mr. Lichstein and Ms. Wiener:
Named Executive Officer | 2018 Salary and Bonus Target | Severance and Change in Control Benefits | ||
Mark Zagorski | Salary: $475,000 Bonus Target: $356,250(1) | If we terminate Ms. Zagorski’s employment for any reason other than for cause, death or disability or Mr. Zagorski resigns for good reason (a “Qualified Separation”), and he delivers a general release of claims to us and continues to comply with his confidentiality invention assignment agreement, Mr. Zagorski is entitled to receive the following severance benefits: (A) twelve months of continued salary; (B) a pro-rated portion of that year's target bonus and any earned but unpaid bonuses from prior periods; and (C) paid COBRA coverage for twelve months. Additionally, if Qualified Separation occurs during the period beginning on the date that is two months before a change in control and ending on the date that is twelve months following a change in control (the “change in control period”), Mr. Zagorski is entitled to acceleration of 100% of the unvested shares subject to his outstanding equity awards. If, during the term of Mr. Zagorski’s continuous service to the Company, a change in control is consummated, Mr. Zagorski will vest in an additional number of the shares underlying each stock option or restricted stock unit award issued by the Company as if he had provided an additional 12 months of continuous service with the Company as of closing of the change in control. As described in the table above, certain option awards issued to Mr. Zagorski are eligible for extended exercise windows post-termination in the event he is terminated without cause. | ||
John Rego | Salary: $465,000 Bonus Target: $235,000(1) | If Mr. Rego’s employment is terminated in connection with a Qualified Separation and he delivers a general release of claims to us and continues to comply with his confidentiality invention assignment agreement, Mr. Rego is entitled to receive the following severance benefits: (A) if the Qualified Separation occurs during the change in control period: (1) twelve months of continued salary; (2) a pro-rated portion of that year's target bonus; and (3) paid COBRA coverage for twelve months or (B) if the Qualified Separation occurs outside of the change in control period: (1) six months of continued salary; (2) a pro-rated portion of that year's target bonus; and (3) paid COBRA coverage for six months. If a Qualified Separation occurs within the change in control period, Mr. Rego is entitled to acceleration of 100% of the unvested shares subject to his outstanding equity awards. As described in the table above, certain option awards issued to Mr. Rego are eligible for extended exercise windows post-termination in the event he is terminated without cause. | ||
96
Katie Evans | Salary: $375,000 Bonus Target: $285,000 | If Ms. Evans’ employment is terminated in connection with a Qualified Separation and she delivers a general release of claims to us and continues to comply with her confidentiality invention assignment agreement, Ms. Evans is entitled to receive the following severance benefits: (A) if the Qualified Separation occurs during the change in control period: (1) twelve months of continued salary; (2) a pro-rated portion of that year's target bonus; and (3) paid COBRA coverage for twelve months or (B) if the Qualified Separation occurs outside of the change in control period: (1) six months of continued salary; (2) a pro-rated portion of that year's target bonus; and (3) paid COBRA coverage for six months. If a Qualified Separation occurs within the change in control period, Ms. Evans is entitled to acceleration of 100% of the unvested shares subject to her outstanding equity awards. | ||
(1) | In addition to an annual bonus opportunity, each of Mr. Zagorski and Mr. Rego are eligible to receive a bonus payment in the amount of $50,000 based on achievement of certain objectives. |
The definitions of "cause," "change in control," "disability" and "good reason" referenced above are defined in the individual offer letters with each of the named executive officers.
Annual Performance Bonus Plans
2018 Annual Bonus Plan
In 2018, Mr. Zagorski, Mr. Rego and Ms. Evans are eligible to earn annual performance bonuses pursuant to our 2018 bonus plan. The plan includes bonus targets based on the company’s achievement of Adjusted EBITDA and revenue goas, as well certain identified performance objectives. The amount of the bonus earned is determined based on defined criteria, allocation ranges and formulas approved by the compensation committee. With respect to financial goals, participants have the ability to receive additional bonus for performance in excess of these objectives capped at 150% of the target. Bonus targets for 2018 are set forth in the table above.
2017 Annual Bonus Plan
In 2017, Mr. Rego, Mr. Lichstein, Ms. Evans and Ms. Wiener were eligible to earn annual performance bonuses pursuant to our 2017 bonus plan. For 2017, Mr. Zagorski earned a guaranteed annual bonus in the amount of $356,250 per the terms of his offer letter.
The 2017 plan included bonus targets based on our achievement of total spend, net revenue and Adjusted EBITDA objectives. In addition, the plans for Mr. Lichstein and Ms. Wiener contained category specific revenue year-end objectives. The amount of the bonus earned was determined based on defined criteria, allocation ranges and formulas approved by the compensation committee. In August 2017, in connection with the sale of our buyer platform, the compensation committee approved changes to the financial targets and performance metrics in the 2017 bonus plan for the remainder of the year to reflect our revised business.
The individual target annual cash bonus opportunities for our named executive officers under the 2017 bonus plan were as follows: $300,000 for Ms. Wiener, $300,000 for Mr. Lichstein, $200,000 for Mr. Rego, and $215,000 for Ms. Evans. There was also an ability to receive additional bonus for performance in excess of these objectives capped at 150% or 200% of the target, depending on the applicable objective.
In February 2018, the compensation committee approved the following payments under the 2017 bonus plan: $230,830 for Ms. Evans and $214,725 for Mr. Rego. The amount of the bonus earned under the plan was determined based on defined criteria, allocation ranges and formulas approved by the compensation committee. For 2017, Mr. Lichstein and Ms. Wiener each received a pro-rata portion of their annual bonus target in connection with a termination of employment in the amount of $228,493 and $179,178, respectively.
Director Compensation
Our Board adopted a director compensation policy for non-employee directors, which became effective upon the closing of our initial public offering in July 2013. In adopting this policy, the Board reviewed the benchmark analysis that was prepared by Pay Governance. The policy was amended by our Board in April 2015, effective as of the date of our 2015 Annual Meeting of Stockholders, to adjust the allocation of compensation between cash and equity by increasing the annual cash component paid to directors from $30,000 to $55,000 with a corresponding decrease in the dollar value of annual equity-based awards from $100,000 to $75,000.
97
Pursuant to our policy, non-employee directors are compensated $55,000 annually for their services and do not receive any additional compensation for any regular board meeting attended. Our lead non-employee director receives an additional annual retainer of $20,000. Non-employee directors receive $5,000 annually for serving on the Audit Committee, Compensation Committee or Nominating and Corporate Governance committee. In addition, directors who are chairpersons of a particular committee also receive additional annual compensation of $15,000 for the Audit Committee, $10,000 for the Compensation Committee and $7,500 for the Nominating and Corporate Governance Committee. Non-employee directors are also reimbursed for their reasonable out-of-pocket expenses incurred in attending meetings of our Board. Non-employee directors are annually granted equity-based awards having an aggregate grant date fair value of $75,000 in the form of restricted stock units. Annual restricted stock unit grants will vest in full on the meeting date of the next annual stockholders' meeting following the grant provided the recipient continues to serve on the Board as of such date.
On June 2, 2017, the date of our 2017 Annual Meeting of Stockholders, we granted Messrs. Rossman, Lee, Caine, Thompson, Lam and Schechter restricted stock units having an aggregate grant date fair value of $75,000 based upon the closing price of our common stock on June 2, 2017, which grants vest in full on the date of our 2018 Annual Meeting provided that the recipient continues to serve on the Board as of such date. In connection with his appointment to the Board, on January 10, 2017, Mr. Thompson was granted restricted stock units representing 96,959 shares of our common stock. 12,571 of these restricted stock units vested in full on the date of the 2017 Annual Meeting and 84,388 of these restricted stock units vested in full on the first anniversary of the date of grant. On February 24, 2017, Ms. Lam was granted restricted stock units having an aggregate grant date fair value of $75,000, which grant vested in full on the date of our 2017 Annual Meeting.
2017 Director Compensation Table
The following table shows for the fiscal year ended December 31, 2017 certain information with respect to the compensation of our directors, other than Mr. Zagorski:
Name | Fees Earned or Paid in Cash ($) | Stock Awards(1)(2) ($) | Option Awards(2) ($) | Total ($) |
Rachel Lam | 45,000 | 150,000 | -- | 195.000 |
Warren Lee | 92,500 | 75,000 | -- | 167,500 |
Paul Caine(3) | 807,818 | 75,000 | -- | 882,818 |
James Rossman | 78,750 | 75,000 | -- | 153,750 |
Robert Schechter | 75,000 | 75,000 | -- | 150,000 |
Kevin Thompson(4) | 41,250 | 304,792 | -- | 346,042 |
(1) | This column reflects the full grant date fair value for restricted stock units granted during the year as measured pursuant to Accounting Standards Codification, or ASC, Topic 718 as stock-based compensation in our financial statements. The assumptions we used in valuing options are described in note 14 to our consolidated financial statements included in this Annual Report on Form 10-K. |
(2) | The table below shows the aggregate number of option and restricted stock unit awards outstanding for each of our non-employee directors as of December 31, 2017: |
Name | Aggregate Stock Awards Outstanding (#) | Aggregate Option Awards Outstanding (#) | ||
Rachel Lam | 32,467(a) | — | ||
Warren Lee | 32,467(a) | — | ||
Paul Caine | 32,467(a) | — | ||
James Rossman | 32,467(a) | 188,687(b) | ||
Robert Schechter | 32,467(a) | 41,666(c) | ||
Kevin Thompson | 116,855(d) | — | ||
(a) | All of the shares underlying this restricted stock unit award vest on the date of the 2018 Annual Meeting, subject to continued service to us through the vesting date. |
98
(b) | All of the shares underlying such option grants were fully vested as of December 31, 2017. |
(c) | All of the shares underlying such option grants were fully vested as of December 31, 2017. |
(d) | Includes 32,467 restricted stock units that vest on the date of the 2018 Annual Meeting and 84,388 restricted stock units that vest on January 10, 2018, in each case, subject to Mr. Thompson’s continued service. |
(3) | Mr. Caine has served as the Executive Chairman of the Board since July 2017. In this position, Mr. Caine currently receives a salary of $20,000 per month. In addition, as of each annual stockholders’ meeting, Mr. Caine will be granted an annual restricted unit award with a grant date fair market value of $75,000, which grant will vest in full on the date of the next annual stockholders’ meeting provided he continues to provide services to us on such date. Mr. Caine served as our Interim Chief Executive Officer from February 2017 to July 2017. In connection with his appointment, we entered into an offer letter with Mr. Caine, pursuant to which Mr. Caine was paid a one-time bonus of $86,000 and received a salary of $66,667 per month. Mr. Caine does not participate in our Non-Employee Director Compensation Plan. |
(4) | Mr. Thompson was appointed to the Board in January 2017. |
Compensation Committee Interlocks and Insider Participation
Our Compensation Committee consists of Messrs. Lee and Rossman. None of the members of our Compensation Committee has at any time during the past year been one of our officers or employees. None of our executive officers currently serves or in the prior year has served as a member of the Board or Compensation Committee of any entity that has one or more executive officers serving on our Board or Compensation Committee.
ITEM 12. SECURITY OWNERSHIP OF CERTAIN BENEFICIAL OWNERS AND MANAGEMENT AND RELATED STOCKHOLDER MATTERS
Security Ownership of Certain Beneficial Owners and Management
The following table sets forth certain information regarding the ownership of our common stock as of February 26, 2018 by: (i) each director and nominee for director; (ii) each of the current executive officers named in the Summary Compensation Table; (iii) all current executive officers and directors as a group; and (iv) all those known by the Company to be beneficial owners of more than five percent of its common stock.
Beneficial Ownership(1) | |||||||||||||||||
Name of Beneficial Owner | Shares | Percentage | |||||||||||||||
5% Stockholders: | |||||||||||||||||
Canaan VII L.P.(2) | 6,896,365 | 13.26 | |||||||||||||||
W Capital Partners II, L.P.(3) | 5,051,886 | 9.7 | |||||||||||||||
Masthead Venture Partners Capital, L.P.(4) | 4,281,001 | 8.2 | |||||||||||||||
Entities affiliated with Meritech Capital(5) | 3,103,129 | 6.0 | |||||||||||||||
Entities affiliated with General Catalyst Partners(6) | 3,360,859 | 6.5 | |||||||||||||||
Named Executive Officers and Directors: | |||||||||||||||||
Mark Zagorski | — | * | |||||||||||||||
John Rego(7) | 405,989 | * | |||||||||||||||
Katie Evans(8) | 140,108 | * | |||||||||||||||
Paul Caine | 119,947 | * | |||||||||||||||
Rachel Lam | 94,576 | * | |||||||||||||||
Warren Lee | 134,601 | * | |||||||||||||||
James Rossman(9) | 416,115 | * | |||||||||||||||
Robert Schechter(10) | 148,800 | * | |||||||||||||||
Kevin Thompson | 96,959 | * | |||||||||||||||
All current executive officers and directors as a group(11) (10 persons) | 1,557,095 | 3.0 | |||||||||||||||
* Represents beneficial ownership of less than 1%.
(1) | This table is based upon information supplied by current officers, directors and, in the case of principal stockholders, Schedules 13G filed with the SEC, which information may not be accurate as of February 26, 2018. The address of |
99
each executive officer and director listed on the table is c/o Telaria, Inc., 1501 Broadway, Suite 801, New York, New York 10036. We have determined beneficial ownership in accordance with the rules of the SEC. Except as indicated by the footnotes below, we believe, based on the information furnished to us, that the executive officers and directors named in the table above have sole voting and investment power with respect to all shares of common stock that they beneficially own, subject to applicable community property laws. Applicable percentages are based on 52,017,481 shares outstanding on February 26, 2018, adjusted as required by rules promulgated by the SEC.
(2) | Consists of 6,896,365 shares held by Canaan VII L.P. Canaan Partners VII LLC is the sole general partner of Canaan VII L.P and may be deemed to beneficially own the shares held by Canaan VII L.P. The principal business address of Canaan VII L.P. is 285 Riverside Avenue, Ste. 250, Westport, CT 06889. |
(3) | Consists of 5,051,886 shares held by W Capital Partners II, L.P. The sole general partner of W Capital Partners II, L.P. is WCP GP II, L.P, and the sole general partner of WCP GP II, L.P. is WCP GP II, LLC. These entities may be deemed to beneficially own the shares held by W Capital Partners II, L.P. The principal business address of W Capital Partners is 400 Park Avenue, Suite 910, New York, NY 10022. |
(4) | Consists of 4,281,001 shares held by Masthead Venture Partners Capital, L.P. Masthead Fund General Partner, LLC, the general partner of Masthead Venture Partners Capital, L.P., may be deemed to have sole voting and dispositive power with respect to the shares held by Masthead Venture Partners Capital, L.P. The managing members of Masthead Fund General Partner, LLC are Braden Bohrmann, Daniel Flatley, Richard Levandov, Brian Owen, and Stephen Smith. These individuals may be deemed to have shared voting and dispositive power with respect to the shares held by this entity. The principal business address of Masthead Venture Partners is 55 Cambridge Parkway Suite 103, Cambridge, MA 02142. |
(5) | Consists of 3,047,580 shares held by Meritech Capital Partners III L.P. (“MCP III”) and 55,549 shares held by Meritech Capital Affiliates III L.P. (“MC AFF III”). Meritech Capital Associates III L.L.C. (“MCA III”) is the general partner of each of MCP III and MC AFF III, and may be deemed to have sole voting and dispositive power with respect to the shares directly owned by MCP III and MC AFF III. Meritech Management Associates III L.L.C. (“MMA III”) is a managing member of MCA III and may be deemed to have sole voting and dispositive power with respect to the shares s directly owned by MCP III and MC AFF III. Paul S. Madera, Michael B. Gordon, Robert D. Ward and George H. Bischof are managing members of MMA III and may be deemed to have shared voting and dispositive power with respect to the shares directly owned by MCP III and MC AFF III. The principal business address of Meritech Capital is 245 Lytton Avenue, Suite 350, Palo Alto, CA 94301. |
(6) | Consists of 3,273,997 shares held by General Catalyst Group IV, L.P. and 86,862 shares held by GC Entrepreneurs Fund IV, L.P. General Catalyst Partners IV, L.P. is the sole general partner of each of General Catalyst Group IV, L.P. and GC Entrepreneurs Fund IV, L.P. and may be deemed to beneficially own the shares held by such entities. General Catalyst GP IV, LLC is the sole general partner of General Catalyst Partners IV, L.P. and may be deemed to beneficially own the shares held by General Catalyst Group IV, L.P. and GC Entrepreneurs Fund IV, L.P. David Fialkow, David Orfao and Joel Cutler are managing directors of General Catalyst GP IV, LLC and may be deemed to beneficially own the shares held by these entities. The principal business address of General Catalyst is 20 University Road, Suite 450, Cambridge, MA 02138. |
(7) | Includes 368,125 shares of common stock underlying options that are vested and exercisable within 60 days of February 21, 2018. |
(8) | Includes 41,383 shares of common stock underlying options that are vested and exercisable within 60 days of February 21, 2018. |
(9) | Includes 188,687 shares of common stock underlying options that are vested and exercisable within 60 days of February 21, 2018. |
(10) | Includes 41,666 shares of common stock underlying options that are vested and exercisable within 60 days of February 21, 2018. |
(11) | Consists of the shares listed in the table above for directors and named executive officers. |
Equity Compensation Plan Information
The following table provides certain information with respect to all of the Company’s equity compensation plans in effect as of December 31, 2017.
100
Equity Compensation Plan Information | ||||
Plan Category | Number of securities to be issued upon exercise of outstanding options, warrants and rights (a) | Weighted-average exercise price of outstanding options, warrants and rights | Number of securities remaining available for issuance under equity compensation plans(1) (excluding securities reflected in column (a)) | |
Equity compensation plans approved by security holders | 8,829,434 | $4.13 | 5,486,155 | |
Equity compensation plans not approved by security holders | 1,781,441 | $2.15 | -- | |
Total | 10,610,875 | $3.63 | ||
(1) | Includes 4,484,497 shares of common stock available for future issuance pursuant to our 2013 Equity Incentive Plan, or the 2013 Plan, and 1,001,658 shares of common stock available for future issuance pursuant to our 2014 Employee Stock Purchase Plan. The number of shares reserved for issuance under our 2013 Plan will automatically increase on January 1 of each year, for a period of ten years, beginning on January 1, 2014 and continuing through and including January 1, 2023, by the lesser of 4.00% of the total number of shares of common stock outstanding on the immediately preceding December 31, or such number of shares determined by our Board. Pursuant to the terms of the 2013 Plan, an additional 2,051,621 shares of common stock were added to the number of shares reserved for issuance under the 2013 Plan, effective January 1, 2018. |
The following equity compensation plans that were in effect as of December 31, 2017 were adopted without the approval of our security holders:
• | On September 8, 2015, we granted John Rego, our Chief Financial Officer, options to purchase 570,000 shares of our common stock at an exercise price of $1.94 per share, the closing price of our common stock on the date of grant. |
• | On September 26, 2016, we granted Jennifer Catto, our Chief Marketing Officer, options to purchase 125,000 shares of our common stock at an exercise price of $1.58 per share, the closing price of our common stock on the date of grant. |
• | On July 10, 2017 we granted Mark Zagorski, our Chief Executive Officer, options to purchase 900,000 shares of our common stock at an exercise price of $2.36 per share and restricted stock units covering 186,440 shares. |
Each of the above grants were made outside of our stockholder approved equity compensation plans in reliance on the employment inducement exception to shareholder approval under Section 303A.08 of the NYSE Listed Company Manual. The grants are generally subject to the same terms and conditions as awards granted under the 2013 Plan.
ITEM 13. CERTAIN RELATIONSHIPS AND RELATED TRANSACTIONS AND DIRECTOR INDEPENDENCE
Related-Person Transactions policy and Procedures
We have adopted a written related person transaction policy that sets forth our procedures for the identification, review, consideration and approval or ratification of related person transactions. For purposes of our policy only, a related person transaction is a transaction, arrangement or relationship, or any series of similar transactions, arrangements or relationships, in which we and any related person are, were or will be participants in which the amount involved exceeds $120,000. Transactions involving compensation for services provided to us as an employee or director are not covered by this policy. A related person is any executive officer, director or beneficial owner of more than 5% of any class of our voting securities, including any of their immediate family members and any entity owned or controlled by such persons.
Under the policy, if a transaction has been identified as a related person transaction, including any transaction that was not a related person transaction when originally consummated or any transaction that was not initially identified as a related person transaction prior to consummation, our management must present information regarding the related person transaction to our audit committee, or, if audit committee approval would be inappropriate, to another independent body of our Board, for review, consideration and approval or ratification. The presentation must include a description of, among other things, the material facts, the interests, direct and indirect, of the related persons, the benefits to us of the transaction and whether the transaction is
101
on terms that are comparable to the terms available to or from, as the case may be, an unrelated third party or to or from employees generally. Under the policy, we will collect information that we deem reasonably necessary from each director, executive officer and, to the extent feasible, significant stockholder to enable us to identify any existing or potential related-person transactions and to effectuate the terms of the policy. In addition, under our Code of Business Conduct and Ethics, our employees and directors have an affirmative responsibility to disclose any transaction or relationship that reasonably could be expected to give rise to a conflict of interest.
In considering related person transactions, our audit committee, or other independent body of our Board, will take into account the relevant available facts and circumstances including, but not limited to:
• | the risks, costs and benefits to us; |
• | the impact on a director's independence in the event that the related person is a director, immediate family member of a director or an entity with which a director is affiliated; |
• | the availability of other sources for comparable services or products; and |
• | the terms available to or from, as the case may be, unrelated third parties or to or from employees generally. |
The policy requires that, in determining whether to approve, ratify or reject a related person transaction, our audit committee, or other independent body of our Board, must consider, in light of known circumstances, whether the transaction is in, or is not inconsistent with, our best interests and those of our stockholders, as our audit committee, or other independent body of our Board, determines in the good faith exercise of its discretion.
Certain of the transactions described below under “Certain Related-Person Transactions” were entered into prior to the adoption of the written policy, but all were approved by our Board considering similar factors to those described above.
Certain Related-Person Transactions
Other than compensation arrangements, we describe below transactions and series of similar transactions, since January 1, 2017, to which we were a party or will be a party, in which:
• | the amounts involved exceeded or will exceed $120,000; and |
• | any of our directors, executive officers or holders of more than 5% of our capital stock; or any member of the immediate family of the foregoing persons, had or will have a direct or indirect material interest. |
Compensation arrangements for our directors and named executive officers are described elsewhere in this proxy statement.
Indemnification
Our certificate of incorporation contains provisions limiting the liability of directors, and our bylaws provide that we will indemnify each of our directors to the fullest extent permitted under Delaware law. Our certificate of incorporation and bylaws also provide our Board with discretion to indemnify our officers and employees when determined appropriate by the Board. We have entered into indemnity agreements with certain officers and directors which provide, among other things, that we will indemnify such officer or director, under the circumstances and to the extent provided for therein, for expenses, damages, judgments, fines and settlements he or she may be required to pay in actions or proceedings which he or she is or may be made a party by reason of his or her position as a director, officer or other agent of ours, and otherwise to the fullest extent permitted under Delaware law and our bylaws.
Independence of The Board
As required under the NYSE listing standards, a majority of the members of a listed company’s board of directors must qualify as “independent,” as affirmatively determined by the board of directors. The Board consults with our counsel to ensure that the Board’s determinations are consistent with relevant securities and other laws and regulations regarding the definition of “independent,” including those set forth in pertinent listing standards of the NYSE, as in effect from time to time.
Consistent with these considerations, after review of all relevant identified transactions or relationships between each director, or any of his or her family members, and us, our senior management and our independent auditors, the Board has affirmatively determined that the following directors are independent directors within the meaning of the applicable NYSE listing standards and our Corporate Governance Guidelines: Mr. Rossman, Ms. Lam, Mr. Lee, Mr. Thompson and Mr.
102
Schechter. In making this determination, the Board found that none of these directors or nominees for director had a material or other disqualifying relationship with us. Messrs. Zagorski and Caine are not considered independent because they currently serve as our Chief Executive Officer and Executive Chairman, respectively.
ITEM 14. PRINCIPAL ACCOUNTING FEES AND SERVICES
Principal Accounting Fees and Services
The following table represents aggregate fees billed to the Company for the fiscal years ended December 31, 2017 and 2016 by Ernst & Young LLP, the Company's principal accountant.
Fiscal Year Ended | ||||||||
(in thousands) | 2017 | 2016 | ||||||
Audit fees(1) | $ | 1,391 | $ | 1,021 | ||||
Audit-related fees(2) | 5 | — | ||||||
All other fees(3) | 3 | 2 | ||||||
Total fees | $ | 1,399 | $ | 1,023 | ||||
(1) | For both fiscal years ended 2017 and 2016, audit fees represents fees for audit services rendered in connection with the audit of our consolidated financial statements. |
(2) | Represents fees for services rendered in connection with becoming Sarbanes Oxley compliant. |
(3) | Fee for the use of Ernst & Young’s Accounting Research portal. |
All fees described above were pre-approved by the Audit Committee.
In connection with the audit of the 2017 and 2016 financial statements, the Company entered into an engagement agreement with Ernst & Young LLP that sets forth the terms by which Ernst & Young LLP will perform audit services for the Company.
Pre-Approval Policies and Procedures
The Audit Committee has adopted a policy and procedures for the pre-approval of audit and non-audit services rendered by the Company’s independent registered public accounting firm, Ernst & Young LLP. The policy generally pre-approves specified services in the defined categories of audit services, audit-related services and tax services up to specified amounts. Pre-approval may also be given as part of the Audit Committee’s approval of the scope of the engagement of the independent auditor or on an individual, explicit, case-by-case basis before the independent auditor is engaged to provide each service. The pre-approval of services may be delegated to one or more of the Audit Committee’s members, but the decision must be reported to the full Audit Committee at its next scheduled meeting.
PART IV
ITEM 15. EXHIBITS, FINANCIAL STATEMENT SCHEDULES
(a)
1. Consolidated Financial Statements: Our consolidated financial statements are listed in the “Index to Consolidated Financial Statements” included in Part II, Item 8 of this Annual Report on Form 10-K.
2. Financial Statement Schedules: All financial statement schedules have been omitted because they are not applicable or the required information is shown in the Consolidated Financial Statements or Notes thereto.
103
3. Exhibits: See the Exhibit Index immediately following the signature page of this Annual Report on Form 10-K.
104
SIGNATURES
Pursuant to the requirements of the Section 13 or 15(d) of the Securities Exchange Act of 1934, the Registrant has duly caused this Annual Report on Form 10-K to be signed on its behalf by the undersigned, thereunto duly authorized on March 1, 2018.
TELARIA, INC. | ||
By: | /s/ Mark Zagorski | |
Mark Zagorski | ||
Chief Executive Officer | ||
Date: March 1, 2018 | ||
By: | /s/ John Rego | |
John Rego | ||
Chief Financial Officer | ||
Date: March 1, 2018 | ||
105
POWER OF ATTORNEY
KNOW ALL PERSONS BY THESE PRESENTS, that each person whose signature appears below constitutes and appoints Paul Caine, John Rego and Aaron Saltz, and each of them, as his true and lawful agent, proxy and attorney-in-fact, with full power of substitution and resubstitution, for him and in his name, place, and stead, in any and all capacities, to sign any and all amendments to this Annual Report on Form 10-K, and to file the same, with all exhibits thereto, and other documents in connection therewith, with the Securities and Exchange Commission, granting unto said agents, proxies and attorneys-in-fact, and each of them, full power and authority to do and perform each and every act and thing requisite and necessary to be done in connection therewith, as fully to all intents and purposes as he might or could do in person, hereby ratifying and confirming that all said agents, proxies and attorneys-in-fact, or any of them or their or his substitute or substitutes, may lawfully do or cause to be done by virtue hereof.
Pursuant to the requirements of the Securities Exchange Act of 1934, this Annual Report on Form 10-K has been signed below by the following persons on behalf of the Registrant and in the capacities and on the dates indicated:
Signature | Title | Date | ||
/s/ Mark Zagorski | ||||
Mark Zagorski | Chief Executive Officer and Director (Principal Executive Officer) | March 1, 2018 | ||
/s/ John Rego | ||||
John Rego | Chief Financial Officer (Principal Accounting and Financial Officer) | March 1, 2018 | ||
/s/ Paul Caine | Director | March 1, 2018 | ||
Paul Caine | ||||
/s/ Rachel Lam | ||||
Rachel Lam | Director | March 1, 2018 | ||
/s/ Warren Lee | ||||
Warren Lee | Director | March 1, 2018 | ||
/s/ James Rossman | ||||
James Rossman | Director | March 1, 2018 | ||
/s/ Robert Schechter | ||||
Robert Schechter | Director | March 1, 2018 | ||
/s/ Kevin Thompson | ||||
Kevin Thompson | Director | March 1, 2018 | ||
106
Exhibit Index
The agreements set forth on this Exhibit Index may contain representations and warranties by each of the parties to the applicable agreement. These representations and warranties were made solely for the benefit of the other parties to the applicable agreement and:
• | were not intended to be treated as categorical statements of fact, but rather as a way of allocating the risk to one of the parties if those statements prove to be inaccurate; |
• | may have been qualified in such agreements by disclosures that were made to the other party in connection with the negotiation of the applicable agreement; |
• | may apply contract standards of “materiality” that are different from “materiality” under the applicable security laws; and |
• | were made only as of the date of the applicable agreement or such other date or dates as may be specified in the agreement. |
The Company acknowledges that notwithstanding the inclusion of the foregoing cautionary statements, it is responsible for considering whether additional specific disclosures of material information regarding material contractual provisions are required to make the statements in this Form 10-K not misleading. Additional information about the Company may be found elsewhere in this Annual Report on Form 10-K and the Company’s other public filings, which are available without charge through the SEC’s website at http://www.sec.gov. See “Available Information” under Item 1 of Part I.
Incorporated by Reference | Filed | |||||||||||
Exhibit No. | Description of Exhibit | Form | File No. | Exhibit | Filing Date | Herewith | ||||||
2.1 | 8-K | 001-35982 | 2.1 | 8/8/2017 | ||||||||
3.1 | S-3 | 333-221374 | 3.1 | 11/6/2017 | ||||||||
3.2 | S-1/A | 333-188813 | 3.4 | 6/14/2013 | ||||||||
4.1 | S-3 | 333-188813 | 4.2 | 11/6/2017 | ||||||||
10.1 | 10-K | 001-35982 | 10.2 | 3/10/2017 | ||||||||
10.2 | First Amendment to the Amended and Restated Loan and Security Agreement, dated January 26, 2018, by and between the Registrant and the Silicon Valley Bank. | X | ||||||||||
10.3 | S-1 | 333-188813 | 10.3 | 5/23/2013 | ||||||||
10.4+ | S-1 | 333-188813 | 10.4 | 5/23/2013 | ||||||||
10.5+ | S-1 | 333-188813 | 10.5 | 5/23/2013 | ||||||||
10.6+ | S-1 | 333-188813 | 10.6 | 5/23/2013 | ||||||||
10.7+ | S-1 | 333-188813 | 10.7 | 5/23/2013 | ||||||||
10.8+ | S-1 | 333-188813 | 10.8 | 5/23/2013 | ||||||||
107
10.9+ | S-1 | 333-188813 | 10.9 | 5/23/2013 | ||||||||
10.10+ | S-1 | 333-188813 | 10.10 | 5/23/2013 | ||||||||
10.11+ | S-1 | 333-188813 | 10.11 | 5/23/2013 | ||||||||
10.12+ | Form of 2013 Equity Incentive Plan as amended. | Proxy | 001-35982 | App. A | 4/15/2013 | |||||||
10.13+ | S-1/A | 333-188813 | 10.13 | 6/14/2013 | ||||||||
10.14+ | S-1/A | 333-188813 | 10.14 | 6/14/2013 | ||||||||
10.15+ | S-1/A | 333-188813 | 10.15 | 6/14/2013 | ||||||||
10.16+ | S-1/A | 333-188813 | 10.16 | 6/14/2013 | ||||||||
10.17+ | 10-K | 001-35982 | 10.17 | 3/10/2017 | ||||||||
10.19+ | S-1 | 333-188813 | 10.19 | 5/23/2013 | ||||||||
10.24* | 10-K | 001-35982 | 10.25 | 3/16/2015 | ||||||||
10.25* | 10-Q | 001-35982 | 10.1 | 5/10/2016 | ||||||||
10.26* | X | |||||||||||
10.27+ | 10-Q | 001-35982 | 10.1 | 8/9/2017 | ||||||||
10.28+ | 10-Q | 001-35982 | 10.2 | 5/10/2017 | ||||||||
10.29+ | 10-Q | 001-35982 | 10.5 | 5/10/2017 | ||||||||
10.30+ | 10-Q | 001-35982 | 10.6 | 5/10/2017 | ||||||||
10.31+ | 10-Q | 001-35982 | 10.1 | 11/9/2017 | ||||||||
10.32+ | X | |||||||||||
10.33+ | X | |||||||||||
21.1 | X | |||||||||||
108
23.1 | X | |||||||||||
24.1 | X | |||||||||||
31.1 | X | |||||||||||
31.2 | X | |||||||||||
32.1† | X | |||||||||||
32.2† | X | |||||||||||
101.INS | XBRL Instance Document. | X | ||||||||||
101.SCH | XBRL Taxonomy Extension Schema. | X | ||||||||||
101.CAL | XBRL Taxonomy Extension Calculation Linkbase. | X | ||||||||||
101.DEF | XBRL Taxonomy Extension Definition Linkbase. | X | ||||||||||
101.LAB | XBRL Taxonomy Extension Labels Linkbase. | X | ||||||||||
101.PRE | XBRL Taxonomy Extension Presentation Linkbase. | X | ||||||||||
+ Indicates management contract or compensatory plan.
† In accordance with Item 601(b)(32)(ii) of Regulation S-K and SEC Release Nos. 33-8238 and 34-47986, Final Rule: Management’s Reports on Internal Control Over Financial Reporting and Certification of Disclosure in Exchange Act Periodic Reports, the certifications furnished in Exhibits 32.1 and 32.2 hereto are deemed to accompany this Annual Report on Form 10-K and will not be deemed “filed” for purpose of Section 18 of the Securities Exchange Act of 1934, as amended. Such certifications will not be deemed to be incorporated by reference into any filing under the Securities Act of 1933, as amended, or the Securities Exchange Act of 1934, as amended, except to the extent that the registrant specifically incorporates it by reference.
* Certain portions of this exhibit omitted and filed separately with the U.S. Securities and Exchange Commission pursuant to a request for confidential treatment.
109