Attached files
| file | filename |
|---|---|
| EX-10.21 - EXHIBIT 10.21 - MINDBODY, Inc. | exhibit1021_12-31x2017.htm |
| EX-32.2 - EXHIBIT 32.2 - MINDBODY, Inc. | exhibit_322x12-31x2017.htm |
| EX-32.1 - EXHIBIT 32.1 - MINDBODY, Inc. | exhibit_321-12x31x2017.htm |
| EX-31.2 - EXHIBIT 31.2 - MINDBODY, Inc. | exhibit_312x12-31x2017.htm |
| EX-31.1 - EXHIBIT 31.1 - MINDBODY, Inc. | exhibit_311x12-31x2017.htm |
| EX-23.1 - EXHIBIT 23.1 - MINDBODY, Inc. | exhibit_231x12-31x2017.htm |
| EX-21.1 - EXHIBIT 21.1 - MINDBODY, Inc. | exhibit_211x12-31x2017.htm |
| EX-10.14 - EXHIBIT 10.14 - MINDBODY, Inc. | exhibit1014_12-31x2017.htm |
| EX-10.12 - EXHIBIT 10.12 - MINDBODY, Inc. | exhibit1012_12-31x2017.htm |
| EX-10.3 - EXHIBIT 10.3 - MINDBODY, Inc. | exhibit103_12-31x2017.htm |
UNITED STATES
SECURITIES AND EXCHANGE COMMISSION
Washington, D.C. 20549
FORM 10-K
(Mark One)
ý | ANNUAL REPORT PURSUANT TO SECTION 13 OR 15(d) OF THE SECURITIES EXCHANGE ACT OF 1934 |
For the fiscal year ended December 31, 2017
OR
o | TRANSITION REPORT PURSUANT TO SECTION 13 OR 15(d) OF THE SECURITIES EXCHANGE ACT OF 1934 |
For the transition period from _________ to _________
Commission File Number 001-37453
MINDBODY, INC.
(Exact name of registrant as specified in its charter)
Delaware | 20-1898451 |
(State or other jurisdiction of incorporation or organization) | (I.R.S. Employer Identification No.) |
4051 Broad Street, Suite 220 San Luis Obispo, CA | 93401 |
(Address of principal executive offices) | (Zip Code) |
Registrant’s telephone number, including area code: (877) 755-4279
Securities registered pursuant to Section 12(b) of the Act:
Title of each class | Name of each exchange on which registered |
Class A Common Stock, par value $0.000004 per share | NASDAQ Stock Market LLC (NASDAQ Global Market) |
Securities registered pursuant to Section 12(g) of the Act: None
Indicate by check mark if the registrant is a well-known seasoned issuer, as defined in Rule 405 of the Securities Act. Yes ý No o
Indicate by check mark if the registrant is not required to file reports pursuant to Section 13 or 15(d) of the Act. Yes o No ý
Indicate by check mark whether the registrant (1) has filed all reports required to be filed by Section 13 or 15(d) of the Securities Exchange Act of 1934 during the preceding 12 months (or for such shorter period that the registrant was required to file such reports), and (2) has been subject to such filing requirements for the past 90 days. Yes ý No ¨
Indicate by check mark whether the registrant has submitted electronically and posted on its corporate Web site, if any, every Interactive Data File required to be submitted and posted pursuant to Rule 405 of Regulation S-T (§232.405 of this chapter) during the preceding 12 months (or for such shorter period that the registrant was required to submit and post such files). Yes ý No o
Indicate by check mark if disclosure of delinquent filers pursuant to Item 405 of Regulation S-K (§229.405 of this chapter) is not contained herein, and will not be contained, to the best of registrant’s knowledge, in definitive proxy or information statements incorporated by reference in Part III of this Form 10-K or any amendment to this Form 10-K. o
Indicate by check mark whether the registrant is a large accelerated filer, an accelerated filer, a non-accelerated filer, smaller reporting company, or an emerging growth company. See the definitions of “large accelerated filer,” “accelerated filer,” “smaller reporting company,” and “emerging growth company” in Rule 12b-2 of the Exchange Act.
Large accelerated filer | x | Accelerated filer | ¨ | |||
Non-accelerated filer | ¨ (Do not check if a smaller reporting company) | Smaller reporting company | ¨ | |||
Emerging growth company | o | |||||
If an emerging growth company, indicate by check mark if the registrant has elected not to use the extended transition period for complying with any new or revised financial accounting standards provided pursuant to Section 13(a) of the Exchange Act. o
Indicate by check mark whether the registrant is a shell company (as defined in Rule 12b-2 of the Act). Yes o No ý
As of June 30, 2017 (the last business day of the registrant’s most recently completed second fiscal quarter), the aggregate market value of shares of Class A common stock and Class B common stock held by non-affiliates of the registrant was approximately $1,010,860,000.
As of February 22, 2018, the registrant had 43,268,897 shares of Class A common stock, and 3,872,725 shares of Class B common stock outstanding.
DOCUMENTS INCORPORATED BY REFERENCE
The information required by Part III of this Annual Report on Form 10-K, to the extent not set forth herein, is incorporated by reference from the registrant’s definitive proxy statement relating to the registrant’s Annual Meeting of Stockholders to be held in 2018. Such definitive proxy statement will be filed with the Securities and Exchange Commission within 120 days after the end of the fiscal year to which this Annual Report on Form 10-K relates.
Table of Contents
Page | ||
F-1 | ||
SPECIAL NOTE REGARDING FORWARD-LOOKING STATEMENTS
This Annual Report on Form 10-K contains forward-looking statements within the meaning of the federal securities laws. Forward-looking statements generally relate to future events or our future financial or operating performance. In some cases, you can identify forward-looking statements because they contain words such as “may,” “will,” “should,” “expects,” “plans,” “anticipates,” “could,” “intends,” “target,” “projects,” “contemplates,” “believes,” “estimates,” “predicts,” “potential,” “possible,” “continue” or the negative of these words or other similar terms or expressions that concern, among other things, our expectations, strategy, plans or intentions. We have based the forward-looking statements contained in this Annual Report on Form 10-K primarily on our current expectations and projections about future events and trends that we believe may affect our business, financial condition, results of operations and prospects. Forward-looking statements contained in this Annual Report on Form 10-K include, but are not limited to, statements about:
• | our ability to grow revenue by adding new customers, retaining and deepening relationships with existing customers, growing our consumer user base and increasing transaction volume across our two-sided marketplace of wellness; |
• | our ability to timely and effectively scale and adapt our existing technology; |
• | the effects of the evolving regulatory framework for privacy, security and data protection on our platform; |
• | the effects of price increases; |
• | benefits associated with use of our products and services; |
• | our ability to develop or acquire new products and services, improve our existing products and services and increase the value of our products and services; |
• | the network effects associated with our business; |
• | our ability to maintain our revenue growth rate; |
• | our future financial performance, including expectations regarding trends in revenue, cost of revenue, operating expenses, other income and expenses, income taxes; |
• | our future key metric performance; |
• | our ability to further develop strategic relationships, including our ability to increase or maintain our revenue from our API and technology partners; |
• | our ability to strengthen or maintain partnerships with payment processors; |
• | the security of our platform and the protection of data on our platform; |
• | our ability to achieve positive returns on investments; |
• | our plans to further invest in and grow our business, including investment in research and development, sales and marketing, the development of our customer and consumer support teams and our data center infrastructure, and our ability to effectively manage our growth and associated investments; |
• | our ability to successfully identify, acquire and integrate companies (including FitMetrix, Inc.) and assets; |
• | our expectations relating to our acquisition of FitMetrix, Inc.; |
• | the sufficiency of our cash and cash equivalents, cash generated from operations or equity debt financing activities to meet requirements for working capital and capital expenditures; |
• | the effects of seasonal trends on our operating results; |
• | our ability to attract and retain senior management, qualified employees and key personnel; |
• | our ability to successfully enter new markets and manage our international expansion; and |
• | our ability to maintain, protect and enhance our intellectual property and not infringe upon others’ intellectual property. |
We caution you that the foregoing list may not contain all of the forward-looking statements made in this Annual Report on Form 10-K. You should not rely upon forward-looking statements as predictions of future events. The outcomes of the events described in these forward-looking statements are subject to substantial risks, uncertainties and other factors described in Part I, Item 1A, Risk Factors, and elsewhere, in this Annual Report on Form 10-K. Moreover, we operate in a very competitive and rapidly changing environment. New risks and uncertainties emerge from time to time and it is not possible for us to predict all risks and uncertainties that could have an impact on the forward-looking statements contained in this Annual Report on Form 10-K. We cannot assure you that the results, events and circumstances reflected in the forward-looking statements will be achieved or occur, and actual results, events or circumstances could differ materially from those described in the forward-looking statements.
The forward-looking statements made in this Annual Report on Form 10-K relate only to events as of the date on which the statements are made. We undertake no obligation to update any forward-looking statements made in this Annual Report on Form 10-K to reflect events or circumstances after the date of this Annual Report on Form 10-K or to reflect new information or the occurrence of unanticipated events, except as required by law. We may not actually achieve the plans, intentions or expectations disclosed in our forward-looking statements and you should not place undue reliance on our forward-looking statements. Our forward-looking statements do not reflect the potential impact of any future acquisitions, mergers, dispositions, joint ventures or investments we may make.
1
GLOSSARY
To assist you in reading this Annual Report on Form 10-K, we have provided definitions of some of the terms and acronyms that we use:
“Active consumer” - As of a given date, the estimated number of unique clients of our customers’ services who have used our platform to transact with our customers during the two years ending on such date.
“API” - Application programming interface.
“app” - Application.
“ARPS” - Average monthly revenue per subscriber.
“Client” - A consumer who has chosen to purchase services from a customer's business.
“Consumer” - Any person who may purchase wellness services.
“Customer” - A business owner who has one or more subscriber locations or individual practitioners who have an active subscription to our platform.
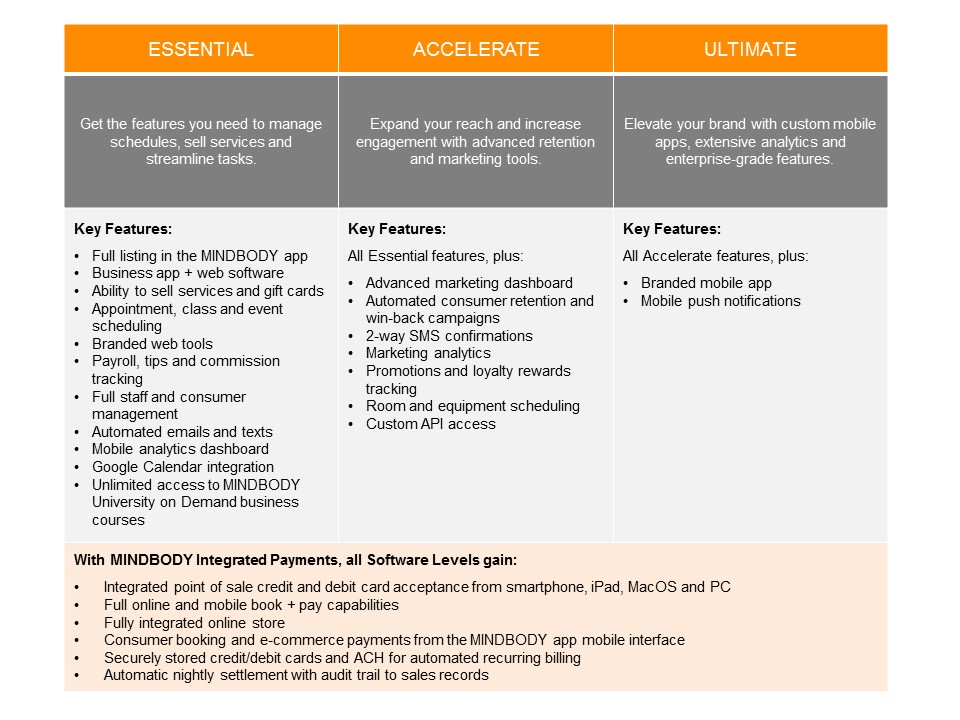
“High Value Subscriber” - A customer on our Starter, Pro, Accelerate or Ultimate software level, and commencing in 2018, also includes customers on our Essential software level.
“Subscriber” - This is one of our key metrics and is defined as unique physical locations or individual practitioners who have active subscriptions to our platform as of the end of the period.
“The app” or “The MINDBODY app” - The MINDBODY app, our consumer-facing mobile application.
“Wellness Practitioner” or “Practitioner” - Generally, staff members, instructors, trainers and stylists, and specifically where discussed as a number, those staff members, instructors, trainers and stylists with one or more bookings on our platform in the last month of the applicable period.
2
PART I
Item 1. Business.
Our Purpose
Our purpose is to help people lead healthier, happier lives by connecting the world to wellness.
This purpose defines our growth strategy and priorities. Our primary objective is growing a transaction-enabled wellness marketplace by adding high quality wellness businesses to our platform, deepening relationships with the existing businesses we serve and rapidly increasing consumer awareness, adoption and engagement.
Overview
We are the leading provider of cloud-based business management software for the wellness services industry and a rapidly growing marketplace for wellness services. As of December 31, 2017, our customers employed over 372,000 wellness practitioners serving approximately 41 million consumers in more than 100 countries. Our integrated software and payments platform helps wellness business owners run, market and build their businesses, while engaging consumers by aggregating available classes and appointments, and enabling rapid discovery, booking and payment. Together, our cloud-based business and consumer software platform comprise a two-sided marketplace, enabling market innovations such as targeted introductory offers and dynamic pricing that simultaneously increases consumer engagement and wellness business capacity utilization.
We were founded in 2001 with a mission to leverage technology to improve the wellness of the world by addressing the vast and growing demand for wellness services by providing innovative business management software and consumer booking tools. We started as a hybrid desktop-web solution focused on yoga, Pilates and indoor cycling businesses. In 2005, we released MINDBODY Online, our software-as-a-service, or SaaS, platform, and began to scale our business into adjacent fitness categories, increasing our total addressable market and fueling growth in consumer online bookings. In 2009, we released MINDBODY Finder, enabling available classes and appointments to be aggregated for consumer search, and an open web services application programming interface, or API, that enabled other developers to build solutions on our platform. In 2013, we launched our MINDBODY Express mobile application for businesses and our MINDBODY Connect application for consumers, establishing our transaction-enabled wellness marketplace. In 2015, we redesigned MINDBODY Connect and re-released it as “The MINDBODY App,” following which we saw a substantial inflection in consumer discovery, bookings and purchases. Over the course of our history, we have consistently made significant investments in our platform to enable increased business penetration and consumer adoption of our two-sided marketplace.
Through our integrated cloud-based business management software and payments platform, we enable our customers to easily manage class and appointment schedules, staff members, client information, online bookings, inventory, payroll and retail sales - all in a cost-effective manner. We also offer advanced marketing and client retention capabilities to help businesses acquire and retain their clients, and analytics capabilities to help them strengthen their businesses and manage future growth. At the same time, we connect consumers with local businesses through the MINDBODY app, which powers a mobile interface that allows consumers to discover, evaluate, book and pay for wellness services, whether they are near their homes or traveling. The MINDBODY app also provides these consumers a unified account that allows them to: access and manage multiple wellness services with one sign-in; see their aggregated schedule and histories with multiple wellness businesses; store multiple credit cards for instant payment; read authentic consumer reviews written by people who actually attended the classes or services; find targeted introductory offers to introduce them to new wellness activities; and view and book offers for dynamically-priced classes to increase their opportunities to engage in wellness. All of this functionality is designed to encourage consumers to more actively participate in wellness and help our customers fill their classes and ultimately be more successful.
The MINDBODY Solution
Our integrated cloud-based business management software and payments platform is specifically designed to engage both wellness services businesses and consumers through a powerful two-sided marketplace. We offer business management solutions that power our customers’ transactions and interactions with consumers, connecting them with millions of people who are seeking these types of services and creating a seamless relationship between practitioners and the clients they serve. We target boutique fitness, salon, spa and integrative health businesses within the wellness services industry.
3
Integrated Software and Payments Platform
Our platform is continuously evolving to help our customers simplify and enhance the way they run their businesses; attract, engage and retain more consumers; increase their revenues; and focus more on what they love to do - improving people’s lives. We have developed this platform with powerful functionality that addresses key aspects of operating a wellness services business, including:
• | Scheduling and Online Booking. Our customers can give their clients the opportunity to book and pay for their next visit wherever and whenever it is most convenient, whether through the MINDBODY app, our customers’ own website or branded mobile app built by MINDBODY, integrated search engines and social media sites such as Google, Facebook, Bing and Yahoo. We offer robust features that enable many different types of scheduling that wellness businesses encounter, including: |
◦ | Appointments. One-on-one appointments typically require preparation time before the appointment as well as off-boarding time after the appointment. Our software can manage practitioner availability as well as gaps between appointments in a time-efficient manner. |
◦ | Open classes. Open classes offer reserved or drop-in attendance on a first-come, first-served basis. Our software can transact at different price points, send automatic check-in and cancellation confirmations and manage waitlists to optimize capacity utilization. |
◦ | Enrollments and workshops. Enrollments and workshops are pre-registered events or series of classes with the same group of attendees. Our software offers the ability to set separate pricing outside of pre-paid packages and track absences, make-ups and various payment plans. |
◦ | Arrivals. Many gyms allow their members to use their facilities and equipment without attending a class. Our software tracks these open-gym arrivals, allowing consumers to check-in to a gym without having a scheduled class to attend. |
◦ | Resource scheduling. To effectively manage their day-to-day business, wellness service providers need to manage and allocate their equipment and facilities. Our software can easily track, manage and allocate equipment and facilities for the classes and services these businesses provide. |
• | Performance Tracking. With FitMetrix performance tracking solutions, our customers can integrate in-studio leaderboards and workout machines, like treadmills and indoor bikes, with wearables that track heart rate and calorie burn. In addition, fitness businesses can identify in their MINDBODY software which machines are enhanced with this integration, making it possible for a client to reserve a specific machine while booking a class. As a result, FitMetrix-enabled studios provide consumers with a highly immersive experience where they can gain valuable insights into the quantifiable results of their workouts. |
• | Staff Management. With our staff and resource scheduling software features, customers can keep their entire staff schedule in one place and enable staff to easily access and maintain their changing availabilities via MINDBODY for Business, our business-facing application. Our customers can also track staff substitutions, hourly and service-based payroll and commissions, all of which can be easily linked and exported to any of several popular payroll service formats, including ADP, Paychex and Exact Payroll Services. |
• | Client Relationship Management. With our client relationship management features, our customers have all of their clients’ information in one place and can take advantage of powerful relationship management and engagement marketing tools. Customers can securely store their clients’ personal information in a unique profile and manage account, visit and purchase history for more effective service. Our platform also helps our customers target new consumers, keep in touch with loyal clients and offer variable, targeted promotions and discounts. |
• | Integrated Payment Processing. We offer our customers integrated payment processing solutions with our software at competitive rates. Our integrated payments capability grows our customers’ revenue by allowing for convenient and secure storage of client card information, enabling seamless online booking and payment from all consumer interfaces, as well as recurring auto-payments for monthly memberships. Additionally, the integration between point-of-sale and payment processing saves customers time by linking payments authorizations and settlements to sales records, thereby eliminating the need for time-consuming and error-prone manual reconciliations. Our payments platform provides instant authorization and nightly settlement of credit card, debit card and ACH transactions. Once a sale is complete, staff can void, edit or return the sale. All client payment information is protected behind Payment Card Industry, or PCI, Level I Data Security Standards. |
4
• | Retail Point-of-Sale. Our point-of-sale capabilities help customers earn more revenue and create a seamless omni-channel purchase experience for their clients, allowing them to sell products and services, contracts and memberships, packages, workshops and store-branded gift cards from every web and mobile interface we offer. Our point-of-sale feature tracks product inventory levels and automatically issues purchase orders when product levels reach a re-order point. |
• | Purchase Tracking. Customers can sell products and services as well as memberships, monthly contracts and packages that combine products and services at their place of business and online. Customers can securely store client billing information to facilitate quicker transactions. Payments for classes or appointments can be applied before or after client check-in, and before or after the session is complete. Our point-of-sale functionality allows the assignment of staff commissions to appropriate parties. |
• | Inventory. Customers can set inventory re-order points, automatically generate purchase orders and easily log arriving inventory. As a result, customers can more efficiently manage availability, calculate gross margin and monitor inventory shrinkage, among other benefits. |
• | Hardware Integration. Our integration with the wireless Poynt Smart Terminal allows customers’ staff and clients a seamless, mobile payment experience, including pin-pad debit, chip-reading EMV, contactless payments, Google Wallet and Apple Pay. The Poynt Smart Terminal is loaded with MINDBODY for Business, so every transaction is fast, convenient and can be processed away from the front desk. Additionally, we offer point-of-sale hardware, such as cash drawers, receipt printers and barcode scanners, smartphone and table credit or debit card readers, as well as branded key chain tags and gift cards that our customers may desire. |
• | Analytics and Reporting. We track key information that helps customers achieve their business goals, including revenue growth, contribution margin of classes, client retention rates, referral sources, return on investment for client retention campaigns and practitioner performance based on client loyalty and reviews by class or type of service. Our platform also generates reports that help our customers allocate their resources, set budgets and measure their performance against goals. Customers are empowered to identify trends and opportunities for improvement in their businesses by leveraging analytics and marketing tools to pull a variety of reports, including, among others, sales forecasts, best-selling products and services, cancellations and no-shows, staff sales commissions, client retention rates, client account balances and many more. |
• | Branded web. Our branded web solution gives our customers the ability to embed their MINDBODY class and appointment schedules within their web and social sites, creating a seamless and branded online experience for their clients. |
• | Mobile. Our platform enables our customers to manage their operations anytime and anywhere via a number of mobile devices and operating systems, including Mac, iOS, Android and Windows. |
◦ | MINDBODY for Business. Our business-facing mobile app enhances our core offering by enabling our customers to easily run their business, book clients and sell products and services while on the go. |
◦ | Branded Mobile App. Our branded mobile app offering enables our customers to have their own consumer-facing app to create a unique branded experience for their clients. |
◦ | MINDBODY App. Our consumer app offering enables our customers to manage consumer and client interactions, including surfacing inventory, sending appointment reminders and providing updates to clients. |
◦ | MINDBODY Class Check-In. The MINDBODY Class Check-In app helps our customers create a better consumer experience at the front desk. Clients can check themselves into class, freeing up front desk staff to help others and making it possible for instructors to start classes faster. |
• | Social Integration. Our platform integrates with popular social networks like Facebook and Twitter. For example, our platform allows our customers to publish schedules on their Facebook page, enabling consumers to directly book appointments and classes via Facebook. |
• | Client Acquisition Dashboard. Our customers can attribute new consumers to various acquisition channels. For example, customers can track conversion of new consumers into clients by tracking the aggregate value of their subsequent purchases, which clients purchased specific introductory offers, and the reviews generated about their business in the MINDBODY app. |
5
• | Integration with Other Cloud-based Partners. We have built an open and extensible platform with an application programming interface, or API, that offers developers access to our inventory of classes, payments and scheduling capabilities. Approved developers can pull information from and post data to our platform and use that capability to create a variety of unique applications with custom interfaces. Our platform can be integrated with other cloud-based software that our customers may be using for critical business management tasks to extend the capabilities of our platform within a variety of focus areas such as automation, marketing, accounting, mobile and social. |
• | Security and Compliance. We have consistently passed our Level I Payment Card Industry Data Security Standard, or PCI DSS, audits. In addition, because we, in certain instances, collect, access, use, maintain and/or transmit protected health information in connection with providing services to customers who are subject to the requirements of the Health Insurance Portability and Accountability Act of 1996, or HIPAA, we have certified to the Health Information Trust Alliance Common Security Framework, or the HITRUST CSF, and consistently passed our HITRUST CSF audits. Our platform is engineered to provide high reliability and availability. We continually monitor our infrastructure for any sign of failure or pending failure and we take preemptive action to minimize or prevent downtime. We maintain the reliability of our service by utilizing redundant network infrastructure, clusters that tolerate failure of individual nodes and deploying high availability server pairs. We also implement various disaster recovery measures, including full replication of hardware and data in our geographically distinct data centers, to minimize data loss in the event of a data center disaster. |
The MINDBODY App
The MINDBODY app is our consumer-facing mobile application that consumers can use to manage their wellness activities and relationships with multiple MINDBODY customers, using a unified account with a single login and multiple stored cards. Consumers can discover local wellness services using a geo-located map function, view class and appointment descriptions, schedules and real-time availability, read practitioner biographies and user reviews written by consumers who have actually attended the class or received the service, and then book and pay for their desired services in a few taps from their mobile devices. Through the app, consumers can also receive appointment reminders and check-in to classes before they arrive, receive real-time updates regarding changes in class schedules, and access their account profile to review their class visit and payment history.
Introductory Offers and Dynamic Pricing. The MINDBODY app helps customers actively promote their businesses by surfacing targeted introductory offers and dynamically-priced classes to targeted consumers, helping to increase consumer demand for wellness services while increasing customers’ revenue and improving their profitability. Introductory offers are targeted via a proprietary recommendation engine that considers a user’s prior history, preferences and geo-location. Dynamically-priced offerings are developed and targeted by a proprietary algorithm that can offer the class to the consumer above or below our customer's standard drop-in rate, based on factors like time until class, relative demand, historical trends and other proprietary methods.
The MINDBODY Network
The MINDBODY Network is a fee-based marketing platform that connects our customers with local consumers via the MINDBODY app and third-party partner applications or websites. Customers who opt in to the MINDBODY Network receive greater exposure through additional promotion of their intro offers or deals on various screens throughout the MINDBODY app, as well as featured placement on third-party partner apps and/or websites including Google and Bing.
MINDBODY API Platform and Partner Ecosystem
We have enabled a rich partner ecosystem that extends the value of our software and payments platform in powerful ways. Our partners have built applications that supplement our capabilities in areas such as marketing automation, accounting, loyalty, mobile and social interactions. Several of these partners have created significant consumer-facing businesses that rely on our unique inventory of classes, scheduling and payments capabilities. All of this is enabled by our APIs, to which we grant access to approved developers and partners. We also integrate with partners that provide email marketing, customer survey, events management and other functionality to augment the capabilities of our platform for the benefit of our customers.
6
Software Subscription Packages
Because each of our customers is unique and at a different stage of their respective professional journeys, our software subscriptions are provided on a tiered pricing model based upon different software functionality packages. Each of these packages has been carefully crafted to meet our customers' differing needs and levels of complexity, giving them appropriate functionality to optimize their business.
Customer and Consumer Services and Support
We believe that many wellness services business owners are not technical experts and that they bear an enormous responsibility to successfully run their businesses day in and day out. Therefore, we provide end-to-end customer support, including full data conversion and import from prior systems, live onboarding and 24/7 technical support via telephone, email, in-software chat and screen sharing; in-software self-service tools; advanced professional services; and educational events. In addition, we also have a dedicated support team that is focused on ensuring that the millions of registered MINDBODY app users are having the best possible experience.
• | Customer Onboarding. We typically onboard new customers with live training sessions delivered via telephone and web conference. These trainings are supplemented by self-service setup checklists, online help materials and webinars. |
• | Customer Success. To identify opportunities for greater adoption of our products and services and to further help our customers be more successful on our platform, we engage with them to better understand their business goals and objectives; provide targeted education about relevant features, products and services as well as business best practices; and develop a recommended success plan with periodic outreach to check in on their progress. |
• | Ongoing Customer Support. Inclusive with our base subscription fees, we offer 24/7 customer service and support via phone, chat, emails and self-help knowledge centers. All customer service and support is provided by our in-house personnel who are invested in MINDBODY’s core values and closely connected to our Product, Technology and Experience team. |
7
• | Professional Services. Our premium support services enable customers to access dedicated, advanced product and business operations support from software and business experts. This service is usually chosen by our higher-end small businesses and multi-location chains or franchises. |
• | MINDBODY University. MINDBODY University is a multi-day advanced customer education event held multiple times per year in various destination locations around the world (e.g., London, New York, San Diego and Sydney). This high-impact business conference teaches advanced software skills and best business practices that help customers increase revenues and improve their bottom line. In addition, all customers have unlimited, online access to recorded business management material derived from our MINDBODY University courses at no additional cost. |
• | BOLD Conference. We provide our customers with a three-day annual user conference where they can learn best business practices and participate in networking opportunities designed to help fuel their business growth and success. Program sessions typically include key topics needed to thrive within the competitive wellness services industry market — from the latest trends in consumer marketing and social media, to selling strategies and strategic business partnerships — taught by MINDBODY team members, industry experts and fellow MINDBODY customers. |
• | Consumer Support. We provide consumer support through live in-app and online chat, email, and self-service support articles. |
Key Benefits to MINDBODY’s Constituents
MINDBODY connects the world to wellness by connecting wellness practitioners with millions of consumers who are seeking these types of services. We have created a two-sided marketplace that benefits both customers and consumers by powering and enabling interactions that drive healthier businesses and healthier lifestyles.
Benefits to consumers:
• | Increased Discovery and Engagement. Our platform aggregates nearly 5 million transaction-enabled wellness class spots and wellness services per day, together with millions of class ratings and hundreds of thousands of consumer reviews written by consumers who have actually participated in a class or used a service. This creates a convenient “one-stop-shop” experience that is much easier and less time consuming for consumers than browsing through numerous disparate websites and making phone calls to schedule a class or service. The MINDBODY app further aggregates compelling introductory offers for first time visitors that encourages consumers to try new things. These benefits increase the consumer’s likelihood to repeat wellness experiences more frequently, which we believe enhances their health and happiness. |
• | Broadened Access to Wellness. Our growing suite of web and mobile interfaces, as well as our consumer partnerships, surface transaction-enabled class and appointment inventory, enticing more people to adopt wellness practices. We also believe that our ability to allow consumers to more easily manage their wellness routine and consume more wellness services on a regular basis increases their engagement in wellness activities and encourages them to live a more active and full life. |
• | Cost Savings and Increased Availability. We believe that dynamic pricing will enable price-sensitive consumers, such as those who are more flexible with their time or are willing to book further in advance, to find a class they can easily afford. Conversely, less price-sensitive consumers, such as busy professionals or travelers, will be more likely to find a popular experience for which they are willing and able to pay a premium. |
• | Ability to Track Personal Health Data with Each Wellness Activity. New technologies, including third-party wearable fitness trackers and mobile apps within the health and fitness category enable consumers to track various aspects of their health and fitness. As part of this trend, the MINDBODY app offers consumers the ability to track their personal health data and to monitor the effectiveness of their wellness activities. With the MINDBODY app, consumers can access their wellness activity history, such as class attendance frequency and class duration, as well as personal activity data tracked by integrated wearable devices. |
Benefits to customers and wellness practitioners:
• | Increased Growth in Client Base and Revenue. We help our customers increase their client base by taking advantage of a free business listing on the MINDBODY app, allowing them to attract a larger pool of consumers. Customers who choose to opt in to the fee-based MINDBODY Network receive greater exposure through additional promotion of their introductory offers or deals on various screens throughout the app, as well as featured placement on third-party partner apps and/or websites. Customers can also opt in to fee-based dynamic pricing, which allows them to dynamically price their inventory based on demand factors such as class times, day of the week, popularity and more. |
8
This helps them sell under-utilized inventory and fill their classes, while maximizing revenue by charging more for classes with the highest demand. Moreover, by having the ability to send reminders, promotions and special offers via email, text, push or in-app notifications to clients based on a record of their past interactions, customers can increase their client engagement and loyalty. We also help customers sell their products and services through a variety of channels: an online store, their website, social sites, or the MINDBODY Network thus helping them to increase their revenue opportunities.
• | Mobility. The MINDBODY app and our branded mobile apps give consumers fast and convenient access to wellness services in their local communities. The business app and class check-in app help customers manage their business and classes on the go. Customers can also utilize these mobile apps to enhance their consumer experience, offering in-app membership contract and liability waivers as well as push notifications. |
• | Simplified Operations. Our business management software and payments platform allows customers and practitioners to streamline and simplify their operations. MINDBODY automates a large number of time-consuming workflows, thus reducing the administrative effort and time customers and their employees need to invest in business operations. |
• | Greater Focus on Clients. By simplifying the operations of wellness businesses, we enable customers and practitioners to focus on their clients. In addition, our analytical tools provide critical insights that help customers focus on optimizing their business and achieving their goals. |
Competition
The market for business management software and payments solutions for wellness businesses, as well as wellness booking services for consumers, is highly competitive, fragmented and rapidly evolving due to technological innovations. We believe our competitors fall into the following primary categories:
• | On-premise software providers and small cloud-based providers that typically focus on a specific vertical within the wellness services industry; |
• | Cloud-based software providers that offer generic scheduling tools with minimal customization by vertical; |
• | Payments services providers that offer basic scheduling tools; and |
• | Consumer apps and websites that offer wellness inventory at a discount or for a monthly subscription fee. |
In addition, for some small to medium-sized organizations, we compete with basic productivity tools that these organizations have adapted for scheduling and business management uses, including desktop applications (e.g., Microsoft Office, Google Docs) and pen and paper for tracking and management purposes.
The principal competitive factors in our market include:
• | Industry expertise |
• | Depth of product functionality and ease of use |
• | Brand recognition and reputation |
• | Ability to drive consumer demand via a large and rapidly growing consumer network |
• | 24/7 customer service |
• | Price |
• | Product extensibility via APIs |
• | Partnerships and integrations with major consumer brands |
• | Integration with mobile devices |
• | Payment processing integration |
• | Marketing capabilities and analytics |
• | Strong company culture |
• | Security and reliability |
• | Global presence |
9
We believe that we compete favorably on the factors described above. However, some of our competitors have greater financial, technical and other resources, greater name recognition and larger sales and marketing budget; therefore, we may not always compare favorably with respect to some or all of the factors above.
Our Technology
We have developed our proprietary technology platform over the last decade, with a focus on delivering industry-leading breadth and flexibility of functionality. Our platform is built API-first with a service-oriented multi-tenant architecture, making it fully extensible to our business and consumer web and mobile applications, as well as complementary technology partner integrations. Maintaining the integrity and security of our technology platform is mission critical to our business and our customers’ success.
• | Reliable. Our platform is engineered to provide high reliability and availability. Our agreements with customers typically provide for limited service level commitments. In certain circumstances, our customers may be eligible for credits if we are unable to meet these service level commitments. Our infrastructure is hosted in two dual redundant Tier 4 (the highest rating available) data centers separately located in North America. Our network operations center provides 24/7 monitoring of hundreds of sensors on all systems, including global synthetic and real user monitoring, to ensure we have complete visibility into our platform and are able to instantly respond to any potential service issue. |
• | Secure. Our platform hosts a large quantity of customer data and processes a large volume of business-to-consumer transactions. We therefore maintain a comprehensive security program designed to help safeguard the confidentiality, integrity and availability of our customers’ data, which includes both organizational and technical control measures. Our platform includes a host of third-party encryption, malware prevention, firewall and intrusion detection, data loss detection and patch management technologies to protect and maintain all systems. We routinely test and review our security program. In addition, we regularly obtain third-party security audits of our technical operations and procedures covering data security including the PCI-DSS, as well as Statement on Standards for Attestation Engagements No. 16, or SSAE 18, and Service Organizations Controls 2, or SOC 2, Type 1 and Type 2 Attestations. |
• | Scalable. We have developed a robust and scalable platform that processes millions of queries per day. By leveraging best-in-breed technology components, server virtualization and a service-oriented architecture, we believe we can seamlessly scale our compute and storage capacity. |
• | Dynamic Cloud-Based Architecture. Our software platform is powered by a dynamic cloud-based architecture that allows our customers to manage their operations as efficiently as possible, while requiring low upfront investment and no maintenance. This architecture allows for automatic software updates and rapid launch of new product features while also allowing our platform to easily scale with customers as their businesses grow. |
Our Customers
We have a diverse customer base with approximately 59,000 subscribers located in over 100 countries and territories across a variety of industries within the wellness services industry. No single customer, API partner, or technology partner represented more than 10% of our total revenue in any of fiscal 2017, 2016 or 2015. As of December 31, 2017 and 2016, one trade receivable represented 17% and 15% of our total accounts receivable balance, respectively.
Our Culture and Employees
Our company and employees share an exceptional corporate culture that is built upon a detailed set of core values that are reinforced throughout the Company through new hire orientation, monthly corporate wellness initiatives and annual performance appraisals. Our employees thrive in a nurturing environment that is driven by innovation, passion for health and wellness and dedication towards excellent customer experience.
As of December 31, 2017, we had 1,426 employees. None of our employees is represented by a labor organization or is a party to any collective bargaining arrangement. We have never had a work stoppage, and we consider our relationship with our employees to be good.
10
Sales and Marketing
We deploy a direct sales approach driven by an outbound tele-sales team located primarily in San Luis Obispo, California with several regional offices throughout the United States, and locations in the United Kingdom and Australia. Our sales team qualifies and manages prospective and current customers, aiming to initiate, retain and expand their use of our platform over time. Our sales team partners with sales engineers to provide consultation and product demonstration to prospects to accelerate the onboarding of new customers.
Our marketing efforts are focused on generating awareness of our platform and consumer app, creating sales leads, establishing and promoting our brand, and cultivating a community of successful and vocal customers and consumers. We utilize both online and offline marketing initiatives, including search engine and email marketing, online display and print advertising, participation in trade shows, events and conferences, permission marketing, social media and media outreach, mass media and strategic partnerships and endorsements.
Our sales prospecting, lead qualification and lead development functions are performed by sales development representatives and lead acquisition specialists. Our sales and marketing headcount as of December 31, 2017 was 471. Our sales and marketing expenses were $71.8 million, $56.5 million and $46.3 million for the years ended December 31, 2017, 2016 and 2015, respectively.
Research and Development
Our research and development organization is responsible for the ideation, research, design, development and testing of all aspects of our platform. To create a roadmap that meets the needs of our customers, we emphasize collaboration during the development process. Customers provide direct input through dialog with our customer support, product management and user experience teams, as well as our community forum and feature utilization data. We deploy new features, functionality and technologies for our platform through monthly software releases or updates to minimize disruption and deliver continuous improvement.
As of December 31, 2017, we had 243 employees in our research and development organization, which is based primarily in San Luis Obispo, California. Our research and development expenses were $35.8 million, $30.3 million and $23.1 million, for the years ended December 31, 2017, 2016 and 2015, respectively.
Intellectual Property
We rely on a combination of trade secret, copyright and trademark laws, a variety of contractual arrangements, such as license agreements, assignment agreements, confidentiality and non-disclosure agreements and confidentiality procedures and technical measures to gain rights to and protect the intellectual property used in our business.
We have also developed a patent program and a strategy to identify, apply for, and secure patents for innovative aspects of our platform and technology. We have eight U.S. patent applications pending. We also have four pending patent applications in jurisdictions outside of the United States. We intend to pursue additional patent protection to the extent we believe it would be beneficial and cost-effective.
We actively pursue registration of our trademarks, logos, service marks and domain names in the United States and in other key jurisdictions. We are the registered holder of a variety of U.S. and international domain names that include the term MINDBODY and similar variations. We use several trademarks or registered trademarks for our products and services, including “MINDBODY,” and several logos and images, such as the Enso logo, as well as the slogans “LOVE YOUR BUSINESS,” “BOOK YOUR BEST DAY. EVERY DAY.” and “CONNECTING THE WORLD TO WELLNESS.”
We also rely on certain intellectual property rights that we license from third parties, including under certain open source licenses. Though such third-party technologies may not continue to be available to us on commercially reasonable terms, we believe that alternative technologies would be available to us, if needed.
Our policy is to require employees and independent contractors to sign agreements assigning to us any inventions, trade secrets, works of authorship, developments and other processes generated by them on our behalf and agreeing to protect our confidential information. All of our key employees have done so. In addition, we generally enter into confidentiality agreements or have confidentiality provisions in our agreements with our vendors and customers. We also control and monitor access to, and distribution of, our software, documentation and other proprietary information.
Despite our precautions, it may be possible for unauthorized third parties to copy our products and use information that we regard as proprietary to create products and services that compete with ours.
11
Some license provisions protecting against unauthorized use, copying, transfer and disclosures of our products may be unenforceable under the laws of certain jurisdictions and foreign countries. In addition, the laws of some countries do not protect proprietary rights to as great of an extent as the laws of the United States, and many foreign countries do not enforce these laws as diligently as government agencies and private parties in the United States. To the extent that we expand our international activities, our exposure to unauthorized copying and use of our products and misappropriation of our proprietary information may increase.
We expect that software and other solutions in our industry may be increasingly subject to third-party infringement claims as the number of competitors grows and the functionality of products in different industry segments overlap.
Seasonality
We believe there are significant seasonal factors that may cause us to record higher revenue in some quarters compared with others. We believe this variability is largely due to our focus on the wellness services industry, as many of our customers experience an increase in demand for their services in the first quarter of each year due to consumers becoming more motivated to pursue health and fitness goals in the new year. However, this seasonality may not be fully evident in our historical business performance because of our significant growth. If our revenue growth rate slows, we expect that the seasonality in our business may become more pronounced and may cause our operating results to fluctuate in the future. In addition, as we attempt to expand the number of our customers and consumers, we may see changes to this pattern of seasonality.
Segments
We have one operating and reporting segment consisting of various products and services that are all related to our integrated cloud-based business management software and payments platform for the wellness services industry. For our revenue, net loss and total assets, see our Consolidated Financial Statements included in Part IV, Item 15 of this Annual Report on Form 10-K.
Geographic Information
Financial information about geographic areas is set forth in Note 12 of the Notes to Consolidated Financial Statements included in Part IV, Item 15 of this Annual Report on Form 10-K. For a discussion of the risks attendant to foreign operations, see the information in Part 1, Item 1A: “Risk Factors” under the caption “Our international sales and operations subject us to additional risks that can adversely affect our business, operating results and financial condition.”
Government Regulation
As a service provider to our customers, we must comply with a number of federal, state and international laws and regulations regarding security, data protection and the privacy and protection of consumer data that affect companies conducting business on the Internet. In addition, in connection with providing online scheduling services for certain customers, we may be subject to specific compliance obligations under HIPAA and similar state laws that govern the collection, use, protection and disclosure of personally identifiable information. HIPAA imposes specific requirements regarding data privacy and security on covered entities (providers, health plans and health care clearinghouses); business associates (entities that may perform services for covered entities, pursuant to which they may access personal information); and business associates’ subcontractors, including us. There may be civil and criminal penalties, as well as contractual ramifications, for violating HIPAA.
12
Corporate Information
We were organized as a California limited liability company in February 2001 and converted into a California corporation in October 2004. We were reincorporated in Delaware in March 2015. Our principal executive offices are located at 4051 Broad Street, Suite 220, San Luis Obispo, California 93401, and our telephone number is (877) 755-4279. Our website address is https://www.mindbodyonline.com, and our investor relations website is http://investors.mindbodyonline.com. Information contained on, or that can be accessed through, our website, does not constitute part of and is not incorporated by reference into this Annual Report on Form 10-K or in any other report or document we file with the SEC, and any references to our website are intended to be inactive textual references only.
Unless expressly indicated or the context requires otherwise, the terms “MINDBODY,” “company,” “we,” “us,” and “our” in this Annual Report on Form 10-K refer to MINDBODY, Inc., a Delaware corporation, and, where appropriate, its wholly owned subsidiaries. The Enso design logo, “MINDBODY,” as well as the slogans “LOVE YOUR BUSINESS,” “BOOK YOUR BEST DAY. EVERY DAY.” and “CONNECTING THE WORLD TO WELLNESS” are trademarks or registered trademarks of MINDBODY. Other trademarks and trade names referred to in this Annual Report on Form 10-K are the property of their respective owners. Except as set forth above and solely for convenience, the trademarks and tradenames in this Annual Report on Form 10-K are referred to without the ® and ™ symbols, but such references should not be construed as any indicator that their respective owners will not assert, to the fullest extent under applicable law, their rights thereto.
Available Information
We file annual reports on Form 10-K, quarterly reports on Form 10-Q, current reports on Form 8-K and amendments to reports filed or furnished pursuant to Sections 13(a) and 15(d) of the Exchange Act. The public may obtain these filings at the Securities and Exchange Commission’s, or SEC, Public Reference Room at 100 F Street, NE, Washington, DC 20549 or by calling the SEC at 1-800-SEC-0330. The SEC also maintains a website at www.sec.gov that contains reports, proxy and information statements and other information that we file with the SEC electronically. We make available on our website, free of charge, our Annual Reports on Form 10-K, Quarterly Reports on Form 10-Q, Current Reports on Form 8-K and any amendments to those reports filed or furnished pursuant to Section 13(a) or 15(d) of the Exchange Act, as soon as reasonably practicable after we electronically file such material with, or furnish it to, the SEC.
We webcast our earnings calls and certain events we participate in or host with members of the investment community on our investor relations page of our website located at investors.mindbodyonline.com. Press releases and corporate governance information, including our board committee charters, code of business conduct and ethics and corporate governance guidelines, are also available on the investor relations page of our website.
Executive Officers of MINDBODY
The following table provides information regarding our executive officers as of February 22, 2018:
Name | Age | Position | ||
Richard Stollmeyer | 52 | Chief Executive Officer and Chairman of the Board of Directors | ||
Michael Mansbach | 50 | President | ||
Brett White | 55 | Chief Financial Officer and Chief Operating Officer | ||
Kimberly Lytikainen | 51 | Chief Legal Officer, Secretary and Compliance Officer | ||
Kunal Mittal | 39 | Chief Technology Officer | ||
Mark Baker | 51 | Chief Revenue Officer | ||
Richard Stollmeyer. Mr. Stollmeyer is a founder and has served as our chief executive officer and as chairman of our board of directors since October 2004. He also served as our president from October 2004 to June 2017. Mr. Stollmeyer holds a B.S. degree in Political Science and Russian Language, with a concentration in International Relations, from the United States Naval Academy.
13
Michael Mansbach. Mr. Mansbach has served as our president since June 2017. From November 2015 to February 2017, Mr. Mansbach served as president of Blue Jeans Network, Inc., a cloud-based video communications company. From September 2014 to September 2015, Mr. Mansbach served as the chief executive officer of PunchTab, Inc., an engagement and insights platform. From November 2004 to April 2014, Mr. Mansbach served in various senior management roles with the software-as-a-service division of Citrix Systems, Inc., a provider of business mobility and security software, including as vice president, customer care from November 2013 to April 2014; vice president and general manager, global sales and client services from December 2007 to November 2013; and vice president, enterprise marketing and business development from November 2004 to December 2007. Mr. Mansbach received his B.A. degree in French Language and Literature from the University of California, Los Angeles, and his M.A. degree in International Economics, European Area Studies, from the Paul H. Nitze School of Advanced International Studies at The Johns Hopkins University.
Brett White. Mr. White has served as our chief financial officer since July 2013 and our chief operating officer since July 2016. From January 2008 to July 2013, Mr. White served as chief financial officer at Meru Networks, Inc., a provider of Wi-Fi solutions. From November 2005 to December 2007, Mr. White served as chief financial officer at Fortinet, Inc., a provider of network security solutions. Mr. White holds a B.A. degree in Business Economics from the University of California, Santa Barbara.
Kimberly Lytikainen. Ms. Lytikainen has served as our chief legal officer since January 2017, our corporate secretary since March 2015, and our compliance officer since June 2015. Ms. Lytikainen previously served as our general counsel from July 2014 through December 2016. From June 2013 to July 2014, Ms. Lytikainen served as associate general counsel at Pivotal Software, Inc., a provider of computer software and services. From April 2006 to June 2013, Ms. Lytikainen served as vice president, assistant general counsel at NVIDIA Corporation, a visual computing company. Ms. Lytikainen holds a B.A. degree in Political Science and Government from Florida State University, and a J.D. degree from Loyola Law School, Loyola Marymount University.
Kunal Mittal. Mr. Mittal has served as our chief technology officer since June 2016. From November 2015 to May 2016, Mr. Mittal served as our senior vice president of technology. From July 2008 to November 2015, Mr. Mittal served as executive director of enterprise technologies at Sony Pictures Entertainment Inc., a global entertainment company. Mr. Mittal holds a B.S. degree in Computer Science from Beloit College and an M.S. degree in Software Engineering from Walden University.
Mark Baker. Mr. Baker has served as our chief revenue officer since February 2018. From January 2017 to January 2018, he served as the executive vice president of global sales at Symphony Talent, LLC, a recruitment marketing SaaS platform company. From July 2014 to April 2016, Mr. Baker served as senior vice president, global sales, at Urban Airship, Inc., a SaaS mobile marketing platform company. From April 2010 to May 2014, Mr. Baker served in senior management roles with the Citrix Online division of Citrix Systems, Inc., a provider of business mobility and security software, providing SaaS-based collaboration and support solutions, including as vice president and general manager of sales and service - Americas from April 2010 to June 2013, and as vice president of global sales, SaaS division from June 2013 to May 2014. Mr. Baker holds a B.S. degree in Business, with an emphasis in Marketing, from Portland State University.
Item 1A. Risk Factors
Investing in our Class A common stock involves a high degree of risk. You should carefully consider the following risks, together with all of the other information contained in this Annual Report on Form 10-K, including our financial statements and related notes, before making a decision to invest in our Class A common stock. Any of the following risks could have a material adverse effect on our business, operating results and financial condition and could cause the trading price of our Class A common stock to decline, which would cause you to lose all or part of your investment.
Risks Related to Our Business
We have a history of losses, and we may not achieve or maintain profitability in the future. In addition, our revenue growth rate may not sustain the levels experienced in recent years.
We have incurred a net loss in each year since our inception, including a net loss of $14.8 million, $23.0 million and $36.1 million in the years ended December 31, 2017, 2016 and 2015, respectively. We have expended and expect to continue to expend financial and other resources on, among other things:
• | continuing the development of, and ongoing improvements to, our platform, including research and development investments in our technology infrastructure, the development or acquisition of new products, features and functionality and improvements to the scalability, availability and security of our platform; |
• | strategic acquisitions; |
14
• | sales and marketing expenses, including personnel, lead generation and consumer advertising expenses; |
• | expenses related to international expansion in an effort to increase our customer and consumer base; and |
• | general and administrative expenses, including legal, regulatory, accounting and other expenses related to being a public company. |
If we expend more resources on growing our business than currently anticipated or if we encounter unforeseen operating expenses, difficulties, complications and other unknown factors, we may not be able to achieve or sustain profitability and our operating results and business would be harmed.
For the years ended December 31, 2017, 2016 and 2015, our revenue was $182.6 million, $139.0 million and $101.4 million, respectively, representing a 31% and 37% growth rate, respectively. Our historical revenue growth rates are not necessarily indicative of future growth, and we may not achieve similar revenue growth rates in future periods.
If we fail to increase market acceptance of our platform, enhance and adapt our platform to changing market dynamics and customer preferences, or keep pace with technological developments, our business, results of operations, financial condition and growth prospects would be adversely affected.
We derive, and expect to continue to derive, a majority of our revenue and cash inflows from our integrated cloud-based business management software and payments platform for the wellness services industry. As such, market acceptance of this platform is critical to our success. Our ability to attract new customers and increase revenue from existing customers depends in part on our ability to enhance and improve our existing platform and to introduce new and innovative features, products and services, including features, products and services designed for a mobile user environment. Demand for our platform is affected by a number of factors, many of which are beyond our control, such as the timing of development and release of new products, features and functionality by our competitors, technological change, consumer preferences and growth or contraction in our addressable market.
To grow our business, we must develop features, products and services that reflect the changing nature of business management software and expand beyond our core scheduling and point-of-sale functionality to other areas of managing relationships with our customers and consumers. For example, in 2013, we expanded our platform to include MINDBODY Connect (now the MINDBODY app), in 2015 we introduced the MINDBODY Marketing Platform (now the MINDBODY Network), and in 2017 we introduced dynamic pricing. The success of these and any other enhancements to our platform depends on several factors, including timely completion, adequate quality testing and sufficient customer or consumer demand. Any new feature, product or service that we develop may not be introduced in a timely or cost-effective manner, may contain defects and/or may not achieve the market acceptance necessary to generate sufficient revenue. If we are unable to successfully develop new and innovative features, products or services, meet the demands and expectations of our customers and consumers for features, products and services that meet their needs and are easy to use and deploy, or enhance our existing platform to meet customer requirements, our ability to achieve widespread market acceptance of our platform will be undermined, and our business, results of operations, financial condition and growth prospects will be adversely affected.
In addition, because our platform is available over the Internet, we need to continuously modify and enhance our platform to keep pace with changes in Internet-related hardware, software, communications and database technologies and standards. If we are unable to respond in a timely and cost-effective manner to these rapid technological developments and changes in standards, our platform may become less marketable, less competitive, or obsolete, and our operating results will be harmed. If new technologies emerge that are able to deliver competitive products and applications at lower prices, more efficiently, more conveniently or more securely, such technologies could adversely impact our ability to compete. Our platform must also integrate with a variety of network, hardware, mobile and software platforms and technologies, and we need to continuously modify and enhance our products and services to adapt to changes and innovation in these technologies. Any failure of our platform to operate effectively with future infrastructure platforms and technologies could reduce the demand for our platform. If we are unable to respond to these changes in a cost-effective manner, our platform may become less marketable, less competitive or obsolete, and our operating results may be adversely affected.
15
Our business depends substantially on our customers renewing, upgrading, or expanding their subscriptions to our platform and our ability to sell subscriptions to a large number of new small and medium-sized businesses on a consistent basis and in a cost-effective manner. Any decline in the rate at which customers renew, upgrade, or expand their subscriptions could harm our future operating results.
The vast majority of our subscription revenue is derived from subscriptions to our platform that have monthly terms, with some larger customers on longer term contracts. For us to maintain or improve our operating results, it is important that our customers renew, upgrade and/or expand their subscriptions. Our retention rate may decline or fluctuate as a result of a number of factors, including our customers’ satisfaction with our platform, accessibility of our platform, our customer support, our prices, the prices of competing software systems, system uptime, network performance, data breaches, mergers and acquisitions affecting our customer base, the effects of global economic conditions and the strength of our customers’ businesses. If our customers do not renew and/or expand their subscriptions or renew but shift to lower priced software subscriptions, our revenue may decline and we may not realize improved operating results from our customer base.
In addition, even if our market grows as expected, our business depends on our sales team’s ability to sell subscriptions to a large number of new small and medium-sized businesses on a consistent basis, with each sale constituting only a small portion of our overall revenue. To achieve this type of customer growth and expansion in a cost-effective manner, it is crucial that our platform is easy to use and implement and remains accessible to our customers through our distribution channels without the need for excessive post-sale customer support. If we are unable to sell a large volume of subscriptions on a consistent basis, if we are forced to incur excessive costs to provide post-sale customer support, or if we are unable to retain, upgrade, or expand offerings to our existing customers, our business, results of operations, financial condition and growth prospects will be adversely affected.
If pricing for our software subscriptions is not acceptable to our customers, our operating results will be harmed.
We have, from time to time, increased the price of our software subscriptions and may do so again in the future. For example, we have implemented several price increases over the past few years, including most recently in February 2018 for some of our software levels. We believe these increases have caused and may continue to cause customers to leave our platform, and such increases may also have reduced, and in the future may reduce, the number of new customers adopting our software. We cannot guarantee that new or existing customers will adopt or renew subscriptions at our current prices. Additionally, in the future we may further refine our tiered pricing model and our software levels, and/or increase pricing. Such further changes may cause customers to migrate to lower level offerings or leave our platform entirely, which would adversely affect our customer numbers, and could adversely affect our revenue, gross margin, profitability, financial position and cash flow.
If our network or computer systems are breached, unauthorized access to customer or consumer data is otherwise obtained, or denial-of-service attacks occur, our platform may be perceived as insecure, we may lose existing customers or fail to attract new customers, and we may incur significant liabilities.
Use of our platform, including some of our third-party applications, involves the storage, transmission and processing of our customers’ proprietary data, including personal or identifying information regarding their clients or employees. As a result, unauthorized access to, security breaches of, or denial-of-service attacks against our platform could result in the unauthorized access to or use of, and/or loss of, such data, as well as loss of intellectual property or trade secrets.
If any unauthorized access to our systems or data, security breach, or significant denial-of-service attack occurs or is believed to have occurred, our reputation and brand could be damaged, we could be required to expend significant capital and other resources to alleviate problems caused by such actual or perceived breaches or attacks and remediate our systems, and we could be exposed to a risk of loss, litigation or regulatory action and possible liability, some or all of which may not be covered by insurance, and our ability to operate our business may be impaired. We have in the past and may in the future experience denial-of-service attacks against our platform. If potential new customers or existing customers believe that our platform does not provide adequate security for the storage of personally identifiable or sensitive information or its transmission over the Internet, they may not adopt our platform or may choose not to renew their subscriptions to our platform, which could harm our business. Additionally, actual, potential or anticipated attacks may cause us to incur increasing costs, including costs to deploy additional personnel and protection technologies, train employees, and engage third-party experts and consultants. Our errors and omissions insurance policies covering certain security and privacy damages and claim expenses may not be sufficient to compensate for all potential liability. Although we maintain cyber liability insurance, we cannot be certain that our coverage will be adequate for liabilities actually incurred or that insurance will continue to be available to us on economically reasonable terms, or at all.
Because the techniques used to obtain unauthorized access or to sabotage systems change frequently and generally are not identified until they are launched against a target, we may be unable to anticipate these techniques or to implement adequate preventative measures. We may also experience security breaches that may remain undetected for extended periods of time.
16
Because data security is a critical competitive factor in our industry, we make statements in our privacy policies and terms of service, through our certifications to privacy standards, and in our marketing materials, describing the security of our platform, including descriptions of certain security measures we employ. Should any of these statements be untrue, become untrue, or be perceived to be untrue, even if through circumstances beyond our reasonable control, we may face claims, including claims of unfair or deceptive trade practices, brought by the U.S. Federal Trade Commission, state, local or foreign regulators (e.g., a European Union-based data protection agency) or private litigants.
Because our platform can be used to collect and store personal information, domestic and international privacy and data security concerns could result in additional costs and liabilities to us or inhibit sales of our platform.
Our customers can use our platform to use, collect and store personal or identifying information regarding their employees and clients. Federal, state and foreign governments and agencies have adopted laws and regulations concerning the collection and use of personally identifiable information obtained from their residents or by businesses operating within their jurisdiction. The costs of compliance with and other burdens imposed by privacy-related laws, regulations and standards may limit the use or adoption of our platform, reduce overall demand for our platform, lead to significant fines, penalties or liabilities for noncompliance, or slow the pace at which we close sales transactions, any of which could harm our business. Moreover, if our employees fail to adhere to adequate data protection practices around the usage of our customers' data, it may damage our reputation and brand.
We also expect that there will continue to be new proposed laws, regulations and industry standards concerning privacy, data protection and information security in the United States, the European Union and other jurisdictions, and we may not be able to predict the impact such future laws, regulations and standards may have on our business. For example, in April 2016, the EU Parliament formally adopted the General Data Protection Regulation, or GDPR, which supersedes existing EU data protection legislation, imposes more stringent EU data protection requirements, and provides for greater penalties for noncompliance. The GDPR will be effective in May 2018. Complying with the GDPR has caused us to incur operational costs and divert attention from other operational priorities. Our efforts to bring practices into compliance before the effective date of the GDPR may not be successful. Additionally, in July 2016, the European Union and the United States adopted a new framework for legitimizing trans-Atlantic data flows, the EU-U.S. Privacy Shield. Uncertainty remains as to whether the EU-U.S. Privacy Shield and other legal mechanisms for the lawful transfer of data from the European Union to the United States will withstand legal challenges, whether from regulators or private parties. If one or more of the legal bases for transferring data from Europe to the United States is invalidated, it could affect the manner in which we provide our services or adversely affect our financial results. Moreover, if our privacy and data policies and practices, are, or are perceived to be, insufficient, customer demand for our platform could decline, and our business could be negatively impacted.
The U.S. Federal Trade Commission and numerous state attorneys general are also applying federal and state consumer protection laws to enforce regulations related to the online collection, use and dissemination of personally identifiable information and other data. Some of these requirements include obligations on companies to notify individuals of security breaches involving particular personal information, which could result from breaches experienced by us or our service providers. For example, our solutions must conform, in certain circumstances, to requirements set forth in the Health Insurance Portability and Accountability Act of 1996, or HIPAA, which governs the privacy and security of protected health information. Through the provision of online scheduling services to certain of our customers, we may collect, access, use, maintain and transmit protected health information in ways that may be subject to certain of these laws and regulations.
Additionally, because we process a significant portion of our payments through debit or credit cards and enable our customers to engage in payments through our service, we are contractually required to maintain Payment Card Industry Data Security Standard, or PCI DSS, compliance as part of our information security program. We also may be bound by additional, more stringent contractual obligations relating to our collection, use and disclosure of personal, financial and other data. If we cannot comply with or if we incur a violation of any of these regulations or requirements, we could incur significant liability through fines and penalties imposed by credit card associations or other organizations or breach of contracts with our payment processors, either of which could have an adverse effect on our reputation, business, financial condition and operating results.
Finally, in March 2017, the U.K. government invoked Article 50 of the Lisbon Treaty to initiate the process to leave the European Union, which follows the results of the referendum in June 2016 in which the United Kingdom voted to leave the European Union. The impact of the foregoing on data and privacy regulations in the United Kingdom remains uncertain.
We may find it necessary to change our business practices or expend significant resources to modify our software or platform to adapt to new laws, regulations and industry standards concerning these matters. We may be unable to make such changes and modifications in a commercially reasonable manner or at all. Any failure to comply with federal, state or foreign laws or regulations, industry standards or other legal obligations, or any actual or suspected security incident, may result in governmental enforcement actions and prosecutions, private litigation, fines, penalties or adverse publicity and could cause our customers to lose trust in us, which could have an adverse effect on our reputation and business.
17
Interruptions or performance problems associated with our technology and infrastructure may adversely affect our business and operating results.
Our continued growth depends in part on the ability of our existing and potential customers and consumers to access our platform at any time and within an acceptable amount of time. Our platform is proprietary, and we rely on the expertise of members of our engineering, operations and software development teams for our platform’s continued performance. In addition, we depend on external data centers to host our applications. While we control and have access to our servers located in our external data centers, we do not control the operation of these facilities. We have experienced, and may in the future experience, disruptions, outages and other performance problems related to our platform due to a variety of factors, including infrastructure changes, introductions of new functionality, human or software errors, delays in scaling our technical infrastructure if we do not maintain enough excess capacity and accurately predict our infrastructure requirements, capacity constraints due to an overwhelming number of users accessing our platform simultaneously, denial-of-service attacks or other security-related incidents. For example, we have been the subject of denial-of-service attacks that have rendered our core software inaccessible for several hours. In addition, from time to time we experience limited periods of server downtime due to server failure or other technical difficulties. In some instances, we may not be able to identify the cause or causes of these performance problems within an acceptable period of time. It may become increasingly difficult to maintain and improve our performance, especially during peak usage times and as our platform becomes more complex and our user traffic increases due to, among other things, a growing number of customers and consumers originating from and demanding service in a greater number of countries. If our platform is unavailable or if our users are unable to access our platform within a reasonable amount of time, or at all, our business would be adversely affected and our brand could be harmed. In the event of any of the factors described above, or certain other failures of our infrastructure, customer or consumer data may be permanently lost. Moreover, our agreements with customers typically provide for limited service level commitments. Our customers may be eligible for credits if we are unable to meet these service level commitments. If we experience significant periods of service downtime in the future, we may be subject to claims by our customers against these service level commitments. To the extent that we do not effectively address capacity constraints, upgrade our systems as needed, and continually develop our technology and network architecture to accommodate actual and anticipated changes in technology, our business and operating results may be adversely affected.
Real or perceived errors, failures, or bugs in our platform could adversely affect our operating results and growth prospects.
Because our platform is complex, undetected errors, failures, vulnerabilities or bugs may occur, especially when updates are deployed or if there are issues with our secure access management procedures. Our platform is often used in connection with computing environments with different operating systems, system management software, equipment and networking configurations, which may cause errors in or failures of our platform or other aspects of the computing environments. In addition, deployment of our platform into complicated, large-scale computing environments may expose undetected errors, failures, vulnerabilities or bugs in our platform. Despite testing by us, errors, failures, vulnerabilities or bugs may not be found in our platform until after it is deployed to our customers or consumers. We have discovered, and expect to discover in the future, software errors, failures, vulnerabilities and bugs in our platform, and we anticipate that certain of these errors, failures, vulnerabilities and certain bugs can only be discovered and remediated after deployment to customers. Real or perceived errors, failures or bugs in our platform could result in negative publicity, loss of or delay in market acceptance of our platform, loss of competitive position or claims by customers for losses sustained by them. In such an event, we may be required, or may choose for customer relations or other reasons, to expend additional resources in order to help correct the problem and or repair goodwill with our customers.
Our payments platform is a core element of our business, and any failure to grow and develop our payment processing activities, or to anticipate changes in consumer behavior, could materially and adversely affect our business and financial results.
Our payments platform is a core element of our business. For the years ended December 31, 2017, 2016 and 2015, our payments platform generated 39%, 39% and 37% of our total revenue, respectively. Our future success depends in large part on the continued growth and development of our payments platform. If such activities are limited, restricted, curtailed or degraded in any way, or if we fail to continue to grow and develop such activities, our business may be materially and adversely affected.
The continued growth and development of our payments platform will depend on our ability to anticipate and adapt to changes in consumer behavior. For example, consumer behavior may change regarding the use of payment types, including the relative increased use of cash, ACH, crypto-currencies, card-based transactions, and other emerging or alternative payment methods and payment systems that we or our processing partners do not adequately support or that do not provide adequate commissions to Independent Sales Organizations such as us. Any failure to timely integrate emerging payment methods (e.g., Alipay, Bitcoin or other crypto-currencies) into our software, anticipate consumer behavior changes, or contract with processing partners that support such emerging payment technologies could cause us to lose traction among our customers, resulting in a corresponding loss of revenue, in the event such methods become popular among their consumers.
18
Our payments platform is subject to U.S. and international rules and regulations, some of which are still developing. If we fail to comply with such rules and regulations or if new laws, rules or practices applicable to payment systems restrict our ability to collect fees from our payments platform, our financial results could be materially and adversely effected.
Payment processing is subject to extensive regulation in the United States and other countries where we operate, and presents a wide range of risks. We may encounter increased regulatory scrutiny and new regulatory compliance requirements brought about by evolving laws, rules and regulations. Some of the payment processing activities on our platform are subject to price controls within the United States and other countries, and may be subject to an increase of price controls, including controls limiting the amount we are allowed to charge customers for processing transactions. In addition, certain countries limit payments-related activities by foreign companies, including by restricting the transfer of funds out of such countries. Changes in the laws, rules or practices applicable to payment systems such as VISA, MasterCard or American Express, among others, including changes resulting in increased costs that we or our customers must pay, may force changes to our payments platform that could adversely affect our business.
If we incur an actual or perceived breach to our payments platform, we may incur significant liabilities and our brand and reputation may be damaged.
We may suffer an attack on our payments platform that results in a breach of consumer cardholder data. We maintain payment records of our customers and consumers on our payments platform, and we are a potential target for hackers and other parties attempting to steal card data via cyber-attacks or other means. As we increase our consumer base and our brand becomes more widely known and recognized, we may become more of a target for these malicious third parties. If we experience any actual or perceived data breach as a result of third-party actions, employee negligence or error, or malfeasance, whether or not resulting in the unauthorized acquisition of or access to cardholder data, we could incur significant liability, our business may suffer and our brand and reputation may be damaged. We could be required to pay extensive fines and costs related to any such data breach, including costs incurred to replace cards and cardholder information and provide security monitoring services, and we could lose future sales and customers, any of which could harm our business and operating results. Such fines and costs could become due soon after such breach and exceed the amount of cash available to us, thereby impacting our ability to operate our business. In addition, a data breach or failure to comply with rules or regulations of payment systems could also result in the termination of our status as a registered Independent Sales Organization / Merchant Service Provider, thereby dramatically impairing our ability to continue doing business in the payments industry.
We are subject to risks related to our reliance on third-party processing partners to perform our payment processing services.
We depend on our third-party processing partners to perform payment processing services. Our processing partners may go out of business or otherwise be unable or unwilling to continue providing such services, which could significantly and materially reduce our payments revenue and disrupt our business. A number of our processing contracts require us to assume liability for any losses our processing partners may suffer as a result of losses caused by our customers, including losses caused by chargebacks and consumer or customer fraud. We have in the past and may in the future incur losses caused by chargebacks and fraud. In the event of a significant loss by our processing partners, we may be required to remit a large amount of cash following such event and, if we do not have sufficient cash on hand, may be deemed in breach of such contracts. In addition, our customers may be subject to quality issues related to products or services provided by our third-party processing partners or we may become involved in contractual disputes with our processing partners, both of which could impact our reputation and adversely impact our revenue. Certain contracts may expire or be terminated, and we may not be able to replicate the associated revenue through a new processing partner relationship for a considerable period of time.
We have initiated and expect to continue to initiate new third-party payment relationships or migrate to other third-party payment partners in the future. The initiation of these relationships and the transition from one relationship to another could require significant time and resources. Due to non-solicitation obligations under our existing contracts, establishing these new relationships may be challenging. Further, any new third-party payment processing relationships may not be as effective, efficient or well received by our customers and consumers, nor is there any assurance that we will be able to reach an agreement with such processing partners. Our contracts with such processing partners may be less lucrative. For instance, we may be required to pay more for payment processing or receive a less favorable revenue arrangement from our payment processing partners. We may also experience the termination of revenue streams due to such migrations or be subject to claims relating to any disputes that could arise as a result of migrations.
19
We may undertake to directly perform certain payment processing services and expand the scope of payment processing services we provide, which may require a significant investment of time and resources, and expand our exposure to potential liabilities.
In the future, we may undertake to directly perform certain payment processing services that we currently depend upon our processing partners to perform, expand the scope of payment processing services we provide, offer additional payment processing services or otherwise undertake additional responsibilities and liabilities related to such payment processing services. For example, in the future, we may undertake to act as a registered payment facilitator or payment service provider of the payment systems, providing merchants with a suite of services, including payment processing and funding and accepting payments as the merchant of record on behalf of other merchants. As part of our dynamic pricing functionality, we have undertaken to act as a payment service provider and the merchant of record for those dynamically priced classes booked on our mobile applications, and we may undertake to expand our role as a payment service provider to other areas of our platform. Any of these endeavors could require a significant investment of time and effective management of resources before presenting any potential upside for us, and may dramatically expand the scope of our potential contractual liability or exposure in the event of a lawsuit. Further, we may fail to effectively execute in performing such an expansion of services.
The market for business management software is intensely competitive, and if we do not compete effectively, our operating results could be harmed.
The market for business management software for the wellness services industry is fragmented and rapidly evolving, with relatively low barriers to entry. We face competition from in-house developed software systems, other software companies, and traditional paper-based methods. Our competitors vary in size and in the breadth and scope of the products and services they offer. In addition, there are a number of companies that are not currently direct competitors but that could in the future shift their focus to the wellness services industry and offer competing products and services. Some of these companies, such as Intuit and Square, have or may in the future acquire greater financial and other resources than we do and could bundle competing products and services with their other offerings or offer such products and services at lower prices as part of a larger sale. There is also a risk that certain of our current business partners could terminate their relationships with us and use the insights they have gained from partnering with us to introduce their own competing products. Many of our current and potential competitors have greater name recognition, established marketing relationships, access to larger customer bases and pre-existing relationships with customers, consultants, system integrators and resellers. Additionally, some potential customers in the wellness services industry, particularly large organizations, have elected, and may in the future elect, to develop their own business management software. Certain of our competitors have partnered with, or have acquired or been acquired by, and may in the future partner with or acquire, or be acquired by, other competitors to offer services, leveraging their collective competitive positions, which makes, or would make, it more difficult to compete with them. Moreover, we may also face competition from wellness booking services for consumers, or other consumer app or website companies, particularly as we grow our consumer brand and awareness.
Our competitors may be able to respond more quickly and effectively than we can to new or changing opportunities, technologies, standards or customer requirements. With the introduction of new technologies, the evolution of our platform and new market entrants, we expect competition to intensify in the future. Pricing pressures and increased competition generally could result in reduced sales, reduced margins, increased churn, reduced customer retention, further losses or the failure of our platform to achieve or maintain more widespread market acceptance, any of which could harm our business. For all of these reasons, we may fail to compete successfully against our current and future competitors, and if such failure occurs, our business will be harmed.
20
Failure to effectively expand our sales and marketing capabilities could harm our ability to increase our customer base and achieve broader market acceptance of our platform.
Increasing our customer base and number of active consumers, upgrading and expanding services to our existing customers, and achieving broader market acceptance of our platform will depend, to a significant extent, on our ability to effectively expand our sales and marketing operations and activities, including internationally. We are substantially dependent on our marketing organization to generate a sufficient pipeline of qualified sales leads and on our direct sales force to close new customers. From December 31, 2016 to December 31, 2017, our sales and marketing organizations decreased from 493 to 471 employees. We plan to expand our direct sales and account development specialist workforce, both domestically and internationally. We believe that there is significant competition for experienced sales professionals with the sales skills and technical knowledge that we require. Our ability to achieve significant revenue growth in the future will depend, in part, on our success in recruiting, training, and retaining a sufficient number of experienced sales professionals. New hires require significant training and time before they achieve full productivity, particularly in new sales segments and territories. Our recent and planned hires may not become productive as quickly as we expect, and we may be unable to hire or retain sufficient numbers of qualified individuals in the future in the markets where we do business. We cannot predict whether, or to what extent, our sales will increase, our existing customers will upgrade or expand their usage of our platform as we invest in our sales force, or how long it will take for sales personnel to become productive. If our marketing organization does not generate a sufficient pipeline of qualified sales leads and our direct sales force is unable to close customers, our business and future growth prospects could be harmed.
Any failure to offer high-quality customer support may adversely affect our relationships with our customers and our financial results.
In deploying and using our platform, our customers depend on our 24/7 customer support team to resolve complex technical and operational issues, including ensuring that our platform is implemented in a manner that integrates with a variety of third-party platforms. We may be unable to respond quickly enough to accommodate short-term increases in customer demand for customer support or to modify the nature, scope and delivery of our customer support to compete with changes in customer support services provided by our competitors. Increased customer demand for customer support, without corresponding revenue, could increase costs and adversely affect our operating results. Our sales are highly dependent on our business reputation and on positive recommendations from our existing customers. Any failure to maintain high-quality customer support, or a market perception that we do not maintain high-quality customer support, could adversely affect our reputation and brand, our ability to sell our platform to existing and prospective customers, our business, operating results and financial position.
Our quarterly results may fluctuate for various reasons, and if we fail to meet the expectations of analysts or investors, our stock price and the value of your investment could decline substantially.
Our quarterly financial results may fluctuate as a result of a variety of factors, many of which are outside of our control. If our quarterly financial results fall below the expectations of investors or any securities analysts who follow our stock, the price of our Class A common stock could decline substantially. Some of the important factors that may cause our revenue, operating results and cash flows to fluctuate from quarter to quarter include but are not limited to:
• | our ability to attract new customers, retain and increase sales to existing customers and satisfy our customers’ requirements; |
• | the mix of our customer base, including the concentration of high value subscribers; |
• | the volume of transactions processed on our payments platform; |
• | the adoption of our fee-based dynamic pricing marketing services by our customers and consumers; |
• | significant security breaches, technical difficulties or interruptions to our platform and any related impact on our reputation; |
• | the variability of revenues derived from our partners; |
• | the number of employees added; |
• | the rate of expansion and productivity of our sales force; |
• | the entrance of new competitors in our market, whether by established companies or new companies; |
• | changes in our or our competitors’ pricing; |
• | the amount and timing of operating costs and capital expenditures related to the expansion of our business, including our sales force, and expenses related to the development or acquisition of technologies or businesses; |
21
• | new pricing models, products, features or functionalities introduced by us or our competitors; |
• | the timing of payments by customers and other payment processing partners and payment defaults by customers or other payment processing partners; |
• | litigation, including class action litigation, involving our company, our services or our industry; |
• | general economic conditions or declines in consumer interest in the wellness industries that we serve, either of which may adversely affect either our customers’ ability or willingness to purchase additional subscriptions, delay a prospective customer’s purchasing decision, reduce the value of new subscription contracts or affect customer retention; |
• | changes in the relative and absolute levels of customer support we provide; |
• | changes in foreign currency exchange rates; |
• | extraordinary expenses such as litigation or other dispute-related settlement payments; |
• | the impact of new accounting pronouncements; and |
• | the timing of the grant or vesting of equity awards to employees. |
Many of these factors are outside of our control, and the occurrence of one or more of them might cause our revenue, operating results and cash flows to vary widely. As such, we believe that quarter-to-quarter comparisons of our revenue, operating results and cash flows may not be meaningful and should not be relied upon as an indication of future performance.
If we fail to effectively manage our growth in a manner that preserves the key aspects of our corporate culture, our business and operating results could be harmed.
We believe that our corporate culture fosters innovation, creativity and teamwork. However, as our organization grows, we may find it increasingly difficult to maintain the beneficial aspects of such culture, and the failure to do so could adversely impact our ability to retain and attract the kind of employees necessary for our future success. If we are unable to manage our anticipated growth and change in a manner that preserves the key aspects of our culture, the quality of our products and services may suffer, which could adversely affect our brand and reputation and harm our ability to retain and attract customers.
We depend on our executive officers and other key employees, and the loss of one or more of these employees or an inability to attract and retain highly skilled employees could adversely affect our business.
Our success depends largely upon the continued services of our executive officers and other key employees, including our Chairman and Chief Executive Officer, Richard Stollmeyer. We rely on our leadership team in the areas of research and development, operations, security, marketing, sales, support, general and administrative functions, and on individual contributors in our research and development and operations. We have experienced, and may in the future experience, changes in our executive management team resulting from the hiring or departure of executives, which could disrupt our business. We do not have employment agreements with our executive officers or other key personnel that require them to continue to work for us for any specified period, and, therefore, they could terminate their employment with us at any time. The loss of one or more of our executive officers, especially our Chief Executive Officer, or other key employees, could have an adverse effect on our business.
In addition, to execute our growth plan, we must attract and retain highly qualified personnel. Competition for these personnel in the locations where we maintain offices is intense, especially in the San Luis Obispo area, where our headquarters is located, due in part to the relatively close proximity to the San Francisco Bay Area. We have from time to time experienced, and we expect to continue to experience, difficulty in hiring and retaining employees with appropriate qualifications. In some cases, we have recruited employees from the San Francisco Bay Area and other regions with a greater supply of managerial, sales and engineering talent, and in such cases, we have sometimes found it necessary to offer compensation packages that were larger than would have been necessary if no relocation had been required. We also outsource some of our research and development to India, which requires compliance with security protocols. Many of the companies with which we compete for experienced personnel have greater resources than we have and are located in areas in which sales and engineering talent is more readily available. Moreover, job candidates and existing employees often consider the value of the equity awards they receive in connection with their employment. If the perceived value of our equity awards declines, our ability to recruit and retain highly skilled employees may be adversely impacted. If we hire employees from competitors or other companies, their former employers may attempt to assert that these employees have breached their legal obligations, resulting in a diversion of our time and resources. If we fail to attract new personnel or fail to retain and motivate our current personnel, our business and future growth prospects could be adversely affected.
22
If we are not able to maintain and enhance our brand, then our business, operating results and financial condition may be adversely affected.
We believe that maintaining and enhancing our reputation as a differentiated and category-defining business management software company serving the wellness services industry and consumers through a two-sided marketplace is critical to our relationship with our existing customers and to our ability to attract new customers. The successful promotion of our brand attributes will depend on a number of factors, including our marketing efforts, our ability to continue to develop high-quality software, and our ability to successfully differentiate our platform from competitive products and services.
The promotion of our brand requires us to make substantial expenditures, and we anticipate that the expenditures will increase as our market becomes more competitive and as we seek to expand our platform. To the extent that these activities yield increased revenue, this revenue may not offset the increased expenses we incur. If we do not successfully maintain and enhance our brand, our business may not grow, we may have reduced pricing power relative to competitors, and we could lose customers or fail to attract potential customers, all of which would adversely affect our business, results of operations and financial condition.
Unfavorable conditions in our industry or the global economy or reductions in information technology spending could limit our ability to grow our business and adversely affect our operating results.
Our operating results may vary based on the impact of changes in our industry or the global economy on us or our customers. The revenue growth and potential profitability of our business depend on demand for business management software generally and for business management software serving the wellness services industry in particular. Historically, during economic downturns, there have been reductions in spending on information technology as well as pressure for extended billing terms and other financial concessions. The adverse impact of economic downturns may be particularly acute among small and medium-sized businesses, which comprise the vast majority of our customer base. If economic conditions deteriorate, our current and prospective customers may elect to decrease their information technology budgets, which would limit our ability to grow our business and adversely affect our operating results.
Our financial results may fluctuate due to increasing variability in our sales cycles resulting from, among other things, an expansion of the focus of our sales efforts to include larger organizations.
We plan our expenses based on certain assumptions about the length and variability of our sales cycle. These assumptions are based upon historical trends for sales cycles and conversion rates associated with our existing customers, many of whom to date have been small to medium-sized organizations. As we expand our sales efforts to include larger organizations, we have incurred and expect to continue to incur higher costs and longer and more unpredictable sales cycles. With larger organizations, the decision to subscribe to our platform may require the approval of more technical personnel and management levels within a potential customer’s organization than we have historically encountered, and if so, these types of sales would require us to invest more time educating these potential customers. In addition, larger organizations may demand more features and integration and customer support services. We have limited experience in developing and managing sales strategies for larger organizations and in successfully onboarding larger organizations as new customers. As a result of these factors, these sales opportunities may not prove to be successful or may require us to devote greater research and development, sales, customer support and professional services resources to individual customers, resulting in increased costs and reduced profitability, and will likely lengthen our typical sales cycle, which could strain our resources. Moreover, these larger transactions may require us to delay recognizing the associated revenue we derive from these customers until any technical or implementation requirements have been met, and larger customers may demand discounts to the prices they pay for our platform.
Other factors that may influence the length and variability of our sales cycle include but are not limited to:
• | our pricing terms; |
• | the need to educate prospective customers about the uses and benefits of our platform; |
• | lead generation, including both inbound and outbound; |
• | the discretionary nature of purchasing and budget cycles and decisions; |
• | the competitive nature of evaluation and purchasing processes; |
• | evolving functionality demands; |
• | announcements or planned introductions of new products, features or functionality by us or our competitors; and |
• | lengthy purchasing approval processes, particularly among larger organizations. |
23
If we are unsuccessful expanding sales to larger organizations, our business and results of operations could be adversely affected. In addition, if we are unable to close one or more expected significant transactions with customers in a particular period, or if one or more expected transactions are delayed until a subsequent period, our operating results for that period, and for any future periods in which revenue from such transactions would otherwise have been recognized, may be adversely affected.
Our future performance depends in part on our reliance on third-party platforms to distribute our mobile applications, and support from our partner ecosystem.
We rely on third-party distribution platforms, including the Apple App Store and Google Play, for distribution of our mobile applications. We are subject to these platform providers’ standard terms and conditions for application developers, which govern the promotion, distribution and operation of applications on their platforms. If we violate, or if a platform provider believes that we have violated, its terms and conditions, the platform provider may, at its discretion, discontinue or limit our access to their platform. We are currently in the process of operationalizing changes to our branded mobile apps offering to comply with Apple’s recent changes to its terms of service. These platform providers have broad discretion to change their terms and conditions at any time, with or without notice to application developers, and to interpret their respective terms and conditions in a manner that limits, eliminates or otherwise interferes with our ability to distribute our mobile applications through their platforms. If Apple or Google took any of these steps to limit or otherwise interfere with our business, our business, financial condition and results of operations could be adversely affected.
We also depend on our partner ecosystem to create applications that will integrate with our platform. This presents certain risks to our business, including:
• | our API’s security standards could limit integration possibilities for our apps with partners’ products; |
• | these applications may not meet the same quality standards that we apply to our own development efforts (including, among other things, data and privacy protections), and to the extent they contain bugs or defects, they may create disruptions in our customers’ use of our platform or adversely affect our brand; |
• | we do not currently provide substantive support for software applications developed by our partner ecosystem, and users may be left without adequate support and potentially cease using our platform if our partners do not provide adequate support for these applications; |
• | our partners may not possess the appropriate intellectual property rights to develop and share their applications; |
• | our relationship with our partners may change, particularly those partners who contribute or who have contributed more significantly to our revenue or demand for our platform, which could adversely affect our revenue and our results of operations; |
• | some of our partners may use the insight or access to data that they gain from integrating with our software and from information publicly available to develop competing products or product features; and |
• | our partners may establish relationships with, or functionality to offer to, our customers that diminish or eliminate the need or desire for our API platform. |
Since many of these risks are not within our control, any new standards or requirements by these third-party developers or platforms could adversely affect our business, thereby reducing our revenue or increase our operating costs and adversely affecting our growth prospects.
We have in the past completed acquisitions, and we may in the future acquire or invest in companies. Such acquisitions and investments divert our management’s attention and may in some cases result in additional dilution to our stockholders. In addition, we may be unable to integrate the acquired businesses and technologies successfully or achieve the expected benefits of such acquisitions.
We have in the past acquired companies, including our acquisition of HealCode LLC in 2016, Lymber Wellness, Inc. in 2017 and FitMetrix in 2018, and we may in the future evaluate and consider potential strategic transactions, including acquisitions of, or investments in, businesses, technologies, services, products and other assets in the future. We also may enter into relationships with other businesses to expand our platform, which could involve preferred or exclusive licenses, additional channels of distribution, discount pricing or investments in other companies.
24
Any acquisition, investment or business relationship may result in unforeseen operating difficulties and expenditures. In particular, we may encounter difficulties assimilating or integrating the businesses, technologies, products, personnel or operations of the acquired companies, particularly if the key personnel of the acquired company choose not to work for us, their software is not easily adapted to work with our platform or we have difficulty retaining the customers of any acquired business due to changes in ownership, management or otherwise. The pursuit of potential acquisitions, whether or not they are consummated, may also disrupt our business, divert our resources and require significant management attention that would otherwise be available for development of our existing business. Moreover, the anticipated benefits of any acquisition, investment or business relationship may not be realized and/or we may be exposed to unknown risks or liabilities.
Negotiating these transactions can be time-consuming, difficult and expensive, and our ability to complete these transactions may be subject to approvals that are beyond our control. Consequently, these transactions, even if announced, may not be completed. For one or more of these transactions, we may:
• | issue additional equity securities that would dilute our existing stockholders; |
• | use cash that we may need in the future to operate our business; |
• | incur large charges or substantial liabilities, whether known or unknown, associated with the acquisition; |
• | encounter difficulties maintaining relationships with customers and partners of the acquired business; |
• | encounter difficulties incorporating acquired technologies and rights into our platform, providing access and rights to our internal systems and of maintaining quality and security standards consistent with our reputation and brand; |
• | incur debt on terms unfavorable to us or that we are unable to repay; |
• | encounter difficulties retaining key employees of the acquired company, integrating diverse software codes or business cultures or coordinating organizations that are geographically diverse and that have different business cultures; |
• | incur impairment charges related to potential write-downs of acquired assets or goodwill; |
• | incur acquisition-related costs, which would be recognized as current period expenses; and |
• | become subject to adverse tax consequences, substantial depreciation or deferred compensation charges. |
The occurrence of any of these risks could have a material adverse effect on our business operations and financial results.
Real or perceived inaccuracies in our key, user and other metrics may harm our reputation and negatively affect our business.
The numbers for certain of our key, user and other metrics, including, among others, active consumers, registered users of our applications and number of wellness practitioners employed by our customers, are calculated using internal company data based on the activity of customer and consumer accounts. While these numbers are based on what we believe to be reasonable estimates for the applicable period of measurement, there are inherent challenges in measuring usage of our platform, usage of specific features of our platform, and user information across large online and mobile populations around the world. For example, we estimate that approximately 41 million active consumers used our platform during the two years ended December 31, 2017. In calculating this number, we have attempted to avoid duplicative counting of consumers by identifying consumers who may have used our platform through different customers. However, in certain cases, a single consumer may have transacted with multiple customers under slightly different names, in which case there is a chance that we have counted the same consumer more than once. Given the challenges inherent in identifying whether a single consumer has engaged in transactions on our platform under different names, we do not have a reliable way of identifying the precise number of consumers using our platform. We are continuing to invest in our systems and controls to improve the precision and reliability of our metrics. If third parties, including investors and analysts, do not perceive our metrics to be accurate, or if we discover material inaccuracies in our metrics, we may be subject to liability and our reputation may be harmed, which could negatively affect our business and financial results.
25
Our international sales and operations subject us to additional risks that can adversely affect our business, operating results and financial condition.
In the years ended December 31, 2017, 2016 and 2015, we derived 19%, 17% and 16%, respectively, of our revenue from customers located outside of the United States. We are continuing to expand our international operations as part of our growth strategy. We currently have sales personnel and sales and customer support operations in the United States, the United Kingdom and Australia. Our sales organization outside the United States is substantially smaller than our sales organization in the United States. We believe our ability to convince new customers to subscribe to our platform or to convince existing customers to renew or expand their use of our platform is directly correlated to the level of engagement we obtain with the customer. To the extent we are unable to effectively engage with non-U.S. customers due to our limited sales force capacity, we may be unable to effectively grow in international markets.
Our international operations subject us to a variety of additional risks and challenges, including:
• | compliance with foreign privacy, information security and data protection laws and regulations and the risks and costs of non-compliance; |
• | differing technical standards, existing or future regulatory and certification requirements and required features and functionality; |
• | requirements or customer requests for localized software and licensing programs, and localized language support; |
• | increased management, travel, infrastructure and legal compliance costs associated with having international operations; |
• | uncertainty regarding the expected departure of the United Kingdom from the European Union; |
• | increased financial accounting and reporting burdens and complexities; |
• | longer payment cycles and difficulties in enforcing contracts, collecting accounts receivable or satisfying revenue recognition criteria, especially in emerging markets; |
• | requirements or preferences for domestic products; |
• | economic conditions in each country or region and general economic uncertainty around the world; |
• | compliance with laws and regulations for foreign operations, including anti-bribery laws (such as the U.S. Foreign Corrupt Practices Act of 1977, as amended, or the FCPA, the U.S. Travel Act, and the U.K. Bribery Act 2010), import and export control laws, tariffs, trade barriers, economic sanctions and other regulatory or contractual limitations on our ability to sell our platform in certain foreign markets, and the risks and costs of non-compliance; |
• | heightened risks of unfair or corrupt business practices in certain geographies and of improper or fraudulent sales arrangements that may impact our financial results and result in restatements of our consolidated financial statements; |
• | fluctuations in currency exchange rates and related effect on our operating results; |
• | difficulties in repatriating or transferring funds from or converting currencies in certain countries; |
• | communication and integration problems related to entering new markets with different languages, cultures and political systems; |
• | differing labor standards, including restrictions related to, and the increased cost of, terminating employees in some countries; |
• | the need or customer requests for localized language support; |
• | reduced protection for intellectual property rights in some countries and practical difficulties of enforcing rights abroad; and |
• | compliance with the laws of numerous foreign taxing jurisdictions, including withholding obligations, and overlapping of different tax regimes. |
Any of these risks could adversely affect our international operations, reduce our international revenue or increase our operating costs, adversely affecting our business, operating results, financial condition and growth prospects.
26
Compliance with laws and regulations applicable to our international operations substantially increases our cost of doing business in foreign jurisdictions. We may be unable to keep current with changes in government requirements as they change from time to time. Failure to comply with these regulations could have adverse effects on our business. In many foreign countries, it is common for others to engage in business practices that are prohibited by our internal policies and procedures or U.S. or other regulations applicable to us. Although we have implemented policies and procedures designed to ensure compliance with these laws and policies, there can be no assurance that all of our employees, contractors, partners and agents will comply with these laws and policies. Violations of laws or key control policies by our employees, contractors, partners, or agents could result in delays in revenue recognition, financial reporting misstatements, enforcement actions, disgorgement of profits, fines, civil and criminal penalties, damages, injunctions, other collateral consequences, or the prohibition of the importation or exportation of our platform and services and could adversely affect our business and results of operations.
We are subject to anti-corruption and anti-money laundering laws with respect to our operations and non-compliance with such laws can subject us to criminal and/or civil liability and harm our business.
We are subject to the FCPA, the U.S. domestic bribery statute contained in 18 U.S.C. § 201, the U.S. Travel Act, the USA PATRIOT Act, the U.K. Bribery Act 2010 and Proceeds of Crime Act 2002, and possibly other anti-bribery and anti-money laundering laws in countries in which we conduct activities. Anti-corruption laws are interpreted broadly and prohibit companies and their employees and third-party intermediaries from authorizing, offering, or providing, directly or indirectly, improper payments or benefits to recipients in the public or private sector. We use third-party representatives to sell our products and services abroad. In addition, as we increase our international sales and business, we may engage with additional business partners and third-party intermediaries to sell our products and services abroad and to obtain necessary permits, licenses and other regulatory approvals. We or our third-party intermediaries may have direct or indirect interactions with officials and employees of government agencies or state-owned or affiliated entities. We can be held liable for the corrupt or other illegal activities of these third-party intermediaries, our employees, representatives, contractors, partners and agents, even if we do not explicitly authorize such activities.
Noncompliance with anti-corruption and anti-money laundering laws could subject us to whistleblower complaints, investigations, sanctions, settlements, prosecution, other enforcement actions, disgorgement of profits, significant fines, damages, other civil and criminal penalties or injunctions, suspension and/or debarment from contracting with certain persons, the loss of export privileges, reputational harm, adverse media coverage and other collateral consequences. If any subpoenas or investigations are launched, or governmental or other sanctions are imposed, or if we do not prevail in any possible civil or criminal litigation, our business, results of operations and financial condition could be materially harmed. In addition, responding to any action will likely result in a materially significant diversion of management’s attention and resources and significant defense costs and other professional fees. Enforcement actions and sanctions could further harm our business, results of operations and financial condition.
Certain of our operating results and financial metrics may be difficult to predict as a result of seasonality.
We believe there are significant seasonal factors that may cause us to record higher revenue in some quarters compared with others. We believe this variability is largely due to our focus on the wellness services industry, as many of our customers experience an increase in demand for their services in the first quarter of each year due to their clients becoming more motivated to pursue health and fitness goals in the new year. Our rapid growth rate over the last couple years may have made seasonal fluctuations more difficult to detect. In addition, as we attempt to expand the number of our customers and consumers, we may see changes to this pattern of seasonality. If our rate of growth slows over time, seasonal or cyclical variations in our operations may become more pronounced, and our business, results of operations and financial position may be adversely affected.
Our business and growth depend in part on the success of our strategic relationships with third parties, including payments partners, API platform partners and technology partners.
We depend on, and anticipate that we will continue to depend on, various third-party relationships in order to sustain and grow our business. We are highly dependent upon partners for certain critical features and functionality of our platform, including data centers and third-party payment processors supporting our payments platform. Failure of these or any other technology providers to maintain, support or secure their technology platforms in general, and our integrations in particular, or errors or defects in their technology, could materially and adversely impact our relationship with our customers, damage our reputation and brand, and harm our business and operating results. Any loss of the right to use any of this hardware or software could result in delays or difficulties in our ability to provide our platform until equivalent technology is either developed by us or, if available, identified, obtained and integrated.
27
Identifying, negotiating and documenting relationships with strategic third parties such as payments partners, API partners and technology partners requires significant time and resources. In addition, integrating third-party technology is complex, costly and time-consuming. Our agreements with these partners are typically limited in duration, non-exclusive and do not prohibit them from working with our competitors or from offering competing services. Our competitors may be effective in providing incentives to third parties to favor their products or services or to prevent or reduce subscriptions to our platform. In addition, our partners could develop competing products or services.
Our third-party partners may also suffer disruptions or weakness in their businesses unrelated to the relationships with us that could cause declines in their business performance. Such occurrences could be harmful to our financial results and cause our stock price to decline.
If we are unsuccessful in establishing or maintaining our relationships with these strategic third parties, our ability to compete in the marketplace or to grow our revenue could be impaired and our operating results could suffer. Even if we are successful, we cannot assure you that these relationships will result in improved operating results.
We depend and rely upon SaaS technologies from third parties and on technology systems and electronic communication networks that are supplied and managed by third parties to operate our business, and interruptions or performance problems with these technologies may adversely affect our business and operating results.
We rely heavily on hosted SaaS applications from third parties in order to operate critical functions of our business, including sales automation and pipeline management, billing and order management, customer support, access to our API, IT support, enterprise resource planning, payroll and financial accounting services. If these services become unavailable due to extended outages or interruptions, security vulnerabilities or cyber-attacks, including prolonged denial-of-service attacks, or because they are no longer available on commercially reasonable terms, our expenses could increase, our ability to manage finances could be interrupted and our processes for managing sales of our platform and supporting and communicating with our customers could be impaired until equivalent services, if available, are identified, obtained and implemented, all of which could adversely affect our business.
Our ability to provide services and solutions to our customers also depends on our ability to communicate with our customers through the public Internet and electronic networks that are owned and operated by third parties. In addition, in order to provide services on-demand and promptly, our computer equipment and network servers must be functional 24 hours per day, which requires access to telecommunications facilities managed by third parties and the availability of electricity, which we do not control. A severe disruption of one or more of these networks, including as a result of utility or third-party system interruptions, could impair our ability to process information, which could impede our ability to provide services to our customers, harm our reputation, result in a loss of customers and adversely affect our business and operating results.
We are subject to risks related to litigation, including, among others, intellectual property , commercial and employment claims and regulatory disputes.
From time to time we may become involved in legal proceedings or be subject to claims, lawsuits (whether class actions or individual lawsuits), government investigations and other proceedings involving alleged infringement of third-party patents and other intellectual property rights, or commercial, corporate and securities, privacy, accessibility, marketing and communications practices, labor and employment, wage and hour and other matters. Our future success depends in part on not infringing upon the intellectual property rights of others. From time to time, we may receive claims from third parties, including our competitors that our platform and underlying technology infringe or violate a third-party’s intellectual property rights, and we may be found to be infringing upon such rights. We may be unaware of the intellectual property rights of others that may cover some or all of our technology. Any claims or litigation could cause us to incur significant expenses and, if successfully asserted against us, could require that we pay substantial damages or ongoing royalty payments, prevent us from offering our platform, or require that we comply with other unfavorable terms. We may also be obligated to indemnify our customers or business partners in connection with any such litigation and to obtain licenses, modify our platform or refund subscription fees, which could further exhaust our resources. In addition, we may incur substantial costs to resolve claims or litigation, whether or not successfully asserted against us, which could include payment of significant settlement, royalty or license fees, modification of our platform or refunds to customers of subscription fees. Even if we were to prevail in the event of claims or litigation against us, such claims or litigation could be costly and time-consuming and divert the attention of our management and other employees from our business operations.
28
Our use of “open source” software could adversely affect our ability to sell our platform and subject us to possible litigation.
We use open source software in our platform and expect to continue to use open source software in the future. We may face claims from others claiming ownership of, or seeking to enforce the terms of, an open source license, including by demanding release of the open source software, derivative works or our proprietary source code that was developed using such software. These claims could also result in litigation, require us to purchase a costly license or require us to devote additional research and development resources to change our platform, any of which would have a negative effect on our business and operating results. In addition, if the license terms for the open source software we utilize change, we may be forced to reengineer our platform or incur additional costs. Although we have implemented policies to regulate the use and incorporation of open source software into our platform, we cannot be certain that we have not incorporated open source software in our platform in a manner that is inconsistent with such policies.
Any failure to protect our intellectual property rights could impair our ability to protect our proprietary technology and our brand.
Our success and ability to compete depend in part upon our intellectual property. We currently have twelve pending patent applications, but there is no guarantee that such applications will result in issued patents. We primarily rely on copyright, trade secret and trademark laws, trade secret protection and confidentiality or license agreements with our employees, customers, partners and others to protect our intellectual property rights. However, the steps we take to protect our intellectual property rights may be inadequate.
To protect our intellectual property rights, we may be required to spend significant resources to monitor and protect these rights. Litigation brought to protect and enforce our intellectual property rights could be costly, time-consuming and distracting to management, and could result in the impairment or loss of portions of our intellectual property. Furthermore, our efforts to enforce our intellectual property rights may be met with defenses, counterclaims and countersuits attacking the validity and enforceability of our intellectual property rights. Our failure to secure, protect and enforce our intellectual property rights could adversely affect our brand and adversely impact our business.
We may not be able to secure additional financing on favorable terms, or at all, to meet our future capital needs.
We have funded our operations since inception primarily through equity financings, loan facilities, financing agreements for software and license maintenance and subscription payments by our customers for use of our platform. For instance, in May 2017, we completed a follow-on public offering in which we issued and sold 5,060,000 shares of our Class A common stock at a public offering price of $27.95 per share. In the future, we intend to continue to make investments to support our business growth, and we may require additional capital to respond to business opportunities, challenges, acquisitions, or unforeseen circumstances. We may not be able to timely secure additional debt or equity financing on favorable terms, or at all. Any debt financing obtained by us could involve restrictive covenants relating to financial and operational matters, which may make it more difficult for us to obtain additional capital and to pursue business opportunities, including potential acquisitions. If we raise additional funds through further issuances of equity, convertible debt securities or other securities convertible into equity, our existing stockholders could suffer significant dilution in their percentage ownership of our company, and any new equity securities we issue could have rights, preferences and privileges senior to those of holders of our Class A common stock. If we are unable to obtain adequate financing or financing on terms satisfactory to us, when we require it, our ability to continue to grow or support our business and to respond to business challenges could be significantly limited.
Our loan agreement contains operating and financial covenants that restrict our business and financing activities.
Borrowings under our loan agreement with Silicon Valley Bank are secured by substantially all of our assets, including our intellectual property. In addition, borrowings under our loan agreement are based on a percentage of our monthly recurring revenue for the prior months, up to $20 million, with an accordion feature that allows for additional borrowings under our loan agreement in an aggregate amount of $20 million, upon our request and subject to certain conditions. If our revenue declines, our ability to draw under the loan agreement could be adversely affected or if we were to draw under the loan agreement, a decline in our revenue could force us to repay all or a portion of the outstanding loan earlier than we may have originally anticipated.
Our loan agreement also restricts our ability to, among other things:
• | sell or otherwise dispose of our assets; |
• | make material changes in our business; |
• | enter into a transaction in which stockholders who were not stockholders immediately prior to such transaction own more than 40% of our voting stock after giving effect to such transaction; |
29
• | consolidate, merge with, or acquire other entities; |
• | incur additional indebtedness; |
• | create liens on our assets; |
• | pay dividends or make other distributions on our capital stock; |
• | make investments; |
• | enter into transactions with affiliates; and |
• | pay off or redeem subordinated indebtedness. |
These restrictions are subject to certain exceptions. The operating and financial restrictions and covenants in the loan agreement, as well as any future financing agreements that we may enter into, could restrict our ability to finance our operations and to engage in, expand or otherwise pursue business activities and strategies that we or our stockholders may consider beneficial. Our ability to comply with these covenants may be affected by events beyond our control, and future breaches of any of these covenants could result in a default under the loan agreement.
The loan agreement also contains customary events of default, subject to cure periods for certain defaults, including, among others, payment defaults, covenant defaults, the occurrence of a material adverse change in our business, defaults relating to certain legal processes affecting our assets or business, insolvency and bankruptcy defaults, cross-defaults to other material indebtedness, material judgment defaults and material misrepresentations. Future defaults, if not waived, could cause all of the outstanding indebtedness under our loan agreement to become immediately due and payable and would permit Silicon Valley Bank to terminate all commitments to extend further credit and exercise remedies against the collateral in which we granted Silicon Valley Bank a security interest.
If we do not have or are unable to generate sufficient cash available to repay our debt obligations when they become due and payable, either upon maturity or in the event of a default, we may not be able to obtain additional debt or equity financing on favorable terms, if at all. This could materially and adversely affect our liquidity and financial condition and our ability to operate and continue our business as a going concern.
We face exposure to foreign currency exchange rate fluctuations.
We conduct transactions in currencies other than the U.S. dollar. While we have primarily transacted with customers and vendors in U.S. dollars, we have transacted in foreign currencies for subscriptions to our platform and expect to significantly expand the number of transactions with customers for our platform that are denominated in foreign currencies in the future. As a result of such foreign currency exchange rate fluctuations, it could be more difficult to detect underlying trends in our business and results of operations. In addition, to the extent that fluctuations in currency exchange rates, including, any fluctuations resulting from uncertainties relating to the expected departure of the United Kingdom from the European Union, cause our results of operations to differ from our expectations or the expectations of our investors, the trading price of our Class A common stock could be adversely affected.
We do not currently maintain a program to hedge transactional exposures in foreign currencies. However, in the future, we may use derivative instruments, such as foreign currency forward and option contracts, to hedge certain exposures to fluctuations in foreign currency exchange rates. The use of such hedging activities may not offset any or more than a portion of the adverse financial effects of unfavorable movements in foreign exchange rates over the limited time the hedges are in place. Moreover, the use of hedging instruments may introduce additional risks if we are unable to structure effective hedges with such instruments.
We may be subject to additional tax liabilities in connection with our operations or due to future legislation, each of which could materially impact our financial position and results of operation.
We are subject to federal and state income, sales, use, value added and other taxes in the United States and other countries in which we conduct business, and such laws and rates vary by jurisdiction. We do not collect sales and use, value added and similar taxes in all jurisdictions in which we have sales, based on our belief that such taxes are not applicable. Certain jurisdictions in which we do not collect sales, use, value added or other taxes on our sales may assert that such taxes are applicable, which could result in tax assessments, penalties and interest, and we may be required to collect such taxes in the future.
30
Significant judgment is required in determining our worldwide provision for income taxes. We generally conduct our international operations through wholly owned subsidiaries and report our taxable income in various jurisdictions worldwide based upon our business operations in those jurisdictions. Our intercompany relationships are subject to complex transfer pricing regulations administered by taxing authorities in various jurisdictions. These determinations are highly complex and require detailed analysis of the available information and applicable statutes and regulatory materials. In the ordinary course of our business, there are many transactions and calculations where the ultimate tax determination is uncertain.
Although we believe our tax practices and provisions are reasonable, the final determination of tax audits and any related litigation could be materially different from our historical tax practices, provisions and accruals. If we receive an adverse ruling as a result of an audit, or we unilaterally determine that we have misinterpreted provisions of the tax regulations to which we are subject, there could be a material effect on our tax provision, net income or cash flows in the period or periods for which that determination is made, which could materially impact our financial results. Further, any changes in the taxation of our activities, including recent changes in U.S. tax laws, may increase our worldwide effective tax rate and adversely affect our financial position and results of operations. In addition, liabilities associated with taxes are often subject to an extended or indefinite statute of limitations period. Therefore, we may be subject to additional tax liability (including penalties and interest) for a particular year for extended periods of time.
Our ability to use our net operating losses to offset future taxable income may be subject to certain limitations.
As of December 31, 2017, we had federal and state net operating loss carryforwards, or NOLs, of $118.0 million and $103.0 million, respectively, due to prior period losses, which, subject to the following discussion, are generally available to be carried forward to offset our future taxable income, if any, until such NOLs are used or expire. Our federal NOLs begin to expire in the year ending December 31, 2025, and our state NOLs started to expire in 2016 for the earliest net operating loss layers. In general, under Section 382 of the U.S. Internal Revenue Code of 1986, as amended, or the Code, a corporation that undergoes an “ownership change” is subject to limitations on its ability to utilize its NOLs to offset future taxable income. Similar rules may apply under state tax laws. During the year ended December 31, 2015, we completed an analysis under Section 382 of the Code through December 31, 2014, and determined that we experienced multiple ownership changes during this period which will limit future utilization of NOL carryforwards. U.S. federal NOLs of approximately $430,000 are expected to expire due to limitations under Section 382 and, as such, have not been reflected in the NOL carryforward above. Future changes in our stock ownership, some of which are outside of our control, could result in additional ownership changes under Section 382 of the Code. Furthermore, our ability to utilize NOLs of companies that we have acquired or may acquire in the future may be subject to limitations. There is also a risk that due to regulatory changes, such as suspensions on the use of NOLs, or other unforeseen reasons, our existing NOLs could expire or otherwise be unavailable to offset future income tax liabilities. For these reasons, we may not be able to realize a tax benefit from the use of our NOLs, whether or not we attain profitability
Changes in laws and regulations related to the Internet or changes in the Internet infrastructure itself may diminish the demand for our platform, and could have a negative impact on our business.
The future success of our business depends upon the continued use of the Internet as a primary medium for commerce, communication and business applications. Federal, state or foreign government bodies or agencies have in the past adopted, and may in the future adopt, laws or regulations affecting the use of the Internet as a commercial medium. Changes in these laws or regulations could require us to modify our platform in order to comply with these changes. In addition, government agencies or private organizations have imposed and may impose additional taxes, fees or other charges for accessing the Internet or commerce conducted via the Internet. These laws or charges could limit the growth of Internet-related commerce or communications generally, or result in reductions in the demand for Internet-based platforms and services such as ours. In addition, the use of the Internet as a business tool could be adversely affected due to delays in the development or adoption of new standards and protocols to handle increased demands of Internet activity, security, reliability, cost, ease-of-use, accessibility and quality of service. The performance of the Internet and its acceptance as a business tool has been adversely affected by “viruses,” “worms” and similar malicious programs, and the Internet has experienced a variety of outages and other delays as a result of damage to portions of its infrastructure. If the use of the Internet is adversely affected by these issues, demand for our platform could decline.
31
Catastrophic events may disrupt our business.
Our corporate headquarters are located in San Luis Obispo, California, and we utilize data centers that are located in North America. Key features and functionality of our platform are enabled by third parties that are headquartered in California and operate or utilize data centers in the United States. Additionally, we rely on our network and third-party infrastructure and enterprise applications, internal technology systems, and our website for our development, marketing, operational support, hosted services and sales activities. The west coast of the United States contains active earthquake zones, both Northern and Southern California have experienced devastating wildfires, and Southern California has recently experiences significant flooding. In addition, the Diablo Canyon nuclear power plant is located a short distance from San Luis Obispo. In the event of a major earthquake, hurricane or other natural disaster, or a catastrophic event such as a nuclear disaster, fire, power loss, telecommunications failure, cyber-attack, war or terrorist attack, we may be unable to continue our operations and may endure system interruptions, reputational harm, delays in our app development, lengthy interruptions in our platform, breaches of data security or data integrity and loss of critical data, all of which could have an adverse effect on our future operating results.
We are subject to governmental economic sanctions and export and import controls that could impair our ability to compete in international markets or subject us to liability if we are not in compliance with applicable laws.
As a U.S. company, we are subject to U.S. export control and economic sanctions laws and regulations, and we are required to export our technology, software, products and services in compliance with those laws and regulations, including the U.S. Export Administration Regulations and economic embargo and trade sanction programs administered by the Treasury Department’s Office of Foreign Assets Control. U.S. economic sanctions and export control laws and regulations prohibit the shipment of certain products and services to countries, governments and persons targeted by U.S. sanctions. While we are currently taking precautions to prevent doing any business, directly or indirectly, with countries, governments and persons targeted by U.S. sanctions and to ensure that our business management software is not exported or used by countries, governments and persons targeted by U.S. sanctions, such measures may be circumvented.
Furthermore, if we export our technology, hardware or software, the exports may require authorizations, including a license, a license exception or other appropriate government authorization. Complying with export control and sanctions regulations for a particular sale may be time-consuming and may result in the delay or loss of sales opportunities. Failure to comply with export control and sanctions regulations for a particular sale may expose us to government investigations and penalties, which could have an adverse effect on our business, operating results and financial condition.
If we are found to be in violation of U.S. sanctions or export control laws, it could result in fines or penalties for us and for individuals, including civil penalties of up to $250,000 or twice the value of the transaction, whichever is greater, per violation, and in the event of conviction for a criminal violation for willful and knowing violations, fines of up to $1 million and possible incarceration for those responsible could be imposed against employees and managers. In addition, we may lose our export or import privileges and suffer reputational harm.
In addition, various countries regulate the import of certain encryption technology, including imposing import permitting and licensing requirements, and have enacted laws that could limit our ability to offer our platform or distribute our platform or could limit our customers’ ability to implement our platform in those countries. Changes in our platform or future changes in export and import regulations may create delays in the introduction of our platform in international markets or prevent our customers with international operations from deploying our platform globally. Any change in export or import regulations, economic sanctions or related legislation, or change in the countries, governments, persons, or technologies targeted by such regulations, could result in decreased use of our platform by, or in our decreased ability to export or sell our platform to, existing or potential customers with international operations. Any decreased use of our platform or limitation on our ability to export or sell our platform would likely adversely affect our business operations and financial results.
32
Risks Related to Ownership of Our Class A Common Stock
The dual class structure of our common stock has the effect of allowing those stockholders who held our capital stock prior to the completion of our initial public offering, including our executive officers, employees and directors and their affiliates, to limit your ability to influence the outcome of important transactions, including a change in control.
Our Class B common stock has ten votes per share, and our Class A common stock has one vote per share. Stockholders who held shares of our Class B common stock as of December 31, 2017, including, among others, our executive officers, employees and directors and their respective affiliates, collectively held approximately 47.5% of the voting power of our outstanding capital stock as of such date. Because of the ten-to-one voting ratio between our Class B common stock and Class A common stock, the holders of our Class B common stock will collectively continue to have significant influence over our management and affairs and over all matters requiring stockholder approval. These holders of our Class B common stock may have interests that differ from yours and may vote in a way with which you disagree and which may be adverse to your interests. The effect of this dual class structure may have the effect of delaying, preventing or deterring a change in control of our company, could deprive our stockholders of an opportunity to receive a premium for their capital stock as part of a sale of our company and might ultimately affect the market price of our Class A common stock.
Significant individual holders of our Class B common stock include our Chairman and Chief Executive Officer, Richard Stollmeyer. If, for example, Mr. Stollmeyer retains a significant portion of his holdings of shares of our Class B common stock for an extended period of time, he could control a significant portion of the voting power of our capital stock for the foreseeable future. In addition, Mr. Stollmeyer holds an irrevocable proxy to vote certain shares of our Class A common stock and Class B common stock held by certain of our stockholders. As a board member, Mr. Stollmeyer owes a fiduciary duty to our stockholders and must act in good faith and in a manner he reasonably believes to be in the best interests of our stockholders. As a stockholder, Mr. Stollmeyer is entitled to vote his shares in his own interest, which may not always be in the interests of our stockholders generally.
Anti-takeover provisions contained in our amended and restated certificate of incorporation and amended and restated bylaws, as well as provisions of Delaware law, could impair a takeover attempt.
Our amended and restated certificate of incorporation, amended and restated bylaws and Delaware law contain provisions which could have the effect of rendering more difficult, delaying or preventing an acquisition deemed undesirable by our board of directors. Among other things, our amended and restated certificate of incorporation and amended and restated bylaws include provisions:
• | establishing a classified board of directors whose members serve staggered three-year terms; |
• | authorizing “blank check” preferred stock, which could be issued by our board of directors without stockholder approval and may contain voting, liquidation, dividend and other rights superior to our common stock; |
• | limiting the liability of, and providing indemnification to, our directors and officers; |
• | limiting the ability of our stockholders to call and bring business before special meetings; |
• | requiring advance notice of stockholder proposals for business to be conducted at meetings of our stockholders and for nominations of candidates for election to our board of directors; |
• | controlling the procedures for the conduct and scheduling of board of directors and stockholder meetings; and |
• | authorizing two classes of common stock, as discussed above. |
These provisions, alone or together, could delay or prevent hostile takeovers and changes in control or changes in our management.
As a Delaware corporation, we are also subject to provisions of Delaware law, including Section 203 of the Delaware General Corporation Law, which prevents certain stockholders holding more than 15% of our outstanding capital stock from engaging in certain business combinations without approval of the holders of at least two-thirds of our outstanding common stock not held by any such stockholder.
Any provision of our amended and restated certificate of incorporation, amended and restated bylaws or Delaware law that has the effect of delaying, preventing or deterring a change in control could limit the opportunity for our stockholders to receive a premium for their shares of our capital stock, and could also affect the price that some investors are willing to pay for our Class A common stock.
33
An active trading market for our Class A common stock may not be sustained.
Our Class A common stock is listed on The NASDAQ Global Market under the symbol “MB.” However, we cannot assure you that an active trading market for our Class A common stock will be sustained. Accordingly, we cannot assure you of the liquidity of any trading market, your ability to sell your shares of our Class A common stock when desired or the prices that you may obtain for your shares of our Class A common stock.
The market price of our Class A common stock may be volatile, and you could lose all or part of your investment.
Prior to our initial public offering, there had been no public market for shares of our Class A common stock. The market price of our Class A common stock since our initial public offering has been and may continue to be subject to wide fluctuations in response to various factors, some of which are beyond our control and may not be related to our operating performance. Factors that could cause fluctuations in the market price of our Class A common stock include the following:
• | price and volume fluctuations in the overall stock market from time to time; |
• | volatility in the market prices and trading volumes of technology securities; |
• | changes in operating performance and stock market valuations of other technology companies generally or those in our industry in particular; |
• | sales of shares of our Class A common stock by us or our stockholders; |
• | failure of securities analysts to maintain coverage of us, changes in financial estimates by securities analysts who follow us, or our failure to meet these estimates or the expectations of investors; |
• | the financial projections we may provide to the public, any changes in those projections or our failure to meet those projections; |
• | announcements by us or our competitors of new products or services; |
• | the public’s reaction to our press releases, other public announcements and filings with the SEC; |
• | rumors and market speculation involving us or other companies in our industry; |
• | actual or anticipated changes in our operating results or fluctuations in our operating results; |
• | actual or anticipated developments in our business, our competitors’ businesses or the competitive landscape generally; |
• | litigation involving us, our industry or both, or investigations by regulators into our operations or those of our competitors; |
• | developments or disputes concerning our intellectual property or other proprietary rights; |
• | announced or completed acquisitions of businesses or technologies by us or our competitors; |
• | political, economic and regulatory developments in the United States or other geographies; |
• | new laws or regulations or new interpretations of existing laws or regulations applicable to our business; |
• | changes in accounting standards, policies, guidelines, interpretations or principles; |
• | any significant change in our management; and |
• | general economic conditions and slow or negative growth of our markets. |
In addition, in the past, following periods of volatility in the overall market and the market price of a particular company’s securities, securities class action litigation has often been instituted against these companies. This litigation, if instituted against us, could result in substantial costs and a diversion of our management’s attention and resources.
34
Future sales of shares of our Class A common stock in the public market, or the perception that such sales might occur, could depress the market price of our Class A common stock.
Sales of a substantial number of shares of our Class A common stock in the public market, or the perception that these sales might occur, could depress the market price of our Class A common stock and could impair our ability to raise capital through the sale of additional equity securities. As of December 31, 2017, we had 43.0 million shares of Class A common stock and 3.9 million shares of Class B common stock outstanding. All outstanding shares of Class A common stock are freely tradable without restrictions or further registration under the Securities Act of 1933, as amended, or the Securities Act, except for any shares held by our affiliates as defined in Rule 144 under the Securities Act and subject in some cases to our insider trading policy.
In addition, shares of our capital stock (including those shares of our capital stock issued upon exercise of outstanding options to purchase shares of our Class A common stock and Class B common stock or upon settlement of outstanding restricted stock units) may be freely sold in the public market upon issuance and once vested, subject to other restrictions provided under the terms of the applicable plan and/or the award agreements, and except for any options or restricted stock units held by our affiliates and subject to our insider trading policy. Certain of our existing stockholders are also entitled under contracts providing for registration rights, to require us to file registration statements covering the sale of their shares or to include their shares in registration statements that we may file for ourselves or other stockholders. Any sales of securities by these stockholders, or the expectation that such sales may occur, could have a material adverse effect on the trading price of our Class A common stock and make it more difficult for you to sell shares of our Class A common stock.
The requirements of being a public company may strain our resources, divert management’s attention and affect our ability to attract and retain qualified board members.
As a public company, we incur significant legal, financial, and other expenses that we did not incur as a private company. We are subject to the reporting requirements of the Securities Exchange Act of 1934, as amended, or the Exchange Act, and are required to comply with the applicable requirements of the Sarbanes-Oxley Act of 2002, the Dodd-Frank Wall Street Reform and Consumer Protection Act of 2010, the listing requirements of the NASDAQ Stock Market, and other applicable securities rules and regulations and corporate governance requirements. Continuing to comply with these rules and regulations may increase our legal and financial compliance costs, make some activities more difficult, time-consuming or costly, and increase demand on our systems and resources. In addition, our management and personnel must divert attention from operational and other business concerns to devote time to these requirements, which could harm our business and results of operations. Although we have already hired additional employees to comply with these requirements, we may need to hire even more employees in the future, which would increase our costs and expenses.
Being a public company and these new rules and regulations have made it more expensive for us to maintain director and officer liability insurance, and in the future we may be required to accept reduced coverage or incur substantially higher costs to obtain coverage. These factors could also make it more difficult for us to attract and retain qualified executive officers and members of our board of directors, particularly to serve on our audit committee and compensation committee.
In addition, as a result of our disclosure obligations as a public company, we have reduced strategic flexibility and are under pressure to focus on short-term results, which may adversely impact our ability to achieve long-term profitability.
If our internal control over financial reporting is not effective, it may adversely affect investor confidence in our company and, as a result, the value of our Class A common stock could decline.
As a public company, we are required to design and maintain effective internal control over financial reporting and to report any material weaknesses in such internal controls. Section 404 of the Sarbanes-Oxley Act of 2002 requires that we assess the effectiveness of our internal control over financial reporting and furnish a report by management on the effectiveness of our internal control over financial reporting, which must be attested to, and reported on, by our independent registered public accounting firm. During such assessment, if we identify one or more material weaknesses in our internal control over financial reporting, we will be unable to assert that our internal controls are effective. As a result, we may need to undertake various actions, such as implementing new internal controls and procedures and hiring accounting or internal audit staff. Our remediation efforts may not enable us to avoid a material weakness in the future.
35
If material weaknesses or control deficiencies occur in the future, and we are unable to assert that our internal control over financial reporting is effective, or if our auditors are unable to attest to management’s report on the effectiveness of our internal controls, we may be unable to report our financial results accurately or on a timely basis, which could cause our reported financial results to be materially misstated and result in the loss of investor confidence or delisting and cause the trading price of our Class A common stock to decline. As a result of such failures, we could also become subject to investigations by the stock exchange on which our securities are listed, the SEC, or other regulatory authorities, and become subject to litigation from investors and stockholders, which could harm our reputation, financial condition or divert financial and management resources from our core business.
If securities or industry analysts cease publishing research or reports about us, our business, our market or our competitors, or if they adversely change their recommendations regarding our Class A common stock, the market price of our Class A common stock and trading volume could decline.
The trading market for our Class A common stock is influenced by the research and reports that securities or industry analysts may publish about us, our business, our market or our competitors. If any of the analysts who cover us adversely change their recommendations regarding our Class A common stock or provide more favorable recommendations about our competitors, the market price of our Class A common stock would likely decline. If any of the analysts who cover us were to cease coverage of our company or fail to regularly publish reports on us, we could lose visibility in the financial markets, which in turn could cause the market price of our Class A common stock and trading volume to decline.
We do not expect to declare any dividends on our Class A common stock in the foreseeable future so any returns will be limited to changes in the value of our Class A common stock.
We do not anticipate declaring any cash dividends on our Class A common stock in the foreseeable future. In addition, our existing loan agreement with Silicon Valley Bank imposes restrictions on our ability to pay dividends. Consequently, investors may need to rely on sales of our Class A common stock after price appreciation, which may never occur, as the only way to realize any future gains on their investment. Investors seeking cash dividends should not purchase shares of our Class A common stock.
Item 1B. Unresolved Staff Comments.
None.
Item 2. Properties.
Our corporate headquarters are located in San Luis Obispo, California, where we operate under various leases for an aggregate of approximately 160,000 square feet of space. These leases expire between April 2019 and April 2030.
We lease additional offices throughout the United States and various international locations, including the United Kingdom and Australia. We lease all of our facilities and do not own any real property. We intend to procure additional space as we add employees and expand geographically. We believe our facilities are adequate and suitable for our current needs and that, should it be needed, suitable additional or alternative space will be available to accommodate any such expansion of our operations.
Item 3. Legal Proceedings.
From time to time we may become involved in legal proceedings or be subject to claims arising in the ordinary course of our business. We are not presently a party to any legal proceedings that in the opinion of our management, if determined adversely to us, would have a material adverse effect on our business, financial condition, operating results or cash flows. Regardless of the outcome, litigation can have an adverse impact on us because of defense and settlement costs, diversion of management resources and other factors.
Item 4. Mine Safety Disclosures.
Not applicable.
36
PART II
Item 5. Market for Registrant’s Common Equity, Related Stockholder Matters and Issuer Purchases of Equity Securities.
Market Information
Our Class A common stock began trading on the NASDAQ Global Market on June 19, 2015 under the symbol “MB.” There is no public trading market for our Class B common stock. The following table sets forth for the periods indicated the high and low sales prices per share of our Class A common stock as reported on the NASDAQ Global Market.
High | Low | ||||||
Year Ended December 31, 2017 | |||||||
First quarter | $ | 28.25 | $ | 21.20 | |||
Second quarter | $ | 29.75 | $ | 23.55 | |||
Third quarter | $ | 27.75 | $ | 21.57 | |||
Fourth quarter | $ | 36.25 | $ | 25.92 | |||
Year Ended December 31, 2016 | |||||||
First quarter | $ | 15.91 | $ | 9.20 | |||
Second quarter | $ | 16.58 | $ | 11.91 | |||
Third quarter | $ | 20.38 | $ | 15.46 | |||
Fourth quarter | $ | 22.95 | $ | 16.95 | |||
Holders
As of February 22, 2018, there were 47 holders of record of our Class A common stock and 54 holders of record of our Class B common stock. The actual number of stockholders is greater than this number of record holders, and includes stockholders who are beneficial owners, but whose shares are held in street name by brokers or other institutions and nominees.
Dividends
We have never declared or paid any cash dividends on our capital stock. We currently intend to retain any future earnings and do not expect to pay any dividends in the foreseeable future. In addition, our ability to pay dividends on our capital stock is subject to restrictions under the terms of our loan agreement with Silicon Valley Bank. Any future determination to declare cash dividends will be made at the discretion of our board of directors, subject to applicable laws, and will depend on a number of factors, including our financial condition, results of operations, capital requirements, contractual restrictions, general business conditions and other factors that our board of directors may deem relevant.
Securities Authorized for Issuance under Equity Compensation Plans
Information about our equity compensation plans is incorporated herein by reference to Item 12 of Part III of this Annual Report on Form 10-K.
Stock Performance Graph
The following shall not be deemed “filed” for purposes of Section 18 of the Exchange Act, or incorporated by reference into any of our other filings under the Exchange Act or the Securities Act, except to the extent we specifically incorporate it by reference into such filing.
This chart compares the cumulative total return on our Class A common stock with that of the S&P 500 Index and the NASDAQ Computer Index. The chart assumes $100 was invested at the close of market on June 19, 2015, in the Class A common stock of MINDBODY, Inc., the S&P 500 Index and the NASDAQ Computer Index, and assumes the reinvestment of any dividends. The stock price performance on the following graph is not necessarily indicative of future stock price performance.
37
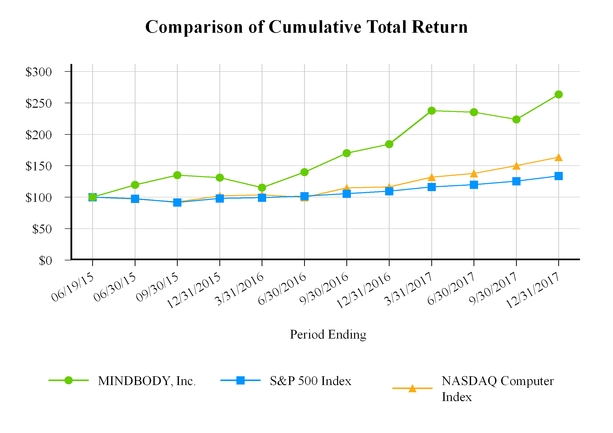
Base Period | ||||||||||||||||||||||||||||||||||||
Company / Index | 6/19/2015 | 6/30/2015 | 9/30/2015 | 12/31/2015 | 3/31/2016 | 6/30/2016 | 9/30/2016 | 12/31/2016 | 3/31/2017 | 6/30/2017 | 9/30/2017 | 12/31/2017 | ||||||||||||||||||||||||
MINDBODY, Inc. | $ | 100.00 | $ | 119.64 | $ | 135.21 | $ | 130.88 | $ | 115.31 | $ | 139.62 | $ | 170.07 | $ | 184.26 | $ | 237.46 | $ | 235.29 | $ | 223.62 | $ | 263.41 | ||||||||||||
S&P 500 Index | 100.00 | 97.83 | 91.53 | 97.97 | 99.29 | 101.73 | 105.65 | 109.69 | 116.35 | 119.94 | 125.31 | 133.64 | ||||||||||||||||||||||||
NASDAQ Computer Index | 100.00 | 96.91 | 92.35 | 102.13 | 103.48 | 99.77 | 114.69 | 116.46 | 131.87 | 137.80 | 150.27 | 163.50 | ||||||||||||||||||||||||
Recent Sales of Unregistered Securities
None.
Use of Proceeds
On June 18, 2015, the Registration Statement on Form S-1 (File No. 333-204068) for our initial public offering of our Class A common stock was declared effective by the SEC. On June 24, 2015, we closed our initial public offering and sold 7,150,000 shares of our Class A common stock at a public offering price of $14.00 per share for an aggregate offering price of approximately $100.1 million.
There has been no material change in the planned use of proceeds from our initial public offering as described in our final prospectus filed with the SEC on June 19, 2015 pursuant to Rule 424(b)(4).
Issuer Purchases of Equity Securities
None.
38
Item 6. Selected Financial Data.
The selected consolidated financial data should be read together with the section entitled “Management’s Discussion and Analysis of Financial Condition and Results of Operations,” our audited consolidated financial statements, related notes, and other financial information included elsewhere in this Annual Report on Form 10-K. We have derived the consolidated statement of operations data for the years ended December 31, 2017, 2016 and 2015 and consolidated balance sheet data as of December 31, 2017 and 2016 from the audited consolidated financial statements included elsewhere in this Annual Report on Form 10-K. The consolidated statement of operations data for the years ended December 31, 2014 and 2013, and the balance sheet data as of December 31, 2015, 2014, and 2013 were derived from audited consolidated financial statements that are not included in this Annual Report on Form 10-K. Our historical results are not necessarily indicative of the results to be expected in the future.
Consolidated Statement of Operations Data
Year Ended December 31, | |||||||||||||||||||
2017 | 2016 | 2015 | 2014 | 2013 | |||||||||||||||
(in thousands, except per share data) | |||||||||||||||||||
Revenue | $ | 182,626 | $ | 139,021 | $ | 101,369 | $ | 70,010 | $ | 48,687 | |||||||||
Cost of revenue1 | 51,870 | 43,080 | 37,190 | 30,004 | 21,890 | ||||||||||||||
Gross profit | 130,756 | 95,941 | 64,179 | 40,006 | 26,797 | ||||||||||||||
Operating expenses: | |||||||||||||||||||
Sales and marketing1 | 71,825 | 56,460 | 46,345 | 30,922 | 20,957 | ||||||||||||||
Research and development1 | 35,810 | 30,316 | 23,057 | 16,167 | 10,517 | ||||||||||||||
General and administrative1 | 37,471 | 30,497 | 29,530 | 18,422 | 10,730 | ||||||||||||||
Change in fair value of contingent consideration | — | (11 | ) | (1,434 | ) | 428 | |||||||||||||
Total operating expenses | 145,106 | 117,273 | 98,921 | 64,077 | 42,632 | ||||||||||||||
Loss from operations | (14,350 | ) | (21,332 | ) | (34,742 | ) | (24,071 | ) | (15,835 | ) | |||||||||
Change in fair value of preferred stock warrant | — | (25 | ) | (283 | ) | (302 | ) | ||||||||||||
Interest income (expense), net | 109 | (1,123 | ) | (943 | ) | (68 | ) | (21 | ) | ||||||||||
Other income (expense), net | (384 | ) | (203 | ) | (132 | ) | (68 | ) | (26 | ) | |||||||||
Loss before provision for income taxes | (14,625 | ) | (22,658 | ) | (35,842 | ) | (24,490 | ) | (16,184 | ) | |||||||||
Provision for income taxes | 167 | 321 | 246 | 116 | 63 | ||||||||||||||
Net loss | (14,792 | ) | (22,979 | ) | (36,088 | ) | (24,606 | ) | (16,247 | ) | |||||||||
Accretion of redeemable convertible preferred stock | — | — | (9,862 | ) | (21,311 | ) | (27,892 | ) | |||||||||||
Deemed dividend—preferred stock modification | — | — | 1,748 | — | — | ||||||||||||||
Net loss attributable to common stockholders | $ | (14,792 | ) | $ | (22,979 | ) | $ | (44,202 | ) | $ | (45,917 | ) | $ | (44,139 | ) | ||||
Net loss per share attributable to common stockholders, basic and diluted | $ | (0.33 | ) | $ | (0.58 | ) | $ | (1.68 | ) | $ | (4.17 | ) | $ | (4.10 | ) | ||||
Weighted-average shares used to compute net loss per share attributable to common stockholders, basic and diluted | 44,309 | 39,913 | 26,320 | 11,014 | 10,758 | ||||||||||||||
(1) Cost of revenue and operating expenses include stock-based compensation expense as follows:
Year Ended December 31, | |||||||||||||||||||
2017 | 2016 | 2015 | 2014 | 2013 | |||||||||||||||
Cost of revenue | $ | 1,334 | $ | 910 | $ | 651 | $ | 220 | $ | 51 | |||||||||
Sales and marketing | 2,872 | 2,059 | 3,533 | 196 | 56 | ||||||||||||||
Research and development | 3,864 | 1,971 | 902 | 298 | 68 | ||||||||||||||
General and administrative | 6,031 | 3,823 | 3,289 | 1,023 | 252 | ||||||||||||||
Total stock-based compensation expense | $ | 14,101 | $ | 8,763 | $ | 8,375 | $ | 1,737 | $ | 427 | |||||||||
39
Consolidated Balance Sheet Data
As of December 31, | |||||||||||||||
2017 | 2016 | 2015 | 2014 | 2013 | |||||||||||
(in thousands) | |||||||||||||||
Cash and cash equivalents | $ | 232,019 | $ | 85,864 | $ | 93,405 | $ | 34,675 | $ | 9,545 | |||||
Restricted cash | — | — | — | 772 | 2,533 | ||||||||||
Working capital | 219,855 | 77,958 | 86,781 | 26,962 | 3,359 | ||||||||||
Total assets | 301,313 | 143,515 | 141,414 | 73,051 | 30,735 | ||||||||||
Total deferred revenue | 9,519 | 8,128 | 5,253 | 2,756 | 2,002 | ||||||||||
Total financing obligation | 15,450 | 15,961 | 16,427 | 15,654 | 3,872 | ||||||||||
Preferred stock warrant | — | — | — | 1,188 | 905 | ||||||||||
Total redeemable convertible preferred stock | — | — | — | 166,448 | 95,224 | ||||||||||
Total stockholders’ equity (deficit) | 251,936 | 101,656 | 105,783 | (124,925 | ) | (81,115 | ) | ||||||||
Item 7. Management’s Discussion and Analysis of Financial Condition and Results of Operations.
MANAGEMENT’S DISCUSSION AND ANALYSIS OF FINANCIAL CONDITION
AND RESULTS OF OPERATIONS
The following discussion and analysis of our financial condition and results of operations should be read in conjunction with the section titled “Selected Consolidated Financial Data” and our consolidated financial statements and related notes included elsewhere in this Annual Report on Form 10-K. This discussion contains forward-looking statements that involve risks and uncertainties. Our actual results could differ materially from those discussed below. Factors that could cause or contribute to such differences include, but are not limited to, those identified below and those discussed in the section titled “Risk Factors” included in Part I, Item 1A of this Annual Report on Form 10-K.
Overview
We are the leading provider of cloud-based business management software for the wellness services industry and a rapidly growing marketplace for wellness services. As of December 31, 2017, our customers employed over 372,000 wellness practitioners serving approximately 41 million consumers in more than 100 countries. We are also a leading payments platform dedicated to the wellness services industry transacting approximately $7.9 billion and $6.5 billion on our payments platform for the years ended December 31, 2017, and 2016, respectively, representing a 23% increase year over year.
We provide our software as a subscription-based service to our 58,584 subscribers as of December 31, 2017. We primarily market and sell subscriptions for our platform to small and medium-sized businesses within the wellness services industry, targeting specifically boutique fitness, salon, spa and integrative health businesses.
Our integrated software and payments platform creates powerful network effects. As more local wellness businesses adopt our platform, more customer listings appear on the MINDBODY app and third-party partner sites available through the MINDBODY Network. As awareness of these businesses increases through these marketing channels, they attract more consumers to our platform. Those consumers then attract even more businesses to our platform. As those businesses and consumers engage in more transactions on our platform, this increases payments and API revenue and enables additional revenue streams from demand generation. Finally, as we add more customers and consumers to our wellness ecosystem, we attract more technology developers and partners who can use our open API to develop additional apps that extend the capabilities of our open platform.
In the first quarter of 2017, we refined our subscriber growth strategy to focus on high value subscribers, which we define as customers on our Starter, Pro, Accelerate and Ultimate software levels. In connection with this strategy, as of January 1, 2017, we stopped actively selling subscriptions of our Solo software level to new customers and increased the monthly subscription pricing across all other software levels for new customers. We also increased monthly subscription pricing across all of our software levels for existing customers without long-term contracts and focused our growth strategy on the United States, Canada, the United Kingdom, Ireland, Australia, New Zealand, Hong Kong, and Singapore. Furthermore, in the first quarter of 2018, we rolled out simplified software packaging to better address the needs of our customers, and we intend to migrate our existing customers to one of these software packages.
40
The vast majority of our customers enter into one-month contracts that are billed in advance, but we have a growing number of larger multi-location customers that subscribe to our software platform through contracts ranging from one to three years for which we bill quarterly or monthly in advance. We recognize software subscription revenue ratably over the term of the subscription period. Additionally, we earn revenue based on the value of transactions processed by our customers utilizing our payments platform, net of the costs charged to us by our processing partners.
We deploy a direct sales approach driven by an outbound tele-sales team located primarily in San Luis Obispo, California with several regional offices throughout the United States, and locations in the United Kingdom and Australia. Our sales team qualifies and manages prospective and current customers, aiming to initiate, retain, and expand their use of our platform over time.
Our marketing efforts are focused on generating awareness of our platform and consumer app, creating sales leads, establishing and promoting our brand, and cultivating a community of successful and vocal customers and consumers. We utilize both online and offline marketing initiatives, including search engine and email marketing, online display and print advertising, participation in trade shows, events and conferences, permission marketing, social media and media outreach, mass media, and strategic partnerships and endorsements.
In May 2017, we completed a follow-on public offering in which we issued and sold 5,060,000 shares of Class A common stock at a public offering price of $27.95 per share. We received net proceeds of $134.7 million after deducting underwriters’ discounts and commissions of $6.7 million, but before deducting offering expenses of approximately $0.4 million.
We intend to continue scaling our organization in order to meet the needs of our customers. We also intend to continue growing the inventory of wellness services on our transaction-enabled marketplace. We have invested and expect to continue to invest in our sales and marketing teams to sell our platform globally, including, in particular, to high value subscribers in the countries noted above. A key element of our growth strategy is the continuous enhancement and expansion of our software and payments platform, as well as our transaction-enabled marketplace by continuously developing and implementing new features and functionality. Through consistent innovation and strategic acquisitions, we have increased both the number of high value subscribers and the revenue we generate from our customers over time.
We plan to continue to enhance our software architecture and enhance and expand our platform through ongoing investments in research and development and sales and marketing, and by pursuing strategic acquisitions of complementary businesses and technologies that will enable us to continue to drive growth in the future.
We also expect to continue to make investments in both our data center infrastructure and our customer service and customer onboarding teams to meet the needs of our growing user base.
While these areas represent significant opportunities for us, we also face significant risks and challenges that we must successfully address in order to sustain the growth of our business and improve our operating results. Due to our continuing investments to grow our business in preparation for our expected increase in sales, we are continuing to incur expenses in the near term from which we may not realize any long-term benefit. In addition, any investments that we make in sales and marketing or other areas will occur in advance of our experiencing any benefits from such investments, so it may be difficult for us to determine if we are efficiently allocating our resources in these areas.
Set forth below are summary financial highlights for the years ended December 31, 2017, 2016, and 2015:
Year Ended December 31, | Change | Year Ended December 31, | Change | ||||||||||||||||||
2017 | 2016 | % | 2016 | 2015 | % | ||||||||||||||||
(dollars in millions) | |||||||||||||||||||||
Revenue | $ | 182.6 | $ | 139.0 | 31 | % | $ | 139.0 | $ | 101.4 | 37 | % | |||||||||
Net loss | (14.8 | ) | (23.0 | ) | (23.0 | ) | (36.1 | ) | |||||||||||||
Adjusted EBITDA(1) | $ | 8.9 | $ | (4.8 | ) | $ | (4.8 | ) | $ | (19.9 | ) | ||||||||||
(1) For a reconciliation of Adjusted EBITDA to net loss, see the section below titled “Non-GAAP Financial Measure.”
During the years ended December 31, 2017 and 2016, approximately 81% and 83% of our revenue came from the United States, respectively.
Our employee headcount has increased to 1,426 employees as of December 31, 2017, from 1,350 as of December 31, 2016 .
41
In this Annual Report on Form 10-K, when we use the term “active consumers” as of a given date, we are referring to the estimated number of unique consumers of our customers' services who have used our platform to transact with our customers during the two years ending on such date. While we do not directly monetize consumers of our customers’ services, we believe that growth in the number of active consumers on our platform also contributes to subscriber growth. For a discussion of risks related to our calculation of active consumers, see the section titled “Risk Factors - Real or perceived inaccuracies in our key, user and other metrics may harm our reputation and negatively affect our business” included in Item 1A of Part I of this Annual Report on Form 10-K.
On February 19, 2018, we completed the acquisition of FitMetrix, Inc., or FitMetrix, a privately-held company, for an aggregate cash purchase price of $15.5 million. FitMetrix, a MINDBODY platform partner at the time of acquisition, specializes in innovative performance tracking integrations with fitness studio equipment and wearables. The FitMetrix technology helps enable business owners to increase retention in the group and personal training environments and provide wellness seekers with an engaging, more interactive fitness experience. We expect to expand adoption of FitMetrix across our customer base while continuing to develop new cutting-edge workout innovations. We believe the acquisition of FitMetrix expands our value proposition for fitness studios and clubs worldwide, while also helping us attract new high value subscribers.
42
Our Business Model
Our business model focuses on maximizing the lifetime value of a customer relationship. We make significant investments in acquiring and onboarding new customers and believe that we will be able to achieve a positive return on these investments by retaining customers and expanding the revenue derived from them over the lifetime of the relationship. In connection with the acquisition of new customers, we incur and recognize significant upfront costs. These costs include sales; onboarding and marketing costs associated with acquiring new customers, such as sales commission expenses, which are expensed upfront; the cost of the onboarding personnel who provide the initial onboarding training to our new customers; marketing costs, which are expensed as incurred; and the cost associated with converting and importing customer data from competitors’ products.
Due to our subscription model, we recognize software subscription revenue ratably over the monthly term of the subscription period, which commences when all of the revenue recognition criteria have been met. We recognize revenue from our payments platform on a net basis when the transactions occur. Although our objective is for each customer to be profitable for us over the duration of our relationship, the costs we incur with respect to any customer relationship, whether a new customer or to a lesser extent selling higher value subscriptions to customers on lower software levels, may exceed revenue in early periods of the relationship because we recognize those costs earlier than we recognize the associated revenue. As a result, an increase in the mix of new customers as a percentage of total customers will initially have a negative impact on our operating results.
We realize different levels of profitability from our customers in large part depending on the fee level of their software subscription and the volume of transactions they process through our payments platform. For new customers, our associated sales, onboarding and marketing expenses typically exceed the first year revenue we recognize from them. For typical customers, their monthly subscriptions automatically renew each month. As a result, our sales and marketing expenses associated with renewals for our existing customers have been de minimis. Over the lifetime of the customer relationship, we incur sales and marketing costs to sell higher value subscriptions to customers on lower software levels, to have customers opt in to our payments platform, to our premium services and to our API and technology partners’ software offerings. However, these costs are significantly less than the costs initially incurred to acquire the customer.
Key Metrics
We regularly review the following key metrics to measure our performance, identify trends affecting our business, formulate financial projections, make strategic business decisions and assess working capital needs.
As of and for the Year Ended December 31, | |||||||||||
2017 | 2016 | 2015 | |||||||||
Subscribers (end of period) | 58,584 | 60,385 | 51,481 | ||||||||
Average monthly revenue per subscriber | $ | 253 | $ | 205 | $ | 182 | |||||
Payments volume (in billions) | $ | 7.9 | $ | 6.5 | $ | 5.1 | |||||
Dollar-based net expansion rate (end of period) | 107 | % | 108 | % | 113 | % | |||||
43
• | Subscribers. Subscribers are defined as unique physical business locations or individual practitioners who have active subscriptions to our platform as of the end of the period. We believe the number of subscribers is one indicator of the growth of our platform, but the revenue contribution of individual subscribers can vary widely. For example, the vast majority of our revenue is generated from our high value subscribers. The number of subscribers on our Solo software level decreased from 7,391 as of December 31, 2016, to 3,405 as of December 31, 2017, and the number of our high value subscribers increased from 52,994 as of December 31, 2016, to 55,179 as of December 31, 2017. Growth in the number of our high value subscribers depends, in part, on our ability to successfully develop and market our platform to wellness businesses and consumers who have not yet become part of our network. While growth in the number of subscribers can be an important indicator of expected revenue growth, it also informs our management’s decisions with respect to the areas of our business that will require further investment in order to support expected future growth. For example, as the number of high value subscribers increases, we may need to increase the headcount in our customer support organization, as well as increase our IT infrastructure capital expenditures in order to maintain the effectiveness of our platform and the performance of our software for our subscribers and consumers. The number of our overall subscribers has decreased year over year, while the number of high value subscribers increased year over year. We expect the number of high value subscribers to continue to increase over time, however our overall subscriber count may continue to decline in the near term as we continue to execute on our growth strategy, focus on high value subscribers, and as a result of pricing increases implemented in February 2018. As of January 1, 2017, we stopped actively selling subscriptions of our Solo software level to new subscribers and increased the monthly subscription pricing across all other software levels for new subscribers. We also increased monthly subscription pricing across all of our software levels for existing subscribers without long term contracts. In addition, we concentrated our subscriber growth strategy on high value subscribers in specific countries, which contributed to a decrease in the total number of subscribers by 1,801, with an increase in the total number of our high value subscribers by 2,185, for the year ended December 31, 2017. The growth rate of the number of subscribers declined as of December 31, 2017 compared to December 31, 2016 and may continue to do so in the future as we execute on our growth strategy and we make changes to our pricing and subscription offerings. |
• | Average Monthly Revenue per Subscriber. We believe that our ability to increase the average monthly revenue per subscriber, which we also refer to as ARPS, is an indicator of our ability to increase the long-term value of our existing subscriber relationships. ARPS is calculated by dividing the subscription and services and payments revenue generated in a given month by the number of subscribers at the end of the previous month. For periods greater than one month, ARPS is the sum of the average monthly revenue per subscriber for each month in the applicable period, divided by the number of months in the period. For example, the ARPS measurement period in the table above was measured over the twelve months ended December 31, 2017, 2016 and 2015. ARPS increased for the year ended December 31, 2017 compared to the year ended December 31, 2016, and we expect it to continue to increase in the future, although we expect the growth rate to fluctuate over time. During the year, we measure ARPS on a quarterly basis rather than a year-to-date basis. To assist in sequential review of our ARPS metric, for the three months ended December 31, 2017 our ARPS was $278, compared to $212 for the three months ended December 31, 2016, a 31% increase year over year. |
• | Payments Volume. We believe that payments volume is an indicator of the underlying current health of our customers’ businesses and of consumer spending trends as well as being a major driver of our payments revenue. Payments volume is the total dollar volume of transactions between our customers and consumers utilizing our payments platform. Payments volume increased for the year ended December 31, 2017 compared to the year ended December 31, 2016, and we expect it to continue to increase in the future. The growth rate in payments volume decreased for the year ended December 31, 2017 compared to the year ended December 31, 2016, and we expect it to fluctuate over time. |
• | Dollar-Based Net Expansion Rate. Our business model focuses on maximizing the lifetime value of a customer relationship. We can achieve this by focusing on delivering value and functionality that retains our existing customers and by expanding the revenue derived from our customers over the lifetime of the relationship by selling higher value subscriptions to customers on lower software levels, through the utilization of our premium customer support offering, by increasing the value of transactions processed through our payments platform, and through services provided by our application programming interface, or API, and technology partners. We assess our performance in this area by measuring our dollar-based net expansion rate. Our dollar-based net expansion rate provides a measurement of our ability to increase revenue across our existing customer base, offset by churn, downgrades in subscriptions, reduction in services utilization and reductions in the value of transactions that our customers process through our payments platform. Our dollar-based net expansion rate |
44
is based upon our monthly subscription and services and payments revenue for a set of customer accounts. We calculate our dollar-based net expansion rate by dividing our retained revenue net of contraction and churn by our base revenue. We define our base revenue as the aggregate monthly subscription and services and payments revenue of our customer base as of the date one year prior to the date of calculation. We define our retained revenue net of contraction and churn as the aggregate monthly subscription and services and payments revenue of the same customer base included in our measure of base revenue at the end of the period being measured. In addition, beginning with the first quarter of 2018, we intend to calculate our dollar-based net expansion rate using a quarterly average. We believe that this change in methodology for calculating our dollar-based net retention rate will mitigate some of the volatility that can occur when this key metric is calculated using only the last month in the period. We expect our dollar based net expansion rate to fluctuate over time.
Non-GAAP Financial Measure
Adjusted EBITDA
To provide investors with additional information regarding our financial results prepared in accordance with U.S. generally accepted accounting principles, or GAAP, we have presented Adjusted EBITDA, which is a non-GAAP financial measure defined by us as our net loss before stock-based compensation expense, depreciation and amortization, change in fair value of contingent consideration (where applicable), change in fair value of preferred stock warrant (where applicable), provision for income taxes, and other income (expense), net, which consisted of interest income (expense), net, and other income (expense), net. We have provided below a reconciliation of Adjusted EBITDA to net loss, the most directly comparable GAAP financial measure. We have presented Adjusted EBITDA in this Annual Report on Form 10-K because it is a key measure used by our management and board of directors to understand and evaluate our core operating performance and trends, to prepare and approve our annual budget, and to develop short and long-term operational plans. In particular, we believe that the exclusion of the amounts eliminated in calculating Adjusted EBITDA can provide a useful measure for period-to-period comparisons of our core business. Accordingly, we believe that Adjusted EBITDA provides useful information to investors and others in understanding and evaluating our operating results in the same manner as our management and board of directors.
Our use of Adjusted EBITDA has limitations as an analytical tool, and you should not consider it in isolation or as a substitute for analysis of our financial results as reported under GAAP. Some of these limitations are as follows:
• | Although depreciation and amortization expense are non-cash charges, the assets being depreciated and amortized may have to be replaced in the future, and Adjusted EBITDA does not reflect cash capital expenditure requirements for such replacements or for new capital expenditure requirements; |
• | Adjusted EBITDA does not reflect: (1) changes in, or cash requirements for, our working capital needs; (2) the potentially dilutive impact of stock-based compensation; or (3) tax payments that may represent a reduction in cash available to us; |
• | Adjusted EBITDA excludes stock-based compensation expense, which has been and will continue to be for the foreseeable future a significant recurring expense in our business; and |
• | Other companies, including companies in our industry, may calculate Adjusted EBITDA or similarly titled measures differently, which reduces its usefulness as a comparative measure. |
Because of these and other limitations, you should consider Adjusted EBITDA along with other GAAP-based financial performance measures, including various cash flow metrics, net loss, and our GAAP financial results. The following table presents a reconciliation of Adjusted EBITDA to net loss for each of the periods indicated:
45
Year Ended December 31, | |||||||||||
2017 | 2016 | 2015 | |||||||||
(in thousands) | |||||||||||
Net loss | $ | (14,792 | ) | $ | (22,979 | ) | $ | (36,088 | ) | ||
Stock-based compensation expense | 14,101 | 8,763 | 8,375 | ||||||||
Depreciation and amortization | 9,150 | 7,755 | 6,516 | ||||||||
Change in fair value of contingent consideration | — | — | (11 | ) | |||||||
Change in fair value of preferred stock warrant | — | — | 25 | ||||||||
Provision for income taxes | 167 | 321 | 246 | ||||||||
Other expense, net | 275 | 1,326 | 1,075 | ||||||||
Adjusted EBITDA | $ | 8,901 | $ | (4,814 | ) | $ | (19,862 | ) | |||
Components of Statements of Operations
Revenue
We generate revenue primarily from providing an integrated cloud-based business management software and payments platform for the wellness services industry. Revenue is recognized when persuasive evidence of an arrangement exists, delivery has occurred, the fee is fixed or determinable and collectability is reasonably assured.
Our total revenue consists of the following:
• | Subscription and services. Subscription and services revenue is generated primarily from sales of subscriptions to our cloud based business management software for the wellness services industry. The majority of subscription fees are prepaid by customers on a monthly basis via a credit card and, to a lesser extent, billed to customers on an annual or quarterly basis. Subscription revenue is recognized ratably over the term of the subscription agreement. Amounts invoiced in excess of revenue recognized are deferred. Service revenue is generated primarily through our premium customer support offering and is recognized ratably over the term of the agreement. Additionally, our customers can choose to enter into a separate contract with our technology partners to purchase additional features and functionality. We receive a revenue share from these arrangements from our technology partners, which is recognized in the period services are rendered. We also earn revenue from API partners for customer site access, data query, and consumer bookings through our platform. The revenue from API partners is recognized in the period services are rendered. We expect our subscription and services revenue to increase over time as we increase the number of our customers, the average monthly subscription revenue per subscriber, and our revenue from our technology and API partners. |
• | Payments. We earn payments revenue from revenue share arrangements with third-party payment processors on transactions between our customers who utilize our payments platform and their consumers. These payment transactions are generally related to purchases of classes, memberships, goods or services through a customer’s website, at its business location, and through the MINDBODY app. These transaction fees are recorded as revenue on a net basis when the payment transactions occur. We expect our payments revenue to increase in absolute dollars as we add new customers who utilize our payments platform and as existing customers increase the volume of transactions that they process through our payments platform. |
• | Product and other. We offer various point-of-sale system products and physical gift cards to our customers. Product and other revenue is recognized upon the delivery of these products to our customers. |
Cost of Revenue
Cost of revenue primarily consists of costs associated with personnel and related infrastructure for operation of our cloud-based business management platform, data center operations, global customer support and onboarding services, payment processing for customers that pay via credit card, and allocated overhead. Personnel costs consist of salaries, benefits, bonuses and stock-based compensation. Overhead consists of certain facilities costs, depreciation expense, amortization expense associated with acquired intangible assets, information technology costs, and impairment charges for acquired intangible assets and internally developed software.
Operating Expenses
Our operating expenses consist of sales and marketing, research and development, and general and administrative expenses.
46
• | Sales and marketing. Sales and marketing expense consists primarily of personnel costs, including salaries, benefits, bonuses, stock-based compensation and commission costs for our sales and marketing personnel. Sales and marketing expense also includes costs for market development programs, advertising, lead generation, promotional and other marketing activities, and allocated overhead. Sales and marketing expense is our largest operating expense, driving growth in customers, ARPS and consumer adoption, and we expect to continue to increase this expense in absolute dollars as we increase our sales and marketing efforts, including consumer marketing efforts, although such expense may fluctuate as a percentage of total revenue. For instance, in 2017 we held BOLD, our annual customer conference in the third quarter, instead of the fourth quarter as in previous years, which resulted in a significant year over year increase in sales and marketing expense for the third quarter of 2017. |
• | Research and development. Research and development expense consists primarily of personnel costs, including salaries, benefits, bonuses, and stock-based compensation for our development personnel. Research and development expense also includes outsourced software development costs and allocated overhead. We expect research and development expense to continue to increase in absolute dollars as we continue to invest in our research and product development efforts to enhance our product capabilities and access new markets, although such expense may fluctuate as a percentage of total revenue. |
• | General and administrative. General and administrative expense consists primarily of personnel costs, including salaries, benefits, bonuses, and stock-based compensation for our executive, finance, legal, human resources, information technology, and other administrative personnel. General and administrative expense also includes consulting, legal and accounting services and allocated overhead. We expect general and administrative expense to continue to increase in absolute dollars as we grow our operations and operate as a public company, although we expect such expense to continue to decline as a percentage of total revenue. |
Other Income and Expenses
Our other income and expenses line items consist of interest income (expense), net, and other expense, net.
• | Interest income (expense), net. Interest income (expense), net, consists primarily of the interest incurred on the financing obligation associated with our build-to-suit lease arrangement and interest earned on our cash and cash equivalent balances. We entered into a loan agreement with Silicon Valley Bank in 2015 for a secured revolving credit facility, and any future draws on this loan agreement will incur interest expense and result in increased interest expense in future periods. This loan agreement is set to expire in January 2019. |
• | Other expense, net. Other expense, net, consists primarily of gains and losses on disposals of property and equipment, gains and losses from foreign currency transactions, and other income and expenses. |
Provision for Income Taxes
Provision for income taxes consists primarily of federal and state income taxes in the United States and income taxes in certain foreign jurisdictions in which we conduct business. We have a full valuation allowance for U.S. deferred tax assets, including net operating loss carryforwards. We expect to maintain this full valuation allowance for the foreseeable future.
Results of Operations for Fiscal Years Ended December 31, 2017, 2016, and 2015
The following tables set forth our results of operations data in dollars and as a percentage of revenue for those periods. The period-to-period comparison of results of operations is not necessarily indicative of results to be expected for future periods.
47
Year Ended December 31, | |||||||||||
2017 | 2016 | 2015 | |||||||||
(in thousands) | |||||||||||
Consolidated Statements of Operations Data: | |||||||||||
Revenue | $ | 182,626 | $ | 139,021 | $ | 101,369 | |||||
Cost of revenue(1) | 51,870 | 43,080 | 37,190 | ||||||||
Gross profit | 130,756 | 95,941 | 64,179 | ||||||||
Operating expenses: | |||||||||||
Sales and marketing(1) | 71,825 | 56,460 | 46,345 | ||||||||
Research and development(1) | 35,810 | 30,316 | 23,057 | ||||||||
General and administrative(1) | 37,471 | 30,497 | 29,530 | ||||||||
Change in fair value of contingent consideration | — | (11 | ) | ||||||||
Total operating expenses | 145,106 | 117,273 | 98,921 | ||||||||
Loss from operations | (14,350 | ) | (21,332 | ) | (34,742 | ) | |||||
Change in fair value of preferred stock warrant | — | — | (25 | ) | |||||||
Interest income (expense), net | 109 | (1,123 | ) | (943 | ) | ||||||
Other expense, net | (384 | ) | (203 | ) | (132 | ) | |||||
Loss before provision for income taxes | (14,625 | ) | (22,658 | ) | (35,842 | ) | |||||
Provision for income taxes | 167 | 321 | 246 | ||||||||
Net loss | $ | (14,792 | ) | $ | (22,979 | ) | $ | (36,088 | ) | ||
Year Ended December 31, | ||||||||
2017 | 2016 | 2015 | ||||||
Consolidated Statements of Operations Data: | ||||||||
Revenue | 100 | % | 100 | % | 100 | % | ||
Cost of revenue | 28 | % | 31 | % | 37 | % | ||
Gross profit | 72 | % | 69 | % | 63 | % | ||
Operating expenses: | ||||||||
Sales and marketing | 39 | % | 40 | % | 45 | % | ||
Research and development | 20 | % | 22 | % | 23 | % | ||
General and administrative | 21 | % | 22 | % | 29 | % | ||
Total operating expenses | 80 | % | 84 | % | 97 | % | ||
Loss from operations | (8 | )% | (15 | )% | (34 | )% | ||
Interest expense, net | — | % | (1 | )% | (1 | )% | ||
Other expense, net | — | % | — | % | (1 | )% | ||
Loss before provision for income taxes | (8 | )% | (16 | )% | (36 | )% | ||
Provision for income taxes | — | % | (1 | )% | — | % | ||
Net loss | (8 | )% | (17 | )% | (36 | )% | ||
(1) Cost of revenue and operating expenses include stock-based compensation expense as follows (in thousands):
Year Ended December 31, | |||||||||||
2017 | 2016 | 2015 | |||||||||
Cost of revenue | $ | 1,334 | $ | 910 | $ | 651 | |||||
Sales and marketing | 2,872 | 2,059 | 3,533 | ||||||||
Research and development | 3,864 | 1,971 | 902 | ||||||||
General and administrative | 6,031 | 3,823 | 3,289 | ||||||||
Total stock-based compensation expense | $ | 14,101 | $ | 8,763 | $ | 8,375 | |||||
48
Comparison of the Years Ended December 31, 2017 and 2016
Revenue
Year Ended December 31, | Change | |||||||||||||
2017 | 2016 | $ | % | |||||||||||
(dollars in thousands) | ||||||||||||||
Revenue: | ||||||||||||||
Subscription and services | $ | 109,174 | $ | 82,919 | $ | 26,255 | 32 | % | ||||||
Payments | 71,263 | 53,808 | 17,455 | 32 | % | |||||||||
Product and other | 2,189 | 2,294 | (105 | ) | (5 | )% | ||||||||
Total revenue | $ | 182,626 | $ | 139,021 | $ | 43,605 | 31 | % | ||||||
Revenue increased $43.6 million, or 31%, in the year ended December 31, 2017 compared to the year ended December 31, 2016. Subscription and services revenue increased $26.3 million, or 32%, of which $24.4 million was due to pricing increases, the increased adoption of our branded mobile app offering, and an improvement in the mix to high value subscribers. Payments revenue increased $17.5 million, or 32%, due to an increase in the volume of transactions processed by our customers combined with an increase in the number of customers that utilize our payments platform and an increase in the value retained from payments transactions.
Cost of Revenue and Gross Margin
Year Ended December 31, | Change | |||||||||||||
2017 | 2016 | $ | % | |||||||||||
(dollars in thousands) | ||||||||||||||
Cost of revenue | $ | 51,870 | $ | 43,080 | $ | 8,790 | 20 | % | ||||||
Gross margin | 72 | % | 69 | % | ||||||||||
Cost of revenue increased $8.8 million, or 20%, in the year ended December 31, 2017 compared to the year ended December 31, 2016. The increase was primarily attributable to a $5.2 million increase in personnel-related expenses due to an increase in headcount, a $2.6 million increase in infrastructure costs, and a $1.0 million increase in amortization of acquired intangible assets. As of December 31, 2017, we had 560 employees dedicated to data center operations, global customer support and onboarding services as compared to 497 employees as of December 31, 2016.
The increase in gross margin, or gross profit as a percentage of revenue, in the year ended December 31, 2017 compared to the year ended December 31, 2016, was primarily driven by an increase in the number of customers adopting payment processing through our platform and an increase in the number of high value subscribers, combined with leveraging our existing infrastructure and customer support.
49
Operating Expenses
Sales and Marketing
Year Ended December 31, | Change | |||||||||||||
2017 | 2016 | $ | % | |||||||||||
(dollars in thousands) | ||||||||||||||
Sales and marketing | $ | 71,825 | $ | 56,460 | $ | 15,365 | 27 | % | ||||||
Sales and marketing expense increased $15.4 million, or 27%, in the year ended December 31, 2017 compared to the year ended December 31, 2016. The increase was primarily attributable to a $9.6 million increase in personnel-related expenses, which includes $0.8 million in stock-based compensation expense due to an increase in the average headcount as we expanded our sales and marketing efforts to increase both the number of high value subscribers and average revenue per subscriber, and a $4.8 million increase in promotional spending and other marketing programs. As of December 31, 2017, we had 471 employees, which includes 22 part time employees, dedicated to sales and marketing, compared to 493 employees, which includes 65 part time employees, as of December 31, 2016. The overall decrease in the total headcount for sales and marketing was due primarily to our focus on building a sales team with a dedicated and skilled full-time workforce.
Research and Development
Year Ended December 31, | Change | |||||||||||||
2017 | 2016 | $ | % | |||||||||||
(dollars in thousands) | ||||||||||||||
Research and development | $ | 35,810 | $ | 30,316 | $ | 5,494 | 18 | % | ||||||
Research and development expense increased $5.5 million, or 18%, in the year ended December 31, 2017 compared to the year ended December 31, 2016. The increase was primarily attributable to an increase in headcount and resulting personnel-related expenses of $6.4 million, including a $1.9 million increase in stock-based compensation, offset by capitalized qualifying development costs incurred during the year ended December 31, 2017 of $1.9 million. As of December 31, 2017, we had 243 employees dedicated to research and development, compared to 222 employees as of December 31, 2016.
General and Administrative
Year Ended December 31, | Change | |||||||||||||
2017 | 2016 | $ | % | |||||||||||
(dollars in thousands) | ||||||||||||||
General and Administrative | $ | 37,471 | $ | 30,497 | $ | 6,974 | 23 | % | ||||||
General and administrative expense increased $7.0 million, or 23%, in the year ended December 31, 2017 compared to the year ended December 31, 2016. The increase was primarily due to a $5.3 million increase in personnel-related expenses, including a $2.2 million increase in stock-based compensation, and a $1.1 million increase in audit, legal and consulting fees. As of December 31, 2017, we had 152 employees dedicated to general and administrative as compared to 138 employees as of December 31, 2016.
50
Other Expense, net, and Income Taxes Expense
Year Ended December 31, | Change | |||||||||||||
2017 | 2016 | $ | % | |||||||||||
(dollars in thousands) | ||||||||||||||
Interest income (expense), net | $ | 109 | $ | (1,123 | ) | $ | 1,232 | 110 | % | |||||
Other expense, net | 384 | 203 | 181 | 89 | % | |||||||||
Provision for income taxes | 167 | 321 | (154 | ) | (48 | )% | ||||||||
Interest income (expense), net increased during the during the year ended December 31, 2017 compared to the year ended December 31, 2016 as a result of interest income earned on our higher cash balances, which are invested in money market funds.
Comparison of the Years Ended December 31, 2016 and 2015
Revenue
Year Ended December 31, | Change | |||||||||||||
2016 | 2015 | $ | % | |||||||||||
(dollars in thousands) | ||||||||||||||
Revenue: | ||||||||||||||
Subscription and services | $ | 82,919 | $ | 61,339 | $ | 21,580 | 35 | % | ||||||
Payments | 53,808 | 37,460 | 16,348 | 44 | % | |||||||||
Product and other | 2,294 | 2,570 | (276 | ) | (11 | )% | ||||||||
Total revenue | $ | 139,021 | $ | 101,369 | $ | 37,652 | 37 | % | ||||||
Revenue increased $37.7 million, or 37%, in the year ended December 31, 2016 compared to the year ended December 31, 2015. Subscription and services revenue increased $21.6 million, or 35%, of which $16.4 million was due to a 17% increase in our number of subscribers to 60,385 as of December 31, 2016 from 51,481 as of December 31, 2015, combined with the impact of pricing increases and additional product offerings, and $4.7 million of which was due to an increase in revenue from arrangements with our API and technology partners. Payments revenue increased $16.3 million, or 44%, due to an increase in the volume of transactions processed by our customers combined with the increase in the number of customers that utilize our payments platform as well as an increase in a value retained from payments transactions.
Cost of Revenue and Gross Margin
Year Ended December 31, | Change | |||||||||||||
2016 | 2015 | $ | % | |||||||||||
(dollars in thousands) | ||||||||||||||
Cost of revenue | $ | 43,080 | $ | 37,190 | $ | 5,890 | 16 | % | ||||||
Gross margin | 69 | % | 63 | % | ||||||||||
Cost of revenue increased $5.9 million, or 16%, in the year ended December 31, 2016 compared to the year ended December 31, 2015. The increase was primarily attributable to a $4.1 million increase in personnel-related expenses and a $1.8 million increase in infrastructure costs to support the growing number of customers. As of December 31, 2016, we had 497 employees dedicated to data center operations, global customer support and onboarding services as compared to 454 employees as of December 31, 2015.
The increase in gross margin, or gross profit as a percentage of revenue, in the year ended December 31, 2016 compared to the year ended December 31, 2015 was primarily driven by growth in the number of customers and average revenue per subscriber, combined with leveraging our existing infrastructure and customer support.
51
Operating Expenses
Sales and Marketing
Year Ended December 31, | Change | |||||||||||||
2016 | 2015 | $ | % | |||||||||||
(dollars in thousands) | ||||||||||||||
Sales and marketing | $ | 56,460 | $ | 46,345 | $ | 10,115 | 22 | % | ||||||
Sales and marketing expense increased $10.1 million, or 22%, in the year ended December 31, 2016 compared to the year ended December 31, 2015. The increase was primarily attributable to a $5.7 million increase in personnel-related expenses with the purpose of both acquiring new customers as well as increasing the average revenue per subscriber. As of December 31, 2016, we had 493 employees dedicated to sales and marketing, compared to 422 employees as of December 31, 2015. The increase in sales and marketing expense was also attributable to a $3.4 million increase in promotional spending related to acquiring new customers, selling our payment processing services, selling higher value subscriptions to customers on lower software levels, and driving consumer adoption of the MINDBODY app.
Research and Development
Year Ended December 31, | Change | |||||||||||||
2016 | 2015 | $ | % | |||||||||||
(dollars in thousands) | ||||||||||||||
Research and development | $ | 30,316 | $ | 23,057 | $ | 7,259 | 31 | % | ||||||
Research and development expense increased $7.3 million, or 31%, in the year ended December 31, 2016 compared to the year ended December 31, 2015. The increase was primarily attributable to a $6.2 million increase in personnel-related expenses and to a $0.5 million increase in outsourced development costs. During the year, certain entry-level employees were replaced with fewer, more skilled and experienced employees, and a Chief Technology Officer was added, bringing the number of employees as of December 31, 2016 to 222, from 224 as of December 31, 2015.
General and Administrative
Year Ended December 31, | Change | |||||||||||||
2016 | 2015 | $ | % | |||||||||||
(dollars in thousands) | ||||||||||||||
General and Administrative | $ | 30,497 | $ | 29,530 | $ | 967 | 3 | % | ||||||
General and administrative expense increased $1.0 million, or 3%, in the year ended December 31, 2016 compared to the year ended December 31, 2015. The increase was primarily attributable to a $1.6 million increase in personnel-related expenses and corporate overhead costs incurred to support our growth, partially offset by a $0.5 million decrease in outsourced legal and professional fees. As of December 31, 2016, we had 138 employees dedicated to general and administrative as compared to 126 employees as of December 31, 2015.
52
Other Expense, net, and Income Taxes Expense
Year Ended December 31, | Change | |||||||||||||
2016 | 2015 | $ | % | |||||||||||
(dollars in thousands) | ||||||||||||||
Interest expense, net | $ | 1,123 | $ | 943 | $ | 180 | 19 | % | ||||||
Other expense, net | 203 | 132 | 71 | 54 | % | |||||||||
Provision for income taxes | 321 | 246 | 75 | 30 | % | |||||||||
The increase in interest expense during the year ended December 31, 2016 was primarily due to interest on the financing obligation associated with the build-to-suit lease arrangement.
Quarterly Results of Operations
The following tables set forth our unaudited consolidated statements of operations data for each of the eight quarters in the period ended December 31, 2017, as well as the percentage that each line item represents of total revenue for each quarter. The unaudited quarterly statements of operations data set forth below have been prepared on a basis consistent with our audited annual consolidated financial statements and include, in our opinion, all normal recurring adjustments necessary for a fair statement of the financial information. Our historical results are not necessarily indicative of the results that may be expected in the future. The following quarterly financial data should be read in conjunction with our audited consolidated financial statements and the related notes included in Item 15 of Part IV of this Annual Report on Form 10-K.
Three Months Ended | |||||||||||||||||||||||||||||||
Dec. 31, 2017 | Sept. 30, 2017 | June 30, 2017 | March 31, 2017 | Dec. 31, 2016 | Sept. 30, 2016 | June 30, 2016 | March 31, 2016 | ||||||||||||||||||||||||
(in thousands, except per share data) | |||||||||||||||||||||||||||||||
Revenue | $ | 49,693 | $ | 46,612 | $ | 44,107 | $ | 42,214 | $ | 38,191 | $ | 35,262 | $ | 33,561 | $ | 32,006 | |||||||||||||||
Cost of revenue1 | 13,990 | 13,123 | 12,738 | 12,019 | 11,423 | 10,972 | 10,713 | 9,972 | |||||||||||||||||||||||
Gross profit | 35,703 | 33,489 | 31,369 | 30,195 | 26,768 | 24,290 | 22,848 | 22,034 | |||||||||||||||||||||||
Operating expenses: | |||||||||||||||||||||||||||||||
Sales and marketing1 | 19,615 | 18,514 | 17,362 | 16,334 | 14,926 | 14,599 | 13,706 | 13,229 | |||||||||||||||||||||||
Research and development1 | 9,384 | 8,976 | 8,802 | 8,648 | 7,558 | 7,747 | 7,594 | 7,417 | |||||||||||||||||||||||
General and administrative1 | 9,664 | 9,763 | 9,358 | 8,686 | 7,947 | 7,346 | 7,681 | 7,523 | |||||||||||||||||||||||
Total operating expenses | 38,663 | 37,253 | 35,522 | 33,668 | 30,431 | 29,692 | 28,981 | 28,169 | |||||||||||||||||||||||
Loss from operations | (2,960 | ) | (3,764 | ) | (4,153 | ) | (3,473 | ) | (3,663 | ) | (5,402 | ) | (6,133 | ) | (6,135 | ) | |||||||||||||||
Interest income (expense), net | 234 | 172 | (83 | ) | (214 | ) | (258 | ) | (261 | ) | (292 | ) | (312 | ) | |||||||||||||||||
Other income (expense), net | (328 | ) | 45 | (21 | ) | (80 | ) | 23 | (90 | ) | (61 | ) | (74 | ) | |||||||||||||||||
Loss before provision for income taxes | (3,054 | ) | (3,547 | ) | (4,257 | ) | (3,767 | ) | (3,898 | ) | (5,753 | ) | (6,486 | ) | (6,521 | ) | |||||||||||||||
Provision for income taxes | (176 | ) | 83 | 118 | 142 | 42 | 142 | 64 | 73 | ||||||||||||||||||||||
Net loss | $ | (2,878 | ) | $ | (3,630 | ) | $ | (4,375 | ) | $ | (3,909 | ) | $ | (3,940 | ) | $ | (5,895 | ) | $ | (6,550 | ) | $ | (6,594 | ) | |||||||
Net loss per share attributable to common stockholders, basic and diluted | (0.06 | ) | (0.08 | ) | (0.10 | ) | (0.10 | ) | (0.10 | ) | (0.15 | ) | (0.16 | ) | (0.17 | ) | |||||||||||||||
Weighted-average shares used to compute net loss per share attributable to common stockholders, basic and diluted | 46,783 | 46,460 | 43,147 | 40,757 | 40,521 | 39,965 | 39,706 | 39,450 | |||||||||||||||||||||||
53
(1) Stock-based compensation expense included above was as follows:
Three Months Ended | |||||||||||||||||||||||||||||||
Dec. 31, 2017 | Sept. 30, 2017 | June 30, 2017 | March 31, 2017 | Dec. 31, 2016 | Sept. 30, 2016 | June 30, 2016 | March 31, 2016 | ||||||||||||||||||||||||
(in thousands) | |||||||||||||||||||||||||||||||
Cost of revenue | $ | 420 | $ | 287 | $ | 366 | $ | 261 | $ | 244 | $ | 231 | $ | 220 | $ | 215 | |||||||||||||||
Sales and marketing | 859 | 836 | 671 | 506 | 423 | 613 | 440 | 583 | |||||||||||||||||||||||
Research and development | 1,190 | 1,167 | 980 | 527 | 515 | 490 | 470 | 495 | |||||||||||||||||||||||
General and administrative | 1,707 | 1,625 | 1,496 | 1,203 | 975 | 975 | 1,253 | 620 | |||||||||||||||||||||||
Total stock-based compensation expense | $ | 4,176 | $ | 3,915 | $ | 3,513 | $ | 2,497 | $ | 2,157 | $ | 2,309 | $ | 2,383 | $ | 1,913 | |||||||||||||||
Three Months Ended | |||||||||||||||||||||||
Dec. 31, 2017 | Sept. 30, 2017 | June 30, 2017 | March 31, 2017 | Dec. 31, 2016 | Sept. 30, 2016 | June 30, 2016 | March 31, 2016 | ||||||||||||||||
(percentage of revenue) | |||||||||||||||||||||||
Revenue | 100 | % | 100 | % | 100 | % | 100 | % | 100 | % | 100 | % | 100 | % | 100 | % | |||||||
Cost of revenue | 28 | % | 28 | % | 29 | % | 28 | % | 30 | % | 31 | % | 32 | % | 31 | % | |||||||
Gross margin | 72 | % | 72 | % | 71 | % | 72 | % | 70 | % | 69 | % | 68 | % | 69 | % | |||||||
Operating expenses: | |||||||||||||||||||||||
Sales and marketing | 40 | % | 40 | % | 39 | % | 39 | % | 39 | % | 41 | % | 41 | % | 41 | % | |||||||
Research and development | 19 | % | 19 | % | 20 | % | 20 | % | 20 | % | 22 | % | 22 | % | 23 | % | |||||||
General and administrative | 19 | % | 21 | % | 21 | % | 21 | % | 21 | % | 21 | % | 23 | % | 24 | % | |||||||
Total operating expenses | 78 | % | 80 | % | 80 | % | 80 | % | 80 | % | 84 | % | 86 | % | 88 | % | |||||||
Loss from operations | (6 | )% | (8 | )% | (9 | )% | (8 | )% | (10 | )% | (15 | )% | (18 | )% | (19 | )% | |||||||
Interest income (expense), net | — | % | — | % | (1 | )% | (1 | )% | — | % | (1 | )% | (1 | )% | (1 | )% | |||||||
Other income (expense), net | — | % | — | % | — | % | — | % | — | % | — | % | — | % | — | % | |||||||
Loss before provision for income taxes | (6 | )% | (8 | )% | (10 | )% | (9 | )% | (10 | )% | (16 | )% | (19 | )% | (20 | )% | |||||||
Provision for income taxes | — | % | — | % | — | % | — | % | — | % | (1 | )% | (1 | )% | (1 | )% | |||||||
Net loss | (6 | )% | (8 | )% | (10 | )% | (9 | )% | (10 | )% | (17 | )% | (20 | )% | (21 | )% | |||||||
Adjusted EBITDA(1)
Three Months Ended | |||||||||||||||||||||||||||||||
Dec. 31, 2017 | Sept. 30, 2017 | June 30, 2017 | March 31, 2017 | Dec. 31, 2016 | Sept. 30, 2016 | June 30, 2016 | March 31, 2016 | ||||||||||||||||||||||||
(in thousands) | |||||||||||||||||||||||||||||||
Net loss | $ | (2,878 | ) | $ | (3,630 | ) | $ | (4,375 | ) | $ | (3,909 | ) | $ | (3,940 | ) | $ | (5,895 | ) | $ | (6,550 | ) | $ | (6,594 | ) | |||||||
Stock-based compensation | 4,176 | 3,915 | 3,513 | 2,497 | 2,157 | 2,309 | 2,383 | 1,913 | |||||||||||||||||||||||
Depreciation and amortization | 2,414 | 2,337 | 2,309 | 2,090 | 2,084 | 2,013 | 1,810 | 1,848 | |||||||||||||||||||||||
Provision for income tax | (176 | ) | 83 | 118 | 142 | 42 | 142 | 64 | 73 | ||||||||||||||||||||||
Other (income) expense, net | 94 | (217 | ) | 104 | 294 | 235 | 351 | 353 | 386 | ||||||||||||||||||||||
Adjusted EBITDA | $ | 3,630 | $ | 2,488 | $ | 1,669 | $ | 1,114 | $ | 578 | $ | (1,080 | ) | $ | (1,940 | ) | $ | (2,374 | ) | ||||||||||||
(1) | We define Adjusted EBITDA as our net loss before stock-based compensation expense, depreciation and amortization, provision for income taxes, and other income (expense), net, which consisted of interest income (expense), net, and other income (expense), net. |
54
Quarterly Trends
Our quarterly revenue increased sequentially for each period presented. The quarterly revenue increases were due to varying reasons, including, pricing increases, an increased adoption of our branded mobile app offering, an increase in the number of high value subscribers, an increase in the volume of transactions processed by our customers on our payments platform combined with an increase in the number of high value subscribers that utilize our payments platform as well as an increase in the value retained from these transactions, and an increase in revenue from API and technology partners.
Our quarterly total operating expenses increased sequentially for each period presented, primarily due to increased expenses related to our rapid growth, including continued expansion of our technical infrastructure and expenses related to increases in employee headcount.
Historical patterns in our business may not be a reliable indicator of our future revenue growth or performance.
Liquidity and Capital Resources
As of December 31, 2017 and December 31, 2016, we had cash and cash equivalents of $232.0 million and $85.9 million, respectively. Cash and cash equivalents consist of cash on deposit and money market funds.
In June 2015, we completed our IPO in which we issued and sold 7,150,000 shares of our Class A common stock at a public offering price of $14.00 per share, resulting in aggregate proceeds of approximately $93.1 million, net of underwriters’ discounts and commissions but before deducting offering expenses of approximately $4.0 million.
In May 2017, we completed a follow-on public offering in which we issued and sold 5,060,000 shares of Class A common stock at a public offering price of $27.95 per share. We received net proceeds of $134.7 million after deducting underwriters’ discounts and commissions of $6.7 million, but before deducting offering expenses of approximately $0.4 million.
In January 2015, we entered into a loan agreement with Silicon Valley Bank for a secured revolving credit facility that allows us to borrow up to $20 million for working capital and general business requirements. Borrowings under our loan agreement are available based on a percentage of our monthly recurring revenue for the previous three months. Amounts outstanding under the credit facility will bear interest at the greater of the prime rate (4.5% as of December 31, 2017) plus 0.5%, or 3.25% with accrued interest payable on a monthly basis and outstanding and unpaid principal due upon maturity of the credit facility in January 2018. The credit facility is secured by substantially all of our corporate assets. We also granted and pledged a security interest to the lender in all rights, title, and interest in our intellectual property. We are also subject to certain reporting and financial performance covenants, which require us to meet certain revenue targets. We did not draw down any amounts under the loan agreement during the year ended December 31, 2017.
In the first quarter of 2018 we amended our loan agreement with Silicon Valley Bank, which amended, among other things, (a) extended the maturity date of the revolving credit facility from January 12, 2018 to January 11, 2019, (b) added an accordion feature for the revolving credit facility, such that the revolving credit facility may, upon our request and subject to certain conditions, be increased by an aggregate amount of up to $20 million, (c) reduced the interest rate to the greater of the prime rate or 4.5% and (d) deleted the revenue covenant.
We believe that our existing cash and cash equivalents balance will be sufficient to meet our working capital requirements for at least the next 12 months. However, our liquidity assumptions may prove to be incorrect, and we could utilize our available financial resources sooner than we currently expect. Our future capital requirements and the adequacy of available funds will depend on many factors, including our growth rate, the timing and extent of spending to support development efforts, the expansion of sales and marketing activities, and those factors set forth in the “Risk Factors” section of this Annual Report on Form 10-K. We cannot assure you that we will be able to raise additional capital on acceptable terms or at all. In addition, if we fail to meet our operating plan during the next 12 months, our liquidity and ability to operate our business could be adversely affected.
55
The following table summarizes our cash and cash equivalents and our cash flows for the periods presented (in thousands):
As of December 31, | |||||||||||
2017 | 2016 | ||||||||||
Cash and cash equivalents | $ | 232,019 | $ | 85,864 | |||||||
Year Ended December 31, | |||||||||||
2017 | 2016 | 2015 | |||||||||
Cash provided by (used in) operating activities | $ | 11,110 | $ | (3,896 | ) | $ | (18,574 | ) | |||
Cash used in investing activities | (10,513 | ) | (12,729 | ) | (12,131 | ) | |||||
Cash provided by financing activities | 145,296 | 9,167 | 89,518 | ||||||||
Operating Activities
During the year ended December 31, 2017, operating activities provided $11.1 million, primarily as a result of $23.6 million of non-cash charges included in our net loss of $14.8 million, and $2.3 million provided by the net change in operating assets and liabilities. The non-cash charges primarily consisted of $14.1 million of stock-based compensation expense and $9.2 million of depreciation and amortization expense. The net change in operating assets and liabilities was primarily a result of a $4.3 million increase in accounts payable, accrued expenses, and other liabilities and a $1.4 million increase in deferred revenue, which were partially offset by a $1.9 million increase in prepaid expenses and other current assets and a $1.7 million increase in accounts receivable. The increase in accounts payable, accrued expenses, and other liabilities was due to the increase in headcount and the timing of payments to our vendors and employees.
During the year ended December 31, 2016, operating activities used $3.9 million, primarily as a result of our net loss of $23.0 million, partially offset by $16.8 million of non-cash charges and $2.3 million provided by the net change in operating assets and liabilities. The non-cash charges primarily consisted of $8.8 million of stock-based compensation expense and $7.8 million of depreciation and amortization expense. The net change in operating assets and liabilities was primarily a result of a $2.7 million increase in accounts payable, accrued expenses, and other liabilities and a $2.8 million increase in deferred revenue, which were partially offset by a $2.6 million increase in accounts receivable and a $0.6 million increase in prepaid expenses and other current assets. The increase in accounts receivable was primarily from higher payments revenue. The increase in accounts payable, accrued expenses, and other liabilities was due to the increase in headcount and the timing of payments to our vendors and employees.
During the year ended December 31, 2015, operating activities used $18.6 million, primarily as a result of our net loss of $36.1 million, offset by $15.4 million of non-cash charges, primarily consisting of $8.4 million of stock-based compensation expense and $6.5 million of depreciation and amortization expense, and a $2.1 million net change in operating assets and liabilities. The change in net operating assets and liabilities were primarily a result of a $3.5 million increase in accounts payable, accrued expenses, and other current liabilities due to the increase in headcount and the timing of payments to our vendors and contributions from our employees under our employee stock purchase plan, in addition to a $2.6 million increase in deferred revenue. These were partially offset by a $3.8 million increase in accounts receivable resulting primarily from higher payments revenue.
Investing Activities
During the year ended December 31, 2017, investing activities used $10.5 million as a result of purchases of property and equipment of $6.9 million, additions of intangible assets through the capitalization of qualifying development costs of $2.0 million, and cash paid to acquire a business of $1.7 million.
During the year ended December 31, 2016, investing activities used $12.7 million as a result of purchases of property and equipment of $8.6 million and cash paid to acquire a business of $4.1 million.
During the year ended December 31, 2015, investing activities used $12.1 million, primarily as a result of purchases of property and equipment of $9.9 million and cash paid to acquire a business of $3.0 million.
Financing Activities
During the year ended December 31, 2017, financing activities provided $145.3 million, consisting primarily of $134.3 million in net proceeds from the issuance of Class A common stock in May 2017, $10.0 million in proceeds from the exercise of equity awards and $3.2 million in proceeds from our employee stock purchase plan, which was partially offset by $1.7 million in tax payments related to employee shares withheld from RSUs vesting during the period.
56
During the year ended December 31, 2016, financing activities provided $9.2 million, consisting primarily of proceeds from the exercise of equity awards of $6.6 million and proceeds from our employee stock purchase plan of $3.0 million, which was partially offset by $0.5 million in repayments on financing and capital lease obligations.
During the year ended December 31, 2015, financing activities provided $89.5 million, consisting of $93.1 million in proceeds from our initial public offering, partially offset by $3.4 million in payments of offering costs.
Contractual Obligations and Commitments
Our principal commitments consist of obligations under non-cancelable lease agreements for our corporate headquarters in San Luis Obispo, California, our smaller regional offices throughout the United States, and international locations in the United Kingdom and Australia, and non-cancelable purchase commitments for software subscriptions and communication services. The following summarizes our contractual obligations and commitments as of December 31, 2017:
Payment Due by Period | |||||||||||||||||||
Total | Less Than 1 Year | 1-3 Years | 3-5 Years | More Than 5 Years | |||||||||||||||
(in thousands) | |||||||||||||||||||
Operating leases1 | $ | 31,418 | $ | 4,703 | $ | 9,424 | $ | 7,184 | $ | 10,107 | |||||||||
Finance obligation, building leases2 | 24,551 | 1,679 | 3,510 | 3,725 | 15,637 | ||||||||||||||
Purchase commitments | 5,949 | 2,819 | 3,130 | — | — | ||||||||||||||
Total minimum payments | $ | 61,918 | $ | 9,201 | $ | 16,064 | $ | 10,909 | $ | 25,744 | |||||||||
________________________________________________________________
(1) We lease office facilities under various non-cancelable operating lease agreements.
(2) For certain build-to-suit lease arrangements where we have concluded that we are the “deemed owner” of a building (for accounting purposes only) during the construction period, we are required to record an asset with a corresponding construction financing obligation for the costs incurred by the landlord.
Off Balance Sheet Arrangements
As of December 31, 2017, we did not have any relationships with unconsolidated entities or financial partnerships, such as structured finance or special purpose entities, which were established for the purpose of facilitating off-balance sheet arrangements or other purposes.
Segment Information
We have one primary business activity and operate in one reportable segment.
Critical Accounting Policies and Estimates
Our consolidated financial statements have been prepared in accordance with U.S. generally accepted accounting principles. The preparation of these consolidated financial statements requires us to make estimates and assumptions that affect the reported amounts of assets, liabilities, revenue, expenses, and related disclosures. We base our estimates on historical experience and on various other assumptions that we believe are reasonable under the circumstances. We evaluate our estimates and assumptions on an ongoing basis. Actual results may differ from these estimates. To the extent that there are material differences between these estimates and our actual results, our future financial statements will be affected.
We believe that the assumptions and estimates associated with revenue recognition, internal-use software development costs and the useful life of that software, income taxes, stock-based compensation expense and valuation assumptions have the greatest potential impact on our consolidated financial statements. Therefore, we consider these to be our critical accounting policies and estimates.
For further information on all of our significant accounting policies, see the notes to our consolidated financial statements.
Revenue Recognition
We recognize revenue on a transaction when all of the following conditions have been satisfied:
• | persuasive evidence of an agreement exists; |
57
• | the service has been or is being provided to the customer or delivery of the product has occurred; |
• | fees are fixed or determinable; and |
• | the collection of the fees is reasonably assured. |
Our primary sources of revenue are derived from monthly subscription and support services and revenue share arrangements with technology partners and third-party payment processors. The subscription revenue is recognized ratably over the term of the agreement, which is most often monthly but can be quarterly or annual. Our customers enter into separate arrangements with technology partners and third-party payment processors. Revenue derived from revenue share arrangements with technology partners and third-party payment processors is recognized in the period services are rendered on a net basis. We also earn revenue from API platform partners for customer site access, data query, and consumer bookings. The revenue from API platform partners is recorded in the period services are rendered on a gross basis.
In certain circumstances, our arrangements include multiple elements which may consist of some or all of subscription services, support services, and hardware products. When multiple-element arrangements exist, we evaluate whether any of these deliverables should be accounted for as separate units of accounting.
Our support services do not have standalone value because we and other vendors do not sell support services separately. Such support services are therefore combined with our subscription services as a single unit of accounting. Our hardware products, such as point-of-sale systems, have standalone value because we and other vendors sell the same products separately. Additionally, while there is a general right of return relative to our hardware products, which are generally delivered upfront, performance of the subscription and support services is considered probable and substantially in our control. Accordingly, we consider the separate units of accounting in our multiple-element arrangements to be the hardware products and subscription and support services. For arrangements with multiple elements which can be separated into different units of accounting, we allocate the arrangement fee to the separate units of accounting based on vendor-specific objective evidence, as demonstrated by separate sales with sufficient concentration in selling prices.
Capitalized Software Costs
We capitalize certain development costs incurred in connection with internal use software. Software projects qualify for capitalization when they add significant new functionality that was not previously available in any former version of our software. Capitalization begins when the preliminary project stage is complete, management with the relevant authority authorizes and commits to the funding of the software project, it is probable the project will be completed, and the software will be used to perform the functions intended and certain functional and quality standards have been met. Capitalization of these costs ceases once the project is substantially complete and the software is ready for its intended purpose.
Research and development costs incurred during the preliminary project stage or costs incurred for training, maintenance, and general and administrative or overhead costs are expensed as incurred. Development costs related to upgrades or enhancements to existing applications are expensed as maintenance costs because such projects do not significantly enhance functionality.
Capitalized software development costs are amortized to cost of revenue using the straight-line method over an estimated useful life of the software of two to three years, commencing when the software is ready for its intended use.
Income Taxes
We account for income taxes under the asset and liability method of accounting for income taxes. Under this method, deferred taxes are recognized for the future tax consequences attributable to differences between the consolidated financial statement carrying amounts of existing assets and liabilities and their respective tax bases. Deferred tax assets and liabilities are measured using enacted tax rates expected to be applied to taxable income in the years in which those temporary differences are expected to be recovered or settled. A valuation allowance is recorded to reduce the carrying amount of deferred tax assets, unless it is more likely than not such assets will be realized.
We also apply the provisions for uncertainty of income taxes. This guidance prescribes a recognition threshold and measurement attribute for consolidated financial statement recognition and measurement of a tax position taken or expected to be taken in a tax return. For those benefits to be recognized, a tax position must be more likely than not to be sustained upon examination by taxing authorities. This guidance also applies to various related matters, such as derecognition, interest, penalties, and required disclosures. We recognize interest and penalties, if any, related to unrecognized tax benefits in our income tax provision.
58
Stock-Based Compensation
Stock-based compensation expense is measured and recognized in the financial statements based on the fair value of the awards granted. The fair value of stock option awards and stock purchases under our employee stock purchase plan (ESPP) are estimated on the grant date using the Black-Scholes option pricing model. The fair value of restricted stock awards and restricted stock units is considered to be the closing market price of our Class A common stock on the grant date. Stock-based compensation expense is recognized, net of forfeitures, using a straight-line basis over the requisite service period of the awards, which is generally four years. We estimate a forfeiture rate to calculate the stock-based compensation for our awards based on an analysis of our actual historical experience and expected employee attrition rates.
Our use of the Black-Scholes option-pricing model requires the input of highly subjective assumptions, including the fair value of the underlying common stock, expected term of the option, expected volatility of the price of our common stock, risk-free interest rates, and the expected dividend yield of our common stock. The assumptions used in our option-pricing model represent management’s best estimates. These estimates involve inherent uncertainties and the application of management’s judgment. If factors change and different assumptions are used, our stock-based compensation expense could be materially different in the future.
These assumptions and estimates are as follows:
• | Fair value of common stock. Prior to our IPO in June 2015, the fair value of the common stock underlying our stock-based awards was determined by our board of directors, with input from management and a third-party valuation firm as discussed below under the heading “Common Stock Valuations Prior to Our Initial Public Offering”. Since our IPO, the fair value of common stock was determined based on the closing market price of our Class A common stock as reported on the NASDAQ Stock Market at each grant date. |
• | Expected term. The expected term of employee stock options represents the weighted-average period that the stock options are expected to remain outstanding. |
• | Volatility. As we have a limited trading history for our common stock, the expected stock price volatility for our common stock was estimated by taking the average historic price volatility for industry peers based on daily price observations over a period equivalent to the expected term of the stock option grants. Industry peers consist of several public companies in our industry which are similar in size, stage of life cycle, and financial leverage. We did not rely on implied volatilities of traded stock options in our industry peers’ common stock because the volume of activity was relatively low. We intend to continue to consistently apply this methodology using the same or similar public companies until sufficient historical information regarding the volatility of our Class A common stock price becomes available, or unless circumstances change such that the identified companies are no longer similar to MINDBODY, in which case, more suitable companies whose share prices are publicly available would be utilized in the calculation. |
• | Risk-free interest rate. We base the risk-free interest rate used in the Black-Scholes option-pricing model on the yields of U.S. Treasury securities with maturities appropriate for the term of employee stock option awards. |
• | Dividend yield. We have never declared or paid any cash dividends and do not presently plan to pay cash dividends on our common stock in the foreseeable future. Consequently, we used an expected dividend yield of zero. |
The following table summarizes the assumptions used in the Black-Scholes option-pricing model to determine the fair value of our stock options as follows:
Year Ended December 31, | |||||
2017 | 2016 | 2015 | |||
Expected term (in years) | 5.8 | 5.8 | 5.8 | ||
Expected volatility | 38% - 44% | 44% - 45% | 45% - 46% | ||
Risk-free interest rate | 1.8% - 2.1% | 1.2% - 1.9% | 1.4% - 1.8% | ||
Expected dividend yield | 0% | 0% | 0% | ||
59
In addition to the assumptions used in the Black-Scholes option-pricing model, we must also estimate a forfeiture rate to calculate the stock-based compensation expense for our awards. Our forfeiture rate is based on historical experience and expected employee attrition rates. We will continue to evaluate the appropriateness of the forfeiture rate based on actual forfeiture experience, analysis of employee turnover, and other factors. Quarterly changes in the estimated forfeiture rate can have a significant impact on our stock-based compensation expense as the cumulative effect of adjusting the rate is recognized in the period the forfeiture estimate is changed. If a revised forfeiture rate is higher than the previously estimated forfeiture rate, an adjustment is made that will result in a decrease to the stock-based compensation expense recognized in the financial statements. If a revised forfeiture rate is lower than the previously estimated forfeiture rate, an adjustment is made that will result in an increase to the stock-based compensation expense recognized in the financial statements.
We will continue to use judgment in evaluating the assumptions related to our stock-based compensation on a prospective basis. As we continue to accumulate additional data related to our common stock, we may have refinements to our estimates, which could materially impact our future stock-based compensation expense.
Common Stock Valuations Prior to Our Initial Public Offering
Prior to completion of our IPO, we were a private company with no active public market for our common stock. The fair value of the common stock underlying our stock options was determined by our board of directors, which intended all options granted to be exercisable at a price per share not less than the per share fair value of our common stock underlying those options on the date of grant. The valuations of our common stock were determined in accordance with the guidelines outlined in the American Institute of Certified Public Accountants Practice Aid, Valuation of Privately-Held-Company Equity Securities Issued as Compensation, or AICPA Practice Aid. The assumptions we used in the valuation model were based on future expectations combined with management judgment. In the absence of a public trading market, our board of directors, with input from management and assistance of third-party valuation specialists hired by us, exercised significant judgment and considered numerous objective and subjective factors to determine the fair value of our common stock as of the date of each option grant, including the following factors:
• | contemporaneous valuations performed by unrelated third-party specialists; |
• | the prices, rights, preferences, and privileges of our redeemable convertible preferred stock relative to those of our common stock; |
• | the prices of our redeemable convertible preferred stock and common stock sold to outside investors in arm’s-length transactions; |
• | the lack of marketability of our common stock; |
• | our actual operating and financial performance; |
• | current business conditions and projections; |
• | our hiring of key personnel and the experience of our management; |
• | our history and the timing of the introduction of new products and services; |
• | our stage of development; |
• | the likelihood of achieving a liquidity event, such as an initial public offering or a merger or acquisition of our company given prevailing market conditions; |
• | the illiquidity of stock-based awards involving securities in a private company; |
• | the market performance of comparable publicly traded companies; and |
• | the U.S. and global capital market conditions. |
The valuations were highly complex and subjective. Following the completion of our initial public offering in June 2015, common stock valuations were no longer necessary as we rely on market prices as reported on the NASDAQ Stock Market to determine the fair value of our common stock.
Redeemable Convertible Preferred Stock
Prior to completion of our IPO, we recorded the carrying value of redeemable convertible preferred stock at fair value upon issuance, net of issuance costs, accreted to its estimated redemption value using the effective interest method. Accretion to the carrying value was recorded as an increase in the carrying value of the redeemable convertible preferred stock and a reduction of stockholder’s deficit.
60
We reviewed the rights and preferences of our redeemable convertible preferred stock for any changes in terms, rights or preferences to determine if such change is a modification or an extinguishment. An amendment that, based on either quantitative or qualitative considerations, changes a substantive contractual term or fundamentally changes the nature of the preferred share is considered an extinguishment. We considered both expected economics as well as the business purpose of the amendment. If considered an extinguishment, we removed the carrying value of the old securities and recognized the new securities at their current fair value. If considered a modification, we recognized the change in the fair value of the security immediately before and after the amendment as either a deemed dividend or a deemed capital contribution.
Preferred Stock Warrant
Prior to completion of our IPO, we accounted for freestanding warrants to purchase shares of our redeemable convertible preferred stock as liabilities in the consolidated balance sheets at their estimated fair value. Our preferred stock warrant was subject to re-measurement at each balance sheet date, and any change in fair value was recognized as a component of other expense, net, in the consolidated statements of operations.
Recently Issued and Adopted Accounting Pronouncements
For a discussion of new accounting pronouncements, refer to Note 1 – “Summary of Business and Significant Accounting Policies” contained in the “Notes to Audited Consolidated Financial Statements” in Item 15 of Part IV of this Annual Report on Form 10-K.
Item 7A. Quantitative and Qualitative Disclosures about Market Risk.
Foreign Currency Exchange Risk
We have foreign currency risks related to our revenue and expenses denominated in currencies other than the U.S. Dollar, principally the British Pound Sterling, the Euro and the Australian Dollar, which are subject to fluctuations due to changes in foreign currency exchange rates. Additionally, fluctuations in foreign currency exchange rates may cause us to recognize transaction gains and losses in our statements of operations. To date, foreign currency transaction gains and losses have not been material to our financial statements, and we have not engaged in foreign currency hedging transactions. A hypothetical 10% change in foreign currency exchange rates during any of the periods presented would not have had a material impact on our consolidated financial statements. As our international operations grow, we will continue to reassess our approach to managing the risks relating to fluctuations in currency rates.
Interest Rate Risk
Our cash and cash equivalents consist of cash on deposit and money market accounts. The primary objective of our investment activities is to preserve principal while maximizing income without significantly increasing risk. Because our cash equivalents have a short maturity, our portfolio’s fair value is relatively insensitive to interest rate changes. To date, we have not been exposed, nor do we anticipate being exposed, to material risks due to changes in interest rates. A hypothetical 100 basis points change in interest rates during any of the periods presented would not have had a material impact on our consolidated financial statements. In future periods, we will continue to evaluate our investment policy in order to ensure that we continue to meet our overall objectives.
Item 8. Financial Statements and Supplementary Data.
The consolidated financial statements required pursuant to this item are included in Part IV, Item 15 of this Annual Report on Form 10-K, and are presented beginning on page F-1.
Item 9. Changes in and Disagreements with Accountants on Accounting and Financial Disclosure.
None.
Item 9A. Controls and Procedures.
Limitations on Effectiveness of Controls
In designing and evaluating the disclosure controls and procedures, management recognizes that any controls and procedures, no matter how well designed and operated, can provide only reasonable assurance of achieving their objectives and management necessarily applies its judgment in evaluating the cost-benefit relationship of possible controls and procedures.
61
Evaluation of Disclosure Controls and Procedures
Our management, with the participation of our Chief Executive Officer and our Chief Financial Officer, has evaluated the effectiveness of our disclosure controls and procedures as of the end of the period covered by this Annual Report on Form 10-K. The term “disclosure controls and procedures,” as defined in Rules 13a-15(e) and 15d-15(e) under the Securities Exchange Act of 1934, as amended, or the Exchange Act, means controls and other procedures of a company that are designed to ensure that information required to be disclosed by a company in the reports that it files or submits under the Exchange Act is recorded, processed, summarized and reported, within the time periods specified in the SEC’s rules and forms. Disclosure controls and procedures include, without limitation, controls and procedures designed to ensure that information required to be disclosed by a company in the reports that it files or submits under the Exchange Act is accumulated and communicated to the Company’s management, including its principal executive and principal financial officers, or persons performing similar functions, as appropriate to allow timely decisions regarding required disclosure. Based on such evaluation, our Chief Executive Officer and Chief Financial Officer concluded that, as of the end of the period covered by this Annual Report on Form 10-K, our disclosure controls and procedures are designed at a reasonable assurance level and are effective to provide reasonable assurance that information we are required to disclose in reports that we file or submit under the Exchange Act is recorded, processed, summarized, and reported within the time periods specified in Securities and Exchange Commission rules and forms, and that such information is accumulated and communicated to our management, including our Chief Executive Officer and Chief Financial Officer, as appropriate, to allow timely decisions regarding required disclosure.
Changes in Internal Control over Financial Reporting
There was no change in our internal control over financial reporting identified in connection with the evaluation required by Rule 13a-15(d) and 15d-15(d) of the Exchange Act that occurred during the fourth fiscal quarter of fiscal 2017 that has materially affected, or is reasonably likely to materially affect, our internal control over financial reporting.
Management’s Report on Internal Control over Financial Reporting
Our management is responsible for establishing and maintaining adequate internal control over financial reporting, as defined in Rule 13a-15(f) under the Exchange Act. Our management conducted an assessment of the effectiveness of our internal control over financial reporting based on the criteria established in Internal Control - Integrated Framework (2013) issued by the Committee of Sponsoring Organizations of the Treadway Commission (COSO). Based on that assessment, our management has concluded that our internal control over financial reporting was effective as of December 31, 2017. The effectiveness of our internal control over financial reporting as of December 31, 2017 has been audited by Deloitte & Touche LLP, an independent registered public accounting firm, as stated in its report which appears herein.
Item 9B. Other Information.
None.
62
PART III
Item 10. Directors, Executive Officers and Corporate Governance.
The information required by this item is incorporated herein by reference from our definitive proxy statement relating to our Annual Meeting of Stockholders to be held in 2018. The definitive proxy statement will be filed with the SEC within 120 days after the end of the 2017 fiscal year.
Our Board of Directors has adopted a Code of Business Conduct and Ethics that applies to all of our employees, officers and directors, including our Chief Executive Officer, Chief Financial Officer, and other executive and senior financial officers. The full text of our Code of Business Conduct and Ethics is posted on the Corporate Governance portion of our website at investors.mindbodyonline.com. We will post amendments to our Code of Business Conduct and Ethics or waivers of our Code of Business Conduct and Ethics for directors and executive officers on the same website.
Item 11. Executive Compensation.
The information required by this item is incorporated herein by reference from our definitive proxy statement relating to our Annual Meeting of Stockholders to be held in 2018. The definitive proxy statement will be filed with the SEC within 120 days after the end of the 2017 fiscal year.
Item 12. Security Ownership of Certain Beneficial Owners and Management and Related Stockholder Matters.
The information required by this item is incorporated herein by reference from our definitive proxy statement relating to our Annual Meeting of Stockholders to be held in 2018. The definitive proxy statement will be filed with the SEC within 120 days after the end of the 2017 fiscal year.
Item 13. Certain Relationships and Related Transactions, and Director Independence.
The information required by this item is incorporated herein by reference from our definitive proxy statement relating to our Annual Meeting of Stockholders to be held in 2018. The definitive proxy statement will be filed with the SEC within 120 days after the end of the 2017 fiscal year.
Item 14. Principal Accounting Fees and Services.
The information required by this item is incorporated herein by reference from our definitive proxy statement relating to our Annual Meeting of Stockholders to be held in 2018. The definitive proxy statement will be filed with the SEC within 120 days after the end of the 2017 fiscal year.
63
PART IV
Item 15. Exhibits, Financial Statement Schedules.
(a) The following documents are filed as part of this Annual Report on Form 10-K:
(1) Financial Statements:
(2) Financial Statement Schedules
All financial statement schedules have been omitted because they are not required, not applicable, not present in amounts sufficient to require submission of the schedule, or the required information is shown in our Consolidated Financial Statements or Notes thereto.
(3) Exhibits
The documents listed in the Exhibit Index of this Annual Report on Form 10-K are incorporated by reference or are filed or furnished with this Annual Report on Form 10-K, in each case as indicated therein (numbered in accordance with Item 601 of Regulation S-K).
64
SIGNATURES
Pursuant to the requirements of Section 13 or 15(d) of the Securities Exchange Act of 1934, the registrant has duly caused this report to be signed on its behalf by the undersigned, thereunto duly authorized.
MINDBODY, Inc. | |||
Date: | March 1, 2018 | By: | /s/ Richard Stollmeyer |
Richard Stollmeyer | |||
Chief Executive Officer | |||
POWER OF ATTORNEY
KNOW ALL PERSONS BY THESE PRESENTS, that each person whose signature appears below hereby constitutes and appoints Richard Stollmeyer and Brett White, and each of them, as his or her true and lawful attorney-in-fact and agent with full power of substitution, for him or her in any and all capacities, to sign any and all amendments to this Annual Report on Form 10-K, and to file the same, with all exhibits thereto, and other documents in connection therewith, with the Securities and Exchange Commission, granting unto said attorney-in-fact, proxy, and agent full power and authority to do and perform each and every act and thing requisite and necessary to be done in connection therewith, as fully for all intents and purposes as he or she might or could do in person, hereby ratifying and confirming all that said attorney-in-fact, proxy and agent, or his substitute, may lawfully do or cause to be done by virtue hereof.
Pursuant to the requirements of the Securities Exchange Act of 1934, this report has been signed below by the following persons on behalf of the registrant and in the capacities and on the dates indicated.
Name | Title | Date | ||
/s/ Richard Stollmeyer | Chief Executive Officer and Director (Principal Executive Officer) | March 1, 2018 | ||
Richard Stollmeyer | ||||
/s/ Brett White | Chief Financial Officer and Chief Operating Officer (Principal Financial Officer and Principal Accounting Officer) | March 1, 2018 | ||
Brett White | ||||
/s/ Katherine Blair Christie | Director | March 1, 2018 | ||
Katherine Blair Christie | ||||
/s/ Court Cunningham | Director | March 1, 2018 | ||
Court Cunningham | ||||
/s/ Gail Goodman | Director | March 1, 2018 | ||
Gail Goodman | ||||
/s/ Cipora Herman | Director | March 1, 2018 | ||
Cipora Herman | ||||
/s/ Eric Liaw | Director | March 1, 2018 | ||
Eric Liaw | ||||
/s/ Adam Miller | Director | March 1, 2018 | ||
Adam Miller | ||||
/s/ Graham Smith | Director | March 1, 2018 | ||
Graham Smith | ||||
65
INDEX TO CONSOLIDATED FINANCIAL STATEMENTS
F-1
REPORT OF INDEPENDENT REGISTERED PUBLIC ACCOUNTING FIRM
To the stockholders and the Board of Directors of MINDBODY, Inc.
Opinion on the Financial Statements
We have audited the accompanying consolidated balance sheets of MINDBODY, Inc. and subsidiaries (the “Company”) as of December 31, 2017 and 2016, the related consolidated statements of operations, comprehensive loss, redeemable convertible preferred stock and stockholders’ equity (deficit) and cash flows for each of the three years in the period ended December 31, 2017, and the related notes (collectively referred to as the “financial statements”). In our opinion, the financial statements present fairly, in all material respects, the financial position of the Company as of December 31, 2017 and 2016, and the results of its operations and its cash flows for each of the three years in the period ended December 31, 2017, in conformity with accounting principles generally accepted in the United States of America.
We have also audited, in accordance with the standards of the Public Company Accounting Oversight Board (United States) (PCAOB), the Company’s internal control over financial reporting as of December 31, 2017, based on the criteria established in Internal Control - Integrated Framework (2013) issued by the Committee of Sponsoring Organizations of the Treadway Commission and our report dated March 1, 2018 expressed an unqualified opinion on the Company’s internal control over financial reporting.
Basis for Opinion
These financial statements are the responsibility of the Company’s management. Our responsibility is to express an opinion on the Company’s financial statements based on our audits. We are a public accounting firm registered with the PCAOB and are required to be independent with respect to the Company in accordance with the U.S. federal securities law and the applicable rules and regulations of the Securities and Exchange Commission and the PCAOB.
We conducted our audits in accordance with the standards of the PCAOB. Those standards require that we plan and perform the audit to obtain reasonable assurance about whether the financial statements are free of material misstatement, whether due to error or fraud. Our audits included performing procedures to assess the risks of material misstatement of the financial statements, whether due to error or fraud, and performing procedures that respond to those risks. Such procedures included examining, on a test basis, evidence regarding the amounts and disclosures in the financial statements. Our audits also included evaluating the accounting principles used and significant estimates made by management, as well as evaluating the overall presentation of the financial statements. We believe that our audits provide a reasonable basis for our opinion.
/s/ Deloitte & Touche LLP
San Jose, California
March 1, 2018
We have served as the Company’s auditor since 2010.
F-2
REPORT OF INDEPENDENT REGISTERED PUBLIC ACCOUNTING FIRM
To the stockholders and the Board of Directors of MINDBODY, Inc.
Opinion on Internal Control over Financial Reporting
We have audited the internal control over financial reporting of MINDBODY, Inc. and subsidiaries (the “Company”) as of December 31, 2017, based on criteria established in Internal Control - Integrated Framework (2013) issued by the Committee of Sponsoring Organizations of the Treadway Commission (COSO). In our opinion, the Company maintained, in all material respects, effective internal control over financial reporting as of December 31, 2017, based on criteria established in Internal Control - Integrated Framework (2013) issued by the COSO.
We have also audited, in accordance with the standards of the Public Company Accounting Oversight Board (United States) (PCAOB), the consolidated financial statements as of and for the year ended December 31, 2017, of the Company and our report dated March 1, 2018 expressed an unqualified opinion on those financial statements.
Basis for Opinion
The Company’s management is responsible for maintaining effective internal control over financial reporting and for its assessment of the effectiveness of internal control over financial reporting, included in the accompanying Management’s Report on Internal Control over Financial Reporting. Our responsibility is to express an opinion on the Company’s internal control over financial reporting based on our audit. We are a public accounting firm registered with the PCAOB and are required to be independent with respect to the Company in accordance with the U.S. federal securities laws and the applicable rules and regulations of the Securities and Exchange Commission and the PCAOB.
We conducted our audit in accordance with the standards of the PCAOB. Those standards require that we plan and perform the audit to obtain reasonable assurance about whether effective internal control over financial reporting was maintained in all material respects. Our audit included obtaining an understanding of internal control over financial reporting, assessing the risk that a material weakness exists, testing and evaluating the design and operating effectiveness of internal control based on the assessed risk, and performing such other procedures as we considered necessary in the circumstances. We believe that our audit provides a reasonable basis for our opinion.
Definition and Limitations of Internal Control over Financial Reporting
A company’s internal control over financial reporting is a process designed to provide reasonable assurance regarding the reliability of financial reporting and the preparation of financial statements for external purposes in accordance with generally accepted accounting principles. A company’s internal control over financial reporting includes those policies and procedures that (1) pertain to the maintenance of records that, in reasonable detail, accurately and fairly reflect the transactions and dispositions of the assets of the company; (2) provide reasonable assurance that transactions are recorded as necessary to permit preparation of financial statements in accordance with generally accepted accounting principles, and that receipts and expenditures of the company are being made only in accordance with authorizations of management and directors of the company; and (3) provide reasonable assurance regarding prevention or timely detection of unauthorized acquisition, use, or disposition of the company’s assets that could have a material effect on the financial statements.
Because of its inherent limitations, internal control over financial reporting may not prevent or detect misstatements. Also, projections of any evaluation of effectiveness to future periods are subject to the risk that controls may become inadequate because of changes in conditions, or that the degree of compliance with the policies or procedures may deteriorate.
/s/ Deloitte & Touche LLP
San Jose, California
March 1, 2018
F-3
MINDBODY, Inc.
Consolidated Balance Sheets
(in thousands, except share and per share data)
As of December 31, | |||||||
2017 | 2016 | ||||||
ASSETS | |||||||
Current assets: | |||||||
Cash and cash equivalents | $ | 232,019 | $ | 85,864 | |||
Accounts receivable | 10,917 | 9,129 | |||||
Prepaid expenses and other current assets | 5,612 | 3,702 | |||||
Total current assets | 248,548 | 98,695 | |||||
Property and equipment, net | 32,871 | 33,084 | |||||
Intangible assets, net | 7,377 | 2,047 | |||||
Goodwill | 11,583 | 9,039 | |||||
Other non-current assets | 934 | 650 | |||||
TOTAL ASSETS | $ | 301,313 | $ | 143,515 | |||
LIABILITIES AND STOCKHOLDERS' EQUITY | |||||||
Current liabilities: | |||||||
Accounts payable | $ | 7,448 | $ | 4,827 | |||
Accrued expenses and other liabilities | 13,099 | 10,470 | |||||
Deferred revenue, current portion | 6,318 | 4,859 | |||||
Other current liabilities | 1,828 | 581 | |||||
Total current liabilities | 28,693 | 20,737 | |||||
Deferred revenue, non-current portion | 3,201 | 3,269 | |||||
Deferred rent, non-current portion | 1,966 | 1,387 | |||||
Financing obligation on leases, non-current portion | 14,932 | 15,450 | |||||
Other non-current liabilities | 585 | 1,016 | |||||
Total liabilities | 49,377 | 41,859 | |||||
Commitments and contingencies (Note 7) | |||||||
Stockholders' equity: | |||||||
Class A common stock, par value of $0.000004 per share; 1,000,000,000 shares authorized, 43,041,405 and 30,820,502 shares issued and outstanding as of December 31, 2017 and 2016, respectively. | 1 | — | |||||
Class B common stock, par value of $0.000004 per share; 100,000,000 shares authorized, 3,901,966 and 9,777,757 shares issued and outstanding as of December 31, 2017 and 2016, respectively. | — | — | |||||
Additional paid-in capital | 454,196 | 289,317 | |||||
Accumulated other comprehensive loss | (108 | ) | (300 | ) | |||
Accumulated deficit | (202,153 | ) | (187,361 | ) | |||
Total stockholders' equity | 251,936 | 101,656 | |||||
TOTAL LIABILITIES AND STOCKHOLDERS' EQUITY | $ | 301,313 | $ | 143,515 | |||
The accompanying notes are an integral part of these consolidated financial statements.
F-4
MINDBODY, Inc.
Consolidated Statements of Operations
(in thousands, except per share data)
Year Ended December 31, | |||||||||||
2017 | 2016 | 2015 | |||||||||
Revenue | $ | 182,626 | $ | 139,021 | $ | 101,369 | |||||
Cost of revenue | 51,870 | 43,080 | 37,190 | ||||||||
Gross profit | 130,756 | 95,941 | 64,179 | ||||||||
Operating expenses: | |||||||||||
Sales and marketing | 71,825 | 56,460 | 46,345 | ||||||||
Research and development | 35,810 | 30,316 | 23,057 | ||||||||
General and administrative | 37,471 | 30,497 | 29,530 | ||||||||
Change in fair value of contingent consideration | — | — | (11 | ) | |||||||
Total operating expenses | 145,106 | 117,273 | 98,921 | ||||||||
Loss from operations | (14,350 | ) | (21,332 | ) | (34,742 | ) | |||||
Change in fair value of preferred stock warrant | — | — | (25 | ) | |||||||
Interest income (expense), net | 109 | (1,123 | ) | (943 | ) | ||||||
Other expense, net | (384 | ) | (203 | ) | (132 | ) | |||||
Loss before provision for income taxes | (14,625 | ) | (22,658 | ) | (35,842 | ) | |||||
Provision for income taxes | 167 | 321 | 246 | ||||||||
Net loss | (14,792 | ) | (22,979 | ) | (36,088 | ) | |||||
Accretion of redeemable convertible preferred stock | — | — | (9,862 | ) | |||||||
Deemed dividend—preferred stock modification | — | — | 1,748 | ||||||||
Net loss attributable to common stockholders | $ | (14,792 | ) | $ | (22,979 | ) | $ | (44,202 | ) | ||
Net loss per share attributable to common stockholders, basic and diluted | $ | (0.33 | ) | $ | (0.58 | ) | $ | (1.68 | ) | ||
Weighted-average shares used to compute net loss per share attributable to common stockholders, basic and diluted | 44,309 | 39,913 | 26,320 | ||||||||
The accompanying notes are an integral part of these consolidated financial statements.
F-5
MINDBODY, Inc.
Consolidated Statements of Comprehensive Loss
(in thousands)
Year Ended December 31, | |||||||||||
2017 | 2016 | 2015 | |||||||||
Net loss | $ | (14,792 | ) | $ | (22,979 | ) | $ | (36,088 | ) | ||
Other comprehensive loss, net of taxes: | |||||||||||
Change in cumulative translation adjustment | 192 | (29 | ) | (139 | ) | ||||||
Comprehensive loss | $ | (14,600 | ) | $ | (23,008 | ) | $ | (36,227 | ) | ||
The accompanying notes are an integral part of these consolidated financial statements.
F-6
MINDBODY, Inc.
Consolidated Statements of Redeemable Convertible Preferred Stock and Stockholders’ Equity (Deficit)
(in thousands, except share data)
Redeemable Convertible Preferred Stock | Class A and B Common Stock(1) | Additional Paid-In Capital | Accumulated Other Comprehensive Loss | Accumulated Deficit | Total Stockholders' Equity (Deficit) | |||||||||||||||||||||||||
Shares | Amount | Shares | Amount | |||||||||||||||||||||||||||
Balance as of January 1, 2015 | 20,454,489 | 166,448 | 11,189,360 | — | — | (132 | ) | (124,793 | ) | (124,925 | ) | |||||||||||||||||||
Reclassification of restricted stock award liability to common stock | — | — | — | — | 88 | — | — | 88 | ||||||||||||||||||||||
Deemed dividend—preferred stock modification | — | (1,748 | ) | — | — | — | — | 1,748 | 1,748 | |||||||||||||||||||||
Accretion of redeemable convertible preferred stock to redemption value | — | 9,862 | — | — | (4,613 | ) | — | (5,249 | ) | (9,862 | ) | |||||||||||||||||||
Issuance of common stock upon initial public offering, net of offering costs of $4,024 | — | — | 7,150,000 | — | 89,069 | — | — | 89,069 | ||||||||||||||||||||||
Conversion of redeemable convertible preferred stock to common stock in connection with initial public offering | (20,454,489 | ) | (174,562 | ) | 20,673,680 | — | 174,562 | — | — | 174,562 | ||||||||||||||||||||
Reclassification of preferred stock warrant liability to equity in connection with initial public offering | — | — | — | — | 1,213 | — | — | 1,213 | ||||||||||||||||||||||
Stock-based compensation expense | — | — | — | — | 8,375 | — | — | 8,375 | ||||||||||||||||||||||
Issuance of common stock for equity awards, net of tax withholdings | — | — | 34,140 | — | 242 | — | — | 242 | ||||||||||||||||||||||
Issuance of common stock upon net exercise of warrants | — | — | 76,565 | — | — | — | — | — | ||||||||||||||||||||||
Issuance of stock for business acquisition | — | — | 103,617 | — | 1,500 | — | — | 1,500 | ||||||||||||||||||||||
Other comprehensive loss | — | — | — | — | — | (139 | ) | — | (139 | ) | ||||||||||||||||||||
Net loss | — | — | — | — | — | — | (36,088 | ) | (36,088 | ) | ||||||||||||||||||||
Balance as of December 31, 2015 | — | — | 39,227,362 | — | 270,436 | (271 | ) | (164,382 | ) | 105,783 | ||||||||||||||||||||
Stock-based compensation expense | — | — | — | — | 8,763 | — | — | 8,763 | ||||||||||||||||||||||
Issuance of common stock for contingent consideration payment | — | — | 207,234 | — | — | — | — | — | ||||||||||||||||||||||
Issuance of common stock for equity awards, net of tax withholdings | — | — | 857,489 | — | 6,578 | — | — | 6,578 | ||||||||||||||||||||||
Issuance of common stock under employee stock purchase plan | — | — | 277,215 | — | 3,040 | — | — | 3,040 | ||||||||||||||||||||||
Issuance of common stock related to HealCode Acquisition | 28,959 | 500 | — | — | 500 | |||||||||||||||||||||||||
Other comprehensive income | — | — | — | — | — | (29 | ) | — | (29 | ) | ||||||||||||||||||||
Net loss | — | — | — | — | — | — | (22,979 | ) | (22,979 | ) | ||||||||||||||||||||
Balance as of December 31, 2016 | — | — | 40,598,259 | — | 289,317 | (300 | ) | (187,361 | ) | 101,656 | ||||||||||||||||||||
Stock-based compensation expense | — | — | — | — | 13,898 | — | — | 13,898 | ||||||||||||||||||||||
Issuance of common stock for equity awards, net of tax withholdings | — | — | 1,013,661 | — | 8,334 | — | — | 8,334 | ||||||||||||||||||||||
Issuance of common stock under employee stock purchase plan | — | — | 271,451 | — | 3,238 | — | — | 3,238 | ||||||||||||||||||||||
Earn-out deemed consideration related to Lymber Acquisition | — | 5,143 | — | — | 5,143 | |||||||||||||||||||||||||
Issuance of common stock upon follow-on public offering, net of offering costs | 5,060,000 | 1 | 134,266 | — | — | 134,267 | ||||||||||||||||||||||||
Accumulated Other comprehensive income | — | — | — | — | — | 192 | — | 192 | ||||||||||||||||||||||
Net loss | — | — | — | — | — | — | (14,792 | ) | (14,792 | ) | ||||||||||||||||||||
Balance as of December 31, 2017 | — | $ | — | 46,943,371 | $ | 1 | $ | 454,196 | $ | (108 | ) | $ | (202,153 | ) | $ | 251,936 | ||||||||||||||
(1) | The activity through June 24, 2015 reflects the sole class of common stock authorized through the closing of the IPO on June 24, 2015, at which point the Company’s certificate of incorporation was amended and restated to authorize Class A and Class B common stock. All capital stock outstanding prior to the IPO was reclassified into Class B common stock and Class A common stock was issued in the IPO. |
The accompanying notes are an integral part of these consolidated financial statements.
F-7
MINDBODY, Inc.
Consolidated Statements of Cash Flows
(in thousands)
Year Ended December 31, | ||||||||||||
2017 | 2016 | 2015 | ||||||||||
CASH FLOWS FROM OPERATING ACTIVITIES | ||||||||||||
Net loss | $ | (14,792 | ) | $ | (22,979 | ) | (36,088 | ) | ||||
Adjustments to reconcile net loss to net cash provided by (used in) operating activities: | ||||||||||||
Stock-based compensation expense | 14,101 | 8,763 | 8,375 | |||||||||
Depreciation and amortization | 9,150 | 7,755 | 6,516 | |||||||||
Other | 342 | 265 | 554 | |||||||||
Changes in operating assets and liabilities net of effects of acquisitions: | ||||||||||||
Accounts receivable | (1,739 | ) | (2,561 | ) | (3,842 | ) | ||||||
Prepaid expenses and other current assets | (1,871 | ) | (638 | ) | (526 | ) | ||||||
Other assets | (277 | ) | (132 | ) | 148 | |||||||
Accounts payable | 1,965 | 92 | 722 | |||||||||
Accrued expenses and other liabilities | 2,307 | 2,631 | 2,743 | |||||||||
Deferred revenue | 1,351 | 2,775 | 2,556 | |||||||||
Deferred rent | 573 | 133 | 268 | |||||||||
Net cash provided by (used in) operating activities | 11,110 | (3,896 | ) | (18,574 | ) | |||||||
CASH FLOWS FROM INVESTING ACTIVITIES | ||||||||||||
Purchase of property and equipment | (6,850 | ) | (8,591 | ) | (9,784 | ) | ||||||
Capitalized software development costs | (1,963 | ) | — | (135 | ) | |||||||
Acquisition of business | (1,700 | ) | (4,138 | ) | (3,000 | ) | ||||||
Change in restricted cash and deposits | — | — | 788 | |||||||||
Net cash used in investing activities | (10,513 | ) | (12,729 | ) | (12,131 | ) | ||||||
CASH FLOWS FROM FINANCING ACTIVITIES | ||||||||||||
Net proceeds from follow-on public offering | 134,266 | — | — | |||||||||
Proceeds from exercise of equity awards | 10,040 | 6,626 | 194 | |||||||||
Proceeds from employee stock purchase plan | 3,238 | 3,040 | — | |||||||||
Payment related to shares withheld for taxes | (1,704 | ) | — | — | ||||||||
Repayment on financing and capital lease obligations | (511 | ) | (466 | ) | (316 | ) | ||||||
Proceeds from initial public offering | — | — | 93,093 | |||||||||
Payments of deferred offering cost | — | — | (3,380 | ) | ||||||||
Other | (33 | ) | (33 | ) | (73 | ) | ||||||
Net cash provided by financing activities | 145,296 | 9,167 | 89,518 | |||||||||
Effect of exchange rate changes on cash and cash equivalents | 262 | (83 | ) | (83 | ) | |||||||
NET INCREASE (DECREASE) IN CASH AND CASH EQUIVALENTS | 146,155 | (7,541 | ) | 58,730 | ||||||||
CASH AND CASH EQUIVALENTS, BEGINNING OF PERIOD | 85,864 | 93,405 | 34,675 | |||||||||
CASH AND CASH EQUIVALENTS, END OF PERIOD | $ | 232,019 | $ | 85,864 | $ | 93,405 | ||||||
SUPPLEMENTAL DISCLOSURE OF CASH FLOW INFORMATION: | ||||||||||||
Cash paid for interest | $ | 1,244 | $ | 1,302 | $ | 934 | ||||||
Cash paid for income taxes | 355 | 226 | 77 | |||||||||
SUPPLEMENTAL DISCLOSURE OF NONCASH INVESTING AND FINANCING ACTIVITIES: | ||||||||||||
Unpaid equipment purchases | $ | 1,396 | $ | 778 | $ | 448 | ||||||
Acquisition consideration held back to satisfy potential indemnification claims | 500 | 750 | — | |||||||||
Stock issued in business acquisition | 5,143 | 500 | 1,500 | |||||||||
Accretion of redeemable convertible preferred stock to redemption value | — | — | 9,862 | |||||||||
Deemed dividend—preferred stock modification | — | — | 1,748 | |||||||||
Conversion of redeemable convertible preferred stock to common stock | — | — | 174,562 | |||||||||
Conversion of preferred stock warrants to common stock warrants | — | — | 1,213 | |||||||||
Reclassification of restricted stock award liability to common stock | — | — | 88 | |||||||||
Property and equipment acquired with financing obligations and leases | — | — | 1,089 | |||||||||
The accompanying notes are an integral part of these consolidated financial statements.
F-8
MINDBODY, Inc.
NOTES TO CONSOLIDATED FINANCIAL STATEMENTS
1. SUMMARY OF BUSINESS AND SIGNIFICANT ACCOUNTING POLICIES
Description of Business
MINDBODY, Inc. (“MINDBODY” or the “Company”) was incorporated in California in 2004 and reincorporated in Delaware in March 2015. MINDBODY is headquartered in San Luis Obispo, California and has operations in the United States, the United Kingdom, and Australia.
MINDBODY and its wholly owned subsidiaries (collectively, the “Company”, “we”, “us” or “our”) is a provider of cloud-based business management software for the wellness services industry and a rapidly growing consumer brand. Its integrated software and payments platform helps business owners in the wellness services industry run, market and build their businesses. MINDBODY enables the consumers to evaluate, engage, and transact with local businesses in its marketplace.
In May 2017, MINDBODY completed a follow-on public offering in which it issued and sold 5,060,000 shares of Class A common stock at a public offering price of $27.95 per share. MINDBODY received net proceeds of $134,709,000 after deducting underwriters’ discounts and commissions of $6,718,000, but before deducting offering expenses of approximately $443,000.
Initial Public Offering
In June 2015, the Company completed its initial public offering (the “IPO”) in which it issued and sold 7,150,000 shares of its Class A common stock, $0.000004 par value, at a public offering price of $14.00 per share. The Company received net proceeds of $93,093,000 after deducting underwriting discounts and commissions of $7,007,000, but before deducting offering expenses of $4,024,000. Immediately prior to the closing of the IPO, all shares of the Company’s then-outstanding redeemable convertible preferred stock were automatically converted and reclassified into 20,673,680 shares of its Class B common stock, $0.000004 par value, and all shares of the Company’s then-outstanding common stock were automatically reclassified into 11,305,355 shares of Class B common stock.
Basis of Presentation and Consolidation
The consolidated financial statements are presented in accordance with United States generally accepted accounting principles (“GAAP”) which include the accounts of MINDBODY and its wholly owned foreign subsidiaries. All intercompany balances and transactions have been eliminated in consolidation.
Use of Estimates
The preparation of consolidated financial statements in conformity with GAAP requires management to make estimates and assumptions that affect the reported amounts of assets and liabilities and disclosure of contingent assets and liabilities at the date of the consolidated financial statements and the reported amounts of revenue and expenses during the reporting period. Significant items subject to such estimates and assumptions include the capitalization and estimated useful life of the Company’s capitalized internal-use software, useful lives of property and equipment, the determination of fair value of stock awards issued and forfeiture rates, a valuation allowance for deferred tax assets, contingencies, and the purchase price allocation of acquired businesses. The Company bases its estimates on historical experience and on various other assumptions that it believes to be reasonable under the circumstances. Changes in facts or circumstances may cause the Company to change its assumptions and estimates in future periods, and it is possible that actual results could differ from current or future estimates.
Cash and Cash Equivalents
Cash and cash equivalents consist of cash and money market accounts. The Company considers all highly liquid short-term investments with original maturities of three months or less at the time of purchase to be cash equivalents.
F-9
Accounts Receivable and Allowance for Doubtful Accounts
The Company’s accounts receivable are derived from client obligations due under normal trade terms and are reported at the principal amount outstanding, net of the allowance for doubtful accounts. The Company maintains an allowance for doubtful accounts that is based upon historical experience and a review in each period of the number of days that billings are past due and an evaluation of the potential risk of loss associated with delinquent accounts. For all periods presented, the allowance for doubtful accounts activity was not significant.
Concentration of Credit Risk
As of December 31, 2017 and 2016, one trade receivable represented 17% and 15% of our total accounts receivable balance, respectively. No single customer, API partner, or technology partner represented over 10% of revenue for any of the periods presented in the consolidated statements of operations.
Fair Value of Financial Instruments
Fair value is defined as the exchange price that would be received for an asset or paid to transfer a liability (an exit price) in the principal or most advantageous market for the asset or liability in an orderly transaction between market participants on the measurement date. Valuation techniques used to measure fair value must maximize the use of observable inputs and minimize the use of unobservable inputs.
The Company carries its cash equivalents at fair value. The carrying amounts of the Company’s accounts receivable, accounts payable, and other accrued expenses approximate fair value due to their short maturities. The Company classifies its cash equivalents, which are made up of money market accounts, within Level 1 because the Company values these investments using quoted market prices.
Property and Equipment, Net
Property and equipment, including leasehold improvements, are recorded at cost less accumulated depreciation and amortization. Repairs and maintenance are charged to expense when incurred. Depreciation expense is calculated using the straight-line method over the useful lives of the related assets or leasehold improvements as follows:
Property and Equipment | Estimated Useful Life |
Property (Building) | 15 years |
Office equipment | 5 years |
Computer equipment | 3 years |
Servers | 3 years |
Software licenses | 3-4 years |
Leasehold improvements | Shorter of estimated useful life or remaining lease term |
Useful lives of significant assets are periodically reviewed and adjusted prospectively to reflect the Company’s current estimates of the respective assets’ expected utility.
In the event the Company has been deemed the owner for accounting purposes of construction projects in build-to-suit lease arrangements, the estimated construction costs incurred to date are recorded as assets in Property and Equipment, net. Upon occupancy of facilities under build-to-suit leases, the Company did not meet the sale-leaseback criteria for de-recognition of the building assets and liabilities. Therefore, the Company continues to be the deemed owner for accounting purposes and the cost of the building is depreciated over its estimated useful life or lease term, whichever is shorter.
F-10
Capitalized Software Development Costs
Certain development costs incurred in connection with internal use software that are probable to result in additional functionality are capitalized. Research and development costs incurred during the preliminary project stage or costs incurred for training, maintenance, and general and administrative or overhead costs are expensed as incurred. Capitalization begins when the preliminary project stage is complete, management with the relevant authority authorizes and commits to the funding of the software project, it is probable the project will be completed and the software will be used to perform the functions intended, and certain functional and quality standards have been met. Capitalization of these costs ceases once the project is substantially complete and the software is ready for its intended purpose. Development costs related to upgrades or enhancements to existing applications are expensed as maintenance costs because such projects do not significantly enhance functionality. Internally developed software costs that are capitalized are classified as intangible assets and amortized over an estimated useful life of the software of two to three years, commencing when the software is ready for its intended use.
Business Combinations
As discussed further in Note 4 of these consolidated financial statements, the Company acquired Lymber Wellness Inc. (“Lymber”) during the year ended December 31, 2017, HealCode LLC (“HealCode”) during the year ended December 31, 2016, and the Fitness Mobile Apps business of Petrol Designs LLC (“Fitness Mobile Apps”) during the year ended December 31, 2015. The Company performs valuations of assets acquired and liabilities assumed for acquisitions and allocates the purchase price to its respective net tangible and intangible assets, and liabilities based on their estimated fair values. Any residual purchase price is recorded as goodwill. Determining the fair value of assets acquired and liabilities assumed requires management to use significant judgment and estimates including the selection of valuation methodologies, estimates of future revenue and cash flows, discount rates and selection of comparable companies. During the measurement period, the Company may record certain adjustments to the assets acquired and liabilities assumed with the corresponding offset to goodwill. After the measurement period, which could be up to one year after the transaction date, all adjustments are recorded to the Company’s consolidated statements of operations. Contingent payments that are dependent upon post-combination services, if any, are considered separate transactions outside of the business combination and therefore included in the post-combination operating results. There has been no such adjustment as of December 31, 2017.
Goodwill and Acquired Intangible Assets
The Company records goodwill when the consideration paid in a purchase acquisition exceeds the fair value of the net tangible assets and the identified intangible assets acquired. Goodwill is not amortized, but rather is tested for impairment. The Company performs testing for impairment of goodwill annually or as events occur or circumstances change that would more likely than not reduce the fair value of a reporting unit below its carrying amount. The Company tests goodwill for impairment at the reporting unit level using a two-step approach. In step one, the Company determines if the fair value of the reporting unit exceeds the unit’s carrying value. If step one indicates that the fair value of the reporting unit is less than its carrying value, the Company performs step two, determining the fair value of goodwill and, if the carrying value of goodwill exceeds the implied fair value, recording an impairment charge. The Company has determined that there is a single reporting unit for the purpose of goodwill impairment tests. Since inception through December 31, 2017, the Company did not have any goodwill impairment.
Acquired intangible assets consist of identifiable intangible assets, primarily developed technology and customer relationships. These intangible assets have been determined to have definite lives and are carried at cost, less accumulated amortization. The Company amortizes the intangible assets with finite lives using the straight-line method over the estimated economic lives of the assets, which is normally two to five years. The amortization expense for acquired technology is recorded in cost of revenues. The amortization expense for the acquired network list is recorded in sales and marketing expense.
Impairment of Long-Lived Assets
Long-lived assets, primarily consisting of property and equipment and intangible assets other than goodwill, are reviewed for impairment whenever events or changes in circumstances indicate that the carrying value of an asset group may not be recoverable. Recoverability of asset groups to be held and used is measured by a comparison of the carrying value of an asset group to the estimated undiscounted future cash flows expected to be generated from the use of such assets. If the undiscounted future cash flows is less than the carrying value of an asset group, an impairment loss is recognized based on the amount by which the carrying value exceeds the estimated fair value of the asset group. For any of the periods presented, the Company did not have any long-lived assets impairment.
F-11
Operating Leases and Financing Obligations
The Company leases office facilities under various non-cancelable operating lease agreements. Certain lease agreements contain free or escalating rent payment provisions. The Company recognizes rent expense under such leases on a straight-line basis over the term of the lease with the difference between the expense and the payments recorded as deferred rent on the consolidated balance sheets.
For certain build-to-suit lease arrangements where the Company has concluded that it is the “deemed owner” of the building (for accounting purposes only) during the construction period, the Company is required to record an asset with a corresponding construction financing obligation for the costs incurred by the landlord. The financing obligation is recorded as a component of other non-current liabilities in the consolidated balance sheets. The Company will increase the asset and financing obligation as additional building costs are incurred by the landlord during the construction period. Once construction is complete, the Company will evaluate whether the asset qualifies for sale-leaseback accounting treatment. If the lease meets the sale-leaseback criteria, the Company will remove the asset and the related liability from its consolidated balance sheet and treat the lease as either an operating or capital lease based on an assessment of the accounting guidance. If the arrangement does not qualify for sale-leaseback treatment, the Company will reduce the obligation over the lease term as payments are made and will depreciate the asset over its estimated useful life or lease term, whichever is shorter. Future lease payments associated with the build-to-suit lease where the Company is the deemed owner are allocated between the land and building components. Payments attributable to the land are recognized as rent expense on a straight-line basis upon commencement of the contract. The Company does not report rent expense for the portion of the rent payment allocated to the buildings, which are owned for accounting purposes. Rather, this portion of the rent payment under the lease is recognized as a reduction of the financing obligation and as interest expense.
Revenue Recognition
The Company has three primary sources of revenue consisting of (i) subscription and support services, (ii) payments, and (iii) product and other sales.
The Company commences revenue recognition when all of the following conditions have been satisfied:
• | persuasive evidence of an agreement exists; |
• | the service has been or is being provided to the customer or delivery of the product has occurred; |
• | fees are fixed or determinable; and |
• | the collection of the fees is reasonably assured. |
Software revenue recognition arrangements that do not give the customer the option to take possession of the software are service arrangements and are outside the scope of the specific industry rules for software recognition. This applies to the Company’s cloud-based business management software, and as such, the Company accounts for the subscription and support services as service arrangements. Amounts invoiced in excess of revenue recognized are deferred. The majority of the fees are prepaid by customers on a monthly basis, and to a lesser extent, for certain customers on an annual or quarterly basis. The subscription revenue is recognized ratably over the term of the agreement.
The customer support offering is delivered together with the subscription services, and the term of the customer support is the same as the related subscription services arrangement. Accordingly, the Company recognizes customer support revenue in the same manner as the associated subscription service. The Company’s customers enter into separate arrangements with the technology partners. Revenue derived from revenue share arrangements with the technology partners is recognized in the period services are rendered on a net basis. The Company also derives revenue from API platform partners for customer site access, data query, and consumer bookings. The revenue from API platform partners is recognized in the period services are rendered.
The Company collects a revenue share from third-party payment processors on transactions between its customers who utilize the MINDBODY payments platform and their consumers. These payment transactions are generally for purchasing classes, goods, or services through a customer’s website, at their business location or through the MINDBODY app or third-party site included in the MINDBODY Network. Transaction fees are recorded as payments revenue on a net basis.
Product revenues are recognized when all revenue recognition criteria have been met, which is upon delivery.
In certain circumstances, the Company’s arrangements include multiple elements which may consist of some or all of subscription services, support services, and hardware products, which are included in product and other. When multiple-element arrangements exist, the Company evaluates whether any of these deliverables should be accounted for as separate units of accounting.
F-12
The Company’s support services do not have standalone value because it and other vendors do not sell support services separately. Such support services are therefore combined with the Company’s subscription services as a single unit of accounting. The Company’s hardware products, such as point of sale systems, have standalone value because it, and other vendors, sell the same products separately. Additionally, while there is a general right of return relative to the Company’s hardware products, which are generally delivered upfront, performance of the subscription and support services is considered probable and substantially in the Company’s control. Accordingly, the Company considers the separate units of accounting in its multiple-element arrangements to be the hardware products and subscription and support services. For arrangements with multiple elements which can be separated into different units of accounting, the Company allocates the arrangement fee to the separate units of accounting based on vendor-specific objective evidence, as demonstrated by separate sales with sufficient concentration in selling prices.
Cost of Revenue
Cost of revenue primarily consists of costs associated with personnel and related infrastructure for operation of the Company's cloud-based business management platform, data center operations, global customer support and onboarding services, payment processing for customers that pay via credit card, and allocated overhead. Personnel costs consist of salaries, benefits, bonuses and stock-based compensation. Overhead consists of certain facilities costs, depreciation expense, amortization expense associated with acquired technology and internally developed software, and information technology costs.
Advertising Costs
Advertising costs are expensed when incurred and are included in sales and marketing expenses in the accompanying consolidated statements of operations. The Company’s advertising expenses, which include print and online advertising, were $12,221,000, $9,083,000, and $5,820,000 during the years ended December 31, 2017, 2016, and 2015, respectively. Expenses for online advertising were omitted in amounts disclosed in previous filings. Previously disclosed amounts, in which online advertising expenses were omitted, were $474,000 and $598,000 for the years ended December 31, 2016 and 2015, respectively. The amount of online advertising expenses omitted, were $8,609,000 and $5,222,000 for the years ended December 31, 2016 and 2015, respectively.
Research and Development
Research and development expenses consist primarily of wages and benefits for development personnel, contingent retention-based bonus expense related to the Company's acquisitions, rent expense, and depreciation of assets used in development. The Company's research and development efforts are focused on both improving the Company's platform and software used in operations, as well as developing new offerings. These costs are expensed unless they meet the requirements for capitalization. The Company capitalized costs of $1,963,000, zero, and $135,000 for the years ended December 31, 2017, 2016, and 2015, respectively, related to internally developed computer software to be sold as a service.
Stock-Based Compensation
Stock-based compensation expense is measured and recognized in the financial statements based on the fair value of the awards granted. The fair value of stock option awards and stock purchases under the Company's employee stock purchase plan (“ESPP”) are estimated on the grant date using the Black-Scholes option pricing model. This model requires the Company to estimate the grant date fair value of the underlying common stock, the expected life of options, the expected volatility of the price of the underlying common stock, risk-free interest rates, and expected dividend yield of the common stock. The fair value of restricted stock awards and restricted stock units is based on the closing market price of the Company's Class A common stock on the date of grant. The stock-based compensation expense for stock options, net of forfeitures, is recognized using a straight-line basis over the requisite service periods of the awards, which is generally four years.
The Company estimates a forfeiture rate to calculate the stock-based compensation for the awards based on an analysis of actual historical experience and expected employee attrition rates. Changes in estimated forfeitures will be recognized through a cumulative catch-up adjustment in the period of change and will also affect the amount of compensation expense to be recognized in future periods.
Segments
The Company’s chief operating decision maker reviews financial information on a consolidated basis to make decisions about how to allocate resources and to measure the Company’s performance. Accordingly, the Company has determined that it operates in one segment.
F-13
Income Taxes
The Company accounts for income taxes under the asset and liability method of accounting for income taxes. Under this method, deferred taxes are recognized for the future tax consequences attributable to differences between the consolidated financial statement carrying amounts of existing assets and liabilities and their respective tax bases. Deferred tax assets and liabilities are measured using enacted tax rates expected to be applied to taxable income in the years in which those temporary differences are expected to be recovered or settled. A valuation allowance is recorded to reduce the carrying amount of deferred tax assets, unless it is more likely than not such assets will be realized.
The Company also applies the provisions for uncertainty of income taxes. This guidance prescribes a recognition threshold and measurement attribute for consolidated financial statement recognition and measurement of a tax position taken or expected to be taken in a tax return. For those benefits to be recognized, a tax position must be more likely than not to be sustained upon examination by taxing authorities. This guidance also applies to various related matters, such as derecognition, interest, penalties, and required disclosures. The Company recognizes interest and penalties, if any, related to unrecognized tax benefits in its income tax provision.
Net Loss Per Share Attributable to Common Stockholders
The Company applies the two-class method in calculating the net loss per share amounts which requires net loss to be allocated between the common and preferred stockholders based on their respective right to receive dividends. Accordingly, the Company’s basic net loss per share attributable to common stockholders is calculated by dividing the net loss attributable to common stockholders by the weighted-average number of shares of common stock outstanding during the period. Net loss attributable to common stockholders is equal to the Company’s net loss as adjusted for accretion of cumulative preferred stock dividends of the related series of redeemable convertible preferred stock to their redemption value. Diluted loss per share attributable to common stockholders adjusts the basic weighted-average number of shares of common stock outstanding for the potential dilution that could occur if stock options, warrants, and redeemable convertible preferred stock were exercised or converted into common stock. For purposes of this calculation, redeemable convertible preferred stock, options to purchase common stock, and preferred stock warrants are considered common stock equivalents but have been excluded from the calculation of diluted net loss per share attributable to common stockholders as their effect is anti-dilutive.
Foreign Currency Translation
The functional currency of the Company’s foreign subsidiaries are their local currencies. The assets and liabilities of the foreign subsidiaries are translated using exchange rates in effect at the balance sheet date. Revenues and expenses are translated using the average exchange rates prevailing during the period. Exchange rate differences resulting from translation adjustments are accounted for as a component of accumulated other comprehensive loss.
Comprehensive Loss
Comprehensive loss is composed of two components: net loss and other comprehensive loss. Other comprehensive loss refers to expenses and losses that under GAAP are recorded as an element of stockholders’ deficit, but are excluded from the Company’s net loss. For all periods presented, the Company’s other comprehensive loss is made up of foreign currency translation adjustments related to the Company’s foreign subsidiaries.
Recently Adopted Accounting Pronouncements
On March 30, 2016, the Financial Accounting Standards Board (“FASB”) issued authoritative guidance related to employee share-based payment transactions. The new guidance requires entities to recognize all excess tax benefits and tax deficiencies as income tax expense or benefit in the income statement and provides guidance on the related cash flow presentation. The new guidance also allows entities to make an accounting policy election to either continue to estimate the total number of awards for which the requisite service period will not be rendered (as currently required) or to account for forfeitures when they occur. The new guidance also stipulates that the net settlement of an award for statutory tax withholding purposes would not result, by itself, in liability classification of the award provided that the amount withheld for taxes does not exceed the maximum statutory tax rate in the employees’ relevant tax jurisdictions. Effective January 1, 2017, the Company adopted this standard. In accordance with this standard, the Company elected to continue the Company's historical approach of estimating forfeitures during the award vesting period. The adoption of this standard did not have a material effect on the Company's consolidated financial statements for the year ended December 31, 2017.
F-14
In November 2015, the FASB issued authoritative guidance related to balance sheet classification of deferred taxes. The new guidance requires entities to present deferred tax assets (“DTAs”) and deferred tax liabilities (“DTLs”) as noncurrent in a classified balance sheet. It thus simplifies the current guidance, which requires entities to separately present DTAs and DTLs as current or noncurrent in a classified balance sheet. Netting of DTAs and DTLs by tax jurisdiction is still required under the new guidance. The new authoritative guidance is effective for annual periods, including interim periods within those annual periods, beginning after December 15, 2016. Early adoption is permitted. The guidance did not have a material impact on the Company’s consolidated financial statements.
Recently Issued Accounting Pronouncements
In May 2017, the FASB issued authoritative guidance related to employee Share-Based Payments Transactions. The new guidance clarifies which changes to the terms or conditions of a share-based payment award require an entity to apply modification accounting. Specifically, an entity would not apply modification accounting if the fair value, vesting conditions, and classification of the awards are the same immediately before and after the modification. The amendments in this guidance are effective for fiscal years beginning after December 15, 2017, including interim periods within those years. Early adoption is permitted, including adoption in any interim period, for reporting periods for which financial statements have not yet been issued. The Company intends to adopt the guidance on the effective date and does not expect the adoption of the new guidance to have a material impact on the Company’s consolidated financial statements.
In January 2017, the FASB issued authoritative guidance related to Clarifying the Definition of a Business. The new guidance clarifies whether transactions should be accounted for as acquisitions of assets or businesses. To be considered a business, the assets in the transaction need to include an input and a substantive process that together significantly contribute to the ability to create outputs. Prior to the adoption of the new guidance, an acquisition or disposition would be considered a business if there were inputs, as well as processes that when applied to those inputs had the ability to create outputs. The standard is effective for fiscal years beginning after December 15, 2017, and interim periods within those fiscal years. Early adoption is permitted. The Company intends to adopt the guidance on the effective date and the adoption of the new guidance may have a material impact on the Company’s consolidated financial statements if it enters into future business combinations.
In January 2017, the FASB issued authoritative guidance related to Simplifying the Test for Goodwill Impairment. The new guidance simplifies the accounting for goodwill impairment by removing Step 2 of the goodwill impairment test. The standard is effective for annual or interim goodwill impairment tests in fiscal years beginning after December 15, 2019, and should be applied on a prospective basis. Early adoption is permitted for interim or annual goodwill impairment tests performed on testing dates after January 1, 2017. The Company intends to adopt the guidance on the effective date and does not expect the adoption of the new guidance to have a material impact on the Company’s consolidated financial statements.
In February 2016, the FASB issued authoritative guidance intended to improve financial reporting about leasing transactions. The new guidance requires entities to recognize assets and liabilities for leases with lease terms of more than 12 months. The new guidance also requires qualitative and quantitative disclosures regarding the amount, timing, and uncertainty of cash flows arising from leases. The new guidance is effective for the Company beginning January 1, 2019. The Company is evaluating the impact of the new standard on its consolidated financial statements and anticipates recording certain operating leases on the balance sheet upon adoption on the effective date.
In August 2016, the FASB issued authoritative guidance related to the Classification of Certain Cash Receipts and Cash Payments. The new guidance standardizes cash flow statement classification of certain transactions, including cash payments for debt prepayment or extinguishment, proceeds from insurance claim settlements, and distributions received from equity method investments. The new guidance is effective for fiscal years beginning after December 15, 2017, including interim periods within those fiscal years. Early adoption is permitted. The amendments in this update should be applied using a retrospective transition method to each period presented. If impracticable to apply the amendments retrospectively for some of the issues, the amendments for those issues would be applied prospectively as of the earliest date practicable. The Company will adopt the new standard as of January 1, 2018. The Company intends to adopt the guidance on the effective date and does not expect the adoption of the new guidance to have a material impact on the Company’s consolidated financial statements.
In May 2014, the FASB issued new guidance on revenue from contracts with customers. The guidance requires the recognition of revenue when promised goods or services are transferred to customers in an amount that reflects the considerations to which the entity expects to be entitled to in exchange for those goods or services. It also states that an entity should recognize as an asset the incremental costs of obtaining a contract that the entity expects to recover and amortize that cost over a period consistent with the period over which the transfer to the customer of the underlying good or services occurs. The guidance requires more detailed disclosures to enable users of financial statements to understand the nature, amount, timing, and uncertainty of revenue and cash flows arising from contracts with customers.
F-15
The Company expects to adopt this guidance effective January 1, 2018 using the modified retrospective method applying this guidance to all contracts at the date of initial application, which is expected to result in an adjustment to accumulated deficit for the cumulative effect of applying the guidance.
The Company has substantially completed its assessment of the impacts of the new guidance on incremental costs of obtaining a contract with a customer and the Company expects to record an adjustment to decrease accumulated deficit as of January 1, 2018 for approximately $800,000 to $900,000 related to the accounting for the incremental costs of obtaining a contract. Historically, the Company expensed these costs as incurred, but under the new guidance, incremental costs of obtaining a contract will be recorded as an asset and recognized as an operating expense over the period that the Company expect to recover the costs. The Company continues to assess the impact the adoption of this guidance will have on its disclosures.
The Company has also substantially completed its assessment of the impacts of the new guidance on revenue from contracts with customers. Revenue recognition related to software subscription, API services, technology partners, payments, and the Company's product & other will remain substantially unchanged. The most significant impact of the new standard to the Company is the deferral of revenue related to one of its payment contracts. Under the new standard, the Company will recognize revenue at the commencement of the contract based on estimated transaction price rather than when fees become fixed and determinable. The Company expects to record an adjustment to decrease accumulated deficit as of January 1, 2018 for approximately $2.8 million to $3.1 million related to the timing of revenue recognition.
Also, in preparation for adoption of the standard, the Company has implemented internal controls and key system functionality to enable the preparation of financial information and have reached conclusions on key accounting assessments related to the standard. The Company continues to assess the impact the adoption of this guidance will have on its disclosures.
2. FAIR VALUE MEASUREMENTS
The Company measures and reports its cash equivalents and contingent consideration on a recurring basis. The Company’s cash equivalents are invested in money market funds. The accounting guidance for fair value measurements provides a framework for measuring fair value on either a recurring or nonrecurring basis, whereby the inputs used in the Company's valuation techniques are assigned a hierarchical level. The following are the three levels of inputs to measure fair value:
Level 1: Observable inputs that reflect quoted prices (unadjusted) for identical assets or liabilities in active markets.
Level 2: Inputs that reflect quoted prices for identical assets or liabilities in less active markets; quoted prices for similar assets or liabilities in active markets; benchmark yields, reported trades, broker/dealer quotes, inputs other than quoted prices that are observable for the assets or liabilities; or inputs that are derived principally from or corroborated by observable market data by correlation or other means.
Level 3: Unobservable inputs that reflect the Company's own assumptions incorporated in valuation techniques used to measure fair value. These assumptions are required to be consistent with market participant assumptions that are reasonably available.
The Company considers an active market to be one in which transactions for the asset or liability occur with sufficient frequency and volume to provide pricing information on an ongoing basis, and consider an inactive market to be one in which there are infrequent or few transactions for the asset or liability, the prices are not current, or price quotations vary substantially either over time or among market makers. Where appropriate, the Company's own or the counterparty’s non-performance risk is considered in measuring the fair values of assets.
The following table presents the fair value of the Company's financial assets and liabilities using the above input categories (in thousands):
December 31, 2017 | |||||||||||||||
Level 1 | Level 2 | Level 3 | Total | ||||||||||||
Financial Assets: | |||||||||||||||
Money market funds(1) | $ | 224,165 | $ | — | $ | — | $ | 224,165 | |||||||
Equity: | |||||||||||||||
Acquisition-related contingent consideration(2) | $ | — | $ | — | $ | 5,143 | $ | 5,143 | |||||||
F-16
December 31, 2016 | |||||||||||||||
Level 1 | Level 2 | Level 3 | Total | ||||||||||||
Financial Assets: | |||||||||||||||
Money market funds(1) | $ | 81,878 | $ | — | $ | — | $ | 81,878 | |||||||
(1) | The Company held certain assets that are required to be measured at fair value on a recurring basis, included in cash equivalents, which are held in money market funds. All such assets as of December 31, 2017 and 2016 were recorded based on Level 1 inputs. |
(2) | The contingent consideration related to the acquisition of Lymber (Note 4) is recorded as equity and is not subject to remeasurement. Fair value was based on significant inputs not observable in the market, which represents a Level 3 measurement within the fair value hierarchy. The Company determined the fair value of the contingent consideration by discounting payments that are calculated based on Lymber’s projected future gross profit scenarios using the Monte Carlo simulation. The significant inputs used in the fair value measurement of contingent consideration are the timing and amount of gross profit in the respective periods (Note 4) and the discount rate. |
There were no transfers of financial instruments between the three levels of the fair value hierarchy during the years ended December 31, 2017 or 2016. As of and for the years ended December 31, 2017 and 2016, the Company did not have any assets or liabilities that were required to be measured at fair value on a nonrecurring basis.
3. BALANCE SHEET COMPONENTS
Property and Equipment, net
Property and equipment consisted of the following (in thousands)1:
December 31, | December 31, | ||||||
2017 | 2016 | ||||||
Computer equipment | $ | 20,671 | $ | 17,262 | |||
Leasehold improvements | 11,386 | 11,123 | |||||
Office equipment | 2,702 | 2,668 | |||||
Software licenses | 5,378 | 3,258 | |||||
Building, leased | 16,438 | 16,438 | |||||
Property and equipment – gross | 56,575 | 50,749 | |||||
Less: accumulated depreciation | (23,704 | ) | (17,665 | ) | |||
Property and equipment – net | $ | 32,871 | $ | 33,084 | |||
(1) Internally developed software is now presented with intangible assets. Refer Note 5.
Depreciation of property and equipment was $7,718,000, $7,008,000, and $5,862,000 for the years ended December 31, 2017, 2016 and 2015, respectively.
Accrued Expenses and Other Liabilities
Accrued expenses and other liabilities consisted of the following (in thousands):
December 31, | December 31, | ||||||
2017 | 2016 | ||||||
Accrued payroll | $ | 7,591 | $ | 6,072 | |||
Accrued vacation | 2,400 | 2,069 | |||||
Employee stock purchase plan contributions | 1,548 | 1,171 | |||||
Other liabilities | 1,560 | 1,158 | |||||
Total accrued expenses and other liabilities | $ | 13,099 | $ | 10,470 | |||
F-17
4. BUSINESS COMBINATION
Lymber
On March 27, 2017, the Company completed the acquisition of substantially all of the assets of Lymber, a privately-held application programming interface (“API”) partner that specializes in yield management solutions for class and appointment-based businesses. Lymber’s technology enables business owners to set dynamic pricing parameters for class and appointment sessions. The technology identifies open class and appointment inventory, and automatically adjusts session prices in real-time to match supply and demand.
The total purchase consideration for these assets was $7,342,000, which included cash consideration of $2,200,000, of which $500,000 was held to satisfy potential indemnification claims as of December 31, 2017, and is included in other current liabilities; and contingent consideration with a fair value of approximately $5,142,000, of which $1,304,000 and $3,838,000 are expected to be earned in 2018 and 2019 respectively, payable in shares of the Company’s Class A common stock. This consideration is contingent upon Lymber’s product achieving certain levels of gross profit, measured annually, in 2018 and 2019, respectively. The fair value of the equity classified contingent consideration was measured using a Monte Carlo simulation with various unobservable market data inputs, which are Level 3 measurements.
The acquisition of Lymber was accounted for in accordance with the acquisition method of accounting for business combinations with MINDBODY as the accounting acquirer. Acquisition-related costs incurred and expensed by the Company were immaterial and were included within general and administrative expenses on the consolidated statements of operations. Under the acquisition method of accounting, the total purchase consideration is allocated to the tangible and identifiable intangible assets acquired and liabilities assumed based on their estimated fair values. Goodwill of $2,544,000 was allocated to the Company’s one operating segment and represents 35% of the total purchase consideration. Goodwill is primarily attributable to expanded market opportunities from selling and integrating Lymber’s yield management solution with the Company’s other offerings and the associated assembled workforce acquired. Goodwill is amortized over 15 years for tax purposes.
The acquisition provided the Company with acquired intangible assets representing internally developed software/technology. The fair value of the acquired intangible asset was determined based on the income approach and discounted cash flow/excess earnings method and is subject to amortization on a straight-line basis over its remaining useful life of five years.
The allocation of the purchase price consideration is as follows (in thousands):
Amount | ||||
Intangible asset – developed software/technology | $ | 4,798 | ||
Goodwill | 2,544 | |||
Fair value of total purchase consideration | $ | 7,342 | ||
The results of Lymber are included in the Company’s consolidated statements of operations since the acquisition date, including revenues and net loss, and were not material. Pro forma results of operations have not been presented because the acquisition was not material to the Company’s results of operations.
Contemporaneous to signing the purchase agreement, the stockholders of Lymber amended the existing company charter to effectively increase the distribution of ownership interest to existing stockholders who continued as employees with MINDBODY. The change in the ownership interest is viewed to have benefited MINDBODY, and as such, a portion of the contingent consideration discussed above is attributed to post-acquisition expense. The approximate fair value of this consideration is $2,547,000, of which $646,000 and $1,901,000 relate to the 2018 and 2019 earnouts, respectively. This post-acquisition expense is recorded as non-cash operating expense over the requisite service periods.
HealCode
On September 1, 2016, the Company completed the acquisition of substantially all of the assets of HealCode, a privately held technology partner that creates web-based and mobile application widgets for the Company’s customers.
The total purchase consideration of $5,388,000 consisted of the payment of $4,888,000 in cash, of which $750,000, was held back to satisfy potential indemnification claims as of December 31, 2017, and is included in other current liabilities, and the issuance of 28,959 shares of the Company’s Class A common stock at a total acquisition date fair value of $500,000.
The acquisition of HealCode was accounted for in accordance with the acquisition method of accounting for business combinations with MINDBODY as the accounting acquirer. The Company incurred and expensed de minimis acquisition-related
F-18
costs, which are included within general and administrative expenses on the consolidated statements of operations. Under the acquisition method of accounting, the total purchase consideration is allocated to the tangible and identifiable intangible assets acquired and liabilities assumed based on their estimated fair values. Goodwill of $3,643,000 was allocated to the Company’s one operating segment and represents 68% of the total purchase consideration. Goodwill is primarily attributable to expanded market opportunities from selling and integrating HealCode’s “website widget” solution with the Company’s other offerings and the associated assembled workforce acquired. Goodwill is amortized over 15 years for tax purposes.
The acquisition provided the Company with acquired intangible assets representing internally developed software/technology. HealCode’s “website widget” solution enables the Company's customers to embed the MINDBODY class and appointment schedules within their web and social sites. The fair value of the acquired intangible asset was determined based on the income approach and discounted cash flow/excess earnings method and is subject to amortization on a straight-line basis over its remaining useful life of five years.
The allocation of the purchase price consideration is as follows (in thousands):
Amount | ||||
Liabilities assumed | $ | (105 | ) | |
Tangible assets acquired | 32 | |||
Intangible asset – developed software/technology | 1,818 | |||
Goodwill | 3,643 | |||
Fair value of total purchase consideration | $ | 5,388 | ||
The results of HealCode are included in the Company's consolidated statements of operations since the acquisition date, including revenues and net loss, and were not material. Pro forma results of operations have not been presented because the acquisition was not material to the Company's results of operations.
Fitness Mobile Apps
On February 2, 2015, the Company completed the acquisition of the Fitness Mobile Apps, a privately held technology partner that creates tailored mobile apps for the Company’s customers. The Company accounted for the acquisition of Fitness Mobile Apps as a business combination. The Company acquired all of the assets that were used in, or otherwise benefit, the mobile apps business for 103,617 shares of the Company’s common stock with a fair value of $14.476 per share, of which 74,260 shares were issued and 29,357 shares were held with an escrow agent and were released in February 2016 following the first anniversary of the closing date, and $3,000,000 in cash, resulting in an aggregate purchase price of $4,500,000. The acquisition also included an obligation to issue up to 207,234 shares of the Company’s common stock to certain former employees of Fitness Mobile Apps, contingent upon performance obligations and their continuous employment with the Company. The measurement period for the contingent consideration ended during the year ended December 31, 2016 and the Company issued 207,234 shares of Class A common stock to such former employees of Fitness Mobile Apps on February 22, 2016 under its 2015 Equity Incentive Plan (see Note 9 Common Stock and Stockholder’s Equity below). The related compensation expense for the fair value of these additional shares was recorded over the respective service period.
The fair value of the Company’s common stock issued for the Fitness Mobile Apps acquisition was based on the Company’s valuation of its common stock as of February 2, 2015. Given the absence of a public trading market, the Company’s board of directors considered numerous objective and subjective factors to determine the fair value of the Company’s common stock. These factors included, but were not limited to (i) contemporaneous third-party valuations of common stock; (ii) the rights and preferences of convertible preferred stock relative to common stock; (iii) the lack of marketability of common stock; (iv) developments in the business; and (v) the likelihood of achieving a liquidity event, such as an IPO or sale of the Company, given prevailing market conditions. The aggregate enterprise value was determined using a combination of the income approach and two market approaches in order to estimate an Enterprise Value under five different possible future scenarios, which were weighted as follows:
Weighting | ||
IPO | 75 | % |
Transaction | 20 | % |
Private company (DCF) | 5 | % |
The Company allocated the total purchase consideration to tangible assets acquired and identifiable intangible assets acquired based on their estimated fair values with the excess of the purchase consideration over the aggregate fair values recorded as
F-19
goodwill allocated to the Company’s one operating segment. Goodwill of $3,569,000 represents 80% of the total purchase consideration and is primarily attributable to the value of acquired personnel, and the Company’s ability to expand its consumer base by transitioning Fitness Mobile Apps onto its platform. Goodwill is amortized over 15 years for tax purposes.
The internally developed software/technology with a remaining useful life of three years represents the tools to create consumer facing customized mobile apps for the Company’s customers. The fair values of the acquired intangible assets were determined based on the income approach and relief-from-royalty method approach and the identifiable intangible assets are subject to amortization on a straight-line basis over their remaining useful lives.
The Company incurred and expensed $150,000 in acquisition-related costs, which are included within general and administrative expenses on the consolidated statements of operations.
The following table summarizes the consideration paid and the fair values of the assets acquired and liabilities assumed at the acquisition date (in thousands):
Amount | |||
Tangible assets acquired | $ | 18 | |
Intangible asset – developed software/technology | 913 | ||
Goodwill | 3,569 | ||
Fair value of total purchase consideration | $ | 4,500 | |
The results of Fitness Mobile Apps are included in the Company’s consolidated statements of operations since the acquisition date, including revenues and net loss, and were not material. Pro forma results of operations have not been presented because the acquisition was not material to the Company’s results of operations.
5. GOODWILL AND OTHER INTANGIBLE ASSETS
The Company’s goodwill balance is solely attributable to acquisitions. There have been no impairment charges recorded against goodwill.
The Company’s intangible assets consisted of the following (in thousands except years):
December 31, 2017 | |||||||||||||
Useful Life (Years) | Gross Carrying Amount | Accumulated Amortization | Net Carrying Amount | ||||||||||
Acquired technology | 3 to 5 | 7,529 | (2,104 | ) | 5,425 | ||||||||
Internally developed software | 2 to 3 | $ | 3,703 | $ | (1,751 | ) | $ | 1,952 | |||||
Acquired network list | 2 | $ | 420 | $ | (420 | ) | $ | — | |||||
Total intangible assets | 11,652 | (4,275 | ) | 7,377 | |||||||||
December 31, 2016 | |||||||||||||
Useful Life (Years) | Gross Carrying Amount | Accumulated Amortization | Net Carrying Amount | ||||||||||
Acquired technology | 3 to 5 | 2,731 | (704 | ) | 2,027 | ||||||||
Internally developed software | 2 to 3 | 1,877 | (1,857 | ) | 20 | ||||||||
Acquired network list | 2 | $ | 420 | $ | (420 | ) | $ | — | |||||
Total intangible assets | 5,028 | (2,981 | ) | 2,047 | |||||||||
(1) Internally developed software, which used to be presented with property and equipment, is now presented with intangible assets.
The Company capitalized software development costs of $1,963,000, zero, and $135,000 for the years ended December 31, 2017, 2016 and 2015, respectively. The Company has internally developed software in process of $1,559,000, zero, and $10,000 for the years ended December 31, 2017, 2016 and 2015, respectively.
F-20
Amortization of intangible assets (in thousands):
Year Ended December 31, | ||||||||
2017 | 2016 | 2015 | ||||||
Amortization of acquired intangible assets | 1,401 | 426 | 337 | |||||
Amortization of internally developed software | 31 | 321 | 317 | |||||
Total amortization of intangible assets | 1,432 | 747 | 654 | |||||
The expected future annual amortization expense of intangible assets as of December 31, 2017 is presented below (in thousands):
Year Ending December 31, | |||
2018 | $ | 1,482 | |
2019 | 1,456 | ||
2020 | 1,451 | ||
2021 | 1,203 | ||
2022 | 226 | ||
Total amortization expense | $ | 5,818 | |
Internally developed software in process | $ | 1,559 | |
Total net book value of intangible assets | $ | 7,377 | |
6. DEBT
Credit Facility
On January 12, 2015, the Company entered into a loan agreement with Silicon Valley Bank for a secured revolving credit facility that allows the Company to borrow up to $20,000,000 for working capital and general business requirements. Amounts outstanding under the credit facility will bear interest at the greater of the prime rate (4.50% as of December 31, 2017) plus 0.5%, or 3.25% with accrued interest payable on a monthly basis and outstanding and unpaid principal due upon maturity of the credit facility in January 2018. There are no prepayment penalties if the Company repays principal and interest prior to maturity. The credit facility is secured by substantially all of the Company's corporate assets. The Company also granted and pledged a security interest to the lender in all rights, title, and interest in its intellectual property. The Company is also subject to certain reporting and financial performance covenants, which require the Company to meet certain revenue targets. The Company did not draw down any amounts under the loan agreement during the year ended December 31, 2017. Refer to Note 14: Subsequent Events for details about the extension and alteration of the loan agreement.
On January 12, 2018, the Company amended the loan agreement with Silicon Valley Bank. Silicon Valley Bank extended the maturity date of the revolving line from January 12, 2018 to January 11, 2019 and included an accordion feature for the revolving line, such that the revolving line may, upon the Company’s request and subject to certain conditions, be increased by an additional aggregate amount of up to $20,000,000. Silicon Valley Bank also reduced the interest rate to the greater of the prime rate or 4.5% and deleted the revenue covenant.
7. COMMITMENTS AND CONTINGENCIES
Operating Lease
The Company has operating lease agreements with lease periods expiring between 2019 and 2030. Rent expense was $6,306,000, $4,767,000, and 4,332,000 for the years ended December 31, 2017, 2016, and 2015, respectively.
F-21
Financing Obligation
During April 2015, the Company began to occupy additional office space constructed under a 15 year build-to-suit lease arrangement entered into in October 2013. During the construction of the facility, the Company concluded that it was the “deemed owner” for accounting purposes due to its extensive involvement in the construction process. Upon completion of the construction, the Company was still considered to be the “deemed owner” of the building for accounting purposes as the asset did not qualify for sale-leaseback accounting treatment due to the Company’s continuing involvement. As such, costs for the building were recorded to “Building, leased” within “Property and equipment, net” and the related financing obligation of $15,450,000 remained recorded as of December 31, 2017. The portion of the lease obligation allocated to the land is being treated for accounting purposes as an operating lease.
The obligation is being settled through monthly lease payments to the landlord and the asset is being depreciated over the initial term of the lease. The lease has an original term of 15 years and the Company also has an option to extend the term of the lease for three consecutive terms of five years each. The Company is responsible to pay landlord’s insurance costs, real property taxes, and operating expenses related to the premises as additional rent.
Future Minimum Lease Payments
Future minimum lease payments under non-cancellable lease agreements as of December 31, 2017 were as follows (in thousands):
Year Ending December 31, | Operating Leases | Financing Obligation, Building- Leased | Total | |||||||||
2018 | $ | 4,703 | $ | 1,679 | $ | 6,382 | ||||||
2019 | 4,773 | 1,729 | 6,502 | |||||||||
2020 | 4,651 | 1,781 | 6,432 | |||||||||
2021 | 3,926 | 1,835 | 5,761 | |||||||||
2022 | 3,258 | 1,890 | 5,148 | |||||||||
Thereafter | 10,107 | 15,637 | 25,744 | |||||||||
Total minimum lease payments | $ | 31,418 | $ | 24,551 | $ | 55,969 | ||||||
The remaining future minimum lease payments on the building, leased, include interest of $9,101,000 to be recognized over the remainder of the initial term of the lease agreement. A total financing obligation of $15,450,000 remained recorded as of December 31, 2017 of which $518,000 is recorded as a current obligation.
Purchase Commitments
Future unconditional purchase commitments for software subscriptions and data center and communication services as of December 31, 2017 were as follows (in thousands):
Year Ending December 31, | |||
2018 | $ | 2,819 | |
2019 | 2,530 | ||
2020 | 600 | ||
Total minimum purchase commitments | $ | 5,949 | |
Litigation
From time to time, the Company may become involved in legal proceedings, claims, and litigation arising in the ordinary course of business. Management is not currently aware of any matters that it expects will have a material adverse effect on the consolidated financial position, results of operations, or cash flows of the Company.
8. WARRANT
F-22
In connection with entering into a credit facility during the year ended December 31, 2010, the Company issued a warrant to purchase 87,500 shares of Series C redeemable convertible preferred stock to the lender. The warrant was fully vested and exercisable upon issuance, had an expiration date in June 2020. In connection with the IPO completed on June 24, 2015, the warrant to purchase 87,500 shares of Series C redeemable convertible preferred stock converted into a warrant to purchase 89,177 shares of the Class B common stock with an aggregate exercise price of $151,603 and a fair value of $1,213,000, and the related preferred stock warrant liability was reclassified to additional paid-in capital, a component of stockholders’ equity (deficit), and the Company ceased recording any further related periodic fair value adjustments. The warrant was exercised on a net basis on July 24, 2015, which resulted in the issuance of 76,565 shares of Class B common stock.
9. COMMON STOCK AND STOCKHOLDERS' EQUITY
Redeemable Convertible Preferred Stock
Amendment and Restatement of Certificate of Incorporation
In March 2015, the Company adopted an amended and restated certificate of incorporation (the “Pre-IPO Restated Certificate”) to modify the dividend, conversion and liquidation rights of the Series A, Series B, Series C and Series D redeemable convertible preferred stock. Under the Pre-IPO Restated Certificate, the Series C and Series D were no longer entitled to cumulative dividends upon a liquidation of the Company, and the Series A, Series B, Series C, and Series D were no longer entitled to receive cumulative dividends upon conversion into common stock, including in connection with an initial public offering. In addition, under the Pre-IPO Restated Certificate, the conversion ratio of each series of redeemable convertible preferred stock, which was 1-to-1 for all series prior to the amendment, was adjusted to 1.0088 for Series A, 1.0148 for Series B, 1.0192 for Series C, and 1.0218 for Series D. As a result of this amendment, the redeemable convertible preferred stock became convertible into shares of common stock upon a qualifying event, including completion of an initial public offering, as follows:
Preferred Stock | Number of Shares, Actual | Conversion Rate | Number of Shares, As Converted | |||||
Series A | 1,319,940 | 1.0088 | 1,331,507 | |||||
Series B | 988,411 | 1.0148 | 1,003,071 | |||||
Series C | 4,019,524 | 1.0192 | 4,096,561 | |||||
Series D | 5,308,875 | 1.0218 | 5,424,802 | |||||
Series E | 2,439,058 | 1.0000 | 2,439,058 | |||||
Series F | 2,685,997 | 1.0000 | 2,685,997 | |||||
Series G | 3,692,684 | 1.0000 | 3,692,684 | |||||
Total | 20,454,489 | 20,673,680 | ||||||
The Company has determined that the changes to the rights underlying the Series A, Series B, Series C and Series D preferred stock resulted in a modification, for accounting purposes, of these shares. The change in the fair value of the Series A, Series B, Series C, and Series D immediately before and after the amendment was recognized as a deemed dividend of $1,748,000 from the Series A, Series B, Series C and Series D preferred stockholders, which was recorded as a reduction of accumulated deficit during the year ended December 31, 2015.
The fair value of the Series A, Series B, Series C, and Series D preferred stock immediately before and after the amendment was estimated by the Company’s board of directors with assistance from a third-party valuation that utilized methodologies and assumptions consistent with the Company’s most recent common stock valuations, including on a minority, nonmarketable interest basis. The Company’s aggregate enterprise value was determined using a combination of valuation approaches, including an income approach and various market approaches, and under five different possible future scenarios.
Preferred Stock
Immediately prior to the completion of the IPO, all outstanding convertible preferred stock was converted and reclassified into 20,673,680 shares of Class B common stock and the Company’s certificate of incorporation was amended and restated to authorize the Company to issue 100,000,000 shares of preferred stock with a par value of $0.000004 per share. No shares of preferred stock were issued or outstanding as of December 31, 2017 and December 31, 2016.
Common Stock
F-23
Immediately prior to the completion of the IPO, all outstanding shares of common stock were reclassified into 11,305,355 shares of Class B common stock and the Company’s certificate of incorporation was amended and restated to authorize the Company to issue 1,000,000,000 shares of Class A common stock and 100,000,000 shares of Class B common stock, each with a par value of $0.000004 per share. The amended and restated certificate of incorporation also:
• | established that, on any matter that is submitted to a vote of the stockholders, the holder of each share of Class A common stock is entitled to 1 vote per share, while the holder of each share of Class B common stock is entitled to 10 votes per share; |
• | established that shares of Class B common stock are convertible into shares of Class A common stock at the option of the holder and automatically convert into shares of Class A common stock upon transfer, subject to limited exceptions; and |
• | established that, except with respect to voting and conversion rights, as discussed above, the rights of the holders of Class A and Class B common stock are identical. |
Following the IPO, the number of outstanding shares of Class A common stock has increased, with an associated decrease in the number of outstanding shares of Class B common stock, primarily as a result of the conversion of shares of Class B common stock held by pre-IPO investors and stockholders into shares of Class A common stock. In addition, several options have been exercised and RSUs have vested, as well as purchases under the Company’s 2015 ESPP (as defined herein), all resulting in an increase in the number of shares of Class A common stock. Finally, in May 2017, the number of shares of Class A common stock increased as a result of the issuance of 5,060,000 shares of Class A common stock in the Company’s follow-on public offering.
2015 Equity Incentive Plan
The Company’s 2015 Equity Incentive Plan (“2015 Plan”) became effective on June 17, 2015 and serves as the successor to the Company’s 2009 Stock Option Plan (“2009 Plan”). As of December 31, 2017, there were 6,195,773 shares of Class A common stock available for issuance under the 2015 Plan. The number of shares available for issuance under the 2015 Plan includes an annual increase on the first day of each fiscal year beginning in 2016, equal to the least of 3,915,682 shares, 5% of the outstanding shares of common stock as of the last day of the immediately preceding fiscal year, or such other amount as the Company’s board of directors or compensation committee may determine. Accordingly, effective as of January 1, 2018, the number of shares available for issuance under the 2015 Plan was increased by 2,347,168 shares of Class A common stock. All stock options under the 2015 Plan have a term of no greater than ten years from the date of grant. As of December 31, 2017, options to purchase 1,162,485 shares of Class A common stock and 1,322,650 restricted stock units (“RSUs”) which will be settled in shares of Class A common stock remained outstanding under the 2015 Plan.
The 2015 Plan provides for the grant of non-statutory stock options, restricted stock awards (“RSAs”), RSUs, stock appreciation rights, performance units and performance shares to the Company’s employees, directors and consultants and its parent and subsidiary corporations’ employees and consultants. Neither RSAs nor RSUs require payment from the employee or service provider. Each RSA and RSU represents the right to receive one share of Class A common stock upon vesting or settlement, as applicable. The RSUs generally vest over a period of approximately one or four years depending on the nature of the award. These awards are contingent upon the related employees’ continuous employment with the Company. As such, compensation expense is being recorded over the requisite service period of one or four years.
2015 Employee Stock Purchase Plan
The Company’s 2015 Employee Stock Purchase Plan (“2015 ESPP Plan”) became effective on June 2, 2015. As of December 31, 2017, there were 1,032,725 shares of Class A common stock available for issuance under the 2015 ESPP Plan. The number of shares available for sale under the 2015 ESPP Plan includes an annual increase on the first day of each fiscal year beginning in 2016, equal to the least of 783,136 shares, 1% of the outstanding shares of common stock as of the last day of the immediately preceding fiscal year, or such other amount as the Company’s board of directors or compensation committee may determine. Accordingly, effective as of January 1, 2018, the number of shares available for issuance under the 2015 ESPP Plan was increased by 469,433 shares of Class A common stock.
Under the 2015 ESPP Plan, eligible employees are granted options to purchase shares of Class A common stock through payroll deductions. The 2015 ESPP Plan provides for 24 months offering periods. Each offering period includes purchase periods, which are approximately six-month periods commencing with one exercise date and ending with the next exercise date. At the end of each purchase period, employees are able to purchase shares at 85% of the lower of the fair market value of the Class A common stock on the first trading day of each offering period or the end of each six-month purchase period. New offering periods commence every six months on or about February 22 and August 22 of each year. Employees purchased 271,451 shares of Class A common stock for an aggregate cost of $3,238,000 under the 2015 ESPP Plan during the year ended December 31, 2017.
F-24
2009 Stock Option Plan
The 2009 Plan, which provides for the grant of incentive stock options, non-statutory stock options, and restricted stock to employees, directors, and consultants, terminated on June 18, 2015. Accordingly, no shares were available for issuance under the 2009 Plan after that time. The 2009 Plan continues to govern outstanding awards granted thereunder. As of December 31, 2017, options to purchase 2,273,563 shares of Class B common stock remained outstanding under the 2009 Plan.
RSU and RSA Activity
A summary of the activity for the Company’s RSUs and RSAs is presented below (in thousands, except share numbers, per share amounts, and contractual life years):
Number of Shares | Weighted- Average Grant Date Fair Value (per share) | Aggregate Intrinsic Value | ||||||||
Unvested balance – December 31, 2015 | — | $ | — | $ | — | |||||
Granted | 1,002,778 | 14.13 | ||||||||
Vested | (208,311 | ) | 12.94 | |||||||
Forfeited | (50,774 | ) | 13.80 | |||||||
Unvested balance – December 31, 2016 | 743,693 | $ | 14.49 | $ | 15,841 | |||||
Granted | 978,202 | 27.04 | ||||||||
Vested | (215,662 | ) | 14.34 | |||||||
Forfeited | (183,583 | ) | 19.23 | |||||||
Unvested balance – December 31, 2017 | 1,322,650 | $ | 23.14 | $ | 40,275 | |||||
As of December 31, 2017, there was a total of $25,697,000 in unrecognized compensation cost related to unvested RSUs, which is expected to be recognized over a weighted average period of approximately 3.0 years.
Stock Option Activity
A summary of the activity for the Company’s stock option plans during the reporting periods and a summary of information related to options vested and expected to vest and options exercisable are presented below (in thousands, except shares, per share amounts, contractual life years):
F-25
Options Outstanding | ||||||||||||||||
Number of Shares Underlying Outstanding Options | Weighted- Average Exercise Price | Weighted-Average Grant Date Fair Value | Weighted- Average Remaining Contractual Term (Years) | Aggregate Intrinsic Value | ||||||||||||
Outstanding – January 1, 2015 | 2,568,781 | $ | 6.39 | 8.1 | $ | 20,773 | ||||||||||
Granted | 2,039,875 | 14.48 | $ | 6.57 | ||||||||||||
Exercised | (34,140 | ) | 7.10 | $ | 274 | |||||||||||
Forfeited or cancelled | (263,053 | ) | 12.07 | |||||||||||||
Outstanding – December 31, 2015 | 4,311,463 | $ | 9.87 | 7.9 | $ | 22,709 | ||||||||||
Granted | 674,102 | 14.54 | $ | 6.28 | ||||||||||||
Exercised | (856,412 | ) | 7.68 | $ | 11,664 | |||||||||||
Forfeited or cancelled | (285,877 | ) | 13.11 | |||||||||||||
Outstanding – December 31, 2016 | 3,843,276 | $ | 10.93 | 7.5 | $ | 39,902 | ||||||||||
Granted | 758,914 | $ | 25.60 | $ | 10.86 | |||||||||||
Exercised | (858,709 | ) | $ | 11.69 | $ | 16,108 | ||||||||||
Forfeited or cancelled | (307,433 | ) | $ | 17.02 | ||||||||||||
Outstanding – December 31, 2017 | 3,436,048 | $ | 13.44 | 6.8 | $ | 58,605 | ||||||||||
Exercisable – December 31, 2017 | 1,960,704 | $ | 8.83 | 5.6 | $ | 42,388 | ||||||||||
Vested and expected to vest – December 31, 2017 | 3,400,765 | $ | 13.34 | 6.8 | $ | 58,325 | ||||||||||
The total fair value of options vested during the years ended December 31, 2017, 2016, and 2015 was $4,741,000, $5,234,000, and $4,898,000, respectively.
As of December 31, 2017, the total unrecognized stock-based compensation expense for unvested stock options, net of expected forfeitures, was $11,125,000, which is expected to be recognized over a weighted-average period of 2.4 years.
Other Stock-Based Compensation
During the years ended December 31, 2017 and 2016, the Company recorded stock-based compensation expense of zero and $271,000, respectively, related to contingent bonuses to certain former employees of Fitness Mobile Apps payable in shares of the Company’s common stock for post-combination employment services.
During the years ended December 31, 2017 and 2016, the Company recorded stock-based compensation expense of $808,000 and zero, respectively, attributed to post-acquisition services that are payable in shares of the Company’s common stock.
There were no non-employee grants during the year ended December 31, 2017.
Determination of Fair Value
The Company records stock-based compensation based on the fair value of stock options on grant date using the Black-Scholes option-pricing model. The Company determines the fair value of shares of common stock to be issued under the ESPP using the Black-Scholes option-pricing model. The fair value of restricted stock units and restricted stock awards equals the market value of the underlying stock on the date of grant. Use of the Black-Scholes option-pricing model requires the input of highly subjective assumptions, including the fair value of the underlying common stock, expected term of the option, expected volatility of the price of the common stock, risk-free interest rates, and expected dividend yield of the common stock. The assumptions used in the Company's option-pricing model represent management’s best estimates. Compensation expense related to stock-based transactions is measured and recognized in the consolidated financial statements based on the fair value of the awards granted. The stock-based compensation expense, net of forfeitures, is recognized on a straight-line basis over the requisite service periods of the awards, which is generally four years. The Company determined valuation assumptions as follows:
F-26
Fair Value of Common Stock
Prior to the Company’s IPO on June 18, 2015, the fair value of the common stock underlying its stock-based awards was determined by the Company’s board of directors, with input from management and a third-party valuation firm.
Since the Company’s IPO, the fair value of common stock was determined based on the market closing price for the Company’s Class A common stock as reported on the NASDAQ Stock Market at each grant date.
Expected Term
The expected term of employee stock options represents the weighted-average period that the stock options are expected to remain outstanding. The expected term assumptions were determined based on the vesting terms, exercise terms, and contractual lives of the options.
Expected Volatility
The expected volatility of stock options is estimated based upon the historical volatility of a number of publicly traded companies in similar stages of development and comparable industries for a period commensurate with the expected life. The Company intends to continue to consistently apply this methodology using the same or similar public companies until sufficient historical information regarding the volatility of the Company’s Class A common stock price becomes available, or unless circumstances change such that the identified companies are no longer similar to MINDBODY, in which case, more suitable companies whose share prices are publicly available would be utilized in the calculation.
Risk-Free Interest Rate
The risk-free interest rate is based on the U.S. Treasury yield curve in effect at the time of grant for zero-coupon U.S. Treasury notes with maturities approximately equal to the option’s expected term.
Dividend Yield
The Company has never declared or paid any cash dividends and does not presently plan to pay cash dividends in the foreseeable future. Consequently, an expected dividend yield of zero was utilized.
The following table summarizes the assumptions used in the Black-Scholes option-pricing model to determine the fair value of the Company’s stock options:
Year Ended December 31, | |||||
2017 | 2016 | 2015 | |||
Expected term (in years) | 5.8 | 5.8 | 5.8 | ||
Expected volatility | 38% - 44% | 44% - 45% | 45% - 46% | ||
Risk-free interest rate | 1.8% - 2.1% | 1.2% - 1.9% | 1.4% - 1.8% | ||
Dividend yield | 0% | 0% | 0% | ||
The following table summarizes the assumptions used in the Black-Scholes option-pricing model to determine fair value of the Company's common shares to be issued under the ESPP:
Year Ended December 31, | |||
2017 | 2016 | ||
Expected term (in years) | 0.5 - 2.0 | 0.5 - 2.0 | |
Expected volatility | 31% - 50% | 39% - 50% | |
Risk-free interest rate | 0.45% - 1.33% | 0.45% - 0.78% | |
Dividend yield | 0% | 0% | |
F-27
Total Stock-Based Compensation Expenses
Total stock-based compensation expense related to stock options, ESPP and restricted stock units and awards is included in the consolidated statements of operations as follows (in thousands):
Year Ended December 31, | |||||||||||
2017 | 2016 | 2015 | |||||||||
Cost of revenue | $ | 1,334 | $ | 910 | $ | 651 | |||||
Sales and marketing | 2,872 | 2,059 | 3,533 | ||||||||
Research and development | 3,864 | 1,971 | 902 | ||||||||
General and administrative | 6,031 | 3,823 | 3,289 | ||||||||
Total stock-based compensation expense | $ | 14,101 | $ | 8,763 | $ | 8,375 | |||||
10. INCOME TAXES
The Tax Cuts and Jobs Act (the “Act”) was enacted on December 22, 2017. The Act, among other things, reduces the US federal corporate tax rate from 35% to 21%, requires companies to pay a one-time transition tax on earnings of certain foreign subsidiaries that were previously tax deferred, changes rules related to uses and limitations of net operating loss carryforwards created in tax years beginning after December 31, 2017, and creates new taxes on certain foreign sourced earnings.
The SEC staff issued SAB 118, which provides guidance on accounting for the tax effects of the Tax Act. SAB 118 provides a measurement period that should not extend beyond one year from the Tax Act enactment date for companies to complete the accounting under ASC 740. In accordance with SAB 118, a company must reflect the income tax effects of those aspects of the Act for which the accounting under ASC 740 is complete. To the extent that a company’s accounting for certain income tax effects of the Tax Act is incomplete but it is able to determine a reasonable estimate, it must record a provisional estimate in the financial statements. If a company cannot determine a provisional estimate to be included in the financial statements, it should continue to apply ASC 740 on the basis of the provisions of the tax laws that were in effect immediately before the enactment of the Tax Act. At December 31, 2017, the Company has not completed its accounting for the tax effects of enactment of the Act; however, in certain cases, as described below, the Company has made a reasonable estimate of the effects on its existing deferred tax balances and the one-time transition tax. In other cases, the Company has not been able to make a reasonable estimate and continue to account for those items based on its existing accounting under ASC 740, Income Taxes, and the tax laws that were in effect immediately prior to enactment. The items for which the Company was able to determine a reasonable estimate did not have a material impact on income tax expense.
The Company remeasured certain deferred tax assets and liabilities based on the rates at which they are expected to reverse in the future, which is generally 21%. However, the Company is still analyzing certain aspects of the Act and refining its calculations, which could potentially affect the measurement of these balances or potentially give rise to new deferred tax amounts. For certain of our DTAs the Company has recorded a decrease of $15,884,000, with a corresponding adjustment to valuation allowance for the year ended December 31, 2017. The re-measurement of our indefinite lived DTLs resulted in an immaterial deferred income tax benefit.
The Deemed Repatriation Transition Tax (“Transition Tax”) is a tax on previously untaxed accumulated and current earnings and profits (“E&P”) of certain of our foreign subsidiaries. To determine the amount of the Transition Tax, the Company must determine, in addition to other factors, the amount of post-1986 E&P of the relevant subsidiaries, as well as the amount of non-U.S. income taxes paid on such earnings. The Company was able to make a reasonable estimate of the Transition Tax and recorded a provisional Transition Tax obligation of $993,000 that is expected to be offset by current year net operating losses. However, the Company is continuing to gather additional information to more precisely compute the amount of the Transition Tax.
The Company must assess whether its valuation allowance analyses are affected by various aspects of the Tax Act (e.g., deemed repatriation of deferred foreign income, GILTI inclusions, new categories of FTCs). Since, as discussed herein, the Company has recorded provisional amounts related to certain portions of the Tax Act, any corresponding determination of the need for or change in a valuation allowance is also provisional.
The following table presents domestic and foreign components of consolidated loss before income taxes for the periods presented (in thousands):
F-28
Year Ended December 31, | |||||||||||
2017 | 2016 | 2015 | |||||||||
Domestic | $ | (15,378 | ) | $ | (23,297 | ) | $ | (36,197 | ) | ||
Foreign | 753 | 639 | 355 | ||||||||
Loss before provision for income taxes | $ | (14,625 | ) | $ | (22,658 | ) | $ | (35,842 | ) | ||
The Company recorded an income tax expense of $167,000, $321,000, and $246,000 for the years ended December 31, 2017, 2016, and 2015. This tax expense is largely attributable to the deferred tax liability associated with the amortization of intangible assets and foreign income taxes associated with the Company’s operations in the United Kingdom and Australia. The Company continues to maintain a valuation allowance for its U.S. federal and state deferred tax assets.
The components of income tax expense were as follows (in thousands):
Year Ended December 31, | |||||||||||
2017 | 2016 | 2015 | |||||||||
Current provisions for income taxes: | |||||||||||
Federal | $ | — | $ | — | $ | — | |||||
State | 73 | 39 | 29 | ||||||||
Foreign | 187 | 162 | 158 | ||||||||
Total current | 260 | 201 | 187 | ||||||||
Deferred tax provision (benefit): | |||||||||||
Federal | (156 | ) | 95 | 93 | |||||||
State | 63 | 19 | 21 | ||||||||
Foreign | — | 6 | (55 | ) | |||||||
Total provision for income taxes | $ | 167 | $ | 321 | $ | 246 | |||||
The tax effects of temporary differences and related deferred tax assets and liabilities as of December 31, 2017 and 2016 are as follows (in thousands):
December 31, | |||||||
2017 | 2016 | ||||||
Deferred tax assets: | |||||||
Net operating losses carryforwards | $ | 31,699 | $ | 39,520 | |||
Accrued expenses and reserves | 668 | 844 | |||||
Stock Compensation | 752 | 2,226 | |||||
Deferred revenue | 847 | 1,270 | |||||
Deferred rent | 513 | 539 | |||||
Depreciation | 1,340 | 915 | |||||
Other | 357 | 224 | |||||
Total deferred tax assets | 36,176 | 45,538 | |||||
Deferred tax liabilities: | |||||||
Amortization | (393 | ) | (216 | ) | |||
Other | (265 | ) | (241 | ) | |||
Total deferred tax liabilities | (658 | ) | (457 | ) | |||
Valuation allowance | (35,665 | ) | (45,329 | ) | |||
Net deferred tax liabilities | $ | (147 | ) | $ | (248 | ) | |
The following table presents a reconciliation of statutory federal rate and the Company’s effective tax rate for the periods presented:
F-29
Year Ended December 31, | ||||||||
2017 | 2016 | 2015 | ||||||
Tax at statutory federal rate | 34 | % | 34 | % | 34 | % | ||
State tax – net of federal benefit | 4.8 | 4.7 | 5.0 | |||||
Stock-based compensation — ISOs | 6.3 | 1.0 | (2.4 | ) | ||||
Change in valuation allowance | (42.5 | ) | (38.3 | ) | (35.6 | ) | ||
Other | (3.7 | ) | (2.8 | ) | (1.7 | ) | ||
Effective tax rate | (1.1 | )% | (1.4 | )% | (0.7 | )% | ||
It is the Company’s intention to reinvest undistributed earnings of its foreign subsidiaries, which approximates $1,752,000 at December 31, 2017, and thereby indefinitely postpone their remittance. Accordingly, no provision has been made for foreign withholding taxes or United States income taxes, which may become payable if undistributed earnings of the foreign subsidiaries were paid as dividends to the Company. Should the Company decide to no longer indefinitely reinvest such earnings outside the United States, the Company would have to adjust the income tax provision in the period management makes such determination.
As of December 31, 2017 and 2016, respectively, deferred tax assets included federal net operating loss carryforwards of $118,864,000 and $103,047,000, and state net operating loss carryforwards of $104,049,000 and $88,929,000. The federal net operating loss carryforwards start to expire in the year ending December 31, 2025. State net operating losses started to expire in 2016 for the earliest net operating loss layers.
As of December 31, 2017 and 2016, the Company had no assurance that future taxable income would be sufficient to fully utilize the net operating loss carryforwards and other deferred tax assets in the future. Consequently, the Company determined that a valuation allowance of $35,665,000 and $45,329,000 as of the years ended December 31, 2017 and 2016, respectively, was needed to offset the deferred tax assets resulting mainly from the net operating loss carryforwards. The net change in the valuation allowance during the years ended December 31, 2017, 2016, and 2015 was a $9,664,000 decrease, $7,881,000 increase, and $13,435,000 increase, respectively.
Section 382 of the Internal Revenue Code of 1986, as amended, places a limitation on the realizability of Net Operating Losses (“NOLs”) in future periods when a loss corporation has undergone significant changes in stock ownership. During the year ended December 31, 2015, the Company completed an analysis under IRC Section 382 through December 31, 2014, and determined that the Company experienced multiple ownership changes during this period. U.S. federal NOLs of approximately $430,000 are expected to expire unused due to limitations under Section 382. The Company performed an IRC Section 382 analysis as of December 31, 2017 and determined that there would be no additional effects on the NOL deferred tax asset if ownership changes occurred between January 1, 2015 and December 31, 2017.
The Company evaluates tax positions for recognition using a more-likely-than-not recognition threshold, and those tax positions eligible for recognition are measured as the largest amount of tax benefit that is greater than 50% likely of being realized upon the effective settlement with a taxing authority that has full knowledge of all relevant information. As of December 31, 2017 and 2016, the Company has not identified any unrecognized income tax benefits and uncertain tax positions, as well as any associated interest and penalties.
All tax years remain subject to examination by the U.S. federal and state tax authorities.
11. NET LOSS PER SHARE
The following table sets forth the computation of the Company’s basic and diluted net loss per share attributable to common stockholders for the periods presented (in thousands, except per share data):
F-30
For Year Ended December 31, | |||||||||||
2017 | 2016 | 2015 | |||||||||
Net loss attributable to common stockholders | $ | (14,792 | ) | $ | (22,979 | ) | $ | (44,202 | ) | ||
Net loss per share attributable to common stockholders, basic and diluted | $ | (0.33 | ) | $ | (0.58 | ) | $ | (1.68 | ) | ||
Weighted-average shares used to compute net loss per share attributable to common stockholders, basic and diluted | 44,309 | 39,913 | 26,320 | ||||||||
Diluted loss per common share is the same as basic loss per common share for all periods presented because the effects of potentially dilutive items were anti-dilutive given the Company’s net loss. The following shares have been excluded from the calculation of diluted net loss per share attributable to common stockholders for each period presented because they are anti-dilutive (in thousands):
As of December 31, | ||||||||
2017 | 2016 | 2015 | ||||||
Shares subject to outstanding stock options and employee stock purchase plan | 3,552 | 3,944 | 4,437 | |||||
Shares subject to outstanding restricted stock units | 1,323 | 744 | — | |||||
Total | 4,875 | 4,688 | 4,437 | |||||
12. SEGMENTS AND INFORMATION BY GEOGRAPHIC LOCATION
Operating segments are components of an enterprise for which separate financial information is available and is evaluated regularly by the Company’s chief operating decision maker in deciding how to allocate resources and assessing performance. The Company’s chief operating decision maker is its Chief Executive Officer.
The Chief Executive Officer reviews financial information presented on a consolidated basis for purposes of allocating resources and evaluating financial performance. Further, there is one business activity, and there are no segment managers who are held accountable for operations, operating results, and plans for levels, components, or types of products or services below the consolidated unit level. Accordingly, the Company has a single operating and reporting segment.
Revenue
The following table presents the Company’s total revenue by category (in thousands):
For Year Ended December 31, | |||||||||||
2017 | 2016 | 2015 | |||||||||
Revenue: | |||||||||||
Subscription and services | $ | 109,174 | $ | 82,919 | $ | 61,339 | |||||
Payments | 71,263 | 53,808 | 37,460 | ||||||||
Product and other | 2,189 | 2,294 | 2,570 | ||||||||
Total revenue | $ | 182,626 | $ | 139,021 | $ | 101,369 | |||||
The following table presents the Company’s total revenue by geography based on the billing address of the customer (in thousands):
For Year Ended December 31, | |||||||||||
2017 | 2016 | 2015 | |||||||||
United States | $ | 147,195 | $ | 114,877 | $ | 84,822 | |||||
Other | 35,431 | 24,144 | 16,547 | ||||||||
Total | $ | 182,626 | $ | 139,021 | $ | 101,369 | |||||
F-31
Substantially all of the Company’s assets were attributable to operations in the United States as of December 31, 2017 and 2016.
13. PROFIT SHARING PLAN
The Company has a 401(k) profit sharing plan (the “401(k) Plan”) that covers all eligible employees. Each participant may elect to contribute up to the maximum limit by federal law. The Company makes a safe harbor contribution at 100% of the first 3% of eligible salary deferral, plus 50% of the next 2% of salary deferral. Charles Schwab Bank is the trustee of the 401(k) Plan. Employer contributions totaled $2,477,000, $2,073,000, and $1,743,000 for the years ended December 31, 2017, 2016, and 2015, respectively.
14. RELATED-PARTY TRANSACTIONS
The Company had no material related party transactions for the years ended December 31, 2017, 2016 and 2015, respectively.
15. SUBSEQUENT EVENTS
On February 19, 2018, the Company completed the acquisition of FitMetrix, Inc. (“FitMetrix”), a privately-held company, for an aggregate cash purchase price of $15.5 million, subject to customary adjustments, of which $1.6 million has been held back and placed in escrow for a period of 18 months to satisfy potential indemnification claims. FitMetrix, a MINDBODY platform partner at the time of acquisition, specializes in innovative performance tracking integrations with fitness studio equipment and wearables. The FitMetrix technology helps enable business owners to increase retention in the group and personal training environments and provide wellness seekers with an engaging, more interactive fitness experience. The initial purchase price accounting is not yet complete. The Company is in the process of completing a purchase price allocation and expects to include it the Company’s consolidated financial statements for the quarterly period ending March 31, 2018. Pro forma results of operations have not been presented because the acquisition was not material to the Company’s results of operations.
F-32
Exhibit Index
Incorporated by Reference | ||||||||||
Exhibit Number | Description | Form | File No. | Exhibit | Filing Date | |||||
3.1 | 10-Q | 001-37453 | 3.1 | August 7, 2015 | ||||||
3.2 | 10-Q | 001-37453 | 3.2 | August 7, 2015 | ||||||
4.1 | S-1/A | 333-204068 | 4.1 | June 8, 2015 | ||||||
4.2 | S-1 | 333-204068 | 4.2 | May 11, 2015 | ||||||
10.1+ | S-1/A | 333-204068 | 10.1 | June 8, 2015 | ||||||
10.2+ | S-1/A | 333-204068 | 10.2 | June 8, 2015 | ||||||
10.3*+ | ||||||||||
10.4+ | S-1/A | 333-204068 | 10.4 | June 8, 2015 | ||||||
10.5+ | S-1/A | 333-204068 | 10.5 | June 8, 2015 | ||||||
10.6+ | S-1/A | 333-204068 | 10.6 | June 8, 2015 | ||||||
10.7+ | 8-K | 001-37453 | 10.1 | June 19, 2017 | ||||||
10.8+ | S-1/A | 333-204068 | 10.8 | June 8, 2015 | ||||||
10.9+ | 10-Q | 001-37453 | 10.3 | November 10, 2016 | ||||||
10.10+ | 10-Q | 001-37453 | 10.4 | November 10, 2016 | ||||||
10.11+ | S-1/A | 333-204068 | 10.11 | June 8, 2015 | ||||||
10.12*+ | ||||||||||
10.13+ | S-1/A | 333-204068 | 10.12 | June 8, 2015 | ||||||
10.14*+ | ||||||||||
10.15 | S-1 | 333-204068 | 10.14 | May 11, 2015 | ||||||
10.16 | 10-Q | 001-37453 | 10.5 | November 10, 2016 | ||||||
10.17 | 8-K | 001-37453 | 10.1 | January 18, 2018 | ||||||
10.18 | S-1 | 333-204068 | 10.15 | May 11, 2015 | ||||||
10.19 | 10-K | 001-37453 | 10.18 | March 1, 2017 | ||||||
10.20 | S-1 | 333-204068 | 10.16 | May 11, 2015 | ||||||
10.21*+ | ||||||||||
23.1* | ||||||||||
24.1* | ||||||||||
31.1* | ||||||||||
31.2* | ||||||||||
32.1** | ||||||||||
32.2** | ||||||||||
101.INS* | XBRL Instance Document | |||||||||
101.SCH* | XBRL Taxonomy Extension Schema Document | |||||||||
101.CAL* | XBRL Taxonomy Extension Calculation Linkbase Document | |||||||||
101.DEF* | XBRL Taxonomy Extension Definition Linkbase Document | |||||||||
101.LAB* | XBRL Taxonomy Extension Label Linkbase Document | |||||||||
101.PRE* | XBRL Taxonomy Extension Presentation Linkbase Document | |||||||||
+ | Indicates management contract or compensatory plan. |
* | Filed herewith. |
** | Furnished herewith. The certifications attached as Exhibit 32.1 and Exhibit 32.2 that accompany this Annual Report on Form 10-K are deemed furnished and not filed with the Securities and Exchange Commission and are not to be incorporated by reference into any filing of MINDBODY, Inc. under the Securities Act of 1933, as amended, or the Securities Exchange Act of 1934, as amended, whether made before or after the date of this Annual Report on Form 10-K, irrespective of any general incorporation language contained in such filing. |