Attached files
| file | filename |
|---|---|
| EX-32.2 - EXHIBIT 32.2 - Core-Mark Holding Company, LLC | a2017-exhibit322.htm |
| EX-32.1 - EXHIBIT 32.1 - Core-Mark Holding Company, LLC | a2017exhibit321.htm |
| EX-31.2 - EXHIBIT 31.2 - Core-Mark Holding Company, LLC | a2017-exhibit312.htm |
| EX-31.1 - EXHIBIT 31.1 - Core-Mark Holding Company, LLC | a2017-exhibit311.htm |
| EX-23.1 - EXHIBIT 23.1 - Core-Mark Holding Company, LLC | a2017-exhibit231.htm |
| EX-21.1 - EXHIBIT 21.1 - Core-Mark Holding Company, LLC | a2017-exhibit211.htm |
UNITED STATES
SECURITIES AND EXCHANGE COMMISSION
Washington, DC 20549
FORM 10-K
x | Annual Report Pursuant to Section 13 OR 15(d) of the Securities Exchange Act of 1934 |
For the Fiscal Year Ended December 31, 2017
o | Transition Report Pursuant to Section 13 or 15(d) of the Securities Exchange Act of 1934 |
For the transition period from to .
Commission File Number: 000-51515

Core-Mark Holding Company, Inc.
(Exact name of registrant as specified in its charter)
Delaware | 20-1489747 |
(State or other jurisdiction of incorporation or organization) | (I.R.S. Employer Identification No.) |
395 Oyster Point Boulevard, Suite 415 South San Francisco, California 94080 | (650) 589-9445 |
(Address of Principal Executive Offices, including Zip Code) | (Registrant's Telephone Number, including Area Code) |
Securities Registered Pursuant to Section 12(b) of the Act:
Title of each class | Name of each exchange on which registered |
Common Stock, par value $0.01 per share | NASDAQ Global Market |
Securities registered pursuant to Section 12(g) of the Act: None
Indicate by check mark if the registrant is a well-known seasoned issuer, as defined in Rule 405 of the Securities Act.
Yes x No o
Indicate by check mark if the registrant is not required to file reports pursuant to Section 13 or Section 15(d) of the Act. Yes o No x
Indicate by check mark whether the registrant (1) has filed all reports required to be filed by Section 13 or 15(d) of the Securities Exchange Act of 1934 during the preceding 12 months (or for such shorter period that the registrant was required to file such reports), and (2) has been subject to such filing requirements for the past 90 days. Yes x No o
Indicate by check mark whether the registrant has submitted electronically and posted on its corporate Web site, if any, every Interactive Data File required to be submitted and posted pursuant to Rule 405 of Regulation S-T during the preceding 12 months (or for such shorter period that the registrant was required to submit and post such files). Yes x No o
Indicate by check mark if disclosure of delinquent filers pursuant to Item 405 of Regulation S-K is not contained herein, and will not be contained, to the best of registrant's knowledge, in definitive proxy or information statements incorporated by reference in Part III of this Form 10-K or any amendment to this Form 10-K. o
Indicate by check mark whether the registrant is a large accelerated filer, an accelerated filer, a non-accelerated filer, or a smaller reporting company. See the definitions of “large accelerated filer,” “accelerated filer” and “smaller reporting company” in Rule 12b-2 of the Exchange Act.
Large accelerated filer x | Accelerated filer o |
Non-accelerated filer o | Smaller reporting company o |
Emerging growth company o | |
If an emerging growth company, indicate by check mark if the registrant has elected not to use the extended transition period for complying with any new or revised financial accounting standards provided pursuant to Section 13(a) of the Exchange Act. o
Indicate by check mark whether the registrant is a shell company (as defined in Rule 12b-2 of the Act). Yes o No x
State the aggregate market value of the voting and non-voting common equity held by non-affiliates computed by reference to the price at which the common equity was last sold, or the average bid and asked price of such common equity, as of June 30, 2017, the last business day of the registrant's most recently completed second fiscal quarter: $1,496,890,911
As of February 23, 2018, the registrant had 46,147,688 shares of its common stock outstanding.
DOCUMENTS INCORPORATED BY REFERENCE
The information called for by Part III of this Form 10-K will be included in an amendment to this Form 10-K or incorporated by reference to the registrant’s 2018 definitive proxy statement to be filed pursuant to Regulation 14A.
FORM 10-K
FOR THE YEAR ENDED DECEMBER 31, 2017
TABLE OF CONTENTS
Page | ||
i
SPECIAL NOTE REGARDING FORWARD-LOOKING STATEMENTS
Statements in this Annual Report on Form 10-K that are not statements of historical fact are forward-looking statements made pursuant to the safe-harbor provisions of the Exchange Act of 1934 and the Securities Act of 1933.
Forward-looking statements in some cases can be identified by the use of words such as “may,” “will,” “should,” “potential,” “intend,” “expect,” “seek,” “anticipate,” “estimate,” “believe,” “could,” “would,” “project,” “predict,” “continue,” “plan,” “propose” or other similar words or expressions. Forward-looking statements are made only as of the date of this Form 10-K and are based on our current intent, beliefs, plans and expectations. They involve risks and uncertainties that could cause actual results to differ materially from historical results or those described in or implied by such forward-looking statements.
A detailed discussion of risks and uncertainties that could cause actual results and events to differ materially from such forward-looking statements is included in Part I, Item 1A, “Risk Factors” of this Form 10-K. Management of Core-Mark Holding Company, Inc. ("Core-Mark") undertake no obligation to update or revise any forward-looking statements, whether as a result of new information, future events or otherwise.
SEC Regulation - Non-GAAP Information
The financial statements in this Annual Report on Form 10-K are prepared in accordance with accounting principles generally accepted in the United States of America ("GAAP"). Core-Mark uses certain non-GAAP financial measures including Adjusted EBITDA, net sales less excise taxes, remaining gross profit, remaining gross profit margin, remaining gross profit margin less excise taxes and cigarette remaining gross profit per carton. We believe these non-GAAP financial measures provide meaningful supplemental information for investors regarding the performance of our business and facilitate a meaningful period to period evaluation. Management uses these non-GAAP financial measures in order to have comparable financial results to analyze changes in Core-Mark’s underlying business. These non-GAAP measures should be considered as a supplement to, and not as a substitute for, or superior to, financial measures calculated in accordance with GAAP. More information about such measures are included in Item 7 - Adjusted EBITDA and Item 7 - Non-GAAP Financial Information.
ii
PART I
ITEM 1. BUSINESS
Unless the context indicates otherwise, all references in this Annual Report on Form 10-K to “Core-Mark,” “the Company,” “we,” “us,” or “our” refer to Core-Mark Holding Company, Inc. and its subsidiaries.
Company Overview
Core-Mark is one of the largest wholesale distributors to the convenience retail industry in North America, providing sales, marketing, distribution and logistics services to approximately 45,000 customer locations across the United States ("U.S.") and Canada through 32 distribution centers (excluding two distribution facilities we operate as a third-party logistics provider). Our origins date back to 1888, when Glaser Bros., a family-owned-and-operated candy and tobacco distribution business, was founded in San Francisco, California.
Our mission is to be the most valued marketer of fresh and broad-line supply solutions to the convenience retail industry. While the past century has brought incredible changes to our business and the world in which we operate, our goal is the same today as it was 130 years ago - to provide customers with the best possible service and to help them grow their sales and profits. We have grown our business organically and through acquisitions which have expanded our distribution network, product selection and customer base.
We operate in an industry where, in 2016, total in-store sales at convenience retail locations across both the U.S. and Canada were approximately $264.0 billion. In the U.S., total in-store sales at convenience locations in 2016 were approximately $233.0 billion, an increase of 3.2% over the prior year, based on the National Association of Convenience Stores ("NACS") State of the Industry ("SOI") report. Over the ten years from 2007 through the end of 2016, U.S. convenience in-store sales have increased by a compounded annual growth rate of approximately 3.3%. The most recent NACS Convenience Industry Store Count noted that the U.S. had approximately 155,000 convenience store locations as of December 31, 2017. Approximately 103,000, or 66%, of the convenience stores in the U.S. are considered independents with ten or fewer stores. In Canada, we estimate that total in-store sales at convenience locations in 2016 were approximately CAD $41.1 billion generated through approximately 27,000 stores, based on the Canadian Convenience Store Association 2016 Industry report.
Core-Mark is one of two national distributors to the convenience store industry in the U.S. and is the largest in Canada. Our established national market presence rests primarily with our ability to service customers in every geographic region within the U.S. through 27 primary distribution centers and servicing customers in Canada with our five Canadian distribution centers. We offer our national and large regional convenience store customers scale and buying power, and we offer our independent store customers store support and marketing programs to assist them in growing their businesses. Our Vendor Consolidation Initiative (“VCI”), Focused Marketing Initiative (“FMI”) and Fresh programs have a proven track record of helping our customers grow their sales and profits at an accelerated rate. We believe this gives us a strong competitive advantage in the North American convenience store industry.
Company Highlights
Our net sales grew from $8.9 billion in 2012 to $15.7 billion in 2017, yielding an annual compounded growth rate of approximately 12%. Our growth has been driven primarily by our business strategies described more fully below. We believe these strategies have positioned us to continue to grow our approximate 7% market share of total in-store sales within the convenience store channel in North America and to take advantage of growth opportunities with other retail store formats. Below are recent key highlights:
• | In July 2017, we acquired substantially all of the assets of Farner-Bocken Company ("Farner-Bocken"), located in Carroll Iowa, for approximately $174.0 million. The acquisition of Farner-Bocken further expands our market share in the Midwest. |
• | In May 2017, we began service of our three-year supply agreement with approximately 530 Walmart Inc. ("Walmart") stores in five western states (Arizona, California, New Mexico, Nevada and Utah). Core-Mark is the primary distributor to these stores for candy, tobacco and certain snack foods. Candy sales, the largest product category serviced under the agreement, contributed to approximately 24% to the total sales for this category. |
• | In October 2016, we began service of our five-year supply agreement with 7-Eleven Inc. ("7-Eleven") as the primary wholesale distributor to approximately 900 stores serviced from three of our divisions in the western U.S.- Las Vegas, NV, Salt Lake City, UT and Sacramento, CA. |
1
• | In June 2016, we acquired substantially all of the assets of Pine State Convenience ("Pine State"), a division of Pine State Trading Company, located in Gardiner, Maine, for approximately $88 million. |
Business Strategy
Our objective is to increase overall return to stockholders by growing our revenues and leveraging operating costs to increase profitability. As one of the largest marketers of fresh and broad-line supply solutions to the convenience retail industry in North America with a track record of effectively selling into other retail channels, we believe we are well-positioned to meet this objective moving forward. Our business strategy includes the following initiatives, designed to further enhance the value we provide to our retail customers:
Fresh Products. There is an increasing trend among consumers to purchase fresh food from convenience and other retail store formats. To meet this demand, we have modified and upgraded our refrigerated capacity, including investing in chill docks, and tri-temperature ("tri-temp") trailers, which provide the infrastructure to deliver a significant range of chilled items including milk, produce and other fresh foods to retail outlets. We have established partnerships with strategically-located dairies, fresh kitchens and bakeries to further enable us to deliver premium consumer items such as sandwiches, wraps, cut-fruit, parfaits, pastries, doughnuts, bread and home meal replacement solutions. We continue to promote our fresh products through the development of unique and comprehensive marketing and equipment programs that assist retailers in showcasing their fresh product offerings. We believe our investments in infrastructure, combined with our strategically located suppliers and in-house expertise, position us as the leader in providing fresh products and programs to the convenience retail industry. Proper execution of Vendor Consolidation Initiative ("VCI"), the cornerstone being dairy distribution, provides Core-Mark the critical mass necessary to offer retailers a multiple weekly delivery platform, which facilitates the proper handling and dating of fresh products. We believe that fresh items are increasingly driving consumer decisions and will continue to be an important category.
Vendor Consolidation Initiative. We expect our VCI program will allow us to continue to grow our sales by capitalizing on the highly fragmented supply chain that services the convenience retail industry. A convenience retailer generally receives store merchandise through a large number of direct-store deliveries. This represents a highly inefficient and costly process for retailers. Our VCI program targets inefficiencies in the convenience store supply chain by offering the retailer the ability to receive multiple weekly deliveries for the bulk of their products, including dairy and other merchandise they previously purchased from multiple direct-store delivery companies. This simplifies the customer supply chain and provides retailers with an opportunity to improve inventory turns and working capital, reduce operational and transaction costs, and greatly diminish their out-of-stocks.
Focused Marketing Initiative. Designed to enhance our relationship with our independent customer base and to further differentiate us in the market place, our FMI program is centered on increasing the sales and profitability of the independent store through improved category insights, optimized retail price strategy and demographic decision-making, along with providing Core-Mark’s marketing solutions to create a comprehensive retail marketing strategy. We believe our innovative approach, which focuses on building a trusted partnership with our customers, has established us as the market leader in providing valuable marketing and supply chain solutions to the convenience retail industry.
Acquisitions and Expansion. We believe there is significant opportunity to increase our market presence and revenue growth through strategic and opportunistic acquisitions and the continued expansion of our facility infrastructure. We completed seven acquisitions and added three primary distribution centers between 2008 and 2017, which expanded our distribution network, product selection and customer base. We will continue to be opportunistic in pursuing acquisitions that allow further leveraging of our geographic footprint and bring Fresh and VCI to a broader customer base.
Competitive Strengths
We believe we have the following fundamental competitive strengths, which form the foundation for our business strategy:
Innovation and Flexibility. Wholesale distributors typically provide convenience retailers access to a broad product line, the ability to place small quantity orders, inventory management and access to trade credit. Our capability to increase sales and profitability with existing and new customers is based on our ability to deliver consistently high levels of service, innovative marketing programs, technology solutions and logistics support. We believe we are one of the first to recognize emerging trends and to offer retailers our unique strategic solutions such as Fresh, VCI, and FMI.
Distribution Capabilities. The wholesale distribution industry is highly fragmented and historically has consisted of a large number of small, privately-owned businesses and a small number of large, full-service wholesale distributors serving multiple geographic regions. Relative to smaller competitors, large national distributors such as Core-Mark benefit from several competitive advantages including: increased purchasing power, the ability to service large national chain accounts, economies of scale in sales and operations, and the resources to invest in information technology and other productivity-enhancing technologies. Our wholesale distributing capabilities provide valuable services to both manufacturers of consumer products and convenience retailers.
2
Manufacturers benefit from our broad retail coverage, inventory management, efficiency in processing small orders and frequency of deliveries. Convenience retailers benefit from our distribution capabilities by gaining access to a broad product line, optimizing inventory management and accessing trade credit.
Customers
We service approximately 45,000 customer locations in all 50 states in the U.S. and five Canadian provinces. Our primary customer base consists of traditional convenience stores, as well as alternative outlets selling consumer packaged goods. Our traditional convenience store customers include many of the major national and super-regional convenience store operators, as well as independently owned convenience stores. Our alternative outlet customers comprise a variety of store formats, including grocery stores, drug stores, big box or supercenter stores, liquor stores, cigarette and tobacco shops, hotel gift shops, military exchanges, college and corporate campuses, casinos, hardware stores, airport concessions and other specialty and small format stores that carry convenience products.
Our top ten customers accounted for 38.7% of our net sales in 2017 including Murphy U.S.A., our largest customer, which accounted for 12.2% of our total net sales.
Products
We purchase a variety of brand name and private label products, in excess of 55,000 stock keeping units ("SKUs"), from suppliers and manufacturers. Cigarette products represent less than 5% of our total SKUs purchased. We offer customers a variety of food/non-food products, including fast food, candy, snacks, groceries, fresh products, dairy, bread, beverages, other tobacco products, general merchandise, and health and beauty care products.
Below is a comparison of our net sales mix by primary product category for the last three years (in millions):
Year Ended December 31, | ||||||||||||||||||||
2017 | 2016 | 2015 | ||||||||||||||||||
Product Category | Net Sales | % of Net Sales | Net Sales | % of Net Sales | Net Sales | % of Net Sales | ||||||||||||||
Cigarettes | $ | 10,887.4 | 69.4 | % | $ | 10,335.7 | 71.1 | % | $ | 7,528.5 | 68.0 | % | ||||||||
Food | 1,561.1 | 10.0 | 1,422.5 | 9.8 | 1,251.1 | 11.3 | ||||||||||||||
Fresh | 436.3 | 2.8 | 389.8 | 2.7 | 335.0 | 3.0 | ||||||||||||||
Candy | 833.4 | 5.3 | 620.0 | 4.3 | 557.0 | 5.0 | ||||||||||||||
Other tobacco products ("OTP") | 1,272.3 | 8.1 | 1,133.8 | 7.8 | 870.3 | 8.0 | ||||||||||||||
Health, beauty & general | 513.3 | 3.3 | 446.7 | 3.1 | 368.8 | 3.3 | ||||||||||||||
Beverages | 183.4 | 1.1 | 176.5 | 1.2 | 156.6 | 1.4 | ||||||||||||||
Equipment/other | 0.4 | — | 4.4 | — | 2.1 | — | ||||||||||||||
Total food/non-food products | 4,800.2 | 30.6 | % | 4,193.7 | 28.9 | % | 3,540.9 | 32.0 | % | |||||||||||
Total net sales | $ | 15,687.6 | 100.0 | % | $ | 14,529.4 | 100.0 | % | $ | 11,069.4 | 100.0 | % | ||||||||
Cigarette Products. We purchase cigarette products from major U.S. and Canadian manufacturers. We have no long-term cigarette purchase agreements and buy substantially all of our products on an as-needed basis. Cigarette manufacturers historically offer structured incentive programs to wholesalers based on maintaining market share and executing promotional programs. Net sales of the cigarettes category grew 5.3% in 2017 to $10,887.4 million, accounting for approximately 69.4% of our total net sales and 27.0% of our total gross profit in 2017. We control major purchases of cigarettes centrally to optimize inventory levels and purchasing opportunities. Daily replenishment of inventory and brand selection is controlled by our distribution centers.
In 2017, our cigarette carton sales in the U.S. and Canada decreased 2.5% and 2.3%, respectively, caused by the expiration of distribution agreements with Kroger Convenience and with Circle K Corp. in the Southeastern Region of the U.S., increases in excise taxes in certain jurisdictions, and a general decline in carton sales to existing customers. These impacts were partially offset by the addition of Walmart in May 2017 and 7-Eleven in October 2016, and the acquisitions of Farner-Bocken in July 2017 and Pine State in June 2016. In the industry overall, U.S. and Canadian cigarette consumption steadily declined over the last decade. Based on data compiled from the U.S. Department of Agriculture - Economic Research Service and provided by the Tobacco Merchants Association ("TMA"), total cigarette consumption in the U.S. declined from 374 billion cigarettes in 2007 to 262 billion cigarettes in 2016, or a compounded annual decline of approximately 3.9%. Total cigarette consumption declined in Canada from 30 billion cigarettes in 2007 to 26 billion cigarettes in 2016, or a compounded annual decline of approximately 1.6% based on statistics provided by the TMA. Although we anticipate overall cigarette consumption will continue to decline, we expect to offset
3
these declines through market share expansion, growth in our non-cigarette categories and incremental gross profit from cigarette manufacturer price increases.
We expect cigarette manufacturers will continue to raise prices as carton sales decline in order to maintain or enhance their overall profitability.
Excise taxes are levied on cigarettes and other tobacco products by the U.S. and Canadian federal governments and are also imposed by various states, localities and provinces. We collect state, local, and provincial excise taxes from our customers and remit these amounts to the appropriate authorities based on the credit terms, if applicable, extended by each jurisdiction. Net sales and cost of sales included amounts related to state, local and provincial excise taxes were approximately $3.5 billion, $3.0 billion and $2.2 billion in 2017, 2016 and 2015, respectively.
Food/Non-food Products. Our food products include fast food, candy, snacks, groceries, beverages and fresh products such as sandwiches, juices, salads, produce, dairy and bread. Our non-food products include cigars, tobacco, health and beauty care products, general merchandise and equipment. Net sales of the combined food/non-food product categories grew 14.5% in 2017 to $4,800.2 million, which was 30.6% of our total net sales, driven primarily by incremental sales to existing customers and market share gains including Walmart and the acquisition of Farner-Bocken. The increase in candy was driven primarily by sales to Walmart, which we began servicing in May 2017. Sales generated from Fresh, VCI and FMI were the primary drivers of increased sales to existing customers. Our OTP and Health, beauty & general categories continued to benefit from higher sales of smokeless tobacco and e-cigarettes products, respectively, which we believe will be a continuing trend. Gross profit for food/non-food categories grew $61.0 million, or 11.8%, to $577.8 million in 2017, which was 73.0% of our total gross profit. Our strategy is to continue to grow sales of food/non-food products through our Fresh, VCI and FMI strategies. In order to take advantage of the significantly higher margins earned by food/non-food products, two of our key business strategies, Fresh and VCI, focus primarily on the highest margin categories in the food/non-food group. We believe there is an increasing trend toward purchases of fresh food from convenience and other retail store formats. Combined sales of our Food and Fresh categories grew $185.1 million, or 10.2%, to $1,997.4 million in 2017. Sales of OTP increased $138.5 million, or 12.2%, while the Health, beauty and general category increased $66.6 million or 14.9%, driven primarily by this trend, as well as market share gains.
Suppliers
We purchase products for resale from approximately 5,300 trade suppliers and manufacturers located across the U.S. and Canada. In 2017, we purchased approximately 81% of our products from our top 20 suppliers, with our top two suppliers, Philip Morris USA, Inc. and R.J. Reynolds Tobacco Company, accounting for approximately 35% and 23% of our purchases, respectively. We coordinate our purchasing from suppliers by negotiating, on a Company-wide basis, special arrangements to obtain volume discounts and additional incentives, while also taking advantage of promotional and marketing incentives offered to us as a wholesale distributor. In addition, buyers in each of our distribution facilities purchase products directly from manufacturers, improving product mix and availability for individual markets.
4
Operations
As of December 31, 2017, we operated a network of 32 primary distribution centers in the U.S. and Canada (excluding two distribution facilities we operate as a third-party logistics provider). Twenty-seven of our distribution centers are located in the U.S. and five are located in Canada.
The map below depicts the scope of our operations and the names of our distribution centers.
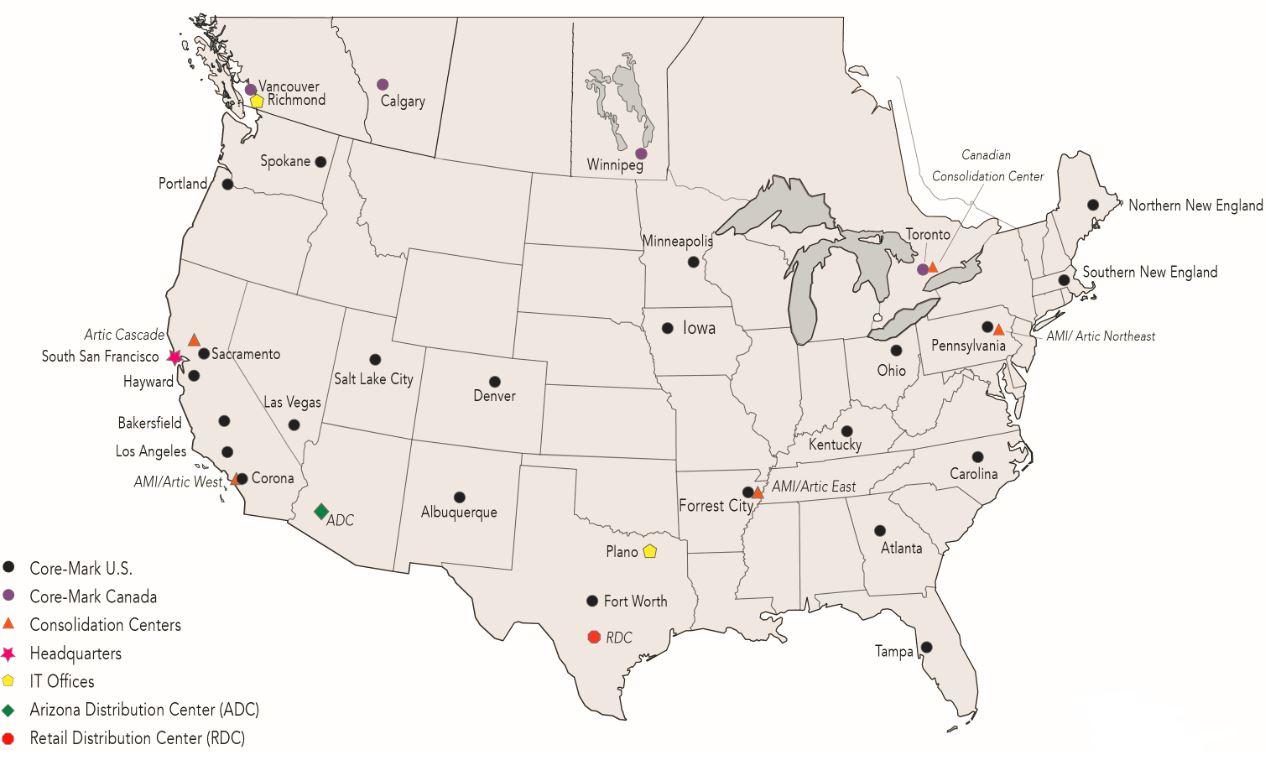
We operate five consolidation centers which buy products from our suppliers in bulk quantities and then redistribute the products to many of our other distribution centers. The products purchased by our consolidation centers may include frozen and chilled items, candy, snacks, beverages, health and beauty care and general merchandise products. We operate two additional facilities as a third-party logistics provider dedicated solely to supporting the logistics and management requirements of one of our major customers, Alimentation Couche-Tard, Inc. ("Couche-Tard"). One distribution facility located in Phoenix, Arizona, is referred to as the Arizona Distribution Center. The other distribution facility located in San Antonio, Texas, is referred to as the Retail Distribution Center.
Our proprietary Distribution Center Management System platform provides our distribution centers with the flexibility to adapt rapidly to changing business needs and allows them to provide our customers with necessary information technology requirements and integration capabilities.
Distribution
As of December 31, 2017, we employed approximately 2,100 transportation department personnel, including delivery drivers, shuttle drivers, routers, training supervisors and managers, all of whom focus on achieving safe, on-time deliveries. Our daily orders are picked and loaded nightly in reverse order of scheduled delivery. At December 31, 2017, our distribution fleet primarily consisted of approximately 1,500 leased tractors and trailers with over 1,300 additional owned tractors and trailers. We have made a significant investment in recent years to upgrade our trailer fleet to tri-temp, which gives us the capability to deliver frozen, chilled and non-refrigerated goods in one delivery. Excluding the fleet of trucks and trailers acquired from the acquisition of Farner-Bocken, 100% of our trailers were tri-temp as of December 31, 2017 This provides us the multiple temperature zone capability needed to support our focus on delivering fresh products to our customers.
As of December 31, 2017, approximately 16% of our trucks ran on Compressed Natural Gas ("CNG"), which allows us to reduce our carbon footprint and lower our transportation costs. To date, we have opened seven CNG stations, two of which we
5
own, located in Wilkes-Barre, Pennsylvania and Corona, California, and the other five are operated in partnership with U.S. Oil and are located in Aurora, Colorado, Forrest City, Arkansas, Sanford, North Carolina, Atlanta, Georgia and Tampa, Florida under the name GAIN Clean Fuel ("GAIN"). In addition to providing fuel to our fleet, the GAIN stations are also open to other public fleets for fueling.
Competition
Competition within the industry is based primarily on the range and quality of the services provided, price, product selection and the reliability of wholesalers’ logistics as well as proximity to the customer's stores. We operate from a perspective that focuses heavily on flexibility and providing outstanding customer service through our distribution centers, order fulfillment rates, on-time delivery, innovative marketing solutions and merchandising support as well as competitive pricing.
Core-Mark is one of the two largest wholesale convenience distributors (measured by annual sales) serving North America. We service both convenience store chain customers and independent operators with ten or fewer stores which comprise approximately 66% of the convenience retail store market. The McLane Company, Inc., a subsidiary of Berkshire Hathaway Inc., our largest competitor focuses on servicing large regional or national convenience store chains as well as our chain customers in other trade channels. There are two other large companies that cover the eastern half of the U.S: The H.T. Hackney Company and the Eby-Brown Company. In addition, there are hundreds of local distributors serving small regional chains and independent convenience retailers. In Canada, in addition to Core-Mark, several companies make-up the competitive landscape. Wallace & Carey, Inc., has national distribution capabilities. Pratts Wholesale Limited, regionally serves the Manitoba, Saskatchewan, and Alberta markets. Sobeys Inc. is a large national convenience store and grocery wholesaler.
Beyond the traditional wholesale supply channels, we face potential competition from at least three other supply avenues. First, certain consumer product manufacturers such as Anheuser-Busch Companies, Inc., MillerCoors LLC, The Coca-Cola Company, Frito-Lay, Inc., a division of PepsiCo, Inc. ("PepsiCo") and PepsiCo deliver their products directly to convenience retailers. Secondly, club wholesalers such as Costco Wholesale Corporation and Sam’s West, Inc. ("Sam's Club") provide a limited selection of products at generally competitive prices; however, they often have limited delivery options and limited services. Finally, some large convenience retail chains self-distribute products due to the geographic density of their stores and their belief that they can economically service such locations.
We face competition from the diversion into the U.S. and Canadian markets of cigarettes intended for sale outside of these markets, including the sale of cigarettes in non-taxable jurisdictions, inter-state/provincial and international smuggling of cigarettes, the sale of counterfeit cigarettes by third parties, increased imports of foreign low priced brands, the sale of cigarettes by third parties over the internet and by other means designed to avoid collection of applicable taxes. The competitive environment has been characterized by a continued influx of cheap products and tobacco alternatives, including electronic cigarettes that challenge sales of higher priced and fully taxed cigarettes.
Working Capital Practices
We sell products on credit terms to our customers that averaged, as measured by days sales outstanding, about nine days for each of 2017, 2016 and 2015. Credit terms may impact pricing and are competitive within our industry. Many of our customers remit payment electronically, which facilitates efficient and timely monitoring of payment risk. Canadian days sales outstanding in receivables tend to be lower as Canadian industry practice is for shorter credit terms than in the U.S.
We maintain our inventory of products based on the level of sales of the particular product and manufacturer replenishment cycles. The number of days a particular item of inventory remains in our distribution centers varies by product and is principally driven by the turnover of that product and economic order quantities. We typically order and carry in inventory additional amounts of certain critical products to assure high order fulfillment levels for these items. Periodically, we may carry higher levels of inventory to take advantage of anticipated manufacturer price increases. The number of days of cost of sales in inventory averaged about 16 days, 15 days, and 16 days, in 2017, 2016 and 2015, respectively. The cigarette category averaged eleven days, nine days, and ten days, in 2017, 2016 and 2015, respectively. The food/non-food categories averaged 29 days, 27 days and 29 days in 2017, 2016 and 2015, respectively.
We obtain terms from our vendors and certain taxing jurisdictions based on industry practices, consistent with our credit standing. We take advantage of the full complement of term offerings, which may include enhanced cash discounts for earlier payment or prepayment. Terms for our accounts payable and cigarette and tobacco taxes payable range anywhere from two days prepaid to 60 days credit. Days payable outstanding for both categories, excluding the impact of prepayments, during each of 2017, 2016 and 2015 averaged 11 days.
6
Employees
The following chart provides a breakdown of our employees by function and geographic region (including employees at our third-party logistics facilities) as of December 31, 2017:
TOTAL EMPLOYEES BY BUSINESS FUNCTION
U.S. | Canada | Total | ||||||
Sales and Marketing | 1,542 | 106 | 1,648 | |||||
Warehousing and Distribution | 5,284 | 390 | 5,674 | |||||
Management, Administration, Finance and Purchasing | 941 | 150 | 1,091 | |||||
Total for all categories | 7,767 | 646 | 8,413 | |||||
Four of our distribution centers, Hayward, Las Vegas, Los Angeles and Calgary, have employees who are covered by collective bargaining agreements with local affiliates of The International Brotherhood of Teamsters (Hayward, Las Vegas and Los Angeles) and the United Food and Commercial Workers International Union (Calgary). Approximately 400 employees, or 5% of our workforce, are unionized. There have been no disruptions in customer service, strikes, work stoppages or slowdowns as a result of union activities, and we believe we have satisfactory relations with our employees.
Regulation
As a distributor of food products in the U.S., we are subject to the Federal Food, Drug and Cosmetic Act and regulations promulgated by the U.S. Food and Drug Administration ("FDA"). In Canada, similar standards related to food and over-the-counter medications are governed by Health Canada. The products we distribute are also subject to federal, state, provincial and local regulation through such measures as: the licensing of our facilities; enforcement by state, provincial and local health agencies of relevant standards for the products we distribute; and regulation of our trade practices in connection with the sale of our products. Our facilities are inspected periodically by federal, state, provincial and local authorities, including the Occupational Safety and Health Administration ("OSHA") under the U.S. Department of Labor, which require us to comply with certain health and safety standards to protect our employees.
We are also subject to regulation by the U.S. and Canadian Departments of Transportation, which regulate transportation of perishable goods, and similar state, provincial and local agencies. Our distribution centers in the U.S. and Canada are subject to a broad spectrum of federal, state, provincial and local environmental protection statutes including those that govern emissions to air, soil and water, and the disposal of hazardous substances.
Our policy is to comply with all regulatory and legal requirements, and management is not aware of any related issues that may have a material effect upon our business, financial condition or results of operations.
Registered Trademarks
We have registered trademarks including the following: Arcadia Bay®, Arcadia Bay Coffee Company®, Cable Car®, Core-Mark®, Core Solutions Group®, EMERALD®, Java Street®, SmartStock®, Pine State Convenience®, Taco Depot® and Farner-Bocken®.
Segment and Geographic Information
We have two operating segments which aggregate into one reportable segment. We also present certain financial information by operating segment region -- the U.S. and Canada. See Note 16 - Segment and Geographic Information to our consolidated financial statements.
Seasonality
We typically generate higher net sales and gross profits during the warm weather months (April through September) than other times of the year. We believe this occurs because the convenience store industry tends to be busier due to timing of vacations and an increase in travel during this period.
Corporate and Contact Information
Our corporate headquarters is located at 395 Oyster Point Boulevard, Suite 415, South San Francisco, California, 94080 and our telephone number is (650) 589-9445.
7
Our website address is www.core-mark.com. We provide free access to various reports that we file with or furnish to the U.S. Securities and Exchange Commission ("SEC") through our website, as soon as they have been filed or furnished. These reports include, but are not limited to, our annual reports on Form 10-K, quarterly reports on Form 10-Q, current reports on Form 8-K and any amendments to those reports. Our SEC reports can be accessed through the “Investors” section of our website under “Financials & Filings,” or through www.sec.gov.
Also available on our website are printable versions of Core-Mark’s Audit Committee Charter, Compensation Committee Charter, Nominating and Corporate Governance Committee Charter, Code of Business Conduct and Ethics, Corporate Governance Guidelines and Principles and other corporate information. Copies of these documents may also be requested from:
Core-Mark Holding Company, Inc.
395 Oyster Point Blvd, Suite 415
South San Francisco, CA 94080
Attention: Investor Relations
Code of Business Conduct and Ethics and Whistle Blower Policy
Our Code of Business Conduct and Ethics is designed to promote honest, ethical and lawful conduct by all employees, officers and directors and is available on the “Investors” section of our website at www.core-mark.com under “Corporate Governance.”
Additionally, the Audit Committee of the Board of Directors of Core-Mark has established procedures to receive, retain, investigate and act on complaints and concerns of employees, stockholders and others regarding accounting, internal accounting controls and auditing matters, including complaints regarding attempted or actual circumvention of internal accounting controls or complaints regarding violations of our accounting policies. The procedures are also described on our website at www.core-mark.com under “Corporate Governance” in the “Investors” section.
8
ITEM 1A. RISK FACTORS
Our business is subject to a variety of risks. Set forth below are certain of the important risks that we face, the occurrence of which may have a material effect on our business, financial condition or results of operations.
Risks Related to Our Business and Industry
We are dependent on the convenience retail industry, and our results of operations could suffer if it experiences an overall decline or consolidation.
The majority of our sales are generated from convenience retail stores which inherently involve industry-specific risks. These risks include: declining sales in the convenience retail industry due to general economic conditions, including rising energy and fuel costs, which may impact “in-store” retail sales; competition from internet retailers such as Amazon, club stores, grocery stores, dollar stores and other retail outlets; termination of customer relationships and consolidation of our customer base. Such events could cause us to experience decreases in revenues, put pressure on our margins and increase our credit risk and potential bad debt exposure.
We depend on attracting and retaining qualified labor including our senior management and other key personnel.
We depend on the continued services and performance of our senior executive officers as named in our Proxy Statement and other key employees. We do not maintain key person life insurance policies on these individuals, and we do not have employment agreements with any of them. The loss of the services of one or more of our senior executive officers or other key personnel could harm our business.
We compete with other businesses in each of our markets to attract and retain qualified employees. A shortage of qualified employees, especially drivers, in any given market could require us to enhance our wage and benefit packages in order to compete effectively in the hiring and retention of qualified employees or to hire more expensive temporary employees in the affected market. Any such shortage of qualified employees could decrease our ability to effectively serve our customers and might lead to lower profits due to higher labor costs.
Our ability to meet our labor needs is generally subject to numerous other external factors, including prevailing wage rates, changing demographics, health and other insurance costs, and adoption of new or revised employment and labor laws and regulations. These external factors could prevent us from locating, attracting or retaining qualified personnel, which could adversely impact the quality of the services we provide to our customers, as well as our financial performance.
Our sales volume is largely dependent upon the distribution of cigarettes, sales of which are declining generally.
The distribution of cigarettes is currently a significant portion of our business. In 2017, approximately 69.4% of our net sales (including excise taxes) and 27.0% of our gross profit were generated from the distribution of cigarettes. Due to increases in the prices of cigarettes, restrictions on cigarette manufacturers’ marketing and promotions, increases in cigarette regulation and excise taxes, health concerns, increased pressure from anti-tobacco groups, the rise in popularity of tobacco alternatives, including electronic cigarettes, and other factors, cigarette consumption in the U.S. and Canada has been declining gradually over the past few decades. In most instances, tobacco alternatives, such as electronic cigarettes, are not subject to federal, state, provincial and local excise taxes like the sale of conventional cigarettes or other tobacco products. We expect consumption trends of legal cigarette products will continue to be negatively impacted by the factors described above. In addition, we expect rising prices may lead to a higher percentage of consumers purchasing cigarettes through illicit markets, over the internet and by other means designed to avoid payment of cigarette taxes. If we are unable to sell other products to make up for these declines in cigarette unit sales, our operating results may suffer.
Many of the markets in which we compete are highly competitive and we may lose market share and suffer a decline in sales and profitability in these markets if we are unable to outperform our competition.
Our distribution centers operate in highly competitive markets. A substantial amount of our sales are made under purchase orders and short-term contracts with convenience retail stores which inherently involve significant risks. We face competition from local, regional and national tobacco and consumable products distributors on the basis of service, price, reliability, delivery schedules, and variety of products offered. We also face competition from club stores, dollar stores and alternate sources that sell consumable products to convenience retailers. Some of our competitors, including The McLane Company, Inc. (a subsidiary of Berkshire Hathaway Inc.), have substantial financial resources and long-standing customer relationships. In addition, heightened competition among our existing competitors, or by new entrants into the distribution market, could create additional competitive pressures that may result in the loss of major customers, reduced margins, or other adverse effects on our business. If we fail to successfully respond to these competitive pressures or to implement our strategies effectively, we may lose market share, and our results of operations could suffer.
9
Our ability to operate effectively could be impaired by the risks and costs associated with expansion activities.
Our business has expanded rapidly and market share growth is one of our key company initiatives. To accomplish this growth, we have focused on strategic acquisitions and securing large regional and national customers as key elements of success. Any significant expansion activity comes with inherent risks. Acquisitions may entail various risks, such as identifying suitable candidates, realizing acceptable rates of return on investment, identifying potential liabilities, obtaining adequate financing, negotiating acceptable terms and conditions, and successfully integrating operations and converting systems post acquisition. Integrating a large new customer has similar risks related to realizing acceptable returns on invested working capital and negotiating acceptable pricing and service levels, while managing resources and business interruptions as we integrate the new business into our current infrastructure. We may realize higher costs, lower margins or fewer benefits than originally anticipated and may experience disruption to our base business in connection with such acquisitions and other new customer integration activities.
Our failure to maintain relationships with large customers could potentially harm our business.
We have relationships with many large regional and national convenience and other store chains. While we expect to maintain these relationships for the foreseeable future, any termination, non-renewal or reduction in services that we provide to such customers could cause our revenues and operating results to suffer.
We may lose business if manufacturers or large retail customers convert to direct distribution of their products.
In the past, certain large manufacturers and customers have elected to engage in direct distribution or third-party distribution of their products and ceased relying on wholesale distributors such as Core-Mark. Similarly, manufacturers or other providers may choose to move their product distribution to Amazon or other e-commerce providers. If other manufacturers or retail customers make similar elections in the future, our revenues and profits would be adversely affected and there can be no assurance that we will be able to mitigate such losses.
Our business is sensitive to fuel prices and related transportation costs, which could adversely affect our business.
Our operating results may be adversely affected by unexpected increases in fuel or other transportation-related costs, including costs from the use of third-party carriers, temporary staff and overtime. Historically, we have been able to pass on a substantial portion of increases in our own fuel or other transportation costs to our customers in the form of fuel or delivery surcharges, but our ability to continue to pass through these increases is not assured. If we are unable to continue to pass on fuel and transportation-related cost increases to our customers, do not realize the benefits we expect from converting a large percentage of our trucks to operate on natural gas or incur higher expenses due to decreases in diesel fuel prices that are not matched by similar decreases in natural gas prices, our operating results could be negatively affected.
Our information technology systems may be subject to failure, disruptions, security breaches (such as malware, viruses, hacking or other cyber-attacks) which could compromise our ability to conduct business, seriously harm our business and adversely affect our financial results.
Our business is highly dependent on our enterprise information technology systems. We rely on our information technology systems and our information technology staff to maintain the information required to operate our distribution centers and to provide our customers with fast, efficient and reliable deliveries. We continue to take steps to increase redundancy in our information technology systems and have disaster recovery plans in place to mitigate events that could disrupt our systems’ service. However, if our systems fail or are not reliable, we may suffer disruptions in service to our customers and our results of operations could suffer.
In addition, we retain sensitive data, including intellectual property, proprietary business information and personally identifiable information, in our secure data centers and on our networks. As the number of global cyber-attacks continue to escalate, we may face increased threats of unauthorized access, security breaches and other system disruptions to our data centers and networks. To help mitigate the risk, we utilize the expertise of our internal and external security resources to monitor our environment and work to install/upgrade tools that protect our systems and data. However, despite these measures, our infrastructure may be vulnerable to attacks by experienced hackers or other disruptive events.
Computer malware, viruses, hacking and other cyber-attacks have become more prevalent and may occur on our systems in the future. Intruders may also take the form of parties that attempt to fraudulently induce employees or other users of our systems to disclose sensitive or confidential information or otherwise disrupt operations. Any such security breach may compromise information stored on our networks and may result in significant data losses or theft of intellectual property, proprietary business information or personally identifiable information belonging to us or our customers, business partners or employees. Though it is difficult to determine what, if any, harm may directly result from any specific interruption or attack, any failure to maintain performance, reliability and security affects the availability of our technical infrastructure and technology-based services. Any such failure may harm our reputation and our ability to retain existing customers and attract new customers and could impact our
10
results of operation. We attempt to address these risks, in part, by continuously providing communications to our employees regarding the characteristics of phishing attempts and are increasing the level of awareness training across the Company.
Cigarette and consumable goods distribution is a low-margin business sensitive to inflation and deflation.
We derive most of our revenues from the distribution of cigarettes, other tobacco products, candy, snacks, fast food, groceries, fresh products, dairy, beverages, general merchandise and health and beauty care products. Our industry is characterized by a high volume of sales with low profit margins. Our food/non-food sales are generally priced based on the manufacturer’s cost of the product plus a percentage markup. As a result, our profit levels may be negatively impacted during periods of cost deflation or stagnation for these products, even though our gross profit as a percentage of the price of goods sold may remain relatively constant. In addition, periods of product cost inflation may have a negative impact on our gross profit margins with respect to sales of cigarettes because gross profits on cigarette sales are generally fixed on a cents per carton basis. Therefore, as cigarette prices increase, gross profit generally decreases as a percentage of sales. In addition, if the cost of the cigarettes that we purchase increases due to manufacturer price increases, reduced or eliminated manufacturer discounts and incentive programs, or increases in applicable excise tax rates, our inventory carrying costs and accounts receivable could rise, placing pressure on our working capital requirements.
We rely on manufacturer discount and incentive programs and cigarette excise stamping allowances, and any material changes in these programs could adversely affect our results of operations.
We receive payments from manufacturers on the products we distribute for allowances, discounts, volume rebates and other merchandising and incentive programs. These payments are a substantial contributor to our gross profit. The amount and timing of these payments are affected by changes in the programs by manufacturers, our ability to sell specified volumes of a particular product, attaining specified levels of purchases by our customers and the duration of carrying a specified product. In addition, we receive discounts from certain taxing jurisdictions in connection with the collection of excise taxes. If manufacturers or taxing jurisdictions change or discontinue these programs or change the timing of payments, or if we are unable to maintain the volume of our sales required by such programs, our results of operations could be negatively affected.
We depend on relatively few suppliers for a large portion of our products, and any interruptions in the supply of the products that we distribute could adversely affect our results of operations.
We obtain the products we distribute from third-party suppliers. At December 31, 2017, we had approximately 5,300 vendors and during 2017 we purchased approximately 81% of our products from our top 20 suppliers, with purchases from our top two suppliers, Philip Morris USA, Inc. and R.J. Reynolds Tobacco Company, representing approximately 35% and 23% of our purchases, respectively. We do not have any long-term contracts with our suppliers committing them to provide products to us. Our suppliers may not provide the products we distribute in the quantities we request on favorable terms, or at all. We are also subject to delays caused by interruptions in production due to conditions outside our control, such as slow-downs or strikes by employees of suppliers, inclement weather, transportation interruptions, regulatory requirements and natural disasters. Our inability to obtain adequate supplies of the products we distribute could cause us to fail to meet our contractual and other obligations to our customers and reduce the volume of our sales and profitability.
We may be subject to product liability claims and counterfeit product claims which could materially adversely affect our business.
As a distributor of food and consumer products, we face the risk of exposure to product liability claims in the event that the use of a product sold by us causes injury or illness. In addition, certain products that we distribute may be subject to counterfeiting. Our business could be adversely affected if consumers lose confidence in the safety and quality of the food and other products we distribute. Further, our operations could be subject to disruptions as a result of manufacturer recalls. This risk may increase as we continue to expand our distribution of fresh products. If we do not have adequate insurance, if contractual indemnification from the supplier or manufacturer of the defective, contaminated or counterfeit product is not available, or if a supplier or manufacturer cannot fulfill its indemnification obligations to us, the liability relating to such product claims or disruption as a result of recall efforts could adversely impact our results of operations.
We may not be able to achieve the expected benefits from the implementation of marketing initiatives.
We are continuously improving our competitive performance through a series of strategic marketing initiatives, such as Focused Marketing Initiative, SmartStock and Vendor Consolidation Initiative. The goal of this effort is to develop and implement a comprehensive and competitive business strategy, addressing the special needs of the convenience industry environment, increasing our market position within the industry and ultimately creating increased stockholder value. Customer acceptance of our new marketing initiatives may not be as anticipated or competitive pressures may cause us to curtail or abandon these initiatives, resulting in lower revenue growth and unachieved cost savings.
11
Maintaining our brand and reputation is necessary for the success of our business.
Our established brand and reputation within the market largely contributes to our success. Our current and future business could be negatively impacted if we were poorly represented or garnered negative publicity through various media channels, which include but are not limited to print, broadcast, web-based, and social media. Brand value is based in large part on perceptions of subjective qualities, and even isolated incidents can erode trust and confidence, particularly if they result in adverse publicity, governmental investigations or litigation. Even if the aforementioned situations were unfounded or not material to our business, these events could still decrease demand for our products and services and erode customer confidence. If any of these events were to occur, they could have a negative impact on our results of operations and financial condition.
We may be subject to various claims and lawsuits that could result in significant expenditures.
The nature of our business exposes us to the potential for various claims and litigation related to labor and employment, personal injury, property damage, business practices, environmental liability and other matters. Any material litigation or a catastrophic accident or series of accidents could have a material adverse effect on our business, financial position, results of operations and cash flows.
Unions may attempt to organize our employees.
As of December 31, 2017, approximately 400 or 5%, of our employees were covered by collective bargaining agreements with labor organizations, under agreements that expire at various times. We cannot assure that we will be able to renew our respective collective bargaining agreements on favorable terms, that employees at other facilities will not unionize or that our labor costs will not increase. In addition, the United States National Labor Relations Board is becoming more active with the passage of administrative rules that could impact our ability to manage our labor force and wage successful campaigns preventing further unionization of our employees. To the extent we suffer business interruptions as a result of strikes or other work stoppages or slow-downs, or our labor costs increase and we are not able to recover such increases through increased prices charged to customers or offsets by productivity gains, our results of operations could be materially adversely affected.
Employee health benefit costs represent a significant expense to us and may negatively affect our profitability.
With over 6,000 employees and their families participating in our health plans, our expenses relating to employee health benefits are substantial. In past years, we have experienced significant increases in certain of these costs, largely as a result of economic factors beyond our control, including, in particular, ongoing increases in health care costs well in excess of the rate of inflation. Increased participation in our health plans, continued increasing health care costs, as well as changes in laws, regulations and assumptions used to calculate health and benefit expenses, may adversely affect our business, financial position and results of operations. In addition, the Patient Protection and Affordable Care Act ("ACA") may continue to increase our employee healthcare-related costs. We have migrated a significant number of employees to our high deductible plan, resulting in a reduction in our claims exposure and offsetting other costs related to ACA. While we have taken steps to minimize the impact of ACA, there is no guarantee our efforts will be successful.
Changes to minimum wage laws and other governmental legislation or regulations could increase our costs substantially.
As of December 31, 2017, we had no employees who were paid under the minimum wage in their respective locations. Several bills have been introduced in the U.S. legislature over the past few years to increase the federal minimum wage. In addition, certain states have adopted or are considering adopting minimum wage statutes that exceed the federal minimum wage rate. Any increases in federal or state minimum wages could require us to increase the wages paid to our minimum wage employees and create pressure to raise wages for other employees who already earn above-minimum wages. Further, changes to wage and hour laws and/or new legislation increasing mandatory paid leave can add costs to our business. If we are unable to pass these additional labor costs on to our customers in the form of increased prices or surcharges, our business and results of operations would be adversely affected.
If we are unable to comply with governmental regulations that affect our business or if there are substantial changes in these regulations, our business could be adversely affected.
As a distributor of food and other consumable products, we are subject to regulation by the FDA, Health Canada and similar regulatory authorities at the federal, state, provincial and local levels. In addition, our employees operate tractor trailers, trucks, forklifts and various other powered material handling equipment, and we are therefore subject to regulation by the U.S. and Canadian Departments of Transportation. Our operations are also subject to regulation by OSHA, the U.S. Drug Enforcement Administration and a myriad of other federal, state, provincial and local agencies. Each of these regulatory authorities has broad administrative powers with respect to our operations. Regulations, and the costs of complying with those regulations, have been increasing in recent years. If we fail to adequately comply with government regulations, we could experience increased inspections or audits, regulatory authorities could take remedial action including imposing fines or shutting down our operations, or we could be subject to increased compliance costs. If any of these events were to occur, our results of operations would be adversely affected.
12
Natural disaster damage could have a material adverse effect on our business.
Our headquarters and several of our warehouses in California, and one warehouse located near Vancouver, British Columbia, Canada, are in or near high hazard earthquake zones. We also have operations in areas that have been affected by natural disasters such as hurricanes, tornados, floods, and ice and snow storms. While we maintain insurance to cover us for certain potential losses, our insurance may not be sufficient in the event of a significant natural disaster, or payments under our policies may not be received timely enough to prevent adverse impacts on our business. Our customers could also be affected by similar events, which could adversely affect our sales and results of operations.
Insurance and claims expenses could have a material adverse effect on us.
We have a combination of both self-insurance and high-deductible insurance programs for the risks arising out of the services we provide and the nature of our operations throughout North America, including claims exposure resulting from personal injury, property damage, business interruption and workers’ compensation. Workers’ compensation, automobile and general liabilities are determined using actuarial estimates of the aggregate liability for claims incurred and an estimate of incurred but not reported claims. Our accruals for insurance reserves reflect certain actuarial assumptions and management judgments, which are subject to a high degree of variability. If the number or severity of claims for which we are retaining risk increases, our financial condition and results of operations could be adversely affected. If we lose our ability to self-insure these risks, our insurance costs could materially increase and we may find it difficult to obtain adequate levels of insurance coverage.
Risks Related to the Distribution of Cigarettes and Other Tobacco Products
Legislation, regulation and other matters are negatively affecting the cigarette and tobacco industry.
The tobacco industry is subject to a wide range of laws and regulations regarding the marketing, distribution, sale, taxation and use of tobacco products imposed by governmental entities. Various jurisdictions have adopted or are considering legislation and regulations restricting displays and marketing of tobacco products, establishing fire safety standards for cigarettes, raising the minimum age to possess or purchase tobacco products, requiring the disclosure of ingredients used in the manufacture of tobacco products, imposing restrictions on public smoking, restricting the sale of tobacco products directly to consumers or other recipients over the internet and other tobacco product regulation. In addition, the FDA has been empowered to regulate changes to nicotine yields and the chemicals and flavors used in tobacco products (including cigars, pipe and e-cigarette products), require ingredient listings be displayed on tobacco products, prohibit the use of certain terms which may attract youth or mislead users as to the risks involved with using tobacco products, as well as limit or otherwise impact the marketing of tobacco products by requiring additional labels or warnings as well as pre-approval by the FDA. Such legislation and related regulation is likely to continue adversely impacting the market for tobacco products and, accordingly, our sales of such products.
In Canada, many provinces have enacted legislation authorizing and facilitating the recovery by provincial governments of tobacco-related health care costs from the tobacco industry by way of lawsuit. Some Canadian provincial governments have either already initiated lawsuits or indicated an intention that such lawsuits will be filed. It is unclear at this time how such restrictions and lawsuits may affect Core-Mark and its Canadian operations.
If excise taxes are increased or credit terms are reduced, our sales of cigarettes and other tobacco products could decline and our liquidity could be negatively impacted.
Cigarettes and tobacco products are subject to substantial excise taxes in the U.S. and Canada. Significant increases in cigarette-related taxes and/or fees have been proposed or enacted and are likely to continue to be proposed or enacted by various taxing jurisdictions within the U.S. and Canada as a means of increasing government revenues. These tax increases negatively impact consumption. Additionally, they may cause a shift in sales from premium brands to discount brands, illicit channels or tobacco alternatives, such as electronic cigarettes, as smokers seek lower priced options.
Taxing jurisdictions have the ability to change or rescind credit terms currently extended for the remittance of taxes that we collect on their behalf. If these excise taxes are substantially increased, or credit terms are substantially reduced, it could have a negative impact on our liquidity. Accordingly, we may be required to obtain additional debt financing, which we may not be able to obtain on satisfactory terms or at all.
Our distribution of cigarettes and other tobacco products exposes us to potential liabilities.
In June 1994, the Mississippi attorney general brought an action against various tobacco industry members on behalf of the state to recover state funds paid for health care costs related to tobacco use. Most other states sued the major U.S. cigarette manufacturers based on similar theories. In November 1998, the major U.S. tobacco product manufacturers entered into a Master Settlement Agreement ("MSA") with 46 states, the District of Columbia and certain U.S. territories. The other four states--Mississippi, Florida, Texas and Minnesota ("non-MSA states")--settled their litigations with the major cigarette manufacturers by separate agreements. The MSA and the other state settlement agreements settled health care cost recovery actions and monetary
13
claims relating to future conduct arising out of the use of, or exposure to, tobacco products, imposed a stream of future payment obligations on major U.S. cigarette manufacturers and placed significant restrictions on the ability to market and sell cigarettes. The payments required under the MSA result in higher pricing of products sold by the participating manufacturers than those sold by non-MSA state manufacturers. In addition, the growth in market share of discount brands since the MSA was signed has had an adverse impact on the total volume of the cigarettes that we sell.
In connection with the MSA, we were indemnified by most of the tobacco product manufacturers from which we purchased cigarettes and other tobacco products, for liabilities arising from our sale of the tobacco products that they supplied to us. Should the MSA ever be invalidated, we could be subject to substantial litigation due to our distribution of cigarettes and other tobacco products, and we may not be indemnified for such costs by the tobacco product manufacturers in the future. In addition, even if we are indemnified by cigarette manufacturers that are parties to the MSA, future litigation awards against such cigarette manufacturers could be so large as to prevent the manufacturers from satisfying their indemnification obligations.
Risks Related to Financial Matters, Financing and Foreign Exchange
Changes to federal, state or provincial income tax legislation could have a material adverse effect on our business and results of operations.
From time to time, new tax legislation is adopted by the federal government and various states or other regulatory bodies. Significant changes in tax legislation could adversely affect our business or results of operations in a material way. On December 22, 2017, the U.S. government enacted comprehensive tax legislation commonly referred to as the Tax Cuts and Jobs Act (the “TCJA”). The changes included in the TCJA are broad and complex. The final transition impacts of the TCJA may differ from the estimates provided elsewhere in this report, possibly materially, due to, among other things, changes in interpretations of the TCJA, any legislative action to address questions that arise because of the TCJA, any changes in accounting standards for income taxes or related interpretations in response to the TCJA, or any updates or changes to estimates the company has utilized to calculate the transition impacts, including impacts from changes to current year earnings estimates and foreign exchange rates of foreign subsidiaries. As these and other tax laws and related regulations change, our financial results could be materially impacted. For example, in the U.S. the federal government has in the past proposed legislation which effectively could limit, or even eliminate, use of the last-in, first-out ("LIFO") inventory method for financial and income tax purposes. Although the final outcome of any such proposals cannot be ascertained, the ultimate financial impact to us of the transition from LIFO to another inventory method could be material to our operating results. Given the unpredictability of possible changes and their potential interdependency, it is very difficult to assess whether the overall effect of such potential tax changes would be cumulatively positive or negative for our earnings and cash flow, but such changes could adversely impact our financial results.
There can be no assurance that we will continue to declare cash dividends in the future or in any particular amounts and if there is a reduction in dividend payments, our stock price may be harmed.
Since the fourth quarter of 2011, we have paid a quarterly cash dividend to our stockholders. We intend to continue to pay quarterly dividends subject to capital availability and periodic determinations by our Board of Directors that cash dividends are in the best interest of our stockholders and are in compliance with all applicable laws and agreements to which we are a party. Future dividends may be affected by a variety of factors such as available cash, anticipated working capital requirements, overall financial condition, credit agreement restrictions, future prospects for earnings and cash flows, capital requirements for acquisitions, stock repurchase programs, reserves for legal risks and changes in federal and state income tax or corporate laws. Our Board of Directors may, at its discretion, decrease or entirely discontinue the payment of dividends at any time. Any such action could have a material, negative effect on our stock price.
Currency exchange rate fluctuations could have an adverse effect on our revenues and financial results.
We generate a significant portion of our revenues in Canadian dollars, approximately 9% in 2017 and 10% in 2016. We also incur a significant portion of our expenses in Canadian dollars. To the extent that we are unable to match revenues received in Canadian dollars with costs paid in the same currency, exchange rate fluctuations in Canadian dollars could have an adverse effect on our financial results. During times of a strengthening U.S. dollar, our reported sales and earnings from Canadian operations will be reduced because the Canadian currency will be translated into fewer U.S. dollars. Conversely, during times of a weakening U.S. dollar, our reported sales and earnings from our Canadian operations will be increased because the Canadian currency will be translated into more U.S. dollars. U.S. GAAP requires that foreign currency transaction gains or losses on short-term intercompany transactions be recorded currently as gains or losses within the statement of operations. To the extent we incur losses on such transactions, our net income will be reduced. We currently do not hedge our Canadian foreign currency cash flows.
14
We may not be able to borrow additional capital to provide us with sufficient liquidity and capital resources necessary to meet our future financial obligations.
We expect that our principal sources of funds will be cash generated from our operations and, if necessary, borrowings under a $750 million revolving credit facility ("Credit Facility") as of December 31, 2017. On March 28, 2017, we entered into a tenth amendment to the Credit Facility which increased our Credit Facility from $600 million to $750 million. The Credit Facility, initially dated as of October 12, 2005, as amended or otherwise modified from time to time, is between us, as Borrowers, the Lenders named therein, and JPMorgan Chase Bank, N.A., as administrative agent. The Credit Facility expires in March 2022. While we believe our sources of liquidity are adequate, we cannot guarantee that these sources will be available or continue to provide us with sufficient liquidity and capital resources required to meet our future financial obligations, or to provide funds for our working capital, capital expenditures and other needs. As such, additional equity or debt financing sources may be necessary and we may not be able to expand our existing Credit Facility or obtain new financing on terms satisfactory to us.
Our operating flexibility is limited in significant respects by the restrictive covenants in our Credit Facility.
Our Credit Facility imposes restrictions on us that could increase our vulnerability to general adverse economic and industry conditions by limiting our flexibility in planning for and reacting to changes in our business and industry. Specifically, these restrictions place limits on our ability to, among other things, incur additional indebtedness, pay dividends, issue stock of subsidiaries, make investments, repurchase stock, create liens, enter into transactions with affiliates, merge or consolidate, or transfer and sell our assets. In addition, under our Credit Facility, under certain circumstances we are required to meet a fixed charge coverage ratio. Our ability to comply with this covenant may be affected by factors beyond our control and a breach of the covenant could result in an event of default under our Credit Facility, which would permit the lenders to declare all amounts incurred thereunder to be immediately due and payable and to terminate their commitments to make further extensions of credit.
Our actual business and financial results could differ as a result of the accounting methods, estimates and assumptions that we use in preparing our financial statements, which may negatively impact our results of operations and financial condition.
To prepare financial statements in conformity with GAAP, management is required to exercise judgment in selecting and applying accounting methodologies and making estimates and assumptions. These methods, estimates, and assumptions are subject to uncertainties and changes, which affect the reported values of assets and liabilities, revenues and expenses, and disclosures of contingent assets and liabilities. Areas requiring significant estimation by our management include but are not limited to the following: allowance for doubtful accounts, provisions for income taxes, vendor rebates and promotional allowances, valuation of goodwill and long-lived assets, valuation of assets and liabilities in connection with business combinations, valuation of pension assets and obligations, stock-based compensation expense and accruals for estimated liabilities including litigation and self-insurance reserves.
ITEM 1B. UNRESOLVED STAFF COMMENTS
None.
15
ITEM 2. PROPERTIES
Our headquarters are located in South San Francisco, California, and consist of approximately 31,800 square feet of leased office space. We also lease approximately 20,000 square feet for use by our information technology and tax personnel in Richmond, British Columbia, approximately 6,000 square feet for use by our information technology personnel in Plano, Texas, and approximately 5,500 and 2,000 square feet of additional office space in Fort Worth, Texas and Phoenix, AZ, respectively. We lease approximately 5.1 million square feet and own approximately 0.6 million square feet of distribution space.
Distribution Center Facilities by City and State/Province of Location(1) | ||
Albuquerque, New Mexico | Hayward, California | Tampa, Florida |
Atlanta, Georgia | Henderson, Nevada | Whitinsville, Massachusetts |
Bakersfield, California | Leitchfield, Kentucky | Wilkes-Barre, Pennsylvania(5) |
Carroll, Iowa | Los Angeles, California | Calgary, Alberta |
Corona, California(2) | Minneapolis, Minnesota | Mississauga, Ontario(6) |
Aurora, Colorado | Portland, Oregon | Milton, Ontario |
Forrest City, Arkansas(3) | Sacramento, California(4) | Burnaby, British Columbia |
Fort Worth, Texas | Salt Lake City, Utah | Winnipeg, Manitoba |
Gardiner, Maine | Sanford, North Carolina | |
Glenwillow, Ohio | Spokane, Washington | |
(1) | Excluding outside storage facilities or depots and two distribution facilities that we operate as a third-party logistics provider. Depots are defined as a secondary location for a division which may include any combination of sales offices, operational departments and/or storage. We own distribution center facilities located in Wilkes-Barre, Pennsylvania; Leitchfield, Kentucky; and Forrest City, Arkansas. All other facilities listed are leased. The facilities we own are subject to encumbrances under our Credit Facility. |
(2) | This location includes two facilities, a distribution center and our AMI consolidating warehouse. |
(3) | This facility includes a distribution center and our AMI-Artic East consolidating warehouse. |
(4) | This facility includes a distribution center and our Artic Cascade consolidating warehouse. |
(5) | This facility includes a distribution center and our AMI-Artic Northeast consolidating warehouse. |
(6) | This facility is our Canadian consolidating warehouse. |
We also operate distribution centers on behalf of one of our major customers, Alimentation Couche-Tard, Inc. (Couche-Tard): one in Phoenix, Arizona and one in San Antonio, Texas. Each facility is leased or owned by Couche-Tard for their use and operated by Core-Mark.
ITEM 3. | LEGAL PROCEEDINGS |
The Company is subject to certain legal proceedings, claims, investigations and administrative proceedings in the ordinary course of its business. The Company records a provision for a liability when it is both probable that the liability has been incurred and that the amount of the liability can be reasonably estimated. These provisions, if any, are reviewed at least quarterly and adjusted to reflect the impacts of negotiations, settlements, rulings, advice of legal counsel and other information and events pertaining to a particular case.
ITEM 4. MINE SAFETY DISCLOSURES
Not applicable.
16
PART II
ITEM 5. MARKET FOR REGISTRANT'S COMMON EQUITY, RELATED STOCKHOLDER MATTERS
AND ISSUER PURCHASES OF EQUITY SECURITIES
Market and Stockholders
Our common stock trades on the NASDAQ Global Market under the symbol “CORE.” According to the records of our transfer agent, we had 1,551 stockholders of record as of February 23, 2018.
The following table provides the range of high and low sales prices of our common stock as reported by NASDAQ and dividends declared per share for the periods indicated:
Market Prices | Dividend Declared | ||||||||||||||||||||||
2017 | 2016 | Year | |||||||||||||||||||||
Low Price | High Price | Low Price | High Price | 2017 | 2016 | ||||||||||||||||||
4th Quarter | $ | 29.06 | $ | 34.39 | $ | 33.24 | $ | 43.46 | $ | 0.10 | $ | 0.09 | |||||||||||
3rd Quarter | 26.28 | 37.96 | 35.16 | 48.96 | 0.09 | 0.08 | |||||||||||||||||
2nd Quarter | 30.23 | 36.72 | 38.26 | 46.86 | 0.09 | 0.08 | |||||||||||||||||
1st Quarter | 30.38 | 43.02 | 35.99 | 41.60 | 0.09 | 0.08 | |||||||||||||||||
We paid dividends of $17.2 million and $15.5 million in 2017 and 2016, respectively. Our Credit Facility, as of December 31, 2017, allows for unlimited dividends, as long as the Company meets certain credit availability percentages and fixed charge coverage ratios. (See Note 8 - Long-term Debt to our consolidated financial statements included in this Form 10-K for additional details on the Credit Facility). We intend to continue increasing our dividends per share over time; however, the payment of any future dividends will be determined by our Board of Directors in light of then existing conditions, including our earnings, financial condition and capital requirements, strategic alternatives, restrictions in financing agreements, business conditions and other factors.
17
PERFORMANCE COMPARISON
The graph below presents a comparison of cumulative total return to stockholders for Core-Mark’s common stock at the end of each year from 2012 through 2017, as well as the cumulative total returns of the NASDAQ Non-Financial Stock Index, the Russell 2000 Index, the Standard and Poor’s Small Cap 600 Index, and a peer group of companies ("Performance Peer Group").
Cumulative total return to stockholders is measured by the change in the share price for the period, plus any dividends, divided by the share price at the beginning of the measurement period. Core-Mark’s cumulative stockholder return is based on an investment of $100 on December 31, 2012, and is compared to the total return of the NASDAQ Non-Financial Stock Index, the Russell 2000 Index, the Standard and Poor’s Small Cap 600 Index, and the weighted-average performance of the Performance Peer Group over the same period with a like amount invested, including the assumption that any dividends have been reinvested. We regularly compare our performance to the Russell 2000 Index since it includes primarily companies with relatively small market capitalization similar to us.
The companies composing the Performance Peer Group are Sysco Corp. ("SYY"), The Chef’s Warehouse, Inc. ("CHEF"), United Natural Foods, Inc. ("UNFI") and AMCON Distributing Co. ("DIT").
COMPARISON OF CUMULATIVE TOTAL RETURN
AMONG CORE-MARK, NASDAQ NON-FINANCIAL STOCK, S&P SMALLCAP 600, RUSSELL 2000 INDEXES AND THE PERFORMANCE PEER GROUP
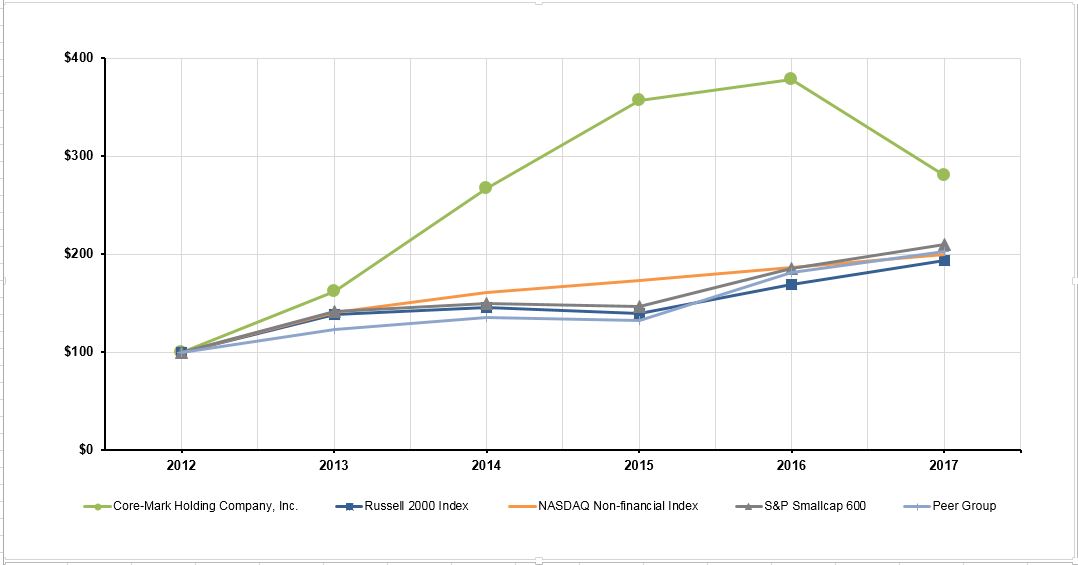
Investment Value at | ||||||||||||||||||||||||
12/31/12 | 12/31/13 | 12/31/14 | 12/31/15 | 12/31/16 | 12/31/17 | |||||||||||||||||||
CORE | $ | 100.00 | $ | 161.87 | $ | 267.03 | $ | 356.46 | $ | 377.87 | $ | 280.43 | ||||||||||||
Russell 2000 | $ | 100.00 | $ | 138.82 | $ | 145.62 | $ | 139.19 | $ | 168.85 | $ | 193.58 | ||||||||||||
NASDAQ Non-financial Index | $ | 100.00 | $ | 140.08 | $ | 161.21 | $ | 172.82 | $ | 186.04 | $ | 199.36 | ||||||||||||
S&P SmallCap 600 | $ | 100.00 | $ | 141.08 | $ | 149.45 | $ | 146.50 | $ | 185.40 | $ | 209.94 | ||||||||||||
Performance Peer Group | $ | 100.00 | $ | 122.53 | $ | 135.78 | $ | 132.37 | $ | 180.86 | $ | 202.40 | ||||||||||||
18
Issuer Purchases of Equity Securities
On August 28, 2017, the Company's Board of Directors authorized a new $40.0 million stock repurchase program (the "Program"). At the time of the approval, we had funds totaling $0.2 million remaining under our prior stock repurchase program which were subsequently retired unused. The timing, price and volume of purchases under the Program are based on market conditions, cash and liquidity requirements, relevant securities laws and other factors. The Program may be discontinued or amended at any time. The Program has no expiration date and terminates when the amount authorized has been expended or the Board withdraws its authorization. As of December 31, 2017, $37.8 million was available for future share repurchases under the Program.
In 2017, we repurchased 158,106 shares of common stock for a total cost of $4.4 million, or an average price of $28.11 per share. In 2016, under the prior program, we repurchased 237,869 shares of common stock for a total cost of $8.9 million, or an average price of $37.76 per share. As of December 31, 2017, we had $37.8 million available for future share repurchases under the program.
The following table provides the repurchases of shares of common stock during the three months ended December 31, 2017:
Calendar Month in which purchases were made: | Total Number of Shares Repurchased | Average Price Paid per Share(1) | Total Cost of Shares Purchased as Part of Publicly Announced Plans or Programs | Approximate Dollar Value of Shares that May Yet be Purchased Under the Plans or Programs (in millions) | |||||||||||
October 1, 2017 to October 31, 2017 | — | $ | — | $ | — | $ | 38.6 | ||||||||
November 1, 2017 to November 30, 2017 | 18,937 | 29.86 | 565,480 | 38.1 | |||||||||||
December 1, 2017 to December 31, 2017 | 7,500 | 30.23 | 226,714 | 37.8 | |||||||||||
Total repurchases for the three months ended December 31, 2017 | 26,437 | $ | 29.97 | $ | 792,194 | $ | 37.8 | ||||||||
_____________________________________________
(1) | Includes related transaction fees. |
19
ITEM 6. SELECTED FINANCIAL DATA
Basis of Presentation
The selected consolidated financial data for the five years from 2013 to 2017 are derived from our audited consolidated financial statements included in our Annual Reports on Form 10-K or Form 10-K/A. The following financial data should be read in conjunction with the consolidated financial statements and notes thereto and with Item 7 - Management’s Discussion and Analysis of Financial Condition and Results of Operations.
SELECTED CONSOLIDATED FINANCIAL DATA
Core-Mark Holding Company, Inc. | |||||||||||||||||||
Year Ended December 31, | |||||||||||||||||||
(in millions except per share amounts) | 2017(1) | 2016(2) | 2015(3) | 2014 | 2013 | ||||||||||||||
Statement of Operations Data: | |||||||||||||||||||
Net sales | $ | 15,687.6 | $ | 14,529.4 | $ | 11,069.4 | $ | 10,280.1 | $ | 9,767.6 | |||||||||
Gross profit (4) | 791.7 | 736.9 | 637.9 | 573.7 | 537.1 | ||||||||||||||
Warehousing and distribution expenses (4) | 504.1 | 431.2 | 352.6 | 318.4 | 297.1 | ||||||||||||||
Selling, general and administrative expenses | 241.5 | 210.3 | 196.0 | 184.4 | 168.3 | ||||||||||||||
Amortization of intangible assets | 8.5 | 5.3 | 2.6 | 2.6 | 2.7 | ||||||||||||||
Income from operations | 37.6 | 90.1 | 86.7 | 68.3 | 69.0 | ||||||||||||||
Interest expense, net (5) | 11.0 | 5.1 | 2.0 | 1.8 | 2.2 | ||||||||||||||
Foreign currency transaction (gains) losses | (1.8 | ) | (0.5 | ) | 1.8 | 0.1 | 0.8 | ||||||||||||
Benefit (provision) for income taxes (6) | 5.1 | (31.3 | ) | (31.4 | ) | (23.7 | ) | (24.4 | ) | ||||||||||
Net income | 33.5 | 54.2 | 51.5 | 42.7 | 41.6 | ||||||||||||||
Per Share Data: | |||||||||||||||||||
Basic net income per common share | $ | 0.72 | $ | 1.17 | $ | 1.12 | $ | 0.93 | $ | 0.91 | |||||||||
Diluted net income per common share | $ | 0.72 | $ | 1.17 | $ | 1.11 | $ | 0.92 | $ | 0.90 | |||||||||
Shares Used to Compute Net Income Per Share: | |||||||||||||||||||
Basic | 46.3 | 46.3 | 46.2 | 46.2 | 46.0 | ||||||||||||||
Diluted | 46.4 | 46.5 | 46.6 | 46.6 | 46.4 | ||||||||||||||
Cash Dividends Declared Per Common Share (7) | $ | 0.37 | $ | 0.33 | $ | 0.29 | $ | 0.23 | $ | 0.15 | |||||||||
Other Financial Data: | |||||||||||||||||||
Excise taxes (8) | $ | 3,462.6 | $ | 3,022.0 | $ | 2,211.7 | $ | 2,110.3 | $ | 2,050.8 | |||||||||
Cigarette inventory holding gains (9) | 16.1 | 15.3 | 10.1 | 8.2 | 9.0 | ||||||||||||||
Candy inventory holding gains (10) | — | — | — | 6.0 | — | ||||||||||||||
Cigarette tax stamp inventory holding gains, net (11) | — | — | 8.5 | — | — | ||||||||||||||
OTP tax items, net (12) | 3.3 | — | 1.7 | 7.5 | — | ||||||||||||||
LIFO expense (13) | 21.5 | 13.2 | 1.9 | 16.3 | 8.7 | ||||||||||||||
Depreciation and amortization (14) | 54.4 | 42.9 | 37.9 | 32.0 | 27.2 | ||||||||||||||
Stock-based compensation | 5.0 | 6.1 | 8.7 | 6.1 | 4.6 | ||||||||||||||
Capital expenditures (15) | 48.2 | 54.3 | 30.3 | 53.9 | 18.0 | ||||||||||||||
Adjusted EBITDA (non-GAAP)(16) | 135.7 | 152.3 | 135.2 | 122.7 | 109.5 | ||||||||||||||
December 31, | |||||||||||||||||||
2017 | 2016 | 2015 | 2014 | 2013 | |||||||||||||||
Balance Sheet Data: | |||||||||||||||||||
Total assets | $ | 1,782.5 | $ | 1,492.2 | $ | 1,077.3 | $ | 1,029.6 | $ | 956.8 | |||||||||
Long-term obligations (17) | 512.9 | 347.7 | 60.4 | 68.2 | 57.6 | ||||||||||||||
20
______________________________________________
(1) | Farner-Bocken Company was acquired in July 2017 and the results of operations have been included in the selected consolidated financial data since the date of the acquisition. |
(2) | Pine State Convenience was acquired in June 2016 and the results of operations have been included in the selected consolidated financial data since the date of the acquisition. |
(3) | Karrys Bros., Limited was acquired in February 2015 and the results of operations have been included in the selected consolidated financial data since the date of the acquisition. |
(4) | Gross profit represents the amount of profit after deductions, cost of goods sold, certain surcharges and other items from net sales. Additionally, warehousing and distribution expenses are not included as a component of our cost of goods sold. Accordingly, gross profit may not be comparable to those of other entities. |
(5) | Interest expense, net, is reported net of interest income. |
(6) | Benefit for income taxes for 2017 included a $14.6 million net income tax benefit as a result of the impacts of the 2017 Tax Cuts and Jobs Act. Refer to Note 10 (Income Taxes) for further discussion. |
(7) | On October 19, 2011, we announced the commencement of a quarterly dividend program. In lieu of the first quarter 2013 dividend, the Board of Directors declared an accelerated cash dividend of $0.05 per common share on December 20, 2012. |
(8) | State, local and provincial excise taxes (predominantly cigarettes and tobacco) paid by us are included in net sales and cost of goods sold. |
(9) | Cigarette inventory holding gains represent income related to cigarette inventories on hand at the time cigarette manufacturers increase their prices. Such increases are reflected in customer pricing for all subsequent sales, including sales of inventory on hand at the time of the increase. The higher gross profits are referred to as inventory holding gains. This income is not predictable and is dependent on inventory levels and the timing of manufacturer price increases. |
(10) | Candy inventory holding gains represent income related to candy inventories on hand at the time candy manufacturers increase their prices. Such increases are reflected in customer pricing for all subsequent sales, including sales of inventory on hand at the time of the increase. The higher gross profits are referred to as inventory holding gains. This income is not predictable and is dependent on inventory levels and the timing of manufacturer price increases. |
(11) | Cigarette tax stamp inventory holding gains represent income related to tax stamp inventories on hand that may be realized at the time taxing jurisdictions increase their excise taxes, depending on the statutory requirements relating to the inventory on hand at the time such excise tax increases. Such tax increases are reflected in customer pricing for all subsequent sales, including sales of inventory on hand at the time of the increase. The incremental gross profits resulting from such tax increases are referred to as inventory holding gains. Although we have realized a cigarette tax stamp inventory holding gain of $9.0 million, offset by $0.5 million in associated fees, in 2015, this income is not predictable and is dependent on inventory levels and the aforementioned statutory requirements. |
(12) | In 2017, we received OTP tax refunds of $3.9 million related to prior years’ taxes, offset by $0.6 million of related expenses. In 2015, we received OTP tax refunds of $1.8 million related to prior years’ taxes, offset by $0.1 million of related expenses. In 2014, we received OTP tax refunds of $9.0 million related to prior years’ taxes, offset by $1.0 million of related expenses and a probable OTP tax assessment of $0.5 million. |
(13) | The decrease in LIFO expense in 2015 was due primarily to a decrease in the Producer Price Index ("PPI") for certain product categories we use to measure food/non-food LIFO expense as published by the Bureau of Labor Statistics. |
(14) | Depreciation and amortization includes depreciation on property and equipment and amortization of purchased intangible assets. |
(15) | Capital expenditures in 2017 include expansion projects, including investments associated with our supply agreement with Walmart and maintenance investments. Capital expenditures in 2016 include leasehold improvements for a new building for our Las Vegas division and other building upgrades, as well as logistical equipment to accommodate new business. Capital expenditures in 2014 include costs for our new distribution center in Ohio. |
(16) | The following table provides the components of Adjusted EBITDA for each year presented (in millions): |
Year Ended December 31, | |||||||||||||||||||
2017 | 2016 | 2015 | 2014 | 2013 | |||||||||||||||
Net income | $ | 33.5 | $ | 54.2 | $ | 51.5 | $ | 42.7 | $ | 41.6 | |||||||||
Interest expense, net | 11.0 | 5.1 | 2.0 | 1.8 | 2.2 | ||||||||||||||
(Benefit) provision for income taxes | (5.1 | ) | 31.3 | 31.4 | 23.7 | 24.4 | |||||||||||||
Depreciation and amortization | 54.4 | 42.9 | 37.9 | 32.0 | 27.2 | ||||||||||||||
LIFO expense | 21.5 | 13.2 | 1.9 | 16.3 | 8.7 | ||||||||||||||
Stock-based compensation expense | 5.0 | 6.1 | 8.7 | 6.1 | 4.6 | ||||||||||||||
Foreign currency transaction (gains) losses, net | (1.8 | ) | (0.5 | ) | 1.8 | 0.1 | 0.8 | ||||||||||||
Pension Termination Settlement (1) | 17.2 | — | — | — | — | ||||||||||||||
Adjusted EBITDA (non-GAAP) | $ | 135.7 | $ | 152.3 | $ | 135.2 | $ | 122.7 | $ | 109.5 | |||||||||
______________________________________________
(1) In December 2017, the Company settled its qualified defined-benefit pension obligation, which resulted in a non-cash charge in SG&A expenses within the consolidated statements of operations related to unrecognized actuarial losses in Accumulated Other Comprehensive Income.
(17) | Includes amounts borrowed and long-term capital lease obligations. |
21
ITEM 7. | MANAGEMENT’S DISCUSSION AND ANALYSIS OF FINANCIAL CONDITION AND RESULTS OF OPERATIONS |
The following discussion and analysis of financial condition, results of operations, liquidity and capital resources should be read in conjunction with the accompanying audited consolidated financial statements and notes thereto that are included under Part II, Item 8, of this Form 10-K. Also refer to “Special Note Regarding Forward-Looking Statements,” which is included after Table of Contents in this Form 10-K. This discussion and analysis also includes non-GAAP financial measures that we believe provide important perspective in understanding trends that may impact our business. These non-GAAP financial measures are discussed, including reconciliation of these measures to GAAP, under "non-GAAP Financial Information" in this Item 7.
Our Business
Core-Mark is one of the largest marketers of fresh and broad-line supply solutions to the convenience retail industry in North America. We offer a full range of products, marketing programs and technology solutions to approximately 45,000 customer locations in the U.S. and Canada. Our customers include traditional convenience stores, drug stores, big box or supercenter stores, grocery stores, liquor stores, and other specialty and small format stores that carry convenience products. Our product offering includes cigarettes, other tobacco products (OTP), candy, snacks, fast food, groceries, fresh products, dairy, bread, beverages, general merchandise and health and beauty care products. We operate a network of 32 primary distribution centers in the U.S. and Canada (excluding two distribution facilities we operate as a third-party logistics provider). Our core business objective is to help our customers increase their sales and profitability.
Overview of 2017 Results
During 2017, we continued to benefit from net market share gains, including the acquisitions of Farner-Bocken Company (Farner-Bocken) and Pine State Convenience (Pine State) in July 2017 and June 2016, respectively, and improved our food/non-food sales through our core strategies, by leveraging our “Fresh” product solutions, driving our Vendor Consolidation Initiative (VCI) and providing category management expertise in order to make our customers more relevant and profitable.
Our net sales in 2017 increased 8.0%, or $1,158.2 million, to $15,687.6 million compared to $14,529.4 million for 2016. Net sales of food/non-food products increased 14.5% in 2017 driven primarily by net market share gains, including the acquisitions of Farner-Bocken and Pine State, the addition of 7-Eleven Inc. (7-Eleven) and Walmart Inc. (Walmart), and an increase in sales to existing customers. Net sales of cigarettes increased 5.3% in 2017, driven primarily by a 9.3% increase in the average sales price per carton, and the additional carton sales from Farner-Bocken and Pine State, offset by a 9.0% carton decrease for the remainder of the business. Both non-cigarette and cigarette sales for 2017 were impacted by a soft convenience industry sales environment and by the expiration of certain distribution agreements in 2017.
Gross profit in 2017 increased $54.8 million, or 7.4%, to $791.7 million from $736.9 million in 2016, driven primarily by net market share gains, including the acquisitions of Farner-Bocken and Pine State, the addition of 7-Eleven and Walmart, and a net increase in sales to existing customers, offset by the expiration of the aforementioned distribution agreements.
Gross profit margin was 5.0% and 5.1% of total net sales for 2017 and 2016, respectively. An increase in gross profit margin driven by the shift in sales mix towards higher margin food/ non-food items was offset by increases in cigarette excise taxes and manufacturers' prices which compressed gross profit margin by approximately 20 basis points.
Operating expenses in 2017 increased 16.6%, or $107.3 million, to $754.1 million from $646.8 million in 2016. The increase was due primarily to the addition of Farner-Bocken and Pine State, higher costs related to onboarding and servicing 7-Eleven and a non-cash settlement charge of $17.2 million during the fourth quarter of 2017, related to the termination of our pension plan.
Net income in 2017 was $33.5 million compared to $54.2 million in 2016. The aforementioned pension termination charge reduced net income by approximately $11.0 million in 2017, which was offset by a tax benefit of $14.6 million related to the 2017 Tax Cuts and Jobs Act (TCJA). Adjusted EBITDA(1) decreased $16.6 million to $135.7 million in 2017 from $152.3 million in 2016. Incremental Adjusted EBITDA generated from Farner-Bocken, Pine State and other market share gains were offset by the expiration of the distribution agreements with Circle K Southeastern Region of the U.S. and Kroger Convenience (Kroger), and increases in operating expenses (see the reconciliation of Adjusted EBITDA to net income in "Adjusted EBITDA").
________________________________________
(1) | Adjusted EBITDA is a non-GAAP financial measure and should be considered as a supplement to, and not as a substitute for, or superior to, financial measures calculated in accordance with generally accepted accounting principles in the United States of America (GAAP). See the reconciliation of Adjusted EBITDA to net income in Item 7 "Adjusted EBITDA". |
22
Business and Supply Expansion
We continue to benefit from the expansion of our business and the execution of our core strategies, focused primarily on enhancing our fresh product offering, leveraging VCI and providing category management expertise to our customers. Our strategies take costs and inefficiencies out of supply chains, bringing our customers an avenue to offer high quality fresh foods and optimize their consumer product offering. We believe each of these strategies, when adopted, will increase our customers’ profits.
Some of our more recent expansion activities include:
• | In July 2017, we acquired substantially all of the assets of Farner-Bocken, located in Carroll Iowa, for purchase consideration of approximately $174.0 million. The acquisition of Farner-Bocken further expands our market share in the Midwest. |
• | In May 2017, we began service of our three-year supply agreement with approximately 530 Walmart stores in five western states (Arizona, California, New Mexico, Nevada and Utah). We are the primary distributor to these stores for candy, tobacco and certain snack foods. Candy sales, the largest product category serviced under this arrangement, contributed approximately 24% to the total sales for this category for 2017. |
• | In October 2016, we began service of our five-year supply agreement with 7-Eleven, as the primary wholesale distributor to approximately 900 stores serviced from three of our divisions in the western U.S. - Las Vegas, NV, Salt Lake City, UT and Sacramento, CA. |
• | In June 2016, we acquired substantially all of the assets of Pine State, a division of Pine State Trading Company, located in Gardiner, Maine, for cash consideration of $88.4 million. |
During 2017, we continued to focus on growing sales in our “Fresh” categories by improving our customers’ product assortment and in-store marketing efforts. We believe that over the long-term, the trend is for the convenience consumer to shift buying preferences to fresh and healthy items. We benefit from this shift due to the higher margins of these products compared to the other merchandise we distribute. Industry experts have indicated that consumers are making more shopping trips related to fresh food and that perishable foods will serve a more important role in the convenience retail channel in the future. We believe our strategies have helped position us and our customers to benefit from these trends. Sales of Fresh to existing customers increased approximately 12% in 2017.
Other Business Developments
As of January 1, 2017, we serviced approximately 3,000 Alimentation Couche-Tard, Inc. (Couche-Tard) locations in the U.S. and Canada. Our agreement to service approximately 1,100 Circle K stores, a brand of Couche-Tard, in the Southeastern Region of the U.S. expired in January 2017. We continue to service approximately 1,900 stores including both company and franchise operated stores located in the Western and Southwestern regions of the U.S. and throughout Canada. We also continue to operate a third-party distribution center dedicated to supplying over 500 Circle K branded convenience stores across Arizona and Nevada.
In January 2017, we announced the expiration of our supply agreement with Kroger effective April 2017. The expired agreement covered approximately 680 stores.
The expiration of the Couche-Tard and Kroger contracts reduced our sales and net income from these large chain customers in 2017. However, we expect organic sales growth and business from new customers, including those described in "Business and Supply Expansion" above, to more than offset the losses going forward.
Dividends
The Board of Directors approved the following cash dividends in 2017 (in millions, except per share data):
Declaration Date | Dividends Per Share | Record Date | Cash Payment Amount (1) | Payment Date | ||||
February 28, 2017 | $0.09 | March 13, 2017 | $4.2 | March 28, 2017 | ||||
May 8, 2017 | $0.09 | May 25, 2017 | $4.2 | June 22, 2017 | ||||
August 7, 2017 | $0.09 | August 29, 2017 | $4.2 | September 15, 2017 | ||||
November 6, 2017 | $0.10 | November 28, 2017 | $4.6 | December 22, 2017 | ||||
______________________________________________
(1) Includes cash payments on declared dividends and payments made on Restricted Stock Units (RSUs) vested subsequent to the payment date.
23
We paid dividends of $17.2 million and $15.5 million in 2017 and 2016, respectively.
Share Repurchase Program
In August 2017, our Board of Directors authorized a new $40.0 million stock repurchase program (Program). At the time of approval, the Company had $0.2 million remaining under its prior stock repurchase program which was subsequently retired unused. The timing, price and volume purchases under the Program are based on market conditions, cash and liquidity requirements, relevant securities laws and other factors. The Program may be discontinued or amended at any time. The Program has no expiration date and terminates when the amount authorized has been expended or the Board of Directors withdraws its authorization. In 2017, we repurchased 158,106 shares of common stock at an average price of $28.11 compared to repurchases of 237,869 shares of common stock at an average price of $37.76 in 2016. As of December 31, 2017 and 2016, we had $37.8 million and $2.6 million, respectively, available for future share repurchases under the respective stock repurchase programs available on those dates.
Results of Operations
Comparison of 2017 and 2016 (in millions) (1):
2017 | 2016 | ||||||||||||||||||||||
Increase (Decrease) | Amounts | % of Net sales | % of Net sales, less excise taxes | Amounts | % of Net sales | % of Net sales, less excise taxes | |||||||||||||||||
Net sales | $ | 1,158.2 | $ | 15,687.6 | 100.0 | % | — | % | $ | 14,529.4 | 100.0 | % | — | % | |||||||||
Net sales — Cigarettes | 551.7 | 10,887.4 | 69.4 | 63.7 | 10,335.7 | 71.1 | 66.2 | ||||||||||||||||
Net sales — Food/non-food | 606.5 | 4,800.2 | 30.6 | 36.3 | 4,193.7 | 28.9 | 33.8 | ||||||||||||||||
Net sales, less excise taxes (non-GAAP) (2) | 717.6 | 12,225.0 | 77.9 | 100.0 | 11,507.4 | 79.2 | 100.0 | ||||||||||||||||
Gross profit (3)(4) | 54.8 | 791.7 | 5.0 | 6.5 | 736.9 | 5.1 | 6.4 | ||||||||||||||||
Warehousing and | |||||||||||||||||||||||
distribution expenses | 72.9 | 504.1 | 3.2 | 4.1 | 431.2 | 3.0 | 3.7 | ||||||||||||||||
Selling, general and | |||||||||||||||||||||||
administrative expenses (5) | 31.2 | 241.5 | 1.5 | 2.0 | 210.3 | 1.4 | 1.8 | ||||||||||||||||
Amortization of | |||||||||||||||||||||||
intangible assets | 3.2 | 8.5 | 0.1 | 0.1 | 5.3 | — | — | ||||||||||||||||
Income from operations | (52.5 | ) | 37.6 | 0.2 | 0.3 | 90.1 | 0.6 | 0.8 | |||||||||||||||
Interest expense | 6.0 | (11.3 | ) | (0.1 | ) | (0.1 | ) | (5.3 | ) | — | — | ||||||||||||
Interest income | 0.1 | 0.3 | — | — | 0.2 | — | — | ||||||||||||||||
Foreign currency transaction | |||||||||||||||||||||||
gains, net | 1.3 | 1.8 | — | — | 0.5 | — | — | ||||||||||||||||
Income before taxes | (57.1 | ) | 28.4 | 0.2 | 0.2 | 85.5 | 0.6 | 0.7 | |||||||||||||||
Benefit (provision) for income taxes (6) | (36.4 | ) | 5.1 | — | — | (31.3 | ) | (0.2 | ) | (0.3 | ) | ||||||||||||
Net income | (20.7 | ) | 33.5 | 0.2 | 0.3 | 54.2 | 0.4 | 0.5 | |||||||||||||||
Adjusted EBITDA (non-GAAP) (7) | (16.6 | ) | 135.7 | 0.9 | 1.1 | 152.3 | 1.0 | 1.3 | |||||||||||||||
(1) | Amounts and percentages have been rounded for presentation purposes and might differ from unrounded results. |
(2) | See the reconciliation of net sales less excise taxes to net sales in "Comparison of Sales and Gross Profit by Product Category" and in "Non-GAAP Financial Information". |
(3) | Gross profit may not be comparable to those of other entities because warehousing and distribution expenses are not included as a component of our cost of goods sold. |
(4) | Gross profit for 2017 was impacted by LIFO expense of $21.5 million compared to $13.2 million in 2016. |
(5) | SG&A expenses for 2017 includes a non-cash settlement charge of $17.2 million related to the termination of our defined- benefit pension plan. |
(6) Benefit for income taxes for 2017 included a $14.6 million net income tax benefit as a result of the impacts of the 2017 TCJA. See Note 10 - Income Taxes to our consolidated financial statements.
(7) See the reconciliation of Adjusted EBITDA to net income in "Adjusted EBITDA".
24
Net Sales. Net sales increased by $1,158.2 million, or 8.0% to $15,687.6 million in 2017 from $14,529.4 million in 2016. The increase in net sales was driven primarily by net market share gains, including the acquisitions of Farner-Bocken in July 2017 and Pine State in June 2016, and the addition of 7-Eleven and Walmart, which we started servicing during the fourth quarter of 2016 and the second quarter of 2017, respectively. In addition, net sales in 2017 benefited from increases in cigarette excise taxes in certain jurisdictions, increases in cigarette manufacturers' prices, and incremental food/non-food sales to existing customers. The aforementioned increases in net sales were offset by a decrease in cigarette carton sales to existing customers, and a reduction in sales related to the expiration of the distribution agreements with Circle K and Kroger, which decreased sales in 2017 by 8.6% compared to the same period in 2016.
Net Sales of Cigarettes. Net sales of cigarettes in 2017 increased by $551.7 million or 5.3% to $10,887.4 million from $10,335.7 million in 2016. The increase in cigarette net sales was driven primarily by a 9.3% increase in the average sales price per carton and the addition of carton sales from Farner-Bocken and Pine State, offset by a 9.0% decrease in carton sales for the remainder of the business. The increase in the average sales price per carton was due primarily to increases in excise taxes in the states of California and Pennsylvania and increases in cigarette manufacturers' prices. Cigarette carton sales, excluding the impact of Farner-Bocken and Pine State, decreased by 9.6% and 2.3% for the U.S. and Canada, respectively, driven primarily by the expiration of the aforementioned distribution agreements in the U.S., increases in excise taxes and general consumption declines.
We believe long-term cigarette consumption will continue to be impacted by rising prices, increases in excise taxes and other legislative actions, diminishing social acceptance and sales through illicit markets. We expect cigarette manufacturers will raise prices as carton sales decline in order to maintain or enhance their overall profitability, thus mitigating the effects of the declines to distributors. In addition, industry data indicates that convenience retailers are more than offsetting cigarette volume profit declines through higher sales of food/non-food products and food services. We expect this trend to continue as the convenience industry adjusts to consumer demands.
Total net cigarette sales as a percentage of total net sales were 69.4% in 2017 compared to 71.1% in 2016.
Net Sales of Food/Non-food Products. Net sales of food/non-food products in 2017 increased $606.5 million, or 14.5%, to $4,800.2 million from $4,193.7 million in 2016.
The following table provides net sales by product category for our food/non-food products (in millions)(1):
2017 | 2016 | Increase | ||||||||||||
Product Category | Net Sales | Net Sales | Amounts | Percentage | ||||||||||
Food | $ | 1,561.1 | $ | 1,422.5 | $ | 138.6 | 9.7 | % | ||||||
Fresh | 436.3 | 389.8 | 46.5 | 11.9 | % | |||||||||
Candy | 833.4 | 620.0 | 213.4 | 34.4 | % | |||||||||
OTP | 1,272.3 | 1,133.8 | 138.5 | 12.2 | % | |||||||||
Health, beauty & general | 513.3 | 446.7 | 66.6 | 14.9 | % | |||||||||
Beverages | 183.4 | 176.5 | 6.9 | 3.9 | % | |||||||||
Equipment/other | 0.4 | 4.4 | (4.0 | ) | N/A | |||||||||
Total Food/Non-food Products | $ | 4,800.2 | $ | 4,193.7 | $ | 606.5 | 14.5 | % | ||||||
______________________________________________
(1) | Amounts and percentages have been rounded for presentation purposes and might differ from unrounded results. |
The increase in food/non-food sales in 2017 was driven primarily by net market share gains, including our acquisitions of Farner-Bocken and Pine State and an increase in sales to existing customers, offset by the expiration of the aforementioned distribution agreements. The increase in our Candy category was driven primarily by the addition of Walmart, which we began servicing in May 2017. Our OTP and Health, beauty & general categories continued to benefit from higher sales of smokeless tobacco and e-cigarettes products, respectively. We believe the overall trend toward the increased use of smokeless tobacco and e-cigarettes products will continue and will partially offset the impact of the expected long-term decline of cigarette consumption.
Total net sales of food/non-food products as a percentage of total net sales were 30.6% in 2017 compared to 28.9% for the same period in 2016.
Gross Profit. Gross profit represents the amount of profit after deductions, cost of goods sold, certain surcharges and other items from net sales. Inventory holding gains represent incremental revenues whereas vendor incentives, OTP tax refunds and changes in LIFO reserves are components of cost of goods sold and therefore part of our gross profit. Gross profit in 2017 increased
25
by $54.8 million or 7.4% to $791.7 million from $736.9 million in 2016. The increase in gross profit was driven primarily by acquisitions of Farner-Bocken and Pine State, the addition of 7-Eleven and Walmart and a net increase in sales to existing customers, offset by the expiration of the aforementioned distribution agreements.
Gross profit margin was 5.05% of total net sales in 2017 compared to 5.07% in 2016. The increase in gross profit margin, driven by the shift in sales mix toward higher margin food/non-food items, was offset by increases in cigarette excise taxes and manufacturers' prices which compressed gross profit margin by approximately 20 basis points.
Inflation in cigarette prices and excise taxes typically have a negative impact on our gross profit margins with respect to sales, because gross profit on cigarette sales is generally fixed on a cents per carton basis. Therefore, as cigarette prices and taxes increase, gross profit generally decreases as a percentage of sales. Conversely, we generally benefit from food/non-food price increases because product costs for these categories are usually marked up using a percentage of cost of goods sold.
Distributors such as Core-Mark may, from time to time, earn higher gross profits on inventory and excise tax stamp quantities on hand at the time manufacturers increase their prices or when states, localities or provinces increase their excise taxes. Such increases are reflected in customer pricing for all subsequent sales, including sales of inventory on hand at the time of the increase. The higher gross profits are referred to as inventory holding gains.
Our cigarette inventory holding gains were $16.1 million in 2017 compared to $15.3 million for the same period in 2016. We expect cigarette manufacturers will continue to raise prices as carton sales decline in order to maintain or enhance their overall profitability and the various taxing jurisdictions will raise excise taxes to make up for lost tax dollars related to consumption declines.
LIFO expense was $21.5 million in 2017 compared to $13.2 million in 2016. Since we value our inventory in the U.S. on a LIFO basis, our gross profit can be positively or negatively impacted depending on the relative level of price inflation or deflation in manufacturer prices as reported in the Bureau of Labor Statistics Producer Price Index (PPI) used to estimate and record our book LIFO expense (see Note 2 - Summary of Significant Accounting Policies to our consolidated financial statements).
The following table provides the components comprising the change in gross profit as a percentage of net sales for 2017 and 2016 (in millions)(1):
2017 | 2016 | ||||||||||||||||||||||
Increase (Decrease) | Amounts | % of Net sales | % of Net sales, less excise taxes | Amounts | % of Net sales | % of Net sales, less excise taxes | |||||||||||||||||
Net sales | $ | 1,158.2 | $ | 15,687.6 | 100.0 | % | — | % | $ | 14,529.4 | 100.0 | % | — | % | |||||||||
Net sales, less excise taxes (non-GAAP)(2) | 717.6 | 12,225.0 | 77.9 | 100.0 | 11,507.4 | 79.2 | 100.0 | ||||||||||||||||
Components of gross profit: | |||||||||||||||||||||||
Cigarette inventory holding gains(3) | $ | 0.8 | $ | 16.1 | 0.10 | % | 0.13 | % | $ | 15.3 | 0.11 | % | 0.13 | % | |||||||||
OTP tax items(4) | 3.9 | 3.9 | 0.02 | 0.03 | — | — | — | ||||||||||||||||
LIFO expense(5) | 8.3 | (21.5 | ) | (0.14 | ) | (0.18 | ) | (13.2 | ) | (0.09 | ) | (0.11 | ) | ||||||||||
Remaining gross profit (non-GAAP)(6) | 58.4 | 793.2 | 5.06 | 6.49 | 734.8 | 5.06 | 6.39 | ||||||||||||||||
Gross profit | $ | 54.8 | $ | 791.7 | 5.05 | % | 6.48 | % | $ | 736.9 | 5.07 | % | 6.40 | % | |||||||||
______________________________________________
(1) | Amounts and percentages have been rounded for presentation purposes and might differ from unrounded results. |
(2) | Net sales, less excise taxes is a non-GAAP financial measure which we provide to separate the increase in sales due to product sales growth and increases in state, local and provincial excise taxes, which we are responsible for collecting and remitting. Federal excise taxes are levied on the manufacturers who pass the tax on to us as part of the product cost and thus are not a component of our excise taxes. Although increases in cigarette excise taxes result in higher net sales, our overall gross profit percentage may be reduced; however we do not expect increases in excise taxes to negatively impact gross profit per carton (see reconciliation of net sales less excise taxes to net sales in "Comparison of Sales and Gross Profit by Product Category" and in "Non-GAAP Financial Information"). |
(3) | The amount of cigarette inventory holding gains attributable to the U.S. and Canada were $13.4 million and $2.7 million, respectively, in 2017, compared to $13.7 million and $1.6 million, respectively, in 2016. |
(4) | In 2017, we received OTP tax refunds of $3.9 million related to prior years’ taxes. |
(5) | The increase of $8.3 million in LIFO expense in 2017 was due primarily to an increase in the PPI for cigarettes and an increase in inventory levels (see Note 2 - Summary of Significant Accounting Policies to our consolidated financial statements). |
(6) | See the reconciliation of remaining gross profit to gross profit in "Non-GAAP Financial Information". |
26
Remaining gross profit, a non-GAAP financial measure (see reconciliation of remaining gross profit to gross profit in "Non-GAAP financial information"), increased $58.4 million, or 7.9%, to $793.2 million in 2017 from $734.8 million for the same period in 2016. Remaining gross profit margin was 5.06% for both 2017 and 2016.
Cigarette remaining gross profit, a non-GAAP financial measure (see reconciliation of remaining gross profit to gross profit in "Non-GAAP financial information"), decreased $1.2 million, or 0.6%, to $215.2 million in 2017 from $216.4 million for the same period in 2016, driven by lower carton sales, offset partially by an increase in remaining gross profit per carton. Cigarette remaining gross profit per carton increased by approximately 2.0% in 2017 compared to 2016, driven primarily by higher manufacturers’ discounts earned as a result of price increases.
Food/non-food remaining gross profit, a non-GAAP financial measure, (see reconciliation of remaining gross profit to gross profit to Food/non-food gross profit in "Non-GAAP financial information") increased $59.6 million or 11.5% to $578.0 million, in 2017 from $518.4 million in 2016. Food/non-food remaining gross profit margin decreased 32 basis points to 12.04% in 2017 compared to 12.36% in 2016 driven by net market share gains. The decrease was driven primarily by net customer gains and a higher sales mix of OTP, which has significantly lower gross profit margins relative to other food/non-food products, offset by the addition of Farner-Bocken.
To the extent we capture large chain business, our gross profit margins may be negatively impacted. However, large chain customers generally require less working capital, allowing us in most cases to offer lower prices to achieve a favorable return on our investment. Our focus is to strike a balance between large chain business, which generally has lower gross profit margins, and independently-owned convenience stores, which per the National Association of Convenience Stores (NACS) State of the Industry (SOI) report, comprise approximately 67% of the overall convenience store market and generally have higher gross profit margins.
In 2017, our remaining gross profit for food/non-food products was approximately 72.9% of our total remaining gross profit compared to 70.6% for the same period in 2016.
Operating Expenses. Our operating expenses include costs related to Warehousing and Distribution, Selling, General and Administrative Expenses and Amortization of Intangible Assets. In 2017, operating expenses increased by $107.3 million or 16.6%, to $754.1 million from $646.8 million in 2016. The increase was due primarily to the acquisition of Farner-Bocken and Pine State and higher warehousing and distribution expenses at two of our Western distribution centers related primarily to the onboarding and servicing of 7-Eleven. In addition, operating expenses in 2017 included a non-cash settlement charge of $17.2 million during the fourth quarter of 2017 related to the termination of our defined-benefit pension plan. As a percentage of net sales, total operating expenses were 4.8% in 2017 compared to 4.5% for 2016.
Warehousing and Distribution Expenses. Warehousing and Distribution expenses increased $72.9 million or 16.9% to $504.1 million in 2017 from $431.2 million in 2016. The increase in warehouse and distribution expenses was due in part to our acquisition of Farner-Bocken and Pine State which added expenses of approximately $38.0 million. Additionally, we incurred higher warehousing and distribution expenses at two of our Western distribution centers related primarily to the onboarding and servicing of 7-Eleven. As a percentage of total net sales, warehousing and distribution expenses were 3.2% in 2017 compared with 3.0% for the same period in 2016.
Selling, General and Administrative ("SG&A") Expenses. SG&A expenses increased $31.2 million, or 14.8%, to $241.5 million in 2017 from $210.3 million in 2016. SG&A expenses in 2017 included a non-cash settlement charge of $17.2 million during the fourth quarter of 2017 related to the termination of the defined-benefit pension plan and approximately $17.0 million of incremental expenses related to the addition of Farner-Bocken and Pine State. SG&A expenses for 2016 included a gain of $2.0 million related to a legacy legal settlement with Sonitrol Corporation. As a percentage of net sales, SG&A expenses were 1.5% in 2017 compared to 1.4% in 2016.
Amortization Expenses. Amortization expenses increased $3.2 million to $8.5 million in 2017 compared to $5.3 million for the same period in 2016. The increase was due primarily to additional amortization of intangible assets related to our acquisitions of Pine State and Farner-Bocken and software costs.
Interest Expense. Interest expense includes interest and amortization of loan origination costs related to borrowings, facility fees and interest on capital lease obligations. Interest expense was $11.3 million and $5.3 million for 2017 and 2016, respectively. The increase in interest expense was due primarily to increased borrowings to support the acquisition of Farner-Bocken and business growth. Average borrowings in 2017 were $342.4 million with a weighted average interest rate of 2.4% compared to average borrowings of $184.4 million and a weighted average interest rate of approximately 1.7% in 2016.
Foreign Currency Transaction Gains, Net. We recognized a foreign currency transaction gain of $1.8 million for the year ended December 31, 2017 compared to a gain of $0.5 million for the same period in 2016. The change was due to the fluctuation
27
in the Canadian/U.S. exchange rate. Conversely, during times of a weakening U.S. dollar, we generally record transaction gains. During times of a strengthening U.S. dollar, we generally record transaction losses from our Canadian operations.
Income Taxes. Our effective tax rate was a benefit of 18.0% for the year ended December 31, 2017 compared to a provision of 36.6% for the same period in 2016. The decrease in effective tax rate was due primarily to the revaluation of the net deferred tax liabilities related to the reduction in the federal statutory rate of $14.6 million under the TCJA and the excess tax benefits related to stock-based compensation of $1.5 million.
Adjusted EBITDA. Adjusted EBITDA decreased $16.6 million, or 10.9%, to $135.7 million for the year ended December 31, 2017 from $152.3 million for the same period last year. Incremental Adjusted EBITDA generated from Farner-Bocken, Pine State and other market share gains were offset by the expiration of the aforementioned distribution agreements and increases in operating expenses as described more fully above (see the reconciliation of Adjusted EBITDA to net income in "Adjusted EBITDA").
Results of Operations
Comparison of 2016 and 2015 (in millions) (1):
2016 | 2015 | ||||||||||||||||||||||
Increase (Decrease) | Amounts | % of Net sales | % of Net sales, less excise taxes | Amounts | % of Net sales | % of Net sales, less excise taxes | |||||||||||||||||
Net sales | $ | 3,460.0 | $ | 14,529.4 | 100.0 | % | — | % | $ | 11,069.4 | 100.0 | % | — | % | |||||||||
Net sales — Cigarettes | 2,807.2 | 10,335.7 | 71.1 | 66.2 | 7,528.5 | 68.0 | 62.7 | ||||||||||||||||
Net sales — Food/non-food | 652.8 | 4,193.7 | 28.9 | 33.8 | 3,540.9 | 32.0 | 37.3 | ||||||||||||||||
Net sales, less excise taxes (non-GAAP) (2) | 2,649.7 | 11,507.4 | 79.2 | 100.0 | 8,857.7 | 80.0 | 100.0 | ||||||||||||||||
Gross profit (3) | 99.0 | 736.9 | 5.1 | 6.4 | 637.9 | 5.8 | 7.2 | ||||||||||||||||
Warehousing and | |||||||||||||||||||||||
distribution expenses | 78.6 | 431.2 | 3.0 | 3.7 | 352.6 | 3.2 | 4.0 | ||||||||||||||||
Selling, general and | |||||||||||||||||||||||
administrative expenses | 14.3 | 210.3 | 1.4 | 1.8 | 196.0 | 1.8 | 2.2 | ||||||||||||||||
Amortization of | |||||||||||||||||||||||
intangible assets | 2.7 | 5.3 | — | — | 2.6 | — | — | ||||||||||||||||
Income from operations (4) | 3.4 | 90.1 | 0.6 | 0.8 | 86.7 | 0.8 | 1.0 | ||||||||||||||||
Interest expense | 2.8 | (5.3 | ) | — | — | (2.5 | ) | — | — | ||||||||||||||
Interest income | (0.3 | ) | 0.2 | — | — | 0.5 | — | — | |||||||||||||||
Foreign currency transaction | |||||||||||||||||||||||
gains (losses), net | 2.3 | 0.5 | — | — | (1.8 | ) | — | — | |||||||||||||||
Income before taxes | 2.6 | 85.5 | 0.6 | 0.7 | 82.9 | 0.7 | 0.9 | ||||||||||||||||
Net income | 2.7 | 54.2 | 0.4 | 0.5 | 51.5 | 0.5 | 0.6 | ||||||||||||||||
Adjusted EBITDA (non-GAAP) (5) | 17.1 | 152.3 | 1.0 | 1.3 | 135.2 | 1.2 | 1.5 | ||||||||||||||||
______________________________________________
(1) | Amounts and percentages have been rounded for presentation purposes and might differ from unrounded results. |
(2) | See the reconciliation of net sales less excise taxes to net sales in “Comparison of Sales and Gross Profit by Product Category” and in "Non-GAAP Financial Information". |
(3) | Gross profit may not be comparable to those of other entities because warehousing and distribution expenses are not included as a component of our cost of goods sold. |
(4) | Income from operations for 2016 includes LIFO expense of $13.2 million compared to $1.9 million in 2015. In addition, income from operations in 2015 includes cigarette tax stamp inventory holding gains in the U.S. of $8.5 million, net of expenses, resulting from the increase in the excise tax rates of certain jurisdictions. |
(5) | See the reconciliation of Adjusted EBITDA to net income in "Adjusted EBITDA". |
28
Net Sales. Net sales increased by $3,460.0 million, or 31.3%, to $14,529.4 million in 2016 from $11,069.4 million in 2015 driven primarily by significant market share gains, including the addition of Murphy U.S.A., which the Company began servicing during the first quarter of 2016, and the acquisition of Pine State in June 2016. In addition, net sales in 2016 also benefited from increases in cigarette manufacturers' prices and incremental food/non-food sales driven by the continued success of our core strategies.
Net Sales of Cigarettes. Net sales of cigarettes in 2016 increased by $2,807.2 million, or 37.3%, to $10,335.7 million from $7,528.5 million in 2015 driven primarily by a 27.5% increase in carton sales, the acquisition of Pine State, and a 2.7% increase in the average sales price per carton mainly as a result of increases in manufacturers' prices. Cigarette carton sales in the U.S. increased by 34.5% during the same period driven primarily by market share gains, including the addition of Murphy U.S.A., and the acquisition of Pine State in June 2016. Carton sales in Canada increased 13.8%, also driven by market share gains.
Total net cigarette sales as a percentage of total net sales were 71.1% in 2016 compared to 68.0% in 2015. The increase in cigarette sales as a percentage of total net sales was due primarily to market share gains in 2016, including the addition of Murphy U.S.A., which have a higher sales mix of cigarettes compared to the rest of our business.
Despite the significant increase in our cigarette sales in 2016, we believe long-term cigarette consumption will continue to be impacted by rising prices, legislative actions, diminishing social acceptance and sales through illicit markets. We expect cigarette manufacturers will raise prices as carton sales decline in order to maintain or enhance their overall profitability, thus mitigating the effects of the declines to distributors. In addition, industry data indicates that convenience retailers are more than offsetting cigarette volume profit declines through higher sales of food/non-food products and food services. We expect this trend to continue as the convenience industry adjusts to consumer demands.
Net Sales of Food/Non-food Products. Net sales of food/non-food products in 2016 increased $652.8 million, or 18.4%, to $4,193.7 million from $3,540.9 million in 2015.
The following table provides net sales by product category for our food/non-food products (in millions)(1):
2016 | 2015 | Increase | ||||||||||||
Product Category | Net Sales | Net Sales | Amounts | Percentage | ||||||||||
Food (2) | $ | 1,422.5 | $ | 1,251.1 | $ | 171.4 | 13.7 | % | ||||||
Fresh (2) | 389.8 | 335.0 | 54.8 | 16.4 | % | |||||||||
Candy | 620.0 | 557.0 | 63.0 | 11.3 | % | |||||||||
Other tobacco products | 1,133.8 | 870.3 | 263.5 | 30.3 | % | |||||||||
Health, beauty & general | 446.7 | 368.8 | 77.9 | 21.1 | % | |||||||||
Beverages | 176.5 | 156.6 | 19.9 | 12.7 | % | |||||||||
Equipment/other | 4.4 | 2.1 | 2.3 | N/A | ||||||||||
Total Food/Non-food Products | $ | 4,193.7 | $ | 3,540.9 | $ | 652.8 | 18.4 | % | ||||||
______________________________________________
(1) | Amounts and percentages have been rounded for presentation purposes and might differ from unrounded results. |
(2) | In 2016, the Fresh category was separated from the Food category to better highlight the growth in the Fresh commodity. The 2015 presentation has been realigned to reflect these changes. |
The increase in food/non-food sales in 2016 was driven primarily by market share gains, the acquisition of Pine State and an increase in sales to existing customers. Sales generated from VCI, Fresh and our Focused Marketing Initiative (FMI) were the primary drivers of the increase in net sales to existing customers. The increase in sales in our OTP category was due primarily to market share gains, including the addition of Murphy U.S.A. and higher sales of smokeless tobacco products. We believe the overall trend toward the increased use of smokeless tobacco products will continue and will help offset the impact of the expected long-term decline of cigarette consumption.
Total net sales of food/non-food products as a percentage of total net sales were 28.9% in 2016 compared to 32.0% for the same period in 2015.
29
Gross Profit. Gross profit represents the amount of profit after deductions, cost of goods sold, certain surcharges and other items from net sales. Inventory holding gains represent incremental revenues whereas vendor incentives, OTP tax refunds and changes in LIFO reserves are components of cost of goods sold and therefore part of our gross profit. Gross profit in 2016 increased $99.0 million, or 15.5% to $736.9 million from $637.9 million in 2015 driven primarily by the increase in sales, including the acquisition of Pine State in June 2016. Gross profit in 2016 also benefited from a $5.2 million increase in cigarette inventory holding gains driven primarily by the increase in carton sales and higher cigarette inflation in 2016.
The increase in gross profit in 2016 was offset by an increase in LIFO expense of $11.3 million compared to 2015, due primarily to an increase in the Producer Price Index (PPI) for certain food/non-food product categories. In addition, gross profit in 2015 included cigarette tax stamp inventory holding gains of $9.0 million which resulted from an increase in excise taxes by certain jurisdictions and $1.8 million in OTP tax refunds, related to the overpayment of taxes in prior years.
Distributors such as Core-Mark may, from time to time, earn higher gross profits on inventory and excise tax stamp quantities on hand at the time manufacturers' increase their prices or when states, localities or provinces increase their excise taxes. Such increases are reflected in customer pricing for all subsequent sales, including sales of inventory on hand at the time of the increase. The higher gross profits are referred to as inventory holding gains. However, significant increases in cigarette product costs and cigarette excise taxes adversely impact our gross profit as a percentage of net sales, because we are paid on a cents per carton basis for cigarette sales. Conversely, we generally benefit from food/non-food price increases because product costs for these categories are usually marked up using a percentage of cost of goods sold.
Gross profit margin was 5.07% of total net sales in 2016 compared to 5.76% in 2015. The decrease in gross profit margins was due primarily to the addition of Murphy U.S.A., which has a higher sales mix of tobacco products and generally lower margins compared to the rest of our business.
Our cigarette inventory holding gains were $15.3 million in 2016 compared to $10.1 million for the same period in 2015. We expect cigarette manufacturers will continue to raise prices as carton sales decline in order to maintain or enhance their overall profitability and the various taxing jurisdictions will raise excise taxes to make up for lost tax dollars related to consumption declines.
LIFO expense was $13.2 million in 2016 compared to $1.9 million in 2015. Since we value our inventory in the U.S. on a LIFO basis, our gross profit can be positively or negatively impacted depending on the relative level of price inflation or deflation in manufacturer prices as reported in the Bureau of Labor Statistics PPI used to estimate and record our book LIFO expense (see Note 2 - Summary of Significant Accounting Policies to our consolidated financial statements).
The following table provides the components comprising the change in gross profit as a percentage of net sales for 2016 and 2015 (in millions)(1):
2016 | 2015 | ||||||||||||||||||||||
Increase (Decrease) | Amounts | % of Net sales | % of Net sales, less excise taxes | Amounts | % of Net sales | % of Net sales, less excise taxes | |||||||||||||||||
Net sales | $ | 3,460.0 | $ | 14,529.4 | 100.0 | % | — | % | $ | 11,069.4 | 100.0 | % | — | % | |||||||||
Net sales, less excise taxes (non-GAAP)(2) | 2,649.7 | 11,507.4 | 79.2 | 100.0 | 8,857.7 | 80.0 | 100.0 | ||||||||||||||||
Components of gross profit: | |||||||||||||||||||||||
Cigarette inventory holding gains(3) | $ | 5.2 | $ | 15.3 | 0.11 | % | 0.13 | % | $ | 10.1 | 0.09 | % | 0.11 | % | |||||||||
Cigarette tax stamp inventory holding gains (4) | (9.0 | ) | — | — | — | 9.0 | 0.08 | 0.10 | |||||||||||||||
OTP tax items(5) | (1.8 | ) | — | — | — | 1.8 | 0.02 | 0.02 | |||||||||||||||
LIFO expense(6) | 11.3 | (13.2 | ) | (0.09 | ) | (0.11 | ) | (1.9 | ) | (0.02 | ) | (0.02 | ) | ||||||||||
Remaining gross profit (non-GAAP)(7) | 115.9 | 734.8 | 5.06 | 6.39 | 618.9 | 5.59 | 6.99 | ||||||||||||||||
Gross profit | $ | 99.0 | $ | 736.9 | 5.07 | % | 6.40 | % | $ | 637.9 | 5.76 | % | 7.20 | % | |||||||||
______________________________________________
(1) | Amounts and percentages have been rounded for presentation purposes and might differ from unrounded results. |
30
(2) | Net sales, less excise taxes is a non-GAAP financial measure which we provide to separate the increase in sales due to product sales growth and increases in state, local and provincial excise taxes which we are responsible for collecting and remitting. Federal excise taxes are levied on the manufacturers who pass the tax on to us as part of the product cost and thus are not a component of our excise taxes. Although increases in cigarette excise taxes result in higher net sales, our overall gross profit percentage may be reduced; however we do not expect increases in excise taxes to negatively impact gross profit per carton (see reconciliation of Net Sales, less excise taxes to Net Sales in "Comparison of Sales and Gross Profit by Product Category" and in "Non-GAAP Financial Information"). |
(3) | The amount of cigarette inventory holding gains attributable to the U.S. and Canada were $13.7 million and $1.6 million, respectively, in 2016, compared to $8.7 million and $1.4 million, respectively, in 2015. |
(4) | In 2015, we recognized cigarette tax stamp inventory holding gains in the U.S. of $9.0 million, resulting from the increase in the excise tax rates of certain jurisdictions. |
(5) | In 2015, we received OTP tax refunds of $1.8 million related to prior years’ taxes. |
(6) | The increase of $11.3 million in LIFO expense in 2016 was due primarily to an increase in the Production Price Index (PPI) for certain Food/ Non Food commodities. Since we value our inventory in the U.S. on a LIFO basis, our gross profit can be positively or negatively impacted depending on the relative level of price inflation or deflation in manufacturer prices as reported in the Bureau of Labor Statistics PPI used to estimate and record our book LIFO expense (see Note 2 - Summary of Significant Accounting Policies to our consolidated financial statements). |
(7) | See the reconciliation of remaining gross profit to gross profit in "Non-GAAP Financial Information". |
Remaining gross profit, a non-GAAP financial measure (see reconciliation of remaining gross profit to gross profit in "Non-GAAP financial information"), increased $115.9 million, or 18.7%, to $734.8 million in 2016 from $618.9 million for the same period in 2015. Remaining gross profit margin was 5.06% in 2016 compared to 5.59% in 2015. The decrease in remaining gross profit margin in 2016 was due primarily to market share gains, including Murphy U.S.A., which have a higher sales mix of cigarettes and other tobacco products. In addition, increases in cigarette manufacturers' prices compressed remaining gross profit margins by approximately five basis points in 2016.
Cigarette remaining gross profit, a non-GAAP financial measure (see reconciliation of remaining gross profit to gross profit in "Non-GAAP financial information"), increased $44.0 million, or 25.5%, to $216.4 million in 2016 from $172.4 million for the same period in 2015. Cigarette remaining gross profit per carton decreased by approximately 5.0% in 2016 compared to 2015 due primarily to the addition of Murphy U.S.A., offset partially by higher manufacturers’ discounts earned as a result of price increases.
Food/non-food remaining gross profit, a non-GAAP financial measure, (see reconciliation of remaining gross profit to gross profit in "Non-GAAP financial information") increased $71.9 million or 16.1% to $518.4 million, in 2016 from $446.5 million in 2015. Food/non-food remaining gross profit margin decreased 25 basis points to 12.36% in 2016 compared to 12.61% in 2015 due primarily to the addition of Murphy U.S.A., which has generally lower overall food/non-food margins compared to the rest of our business and a higher sales mix of OTP, which have lower gross profit margins relative to other food/non-food products.
To the extent we capture large chain business, our gross profit margins may be negatively impacted. However, large chain customers generally require less working capital, allowing us in most cases to offer lower prices to achieve a favorable return on our investment. Our focus is to strike a balance between large chain business, which generally has lower gross profit margins, and independently-owned convenience stores, which per the NACS SOI report, comprise approximately 67% of the overall convenience store market and generally have higher gross profit margins.
In 2016, our remaining gross profit for food/non-food products was approximately 70.6% of our total remaining gross profit compared to 72.1% for the same period in 2015.
Operating Expenses. Our operating expenses include costs related to Warehousing and Distribution, Selling, General and Administrative Expenses and Amortization of Intangible Assets. In 2016, operating expenses increased by $95.6 million or 17.3%, to $646.8 million from $551.2 million in 2015. Increases in the amount of comparable cubic feet of product handled, incremental deliveries made, and costs related to the on-boarding of new customers, contributed to higher operating expenses in 2016. In addition, operating expenses in 2016 include expenses of approximately $29.5 million related to Pine State, including $2.2 million of acquisition costs. As a percentage of net sales, total operating expenses were 4.5% in 2016 compared to 5.0% for the same period in 2015. Operating expenses as a percentage of total net sales in 2016 benefited from an increase in cigarette sales, which grew faster than food/non-food sales. The shift in sales to cigarettes, which have higher price points than our food/non-food products, decreased operating expenses as a percentage of total net sales by approximately 40 basis points in 2016 compared to 2015.
Warehousing and Distribution Expenses. Warehousing and Distribution expenses increased $78.6 million or 22.3% to $431.2 million in 2016 from $352.6 million in 2015. The increase in warehouse and distribution expenses was driven primarily by a 12.6% increase in comparable cubic feet of product handled and a 14.7% increase in incremental deliveries, the addition of Pine State and approximately $5.3 million of identifiable costs related to the on-boarding of significant new customers in 2016. In
31
addition, warehousing and distribution expenses in certain of our operating divisions were higher due to temporary inefficiencies driven primarily by the hiring and training of new employees to support significant increases in sales volume. As a percentage of total net sales, warehousing and distribution expenses were 3.0% in 2016 compared with 3.2% for the same period in 2015. The shift in sales to cigarettes decreased warehousing and distribution expenses as a percentage of total net sales by approximately 30 basis points in 2016 compared to 2015.
Selling, General and Administrative (SG&A) Expenses. SG&A expenses increased $14.3 million, or 7.3%, to $210.3 million in 2016 from $196.0 million in 2015. As a percentage of net sales, SG&A expenses were 1.4% in 2016 compared to 1.8% in 2015. The decline as a percentage of net sales was driven primarily by leverage of our fixed expenses in 2016 compared to 2015 and by the shift in sales to cigarettes, which have higher price points than our food/non-food products, which decreased SG&A expenses as a percentage of total net sales by approximately 10 basis points. In addition, SG&A expenses for 2016 included a gain of $2.0 million related to the settlement of a legacy lawsuit with Sonitrol Corporation, which was recognized in the first quarter of 2016 and offset by $2.2 million of acquisition costs for Pine State. SG&A expenses in 2015 included $1.7 million of costs related to the acquisition of Karrys Bros.
Amortization Expenses. Amortization expenses increased $2.7 million, to $5.3 million, in 2016 compared to $2.6 million for the same period in 2015. The increase was primarily due to the amortization costs for our new financial system which commenced in February 2016, and amortization of intangible assets related to the acquisition of Pine State.
Interest Expense. Interest expense includes interest and amortization of loan origination costs related to borrowings and facility fees and interest on capital lease obligations. Interest expense was $5.3 million and $2.5 million for 2016 and 2015, respectively. Average borrowings in 2016 were $184.4 million with a weighted average interest rate of 1.7% compared to average borrowings of $39.6 million and a weighted average interest rate of 1.6% in 2015. The increase in average borrowings in 2016 was due primarily to our acquisition of Pine State for $88.4 million, as well as increased working capital requirements to support our business expansion activities.
Foreign Currency Transaction Gains and Losses, Net. We recognized a foreign currency transaction gain of $0.5 million for the year ended December 31, 2016 compared to a loss of $1.8 million for the same period in 2015. The change was due to fluctuations in the Canadian/U.S. exchange rate. During times of a strengthening U.S. dollar, we generally record transaction losses from our Canadian operations. Conversely, during times of a weakening U.S. dollar, we generally record transaction gains.
Income Taxes. Our effective tax rate was 36.6% for the year ended December 31, 2016 compared to 37.9% for the same period in 2015.The decrease in the effective tax rate for the year ended December 31, 2016 is due primarily to the effects of prior years' estimates for foreign operations, as well as benefits in the current year related to the expiration of statute of limitations for uncertain tax positions and related interest recovery.
Adjusted EBITDA. Adjusted EBITDA increased $17.1 million, or 12.6%, to $152.3 million for the year ended December 31, 2016 from $135.2 million for the same period last year. The increase in Adjusted EBITDA was due primarily to growth in our gross profit resulting from market share gains and the acquisition of Pine State, offset by incremental expenses related to the on-boarding of significant new customers. In addition, Adjusted EBITDA in 2015 included cigarette tax stamp holding gains of $8.5 million, net of expenses, and $1.7 million, net of expenses, in refunds of excise taxes on OTP from prior years (see the reconciliation of Adjusted EBITDA to net income in "Adjusted EBITDA").
Adjusted EBITDA
Adjusted EBITDA is a non-GAAP financial measure used by management to measure operating performance. We believe Adjusted EBITDA provides meaningful supplemental information for investors regarding the performance of our business and allows investors to view results in a manner similar to the method used by our management. Adjusted EBITDA is also among the primary measures used externally by our investors, analysts and peers in our industry for purposes of valuation and comparing our results to other companies. Adjusted EBITDA is not defined by GAAP and the discussion of Adjusted EBITDA should be considered as a supplement to, and not as a substitute for, or superior to, financial measures calculated in accordance with GAAP. We may define Adjusted EBITDA differently than other companies and therefore such measures may not be comparable to ours.
32
The following table provides the components of Adjusted EBITDA for years ended December 31, 2017, 2016 and 2015 (in millions):
Year Ended December 31, | |||||||||||
2017 | 2016 | 2015 | |||||||||
Net income | $ | 33.5 | $ | 54.2 | $ | 51.5 | |||||
Interest expense, net (1) | 11.0 | 5.1 | 2.0 | ||||||||
(Benefit) provision for income taxes | (5.1 | ) | 31.3 | 31.4 | |||||||
Depreciation and amortization | 54.4 | 42.9 | 37.9 | ||||||||
LIFO expense | 21.5 | 13.2 | 1.9 | ||||||||
Stock-based compensation expense | 5.0 | 6.1 | 8.7 | ||||||||
Foreign currency transaction (gains) losses, net | (1.8 | ) | (0.5 | ) | 1.8 | ||||||
Pension termination settlement (2) | 17.2 | — | — | ||||||||
Adjusted EBITDA (non-GAAP) | $ | 135.7 | $ | 152.3 | $ | 135.2 | |||||
______________________________________________
(1) | Interest expense, net, is reported net of interest income. |
(2) | In December 2017, the Company settled its qualified defined-benefit pension plan, which resulted in a non-cash charge in SG&A expenses within the consolidated statements of operations related to unrecognized actuarial losses in Accumulated Other Comprehensive Income (AOCI). |
33
Comparison of Sales and Gross Profit by Product Category
The following table summarizes our cigarette and food/non-food product sales, LIFO expense, gross profit and other relevant financial data for 2017, 2016 and 2015 (in millions)(1):
2017 | 2016 | 2015 | |||||||||
Cigarettes | |||||||||||
Net sales | $ | 10,887.4 | $ | 10,335.7 | $ | 7,528.5 | |||||
Excise taxes in sales (2) | 3,094.3 | 2,716.2 | 1,977.5 | ||||||||
Net sales, less excise taxes (non-GAAP)(3) | 7,793.1 | 7,619.5 | 5,551.0 | ||||||||
LIFO expense (4) | 17.5 | 11.7 | 11.0 | ||||||||
Gross profit (5) | 213.8 | 220.0 | 180.5 | ||||||||
Gross profit % | 1.96 | % | 2.13 | % | 2.40 | % | |||||
Gross profit % less excise taxes (non-GAAP) | 2.74 | % | 2.89 | % | 3.25 | % | |||||
Remaining gross profit (non-GAAP)(7) | $ | 215.2 | $ | 216.4 | $ | 172.4 | |||||
Remaining gross profit % (non-GAAP) | 1.98 | % | 2.09 | % | 2.29 | % | |||||
Remaining gross profit % less excise taxes (non-GAAP) | 2.76 | % | 2.84 | % | 3.11 | % | |||||
Food/Non-food | |||||||||||
Net sales | $ | 4,800.2 | $ | 4,193.7 | $ | 3,540.9 | |||||
Excise taxes in sales (2) | 368.3 | 305.8 | 234.2 | ||||||||
Net sales, less excise taxes (non-GAAP)(3) | 4,431.9 | 3,887.9 | 3,306.7 | ||||||||
LIFO expense (income) (4) | 4.0 | 1.5 | (9.1 | ) | |||||||
Gross profit (6) | 577.9 | 516.9 | 457.4 | ||||||||
Gross profit % | 12.04 | % | 12.33 | % | 12.92 | % | |||||
Gross profit % less excise taxes (non-GAAP) | 13.04 | % | 13.30 | % | 13.83 | % | |||||
Remaining gross profit (non-GAAP)(7) | $ | 578.0 | $ | 518.4 | $ | 446.5 | |||||
Remaining gross profit % (non-GAAP) | 12.04 | % | 12.36 | % | 12.61 | % | |||||
Remaining gross profit % less excise taxes (non-GAAP) | 13.04 | % | 13.33 | % | 13.50 | % | |||||
Totals | |||||||||||
Net sales | $ | 15,687.6 | $ | 14,529.4 | $ | 11,069.4 | |||||
Excise taxes in sales (2) | 3,462.6 | 3,022.0 | 2,211.7 | ||||||||
Net sales, less excise taxes (non-GAAP)(3) | 12,225.0 | 11,507.4 | 8,857.7 | ||||||||
LIFO expense (4) | 21.5 | 13.2 | 1.9 | ||||||||
Gross profit (5) (6) | 791.7 | 736.9 | 637.9 | ||||||||
Gross profit % | 5.05 | % | 5.07 | % | 5.76 | % | |||||
Gross profit % less excise taxes (non-GAAP) | 6.48 | % | 6.40 | % | 7.20 | % | |||||
Remaining gross profit (non-GAAP)(7) | $ | 793.2 | $ | 734.8 | $ | 618.9 | |||||
Remaining gross profit % (non-GAAP) | 5.06 | % | 5.06 | % | 5.59 | % | |||||
Remaining gross profit % less excise taxes (non-GAAP) | 6.49 | % | 6.39 | % | 6.99 | % | |||||
______________________________________________
(1) | Amounts and percentages have been rounded for presentation purposes and might differ from unrounded results. |
(2) | Excise taxes included in our net sales consist of state, local and provincial excise taxes, for which we are the primary obligor and held responsible for remitting to the appropriate tax authorities. Federal excise taxes are levied on the manufacturers who pass the tax on to us as part of the product cost and thus are not a component of our excise taxes. Although increases in cigarette excise taxes result in higher net sales, our overall gross profit percentage may be reduced since gross profit dollars generally remain the same. |
(3) | See the reconciliation of net sales less excise taxes to net sales in "Comparison of Sales and Gross Profit by Product Category" and in "Non-GAAP Financial Information". |
34
(4) | The increase of $8.3 million in LIFO expense in 2017 was due primarily to an increase in the PPI for cigarettes and an increase in inventory levels (see Note 2 - Summary of Significant Accounting Policies to our consolidated financial statements). |
(5) | Cigarette gross profit includes (i) cigarette inventory holding gains related to manufacturer price increases, (ii) increases in state, local and provincial excise taxes and (iii) LIFO effects. Cigarette inventory holding gains for the years 2017, 2016 and 2015 were $16.1 million, $15.3 million and $10.1 million, respectively. For 2015, we recognized cigarette tax stamp inventory holding gains in the U.S. of $9.0 million, resulting from the increase in the excise tax rates of certain jurisdictions. |
(6) | Food/non-food gross profit includes (i) inventory holding gains related to manufacturer price increases, (ii) increases in state, local and provincial excise taxes, (iii) LIFO effects, and (iv) OTP tax refunds of $3.9 million in 2017 and $1.8 million in 2015, respectively. |
(7) | See the reconciliation of remaining gross profit to gross profit in "Non-GAAP Financial Information". |
Liquidity and Capital Resources
Our cash and cash equivalents were $41.6 million and $26.4 million as of December 31, 2017 and December 31, 2016, respectively. As of December 31, 2017, we no longer have any restricted cash balances due to the rescission of restrictions by the Canadian Alberta provincial government. Our restricted cash was $15.3 million at December 31, 2016.
Our liquidity requirements arise primarily from our working capital, capital expenditures, debt service requirements for our revolving credit facility (Credit Facility), income taxes, repurchases of common stock and dividend payments. We have historically funded our liquidity requirements through our cash flows from operations and external borrowings. For the year ended December 31, 2017, our cash flows from operating activities provided was $93.6 million. On December 31, 2017, we had $152.1 million of borrowing capacity available under our Credit Facility.
Based on our anticipated cash needs, availability under our Credit Facility and the scheduled maturity of our debt, we expect that our current liquidity will be sufficient to meet our anticipated operating needs during the next twelve months.
On September 14, 2016, our Board of Directors approved a motion to terminate our qualified defined-benefit pension plan. We settled all of our remaining pension liabilities through annuities purchased in December 2017. We made a final cash contribution of $4.9 million to fully fund the pension plan prior to terminating it in 2017. Settling the plan eliminates future cash contributions, lowers future expenses and eliminates Pension Benefit Guaranty Corporation premiums.
Cash flows from operating activities
Year ended December 31, 2017
Our operating activities, including net income, net non-cash additions to net income and working capital changes, provided net cash of $93.6 million for the year ended December 31, 2017 compared to cash used of $98.0 million for the same period in 2016. Changes in operating assets and liabilities used net cash of $39.5 million for the year ended December 31, 2017, compared to cash used of $226.1 million for the prior year. Working capital requirements for 2017 were impacted by the commencement of our three-year supply agreement with Walmart; however these working capital requirements were partially offset by the expiration of two other distribution agreements during the year. Related to the prior year, elevated working capital requirements for 2016 were caused by significant new operating agreements with Murphy U.S.A. and 7-Eleven Inc., both of which commenced in 2016.
Our cash flows from operating activities were impacted by the following movements in working capital for the years ended 2017 and 2016, respectively (in millions):
2017 | 2016 | Change | |||||||||
Accounts receivable, net | $ | (32.7 | ) | $ | (59.2 | ) | $ | 26.5 | |||
Other receivables, net | 8.0 | (37.0 | ) | 45.0 | |||||||
Inventories, net | (70.5 | ) | (180.4 | ) | 109.9 | ||||||
Deposits, prepayments and other assets | (16.9 | ) | (22.8 | ) | 5.9 | ||||||
Accounts payable | 50.2 | (11.0 | ) | 61.2 | |||||||
Cigarette and tobacco taxes payable | 40.7 | 65.5 | (24.8 | ) | |||||||
Pension, claims, accrued and other long-term liabilities | (18.3 | ) | 18.8 | (37.1 | ) | ||||||
Net cash used by changes in operating assets and liabilities | $ | (39.5 | ) | $ | (226.1 | ) | $ | 186.6 | |||
35
Year ended December 31, 2016
Our operating activities used cash of $98.0 million for the year ended December 31, 2016 compared to $77.2 million of cash provided for the same period in 2015.
Significant new operating agreements with Murphy U.S.A. and 7-Eleven Inc., both of which commenced in 2016, significantly contributed to increases in working capital requirements during 2016. Changes in operating assets and liabilities caused net cash used in operating activities of $226.1 million. Specifically, inventories, accounts receivable, and other receivables, increased $180.4 million, $59.2 million, and $37.0 million, respectively, utilizing working capital, and using cash. Offsetting this usage was an increase of cigarette and tobacco taxes payables, which provided cash of $65.5 million. Other net working capital movements used cash of $15.0 million.
Offsetting the working capital requirements of $226.1 million was net income of $54.2 million plus non-cash additions to net income from Depreciation, LIFO and inventory provision, of $42.9 million, and $13.2 million, respectively. Other non-cash adjustments to net income were $17.8 million.
Cash flows from investing activities
Year ended December 31, 2017
Our investing activities used cash of $221.6 million for the year ended December 31, 2017 compared to cash used of $150.4 million for the same period in 2016, an increase of $71.2 million. The increase in cash used was driven primarily by the acquisition of Farner-Bocken for $169.0 million compared to the acquisition of Pine State for $88.4 million in the prior year. Significant capital expenditures for the year included $11.0 million for freezer expansion of our new distribution center, AMI/Artic North East, $8.4 million for leasehold improvements for our various divisions and $7.4 million for our delivery fleet to support our new customers Walmart and 7-Eleven.
Year ended December 31, 2016
Our investing activities used net cash of $150.4 million for the year ended December 31, 2016 compared to cash used of $47.7 million for the same period in 2015, an increase of $102.7 million. The increase in cash used was primarily driven by the acquisition of Pine State for $88.4 million compared to $8.0 million for the acquisition of Karrys Bros. in the prior year. Significant capital expenditures for the year included $16.8 million in leasehold improvements for a new building for our Las Vegas division and other building upgrades as well as $13.7 million in logistics equipment to accommodate new business.
Cash flows from financing activities
Year ended December 31, 2017
Our financing activities provided net cash of $130.4 million for the year ended December 31, 2017 compared to net cash provided of $266.7 million for the same period in 2016, a decrease of $136.3 million. This decrease was due primarily due to lower net borrowings made under our Credit Facility during the year ended December 2017, compared to the prior year period. Net borrowings made under our Credit Facility in 2017 included borrowings for our acquisition of Farner-Bocken for $169.0 million. Net borrowings in 2016 were primarily due to our acquisition of Pine State for $88.4 million and to support our operating agreements with Murphy U.S.A and 7-Eleven, both of which commenced in 2016.
Year ended December 31, 2016
Our financing activities provided net cash of $266.7 million for the year ended December 31, 2016 compared to net cash used of $34.2 million for the same period in 2015, an increase of $300.9 million. This increase was due primarily to a $297.9 million increase in net borrowings made under our Credit Facility, partially in support of our acquisition of Pine State for $88.4 million, as well as to fund increased working capital requirements to support our business expansion activities. Book overdrafts increased $8.6 million caused by the level of cash on hand in relation to the timing of vendor payments and outstanding checks.
36
Our Credit Facility
We have a Credit Facility with a borrowing capacity of $750 million as of December 31, 2017, limited by a borrowing base consisting of eligible accounts receivable and inventories. On March 28, 2017, we entered into a tenth amendment to the Credit Facility (the Tenth Amendment), which increased the Credit Facility from $600 million to $750 million and extended the maturity of the facility to March 2022. The Credit Facility has an expansion feature which can be increased up to an additional $200 million. All obligations under the Credit Facility are secured by first priority liens on substantially all of our present and future assets. The terms of the Credit Facility permit prepayment without penalty at any time subject to customary breakage costs with respect to London Interbank Offer Rate (LIBOR) or Canadian Dollar Offer Rate (CDOR) based loans prepaid prior to the end of an interest period. The Credit Facility contains customary affirmative and restrictive covenants. In addition, the credit facility allows for unlimited stock repurchases and dividends as long as we meet certain credit availability percentages and fixed charge coverage ratios. As of December 31, 2017, we were in compliance with all of the covenants under the Credit Facility.
We incurred fees of approximately $1.8 million in connection with the amendments.
Amounts borrowed, outstanding letters of credit and amounts available to borrow, net of certain reserves required under the Credit Facility, were as follows (in millions):
December 31, | |||||||
2017 | 2016 | ||||||
Amounts borrowed, net | $ | 488.2 | $ | 336.0 | |||
Outstanding letters of credit | 14.2 | 17.4 | |||||
Amounts available to borrow (1) | 152.1 | 224.8 | |||||
______________________________________________
(1) | Excluding expansion features as of December 31, 2017 and December 31, 2016 of $200 million and $100 million, respectively. |
Average borrowings during the years ended December 31, 2017 and 2016 were $342.4 million and $184.4 million, respectively, with amounts borrowed at any one time during the years then ended ranging from $165.0 million to $605.0 million and zero to $428.0 million, respectively. See Liquidity and Capital Resources for additional details on the increase to average borrowings details.
Contractual Obligations and Commitments
Contractual Obligations. The following table presents information regarding our contractual obligations that existed as of December 31, 2017 (in millions):
Total | Less than 1 Year | 1 - 3 Years | 3 - 5 Years | More than 5 Years | |||||||||||||||
Credit Facility (1) | $ | 488.2 | $ | — | $ | — | $ | 488.2 | $ | — | |||||||||
Purchase obligations (2) | 26.0 | 4.8 | 9.9 | 11.3 | — | ||||||||||||||
Letters of credit | 14.2 | 14.2 | — | — | — | ||||||||||||||
Operating leases | 363.9 | 59.4 | 106.3 | 74.7 | 123.5 | ||||||||||||||
Capitalized leases (3) | 36.3 | 4.1 | 7.3 | 5.5 | 19.4 | ||||||||||||||
Total contractual obligations (4)(5) | $ | 928.6 | $ | 82.5 | $ | 123.5 | $ | 579.7 | $ | 142.9 | |||||||||
______________________________________________
(1) | Represents amounts borrowed under our Credit Facility and does not include interest costs associated with the Credit Facility due to the variation of outstanding debt at Prime-based or LIBOR-based interest rates. See Our Credit Facility above. |
(2) | Our purchase obligations at December 31, 2017 were related primarily to purchases of compressed natural gas for our trucking fleet, delivery and warehouse equipment, computer software and services, and leasehold improvements (see Note 9 - Commitments and Contingencies to our consolidated financial statements). |
(3) | Represents net future minimum lease payments for warehouse facility, refrigeration and other office and warehouse equipment. Current maturities of capital leases are included in accrued liabilities and non-current maturities are included in long-term debt. Interest costs associated with the capitalized leases are included in the table above. |
(4) | We have not included in the table above claims liabilities of $41.3 million, which includes health and welfare, workers’ compensation and general and auto liabilities because they do not have a definite payout by year. Claims liabilities are discussed in Note 2 - Summary of Significant Accounting Policies to our consolidated financial statements. |
(5) | As discussed in Note 11 - Employee Benefit Plans to our consolidated financial statements, we have $0.2 million in short-term obligations and $1.9 million in long-term obligation, arising from an underfunded other post-retirement benefit plan. |
37
Off-Balance Sheet Arrangements
Letters of Credit. As of December 31, 2017, our standby letters of credit issued under our Credit Facility were $14.2 million related primarily to casualty insurance. The majority of the standby letters of credit mature in one year. However, in the ordinary course of our business, we will continue to renew or modify the terms of the letters of credit to support business requirements. The liabilities underlying the letters of credit are reflected on our consolidated balance sheets.
Operating Leases. The majority of our sales offices, warehouse facilities and trucks are subject to lease agreements which expire at various dates through 2032, excluding renewal options. We are generally required to incur maintenance, insurance, and property tax expenses in connection with our lease agreements. In most instances, we expect the leases that expire will be renewed or replaced in the normal course of our business.
Critical Accounting Policies and Estimates
Management’s Discussion and Analysis of our Financial Condition and Results of Operations is based on our consolidated financial statements, which have been prepared in accordance with accounting principles generally accepted in the U.S. The preparation of our consolidated financial statements requires estimates and assumptions that affect the reported amounts of assets and liabilities as of the date of the financial statements and the reported amounts of net sales and expenses during the reporting period. The critical accounting polices used in the preparation of the consolidated financial statements are those that are important both to the presentation of financial condition and results of operations and require significant judgments with regards to estimates. We base our estimates on historical experience and on various assumptions we believe are reasonable under the circumstances, the results of which form the basis for making judgments about the carrying value of assets and liabilities that are not readily apparent from other sources. We believe the current assumptions and other considerations used to estimate amounts reflected in our financial statements are appropriate; however, actual results could differ from these estimates.
We consider the allowance for doubtful accounts, vendor rebates and promotional allowances, claims liabilities and insurance recoverables, valuation of pension assets and obligations, valuation of long-lived assets and goodwill, realizability of deferred income taxes and uncertain tax positions to be those estimates which involve a higher degree of judgment and complexity. We believe that the following represent the more critical accounting policies, which are subject to estimates and assumptions used in the preparation of our financial statements.
Allowance for Doubtful Accounts
We maintain an allowance for doubtful accounts for losses we estimate will arise from our trade customers’ inability to make required payments. We evaluate the collectability of accounts receivable and determine the appropriate allowance for doubtful accounts based on historical experience and a review of specific customer accounts. In determining the adequacy of allowances for customer receivables, we analyze factors such as the value of any collateral, customer financial statements, historical collection experience, aging of receivables, general economic conditions and other factors. It is possible that the accuracy of the estimation process could be materially affected by different judgments as to the collectability based on information considered and further deterioration of accounts. If circumstances change (i.e., further evidence of material adverse creditworthiness, additional accounts become credit risks, store closures or deterioration in general economic conditions), our estimates of the recoverability of amounts due us could be reduced by a material amount.
The allowance for doubtful accounts at December 31, 2017 and 2016 amounted to 1.6% and 1.9%, respectively, of gross trade accounts receivable.
Bad debt expense associated with our trade customer receivables was $1.1 million, $2.0 million and $1.3 million in 2017, 2016 and 2015, respectively. As a percentage of net sales, our bad debt expense was less than 0.1% for each of 2017, 2016 and 2015.
Vendor Rebates and Promotional Allowances
Periodic payments from vendors in various forms including rebates, promotional allowances and volume discounts are reflected in the carrying value of the related inventory when earned and as cost of goods sold as the related merchandise is sold. Up-front consideration received from vendors linked to purchase or other commitments is initially deferred and amortized ratably to cost of goods sold as the performance of the activities specified by the vendor to earn the fee is completed. Cooperative marketing incentives from suppliers are recorded as reductions to cost of goods sold to the extent the vendor considerations exceed the costs relating to the programs. These amounts are recorded in the period the related promotional or merchandising programs are provided. Certain vendor incentive promotions require that we make assumptions and judgments regarding, for example, the likelihood of achieving market share levels or attaining specified levels of purchases. Vendor incentives are at the discretion of our vendors and can fluctuate due to changes in vendor strategies and market requirements.
38
Claims Liabilities and Insurance Recoverables
We maintain reserves related to workers’ compensation, general and auto liability and health and welfare programs that are principally self-insured. Our workers’ compensation, general and auto liability insurance policies currently include a deductible of $500,000 per occurrence and we maintain excess loss insurance that covers any health and welfare costs in excess of $400,000 per person per year.
Our reserves for workers’ compensation, general and auto insurance liabilities are estimated based on applying an actuarially derived loss development factor to our incurred losses, including losses for claims incurred but not yet reported. Actuarial projections of losses concerning workers’ compensation, general and auto insurance liabilities are subject to a high degree of variability. Among the causes of this variability are unpredictable external factors affecting future inflation rates, health care costs, litigation trends, legal interpretations, legislative reforms, benefit level changes and claim settlement patterns. Our reserve for health and welfare claims includes an estimate of claims incurred but not yet reported, which is derived primarily from historical experience.
Our claim liabilities and the related recoverables from insurance carriers for estimated claims in excess of the deductible and other insured events are presented in their gross amounts because there is no right of offset. The following is a summary of our net reserves as of December 31, 2017 and 2016 (in millions):
2017 | 2016 | ||||||||||||||||||||||
Current | Long-Term | Total | Current | Long-Term | Total | ||||||||||||||||||
Gross claims liabilities: | |||||||||||||||||||||||
Workers’ compensation | $ | 7.1 | $ | 21.3 | $ | 28.4 | $ | 6.6 | $ | 22.3 | $ | 28.9 | |||||||||||
Auto & general insurance | 3.6 | 5.0 | 8.6 | 3.1 | 4.5 | 7.6 | |||||||||||||||||
Health & welfare | 4.3 | — | 4.3 | 3.7 | — | 3.7 | |||||||||||||||||
Total gross claims liabilities | $ | 15.0 | $ | 26.3 | $ | 41.3 | $ | 13.4 | $ | 26.8 | $ | 40.2 | |||||||||||
Insurance recoverables | $ | (1.7 | ) | $ | (10.4 | ) | $ | (12.1 | ) | $ | (2.1 | ) | $ | (12.9 | ) | $ | (15.0 | ) | |||||
Reserves, net: | |||||||||||||||||||||||
Workers’ compensation | $ | 6.2 | $ | 12.6 | $ | 18.8 | $ | 5.7 | $ | 11.3 | $ | 17.0 | |||||||||||
Auto & general insurance | 2.8 | 3.3 | 6.1 | 1.9 | 2.6 | 4.5 | |||||||||||||||||
Health & welfare | 4.3 | — | 4.3 | 3.7 | — | 3.7 | |||||||||||||||||
Reserves, net | $ | 13.3 | $ | 15.9 | $ | 29.2 | $ | 11.3 | $ | 13.9 | $ | 25.2 | |||||||||||
The increase in these reserves for 2017 was due primarily to a higher number of claims and reported losses for our workers compensation, general and auto insurance liability, due in part to the growth of our business, including acquisitions. A 10% change in our incurred but not reported estimates would increase or decrease the estimated reserves for our workers’ compensation, general and auto insurance, and health and welfare liabilities by $1.1 million, $0.3 million and $0.4 million as of December 31, 2017, respectively.
Valuation of Pension Assets and Obligations
We sponsored a qualified defined-benefit pension plan and a post-retirement benefit plan (collectively, “the Pension Plans”) for employees hired before September 1986 and certain employees of Fleming, our former parent company. As discussed in Note 11 - Employee Benefit Plans to our consolidated financial statements, our qualified defined-benefit pension plan was overfunded by $0.2 million and underfunded by $4.3 million at December 31, 2017 and 2016, respectively.
On September 14, 2016, our Board of Directors approved a motion to terminate our qualified defined-benefit pension plan. We settled our pension liabilities through annuities purchased in December 2017. At such time, we recognized a non-cash settlement charge in SG&A expenses within the consolidated statements of operations related to unrecognized actuarial losses in AOCI of approximately $17.2 million. In addition, we made cash contributions of $4.9 million to fully fund the pension obligation prior to terminating in 2017 (see Note 11 - Employee Benefit Plans). There have been no new entrants to the pension or non-pension post-retirement benefit plans after those benefit plans were frozen on September 30, 1986.
The determination of the obligation and expense associated with our Pension Plans is dependent, in part, on our selection of certain assumptions used by our independent actuaries in calculating these amounts. These assumptions are disclosed in Note 11 - Employee Benefit Plans and include, among other things, the weighted-average discount rate and the expected weighted-average long-term rate of return on plan assets. Actual results in any given year will often differ from actuarial assumptions because of economic and other factors. In accordance with U.S. GAAP, actual results that differ from actuarial assumptions are accumulated
39
and amortized over future periods and therefore affect recognized expense and the recorded obligation in such future periods. While we believe our assumptions are appropriate, significant differences in actual results or changes in our assumptions may materially affect our pension and other post-retirement obligations and associated future expense.
Valuation of Long-Lived Assets
We review our long-lived assets for indicators of impairment whenever events or changes in circumstances indicate that the carrying amounts of such assets may not be recoverable. Long-lived assets consist primarily of land, buildings, delivery, warehouse and office equipment, leasehold improvements and intangible assets with definite useful lives. An impairment of long-lived assets exists when the carrying amount of a long-lived asset, or asset group, exceeds its fair value. Impairment losses are recorded when the carrying amount of the impaired asset is not recoverable. Recoverability is determined by comparing the carrying amount of the asset (or asset group) to the undiscounted cash flows which are expected to be generated from its use. Our estimates of future cash flows are based on historical experience and management’s expectations of relevant customers and markets and other operational factors. These estimates project future cash flows several years into the future and can be affected by factors such as competition, inflation and other economic conditions. We have assessed our asset groups and determined we have five asset groups. We did not record impairment losses related to long-lived assets in any of the years ended December 31, 2017, 2016 and 2015.
Valuation of Goodwill
Goodwill represents the excess of the purchase consideration of an acquired business over the fair value of the identifiable tangible and intangible assets acquired and liabilities assumed in a business combination. Goodwill is not subject to amortization but must be evaluated for impairment. We test goodwill for impairment annually as of October 1, or whenever events or circumstances indicate that it is more likely than not that the fair value of a reporting unit is below its carrying amount. The Company’s reporting units, which are the United States and Canada, also represent the Company’s operating segments. Whenever events or circumstances change, we assess the related qualitative factors to determine whether it is necessary to perform the two-step quantitative goodwill impairment test. The tests to evaluate goodwill for impairment are performed at the reporting unit level. In the first step of the quantitative impairment test, we compare the fair value of the reporting unit to its carrying value. If the fair value of the reporting unit is less than its carrying value, we perform a second step to determine the implied fair value of goodwill associated with the reporting unit. If the carrying value of goodwill exceeds the implied fair value of goodwill, such excess represents the amount of goodwill impairment for which an impairment loss would be recorded. Determining the fair value of a reporting unit involves the use of significant estimates and assumptions. The estimated fair value of each reporting unit is based on the discounted cash flow method, which is based on historical and forecasted amounts specific to each reporting unit and considers sales, gross profit, operating profit and cash flows and general economic and market conditions, as well as the impact of planned business and operational strategies and other estimates and assumptions for future growth rates, working capital and capital expenditures. We base our fair value estimates on assumptions we believe to be reasonable at the time, but such assumptions are subject to inherent uncertainty. We did not record any impairment charges related to goodwill during the years ended December 31, 2017, 2016 and 2015.
In connection with our annual goodwill impairment testing performed during 2017, the first step of the test indicated that the fair values of the applicable reporting units significantly exceeded their carrying values, and accordingly, no further testing of goodwill was required. However, changes in the judgments and estimates underlying our analysis of goodwill for possible impairment, including expected future cash flows and discount rate, could result in a significantly different estimate of the fair value of the reporting units in the future and could result in impairment of goodwill.
Non-GAAP Financial Information
The financial statements in this Annual Report on Form 10-K are prepared in accordance with GAAP. Core-Mark uses certain non-GAAP financial measures including (i) Adjusted EBITDA, (ii) net sales, less excise taxes, (iii) remaining gross profit, (iv) remaining gross profit margin, (v) remaining gross profit margin less excise taxes, and (vi) cigarette remaining gross profit per carton. We believe these non-GAAP financial measures provide meaningful supplemental information for investors regarding the performance of our business and facilitate a meaningful period to period evaluation. We also believe these measures allow investors to view results in a manner similar to the method used by our management. Management uses these non-GAAP financial measures in order to have comparable financial results to analyze changes in our underlying business. These non-GAAP measures should be considered as a supplement to, and not as a substitute for, or superior to, financial measures calculated in accordance with GAAP. These measures may be defined differently than other companies and therefore, such measures may not be comparable to ours. We strongly encourage investors and stockholders to review our financial statements and publicly filed reports in their entirety and not to rely on any single financial measure. These non-GAAP measures are defined as follows:
40
(i) Adjusted EBITDA is a measure used by management to measure operating performance. Adjusted EBITDA is also among the primary measures used externally by our investors, analysts and peers in our industry for purposes of valuation and comparing our results to other companies. Adjusted EBITDA is equal to net income adding back net interest expense, provision for income taxes, depreciation and amortization, LIFO expense, stock-based compensation expense, net foreign currency transaction gains or losses and pension termination expenses. See Adjusted EBITDA tables to our Management's Discussion and Analysis for additional details on the components of Adjusted EBITDA.
(ii) Net sales less excise taxes is a non-GAAP financial measure which we provide to separate the increase in sales and gross profits due to product sales growth and increases in state, local and provincial excise taxes, which we are responsible for collecting and remitting. Federal excise taxes are levied on the manufacturers who pass the tax on to us as part of the product cost and thus are not a component of our excise taxes. Although increases in cigarette taxes result in higher net sales, our overall gross profit percentage may be reduced.
(iii) Remaining gross profit (including cigarette remaining gross profit and Food/Non-Food remaining gross profit), (iv) remaining gross profit margin, (v) remaining gross profit margin less excise taxes, and (vi) cigarette remaining gross profit per carton, are non-GAAP financial measures, which we provide to segregate the effects of LIFO expense, cigarette and candy inventory holding gains and certain other items that significantly affect the comparability of gross profit.
The following tables reconcile net sales less excise taxes to net sales and remaining gross profit to gross profit, their most comparable financial measures under U.S. GAAP (in millions) (1):
2017 | 2016 | 2015 | ||||||||||
Amounts | Amounts | Amounts | ||||||||||
Net sales | $ | 15,687.6 | $ | 14,529.4 | $ | 11,069.4 | ||||||
Excise taxes | (3,462.6 | ) | (3,022.0 | ) | (2,211.7 | ) | ||||||
Net sales, less excise taxes (non-GAAP) | $ | 12,225.0 | $ | 11,507.4 | $ | 8,857.7 | ||||||
Gross profit | $ | 791.7 | $ | 736.9 | $ | 637.9 | ||||||
Cigarette inventory holding gains | (16.1 | ) | (15.3 | ) | (10.1 | ) | ||||||
Cigarette tax stamp holding gains | — | — | (9.0 | ) | ||||||||
OTP tax refunds | (3.9 | ) | — | (1.8 | ) | |||||||
LIFO expense | 21.5 | 13.2 | 1.9 | |||||||||
Remaining gross profit (non-GAAP) | $ | 793.2 | $ | 734.8 | $ | 618.9 | ||||||
Remaining gross profit % (non-GAAP) | 5.06 | % | 5.06 | % | 5.59 | % | ||||||
Remaining gross profit % less excise taxes (non-GAAP) | 6.49 | % | 6.39 | % | 6.99 | % | ||||||
Gross profit % | 5.05 | % | 5.07 | % | 5.76 | % | ||||||
Gross profit % less excise taxes (non-GAAP) | 6.48 | % | 6.40 | % | 7.20 | % | ||||||
______________________________________________
(1) Amounts and percentages have been rounded for presentation purposes and might differ from unrounded results.
41
2017 | 2016 | 2015 | ||||||||||
Amounts | Amounts | Amounts | ||||||||||
Cigarettes: | ||||||||||||
Net sales | $ | 10,887.4 | $ | 10,335.7 | $ | 7,528.5 | ||||||
Excise taxes | (3,094.3 | ) | (2,716.2 | ) | (1,977.5 | ) | ||||||
Net sales, less excise taxes (non-GAAP) | $ | 7,793.1 | $ | 7,619.5 | $ | 5,551.0 | ||||||
Gross profit | $ | 213.8 | $ | 220.0 | $ | 180.5 | ||||||
Cigarette inventory holding gains | (16.1 | ) | (15.3 | ) | (10.1 | ) | ||||||
Cigarette tax stamp holding gains | — | — | (9.0 | ) | ||||||||
LIFO expense | 17.5 | 11.7 | 11.0 | |||||||||
Remaining gross profit (non-GAAP) | $ | 215.2 | $ | 216.4 | $ | 172.4 | ||||||
Remaining gross profit % (non-GAAP) | 1.98 | % | 2.09 | % | 2.29 | % | ||||||
Remaining gross profit % less excise taxes (non-GAAP) | 2.76 | % | 2.84 | % | 3.11 | % | ||||||
Gross profit % | 1.96 | % | 2.13 | % | 2.40 | % | ||||||
Gross profit % less excise taxes (non-GAAP) | 2.74 | % | 2.89 | % | 3.25 | % | ||||||
______________________________________________
(1) Amounts and percentages have been rounded for presentation purposes and might differ from unrounded results.
2017 | 2016 | 2015 | ||||||||||
Amounts | Amounts | Amounts | ||||||||||
Food/Non-food: | ||||||||||||
Net sales | $ | 4,800.2 | $ | 4,193.7 | $ | 3,540.9 | ||||||
Excise taxes | (368.3 | ) | (305.8 | ) | (234.2 | ) | ||||||
Net sales, less excise taxes (non-GAAP) | $ | 4,431.9 | $ | 3,887.9 | $ | 3,306.7 | ||||||
Gross profit | $ | 577.9 | $ | 516.9 | $ | 457.4 | ||||||
OTP tax refunds | (3.9 | ) | — | (1.8 | ) | |||||||
LIFO expense (income) | 4.0 | 1.5 | (9.1 | ) | ||||||||
Remaining gross profit (non-GAAP) | $ | 578.0 | $ | 518.4 | $ | 446.5 | ||||||
Remaining gross profit % (non-GAAP) | 12.04 | % | 12.36 | % | 12.61 | % | ||||||
Remaining gross profit % less excise taxes (non-GAAP) | 13.04 | % | 13.33 | % | 13.50 | % | ||||||
Gross profit % | 12.04 | % | 12.33 | % | 12.92 | % | ||||||
Gross profit % less excise taxes (non-GAAP) | 13.04 | % | 13.30 | % | 13.83 | % | ||||||
(1) Amounts and percentages have been rounded for presentation purposes and might differ from unrounded results.
42
ITEM 7A. QUANTITATIVE AND QUALITATIVE DISCLOSURES ABOUT MARKET RISK
Our most significant exposure to market risk comes from changes in short-term interest rates on our variable rate debt. Depending upon the borrowing option chosen, the interest charged is generally based upon the prime rate or LIBOR plus an applicable margin. If interest rates increased 24 basis points (which approximates 10% of the weighted-average interest rate on our average borrowings during the year ended December 31, 2017), our results of operations and cash flows would not be materially affected.
We are exposed to foreign currency risk, primarily through our operations in Canada which conduct business in Canadian dollars. We record gains and losses within our stockholders’ equity due to the translation of the Canadian branches’ financial statements into U.S. dollars. A 10% unfavorable change in the weighted average Canadian/U.S. dollar exchange rate for 2017 would have reduced our net sales for 2017 by 0.9% and would not have materially impacted our operating income. Additionally, we incur foreign currency transaction gains and losses related to the level of activity between the U.S. and Canada. In 2017, we realized foreign currency transaction gains of $1.8 million. A 10% unfavorable change in the Canadian/U.S. dollar noon exchange rate on December 31, 2017 would have had an immaterial impact on foreign currency transaction gains for 2017. We did not engage in hedging transactions during 2017, 2016 or 2015.
43
ITEM 8. | FINANCIAL STATEMENTS AND SUPPLEMENTARY DATA |
Page | |
(a) Financial Statements filed as part of this Annual Report on Form 10-K | |
1. Financial Statements | |
A. Audited Financial Statements | |
44
REPORT OF INDEPENDENT REGISTERED PUBLIC ACCOUNTING FIRM
To the Stockholders and the Board of Directors of Core-Mark Holding Company, Inc.
Opinion on the Financial Statements
We have audited the accompanying consolidated balance sheets of Core-Mark Holding Company, Inc. and subsidiaries (the "Company") as of December 31, 2017 and 2016, the related consolidated statements of operations, comprehensive income, stockholders' equity, and cash flows, for each of the three years in the period ended December 31, 2017, and the related notes and the schedule listed in the Index at Item 15 (collectively referred to as the "financial statements"). In our opinion, the financial statements present fairly, in all material respects, the financial position of the Company as of December 31, 2017 and 2016, and the results of its operations and its cash flows for each of the three years in the period ended December 31, 2017, in conformity with accounting principles generally accepted in the United States of America.
We have also audited, in accordance with the standards of the Public Company Accounting Oversight Board (United States) (PCAOB), the Company's internal control over financial reporting as of December 31, 2017, based on criteria established in Internal Control - Integrated Framework (2013) issued by the Committee of Sponsoring Organizations of the Treadway Commission and our report dated March 1, 2018, expressed an unqualified opinion on the Company's internal control over financial reporting.
Basis for Opinion
These financial statements are the responsibility of the Company's management. Our responsibility is to express an opinion on the Company's financial statements based on our audits. We are a public accounting firm registered with the PCAOB and are required to be independent with respect to the Company in accordance with the U.S. federal securities laws and the applicable rules and regulations of the Securities and Exchange Commission and the PCAOB.
We conducted our audits in accordance with the standards of the PCAOB. Those standards require that we plan and perform the audit to obtain reasonable assurance about whether the financial statements are free of material misstatement, whether due to error or fraud. Our audits included performing procedures to assess the risks of material misstatement of the financial statements, whether due to error or fraud, and performing procedures that respond to those risks. Such procedures included examining, on a test basis, evidence regarding the amounts and disclosures in the financial statements. Our audits also included evaluating the accounting principles used and significant estimates made by management, as well as evaluating the overall presentation of the financial statements. We believe that our audits provide a reasonable basis for our opinion.
/s/ Deloitte & Touche LLP |
San Francisco, California |
March 1, 2018 |
We have served as the Company's auditor since 2006.
45
CORE-MARK HOLDING COMPANY, INC. AND SUBSIDIARIES
CONSOLIDATED BALANCE SHEETS
(In millions, except share and per share data)
December 31, | |||||||
2017 | 2016 | ||||||
Assets | |||||||
Current assets: | |||||||
Cash and cash equivalents | $ | 41.6 | $ | 26.4 | |||
Restricted cash | — | 15.3 | |||||
Accounts receivable, net of allowance for doubtful accounts of $7.3 and $7.1 | |||||||
at December 31, 2017 and December 31, 2016, respectively (Note 4) | 442.3 | 365.9 | |||||
Other receivables, net (Note 4) | 94.4 | 106.5 | |||||
Inventories, net (Note 5) | 689.1 | 596.6 | |||||
Deposits and prepayments (Note 4) | 108.0 | 82.8 | |||||
Total current assets | 1,375.4 | 1,193.5 | |||||
Property and equipment, net (Note 6) | 249.0 | 194.7 | |||||
Goodwill (Note 7) | 72.8 | 36.0 | |||||
Other intangible assets, net (Note 7) | 59.1 | 41.5 | |||||
Other non-current assets, net (Note 4) (1) | 26.2 | 26.5 | |||||
Total assets | $ | 1,782.5 | $ | 1,492.2 | |||
Liabilities and Stockholders’ Equity | |||||||
Current liabilities: | |||||||
Accounts payable | $ | 169.9 | $ | 119.2 | |||
Book overdrafts (Note 2) | 45.3 | 37.9 | |||||
Cigarette and tobacco taxes payable | 304.5 | 259.8 | |||||
Accrued liabilities (Note 4) | 124.8 | 131.8 | |||||
Total current liabilities | 644.5 | 548.7 | |||||
Long-term debt (Note 8) | 512.9 | 347.7 | |||||
Deferred income taxes (Note 10) (1) | 27.4 | 25.3 | |||||
Other long-term liabilities | 14.3 | 11.5 | |||||
Claims liabilities (Note 2) | 26.3 | 26.8 | |||||
Pension liabilities (Note 11) | 1.9 | 2.4 | |||||
Total liabilities | 1,227.3 | 962.4 | |||||
Commitments and contingencies (Note 9) | |||||||
Stockholders’ equity (Note 14): | |||||||
Common stock, $0.01 par value (100,000,000 shares authorized, 52,397,668 and | |||||||
52,227,511 shares issued; 46,165,009 and 46,152,958 shares outstanding at | |||||||
December 31, 2017 and December 31, 2016, respectively) | 0.5 | 0.5 | |||||
Additional paid-in capital | 276.8 | 275.5 | |||||
Treasury stock at cost (6,232,659 and 6,074,553 shares of common stock at | |||||||
December 31, 2017 and December 31, 2016, respectively) | (75.1 | ) | (70.7 | ) | |||
Retained earnings | 355.1 | 338.7 | |||||
Accumulated other comprehensive loss (Note 15) | (2.1 | ) | (14.2 | ) | |||
Total stockholders’ equity | 555.2 | 529.8 | |||||
Total liabilities and stockholders’ equity | $ | 1,782.5 | $ | 1,492.2 | |||
______________________________________________
(1) | Retrospective adoption of ASU No. 2015-17, Income Taxes: Balance Sheet Classification of Deferred Taxes. Refer to Note 2. |
The accompanying notes are an integral part of these consolidated financial statements.
46
CORE-MARK HOLDING COMPANY, INC. AND SUBSIDIARIES
CONSOLIDATED STATEMENTS OF OPERATIONS
(In millions, except per share data)
Year Ended December 31, | |||||||||||
2017 | 2016 | 2015 | |||||||||
Net sales | $ | 15,687.6 | $ | 14,529.4 | $ | 11,069.4 | |||||
Cost of goods sold | 14,895.9 | 13,792.5 | 10,431.5 | ||||||||
Gross profit | 791.7 | 736.9 | 637.9 | ||||||||
Warehousing and distribution expenses | 504.1 | 431.2 | 352.6 | ||||||||
Selling, general and administrative expenses | 241.5 | 210.3 | 196.0 | ||||||||
Amortization of intangible assets | 8.5 | 5.3 | 2.6 | ||||||||
Total operating expenses | 754.1 | 646.8 | 551.2 | ||||||||
Income from operations | 37.6 | 90.1 | 86.7 | ||||||||
Interest expense | (11.3 | ) | (5.3 | ) | (2.5 | ) | |||||
Interest income | 0.3 | 0.2 | 0.5 | ||||||||
Foreign currency transaction gains (losses), net | 1.8 | 0.5 | (1.8 | ) | |||||||
Income before income taxes | 28.4 | 85.5 | 82.9 | ||||||||
Benefit (provision) for income taxes (Note 10) | 5.1 | (31.3 | ) | (31.4 | ) | ||||||
Net income | $ | 33.5 | $ | 54.2 | $ | 51.5 | |||||
Basic net income per common share (Note 12) | $ | 0.72 | $ | 1.17 | $ | 1.12 | |||||
Diluted net income per common share (Note 12) | $ | 0.72 | $ | 1.17 | $ | 1.11 | |||||
Basic weighted-average shares (Note 12) | 46.3 | 46.3 | 46.2 | ||||||||
Diluted weighted-average shares (Note 12) | 46.4 | 46.5 | 46.6 | ||||||||
______________________________________________
The accompanying notes are an integral part of these consolidated financial statements.
47
CORE-MARK HOLDING COMPANY, INC. AND SUBSIDIARIES
CONSOLIDATED STATEMENTS OF COMPREHENSIVE INCOME
(In millions)
Year Ended December 31, | |||||||||||
2017 | 2016 | 2015 | |||||||||
Net income | $ | 33.5 | $ | 54.2 | $ | 51.5 | |||||
Other comprehensive income (loss), net of tax: | |||||||||||
Defined benefit plan adjustments (Note 15) | 11.0 | 0.2 | 0.2 | ||||||||
Foreign currency translation gain (loss), net | 1.1 | 1.9 | (4.9 | ) | |||||||
Other comprehensive income (loss), net of tax | 12.1 | 2.1 | (4.7 | ) | |||||||
Comprehensive income | $ | 45.6 | $ | 56.3 | $ | 46.8 | |||||
______________________________________________
The accompanying notes are an integral part of these consolidated financial statements.
48
CORE-MARK HOLDING COMPANY, INC. AND SUBSIDIARIES
CONSOLIDATED STATEMENTS OF STOCKHOLDERS' EQUITY
(In millions (1))
Common Stock Issued | Additional Paid-in | Treasury Stock | Retained | Accumulated Other Comprehensive | Total Stockholders' | ||||||||||||||||||||||||
Shares | Amount | Capital | Shares | Amount | Earnings | (Loss) Income | Equity | ||||||||||||||||||||||
Balance, December 31, 2014 | 51.6 | $ | 0.5 | $ | 263.6 | (5.6 | ) | $ | (52.6 | ) | $ | 261.4 | $ | (11.6 | ) | $ | 461.3 | ||||||||||||
Net income | — | — | — | — | — | 51.5 | — | 51.5 | |||||||||||||||||||||
Other comprehensive loss, net of tax | — | — | — | — | — | — | (4.7 | ) | (4.7 | ) | |||||||||||||||||||
Dividends declared | — | — | — | — | — | (12.9 | ) | — | (12.9 | ) | |||||||||||||||||||
Stock-based compensation expense | — | — | 8.7 | — | — | — | — | 8.7 | |||||||||||||||||||||
Cash proceeds from exercise of | |||||||||||||||||||||||||||||
common stock options | 0.2 | — | 0.4 | — | — | — | — | 0.4 | |||||||||||||||||||||
Excess tax deductions associated with | |||||||||||||||||||||||||||||
stock-based compensation | — | — | 2.2 | — | — | — | — | 2.2 | |||||||||||||||||||||
Issuance of stock based instruments, net of | |||||||||||||||||||||||||||||
shares withheld for employee taxes | 0.2 | — | (3.3 | ) | — | — | — | — | (3.3 | ) | |||||||||||||||||||
Repurchase of common stock | — | — | — | (0.2 | ) | (9.2 | ) | — | — | (9.2 | ) | ||||||||||||||||||
Balance, December 31, 2015 | 52.0 | 0.5 | 271.6 | (5.8 | ) | (61.8 | ) | 300.0 | (16.3 | ) | 494.0 | ||||||||||||||||||
Net income | — | — | — | — | — | 54.2 | — | 54.2 | |||||||||||||||||||||
Other comprehensive loss, net of tax | — | — | — | — | — | — | 2.1 | 2.1 | |||||||||||||||||||||
Dividends declared | — | — | — | — | — | (15.5 | ) | — | (15.5 | ) | |||||||||||||||||||
Stock-based compensation expense | — | — | 6.1 | — | — | — | — | 6.1 | |||||||||||||||||||||
Cash proceeds from exercise of | |||||||||||||||||||||||||||||
common stock options | 0.1 | — | 0.3 | — | — | — | — | 0.3 | |||||||||||||||||||||
Excess tax deductions associated with | |||||||||||||||||||||||||||||
stock-based compensation | — | — | 2.9 | — | — | — | — | 2.9 | |||||||||||||||||||||
Issuance of stock based instruments, net of | |||||||||||||||||||||||||||||
shares withheld for employee taxes | 0.1 | — | (5.4 | ) | — | — | — | — | (5.4 | ) | |||||||||||||||||||
Repurchase of common stock | — | — | — | (0.2 | ) | (8.9 | ) | — | — | (8.9 | ) | ||||||||||||||||||
Balance, December 31, 2016 | 52.2 | 0.5 | 275.5 | (6.0 | ) | (70.7 | ) | 338.7 | (14.2 | ) | 529.8 | ||||||||||||||||||
Net income | — | — | — | — | — | 33.5 | — | 33.5 | |||||||||||||||||||||
Other comprehensive income, net of tax | — | — | — | — | — | — | 12.1 | 12.1 | |||||||||||||||||||||
Dividends declared | — | — | — | — | — | (17.1 | ) | — | (17.1 | ) | |||||||||||||||||||
Stock-based compensation expense | — | — | 5.0 | — | — | — | — | 5.0 | |||||||||||||||||||||
Issuance of stock based instruments, net of | |||||||||||||||||||||||||||||
shares withheld for employee taxes | 0.2 | — | (3.7 | ) | — | — | — | — | (3.7 | ) | |||||||||||||||||||
Repurchase of common stock | — | — | — | (0.2 | ) | (4.4 | ) | — | — | (4.4 | ) | ||||||||||||||||||
Balance, December 31, 2017 | 52.4 | $ | 0.5 | $ | 276.8 | (6.2 | ) | $ | (75.1 | ) | $ | 355.1 | $ | (2.1 | ) | $ | 555.2 | ||||||||||||
______________________________________________
(1) | Amounts have been rounded for presentation purposes and might differ from unrounded results. |
The accompanying notes are an integral part of these consolidated financial statements.
49
CORE-MARK HOLDING COMPANY, INC. AND SUBSIDIARIES
CONSOLIDATED STATEMENTS OF CASH FLOWS
(In millions)
Year Ended December 31, | |||||||||||
2017 | 2016 | 2015 | |||||||||
Cash flows from operating activities: | |||||||||||
Net income | $ | 33.5 | $ | 54.2 | $ | 51.5 | |||||
Adjustments to reconcile net income to net cash provided by (used in) operating activities: | |||||||||||
LIFO and inventory provisions | 21.3 | 13.2 | 2.0 | ||||||||
Amortization of debt issuance costs | 0.8 | 0.5 | 0.3 | ||||||||
Stock-based compensation expense | 5.0 | 6.1 | 8.7 | ||||||||
Bad debt expense, net | 1.1 | 2.0 | 1.3 | ||||||||
Gain on disposals | (0.4 | ) | — | — | |||||||
Depreciation and amortization | 54.4 | 42.9 | 37.9 | ||||||||
Foreign currency (gains) losses, net | (1.8 | ) | (0.5 | ) | 1.8 | ||||||
Deferred income taxes | 2.0 | 8.4 | 8.9 | ||||||||
Pension settlement charge | 17.2 | 1.3 | 1.6 | ||||||||
Changes in operating assets and liabilities: | |||||||||||
Accounts receivable, net | (32.7 | ) | (59.2 | ) | (28.1 | ) | |||||
Other receivables, net | 8.0 | (37.0 | ) | (8.9 | ) | ||||||
Inventories, net | (70.5 | ) | (180.4 | ) | 1.5 | ||||||
Deposits, prepayments and other non-current assets | (16.9 | ) | (19.9 | ) | (25.9 | ) | |||||
Accounts payable | 50.2 | (11.0 | ) | 4.0 | |||||||
Cigarette and tobacco taxes payable | 40.7 | 65.5 | 13.8 | ||||||||
Pension, claims, accrued and other long-term liabilities | (18.3 | ) | 18.8 | 9.0 | |||||||
Excess tax deductions associated with stock-based compensation (1) | — | (2.9 | ) | (2.2 | ) | ||||||
Net cash provided by (used in) operating activities | 93.6 | (98.0 | ) | 77.2 | |||||||
Cash flows from investing activities: | |||||||||||
Acquisition of business, net of cash acquired | (169.0 | ) | (88.4 | ) | (9.0 | ) | |||||
Additions to property and equipment, net | (48.2 | ) | (54.3 | ) | (30.3 | ) | |||||
Capitalization of software and related development costs | (4.4 | ) | (7.7 | ) | (8.7 | ) | |||||
Proceeds from sale of property and equipment | — | — | 0.3 | ||||||||
Net cash used in investing activities | (221.6 | ) | (150.4 | ) | (47.7 | ) | |||||
Cash flows from financing activities: | |||||||||||
Borrowings under revolving credit facility | 1,708.6 | 1,638.7 | 936.2 | ||||||||
Repayments under revolving credit facility | (1,556.4 | ) | (1,349.7 | ) | (945.1 | ) | |||||
Payments of financing costs | (1.8 | ) | (2.0 | ) | (0.4 | ) | |||||
Payments of capital leases | (2.1 | ) | (2.4 | ) | (2.3 | ) | |||||
Dividends paid | (17.2 | ) | (15.5 | ) | (12.8 | ) | |||||
Repurchases of common stock | (4.4 | ) | (8.9 | ) | (9.2 | ) | |||||
Proceeds from exercise of common stock options | — | 0.3 | 0.4 | ||||||||
Tax withholdings related to net share settlements of restricted stock units | (3.7 | ) | (5.4 | ) | (3.3 | ) | |||||
Excess tax deductions associated with stock-based compensation (1) | — | 2.9 | 2.2 | ||||||||
Increase in book overdrafts, net | 7.4 | 8.7 | 0.1 | ||||||||
Net cash provided by (used in) financing activities | 130.4 | 266.7 | (34.2 | ) | |||||||
Effects of changes in foreign exchange rates | (2.5 | ) | 2.4 | (1.7 | ) | ||||||
Change in cash, cash equivalents and restricted cash (Note 2) | (0.1 | ) | 20.7 | (6.4 | ) | ||||||
Cash, cash equivalents and restricted cash at beginning of period (Note 2) | 41.7 | 21.0 | 27.4 | ||||||||
Cash, cash equivalents and restricted cash at end of period (Note 2) | $ | 41.6 | $ | 41.7 | $ | 21.0 | |||||
Supplemental disclosures: | |||||||||||
Cash paid during the period for: | |||||||||||
Income taxes paid, net | $ | 16.7 | $ | 20.9 | $ | 26.8 | |||||
Interest paid | $ | 9.2 | $ | 3.7 | $ | 1.3 | |||||
Non-cash capital lease obligations incurred | $ | 16.5 | $ | 0.1 | $ | 5.4 | |||||
Non-cash indemnification holdback | $ | 5.0 | $ | — | $ | — | |||||
Unpaid property and equipment purchases included in accrued liabilities | $ | 1.6 | $ | 2.9 | $ | 5.1 | |||||
(1) | Prospective adoption of ASU No. 2016-09, Compensation - Stock Compensation: Topic 718: Improvements to Employee Share-Based Payment Accounting. Refer to Note 2. |
_____________________________________________
The accompanying notes are an integral part of these consolidated financial statements.
50
CORE-MARK HOLDING COMPANY, INC. AND SUBSIDIARIES
NOTES TO CONSOLIDATED FINANCIAL STATEMENTS
1. | Summary of Company Information |
Business
Core-Mark Holding Company, Inc. and subsidiaries (referred to herein as “the Company” or “Core-Mark”) is one of the largest marketers of fresh and broad-line supply solutions to the convenience retail industry in North America. The Company offers a full range of products, marketing programs and technology solutions to approximately 45,000 customer locations in the United States (“U.S.”) and Canada. The Company’s customers include traditional convenience stores, drug stores, big box or supercenter stores, grocery stores, liquor stores and other specialty and small format stores that carry convenience products. The Company’s product offering includes cigarettes, other tobacco products ("OTP"), candy, snacks, fast food, groceries, fresh products, dairy, bread, beverages, general merchandise and health and beauty care products. The Company operates a network of primary 32 distribution centers in the U.S. and Canada (excluding two distribution facilities it operates as a third-party logistics provider). Twenty-seven of the Company’s distribution centers are located in the U.S. and five are located in Canada.
2. | Summary of Significant Accounting Policies |
Basis of Presentation and Principles of Consolidation
The consolidated financial statements include Core-Mark and its wholly-owned subsidiaries. All intercompany balances and transactions have been eliminated in the consolidated financial statements.
Use of Estimates
The preparation of financial statements in accordance with accounting principles generally accepted in the U.S. (“U.S. GAAP”) requires management to make certain estimates and assumptions that affect the reported amounts of assets and liabilities and the disclosure of contingent assets and liabilities at the date of the financial statements and the reported amounts of revenues and expenses during the reporting period. The Company considers the allowance for doubtful accounts, vendor rebates and promotional allowances, claims liabilities and insurance recoverables, valuation of pension assets and obligations, valuation of long-lived assets and goodwill, realizability of deferred income taxes and uncertain tax positions to be those estimates which involve a higher degree of judgment and complexity. Actual results could differ from those estimates.
Revenue Recognition
The Company recognizes revenue at the point at which the product is delivered and title passes to the customer. The Company includes fees charged to customers for shipping and handling activities in net sales and the related costs in cost of goods sold. Revenues are reported net of customer incentives, discounts and returns, including an allowance for estimated returns. The allowance for sales returns is calculated based on the Company’s returns experience, which has historically not been significant. The Company also earns management service fee revenue from operating third-party distribution centers belonging to certain customers. These revenues represented less than 1% of the Company’s total net sales for 2017, 2016 and 2015. Service fee revenue is recognized as earned on a monthly basis in accordance with the terms of the management service fee contracts and is included in net sales on the accompanying consolidated statements of operations.
Customers’ Sales Incentives
The Company also provides sales allowances or discounts to its customers on a regular basis. These customers’ sales incentives are recorded as a reduction to net sales as the sales incentive is earned by the customer. Additionally, the Company may provide allowances for the customers' commitments to continue using Core-Mark as the supplier. These incentives are known as racking allowances. These allowances may be paid at the inception of the contract or on a periodic basis. Allowances paid at the inception of the contract are deferred and amortized over the period of the distribution agreement as a reduction to sales.
Vendor Rebates and Promotional Allowances
Periodic payments from vendors in various forms including rebates, promotional allowances and volume discounts, are reflected in the carrying value of the related inventory when earned and in cost of goods sold when the related merchandise is sold. Up-front consideration received from vendors for purchase or other commitments is initially deferred and amortized ratably to cost of goods sold as the performance of the activities specified by the vendor is completed.
Cooperative marketing incentives received from vendors to fund specific programs first offset the costs of the program, and to the extent the consideration exceeds the costs relating to the program, the excess funds are recorded as reductions to cost of
51
goods sold. These amounts are recorded in the period the related promotional or merchandising programs are provided. Certain vendor incentive promotions require the Company to make assumptions and judgments regarding, for example, the likelihood of achieving market share levels or attaining specified levels of purchases. Vendor incentives are at the discretion of the Company’s vendors and can fluctuate due to changes in vendor strategies and market requirements. Vendor rebates and promotional allowances earned totaled $231.9 million, $221.2 million and $191.4 million in 2017, 2016 and 2015, respectively.
Excise Taxes
The Company is responsible for collecting and remitting state, local and provincial excise taxes on cigarette and other tobacco products. These excise taxes are a significant component of the Company’s net sales and cost of goods sold. In 2017, 2016 and 2015, approximately $3.5 billion, $3.0 billion and $2.2 billion, or 22%, 21% and 20% of the Company’s net sales, and approximately 23%, 22% and 21% of its cost of goods sold, respectively, represented excise taxes. Federal excise taxes are levied on the manufacturers who, in turn, pass the tax on to the Company as part of the product cost. As a result, federal excise taxes are not a component of the Company’s excise taxes.
Stock-based Compensation
The Company accounts for stock-based compensation expense related to restricted stock unit ("RSU") awards and performance shares based on the grant-date fair value of the awards. For service based awards, the Company recognizes the expense using a straight-line method. For performance based awards, the Company recognizes the expense ratably based on the probable achievement of performance conditions.
Pension and Other Post-retirement Benefit Costs
On September 14, 2016, the Board of Directors approved a motion to terminate the Company’s qualified defined-benefit pension plan. In December 2017, the Company completed the settlement with an annuity transfer to a third-party insurance company, who will be responsible for all remaining payments to plan participants. At settlement, the Company recognized a non-cash charge in selling, general & administrative expenses within the consolidated statements of operations related to unrecognized actuarial losses in Accumulated Other Comprehensive Income ("AOCI") of approximately $17.2 million (see Note 11 - Employee Benefit Plans).
Pension and other post-retirement benefit costs are estimated on the basis of annual valuations by an independent actuary. Adjustments arising from plan amendments, changes in assumptions, and experience gains and losses are amortized over the expected average remaining service life of the employee group.
The Company recognized an asset for the plan’s overfunded status or a liability for the plan’s underfunded status on its consolidated balance sheet as of the end of each fiscal year. The Company determines the plan’s funded status by measuring its assets and its obligations and recognizes changes in the funded status of its defined benefit post-retirement plan in the year in which the change occurred.
Income Taxes
Income taxes are accounted for using the asset and liability method. Deferred tax assets and liabilities are recognized for the estimated future tax consequences attributable to differences between the financial statement carrying amounts of existing assets and liabilities, their respective tax bases, and operating loss and tax credit carry-forwards. The effect on deferred tax assets and liabilities of a change in tax rates is recognized in income in the period that includes the enactment date. Deferred tax assets are reduced by a valuation allowance when the Company does not consider it more likely than not that some portion or all of the deferred tax assets will be realized.
A tax benefit from an uncertain tax position may be recognized when it is more likely than not that the position will be sustained upon examination, including resolutions of any related appeals or litigation processes, based on the technical merits. The Company has established an estimated liability for income tax exposures that arise and meet the criteria for accrual. The Company prepares and files tax returns based on its interpretation of tax laws and regulations and records estimates based on these judgments and interpretations. In the normal course of business, the Company’s tax returns are subject to examination by various taxing authorities. Such examinations may result in future tax and interest assessments by these taxing authorities. Inherent uncertainties exist in estimates of tax contingencies due to changes in tax law resulting from legislation, regulation and/or as concluded through the various jurisdictions’ tax court systems. The Company classifies interest and penalties related to income taxes as income tax expense (see Note 10 - Income Taxes).
Earnings Per Share
Basic earnings per share is calculated by dividing net income by the weighted-average number of common shares outstanding during each period, excluding unvested RSUs and performance shares. Diluted earnings per share is calculated by dividing net income by weighted-average shares outstanding including common stock equivalents. Common stock equivalents include RSUs
52
and performance based share awards, if the impact of the individual awards is dilutive, using the treasury stock method (see Note 12 - Earnings Per Share).
Cash, Cash Equivalents, Restricted Cash and Book Overdrafts
Cash and cash equivalents include cash, money market funds and highly liquid investments with original maturities of three months or less. Restricted cash represents funds collected and set aside in trust as required by one of the Canadian provincial taxing authorities to secure amounts payable for cigarette and tobacco excise taxes. As of December 31, 2017, the Company no longer had restricted cash balances due to the rescission of restrictions by the Canadian Alberta provincial government. The Company had book overdrafts of $45.3 million and $37.9 million at December 31, 2017 and 2016, respectively. Book overdrafts consist primarily of outstanding checks in excess of cash on hand in the corresponding bank accounts at the end of the period. The Company’s policy has been to fund these outstanding checks as they clear with cash held on deposit with other financial institutions or with borrowings under the Company’s revolving credit facility.
Accounts Receivable and Allowance for Doubtful Accounts
Accounts receivable consists of trade receivables from customers. The Company evaluates the collectability of accounts receivable and determines the appropriate allowance for doubtful accounts based on historical experience and a review of specific customer accounts. Account balances are charged against the allowance when collection efforts have been exhausted and the receivable is deemed uncollectible (see Note 4 - Other Consolidated Balance Sheet Accounts Detail).
Other Receivables
Other receivables consist primarily of amounts due from vendors for promotional and other incentives, which are accrued as earned. The Company evaluates the collectability of amounts due from vendors and determines the appropriate allowance for doubtful accounts based on historical experience and a review of specific amounts outstanding (see Note 4 - Other Consolidated Balance Sheet Accounts Detail).
Inventories
Inventories consist of finished goods, including cigarettes and other tobacco products, food and other consumable products held for re-sale and are valued at the lower of cost or market. In the Company’s U.S. divisions, cost is determined primarily on a last-in, first-out (“LIFO”) basis. The Company uses the link-chain dollar value LIFO method. The inventory price index computation ("IPIC") is used to calculate LIFO inflation indices, for which the LIFO inflation source is the producer price indices ("PPI") published by the US Bureau of Labor Statistics ("BLS"). The Company uses the IPIC pooling method, for which LIFO pools are established for each PPI in accordance with current regulations. When the Company is aware of material price increases or decreases from manufacturers, the Company estimates the PPI for the respective period if it determines the price increase is not fully reflected in the PPI in order to more accurately reflect inflation rates. Under the LIFO method, current costs of goods sold are matched against current sales. Inventories in the Company’s Canadian divisions are valued on a first-in, first-out ("FIFO") basis, as LIFO is not a permitted inventory valuation method in Canada. Approximately 86% and 82% of the Company’s inventory was valued on a LIFO basis at December 31, 2017 and 2016, respectively. The Company reduces inventory value for spoiled, aged and unrecoverable inventory based on amounts on-hand and historical experience (see Note 5 - Inventories, Net).
Property and Equipment
Property and equipment are recorded at cost, net of accumulated depreciation and amortization. Depreciation and amortization on new purchases is computed using the straight-line method over the assets’ estimated useful lives. Leasehold improvements are amortized using the straight-line method over the shorter of the estimated useful life of the property or the term of the lease, including available renewal option terms if it is reasonably assured that those options will be exercised. Upon retirement or sale, the cost and related accumulated depreciation of the assets are removed and any related gain or loss is reflected in the consolidated statements of operations. Maintenance and repairs are charged to expense as incurred (see Note 6 - Property and Equipment, Net).
53
The Company uses the following depreciable lives for its property and equipment:
Useful Life in Years | |
Office furniture and equipment | 3-10 |
Delivery equipment | 4-10 |
Warehouse equipment | 5-15 |
Leasehold improvements | 3-25 |
Buildings | 15-25 |
Other Long-lived Assets
Intangible assets with definite lives are generally amortized on a straight-line basis over the following lives:
Useful Life in Years | |
Customer relationships | 9-15 |
Non-competition agreements | 1-5 |
Trade names | 1-2 |
Internally developed and other purchased software | 3-7 |
The Company reviews its long-lived assets for indicators of impairment whenever events or changes in circumstances indicate that the carrying amount of such assets may not be recoverable. An impairment of long-lived assets exists when the carrying amount of a long-lived asset, or asset group, exceeds its fair value, and impairment losses are recorded when the carrying amount of the impaired asset is not recoverable. Recoverability is determined by comparing the carrying amount of the asset (or asset group) to the undiscounted cash flows which are expected to be generated from its use. The Company has determined that it has five asset groupings based on a review of its assets and liabilities at the lowest level for which identifiable cash flows are largely independent of the cash flows of other assets and liabilities. During 2017, 2016 and 2015, the Company did not record impairment charges related to long-lived assets (see Note 6 - Property and Equipment, Net and Note 7 - Goodwill and Other Intangible Assets, Net).
Goodwill
Goodwill represents the excess of cost over the fair value of net assets acquired in a business combination. Goodwill is not amortized.
The Company tests goodwill for impairment annually as of October 1 or whenever events or circumstances indicate that it is more likely than not that the fair value of a reporting unit is below its carrying amount. The Company’s reporting units are its U.S. operations and Canadian operations. Whenever events or circumstances change, the Company assesses the related qualitative factors to determine whether it is necessary to perform the two-step quantitative goodwill impairment test. The tests to evaluate goodwill for impairment are performed at the reporting unit level. In the first step of the quantitative impairment test, the Company compares the fair value of the reporting unit to its carrying value. If the fair value of the reporting unit is less than its carrying value, the Company performs a second step to determine the implied fair value of goodwill associated with the reporting unit. If the carrying value of goodwill exceeds the implied fair value of goodwill, such excess represents the amount of goodwill for which an impairment loss would be recorded. Determining the fair value of a reporting unit involves the use of significant estimates and assumptions. The estimated fair value of each reporting unit is based on the discounted cash flow method, which is based on historical and forecasted amounts specific to each reporting unit and considers net sales, gross profit, income from operations and cash flows and general economic and market conditions, as well as the impact of planned business and operational strategies and other estimates and assumptions for future growth rates, working capital and capital expenditures. The Company bases its fair value estimates on assumptions it believes to be reasonable at the time, but such assumptions are subject to inherent uncertainty. Measuring the fair value of reporting units constitutes a Level 3 measurement under the fair value hierarchy. There has been no impairment of goodwill for any periods presented (see Note 7 - Goodwill and Other Intangible Assets, Net).
54
Computer Software Developed or Obtained for Internal Use
The Company accounts for computer software systems, namely SAP Enterprise Resource Planning modules, the Company's proprietary Distribution Center Management System (“DCMS”), and software purchased from third-party vendors, using certain criteria under which costs associated with this software are either expensed or capitalized and amortized over periods from three to seven years. During 2017, 2016 and 2015 the Company capitalized approximately $3.5 million, $7.2 million and $9.5 million, respectively, of costs related to software developed or obtained for internal use (see Note 7 - Goodwill and Other Intangible Assets, Net).
Debt Issuance Costs
Debt issuance costs related to the Company's revolving credit facility ("Credit Facility") are deferred and amortized as interest expense over the term of the related debt agreement on a straight-line basis, which approximates the effective interest method. Debt issuance costs are included in deposits and prepayments and other non-current assets on the accompanying consolidated balance sheets. Total unamortized debt issuance costs were $3.3 million and $2.3 million at December 31, 2017 and 2016, respectively (see Note 8 - Long-term Debt).
Claims Liabilities and Insurance Recoverables
The Company maintains reserves related to health and welfare, workers’ compensation, auto and general liability programs that are principally self-insured. The Company currently has a per-claim deductible of $500,000 for its workers’ compensation, general and auto liability self-insurance programs and a per-person annual claim deductible of $400,000 for its health and welfare program. The Company purchases insurance to cover the claims that exceed the deductible up to policy limits. Self-insured reserves are for pending or future claims that fall outside the policy and reserves include an estimate of expected settlements on pending claims and a provision for claims incurred but not reported. Estimates for workers’ compensation, auto and general liability insurance are based on the Company’s assessment of potential liability using an annual actuarial analysis of available information with respect to pending claims, historical experience and current cost trends. Reserves for claims under these programs are included in accrued liabilities (current portion) and claims liabilities, net of current portion on the accompanying consolidated balance sheets.
Claims liabilities and the related recoverables from insurance carriers for estimated claims in excess of the deductible and other insured events are presented in their gross amounts on the accompanying consolidated balance sheets because there is no right of offset. The carrying values of claims liabilities and insurance recoverables are not discounted. Insurance recoverables are included in other receivables, net and other non-current assets, net. The Company had gross liabilities for health and welfare, workers’ compensation, auto and general liability self-insurance obligations in the amounts of $26.3 million long-term and $15.0 million short-term at December 31, 2017, and $26.8 million long-term and $13.4 million short-term at December 31, 2016. The Company’s liabilities net of insurance recoverables were $15.9 million long-term and $13.3 million short-term at December 31, 2017, and $13.9 million long-term and $11.3 million short-term at December 31, 2016.
Foreign Currency Translation
The operating assets and liabilities of the Company’s Canadian operations, whose functional currency is the Canadian dollar, are translated to U.S. dollars at exchange rates in effect at period-end. Translation gains and losses are recorded in Accumulated Other Comprehensive Income ("AOCI") as a component of stockholders’ equity. Revenue and expenses from Canadian operations are translated using the monthly average exchange rates in effect during the period in which the transactions occur. The Company also recognizes gains or losses on foreign currency exchange transactions between its Canadian and U.S. operations, net of applicable income taxes, in the consolidated statements of operations. The Company currently does not hedge Canadian foreign currency cash flows.
Total Comprehensive Income
Comprehensive income consists of net income and other transactions recorded directly to stockholders’ equity that are excluded from net income. Other comprehensive income is comprised of defined benefit plan adjustments and foreign currency translation adjustments related to the Company’s foreign operations in Canada, whose functional currency is not the U.S. dollar (see Note 15 - Other Comprehensive Income (Loss)).
Fair Value Measurements
The Company’s financial assets and liabilities are recognized or disclosed at fair value in the financial statements on a recurring basis. The carrying amount of cash equivalents, restricted cash, trade accounts receivable, other receivables, trade accounts payable, cigarette and tobacco taxes payable and other accrued liabilities approximates fair value because of the short maturity of these financial instruments. The carrying amount of the Company’s variable rate debt approximates fair value.
55
The Company calculates the fair value of certain assets related to acquisitions and cash based pension plan assets using assumptions that market participants would use in pricing these assets (see Note 11 - Employee Benefit Plans). The Company uses a fair value hierarchy that prioritizes the inputs to valuation techniques used to measure fair value and gives precedence to observable inputs in determining fair value. An instrument’s level within the hierarchy is based on the lowest level of any significant input to the fair value measurement. The following levels were established for each input:
Level 1 - Quoted prices in active markets for identical assets or liabilities.
Level 2 - Inputs other than quoted prices included within Level 1 that are observable for the asset or liability, either directly or indirectly, such as quoted prices for similar assets or liabilities; quoted prices in markets that are not active; or other inputs that are observable or can be corroborated by observable market data.
Level 3 - Unobservable inputs for the asset or liability, which reflect the Company’s own assumptions about what market participants would assume when pricing the asset or liability.
Business Combinations
The Company accounts for all business combinations using the acquisition method of accounting, which allocates the fair value of the purchase consideration to the tangible and intangible assets acquired and liabilities assumed based on their estimated fair values. The excess of the purchase consideration over the fair values of these identifiable assets and liabilities is recorded as goodwill. When determining the fair values of assets acquired and liabilities assumed, management makes significant estimates and assumptions. Management may further adjust the acquisition date fair values for a period of up to one year from the date of acquisition. Acquisition related expenses and transaction costs associated with business combinations are expensed as incurred (see Note 3 - Acquisition).
Risks and Concentrations
Financial instruments, which potentially subject the Company to concentrations of credit risk, consist principally of cash investments, accounts receivable and other receivables. The Company places its cash and cash equivalents in short-term instruments with high quality financial institutions and limits the amount of credit exposure in any one financial instrument. The Company pursues amounts and incentives due from vendors in the normal course of business and is often allowed to deduct these amounts and incentives from payments made to vendors.
A credit review is completed for new customers and ongoing credit evaluations of each customer’s financial condition are performed periodically, with reserves maintained for potential credit losses. Credit limits given to customers are based on a risk assessment of their ability to pay and other factors. Accounts receivable are typically not collateralized, but the Company may require prepayments or other guarantees whenever deemed necessary.
Murphy U.S.A., whom the Company began servicing in 2016, is the Company's largest customer and accounted for 12.2% and 12.0% of total net sales in 2017 and 2016 respectively. Alimentation Couche-Tard, Inc. (“Couche-Tard”), the Company’s second largest customer in 2016 and the largest customer in 2015, accounted for 11.4% and 14.2% of total net sales in 2016 and 2015, respectively. In addition, no single customer accounted for 10% or more of accounts receivable at December 31, 2017 and 2016.
The Company has two significant suppliers: Philip Morris USA, Inc. and R.J. Reynolds Tobacco Company. Product purchased from Philip Morris USA, Inc. accounted for approximately 35%, 35% and 29% of total product purchases in 2017, 2016 and 2015, respectively. Product purchases from R.J. Reynolds Tobacco Company were approximately 23%, 23% and 17% of total product purchases in 2017, 2016 and 2015, respectively.
Cigarette sales represented 69.4%, 71.1% and 68.0% of net sales in 2017, 2016 and 2015, respectively, and contributed 27.0%, 29.9% and 28.3% of gross profit in 2017, 2016 and 2015, respectively. The decrease in cigarette sales as a percentage of total net sales and gross profit was due primarily to declines in carton sales attributed primarily to increases in excise taxes, the losses of Kroger and Circle K Corp ("Circle K") in the Southeastern region in 2017, and general consumption declines. Although cigarettes represent a significant portion of the Company’s total net sales, the majority of its gross profit is generated from food/non-food products.
Adoption of Accounting Pronouncements
On March 30, 2016, the Financial Accounting Standards Board ("FASB") issued Accounting Standards Update ("ASU") No. 2016-09, Compensation - Stock Compensation: Topic 718: Improvements to Employee Share-Based Payment Accounting (“ASU 2016-09”). The Company adopted this pronouncement on a prospective basis effective January 1, 2017. The new guidance simplifies several aspects of how companies account for share-based compensation, including the accounting for income taxes, forfeitures, and statutory tax withholding requirements, as well as classification in the statements of cash flows. ASU 2016-09 was effective for annual periods beginning after December 15, 2016. As a result of the adoption, the Company recognized excess
56
tax benefits in net income of approximately $1.5 million for the year ended December 31, 2017. Also as a result of the adoption, excess tax benefits are included in operating activities rather than classified as a financing activity on the statement of cash flows on a prospective basis. The Company will maintain the current policy of estimating forfeitures expected to occur to determine stock-based compensation expense.
On November 20, 2015, the FASB issued ASU No. 2015-17, Income Taxes: Balance Sheet Classification of Deferred Taxes: Topic 740. ASU 2015-17 was effective for annual periods beginning after December 15, 2016. The Company adopted this pronouncement on a retrospective basis effective January 1, 2017, and reclassified its consolidated balance sheet to present all deferred income tax assets and liabilities as non-current. As a result of this adoption, amounts previously presented as current deferred income tax assets of $4.7 million as of December 31, 2016, were reclassified to net non-current deferred income tax liabilities. Similarly, amounts previously presented as current deferred income tax liabilities of $0.1 million were reclassified to net non-current deferred income tax assets.
On November 17, 2016, the FASB issued ASU No. 2016-18, Statement of Cash Flows (Topic 230): Restricted Cash. The Company has elected to early adopt this pronouncement effective January 1, 2017, using the required retrospective transition method to each period presented. The new guidance requires the statements of cash flows to reconcile the changes in the total of cash, cash equivalents, and restricted cash. As a result, transfers between cash and cash equivalents, and restricted cash and restricted cash equivalents will no longer be presented in the statement of cash flows. Additionally, the Company combined its historical movements of restricted cash, with those of non-restricted cash and cash equivalents, as reflected in the Company’s Consolidated Statements of Cash Flows. For the years ended December 31 2016, and 2015, $6.8 million of cash outflows, and $4.5 million of cash inflows were reclassified from investing activities to changes in cash, cash equivalents and restricted cash.
Restricted cash included funds placed in trust as required by one of the Canadian provincial taxing authorities. As of December 31, 2017, the Company no longer has any restricted cash balances due to the rescission of restrictions by the Canadian Alberta provincial government. The following table provides a reconciliation of cash, cash equivalents, and restricted cash reported within the consolidated balance sheets that sum to the total of the same such amounts shown in the consolidated statement of cash flows ($ in millions):
Year Ended December 31, | |||||||||||
2017 | 2016 | 2015 | |||||||||
Cash and cash equivalents | $ | 41.6 | $ | 26.4 | $ | 12.5 | |||||
Restricted cash | — | 15.3 | 8.5 | ||||||||
Total cash, cash equivalents and restricted cash flows in the consolidated statement of cash flows | $ | 41.6 | $ | 41.7 | $ | 21.0 | |||||
Recent Accounting Standards or Updates Not Yet Effective
On May 28, 2014, the FASB issued ASU No. 2014-09, Revenue from Contracts with Customers: (Topic 606) ("ASU 2014-09"), to supersede nearly all existing revenue recognition guidance under U.S. GAAP. The core principle of ASU 2014-09 is to recognize revenues when promised goods or services are transferred to customers in an amount that reflects the consideration that is expected to be received for those goods or services. This standard is effective for the Company in the first quarter of 2018. The Company will adopt this standard using the modified retrospective method. As a result of its assessment, the Company reviewed the following areas: (i) presentation of certain items, including excise taxes on a gross or net basis; (ii) deferral and amortization of contract fulfillment costs; (iii) recognition of contract assets and liabilities for certain contracts that are performed but not completed; and (iv) the timing of recognition of variable consideration received from vendors and paid to customers. The Company does not believe the adoption of this pronouncement will have material impacts related to the above noted areas. The Company's adoption of ASU 2014-09 using the modified retrospective method will not have an impact to opening retained earnings as of January 1, 2018.
This new revenue standard is not expected to have any material impacts on the amount and timing of revenue recognized in the Company's consolidated financial statements. Once adopted, the Company will provide expanded disclosures regarding the characteristics of its revenue.
On February 25, 2016, the FASB issued ASU No. 2016-02, Leases (Topic 842) (“ASU 2016-02”), which supersedes existing lease guidance. The new guidance increases transparency by requiring lessees to recognize right-of-use assets and corresponding lease liabilities on the balance sheet. This standard is effective for annual periods beginning after December 15, 2018, although early adoption is permitted. The Company believes the new standard will have a material impact on its consolidated balance
57
sheets. The Company is currently quantifying the impact and evaluating its approach to adopting ASU 2016-02 on its consolidated financial statements.
On January 26, 2017, the FASB issued ASU No. 2017-04, Intangibles - Goodwill and Other (Topic 350): Simplifying the Test for Goodwill Impairment (“ASU 2017-04”). The new guidance simplifies the subsequent measurement of goodwill by eliminating Step 2 from the goodwill impairment test. ASU 2017-04 requires goodwill impairment to be measured as the amount by which a reporting unit’s carrying amount exceeds its fair value, not to exceed the carrying amount of its goodwill. ASU 2017-04 requires prospective application and is effective for annual periods beginning after December 15, 2019. The Company believes ASU 2017-04 will amend its methodology for determining any goodwill impairment calculations beginning in 2020.
On March 10, 2017, the FASB issued ASU No. 2017-07, Compensation - Retirement Benefits (Topic 715): Improving the Presentation of Net Periodic Pension Cost and Benefit Cost. The new guidance requires employers that sponsor defined benefit pension and other post-retirement plans to present the service cost component of net benefit cost in the same income statement line item as other employee compensation costs arising from services rendered and further requires that only the service cost component will be eligible for capitalization. The other components of the net periodic benefit cost must be presented separately from the line item that includes the service cost component and outside of the income from operations subtotal. ASU 2017-07 is effective for annual periods beginning after December 15, 2017, although early adoption is permitted. The update may result in retrospective re-classification of costs. There will be no impact on consolidated net income. On September 14, 2016, the Board of Directors approved the termination of the Company’s qualified defined-benefit pension plan. In December 2017, the Company completed the settlement with an annuity transfer to a third-party insurance company, who will be responsible for all remaining payments to plan participants.
3. Acquisitions
Acquisition of Farner-Bocken Company
On July 10, 2017, the Company completed the acquisition of substantially all of the assets of Farner-Bocken Company ("Farner-Bocken"), a regional convenience wholesaler headquartered in Carroll, Iowa. The acquisition increased the Company’s market presence primarily in the Midwestern U.S. and will further enhance the Company’s ability to cost effectively service national and regional retailers. The acquisition was accounted for as a business combination in accordance with ASC 805 - Business Combinations. The total purchase consideration was approximately $174.0 million of which, $169.0 million was paid at closing. The remaining $5.0 million indemnity holdback will be released in annual installments over two years from the date of the agreement, less amounts related to indemnification claims made pursuant to the purchase agreement, if any. The acquisition was funded through borrowings under the Company's revolving credit facility.
The fair values of the assets acquired and liabilities assumed were determined using the income, cost and market approaches. The income approach was primarily used to value the intangible assets, consisting primarily of acquired customer relationships and trade names. The income approach estimates fair value for an asset based on the present value of cash flows projected to be generated by the asset. Projected cash flows are discounted at a required rate of return that reflects the relative risk of achieving the cash flows and the time value of money. The cost approach, which estimates value by determining the current cost of replacing an asset with another of equivalent economic utility, was used primarily for property and equipment. The cost to replace a given asset reflects the estimated reproduction or replacement cost for the property, less an allowance for loss in value due to depreciation.
The Company determined the fair values of tangible fixed assets and intangible assets acquired with the assistance of independent valuation consultants. Goodwill is calculated as the difference between the acquisition date fair value of the total purchase consideration and the fair value of the net assets acquired, and represents the future economic benefits that the Company expects to achieve as a result of the acquisition. The following table presents the assets acquired and liabilities assumed, based on their fair values and purchase consideration as of the acquisition date (in millions):
58
July 10, 2017 | |||
Accounts receivable | $ | 43.2 | |
Inventories | 35.5 | ||
Deposits and prepayments | 10.2 | ||
Other receivables | 0.4 | ||
Property and equipment | 43.1 | ||
Goodwill (tax deductible) | 36.8 | ||
Other intangible assets | 22.6 | ||
Less: Capital lease liability | (15.8 | ) | |
Less: Accrued liabilities, and other | (2.0 | ) | |
Total consideration | $ | 174.0 | |
The Company finalized its valuation of its beginning goodwill and intangible assets during the fourth quarter ended December 31, 2017. Based on the valuation, intangible assets acquired include the following (in millions):
Fair Value | Useful Life in Years | ||||
Customer relationships | $ | 19.7 | 9-11 | ||
Non-competition agreements | 0.1 | 4-6 | |||
Trade names | 2.8 | 1-2 | |||
Total Other intangible assets | $ | 22.6 | |||
The results of Farner-Bocken's operations have been included in the Company’s consolidated financial statements since the date of acquisition. The Company incurred $1.8 million of acquisition-related costs, which are included in selling, general and administrative expenses for the year ended December 31, 2017. Simultaneous with the closing of the acquisition, the Company executed a capital lease for a warehouse facility in Carroll, Iowa. The lease has an initial 15 year term and an initial capital lease obligation of $15.8 million based on the valuation as of December 31, 2017.
Pro Forma Information
The consolidated financial statements for 2017 include Farner-Bocken's results from operations from July 10, 2017 through December 31, 2017, with the Company's consolidated statement of income including $703.4 million in net sales and $9.4 million in operating income.
The following unaudited pro forma information presents the combined results of operations as if the asset acquisition of Farner-Bocken had occurred as of January 1, 2016, giving effect on a pro forma basis to purchase accounting adjustments such as depreciation of property and equipment, amortization of intangible assets, and acquisition-related costs. The pro forma data is for informational purposes only and may not necessarily reflect the actual results of operations had the assets of Farner-Bocken been operated as part of the Company since January 1, 2016. Furthermore, the pro forma results do not intend to project the future results of operations of the Company (in millions, except per share amounts):
(Unaudited) Year Ended December 31, | |||||||
2017 (1) | 2016 (1) | ||||||
Pro forma | Pro forma | ||||||
Net sales | $ | 16,427.9 | $ | 15,973.6 | |||
Net income | 38.1 | 63.6 | |||||
Basic and Diluted Earnings Per Share | 0.82 | 1.37 | |||||
(1) | Includes consolidated results of Farner-Bocken. |
59
Acquisition of Pine State Convenience
On June 6, 2016, the Company acquired substantially all of the assets of Pine State Convenience ("Pine State"), a division of Pine State Trading Company, located in Gardiner, Maine. The acquisition was accounted for as a business combination in accordance with ASC 805 - Business Combinations. The acquisition increased the Company’s market presence primarily in the Northeastern U.S. and further enhanced the Company’s ability to cost effectively service national and regional retailers. The total purchase consideration was $88.4 million which was paid at closing and funded through borrowings under the Company's revolving credit facility.
The following table presents the assets acquired and liabilities assumed, based on their fair values and purchase consideration (in millions):
June 6, 2016 | |||
Accounts receivable | $ | 35.5 | |
Inventories | 21.2 | ||
Deposits and prepayments, and other | 0.9 | ||
Property and equipment | 10.3 | ||
Goodwill (tax deductible) | 13.1 | ||
Other intangible assets | 10.2 | ||
Less: Accrued liabilities, and other | (2.8 | ) | |
Total consideration | $ | 88.4 | |
The Company determined the estimated fair values of intangible assets acquired with the assistance of independent valuation consultants. Based on the valuation, intangible assets acquired include the following (in millions):
Fair Value | Useful Life in Years | ||||
Customer relationships | $ | 7.2 | 12 | ||
Non-competition agreements | 1.9 | 5 | |||
Trade names | 1.0 | 2 | |||
Favorable lease terms | 0.1 | 2 | |||
Total intangible assets | $ | 10.2 | |||
The results of Pine State operations have been included in the Company’s consolidated financial statements since the date of acquisition. The Company incurred $2.2 million of acquisition-related costs, which are included in selling, general and administrative expenses for the year ended December 31, 2016. The Company did not consider the Pine State acquisition to be a material business combination and therefore has not disclosed pro forma results of operations for the acquired business. Simultaneously with the closing of the acquisition, the Company entered into two operating lease arrangements with certain former owners of Pine State. One operating lease bears a fifteen year term for a facility in Maine and the second operating lease bears a two year term for a facility in Vermont.
Acquisition of Karrys Bros., Limited.
On February 23, 2015, the Company acquired substantially all of the assets of Karrys Bros., Limited (“Karrys Bros.”), a regional convenience wholesaler servicing customers in Ontario, Canada, and the surrounding provinces, for cash consideration of approximately $8.0 million, or $10.0 million (Canadian dollars). Transaction and integration costs in connection with the acquisition of Karrys Bros. were approximately $1.7 million for the year ended December 31, 2015. The Karrys Bros. operations have been integrated into the Company’s existing distribution center in Toronto and have provided the Company with the opportunity to increase its market share in eastern Canada. The results of operations of Karrys Bros. have been included in the Company’s consolidated statements of operations and comprehensive income since the date of acquisition. The Company did not consider the Karrys Bros. acquisition to be a material business combination and therefore has not disclosed pro-forma results of operations for the acquired business.
60
4. | Other Consolidated Balance Sheet Accounts Detail |
Allowance for Doubtful Accounts, Accounts Receivable
The changes in the allowance for doubtful accounts due from customers consist of the following (in millions):
Year Ended December 31, | |||||||||||
2017 | 2016 | 2015 | |||||||||
Balance, beginning of year | $ | 7.1 | $ | 10.9 | $ | 10.8 | |||||
Net additions charged to operations (1) | 1.1 | 2.0 | 1.3 | ||||||||
Less: Write-offs and adjustments | (0.9 | ) | (5.8 | ) | (1.2 | ) | |||||
Balance, end of year | $ | 7.3 | $ | 7.1 | $ | 10.9 | |||||
______________________________________________
(1) The net additions to the allowance for doubtful accounts were recognized in the consolidated statements of operations as a component of the Company’s selling, general and administrative expenses.
Other Receivables, Net
Other receivables, net consist of the following (in millions):
December 31, 2017 | December 31, 2016 | ||||||
Vendor receivables, net | $ | 74.6 | $ | 90.6 | |||
Insurance recoverables, current | 1.7 | 2.1 | |||||
Other miscellaneous receivables (1) | 18.1 | 13.8 | |||||
Total other receivables, net | $ | 94.4 | $ | 106.5 | |||
______________________________________________
(1) Other miscellaneous receivables include amounts related primarily to notes receivables, miscellaneous tax receivables, receivables from the Company’s third-party logistics customers, and other miscellaneous receivables.
Deposits and Prepayments
Deposits and prepayments consist of the following (in millions):
December 31, 2017 | December 31, 2016 | ||||||
Vendor prepayments | $ | 49.8 | $ | 44.7 | |||
Deposits (1) | 7.6 | 8.5 | |||||
Prepaid taxes | 28.2 | 10.5 | |||||
Racking allowances, current | 6.1 | 5.7 | |||||
Other prepayments (2) | 16.3 | 13.4 | |||||
Total deposits and prepayments | $ | 108.0 | $ | 82.8 | |||
______________________________________________
(1) Deposits include amounts related primarily to cigarette stamps and workers’ compensation claims.
(2) Other prepayments include prepayments relating to insurance policies, software licenses, rent and other miscellaneous prepayments.
61
Other Non-current Assets, Net
Other non-current assets, net of current portion, consist of the following (in millions):
December 31, 2017 | December 31, 2016 | ||||||
Insurance recoverables | $ | 10.4 | $ | 12.9 | |||
Debt issuance costs | 2.6 | 1.6 | |||||
Insurance deposits | 3.3 | 3.4 | |||||
Racking allowances, net | 7.5 | 5.0 | |||||
Other assets | 2.4 | 3.6 | |||||
Total other non-current assets, net | $ | 26.2 | $ | 26.5 | |||
Accrued Liabilities
Accrued liabilities consist of the following (in millions):
December 31, 2017 | December 31, 2016 | ||||||
Accrued payroll, retirement and other benefits (1) | $ | 31.8 | $ | 35.7 | |||
Claims liabilities, current | 15.0 | 13.4 | |||||
Accrued customer incentives payable | 39.2 | 40.1 | |||||
Indirect taxes | 8.4 | 6.2 | |||||
Vendor advances | 3.3 | 10.9 | |||||
Other accrued expenses (2) | 27.1 | 25.5 | |||||
Total accrued liabilities | $ | 124.8 | $ | 131.8 | |||
______________________________________________
(1) The Company’s accrued payroll, retirement and other benefits include accruals for vacation, bonuses, wages, 401(k) benefit matching and the current portion of pension and post-retirement benefit obligations.
(2) The Company’s other accrued expenses include accruals for goods and services, lease liabilities, construction in process, legal expenses, and other miscellaneous accruals.
5. Inventories, Net
Inventories consist of the following (in millions):
December 31, 2017 | December 31, 2016 | ||||||
Inventories at FIFO, net of reserves | $ | 841.0 | $ | 727.0 | |||
Less: LIFO reserve | (151.9 | ) | (130.4 | ) | |||
Total inventories at LIFO, net of reserves | $ | 689.1 | $ | 596.6 | |||
During periods of rising prices, the LIFO method of costing inventories generally results in higher current costs being charged against income while lower costs are retained in inventories. Conversely, during periods of decreasing prices, the LIFO method of costing inventories generally results in lower current costs being charged against income and higher stated inventories. If the FIFO method had been used for valuing inventories in the U.S., inventories would have been approximately $151.9 million and $130.4 million higher at December 31, 2017 and 2016, respectively. The Company recorded LIFO expense of $21.5 million, $13.2 million and $1.9 million for the years ended December 31, 2017, 2016 and 2015, respectively. The Company had a decrement in certain of its LIFO inventory layers of $10.7 million and $4.8 million in 2017 and 2016, respectively, which had the effect of reducing its LIFO expense by $0.3 million in 2017 and $0.6 million in 2016.
62
6. Property and Equipment, Net
Property and equipment consist of the following (in millions):
December 31, 2017 | December 31, 2016 | ||||||
Delivery, warehouse and office equipment (1) | $ | 344.8 | $ | 280.4 | |||
Leasehold improvements | 82.2 | 68.6 | |||||
Land and buildings (2) | 49.5 | 32.0 | |||||
Construction in progress | 0.5 | 3.0 | |||||
477.0 | 384.0 | ||||||
Less: Accumulated depreciation and amortization | (228.0 | ) | (189.3 | ) | |||
Total property and equipment, net | $ | 249.0 | $ | 194.7 | |||
______________________________________________
(1) Includes equipment capital leases of $14.2 million for 2017 and $13.5 million for 2016.
(2) Includes warehouse capital leases of $20.6 million for 2017 and $4.8 million for 2016.
Depreciation and amortization expenses related to property and equipment were $37.4 million, $28.9 million and $26.0 million for 2017, 2016 and 2015, respectively.
7. Goodwill and Other Intangible Assets, Net
Goodwill
Goodwill represents the excess of the purchase consideration of an acquired business over the fair value of the identifiable tangible and intangible assets acquired and liabilities assumed in certain business combinations. The carrying amount of goodwill during 2017 and 2016 were as follows (in millions):
Year Ended December 31, | |||||||
2017 | 2016 | ||||||
Goodwill, beginning of year | $ | 36.0 | $ | 22.9 | |||
Farner-Bocken Acquisition | 36.8 | — | |||||
Pine State Acquisition | — | 13.1 | |||||
Goodwill, end of year | $ | 72.8 | $ | 36.0 | |||
The Company did not record any impairment charges related to goodwill during the years ended December 31, 2017 and 2016.
Other Intangible Assets, Net
The carrying amount and accumulated amortization of other intangible assets as of December 31, 2017 and 2016 are as follows (in millions):
December 31, 2017 | December 31, 2016 | ||||||||||||||||||||||
Gross | Net | Gross | Net | ||||||||||||||||||||
Carrying | Accumulated | Carrying | Carrying | Accumulated | Carrying | ||||||||||||||||||
Amount | Amortization | Amount | Amount | Amortization | Amount | ||||||||||||||||||
Customer relationships | $ | 48.0 | $ | (12.3 | ) | $ | 35.7 | $ | 28.3 | $ | (9.4 | ) | $ | 18.9 | |||||||||
Non-competition agreements | 5.1 | (3.6 | ) | 1.5 | 5.0 | (3.1 | ) | 1.9 | |||||||||||||||
Trade names | 3.8 | (1.5 | ) | 2.3 | 1.0 | (0.3 | ) | 0.7 | |||||||||||||||
Favorable lease terms | 0.1 | (0.1 | ) | — | 0.1 | — | 0.1 | ||||||||||||||||
Internally developed and other purchased software | 36.5 | (16.9 | ) | 19.6 | 33.0 | (13.1 | ) | 19.9 | |||||||||||||||
Total other intangible assets | $ | 93.5 | $ | (34.4 | ) | $ | 59.1 | $ | 67.4 | $ | (25.9 | ) | $ | 41.5 | |||||||||
The amortization of intangible assets recorded in the consolidated statements of operations was $8.5 million, $5.3 million and $2.6 million for 2017, 2016 and 2015, respectively.
63
Estimated future amortization expense for intangible assets is as follows (in millions):
Year ending December 31, | |||
2018 | $ | 9.9 | |
2019 | 8.8 | ||
2020 | 7.8 | ||
2021 | 7.4 | ||
2022 | 7.2 | ||
2023 and thereafter | 18.0 | ||
Total | $ | 59.1 | |
8. Long-term Debt
Total long-term debt consists of the following (in millions):
December 31, | December 31, | ||||||
2017 | 2016 | ||||||
Amounts borrowed (Credit Facility) | $ | 488.2 | $ | 336.0 | |||
Obligations under capital leases (Note 9) | 24.7 | 11.7 | |||||
Total long-term debt | $ | 512.9 | $ | 347.7 | |||
The Company has a revolving credit facility ("Credit Facility") with a borrowing capacity of $750.0 million as of December 31, 2017, limited by a borrowing base consisting of eligible accounts receivable and inventories. On March 28, 2017, we entered into a tenth amendment to the Credit Facility (the "Tenth Amendment"), which increased the Credit Facility from $600.0 million to $750.0 million and extended the maturity of the facility to March 2022. The Credit Facility has an expansion feature, which can be increased up to an additional $200.0 million. All obligations under the Credit Facility are secured by first priority liens on substantially all of the Company’s present and future assets. The terms of the Credit Facility permit prepayment without penalty at any time subject to customary breakage costs with respect to London Interbank Offer Rate ("LIBOR") or Canadian Dollar Offer Rate ("CDOR") based loans prepaid prior to the end of an interest period. The Credit Facility contains customary affirmative and restrictive covenants. In addition, the credit facility allows for unlimited stock repurchases and dividends, as long as the Company meets certain credit availability percentages and fixed charge coverage ratios. As of December 31, 2017, we were in compliance with all of the covenants under the Credit Facility.
The Company incurred fees of approximately $1.8 million in connection with the Tenth Amendment.
Amounts borrowed, outstanding letters of credit and amounts available to borrow, net of certain reserves required under the Credit Facility, were as follows (in millions):
December 31, | December 31, | ||||||
2017 | 2016 | ||||||
Amounts borrowed | $ | 488.2 | $ | 336.0 | |||
Outstanding letters of credit | 14.2 | 17.4 | |||||
Amounts available to borrow (1) | 152.1 | 224.8 | |||||
______________________________________________
(1) | Excluding expansion features as of December 31, 2017 and December 31, 2016 of $200.0 million and $100.0 million, respectively. |
Average borrowings during the years ended December 31, 2017 and 2016 were $342.4 million and $184.4 million, respectively, with amounts borrowed at any one time during the years then ended ranging from $165.0 million to $605.0 million and zero to $428.0 million, respectively. The increase in borrowings was due primarily to the cash payment for the acquisition of Farner-Bocken of $169.0 million, which was completed on July 10, 2017.
The weighted-average interest rate on the Credit Facility for the years ended December 31, 2017 and 2016 were 2.4%, and 1.7%, respectively. The weighted-average interest rate is calculated based on the daily cost of borrowing, reflecting a blend of prime and LIBOR rates. The Company paid fees for unused credit facility and letter of credit participation, which are included in interest expense, of $1.0 million, $0.7 million, and $0.6 million for the years ended December 31, 2017, 2016 and 2015, respectively. The Company recorded charges related to amortization of debt issuance costs, which are included in interest expense, of $0.8 million, $0.5 million, and $0.3 million for the years ended December 31, 2017, 2016 and 2015, respectively. Unamortized debt issuance costs were $3.3 million and $2.3 million as of December 31, 2017 and 2016, respectively.
64
9. | Commitments and Contingencies |
Purchase Commitments
The Company enters into purchase commitments in the ordinary course of business. The Company had purchase obligations of $26.0 million and $47.8 million as of December 31, 2017 and 2016, respectively, related primarily to purchases of compressed natural gas for its trucking fleet, delivery and warehouse equipment, computer software and services and leasehold improvements. Purchase orders for the purchase of inventory and other services are not included in the purchase obligations as of December 31, 2017 and 2016, respectively, because purchase orders represent authorizations to purchase rather than binding agreements. For purposes of this commitment, contractual obligations for purchase of goods or services are defined as agreements that are enforceable and legally binding and that specify all significant terms, including: fixed or minimum quantities to be purchased; fixed, minimum or variable price provisions; and the approximate timing of the transaction. The Company’s purchase orders are based on its current inventory needs and are fulfilled by its suppliers within short time periods. The Company also enters into contracts for outsourced services; however, the obligations under these contracts are not significant and the contracts generally contain clauses allowing for cancellation without significant penalty.
Operating Leases
The Company leases most of its sales and warehouse facilities and a significant number of trucks, vans and certain equipment under operating lease agreements expiring at various dates through 2032, excluding renewal options. Rent expense is recorded on a straight-line basis over the term of the lease, including available renewal option terms, if it is reasonably assured that the renewal options will be exercised. The operating leases generally require the Company to pay taxes, maintenance and insurance. In most instances, the Company expects the operating leases that expire will be renewed or replaced in the normal course of business.
Future minimum rental payments under non-cancelable operating leases (with initial or remaining lease terms in excess of one year and excluding contracted vehicle maintenance costs) were as follows as of December 31, 2017 (in millions):
Year ending December 31, | |||
2018 | $ | 59.4 | |
2019 | 56.0 | ||
2020 | 50.3 | ||
2021 | 42.0 | ||
2022 | 32.7 | ||
2023 and thereafter | 123.5 | ||
Total | $ | 363.9 | |
For 2017, 2016 and 2015, rental expenses for operating and month-to-month leases, including contracted vehicle maintenance costs, were $76.0 million, $66.8 million and $57.9 million, respectively.
Capital Leases
As of December 31, 2017 and 2016, the Company had approximately $27.5 million and $13.6 million, respectively, in capital lease obligations, related to warehouse facilities, refrigeration and other office and warehouse equipment with lease agreements expiring at various dates through 2032, excluding renewal options.
Future minimum lease payments under non-cancelable capital leases were as follows as of December 31, 2017 (in millions):
65
Year ending December 31, | |||
2018 | $ | 4.1 | |
2019 | 3.9 | ||
2020 | 3.4 | ||
2021 | 2.7 | ||
2022 | 2.8 | ||
2023 and thereafter | 19.4 | ||
Total | 36.3 | ||
Less: Interest | (8.8 | ) | |
Present value of future minimum lease payments | 27.5 | ||
Less: current portion | (2.8 | ) | |
Non-current portion | $ | 24.7 | |
Contingencies
Off-Balance Sheet Arrangements
Letters of Credit
As of December 31, 2017, the Company’s standby letters of credit issued under the Company’s Credit Facility were $14.2 million related primarily to casualty insurance. The majority of the standby letters of credit mature within one year. However, in the ordinary course of business, the Company will continue to renew or modify the terms of the letters of credit to support business requirements. The letters of credit are contingent liabilities, supported by the Company’s line of credit, and are not reflected on the consolidated balance sheets.
Litigation
The Company is subject to certain legal proceedings, claims, investigations and administrative proceedings in the ordinary course of its business. The Company records a provision for a liability when it is both probable that the liability has been incurred and the amount of the liability can be reasonably estimated. These provisions, if any, are reviewed at least quarterly and adjusted to reflect the impacts of negotiations, settlements, rulings, advice of legal counsel and other information and events pertaining to a particular case. In the opinion of management, the outcome of pending litigation is not expected to have a material effect on the Company’s results of operations or financial condition.
10. Income Taxes
On December 22, 2017, the Tax Cuts and Jobs Act ("TCJA") was signed into law, which enacts significant changes to the U.S. tax laws. Under ASC 740, the effects of the changes in tax law are recognized in the period in which the law is enacted. The key provisions of the TCJA impacting the Company are a permanent reduction of the federal corporate income tax rate from 35% to 21% effective January 1, 2018, the immediate expensing of the cost of acquired qualified property and limitations on certain corporate deductions and credits.
As a result of the rate change, the Company’s net deferred tax liabilities, which represent an increase in corporate taxes expected to be paid in the future, were revalued. The revaluation resulted in a one-time reduction of our net deferred tax liabilities of $14.6 million and a corresponding deferred income tax benefit in 2017. Our federal income tax expense for periods beginning in 2018 will be based on the new rate.
The income tax liability for 2017 included a federal alternative minimum tax ("AMT") of $7.2 million. The Tax Cuts and Jobs Act repealed the federal AMT for fiscal years beginning after December 31, 2017. Taxpayers with federal AMT carry-forwards from 2017 and prior years may claim a refund in future years equal to their AMT carry-forward even if no future tax liabilities exist. The Company has treated the federal AMT amount as a receivable of current taxes.
66
The Company’s income tax provision consists of the following (in millions):
Year Ended December 31, | |||||||||||
2017 | 2016 | 2015 | |||||||||
Current: | |||||||||||
Federal | $ | (2.2 | ) | $ | 21.4 | $ | 19.4 | ||||
State | 0.9 | 3.1 | 3.2 | ||||||||
Total current tax (benefit) provision | (1.3 | ) | 24.5 | 22.6 | |||||||
Deferred: | |||||||||||
Federal | $ | (5.3 | ) | $ | 6.7 | $ | 7.8 | ||||
State | 1.4 | 0.8 | 1.1 | ||||||||
Foreign | 0.1 | (0.7 | ) | (0.1 | ) | ||||||
Total deferred tax (benefit) provision | (3.8 | ) | 6.8 | 8.8 | |||||||
Total income tax (benefit) provision | $ | (5.1 | ) | $ | 31.3 | $ | 31.4 | ||||
A reconciliation of the statutory federal income tax rate to the Company’s effective income tax rate and income tax provision is as follows (in millions):
Year Ended December 31, | ||||||||||||||||||||
2017 | 2016 | 2015 | ||||||||||||||||||
Federal income tax provision at the statutory rate | $ | 9.9 | 35.0 | % | $ | 29.9 | 35.0 | % | $ | 29.0 | 35.0 | % | ||||||||
Increase (decrease) resulting from: | ||||||||||||||||||||
State income taxes, net of federal benefit | 1.6 | 5.7 | 2.9 | 3.4 | 2.9 | 3.5 | ||||||||||||||
Reduction in federal statutory rate (1) | (14.6 | ) | (51.6 | ) | — | — | — | — | ||||||||||||
Decrease in unrecognized tax benefits (inclusive of | ||||||||||||||||||||
related interest and penalty) | (0.3 | ) | (1.0 | ) | (0.3 | ) | (0.4 | ) | — | — | ||||||||||
Effect of foreign operations | 0.1 | 0.4 | (0.7 | ) | (0.8 | ) | (0.1 | ) | (0.1 | ) | ||||||||||
Excess tax benefits from stock-based award payments (2) | (1.5 | ) | (5.3 | ) | — | — | — | — | ||||||||||||
Change in valuation allowance | — | — | — | — | (0.1 | ) | (0.1 | ) | ||||||||||||
Tax credits and other, net | (0.3 | ) | (1.2 | ) | (0.5 | ) | (0.6 | ) | (0.3 | ) | (0.4 | ) | ||||||||
Income tax (benefit) provision | $ | (5.1 | ) | (18.0 | )% | $ | 31.3 | 36.6 | % | $ | 31.4 | 37.9 | % | |||||||
______________________________________________
(1) | As a result of the enactment of the TCJA, a $14.6 million net income tax benefit was recorded in the fourth quarter of 2017 due to a one-time revaluation of our net deferred tax liability. |
(2) As the result of the adoption of ASU 2016-09, the Company recognized excess tax benefits of approximately $1.5 million, for 2017.
The Company’s effective tax rate was a benefit of 18.0% for 2017 compared to a provision of 36.6% for 2016. The effective tax rate for 2017 decreased 5.3% due to the excess tax benefits related to stock-based compensation and 51.6% due to the revaluation of the net deferred tax liabilities, related to the reduction in the federal statutory rate from 35.0% to 21.0% effective January 1, 2018.
The provision for income taxes included a net benefit of $0.5 million and $1.5 million for 2017 and 2016, respectively, related primarily to the expiration of the statute of limitations for uncertain tax positions and adjustments of prior years’ estimates.
67
Deferred tax assets and liabilities are measured using enacted tax rates expected to apply to taxable income in the years in which those temporary differences are expected to be recovered or settled. The tax effects of significant temporary differences which comprise deferred tax assets and liabilities are as follows (in millions):
December 31, 2017 | December 31, 2016 | ||||||
Deferred tax assets: | |||||||
Employee benefits, including post-retirement benefits | $ | 9.1 | $ | 15.4 | |||
Trade and other receivables | 1.8 | 2.9 | |||||
Goodwill and intangibles | — | — | |||||
Self-insurance reserves | 1.5 | 1.7 | |||||
Other | 3.8 | 6.1 | |||||
Subtotal | 16.2 | 26.1 | |||||
Less: valuation allowance | — | — | |||||
Net deferred tax assets | $ | 16.2 | $ | 26.1 | |||
Deferred tax liabilities: | |||||||
Inventories | $ | 12.1 | $ | 7.0 | |||
Property and equipment | 28.7 | 36.2 | |||||
Goodwill and intangibles | 1.3 | 5.4 | |||||
Other | 1.5 | 1.8 | |||||
Total deferred tax liabilities | $ | 43.6 | $ | 50.4 | |||
Net deferred tax liabilities | $ | (27.4 | ) | $ | (24.3 | ) | |
Tax jurisdiction: | |||||||
Net deferred asset (Canada) | $ | 0.1 | $ | 1.0 | |||
Net deferred liability (U.S.) | $ | (27.5 | ) | $ | (25.3 | ) | |
At each balance sheet date, management assesses whether it is more likely than not that these deferred tax assets would not be realized. The Company had no valuation allowance at December 31, 2017 and 2016.
The Company had no unrecognized tax benefits related to federal, state and foreign taxes at December 31, 2017 and approximately $0.2 million unrecognized tax benefits related to federal, state and foreign taxes at December 31, 2016.
A reconciliation of the beginning and ending amounts of unrecognized tax benefits for 2017, 2016 and 2015 is as follows (in millions):
Year Ended December 31, | |||||||||||
2017 | 2016 | 2015 | |||||||||
Balance at beginning of year | $ | 0.2 | $ | 0.4 | $ | 0.4 | |||||
Lapse of statute of limitations | (0.2 | ) | (0.2 | ) | — | ||||||
Balance at end of year | $ | — | $ | 0.2 | $ | 0.4 | |||||
____________________________________________
The Company files U.S. federal, state and foreign income tax returns in jurisdictions with varying statutes of limitations. The 2014 to 2017 tax years remain subject to examination by federal and state tax authorities. The 2013 tax year is still open for certain state tax authorities. The 2010 to 2017 tax years remain subject to examination by the tax authorities in Canada.
68
11. | Employee Benefit Plans |
Pension Plans
The Company sponsored a qualified defined-benefit pension plan and a post-retirement benefit plan (collectively, “the Pension Plans”). The Pension Plans were frozen on September 30, 1986 and since then there have been no new entrants to the Pension Plans.
On September 14, 2016, the Board of Directors approved a motion to terminate the Company’s qualified defined-benefit pension plan. The Company settled all of its remaining pension liabilities through annuities purchased in December 2017. At such time, the Company recognized a non-cash charge in selling, general & administrative expenses within the consolidated statements of operations related to unrecognized actuarial losses in AOCI of approximately $17.2 million. The Company made cash contributions of $4.9 million to fully fund the pension obligation prior to terminating in 2017. Settling the plan eliminates future cash contributions, lowers future expenses and eliminates the risk of rising Pension Benefit Guaranty Corporation (“PBGC”) premiums.
The Company’s post-retirement benefit plan is not subject to ERISA. As a result, the post-retirement benefit plan is not required to be pre-funded, and, accordingly, has no plan assets.
Other post-retirement benefit costs charged to operations are estimated on the basis of annual valuations with the assistance of an independent actuary. Adjustments arising from plan amendments, and changes in assumptions and experience gains and losses, are amortized over the average remaining future service of active employees expected to receive benefits for the post-retirement benefit plan.
69
The following tables provide a reconciliation of the changes in the Pension Plans’ benefit obligation and fair value of assets, the funded status of the plans and the amounts recognized in the consolidated balance sheets and AOCI as of December 31, 2017 and 2016 (in millions):
Pension Benefits | Other Post-retirement Benefits | |||||||||||||||
December 31, 2017 | December 31, 2016 | December 31, 2017 | December 31, 2016 | |||||||||||||
Change in Benefit Obligation: | ||||||||||||||||
Obligation at beginning of year | $ | 34.8 | $ | 37.0 | $ | 2.6 | $ | 3.0 | ||||||||
Interest cost | 1.0 | 1.2 | — | 0.2 | ||||||||||||
Actuarial loss (gain) | 0.8 | 1.7 | (0.5 | ) | (0.5 | ) | ||||||||||
Benefit payments | (2.3 | ) | (2.4 | ) | — | (0.1 | ) | |||||||||
Group annuity contract discontinuance | 0.3 | — | — | — | ||||||||||||
Settlement of accumulated benefits | (4.8 | ) | (2.7 | ) | — | — | ||||||||||
Plan termination - annuity transfer | (29.2 | ) | — | — | — | |||||||||||
Benefit obligation at end of year | $ | 0.6 | $ | 34.8 | $ | 2.1 | $ | 2.6 | ||||||||
Change in Plan Assets: | ||||||||||||||||
Fair value of plan assets at beginning of year | $ | 30.5 | $ | 32.3 | $ | — | $ | — | ||||||||
Actual return on plan assets | 1.1 | 1.4 | — | — | ||||||||||||
Employer contributions | 4.9 | 1.9 | — | 0.1 | ||||||||||||
Benefit payments | (2.3 | ) | (2.4 | ) | — | (0.1 | ) | |||||||||
Group annuity contract discontinuance | 0.6 | — | — | — | ||||||||||||
Settlement of accumulated benefits | (4.8 | ) | (2.7 | ) | — | — | ||||||||||
Plan termination - annuity transfer | (29.2 | ) | — | — | — | |||||||||||
Fair value of plan assets at end of year | $ | 0.8 | $ | 30.5 | $ | — | $ | — | ||||||||
Funded (unfunded) status at end of year | $ | 0.2 | $ | (4.3 | ) | $ | (2.1 | ) | $ | (2.6 | ) | |||||
Amounts recognized in the balance sheet consist of: | ||||||||||||||||
Current assets | $ | 0.2 | $ | — | $ | — | $ | — | ||||||||
Current liabilities | — | (4.3 | ) | (0.2 | ) | (0.2 | ) | |||||||||
Non-current liabilities | — | — | (1.9 | ) | (2.4 | ) | ||||||||||
Total assets / (liabilities) | $ | 0.2 | $ | (4.3 | ) | $ | (2.1 | ) | $ | (2.6 | ) | |||||
Amounts recognized in AOCI consist of: | ||||||||||||||||
Net actuarial loss (gain) | $ | — | $ | 17.7 | $ | (0.9 | ) | $ | (0.7 | ) | ||||||
Total | $ | — | $ | 17.7 | $ | (0.9 | ) | $ | (0.7 | ) | ||||||
Additional Information: | ||||||||||||||||
Accumulated benefit obligation | $ | 0.6 | $ | 34.8 | ||||||||||||
In December 2017, the Company completed the plan settlement with an annuity transfer to a third-party insurance company of $29.2 million.
70
The following table provides components of net periodic benefit cost and other changes in plan assets and benefit obligations recognized in other comprehensive income (in millions):
Pension Benefits | Other Post-retirement Benefits | |||||||||||||||||||||||
December 31, | December 31, | |||||||||||||||||||||||
2017 | 2016 | 2015 | 2017 | 2016 | 2015 | |||||||||||||||||||
Net Periodic Benefit Cost: | ||||||||||||||||||||||||
Interest cost | $ | 1.0 | $ | 1.2 | $ | 1.7 | $ | — | $ | 0.2 | $ | 0.1 | ||||||||||||
Expected return on plan assets | (0.9 | ) | (1.8 | ) | (2.1 | ) | — | — | — | |||||||||||||||
Amortization of net actuarial loss (gain) | 0.7 | 0.6 | 0.6 | (0.3 | ) | — | — | |||||||||||||||||
Settlement charge | 17.2 | 1.3 | 1.6 | — | — | — | ||||||||||||||||||
Net periodic benefit cost (income) | $ | 18.0 | $ | 1.3 | $ | 1.8 | $ | (0.3 | ) | $ | 0.2 | $ | 0.1 | |||||||||||
Other Changes in Plan Assets and Benefit Obligations Recognized in Other Comprehensive Income: | ||||||||||||||||||||||||
Net actuarial loss (gain) | $ | 0.2 | $ | 2.1 | $ | 1.9 | $ | (0.5 | ) | $ | (0.5 | ) | $ | 0.2 | ||||||||||
Settlement charge | (17.2 | ) | (1.3 | ) | (1.6 | ) | — | — | — | |||||||||||||||
Amortization of actuarial (loss) gain | (0.7 | ) | (0.6 | ) | (0.6 | ) | 0.3 | — | — | |||||||||||||||
Total net (gain) loss recognized in | ||||||||||||||||||||||||
other comprehensive income | $ | (17.7 | ) | $ | 0.2 | $ | (0.3 | ) | $ | (0.2 | ) | $ | (0.5 | ) | $ | 0.2 | ||||||||
For the post-retirement benefit plans, prior service costs are amortized on a straight-line basis over the average remaining future service of active employees expected to receive benefits under the plans. Gains and losses in excess of 10% of the greater of the benefit obligation and market-related value of assets are amortized over the average remaining future service of active employees expected to receive benefits under the plan. The Company uses its fiscal year-end date as the measurement date for the post-retirement benefit plan. The Company estimated that the remaining service life of active participants is 3.9 years for the post-retirement benefits plan.
Assumptions Used:
The following table shows the weighted-average assumptions used in the measurement of:
Other Post-retirement Benefits | ||||||||
December 31, | ||||||||
2017 | 2016 | 2015 | ||||||
Benefit Obligations: | ||||||||
Discount rate | 3.56 | % | 3.98 | % | 4.32 | % | ||
Expected return on assets | N/A | N/A | N/A | |||||
Net Periodic Benefit Costs: | ||||||||
Discount rate | 3.98 | % | 4.29 | % | 3.99 | % | ||
Expected return on assets | N/A | N/A | N/A | |||||
71
Assumed health care cost trend rates have an effect on the amounts reported for the post-retirement health care plans. The health care cost trend rates assumed for the end of year benefit obligation for the post-retirement benefit plans are as follows:
December 31, 2017 | December 31, 2016 | ||
Assumed current trend rate for next year for participants under 65 | 7.50% | 6.62% | |
Assumed current trend rate for next year for participants 65 and over | 8.00% | 7.73% | |
Ultimate year trend rate | 4.50% | 4.50% | |
Year that ultimate trend rate is reached for participants under 65 | 2026 | 2025 | |
Year that ultimate trend rate is reached for participants 65 and over | 2026 | 2025 | |
A one percent point change in assumed health care cost trend rates would have the following effects (in millions):
1% Increase | 1% Decrease | ||||||
Effect on total of service and interest cost components of net periodic post-retirement | |||||||
health care benefit cost | $ | — | $ | — | |||
Effect on the health care component of the accumulated post-retirement benefit | |||||||
obligation | $ | 0.2 | $ | 0.2 | |||
Estimated Future Contributions and Benefit Payments
As a result of the Company's 2017 settlement of the qualified defined-benefit pension plan, there are no future benefit contributions for the defined-benefit pension plan. Estimated future benefit payments for the post-retirement benefits plan reflecting future service are as follows (in millions):
Year ending December 31, | Other Post-retirement Benefits | ||
2018 | $ | 0.2 | |
2019 | 0.2 | ||
2020 | 0.2 | ||
2021 | 0.1 | ||
2022 | 0.1 | ||
2023 through 2027 | 0.7 | ||
Expected amortization from AOCI into net periodic benefit cost for the year ending December 31, 2018 is as follows (in millions):
Pension Benefits | Other Post-retirement Benefits | ||||||
Expected amortization of net actuarial loss | $ | — | $ | (0.2 | ) | ||
72
Multi-employer Defined Benefit Plan
The Company contributed $0.5 million in the year ended December 31, 2017, $0.5 million in the year ended December 31, 2016, and $0.4 million in the year ended December 31, 2015, respectively, to multi-employer defined benefit plans under the terms of a collective-bargaining agreement that covers its union represented employees.
Savings Plans
The Company maintains defined-contribution plans in the U.S., subject to Section 401(k) of the Internal Revenue Code, and in Canada, subject to the Income Tax Act. For the year ended December 31, 2017, eligible U.S. employees could elect to contribute, on a tax-deferred basis, from 1% to 75% of their compensation to a maximum of $18,000. Eligible U.S. employees over 50 years of age could also contribute an additional $6,000 on a tax-deferred basis. In Canada, employees can elect to contribute up to a maximum of $26,010 Canadian dollars. As of December 31, 2017, the Company matches 50% of U.S. and Canada employee contributions up to 6% of base salary for a total maximum company contribution of 3%. Effective January 1, 2018, the maximum contribution available to employees in Canada increased to $26,230. For the years ended December 31, 2017, 2016 and 2015, the Company made matching payments of $4.8 million, $3.9 million and $3.1 million, respectively.
12. | Earnings Per Share |
The following table sets forth the computation of basic and diluted net earnings per share (dollars and shares in millions, except per share amounts):
Years Ended December 31, | ||||||||||||||||||||||||||||||||
2017 | 2016 | 2015 | ||||||||||||||||||||||||||||||
Net Income | Weighted-Average Shares Outstanding | Net Income Per Common Share | Net Income | Weighted-Average Shares Outstanding | Net Income Per Common Share | Net Income | Weighted-Average Shares Outstanding | Net Income Per Common Share | ||||||||||||||||||||||||
Basic EPS | $ | 33.5 | 46.3 | $ | 0.72 | $ | 54.2 | 46.3 | $ | 1.17 | $ | 51.5 | 46.2 | $ | 1.12 | |||||||||||||||||
Effect of dilutive | ||||||||||||||||||||||||||||||||
common share | ||||||||||||||||||||||||||||||||
equivalents: | ||||||||||||||||||||||||||||||||
Restricted | ||||||||||||||||||||||||||||||||
stock units | — | 0.1 | — | — | 0.1 | — | — | 0.2 | (0.01 | ) | ||||||||||||||||||||||
Performance shares | — | — | — | — | 0.1 | — | — | 0.2 | — | |||||||||||||||||||||||
Diluted EPS | $ | 33.5 | 46.4 | $ | 0.72 | $ | 54.2 | 46.5 | $ | 1.17 | $ | 51.5 | 46.6 | $ | 1.11 | |||||||||||||||||
______________________________________________
Note: Basic and diluted earnings per share are calculated based on unrounded actual amounts.
Anti-dilutive stock-based awards were excluded from the calculations of diluted EPS and they were immaterial for the years ended December 31, 2017, 2016, and 2015.
13. | Stock Incentive Plans |
2010 Long-Term Incentive Plan
On May 25, 2010, the Company’s stockholders approved the 2010 Long-Term Incentive Plan (“2010 LTIP”) which provided for the granting of awards of the Company’s common stock to officers, employees and non-employee directors. On May 20, 2014, the Company’s stockholders approved an amendment to the 2010 LTIP increasing the shares reserved for issuance by 1,800,000 shares of the Company’s common stock and reapproved the performance measures that may apply to awards granted thereunder. As of December 31, 2017, the total number of shares available for issuance under the 2010 LTIP was 2,629,291. The 2010 LTIP became effective on April 1, 2010 and awards may be made under the plan through March 31, 2020. The available awards under the 2010 LTIP include: stock appreciation rights, RSUs, other stock-based awards and performance shares. The 2010 LTIP limits awards to 200,000 shares to any one participant in any one year. The majority of awards issued under the 2010 LTIP through December 31, 2017 have been RSUs and performance shares, which generally vest over three years. The Company issues new shares upon vesting of RSUs and performance shares.
73
Prior Long-Term Incentive Plans
The 2004 Long-Term Incentive Plan (“2004 LTIP”) provided for issuance of shares of non-qualified stock options and RSUs to officers and key employees. The 2005 Long-Term Incentive Plan (“2005 LTIP”) provided for the granting of RSUs to officers and key employees. The 2007 Long-Term Incentive Plan (“2007 LTIP”) provided for the granting of stock options, RSUs and performance share awards of the Company’s common stock to officers, employees and non-employee directors.
The majority of awards granted by the Company vested over a three-year period: one-third of the awards cliff-vested on the first anniversary of the vesting commencement date and the remaining awards vested in equal monthly installments for the 2004 LTIP and equal quarterly installments for the 2005 LTIP and the 2007 LTIP, over the two-year period following the first anniversary of the vesting commencement date.
For option grants, the exercise price equaled the fair value of the Company’s common stock on the date of grant. Stock options expired seven years after the date of grant. RSUs do not have an expiration date. No further grants will be made under the 2007 LTIP. During 2017, the Company closed the 2004 LTIP and the 2005 LTIP plans.
The following table summarizes the number of securities to be issued and remaining available for future issuance under all of the Company’s stock incentive plans as of December 31, 2017:
Number of securities to be issued upon exercise of outstanding options and vesting of RSUs | Weighted-average exercise price of outstanding options and vesting of RSUs | Number of securities remaining available for future issuance under equity compensation plans (excluding securities reflected in column 1) | |||||||
2007 Long-Term Incentive Plan(1) | 1,624 | $ | 0.01 | — | |||||
2010 Long-Term Incentive Plan(2) | 288,221 | $ | 0.01 | 2,629,291 | |||||
______________________________________________
(1) | Includes RSUs. |
(2) | Includes RSUs and performance shares. |
The following table summarizes the activity for all stock options, RSUs and performance shares under all of the Long-Term Incentive Plans (“LTIPs”) for the year ended December 31, 2017:
December 31, 2016 | Activity during 2017 | December 31, 2017 | ||||||||||||||||||||||||||||||||||||||||||
Outstanding | Granted | Vested / Exercised | Canceled | Outstanding | Exercisable | |||||||||||||||||||||||||||||||||||||||
Plans | Securities | Number | Price | Number | Price | Number | Price | Number | Price | Number | Price | Number | Price | |||||||||||||||||||||||||||||||
2007 LTIP | RSUs | 1,624 | $ | 0.01 | — | $ | — | — | $ | — | — | $ | — | 1,624 | $ | 0.01 | 1,624 | $ | 0.01 | |||||||||||||||||||||||||
2010 LTIP | RSUs | 230,858 | 0.01 | 177,575 | (1) | 0.01 | (149,795 | ) | 0.01 | (9,336 | ) | 0.01 | 249,302 | 0.01 | — | — | ||||||||||||||||||||||||||||
Performance shares | 168,710 | 0.01 | 126,220 | (2) | 0.01 | (128,966 | ) | 0.01 | (127,045 | ) | 0.01 | 38,919 | 0.01 | — | — | |||||||||||||||||||||||||||||
Total | 401,192 | 303,795 | (278,761 | ) | (136,381 | ) | 289,845 | 1,624 | ||||||||||||||||||||||||||||||||||||
______________________________________________
Note: Price is weighted-average price per share.
(1) | Consists of non-performance RSUs. |
(2) | In January 2017, the Company awarded a maximum of 126,220 performance shares that would have been received if the highest level of performance was achieved. The shares were ultimately canceled as the Company did not achieve the related performance targets for fiscal 2017. |
The following table summarizes RSUs and performance shares that have vested and are expected to vest as of December 31, 2017:
74
December 31, 2017 | ||||||||||||||||||||||
Outstanding | Weighted-Average Remaining Contractual Term (years) | Aggregate Intrinsic Value(1) (dollars in thousands) | ||||||||||||||||||||
Plans | Securities | Vested | Expected to vest(2) | Vested | Expected to vest(2) | Vested | Expected to vest(2) | |||||||||||||||
2007 LTIP | RSUs | 1,624 | — | — | — | $ | 51 | $ | — | |||||||||||||
2010 LTIP | RSUs | — | 240,776 | — | — | — | 7,601 | |||||||||||||||
Performance shares | — | 38,530 | — | — | — | 1,216 | ||||||||||||||||
Total | 1,624 | 279,306 | $ | 51 | $ | 8,817 | ||||||||||||||||
______________________________________________
(1) | Aggregate intrinsic value is calculated based upon the difference between the exercise price of RSUs and the Company’s closing common stock price on December 31, 2017 of $31.58, multiplied by the number of instruments that are vested or expected to vest. RSUs having exercise prices greater than the closing stock price noted above are excluded from this calculation. |
(2) | RSUs and performance shares that are expected to vest are net of estimated future forfeitures. |
The aggregate intrinsic value of stock options exercised in 2017, 2016 and 2015 was zero, $1.3 million and $1.8 million, respectively. The aggregate intrinsic value of RSUs vested and exercised in 2017, 2016 and 2015 was $6.1 million, $9.3 million and $5.8 million, respectively. The aggregate intrinsic value of performance shares vested and exercised in 2017, 2016 and 2015 was $5.5 million, $5.1 million and $2.7 million, respectively.
Assumptions Used for Fair Value
The fair values for RSUs and performance shares, which are based on the fair market value of the Company’s stock at date of grant, are included below for shares granted during 2017, 2016 and 2015.
Year Ended December 31, | |||||||||||
2017 | 2016 | 2015 | |||||||||
Weighted-average fair value per share of grants: | |||||||||||
RSUs | $ | 38.37 | $ | 38.21 | $ | 32.47 | |||||
Performance shares (1) | N/A | N/A | $ | 32.60 | |||||||
______________________________________________
(1) | Performance shares awarded in 2017 were ultimately canceled as the Company did not achieve the related performance targets for 2017. |
Stock-based Compensation Expense
The Company recognized stock-based compensation expense of $5.0 million, $6.1 million and $8.7 million for the years ended December 31, 2017, 2016 and 2015, respectively. Stock-based compensation expense is included in selling, general and administrative expenses on the consolidated statements of operations. Stock-based compensation expense recognized for 2017 was calculated based on awards ultimately expected to vest and has been reduced for estimated forfeitures. The Company’s forfeiture experience since inception of its plans has been approximately 4% of the total grants. The historical rate of forfeiture is a component of the basis for predicting the future rate of forfeitures, which are also dependent on the remaining service period related to grants and on the limited number of approximately 118 plan participants that have been awarded grants since the inception of the Company’s plans.
As of December 31, 2017, total unrecognized compensation cost related to non-vested share-based compensation arrangements was $5.2 million, which is expected to be recognized over a weighted-average period of 1.5 years.
75
14. | Stockholders’ Equity |
Amendment to the Certificate of Incorporation
On May 19, 2015, the Company’s stockholders approved an amendment to the Certificate of Incorporation increasing the total number of authorized shares of common stock from 50,000,000 to 100,000,000.
Dividends
On October 19, 2011, the Company announced the commencement of a quarterly dividend program. The Company's intentions are to continue increasing its dividends per share over time; however, the payment of any future dividends will be determined by the Company’s Board of Directors in light of then existing conditions, including the Company’s earnings, financial condition and capital requirements, strategic alternatives, restrictions in financing agreements, business conditions and other factors.
The Board of Directors approved the following cash dividends in 2017 (in millions, except per share data):
Declaration Date | Dividends Per Share | Record Date | Cash Payment Amount (1) | Payment Date | ||||
February 28, 2017 | $0.09 | March 13, 2017 | $4.2 | March 28, 2017 | ||||
May 8, 2017 | $0.09 | May 25, 2017 | $4.2 | June 22, 2017 | ||||
August 7, 2017 | $0.09 | August 29, 2017 | $4.2 | September 15, 2017 | ||||
November 6, 2017 | $0.10 | November 28, 2017 | $4.6 | December 22, 2017 | ||||
______________________________________________
(1) Includes cash payments on declared dividends and payments made on RSUs vested subsequent to the payment date.
The Company paid total dividends of $17.2 million, $15.5 million and $12.8 million in 2017, 2016 and 2015, respectively. Dividends declared and paid per common share were $0.37, $0.33 and $0.29 in 2017, 2016 and 2015, respectively.
On February 28, 2018 the Board of Directors declared a quarterly cash dividend of $0.10 per common share, which is payable on March 29, 2018 to shareholders of record as of close of business on March 12, 2018.
Repurchase of Common Stock
In August 2017, the Company’s Board of Directors authorized a new $40 million stock repurchase program (the "Program"). At the time of approval, the Company had $0.2 million remaining under its prior stock repurchase program which was subsequently retired unused. The timing, price and volume purchases under the Program are based on market conditions, cash and liquidity requirements, relevant securities laws and other factors. The Program may be discontinued or amended at any time. The Program has no expiration date and terminates when the amount authorized has been expended or the Board of Directors withdraws its authorization. As of December 31, 2017, the Company had $37.8 million under the program available for future share repurchases. As of December 31, 2016, the Company had $2.6 million under the prior program.
The following table summarizes the Company’s stock repurchase activities for the years ended December 31, 2017 and 2016:
Year Ended December 31, | |||||||
2017 | 2016 | ||||||
Number of shares repurchased | 158,106 | 237,869 | |||||
Average price per share | $ | 28.11 | $ | 37.76 | |||
Total repurchase costs (in millions) | $ | 4.4 | $ | 8.9 | |||
76
15. | Other Comprehensive Income (Loss) |
The components of other comprehensive income (“OCI”) and the related tax effects were as follows (in millions):
Year Ended December 31, | |||||||||||||||||||||||||||||||||||
2017 | 2016 | 2015 | |||||||||||||||||||||||||||||||||
Net | Net | Net | |||||||||||||||||||||||||||||||||
Before | Tax | of | Before | Tax | of | Before | Tax | of | |||||||||||||||||||||||||||
Tax | Effect | Tax | Tax | Effect | Tax | Tax | Effect | Tax | |||||||||||||||||||||||||||
Defined benefit plan adjustments: | |||||||||||||||||||||||||||||||||||
Net actuarial gain (loss) during the year | $ | 0.3 | $ | (0.1 | ) | $ | 0.2 | $ | (1.6 | ) | $ | 0.6 | $ | (1.0 | ) | $ | (2.1 | ) | $ | 0.9 | $ | (1.2 | ) | ||||||||||||
Pension settlement reclassification | 17.2 | (6.6 | ) | 10.6 | 1.3 | (0.5 | ) | 0.8 | 1.6 | (0.6 | ) | 1.0 | |||||||||||||||||||||||
Amortization of net actuarial gain (loss) | |||||||||||||||||||||||||||||||||||
included in net income | 0.4 | (0.2 | ) | 0.2 | 0.6 | (0.2 | ) | 0.4 | 0.6 | (0.2 | ) | 0.4 | |||||||||||||||||||||||
Net gain during the year | 17.9 | (6.9 | ) | 11.0 | 0.3 | (0.1 | ) | 0.2 | 0.1 | 0.1 | 0.2 | ||||||||||||||||||||||||
Foreign currency translation gain (loss) | 1.1 | — | 1.1 | 1.9 | — | 1.9 | (4.9 | ) | — | (4.9 | ) | ||||||||||||||||||||||||
Other comprehensive income (loss) | $ | 19.0 | $ | (6.9 | ) | $ | 12.1 | $ | 2.2 | $ | (0.1 | ) | $ | 2.1 | $ | (4.8 | ) | $ | 0.1 | $ | (4.7 | ) | |||||||||||||
The following table provides a summary of the changes in AOCI for the years presented (in millions):
Foreign | |||||||||||
Defined | Currency | ||||||||||
Benefit Plan | Translation | Total | |||||||||
Balance as of December 31, 2014 | $ | (10.8 | ) | $ | (0.8 | ) | $ | (11.6 | ) | ||
Other comprehensive income (loss) | 0.2 | (4.9 | ) | (4.7 | ) | ||||||
Balance as of December 31, 2015 | (10.6 | ) | (5.7 | ) | (16.3 | ) | |||||
Other comprehensive income | 0.2 | 1.9 | 2.1 | ||||||||
Balance as of December 31, 2016 | (10.4 | ) | (3.8 | ) | (14.2 | ) | |||||
Other comprehensive income (loss) | 11.0 | 1.1 | 12.1 | ||||||||
Balance as of December 31, 2017 | $ | 0.6 | $ | (2.7 | ) | $ | (2.1 | ) | |||
77
16. Segment and Geographic Information
The Company identifies its operating segments based primarily on the way the Chief Operating Decision Maker (“CODM”) evaluates performance and makes decisions. During 2017, the Company appointed Scott McPherson, President and Chief Operating Officer ("COO"), and with this promotion, we consider the Company's CEO and COO as the Chief Operating Decision Makers. From the perspective of the CODMs, the Company is engaged primarily in the business of distributing packaged consumer products to convenience retail stores in the U.S. and Canada (collectively “North America”), which consists of customers that have similar characteristics. Therefore, the Company has determined that it has two operating segments, U.S. and Canada, that aggregate to one reportable segment. Additionally, the Company presents its segment reporting information based on business operations for each of the two geographic areas in which it operates and also by major product category.
Information about the Company’s business operations based on geographic areas is as follows (in millions):
Year Ended December 31, | |||||||||||
2017 | 2016 | 2015 | |||||||||
Net sales: | |||||||||||
United States | $ | 14,245.8 | $ | 13,133.0 | $ | 9,829.7 | |||||
Canada | 1,396.6 | 1,356.4 | 1,203.5 | ||||||||
Corporate (1) | 45.2 | 40.0 | 36.2 | ||||||||
Total | $ | 15,687.6 | $ | 14,529.4 | $ | 11,069.4 | |||||
Income (loss) before income taxes: | |||||||||||
United States | $ | 58.4 | $ | 90.7 | $ | 79.4 | |||||
Canada | 8.2 | 6.4 | 1.7 | ||||||||
Corporate (2) | (38.2 | ) | (11.6 | ) | 1.8 | ||||||
Total | $ | 28.4 | $ | 85.5 | $ | 82.9 | |||||
Interest expense: | |||||||||||
United States | $ | 47.1 | $ | 40.8 | $ | 35.0 | |||||
Canada | 1.0 | 1.1 | 0.7 | ||||||||
Corporate (3) | (36.8 | ) | (36.6 | ) | (33.2 | ) | |||||
Total | $ | 11.3 | $ | 5.3 | $ | 2.5 | |||||
Depreciation and amortization: | |||||||||||
United States | $ | 37.5 | $ | 31.0 | $ | 29.3 | |||||
Canada | 2.4 | 2.5 | 2.4 | ||||||||
Corporate (4) | 14.5 | 9.4 | 6.2 | ||||||||
Total | $ | 54.4 | $ | 42.9 | $ | 37.9 | |||||
Capital expenditures: | |||||||||||
United States | $ | 46.7 | $ | 52.4 | $ | 28.6 | |||||
Canada | 1.5 | 1.9 | 1.7 | ||||||||
Total | $ | 48.2 | $ | 54.3 | $ | 30.3 | |||||
_____________________________________________
(1) | Consists primarily of external sales made by the Company’s consolidating warehouses, management service fee revenue, allowance for sales returns and certain other sales adjustments. |
(2) | Consists primarily of expenses and other income, such as corporate incentives and salaries, LIFO expense, final pension settlement, health care costs, insurance and workers’ compensation adjustments, elimination of overhead allocations and foreign exchange gains or losses. The change from 2017 to 2016 is primarily related to the recognition of $17.2 million of pension termination expenses which were recorded in accumulated other comprehensive loss on our consolidated balance sheets in prior years. The change from 2016 to 2015 is attributable primarily to lower LIFO expenses and lower payroll costs in 2015. |
(3) | Consists primarily of intercompany eliminations for interest. |
(4) | Consists primarily of depreciation for the consolidation centers and amortization of intangible assets. The change from 2017 to 2016 is primarily attributable to the additional amortization of intangible assets related to our acquisitions and software costs. |
78
Identifiable assets by geographic area are as follows (in millions):
December 31, | December 31, | December 31, | |||||||||
2017 | 2016 | 2015 | |||||||||
Identifiable assets (1): | |||||||||||
United States | $ | 1,510.5 | $ | 1,312.5 | $ | 981.4 | |||||
Canada | 272.0 | 179.7 | 95.9 | ||||||||
Total | $ | 1,782.5 | $ | 1,492.2 | $ | 1,077.3 | |||||
______________________________________________
(1) | Retrospective adoption of ASU No. 2015-17, Income Taxes: Balance Sheet Classification of Deferred Taxes. Refer to Note 2. |
The net sales for the Company’s product categories are as follows (in millions):
Year Ended December 31, | |||||||||||
2017 | 2016 | 2015 | |||||||||
Product Category | Net Sales | Net Sales | Net Sales | ||||||||
Cigarettes | $ | 10,887.4 | $ | 10,335.7 | $ | 7,528.5 | |||||
Food | 1,561.1 | 1,422.5 | 1,251.1 | ||||||||
Fresh | 436.3 | 389.8 | 335.0 | ||||||||
Candy | 833.4 | 620.0 | 557.0 | ||||||||
Other tobacco products | 1,272.3 | 1,133.8 | 870.3 | ||||||||
Health, beauty & general | 513.3 | 446.7 | 368.8 | ||||||||
Beverages | 183.4 | 176.5 | 156.6 | ||||||||
Equipment/other | 0.4 | 4.4 | 2.1 | ||||||||
Total food/non-food products | $ | 4,800.2 | $ | 4,193.7 | $ | 3,540.9 | |||||
Total net sales | $ | 15,687.6 | $ | 14,529.4 | $ | 11,069.4 | |||||
79
17. | Quarterly Financial Data (Unaudited) |
The tables below provide the Company’s unaudited consolidated results of operations for each of the four quarters in 2017 and 2016:
Three Months Ended | |||||||||||||||
(in millions, except per share data) | |||||||||||||||
December 31, | September 30, | June 30, | March 31, | ||||||||||||
2017 | 2017 | 2017 | 2017 | ||||||||||||
Net sales — Cigarettes (1) | $ | 2,775.9 | $ | 2,958.6 | $ | 2,666.2 | $ | 2,486.7 | |||||||
Net sales — Food/non-food (1) | 1,296.1 | 1,352.1 | 1,134.5 | 1,017.5 | |||||||||||
Net sales (1) | 4,072.0 | 4,310.7 | 3,800.7 | 3,504.2 | |||||||||||
Cost of goods sold (1) | 3,862.6 | 4,088.5 | 3,614.6 | 3,330.2 | |||||||||||
Gross profit (2) | 209.4 | 222.2 | 186.1 | 174.0 | |||||||||||
Warehousing and distribution expenses (3) | 134.0 | 137.4 | 118.0 | 114.7 | |||||||||||
Selling, general and administrative expenses (4) | 75.0 | 57.0 | 54.2 | 55.3 | |||||||||||
Amortization of intangible assets | 2.5 | 2.4 | 1.8 | 1.8 | |||||||||||
Total operating expenses | 211.5 | 196.8 | 174 | 171.8 | |||||||||||
(Loss) income from operations | (2.1 | ) | 25.4 | 12.1 | 2.2 | ||||||||||
Interest expense | (3.4 | ) | (3.9 | ) | (2.0 | ) | (2.0 | ) | |||||||
Interest income | 0.1 | 0.1 | — | 0.1 | |||||||||||
Foreign currency (loss) gain, net | (0.1 | ) | 0.2 | 1.1 | 0.6 | ||||||||||
(Loss) income before income taxes (5) | (5.5 | ) | 21.8 | 11.2 | 0.9 | ||||||||||
Income tax benefit (provision) (6) | 16.3 | (8.1 | ) | (4.3 | ) | 1.2 | |||||||||
Net income | 10.8 | 13.7 | 6.9 | 2.1 | |||||||||||
Basic net income per common share (7) | $ | 0.23 | $ | 0.29 | $ | 0.15 | $ | 0.05 | |||||||
Diluted net income per common share (7) | $ | 0.23 | $ | 0.29 | $ | 0.15 | $ | 0.05 | |||||||
Shares used to compute basic net income | |||||||||||||||
per common share | 46.2 | 46.3 | 46.3 | 46.3 | |||||||||||
Shares used to compute diluted net income | |||||||||||||||
per common share | 46.3 | 46.4 | 46.4 | 46.4 | |||||||||||
Excise taxes (1) | $ | 891.4 | $ | 961.6 | $ | 872.1 | $ | 737.5 | |||||||
Cigarette inventory holding gains (8) | 2.0 | 6.6 | 0.9 | 6.6 | |||||||||||
LIFO expense | 6.7 | 6.0 | 4.6 | 4.2 | |||||||||||
Depreciation and amortization | 14.8 | 15.3 | 12.2 | 12.1 | |||||||||||
Stock-based compensation | 1.5 | 1.2 | 1.2 | 1.1 | |||||||||||
Capital expenditures | 4.2 | 13.2 | 17.1 | 13.7 | |||||||||||
Pension Termination Settlement (5) | 17.2 | — | — | — | |||||||||||
____________________________________________
(1) | Excise taxes are included as a component of net sales and cost of goods sold. |
(2) | In 2017, we received OTP tax refunds of $3.9 million related to prior years’ taxes, offset by $0.6 million of related expenses. |
(3) | Warehousing and distribution expenses are not included as a component of the Company’s cost of goods sold. This presentation may differ from that of other registrants. |
(4) | Selling, general and administrative (“SG&A”) expenses include acquisition related expenses and transaction costs of $1.8 million, related primarily to the addition of Farner-Bocken consisting of less than $0.1 million in Q4, $0.3 million in Q3, $0.8 million in Q2, and $0.6 million in Q1. |
(5) | Income before income taxes in Q4 was impacted by pension settlement charges of $17.2 million recorded in SG&A expenses. |
(6) | The fourth quarter of 2017, included a $14.6 million net income tax benefit as a result of the impacts of the 2017 TCJA. See Note 10 for additional information. |
(7) | Totals may not agree with full year amounts due to rounding. |
(8) | Cigarette inventory holding gains represent income related to cigarette inventories on hand at the time cigarette manufacturers increase their prices. Such increases are reflected in customer pricing for all subsequent sales, including sales of inventory on hand at the time of the increase. |
80
Three Months Ended | |||||||||||||||
(in millions, except per share data) | |||||||||||||||
December 31, | September 30, | June 30, | March 31, | ||||||||||||
2016 | 2016 | 2016 | 2016 | ||||||||||||
Net sales — Cigarettes (1) | $ | 2,734.7 | $ | 2,855.3 | $ | 2,631.1 | $ | 2,114.6 | |||||||
Net sales — Food/non-food (1) | 1,102.1 | 1,138.6 | 1,056.3 | 896.7 | |||||||||||
Net sales (1) | 3,836.8 | 3,993.9 | 3,687.4 | 3,011.3 | |||||||||||
Cost of goods sold (1) | 3,637.8 | 3,795.0 | 3,499.5 | 2,860.2 | |||||||||||
Gross profit | 199.0 | 198.9 | 187.9 | 151.1 | |||||||||||
Warehousing and distribution expenses (2) | 116.2 | 117.4 | 106.0 | 91.6 | |||||||||||
Selling, general and administrative expenses (3) | 50.3 | 57.6 | 53.0 | 49.4 | |||||||||||
Amortization of intangible assets | 1.5 | 1.7 | 1.2 | 0.9 | |||||||||||
Total operating expenses | 168.0 | 176.7 | 160.2 | 141.9 | |||||||||||
Income from operations | 31.0 | 22.2 | 27.7 | 9.2 | |||||||||||
Interest expense | (2.0 | ) | (1.5 | ) | (1.0 | ) | (0.8 | ) | |||||||
Interest income | 0.1 | — | — | 0.1 | |||||||||||
Foreign currency gains (losses), net | 0.6 | (0.5 | ) | (0.3 | ) | 0.7 | |||||||||
Income before income taxes | 29.7 | 20.2 | 26.4 | 9.2 | |||||||||||
Income tax provision | (11.0 | ) | (6.7 | ) | (10.1 | ) | (3.5 | ) | |||||||
Net income | 18.7 | 13.5 | 16.3 | 5.7 | |||||||||||
Basic net income per common share (4) | $ | 0.41 | $ | 0.29 | $ | 0.35 | $ | 0.12 | |||||||
Diluted net income per common share (4) | $ | 0.41 | $ | 0.29 | $ | 0.35 | $ | 0.12 | |||||||
Shares used to compute basic net income | |||||||||||||||
per common share | 46.2 | 46.3 | 46.3 | 46.4 | |||||||||||
Shares used to compute diluted net income | |||||||||||||||
per common share | 46.4 | 46.5 | 46.5 | 46.6 | |||||||||||
Excise taxes (1) | $ | 815.4 | $ | 879.1 | $ | 729.5 | $ | 598.0 | |||||||
Cigarette inventory holding gains (5) | 6.9 | 0.4 | 7.0 | 1.0 | |||||||||||
LIFO expense | 3.2 | 3.7 | 2.9 | 3.4 | |||||||||||
Depreciation and amortization | 11.7 | 11.4 | 10.2 | 9.6 | |||||||||||
Stock-based compensation | 0.6 | 1.9 | 1.7 | 1.9 | |||||||||||
Capital expenditures | 9.8 | 21.7 | 14.0 | 8.8 | |||||||||||
______________________________________________
(1) | Excise taxes are included as a component of net sales and cost of goods sold. |
(2) | Warehousing and distribution expenses are not included as a component of the Company’s cost of goods sold. This presentation may differ from that of other registrants. |
(3) | Selling, general and administrative ("SG&A") expenses include acquisition related expenses and transaction costs of $2.2 million, related primarily to the addition of Pine State consisting of $0.3 million in Q4, $0.5 million in Q3, $0.8 million in Q2, and $0.6 million in Q1. SG&A expenses also include $1.3 million related to pension settlements, consisting of $0.1 million in Q4 and $1.2 million in Q3 and a $2.0 million gain, net of legal costs, related to the settlement of a legacy legal proceeding with Sonitrol Corporation in Q1. |
(4) | Totals may not agree with full year amounts due to rounding. |
(5) | Cigarette inventory holding gains represent income related to cigarette inventories on hand at the time cigarette manufacturers increase their prices. Such increases are reflected in customer pricing for all subsequent sales, including sales of inventory on hand at the time of the increase. |
81
ITEM 9. | CHANGES IN AND DISAGREEMENTS WITH ACCOUNTANTS ON ACCOUNTING AND |
FINANCIAL DISCLOSURE
None.
ITEM 9A. CONTROLS AND PROCEDURES
Evaluation of Disclosure Controls and Procedures
We conducted, under the supervision and with the participation of our management, including the chief executive officer and chief financial officer, an evaluation of the effectiveness of the design and operation of our disclosure controls and procedures (as defined in Rules 13a-15(e) and 15d-15(e) under the Securities Exchange Act of 1934, as amended). Based on our evaluation, the chief executive officer and chief financial officer concluded that, as of December 31, 2017, our disclosure controls and procedures were effective.
Management’s Report on Internal Control over Financial Reporting
Our management is responsible for establishing and maintaining adequate internal control over financial reporting as defined in Rule 13a-15(f) of the Securities Exchange Act of 1934. We assessed the effectiveness of our internal control over financial reporting as of December 31, 2017. In making this assessment, we used the criteria set forth by the Committee of Sponsoring Organizations of the Treadway Commission ("COSO") in Internal Control-Integrated Framework (2013), issued by the Committee of Sponsoring Organizations of the Treadway Commission.
Based on this assessment, we concluded that our internal control over financial reporting was effective as of December 31, 2017. Our assessment of the effectiveness of internal control over financial reporting as of December 31, 2017 did not include the internal controls of Farner-Bocken Company, which we acquired on July 10, 2017, as permitted by Securities and Exchange Commission guidelines that allow companies to exclude certain acquisitions from their assessment of internal control over financial reporting during the first year of an acquisition. The total assets and total revenues of Farner-Bocken Company represented approximately 3% of the Company’s total assets as of December 31, 2017, approximately 4% of its total revenues, and approximately 33% of income before income taxes of the consolidated financial statement amounts for the year ended December 31, 2017.
Our internal control over financial reporting as of December 31, 2017 has been audited by Deloitte & Touche LLP, our independent registered public accounting firm, as stated in their report which appears herein.
Changes in Internal Control over Financial Reporting
There were no changes in our internal control over financial reporting that occurred during the fourth quarter of the year ended December 31, 2017 that have materially affected, or are reasonably likely to materially affect, the internal control over financial reporting.
82
REPORT OF INDEPENDENT REGISTERED PUBLIC ACCOUNTING FIRM
To the Stockholders and the Board of Directors of Core-Mark Holding Company, Inc.
Opinion on Internal Control over Financial Reporting
We have audited the internal control over financial reporting of Core-Mark Holding Company, Inc. and subsidiaries (the “Company”) as of December 31, 2017, based on criteria established in Internal Control - Integrated Framework (2013) issued by the Committee of Sponsoring Organizations of the Treadway Commission (COSO). In our opinion, the Company maintained, in all material respects, effective internal control over financial reporting as of December 31, 2017, based on criteria established in Internal Control - Integrated Framework (2013) issued by COSO.
We have also audited, in accordance with the standards of the Public Company Accounting Oversight Board (United States) (PCAOB), the consolidated financial statements as of and for the year ended December 31, 2017, of the Company and our report dated March 1, 2018, expressed an unqualified opinion on those financial statements.
As described in Management’s Report on Internal Control over Financial Reporting, management excluded from its assessment the internal control over financial reporting at Farner-Bocken Company (“Farner-Bocken”), which was acquired on July 10, 2017 and whose financial statements constitute approximately 3% of total assets, approximately 4% of total net sales and approximately 33% of income before income taxes of the consolidated financial statement amounts as of and for the year ended December 31, 2017. Accordingly, our audit did not include the internal control over financial reporting at Farner-Bocken.
Basis for Opinion
The Company’s management is responsible for maintaining effective internal control over financial reporting and for its assessment of the effectiveness of internal control over financial reporting, included in the accompanying Management’s Report on Internal Control over Financial Reporting. Our responsibility is to express an opinion on the Company’s internal control over financial reporting based on our audit. We are a public accounting firm registered with the PCAOB and are required to be independent with respect to the Company in accordance with the U.S. federal securities laws and the applicable rules and regulations of the Securities and Exchange Commission and the PCAOB.
We conducted our audit in accordance with the standards of the PCAOB. Those standards require that we plan and perform the audit to obtain reasonable assurance about whether effective internal control over financial reporting was maintained in all material respects. Our audit included obtaining an understanding of internal control over financial reporting, assessing the risk that a material weakness exists, testing and evaluating the design and operating effectiveness of internal control based on the assessed risk, and performing such other procedures as we considered necessary in the circumstances. We believe that our audit provides a reasonable basis for our opinion.
Definition and Limitations of Internal Control over Financial Reporting
A company’s internal control over financial reporting is a process designed to provide reasonable assurance regarding the reliability of financial reporting and the preparation of financial statements for external purposes in accordance with generally accepted accounting principles. A company’s internal control over financial reporting includes those policies and procedures that (1) pertain to the maintenance of records that, in reasonable detail, accurately and fairly reflect the transactions and dispositions of the assets of the company; (2) provide reasonable assurance that transactions are recorded as necessary to permit preparation of financial statements in accordance with generally accepted accounting principles, and that receipts and expenditures of the company are being made only in accordance with authorizations of management and directors of the company; and (3) provide reasonable assurance regarding prevention or timely detection of unauthorized acquisition, use, or disposition of the company’s assets that could have a material effect on the financial statements.
Because of its inherent limitations, internal control over financial reporting may not prevent or detect misstatements. Also, projections of any evaluation of effectiveness to future periods are subject to the risk that controls may become inadequate because of changes in conditions, or that the degree of compliance with the policies or procedures may deteriorate.
/s/ Deloitte & Touche LLP |
San Francisco, California |
March 1, 2018 |
83
ITEM 9B. OTHER INFORMATION
None.
84
PART III
ITEM 10. | DIRECTORS, EXECUTIVE OFFICERS AND CORPORATE GOVERNANCE |
The information required by this item is included in our Proxy Statement for the 2018 Annual Meeting of Stockholders under the following captions and is incorporated herein by reference thereto: “Nominees for Director,” “Board of Directors,” “Our Executive Officers,” and “Ownership of Core-Mark Common Stock-Section 16(a) Beneficial Ownership Reporting Compliance.”
ITEM 11. EXECUTIVE COMPENSATION
The information required by this item is included in our Proxy Statement for the 2018 Annual Meeting of Stockholders under the following captions and is incorporated herein by reference thereto: “Board of Directors-Director Compensation,” “Board of Directors-Compensation Committee Interlocks and Insider Participation,” “Compensation Discussion and Analysis,” “Compensation Committee Report,” and “Compensation of Named Executives.”
ITEM 12. SECURITY OWNERSHIP OF CERTAIN BENEFICIAL OWNERS AND MANAGEMENT AND
RELATED STOCKHOLDER MATTERS
The information required by this item is included in our Proxy Statement for the 2018 Annual Meeting of Stockholders under the captions “Ownership of Core-Mark Common Stock” and “Equity Compensation Plan Information” and is incorporated herein by reference thereto.
ITEM 13. CERTAIN RELATIONSHIPS AND RELATED TRANSACTIONS, AND DIRECTOR
INDEPENDENCE
The information required by this item is included in our Proxy Statement for the 2018 Annual Meeting of Stockholders under the following caption and is incorporated by reference herein by reference thereto: “Board of Directors-Certain Relationships and Related Transactions,” “Board of Directors-Committees of the Board of Directors” and “Board of Directors-Corporate Governance.”
ITEM 14. PRINCIPAL ACCOUNTING FEES AND SERVICES
The information required by this item is included in our Proxy Statement for the 2018 Annual Meeting of Stockholders under the caption “Ratification of Selection of Independent Registered Public Accounting Firm-Auditor Fees” and is incorporated herein by reference thereto.
85
PART IV
ITEM 15. EXHIBITS, FINANCIAL STATEMENT SCHEDULES
We have filed the following documents as part of this Annual Report on Form 10-K:
1. | Consolidated Financial Statements |
Report of Independent Registered Public Accounting Firm |
Financial Statements: |
Consolidated Balance Sheets |
Consolidated Statements of Operations |
Consolidated Statements of Comprehensive Income |
Consolidated Statements of Stockholders’ Equity |
Consolidated Statements of Cash Flows |
Notes to Consolidated Financial Statements |
2. | Financial Statement Schedules |
SCHEDULE II-VALUATION AND QUALIFYING ACCOUNTS
(in millions)
Balance at Beginning of Period | Charged to Costs and Expenses | Deductions | Charged to Other Accounts | Balance at End of Period | |||||||||||||||
Year Ended December 31, 2017 | |||||||||||||||||||
Allowances for: | |||||||||||||||||||
Trade receivables | $ | 7.1 | $ | 1.1 | $ | (1.3 | ) | $ | 0.4 | $ | 7.3 | ||||||||
Inventory reserves | 0.8 | 20.7 | (20.5 | ) | — | 1.0 | |||||||||||||
$ | 7.9 | $ | 21.8 | $ | (21.8 | ) | $ | 0.4 | $ | 8.3 | |||||||||
Year Ended December 31, 2016 | |||||||||||||||||||
Allowances for: | |||||||||||||||||||
Trade receivables | $ | 10.9 | $ | 2.0 | $ | (6.0 | ) | $ | 0.2 | $ | 7.1 | ||||||||
Inventory reserves | 0.7 | 20.9 | (20.8 | ) | — | 0.8 | |||||||||||||
$ | 11.6 | $ | 22.9 | $ | (26.8 | ) | $ | 0.2 | $ | 7.9 | |||||||||
Year Ended December 31, 2015 | |||||||||||||||||||
Allowances for: | |||||||||||||||||||
Trade receivables | $ | 10.8 | $ | 1.3 | $ | (1.3 | ) | $ | 0.1 | $ | 10.9 | ||||||||
Inventory reserves | 0.6 | 18.6 | (18.5 | ) | — | 0.7 | |||||||||||||
$ | 11.4 | $ | 19.9 | $ | (19.8 | ) | $ | 0.1 | $ | 11.6 | |||||||||
All other schedules have been omitted because they are not required, not applicable, or the required information is otherwise included.
86
3. | Exhibits |
The following exhibits are filed as part of this Annual Report on Form 10-K:
EXHIBIT INDEX
Exhibit No. | Description |
Third Amended and Revised Joint Plan of Reorganization of Fleming Companies, Inc. and its Subsidiaries Under Chapter 11 of the Bankruptcy Code, dated May 25, 2004 (incorporated by reference to Exhibit 2.1 of the Company’s Registration Statement on Form 10 filed on September 6, 2005). | |
Certificate of Incorporation of Core-Mark Holding Company, Inc. (incorporated by reference to Exhibit 3.1 of the Company’s Registration Statement on Form 10 filed on September 6, 2005). | |
Certificate of Amendment to Certificate of Incorporation of Core-Mark Holding Company, Inc. (incorporated by reference to Exhibit 3.1 of the Company’s Current Report on Form 8-K filed on May 21, 2015). | |
Second Amended and Restated Bylaws of Core-Mark Holding Company, Inc. (incorporated by reference to Exhibit 3.2 of the Company’s Current Report on Form 8-K filed on August 18, 2008). | |
2007 Long-Term Incentive Plan (incorporated by reference to Annex A of the Company’s Proxy Statement on Schedule 14A filed on April 23, 2007). | |
Statement of Policy Regarding 2007 Long-Term Incentive Plan (incorporated by reference to Exhibit 99.1 of the Company's Current Report on Form 8-K filed on May 9, 2007). | |
2010 Long-Term Incentive Plan (as amended, effective May 20, 2014) (incorporated by reference to Annex II of the Company's Proxy Statement on Schedule 14A filed on April 8, 2014). | |
Form of Management Option Award Agreement for Awards under the Core-Mark Holding Company, Inc. 2004 Long-Term Incentive Plan (incorporated by reference to Exhibit 10.7 of the Company's Annual Report on Form 10-K filed on March 13, 2009). | |
Form of Non-Employee Director RSU Award Agreement under the Core-Mark Holding Company, Inc. 2010 Long-Term Incentive Plan. (Incorporated by reference to Exhibit 10.7 of the Company's Annual Report on Form 10-K filed on February 26, 2016.) | |
Form of Management RSU Award Agreement under the Core-Mark Holding Company, Inc. 2010 Long-Term Incentive Plan. (Incorporated by reference to Exhibit 10.8 of the Company's Annual Report on Form 10-K filed on February 26, 2016.) | |
Form of Performance RSU Award Agreement under the Core- Mark Holding Company, Inc. 2010 Long-Term Incentive Plan. (Incorporated by reference to Exhibit 10.9 of the Company's Annual Report on Form 10-K filed on February 26, 2016.) | |
Form of Indemnification Agreement for Officers and Directors (incorporated by reference to Exhibit 10.5 of the Company's Registration Statement on Form 10 filed on September 6, 2005). | |
Registration Rights Agreement, dated August 20, 2004, among Core-Mark Holding Company, Inc. and the parties listed on Schedule I attached thereto (incorporated by reference to Exhibit 10.10 of the Company's Registration Statement on Form 10 filed on September 6, 2005). | |
Credit Agreement, dated October 12, 2005, among Core-Mark Holding Company, Inc., Core-Mark International, Inc., Core-Mark Holdings I, Inc., Core-Mark Holdings II, Inc., Core-Mark Holdings III, Inc., Core-Mark Midcontinent, Inc., Core-Mark Interrelated Companies, Inc., Head Distributing Company and Minter-Weisman Co., as Borrowers, the Lenders Signatory Thereto as Lenders, JPMorgan Chase Bank, N.A., as Administrative Agent, General Electric Capital Corporation and Wachovia Capital Finance Corporation (Western), as Co-Syndication Agents and Bank of America, N.A. and Wells Fargo Foothill, LLC, as Co-Documentation Agents (incorporated by reference to Exhibit 10.13 of the Company's Registration Statement on Form 10 filed on October 21, 2005). | |
87
Exhibit No. | Description |
First Amendment to Credit Agreement, dated December 4, 2007, among Core-Mark Holding Company, Inc., Core-Mark International, Inc., Core-Mark Holdings I, Inc., Core-Mark Holdings II, Inc., Core-Mark Holdings III, Inc., Core-Mark Midcontinent, Inc., Core-Mark Interrelated Companies, Inc., Head Distributing Company and Minter-Weisman Co., as Borrowers, the Lenders Signatory Thereto as Lenders and JPMorgan Chase Bank, N.A., as Administrative Agent (incorporated by reference to Exhibit 10.19 of the Company's Annual Report on Form 10-K filed on March 12, 2009). | |
Second Amendment to Credit Agreement, dated March 12, 2008, among Core-Mark Holding Company, Inc., Core-Mark International, Inc., Core-Mark Holdings I, Inc., Core-Mark Holdings II, Inc., Core-Mark Holdings III, Inc., Core-Mark Midcontinent, Inc., Core-Mark Interrelated Companies, Inc., Head Distributing Company and Minter-Weisman Co., as Borrowers, the Lenders Signatory Thereto as Lenders and JPMorgan Chase Bank, N.A., as Administrative Agent (incorporated by reference to Exhibit 10.1 of the Company's Current Report on Form 8-K filed on March 18, 2008). | |
Third Amendment to Credit Agreement, dated February 2, 2010, among Core-Mark Holding Company, Inc., Core-Mark International, Inc., Core-Mark Holdings I, Inc., Core-Mark Holdings II, Inc., Core-Mark Holdings III, Inc., Core-Mark Midcontinent, Inc., Core-Mark Interrelated Companies, Inc., Head Distributing Company and Minter-Weisman Co., as Borrowers, the Lenders Signatory Thereto as Lenders and JPMorgan Chase Bank, N.A., as Administrative Agent (incorporated by reference to Exhibit 10.1 of the Company's Current Report on Form 8-K filed on February 5, 2010). | |
Fourth Amendment to Credit Agreement, dated May 5, 2011, among Core-Mark Holding Company, Inc., Core-Mark International, Inc., Core-Mark Holdings I, Inc., Core-Mark Holdings II, Inc., Core-Mark Holdings III, Inc., Core-Mark Midcontinent, Inc., Core-Mark Interrelated Companies, Inc., Head Distributing Company and Minter-Weisman Co., as Borrowers, the Lenders Signatory Thereto as Lenders and JPMorgan Chase Bank, N.A., as Administrative Agent (incorporated by reference to Exhibit 10.1 of the Company's Quarterly Report on Form 10-Q filed on May 9, 2011). | |
Fifth Amendment to Credit Agreement, dated May 30, 2013, among Core-Mark Holding Company, Inc., Core-Mark International, Inc., Core-Mark Holdings I, Inc., Core-Mark Holdings II, Inc., Core-Mark Holdings III, Inc., Core-Mark Midcontinent, Inc., Core-Mark Interrelated Companies, Inc., Head Distributing Company and Minter-Weisman Co., as Borrowers, the Lenders Signatory Thereto as Lenders and JPMorgan Chase Bank, N.A., as Administrative Agent (incorporated by reference to Exhibit 10.1 of the Company's Quarterly Report on Form 10-Q filed on August 7, 2013). | |
Sixth Amendment to Credit Agreement, dated May 21, 2015, among Core-Mark Holding Company, Inc., Core-Mark International, Inc., Core-Mark Midcontinent, Inc., Core-Mark Interrelated Companies, Inc., Core-Mark Distributors, Inc. and Minter-Weisman Co., as Borrowers, the Lenders Signatory Thereto as Lenders and JPMorgan Chase Bank, N.A., as Administrative Agent (incorporated by reference to Exhibit 10.1 of the Company's Current Report on Form 8-K filed on May 22, 2015). | |
Seventh Amendment to Credit Agreement, dated January 11, 2016, among Core-Mark Holding Company, Inc., Core-Mark International, Inc., Core-Mark Midcontinent, Inc., Core-Mark Interrelated Companies, Inc., Core-Mark Distributors, Inc. and Minter-Weisman Co., as Borrowers, the Lenders Signatory Thereto as Lenders and JPMorgan Chase Bank, N.A., as Administrative Agent (incorporated by reference to Exhibit 10.1 of the Company's Current Report on Form 8-K filed on January 12, 2016). | |
Eighth Amendment to Credit Agreement, dated May 16, 2016, among Core-Mark Holding Company, Inc., Core-Mark International, Inc., Core-Mark Midcontinent, Inc., Core-Mark Interrelated Companies, Inc., Core-Mark Distributors, Inc. and Minter-Weisman Co., as Borrowers, the Lenders Signatory Thereto as Lenders and JPMorgan Chase Bank, N.A., as Administrative Agent (incorporated by reference to Exhibit 10.1 of the Company's Current Report on Form 8-K filed on May 17, 2016). | |
Ninth Amendment to Credit Agreement, dated November 4, 2016, among Core-Mark Holding Company, Inc., Core-Mark International, Inc., Core-Mark Midcontinent, Inc., Core-Mark Interrelated Companies, Inc., Core-Mark Distributors, Inc. and Minter-Weisman Co., as Borrowers, the Lenders Signatory Thereto as Lenders and JPMorgan Chase Bank, N.A., as Administrative Agent (incorporated by reference to Exhibit 10.1 of the Company's Quarterly Report on Form 10-Q filed on November 11, 2016). | |
Tenth Amendment to Credit Agreement, dated March 28, 2017, among Core-Mark Holding Company, Inc., Core-Mark International, Inc., Core-Mark Midcontinent, Inc., Core-Mark Interrelated Companies, Inc., Core-Mark Distributors, Inc. and Minter-Weisman Co., as Borrowers, the Lenders Signatory Thereto as Lenders and JPMorgan Chase Bank, N.A., as Administrative Agent (incorporated by reference to Exhibit 10.1 of the Company's Quarterly Report on Form 8-K filed on March 29, 2017). | |
88
Pledge and Security Agreement, dated October 12, 2005, among Core-Mark Holding Company, Inc., Core-Mark Holdings I, Inc., Core-Mark Holdings II, Inc., Core-Mark Holdings III, Inc., Core-Mark International, Inc., Core-Mark Midcontinent, Inc., Core-Mark Interrelated Companies, Inc., Head Distributing Company, Inc. and Minter-Weisman Co., Inc., as Grantors and JPMorgan Chase Bank, N.A., as Administrative Agent (incorporated by reference to Exhibit 10.13 of the Company's Registration Statement on Form 10 filed on October 21, 2005). | |
Exhibit No. | Description |
11.1 | Statement of Computation of Earnings Per Share (required information contained within this Annual Report on Form 10-K). |
List of Subsidiaries of Core-Mark Holding Company, Inc. | |
Consent of Deloitte & Touche LLP, Independent Registered Public Accounting Firm | |
Certification of Chief Executive Officer Pursuant to Section 302 of the Sarbanes-Oxley Act of 2002. | |
Certification of Chief Financial Officer Pursuant to Section 302 of the Sarbanes-Oxley Act of 2002. | |
Certification of Chief Executive Officer Pursuant to 18 U.S.C. Section 1350. | |
Certification of Chief Financial Officer Pursuant to 18 U.S.C. Section 1350. | |
101.INS | XBRL Instance Document |
101.SCH | XBRL Taxonomy Extension Schema Document |
101.CAL | XBRL Taxonomy Extension Calculation Linkbase Document |
101.DEF | XBRL Taxonomy Extension Definition Linkbase Document |
101.LAB | XBRL Taxonomy Extension Label Linkbase Document |
101.PRE | XBRL Taxonomy Extension Presentation Linkbase Document |
89
SIGNATURES
Pursuant to the requirements of Section 13 or 15(d) of the Securities Exchange Act of 1934, the registrant has duly caused this report to be signed on its behalf by the undersigned, thereunto duly authorized.
CORE-MARK HOLDING COMPANY, INC. | ||||
Date: | March 1, 2018 | By: | /s/ THOMAS B. PERKINS | |
Thomas B. Perkins | ||||
Chief Executive Officer and Director | ||||
Pursuant to the requirements of the Securities Exchange Act of 1934, this report has been signed below by the following persons on behalf of the registrant and in the capacities and on the dates indicated.
SIGNATURE | TITLE | DATE | ||
/s/ THOMAS B. PERKINS | Chief Executive Officer and Director | March 1, 2018 | ||
Thomas B. Perkins | (Principal Executive Officer) | |||
/s/ CHRISTOPHER M. MILLER | Senior Vice President and Chief Financial Officer | March 1, 2018 | ||
Christopher M. Miller | (Principal Financial Officer) | |||
/s/ MATTHEW J. TACHOUET | Vice President and Chief Accounting Officer | March 1, 2018 | ||
Matthew J. Tachouet | (Principal Accounting Officer) | |||
/S/ RANDOLPH I. THORNTON | Chairman of the Board of Directors | March 1, 2018 | ||
Randolph I. Thornton | ||||
/S/ ROBERT A. ALLEN | Director | March 1, 2018 | ||
Robert A. Allen | ||||
/S/ STUART W. BOOTH | Director | March 1, 2018 | ||
Stuart W. Booth | ||||
/S/ GARY F. COLTER | Director | March 1, 2018 | ||
Gary F. Colter | ||||
/s/ LAURA FLANAGAN | Director | March 1, 2018 | ||
Laura Flanagan | ||||
/S/ ROBERT G. GROSS | Director | March 1, 2018 | ||
Robert G. Gross | ||||
/S/ HARVEY L. TEPNER | Director | March 1, 2018 | ||
Harvey L. Tepner | ||||
/S/ J. MICHAEL WALSH | Director | March 1, 2018 | ||
J. Michael Walsh | ||||
90