Attached files
UNITED STATES
SECURITIES AND EXCHANGE COMMISSION
Washington, D.C. 20549
FORM 10-K
(Mark One)
|
☒ |
ANNUAL REPORT PURSUANT TO SECTION 13 OR 15(d) OF THE SECURITIES EXCHANGE ACT OF 1934 |
For the year ended December 31, 2017
OR
|
☐ |
TRANSITION REPORT PURSUANT TO SECTION 13 OR 15 (d) OF THE SECURITIES EXCHANGE ACT OF 1934 |
For the transition period from to
Commission file number: 001-33435
CAVIUM, INC.
(Exact name of registrant as specified in its charter)
|
Delaware |
|
77-0558625 |
|
(State or other jurisdiction of incorporation or organization) |
|
(I.R.S. employer identification no.) |
2315 N. First Street
San Jose, CA 95131
(408) 943-7100
(Address of principal executive offices)
Securities registered pursuant to Section 12(b) of the Act:
|
Title of Each Class |
|
Name of Each Exchange on Which Registered |
|
Common Stock, $0.001 par value |
|
The NASDAQ Stock Market LLC |
Securities registered pursuant to Section 12(g) of the Act:
None
Indicate by check mark if the registrant is a well-known seasoned issuer, as defined in Rule 405 of the Securities Act. YES ☒ NO ☐
Indicate by check mark if the registrant is not required to file reports pursuant to Section 13 or Section 15(d) of the Act. YES ☐ NO ☒
Indicate by check mark whether the registrant (1) has filed all reports required to be filed by Section 13 or 15(d) of the Securities Exchange Act of 1934 during the preceding 12 months (or for such shorter period that the registrant was required to file such reports), and (2) has been subject to such filing requirements for the past 90 days. YES ☒ NO ☐
Indicate by check mark whether the registrant has submitted electronically and posted on its corporate Web site, if any, every Interactive Data File required to be submitted and posted pursuant to Rule 405 of Regulation S-T (§ 232.405 of this chapter) during the preceding 12 months (or for such shorter period that the registrant was required to submit and post such files). YES ☒ NO ☐
Indicate by check mark if disclosure of delinquent filers pursuant to Item 405 of Regulation S-K is not contained herein and will not be contained, to the best of registrant’s knowledge, in definitive proxy or information statements incorporated by reference in Part III of this Form 10-K or any amendment to this Form 10-K. ☒
Indicate by check mark whether the registrant is a large accelerated filer, an accelerated filer, a non-accelerated filer, or a smaller reporting company, or an emerging growth company. See the definitions of “large accelerated filer,” “accelerated filer,” “smaller reporting company,” and “emerging growth company” in Rule 12b-2 of the Exchange Act.
|
Large accelerated filer ☑ |
Accelerated filer ☐ |
Non-accelerated filer ☐ |
(Do not check if a smaller reporting company) |
|
Smaller reporting company ☐ |
Emerging growth company ☐ |
If emerging growth company, indicate by check mark if the registrant has elected not to use the extended transition period for complying with any new or revised financial accounting standards provided pursuant to Section 13(a) of the Exchange Act. ☐
Indicate by check mark whether the registrant is a shell company (as defined in Rule 12b-2 of the Exchange Act). YES ☐ NO ☒
As of June 30, 2017, the last business day of the registrant’s most recently completed second fiscal quarter, the aggregate market value of the voting stock held by non-affiliates was approximately $4.1 billion, based on the number of shares held by non-affiliates of the registrant, and based on the reported last sale price of common stock on The NASDAQ Global Select Market for such date. Excludes an aggregate of 2.1 million shares of common stock held by officers and directors as of June 30, 2017. Exclusion of shares held by any of these persons should not be construed to indicate that such person possesses the power, direct or indirect, to direct or cause the direction of the management or policies of the registrant, or that such person is controlled by or under common control with the registrant.
Number of shares of common stock outstanding as of February 23, 2018: 69,848,973
Documents Incorporated by Reference: None.
ANNUAL REPORT ON FORM 10-K
FOR THE YEAR ENDED DECEMBER 31, 2017
TABLE OF CONTENTS
|
|
|
|
|
Page |
|
Item 1. |
|
|
3 |
|
|
Item 1A. |
|
|
13 |
|
|
Item 1B. |
|
|
31 |
|
|
Item 2. |
|
|
31 |
|
|
Item 3. |
|
|
32 |
|
|
Item 4. |
|
|
32 |
|
|
|
|
|
||
|
Item 5. |
|
|
33 |
|
|
Item 6. |
|
|
34 |
|
|
Item 7. |
|
Management’s Discussion and Analysis of Financial Condition and Results of Operations |
|
35 |
|
Item 7A. |
|
|
50 |
|
|
Item 8. |
|
|
51 |
|
|
Item 9. |
|
Changes in and Disagreements with Accountants on Accounting and Financial Disclosure |
|
87 |
|
Item 9A. |
|
|
87 |
|
|
Item 9B. |
|
|
88 |
|
|
|
|
|
||
|
Item 10. |
|
|
89 |
|
|
Item 11. |
|
|
91 |
|
|
Item 12. |
|
Securities Ownership of Certain Beneficial Owners and Management and Related Stockholder Matters |
|
110 |
|
Item 13. |
|
Certain Relationships and Related Transactions, and Director Independence |
|
112 |
|
Item 14. |
|
|
113 |
|
|
|
|
|
||
|
Item 15. |
|
|
114 |
|
2
The information in this Annual Report on Form 10-K contains forward-looking statements within the meaning of Section 27A of the Securities Act of 1933, as amended (“Securities Act”), and Section 21E of the Securities Exchange Act of 1934, as amended (“Exchange Act”), which are subject to the “safe harbor” created by those sections. Such statements are based upon our management’s beliefs and assumptions and on information currently available to our management. Any statements contained herein that are not statements of historical facts may be deemed to be forward-looking statements. For example, words such as “may,” “will,” “should,” “could,” “would,” “estimates,” “predicts,” “potential,” “continue,” “strategy,” “beliefs,” “anticipates,” “plans,” “expects,” “intends” and variations of such words and similar expressions are intended to identify forward-looking statements. These statements involve known and unknown risks, uncertainties and other factors, which may cause our actual results, performance, time frames or achievements to be materially different from any future results, performance, time frames or achievements expressed or implied by the forward-looking statements. These risks, uncertainties and other factors in this Annual Report on Form 10-K are discussed in greater detail under the heading “Risk Factors.” Given these risks, uncertainties and other factors, you should not place undue reliance on these forward-looking statements. These forward-looking statements represent our estimates and assumptions only as of the date of this filing. You should read this Annual Report on Form 10-K completely and with the understanding that our actual future results may be materially different from what we expect. We hereby qualify our forward-looking statements by these cautionary statements. Except as required by law, we assume no obligation to update these forward-looking statements publicly, or to update the reasons actual results could differ materially from those anticipated in these forward-looking statements, even if new information becomes available in the future.
Corporate Information
We were incorporated in California in November 2000 and reincorporated in Delaware in February 2007. Our principal offices are located at 2315 N. First Street, San Jose, California 95131, and our telephone number is (408) 943-7100. Our Web site address is www.cavium.com. Information found on, or accessible through, our Web site is not a part of, and is not incorporated into, this Annual Report on Form 10-K. Unless the context requires otherwise, references in this Annual Report on Form 10-K to “Cavium,” “the company,” “we,” “us” and “our” refer to Cavium, Inc. and its wholly-owned subsidiaries on a consolidated basis.
Overview
We are a provider of highly integrated semiconductor processors that enable intelligent processing for wired and wireless infrastructure and cloud for networking, communications, storage, and security applications. Our products consist of multi-core processors for embedded and datacenter applications, network connectivity for server and switches, storage connectivity, and security processors for offload and appliance. A range of our products also include a rich suite of embedded security protocols that enable unified threat management, or UTM, secure connectivity, network perimeter protection, and deep packet inspection, or DPI. We sell our products to server and storage networking original equipment manufacturers, or OEMs, that sell into the enterprise, datacenter, service provider, and broadband and consumer markets. We also sell our products through channels, original design manufacturers, or ODMs, as well as direct sales to mega datacenters. In the enterprise market, our products are used in routers, switches, storage appliances, server connectivity for networking and storage, wireless local area networks, or WLAN, and UTM. In the datacenter market, our products are used in servers for data and storage connectivity as well as security offload and server load balancers. In the service provider market in wired infrastructure our products are used in edge routers, cable modem termination system head-ends, and media gateways, and in wireless infrastructure in 3G/4G/5G base stations, radio network controllers, micro/macro cell, evolved packet core nodes, and CloudRAN. In the broadband and consumer market our products are used in home gateways, wireless high-definition multimedia interface, or HDMI, WLAN, small office/home office, and UTM. Several of our products are systems on a chip, or SoCs, which incorporate single or multiple processor cores, a highly integrated architecture and customizable software that is based on a broad range of standard operating systems. We focus our resources on the design, sales and marketing of our products, and outsource the manufacturing of our products.
Our server data and storage connectivity product portfolio was expanded by our acquisition of QLogic Corporation in August 2016, which we subsequently converted to a limited liability company. Where we refer to “QLogic” in this document, we refer to QLogic Corporation for time periods prior to the conversion to a limited liability company, and to the limited liability company for time periods after the conversion. These products consist primarily of connectivity products including adapters and application-specific integrated circuits (ASICs) that facilitate the rapid transfer of data and enable efficient resource sharing between servers and storage. The QLogic products are based primarily on Fibre Channel and Ethernet technologies and are used in conjunction with storage networks, data networks and converged networks. We sell QLogic products predominantly to OEMs who then incorporate these products into server and storage subsystem solutions that are used by enterprises with critical business data requirements, as well as managed service and cloud service providers.
3
We have a broad portfolio of multi-core processors to deliver integrated and optimized hardware and software embedded solutions to the market. Our software and service revenue is primarily from the sale of software subscriptions of embedded Linux operating system, related development tools, application software stacks, support and professional services.
Industry Background
Traffic on the Internet, wireless networks and enterprise networks is rapidly increasing due to trends that include greater adoption of multimedia, video, smart-phones, internet protocol (IP) television (TV) and rich, interactive internet applications, voice over IP, or VoIP, video over broadband, file sharing, greater use of web-based cloud services and the proliferation of stored content accessed through networks. Enterprises, service providers and consumers are demanding networking and electronic equipment that can take advantage of these trends, and address the significant market opportunities and life-style changes that these new applications provide. As a result, there is growing pressure on providers of networking equipment, wireless, storage and electronic equipment to rapidly introduce new products with enhanced functionality while reducing their design and manufacturing costs. Providers of networking, wireless, storage and electronic equipment are increasingly seeking advanced processing solutions from third-party vendors to access the best available technology and reduce development costs. Internet delivery of video to the TV and mobile devices followed by cost effective, high-definition interactive video communications is expected to fuel the future growth of video traffic over the Internet.
The processing needs of advanced networking systems can be described in the context of the Open System Interconnection Model which divides network activities, equipment, and protocols into seven layers. According to this model, Layers 1 through 3 are the physical, data link and network layers, respectively, which provide the protocols to ensure the transmission of data between the source and destination regardless of the content and type of data processed. Traditionally, network infrastructure products have focused on Layer 1 through 3 products that route and switch data traffic based solely on the source and destination address contained in the packet header. Processors that provide Layer 1 through 3 solutions are widely available from many vendors. Layers 4 through 7 are the transport, session, presentation and application layers, which provide the protocols to enable the reliable end-to-end communication of application information. Intelligent processing generally takes place in Layers 4 through 7. To provide this intelligence, advanced networking systems must include processors that enable extensive inspection of the application and data content, or deep packet inspection, and make intelligent switching and routing decisions based upon that inspection. To address customer demands, providers of networking equipment must offer products that include functionality such as intelligent routing or switching of network traffic prioritized by application and data content, and security services. Processors required for Layer 4 through 7 processing are significantly more complex than processors that provide only Layer 1 through 3 solutions.
One of the major trends driving information technology spending today is the transformation of the datacenter to cloud computing, also known as “on-demand computing”. Cloud computing is a kind of internet-based computing, where shared resources, data and information are provided to computers and other devices on-demand. It is a model for enabling ubiquitous, on-demand access to a shared pool of configurable computing resources. Cloud computing and storage solutions provide users and enterprises with various capabilities to store and process their data in third-party datacenters. Key trends driving this transformation includes the adoption of Software as a Service, or SaaS, Platform as a Service, or PaaS, and Infrastructure as a Service, or IaaS, enabled by software defined datacenter with virtualized on demand compute, software defined networking, or SDN, and software defined storage. The current datacenter market has generally been serviced with processors that are designed with “one size fits all” approach and are based on a legacy control plane architecture where many of the networking, storage, virtualization and security functions are implemented in software or additional chips leading to huge system and rack level inefficiencies specific to performance, latency, footprint, power and cost.
In today’s datacenters, companies use both Ethernet for data (TCP/IP) networks and Fibre Channel for storage area networks (SANs), each dedicated to their specific purposes. Ethernet networks are generally implemented when end-users need to transfer information over both local and global distances or in clustered, low-latency compute environments, such as with workstation-to-server, server-to-server, and server-to-storage connections. Storage area networks are used to provide robust highly-reliable access to storage across enterprise environments and are implemented by companies who require shared access to block I/O for applications such as large databases, mail servers and system booting from storage. The benefits of deploying highly-reliable and proven SAN technology include: (i) centralized management, security, and administration of the storage resources; (ii) uniform delivery of storage services like periodic backups; and (iii) running efficient utilization levels of storage resources. Internet Small Computer System Interface (iSCSI) is a converged networking technology that uses high-speed Ethernet for both storage and data transmission, thereby enabling the consolidation of both SANs and Ethernet traffic onto a common network adapter.
4
Products
OCTEON®, OCTEON Fusion-M®, OCTEON XL®, OCTEON TX®, LiquidIO®, LiquidSecurity ®, NITROX®, ThunderX®, ThunderX2®, Xpliant®, XPA®, QLogic® and FastLinQ® are trademarks or registered trademarks of Cavium, Inc.
We offer highly integrated semiconductors that provide single or multiple cores of processors, along with intelligent Layer 2 through 7 processing for enterprise, datacenter, storage, broadband and consumer, and service provider markets. All of our products are compatible with standards-based operating systems and general purpose software to enable ease of programming, and are supported by our ecosystem partners. Following out acquisition of QLogic, we also offer high-performance server and storage networking connectivity products for computer data communication.
Our OCTEON, OCTEON Plus, OCTEON II and OCTEON III multi-core MIPS64 processor families provide integrated Layer 4 through 7 data and security processing (with additional capabilities at Layers 2 and 3) at line speeds from 100Mbps to 100Gbps. These software-compatible processors, with 1 to 48 cnMIPS cores on a single chip, integrate next-generation networking I/Os along with advanced security, storage, and application hardware acceleration, offering programmability for the Layer 2 through Layer 7 processing requirements of intelligent networks. The OCTEON processors are targeted for use in a wide variety of original equipment manufacturer, or OEM, networking and storage equipment, including routers, switches, UTM appliances, content-aware switches, application-aware gateways, triple-play gateways, WLAN and 3G/4G/5G access and aggregation devices, storage arrays, storage networking equipment, servers, and intelligent network interface controllers. The OCTEON product family provides a broad range of product lines based upon the distinct performance, feature, and cost requirements of the target equipment. All OCTEON processors are software compatible and supported by industry-standard software tool chains and operating systems. Various product options are available within each OCTEON family to suit the specific needs of each individual application.
Our OCTEON Fusion-M family of wireless baseband processors is a highly scalable product family supporting enterprise small cells, high capacity outdoor picocells all the way up to multi-sector macrocells for multiple wireless protocols. The OCTEON Fusion-M processors are single chip solutions (supporting Layer 1 to 7) that target next generation radio networks including 3GPP LTE Release 11/13. The key features include highly optimized full 64 bit MIPS processor cores, a highly efficient caching subsystem, high memory bandwidth Very Long Instruction Word, or VLIW, digital signal processing engines along with a host of hardware accelerators for the wireless modem pipeline, network processing and traffic shaping. Additionally, multiple OCTEON Fusion-M chips can be cascaded for even denser deployments or higher order multiple-input and multiple-output, or MIMO. The OCTEON Fusion-M family is designed to allow system OEM and operators to build next generation networks in macrocell, microcell and Cloud-RAN deployments. The architecture allows the implementation of any of the popular Centralized Radio Access Network, or CRAN splits, including 3GPP Options 2,3,4,5 & 7/8 (MAC-PHY, RLC and CPRI) and working in conjunction with standard commercial off-the-shelf systems, such as Cavium’s ThunderX processor, while retaining the flexibility to evolve into the new 5G standard.
Our OCTEON TX is a 64-bit ARM based processor family for control plane and data plane applications in networking, security, and storage provides a broad range of highly integrated 64-bit ARM SOC products for a wide variety of embedded processing applications. The OCTEON TX expands the addressability of our embedded products into control plane application areas within enterprise, service provider, datacenter networking and storage that need support of extensive software ecosystem and virtualization features. This product line is also optimized to run multiple concurrent data and control planes simultaneously for security and router appliances, NFV and SDN infrastructure, service provider CPE, wireless transport, network-attached storage, storage controllers, internet-of-things (IoT) gateways, printer and industrial applications.
Our NITROX processor family offers stand-alone security processors that provide the functionality required for Layer 3 to Layer 5 secure communication in a single chip. This single chip, custom-designed processors provide complete security protocol processing, encryption, authentication and compression algorithms to reduce the load on the system processor and increase total system throughput. NITROX V, which is a 144 core processor family, delivers security and compression processors for cloud computing, application delivery and wide area network optimization at up to 50 Gigabits per second data rates and up to 150,000 elliptic curve cryptography, or ECC, transactions per second.
Our Xpliant family of products provide high-performance, high density switch silicon that targets a broad range of switching applications for the datacenter, cloud, service provider and enterprise markets. Xpliant Packet Architecture, or XPA, allows programing of switch packet processing elements. It enables various network switching protocols with a switch. As new protocols are required, the switch can be updated by software to add support for these new protocols, including changes to parsing, lookups, traffic scheduling, packet modification, scheduling and traffic monitoring.
5
Our ThunderX processor family are highly integrated, multi-core SoC processors that incorporate highly optimized, full custom cores based on 64-bit ARMv8 instruction set architecture into SoC. ThunderX products provide a scalable family of 64-bit ARMv8 processors incorporated into a highly differentiated SoC architecture optimized for cloud and datacenter applications. The ThunderX product line includes four workload optimized families targeting cloud compute, secure compute, cloud storage/big data and networking/network functions virtualization workloads. ThunderX2 is the second-generation workload optimized ARMv8 processor built using FinFET process. It is fully compliant with ARMv8-A architecture as well as ARM's Server Base System Architecture (SBSA) standard. ThunderX2 targets high-performance volume servers deployed by public/private cloud and telco datacenters and high-performance computing applications.
The LiquidIO Server Adapter family is a standard server compliant half-height Peripheral Component Interconnect Express, or PCI Express, form-factor, providing a high-performance, general-purpose programmable adapter platform that enables cloud service providers to offload any functionality in the datacenter. This product family enables datacenters to rapidly deploy high-performance SDN applications for both installed and new infrastructure while enhancing server utilization, response times and network agility. The LiquidIO Server Adapter family is supported by a feature rich software development kit that allows customers and partners to develop high-performance SDN applications with packet processing, switching, security, tunneling, quality of service, and metering.
The LiquidSecurity product family is a high-performance hardware based transaction security solution for cloud datacenters, enterprise, government organizations and ecommerce applications. It addresses the high-performance security requirements for private key management and administration while also addressing elastic performance per virtual / network domain for the virtualized cloud environment. This family is available as an adapter with complete software or as a standalone appliance providing 35,000 RSA operations/second and 50,000 key store divisible over up to 32 partitioned Federal Information Processing Standards, or FIPS, 140-2 level 3 high security modules.
The QLogic Fibre Channel product family includes both adapters for server connectivity as well as ASICs and adapters for storage system connectivity. The adapter portfolio includes the 2700 Series Gen 6 (32GFC) adapters that enable greater virtualization density and improved database performance, combined with increased operational efficiency. These products accelerate enterprise applications, deliver a highly resilient infrastructure, and optimize IT staff productivity. The QLogic Fibre Channel product family also includes our 2690 Series Enhanced Gen 5 Fibre Channel adapters, our second generation of Gen 5 (16GFC) products. These products provide reliability, power efficiency and investment protection, along with an advanced set of datacenter diagnostic, orchestration and Quality of Service capabilities. Our latest high-performance, high port density, Fibre Channel products are particularly well-suited for use with all-flash arrays. The QLogic Fibre Channel adapter portfolio is complemented by dual and quad port, Gen5 and Gen6, ASICs for integration into storage systems.
The QLogic Ethernet product family includes the latest FastLinQ 41000 and 45000 Series of Ethernet Adapters and controllers, enabling 10, 25, 40, 50 and 100Gb Ethernet connectivity. The QLogic FastLinQ family is highly extensible and flexible, delivering a broad set of capabilities customized to address the needs of the telco, enterprise, managed service provider, public and private cloud, and storage markets including: advanced L2 NIC, virtualization acceleration, storage offloads, and low latency RDMA transports. This product family improves server utilization, increases scalability of servers and networks, and provides flexibility for highly virtualized, software defined datacenters. The FastLinQ product family is a comprehensive product set that reliably serves the connectivity needs of both server and storage systems.
Customers
We primarily sell our products to providers of networking, wireless, server, storage and consumer electronic equipment, either directly or through contract manufacturing organizations and distributors. By providing comprehensive systems-level products along with our ecosystem partners, we provide our customers with products that empower their next-generation networking systems more quickly and at lower cost than other alternatives.
We currently rely, and expect to continue to rely, on a limited number of customers for a significant portion of our net revenue. We received an aggregate of approximately 54.7%, 49.3% and 55.3% of our net revenue from our top five customers in 2017, 2016 and 2015, respectively. Hewlett Packard Enterprise Company, Dell Inc. and Nokia Solutions and Networks together accounted for 36.2% of our net revenue in 2017. Cisco Systems, Inc. and Nokia Solutions and Networks together accounted for 25.1% of our net revenue in 2016. Cisco Systems, Inc., Nokia Solutions and Networks and Amazon.com, Inc., together accounted for 42.9% of our net revenue in 2015. No other customer accounted for more than 10% of our net revenue in 2017, 2016 and 2015. For information regarding our revenue from external customers, see our Consolidated Financial Statements in Item 8 of this Annual Report.
Some of our OEM customers experience seasonality and uneven sales patterns in their business. As a result, we may experience similar seasonality and uneven sales patterns.
6
Sales and Marketing
We currently sell our products through our direct sales and applications support organization to providers of networking equipment, original design manufacturers and contract electronics manufacturers, as well as through arrangements with distributors that fulfill third-party orders for our products.
We work directly with our customers’ system designers to create demand for our products by providing them with application-specific product information for their system design, engineering and procurement groups. Our technical marketing, sales and field application engineers actively engage potential customers during their design processes to introduce them to our product capabilities and target applications. We typically undertake a multi-month sales and development process with our customer system designers and management. If successful, this process culminates in a customer decision to use our product in their system, which we refer to as a design win. Volume production can begin from six months to three years after the design win depending on the complexity of our customer’s product and other factors. Once one of our products is incorporated into a customer’s design, it is likely to be used for the life cycle of the customer’s product. We believe this to be the case because a redesign would generally be time consuming and expensive.
Manufacturing
We use third-party foundries and assembly and test contractors to manufacture, assemble and test our semiconductor products. This outsourced manufacturing approach allows us to focus our resources on the design, sales and marketing of our products. Our foundries are responsible for procurement of the raw materials used in the production of our products. Our engineers work closely with our foundries and other contractors to increase yields, lower manufacturing costs and improve quality.
Integrated Circuit Fabrication. Our integrated circuits are fabricated using complementary metal-oxide semiconductor processes, which provide greater flexibility to engage independent foundries to manufacture our integrated circuits. By outsourcing manufacturing, we are able to avoid the cost associated with owning and operating our own manufacturing facility. We currently outsource a substantial percentage of our integrated circuit manufacturing to Global Foundries, Samsung Electronics and Taiwan Semiconductor Manufacturing Company, or TSMC. We negotiate wafer fabrication on a purchase order basis. There are no long-term agreements with any of these foundries, assembly, test or processing third-party contractors. We work closely with Global Foundries, Samsung and TSMC to forecast on a monthly basis our manufacturing capacity requirements. Our integrated circuits are currently fabricated in several advanced, sub-micron manufacturing processes. Because finer manufacturing processes lead to enhanced performance, smaller size and lower power requirements, we continually evaluate the benefits and feasibility of migrating to smaller geometry process technology to reduce cost and improve performance.
Assembly and Test. Our products are shipped from our third-party foundries to third-party assembly and test facilities where they are assembled into finished integrated circuit packages and tested. We outsource all product packaging and substantially all testing requirements for these products to several assembly and test subcontractors, including ASE Electronics in Taiwan, Malaysia and Singapore, as well as ISE Labs, Inc., in the United States. Our products are designed to use standard packages and to be tested with widely available test equipment. For the adapter products, we use third-party contract manufacturers for material procurement, assembly, test and inspection in a turnkey model, prior to shipment to our customers. To the extent that we rely on these contract manufacturers, we are not able to directly control product delivery schedules and quality assurance. A significant disruption in the operations of one or more of these third-party contractors would impact the production of our products for a substantial period of time, which could have a material adverse effect on our business, financial condition and results of operations.
Quality Assurance. We have implemented significant quality assurance and test procedures to assure high levels of product quality for our customers. Our designs are subjected to extensive circuit simulation under extreme conditions of temperature, voltage and processing before being committed to manufacture. We have completed and have been awarded ISO 9001 certification and ISO 9001:2000 certification. In addition, all of our independent foundries and assembly and test subcontractors have been awarded ISO 9001 certification.
Engineering and Development
We believe that our future success depends on our ability to introduce enhancements to our existing products and to develop new products for both existing and new markets. Our research and development efforts are directed largely to the development of additional high-performance multi-core microprocessor semiconductors. We are also focused on incorporating functions currently provided by stand-alone semiconductors into our products and expanding our capabilities to address the emerging technologies in the rapid evolution of storage, data and converged networks. We have assembled a team of highly skilled semiconductor and embedded software design engineers who have strong design expertise in high-performance multi-core microprocessor design, along with embedded software, security and networking expertise. Our engineering design teams are located in San Jose, Irvine and Roseville, California; Marlborough, Massachusetts; Beijing, China; Ramat Gan, Israel; Taipei, Taiwan; and Hyderabad, Bangalore and Pune, India. Research and development expense was $377.9 million, $257.8 million and $203.8 million in 2017, 2016 and 2015, respectively.
7
Business Combinations
Pending Acquisition by Marvell
On November 19, 2017, we entered into an Agreement and Plan of Merger with Marvell Technology Group Ltd., a Bermuda exempted company (“Marvell” or “Parent”) and Kauai Acquisition Corp., a Delaware corporation and an indirect wholly owned subsidiary of Parent (“Merger Sub”) (the “Marvell Merger Agreement”). Pursuant to the Marvell Merger Agreement, Merger Sub will be merged with and into us (the “Merger”), with us continuing as an indirect wholly owned subsidiary of Parent. Subject to the terms and conditions set forth in the Marvell Merger Agreement, at the effective time of the Merger, each share of our common stock (“Company Share”) issued and outstanding immediately prior to the effective time of the Merger (other than (i) Company Shares held by us (or held in our treasury) or held by Parent, Merger Sub or any other subsidiary of Parent, (ii) Company Shares held, directly or indirectly, by any subsidiary of us, or (iii) Company Shares with respect to which appraisal rights are properly exercised and not withdrawn under Delaware law) will be converted into the right to receive 2.1757 common shares, $0.002 par value per share, of Parent (each, a “Parent Share”) and $40.00 in cash, without interest (the “Merger Consideration”).
In general, as a result of the Merger, at the effective time of the Merger, (i) each stock option, then outstanding, whether vested or unvested, shall be assumed by Parent and converted into an option to purchase, on the same terms and conditions as were applicable under such company stock option, Parent Shares at a conversion ratio as set forth in the Marvell Merger Agreement; (ii) unvested restricted stock units will be assumed and converted into Marvell restricted stock units at a conversion ratio as set forth in the Marvell Merger Agreement; (iii) vested restricted stock units (including restricted stock units that will vest just prior to or as of the effective time of the Merger) will receive the Merger Consideration based on the number of shares of our common stock underlying the restricted stock unit; and (iv) unvested performance-based restricted stock units will be assumed by Marvell and converted into Marvell restricted stock units (based on target level of performance achieved as of the last trading day prior to the closing of the Merger and the conversion ratio as set forth in the Marvell Merger Agreement).
The Marvell Merger Agreement contains representations, warranties and covenants of the parties customary for a transaction of this type. The consummation of the Merger is subject to customary closing conditions, including, among other things, approval by our shareholders, approval by Parent’s shareholders of the issuance of Parent Shares in connection with the Merger (the “Parent Share Issuance”), and the receipt of certain regulatory clearance, including the required clearances from the Committee on Foreign Investment in the United States (“CFIUS”), the Ministry of Commerce of the People’s Republic of China (“MOFCOM”), and the Office for Competition and Consumer Protection of Poland (“OCCP”).
The Marvell Merger Agreement provides Parent and us with certain termination rights, and under certain circumstances, may require Parent or us to pay a termination fee. The Marvell Merger Agreement provides that in certain circumstances, our board of directors has the right to terminate the Marvell Merger Agreement in order to enter into a definitive agreement relating to a superior offer. In that event, the Marvell Merger Agreement requires us to pay a termination fee of $180.0 million. The Marvell Merger Agreement provides that, in certain circumstances, the Marvell board of directors has the right to terminate the Merger Agreement in order to enter into a definitive agreement relating to a superior offer. In that event, the Marvell Merger Agreement provides that Marvell pay us a termination fee of $180.0 million. In addition, the Merger Agreement provides that Marvell will be required to pay us a termination fee of $50.0 million if, under certain specified circumstances, MOFCOM approval has not been obtained and the Marvell Merger Agreement is terminated. The Marvell Merger Agreement also provides that Marvell will be required to pay us a termination fee of $180.0 million if, under certain specified circumstances, CFIUS Approval has not been obtained and the Merger Agreement is terminated. The transaction is expected to close in mid-calendar year 2018.
The foregoing description of the Marvell Merger Agreement and the Merger does not purport to be complete and is subject to, and qualified in its entirety by, (i) the full text of the Marvell Merger Agreement, a copy of which is attached as Exhibit 2.1 to the Form 8-K filed by us on November 22, 2017. Additionally, the Registration Statement on Form S-4/A filed by Marvell on January 24, 2018, as may be amended (“the Registration Statement”) describes the Marvell Merger Agreement and the Merger in more detail. Investors and security holders are urged to read the prospectus/joint proxy statement included in the Registration Statement and any other relevant documents that have been or will be filed with the Securities and Exchange Commission (“SEC”) carefully and in their entirety because they contain or will contain important information about the Merger.
We recorded acquisition-related costs of approximately $11.2 million in the year ended December 31, 2017, primarily for outside legal and external financial advisory fees associated with the pending acquisition by Marvell. These costs were recorded in sales, general and administrative expenses in the Company’s consolidated statements of operations. Additional acquisition-related costs are expected to be incurred through the closing of the Merger.
8
Acquisition of QLogic Corporation
On August 16, 2016, pursuant to the terms of an Agreement and Plan of Merger dated June 15, 2016 by and among Cavium, Inc., QLogic Corporation and Quasar Acquisition Corp. (a wholly owned subsidiary of Cavium) (the “QLogic Merger Agreement”), we acquired all outstanding shares of common stock of QLogic pursuant to an exchange offer for $15.50 per share, comprised of $11.00 per share in cash and 0.098 of a share of our common stock for each outstanding share of common stock of QLogic followed by a merger. The acquisition was funded with a combination of balance sheet cash and proceeds from debt financing. See Notes 2 and 11 of Notes to Consolidated Financial Statements in Item 8 of this Annual Report, which is incorporated herein by reference for further discussions related to the acquisition of QLogic.
We incurred employee severance costs of $12.0 million related to actions following the acquisition of QLogic and our integration of QLogic which was recorded within sales, general and administrative expenses in our consolidated statement of operations for the year ended December 31, 2016.
Other Acquisition in the last five years
We completed the acquisition of Xpliant, Inc. in April 2015. This acquisition provides high-performance, high density switch silicon and will target a broad range of switching applications for the datacenter, cloud service provider and enterprise markets.
For more detailed discussions on these most recent business combinations, see Note 2 of Notes to Consolidated Financial Statements in Item 8 of this Annual Report, incorporated herein by reference.
Intellectual Property
Our success depends in part upon our ability to protect our core technology and intellectual property. To accomplish this, we rely on a combination of intellectual property rights, including patents, trade secrets, copyrights and trademarks, and contractual protections.
Including patents from our acquisitions, we have been issued 704 patents in the United States and 99 patents in foreign countries and have an additional 180 patent applications pending in the United States and 274 patent applications pending in foreign countries as of December 31, 2017. The issued patents in the United States expire in the years beginning in 2018 through 2036. The issued foreign patents expire in the years beginning in 2021 through 2035. Our issued patents and pending patent applications relate to enterprise storage, networking, security processors, multi-core microprocessor processing and other processing concepts. We focus our patent efforts in the United States and, when justified by cost and strategic importance, we file corresponding foreign patent applications in strategic jurisdictions within Asia and Europe. Our patent strategy is designed to provide a balance between the need for coverage in our strategic markets and the need to maintain costs at a reasonable level. We believe our issued patents and patent applications, to the extent the applications are issued, may be used defensively by us in the event of future intellectual property claims.
In addition to our own intellectual property, we also rely on third-party technologies for the development of our products. We license certain technology from Imagination Technologies, LLC (which acquired MIPS Technologies, Inc.) and ARM Holdings PLC, pursuant to license agreements wherein we were granted a non-exclusive, worldwide license to MIPS and ARM microprocessor core technologies to develop, implement and use in our products.
We obtained a United States registration for each of our marks, including C circle and design, cnMIPS, ECONA, LiquidIO, Nitrox, Octeon, Octeon XL, ThunderX, ThunderX2, QLogic, FastLinQ, Security Everywhere, Wavesat, wirelessdisplay.com, wireless display logo and WiVu. We also have a license from Imagination Technologies, LLC to use MIPS by Imagination and certain other Imagination Technologies’ trademarks and from ARM Holdings PLC to use certain ARM trademarks.
In addition, we generally control access to and use of our proprietary software and other confidential information through the use of internal and external controls, including contractual protections with employees, contractors, customers and partners. We rely in part on United States and international copyright laws to protect our software. All employees and consultants are required to execute confidentiality agreements in connection with their employment and consulting relationships with us. We also require them to agree to disclose and assign to us all inventions conceived or made in connection with the employment or consulting relationship. We cannot provide any assurance that employees and consultants will abide by the confidentiality or invention assignment terms of their agreements. Despite measures taken to protect our intellectual property, unauthorized parties may copy aspects of our products or obtain and use information that we regard as proprietary.
9
The semiconductor industry is characterized by the existence of a large number of patents, trademarks and copyrights and by frequent litigation based on allegations of infringement or other violations of intellectual property rights. We expect that the potential for infringement claims against us may further increase as the number of products and competitors in our market increase. Litigation in this industry is often protracted and expensive. Questions of infringement in the semiconductor industry involve highly technical and subjective analyses. In addition, litigation may become necessary in the future to enforce our granted patents and other intellectual property rights, to protect our trade secrets, to determine the validity and scope of the proprietary rights of others, or to defend against claims of infringement or invalidity, and we may not prevail in any future litigation. The results of any litigation are inherently uncertain. Any successful infringement claim or litigation against us could have a significant adverse impact on our business.
We are not currently a party to any material legal proceedings related to intellectual property, which, if determined adversely to us, we believe would individually or in the aggregate have a material adverse effect on our business, operating results, financial condition or cash flows.
Environment
Our operations are subject to regulation under various federal, state, local and foreign laws concerning the environment, including laws addressing the discharge of pollutants into the environment, the management and disposal of hazardous substances and wastes, and the cleanup of contaminated sites. We could incur substantial costs, including cleanup costs, fines and civil or criminal sanctions, and third-party damage or personal injury claims, if we violate or become liable under environmental laws.
Most of our products are also subject to various laws governing chemical substances in products, including those regulating the manufacture and distribution of chemical substances and those restricting the presence of certain substances in electronic products. We could incur substantial costs, or our products could be restricted from entering certain countries, if our products become non-compliant with environmental laws. We also face increasing complexity in our product design and procurement operations as we adjust to new and future requirements relating to the materials composition of our products. For example, the European Union adopted the Waste Electrical and Electronic Equipment (WEEE) Directive, pursuant to which European Union countries have enacted legislation making producers of electrical goods financially responsible for specified collection, recycling, treatment and disposal of past and future covered products. These and similar laws adopted in other countries could impose a significant cost of doing business in those countries.
Environmental costs are presently not material to our results of operations or financial position, and we do not currently anticipate material capital expenditures for environmental control facilities.
Competition
We compete with numerous domestic and international semiconductor companies, many of which have greater financial and other resources with which to pursue marketing, technology development, product design, manufacturing, quality, sales and distribution of their products. Our ability to compete effectively depends on defining, designing and regularly introducing new products that anticipate the processing and integration needs of our customers’ next-generation products and applications.
In the enterprise, datacenter, service provider, and broadband and consumer markets, we consider our primary competitors to be other companies that provide processor products to one or more of our markets, including NXP Semiconductors N.V. (“NXP Semiconductors”), Intel Corporation (“Intel”), Marvell Technology Group Ltd. (“Marvell”), Qualcomm Incorporated (“Qualcomm”), and Hisilicon Technologies Co., Ltd. (“HiSilicon”). In the high-speed Ethernet adapter and ASIC markets, which include converged networking products such as iSCSI, we compete primarily with Broadcom Limited (“Broadcom”), Mellanox Technologies, Ltd. (“Mellanox”) and Intel. In the traditional enterprise storage Fibre Channel adapter and ASIC markets, our primary competitor is Broadcom. And in the Ethernet switch silicon market, our primary competitors are Broadcom and Mellanox.
Our competitors include public companies with broader product lines, a large installed base of customers and greater resources compared to us. We expect continued competition from existing suppliers as well as from potential new entrants into our markets. Our ability to compete depends on a number of factors, including our success in identifying new and emerging markets, applications and technologies and developing products for these markets; our products’ performance and cost effectiveness relative to that of our competitors; our ability to deliver products in large volume on a timely basis at a competitive price; our success in utilizing new proprietary technologies to offer products and features not previously available in the marketplace; our ability to recruit good talent, including design and application engineers; and our ability to protect our intellectual property.
10
Backlog
Sales of our products are generally made pursuant to purchase orders. We typically include in backlog only those customer orders for which we have accepted purchase orders and which we expect to ship within the next 12 months. A large portion of our sales of QLogic products to OEM customers are transacted through hub arrangements whereby our QLogic products are purchased on a just-in-time basis and fulfilled from warehouse facilities, or hubs, in proximity to the facilities of our customers or their contract manufacturers. Since orders constituting our current backlog are subject to changes in delivery schedules or cancellation with limited or no penalties, we believe that the amount of our backlog is not necessarily an accurate indication of our future revenues and is not material to understanding our business.
Geographic and Other Financial Information
For geographic financial information and net revenue by markets, see Note 12, Segment and Geographical Information in Item 8 of this Annual Report, which is incorporated herein by reference. For information regarding our net revenue from external customers, net loss attributable to the Company and total assets, see our Consolidated Financial Statements in Item 8 of this Annual Report.
For risks attendant to our foreign operations, see the risks set forth in Item 1A below, including, but not limited to, “Some of our operations and a significant portion of our suppliers, customers and contract manufacturers are located outside of the United States, which subjects us to additional risks, including increased complexity and costs of managing international operations and geopolitical instability,” “We are subject to governmental export and import controls that may adversely affect our business,” and “Our failure to protect our intellectual property rights adequately could impair our ability to compete effectively or to defend ourselves from litigation, which could harm our business, financial condition and results of operations.”
Net Revenue by Reportable Segment
Our consolidated net revenue for 2017, 2016 and 2015 amounted to $984.0 million, $603.3 million and $412.7 million, respectively. We operate as one reportable segment. See Note 12, Segment and Geographical Information in Item 8 of this Annual Report, which is incorporated herein by reference for detailed discussions.
Employees
As of December 31, 2017, we had 1,895 regular employees located in the United States, India and other countries in Asia and Europe, which was comprised of: 1,387 employees in engineering, research and development, 415 in sales, marketing and administrative and 93 in manufacturing and direct service operations. None of our employees is represented by a labor union and we consider current employee relations to be good.
Executive Officers of the Registrant
The following sets forth certain information regarding our executive officers as of March 1, 2018:
|
Name |
|
Age |
|
Position |
|
Syed B. Ali |
|
59 |
|
President, Chief Executive Officer, Director and Chairman of the Board of Directors |
|
Raghib Hussain |
|
46 |
|
Chief Operating Officer |
|
Arthur D. Chadwick |
|
61 |
|
Vice President of Finance and Administration and Chief Financial Officer |
|
Anil Jain |
|
61 |
|
Corporate Vice President, IC Engineering |
|
Vincent P. Pangrazio |
|
54 |
|
Senior Vice President, General Counsel and Corporate Secretary |
Syed B. Ali is one of our founders and has served as our President, Chief Executive Officer and Chairman of the Board of Directors since the inception of Cavium in 2000. From 1998 to 2000, Mr. Ali was Vice President of Marketing and Sales at Malleable Technologies, a communication chip company of which he was a founding management team member. Malleable Technologies was acquired by PMC Sierra, Inc., a communication IC company in 2000. From 1994 to 1998, Mr. Ali was an Executive Director at Samsung Electronics. Prior to that, he had various positions at Wafer Scale Integration, a division of SGS-Thompson, Tandem Computer, and American Microsystems. He received a BE (Electrical Engineering) from Osmania University, in Hyderabad, India and an MSE from the University of Michigan.
11
Raghib Hussain has served as our Chief Operating Officer since July 2016. Mr. Hussain co-founded Cavium in 2000. He has served in various management and technology leadership roles since the inception of Cavium. From January 2013 to July 2015, Mr. Hussain served as the Corporate Vice President, Chief Technology Officer and General Manager. Mr. Hussain served as Chief Technology Officer and Vice President of Software and Engineering until January 2013. Prior to co-founding Cavium, Mr. Hussain held various engineering roles at Cisco Systems, Inc. and Cadence Design Systems, Inc. Prior to that, Mr. Hussain served at VPNet, an enterprise security company, of which he was a founding team member. At VPNet, he was a key contributor to the design of the first commercial IPSec based VPN (Virtual Private Network) gateway. Mr. Hussain received a BS degree in Computer Systems Engineering from NED University in Karachi, Pakistan, and an MS degree in Computer Engineering from San Jose State University.
Arthur D. Chadwick has served as our Vice President of Finance and Administration and Chief Financial Officer since December 2004. Prior to joining us, from 1989 to 2004, Mr. Chadwick served as the Senior Vice President of Finance and Administration and Chief Financial Officer at Pinnacle Systems, a provider of digital video processing solutions. From 1979 through 1989, Mr. Chadwick served in various financial and management roles at American Microsystems, Austrian Microsystems, Gould Semiconductor and AMI-Philippines. Mr. Chadwick received a BS degree in Mathematics and an MBA in Finance, both from the University of Michigan.
Anil K. Jain has served as our Corporate Vice President of IC Engineering since January 2001, and is a founding management team member. Prior to joining us, from 1998 to 2000 he was at Compaq Computer, a computer manufacturer. From 1980 to 1998, Mr. Jain served at Digital Equipment Corporation, or DEC, as Senior Consulting Engineer when DEC was acquired by Compaq Computer. He received a BS degree in Electrical Engineering from Punjab Engineering College in Chandigarh, India, and an MSEE from the University of Cincinnati.
Vincent P. Pangrazio has served as our Senior Vice President and General Counsel since March 2011. He was appointed as the Corporate Secretary in 2013. Prior to joining us, from 2000 to 2011, Mr. Pangrazio was a partner in the business department at the law firm of Cooley LLP. From 1999 to 2000, Mr. Pangrazio served as Vice President and General Counsel for Women.com Networks, Inc., a network online site featuring content and services for women. From 1993 to 1999, Mr. Pangrazio was an associate in the business department at Cooley LLP. From 1985 to 1993, Mr. Pangrazio worked as an electrical engineer for the Los Angeles Department of Water and Power in the areas of power generation and distribution. Mr. Pangrazio received a BS degree in Electrical Engineering from Loyola Marymount University and received his J.D. degree from Loyola Law School.
Available Information
We file electronically with the United States Securities and Exchange Commission, or SEC, our annual reports on Form 10-K, quarterly reports on Form 10-Q, current reports on Form 8-K, and amendments to those reports filed or furnished pursuant to Section 13(a) or 15(d) of the Securities Exchange Act of 1934. We make available on our website at http://www.cavium.com, free of charge, copies of these reports as soon as reasonably practicable after filing these reports with, or furnishing them to, the SEC.
12
The following risks and uncertainties may have a material adverse effect on our business, financial condition or results of operations. Investors should carefully consider the risks described below before making an investment decision. The risks described below are not the only ones we face. Additional risks not presently known to us or that we currently believe are immaterial may also significantly impair our business operations. Our business could be harmed by any of these risks. The trading price of our common stock could decline due to any of these risks, and investors may lose all or part of their investment.
Risks Related to Our Business and Industry
The announcement and pendency of our agreement to be acquired by Marvell may have an adverse effect on our business, operating results and our stock price.
On November 19, 2017, we entered into the Merger Agreement with Marvell. The announcement of the Merger with Marvell could cause a material disruption to our business. Additionally, we are subject to additional risks in connection with the announcement and pendency of the Merger, including, but not limited to, the following:
|
|
• |
market reaction to the announcement of the Merger; |
|
|
• |
changes in the respective business, operations, financial position and prospects of either company or the combined company following consummation of the Merger; |
|
|
• |
market assessments of the likelihood that the Merger will be consummated; |
|
|
• |
the amount of cash and the number of shares of Marvell common stock comprising the per share Merger Consideration will not be adjusted for changes in our business, assets, liabilities, prospects, outlook, financial condition or results of operations during the pendency of the Marvell Merger Agreement, including any successful execution of our current strategy as an independent company or in the event of any change in the market price of, analyst estimates of, or projections relating to, our common stock; |
|
|
• |
potential adverse effects on our relationships with our current customers, suppliers and other business partners, or those with which we are seeking to establish business relationships, due to uncertainties about the Merger; |
|
|
• |
pursuant to the Marvell Merger Agreement, we are subject to certain restrictions on the conduct of our business prior to consummation of the Merger, which restrictions could adversely affect our ability to realize certain of our business strategies or take advantage of certain business opportunities; |
|
|
• |
we have incurred, and will continue to incur, significant costs, expenses and fees for professional services and other transaction costs in connection with the Merger, and many of these fees and costs are payable by us regardless of whether the Merger is consummated; |
|
|
• |
potential adverse effects on our ability to attract, recruit, retain and motivate current and prospective employees who may be uncertain about their future roles and relationships with us following the completion of the Merger, and the possibility that our employees could lose productivity as a result of uncertainty regarding their employment following the Merger; |
|
|
• |
the pendency and outcome of any legal proceedings that have been or may be instituted against us, our directors, executive officers and others relating to the transactions contemplated by the Marvell Merger Agreement; |
|
|
• |
the possibility of disruption to our business, including increased costs and diversion of management time and resources that could otherwise have been devoted to other opportunities that may have been beneficial to us; and |
|
|
• |
interest rates, general market and economic conditions and other factors generally affecting the market prices of Marvell common stock and our common stock. |
Since a portion of the Merger Consideration consists of Marvell common stock, our stock price will be adversely affected by a decline in Marvell’s stock price and any adverse developments in Marvell’s business. Changes in Marvell’s stock price and business may result from a variety of factors, including changes in its business operations and changes in general market and economic conditions. These factors are beyond our control.
13
The failure of the Merger to be completed, or conditions imposed in connection with obtaining required regulatory clearance, may adversely affect our business and our stock price.
The Merger is subject to a number of conditions, including, among other things, (i) approval by our shareholders, (ii) approval by Parent’s shareholders of the Parent Share Issuance, (iii) the receipt of certain regulatory clearances, including required clearances from CFIUS, MOFCOM and the OCCP, (iv) the issuance of shares of Marvell common stock pursuant to the Merger having been registered pursuant to a registration statement filed by Marvell with the SEC and declared effective by the SEC, (v) shares of Marvell common stock issuable pursuant to the Merger having been authorized for listing on NASDAQ, (vi) the absence of any order or ruling prohibiting the consummation of the Merger, and (vii) subject to certain exceptions, the accuracy of the other party’s representations and warranties and compliance with covenants. In addition, the obligation of Marvell to consummate the Merger is also subject to the satisfaction or waiver of the condition that no material adverse effect on the Company shall have occurred since the date of the Marvell Merger Agreement. There may also be conditions imposed in connection with obtaining regulatory clearance for the Merger that may reduce the potential benefits of the Merger or impact the business or financial performance of the combined companies going forward, including potential tax consequences and/or changes in shareholders rights if Marvell makes the determination to re-domesticate as a Delaware corporation or establish a Delaware holding company in connection with its efforts to obtain required regulatory clearances. There can be no assurance that these conditions to the completion of the Offer will be satisfied, or that the Merger will be completed on the proposed terms, within the expected timeframe or at all. In addition, other factors, such as Marvell’s ability to obtain the debt financing it needs to consummate the Merger, may affect when and whether the Merger will occur. If the Merger is not completed, we may be subject to negative publicity or be negatively perceived by the investment or business communities and our stock price could fall to the extent that our current stock price reflects an assumption that the Merger will be completed. Furthermore, if the Merger is not completed, we may suffer other consequences that could adversely affect our business and results of our operations.
The Merger Agreement with Marvell limits our ability to pursue alternative transactions, and in certain instances requires payment of a termination fee, which could deter a third-party from proposing an alternative transaction.
The Marvell Merger Agreement contains provisions that, subject to certain exceptions, limit our ability to initiate, solicit or knowingly take any action to facilitate or encourage, or participate or engage in any negotiations, inquiries or discussions with respect to an alternative transaction. In addition, under specified circumstances in which the Marvell Merger Agreement is terminated, we could be required to pay a termination fee of up to $180.0 million. It is possible that these or other provisions in the Marvell Merger Agreement might discourage a potential competing acquirer that might have an interest in acquiring all or a significant part of our company from considering or proposing an acquisition or might result in a potential competing acquirer proposing to pay a lower per share price to acquire our common stock than it might otherwise have proposed to pay.
Any potential future acquisitions, strategic investments, divestitures, mergers or joint ventures may subject us to significant risks, any of which could harm our business.
We completed the acquisition of QLogic Corporation on August 16, 2016. Further, in the past, we acquired a number of businesses and assets of companies. We may in the future continue to acquire companies, or assets of companies or invest in other companies that we believe to be complementary to our business including for the purpose of expanding our new product design capacity, introducing new design, market or application skills or enhancing and expanding our existing product lines. While we expect to receive benefits from the acquisitions, there can be no assurance that we will actually realize the benefits on a timely basis or at all. Achieving the anticipated benefits of the acquisition will depend, in part, on our ability to integrate the business and operations successfully and efficiently with our existing business. In addition, acquisitions of companies exposes us to risks, including:
|
|
• |
difficulties entering new markets or manufacturing in new geographies where we have no or limited direct prior experience; |
|
|
• |
coordinating sales and marketing efforts to effectively position the combined company’s capabilities and the direction of product development; |
|
|
• |
successfully managing relationships with our combined supplier and customer base; |
|
|
• |
coordinating and integrating independent research and development and engineering teams across technologies and product platforms to enhance product development while reducing costs; |
|
|
• |
difficulties that may occur in assimilating and integrating complex operations including multiple manufacturing sites, personnel, technologies, and products of acquired companies or businesses; |
|
|
• |
the financial return on the acquisition may not support the expenditure incurred to acquire such business or develop the business; |
14
|
|
• |
to the extent we acquire a company with existing products, those products may have lower gross margins than our customary products, which could adversely affect our gross margin and operating results; |
|
|
• |
assuming the legal obligations of the acquired business; |
|
|
• |
the effect that internal control processes of the acquired business might have on our financial reporting; |
|
|
• |
retaining key employees; and |
|
|
• |
minimizing the diversion of management attention from other important business objectives. |
Acquisitions, divestitures and investment strategies may also result in unanticipated accounting charges or otherwise adversely affect our business, financial condition and results of operation.
If we do not successfully manage these issues and the other challenges inherent in integration, then we may not achieve the anticipated benefits of the acquisition and our revenue, expenses, operating results and financial condition could be materially adversely affected.
We have made, and could make in the future, investments in technology companies, including privately-held companies in a development stage. Many of these private equity investments are inherently risky because the companies’ businesses may never develop, and we may incur losses related to these investments. In addition, we may be required to write down the carrying value of these investments to reflect other-than-temporary declines in their value, which could have a material adverse effect on our financial condition and results of operations.
Our indebtedness could adversely affect our financial condition and our ability to raise additional capital to fund our operations and limit our ability to react to changes in the economy or our industry.
On August 16, 2016, in connection with our acquisition of QLogic we incurred substantial indebtedness pursuant to a Credit Agreement. The Credit Agreement provides for a $700.0 million Initial Term B Loan Facility. Our obligations under the Credit Agreement are guaranteed by a number of our subsidiaries. The Initial Term B Loan Facility will mature on August 16, 2022 and requires quarterly principal payments, with the balance payable at maturity. On March 20, 2017, we entered into an amendment to the Credit Agreement. The amendment provides for, among other things, a reduction of the interest rate margin on our outstanding Initial Term B Loan Facility by 0.75% per annum. As of December 31, 2017, the outstanding principal balance of the Initial Term B Loan Facility amounted to $609.2 million.
Our substantial indebtedness could have important consequences to us including:
|
|
• |
increasing our vulnerability to adverse general economic and industry conditions; |
|
|
• |
requiring us to dedicate a substantial portion of our cash flow from operations to payments on our indebtedness, thereby reducing the availability of our cash flow to fund working capital, capital expenditures, research and development efforts, execution of our business strategy, acquisitions and other general corporate purposes; |
|
|
• |
limiting our flexibility in planning for, or reacting to, changes in the economy and the semiconductor industry; |
|
|
• |
placing us at a competitive disadvantage compared to our competitors with less indebtedness; |
|
|
• |
exposing us to interest rate risk to the extent of our variable rate indebtedness; and |
|
|
• |
making it more difficult to borrow additional funds in the future to fund growth, acquisitions, working capital, capital expenditures and other purposes. |
The Credit Agreement contains customary events of default upon the occurrence of which, after any applicable grace period, the lenders would have the ability to immediately declare the loans due and payable in whole or in part. In such event, we may not have sufficient available cash to repay such debt at the time it becomes due, or be able to refinance such debt on acceptable terms or at all. Any of the foregoing could materially and adversely affect our financial condition and results of operations.
We receive debt ratings from the major credit rating agencies in the United States. Factors that may impact our credit ratings include debt levels, planned asset purchases or sales and near-term and long-term production growth opportunities. Liquidity, asset quality, cost structure, reserve mix and commodity pricing levels could also be considered by the rating agencies. The applicable margins with respect to the Initial Term B Loan Facility will vary based on the applicable public ratings assigned to the collateralized, long-term indebtedness for borrowed money by Moody's Investors Service, Inc., Standard & Poor's Financial Services LLC and any successor to each such rating agency business. A ratings downgrade could adversely impact our ability to access debt markets in the future and increase the cost of current or future debt and may adversely affect our share price.
15
Our Credit Agreement imposes restrictions on our business.
The Credit Agreement contains a number of covenants imposing restrictions on our business. These restrictions may affect our ability to operate our business and may limit our ability to take advantage of potential business opportunities as they arise. The restrictions, among other things, restrict our ability and our subsidiaries’ ability to create or incur certain liens, incur or guarantee additional indebtedness, merge or consolidate with other companies, payment of dividends, transfer or sell assets and make restricted payments. These restrictions are subject to a number of limitations and exceptions set forth in the Credit Agreement. Our ability to meet the liquidity covenant may be affected by events beyond our control.
The foregoing restrictions could limit our ability to plan for, or react to, changes in market conditions or our capital needs. We do not know whether we will be granted waivers under, or amendments to, our Credit Agreement if for any reason we are unable to meet these requirements, or whether we will be able to refinance our indebtedness on terms acceptable to us, or at all.
Servicing our debt requires a significant amount of cash, and we may not have sufficient cash flow from our business to pay our substantial debt.
Our ability to make scheduled payments of the principal of, to pay interest on, and to refinance our debt, depends on our future performance, which is subject to financial, competitive, economic, and other factors beyond our control. Our business may not continue to generate cash flow from operations in the future sufficient to make necessary capital expenditures or to satisfy our obligations under the Credit Agreement and any future indebtedness that we may incur. If we are unable to generate such cash flow, we may be required to adopt one or more alternatives, such as reducing or delaying investments or capital expenditures, selling assets, refinancing or obtaining additional equity capital on terms that may be onerous or highly dilutive. We may not be able to engage in any of these activities or engage in these activities on desirable terms when needed, which could result in a default on our indebtedness.
We have a limited history of profitability, and we may not achieve or sustain profitability in the future, on a quarterly or annual basis.
We have a history of losses during certain quarterly or annual periods since our incorporation. As of December 31, 2017, our accumulated deficit was $406.4 million. We expect to make significant expenditures related to the development of our products and expansion of our business, including research and development and sales and administrative expenses. Additionally, we may encounter unforeseen difficulties, complications, product delays and other unknown factors that may require additional expenditures. As a result of these expenditures, we may not generate sufficient revenue to achieve profitability. Our revenue growth trend may not be sustainable, and accordingly, we may incur losses in the future.
We expect our operating results to fluctuate, which could adversely affect the price of our common stock.
We expect our revenues and expense levels to vary in the future, making it difficult to predict our future operating results. In particular, we experience variability in demand for our products as our customers manage their product introduction dates and their inventories. As a portion of our net revenue in each fiscal quarter results from orders booked in that quarter, it is difficult for us to forecast sales levels and historical information may not be indicative of future trends. Further, the market for our Fibre Channel products is mature and has declined during recent periods. The lack of growth in the market for our Fibre Channel products may be the result of a shift in the information technology datacenter deployment model, as more enterprise workloads are moving to cloud datacenters, which primarily use Ethernet solutions as their connectivity protocol. To the extent the market for our Fibre Channel products declines, our quarterly operating results would be negatively impacted.
Factors that could cause our results to fluctuate include, but are not limited to:
|
|
• |
fluctuations in demand, sales cycles, product mix and prices for our products; |
|
|
• |
any mergers, acquisitions or divestitures of assets undertaken by us, including the acquisition of QLogic Corporation; |
|
|
• |
the variability in lead time between the time when a customer begins to design in one of our products and the time when the customer’s end system goes into production and they begin purchasing our products; |
|
|
• |
the forecasting, scheduling, rescheduling or cancellation of orders by our customers; |
|
|
• |
our dependence on a few significant customers; |
|
|
• |
sales discounts and customer incentives; |
|
|
• |
our ability to retain, recruit and hire key executives, technical personnel and other employees in the positions and numbers, and with the experience and capabilities that we need; |
|
|
• |
our ability to successfully define, design and release new products in a timely manner that meet our customers’ needs; |
16
|
|
• |
changes in manufacturing costs, including wafer, test and assembly costs, mask costs, manufacturing yields, cost of components and product quality and reliability; |
|
|
• |
the timing and availability of adequate manufacturing capacity from our manufacturing suppliers; |
|
|
• |
the timing of announcements and introductions of products by our competitors or us; |
|
|
• |
future accounting pronouncements and changes in accounting policies; |
|
|
• |
actual events, circumstances, outcomes and amounts differing from judgments, assumptions and estimates used in determining the value of certain assets (including the amounts of related valuation allowances), liabilities and other items reflected in our consolidated financial statements; |
|
|
• |
the timing of recognition of non-recurring engineering credits. From time to time, we enter into research and development collaboration agreements with certain customers. Subject to the terms of the agreements, the consideration is recognized as a credit to our research and development expenses. The timing of the recognition of such credit may be subject to certain milestones specified in the agreement. |
|
|
• |
volatility in our stock price, which may lead to higher stock compensation expenses; |
|
|
• |
general economic and political conditions in the countries in which we and our suppliers operate or our products are sold or used; |
|
|
• |
costs associated with litigation, especially related to intellectual property; and |
|
|
• |
productivity and growth of our sales and marketing force. |
Unfavorable changes in any of the above factors, many of which are beyond our control, could significantly harm our business and results of operations, and therefore our stock price. In addition, a significant portion of our operating expenses are relatively fixed. Therefore, if we are unable to accurately forecast quarterly and annual revenues we could experience budgeting and cash flow management problems, unexpected fluctuations in our results of operations and other difficulties, any of which could make it difficult for us to attain and maintain profitability and could increase the volatility of the market price of our common stock.
The average selling prices of products in our markets have historically decreased over time and will likely do so in the future, which could harm our revenues and gross profits. Also any increase in the manufacturing cost of our products could reduce our gross margins.
Average selling prices of semiconductor products in the markets we serve have historically decreased over time. The average unit prices of our products may decline in the future as a result of competitive pricing pressures, increased sales discounts and customer incentives, new product introductions by us or our competitors, or other factors. Our gross profits and financial results will suffer if we are unable to offset any reductions in our average selling prices by reducing our costs, developing new or enhanced products on a timely basis with higher selling prices or gross profits, or increasing our sales volumes. Additionally, because we do not operate our own manufacturing, assembly or testing facilities, we may not be able to reduce our costs rapidly and may not be able to decrease our spending to offset any unexpected shortfall in revenue. If this occurs, our revenue, gross margins and profitability could decline.
Fluctuations in gross margins, primarily due to the mix of products sold, may adversely affect our financial results.
Because of the wide price differences among our products, the mix and types of performance capabilities of products sold affect the average selling price of our products and have a substantial impact on our revenue. Generally, sales of higher performance products have higher gross margins than sales of lower performance products. We currently offer both higher and lower performance products in a number of our different product families. If the sales mix shifts towards lower performance, lower margin products, our overall gross margins will be negatively affected and a decrease in our gross margins could adversely affect the market price of our common stock. Fluctuations in the mix and types of our products may also affect the extent to which we are able to recover our fixed costs and investments that are associated with a particular product, and as a result can negatively impact our financial results.
Our gross margins may also be adversely affected by numerous factors, including:
|
|
• |
entry into new markets, which may have lower gross margins; |
|
|
• |
changes in manufacturing volumes over which fixed costs are absorbed; |
|
|
• |
increased price competition; |
|
|
• |
introduction of new products by us or our competitors, including products with advantages in price, performance or features; |
17
|
|
• |
our inability to reduce manufacturing-related or component costs; |
|
|
• |
amortization and impairments of purchased intangible assets; |
|
|
• |
sales discounts and customer incentives; |
|
|
• |
excess inventory and inventory holding charges; |
|
|
• |
changes in distribution channels; |
|
|
• |
increased warranty costs; and |
|
|
• |
acquisitions and dispositions of businesses, technologies or product lines. |
The semiconductor business experiences ongoing competitive pricing pressure from customers and competitors. Accordingly, any increase in the cost of our products, whether by adverse purchase price variances or adverse manufacturing cost variances, may not be able to be passed on to our customers and we may experience reduced gross margins and operating profit. We do not have any long-term supply agreements with our manufacturing suppliers and we typically negotiate pricing on a purchase order by purchase order basis. Consequently, we may not be able to obtain price reductions or anticipate or prevent future price increases from our suppliers.
We face intense competition and expect competition to increase in the future, which could reduce our revenues, gross margin and/or customer base.
The market for our products is highly competitive and we expect competition to intensify in the future. This competition could make it more difficult for us to sell our products, and result in increased pricing pressure, reduced profit margins, increased sales and marketing expenses, delayed or reduced customer adoption of our new products, and failure to increase, or the loss of, market share or expected market share, any of which would likely seriously harm our business, operating results and financial condition. For instance, semiconductor products have a history of declining prices as the cost of production is reduced. However, if market prices decrease faster than product costs, gross and operating margins can be adversely affected. In the enterprise, datacenter, service provider, broadband and consumer markets, we consider our primary competitors to be other companies that provide processor products to one or more of our markets, including NXP Semiconductors, Intel, Marvell, Qualcomm and HiSilicon. In the high-speed Ethernet adapter and ASIC markets, which include converged networking products such as iSCSI, we compete primarily with Broadcom, Mellanox and Intel. In the traditional enterprise storage Fibre Channel adapter and ASIC markets, our primary competitor is Broadcom. And in the Ethernet switch silicon market, our primary competitors are Broadcom and Mellanox.
A few of our current competitors operate their own fabrication facilities and have, and some of our potential competitors could have, longer operating histories, greater name recognition, larger customer bases and significantly greater financial, technical, sales, marketing and other resources than we have. Should these competitors leverage these competitive advantages, our results of operations could be materially and adversely affected. Potential customers may also prefer to purchase from their existing suppliers rather than a new supplier regardless of product performance or features.
We expect increased competition from other established and emerging companies both domestically and internationally. Our current and potential competitors may also establish cooperative relationships among themselves or with third parties. If so, new competitors or alliances that include our competitors may emerge that could acquire significant market share. In the future, further development by our competitors, and development by our potential competitors, could cause our products to become obsolete.
Further, for several years there has been increased consolidation in our industry. Our customers could acquire current or potential competitors. In addition, competitors could acquire current or potential customers. As a result of such transactions, demand for our products could decrease, which could have a material adverse effect on our revenue and financial condition.
Our ability to compete depends on a number of factors, including:
|
|
• |
our success in identifying new and emerging markets, applications and technologies and developing products for these markets; |
|
|
• |
our products’ performance and cost effectiveness relative to that of our competitors’ products; |
|
|
• |
our ability to deliver products in large volume on a timely basis at a competitive price; |
|
|
• |
our success in utilizing new and proprietary technologies to offer products and features previously not available in the marketplace; |
18
|
|
• |
our ability to recruit design and application engineers and sales and marketing personnel; and |
|
|
• |
our ability to protect our intellectual property. |
In addition, we cannot assure you that existing customers or potential customers will not develop their own products, purchase competitive products or acquire companies that have competing products. Any of these competitive threats, alone or in combination with others, could seriously harm our business, operating results and financial condition.
Our customers may cancel their orders, change production quantities or delay production, and if we fail to forecast demand for our products accurately, we may incur product shortages, delays in product shipments or excess or insufficient product inventory.
We generally do not obtain firm, long-term purchase commitments from our customers. Because production lead times often exceed the amount of time required to fulfill orders, we often must build in advance of orders, relying on an imperfect demand forecast to project volumes and product mix.
Our demand forecast accuracy can be adversely affected by a number of factors, including inaccurate forecasting by our customers, changes in market conditions, adverse changes in our product order mix and demand for our customers’ products. Even after an order is received, our customers may cancel these orders or request a decrease in production quantities. Any such cancellation or decrease subjects us to a number of risks, most notably that our projected sales will not materialize on schedule or at all, leading to unanticipated revenue shortfalls and excess or obsolete inventory which we may be unable to sell to other customers. Alternatively, if we project customer requirements to be less than the demand that materializes, we may not build enough products, which could lead to delays in product shipments and lost sales opportunities in the near term, as well as force our customers to identify alternative sources, which could affect our ongoing relationships with these customers. In the past, we have had customers dramatically increase their requested production quantities with little or no advance notice. Either underestimating or overestimating demand could lead to insufficient, excess or obsolete inventory, which could harm our operating results, cash flow and financial condition, as well as our relationships with our customers.
We receive a substantial portion of our revenues from a limited number of customers, and the loss of, or a significant reduction in, revenue from one or a few of our major customers would adversely affect our operations and financial condition.
We receive a substantial portion of our revenues from a limited number of customers. We received an aggregate of approximately 54.7%, 49.3% and 55.3% of our net revenue from our top five customers in 2017, 2016 and 2015, respectively. Three customers together accounted for 36.2% of our net revenue in 2017, two customers together accounted for 25.1% of our net revenue in 2016 and three customers together accounted for 42.9% of our net revenue in 2015. No other customer accounted for more than 10% of our net revenue in 2017, 2016 and 2015. We anticipate that we will continue to be dependent on a limited number of customers for a significant portion of our revenues in the immediate future and that the portion of our revenues attributable to some of these customers may increase in the future. We may not be able to maintain or increase sales to some of our top customers for a variety of reasons, including the following:
|
|
• |
our agreements with our customers do not require them to purchase a minimum quantity of our products; |
|
|
• |
some of our customers can stop incorporating our products into their own products with limited notice to us and suffer little or no penalty; and |
|
|
• |
many of our customers have pre-existing or concurrent relationships with our current or potential competitors that may affect the customers’ decisions to purchase our products. |
In the past, we have relied in significant part on our relationships with customers that are technology leaders in our target markets. We intend to continue expanding these relationships and forming new relationships but we cannot assure you that we will be able to do so. These relationships often require us to develop new products that may involve significant technological challenges. Our customers frequently place considerable pressure on us to meet their tight development schedules. Accordingly, we may need to devote a substantial amount of our resources to our relationships, which could detract from or delay our completion of other important development projects. Delays in development could impair our relationships with our other large customers and negatively impact sales of the products under development.
19
Major customers also have significant leverage over us and may attempt to change the sales terms, including pricing, customer incentives and payment terms, which could have a material adverse effect on our business, financial condition or results of operations. As our customers are pressured to reduce prices as a result of competitive factors, we may be required to contractually commit to price reductions for our products before we know how, or if, cost reductions can be achieved. If we are unable to achieve these cost reductions, our gross margins could decline and such a decline could have a material adverse effect on our business, financial condition or results of operations. In addition, the ongoing consolidation in the technology industry could adversely impact our business. There is a possibility that one of our large customers could acquire one of our current or potential competitors. As a result of such transactions, demand for our products could decrease, which could have a material adverse effect on our business, financial condition and results of operations.
It is also possible that our customers may develop their own product or adopt a competitor’s solution for products that they currently buy from us. If that happens, our sales would decline and our business, financial condition and results of operations could be materially and adversely affected.
The loss of a major customer, a reduction in sales to any major customer or our inability to attract new significant customers could seriously impact our revenue and materially and adversely affect our business, financial condition, and results of operations.
We may be unsuccessful in developing and selling new products or in penetrating new markets.
We operate in a dynamic environment characterized by rapidly changing technologies and industry standards and technological obsolescence. Our competitiveness and future success depend on our ability to design, develop, manufacture, assemble, test, market and support new products and enhancements on a timely and cost effective basis. A fundamental shift in technologies in any of our product markets could harm our competitive position within these markets. Our failure to anticipate these shifts, to develop new technologies or to react to changes in existing technologies could materially delay our development of new products, which could result in product obsolescence, decreased revenues and a loss of design wins to our competitors. The success of a new product depends on accurate forecasts of long-term market demand and future technological developments, as well as a variety of specific implementation factors, including:
|
|
• |
timely and efficient completion of process design and transfer to manufacturing, assembly and test processes; |
|
|
• |
the quality, performance and reliability of the product; |
|
|
• |
competitive pricing of the product; and |
|
|
• |
effective marketing, sales and service. |
If we fail to introduce new products that meet the demand of our customers or penetrate new markets in which we expend significant resources, our revenues will likely decrease over time and our financial condition could suffer. Additionally, if we concentrate resources on a new market that does not prove profitable or sustainable, our financial condition could decline.
Adverse changes in general economic or political conditions in any of the major countries in which we do business could adversely affect our operating results.
As our business has grown to both customers located in the United States as well as customers located outside of the United States, we have become increasingly subject to the risks arising from adverse changes in both domestic and global economic and political conditions. If economic growth in the United States and other countries’ economies slows, the demand for our customers’ products could decline, which would then decrease demand for our products. Furthermore, if economic conditions in the countries into which our customers sell their products deteriorate, some of our customers may decide to postpone or delay some of their development programs, which would then delay their need to purchase our products. This could result in a reduction in sales of our products or in a reduction in the growth of our product sales. Any of these events would likely harm our financial condition and results of operations. This could also make it difficult for us to forecast future revenue and if we do not achieve anticipated levels of revenue our operating results could be adversely affected.
20
The semiconductor and communications industries have historically experienced significant fluctuations with prolonged downturns, which could impact our operating results, financial condition and cash flows.
The semiconductor industry has historically exhibited cyclical behavior, which at various times has included significant downturns in customer demand. Because a significant portion of our expenses are fixed in the near term or are incurred in advance of anticipated sales, we may not be able to decrease our expenses rapidly enough to offset any unanticipated shortfall in revenues. If this situation were to occur, it could adversely affect our operating results, cash flow and financial condition. Furthermore, the semiconductor industry has periodically experienced periods of increased demand and production constraints. If this happens in the future, we may not be able to produce sufficient quantities of our products to meet the increased demand. We may also have difficulty in obtaining sufficient wafer, assembly and test resources from our subcontract manufacturers. Any factor adversely affecting the semiconductor industry in general, or the particular segments of the industry that our products target, may adversely affect our ability to generate revenue and could negatively impact our operating results.
The communications industry has, in the past, experienced pronounced downturns, and these cycles may continue in the future. To respond to a downturn or weakness in a particular market or geography, customers may slow their research and development activities, cancel or delay new product development, reduce their inventories and take a cautious approach to acquiring our products, which would have a significant negative impact on our business. If this situation were to occur, it could adversely affect our operating results, cash flow and financial condition. In the future, any of these trends may also cause our operating results to fluctuate significantly from year to year, which may increase the volatility of the price of our stock.
We rely on our customers to design our products into their systems, and the nature of the design process requires us to incur expenses prior to customer commitments to use our products or recognizing revenues associated with those expenses which may adversely affect our financial results.
One of our primary focuses is on winning competitive bid selection processes, known as “design wins,” to develop products for use in our customers’ products. We devote significant time and resources in working with our customers’ system designers to understand their future needs and to provide products that we believe will meet those needs and these bid selection processes can be lengthy. If a customer’s system designer initially chooses a competitor’s product, it becomes significantly more difficult for us to sell our products for use in that system because changing suppliers can involve significant cost, time, effort and risk for our customers. Thus, our failure to win a competitive bid can result in our foregoing revenues from a given customer’s product line for the life of that product. In addition, design opportunities may be infrequent or may be delayed. Our ability to compete in the future will depend, in large part, on our ability to design products to ensure compliance with our customers’ and potential customers’ specifications. We expect to invest significant time and resources and to incur significant expenses to design our products to ensure compliance with relevant specifications.
We often incur significant expenditures in the development of a new product without any assurance that our customers’ system designers will select our product for use in their applications. We often are required to anticipate which product designs will generate demand in advance of our customers expressly indicating a need for that particular design. Even if our customers’ system designers select our products, a substantial period of time will elapse before we generate revenues related to the significant expenses we have incurred.
The reasons for this delay generally include the following elements of our product sales and development cycle timeline and related influences:
|
|
• |
our customers usually require a comprehensive technical evaluation of our products before they incorporate them into their designs; |
|
|
• |
it can take from six months to three years from the time our products are selected to commence commercial shipments; and |
|
|
• |
our customers may experience changed market conditions or product development issues. |
The resources devoted to product development and sales and marketing may not generate material revenue for us, and from time to time, we may need to write off excess and obsolete inventory if we have produced product in anticipation of expected demand. We may spend resources on the development of products that our customers may not adopt. If we incur significant expenses and investments in inventory in the future that we are not able to recover, and we are not able to compensate for those expenses, our operating results could be adversely affected. In addition, if we sell our products at reduced prices in anticipation of cost reductions but still hold higher cost products in inventory, our operating results would be harmed.
Additionally, even if system designers use our products in their systems, we cannot assure you that these systems will be commercially successful or that we will receive significant revenue from the sales of our products for those systems. As a result, we may be unable to accurately forecast the volume and timing of our orders and revenues associated with any new product introductions.
21
Our products must meet exact specifications, and defects and failures may occur, which may cause customers to return or stop buying our products.
Our customers generally establish demanding specifications for quality, performance and reliability that our products must meet. However, our products are highly complex and may contain defects and failures when they are first introduced or as new versions are released. If defects and failures occur in our products during or after the design phase, we could experience lost revenues, increased costs, including warranty expense and costs associated with customer support, delays in or cancellations or rescheduling of orders or shipments, product returns or discounts, diversion of management and technical resources or damage to our reputation and brand equity, and in some cases consequential damages, any of which could harm our operating results. In addition, delays in our ability to fill product orders as a result of quality control issues may negatively impact our relationship with our customers.
Some of our operations and a significant portion of our suppliers, customers and contract manufacturers are located outside of the United States, which subjects us to additional risks, including increased complexity and costs of managing international operations and geopolitical instability.
We have international sales offices and research and development facilities and we conduct, and expect to continue to conduct, a significant amount of our business with companies located outside the United States, particularly in Asia and Europe. Even customers based in the United States often use contract manufacturers based in Asia to manufacture their systems, and it is the contract manufacturers that often purchase products directly from us. In addition, a significant portion of our suppliers are located outside of the United States. As a result, we face numerous challenges, including:
|
|
• |
increased complexity and costs of managing international operations; |
|
|
• |
longer and more difficult collection of receivables; |
|
|
• |
difficulties in enforcing contracts generally; |
|
|
• |
geopolitical and economic instability and military conflicts; |
|
|
• |
limited protection of our intellectual property and other assets; |
|
|
• |
compliance with local laws and regulations and unanticipated changes in local laws and regulations, including tax laws and regulations; |
|
|
• |
trade and foreign exchange restrictions and higher tariffs; |
|
|
• |
travel restrictions; |
|
|
• |
timing and availability of import and export licenses and other governmental approvals, permits and licenses, including export classification requirements; |
|
|
• |
foreign currency exchange fluctuations relating to our international operating activities; |
|
|
• |
transportation delays and limited local infrastructure and disruptions, such as large scale outages or interruptions of service from utilities or telecommunications providers; |
|
|
• |
difficulties in staffing international operations; |
|
|
• |
heightened risk of terrorism; |
|
|
• |
local business and cultural factors that differ from our normal standards and practices; |
|
|
• |
differing employment practices and labor issues; |
|
|
• |
regional health issues and natural disasters; and |
|
|
• |
work stoppages. |
Our international sales are invoiced in United States dollars and, accordingly, if the relative value of the United States dollar in comparison to the currency of our foreign customers should increase, the resulting effective price increase of our products to such foreign customers could result in decreased sales. In addition, a significant portion of our inventory is purchased from international suppliers, who invoice us in United States dollars. If the relative value of the United States dollar in comparison to the currency of our foreign suppliers should decrease, our suppliers may increase prices, which could result in a decline of our gross margin. Any of the foregoing factors could have a material adverse effect on our business, financial condition or results of operations.
22
We outsource our wafer fabrication, assembly, testing, warehousing and shipping operations to third parties, including contract manufacturers, and rely on these parties to produce and deliver our products according to requested demands in specification, quantity, cost and time.
We rely on third parties, including contract manufacturers, for substantially all of our manufacturing operations, including wafer fabrication, assembly, testing, warehousing and shipping. We depend on these parties to supply us with material of a requested quantity in a timely manner that meets our standards for yield, cost and manufacturing quality. We do not have any long-term supply agreements with our manufacturing suppliers or contract manufacturers. Any problems with our manufacturing supply chain could adversely impact our ability to ship our products to our customers on time and in the quantity required, which in turn could cause an unanticipated decline in our sales and possibly damage our customer relationships.
The fabrication of integrated circuits is a complex and technically demanding process. Our foundries could, from time to time, experience manufacturing defects and reduced manufacturing yields. Changes in manufacturing processes or the inadvertent use of defective or contaminated materials by our foundries could result in lower than anticipated manufacturing yields or unacceptable performance. Many of these problems are difficult to detect at an early stage of the manufacturing process and may be time consuming and expensive to correct. In addition, our manufacturing processes with our foundries are unique and not within the customary manufacturing processes of these foundries, which may lead to manufacturing defects, reduced manufacturing yields and/or increases in manufacturing costs.
Poor yields from our foundries, or defects, integration issues or other performance problems in our products could cause us significant customer relations and business reputation problems, harm our financial results and result in financial or other damages to our customers. Our customers could also seek damages from us for their losses. A product liability claim brought against us, even if unsuccessful, would likely be time consuming and costly to defend.
Availability of foundry capacity has in the past been reduced due to strong demand. The ability of each foundry to provide us with semiconductor devices is limited by its available capacity and existing obligations. Foundry capacity may not be available when we need it or at reasonable prices which could cause us to be unable to meet customer needs or delay shipments, which could result in a decline in our sales and harm our financial results. To secure sufficient foundry capacity when demand is high, we may enter into various arrangements with suppliers that could be costly and harm our operating results, such as nonrefundable deposits with or loans to foundries in exchange for capacity commitments and contracts that commit us to purchase specified quantities of integrated circuits over extended periods. We may not be able to make any such arrangement in a timely fashion or at all, and any arrangements may be costly, reduce our financial flexibility, and not be on terms favorable to us. Moreover, if we are able to secure foundry capacity, we may be obligated to use all of that capacity or incur penalties. These penalties may be expensive and could harm our financial results.
A significant portion of our sales are to customers that practice just-in-time order management from their suppliers, which gives us a very limited amount of time in which to process and complete these orders. As a result, delays in our production or shipping by the parties to whom we outsource these functions could reduce our sales, damage our customer relationships and damage our reputation in the marketplace, any of which could harm our business, financial condition and results of operations.
Our products are manufactured at a limited number of locations and if we experience manufacturing problems at a particular location, we could experience a delay in obtaining our manufactured products, which could harm our business and reputation.
Although we use several independent foundries to manufacture substantially all of our semiconductor products, most of our components are not manufactured at more than one foundry at any given time, and our products typically are designed to be manufactured in a specific process at only one of these foundries. Accordingly, if one of our foundries is unable to provide us with components as needed or chooses to significantly change its relationship with us, we could experience significant delays in securing sufficient supplies of those components from other sources, which could have a material adverse effect on our results of operations. In addition, the loss of our largest third-party contract manufacturer could significantly impact our ability to produce products for an indefinite period of time.
Converting or transferring manufacturing from a primary location or supplier to a backup facility could be expensive and could take one to two quarters. During such a transition, we would be required to meet customer demand from our then-existing inventory, as well as any partially finished goods that can be modified to the required product specifications. We do not seek to maintain sufficient inventory to address a lengthy transition period because we believe it is uneconomical to keep more than minimal inventory on hand. Qualifying a new contract manufacturer and commencing volume production is a lengthy and expensive process. Some customers will not purchase any products, other than a limited number of evaluation units, until they qualify the manufacturing line for the product. As a result, we may not be able to meet customer needs during such a transition, which could delay shipments, cause a production delay or stoppage for our customers, result in a decline in our sales and damage our customer relationships.
23
We cannot assure you that any of our existing or new foundries and manufacturers will be able to produce products with acceptable manufacturing yields, or be able to deliver enough products to us on a timely basis, or at reasonable prices. These and other related factors could impair our ability to meet our customers’ needs and have a material and adverse effect on our operating results, competitive position and relationships with customers.
We rely on third-party technologies for the development of our products and our inability to use these technologies in the future would harm our ability to remain competitive.
We rely on third parties for technologies that are integrated into our products, such as wafer fabrication and assembly and test technologies used by our contract manufacturers, as well as licensed MIPS and ARM architecture technologies. If we are unable to continue to use or license these technologies on reasonable terms, or if these technologies fail to operate properly, we may not be able to secure alternatives in a timely manner and our ability to remain competitive would be harmed, which could harm our business, financial condition and results of operations. In addition, if we are unable to successfully license technology from third parties to develop future products, we may not be able to develop such products in a timely manner or at all.
Sales and purchasing patterns with our customers and suppliers are uneven and subject to seasonal fluctuations.
A portion of our products are sold to customers who experience seasonality and uneven sales patterns in their own businesses. As a result, we experience similar seasonality and uneven sales and purchasing patterns with certain of our customers and suppliers. We believe the variability in sales and purchasing patterns results from many factors, including:
|
|
• |
spikes in sales during the fourth quarter of each calendar year typically experienced by our customers, which in turn leads to higher sales volume in our fourth quarter; |
|
|
• |
the tendency of our customers to close a disproportionate percentage of their sales transactions in the last month, weeks and days of each quarter, which in turn leads to an increase in our sales during those same time periods; and |
|
|
• |
strategic purchases, including entering into non-cancelable purchase commitments, by us or our customers in advance of demand to take advantage of favorable pricing or to mitigate risks around product availability. |
This variability makes it extremely difficult to predict the demand and buying patterns of our customers and, in turn, causes challenges for us in sourcing goods and services from our suppliers, adjusting manufacturing capacity, and forecasting cash flow and working capital needs. If we predict demand that is substantially greater than actual customer orders, we will have excess inventory. Alternatively, if customer orders substantially exceed predicted demand, the ability to assemble, test and ship orders received in the last weeks and days of each quarter may be limited, or be completed at an increased cost, which could have a material adverse effect on our business, financial condition or results of operations.
The loss of any of our key personnel could seriously harm our business, and our failure to attract or retain specialized technical, management or sales and marketing talent could impair our business.
We believe our future success will depend in large part upon our ability to attract, retain and motivate highly skilled managerial, engineering, sales and marketing personnel. The loss of any key employees or the inability to attract, retain or motivate qualified personnel, including engineers and sales and marketing personnel, could delay the development and introduction of, and harm our ability to sell our products which would materially and adversely affect our business, financial condition and results of operations. For instance, if any of these individuals were to leave our company unexpectedly, we could face substantial difficulty in hiring qualified successors and could experience a loss in productivity during the search for and while any successor is integrated into our business and operations. Further, if we are unable to integrate and retain personnel acquired through our various acquisitions, we may not be able to fully capitalize on such acquisitions.
We believe that the market for key personnel in the industries in which we compete is highly competitive and we anticipate that competition for such personnel will increase in the future. Our key technical personnel represent a significant asset and serve as the source of our technological and product innovations. Changes to United States immigration policies that restrict our ability to attract and retain technical personnel may negatively affect our research and development efforts. We may not be successful in attracting, retaining and motivating sufficient numbers of technical personnel to support our anticipated growth.
To date, we have relied primarily on our direct marketing and sales force to drive new customer design wins and to sell our products. Because we are looking to expand our customer base and grow our sales, we will need to hire additional qualified sales personnel in the near term and beyond if we are to achieve revenue growth. The competition for qualified marketing and sales personnel in our industry, and particularly in Silicon Valley, is very intense. If we are unable to hire, train, deploy and manage qualified sales personnel in a timely manner, our ability to grow our business will be impaired. In addition, if we are unable to retain our existing sales personnel, our ability to maintain or grow our current level of revenues will be adversely affected.
24
We rely on stock-based awards as one means for recruiting, motivating and retaining highly skilled talent. If the value of the stock awards does not appreciate as measured by the performance of the price of our common stock or if our share-based compensation otherwise ceases to be viewed as a valuable benefit, our ability to attract, retain, and motivate employees could be weakened, which could harm our business, financial condition and results of operations.
We are subject to governmental export and import controls that may adversely affect our business.
We and our customers are subject to various import and export laws and regulations. Government export regulations apply to the encryption or other features contained in some of our products. Although our processes and procedures are designed to maintain compliance, we cannot assure you that we have been or will be at all times in complete compliance with these laws and regulations. On January 30, 2015, we submitted an initial notification of a voluntary self-disclosure to the United States Department of Commerce, Bureau of Industry and Security, or BIS. The notification reported our discovery that hardware and software, with encryption functionality, may have been exported without the required BIS export license. With the assistance of outside counsel, we conducted a review of past export transactions during the past five years, and on July 17, 2015, we reported our findings in a full voluntary self-disclosure to BIS. The findings reported that we exported certain encryption hardware and software to fifteen government end-users in the People’s Republic of China, Taiwan, Hong Kong, Singapore, India and South Korea, as well as one party on BIS' entity list, without the required BIS export license. The aggregate billings for the reported exports were not material. The disclosure also addressed our remedial and corrective actions. BIS is reviewing our voluntary self-disclosure and we are cooperating fully with BIS. Violations of the export control laws may result in civil, administrative or criminal fines or penalties, loss of export privileges, debarment or a combination of these penalties. At this time we are unable to determine the outcome of the government’s investigation or its possible effect on the Company.
If we fail to receive licenses or otherwise comply with import and export laws and regulations, we may be unable to manufacture the affected products at foreign foundries or ship these products to some customers; we may be subject to investigations or notices of non-compliance; we may incur penalties or fines and civil and criminal liabilities or other sanctions; or we may experience adverse publicity and reputational damage. In addition, changes in import or export laws and regulations may create delays in the introduction of our products in international markets, prevent our customers with international operations from deploying our products or cause decreased use of our products by customers with international operations, each of which would adversely affect our business and results of operations.
Changes in and compliance with regulations could materially and adversely affect us.
Our business, results of operations or financial condition could be materially and adversely affected if new laws, regulations or standards relating to us or our products are implemented or existing ones are changed, including laws, regulations or standards affecting licensing practices, competitive business practices, the use of our technology or products, protection of intellectual property, trade, foreign investments or loans, taxation, privacy and data protection, environmental protection or employment. In addition, our compliance with existing regulations may have a material adverse impact on us. For example, the Dodd-Frank Wall Street Reform and Consumer Protection Act (the Dodd-Frank Act) was enacted in 2010. There are significant corporate governance and executive compensation related provisions in the Dodd-Frank Act, including the disclosure requirements relating to the sourcing of so-called conflict minerals from the Democratic Republic of Congo and certain other adjoining countries. Our disclosures regarding conflict minerals have been and will be predicated upon the timely receipt of accurate information from suppliers, who may be unwilling or unable to provide us with the relevant information, which may harm our reputation and our relationships with our customers. In addition, these requirements could adversely affect the sourcing, availability and pricing of minerals used in the manufacture of our products.
We are subject to laws, rules and regulations in the United States and other countries relating to the collection, use and security of personal information and data. We have incurred, and will continue to incur, expenses to comply with privacy and security standards, protocols and obligations imposed by applicable laws, regulations, industry standards and contracts. Any inability to comply with applicable privacy or data protection laws, regulations or other obligations, could result in significant cost and liability, damage our reputation, and adversely affect our business.
Under applicable federal securities laws, including the Sarbanes-Oxley Act of 2002, we are required to evaluate and determine the effectiveness of our internal control structure and procedures for financial reporting. Should we or our independent auditors determine that we have material weaknesses in our internal controls, our business, financial condition or results of operations may be materially and adversely affected and our stock price may decline. We may not be able to effectively and timely implement necessary control changes and employee training to ensure continued compliance with the Sarbanes-Oxley Act and other regulatory and reporting requirements. Our rapid growth in recent years, including through acquisitions, and our possible future expansion through acquisitions, present challenges to maintain the internal control and disclosure control standards applicable to public companies. If we fail to maintain effective internal controls, we could be subject to regulatory scrutiny and sanctions and investors could lose confidence in the accuracy and completeness of our financial reports.
25
In many foreign countries, particularly in those with developing economies, it is common to engage in business practices that are prohibited by regulations applicable to us, such as the Foreign Corrupt Practices Act and other anti-bribery laws. Although we have policies and procedures designed to ensure compliance with these laws, our employees, contractors and agents, as well as those companies to which we outsource certain of our business operations, may take actions in violation of our policies. Any such violation, even if prohibited by our policies, could have a material adverse effect on our business, financial condition or results of operations.
We face increasing complexity in our product design and procurement operations as we adjust to new and future requirements relating to the chemical and material composition of our products, their safe use, the energy consumption associated with those products and product take-back legislation (i.e., legislation that makes producers of electrical goods financially responsible for specified collection, recycling, treatment and disposal of past and future covered products). We could incur substantial costs, our products could be restricted from entering certain jurisdictions, and we could face other sanctions, if we were to violate or become liable under environmental laws or if our products become non-compliant with environmental laws.
The migration of our customers toward new products could adversely affect our results of operations.
As new or enhanced products are introduced, we must successfully manage the transition from older products in order to minimize the effects of product inventories that may become excess and obsolete, as well as ensure that sufficient supplies of new products can be delivered to meet customer demand. Our failure to manage the transition to newer products in the future could adversely affect our business or results of operations. When we introduce new products and product enhancements, we face additional risks relating to product transitions, including risks relating to forecasting demand and longer lead times associated with smaller product geometries and more complex production operations. Any such adverse event or increased costs could have a material adverse effect on our business, financial condition or results of operations.
In the event one of our distributor arrangements terminates, it could lead to a loss of revenues and possible product returns.
A portion of our sales is made through third-party distribution agreements. Termination of a distributor relationship, either by us or by the distributor, could result in a temporary loss of revenues until a replacement distributor can be established to service the affected end-user customers, or a permanent loss of revenues if no replacement can be established. We may not be successful in finding suitable alternative distributors on satisfactory terms or at all and this could adversely affect our ability to sell in some locations or to some end-user customers. Additionally, if we terminate our relationship with a distributor, we may be obligated to repurchase unsold products. We record a reserve for estimated returns and price credits. If actual returns and credits exceed our estimates, our operating results could be harmed.
Our failure to protect our intellectual property rights adequately could impair our ability to compete effectively or to defend ourselves from litigation, which could harm our business, financial condition and results of operations.
We rely primarily on patent, copyright, trademark and trade secret laws, as well as confidentiality and nondisclosure agreements and other methods, to protect our proprietary technologies and know-how. There can be no assurance that these protections will be adequate to protect our proprietary rights, that others will not independently develop or otherwise acquire equivalent or superior technology, or that we can maintain such technology as trade secrets.
The failure of our patents and other intellectual property protections to adequately protect our technology might make it easier for our competitors to offer similar products or technologies, which would harm our business. For example, our patents could be opposed, contested, circumvented or designed around by our competitors or be declared invalid or unenforceable in judicial or administrative proceedings. Our foreign patent protection is generally not as comprehensive as our United States patent protection and may not protect our intellectual property in some countries where our products are shipped, sold or may be sold in the future. Many United States-based companies have encountered substantial intellectual property infringement in foreign countries, including countries where we sell products. Even if foreign patents are granted, effective enforcement in foreign countries may not be available.
We enter into confidentiality agreements with our employees, consultants and strategic partners. We also control access to and distribution of our technologies, documentation and other proprietary information. However, internal or external parties may copy, disclose, obtain or use our proprietary information without our authorization. Further, current or former employees or third parties may attempt to misappropriate our proprietary information.
Monitoring unauthorized use of our intellectual property and the intellectual property of our customers and strategic partners is difficult and costly. It is possible that unauthorized use of our intellectual property may have occurred or may occur without our knowledge. We cannot assure you that the steps we have taken will prevent unauthorized use of our intellectual property.
26
Our failure to effectively protect our intellectual property could reduce the value of our technology in licensing arrangements or in cross-licensing negotiations, and could harm our business, financial condition, and results of operations. We may in the future need to initiate infringement claims or litigation to defend or enforce our intellectual property rights. Litigation, whether we are a plaintiff or a defendant, can be expensive, time consuming and may divert the efforts of our technical staff and managerial personnel, which could harm our business, whether or not such litigation results in a determination favorable to us.
Assertions by third parties of infringement by us of their intellectual property rights could result in significant costs and cause our operating results to suffer.
The semiconductor industry is characterized by vigorous protection and pursuit of intellectual property rights and positions, which has resulted in protracted and expensive litigation for many companies. From time to time we receive communications that allege we have infringed specified patents, trade secrets or other intellectual property rights owned by others. Any of these allegations, regardless of merit, could cause us to incur significant costs in responding to, defending and resolving these allegations. Any lawsuits resulting from these allegations could subject us to significant liability for damages and invalidate our proprietary rights. Any potential intellectual property infringement allegations or litigation also could force us to do one or more of the following:
|
|
• |
stop selling products or using technology that contain the allegedly infringing intellectual property; |
|
|
• |
lose the opportunity to license our technology to others or to collect royalty payments based upon successful protection and assertion of our intellectual property against others; |
|
|
• |
incur significant legal expenses; |
|
|
• |
pay substantial damages or settlement amounts to a third-party; |
|
|
• |
redesign those products that contain the allegedly infringing intellectual property; or |
|
|
• |
attempt to obtain a license to the relevant intellectual property from third parties, which may not be available on reasonable terms or at all. |
Any significant impairment of our intellectual property rights from any litigation we face could harm our business and our ability to compete.
Our customers have in the past and may in the future also become the target of allegations of infringement or litigation relating to the patent and other intellectual property rights of others. This could trigger technical support and indemnification obligations in some of our licenses or customer agreements. These obligations could result in substantial expenses, including the payment by us of costs and damages relating to claims of intellectual property infringement. In addition to the time and expense required for us to provide support or indemnification to our customers, litigation could disrupt the businesses of our customers, which in turn could hurt our relationships with our customers and cause the sale of our products to decrease. We cannot assure you that claims for indemnification will not be made or that if made, the claims would not have a material adverse effect on our business, operating results or financial conditions.
A breach of our security systems or a cyber-attack may have a material adverse effect on our business.
Our security systems are designed to maintain the physical security of our facilities and protect our customers’, suppliers’ and employees’ confidential information. However, we are also dependent on a number of third-party “cloud-based” service providers of critical corporate infrastructure services relating to, among other things, human resources, electronic communication services and some finance functions, and we are, of necessity, dependent on the security systems of these providers. Accidental or willful security breaches, including cyber-attacks, or other unauthorized access by third parties to our facilities, our information systems or the systems of our cloud-based service providers or the existence of computer viruses in our or their data or software could expose us to a risk of information loss and misappropriation of proprietary and confidential information. Any theft or misuse of this information could result in, among other things, unfavorable publicity, damage to our reputation, disclosure of our intellectual property and/ or confidential customer, supplier or employee data, difficulty in marketing our products, allegations by our customers that we have not performed our contractual obligations, litigation by affected parties and possible financial obligations for liabilities and damages related to the theft or misuse of this information, any of which could have a material adverse effect on our business, profitability and financial condition. Since the techniques used to obtain unauthorized access or to sabotage systems change frequently and are often not recognized until launched against a target, we may be unable to anticipate these techniques or to implement adequate preventative measures.
27
We may need to raise additional capital, which might not be available or which, if available, may be on terms that are not favorable to us.
We believe our existing cash and cash equivalent balances and cash expected to be generated from our operations will be sufficient to meet our working capital, capital expenditures and other needs for at least the next 12 months. In the future, we may seek to raise additional funds, and we cannot be certain that we will be able to obtain additional financing on favorable terms, if at all. If we issue equity securities to raise additional funds, the ownership percentage of our stockholders would be reduced, and the new equity securities may have rights, preferences or privileges senior to those of existing holders of our common stock. We may also increase our debt in the future for which we may incur additional significant interest charges, which could harm our profitability. Holders of debt would also have rights, preferences or privileges senior to those of existing holders of our common stock. If we cannot raise needed funds on acceptable terms, we may not be able to develop or enhance our products, take advantage of future opportunities or respond to competitive pressures or unanticipated requirements, which could harm our business, operating results and financial condition.
We rely on our ecosystem partners to enhance our product offerings and our inability to continue to develop or maintain these relationships in the future would harm our ability to remain competitive.
We have developed relationships with third parties, which we refer to as ecosystem partners, which provide operating systems, tool support, reference designs and other services designed for specific uses with our SoCs. We believe that these relationships enhance our customers’ ability to get their products to market quickly. If we are unable to continue to develop or maintain these relationships, we may not be able to enhance our customers’ ability to commercialize their products in a timely fashion and our ability to remain competitive would be harmed, which would negatively impact our ability to generate revenue and our operating results.
If we fail to carefully manage the use of “open source” software in our products, we may be required to license key portions of our products on a royalty-free basis or expose key parts of our source code.
Certain of our software may be derived from “open source” software that is generally made available to the public by its authors and/or other third parties. Such open source software is often made available to us under licenses, such as the GNU General Public License, that impose certain obligations on us in the event we were to distribute derivative works of the open source software. These obligations may require us to make source code for the derivative works available to the public and license such derivative works under a particular type of license, rather than the forms of licenses customarily used to protect our intellectual property. In the event the copyright holder of any open source software were to successfully establish in court that we had not complied with the terms of a license for a particular work, we could be required to release the source code of that work to the public or stop distributing that work.
Our facilities and the facilities of our suppliers, third-party contractors and customers are located in regions that are subject to natural disasters and other risks. Any disruption to the operations of these could cause significant delays in the production or shipment of our products.
Our California facilities, including our principal executive offices, are located near major earthquake faults. Any personal injury at, or damages to, the facilities as a result of such occurrences could have a material adverse effect on our business, results of operations or financial condition. Additionally, a substantial portion of our products are manufactured by third-party contractors located in the Asia-Pacific (or APAC) region. The risk of an earthquake in the APAC region is significant due to the proximity of major earthquake fault lines to the facilities of our foundries and assembly and test subcontractors. For example, several major earthquakes have occurred in Taiwan and Japan since our incorporation in 2000, the most recent being the major earthquake and tsunami that occurred in March 2011 in Japan. Although our third-party contractors did not suffer any significant damage as a result of these most recent earthquakes, the occurrence of additional earthquakes or other events causing closures could result in the disruption of our foundry or assembly and test capacity.
We have additional operations, suppliers, third-party contractors and customers in regions that have historically experienced natural disasters. Any disruption resulting from a natural disaster could cause significant delays in the production or shipment of our products which could adversely affect our business, results of operations and financial condition. Further, as a result of a natural disaster, our major customers may face shortages of components that could negatively impact their ability to build the devices into which our products are integrated, thereby negatively impacting the demand for our products even if the supply of our products is not directly affected by the natural disaster.
28
We may experience difficulties in transitioning to new wafer fabrication process technologies or in achieving higher levels of design integration, which may result in reduced manufacturing yields, delays in product deliveries and increased expenses.
To remain competitive, we expect to continue to transition our semiconductor products to increasingly smaller line width geometries. This transition requires us to modify our designs to work with the manufacturing processes of our foundries. We periodically evaluate the benefits, on a product-by-product basis, of migrating to new process technologies to reduce cost and improve performance. We may face difficulties, delays and expenses as we continue to transition our products to new processes. We are dependent on our relationships with our foundry contractors to transition to new processes successfully. We cannot assure you that the foundries that we use will be able to effectively manage the transition or that we will be able to maintain our existing foundry relationships or develop new ones. If any of our foundry contractors or we experience significant delays in this transition or fail to efficiently implement this transition, we could experience reduced manufacturing yields, delays in product deliveries and increased expenses, all of which could harm our relationships with our customers and our results of operations. As new processes become more prevalent, we expect to continue to integrate greater levels of functionality, as well as customer and third-party intellectual property, into our products. However, we may not be able to achieve higher levels of design integration or deliver new integrated products on a timely basis.
We may incur impairments to goodwill or long-lived assets.
We review our long-lived assets, including goodwill and other intangible assets, for impairment annually in the fourth quarter or whenever events or changes in circumstances indicate that the carrying amount of these assets may not be recoverable. Significant negative industry or economic trends, including a significant decline in the market price of our common stock, reduced estimates of future cash flows for our reporting units or disruptions to our business could lead to an impairment charge of our long-lived assets, including goodwill and other intangible assets.
Our valuation methodology for assessing impairment requires management to make judgments and assumptions based on historical experience and to rely heavily on projections of future operating performance. If our actual results, or the plans and estimates used in future impairment analyses are lower than the original estimates used to assess the recoverability of these assets, we could incur additional impairment charges. We operate in highly competitive environments and projections of future operating results and cash flows may vary significantly from results. Additionally, if our analysis results in impairment to our goodwill, we may be required to record a charge to earnings in our financial statements during a period in which such impairment is determined to exist, which may negatively impact our business, financial condition and results of operations.
Our future effective tax rates could be affected by the allocation of our income among different geographic regions, which could affect our future operating results, financial condition and cash flows.
As a global company, we are subject to taxation in the United States and various other countries and states. Significant judgment is required to determine and estimate worldwide tax liabilities. We may further expand our international operations and staff to better support our international markets. As a result, we anticipate that our consolidated pre-tax income will be subject to tax at relatively lower tax rates when compared to the United States federal statutory tax rate. Further, because we have established valuation allowance against our deferred tax assets in the United States, combined with lower foreign tax rates, our effective income tax rate is expected to be lower than the United States federal statutory rate. Our future effective income tax rates could be adversely affected if tax authorities were to successfully challenge our international tax structure or if the relative mix of United States and international income changes for any reason, or United States or foreign tax laws were to change. Accordingly, there can be no assurance that our income tax rate will continue to be less than the United States federal statutory rate.
Any significant change in our future effective tax rates could adversely impact our consolidated financial position, results of operations and cash flows. Our future effective tax rates may be adversely affected by a number of factors including:
|
|
• |
changes in tax laws in the countries in which we operate or the interpretation of such laws including the Base Erosion Profit Shifting, or BEPS, project being conducted by the Organization for Economic Co-operation and Development and the appeal of the United States tax court’s recent opinion on the exclusion of stock compensation expense in inter-company cost sharing arrangements; |
|
|
• |
increase in expenses not deductible for tax purposes; |
|
|
• |
changes in share-based compensation expense; |
|
|
• |
change in the mix of income among different taxing jurisdictions; |
|
|
• |
audit examinations with adverse outcomes; |
29
|
|
• |
changes in generally accepted accounting principles; and |
|
|
• |
our ability to use tax attributes such as research and development tax credits and net operating losses. |
In December 2017, both houses of the U.S. Congress passed legislation that was approved and signed into law. This legislation could have a material benefit or material adverse impact on our effective tax rate, tax expense and cash flows in the future. Any benefits associated with lower U.S. corporate tax rates could be reduced or outweighed by other tax changes adverse to our business or operations, such as new or additional taxes imposed on earnings and/or reinvested earnings of our foreign subsidiaries. The aggregate impact of such legislation could have a material adverse impact on our cash flows and results of operations.
We are subject to examination of our income tax returns by the United States Internal Revenue Service and other tax authorities, which may result in the assessment of additional income taxes. Although we reserve for uncertain tax positions, including related penalties and interest, the amounts ultimately paid upon resolution of audits could be materially different from the amounts previously included in our income tax expense and therefore could have a material impact on our tax provision, net income and cash flows. In the event that actual results differ from these estimates or we adjust these estimates in future periods, we may need to record additional income tax expense or establish an additional valuation allowance, which could materially impact our financial position and results of operations. (See Note 9 of the Notes to Consolidated Financial Statements in Item 8 of this Annual Report, which is incorporated herein by reference).
Changes in valuation allowance of deferred tax assets may affect our future operating results
We record a valuation allowance to reduce our net deferred tax assets to the amount that we believe is more-likely-than-not to be realized. In assessing the need for a valuation allowance, we consider historical levels of income, expectations and risks associated with estimates of future taxable income. We periodically evaluate our deferred tax asset balance for realizability. To the extent we believe it is more-likely-than-not that some portion of our deferred tax assets will not be realized, we will increase the valuation allowance against the deferred tax assets. Realization of our deferred tax assets is dependent primarily upon future taxable income in related tax jurisdictions. If our assumptions and consequently our estimates change in the future, the valuation allowances may be increased or decreased, resulting in a respective increase or decrease in income tax expense.
Risks Related to our Common Stock
The market price of our common stock may be volatile, which could cause the value of your investment to decline.
The market price of our common stock has fluctuated substantially and there is no assurance that such volatility will not continue. Several factors that could impact our stock price are:
|
|
• |
quarterly variations in our results of operations or those of our competitors; |
|
|
• |
changes in financial estimates including our ability to meet our future revenue and operating profit or loss projections; |
|
|
• |
general economic conditions and slow or negative growth of related markets; |
|
|
• |
announcements by us or our competitors of design wins, acquisitions, new products, significant contracts, commercial relationships or capital commitments; |
|
|
• |
our ability to develop and market new and enhanced products on a timely basis; |
|
|
• |
commencement of, or our involvement in, litigation; |
|
|
• |
disruption to our operations; |
|
|
• |
the emergence of new sales channels in which we are unable to compete effectively; |
|
|
• |
any major change in our board of directors or management; |
|
|
• |
changes in governmental regulations; and |
|
|
• |
changes in earnings estimates or recommendations by securities analysts. |
Furthermore, the stock market in general, and the market for semiconductor and other technology companies in particular, have experienced price and volume fluctuations that have often been unrelated or disproportionate to the operating performance of those companies. These broad market and industry factors may seriously harm the market price of our common stock, regardless of our actual operating performance. These trading price fluctuations may also make it more difficult for us to use our common stock as a means to make acquisitions or to use our common stock to attract and retain employees. In addition, in the past, following periods of volatility in the overall market and the market price of a company’s securities, securities class action litigation has often been instituted against these companies. This litigation, if instituted against us, could result in substantial costs and a diversion of our management’s attention and resources.
30
Delaware law and our amended and restated certificate of incorporation and bylaws contain provisions that could delay or discourage takeover attempts that stockholders may consider favorable.
Provisions in our amended and restated certificate of incorporation and bylaws may have the effect of delaying or preventing a change of control or changes in our management. These provisions include the following:
|
|
• |
the division of our board of directors into three classes; |
|
|
• |
the right of the board of directors to elect a director to fill a vacancy created by the expansion of the board of directors or due to the resignation or departure of an existing board member; |
|
|
• |
the prohibition of cumulative voting in the election of directors, which would otherwise allow less than a majority of stockholders to elect director candidates; |
|
|
• |
the requirement for the advance notice of nominations for election to the board of directors or for proposing matters that can be acted upon at a stockholders’ meeting; |
|
|
• |
the ability of our board of directors to alter our bylaws without obtaining stockholder approval; |
|
|
• |
the ability of the board of directors to issue, without stockholder approval, up to 10,000,000 shares of preferred stock with terms set by the board of directors, which rights could be senior to those of our common stock; |
|
|
• |
the elimination of the rights of stockholders to call a special meeting of stockholders and to take action by written consent in lieu of a meeting; |
|
|
• |
the required approval of at least 66 2/3% of the shares entitled to vote at an election of directors to adopt, amend or repeal our bylaws or repeal the provisions of our amended and restated certificate of incorporation regarding the election and removal of directors and the inability of stockholders to take action by written consent in lieu of a meeting; and |
|
|
• |
the required approval of at least a majority of the shares entitled to vote at an election of directors to remove directors without cause. |
In addition, because we are incorporated in Delaware, we are governed by the provisions of Section 203 of the Delaware General Corporation Law. These provisions may prohibit large stockholders, particularly those owning 15% or more of our outstanding voting stock, from merging or combining with us. These provisions in our amended and restated certificate of incorporation and bylaws and under Delaware law could discourage potential takeover attempts, could reduce the price that investors are willing to pay for shares of our common stock in the future and could potentially result in the market price being lower than they would without these provisions.
Item 1B. Unresolved Staff Comments
Not applicable.
Our principal executive office is in a leased facility in San Jose, California, consisting of approximately 224,300 square feet of office space under lease that expires in October 2022, with the option to extend the lease for additional 5 years through October 2027. These facilities accommodate our principal software engineering, sales, marketing, operations and finance and administrative activities. In January 2017, we entered into a lease agreement which expires in July 2027 to lease approximately 116,000 sq. ft. in a building located adjacent to our corporate headquarter in San Jose, California. This new leased facility is currently planned to accommodate our sales, marketing, operations and finance and administrative activities.
Following our acquisition of QLogic in August 2016, we owned real property comprised of land and three buildings with approximately 161,000 square feet in Aliso Viejo, California (the “Aliso Viejo property”) which housed the principal product development, operations, sales, and general and administrative functions for QLogic. In December 2016, we completed the sale of the Aliso Viejo property and entered into a short-term lease-back that expired in November 2017. In November 2016, we signed an agreement to lease approximately 105,600 square feet in a building located in Irvine, California (the “Irvine property”). In March 2017, the Company entered into an amendment to the Irvine property lease agreement to extend the lease term through October 2027. We began occupying the Irvine property in October 2017.
We also currently occupy a space in Marlborough, Massachusetts, consisting of approximately 97,200 square feet under a lease that expires in November 2021. This accommodates a portion of our product design team. Additionally, from our acquisition of QLogic, we lease a building comprising approximately 100,000 square feet in Shakopee, Minnesota, that previously housed product development and operations teams for QLogic’s legacy switch products. Our lease for the Shakopee facility expires in April 2018.
31
We lease an operations, sales and fulfillment facility located in Dublin, Ireland. We also lease facilities in San Jose and Roseville, California; Minnetonka, Minnesota; Hyderabad, Bangalore and Pune, India; Ramat Gan, Israel; and Taipei, Taiwan. These facilities are used primarily for product engineering, development and support services. In addition, we lease office spaces in Shanghai, Shenzhen, Hong Kong and Beijing, China; Taipei and Hsin-Chu, Taiwan; Seoul, Korea; Tokyo, Japan, Singapore; and Madrid, Spain, which accommodate product design teams, as well as other operations and administrative activities. We also maintain sales offices at various locations in the United States, Europe and Asia. We believe that our existing properties are in good condition and suitable for the conduct of our business.
Four putative class actions challenging the Merger have been filed on behalf of Cavium shareholders in the United States District Court for the Northern District of California. On January 2, 2018, a putative class action was filed by Scott Fineberg (Fineberg v. Cavium et al.). On January 8, 2018, a putative class action was filed by Tammy Raul (Raul v. Cavium et al.). Also, on January 8, 2018, a putative class action was filed by Shiva Stein (Stein v. Cavium et al.). Finally, on January 12, 2018, a putative class action was filed by Jordan Rosenblatt (Rosenblatt v. Cavium et al.). All four complaints assert claims for violation of section 14(a), Rule 14a-9 and section 20(a) based on allegations that the Registration Statement on Form S-4 filed by Marvell with the SEC on December 21, 2017 omits material information. Two of the complaints are filed against Cavium and its directors; the other two complaints name those defendants as well as the Marvell entities. All complaints also assert control person claims against the members of Cavium’s board of directors.
A fifth putative class action challenging the Merger was filed on January 29, 2018 in the Superior Court of California, Monterey County, by Paul Berger on behalf of Cavium shareholders (Berger v. Ali et al.). The Berger complaint asserts claims for breach of fiduciary duty against Cavium and its directors based on allegations that the Merger provides shareholders insufficient value and that the proxy statement omits material information. On February 13, 2018, the plaintiff in the Berger action filed a motion for a temporary restraining order, seeking to enjoin the shareholder vote pending a hearing on a yet-to-be-filed preliminary injunction motion. A hearing on the motion for a temporary restraining order is scheduled for March 16, 2018.
Shareholders may file additional lawsuits challenging the Merger, which may name Cavium, Marvell, members of the boards of directors of either party, or others as defendants. No assurance can be made as to the outcome of such lawsuits or the lawsuits described above, including the amount of costs associated with defending these claims or any other liabilities that may be incurred in connection with the litigation of these claims. If plaintiffs are successful in obtaining an injunction prohibiting the parties from completing the Merger on the agreed-upon terms, such an injunction may delay the completion of the Merger in the expected timeframe, or may prevent the Merger from being completed altogether.
We believe the allegations and claims asserted in the complaints in the five putative class actions are without merit, and we intend to vigorously defend our position.
From time to time, we may be involved in other legal proceedings arising in the ordinary course of our business. As of the date of this Annual Report on Form 10-K, we are not currently a party to any other legal proceedings the outcome of which, if determined adversely to us, we believe would individually or in the aggregate have a material adverse effect on our business, operating results, financial condition or cash flows.
Item 4. Mine Safety Disclosure
Not applicable.
32
Item 5. Market for Registrant’s Common Equity, Related Stockholder Matters and Issuer Purchases of Equity Securities
Market Information for Common Stock
Our common stock has been quoted on The NASDAQ Global Select Market under the symbol “CAVM” since our initial public offering on May 2, 2007. Prior to that time, there was no public market for our common stock. As of February 23, 2018, there were approximately 159 holders of record (not including beneficial holders of stock held in street names) of our common stock.
The following table sets forth for the indicated periods the high and low closing sales prices of our common stock as reported by The NASDAQ Global Select Market.
|
|
|
2017 |
|
|
2016 |
|
||||||||||
|
|
|
High |
|
|
Low |
|
|
High |
|
|
Low |
|
||||
|
Fourth quarter |
|
$ |
88.80 |
|
|
$ |
66.01 |
|
|
$ |
65.38 |
|
|
$ |
52.31 |
|
|
Third quarter |
|
|
69.79 |
|
|
|
57.47 |
|
|
|
58.20 |
|
|
|
36.61 |
|
|
Second quarter |
|
|
75.48 |
|
|
|
62.13 |
|
|
|
63.92 |
|
|
|
36.25 |
|
|
First quarter |
|
|
72.34 |
|
|
|
60.93 |
|
|
|
64.35 |
|
|
|
46.69 |
|
Dividend Policy
We have never paid any cash dividends on our common stock. Our board of directors currently intends to retain any future earnings to support operations, repayment of debt and to finance the growth and development of our business and does not intend to pay cash dividends on our common stock for the foreseeable future. Any future determination related to our dividend policy will be made at the discretion of our board.
Stock Performance Graph(1)
The following line graph compares the yearly percentage change in the cumulative total stockholder return on our common stock against the total cumulative return of (i) the NASDAQ Composite Index and (ii) Standard and Poors, or S&P, Semiconductor Select Industry Index for the last five years. This graph assumes the investment of $100,000 on December 31, 2012, in our common stock or indexes and assumes the reinvestment of dividends, if any. The stockholder return shown in the graph below is not necessarily indicative of, nor is it intended to forecast, the potential future performance of our common stock, and we do not make or endorse any predictions as to future stockholder returns.
COMPARISON OF 5 YEAR CUMULATIVE TOTAL RETURN
Among Cavium, Inc., the Nasdaq Composite Index,
and the S&P Semiconductors Index
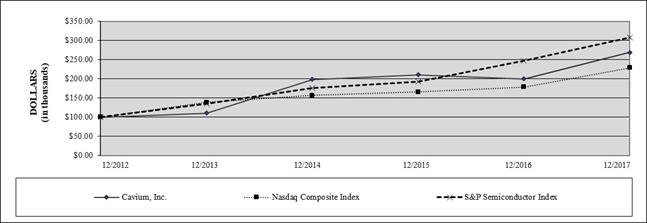
|
|
|
|
|
12/31/2013 |
|
|
12/31/2014 |
|
|
12/31/2015 |
|
|
12/31/2016 |
|
|
12/31/2017 |
|
|||||
|
|
|
|
|
(in thousands) |
|
|||||||||||||||||
|
Cavium, Inc. |
|
|
|
$ |
110.57 |
|
|
$ |
198.08 |
|
|
$ |
210.54 |
|
|
$ |
200.06 |
|
|
$ |
268.60 |
|
|
Nasdaq Composite Index |
|
|
|
|
138.32 |
|
|
|
156.85 |
|
|
|
165.84 |
|
|
|
178.28 |
|
|
|
228.63 |
|
|
S&P Semiconductor Index |
|
|
|
|
135.37 |
|
|
|
176.35 |
|
|
|
192.99 |
|
|
|
247.59 |
|
|
|
308.24 |
|
33
|
(1) |
This Section is not “soliciting material,” is not deemed “filed” with the SEC and is not to be incorporated by reference in any filing of Cavium under the Securities Act of 1933, as amended, or the Securities Exchange Act of 1934 Act, as amended, whether made before or after the date hereof and irrespective of any general incorporation language in any such filing. |
Item 6. Selected Financial Data
The following selected consolidated financial data should be read in conjunction with our audited consolidated financial statements and related notes thereto and with “Management’s Discussion and Analysis of Financial Condition and Results of Operations” section and other financial information included elsewhere in this Annual Report on Form 10-K. The consolidated statements of operations data for each of the years ended December 31, 2017, 2016 and 2015, and the summary consolidated balance sheet data as of December 31, 2017 and 2016, are derived from our audited consolidated financial statements included elsewhere in this Annual Report on Form 10-K. The consolidated statements of operations data for the years ended December 31, 2014 and 2013, and the summary consolidated balance sheet data as of December 31, 2015, 2014 and 2013, are derived from audited consolidated financial statements which are not included in this Annual Report on Form 10-K. Our historical results are not necessarily indicative of the results to be expected in any future period.
The selected consolidated financial data presents financial information in the relevant periods of our business combinations and divestitures. See Note 2 of Notes to Consolidated Financial Statements in Item 8 of this Annual Report, which is incorporated herein by reference for further discussions of our recent business combinations.
|
|
|
Year Ended December 31, |
|
|||||||||||||||||
|
|
|
2017 |
|
|
2016 |
|
|
2015 |
|
|
2014 |
|
|
2013 |
|
|||||
|
|
|
(in thousands, except per share data) |
|
|||||||||||||||||
|
Consolidated Statements of Operations Data: |
|
|
|
|
|
|
|
|
|
|
|
|
|
|
|
|
|
|
|
|
|
Net revenue |
|
$ |
984,018 |
|
|
$ |
603,314 |
|
|
$ |
412,744 |
|
|
$ |
372,978 |
|
|
$ |
303,993 |
|
|
|
|
|
|
|
|
|
|
|
|
|
|
|
|
|
|
|
|
|
|
|
|
Gross profit |
|
|
499,584 |
|
|
|
285,314 |
|
|
|
268,977 |
|
|
|
234,619 |
|
|
|
189,314 |
|
|
Total operating expenses |
|
|
556,276 |
|
|
|
418,867 |
|
|
|
282,704 |
|
|
|
242,094 |
|
|
|
198,684 |
|
|
Loss from operations |
|
|
(56,692 |
) |
|
|
(133,553 |
) |
|
|
(13,727 |
) |
|
|
(7,475 |
) |
|
|
(9,370 |
) |
|
Total other expense, net |
|
|
(28,927 |
) |
|
|
(12,659 |
) |
|
|
(1,651 |
) |
|
|
(16,707 |
) |
|
|
(2,381 |
) |
|
Loss before income taxes |
|
|
(85,619 |
) |
|
|
(146,212 |
) |
|
|
(15,378 |
) |
|
|
(24,182 |
) |
|
|
(11,751 |
) |
|
Provision for (benefit from) income taxes |
|
|
(16,760 |
) |
|
|
997 |
|
|
|
1,682 |
|
|
|
1,633 |
|
|
|
1,937 |
|
|
Net loss |
|
$ |
(68,859 |
) |
|
$ |
(147,209 |
) |
|
$ |
(17,060 |
) |
|
$ |
(25,815 |
) |
|
$ |
(13,688 |
) |
|
Net loss attributable to non-controlling interest |
|
|
- |
|
|
|
- |
|
|
|
- |
|
|
|
(10,520 |
) |
|
|
(10,723 |
) |
|
Net loss attributable to the Company |
|
$ |
(68,859 |
) |
|
$ |
(147,209 |
) |
|
$ |
(17,060 |
) |
|
$ |
(15,295 |
) |
|
$ |
(2,965 |
) |
|
|
|
|
|
|
|
|
|
|
|
|
|
|
|
|
|
|
|
|
|
|
|
Earnings per share attributable to the Company: |
|
|
|
|
|
|
|
|
|
|
|
|
|
|
|
|
|
|
|
|
|
Net loss per common share, basic and diluted |
|
$ |
(1.01 |
) |
|
$ |
(2.42 |
) |
|
$ |
(0.31 |
) |
|
$ |
(0.29 |
) |
|
$ |
(0.06 |
) |
|
Shares used in computing basic and diluted net loss per common share |
|
|
68,394 |
|
|
|
60,883 |
|
|
|
55,589 |
|
|
|
53,451 |
|
|
|
51,596 |
|
|
|
|
As of December 31, |
|
|||||||||||||||||
|
|
|
2017 |
|
|
2016 |
|
|
2015 |
|
|
2014 |
|
|
2013 |
|
|||||
|
|
|
(in thousands) |
|
|||||||||||||||||
|
Consolidated Balance Sheet Data: |
|
|
|
|
|
|
|
|
|
|
|
|
|
|
|
|
|
|
|
|
|
Cash and cash equivalents |
|
$ |
140,498 |
|
|
$ |
221,439 |
|
|
$ |
134,646 |
|
|
$ |
131,718 |
|
|
$ |
127,763 |
|
|
Working capital |
|
|
313,097 |
|
|
|
320,883 |
|
|
|
196,772 |
|
|
|
177,453 |
|
|
|
151,071 |
|
|
Total assets |
|
|
1,589,325 |
|
|
|
1,650,531 |
|
|
|
433,993 |
|
|
|
408,860 |
|
|
|
367,985 |
|
|
|
|
|
|
|
|
|
|
|
|
|
|
|
|
|
|
|
|
|
|
|
|
Capital lease and technology license obligations |
|
|
46,805 |
|
|
|
53,413 |
|
|
|
30,466 |
|
|
|
45,896 |
|
|
|
33,395 |
|
|
Current and long-term debt |
|
|
596,233 |
|
|
|
679,279 |
|
|
|
- |
|
|
|
- |
|
|
|
13,512 |
|
|
Other non-current liabilities |
|
|
28,634 |
|
|
|
37,160 |
|
|
|
6,379 |
|
|
|
5,767 |
|
|
|
4,275 |
|
|
Common stock and additional paid-in capital |
|
|
1,183,888 |
|
|
|
1,079,110 |
|
|
|
543,312 |
|
|
|
489,035 |
|
|
|
443,641 |
|
|
Total stockholders’ equity |
|
|
778,346 |
|
|
|
741,844 |
|
|
|
353,900 |
|
|
|
316,683 |
|
|
|
286,584 |
|
34
Item 7. Management’s Discussion and Analysis of Financial Condition and Results of Operations
The following discussion should be read in conjunction with the Consolidated Financial Statements and the related notes that appear elsewhere in the document.
The information in this Item 7, as well as in other sections of this Annual Report on Form 10-K, contains forward-looking statements that are subject to risks and uncertainties. In some cases, you can identify forward-looking statements by terms such as “may,” “will,” “should,” “could,” “would,” “estimate,” “project,” “predict,” “potential,” “continue,” “strategy,” “believe,” “anticipate,” “plan,” “expect,” “intend” and similar expressions intended to identify forward-looking statements. See the section entitled “Forward Looking Statements” at the beginning of this Form 10-K for information you should consider when reading these forward-looking statements.
OCTEON®, OCTEON Fusion-M®, OCTEON XL®, OCTEON TX®, LiquidIO®, LiquidSecurity ®, NITROX®, ThunderX®, ThunderX2® Xpliant®, XPA®, QLogic® and FastLinQ® are trademarks or registered trademarks of Cavium, Inc.
Overview
We are a provider of highly integrated semiconductor processors that enable intelligent processing for wired and wireless infrastructure and cloud for networking, communications, storage and security applications. We sell our products to networking original equipment manufacturers, or OEMs, that sell into the enterprise, datacenter, service provider, broadband and consumer markets. We also sell our products through channels, original design manufacturers, or ODMs, as well as direct sales to mega datacenters. Several of our products are systems on a chip, or SoCs, which incorporate single or multiple processor cores, a highly integrated architecture and customizable software that is based on a broad range of standard operating systems. We focus our resources on the design, sales and marketing of our products, and outsource the manufacturing of our products. Our server data and storage connectivity product portfolio was expanded by our acquisition of QLogic. These products facilitate the rapid transfer of data and enable efficient resource sharing between servers, networks and storage. We also have a broad portfolio of multi-core processors to deliver integrated and optimized hardware and software embedded solutions to the market. Our software and service revenue is primarily from the sale of software subscriptions of embedded Linux operating system, related development tools, application software stacks, support and professional services.
35
The following summarizes our product timeline introduction:
|
Timeline |
|
History |
|
2000 through 2003 |
• |
We were incorporated and commenced product development. |
|
|
• |
We began shipping NITROX security processors commercially. |
|
2004 |
• |
We introduced and commenced commercial shipments of NITROX Soho. |
|
2006 |
• |
We commenced our first commercial shipments of OCTEON multi-core processors. |
|
2007 |
• |
We introduced our new line of OCTEON based storage services processors designed to address the specific needs in the storage market, as well as other new products in the OCTEON and NITROX families. |
|
2008 |
• |
We expanded our OCTEON and NITROX product families with new products including wireless services processors to address the needs for wireless infrastructure equipment. |
|
2009 |
• |
We announced the OCTEON II Internet Application Processor, or IAP, family multi-core MIPS64 processors. |
|
|
• |
We acquired MontaVista Software, Inc. in December 2009. This acquisition complemented our broad portfolio of multi-core processors to deliver integrated and optimized embedded solutions to the market. |
|
2010 |
• |
We announced the next generation NITROX III, a processor family with 16 to 64-cores that delivers security and compression processors for application delivery, cloud computing and wide area network optimization. |
|
2011 |
• |
We introduced NEURON, a new search processor product family that targets a wide range of high-performance, L2-L4 network search applications in enterprise and service provider infrastructure equipment. |
|
|
• |
We also introduced another new product family, the OCTEON Fusion, a single chip SoCs with up to 6x MIPS64 cores and up to 8x LTE/3G baseband DSP cores which enable macro base station class features for small cell base stations. |
|
2012 |
• |
We introduced OCTEON III, Cavium’s 48-core 2.5GHz multi-core processor family that can deliver up to 100Gbps of application processing, up to 120GHz of 64-bit compute processing per chip and can be connected in multi-chip configurations. |
|
|
• |
We announced Project Thunder, the development of a new family of 64-bit ARMv8 scalable multi-core processors for cloud and datacenter applications. |
|
2013 |
• |
We introduced the LiquidIO family of 10 Gigabit Server Adapters which provide high-performance, programmable adapter platform to enable software defined networks for cloud service providers and datacenters. |
|
2014 |
• |
We introduced the ThunderX family of 64-bit ARMv8 processors incorporated into a highly differentiated SoC architecture optimized for cloud and datacenter applications. |
|
2015 |
• |
We introduced OCTEON Fusion-M, a family of single chip solutions for next generation macrocell base stations and smart radio heads. |
|
|
• |
We introduced LiquidSecurity, a high-performance hardware based transaction security solution for cloud datacenters, enterprise, government organizations and ecommerce applications. |
|
|
• |
We introduced Nitrox V, a processor family with up to 288 cores for security in the enterprise and virtualized cloud datacenters. |
|
|
• |
We acquired Xpliant, Inc. which included the Xpliant high-performance, high density switch silicon that targets a broad range of switching applications for the datacenter, cloud, service provider and enterprise markets. |
|
2016 |
• |
We introduced OCTEON TX, a 64-bit ARM-based SOC for a broad spectrum of open, services-centric applications in enterprise and service provider infrastructure. |
|
|
• |
We introduced ThunderX2, our second generation workload optimized ARM server SoC. |
|
|
• |
We acquired QLogic Corporation in August 2016, which included connectivity products including adapters and ASICs that facilitate the rapid transfer of data and enable efficient resource sharing between servers, networks and storage. |
|
2017 |
• |
We introduced the second generation FastLinQ series of optimized Ethernet network interface controllers and adapters. |
36
The following summarizes our acquisitions in the last five years:
|
|
• |
We completed the acquisition of QLogic in August 2016. The addition of QLogic’s product portfolio to ours enables us to offer a complete end-to-end offering to our customers in enterprise, cloud, datacenter, storage, telco and networking markets. |
|
|
• |
We completed the acquisition of Xpliant in April 2015. This acquisition provides high-performance, high density switch silicon under development and will target a broad range of switching applications for the datacenter, cloud service provider and enterprise markets. |
Since inception, we have invested heavily in new product development and our net revenue has grown from $7.4 million in 2004 to $984.0 million in 2017. We expect sales of our products for use in the enterprise, datacenter and service provider markets to continue to represent a significant portion of our revenue in the foreseeable future, and also expect some growth in the broadband market.
We primarily sell our products to OEMs, either directly or through their contract manufacturers. Contract manufacturers purchase our products only when an OEM incorporates our product into the OEM’s product, not as commercial off-the-shelf products. Our customers’ products are complex and require significant time to define, design and ramp to volume production. Accordingly, our sales cycle is long. This cycle begins with our technical marketing, sales and field application engineers engaging with our customers’ system designers and management, which is typically a multi-month process. If we are successful, a customer will decide to incorporate our product in its product, which we refer to as a design win. Because the sales cycles for our products are long, we incur expenses to develop and sell our products, regardless of whether we achieve the design win and well in advance of generating revenue, if any, from those expenditures. We do not have long-term purchase commitments from any of our customers, as sales of our products are generally made under individual purchase orders. We have experienced revenue growth due to an increase in the number of our products, an expansion of our customer base, an increase in the number of average design wins within any one customer and an increase in the average revenue per design win. We also earn revenue from the sale of software subscriptions of embedded Linux operating system, related development tools, support and professional services. The net revenue for our software and services operations is primarily derived from the sale of time-based software licenses, software maintenance and support, and from professional services arrangements and training.
Key Business Metrics
Design Wins. We closely monitor design wins by customer and end market. We consider design wins to be a key ingredient in our future success, although the revenue generated by each design win can vary significantly. Our long-term sales expectations are based on internal forecasts from specific customer design wins based upon the expected time to market for end customer products deploying our products and associated revenue potential.
Pricing and Margins. Pricing and margins depend on the products and the features of the products we provide to our customers. In general, products with more complex configurations and higher performance tend to be priced higher and have higher gross margins. These configurations tend to be used in high-performance applications that are focused on the enterprise, datacenter, and service provider markets. We tend to experience price decreases over the life cycle of our products, which can vary by market and application.
Sales Volume. A typical design win can generate a wide range of sales volumes for our products, depending on the end market demand for our customers’ products. This can depend on several factors, including the reputation, market penetration, the size of the end market that the product addresses, and the marketing and sales effectiveness of our customer. In general, our customers with greater market penetration and better branding tend to develop products that generate larger volumes over the product life cycle. In addition, some markets generate large volumes if the end market product is adopted by the mass market.
Customer Product Life Cycle. We typically commence commercial shipments from six months to three years following a design win. Once our product is in production, revenue from a particular customer may continue for several years. We estimate our customers’ product life cycles based on the customer, type of product and end market. In general, products that go into the enterprise network and datacenter take longer to reach volume production but tend to have longer lives. Products for other markets, such as broadband and consumer, tend to ramp relatively quickly, but generally have shorter life cycles. We estimate these life cycles based on our management’s experience with network equipment providers and datacenters as well as the semiconductor market as a whole.
37
Critical Accounting Policies and Estimates
Our management’s discussion and analysis of our financial condition and results of operations is based on our consolidated financial statements, which have been prepared in accordance with United States generally accepted accounting principles, or GAAP. These accounting principles require us to make certain estimates and judgments that can affect the reported amounts of assets and liabilities as of the dates of the consolidated financial statements, the disclosure of contingencies as of the dates of the consolidated financial statements, and the reported amounts of revenue and expenses during the periods presented. We base our estimates on historical experience and on various other assumptions that we believe to be reasonable under the circumstances, the results of which form the basis for making judgments about the carrying values of assets and liabilities. If actual results or events differ materially from those contemplated by us in making these estimates, our reported financial condition and results of operations for future periods could be materially affected. See “Risk Factors” for certain matters that may affect our future financial condition or results of operations.
An accounting policy is deemed to be critical if it requires an accounting estimate to be made based on assumptions about matters that are uncertain at the time the estimate is made, if different estimates reasonably could have been used, or if the changes in estimate that are reasonably likely to occur could materially impact the financial statements. Our management has discussed the development, selection and disclosure of these estimates with the Audit Committee of our Board of Directors. See Note 1 of Notes to Consolidated Financial Statements in Item 8 of this Annual Report, which is incorporated herein by reference, for a more comprehensive discussion of our significant accounting policies. We believe the following critical accounting policies reflect significant judgments and estimates used in the preparation of our consolidated financial statements:
|
|
• |
revenue recognition; |
|
|
• |
stock-based compensation; |
|
|
• |
inventory valuation; |
|
|
• |
accounting for income taxes; |
|
|
• |
mask costs; |
|
|
• |
business combinations; and |
|
|
• |
goodwill and intangible assets. |
Revenue Recognition
We primarily derive our revenue from sales of semiconductor products to OEMs, or through an OEM’s contract manufacturers or distributors. To a lesser extent, we also derive revenue from licensing software and related maintenance and support and from professional service arrangements.
We recognizes revenue when (i) persuasive evidence of a binding arrangement exists; (ii) delivery has occurred or service has been rendered; (iii) the price is deemed fixed or determinable and free of contingencies and significant uncertainties; and (iv) collectibility is reasonably assured. We record a reduction in revenue for provision for estimated sales returns in the same period the related revenues are recorded. These estimates are based on historical patterns of return, analysis of credit memo data and other known factors at the time. We record reductions of revenue for pricing adjustments, such as competitive pricing programs and rebates, in the same period that the related revenue is recorded. We started our rebate programs with certain customers in 2016. In addition, we assumed and continued the existing QLogic rebate programs following the closing of the QLogic acquisition. We accrue the full potential rebates at the time of sale and do not apply a breakage factor. The reversal of the accrual of unclaimed rebate will be made if the specific rebate program contractually ends and when we believe that the unclaimed rebates are no longer subject to payment. The reversal of unclaimed rebates may have a positive impact on our net revenue and net income in subsequent periods when the accrued rebates are reversed. Although rebates and accrued rebates balances included in our consolidated financial statements for the periods presented were not material, it will vary in future periods based upon the level of overall sales to customers that participate in our rebate programs. Establishing accruals for rebates requires the use of judgment and estimates that impact the amount and timing of revenue recognition.
Revenue is recognized upon shipment to distributors with limited rights of returns and price protection if we conclude it can reasonably estimate the credit for returns and price adjustments issuable. We record an estimated allowance, at the time of shipment, based on our historical patterns of returns and pricing credit of sales recognized upon shipment. Credits issued to distributors or other customers have historically not been material. The inventory at these distributors at the end of the period may fluctuate from time to time mainly due to the OEM production ramps and/or new customer demands.
38
Software arrangements typically include time-based licenses for 12 months with related support. We do not sell support separately, therefore, revenue from software arrangements is recognized ratably over the support period. The software arrangement may also include professional services, and these services may be purchased separately. Professional services engagements are billed on either a fixed-fee or time-and-materials basis. For fixed-fee arrangements, professional services revenue is recognized under the proportional performance method, with the associated costs included in cost of revenue. We estimate the proportional performance of the arrangements based on an analysis of progress toward completion. We periodically evaluate the actual status of each project to ensure that the estimates to complete each contract remain accurate, and a loss is recognized when the total estimated project cost exceeds project revenue. If the amount billed exceeds the amount of revenue recognized, the excess amount is recorded as deferred revenue. Revenue recognized in any period is dependent on progress toward completion of projects in progress. To the extent we are unable to estimate the proportional performance, revenue is recognized on a completed performance basis. Revenue for time-and-materials engagements is recognized as the effort is incurred.
For sales that include multiple deliverables, we allocate revenue based on the relative selling price of the individual components. When more than one element, such as hardware and services, are contained in a single arrangement, we allocate revenue between the elements based on each element’s relative selling price, provided that each element meets the criteria for treatment as a separate unit of accounting.
Stock-Based Compensation
We apply the fair value recognition provisions of stock-based compensation. Stock-based compensation expense is measured at the grant date based on the fair value of the award and is recognized as compensation expense net of an estimated forfeiture rate over the vesting period. We use the Black-Scholes option valuation model to determine the fair value of stock options, which require various subjective assumptions, such as expected volatility, expected term and the risk-free interest rates. Our stock price volatility assumption is estimated using our historical stock price volatility. For options granted beginning in 2016, we used historical exercise patterns to estimate the expected life. Prior to 2016, we used the simplified method as permitted by the guidance on stock-based compensation to estimate the expected life since we had no sufficient history of weighted average period from the date of grant to exercise, cancellation, or expiration. The risk free interest rate is based on the implied yield currently available on United States Treasury securities with an equivalent remaining term. The assumptions used in calculating the fair value of stock-based awards represent management’s best estimates and judgment.
For all restricted stock unit, or RSU, grants other than RSU grants with a market condition, the fair value of the RSU grant is based on the market price of our common stock on the date of grant. For performance-based RSU grants, we evaluate the probability of achieving the milestones for each of the outstanding performance-based RSU grants at each reporting period and update the related stock-based compensation expense. The fair value of market-based RSUs is determined using the Monte Carlo simulation method which takes into account multiple input variables that determine the probability of satisfying the market conditions stipulated in the award. This method requires the input of assumptions, including the expected volatility of our common stock, and a risk-free interest rate, similar to assumptions used in determining the fair value of the stock option grants discussed above.
The grant date fair value of the stock options and RSUs are recorded based upon the vesting method over the service period. Following the adoption of the updated guidance on stock-based compensation effective January 1, 2017, we elected to account for forfeitures when they occur, on a modified retrospective basis. The adoption of this updated guidance did not have a material impact on our consolidated financial statements.
Inventory Valuation
Inventories are stated at the lower of cost (determined using the first-in, first-out method), or market value (estimated net realizable value). We write down excess and obsolete inventory based on its age and forecasted demand, generally over a 12 month period, though for some long lived products we forecast using a longer time period which could extend 24 to 30 months. Demand is impacted by market and economic conditions, technology advances, new product introductions and changes in strategic direction which requires management to make estimates that may include uncertain elements. In addition, our industry is characterized by rapid technological change, frequent new product development and rapid product obsolescence that could result in an increase in the amount of obsolete inventory quantities on hand. Additionally, our estimates of future product demand may prove to be inaccurate, in which case we may have understated or overstated the provision required for excess and obsolete inventory. In the future, if our inventory is determined to be overvalued, we would be required to recognize such costs in our cost of goods sold at the time of such determination. Likewise, if our inventory is determined to be undervalued, we may have over-reported our cost of goods sold in previous periods and would be required to recognize additional gross margin at the time the related inventory is sold. Therefore, although we make every effort to ensure the accuracy of our forecasts of future product demand, any significant unanticipated changes in demand or technological developments could have a significant impact on the value of our inventory and our results of operations.
Inventories acquired through business combinations are recorded at their acquisition date fair value, which is generally estimated selling price less the costs of disposal and a normal profit allowance.
39
Accounting for Income Taxes
We account for income taxes under the asset and liability approach. Under this method, deferred tax assets, including those related to tax loss carryforwards and credits, and liabilities are determined based on the differences between the financial statement and tax bases of assets and liabilities using enacted tax rates in effect for the year in which the differences are expected to reverse. We recognize uncertain tax positions when it meets a more-likely-than-not threshold. We recognize potential accrued interest and penalties related to unrecognized tax benefits as income tax expense.
A valuation allowance is recorded to reduce deferred tax assets when management cannot conclude that it is more-likely-than-not that the net deferred tax asset will be recovered. The valuation allowance is determined by assessing both positive and negative evidence to determine whether it is more-likely-than-not that deferred tax assets are recoverable; such assessment is required on a jurisdiction-by-jurisdiction basis. Significant judgment is required in determining whether the valuation allowance should be recorded against deferred tax assets. In assessing the need for valuation allowance, we consider all available evidence including past operating results and estimates of future taxable income. Since 2012, we have assessed that it is more-likely-than-not that we would not realize our federal and state deferred tax assets based on the absence of sufficient positive objective evidence to realize such deferred tax assets. Accordingly, we have maintained a full valuation allowance on our federal and state deferred tax assets.
We periodically evaluate the realizability of our net deferred tax assets based on all available evidence, both positive and negative. The realization of net deferred tax assets is dependent on our ability to generate sufficient future taxable income during periods prior to the expiration of tax attributes to fully utilize these assets. We weighed both positive and negative evidence and determined that there is a continued need for a valuation allowance. As such, we have not changed our judgment regarding the need for a full valuation allowance on our federal and state deferred tax assets as of December 31, 2017.
Mask Costs
We incur costs for the fabrication of masks used by our contract manufacturers to manufacture wafers that incorporate our products. We capitalize the costs of fabrication masks that are reasonably expected to be used during production manufacturing. These amounts are included within property and equipment and are depreciated over a period of 12 to 24 months to cost of revenue. If we do not reasonably expect to use the fabrication mask during production manufacturing, we expense the related mask costs to research and development in the period in which such determination is made.
Business Combinations
We account for business combinations using the purchase method of accounting. In accordance with the guidance provided under business combinations, we allocate the purchase price of business combinations to the tangible assets, liabilities and intangible assets acquired, including in-process research and development, or IPR&D, based on their estimated fair values. We record the excess purchase price over those fair values as goodwill. Our valuation of acquired assets and assumed liabilities requires significant estimates, especially with respect to intangible assets. We determine the recognition of intangible assets based on the following criteria: (i) the intangible asset arises from contractual or other rights; or (ii) the intangible is separable or divisible from the acquired entity and capable of being sold, transferred, licensed, returned or exchanged. We estimate the fair value based upon assumptions we believe to be reasonable, but which are inherently uncertain and unpredictable and, as a result, actual results may differ from estimates. Estimates associated with the accounting for acquisitions may change as additional information becomes available regarding the assets acquired and liabilities assumed. We expense acquisition-related costs, including advisory, legal, accounting, valuation and other costs, in the periods in which the costs are incurred. The results of operations of acquired businesses are included in the consolidated financial statements from the acquisition date.
Goodwill and Intangible Assets
Goodwill is measured as the excess of the cost of an acquisition over the sum of the amounts assigned to tangible and identifiable intangible assets and liabilities assumed. We evaluate goodwill for impairment at our single reporting unit level at least on an annual basis in the fourth quarter of the calendar year or whenever events and changes in circumstances suggest that the carrying amount may not be recoverable from its estimated future cash flows. We perform qualitative assessment to determine if any events have occurred or circumstances exist that would indicate that it is more-likely-than-not that a goodwill impairment exists. The qualitative factors include, but are not limited to: (a) macroeconomic conditions; (b) industry and market considerations; (c) overall financial performance; (d) a significant adverse change in legal factors or in the business climate; (e) an adverse action or assessment by a regulator; (f) relevant entity-specific events including changes in management, strategy or customers; (g) a more-likely-than-not expectation of sale or disposal of a reporting unit or a significant portion thereof; or (h) sustained decrease in share price. If any indicators exist based on the qualitative analysis that it is more-likely-than-not that a goodwill impairment exists, the quantitative test is required. Otherwise, no further testing is required.
40
IPR&D acquired in an asset acquisition is capitalized only if it has an alternative future use. IPR&D recorded as an asset acquired through business combinations is not amortized but instead is tested annually for impairment, or more frequently when events or changes in circumstances indicate that the asset might be impaired. We initially assess qualitative factors to determine whether it is more likely than not that the fair value of IPR&D is less than its carrying amount, and if so, we conduct a quantitative impairment test. The quantitative impairment test consists of a comparison of the fair value of IPR&D to its carrying amount. If the carrying value exceeds its fair value, an impairment loss is recognized in an amount equal to the difference. When an IPR&D project is complete, the related intangible asset becomes subject to amortization and impairment analysis as a long-lived asset.
We also perform an impairment review of finite-lived intangible assets whenever events or changes in business circumstances indicate the carrying amount of the assets (or asset group) may not be fully recoverable. Whenever events or changes in circumstances suggest that the carrying amount of the finite-lived intangible assets may not be recoverable, we estimate the future cash flows expected to be generated by the asset (or asset group) from its use or eventual disposition. If the sum of the expected future undiscounted cash flows is less than the carrying amount of the assets (or asset group), we recognize an impairment loss based on the excess of the carrying amount over the fair value of the assets. Significant management judgment is required in the grouping of assets and forecasts of future operating results that are used in the impairment analysis. If our actual results, or the plans and estimates used in future impairment analyses are lower than the original estimates used to assess the recoverability of these assets, we could incur material impairment charges.
We performed a qualitative impairment test as of the first day of the fourth quarter of the calendar year and determined that there was no impairment on our goodwill and intangible assets as of the periods presented.
Results of Operations
Our net revenue, cost of revenue, gross profit and gross margin for the periods presented were:
|
|
|
Year Ended December 31, |
|
|
FY2017 compared to FY2016 |
|
|
FY2016 compared to FY2015 |
|
|||||||||||||||||||
|
|
|
2017 |
|
|
2016 |
|
|
2015 |
|
|
Change |
|
|
% |
|
|
Change |
|
|
% |
|
|||||||
|
|
|
(in thousands) |
|
|
|
|
|
|
|
|
|
|
|
|
|
|
|
|
|
|||||||||
|
Net revenue |
|
$ |
984,018 |
|
|
$ |
603,314 |
|
|
$ |
412,744 |
|
|
$ |
380,704 |
|
|
|
63.1 |
% |
|
$ |
190,570 |
|
|
|
46.2 |
% |
|
Cost of revenue |
|
|
484,434 |
|
|
|
318,000 |
|
|
|
143,767 |
|
|
|
166,434 |
|
|
|
52.3 |
% |
|
|
174,233 |
|
|
|
121.2 |
% |
|
Gross Profit |
|
$ |
499,584 |
|
|
$ |
285,314 |
|
|
$ |
268,977 |
|
|
$ |
214,270 |
|
|
|
75.1 |
% |
|
$ |
16,337 |
|
|
|
6.1 |
% |
|
Gross Margin |
|
|
50.8 |
% |
|
|
47.3 |
% |
|
|
65.2 |
% |
|
|
3.5 |
% |
|
|
|
|
|
|
(17.9 |
)% |
|
|
|
|
Net Revenue. Our net revenue consists primarily of sales of our semiconductor products to providers of networking equipment and their contract manufacturers and distributors. Initial sales of our products for a new design are usually made directly to providers of networking equipment as they design and develop their product. Once their design enters production, they often outsource their manufacturing to contract manufacturers that purchase our products directly from us or from our distributors. We price our products based on market and competitive conditions and periodically reduce the price of our products, as market and competitive conditions change, and as manufacturing costs are reduced. We do not experience different margins on direct sales to providers of networking equipment and indirect sales through contract manufacturers because in all cases we negotiate product pricing directly with the providers of networking equipment. To date, substantially all of our revenue has been denominated in United States dollars.
41
Three customers together accounted for 36.2% of our net revenue in 2017, two customers together accounted for 25.1% of our net revenue in 2016 and three customers together accounted for 42.9% of our net revenue in 2015. No other customer accounted for more than 10% of our net revenue in 2017, 2016 and 2015.
A portion of our products are sold to customers who experience seasonality and uneven sales patterns in their business. Further, some of our customers may purchase products strategically in advance of demand to take advantage of favorable pricing or mitigate the risk around product availability.
We use distributors to support some of our sales logistics including importation and credit management. While we have purchase agreements with our distributors, the distributors do not have long-term contracts with any of the equipment providers. Our distributor agreements limit the distributor’s ability to return product up to a portion of purchases in the preceding quarter. Given our experience, along with our distributors’ limited contractual return rights, we believe we can reasonably estimate expected returns from our existing distributors. Accordingly, we recognize sales through existing distributors at the time of shipment, reduced by our estimate of expected returns. The inventory at these distributors at the end of the period may fluctuate from time to time mainly due to the OEM production ramps or new customer demands. Total net revenue through distributors accounted for 21.5%, 29.2% and 29.6% in the years ended December 31, 2017, 2016 and 2015, respectively.
Our net revenue by markets for the periods presented was as follows:
|
|
Year Ended December 31, |
|
|||||||||
|
|
2017 |
|
|
2016 |
|
|
2015 |
|
|||
|
|
(in thousands) |
|
|||||||||
|
Enterprise, service provider, broadband and consumer markets |
$ |
762,967 |
|
|
$ |
461,299 |
|
|
$ |
318,006 |
|
|
Datacenter market |
|
221,051 |
|
|
|
142,015 |
|
|
|
94,738 |
|
|
|
$ |
984,018 |
|
|
$ |
603,314 |
|
|
$ |
412,744 |
|
Revenues by geographic area are presented based upon the ship-to location of the original equipment manufacturers, the contract manufacturers or the distributors who purchased our products. For sales to the distributors, their geographic location may be different from the geographic locations of the ultimate end customers. Net revenues by geographic area are as follows:
|
|
Year Ended December 31, |
|
|||||||||
|
|
2017 |
|
|
2016 |
|
|
2015 |
|
|||
|
|
(in thousands) |
|
|||||||||
|
United States |
$ |
277,100 |
|
|
$ |
196,727 |
|
|
$ |
128,431 |
|
|
China |
|
228,833 |
|
|
|
139,957 |
|
|
|
100,980 |
|
|
Korea |
|
93,243 |
|
|
|
54,367 |
|
|
|
28,578 |
|
|
Finland |
|
62,019 |
|
|
|
38,768 |
|
|
|
38,283 |
|
|
Taiwan |
|
55,022 |
|
|
|
39,839 |
|
|
|
34,533 |
|
|
Other countries |
|
267,801 |
|
|
|
133,656 |
|
|
|
81,939 |
|
|
Total |
$ |
984,018 |
|
|
$ |
603,314 |
|
|
$ |
412,744 |
|
Cost of Revenue and Gross Margin. We outsource wafer fabrication, assembly and test functions of our products. A significant portion of our cost of revenue consists of payments for the purchase of wafers and for assembly and test services, amortization related to capitalized mask costs and amortization of acquired intangibles. To a lesser extent, cost of revenue includes expenses relating to our internal operations that manage our contractors, stock-based compensation, the cost of shipping and logistics, royalties, inventory valuation expenses for excess and obsolete inventories, warranty costs and changes in product cost due to changes in sort, assembly and test yields. In general, our cost of revenue associated with a particular product declines over time as a result of yield improvements, primarily associated with design and test enhancements.
42
We use third-party foundries and assembly and test contractors, which are primarily located in the Asia-Pacific region, to manufacture, assemble and test our semiconductor products. We currently outsource a substantial percentage of our integrated circuit wafer manufacturing to Global Foundries, Samsung Electronics and TSMC. We also outsource the sort, assembly, final testing and other processing of our product to third-party contractors, primarily ASE Electronics in Taiwan, Malaysia and Singapore, as well as ISE Labs, Inc., in the United States. We negotiate wafer fabrication on a purchase order basis. There are no long-term agreements with any of these foundries, assembly, test or processing third-party contractors. For our board products, we use third-party contract manufacturers, primarily Venture Corporation Ltd. and Gigabyte Technology Co., Ltd., for material procurement, assembly, test and inspection in a turnkey model, prior to shipment to our customers. These contract manufacturers are primarily located outside the United States. To the extent that we rely on these contract manufacturers, we are not able to directly control product delivery schedules and quality assurance. A significant disruption in the operations of one or more of these third-party contractors would impact the production of our products for a substantial period of time, which could have a material adverse effect on our business, financial condition and results of operations.
Cost of revenue includes amortized cost of certain identifiable intangible assets from our business acquisitions to the extent those identifiable intangible assets are directly associated with cost of revenue. The total amortization expense from identifiable intangible assets acquired from business acquisitions included in the cost of revenue was $110.7 million, $40.3 million and $1.3 million in 2017, 2016 and 2015, respectively. The increased total amortization expense in the cost of revenue in 2017 compared to 2016 and 2015 was mainly due to the identifiable intangible assets acquired from the QLogic acquisition. Cost of revenue also includes manufacturing profit in acquired inventories of $2.8 million and $19.9 million in 2017 and 2016, respectively. The manufacturing profit in acquired inventories is the difference between the cost and the relative fair value of the inventories acquired from QLogic at the acquisition date, which are being recognized to cost of revenue as the related inventories are sold over time. In 2016, we recorded additional cost of revenue of $37.1 million associated with the exercise of manufacturing rights and write-down of certain fixed assets. In 2017, we recorded additional cost of revenue of $21.4 million associated with the write-down of assets due to rationalization of certain product lines.
We also incur costs for the fabrication of masks used by our contract manufacturers to manufacture wafers that incorporate our products. In 2017, 2016 and 2015, we capitalized $11.1 million, $10.1 million and $8.9 million, respectively, of mask costs. As our product processes continue to mature and as we develop more history and experience, we expect to capitalize most or all of our mask costs in the future. We amortize the cost of fabrication masks that we reasonably expect to use for production manufacturing over a 12 to 24 month period. Total amortized expenses for the masks included in cost of revenue were $11.5 million, $6.7 million and $4.9 million in 2017, 2016 and 2015, respectively. The unamortized balance of capitalized mask costs as of December 31, 2017 and 2016 was $12.6 million and $12.9 million, respectively.
Our gross margin has been and will continue to be affected by a variety of factors, including the product mix, average sales prices of our products, the amortization expense associated with the acquired intangible assets, expense from manufacturing profit in acquired inventories, the timing of cost reductions for fabricated wafers and assembly and test service costs, inventory valuation charges, the cost of fabrication masks that are capitalized and amortized, and the timing and changes in sort, assembly and test yields. Overall gross margin is impacted by the mix between higher performance, higher margin products and services and lower performance, lower margin products and services. In addition, we typically experience lower yields and higher associated costs on new products, which improve as production volumes increase.
Research and Development Expenses. Research and development expenses primarily include personnel costs, engineering design development software and hardware tools, allocated facilities expenses and depreciation of equipment used in research and development and stock-based compensation. We expect research and development expenses to continue to increase in total dollars to support the development of new products and improvement of existing products. Additionally, as a percentage of revenue, these costs fluctuate from one period to another. Total research and development expenses for the periods presented were:
|
|
|
Year Ended December 31, |
|
|
FY2017 compared to FY2016 |
|
|
FY2016 compared to FY2015 |
|
|||||||||||||||||||
|
|
|
2017 |
|
|
2016 |
|
|
2015 |
|
|
Change |
|
|
% |
|
|
Change |
|
|
% |
|
|||||||
|
|
|
(in thousands) |
|
|
|
|
|
|
|
|
|
|
|
|
|
|
|
|
|
|||||||||
|
Research and development expenses |
|
$ |
377,941 |
|
|
$ |
257,816 |
|
|
$ |
203,778 |
|
|
$ |
120,125 |
|
|
|
46.6 |
% |
|
$ |
54,038 |
|
|
|
26.5 |
% |
|
Percent of total net revenue |
|
|
38.4 |
% |
|
|
42.7 |
% |
|
|
49.4 |
% |
|
|
(4.3 |
)% |
|
|
|
|
|
|
(6.6 |
)% |
|
|
|
|
43
Sales, General and Administrative Expenses. Sales, general and administrative expenses primarily include personnel costs, accounting and legal advisory fees, information systems, sales commissions, trade shows, marketing programs, depreciation, allocated facilities expenses and stock-based compensation. We expect sales, general and administrative expenses to increase in absolute dollars to support our growing sales and marketing activities resulting from our expanded product portfolio. Total sales, general and administrative costs for the periods presented were:
|
|
|
Year Ended December 31, |
|
|
FY2017 compared to FY2016 |
|
|
FY2016 compared to FY2015 |
|
|||||||||||||||||||
|
|
|
2017 |
|
|
2016 |
|
|
2015 |
|
|
Change |
|
|
% |
|
|
Change |
|
|
% |
|
|||||||
|
|
|
(in thousands) |
|
|
|
|
|
|
|
|
|
|
|
|
|
|
|
|
|
|||||||||
|
Sales, general and administrative expenses |
|
$ |
178,335 |
|
|
$ |
161,051 |
|
|
$ |
78,926 |
|
|
$ |
17,284 |
|
|
|
10.7 |
% |
|
$ |
82,125 |
|
|
|
104.1 |
% |
|
Percent of total net revenue |
|
|
18.1 |
% |
|
|
26.7 |
% |
|
|
19.1 |
% |
|
|
(8.6 |
)% |
|
|
|
|
|
|
7.6 |
% |
|
|
|
|
Other Expense, net. Other expense, net primarily includes interest expense associated with the debt, notes payable and capital lease and technology license obligations, amortization of deferred financing costs, change in estimated fair value of notes payable and other, interest income on cash and cash equivalents and foreign currency gains and losses. Total other expense, net for the periods presented were:
|
|
|
Year Ended December 31, |
|
|
FY2017 compared to FY2016 |
|
|
FY2016 compared to FY2015 |
|
|||||||||||||||||||
|
|
|
2017 |
|
|
2016 |
|
|
2015 |
|
|
Change |
|
|
% |
|
|
Change |
|
|
% |
|
|||||||
|
|
|
(in thousands) |
|
|
|
|
|
|
|
|
|
|
|
|
|
|
|
|
|
|||||||||
|
Interest expense |
|
$ |
(29,147 |
) |
|
$ |
(12,734 |
) |
|
$ |
(1,241 |
) |
|
$ |
(16,413 |
) |
|
|
128.9 |
% |
|
$ |
(11,493 |
) |
|
|
926.1 |
% |
|
Other, net |
|
|
220 |
|
|
|
75 |
|
|
|
(410 |
) |
|
|
145 |
|
|
|
193.3 |
% |
|
|
485 |
|
|
|
(118.3 |
)% |
|
Total other expense, net |
|
$ |
(28,927 |
) |
|
$ |
(12,659 |
) |
|
$ |
(1,651 |
) |
|
$ |
(16,268 |
) |
|
|
56.2 |
% |
|
$ |
(11,008 |
) |
|
|
666.7 |
% |
Provision for (Benefit from) Income taxes. The provision for (benefit from) income taxes and the effective tax rates for the periods presented were:
|
|
|
Year Ended December 31, |
|
|
FY2017 compared to FY2016 |
|
|
FY2016 compared to FY2015 |
|
|||||||||||||||||||
|
|
|
2017 |
|
|
2016 |
|
|
2015 |
|
|
Change |
|
|
% |
|
|
Change |
|
|
% |
|
|||||||
|
|
|
(in thousands) |
|
|
|
|
|
|
|
|
|
|
|
|
|
|
|
|
|
|||||||||
|
Loss before income taxes |
|
$ |
(85,619 |
) |
|
$ |
(146,212 |
) |
|
$ |
(15,378 |
) |
|
$ |
60,593 |
|
|
|
(41.4 |
)% |
|
$ |
(130,834 |
) |
|
|
850.8 |
% |
|
Provision for (benefit from) income taxes |
|
|
(16,760 |
) |
|
|
997 |
|
|
|
1,682 |
|
|
|
(17,757 |
) |
|
|
-1781.0 |
% |
|
|
(685 |
) |
|
|
(40.7 |
)% |
|
Effective tax rate |
|
|
19.6 |
% |
|
|
(0.7 |
)% |
|
|
(10.9 |
)% |
|
|
20.3 |
% |
|
|
|
|
|
|
10.3 |
% |
|
|
|
|
Fiscal 2017 Compared to Fiscal 2016
Net Revenue. The increase in net revenue in 2017 compared to 2016 was attributable mainly to the increases in sales in our enterprise, service provider, broadband and consumer markets of $301.7 million. Sales in our datacenter market also increased by $79.0 million. The overall increase in revenue in the respective markets was primarily due to sales resulting from our acquisition of QLogic and the increase in demand for our products. The fluctuation in demand for our products in the respective markets was a result of the timing of our customers’ volume production of our design wins.
Cost of revenue and Gross Margin. Gross profit increased in 2017 compared to 2016 generally as a result of the increase in product sales. Gross margin in 2017 increased by 3.5 percentage points compared to 2016 mainly due to the increase in product sales, lower cost of revenue due to the additional cost recognized in 2016 associated with the exercise of manufacturing rights and write-down of fixed assets, and lower manufacturing profit in acquired inventory. These favorable impacts to gross margin were partially offset by higher amortization of acquired intangible assets due to the timing of acquisition of QLogic and due to additional cost of revenue recorded in 2017 resulting from rationalization of certain product lines. Our gross margin was also slightly impacted by a shift of product sales mix. Generally, higher performance products yield higher gross margins compared to our lower performance products.
44
Research and Development Expenses. The overall increase in research and development expenses in 2017 compared 2016 was primarily attributable to the acquisition of QLogic. Salaries and employee benefits increased by $59.3 million and stock-compensation expense and related taxes increased by $25.3 million, mainly as a result of the full year of increased headcount that resulted from the acquisition of QLogic. Stock-based compensation was also impacted by the timing of recognition of incremental expense from the assumed QLogic awards. Depreciation and amortization expense also increased by $16.5 million due to additional property and equipment and intangible assets used for research and development acquired from third-party companies and from the acquisition of QLogic. The outsourced engineering services, facilities and other research and development expenses increased by $19.0 million due primarily to the increase in headcount, timing of our research and development work for several product families and the timing of the recognition of development funding credits. Research and development headcount was 1,387 at December 31, 2017 compared to 1,331 at December 31, 2016.
Sales, General and Administrative Expenses. The fluctuation in sales, general and administrative expenses in 2017 compared to 2016 was primarily attributable to the acquisition of QLogic. Salaries and employee benefits increased by $23.3 million as a result of the full year of increased headcount that resulted from the acquisition of QLogic. In 2016, we recorded severance expense of $12.0 million related to QLogic-related-post-acquisition and integration actions. Stock-based compensation and related taxes decreased by $8.0 million due to the timing of recognition of incremental expense from the assumed QLogic awards, partially offset by the impact of the increase in headcount. Outside services increased by $5.0 million mainly due to the timing of acquisition and integration costs incurred related to the acquisition of QLogic in 2016 and the costs incurred related to the pending acquisition by Marvell in 2017. Facilities, marketing and other sales, general and administrative expenses increased by $9.0 million, primarily due to increase in depreciation and amortization expense resulting from increase in depreciable assets acquired from the QLogic acquisition and increase in other expenses impacted by higher headcount and increased marketing and sales related activities. Sales, general and administrative headcount was 415 at December 31, 2017 compared to 405 at December 31, 2016.
Other Expense, Net. The increase in other expense, net in 2017 compared to 2016 was mainly due to the increase in interest expense associated with the debt and amortization of deferred financing costs.
Provision for (Benefit from) Income Taxes. On December 22, 2017, the United States enacted tax reform legislation through the Tax Cuts and Jobs Act (the “Act”), which significantly changes the existing U.S. tax laws. Major reforms in the legislation include reduction in the corporate tax rate from 35.0% to 21.0% and a move from a worldwide tax system to a territorial system. As a result of enactment of the legislation, we recognized a tax benefit of $11.6 million in our consolidated statement of operations for the year ended December 31, 2017 primarily due to reduction of our net long-term deferred tax liabilities recorded on its consolidated balance sheet. The changes included in the Act are broad and complex. The final transition impacts of the Act may differ from the above estimate, possibly materially, due to, among other things, changes in interpretations of the Act, any legislative action to address questions that arise because of the Act, any changes in accounting standards for income taxes or related interpretations in response to the Act, or any updates or changes to estimates we utilized to calculate the transition impacts, including impacts from changes to current year earnings estimates, cumulative unrepatriated foreign earnings and foreign exchange rates of foreign subsidiaries. The SEC has issued guidance that would allow for a measurement period of up to one year after the enactment date of the Act to finalize the recording of the related tax impacts. Any adjustments to these provisional amounts will be reported as a component of income tax expense or benefit in the reporting period in which any such adjustments are determined, which will be no later than the fourth quarter of 2018.
The benefit from income taxes for the year ended December 31, 2017 was mainly due to the income tax benefit as a result of the Act as discussed above, a release of the unrecognized tax benefit liability of $5.2 million mainly due to the expiration of the statutes of limitations and a partial release of the valuation allowance on net deferred tax assets of $2.4 million due to the increase in taxable income as a result of the reclassification of an indefinite-lived to a finite-lived intangible asset. These tax benefits were partially offset by the provision for income taxes on earnings in foreign jurisdictions. The provision for income taxes for the year ended December 31, 2016 was primarily related to tax on earnings in foreign jurisdictions. The difference between the provision for income taxes that would be derived by applying the statutory rate to our loss before income taxes and the benefit for income taxes recorded in 2017 was primarily attributable to the impact of the enactment of the Act, difference in foreign tax rates and change in valuation allowance. The difference between the provision for income taxes that would be derived by applying the statutory rate to our loss before income taxes and the provision for income taxes recorded in 2016 was primarily attributable to the difference in foreign tax rates, change in valuation allowance and deferred tax liability related to the indefinite lived intangible assets.
Fiscal 2016 Compared to Fiscal 2015
Net Revenue. The increase in net revenue in 2016 compared to 2015 was attributable mainly to the increases in sales in our enterprise, service provider, broadband and consumer markets of $143.3 million. Sales in our datacenter market also increased by $47.3 million. The overall increase in revenue in the respective markets was primarily due to sales resulting from our acquisition of QLogic and the increase in demand for our products. The fluctuation in demand for our products in the respective markets was a result of the timing of our customers’ volume production of our design wins.
45
Cost of revenue and Gross Margin. Gross profit increased in 2016 compared to 2015 mainly due to the increase in revenue, partially offset by the additional cost of revenue associated with the exercise of manufacturing rights and write-down of certain fixed assets, manufacturing profit in acquired inventory and amortization of acquired intangible assets from QLogic recognized in 2016. Gross margin decreased 17.9 percentage points from 65.2% in 2015 to 47.3% in 2016 due to additional charges to cost of revenue in 2016 as discussed above. In addition, our gross margin was impacted by a small shift of product sales mix. Generally, higher performance products yield higher gross margins compared to our lower performance products.
Research and Development Expenses. The overall increase in research and development expenses in 2016 compared to 2015 was primarily attributable to the acquisition of QLogic. Salaries and employee benefits increased by $31.7 million mainly as a result of the increase in headcount. Stock-based compensation and related taxes also increased by $12.0 million due to the increase in headcount and the incremental stock-compensation expense from the assumed QLogic awards. Depreciation and amortization expense also increased by $9.2 million due to additional property and equipment and intangible assets used for research and development acquired from third-party companies and from the acquisition of QLogic. In 2016, we recorded acquired IPR&D from an asset acquisition amounting to $2.0 million to research and development expense. The outsourced engineering services and other miscellaneous research and development increased by $6.6 million due to the timing of our research and development work for our other new product families and Xpliant and the timing of the recognition of development funding credits. In March 2015, we exercised a manufacturing right from a third-party vendor for a total consideration of $7.5 million which we recognized as research and development expense in the first quarter of 2015. Research and development headcount was 1,331 at December 31, 2016 compared to 774 at December 31, 2015.
Sales, General and Administrative Expenses. The overall increase in sales, general and administrative expenses in 2016 compared to 2015 was primarily attributable to the acquisition of QLogic. Outside services increased by $21.1 million mainly due to the transaction and integration costs incurred related to the acquisition of QLogic. Stock-based compensation and related taxes also increased by $24.8 million due to the incremental stock-compensation expense from the assumed QLogic awards and increase in total headcount. Salaries and employee benefits increased by $16.4 million mainly as a result of the increase in headcount. In 2016, we recorded severance expense of $12.0 million related to QLogic-related post-acquisition and integration actions. Facilities, marketing and other miscellaneous sales, general and administrative expenses combined increased by $7.8 million as a result of an increase in headcount and increase in marketing related activities. Sales, general and administrative headcount was 405 at December 31, 2016 compared to 184 at December 31, 2015.
Other Expense, Net. The increase in other expense, net was mainly due to the increase in interest expense associated with the debt and amortization of deferred financing costs. This increase was partly offset by lower foreign exchange losses.
Provision for Income Taxes. The decrease in provision for income taxes in 2016 compared to 2015 was primarily due to the decrease in the uncertain tax position liability due to the settlement of tax audits in certain foreign jurisdictions which was partly offset by the increase in foreign income taxes. The difference between the provision for income taxes that would be derived by applying the statutory rate to our loss before income taxes and the provision for income taxes recorded in 2016 and 2015 was primarily attributable to the difference in foreign tax rates, change in valuation allowance and deferred tax liability related to the indefinite lived intangible assets.
Liquidity and Capital Resources
As of December 31, 2017, we had cash and cash equivalents of $140.5 million and net accounts receivable of $230.1 million. This compares to cash and cash equivalents of $221.4 million and net accounts receivable of $125.7 million at December 31, 2016.
Following is a summary of our working capital and cash and cash equivalents as of the periods presented:
|
|
|
As of December 31, |
|
|||||
|
|
|
2017 |
|
|
2016 |
|
||
|
|
|
(in thousands) |
|
|||||
|
Working capital |
|
$ |
313,097 |
|
|
$ |
320,883 |
|
|
Cash and cash equivalents |
|
|
140,498 |
|
|
|
221,439 |
|
|
|
Following is a summary of our cash flows from operating activities, investing activities and financing activities for the periods presented: |
46
|
|
|
Year Ended December 31, |
|
|||||||||
|
|
|
2017 |
|
|
2016 |
|
|
2015 |
|
|||
|
|
|
(in thousands) |
|
|||||||||
|
Net cash provided by operating activities |
|
$ |
145,894 |
|
|
$ |
65,498 |
|
|
$ |
57,849 |
|
|
Net cash used in investing activities |
|
|
(107,515 |
) |
|
|
(642,135 |
) |
|
|
(44,496 |
) |
|
Net cash provided by (used in) financing activities |
|
|
(119,320 |
) |
|
|
663,430 |
|
|
|
(10,425 |
) |
Cash Flows from Operating Activities
Net cash flows from operating activities increased by $80.4 million from net cash provided by operating activities of $65.5 million in 2016 compared to net cash provided by operating activities of $145.9 million in 2017. Total cash inflow from operations after adjustments of certain non-cash items in 2017 and 2016 was $229.5 million and $42.0 million, respectively. The increase was primarily due to higher operating income as a result of the increase in revenue and lower expenses as 2016 included additional costs associated with the exercise of manufacturing rights and expenses associated with the acquisition of QLogic. Changes in assets and liabilities resulted in net cash outflow of $83.6 million in 2017 compared to $23.4 million in 2016. The significant changes in assets and liabilities in 2017 were mainly due to higher accounts receivable resulting from the timing of shipments to customers, lower inventories due to timing of inventory build-up, higher accounts payable due to the timing of payments to vendors and lower accrued expense and other current liabilities mainly due to the timing of recognition of deferred research and development costs. The significant changes in assets and liabilities in 2016 taking into account the assets and liabilities acquired and assumed from the acquisition of QLogic were lower accounts receivable resulting from the timing of shipments to customers, higher inventories due to timing of inventory build-up, higher accounts payable due to the timing of payments to vendors and higher accrued expenses and other current liabilities due to the cash received for funding developments.
Net cash flows from operating activities increased by $7.7 million from net cash provided by operating activities of $57.8 million in 2015 compared to net cash provided by operating activities of $65.5 million in 2016. Total cash inflow from operations after adjustments of non-cash items in 2016 and 2015 was $42.0 million and $74.1 million, respectively. The decrease was primarily from higher expenses due to recognition of additional cost of revenue related to the exercise of manufacturing rights and the transaction related costs incurred in connection with the acquisition of QLogic. These higher expenses were partially offset by higher operating income due to increase in revenue. Changes in assets and liabilities resulted in net cash inflow of $23.5 million in 2016 compared to $16.2 million in 2015. The significant changes in assets and liabilities in 2015 were higher accounts receivable resulting from the timing of shipments to customers and higher accrued expenses and other current liabilities mainly from the timing of payments to vendors.
Cash Flows from Investing Activities
Net cash used in investing activities in 2017 was $107.5 million compared to $642.1 million in 2016 and 44.5 million in 2015. Net cash used in investing activities in 2017 resulted from the cash payments for the purchases of property and equipment of $89.7 million and intangible assets of $17.9 million. Net cash used in investing activities in 2016 resulted from the cash payments for the acquisition of QLogic, net of cash assumed from the acquisition of $573.8 million, purchases of property and equipment of $49.7 million and intangible assets of $51.4 million. These cash outflows were partially offset by the net proceeds from the sale of held for sale assets of $32.4 million and proceeds from sale of available for sale securities of $0.4 million. Net cash used in investing activities in 2015 resulted from the cash payments made to purchase property and equipment of $35.8 million and intangible assets of $6.4 million and cash payment to common shareholders of Xpliant of $3.6 million pursuant to the closing of the Xpliant merger. These decreases were partially offset by the proceeds from sale of a short-term investment of $1.0 million and the proceeds received from the disposition of certain consumer product assets of $0.4 million.
Cash Flows from Financing Activities
Net cash used in financing activities in 2017 was $119.3 million compared to net cash provided from financing activities in 2016 of $663.4 million and net cash used in financing activities of $10.4 million in 2015. The cash flow used in financing activities in 2017 was due to the principal payments of $89.1 million towards the outstanding principal balance of the debt, principal payments of capital lease and technology license obligations of $31.0 million and payment of taxes withheld on net settled vesting of restricted stock units of $5.7 million. These cash outflows were partly offset by the proceeds received from the issuance of common stock upon exercise of options of $6.5 million. Net cash provided by financing activities in 2016 was due to the proceeds from debt, net of deferred financing costs of $729.4 million and the proceeds from issuance of common stock upon exercise of stock options of $11.4 million. These cash inflows were partly offset by the principal payments of debt of $51.8 million, principal payments of capital lease and technology license obligations of $23.7 million and payment of taxes withheld on net settled vesting of restricted stock units of $1.9 million. Net cash used in financing activities in 2015 resulted from the principal payment of capital lease and technology license obligations of $20.0 million, which was partially offset by the proceeds received from issuance of common stock upon the exercise of options of $9.6 million.
47
Capital Resources
Our cash equivalents consist of an investment in a money market fund. We believe that our $140.5 million of cash and cash equivalents as of December 31, 2017, and expected cash flows from operations, if any, will be sufficient to fund our projected operating requirements for at least 12 months.
As of December 31, 2017, our international subsidiaries held $109.0 million of our total cash and cash equivalents. We continue to repatriate cash from certain offshore operations in accordance with management’s review of our cash position and anticipated cash needs for investment in our core business, including interest charges and principal prepayments to our outstanding Term Loan Facility. We changed our assertion regarding the repatriation of cash during the second quarter of 2017 in that the current and future earnings of certain foreign entities will no longer be indefinitely reinvested, and that we provide deferred taxes for the anticipated income taxes. The enactment of the Act during the fourth quarter of 2017 provides a one-time deemed repatriation tax, or “transition tax” on undistributed foreign earnings which required us to reclassify our deferred tax liabilities related to undistributed foreign earnings to income tax payable. The one-time transition tax is based on our total post-1986 earnings and profits, or “E&P”. We recorded a provisional amount for the transition tax resulting in a reduction of $180.1 million of net operating loss carryforwards. However, given the net operating losses and the full valuation allowance on our net deferred income tax assets in the U.S., we will have no cash tax impact in the U.S. We have not finalized our calculation of the E&P for these foreign subsidiaries. Further, the transition tax is based in part on the amount of those earnings held in cash and other specified assets. This amount may change when we finalize the calculation of E&P previously deferred from U.S. federal taxation and finalize the amounts held in cash or other specified assets. Under the provisions of the Act, all foreign earnings are subject to U.S. taxation. As a result, we intend to repatriate substantially all foreign earnings that have been taxed in the U.S. to the extent that the foreign earnings are not restricted by local laws or accounting rules, and there are no substantial incremental costs associated with repatriating the foreign earnings. We continue to maintain our indefinite reinvestment policy with respect to immaterial earnings from certain subsidiaries and the associated tax cost is insignificant.
On August 16, 2016, we entered into a Credit Agreement with JPMCB, as administrative agent and collateral agent, the other agents party thereto and the lenders referred to therein (collectively, the “Lenders”). The Lenders have provided (i) a $700.0 million Initial Term B Loan Facility and (ii) a $50.0 million Interim Term Loan Facility, ((i) and (ii) together, the “Term Facility”). We entered into the Credit Agreement to finance the acquisition of QLogic and pay fees and expenses related to such acquisition. In October 2016, we paid the outstanding Interim Term Loan. As of December 31, 2017, the principal outstanding debt from our Initial Term B Loan Facility amounted to $609.2 million. See Notes 2 and 11 of Notes to Consolidated Financial Statements in Item 8 of this Annual Report, which is incorporated herein by reference for detailed discussions of our acquisition of QLogic and the Term Facility.
Our future capital requirements will depend on many factors, including our rate of revenue growth, the expansion of our engineering, sales and marketing activities, the timing and extent of our expansion into new territories, the timing of introductions of new products and enhancements to existing products and the continuing market acceptance of our products. Although we currently are not a party to any agreement with respect to potential material investments in, or acquisitions of, complementary businesses, services or technologies, we may enter into these types of arrangements in the future, which could also require us to seek additional equity or debt financing. Additional funds may not be available on terms favorable to us or at all.
Indemnities
In the ordinary course of business, we have entered into agreements with customers that include indemnity provisions. Based on historical experience and information known through the filing of this report, we believe our exposure related to the above indemnities as of December 31, 2017, was not material. We also enter into indemnification agreements with our officers and directors and our certificate of incorporation and bylaws include similar indemnification obligations to our officers and directors. It is not possible to determine the amount of our liability related to these indemnification agreements and obligations to our officers and directors due to the limited history of prior indemnification claims and the unique facts and circumstances involved in each particular agreement.
Off-Balance Sheet Arrangements
During the periods presented, we did not have, nor do we currently have, any relationships with unconsolidated entities or financial partnerships, such as entities often referred to as structured finance or special purpose entities, which would have been established for the purpose of facilitating off-balance sheet arrangements or other contractually narrow or limited purposes. As of December 31, 2017, we had no material off-balance sheet arrangements other than our facility operating leases.
48
Contractual Obligations
The table below describes our contractual payment obligations and commitments, excluding liabilities related to uncertain tax positions, as of December 31, 2017:
|
|
|
Payments Due By Period |
|
|||||||||||||||||
|
|
|
Less than 1 Year |
|
|
1 to 3 Years |
|
|
3 to 5 Years |
|
|
More Than 5 Years |
|
|
Total |
|
|||||
|
|
|
(in thousands) |
|
|||||||||||||||||
|
Principal payment of credit facilities |
|
$ |
6,123 |
|
|
$ |
12,245 |
|
|
$ |
590,821 |
|
|
$ |
- |
|
|
$ |
609,189 |
|
|
Estimated interest on credit facilities (LIBOR minimum) |
|
|
18,459 |
|
|
|
36,409 |
|
|
|
28,986 |
|
|
|
- |
|
|
|
83,854 |
|
|
Operating lease obligations |
|
|
18,193 |
|
|
|
38,317 |
|
|
|
61,266 |
|
|
|
57,000 |
|
|
|
174,776 |
|
|
Capital lease and technology license obligations |
|
|
32,423 |
|
|
|
15,604 |
|
|
|
- |
|
|
|
- |
|
|
|
48,027 |
|
|
Non-cancellable purchase orders |
|
|
26,759 |
|
|
|
- |
|
|
|
- |
|
|
|
- |
|
|
|
26,759 |
|
|
Total |
|
$ |
101,957 |
|
|
$ |
102,575 |
|
|
$ |
681,073 |
|
|
$ |
57,000 |
|
|
$ |
942,605 |
|
On January 31, 2017, we entered into a lease agreement to lease approximately 116,000 sq. ft. in a building located adjacent to our corporate headquarter in San Jose, California which lease term expires in July 2027. In March 2017, we entered into an amendment to the lease agreement dated November 18, 2016 for a building located in Irvine, California to extend the lease term through October 2027.
As of December 31, 2017, the liability for uncertain tax positions was $6.6 million. The timing of any payments which could result from these unrecognized tax benefits will depend upon a number of factors. Accordingly, the timing of payment cannot be estimated.
The Merger Agreement with Marvell provides Marvell and us with certain termination rights and, under certain circumstances specified in the Marvell Merger Agreement, we could be required to pay Marvell a termination fee of up to $180.0 million. Also, we recorded acquisition-related costs associated with the pending merger with Marvell in the year ended December 31, 2017 primarily for outside legal and external financial advisory fees and expect additional acquisition-related costs will be incurred through the closing of the Merger.
In addition, we have other obligations for goods and services entered into in the normal course of business. These obligations, however, are either not enforceable or legally binding or are subject to change based on our business decisions.
Recent Accounting Pronouncements
See “Recent Accounting Pronouncements” in “Note 1 Organization and Significant Accounting Policies” in Item 8 of this Annual Report, which is incorporated herein by reference.
49
Item 7A. Quantitative and Qualitative Disclosure About Market Risk
Foreign Currency Risk
Substantially all of our sales are denominated in United States dollars. We therefore have minimal foreign currency risk associated with sale of products. Our international sales and marketing and research and development operations incur expenses that are denominated in foreign currencies. These expenses could be materially affected by currency fluctuations; however, we do not consider this currency risk to be material as the related costs do not constitute a significant portion of our total spending. We outsource our wafer fabrication, assembly, testing, warehousing and shipping operations; however, all expenses related thereto are denominated in United States dollars.
Interest Rate Risk
We had cash and cash equivalents of $140.5 million and $221.4 million as of December 31, 2017 and 2016, respectively, which was held for working capital purposes. Our cash equivalents as of December 31, 2017 and 2016, consisted of investments in a money market fund. We do not enter into investments for trading or speculative purposes. We do not believe that we have any material exposure to changes in the fair value of these investments as a result of changes in interest rates due to their short term nature. Declines in interest rates, however, will reduce future investment income.
With our outstanding debt following the acquisition of QLogic, we are exposed to various forms of market risk. See Note 11 of Notes to Consolidated Financial Statements in Item 8 of this Annual Report, which is incorporated herein by reference for information regarding interest rates under our debt facilities. Based on the outstanding balance of our debt, an increase or decrease in the annual interest expense following the hypothetical change in the interest rate of 0.125% to 0.50% would be approximately $0.8 million to $3.0 million.
50
Item 8. Financial Statement and Supplementary Data
INDEX TO CONSOLIDATED FINANCIAL STATEMENTS
The following financial statements are filed as part of this Annual Report
51
REPORT OF INDEPENDENT REGISTERED PUBLIC ACCOUNTING FIRM
To the Board of Directors and Stockholders of Cavium, Inc.
Opinions on the Financial Statements and Internal Control over Financial Reporting
We have audited the accompanying consolidated balance sheets of Cavium, Inc. and its subsidiaries (“the Company”) as of December 31, 2017 and 2016, and the related consolidated statements of operations, changes in stockholders’ equity, comprehensive loss and cash flows for each of the three years in the period ended December 31, 2017, including the related notes and schedule of valuation and qualifying accounts for each of the three years in the period ended December 31, 2017 appearing under Item 8 (collectively referred to as the “consolidated financial statements”). We also have audited the Company's internal control over financial reporting as of December 31, 2017, based on criteria established in Internal Control - Integrated Framework (2013) issued by the Committee of Sponsoring Organizations of the Treadway Commission (COSO).
In our opinion, the consolidated financial statements referred to above present fairly, in all material respects, the financial position of the Company as of December 31, 2017 and 2016, and the results of its operations and its cash flows for each of the three years in the period ended December 31, 2017 in conformity with accounting principles generally accepted in the United States of America. Also in our opinion, the Company maintained, in all material respects, effective internal control over financial reporting as of December 31, 2017, based on criteria established in Internal Control - Integrated Framework (2013) issued by the COSO.
Change in Accounting Principle
As discussed in Note 1 to the consolidated financial statements, the Company changed the manner in which it accounts for certain elements of its employee share-based payments in 2017.
Basis for Opinions
The Company's management is responsible for these consolidated financial statements, for maintaining effective internal control over financial reporting, and for its assessment of the effectiveness of internal control over financial reporting, included in Management’s Report on Internal Control over Financial Reporting appearing under Item 9A. Our responsibility is to express opinions on the Company’s consolidated financial statements and on the Company's internal control over financial reporting based on our audits. We are a public accounting firm registered with the Public Company Accounting Oversight Board (United States) ("PCAOB") and are required to be independent with respect to the Company in accordance with the U.S. federal securities laws and the applicable rules and regulations of the Securities and Exchange Commission and the PCAOB.
We conducted our audits in accordance with the standards of the PCAOB. Those standards require that we plan and perform the audits to obtain reasonable assurance about whether the consolidated financial statements are free of material misstatement, whether due to error or fraud, and whether effective internal control over financial reporting was maintained in all material respects.
Our audits of the consolidated financial statements included performing procedures to assess the risks of material misstatement of the consolidated financial statements, whether due to error or fraud, and performing procedures that respond to those risks. Such procedures included examining, on a test basis, evidence regarding the amounts and disclosures in the consolidated financial statements. Our audits also included evaluating the accounting principles used and significant estimates made by management, as well as evaluating the overall presentation of the consolidated financial statements. Our audit of internal control over financial reporting included obtaining an understanding of internal control over financial reporting, assessing the risk that a material weakness exists, and testing and evaluating the design and operating effectiveness of internal control based on the assessed risk. Our audits also included performing such other procedures as we considered necessary in the circumstances. We believe that our audits provide a reasonable basis for our opinions.
52
Definition and Limitations of Internal Control over Financial Reporting
A company’s internal control over financial reporting is a process designed to provide reasonable assurance regarding the reliability of financial reporting and the preparation of financial statements for external purposes in accordance with generally accepted accounting principles. A company’s internal control over financial reporting includes those policies and procedures that (i) pertain to the maintenance of records that, in reasonable detail, accurately and fairly reflect the transactions and dispositions of the assets of the company; (ii) provide reasonable assurance that transactions are recorded as necessary to permit preparation of financial statements in accordance with generally accepted accounting principles, and that receipts and expenditures of the company are being made only in accordance with authorizations of management and directors of the company; and (iii) provide reasonable assurance regarding prevention or timely detection of unauthorized acquisition, use, or disposition of the company’s assets that could have a material effect on the financial statements.
Because of its inherent limitations, internal control over financial reporting may not prevent or detect misstatements. Also, projections of any evaluation of effectiveness to future periods are subject to the risk that controls may become inadequate because of changes in conditions, or that the degree of compliance with the policies or procedures may deteriorate.
/s/ PricewaterhouseCoopers LLP
San Jose, California
March 1, 2018
We have served as the Company’s auditor since 2001.
53
PART I. FINANCIAL INFORMATION
CAVIUM, INC.
(in thousands, except share and per share data)
|
|
As of December 31, |
|
|||||
|
|
2017 |
|
|
2016 |
|
||
|
Assets |
|
|
|
|
|
|
|
|
Current assets: |
|
|
|
|
|
|
|
|
Cash and cash equivalents |
$ |
140,498 |
|
|
$ |
221,439 |
|
|
Accounts receivable, net of allowances of $3,156 and $4,130, respectively |
|
230,143 |
|
|
|
125,728 |
|
|
Inventories |
|
93,674 |
|
|
|
119,692 |
|
|
Prepaid expenses and other current assets |
|
22,794 |
|
|
|
22,259 |
|
|
Total current assets |
|
487,109 |
|
|
|
489,118 |
|
|
Property and equipment, net |
|
192,515 |
|
|
|
150,862 |
|
|
Intangible assets, net |
|
664,769 |
|
|
|
764,885 |
|
|
Goodwill |
|
237,692 |
|
|
|
241,067 |
|
|
Other assets |
|
7,240 |
|
|
|
4,599 |
|
|
Total assets |
$ |
1,589,325 |
|
|
$ |
1,650,531 |
|
|
|
|
|
|
|
|
|
|
|
Liabilities and Stockholders' equity |
|
|
|
|
|
|
|
|
Current liabilities: |
|
|
|
|
|
|
|
|
Accounts payable |
$ |
91,318 |
|
|
$ |
65,456 |
|
|
Accrued expenses and other current liabilities |
|
38,753 |
|
|
|
64,967 |
|
|
Deferred revenue |
|
9,236 |
|
|
|
8,412 |
|
|
Current portion of long-term debt |
|
3,270 |
|
|
|
3,865 |
|
|
Capital lease and technology license obligations |
|
31,435 |
|
|
|
25,535 |
|
|
Total current liabilities |
|
174,012 |
|
|
|
168,235 |
|
|
Long-term debt |
|
592,963 |
|
|
|
675,414 |
|
|
Capital lease and technology license obligations, net of current portion |
|
15,370 |
|
|
|
27,878 |
|
|
Deferred tax liability |
|
2,686 |
|
|
|
18,774 |
|
|
Other non-current liabilities |
|
25,948 |
|
|
|
18,386 |
|
|
Total liabilities |
|
810,979 |
|
|
|
908,687 |
|
|
|
|
|
|
|
|
|
|
|
Commitments and contingencies (Note 13) |
|
|
|
|
|
|
|
|
|
|
|
|
|
|
|
|
|
Stockholders' equity |
|
|
|
|
|
|
|
|
Preferred stock, par value $0.001: |
|
|
|
|
|
|
|
|
10,000,000 shares authorized; no shares issued and outstanding |
|
- |
|
|
|
- |
|
|
Common stock, par value $0.001: |
|
|
|
|
|
|
|
|
200,000,000 shares authorized; 69,155,793 and 67,181,634 shares issued and outstanding, respectively |
|
69 |
|
|
|
67 |
|
|
Additional paid-in capital |
|
1,183,819 |
|
|
|
1,079,043 |
|
|
Accumulated deficit |
|
(406,352 |
) |
|
|
(336,621 |
) |
|
Accumulated other comprehensive income (loss) |
|
810 |
|
|
|
(645 |
) |
|
Total stockholders' equity |
|
778,346 |
|
|
|
741,844 |
|
|
Total liabilities and stockholders' equity |
$ |
1,589,325 |
|
|
$ |
1,650,531 |
|
The accompanying notes are an integral part of these consolidated financial statements.
54
CAVIUM, INC.
CONSOLIDATED STATEMENTS OF OPERATIONS
(in thousands, except per share data)
|
|
Year Ended December 31, |
|
|||||||||
|
|
2017 |
|
|
2016 |
|
|
2015 |
|
|||
|
Net revenue |
$ |
984,018 |
|
|
$ |
603,314 |
|
|
$ |
412,744 |
|
|
Cost of revenue |
|
484,434 |
|
|
|
318,000 |
|
|
|
143,767 |
|
|
Gross profit |
|
499,584 |
|
|
|
285,314 |
|
|
|
268,977 |
|
|
Operating expenses: |
|
|
|
|
|
|
|
|
|
|
|
|
Research and development |
|
377,941 |
|
|
|
257,816 |
|
|
|
203,778 |
|
|
Sales, general and administrative |
|
178,335 |
|
|
|
161,051 |
|
|
|
78,926 |
|
|
Total operating expenses |
|
556,276 |
|
|
|
418,867 |
|
|
|
282,704 |
|
|
Loss from operations |
|
(56,692 |
) |
|
|
(133,553 |
) |
|
|
(13,727 |
) |
|
Other income (expense), net: |
|
|
|
|
|
|
|
|
|
|
|
|
Interest expense |
|
(29,147 |
) |
|
|
(12,734 |
) |
|
|
(1,241 |
) |
|
Other, net |
|
220 |
|
|
|
75 |
|
|
|
(410 |
) |
|
Total other expense, net |
|
(28,927 |
) |
|
|
(12,659 |
) |
|
|
(1,651 |
) |
|
Loss before income taxes |
|
(85,619 |
) |
|
|
(146,212 |
) |
|
|
(15,378 |
) |
|
Provision for (benefit from) income taxes |
|
(16,760 |
) |
|
|
997 |
|
|
|
1,682 |
|
|
Net loss |
$ |
(68,859 |
) |
|
$ |
(147,209 |
) |
|
$ |
(17,060 |
) |
|
|
|
|
|
|
|
|
|
|
|
|
|
|
Earnings per share: |
|
|
|
|
|
|
|
|
|
|
|
|
Net loss per common share, basic |
$ |
(1.01 |
) |
|
$ |
(2.42 |
) |
|
$ |
(0.31 |
) |
|
Shares used in computing basic net loss per common share |
|
68,394 |
|
|
|
60,883 |
|
|
|
55,589 |
|
|
Net loss per common share, diluted |
$ |
(1.01 |
) |
|
$ |
(2.42 |
) |
|
$ |
(0.31 |
) |
|
Shares used in computing diluted net loss per common share |
|
68,394 |
|
|
|
60,883 |
|
|
|
55,589 |
|
The accompanying notes are an integral part of these consolidated financial statements.
55
CAVIUM, INC.
CONSOLIDATED STATEMENTS OF CHANGES IN STOCKHOLDERS’ EQUITY
(in thousands, except share data)
|
|
Common Stock |
|
|
Additional Paid-in |
|
|
Accumulated |
|
|
Accumulated Other Comprehensive |
|
|
|
|
|
||||||||
|
|
Shares |
|
|
Amount |
|
|
Capital |
|
|
Deficit |
|
|
Loss |
|
|
Total |
|
||||||
|
Balance at December 31, 2014 |
|
54,458,288 |
|
|
|
54 |
|
|
$ |
488,981 |
|
|
$ |
(172,352 |
) |
|
$ |
- |
|
|
$ |
316,683 |
|
|
Common stock issued in connection with exercises of stock options |
|
685,439 |
|
|
|
1 |
|
|
|
9,607 |
|
|
|
|
|
|
|
|
|
|
|
9,608 |
|
|
Common stock issued in connection with vesting of restricted stock units |
|
1,115,525 |
|
|
|
1 |
|
|
|
|
|
|
|
|
|
|
|
|
|
|
|
1 |
|
|
Stock-based compensation |
|
|
|
|
|
|
|
|
|
48,298 |
|
|
|
|
|
|
|
|
|
|
|
48,298 |
|
|
Payments to common shareholders of Xpliant |
|
|
|
|
|
|
|
|
|
(3,630 |
) |
|
|
|
|
|
|
|
|
|
|
(3,630 |
) |
|
Net loss |
|
|
|
|
|
|
|
|
|
|
|
|
|
(17,060 |
) |
|
|
|
|
|
|
(17,060 |
) |
|
Balance at December 31, 2015 |
|
56,259,252 |
|
|
|
56 |
|
|
|
543,256 |
|
|
|
(189,412 |
) |
|
|
- |
|
|
|
353,900 |
|
|
Common stock issued in connection with exercises of stock options |
|
1,010,670 |
|
|
|
1 |
|
|
|
11,424 |
|
|
|
|
|
|
|
|
|
|
|
11,425 |
|
|
Common stock issued in connection with vesting of restricted stock units |
|
1,547,694 |
|
|
|
2 |
|
|
|
|
|
|
|
|
|
|
|
|
|
|
|
2 |
|
|
Taxes withheld on net settled vesting of restricted stock units |
|
|
|
|
|
|
|
|
|
(1,930 |
) |
|
|
|
|
|
|
|
|
|
|
(1,930 |
) |
|
Issuance of common stock in connection with the acquisition of QLogic |
|
8,364,018 |
|
|
|
8 |
|
|
|
431,157 |
|
|
|
|
|
|
|
|
|
|
|
431,165 |
|
|
Stock-based compensation |
|
|
|
|
|
|
|
|
|
85,703 |
|
|
|
|
|
|
|
|
|
|
|
85,703 |
|
|
Fair value of the replacement equity awards attributable to pre-acquisition service |
|
|
|
|
|
|
|
|
|
9,433 |
|
|
|
|
|
|
|
|
|
|
|
9,433 |
|
|
Other comprehensive loss |
|
|
|
|
|
|
|
|
|
|
|
|
|
|
|
|
|
(645 |
) |
|
|
(645 |
) |
|
Net loss |
|
|
|
|
|
|
|
|
|
|
|
|
|
(147,209 |
) |
|
|
|
|
|
|
(147,209 |
) |
|
Balance at December 31, 2016 |
|
67,181,634 |
|
|
|
67 |
|
|
|
1,079,043 |
|
|
|
(336,621 |
) |
|
|
(645 |
) |
|
|
741,844 |
|
|
Common stock issued in connection with exercises of stock options |
|
205,535 |
|
|
|
|
|
|
|
6,472 |
|
|
|
|
|
|
|
|
|
|
|
6,472 |
|
|
Common stock issued in connection with vesting of restricted stock units |
|
1,768,624 |
|
|
|
2 |
|
|
|
|
|
|
|
|
|
|
|
|
|
|
|
2 |
|
|
Taxes withheld on net settled vesting of restricted stock units |
|
|
|
|
|
|
|
|
|
(5,748 |
) |
|
|
|
|
|
|
|
|
|
|
(5,748 |
) |
|
Stock-based compensation |
|
|
|
|
|
|
|
|
|
103,180 |
|
|
|
|
|
|
|
|
|
|
|
103,180 |
|
|
Impact of adoption of updated guidance on stock-based compensation |
|
|
|
|
|
|
|
|
|
872 |
|
|
|
(872 |
) |
|
|
|
|
|
|
- |
|
|
Other comprehensive income |
|
|
|
|
|
|
|
|
|
|
|
|
|
|
|
|
|
1,455 |
|
|
|
1,455 |
|
|
Net loss |
|
|
|
|
|
|
|
|
|
|
|
|
|
(68,859 |
) |
|
|
|
|
|
|
(68,859 |
) |
|
Balance at December 31, 2017 |
|
69,155,793 |
|
|
$ |
69 |
|
|
$ |
1,183,819 |
|
|
$ |
(406,352 |
) |
|
$ |
810 |
|
|
$ |
778,346 |
|
The accompanying notes are an integral part of these consolidated financial statements.
56
CAVIUM, INC.
CONSOLIDATED STATEMENTS OF COMPREHENSIVE LOSS
(in thousands)
|
|
Year Ended December 31, |
|
|||||||||
|
|
2017 |
|
|
2016 |
|
|
2015 |
|
|||
|
Net loss |
$ |
(68,859 |
) |
|
$ |
(147,209 |
) |
|
$ |
(17,060 |
) |
|
Foreign currency translation adjustments |
|
1,455 |
|
|
|
(645 |
) |
|
|
- |
|
|
Comprehensive loss |
$ |
(67,404 |
) |
|
$ |
(147,854 |
) |
|
$ |
(17,060 |
) |
The accompanying notes are an integral part of these consolidated financial statements.
57
CAVIUM, INC.
CONSOLIDATED STATEMENTS OF CASH FLOWS
(in thousands)
|
|
Year Ended December 31, |
|
|||||||||
|
|
2017 |
|
|
2016 |
|
|
2015 |
|
|||
|
Cash flows from operating activities: |
|
|
|
|
|
|
|
|
|
|
|
|
Net loss |
$ |
(68,859 |
) |
|
$ |
(147,209 |
) |
|
$ |
(17,060 |
) |
|
Adjustments to reconcile net loss to net cash provided by operating activities: |
|
|
|
|
|
|
|
|
|
|
|
|
Stock-based compensation expense |
|
102,871 |
|
|
|
85,330 |
|
|
|
48,297 |
|
|
Depreciation and amortization |
|
205,155 |
|
|
|
99,236 |
|
|
|
42,442 |
|
|
Deferred income taxes |
|
(16,646 |
) |
|
|
(2,138 |
) |
|
|
663 |
|
|
Amortization of deferred debt financing costs |
|
6,015 |
|
|
|
1,631 |
|
|
|
- |
|
|
Loss on disposal of property and equipment |
|
933 |
|
|
|
5,188 |
|
|
|
129 |
|
|
Gain on disposition of certain consumer product assets |
|
- |
|
|
|
- |
|
|
|
(400 |
) |
|
Changes in assets and liabilities, net of assets acquired and liabilities assumed from acquisitions: |
|
|
|
|
|
|
|
|
|
|
|
|
Accounts receivable, net |
|
(104,415 |
) |
|
|
8,590 |
|
|
|
(20,543 |
) |
|
Inventories |
|
26,328 |
|
|
|
(9,010 |
) |
|
|
4,914 |
|
|
Prepaid expenses, other current and non-current assets |
|
(1,153 |
) |
|
|
(1,118 |
) |
|
|
(2,110 |
) |
|
Accounts payable |
|
14,941 |
|
|
|
(7,524 |
) |
|
|
(220 |
) |
|
Deferred revenue |
|
824 |
|
|
|
1,492 |
|
|
|
31 |
|
|
Accrued expenses, other current and non-current liabilities |
|
(20,100 |
) |
|
|
31,030 |
|
|
|
1,706 |
|
|
Net cash provided by operating activities |
|
145,894 |
|
|
|
65,498 |
|
|
|
57,849 |
|
|
|
|
|
|
|
|
|
|
|
|
|
|
|
Cash flows from investing activities: |
|
|
|
|
|
|
|
|
|
|
|
|
Purchases of property and equipment |
|
(89,655 |
) |
|
|
(49,660 |
) |
|
|
(35,826 |
) |
|
Purchases of intangible assets |
|
(17,860 |
) |
|
|
(51,440 |
) |
|
|
(6,440 |
) |
|
Cash payment for acquisitions, net of cash and cash equivalents acquired |
|
- |
|
|
|
(573,830 |
) |
|
|
(3,630 |
) |
|
Proceeds received from sale of held for sale assets |
|
- |
|
|
|
32,420 |
|
|
|
- |
|
|
Proceeds received from disposition of certain consumer product assets |
|
- |
|
|
|
- |
|
|
|
400 |
|
|
Proceeds from the sale of available-for-sale securities |
|
- |
|
|
|
375 |
|
|
|
1,000 |
|
|
Net cash used in investing activities |
|
(107,515 |
) |
|
|
(642,135 |
) |
|
|
(44,496 |
) |
|
|
|
|
|
|
|
|
|
|
|
|
|
|
Cash flows from financing activities: |
|
|
|
|
|
|
|
|
|
|
|
|
Proceeds from issuance of common stock upon exercise of options |
|
6,474 |
|
|
|
11,427 |
|
|
|
9,609 |
|
|
Payment of taxes withheld on net settled vesting of restricted stock units |
|
(5,748 |
) |
|
|
(1,930 |
) |
|
|
- |
|
|
Principal payment of capital lease and technology license obligations |
|
(30,985 |
) |
|
|
(23,716 |
) |
|
|
(20,034 |
) |
|
Proceeds from issuance of long-term debt |
|
- |
|
|
|
750,000 |
|
|
|
- |
|
|
Debt financing costs |
|
- |
|
|
|
(20,601 |
) |
|
|
- |
|
|
Principal payments of long-term debt |
|
(89,061 |
) |
|
|
(51,750 |
) |
|
|
- |
|
|
Net cash provided by (used in) financing activities |
|
(119,320 |
) |
|
|
663,430 |
|
|
|
(10,425 |
) |
|
|
|
|
|
|
|
|
|
|
|
|
|
|
Net increase (decrease) in cash and cash equivalents |
|
(80,941 |
) |
|
|
86,793 |
|
|
|
2,928 |
|
|
Cash and cash equivalents, beginning of period |
|
221,439 |
|
|
|
134,646 |
|
|
|
131,718 |
|
|
Cash and cash equivalents, end of period |
$ |
140,498 |
|
|
$ |
221,439 |
|
|
$ |
134,646 |
|
|
|
|
|
|
|
|
|
|
|
|
|
|
|
Supplemental disclosures of cash flow information: |
|
|
|
|
|
|
|
|
|
|
|
|
Cash paid for interest |
$ |
24,376 |
|
|
$ |
10,105 |
|
|
$ |
1,273 |
|
|
Cash paid for taxes |
|
7,726 |
|
|
|
2,207 |
|
|
|
958 |
|
|
|
|
|
|
|
|
|
|
|
|
|
|
|
Supplemental disclosure of cash flows from investing activities: |
|
|
|
|
|
|
|
|
|
|
|
|
Additions to property and equipment and intangible assets included in accounts payable |
$ |
16,899 |
|
|
$ |
3,419 |
|
|
$ |
2,335 |
|
|
|
|
|
|
|
|
|
|
|
|
|
|
|
Supplemental disclosure of cash flows from financing activities: |
|
|
|
|
|
|
|
|
|
|
|
|
Issuance of common stock in connection with the QLogic acquisition |
$ |
- |
|
|
$ |
431,165 |
|
|
$ |
- |
|
The accompanying notes are an integral part of these consolidated financial statements.
58
CAVIUM, INC.
NOTES TO CONSOLIDATED FINANCIAL STATEMENTS
1. Organization and Significant Accounting Policies
Organization
Cavium, Inc., (the “Company”), was incorporated in the state of California on November 21, 2000 and was reincorporated in the state of Delaware effective February 6, 2007. The Company designs, develops and markets semiconductor processors for intelligent and secure networks.
Acquisition of QLogic
On August 16, 2016, the Company completed the acquisition of QLogic Corporation, which we subsequently converted to a limited liability company. Where we refer to “QLogic” in this document, we refer to QLogic Corporation for time periods prior to the conversion to a limited liability company, and to the limited liability company for time periods after the conversion. QLogic designs and supplies high-performance server and storage networking connectivity products that provide, enhance and manage computer data communication used in enterprise, managed service provider and cloud service provider datacenters. See Note 2 of Notes to Consolidated Financial Statements for further discussion regarding the Company’s acquisition of QLogic.
Pending Acquisition by Marvell
On November 19, 2017, the Company entered into an Agreement and Plan of Merger with Marvell Technology Group Ltd., a Bermuda exempted company (“Marvell” or “Parent”) and Kauai Acquisition Corp., a Delaware corporation and an indirect wholly owned subsidiary of Parent (“Merger Sub”) (the “Marvell Merger Agreement”). Pursuant to the Marvell Merger Agreement, Merger Sub will be merged with and into the Company (the “Merger”), with the Company continuing as an indirect wholly owned subsidiary of Parent. Subject to the terms and conditions set forth in the Marvell Merger Agreement, at the effective time of the Merger, each share of common stock of the Company (“Company Share”) issued and outstanding immediately prior to the effective time of the Merger (other than (i) Company Shares held by the Company (or held in the Company’s treasury) or held by Parent, Merger Sub or any other subsidiary of Parent, (ii) Company Shares held, directly or indirectly, by any subsidiary of the Company, or (iii) Company Shares with respect to which appraisal rights are properly exercised and not withdrawn under Delaware law) will be converted into the right to receive 2.1757 common shares, $0.002 par value per share, of Parent (each, a “Parent Share”) and $40.00 in cash, without interest (the “Merger Consideration”).
In general, as a result of the Merger, at the effective time of the Merger, (i) each stock option, then outstanding, whether vested or unvested, shall be assumed by Parent and converted into an option to purchase, on the same terms and conditions as were applicable under such company stock option, Parent Shares at a conversion ratio as set forth in the Marvell Merger Agreement; (ii) unvested restricted stock units will be assumed and converted into Marvell restricted stock units at a conversion ratio as set forth in the Marvell Merger Agreement; (iii) vested restricted stock units (including restricted stock units that will vest just prior to or as of the effective time of the Merger) will receive the Merger Consideration based on the number of shares of our common stock underlying the restricted stock unit; and (iv) unvested performance-based restricted stock units will be assumed by Marvell and converted into Marvell restricted stock units (based on target level of performance achieved as of the last trading day prior to the closing of the Merger and the conversion ratio as set forth in the Marvell Merger Agreement).
The Marvell Merger Agreement contains representations, warranties and covenants of the parties customary for a transaction of this type. The consummation of the Merger is subject to customary closing conditions, including, among other things, approval by the Company’s shareholders, approval by Parent’s shareholders of the issuance of Parent Shares in connection with the Merger (the “Parent Share Issuance”), and the receipt of certain regulatory clearances, including the required clearances from the Committee on Foreign Investment in the United States (“CFIUS”), the Ministry of Commerce of the People’s Republic of China (“MOFCOM”), and the Office for Competition and Consumer Protection of Poland (“OCCP).
The Marvell Merger Agreement provides Parent and us with certain termination rights, and under certain circumstances, may require Parent or the Company to pay a termination fee. The Marvell Merger Agreement provides that in certain circumstances, the Company’s board of directors has the right to terminate the Marvell Merger Agreement in order to enter into a definitive agreement relating to a superior offer. In that event, the Marvell Merger Agreement requires the Company to pay a termination fee of $180.0 million. The Marvell Merger Agreement provides that, in certain circumstances, the Marvell board of directors has the right to terminate the Merger Agreement in order to enter into a definitive agreement relating to a superior offer. In that event, the Marvell Merger Agreement provides that Marvell pay the Company a termination fee of $180.0 million. In addition, the Merger Agreement provides that Marvell will be required to pay the Company a termination fee of $50.0 million if, under certain specified circumstances, MOFCOM approval has not been obtained and the Marvell Merger Agreement is terminated. The Marvell Merger Agreement also provides that Marvell will be required to pay the Company a termination fee of $180.0 million if, under certain specified
59
circumstances, CFIUS Approval has not been obtained and the Merger Agreement is terminated. The transaction is expected to close in mid-calendar year 2018.
The Company recorded acquisition-related costs of approximately $11.2 million in the year ended December 31, 2017, primarily for outside legal and external financial advisory fees associated with the pending acquisition by Marvell. These costs were recorded in sales, general and administrative expenses in the Company’s consolidated statements of operations. Additional acquisition-related costs are expected to be incurred through the closing of the Merger.
Basis of Consolidation
The consolidated financial statements include the accounts of Cavium, Inc. and its wholly owned subsidiaries. All intercompany transactions and balances have been eliminated in consolidation. Prior to the closing of the acquisition of Xpliant, Inc. (“Xpliant”) in April 2015, as discussed in Note 2 of Notes to Consolidated Financial Statements, the Company accounted for Xpliant as a variable interest entity, or VIE. Under the accounting principles generally accepted in the United States of America, or US GAAP, a VIE is required to be consolidated by its primary beneficiary. The primary beneficiary is the party that absorbs a majority of the VIE’s anticipated losses and/or a majority of the expected returns. All intercompany transactions and balances have been eliminated in consolidation.
Use of Estimates
The preparation of financial statements in conformity with accounting principles generally accepted in the United States requires management to make estimates and assumptions that affect the amounts reported in its consolidated financial statements and accompanying notes. Management bases its estimates on historical experience and on various other assumptions it believes to be reasonable under the circumstances, the results of which form the basis of making judgments about the carrying values of assets and liabilities. Actual results could differ from those estimates.
Revenue Recognition
The Company primarily derives its revenue from sales of semiconductor products to original contract manufacturers, or OEM, or through an OEM’s contract manufacturers or distributors. To a lesser extent, the Company also derive revenue from licensing software and related maintenance and support and from professional service arrangements. The Company recognizes revenue when (i) persuasive evidence of a binding arrangement exists; (ii) delivery has occurred or service has been rendered; (iii) the price is deemed fixed or determinable and free of contingencies and significant uncertainties; and (iv) collectibility is reasonably assured.
The Company records a reduction in revenue for provision for estimated sales returns in the same period the related revenues are recorded. These estimates are based on historical patterns of return, analysis of credit memo data and other known factors at the time. The Company also records reductions of revenue for pricing adjustments, such as competitive pricing programs and rebates, in the same period that the related revenue is recorded. In 2016, the Company started its rebate programs with certain customers. In addition, the Company assumed and continued the existing QLogic rebate programs following the closing of the QLogic acquisition. The Company accrues the full potential rebates at the time of sale and does not apply a breakage factor. The reversal of the accrual of unclaimed rebate will be made if the specific rebate programs contractually ends and when the Company believes that the unclaimed rebates are no longer subject to payment. Rebates and accrued rebates balances included in the Company’s consolidated financial statements for the periods presented were not material.
Revenue is recognized upon shipment to distributors with limited rights of returns and price protection if the Company concludes that it can reasonably estimate the credit for returns and price adjustments issuable. The Company records an estimated allowance, at the time of shipment, based on the Company’s historical patterns of returns and pricing credit of sales recognized upon shipment. Credits issued to distributors or other customers have historically not been material. The inventory at these distributors at the end of the period may fluctuate from time to time mainly due to the OEM production ramps and/or new customer demands.
Software arrangements typically include time-based licenses for 12 months with related support. The Company does not sell support separately, therefore, revenue from software arrangements is recognized ratably over the support period. The software arrangement may also include professional services, and these services may be purchased separately. Professional services engagements are billed on either a fixed-fee or time-and-materials basis. For fixed-fee arrangements, professional services revenue is recognized under the proportional performance method, with the associated costs included in cost of revenue. The Company estimates the proportional performance of the arrangements based on an analysis of progress toward completion. The Company periodically evaluates the actual status of each project to ensure that the estimates to complete each contract remain accurate, and a loss is recognized when the total estimated project cost exceeds project revenue. If the amount billed exceeds the amount of revenue recognized, the excess amount is recorded as deferred revenue. Revenue recognized in any period is dependent on progress toward completion of projects in progress. To the extent we are unable to estimate the proportional performance, revenue is recognized on a completed performance basis. Revenue for time-and-materials engagements is recognized as the effort is incurred.
60
For sales that include multiple deliverables, the Company allocates revenue based on the relative selling price of the individual components. When more than one element, such as hardware and services, are contained in a single arrangement, the Company allocates revenue between the elements based on each element’s relative selling price, provided that each element meets the criteria for treatment as a separate unit of accounting.
Accounting for Stock-Based Compensation
The Company applies the fair value recognition provisions of stock-based compensation. The Company recognizes the fair value of the awards on a straight-line basis over its vesting periods. The Company estimates the grant date fair value of stock options using the Black-Scholes option valuation model. The Black-Scholes option valuation model used to determine the fair value of stock options requires various subjective assumptions, including expected volatility, expected term and the risk-free interest rates. The stock price volatility assumption is estimated using the Company’s historical stock price volatility. For options granted beginning in 2016, the Company used historical exercise patterns to estimate the expected life. Prior to 2016, the Company used the simplified method as permitted by the guidance on stock-based compensation to estimate the expected life since the Company had no sufficient history of weighted average period from the date of grant to exercise, cancellation, or expiration. The risk free interest rate is based on the implied yield currently available on United States. Treasury securities with an equivalent remaining term.
For all restricted stock unit, or RSU, grants other than RSU grants with a market condition, the fair value of the RSU grant is based on the market price of the Company’s common stock on the date of grant. For performance-based RSU grants, the Company evaluates the probability of achieving the milestones for each of the outstanding performance-based RSU grants at each reporting period and updates the related stock-based compensation expense. The fair value of market-based RSUs is determined using the Monte Carlo simulation method which takes into account multiple input variables that determine the probability of satisfying the market conditions stipulated in the award. This method requires the input of assumptions, including the expected volatility of the Company’s common stock, and a risk-free interest rate, similar to assumptions used in determining the fair value of the stock option grants discussed above.
The grant date fair value of the stock options and RSUs are recorded based upon the vesting method over the service period. Following the adoption of the updated guidance on stock-based compensation effective January 1, 2017, the Company elected to account for forfeitures when they occur, on a modified retrospective basis. The adoption of this updated guidance did not have a material impact on the Company’s consolidated financial statements.
Income Taxes
The Company accounts for income taxes under the asset and liability method. Under this method, deferred tax assets, including those related to tax loss carryforwards and credits, and liabilities are determined based on the differences between the financial statement and tax bases of assets and liabilities using enacted tax rates in effect for the year in which the differences are expected to reverse. A valuation allowance is recorded to reduce deferred tax assets when management cannot conclude that it is more-likely-than-not that the net deferred tax asset will be recovered. The valuation allowance is determined by assessing both positive and negative evidence to determine whether it is more-likely-than-not that deferred tax assets are recoverable; such assessment is required on a jurisdiction-by-jurisdiction basis.
The Company recognizes uncertain tax positions when it meets a more-likely-than-not threshold. The Company recognizes potential accrued interest and penalties related to unrecognized tax benefits as income tax expense.
61
Business Combinations
The Company accounts for business combinations using the purchase method of accounting. In accordance with the guidance provided under business combinations, the Company allocates the purchase price of business combinations to the tangible assets, liabilities and intangible assets acquired, including in-process research and development, or IPR&D, based on their estimated fair values. The excess purchase price over those fair values is recorded as goodwill. The Company’s valuation assumption of acquired assets and assumed liabilities requires significant estimates, especially with respect to intangible assets. The Company determines the recognition of intangible assets based on the following criteria: (i) the intangible asset arises from contractual or other rights; or (ii) the intangible is separable or divisible from the acquired entity and capable of being sold, transferred, licensed, returned or exchanged. The Company estimates the fair value based upon assumptions the Company believes to be reasonable, but which are inherently uncertain and unpredictable and, as a result, actual results may differ from estimates. Estimates associated with the accounting for acquisitions may change as additional information becomes available regarding the assets acquired and liabilities assumed. Acquisition-related costs, including advisory, legal, accounting, valuation and other costs, are expensed in the periods in which the costs are incurred. The results of operations of acquired businesses are included in the consolidated financial statements from the acquisition date.
Goodwill and indefinite-lived intangible assets
Goodwill is measured as the excess of the cost of an acquisition over the sum of the amounts assigned to tangible and identifiable intangible assets and liabilities assumed. The Company evaluates goodwill for impairment at its single reporting unit level at least on an annual basis in the fourth quarter of the calendar year or whenever events and changes in circumstances suggest that the carrying amount may not be recoverable from its estimated future cash flow. The Company performs a qualitative assessment to determine if any events have occurred or circumstances exist that would indicate that it is more-likely-than-not that a goodwill impairment exists. If any indicators exist based on the qualitative analysis that it is more-likely-than-not that a goodwill impairment exists, the quantitative test is required. Otherwise, no further testing is required.
IPR&D acquired in an asset acquisition is capitalized only if it has an alternative future use. IPR&D recorded as an asset acquired through business combinations is not amortized but instead is tested annually for impairment, or more frequently when events or changes in circumstances indicate that the asset might be impaired. The Company initially assesses qualitative factors to determine whether it is more likely than not that the fair value of IPR&D is less than its carrying amount, and if so, the Company conducts a quantitative impairment test. The quantitative impairment test consists of a comparison of the fair value of IPR&D to its carrying amount. If the carrying value exceeds its fair value, an impairment loss is recognized in an amount equal to the difference. When an IPR&D project is complete, the related intangible asset becomes subject to amortization and impairment analysis as a long-lived asset.
Long-lived assets
The Company reviews long-lived assets, including property and equipment and intangible assets, for impairment whenever events or changes in business circumstances indicate that the carrying amount of the assets (or asset group) may not be fully recoverable. Whenever events or changes in circumstances suggest that the carrying amount of long-lived assets may not be recoverable, the Company estimates the future cash flows expected to be generated by the assets (or asset group) from its use or eventual disposition. If the sum of the expected future cash flows is less than the carrying amount of those assets, the Company recognizes an impairment loss based on the excess of the carrying amount over the fair value of the assets. Significant management judgment is required in the grouping of long-lived assets and forecasts of future operating results that are used in the discounted cash flow method of valuation.
Inventories
Inventories consist of work-in-process and finished goods. Inventories not related to an acquisition are stated at the lower of cost (determined using the first-in, first-out method), or market value (estimated net realizable value). Inventories from acquisitions are stated at fair value at the date of acquisition. The Company writes down excess and obsolete inventory based on its age and forecasted demand, generally over a 12 month period, which includes estimates taking into consideration the Company’s outlook on uncertain events such as market and economic conditions, technology changes, new product introductions and changes in strategic direction. Actual demand may differ from forecasted demand and such differences may have a material effect on recorded inventory values. Inventory write-downs are not reversed until the related inventories have been sold or scrapped.
Inventories acquired through business combinations are recorded at their acquisition date fair value, which is the estimated selling price less the costs of disposal and a normal profit allowance.
62
Property and Equipment
Property and equipment are stated at cost and depreciated using the straight-line method generally over the following estimated useful lives:
|
|
Estimated |
|
|
|
Software, design tools, computer and other equipment |
|
1 to 5 years |
|
|
Test equipment and mask costs |
|
1 to 5 years |
|
|
Furniture and office equipment |
|
1 to 5 years |
|
Leasehold improvements are amortized over the shorter of estimated useful lives or unexpired lease term. Additions and improvements that increase the value or extend the life of an asset are capitalized. Upon retirement or sale, the cost of assets disposed of and the related accumulated depreciation are removed from the accounts and any resulting gain or loss is credited or charged to income. Ordinary repairs and maintenance costs are expensed as incurred.
The Company capitalizes the cost of fabrication masks that are reasonably expected to be used during production manufacturing. Such amounts are included within property and equipment and are depreciated over a period of 12 to 24 months and recorded as a component of cost of revenue. If the Company does not reasonably expect to use the fabrication mask during production manufacturing, the related mask costs are expensed to research and development in the period in which the costs are incurred.
The Company leases certain design tools under financing arrangements which are included in property and equipment. The Company also capitalizes acquired internally used software in property and equipment. Subsequent additions, modifications or upgrades to internally used software are capitalized to the extent it provides additional usage or functionality.
Fair Value Measurements
Fair value is the exchange price that would be received for an asset or paid to transfer a liability (an exit price) in the principal or most advantageous market for the asset or liability in an orderly transaction between market participants on the measurement date. Valuation techniques used to measure fair value must maximize the use of observable inputs and minimize the use of unobservable inputs. The fair value hierarchy is based on three levels of inputs that may be used to measure fair value. The first two levels of inputs are considered observable and the last unobservable. A description of the three levels of inputs is as follows:
|
|
• |
Level 1 – Quoted prices in active markets for identical assets or liabilities. |
|
|
• |
Level 2 – Inputs other than Level 1 that are observable, either directly or indirectly, such as quoted prices for similar assets or liabilities; quoted prices in markets that are not active; or other inputs that are observable or can be corroborated by observable market data for substantially the full term of the assets or liabilities. |
|
|
• |
Level 3 – Unobservable inputs that are supported by little or no market activity and that are significant to the fair value of the assets or liabilities. |
Cash and Cash Equivalents
The Company considers all highly liquid investments with an original or remaining maturity of 90 days or less at the date of purchase to be cash equivalents. Cash equivalents consist of an investment in a money market fund.
Allowance for Doubtful Accounts
The Company reviews its allowance for doubtful accounts by assessing individual accounts receivable over a specific age and amount. The Company’s allowance for doubtful accounts were not material for the periods presented.
Concentration of Risk
The Company’s products are currently manufactured, assembled and tested by third-party contractors in Asia. There are no long-term agreements with any of these contractors. A significant disruption in the operations of one or more of these contractors would impact the production of the Company’s products for a substantial period of time, which could have a material adverse effect on the Company’s business, financial condition and results of operations.
63
Financial instruments that potentially subject the Company to a concentration of credit risk consist of cash, cash equivalents and accounts receivable. The Company deposits cash with credit worthy financial institutions. The Company has not experienced any losses on its deposits of cash. Management believes that the financial institutions the Company utilizes are reputable and, accordingly, minimal credit risk exists. The Company’s cash equivalents are invested in a money market fund. The Company follows an established investment policy and set of guidelines to monitor, manage and limit the Company’s exposure to interest rate and credit risk. The policy sets forth credit quality standards and limits the Company’s exposure to any one issuer, as well as the maximum exposure to various asset classes.
A majority of the Company’s accounts receivable are derived from customers headquartered in the United States. The Company performs ongoing credit evaluations of its customers’ financial condition and, generally, requires no collateral from its customers. The Company provides an allowance for doubtful accounts receivable based upon the expected collectability of accounts receivable.
Summarized below are individual customers whose accounts receivable balances were 10% or higher of the consolidated gross receivable:
|
|
|
As of December 31, |
|
|||||
|
|
|
2017 |
|
|
2016 |
|
||
|
Percentage of gross accounts receivable |
|
|
|
|
|
|
|
|
|
Customer A |
|
|
15% |
|
|
|
15% |
|
|
Customer B |
|
11% |
|
|
* |
|
||
|
Customer C |
|
* |
|
|
|
12% |
|
|
|
Customer D |
|
* |
|
|
|
11% |
|
|
|
Customer E |
|
* |
|
|
|
11% |
|
|
|
* |
Represents less than 10% of the gross accounts receivable for the respective year end. |
Summarized below are individual OEM customers whose revenue balances were 10% or higher of the consolidated net revenue:
|
|
|
Year Ended December 31, |
|
|||||||||
|
|
|
2017 |
|
|
2016 |
|
|
2015 |
|
|||
|
Percentage of revenue by customer |
|
|
|
|
|
|
|
|
|
|
|
|
|
Customer C |
|
12% |
|
|
* |
|
|
* |
|
|||
|
Customer D |
|
13% |
|
|
* |
|
|
* |
|
|||
|
Customer F |
|
11% |
|
|
12% |
|
|
13% |
|
|||
|
Customer G |
|
* |
|
|
13% |
|
|
18% |
|
|||
|
Customer H |
|
* |
|
|
* |
|
|
12% |
|
|||
* Represents less than 10% of the net revenue for the respective year end.
Deferred revenue
The Company records deferred revenue for customer billings and advance payments received from customers before the performance obligations have been completed and/or services have been performed for products and/or service related agreements.
Warranty Accrual
The Company’s products are generally subject to a one-year warranty period though certain products carry a warranty for up to three years. The Company records a liability for product warranty obligations in the period the related revenue is recorded based on historical warranty experience. Warranty expenses and warranty accrual included in the Company’s consolidated financial statements were not material for the periods presented.
Deferred Research and Development Cost
Occasionally, the Company receives funding from third-party companies for certain collaboration research and development. The Company records the funding received as deferred research and development costs within accrued expense and other liabilities. The liability for deferred research and development cost will be reduced over time to offset the research and development expenses incurred by the Company related to such funding.
64
Research and Development
Research and development costs are expensed as incurred and primarily include personnel costs, prototype expenses, which include the cost of fabrication mask costs not reasonably expected to be used in production manufacturing, and allocated facilities costs as well as depreciation of equipment used in research and development.
Advertising
The Company expenses advertising costs as incurred. Advertising expenses included in the Company’s consolidated statements of operations were not material for the periods presented.
Operating Leases
The Company recognizes rent expense on a straight-line basis over the term of the lease. The difference between rent expense and rent paid is recorded as accrued rent in accrued expenses and other current and non-current liabilities on the consolidated balance sheets. In instances where the Company leases an existing structure and is entitled for reimbursement from a landlord for the tenant improvements, the Company classifies the amount as an incentive and includes the amount as deferred rent credits (either prepaid rent or accrued rent) on the consolidated balance sheets. The deferred rent credit is amortized as rent expense on a straight-line basis over the base term of the lease. Landlord reimbursements from these transactions are included in cash flows from operating activities as changes in assets and liabilities.
Other Comprehensive Income (Loss)
Comprehensive income (loss) includes all changes in equity other than transactions with stockholders. The Company’s accumulated other comprehensive income (loss) consists of foreign currency translation adjustments.
Foreign Currency Remeasurement
Prior to the completion of operational and tax restructuring during the third quarter of 2017, certain of the Company’s foreign subsidiaries from the QLogic acquisition used functional currency other than United States dollars. Assets and liabilities of these subsidiaries were translated to United States dollars at exchange rates in effect at the balance sheet date, and income and expenses were translated at average exchange rates during the period. The resulting translation adjustments were recorded as a component of accumulated other comprehensive income (loss).
Following the completion of operational and tax restructuring of certain QLogic foreign subsidiaries as discussed above, the Company uses the United States dollar as functional currency for most of its subsidiaries. Assets and liabilities denominated in non-United States dollars are remeasured into United States dollars at end-of-period exchange rates for monetary assets and liabilities. Historical exchange rates are used for non-monetary assets and liabilities. Income and expense amounts are remeasured at average exchange rates in effect during each period, except those income and expense amounts related to the non-monetary assets and liabilities which are measured at historical exchange rates. The aggregate foreign exchange gains and losses, which are included in other, net in the consolidated statements of operations were not material for the periods presented.
Recently Adopted Accounting Standard
Effective January 1, 2017, the Company adopted the updated guidance on stock-based compensation issued by the Financial Accounting Standards Board, or FASB, in March 2016. Under the new guidance, all excess tax benefits and tax deficiencies will be recognized in the income statement as they occur. This replaced the previous guidance, which requires tax benefits that exceed compensation cost (windfalls) to be recognized in equity. It also eliminates the need to maintain a “windfall pool,” and removes the requirement to delay recognizing a windfall until it reduces current taxes payable. Upon adoption of this new guidance, in the first quarter of 2017, the Company recognized deferred tax assets of $101.7 million for the excess tax benefits that arose directly from tax deductions related to equity compensation greater than the amounts recognized for financial reporting and also recognized an increase of an equal amount in the valuation allowance against those deferred tax assets. Upon adoption, the Company elected to account for forfeitures when they occur, on a modified retrospective basis, which did not have a material impact on the Company’s consolidated financial statements. The new guidance also changed the cash flow presentation of excess tax benefits, classifying them as operating inflows, consistent with other cash flows related to income taxes. Further, following the adoption of this updated guidance, there will be additional dilutive effects in earnings per share calculations because there will no longer be excess tax benefits recognized in additional paid in capital.
65
Update to Recently Issued Accounting Standards Not Yet Effective
The FASB issued accounting standard updates that create a single source of revenue guidance under US GAAP for all companies, in all industries, effective for annual reporting periods beginning after December 15, 2017, including interim periods within that reporting period. The Company will adopt this standard effective on January 1, 2018, with an immaterial estimated cumulative effect adjustment to its opening accumulated deficit, under the modified retrospective approach. The Company’s assessment process consisted of reviewing its current accounting policies and practices to identify potential differences that would result from applying the requirements of the new standard to its revenue contracts and identifying appropriate changes to its business processes, systems and controls to support revenue recognition and disclosure requirements under the new standard. The Company’s evaluation of its revenue sources and their treatment under the new standard is nearing completion. The Company has concluded the unit of accounting will be consistent with the current revenue guidance. The Company believes that the new standard and related new revenue recognition policies will not result in a material change to its consolidated financial statements, including no change to the timing of recognition of revenue for the sale of its semiconductor products, which represent the substantial majority of the Company’s consolidated revenue.
In May 2017, the FASB issued an update to the guidance on stock-based compensation which clarifies when changes to the terms or conditions of a share-based payment award must be accounted for as modifications. The new guidance will reduce diversity in practice and result in fewer changes to the terms of an award being accounted for as modifications. Under this updated standard, an entity will not apply modification accounting to a share-based payment award if the award’s fair value, vesting conditions and classification as an equity or liability instrument are the same immediately before and after the change. The guidance is effective for annual periods, and interim periods within those annual periods, beginning after December 15, 2017, and will be applied prospectively to awards modified on or after the adoption date. The Company will adopt this standard effective on January 1, 2018 and does not expect it to have a material impact on its consolidated financial statements.
In January 2017, the FASB issued an update to the guidance to simplify the measurement of goodwill by eliminating the Step 2 impairment test. The update is effective for goodwill impairment tests in fiscal years beginning after December 15, 2019, though early adoption is permitted. The Company is currently assessing the impact of this new guidance but does not expect it to have a material impact on its consolidated financial statements.
In November 2016, the FASB issued an update to the guidance on statement of cash flows - restricted cash presentation. This standard is effective for fiscal years beginning after December 15, 2017, including interim periods within those fiscal years. Early adoption is permitted, including adoption in an interim period, but any adjustments must be reflected as of the beginning of the fiscal year that includes that interim period. The new standard must be adopted retrospectively. The Company will adopt this standard effective on January 1, 2018 and does not expect it to have a material impact on its consolidated financial statements. The Company does not have restricted cash in the periods presented.
In October 2016, the FASB issued an update to the guidance on income taxes. This new guidance requires an entity to recognize the income tax consequences of an intra-entity transfer of an asset, other than inventory, when the transfer occurs. This new guidance is effective for fiscal years beginning after December 15, 2017, and interim periods within those fiscal years. The Company will adopt this standard effective on January 1, 2018 and does not expect it to have a material impact on its consolidated financial statements.
In August 2016, the FASB issued new guidance on cash flow classification of certain cash receipts and cash payments. This new guidance is effective for fiscal years beginning after December 15, 2017, including interim periods during the annual period and require adoption on a retrospective basis unless it is impracticable to apply, in which case it would be required to apply the amendments prospectively as of the earliest date practicable. The Company will adopt this standard effective on January 1, 2018 and does not expect it to have a material impact on its consolidated financial statements.
In February 2016, the FASB issued updated guidance on leases which requires a lessee to recognize the assets and lease liabilities on the balance sheet for certain leases classified as operating leases under previous GAAP. In September 2017, the FASB provided additional clarification and implementation guidance on leases. This updated guidance is effective for annual and interim periods beginning after December 15, 2018. Early adoption is permitted. Although the Company is currently evaluating the impact this new guidance will have on its consolidated financial statements and related disclosures, the Company expects that most of its operating lease commitments will be subject to the new standard and will be recognized as operating lease liabilities and right-of-use assets upon adoption.
In January 2016, the FASB issued updated guidance on Recognition and Measurement of Financial Assets and Financial Liabilities. The amendments in this updated guidance are effective for annual and interim periods beginning after December 15, 2017. The Company will adopt this standard effective on January 1, 2018 and does not expect it to have a material impact on its consolidated financial statements.
66
2. Business Combinations
QLogic Corporation
On August 16, 2016, pursuant to the terms of an Agreement and Plan of Merger dated June 15, 2016, by and among the Company, Quasar Acquisition Corp. (a wholly owned subsidiary of the Company) and QLogic (the “QLogic Merger Agreement”), the Company acquired all outstanding shares of common stock of QLogic (the “QLogic shares”) pursuant to an exchange offer for $11.00 per share in cash and 0.098 of a share of the Company’s common stock for each share of QLogic stock (“Transaction Consideration”) followed by a merger. The acquisition was funded with a combination of cash and proceeds from debt financing. See Note 11 of Notes to Consolidated Financial Statements for discussion of the debt financing.
The following table summarizes the total acquisition consideration (in thousands, except shares and per share data):
|
Cash consideration to QLogic common stockholders |
$ |
936,961 |
|
|
Common stock (8,364,018 shares of the Company's common stock at $51.55 per share) |
|
431,165 |
|
|
Cash consideration for vested "in the money" stock options and fractional shares |
|
1,934 |
|
|
Fair value of replacement equity awards attributable to pre-acquisition service |
|
9,433 |
|
|
Total acquisition consideration |
$ |
1,379,493 |
|
Pursuant to the QLogic Merger Agreement, the Company assumed the unvested equity awards originally granted by QLogic and converted them into the Company’s equivalent awards. The portion of the fair value of partially vested awards associated with prior service of QLogic employees represented a component of the total consideration, as presented above. The Company also made cash payments for vested and in the money stock options and for the fractional shares that resulted from conversion as specified in the QLogic Merger Agreement.
The Company allocated the acquisition consideration to tangible and identifiable intangible assets acquired and liabilities assumed based on their estimated fair values as of the acquisition date. The fair value of the acquired tangible and identifiable intangible assets were determined based on inputs that are unobservable and significant to the overall fair value measurement. It is also based on estimates and assumptions made by management at the time of the acquisition. As such, this was classified as Level 3 fair value hierarchy measurements and disclosures.
The Company allocated the acquisition consideration to tangible and identifiable intangible assets acquired and liabilities assumed based on their estimated fair values as of the acquisition date. The allocation was as follows:
|
|
Amounts Previously Recognized as of Acquisition Date (Provisional) |
|
|
Measurement Period Adjustments |
|
|
Amounts Recognized as of Acquisition Date (Final Allocation) |
|
|||
|
|
(amounts in thousands) |
|
|||||||||
|
Cash and cash equivalents |
$ |
365,065 |
|
|
$ |
- |
|
|
$ |
365,065 |
|
|
Marketable securities |
|
375 |
|
|
|
- |
|
|
|
375 |
|
|
Accounts receivable |
|
65,576 |
|
|
|
- |
|
|
|
65,576 |
|
|
Inventories |
|
63,300 |
|
|
|
- |
|
|
|
63,300 |
|
|
Prepaid expense and other current assets |
|
8,274 |
|
|
|
3,121 |
|
|
|
11,395 |
|
|
Property and equipment |
|
81,890 |
|
|
|
- |
|
|
|
81,890 |
|
|
Intangible assets |
|
721,700 |
|
|
|
- |
|
|
|
721,700 |
|
|
Other assets |
|
1,559 |
|
|
|
- |
|
|
|
1,559 |
|
|
Goodwill |
|
169,589 |
|
|
|
(3,375 |
) |
|
|
166,214 |
|
|
Accounts payable |
|
(41,776 |
) |
|
|
- |
|
|
|
(41,776 |
) |
|
Accrued expense and other current liabilities |
|
(21,884 |
) |
|
|
- |
|
|
|
(21,884 |
) |
|
Deferred revenue |
|
(603 |
) |
|
|
- |
|
|
|
(603 |
) |
|
Deferred tax liability |
|
(17,237 |
) |
|
|
- |
|
|
|
(17,237 |
) |
|
Other non-current liabilities |
|
(16,335 |
) |
|
|
254 |
|
|
|
(16,081 |
) |
|
Total acquisition consideration |
$ |
1,379,493 |
|
|
$ |
- |
|
|
$ |
1,379,493 |
|
67
The provisional amounts presented in the table above pertained to the preliminary purchase price allocation reported in the Company’s December 31, 2016 Annual Report on Form 10-K. The measurement period adjustments recorded in the third quarter of 2017 were primarily related to the completion of the final QLogic income tax returns. The Company does not believe that the measurement period adjustments had a material impact on its consolidated statements of operations, balance sheets or cash flows in any periods previously reported.
The valuation of identifiable intangible assets and their estimated useful lives are as follows:
|
|
Estimated Asset Fair Value |
|
|
Weighted Average Useful Life (Years) |
|
||
|
|
(in thousands, except for useful life) |
|
|||||
|
Existing and core technology |
$ |
578,400 |
|
|
|
6 |
|
|
In-process research and development (IPRD) |
|
78,900 |
|
|
n/a |
|
|
|
Customer relationships |
|
51,100 |
|
|
|
10 |
|
|
Tradename and trademark |
|
13,300 |
|
|
|
5 |
|
|
|
$ |
721,700 |
|
|
|
|
|
The IPR&D consists of two projects relating to the development of process technologies to manufacture next generation Fibre Channel and Ethernet products. The IPRD are accounted for as an indefinite-lived intangible asset until the underlying projects are completed or abandoned. The IPRD will not be amortized until the completion of the related products which is determined by when the underlying projects reached technological feasibility. Upon completion, the IPRD will be amortized over its estimated useful life; useful lives for IPRD are expected to range between 5 to 6 years. During the second quarter of 2017, the underlying project related to Ethernet had achieved production status and concurrently was introduced to the market. As such, the Company reclassified $18.6 million of the IPRD associated with the Ethernet project to existing and core technology and it is being amortized over the estimated useful life of the asset. The Fibre Channel project is expected to be completed in fiscal year 2019.
The fair value of existing and core technology and IPR&D was determined by performing a discounted cash flow analysis using the multi period excess earnings approach. This method includes discounting the projected cash flows associated with each technology over its expected life. Projected cash flows attributable to the existing and core technology and IPR&D were discounted to their present value at a rate commensurate with the perceived risk. The valuation of customer relationships was based on the distributor method, taking into account the profit margin a market participant distributor would obtain in selling QLogic products. The useful lives of customer relationships are estimated based upon customer turnover data and management estimates. Other identifiable intangible assets consisted of tradename and trademark, valued using a relief from royalty method. The useful lives of tradename and trademark are expected to correlate to the life of the technology or customer relationships.
The assumptions used in forecasting cash flows for each of the identified intangible assets included consideration of the following:
|
|
• |
Historical performance including sales and profitability. |
|
|
• |
Business prospects and industry expectations |
|
|
• |
Estimated economic life of asset |
|
|
• |
Development of new technologies |
|
|
• |
Acquisition of new customers and attrition of existing customers |
|
|
• |
Obsolescence of technology over time |
Depending on the structure of a particular acquisition, goodwill and identifiable intangible assets may not be deductible for tax purposes. Goodwill recorded in the QLogic acquisition is not expected to be deductible for tax purposes. The factors that contributed to the recognized goodwill with the acquisition of QLogic include the Company’s belief that the acquisition will create a more diverse semiconductor company with expansive offerings which will enable the Company to expand its product offerings and expected synergies from the combined operations of the Company and QLogic.
The Company incurred $16.6 million in acquisition related costs which were recorded in selling, general and administrative expense in the consolidated statements of operations in the year ended December 31, 2016.
68
Unaudited Supplemental Pro Forma Information
The unaudited supplemental pro forma financial information presented below is for illustrative purposes only and is not necessarily indicative of the financial operations or results of operations that would have been realized if the acquisition had been completed on the date indicated, does not reflect synergies that might have been achieved, nor is it indicative of future operating results or financial position. The pro forma adjustments are based upon currently available information and certain assumptions the Company believe are reasonable under the circumstances.
The following unaudited supplemental pro forma financial information summarizes the results of operations for the periods presented, as if the acquisition was completed on January 1, 2015. The unaudited supplemental pro forma information reports actual operating results, adjusted to include the pro forma effect of certain fair value adjustments for acquired items, such as the amortization of identifiable intangible assets, depreciation of property and equipment and inventories. It also includes pro forma adjustments for stock-based compensation expense related to replacement equity awards, interest expense on debt and the related tax effects of the acquisition. In accordance with the pro forma acquisition date, the Company recorded in the year ended December 31, 2015 supplemental pro forma financial information the cost of goods sold from the fair value mark-up in acquired inventory and $40.9 million for the acquisition-related transaction costs incurred by the Company and QLogic. The corresponding adjustments to the supplemental pro forma financial information in the year ended December 31, 2016 were made for the aforementioned pro forma adjustments.
QLogic constituted approximately 26% of the consolidated net revenue for the year ended December 31, 2016. Post-acquisition income (loss) on a standalone basis is impracticable to determine as, on the acquisition date, the Company implemented a plan developed prior to the completion of the acquisition and began to immediately integrate QLogic into the Company’s existing operations, engineering groups, sales distribution networks and management structure.
The supplemental pro forma financial information for the periods presented is as follows:
|
|
Year Ended December 31, |
|
|||||
|
|
2016 |
|
|
2015 |
|
||
|
|
(in thousands, except per share data) |
|
|||||
|
Pro forma net revenue |
$ |
881,498 |
|
|
$ |
885,276 |
|
|
Pro forma net loss |
|
(131,849 |
) |
|
|
(167,626 |
) |
|
Pro forma net loss per share, basic and diluted |
$ |
(1.99 |
) |
|
$ |
(2.62 |
) |
Xpliant, Inc.
Pursuant to the Agreement and Plan of Merger and Reorganization (the “Xpliant Merger Agreement”) between the Company and Xpliant, Inc., a final closing occurred on April 29, 2015 as discussed in detail below. Between May 2012 and March 2015, the Company entered into several note purchase agreements and promissory notes with Xpliant to provide cash advances. Xpliant was a Delaware incorporated and privately held company, engaged in the design and development of next generation software defined network switch chips. Prior to the closing of the merger pursuant to the Xpliant Merger Agreement, the Company concluded that Xpliant was a VIE as the Company was Xpliant’s primary beneficiary due to the Company’s involvement with Xpliant and the Company’s purchase option to acquire Xpliant. As such, the Company has included the accounts of Xpliant in the consolidated financial statements. The Company had made total cash advances of $85.8 million, consisting of $10.0 million under nine convertible notes which, as amended, matured on August 31, 2014 and $75.8 million under several promissory notes which matured between April 2015 and March 2016. All promissory notes were cancelled as of July 31, 2015.
On July 30, 2014, the Company entered into the Xpliant Merger Agreement, which was amended on October 8, 2014 and March 31, 2015 with Xpliant. Under the terms of the Xpliant Merger Agreement, as amended, the final closing occurred on April 29, 2015 and the Company paid approximately $3.6 million in total cash consideration in exchange for all outstanding securities held by Xpliant’s stockholders. Based on the substance of the transaction, the Company recorded the payments of cash consideration to Xpliant stockholders as a decrease to the Company’s additional paid-in capital within stockholders’ equity.
69
3. Net Loss Per Common Share
Basic net income (loss) per share is computed using the weighted-average common shares outstanding. Diluted net income per share is computed using the weighted-average common shares outstanding and any dilutive potential common shares. Diluted net loss per common share is computed using the weighted-average common shares outstanding and excludes all dilutive potential common shares when the Company is in a net loss position their inclusion would be anti-dilutive. The Company’s dilutive securities primarily include stock options and restricted stock units.
The following outstanding options and restricted stock units were excluded from the computation of diluted net loss per common share for the periods presented because including them would have had an anti-dilutive effect:
|
|
Year Ended December 31, |
|
|||||||||
|
|
2017 |
|
|
2016 |
|
|
2015 |
|
|||
|
|
(in thousands) |
|
|||||||||
|
Options to purchase common stock |
|
1,130 |
|
|
|
1,194 |
|
|
|
2,028 |
|
|
Restricted stock units |
|
3,623 |
|
|
|
4,119 |
|
|
|
2,194 |
|
4. Fair Value Measurements
At December 31, 2017 and 2016, the Company’s cash equivalents comprised of an investment in a money market fund. In accordance with the guidance for fair value measurements and disclosures, the Company determined the fair value hierarchy of its money market fund as Level 1, which approximated $39.7 million and $61.4 million as of December 31, 2017 and 2016, respectively. The carrying amount of the Company’s accounts receivable, accounts payable and accrued expenses and other current liabilities approximate fair value due to their short term maturities.
There are no other financial assets and liabilities, except those disclosed in Notes 2, 5, 7, 11 and 13 of Notes to Consolidated Financial Statements that require Level 2 or Level 3 fair value hierarchy measurements and disclosures.
Inventories
|
|
As of December 31, |
|
|||||
|
|
2017 |
|
|
2016 |
|
||
|
|
(in thousands) |
|
|||||
|
Work-in-process |
$ |
54,835 |
|
|
$ |
61,363 |
|
|
Finished goods |
|
38,839 |
|
|
|
58,329 |
|
|
|
$ |
93,674 |
|
|
$ |
119,692 |
|
Property and equipment, net
|
|
As of December 31, |
|
|||||
|
|
2017 |
|
|
2016 |
|
||
|
|
(in thousands) |
|
|||||
|
Test equipment and mask costs |
$ |
174,710 |
|
|
$ |
138,633 |
|
|
Software, design tools, computer and other equipment |
|
114,322 |
|
|
|
87,648 |
|
|
Furniture, office equipment and leasehold improvements |
|
50,754 |
|
|
|
12,927 |
|
|
Construction in progress |
|
20,368 |
|
|
|
4,767 |
|
|
|
|
360,154 |
|
|
|
243,975 |
|
|
Less: accumulated depreciation and amortization |
|
(167,639 |
) |
|
|
(93,113 |
) |
|
|
$ |
192,515 |
|
|
$ |
150,862 |
|
Depreciation and amortization expense was $76.7 million, $46.7 million and $32.9 million for years ended December 31, 2017, 2016 and 2015, respectively. Certain fully depreciated property and equipment have been eliminated from both the gross and accumulated amount as they were disposed of as the Company no longer utilized them.
The Company leases certain design tools under financing arrangements which are included in property and equipment, which total cost, net of accumulated amortization amounted to $43.7 million and $46.3 million at December 31, 2017 and 2016, respectively. Amortization expense related to assets recorded under capital lease and certain financing arrangements was $18.4 million, $16.8 million and $14.7 million for the years ended December 31, 2017, 2016 and 2015, respectively.
70
The Company decided to rationalize certain product lines in March 2017. As a result, the Company wrote-down certain assets in 2017 totaling $22.4 million which was recorded in the condensed consolidated statements of operations within cost of revenue of $21.4 million, research and development expense of $0.4 million and sales, general and administrative expense of $0.6 million. The assets written-down included inventories of $17.3 million, property and equipment of $4.5 million, and intangibles and other assets of $0.6 million.
Sale of held for sale assets
In September 2016, the Company began to actively market the real property located in Aliso Viejo, California that was acquired in the QLogic acquisition. The Company classified this real property as held for sale assets on its consolidated balance sheet as of September 30, 2016. On December 16, 2016, the Company completed the sale of this real property for a total net cash consideration of $32.4 million. Concurrently, the Company leased back the property on a month-to-month basis until November 2017. The first six months of the leaseback were rent free; thereafter, the rents were lower than the market rates. For accounting purposes, these rents were deemed to have been netted against the sale proceeds and represented a prepaid rent. Accordingly, the Company recorded $1.8 million off-market rental rate adjustment as prepaid rent on the consolidated balance sheets and such amount was recognized as rent expense over the lease-back term. The Company adjusted the fair value of the acquired real property from QLogic based upon the business combination guidance on measurement period, and accordingly did not recognize a gain or loss upon the sale of the related asset.
Other Asset Acquisition
In November 2016, the Company entered into an asset purchase agreement with a third-party company. Pursuant to the asset purchase agreement, the Company acquired property and equipment of $9.2 million and IPR&D of $2.0 million. The IPR&D was recorded at its relative fair using the multi-period excess earnings valuation approach and was written off immediately as the asset had no alternative future use. The fair value of the IPR&D was determined based on inputs that are unobservable which was significant to the overall fair value measurement and was based on estimates and assumptions made by management at the time of the acquisition. This fair value measurement was classified as Level 3 under fair value hierarchy measurements and disclosures.
Accrued expenses and other current liabilities
|
|
As of December 31, |
|
|||||
|
|
2017 |
|
|
2016 |
|
||
|
|
(in thousands) |
|
|||||
|
Accrued compensation and related benefits |
$ |
18,576 |
|
|
$ |
18,197 |
|
|
Deferred research and development costs |
|
1,180 |
|
|
|
25,370 |
|
|
Other |
|
18,997 |
|
|
|
21,400 |
|
|
|
$ |
38,753 |
|
|
$ |
64,967 |
|
Deferred revenue
|
|
As of December 31, |
|
|||||
|
|
2017 |
|
|
2016 |
|
||
|
|
(in thousands) |
|
|||||
|
Services/support and maintenance |
$ |
8,091 |
|
|
$ |
7,773 |
|
|
Software license/subscription and other |
|
1,145 |
|
|
|
639 |
|
|
|
$ |
9,236 |
|
|
$ |
8,412 |
|
Other non-current liabilities
|
|
As of December 31, |
|
|||||
|
2017 |
|
|
2016 |
|
|||
|
|
(in thousands) |
|
|||||
|
Income tax payable |
$ |
6,605 |
|
|
$ |
12,071 |
|
|
Accrued rent |
|
12,813 |
|
|
|
2,163 |
|
|
Other |
|
6,530 |
|
|
|
4,152 |
|
|
|
$ |
25,948 |
|
|
$ |
18,386 |
|
71
6. Goodwill and Intangible Assets, Net
Goodwill
Goodwill represents the excess of the purchase price over the fair value of the net tangible and identifiable intangible assets acquired in a business combination. The carrying value of goodwill as of December 31, 2017 and 2016 was $237.7 million and $241.1 million, respectively. The change in the carrying value of goodwill from December 31, 2016 to December 31, 2017 was due to the measurement period adjustment related to the acquisition of QLogic. See Note 2 of Notes to Consolidated Financial Statements.
The Company reviews goodwill for impairment annually at the beginning of its fourth calendar quarter or whenever events or changes in circumstances that would more-likely-than-not reduce the fair value of a reporting unit below its carrying amount. The Company manages and operates as one reporting unit. The Company performed a qualitative assessment of the goodwill at the Company level as a whole and concluded that it was more-likely-than-not that goodwill was not impaired as of December 31, 2017 and 2016. In assessing the qualitative factors, the Company considered among others these key factors: (i) changes in the industry and competitive environment; (ii) market capitalization; (iii) stock price; and (iv) overall financial performance.
Intangible assets, net
|
|
|
As of December 31, 2017 |
|
|
|
|
|
|||||||||
|
|
|
Gross |
|
|
Accumulated Amortization |
|
|
Net |
|
|
Weighted average remaining amortization period (years) |
|
||||
|
|
|
(in thousands) |
|
|
|
|
|
|||||||||
|
Existing and core technology - product |
|
$ |
638,738 |
|
|
$ |
(176,199 |
) |
|
$ |
462,539 |
|
|
|
4.67 |
|
|
Technology licenses |
|
|
158,997 |
|
|
|
(70,759 |
) |
|
|
88,238 |
|
|
|
4.11 |
|
|
Customer contracts and relationships |
|
|
53,288 |
|
|
|
(9,238 |
) |
|
|
44,050 |
|
|
|
8.62 |
|
|
Trade name |
|
|
15,596 |
|
|
|
(5,954 |
) |
|
|
9,642 |
|
|
|
3.63 |
|
|
Total amortizable intangible assets |
|
$ |
866,619 |
|
|
$ |
(262,150 |
) |
|
$ |
604,469 |
|
|
|
4.42 |
|
|
IPRD |
|
|
60,300 |
|
|
|
- |
|
|
|
60,300 |
|
|
|
|
|
|
Total intangible assets |
|
$ |
926,919 |
|
|
$ |
(262,150 |
) |
|
$ |
664,769 |
|
|
|
|
|
|
|
|
As of December 31, 2016 |
|
|
|
|
|
|||||||||
|
|
|
Gross |
|
|
Accumulated Amortization |
|
|
Net |
|
|
Weighted average remaining amortization period (years) |
|
||||
|
|
|
(in thousands) |
|
|
|
|
|
|||||||||
|
Existing and core technology - product |
|
$ |
620,110 |
|
|
$ |
(78,017 |
) |
|
$ |
542,093 |
|
|
|
5.63 |
|
|
Technology licenses |
|
|
130,676 |
|
|
|
(48,225 |
) |
|
|
82,451 |
|
|
|
4.68 |
|
|
Customer contracts and relationships |
|
|
53,315 |
|
|
|
(4,161 |
) |
|
|
49,154 |
|
|
|
9.62 |
|
|
Trade name |
|
|
15,596 |
|
|
|
(3,309 |
) |
|
|
12,287 |
|
|
|
4.63 |
|
|
Total amortizable intangible assets |
|
$ |
819,697 |
|
|
$ |
(133,712 |
) |
|
$ |
685,985 |
|
|
|
5.18 |
|
|
IPRD |
|
|
78,900 |
|
|
|
- |
|
|
|
78,900 |
|
|
|
|
|
|
Total intangible assets |
|
$ |
898,597 |
|
|
$ |
(133,712 |
) |
|
$ |
764,885 |
|
|
|
|
|
Amortization expense was $128.4 million, $52.6 million and $9.6 million for the years ended December 31, 2017, 2016 and 2015, respectively. Certain fully amortized intangible assets have been eliminated from both the gross and accumulated amortization amounts.
72
The following table presents the estimated future amortization expense of amortizable intangible assets as of December 31, 2017 (in thousands):
|
2018 |
|
|
|
$ |
132,676 |
|
|
2019 |
|
|
|
|
130,185 |
|
|
2020 |
|
|
|
|
125,433 |
|
|
2021 |
|
|
|
|
117,169 |
|
|
2022 |
|
|
|
|
80,291 |
|
|
2023 and thereafter |
|
|
|
|
18,715 |
|
|
|
|
|
|
$ |
604,469 |
|
7. Restructuring Accrual
There was no restructuring activity during the year ended December 31, 2015. The following table summarizes the activity and the outstanding balances of the restructuring liability as of and for the years ended December 31, 2016 and 2017:
|
|
|
Severance and other benefits |
|
|
Excess Facility Related Cost |
|
|
Total |
|
|||
|
|
|
(in thousands) |
|
|||||||||
|
Balance at December 31, 2015 |
|
$ |
- |
|
|
$ |
- |
|
|
$ |
- |
|
|
Assumed restructuring liabilities from the acquisition of QLogic |
|
|
- |
|
|
|
4,215 |
|
|
|
4,215 |
|
|
Additions |
|
|
12,018 |
|
|
|
- |
|
|
|
12,018 |
|
|
Cash payments |
|
|
(10,857 |
) |
|
|
(1,060 |
) |
|
|
(11,917 |
) |
|
Balance at December 31, 2016 |
|
|
1,161 |
|
|
|
3,155 |
|
|
|
4,316 |
|
|
Cash payments |
|
|
(965 |
) |
|
|
(2,493 |
) |
|
|
(3,458 |
) |
|
Balance at December 31, 2017 |
|
$ |
196 |
|
|
$ |
662 |
|
|
$ |
858 |
|
Following the acquisition of QLogic, the Company assumed outstanding liabilities from the restructuring initiatives undertaken by QLogic prior to the acquisition. This restructuring initiative was designed to enhance product focus and streamline the business operations. The assumed restructuring liability was related to the excess facility which was calculated based on the discounted future lease payments. This non-recurring fair value measurement was classified as Level 3 fair value hierarchy measurements and disclosures. This restructuring initiative included an excess facility which is expected to be settled over the term of the lease through April 2018. In addition, the Company recorded employee severance expense of $12.0 million within sales, general and administrative expenses on the consolidated statement of operations for the year ended December 31, 2016 related to actions following the acquisition of QLogic and integration of QLogic with the Company.
8. Stockholders’ Equity
Common and Preferred Stock
As of December 31, 2017 and 2016, the Company is authorized to issue 200,000,000 shares of $0.001 par value common stock and 10,000,000 shares of $0.001 par value preferred stock. The Company is authorized to issue preferred stock in one or more series and to fix the rights, preferences, privileges and restrictions thereof, including dividend rights, dividend rates, conversion rights, voting rights, terms of redemption and liquidation preferences.
2001 Stock Incentive Plan
The Company’s 2001 Stock Incentive Plan (the “2001 Plan”) expired as of December 31, 2011. Options granted under the 2001 Plan were either incentive stock options or non-statutory stock options as determined by the Company’s board of directors. Options granted under the 2001 Plan vested at the rate specified by the plan administrator, typically with 1/8th of the shares vesting six months after the date of grant and 1/48th of the shares vesting monthly thereafter over the next three and one half years to four and one half years. Options expire ten years from the date of grant.
73
2007 Equity Incentive Plan
Upon completion of its IPO in May 2007, the Company adopted the 2007 Equity Incentive Plan, the (“2007 Plan”), which initially reserved 5,000,000 shares of the Company’s common stock. The 2007 Plan provides for the grant of incentive stock options, non-statutory stock options, restricted stock awards, restricted stock unit awards, stock appreciation rights, performance stock awards, and other forms of equity compensation (collectively, “stock awards”), and performance cash awards, all of which may be granted to employees (including officers), directors, and consultants or affiliates. Awards granted under the 2007 Plan vest at the rate specified by the plan administrator, for stock options, typically with 1/8th of the shares vesting six months after the date of grant and 1/48th of the shares vesting monthly thereafter over the next three and one half years and for restricted stock unit awards typically with quarterly vesting over four years. Awards expire seven to ten years from the date of grant. Following the adoption of the 2016 Equity Incentive Plan (the “2016 EIP”) as discussed below, no additional awards will be granted from the 2007 Plan.
2016 Equity Incentive Plan
On June 15, 2016, the Company adopted the 2016 EIP, which initially reserved for issuance 3,600,000 shares of the Company’s common stock. The 2016 EIP is intended as the successor to and continuation of the Company’s 2007 Plan. The 2016 EIP provides for the grant of incentive stock options, non-statutory stock options, stock appreciation rights, restricted stock awards, restricted stock unit awards, performance stock awards, performance cash awards and other stock awards, which may be granted to employees, directors and consultants. Following the effective date, no additional awards may be granted under the 2007 Plan. All outstanding awards granted under the 2007 EIP will remain subject to the terms of such plan, provided however, that the following shares of common stock subject to any outstanding stock award granted under the 2007 Plan (collectively, the “2007 Plan Returning Shares”) will immediately be added to the share reserve as and when such shares become 2007 Plan Returning Shares and become available for issuance pursuant to awards granted under the 2016 EIP: (i) any shares subject to such stock award that are not issued because such stock award or any portion thereof expires or otherwise terminates without all of the shares covered by such stock award having been issued; (ii) any shares subject to such stock award that are not issued because such stock award or any portion thereof is settled in cash; and (iii) any shares issued pursuant to such stock award that are forfeited back to or repurchased by the Company because of the failure to meet a contingency or condition required for the vesting of such shares. As of December 31, 2017, there were 2,421,854 shares reserved for issuance under the 2016 EIP.
QLogic 2005 Plan
Following the closing of the acquisition of QLogic, the Company assumed and registered to continue the QLogic 2005 Performance Incentive Plan (the “QLogic 2005 Plan”). The total shares available for future grant registered under the QLogic 2005 Plan was 3,612,039 shares of the Company’s common stock. The QLogic 2005 Plan provides for the issuance of restricted stock unit awards, incentive and non-qualified stock options, and other stock-based incentive awards. Restricted stock unit awards, or RSUs, granted pursuant to the QLogic 2005 Plan to employees subject to a service condition generally vest over four years from the date of grant. Stock options granted pursuant to the QLogic 2005 Plan to employees have ten-year terms and generally vest over four years from the date of grant. Shares issued in respect of any full value award granted under this plan shall be counted against the shares available for future grant as 1.75 shares for every one share issued in connection with such award. Full value award means any award under the QLogic 2005 Plan that is not a stock option grant or a stock appreciation right grant. As of December 31, 2017, there were 1,200,046 shares reserved for issuance under the QLogic 2005 Plan.
74
Stock Options
Detail related to stock option activity is as follows:
|
|
|
Number of Options Outstanding |
|
|
Weighted Average Exercise Price Per Share |
|
||
|
Balance as of December 31, 2014 |
|
|
2,626,260 |
|
|
$ |
20.62 |
|
|
Options granted |
|
|
87,178 |
|
|
|
64.70 |
|
|
Options exercised |
|
|
(685,439 |
) |
|
|
14.02 |
|
|
Options cancelled and forfeited |
|
|
- |
|
|
|
- |
|
|
Balance as of December 31, 2015 |
|
|
2,027,999 |
|
|
|
24.75 |
|
|
Options granted |
|
|
175,776 |
|
|
|
48.88 |
|
|
Assumed from the acquisition |
|
|
1,045 |
|
|
|
34.63 |
|
|
Options exercised |
|
|
(1,010,670 |
) |
|
|
11.31 |
|
|
Options cancelled and forfeited |
|
|
(161 |
) |
|
|
32.40 |
|
|
Balance as of December 31, 2016 |
|
|
1,193,989 |
|
|
|
39.68 |
|
|
Options granted |
|
|
145,574 |
|
|
|
65.82 |
|
|
Options exercised |
|
|
(205,535 |
) |
|
|
31.50 |
|
|
Options cancelled and forfeited |
|
|
(4,012 |
) |
|
|
8.60 |
|
|
Balance as of December 31, 2017 |
|
|
1,130,016 |
|
|
|
44.65 |
|
The aggregate intrinsic value for options exercised during the years ended December 31, 2017, 2016 and 2015, was $7.3 million, $41.5 million and $37.4 million, respectively, representing the difference between the closing price of the Company’s common stock at the date of exercise and the exercise price paid.
The following table summarizes information about stock options outstanding as of December 31, 2017:
|
|
|
Outstanding Options |
|
|
Exercisable Options |
|
|
|
|
|
||||||||||||||
|
Exercise Prices |
|
Number of Shares |
|
|
Weighted Average Remaining Contractual Term |
|
|
Weighted Average Exercise Price |
|
|
Number of shares |
|
|
Weighted Average Exercise Price |
|
|
Aggregate Intrinsic Value |
|
||||||
|
$25.99 - $33.44 |
|
|
42,029 |
|
|
|
1.77 |
|
|
$ |
28.47 |
|
|
|
42,029 |
|
|
$ |
28.47 |
|
|
|
|
|
|
$35.73 - $37.22 |
|
|
323,252 |
|
|
|
0.68 |
|
|
|
36.46 |
|
|
|
323,252 |
|
|
|
36.46 |
|
|
|
|
|
|
$37.63 - $37.83 |
|
|
322,148 |
|
|
|
2.60 |
|
|
|
37.72 |
|
|
|
316,020 |
|
|
|
37.72 |
|
|
|
|
|
|
$38.24 - $43.97 |
|
|
25,059 |
|
|
|
0.43 |
|
|
|
42.01 |
|
|
|
25,059 |
|
|
|
42.01 |
|
|
|
|
|
|
$48.88 - $48.88 |
|
|
175,776 |
|
|
|
5.12 |
|
|
|
48.88 |
|
|
|
80,559 |
|
|
|
48.88 |
|
|
|
|
|
|
$50.83 - $76.38 |
|
|
241,752 |
|
|
|
7.12 |
|
|
|
64.86 |
|
|
|
74,323 |
|
|
|
63.58 |
|
|
|
|
|
|
$25.99 - $76.38 |
|
|
1,130,016 |
|
|
|
3.33 |
|
|
$ |
44.65 |
|
|
|
861,242 |
|
|
$ |
40.19 |
|
|
$ |
44,273,547 |
|
|
Exercisable |
|
|
861,242 |
|
|
|
2.14 |
|
|
$ |
40.19 |
|
|
|
|
|
|
|
|
|
|
$ |
37,582,059 |
|
|
Vested and expected to vest |
|
|
1,130,016 |
|
|
|
3.33 |
|
|
$ |
44.65 |
|
|
|
|
|
|
|
|
|
|
$ |
44,273,547 |
|
The aggregate intrinsic value for options outstanding at December 31, 2017, represents the difference between the weighted average exercise price and the closing price of the Company’s common stock at December 31, 2017, as reported on The NASDAQ Global Market, for all in the money options outstanding.
75
The estimated weighted-average grant date fair value of options granted for years ended December 31, 2017, 2016 and 2015 was $25.92 per share, $18.65 per share, and $23.79 per share, respectively. The fair value of each option grant for the years ended December 31, 2017, 2016 and 2015 were estimated on the date of grant using the Black-Scholes option valuation model using the assumptions below.
|
|
|
Year Ended December 31, |
|
|||||||||
|
|
|
2017 |
|
|
2016 |
|
|
2015 |
|
|||
|
Risk-free interest rate |
|
|
1.89% |
|
|
|
1.11% |
|
|
1.34% to 1.41% |
|
|
|
Expected life |
|
5.31 years |
|
|
4.96 years |
|
|
3.77 to 4.58 years |
|
|||
|
Dividend yield |
|
|
0% |
|
|
|
0% |
|
|
|
0% |
|
|
Volatility |
|
|
40.84% |
|
|
|
42.51% |
|
|
40.96% to 43.03% |
|
|
As of December 31, 2017, there was $5.2 million of unrecognized compensation cost related to stock options granted. The unrecognized compensation cost is expected to be recognized over a weighted average period of 2.53 years.
Restricted Stock Units
A summary of the activity of RSU for the related periods are presented below:
|
|
|
Number of Shares |
|
|
Weighted- Average Grant Date Fair Value Per Share |
|
||
|
Balance as of December 31, 2014 |
|
|
2,464,747 |
|
|
$ |
39.21 |
|
|
Granted |
|
|
955,592 |
|
|
|
61.82 |
|
|
Issued and released |
|
|
(1,115,525 |
) |
|
|
40.94 |
|
|
Cancelled and forfeited |
|
|
(110,746 |
) |
|
|
45.82 |
|
|
Balance as of December 31, 2015 |
|
|
2,194,068 |
|
|
|
47.85 |
|
|
Granted |
|
|
2,482,048 |
|
|
|
53.22 |
|
|
Assumed from the acquisition |
|
|
1,301,199 |
|
|
|
51.55 |
|
|
Vested |
|
|
(1,583,775 |
) |
|
|
47.60 |
|
|
Cancelled and forfeited |
|
|
(274,221 |
) |
|
|
53.37 |
|
|
Balance as of December 31, 2016 |
|
|
4,119,319 |
|
|
|
51.98 |
|
|
Granted |
|
|
1,724,148 |
|
|
|
67.42 |
|
|
Vested |
|
|
(1,847,879 |
) |
|
|
52.29 |
|
|
Cancelled and forfeited |
|
|
(372,764 |
) |
|
|
59.59 |
|
|
Balance as of December 31, 2017 |
|
|
3,622,824 |
|
|
|
58.39 |
|
For the years ended December 31, 2017 and 2016, the Company issued 1,768,624 shares and 1,547,694 shares, respectively, of common stock in connection with the vesting of RSUs. The difference between the number of RSUs vested and the shares of common stock issued for the year ended December 31, 2017 was due to the RSUs withheld in satisfaction of minimum tax withholding obligations associated with the vesting of certain QLogic awards.
The total intrinsic value of the RSUs outstanding as of December 31, 2017 was $303.7 million, representing the closing price of the Company’s stock on December 31, 2017, multiplied by the number of RSUs expected to vest as of December 31, 2017.
In February 2015, the Company granted one-year and two-year performance based RSUs with grant date fair values of $2.1 million and $0.7 million, respectively. In February 2016 and 2017, the Company granted one-year performance based RSUs with grant date fair values of $2.9 million and $3.6 million, respectively. The Company recorded the related stock-based compensation expense based on its evaluation of the probability of achieving the milestones of all of the outstanding performance-based RSUs at each reporting periods.
76
The Company also granted a four-year vesting market-based RSU in February 2015 with a grant date fair value of $1.5 million. In February 2016 and 2017, the Company granted three-year vesting market-based RSUs with grant date fair values of $3.3 million and $3.1 million, respectively. These market-based RSUs will vest if: (i) during the performance period, the Company’s total stockholder return is equal to or greater than that of the industry index set by the Compensation Committee of the Board of Directors; and (ii) the recipient remains in continuous service with the Company through such vesting period. The fair value of the market-based RSUs were determined by management using the Monte Carlo simulation method which took into account multiple input variables that determine the probability of satisfying the market conditions stipulated in the award. This method requires the input of assumptions, including the expected volatility of the Company’s common stock, and a risk-free interest rate, similar to assumptions used in determining the fair value of the stock option grants discussed above.
As of December 31, 2017, there was $177.6 million of unrecognized compensation costs related to RSUs. The unrecognized compensation cost is expected to be recognized over a weighted average period of 2.21 years.
Stock-Based Compensation
The following table presents the detail of stock-based compensation expense amounts included in the consolidated statements of operations for each of the periods presented:
|
|
Year Ended December 31, |
|
|||||||||
|
|
2017 |
|
|
2016 |
|
|
2015 |
|
|||
|
|
(in thousands) |
|
|||||||||
|
Cost of revenue |
$ |
3,038 |
|
|
$ |
1,389 |
|
|
$ |
765 |
|
|
Research and development |
|
65,645 |
|
|
|
41,701 |
|
|
|
29,085 |
|
|
Sales, general and administrative |
|
34,188 |
|
|
|
42,240 |
|
|
|
18,447 |
|
|
|
$ |
102,871 |
|
|
$ |
85,330 |
|
|
$ |
48,297 |
|
The total stock-based compensation cost capitalized as part of inventory as of December 31, 2017 and 2016 was not material.
9. Income Taxes
The following table presents the provision for (benefit from) income taxes and the effective tax rates:
|
|
|
Year Ended December 31, |
|
|||||||||
|
|
|
2017 |
|
|
2016 |
|
|
2015 |
|
|||
|
|
|
(in thousands) |
|
|||||||||
|
Loss before income taxes |
|
$ |
(85,619 |
) |
|
$ |
(146,212 |
) |
|
$ |
(15,378 |
) |
|
Provision for (benefit from) income taxes |
|
|
(16,760 |
) |
|
|
997 |
|
|
|
1,682 |
|
|
Effective tax rate |
|
|
19.6 |
% |
|
|
(0.7 |
)% |
|
|
(10.9 |
)% |
On December 22, 2017, the United States enacted tax reform legislation through the Tax Cuts and Jobs Act (the “Act”), which significantly changes the existing U.S. tax laws. Major reforms in the legislation include reduction in the corporate tax rate from 35.0% to 21.0% and a move from a worldwide tax system to a territorial system. As a result of enactment of the legislation, we recognized a tax benefit of $11.6 million in our consolidated statement of operations for the year ended December 31, 2017 primarily due to reduction of our net long-term deferred tax liabilities recorded on the Company’s consolidated balance sheet. The changes included in the Act are broad and complex. The final transition impacts of the Act may differ from the above estimate, possibly materially, due to, among other things, changes in interpretations of the Act, any legislative action to address questions that arise because of the Act, any changes in accounting standards for income taxes or related interpretations in response to the Act, or any updates or changes to estimates that the Company has utilized to calculate the transition impacts, including impacts from changes to current year earnings estimates, cumulative unrepatriated foreign earnings and foreign exchange rates of foreign subsidiaries. The SEC has issued guidance that would allow for a measurement period of up to one year after the enactment date of the Act to finalize the recording of the related tax impacts. Any adjustments to these provisional amounts will be reported as a component of income tax expense or benefit in the reporting period in which any such adjustments are determined, which will be no later than the fourth quarter of 2018.
77
The benefit from income taxes for the year ended December 31, 2017 was mainly due to the income tax benefit as a result of the Act as discussed above, a release of the unrecognized tax benefit liability of $5.2 million mainly due to the expiration of the statutes of limitations and a partial release of the valuation allowance on net deferred tax assets of $2.4 million due to the increase in taxable income as a result of the reclassification of an indefinite-lived to a finite-lived intangible asset. These tax benefits were partially offset by the provision for income taxes on earnings in foreign jurisdictions. The provision for income taxes for the years ended December 31, 2016 and 2015 were primarily related to tax on earnings in foreign jurisdictions.
As a result of the QLogic acquisition, during the third quarter of 2016, the Company recognized a net deferred tax liability mainly related to book-tax basis difference on purchased intangible assets. This net deferred tax liability was treated as a source of taxable income to support the realizability of the Company’s pre-existing deferred tax assets. As such, the Company recorded a partial release of its net deferred tax assets valuation allowance of $82.9 million to offset against the deferred tax liability. However, during the fourth quarter of 2016, the Company was able to assess and measure an additional deferred tax asset that existed as of the acquisition date of QLogic. Due to the identification of this additional deferred tax asset, the Company made adjustments in the fourth quarter of 2016 to certain tax balances including the reversal of the partial release of the valuation allowance recorded in the third quarter of 2016.
The domestic and foreign components of income (loss) before income tax expense were as follows:
|
|
|
Year Ended December 31, |
|
|||||||||
|
|
|
2017 |
|
|
2016 |
|
|
2015 |
|
|||
|
|
|
(in thousands) |
|
|||||||||
|
Domestic |
|
$ |
(104,659 |
) |
|
$ |
(147,752 |
) |
|
$ |
(37,109 |
) |
|
Foreign |
|
|
19,040 |
|
|
|
1,540 |
|
|
|
21,731 |
|
|
|
|
$ |
(85,619 |
) |
|
$ |
(146,212 |
) |
|
$ |
(15,378 |
) |
The provision for (benefit from) income taxes consists of the following:
|
|
|
Year Ended December 31, |
|
|||||||||
|
|
|
2017 |
|
|
2016 |
|
|
2015 |
|
|||
|
|
|
(in thousands) |
|
|||||||||
|
Current tax provision (benefit) |
|
|
|
|
|
|
|
|
|
|
|
|
|
Domestic |
|
$ |
(5,059 |
) |
|
$ |
51 |
|
|
$ |
(15 |
) |
|
Foreign |
|
|
4,945 |
|
|
|
3,084 |
|
|
|
1,034 |
|
|
|
|
|
(114 |
) |
|
|
3,135 |
|
|
|
1,019 |
|
|
|
|
|
|
|
|
|
|
|
|
|
|
|
|
Deferred tax provision (benefit) |
|
|
|
|
|
|
|
|
|
|
|
|
|
Domestic |
|
|
(11,755 |
) |
|
|
775 |
|
|
|
564 |
|
|
Foreign |
|
|
(4,891 |
) |
|
|
(2,913 |
) |
|
|
99 |
|
|
|
|
|
(16,646 |
) |
|
|
(2,138 |
) |
|
|
663 |
|
|
Provision for (benefit from) income taxes |
|
$ |
(16,760 |
) |
|
$ |
997 |
|
|
$ |
1,682 |
|
The Company’s effective tax rate differs from the United States federal statutory rate as follows:
|
|
|
Year Ended December 31, |
|
|||||||||
|
|
|
2017 |
|
|
2016 |
|
|
2015 |
|
|||
|
Income tax at statutory rate |
|
|
35.0 |
% |
|
|
35.0 |
% |
|
|
35.0 |
% |
|
Stock compensation costs |
|
|
5.1 |
|
|
|
(2.9 |
) |
|
|
(13.1 |
) |
|
Enactment of U.S. tax reform |
|
|
(60.0 |
) |
|
|
- |
|
|
|
- |
|
|
State taxes, net of federal benefit |
|
|
0.2 |
|
|
|
(0.1 |
) |
|
|
(0.1 |
) |
|
Foreign income inclusion in the United States |
|
|
(1.1 |
) |
|
|
6.8 |
|
|
|
(4.9 |
) |
|
Research and development credits |
|
|
8.9 |
|
|
|
4.1 |
|
|
|
42.6 |
|
|
Foreign tax rate differential |
|
|
7.7 |
|
|
|
(32.1 |
) |
|
|
41.5 |
|
|
Change in valuation allowance |
|
|
19.3 |
|
|
|
(9.7 |
) |
|
|
(111.8 |
) |
|
U.S. federal release related to expiration of statute of limitations |
|
|
4.9 |
|
|
|
- |
|
|
|
- |
|
|
Other |
|
|
(0.4 |
) |
|
|
(1.8 |
) |
|
|
(0.1 |
) |
|
Total |
|
|
19.6 |
% |
|
|
(0.7 |
)% |
|
|
(10.9 |
)% |
78
On July 27, 2015, the United States Tax Court in Altera Corp. v. Commissioner, 145 T.C. No. 3 (2015) issued an opinion with respect to Altera’s litigation with the Internal Revenue Service, concerning the treatment of stock-based compensation expense in an inter-company cost sharing arrangement. In ruling in favor of Altera, the Tax Court invalidated the portion of the Treasury regulations requiring the inclusion of stock-based compensation expense in such inter-company cost-sharing arrangements. Accordingly, the Company adjusted its inter-company arrangement to reflect the recent ruling in 2015. QLogic had a similar global structure prior to the acquisition and had not adjusted its inter-company arrangement to exclude stock-based compensation expense. In July 2017, as part of a global restructuring and legal entity realignment, the Company executed a harmonized inter-company cost sharing arrangement and continued to exclude stock-based compensation expense under the Tax Court’s opinion issued in July 2015 on a consolidated basis. There was no material impact on the Company’s consolidated financial statements as of and for the year ended December 31, 2017 considering the full valuation allowance on the Company’s federal and state net deferred tax assets.
Effective January 1, 2017 the Company adopted the updated guidance on stock-based compensation. Under the new guidance, all excess tax benefits and tax deficiencies are recognized in the income statement as they occur.
The tax effects of the temporary differences that give rise to deferred tax assets and liabilities are as follows:
|
|
|
|
|
As of December 31, |
|
|||||
|
|
|
|
|
2017 |
|
|
2016 |
|
||
|
|
|
|
|
(in thousands) |
|
|||||
|
Deferred tax assets: |
|
|
|
|
|
|
|
|
|
|
|
Tax credits |
|
|
|
$ |
107,690 |
|
|
$ |
77,569 |
|
|
Net operating loss carryforwards |
|
|
|
|
215,336 |
|
|
|
257,286 |
|
|
Capitalized research and development |
|
|
|
|
8,365 |
|
|
|
15,077 |
|
|
Depreciation and amortization |
|
|
|
|
1,993 |
|
|
|
389 |
|
|
Stock compensation |
|
|
|
|
9,546 |
|
|
|
14,372 |
|
|
Other |
|
|
|
|
17,643 |
|
|
|
9,887 |
|
|
Gross deferred tax assets |
|
|
|
|
360,573 |
|
|
|
374,580 |
|
|
Less: valuation allowance |
|
|
|
|
(326,114 |
) |
|
|
(315,915 |
) |
|
Net deferred tax assets |
|
|
|
|
34,459 |
|
|
|
58,665 |
|
|
Deferred tax liabilities: |
|
|
|
|
|
|
|
|
|
|
|
Intangible assets |
|
|
|
|
(36,108 |
) |
|
|
(55,788 |
) |
|
Unremitted foreign earnings |
|
|
|
|
- |
|
|
|
(21,171 |
) |
|
Net deferred tax liabilities |
|
|
|
$ |
(1,649 |
) |
|
$ |
(18,294 |
) |
|
|
|
|
|
|
|
|
|
|
|
|
|
Reported As |
|
|
|
|
|
|
|
|
|
|
|
Deferred tax assets |
|
|
|
$ |
1,037 |
|
|
$ |
480 |
|
|
Deferred tax liabilities |
|
|
|
|
(2,686 |
) |
|
|
(18,774 |
) |
|
Net deferred tax liabilities |
|
|
|
$ |
(1,649 |
) |
|
$ |
(18,294 |
) |
As of December 31, 2017, the Company had total net operating loss carryforwards for federal and states of California and Massachusetts income tax purposes of $1,096.0 million and $562.6 million, respectively. If not utilized, these federal and state net operating loss carryforwards will expire beginning in 2020 and 2018, respectively. Effective January 1, 2017, the Company adopted the updated guidance on stock-based compensation, the Company recognized deferred tax assets of $101.7 million for the excess tax benefits that arose directly from tax deductions related to equity compensation greater than the amounts recognized for financial reporting and also recognized an increase of an equal amount in the valuation allowance against those deferred tax assets.
As of December 31, 2017, the Company also had federal and state research and development tax credit carryforwards of approximately $69.2 million and $83.4 million, respectively. The federal and state tax credit carryforwards will expire commencing 2020 and 2018, respectively, except for the California research tax credits which carry forward indefinitely. The Company also has various foreign and alternative minimum tax credits of approximately $3.7 million.
The Company’s net deferred tax assets relate predominantly to its United States tax jurisdiction. A full valuation allowance against the Company’s federal and state net deferred tax assets has been in place since 2012. The Company periodically evaluates the realizability of its net deferred tax assets based on all available evidence, both positive and negative. The realization of net deferred tax assets is dependent on the Company's ability to generate sufficient future taxable income during periods prior to the expiration of tax attributes to fully utilize these assets. The Company weighed both positive and negative evidence and determined that there is a continued need for a valuation allowance on its federal and state deferred tax assets as December 31, 2017 and 2016.
79
The Company reviews whether the utilization of its net operating losses and research credits are subject to an annual limitation due to the ownership change limitations provided by the Internal Revenue Code and similar state provisions. Utilization of these carryforwards is restricted and results in some amount expiring prior to benefiting the Company. The deferred tax assets shown above have been adjusted to reflect these expiring carryforwards.
The Company continues to repatriate cash from certain offshore operations in accordance with management’s review of the Company’s cash position and anticipated cash needs for investment in the Company’s core business, including interest charges and principal prepayments to the Company’s outstanding Term Loan Facility. The Company has changed its assertion regarding the repatriation of cash during the second quarter of 2017 in that the current and future earnings of certain foreign entities will no longer be indefinitely reinvested, and that the Company provides deferred taxes for the anticipated income taxes. The enactment of the Act during the fourth quarter of 2017 provides a one-time deemed repatriation tax, or “transition tax” on undistributed foreign earnings which required the Company to reclassify its deferred tax liabilities related to undistributed foreign earnings to income tax payable. The one-time transition tax is based on the Company’s total post-1986 earnings and profits, or “E&P”. The Company recorded a provisional amount for the transition tax resulting in a reduction of $180.1 million of net operating loss carryforwards. However, given the net operating losses and the full valuation allowance on the Company’s net deferred income tax assets in the U.S., the Company will have no cash tax impact in the U.S. The Company has not finalized its calculation of the E&P for these foreign subsidiaries. Further, the transition tax is based in part on the amount of those earnings held in cash and other specified assets. This amount may change when the Company finalizes the calculation of E&P previously deferred from U.S. federal taxation and finalizes the amounts held in cash or other specified assets.
Under the provisions of the Act, all foreign earnings are subject to U.S. taxation. As a result, the Company intends to repatriate substantially all foreign earnings that have been taxed in the U.S. to the extent that the foreign earnings are not restricted by local laws or accounting rules, and there are no substantial incremental costs associated with repatriating the foreign earnings. The Company continues to maintain its indefinite reinvestment policy with respect to immaterial earnings from certain subsidiaries and the associated tax cost is insignificant.
The following table summarizes the activity related to the unrecognized tax benefits:
|
|
|
Year Ended December 31, |
|
|||||||||
|
|
|
2017 |
|
|
2016 |
|
|
2015 |
|
|||
|
|
|
(in thousands) |
|
|||||||||
|
Balance at beginning of the year |
|
$ |
202,415 |
|
|
$ |
19,709 |
|
|
$ |
16,270 |
|
|
Gross increases related to current year's tax positions |
|
|
5,517 |
|
|
|
5,640 |
|
|
|
3,138 |
|
|
Gross increases (decreases) resulting from the acquisition of QLogic |
|
|
(80,908 |
) |
|
|
179,366 |
|
|
|
- |
|
|
Gross increases (decreased) related to prior year's tax positions |
|
|
1,151 |
|
|
|
(383 |
) |
|
|
398 |
|
|
Releases related to settlements/ statutes expiration |
|
|
(7,883 |
) |
|
|
(1,917 |
) |
|
|
(97 |
) |
|
Balance at the end of the year |
|
$ |
120,292 |
|
|
$ |
202,415 |
|
|
$ |
19,709 |
|
The gross increase resulting from the acquisition of QLogic in 2016 was primarily related to the unrecognized tax benefits against the additional tax assets identified in the measurement period but existed as of the acquisition date. During the third quarter of 2017, the Company filed the final pre-acquisition of QLogic US federal income tax return and made measurement period adjustments to the acquired tax accounts of QLogic. The change had no income statement impact due to the full valuation allowance against the Company’s federal and state net deferred tax assets. Also included in the unrecognized tax benefits at December 31, 2017 is $5.2 million that, if recognized, would reduce the Company’s annual effective tax rate after considering the valuation allowance. The Company’s practice is to recognize interest and/or penalties related to income tax matters in income tax expense. The Company has accrued $1.4 million potential penalties and interest as of December 31, 2017.
80
Beginning in 2011, the Company is operating under tax incentives in Singapore, which are effective through February 2020. The tax incentives are conditional upon the Company meeting certain employment, revenue, and investment thresholds. The Company realized benefits from the reduced tax rate for the periods presented as follows:
|
|
|
Year Ended December 31, |
|
|||||||||
|
|
|
2017 |
|
|
2016 |
|
|
2015 |
|
|||
|
|
|
(in thousands) |
|
|||||||||
|
Provision for Singapore entity at statutory tax rate of 17% |
|
$ |
1,583 |
|
|
$ |
973 |
|
|
$ |
811 |
|
|
Provision for Singapore entity in the consolidated statement of operations |
|
|
555 |
|
|
|
363 |
|
|
|
310 |
|
|
Benefit from preferential tax rate differential |
|
$ |
1,028 |
|
|
$ |
610 |
|
|
$ |
501 |
|
|
Impact of tax benefits per basic and diluted share |
|
$ |
0.02 |
|
|
$ |
0.01 |
|
|
$ |
0.01 |
|
The Company’s major tax jurisdictions are the United States federal government, the states of California and Massachusetts, China, India, Ireland, Israel, Japan, Singapore and the United Kingdom. The Company files income tax returns in the United States federal jurisdiction, the states of California and Massachusetts, various other states, and foreign jurisdictions in which it has a subsidiary or branch operations. The United States federal corporation income tax returns beginning with the 2000 tax year remain subject to examination by the Internal Revenue Service, or IRS. The California corporation income tax returns beginning with the 2000 tax year remain subject to examination by the California Franchise Tax Board. As of December 31, 2017, QLogic’s 2014 tax year is under audit by the IRS. There are routine on-going foreign tax audits in certain jurisdictions such as India, Israel and Taiwan. The Company does not expect any material tax adjustments from any of these audits.
10. Retirement Plan
The Company has established a defined contribution savings plan under Section 401(k) of the Internal Revenue Code for substantially all United States employees. This plan covers substantially all United States employees who meet minimum age and service requirements and allows participants to defer a portion of their annual compensation on a pre-tax basis. The Company matches 50% of the employees’ annual contribution up to two thousand dollars per employee. The Company contributions to the plan may be made at the discretion of the Company’s board of directors. The defined contribution expense included in the Company’s condensed consolidated statements of operations were not material for the periods presented.
In connection with local foreign laws, the Company is required to have a tenured-based defined benefit plan for its employees in certain non-US locations. The Company’s tenured-based payout liability is calculated based on the salary of each employee multiplied by the years of such employee’s employment, and is reflected on the Company’s consolidated balance sheets in other non-current liabilities on an accrual basis. The total expense and total obligation for these plans were not material to the consolidated financial statements.
11. Debt
On August 16, 2016, the Company entered into a Credit Agreement with JPMorgan Chase Bank, N.A. (“JPMCB”), as administrative agent and collateral agent, the other agents party thereto and the lenders referred to therein (collectively, the “Lenders”). The Lenders provided (i) a $700.0 million six year term B loan facility (the “Initial Term B Loan Facility”) and (ii) a $50.0 million interim term loan facility (the “Interim Term Loan Facility”, (i) and (ii) together, the “Term Facility”) to finance the acquisition of QLogic and pay fees and expenses of such acquisition. The outstanding debt under the Term Facility are collateralized by a lien on substantially all of the Company’s assets. In October 2016, the Company paid the outstanding Interim Term Loan Facility.
The Initial Term B Loan Facility will mature on August 16, 2022 and requires quarterly principal payments commencing on December 31, 2016 equal to 0.25% of the aggregate original principal amount, with the balance payable at maturity (in each case subject to adjustment for prepayments). In January 2017, the Company made prepayments of $86.0 million towards the outstanding principal balance of the Initial Term B Loan Facility and recorded additional amortization of the debt financing costs of $2.5 million associated with these principal payments in the first quarter of 2017.
81
The interest rates applicable to loans outstanding under the original Credit Agreement with respect to the Initial Term B Loan Facility are, at the Company's option, equal to either a base rate plus a margin of 2.00% per annum or LIBOR plus a margin of 3.00% per annum. In no event shall the LIBOR for any interest period be less than 0.75% with respect to the Initial Term B Facility. On March 20, 2017, the Company entered into an amendment to its Credit Agreement. The amendment provides for among other things, a reduction of the interest rate margin by 0.75% per annum, substantially all of which was treated as a debt modification. As such, the Company wrote-off an immaterial amount of the deferred financing costs associated with the extinguished portion of the debt in the first quarter of 2017 and continues to amortize the remaining unamortized deferred financing costs over the remaining term of the Initial Term B Loan Facility.
As of December 31, 2017 and 2016, the carrying value of the Term Facility approximates the fair value basis. The Company classified the Term Loan Facility under Level 2 of the fair value measurement hierarchy as the borrowings are not actively traded and have variable interest structure based upon market rates currently available to the Company for debt with similar terms and maturities. The following table summarizes the outstanding borrowings from the Initial Term B Loan Facility as of the periods presented:
|
|
As of December 31, |
|
|||||
|
|
2017 |
|
|
2016 |
|
||
|
|
(in thousands) |
|
|||||
|
Principal outstanding |
$ |
609,189 |
|
|
$ |
698,250 |
|
|
Unamortized deferred financing costs |
|
(12,956 |
) |
|
|
(18,971 |
) |
|
Principal outstanding, net of unamortized deferred financing costs |
$ |
596,233 |
|
|
$ |
679,279 |
|
|
|
|
|
|
|
|
|
|
|
Current portion of long-term debt |
$ |
3,270 |
|
|
$ |
3,865 |
|
|
Long-term debt |
$ |
592,963 |
|
|
$ |
675,414 |
|
For the year ended December 31, 2017 and 2016, the Company recognized contractual interest expense on debt of $22.0 million and $10.2 million, respectively, and amortization of deferred financing costs of $6.0 million and $1.6 million, respectively. Unamortized deferred financing costs was recorded as a reduction to principal outstanding in the consolidated balance sheets and is being amortized over the term of the Term Facility.
The Credit Agreement contains customary representations and warranties and affirmative and negative covenants that, among other things, restrict the ability of the Company and its subsidiaries to create or incur certain liens, incur or guarantee additional indebtedness, merge or consolidate with other companies, payment of dividends, transfer or sell assets and make restricted payments. These covenants are subject to a number of limitations and exceptions set forth in the Credit Agreement. The Company was in compliance with these covenants as of December 31, 2017.
12. Segment and Geographic Information
Operating segments are based on components of the Company that engage in business activities that earn revenue and incur expenses and (a) whose operating results are regularly reviewed by the Company’s chief operating decision maker, or CODM, to make decisions about resource allocation and performance and (b) for which discrete financial information is available. The Company manages and operates as one reportable segment. The acquisition of QLogic did not change the Company’s reportable segment as management views and operates the combined companies as one reportable segment. Following the acquisition of QLogic, the Company immediately integrated QLogic into the Company’s existing operations, engineering groups, sales distribution networks and management structure. The Company’s net revenue consists primarily of the sale of semiconductor products and the Company also derives revenue from licensing software. The revenue from these sources is classified by the Company as product revenue. The Company also generates revenue from professional service arrangements which is categorized as service revenue. The total service revenue is less than 5% of the Company’s total net revenue for the years ended December 31, 2017, 2016 and 2015. The Company categorizes its net revenue in the following different markets:
|
|
Year Ended December 31, |
|
|||||||||
|
|
2017 |
|
|
2016 |
|
|
2015 |
|
|||
|
|
(in thousands) |
|
|||||||||
|
Enterprise, service provider, broadband and consumer markets |
$ |
762,967 |
|
|
$ |
461,299 |
|
|
$ |
318,006 |
|
|
Datacenter market |
|
221,051 |
|
|
|
142,015 |
|
|
|
94,738 |
|
|
|
$ |
984,018 |
|
|
$ |
603,314 |
|
|
$ |
412,744 |
|
82
Revenues by geographic area are presented based upon the ship-to location of the original equipment manufacturers, the contract manufacturers or the distributors who purchased the Company’s products. For sales to the distributors, their geographic location may be different from the geographic locations of the ultimate end customers.
Net revenues by geographic area are as follows:
|
|
Year Ended December 31, |
|
|||||||||
|
|
2017 |
|
|
2016 |
|
|
2015 |
|
|||
|
|
(in thousands) |
|
|||||||||
|
United States |
$ |
277,100 |
|
|
$ |
196,727 |
|
|
$ |
128,431 |
|
|
China |
|
228,833 |
|
|
|
139,957 |
|
|
|
100,980 |
|
|
Korea |
|
93,243 |
|
|
|
54,367 |
|
|
|
28,578 |
|
|
Finland |
|
62,019 |
|
|
|
38,768 |
|
|
|
38,283 |
|
|
Taiwan |
|
55,022 |
|
|
|
39,839 |
|
|
|
34,533 |
|
|
Other countries |
|
267,801 |
|
|
|
133,656 |
|
|
|
81,939 |
|
|
Total |
$ |
984,018 |
|
|
$ |
603,314 |
|
|
$ |
412,744 |
|
The following table sets forth tangible long lived assets, which consist of property and equipment, net by geographic regions:
|
|
As of December 31, |
|
|||||
|
|
2017 |
|
|
2016 |
|
||
|
|
(in thousands) |
|
|||||
|
United States |
$ |
161,249 |
|
|
$ |
115,328 |
|
|
All other countries |
|
31,266 |
|
|
|
35,534 |
|
|
Total |
$ |
192,515 |
|
|
$ |
150,862 |
|
13. Commitments and Contingencies
Operating and Capital Leases
The Company leases its facilities under non-cancelable operating leases, which contain renewal options and escalation clauses, and expire on various dates ending in October 2027. On January 31, 2017, the Company entered into a lease agreement which expires in July 2027 to lease approximately 116,000 sq. ft. in a building located adjacent to the Company’s corporate headquarter in San Jose, California. On March 24, 2017, the Company entered into an amendment to the lease agreement dated November 18, 2016 for a building located in Irvine, California to extend the lease term through October 2027. Rent expense incurred under operating leases was $21.4 million, $11.3 million and $8.0 million for the years ended December 31, 2017, 2016 and 2015, respectively.
The Company acquired certain assets under capital lease and technology license obligations. The capital lease and technology license obligations include future cash payments payable primarily for license agreements with various vendors. For license agreements which qualify under capital lease and where installment payments extend beyond one year, the present value of the future installment payments are capitalized and included as part of intangible assets or property and equipment which is amortized over the estimated useful lives of the related assets.
The Company also has non-cancellable software and maintenance commitments which are generally billed on a quarterly basis, which are included in the operating lease disclosure included herein.
83
Minimum commitments under non-cancelable operating and capital lease agreements as of December 31, 2017 are as follows:
|
|
|
Capital lease and technology license obligations |
|
|
Operating leases |
|
|
Total |
|
|||
|
|
|
(in thousands) |
|
|||||||||
|
2018 |
|
$ |
32,423 |
|
|
$ |
18,193 |
|
|
$ |
50,616 |
|
|
2019 |
|
|
15,604 |
|
|
|
19,591 |
|
|
|
35,195 |
|
|
2020 |
|
|
- |
|
|
|
18,726 |
|
|
|
18,726 |
|
|
2021 |
|
|
- |
|
|
|
18,292 |
|
|
|
18,292 |
|
|
2022 |
|
|
- |
|
|
|
42,974 |
|
|
|
42,974 |
|
|
2023 thereafter |
|
|
- |
|
|
|
57,000 |
|
|
|
57,000 |
|
|
|
|
$ |
48,027 |
|
|
$ |
174,776 |
|
|
$ |
222,803 |
|
|
Less: Interest component (3.75% annual rate) |
|
|
1,222 |
|
|
|
|
|
|
|
|
|
|
Present value of minimum lease payment |
|
|
46,805 |
|
|
|
|
|
|
|
|
|
|
|
|
|
|
|
|
|
|
|
|
|
|
|
|
Current portion of the obligations |
|
$ |
31,435 |
|
|
|
|
|
|
|
|
|
|
Long-term portion of obligations |
|
$ |
15,370 |
|
|
|
|
|
|
|
|
|
Merger Termination Fee
As discussed in Note 1 of Notes to Consolidated Financial Statements, the Marvell Merger Agreement provides Marvell and the Company with certain termination rights and, under certain circumstances specified in the Marvell Merger Agreement, the Company could be required to pay Marvell a termination fee of up to $180.0 million. Also, the Company recorded acquisition-related costs associated with the pending merger with Marvell in the year ended December 31, 2017, primarily for outside legal and external financial advisory fees and expect additional acquisition-related costs will be incurred through the closing of the Merger.
Legal Proceedings
Four putative class actions challenging the Merger have been filed on behalf of the Company’s shareholders in the United States District Court for the Northern District of California. On January 2, 2018, a putative class action was filed by Scott Fineberg (Fineberg v. Cavium et al.). On January 8, 2018, a putative class action was filed by Tammy Raul (Raul v. Cavium et al.). Also, on January 8, 2018, a putative class action was filed by Shiva Stein (Stein v. Cavium et al.). Finally, on January 12, 2018, a putative class action was filed by Jordan Rosenblatt (Rosenblatt v. Cavium et al.). All four complaints assert claims for violation of section 14(a), Rule 14a-9 and section 20(a) based on allegations that the Registration Statement on Form S-4 filed by Marvell with the SEC on December 21, 2017 omits material information. Two of the complaints are filed against the Company and its directors; the other two complaints name those defendants as well as the Marvell entities. All complaints also assert control person claims against the members of Company’s board of directors.
A fifth putative class action challenging the Merger was filed on January 29, 2018 in the Superior Court of California, Monterey County, by Paul Berger on behalf of the Company’s shareholders (Berger v. Ali et al.). The Berger complaint asserts claims for breach of fiduciary duty against the Company and its directors based on allegations that the Merger provides shareholders insufficient value and that the proxy statement omits material information. On February 13, 2018, the plaintiff in the Berger action filed a motion for a temporary restraining order, seeking to enjoin the shareholder vote pending a hearing on a yet-to-be-filed preliminary injunction motion. A hearing on the motion for a temporary restraining order is scheduled for March 16, 2018.
Shareholders may file additional lawsuits challenging the Merger, which may name the Company, Marvell, members of the boards of directors of either party, or others as defendants. No assurance can be made as to the outcome of such lawsuits or the lawsuits described above, including the amount of costs associated with defending these claims or any other liabilities that may be incurred in connection with the litigation of these claims. If plaintiffs are successful in obtaining an injunction prohibiting the parties from completing the Merger on the agreed-upon terms, such an injunction may delay the completion of the Merger in the expected timeframe, or may prevent the Merger from being completed altogether.
From time to time, the Company may be involved in other legal proceedings arising in the ordinary course of its business. The Company is not currently a party to any other legal proceedings, the outcome of which, if determined adversely to the Company, the Company believes would have a material adverse effect on the consolidated financial position, results of operations or cash flows of the Company.
84
QLogic Manufacturing Rights Buy-outs
Following the closing of the acquisition of QLogic, the Company exercised non-cancellable options to purchase the manufacturing rights from a QLogic application specific integrated circuit, or ASIC, vendor effective at the closing of the acquisition of QLogic for certain QLogic ASIC products. In consideration for the exercise of the manufacturing rights, in September 2016, the Company paid an aggregate of $55.0 million manufacturing buy-out consideration and a one-time royalty buy-out fee of $10.0 million for certain QLogic ASIC products. Further, in September 2016, the Company entered into an ownership transfer and manufacturing rights agreement with another QLogic third-party ASIC vendor to acquire manufacturing rights and relieve the Company from future royalty obligations related to certain ASIC products for a total consideration of $10.0 million.
The Company determined that the total consideration amounting to $75.0 million as discussed above pertained to the use of technologies and the cost to cancel the exclusive rights to manufacture the related products. The Company estimated the components of the total consideration attributable to the use of technologies and the cost to cancel the exclusive manufacturing rights using market-based fair value estimation. The fair value estimation was determined based on inputs that are unobservable and significant to the overall fair value measurement. It was also based on estimates and assumptions made by management. As such this was classified as Level 3 fair value hierarchy measurements and disclosures. Based on the analysis, the Company attributed $42.8 million of the total consideration to the use of the related technologies in future periods and recorded this amount as intangible assets in the condensed consolidated balance sheets. The remaining balance of $32.2 million was attributed to the cost of cancelling the exclusive rights to manufacture the related products and was recorded as cost of revenue in the consolidated statements of operations in the year ended December 31, 2016.
Xpliant Manufacturing Rights Buy-out
On March 30, 2015, Xpliant exercised its option to purchase the manufacturing rights to accelerate the takeover of manufacturing, and to relieve Xpliant from any further obligation to purchase product quantities from an Xpliant ASIC vendor. In consideration for this, Xpliant paid $7.5 million manufacturing rights licensing fee and a per-unit royalty fee for certain ASIC products sold to certain customers for a limited time. Considering the terms of the purchase of the manufacturing rights and the stage of development of the related ASIC products covered by the manufacturing rights, the Company recorded the full amount of the manufacturing rights licensing fee within research and development expense on the consolidated statement of operations in 2015.
85
Selected Quarterly Consolidated Financial Data (Unaudited)
The following table summarizes certain unaudited quarterly financial information in each of the quarters in 2017 and 2016. The quarterly data have been prepared on the same basis as the audited consolidated financial statements. This should be read together with the consolidated financial statements and related notes included elsewhere in this Annual Report.
|
|
Quarter Ended |
|
|||||||||||||
|
|
December 31, 2017 |
|
|
September 30, 2017 |
|
|
June 30, 2017 |
|
|
March 31, 2017 |
|
||||
|
Fiscal 2017 |
(in thousands, except per share data) |
|
|||||||||||||
|
Revenue |
$ |
260,361 |
|
|
$ |
251,987 |
|
|
$ |
242,093 |
|
|
$ |
229,577 |
|
|
|
|
|
|
|
|
|
|
|
|
|
|
|
|
|
|
|
Gross Profit |
|
140,440 |
|
|
|
137,532 |
|
|
|
129,489 |
|
|
|
92,123 |
|
|
Total operating expenses |
|
152,573 |
|
|
|
137,044 |
|
|
|
135,549 |
|
|
|
131,110 |
|
|
Income (loss) from operations |
|
(12,133 |
) |
|
|
488 |
|
|
|
(6,060 |
) |
|
|
(38,987 |
) |
|
Total other expense, net |
|
(6,393 |
) |
|
|
(6,216 |
) |
|
|
(6,061 |
) |
|
|
(10,257 |
) |
|
Loss before income taxes |
|
(18,526 |
) |
|
|
(5,728 |
) |
|
|
(12,121 |
) |
|
|
(49,244 |
) |
|
Provision for (benefit from) income taxes |
|
(17,476 |
) |
|
|
486 |
|
|
|
(1,049 |
) |
|
|
1,279 |
|
|
Net loss |
$ |
(1,050 |
) |
|
$ |
(6,214 |
) |
|
$ |
(11,072 |
) |
|
$ |
(50,523 |
) |
|
Net loss per common share, basic and diluted |
$ |
(0.02 |
) |
|
$ |
(0.09 |
) |
|
$ |
(0.16 |
) |
|
$ |
(0.75 |
) |
|
|
|
|
|
|
|
|
|
|
|
|
|
|
|
|
|
|
|
Quarter Ended |
|
|||||||||||||
|
|
December 31, 2016 |
|
|
September 30, 2016 |
|
|
June 30, 2016 |
|
|
March 31, 2016 |
|
||||
|
Fiscal 2016 |
(in thousands, except per share data) |
|
|||||||||||||
|
Revenue |
$ |
226,151 |
|
|
$ |
168,123 |
|
|
$ |
107,158 |
|
|
$ |
101,882 |
|
|
|
|
|
|
|
|
|
|
|
|
|
|
|
|
|
|
|
Gross Profit |
|
98,225 |
|
|
|
47,414 |
|
|
|
71,659 |
|
|
|
68,016 |
|
|
Total operating expenses |
|
127,371 |
|
|
|
141,656 |
|
|
|
78,460 |
|
|
|
71,380 |
|
|
Loss from operations |
|
(29,146 |
) |
|
|
(94,242 |
) |
|
|
(6,801 |
) |
|
|
(3,364 |
) |
|
Total other expense, net |
|
(7,915 |
) |
|
|
(4,214 |
) |
|
|
(336 |
) |
|
|
(194 |
) |
|
Loss before income taxes |
|
(37,061 |
) |
|
|
(98,456 |
) |
|
|
(7,137 |
) |
|
|
(3,558 |
) |
|
Provision for (benefit from) income taxes |
|
84,539 |
|
|
|
(84,090 |
) |
|
|
273 |
|
|
|
275 |
|
|
Net loss |
$ |
(121,600 |
) |
|
$ |
(14,366 |
) |
|
$ |
(7,410 |
) |
|
$ |
(3,833 |
) |
|
Net loss per common share, basic and diluted |
$ |
(1.82 |
) |
|
$ |
(0.23 |
) |
|
$ |
(0.13 |
) |
|
$ |
(0.07 |
) |
|
(1) |
Total operating expenses for the quarter ended December 31, 2017 included external legal and financial advisory fees of $11.2 million associated with the pending merger with Marvell. |
|
(3) |
Gross profit for the quarter ended March 31, 2017 included charges of $21.4 million associated with the write-down of assets due to rationalization of certain product lines. |
|
(4) |
Gross profit for the quarter ended September 30, 2016 included charges of $37.1 million related to the QLogic manufacturing rights buy-out and write-down of fixed assets. |
|
(5) |
Total operating expenses for the quarter ended September 30, 2016 included stock-based compensation expense related to QLogic employees with change in control provisions of $15.6 million, acquisition and integration costs of $13.4 million and restructuring, severance and other employment charges of $12.0 million related to the QLogic acquisition. |
|
(6) |
The benefit from income taxes for the quarter ended September 30, 2016 included a tax benefit from the partial release of the valuation allowance on net deferred tax assets. As a result of the QLogic acquisition, during the third quarter of 2016, the Company recognized a net deferred tax liability mainly related to book-tax basis difference on purchased intangible assets. This net deferred tax liability was treated as a source of taxable income to support the realizability of the Company’s pre-existing deferred tax assets. As such, the Company recorded a partial release of the net deferred tax assets valuation allowance of $82.9 million to offset against the deferred tax liability. |
86
|
(7) |
The provision for income taxes for the quarter ended December 31, 2016 included tax expense due to the reversal of the partial release of the valuation allowance on net deferred tax assets recorded in the quarter ended September 30, 2016 as discussed above. During the fourth quarter of 2016, the Company was able to assess and measure an additional deferred tax asset that existed as of the acquisition date of QLogic. Due to the identification of this additional deferred tax asset, the Company made adjustments in the fourth quarter of 2016 to certain tax balances including the reversal of the partial release of the valuation allowance recorded in the third quarter of 2016. |
Schedule II - Valuation and Qualifying Accounts
|
|
|
Balance at beginning of period |
|
|
Additions |
|
|
Deductions |
|
|
Balance at end of period |
|
||||
|
|
|
(in thousands) |
|
|||||||||||||
|
Year ended December 31, 2017 |
|
|
|
|
|
|
|
|
|
|
|
|
|
|
|
|
|
Allowance for doubtful accounts |
|
$ |
24 |
|
|
$ |
26 |
|
|
$ |
(26 |
) |
|
$ |
24 |
|
|
Allowance for customer returns |
|
|
4,106 |
|
|
|
7,516 |
|
|
|
(8,490 |
) |
|
|
3,132 |
|
|
Income tax valuation allowance |
|
|
315,915 |
|
|
|
10,199 |
|
|
|
- |
|
|
|
326,114 |
|
|
|
|
|
|
|
|
|
|
|
|
|
|
|
|
|
|
|
|
Year ended December 31, 2016 |
|
|
|
|
|
|
|
|
|
|
|
|
|
|
|
|
|
Allowance for doubtful accounts |
|
$ |
24 |
|
|
$ |
28 |
|
|
$ |
(28 |
) |
|
$ |
24 |
|
|
Allowance for customer returns |
|
|
1,444 |
|
|
|
7,789 |
|
|
|
(5,127 |
) |
|
|
4,106 |
|
|
Income tax valuation allowance |
|
|
127,328 |
|
|
|
188,587 |
|
|
|
- |
|
|
|
315,915 |
|
|
|
|
|
|
|
|
|
|
|
|
|
|
|
|
|
|
|
|
Year ended December 31, 2015 |
|
|
|
|
|
|
|
|
|
|
|
|
|
|
|
|
|
Allowance for doubtful accounts |
|
$ |
24 |
|
|
$ |
- |
|
|
$ |
- |
|
|
$ |
24 |
|
|
Allowance for customer returns |
|
|
1,118 |
|
|
|
4,513 |
|
|
|
(4,187 |
) |
|
|
1,444 |
|
|
Income tax valuation allowance |
|
|
105,638 |
|
|
|
21,690 |
|
|
|
- |
|
|
|
127,328 |
|
All other schedules are omitted because they are inapplicable or the requested information is shown in the consolidated financial statements of the registrant or related notes thereto.
Item 9. Changes in and Disagreements with Accountants on Accounting and Financial Disclosure
Not applicable.
Item 9A. Controls and Procedures
MANAGEMENT’S REPORT ON INTERNAL CONTROL OVER FINANCIAL REPORTING
Our management is responsible for establishing and maintaining adequate internal control over financial reporting (as defined in Rules 13a-15(f) and 15d-15(f) under the Exchange Act of 1934, as amended). Our internal control over financial reporting is a process designed to provide reasonable assurance regarding the reliability of financial reporting and the preparation of financial statements for external purposes in accordance with United States generally accepted accounting principles. Our internal control over financial reporting includes those policies and procedures that (i) pertain to the maintenance of records that, in reasonable detail, accurately and fairly reflect the transactions and dispositions of our assets; (ii) provide reasonable assurance that transactions are recorded as necessary to permit preparation of financial statements in accordance with generally accepted accounting principles, and that receipts and expenditures are being made only in accordance with authorizations of our management and directors; and (iii) provide reasonable assurance regarding prevention or timely detection of unauthorized acquisition, use, or disposition of our assets that could have a material effect on the financial statements.
87
Because of its inherent limitations, internal control over financial reporting may not prevent or detect misstatements. Also, projections of any evaluation of effectiveness to future periods are subject to the risk that controls may become inadequate because of changes in conditions, or that the degree of compliance with the policies or procedures may deteriorate. Our management does not expect that our disclosure controls or our internal control over financial reporting will prevent or detect all error and all fraud. A control system, no matter how well designed and operated, can provide only reasonable, not absolute, assurance that the control system’s objectives will be met. The design of a control system must reflect the fact that there are resource constraints, and the benefits of controls must be considered relative to their costs. Further, because of the inherent limitations in all control systems, no evaluation of controls can provide absolute assurance that misstatements due to error or fraud will not occur or that all control issues and instances of fraud, if any, have been detected. These inherent limitations include the realities that judgments in decision-making can be faulty and that breakdowns can occur because of simple error or mistake. Controls can also be circumvented by the individual acts of some persons, by collusion of two or more people, or by management override of the controls. The design of any system of controls is based in part on certain assumptions about the likelihood of future events, and there can be no assurance that any design will succeed in achieving its stated goals under all potential future conditions. Projections of any evaluation of controls effectiveness to future periods are subject to risks. Over time, controls may become inadequate because of changes in conditions or deterioration in the degree of compliance with policies or procedures.
Our management assessed the effectiveness of our internal control over financial reporting as of December 31, 2017, utilizing the criteria set forth by the Committee of Sponsoring Organizations of the Treadway Commission (COSO) in Internal Control-Integrated Framework (2013). Based on the assessment by our management, it was determined that our internal control over financial reporting was effective at a reasonable assurance level as of December 31, 2017. Management reviewed the results of their assessment with our Audit Committee. The effectiveness of our internal control over financial reporting as of December 31, 2017, has been audited by PricewaterhouseCoopers LLP, an independent registered public accounting firm, as stated in their report which appears herein.
Changes in Internal Control Over Financial Reporting
There were no changes in our internal control over financial reporting (as defined in Rules 13a-15(f) and 15d-15(f) under the Exchange Act of 1934, as amended) during the quarter ended December 31, 2017 that have materially affected, or are reasonably likely to materially affect, our internal control over financial reporting.
Disclosure Controls and Procedures
Our management evaluated, with the participation of our Chief Executive Officer and our Chief Financial Officer, the effectiveness of our disclosure controls and procedures (as defined in Rules 13a-15(e) and 15d-15(e) of the Exchange Act of 1934, as amended) as of the end of the period covered by this Annual Report on Form 10-K. Based on this evaluation, our Chief Executive Officer and our Chief Financial Officer have concluded that our disclosure controls and procedures are effective to provide reasonable assurance that information we are required to disclose in reports that we file or submit under the Securities Exchange Act of 1934 is recorded, processed, summarized and reported within the time periods specified in Securities and Exchange Commission rules and forms, and that such information is accumulated and communicated to management as appropriate to allow for timely decisions regarding required disclosure.
None.
88
Item 10. Directors, Executive Officers and Corporate Governance
The information required by this item with respect to executive officers may be found under the caption “Executive Officers of the Registrant” in Part I, Item 1 of this Annual Report on Form 10-K. Such information is incorporated herein by reference.
DIRECTORS
Syed B. Ali, age 59, is one of our founders and has served as our President, Chief Executive Officer and Chairman of the Board of Directors since the inception of Cavium in 2000. From 1998 to 2000, Mr. Ali was Vice President of Marketing and Sales at Malleable Technologies, a communication chip company of which he was a founding management team member. Malleable Technologies was acquired by PMC-Sierra, Inc., a communication integrated circuit company, in 2000. From 1994 to 1998, Mr. Ali was an Executive Director at Samsung Electronics Co., Ltd. Prior to that, he had various positions at Wafer Scale Integration, a division of SGS-Thomson, Tandem Computers, Inc., and American Microsystems, Ltd. He received a BE (Electrical Engineering) from Osmania University, in Hyderabad, India and an MSE from the University of Michigan. The Nominating and Corporate Governance Committee believes that Mr. Ali’s extensive experience in numerous senior managerial positions in the semiconductor industry, as well as his experience as a founder of Cavium and his long tenure as President and Chief Executive Officer of Cavium, brings necessary industry experience, historic Cavium knowledge and experience as well as continuity to the Board of Directors. In addition, the Nominating and Corporate Governance Committee believes that having Mr. Ali serve on the Board of Directors helps to ensure that the Board of Directors and management act with a common purpose to execute Cavium’s strategic initiatives and business plans, and that Mr. Ali, as Chief Executive Officer and Chairman of the Board of Directors, is able to act as a bridge between management and the Board of Directors, facilitating the regular flow of information.
Brad W. Buss, age 54, has served as a director since July 2016. Mr. Buss was the Chief Financial Officer of SolarCity Corporation from 2014 until he retired in February 2016. Mr. Buss served as the Executive Vice President of Finance and Administration and Chief Financial Officer of Cypress Semiconductor Corporation from 2005 to June 2014. Mr. Buss also held prior financial leadership roles with Altera Corporation, Cisco Systems, Inc., Veba Electronics LLC and Wyle Electronics, Inc. Mr. Buss serves on the board of directors for Tesla Inc. and Advance Auto Parts, Inc. Mr. Buss served on the board of directors of CaféPress, Inc. from 2007 until July 2016. Mr. Buss holds a B.A. in economics from McMaster University and an Honors Business Administration degree, majoring in finance and accounting, from the University of Windsor. The Nominating and Corporate Governance Committee believes that Mr. Buss’s experience as chief financial officer of public reporting companies as well as his experience in the semiconductor industry position him to contribute expertise to the Board of Directors. The Nominating and Corporate Governance Committee believes that in addition to Mr. Buss’s extensive chief financial officer experience, his service as a director of public reporting companies, including as a member of the audit committee of a public reporting company, is valuable in his position as a member of Cavium’s Audit Committee.
Edward H. Frank, Ph.D., age 62, has served as a director since July 2016. Dr. Frank co-founded Cloud Parity Inc., a voice-of-the-customer startup in the San Francisco Bay Area, in late 2013 and served as its Chief Executive Officer until September 2016. From 2009 through 2013, Dr. Frank was Vice President of Macintosh Hardware Systems Engineering at Apple, Inc. Before joining Apple, Dr. Frank was Corporate Vice President of Research and Development at Broadcom Corporation. Prior to joining Broadcom, Dr. Frank was the founding Chief Executive Officer of Epigram, Inc., a developer of integrated circuits and software for home networking, which Broadcom acquired in 1999. Dr. Frank serves on the board of directors of Analog Devices, Inc., eASIC Corporation, and Quantenna Communications, Inc., and is an advisor to several Bay Area venture capital firms and startups. Dr. Frank served as a director of Fusion-IO, Inc. from 2013 until July 2014 when it was acquired by SanDisk Corporation. Dr. Frank holds a B.S.E.E. and M.S.E.E. from Stanford University and a Ph.D. in Computer Science from Carnegie Mellon University. Since July 2017, he has been Executive Director (pro bono) and a member of the Board of Directors of Metallica’s All Within My Hands Foundation. The Nominating and Corporate Governance Committee believes that Dr. Frank’s experience in the semiconductor industry brings necessary industry experience to the Board of Directors. In addition, Dr. Frank’s extensive experience in executive positions has provided him with leadership skills and experience that are valuable to the Board of Directors.
Sanjay Mehrotra, age 58, has served as a director since July 2009. Mr. Mehrotra has served as the President, Chief Executive Officer and a director of Micron Technology, Inc. since May 2017. He co-founded SanDisk Corporation in 1988 and served as its President and Chief Executive Officer from January 2011 until the acquisition of SanDisk by Western Digital in May 2016. He previously served as President and Chief Operating Officer, Executive Vice President and Vice President of Engineering at SanDisk. Mr. Mehrotra has more than 35 years of experience in the non-volatile semiconductor memory industry, including engineering and engineering management positions at SanDisk, Integrated Device Technology, Inc., SEEQ Technology, Inc., Intel Corporation and Atmel Corporation. Mr. Mehrotra currently serves on the board of directors of Micron, and he previously served on the board of directors of SanDisk Corporation until May 2016 and Western Digital Corporation from May 2016 to February 2017. Mr. Mehrotra earned B.S. and M.S. degrees in Electrical Engineering and Computer Sciences from the University of California, Berkeley. The Nominating and Corporate Governance Committee believes that Mr. Mehrotra’s experience in the semiconductor business, as the co-
89
founder and Chief Executive Officer of SanDisk, where he was involved in growing that company’s business from formation to its size when acquired by Western Digital, as well as his experience in other engineering management positions, has provided him with leadership skills, experience in creating and capturing business opportunities, and experience in scaling up a business to enable growth, which are valuable to Cavium and the Board of Directors.
Madhav V. Rajan, age 53, has served as a director since March 2013. He is the Dean and George Pratt Shultz Professor of Accounting at the University of Chicago Booth School of Business. From 2001 to 2016, he was Senior Associate Dean for Academic Affairs and head of the MBA program at the Stanford Graduate School of Business. In April 2017, he received Stanford GSB's Robert T. Davis Award for Lifetime Achievement and Service. Mr. Rajan serves on the board of directors of iShares, Inc. and the Investment Advisory Board of C.M. Capital Corporation. Mr. Rajan received his undergraduate degree in Commerce from the University of Madras, India, and his MS and Ph.D. in Accounting from the Graduate School of Industrial Administration at Carnegie Mellon University. The Nominating and Corporate Governance Committee believes that Mr. Rajan’s extensive experience in finance position him to contribute financial expertise to the Board of Directors and the Audit Committee.
Anthony S. Thornley, age 71, has served as a director since September 2006 and has served as our lead independent director since June 2012. From June 2011 to March 2012 he served as Interim President and Chief Executive Officer of Callaway Golf Company, a golf equipment company. From February 2002 to June 2005 he served as President and Chief Operating Officer of Qualcomm Incorporated, a wireless communication technology and integrated circuit company. From July 2001 to February 2002 he served as Chief Financial and Operating Officer of Qualcomm and from March 1994 to February 2002 as Chief Financial Officer of Qualcomm. Prior to joining Qualcomm, he was with Nortel Networks, a telecommunications equipment manufacturer, for sixteen years in various financial and information systems management positions, including Vice President Finance and IS, Public Networks, Vice President Finance NT World Trade and Corporate Controller Nortel Limited. He has also worked for Coopers and Lybrand in public accounting. Mr. Thornley is also a director of Callaway Golf Company. Mr. Thornley was previously a director of Peregrine Semiconductor Corporation, a radio frequency semiconductor company. Mr. Thornley received his BSc degree in Chemistry from the University of Manchester, England. The Nominating and Corporate Governance Committee believes that Mr. Thornley’s experience as a chief financial officer, chief operating officer and director, as well as his experience in the semiconductor industry, position him to contribute financial, operational and industry expertise to the Board of Directors. The Nominating and Corporate Governance Committee believes that Mr. Thornley’s experience as chief financial officer of a public reporting company and service on the audit committee of public reporting companies, and experience as a director for other private and public companies is especially valuable in his positions as lead independent director and the chairperson of Cavium’s Audit Committee.
SECTION 16(a) BENEFICIAL OWNERSHIP REPORTING COMPLIANCE
Section 16(a) of the Exchange Act requires Cavium’s directors and executive officers, and persons who own more than ten percent of a registered class of Cavium’s equity securities, to file with the SEC initial reports of ownership and reports of changes in ownership of common stock and other equity securities of Cavium. Officers, directors and greater than ten percent stockholders are required by SEC regulation to furnish Cavium with copies of all Section 16(a) forms they file.
To Cavium’s knowledge, based solely on a review of the copies of the reports furnished to Cavium and written representations that no other reports were required, during the fiscal year ended December 31, 2017, we believe that all Section 16(a) filing requirements applicable to our officers, directors and greater than ten percent beneficial owners were complied with.
CODE OF CONDUCT
We have adopted the Cavium, Inc. Code of Conduct that applies to all officers, directors and employees. The Code of Conduct is available on our website at http://investor.cavium.com. If we make any substantive amendments to the Code of Conduct or grant any waivers from a provision of the Code to any executive officer or director, we will promptly disclose the nature of the amendment or waiver on our website.
Audit Committee
The Audit Committee of the Board of Directors was established in accordance with Section 3(a)(58)(A) of the Securities Exchange Act of 1934 to oversee Cavium’s corporate accounting and financial reporting processes and audits of its financial statements. The Audit Committee is currently composed of three directors: Messrs. Buss, Rajan, and Thornley. The Board of Directors reviews the NASDAQ listing standards definition of independence for Audit Committee members on an annual basis and has determined that all members of Cavium’s Audit Committee are independent (as independence is currently defined in the NASDAQ listing standards and Rule 10A-3(b)(1) of the Exchange Act). The Board of Directors has also determined that each of Messrs. Thornley and Buss qualifies as an “audit committee financial expert,” as defined in applicable SEC rules. The Board of Directors made a qualitative assessment of Messrs. Thornley’s and Buss’ level of knowledge and experience based on a number of factors, including formal education and experiences as a chief financial officer for public reporting companies. The Audit Committee has a written charter that is available on Cavium’s website at http://investor.cavium.com.
90
Item 11. Executive Compensation
Compensation Discussion and Analysis
This Compensation Discussion and Analysis describes our executive compensation philosophy and programs, compensation decisions made under those programs and the factors considered in making those decisions for our “named executive officers,” who, for 2017, were:
|
|
• |
Syed Ali, our President, Chief Executive Officer and Chairman of the Board; |
|
|
• |
M. Raghib Hussain, our Chief Operating Officer; |
|
|
• |
Arthur D. Chadwick, our Vice President of Finance and Administration and Chief Financial Officer; |
|
|
• |
Anil K. Jain, our Corporate Vice President, IC Engineering; and |
|
|
• |
Vincent P. Pangrazio, our Senior Vice President, General Counsel and Secretary |
Executive Summary
2017 Corporate Performance Highlights
The highlights of our corporate performance for fiscal 2017 include:
|
|
• |
achieved fiscal 2017 net revenue of $984 million, a 63% increase over fiscal 2016 net revenue; and |
|
|
• |
signed an agreement to be acquired by Marvell Technology Group Ltd. for consideration of $40.00 per share in cash and 2.1757 Marvell common shares for each Cavium share outstanding. |
Our financial and operational success has translated into sustained stock price growth for the benefit of our stockholders.
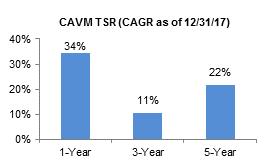
For purposes of the graph above, “TSR” means total stockholder return and “CAGR” means compound annual growth rate.
2017 Compensation Program Highlights
The highlights of our compensation program for 2017 include:
|
|
• |
long term equity incentive awards with a mix of options, restricted stock unit awards, or RSUs, and performance restricted stock unit awards, or PRSUs; |
|
|
• |
PRSUs as a percentage of total annual equity awards for our CEO exceeded 50% on a target grant date fair value basis; |
|
|
• |
use of a rigorous non-GAAP earnings per share performance metric for PRSUs for our named executive officers; and |
|
|
• |
use of a three year performance measure of our TSR relative to the S&P Semiconductor Select Industry Index for a PRSU for our CEO. |
91
The graphics below illustrate the components of the total compensation of the Chief Executive Officer and average other named executive officers for 2017.
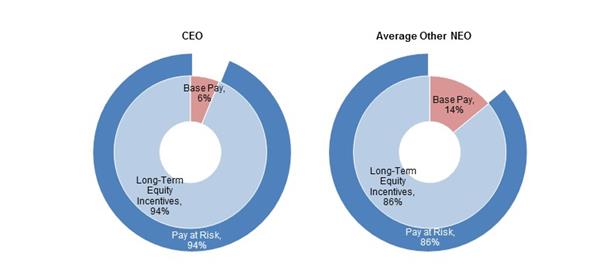
Key Features of Our Executive Compensation Program
|
|
||||
|
|
|
|
||
|
WHAT WE DO |
|
|
||
|
✓ We tie pay to performance by providing a significant amount of compensation that is at risk and aligned with stockholder interests. ✓ We provide modest executive fixed cash compensation. ✓ We issue PRSUs to our named executive officers and PRSUs are a significant percentage of the total annual equity grant to our CEO. ✓ We used stock price-based performance criteria as the metric for vesting of the PRSU for our CEO in 2017. ✓ We align pay and performance by selecting performance criteria that are intended to drive short-term growth and create long-term stockholder value. ✓ We have rigorous stock ownership guidelines for our executive officers and board of directors. ✓ We set maximum payout amounts for our PRSUs that are aligned with competitive market practices. ✓ Our Compensation Committee selects and retains an independent compensation consultant. ✓Our Compensation Committee reviews external market data when making compensation decisions and annually reviews our peer group with its independent compensation consultant. ✓ Our Compensation Committee is comprised solely of independent directors. ✓ We have “at-will” employment agreements with our named executive officers. ✓ We schedule and price equity grants to promote transparency and consistency. |
|
|
||
|
WHAT WE DON’T DO |
||||
|
✘We do not provide excessive perquisites. ✘We do not allow hedging or pledging of Cavium stock. ✘We do not provide our named executive officers with guaranteed annual salary increases, bonuses or equity rights. ✘We do not maintain compensation programs that we believe create risks reasonably likely to have a material adverse impact on Cavium. ✘We do not have a supplemental executive retirement plan that provides pension or other benefits to our named executive officers. ✘We do not have excise tax gross-ups for change-in-control severance benefits. ✘We do not reprice underwater awards and do not provide discount stock options or stock appreciation rights. |
||||
92
Compensation Philosophy
The primary objectives of the Compensation Committee with respect to executive compensation are to attract, motivate and retain the best possible executive talent, to align executives’ incentives with stockholder value creation, to tie annual and long-term stock incentives to achievement of measurable corporate and individual performance, to be affordable within the context of our operating expense model, to be fairly and equitably administered, and to reflect our values. Our Compensation Committee designs our executive compensation program to be competitive with comparable public companies.
As we administer our compensation programs, we work to:
|
|
• |
evolve and modify our programs to reflect the competitive environment, our changing business needs, and stockholder feedback; |
|
|
• |
focus on simplicity wherever possible; and |
|
|
• |
openly communicate the details of our programs with our employees and managers to ensure that our programs and their goals are understood. |
Realizable Pay for 2017
Because our Compensation Committee aims to align executives’ incentives with stockholder value creation, the substantial majority of our named executive officers’ compensation is composed of equity awards, whose value is significantly impacted by both stock price performance and Cavium financial performance. There is no assurance that the grant date fair values reported in the Summary Compensation Table for these equity awards will be reflective of their actual economic value or that comparable amounts will ever be realized by our named executive officers.
The chart below compares 2017 compensation paid to Syed Ali, our Chief Executive Officer, as reported in the Summary Compensation Table of this Compensation and Discussion Analysis to the value of the pay realizable by Mr. Ali as of fiscal year end 2017. For the chart below, 2017 realizable compensation represents: (1) total compensation, as determined under applicable SEC rules and reported in the Summary Compensation Table, minus (2) the aggregate grant date fair value of all equity awards (as reflected in the Stock Awards and Option Awards columns), plus (3) the actual intrinsic value of the equity awards granted to Mr. Ali in 2017 (for RSUs this reflects the number of shares multiplied by our closing stock price on December 29, 2017, for stock options this reflects the spread between our closing stock price on December 29, 2017 and the exercise price of such options multiplied by the number of shares, and for the non-GAAP EPS target PRSU this reflects the number of shares earned in 2017 that vested in January 2018 multiplied by our closing stock price on December 29, 2017). The value for realizable compensation for the relative TSR PRSU granted to Mr. Ali in 2017 was not yet earned in 2017 and therefore is not included in the chart below.
2017 CEO Total Compensation – Summary Compensation Table versus Realizable Total Compensation
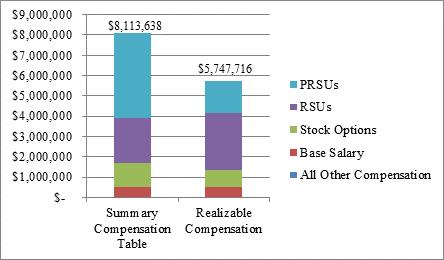
93
Compensation Process
Compensation Committee. Historically, the Compensation Committee has determined annual compensation and granted annual equity awards at one or more meetings held during the first quarter of the year. However, at various meetings throughout the year, the Compensation Committee also considers matters related to individual compensation, such as compensation for new executive hires, as well as high-level strategic issues, such as the efficacy of Cavium’s compensation strategy, potential modifications to that strategy, regulatory developments and new market trends, plans or approaches to compensation in Cavium’s industry and the broader market environment.
Role of Executive Officers. The Compensation Committee meets regularly in executive session, or as a part of the regular meetings of our Board of Directors. Our Chief Executive Officer, Chief Financial Officer and legal department work together to design and develop compensation programs for our Compensation Committee’s consideration, recommend changes to existing compensation programs, recommend performance targets to be achieved under those programs, and ultimately to implement the decisions of the Compensation Committee. These individuals also provide information to our independent compensation consultant so that it can perform its duties for the Compensation Committee.
At the beginning of each year our Chief Executive Officer provides recommendations to the Compensation Committee on the compensation levels of the other named executive officers, as well as his review of each other named executive officer’s performance and contributions during the previous year. When appropriate, our Chief Executive Officer, Chief Financial Officer and General Counsel attend portions of the Compensation Committee meetings to provide information and answer questions. No named executive officer was present or voted in the final determinations regarding the structure or amount of any component of his compensation package.
Compensation Consultant. The Compensation Committee continued to use Compensia, Inc., a national compensation consulting firm, to serve as its independent advisor for fiscal 2017. Our Compensation Committee originally retained Compensia in 2008. Compensia advises the Compensation Committee with respect to trends in executive and Board compensation, compensation peer group selection, analysis of survey data, the determination and design of compensation plans and arrangements, the assessment of competitive executive and Board pay levels and mix, setting compensation levels and reviewing disclosures such as the Compensation Discussion and Analysis section. As part of its engagement, Compensia conducted executive compensation assessments to be used in connection with fiscal 2017 compensation actions. The Compensation Committee may replace Compensia or hire additional advisors at any time. Compensia did not provide any other services to us and received no compensation other than with respect to the services described above.
Based on the consideration of the various factors as set forth in the rules of the SEC and the listing standards of the NASDAQ Stock Market, the Compensation Committee has determined that its relationship with Compensia and the work of Compensia on behalf of the Compensation Committee has not raised any conflict of interest.
Considerations in Setting Executive Compensation
Our Compensation Committee is responsible for making final decisions on compensation for our executive officers. For all executive officers, as part of its deliberations, the Compensation Committee may review and consider, as appropriate, one or more of the following: (i) materials such as financial reports and projections, (ii) operational data, (iii) tax and accounting information, (iv) executive stock ownership information, (v) Cavium stock performance data, (vi) analyses of historical Cavium executive compensation levels and current company-wide compensation levels, (vii) trends in compensation structures and pay levels for similarly situated executives at our peer companies, (viii) an executive officer’s past performance and expected contribution to future results, (ix) our Chief Executive Officer’s recommendations based on his direct knowledge of each executive officer’s performance and contributions during the previous year as well as expected contributions in the coming year, and (x) recommendations of a compensation consultant.
The Compensation Committee has not established any formal policies or guidelines for allocating compensation between current and long-term incentive compensation, or between cash and non-cash compensation; however, in general the Compensation Committee emphasizes equity compensation over cash compensation to promote long-term strategy, growth and alignment with stockholders. In determining the amount and mix of compensation elements and whether each element provides the correct incentives and rewards for performance consistent with our short and long-term goals and objectives, the Compensation Committee relies on its judgment about each individual rather than adopting a formulaic approach to compensatory decisions.
In connection with evaluating the executive compensation for 2017, the Compensation Committee engaged Compensia in September 2016 to prepare analysis regarding executive compensation. To learn more about overall market conditions, in December 2016 and January 2017 the Compensation Committee reviewed market data compiled by Compensia regarding a peer group of companies for fiscal year 2017 which are companies that (i) we generally think we compete with for executive talent, (ii) have an established business, market presence, and complexity similar to us, and (iii) are of similar size to us as measured by revenue and
94
market capitalization. Among our peer group for fiscal year 2017, we were at the 62nd percentile with respect to revenue and at approximately the 50th percentile with respect to market capitalization in September 2016. We made the following changes to our peer group for fiscal year 2017: (a) Cognex Corporation, InterDigital, Inc., Nimble Storage, Inc., PMC-Sierra, Inc. and Tessera Technologies, Inc. were removed, and (b) Cree, Inc., Cypress Semiconductor Corporation, Microsemi Corporation and Synaptics Incorporated were added to ensure that the updated group reflected companies of similar size, value and complexity to Cavium. Therefore, our peer group for making compensation decisions in February 2017 consisted of the following companies:
|
• Ambarella, Inc. |
• Infinera Corporation |
• Palo Alto Networks, Inc. |
|
• Cirrus Logic, Inc. |
• Integrated Device Technology, Inc. |
• Proofpoint, Inc. |
|
• Cree, Inc. |
• MACOM Technology Solutions Holdings, Inc. |
• Silicon Laboratories Inc. |
|
• Cypress Semiconductor Corporation • FireEye, Inc. |
• Mellanox Technologies, Ltd. • Microsemi Corporation |
• Splunk Inc. • Synaptics Incorporated |
|
• Guidewire Software, Inc. |
• Monolithic Power Systems, Inc. |
• Ubiquiti Networks, Inc. |
In 2015 and 2016, over 98% of the shares that were voted at our annual meetings of stockholders, counting abstentions as “against” votes, approved our say-on-pay proposal and the compensation paid to our named executive officers. Our Board of Directors and the Compensation Committee value the opinions of our stockholders. The Compensation Committee considers the results of the advisory say-on-pay votes on the compensation of the named executive officers in determining the executive compensation program.
Compensation Components
As discussed below, our executive compensation program consists of the following principal components: annual base salary and long term equity incentives (granted in the form of stock options, RSUs, PRSUs, or a combination of awards).
Base Salary. Base salaries are the fixed portion of executive compensation to compensate executive officers for day-to-day job duties and retain executive officers. Generally, we believe that executive base salaries should be in the range of salaries for executives in similar positions and with similar responsibilities at comparable companies in line with our compensation philosophy, which emphasizes long-term compensation. Base salaries are reviewed by our Compensation Committee annually, and adjusted from time to time to realign salaries with market levels after taking into account individual responsibilities, performance, experience, internal pay equity, our compensation budget, overall compensation of the executive officer, and cost of living adjustments, as appropriate. The Compensation Committee neither bases its consideration on any single factor nor does it specifically assign relative weights to factors, but rather considers a number of factors.
The Compensation Committee performed an annual review of the named executive officer salaries for 2017 in December 2016 and January 2017. The Compensation Committee reviewed certain factors described above and the analysis provided by Compensia which indicated that the base salaries of the named executive officers were at or below the 25th percentile of the peer group. As a result of its review, the Compensation Committee increased the salaries of the named executive officers for the first time since 2013 such that the salaries for Messrs. Ali, Hussain, Chadwick, Jain and Pangrazio were $500,000, $450,000, $375,000, $375,000 and $285,000, respectively, effective January 1, 2017.
Long-Term Incentive Program. We believe that equity compensation is an essential element of our executive compensation program and therefore equity compensation is a significant portion of the total compensation for each named executive officer. Equity compensation aligns the interests of our executive officers with the interests of stockholders, and focuses our executive officers on long-term performance and stockholder return through an ownership culture. In addition, equity compensation is crucial in attracting and retaining executive officers.
95
In the past few years we have granted a mix of stock options and RSUs. In February 2014, 2015, 2016 and 2017, the Compensation Committee also granted PRSUs to the named executive officers which could only be earned contingent upon our achievement of rigorous revenue growth, non-GAAP earnings per share (“Adjusted EPS”), stock price and relative TSR targets. PRSUs with rigorous revenue growth, Adjusted EPS, stock price and relative TSR targets directly align executive officer compensation with company performance. Stock options motivate long-term value creation as our stock price must increase and the executive officer must stay with Cavium through the vesting dates for stock options to have meaningful value. RSUs serve as a meaningful retention tool even in periods of volatile stock prices, which we believe is necessary to retain our executive officers and to be competitive with compensation packages offered by comparable companies.
Our Compensation Committee does not apply a formula in allocating equity compensation to named executive officers as a group or to any particular named executive officer. Instead, our Compensation Committee exercises its judgment and discretion and considers, among other things, the factors discussed above in Considerations in Setting Executive Compensation as well as the cash compensation received by the named executive officer and the total equity compensation to be granted to all employees during the year. Our Compensation Committee also considers each named executive officer’s unvested equity compensation, as we believe the vesting of stock options, RSUs and PRSUs over time is important to the future performance and retention of our named executive officers and Cavium.
In the past, our practice has been to review structure and amount of potential equity awards to our named executive officers in the beginning of the fiscal year. Our Compensation Committee does not time the grant of our equity awards with any favorable or unfavorable news released by us and the proximity of the grant of any awards to an earnings announcement or other market event is coincidental. The exercise price of options is set at the closing price of our common stock on the date of grant.
2017 Equity Compensation
The Compensation Committee performed an annual review of the named executive officer equity compensation for 2017 in December 2016 and January 2017. The Compensation Committee reviewed the analysis provided by Compensia that provided market-based grant date fair values of annual equity awards for similar executives at Cavium’s peer group companies.
The Compensation Committee’s primary objective has been to ensure that equity compensation comprises a significant portion of each named executive officer’s total compensation in order to align interests of the named executive officers with stockholders and focus the named executive officers on long-term performance and stockholder returns. Accordingly, in February 2017, the Compensation Committee granted equity awards in the form of stock options, RSUs and PRSUs to Messrs. Ali, Hussain, Chadwick, Jain and Pangrazio in the share amounts set forth in the following table:
|
|
Stock Options |
|
RSUs |
|
PRSUs (Target) |
|
Syed B. Ali |
44,359 |
|
33,713 |
|
55,331 |
|
M. Raghib Hussain |
28,762 |
|
32,789 |
|
10,930 |
|
Arthur D. Chadwick |
20,344 |
|
23,193 |
|
7,731 |
|
Anil K. Jain |
15,345 |
|
17,494 |
|
5,831 |
|
Vincent P. Pangrazio |
11,464 |
|
13,069 |
|
4,356 |
2017 PRSUs with One Year Non-GAAP EPS Targets
In February 2017 the Compensation Committee granted PRSUs to each of Messrs. Ali, Hussain, Chadwick, Jain and Pangrazio that could only be earned upon our achievement of certain Adjusted EPS levels for 2017. The Compensation Committee believes that Adjusted EPS is a key driver of increases in stockholder value and therefore PRSUs with Adjusted EPS targets further link executive compensation with the interests of stockholders. For the 2017 PRSUs, a threshold level of non-GAAP EPS (as detailed below) had to be achieved before any PRSUs would be earned and the number of shares possibly earned was capped at the maximum amount of shares (as detailed below).
For the 2017 PRSUs with Adjusted EPS targets the Compensation Committee set the targets at the time of grant. In setting the threshold, target and maximum Adjusted EPS targets the Compensation Committee considered our then-current annual operating plan for fiscal year 2017 as well as our industry at the time and set the Adjusted EPS target to promote strong growth and increased market share in light of expected industry trends and expected growth of our peers. The Compensation Committee believed that the Adjusted EPS target reflected significant growth from Cavium’s performance in fiscal year 2016. If earned, and upon certification of achievement by the Compensation Committee, all of the shares subject the PRSU would be earned on January 31, 2018, however half of the shares would vest and be delivered on January 31, 2018 and the other half of the shares would vest and be delivered on January 31, 2019.
96
For purposes of the 2017 PRSUs with one year Adjusted EPS targets, in January 2018, the Compensation Committee certified that Cavium achieved non-GAAP EPS of $2.84. As a result, 113% of the target number of the PRSUs held by Messrs. Ali, Hussain, Chadwick, Jain and Pangrazio vested on January 31, 2018.
|
|
|
Threshold (Payout = 50% of Target) |
|
Target |
|
Maximum (Payout = 150% of Target) |
|
Actual Number of Shares Earned (113% of Target) |
|||
|
Named Executive Officers |
|
At non- GAAP EPS of $2.267 |
|
At non- GAAP EPS of $2.72 |
|
At or Exceed non- GAAP EPS of $3.173 |
|
At non- GAAP EPS of $2.84 |
|||
|
Syed B. Ali |
|
8,428 |
|
|
16,856 |
|
|
25,284 |
|
|
19,047 |
|
M. Raghib Hussain |
|
5,465 |
|
|
10,930 |
|
|
16,395 |
|
|
12,351 |
|
Arthur D. Chadwick |
|
3,865 |
|
|
7,731 |
|
|
11,596 |
|
|
8,736 |
|
Anil K. Jain |
|
2,915 |
|
|
5,831 |
|
|
8,746 |
|
|
6,589 |
|
Vincent P. Pangrazio |
|
2,178 |
|
|
4,356 |
|
|
6,534 |
|
|
4,922 |
2017 Relative TSR PRSUs
In February 2017 the Compensation Committee also granted Mr. Ali a PRSU that could be earned based on the relative performance of our TSR compared to that of the S&P Semiconductor Select Industry Index over a three year performance period. The Compensation Committee believes that PRSUs with relative TSR performance metrics further link executive compensation with the interests of stockholders. Relative TSR performance as compared to the S&P Semiconductor Select Industry Index provides direct comparison of our stock price performance against an index that the Compensation Committee believes represents a broader capital market with which we compete. Further, relative TSR is both objectively determinable and readily available. The Compensation Committee set the relative TSR performance scale and related payout scale at the time of grant after considering the factors discussed above. The number of shares that could be earned ranges from none to 200% of the target shares based on how our TSR compares to that of the S&P Semiconductor Select Industry Index over the three year period. Even if our TSR significantly outperforms that of the S&P Semiconductor Select Industry Index over the three year period, if our TSR is negative over the three year period the total number of shares that could be earned is capped at 100% of target shares. If earned, and upon certification of achievement by the Compensation Committee, the shares subject to the PRSU would vest on February 10, 2020.
Total 2017 PRSUs granted to Mr. Ali
|
Target Shares |
|
Target Measurement |
|
Percent of Total 2017 Equity Compensation Granted to Mr. Ali* |
Amount Earned in 2017 |
|
|
16,856 |
|
2017 non-GAAP EPS |
|
15% |
|
19,047 |
|
38,475 |
|
TSR relative to the S&P Semiconductor Select Industry Index over a three-year period |
40% |
|
0 |
|
* Presented on a target grant date fair value basis.
2018 Compensation
The Compensation Committee considered the 2017 say-on-pay vote of the stockholders and the parameters agreed to in the Agreement and Plan of Merger with Marvell Technology Group Ltd. dated November 19, 2018, in making compensation decisions for the named executive officers in January 2018. The Compensation Committee did not increase the salaries of the named executive officers. In addition, the Compensation Committee granted Mr. Ali two PRSUs: (i) the first PRSU has a one-year non-GAAP earnings per share target tied to our performance in fiscal year 2018 and if earned, and upon certification of achievement by the Compensation Committee, half of the shares subject to the PRSU would vest on January 31, 2019 and half of the shares subject to the PRSU would vest on January 31, 2020, and (ii) the second PRSU may be earned after three years based on the performance of Cavium TSR relative to the S&P Semiconductor Select Industry Index and if earned, and upon certification of achievement by the Compensation Committee, all of the shares subject to the PRSU would vest on January 19, 2021. The PRSUs granted to Mr. Ali in January 2018 accounted for 40% of Mr. Ali’s total 2018 annual equity awards on a target grant date fair value basis. The PRSUs that the Compensation Committee granted to Messrs. Hussain, Chadwick, Jain and Pangrazio in January 2018 can only be earned based upon achievement of a one-year non-GAAP earnings per share target. If earned, and upon certification of achievement by the Compensation Committee, half of the shares subject to the PRSU would vest on January 31, 2019 and half of the shares subject to the PRSU would vest on January 31, 2020.
97
Other Compensation Practices
Stock ownership guidelines. We have established stock ownership guidelines for our executive officers and directors to better align our executive officers’ and directors’ interests with our stockholders’ interests by promoting share ownership. The ownership guidelines are based on a multiple of annual base salary or annual cash retainer. The required ownership levels under our stock ownership guidelines are as follows:
|
|
||
|
|
|
|
|
Position |
|
Ownership Requirement |
|
Chief Executive Officer |
|
3x Annual Cash Salary |
|
Other Executive Officers |
|
1x Annual Cash Salary |
|
Non-Employee Director |
|
5x Annual Cash Retainer |
For purposes of determining ownership under these guidelines we include shares of common stock actually owned and vested deferred stock units as well as the net exercise or “spread” value of vested stock options, however, unvested RSUs, PRSUs or stock options are not included. Directors and executive officers are required to meet these guidelines within three years of becoming a director or executive officer. As of December 31, 2017, all of the named executive officers and directors met the stock ownership guidelines.
Prohibition against pledging and hedging. We prohibit our executive officers, directors and other insiders from pledging Cavium stock and any type of hedging transaction involving Cavium stock without prior approval from our Nominating and Corporate Governance Committee.
No perquisites. Our executive officers do not receive any perquisites or personal benefits that are not available to all Cavium employees on the same terms and conditions.
Broad based benefits. All of our full-time employees in the United States, including our named executive officers, may participate in our health programs, which include medical, dental and vision care coverage, and our 401(k) and life insurance programs.
Compensation Policies and Practices as They Relate to Risk Management
Our Compensation Committee has reviewed our compensation programs for our employees and believes that our compensation programs are structured in a manner that does not create risks that are reasonably likely to have a material adverse effect on Cavium. The Compensation Committee considered, among other factors, the allocation of compensation among base salary and long term equity, our performance targets, and our executive stock ownership guidelines.
Accounting and Tax Considerations
Section 162(m) of the Internal Revenue Code of 1986, or the Code, in effect at the time the Compensation Committee made compensation determinations with respect to the compensation described in this Annual Report, limited the Company’s deduction for federal income tax purposes to not more than $1.0 million of compensation paid to certain executive officers in a calendar year. Section 162(m) of the Code, in effect at such time, further contained an exception, providing that compensation above $1.0 million may be deducted if it is “performance-based compensation” within the meaning of the Code.
However, the Tax Cuts and Jobs Act (the “Act”), which became law on December 22, 2017, significantly amends Section 162(m). The Act eliminated the performance-based compensation exception with respect to tax years beginning January 1, 2018, provided however, the Act includes a transition rule with respect to compensation that is provided pursuant to a written binding contract that was in effect on November 2, 2017 and not materially modified after that date. Accordingly, commencing in 2018 the Company’s tax deduction with regard to compensation of “covered employees,” which under the Act now includes a company’s chief financial officer, is limited to $1 million per taxable year for each officer. The Compensation Committee generally considers, and will continue to consider, the tax deductibility of each element of executive compensation as a factor in our overall compensation program, to the extent any deduction would be permitted under the Act’s transition rules.
We account for stock-based awards to our employees under the rules of FASB ASC Topic 718, which requires us to record the compensation expense over the service period of the award. Accounting rules also require us to record cash compensation as an expense at the time the obligation is accrued.
98
SUMMARY COMPENSATION TABLE
The following table shows for the fiscal years ended December 31, 2017, 2016, and 2015 compensation awarded to, paid to or earned by Cavium’s named executive officers:
SUMMARY COMPENSATION TABLE FOR FISCAL 2017
|
Name and Principal Position |
|
Year |
|
Salary ($) |
|
Stock Awards ($)(1) |
|
Option Awards ($)(1) |
|
All Other Compensation ($)(2) |
|
Total($) |
|
Syed B. Ali, |
|
2017 |
|
500,000 |
|
6,438,530 |
|
1,150,056 |
|
25,052 |
|
8,113,638 |
|
President and Chief Executive Officer |
|
2016 |
|
375,000 |
|
5,631,718 |
|
1,037,077 |
|
23,608 |
|
7,067,403 |
|
|
|
2015 |
|
375,000 |
|
4,248,024 |
|
766,571 |
|
20,779 |
|
5,410,374 |
|
|
|
|
|
|
|
|
|
|
|
|
|
|
|
M. Raghib Hussain, |
|
2017 |
|
432,692 |
|
2,876,711 |
|
745,687 |
|
22,700 |
|
4,077,790 |
|
Chief Operating Officer (3) |
|
2016 |
|
307,083 |
|
2,656,580 |
|
674,780 |
|
20,865 |
|
3,659,308 |
|
|
|
|
|
|
|
|
|
|
|
|
|
|
|
Arthur D. Chadwick, |
|
2017 |
|
375,000 |
|
2,034,800 |
|
527,441 |
|
26,984 |
|
2,964,225 |
|
Vice President of Finance and |
|
2016 |
|
291,923 |
|
1,608,006 |
|
408,438 |
|
24,180 |
|
2,332,547 |
|
Administration, Chief Financial Officer |
|
2015 |
|
290,769 |
|
1,199,998 |
|
180,298 |
|
20,187 |
|
1,691,252 |
|
|
|
|
|
|
|
|
|
|
|
|
|
|
|
Anil K. Jain, |
|
2017 |
|
375,000 |
|
1,534,786 |
|
397,836 |
|
20,144 |
|
2,327,766 |
|
Corporate Vice President |
|
2016 |
|
240,000 |
|
1,417,912 |
|
360,153 |
|
16,751 |
|
2,034,816 |
|
IC Engineering |
|
2015 |
|
300,000 |
|
1,050,014 |
|
157,773 |
|
14,460 |
|
1,522,247 |
|
|
|
|
|
|
|
|
|
|
|
|
|
|
|
Vincent P. Pangrazio |
|
2017 |
|
285,000 |
|
1,146,566 |
|
297,217 |
|
22,876 |
|
1,751,659 |
|
Senior Vice President, |
|
2016 |
|
285,000 |
|
1,128,151 |
|
286,559 |
|
21,225 |
|
1,720,935 |
|
General Counsel and Secretary |
|
2015 |
|
285,000 |
|
825,038 |
|
123,961 |
|
19,334 |
|
1,253,333 |
|
(1) |
Amounts shown in this column do not reflect dollar amounts actually received by the named executive officer. The dollar amounts in this column represent the aggregate full grant date fair value calculated in accordance with FASB ASC Topic 718 for equity granted during the fiscal years ended December 31, 2017, 2016, and 2015. For the PRSUs, the grant date fair value was calculated based on the probable outcome of the performance conditions and target number of shares, determined at the grant date. The amounts reported exclude the effect of estimated forfeitures. The fair value for the maximum number of shares available for the PRSUs was $6,653,389, $1,066,989, $754,668, $569,190 and $425,233 for Messrs. Ali, Hussain, Chadwick, Jain and Pangrazio, respectively. Stock options are valued using the Black Scholes option valuation model and the assumptions outlined in Note 8 of our financial statements included in this Annual Report on Form 10-K for the year ended December 31, 2017. |
|
(2) |
The amounts shown include matching contributions to Cavium’s 401(k) Plan, health insurance premiums paid by Cavium and premiums paid by Cavium for and imputed income from term life insurance coverage, each of which we provide to all of our employees. |
|
(3) |
Mr. Hussain was appointed Chief Operating Officer on July 22, 2016, and was not a named executive officer in fiscal year 2015. |
99
GRANTS OF PLAN-BASED AWARDS
The following table shows for the fiscal year ended December 31, 2017, certain information regarding grants of plan-based awards to the named executive officers:
GRANTS OF PLAN-BASED AWARDS IN FISCAL 2017
|
Name |
|
Grant Date |
|
Estimated Future Payouts Under Equity Incentive Plan Awards (1) |
|
All Other Stock Awards: Number of Shares of Stock or Units (#)(2) |
|
All Other Option Awards: Number of Securities Underlying Options (#)(3) |
|
Exercise or Base Price of Option Awards ($/Sh) |
|
Grant Date Fair Value of Stock and Option Awards ($)(4) |
||||
|
|
Threshold |
|
Target |
|
Maximum |
|
|
|
|
|||||||
|
Syed B. Ali |
|
2/10/2017 |
|
|
|
|
|
|
|
— |
|
44,359 |
|
65.8 |
|
1,150,056 |
|
|
|
2/10/2017 |
|
|
|
|
|
|
|
33,713 |
|
— |
|
— |
|
2,218,316 |
|
|
|
2/10/2017 |
|
8,428 |
|
16,856 |
|
25,284 |
|
|
|
|
|
|
|
1,109,125 |
|
|
|
2/10/2017 |
|
— |
|
38,475 |
|
76,950 |
|
|
|
|
|
|
|
3,111,089 |
|
|
|
|
|
|
|
|
|
|
|
|
|
|
|
|
|
|
|
M. Raghib Hussain |
|
2/10/2017 |
|
|
|
|
|
|
|
— |
|
28,762 |
|
65.8 |
|
745,687 |
|
|
|
2/10/2017 |
|
|
|
|
|
|
|
32,789 |
|
— |
|
— |
|
2,157,517 |
|
|
|
2/10/2017 |
|
5,465 |
|
10,930 |
|
16,395 |
|
|
|
|
|
|
|
719,194 |
|
|
|
|
|
|
|
|
|
|
|
|
|
|
|
|
|
|
|
Arthur D. Chadwick |
|
2/10/2017 |
|
|
|
|
|
|
|
— |
|
20,344 |
|
65.8 |
|
527,441 |
|
|
|
2/10/2017 |
|
|
|
|
|
|
|
23,193 |
|
— |
|
— |
|
1,526,100 |
|
|
|
2/10/2017 |
|
3,865 |
|
7,731 |
|
11,596 |
|
|
|
|
|
|
|
508,700 |
|
|
|
|
|
|
|
|
|
|
|
|
|
|
|
|
|
|
|
Anil K. Jain |
|
2/10/2017 |
|
|
|
|
|
|
|
— |
|
15,345 |
|
65.8 |
|
397,836 |
|
|
|
2/10/2017 |
|
|
|
|
|
|
|
17,494 |
|
— |
|
— |
|
1,151,106 |
|
|
|
2/10/2017 |
|
2,915 |
|
5,831 |
|
8,746 |
|
|
|
|
|
|
|
383,680 |
|
|
|
|
|
|
|
|
|
|
|
|
|
|
|
|
|
|
|
Vincent P. Pangrazio |
|
2/10/2017 |
|
|
|
|
|
|
|
— |
|
11,464 |
|
65.8 |
|
297,217 |
|
|
|
2/10/2017 |
|
|
|
|
|
|
|
13,069 |
|
— |
|
— |
|
859,941 |
|
|
|
2/10/2017 |
|
2,178 |
|
4,356 |
|
6,534 |
|
|
|
|
|
|
|
286,625 |
|
((1) |
Represents the range of possible shares able to be earned with respect to the PRSUs granted to our named executive officers, which are described further in the section titled Compensation Discussion and Analysis above. |
|
(2) |
Represents RSUs granted to our named executive officers pursuant to Cavium’s 2016 Equity Incentive Plan, which are described further in the Outstanding Equity Awards at Fiscal Year-End table below. |
|
(3) |
Represents stock options granted to our named executive officers pursuant to Cavium’s 2016 Equity Incentive Plan, which are described further in the Outstanding Equity Awards at Fiscal Year-End table below. |
|
(4) |
Represents the grant date fair value of the stock option award, RSUs and PRSUs as determined in accordance with FASB ASC Topic 718. For the PRSUs, the grant date fair value was calculated based on the probable outcome of the performance conditions and target number of shares, determined at the grant date. The amounts reported exclude the effect of estimated forfeitures. Stock options are valued using the Black Scholes option valuation model and the assumptions outlined in Note 8 of our financial statements included in this Annual Report on Form 10-K for the year ended December 31, 2017. |
401(k) Plan
We maintain a defined contribution employee retirement plan, or 401(k) plan, for our employees. Our named executive officers are also eligible to participate in the 401(k) plan on the same basis as our other employees. The 401(k) plan is intended to qualify as a tax-qualified plan under Section 401(k) of the Internal Revenue Code. The 401(k) plan provides that each participant may contribute up to 65% of his or her pre-tax compensation, up to the statutory limit, which was $18,000 for calendar year 2017. Participants that are 50 years or older can also make “catch-up” contributions, which in calendar year 2017 could be up to an additional $6,000 above the statutory limit.
Under the 401(k) plan, each participant is fully vested in all contributions. In 2015, 2016 and 2017 we made matching contributions equal to 50% of the employee contribution up to a maximum annual matching amount of $2,000. Participant contributions are held and invested by the plan’s trustee.
100
OUTSTANDING EQUITY AWARDS AT FISCAL YEAR-END
The following table shows for the fiscal year ended December 31, 2017, certain information regarding outstanding equity awards at fiscal year-end for the named executive officers.
OUTSTANDING EQUITY AWARDS AT DECEMBER 31, 2017
|
|
|
Option Awards |
|
Stock Awards |
||||||||||||||
|
Name |
|
Number of Securities Underlying Unexercised Options |
|
Number of Securities Underlying Unexercised Options |
|
Option Exercise Price |
|
Option Expiration Date |
|
Number of Shares or Units of Stock That Have Not Vested |
|
Market Value of Shares or Units of Stock That Have Not Vested |
|
Equity Incentive Plan Awards: Number of Unearned Shares, Units or Other Rights That Have Not Vested (#) |
|
Equity Incentive Plan Awards: Market or Payout Value of Unearned Shares, Units or Other Rights That Have Not Vested ($)(3) |
||
|
Syed B. Ali |
|
— (3) |
|
44,359 |
|
65.80 |
|
2/10/2024 |
|
|
|
|
|
|
|
|
||
|
|
|
25,486(2) |
|
30,121 |
|
48.88 |
|
2/11/2023 |
|
|
|
|
|
|
|
|
||
|
|
|
22,996(2) |
|
9,470 |
|
62.86 |
|
2/16/2022 |
|
|
|
|
|
|
|
|
||
|
|
|
76,666(1) |
|
3,334 |
|
37.83 |
|
2/7/2021 |
|
|
|
|
|
|
|
|
||
|
|
|
100,000(1) |
|
— |
|
37.63 |
|
3/22/2020 |
|
|
|
|
|
|
|
|
||
|
|
|
125,000(1) |
|
— |
|
35.73 |
|
2/24/2019 |
|
|
|
|
|
|
|
|
||
|
|
|
125,000(1) |
|
— |
|
37.22 |
|
3/10/2018 |
|
|
|
|
|
|
|
|
||
|
|
|
|
|
|
|
|
|
|
|
33,713(4) |
|
2,826,161 |
|
|
|
|
||
|
|
|
|
|
|
|
|
|
|
|
26,103(5) |
|
2,188,214 |
|
|
|
|
||
|
|
|
|
|
|
|
|
|
|
|
9,942(6) |
|
833,438 |
|
|
|
|
||
|
|
|
|
|
|
|
|
|
|
|
17,500(7) |
|
1,467,025 |
|
|
|
|
||
|
|
|
|
|
|
|
|
|
|
|
7,954(8) |
|
666,784 |
|
|
|
|
||
|
|
|
|
|
|
|
|
|
|
|
|
|
|
|
25,284(9) |
|
2,119,558 |
||
|
|
|
|
|
|
|
|
|
|
|
|
|
|
|
38,475(10) |
|
3,225,360 |
||
|
|
|
|
|
|
|
|
|
|
|
|
|
|
|
64,153(11) |
|
5,377,955 |
||
|
|
|
|
|
|
|
|
|
|
|
|
|
|
|
15,395(12) |
|
1,290,563 |
||
|
|
|
|
|
|
|
|
|
|
|
|
|
|
|
|
|
|
||
|
M. Raghib Hussain |
|
— (3) |
|
28,762 |
|
65.8 |
|
2/10/2024 |
|
|
|
|
|
|
|
|
||
|
|
|
16,582(2) |
|
19,599 |
|
48.88 |
|
2/11/2023 |
|
|
|
|
|
|
|
|
||
|
|
|
9,127(2) |
|
3,759 |
|
62.86 |
|
2/16/2022 |
|
|
|
|
|
|
|
|
||
|
|
|
23,958(1) |
|
1,042 |
|
37.83 |
|
2/7/2021 |
|
|
|
|
|
|
|
|
||
|
|
|
10,000(1) |
|
— |
|
37.63 |
|
3/22/2020 |
|
|
|
|
|
|
|
|
||
|
|
|
|
|
|
|
|
|
|
|
32,789(4) |
|
2,748,702 |
|
|
|
|
||
|
|
|
|
|
|
|
|
|
|
|
30,571(5) |
|
2,562,767 |
|
|
|
|
||
|
|
|
|
|
|
|
|
|
|
|
12,886(6) |
|
1,080,233 |
|
|
|
|
||
|
|
|
|
|
|
|
|
|
|
|
8,250(7) |
|
691,598 |
|
|
|
|
||
|
|
|
|
|
|
|
|
|
|
|
|
|
|
|
16,395(9) |
|
1,374,393 |
||
101
|
|
|
Option Awards |
|
Stock Awards |
|
|
||||||||||
|
Name |
|
Number of Securities Underlying Unexercised Options |
|
Number of Securities Underlying Unexercised Options |
|
Option Exercise Price |
|
Option Expiration Date |
|
Number of Shares or Units of Stock That Have Not Vested |
|
Market Value of Shares or Units of Stock That Have Not Vested |
|
Equity Incentive Plan Awards: Number of Unearned Shares, Units or Other Rights That Have Not Vested (#) |
|
Equity Incentive Plan Awards: Market or Payout Value of Unearned Shares, Units or Other Rights That Have Not Vested ($)(3) |
|
Arthur D. Chadwick |
|
— (3) |
|
20,344 |
|
65.8 |
|
2/10/2024 |
|
|
|
|
|
|
|
|
|
|
|
10,037(2) |
|
11,863 |
|
48.88 |
|
2/11/2023 |
|
|
|
|
|
|
|
|
|
|
|
5,408(2) |
|
2,228 |
|
62.86 |
|
2/16/2022 |
|
|
|
|
|
|
|
|
|
|
|
10,541(1) |
|
459 |
|
37.83 |
|
2/7/2021 |
|
|
|
|
|
|
|
|
|
|
|
22,000(1) |
|
— |
|
37.63 |
|
3/22/2020 |
|
|
|
|
|
|
|
|
|
|
|
30,000(1) |
|
— |
|
35.73 |
|
2/24/2019 |
|
|
|
|
|
|
|
|
|
|
|
30,000(1) |
|
— |
|
37.22 |
|
3/10/2018 |
|
|
|
|
|
|
|
|
|
|
|
|
|
|
|
|
|
|
|
23,193(4) |
|
1,540,583 |
|
|
|
|
|
|
|
|
|
|
|
|
|
|
|
18,504(5) |
|
715,188 |
|
|
|
|
|
|
|
|
|
|
|
|
|
|
|
7,636(6) |
|
755,524 |
|
|
|
|
|
|
|
|
|
|
|
|
|
|
|
6,050(7) |
|
343,420 |
|
|
|
|
|
|
|
|
|
|
|
|
|
|
|
|
|
|
|
11,596(9) |
|
972,093 |
|
|
|
|
|
|
|
|
|
|
|
|
|
|
|
|
|
|
|
Anil K. Jain |
|
— (3) |
|
15,345 |
|
65.8 |
|
2/10/2024 |
|
|
|
|
|
|
|
|
|
|
|
8,850(2) |
|
10,461 |
|
48.88 |
|
2/11/2023 |
|
|
|
|
|
|
|
|
|
|
|
4,732(2) |
|
1,950 |
|
62.86 |
|
2/16/2022 |
|
|
|
|
|
|
|
|
|
|
|
8,021(1) |
|
459 |
|
37.83 |
|
2/7/2021 |
|
|
|
|
|
|
|
|
|
|
|
11,918(1) |
|
— |
|
37.63 |
|
3/22/2020 |
|
|
|
|
|
|
|
|
|
|
|
7,584(1) |
|
— |
|
35.73 |
|
2/24/2019 |
|
|
|
|
|
|
|
|
|
|
|
1,168(1) |
|
— |
|
37.22 |
|
3/10/2018 |
|
|
|
|
|
|
|
|
|
|
|
|
|
|
|
|
|
|
|
17,494(4) |
|
1,466,522 |
|
|
|
|
|
|
|
|
|
|
|
|
|
|
|
16,317(5) |
|
1,367,854 |
|
|
|
|
|
|
|
|
|
|
|
|
|
|
|
6,681(6) |
|
560,069 |
|
|
|
|
|
|
|
|
|
|
|
|
|
|
|
6,050(7) |
|
507,172 |
|
|
|
|
|
|
|
|
|
|
|
|
|
|
|
|
|
|
|
8,746(9) |
|
733,178 |
|
|
|
|
|
|
|
|
|
|
|
|
|
|
|
|
|
|
|
Vincent P. Pangrazio |
|
— (3) |
|
11,464 |
|
65.8 |
|
2/10/2024 |
|
|
|
|
|
|
|
|
|
|
|
7,042(2) |
|
8,323 |
|
48.88 |
|
2/11/2023 |
|
|
|
|
|
|
|
|
|
|
|
3,718(2) |
|
1,532 |
|
62.86 |
|
2/16/2022 |
|
|
|
|
|
|
|
|
|
|
|
6,229(1) |
|
271 |
|
37.83 |
|
2/7/2021 |
|
|
|
|
|
|
|
|
|
|
|
13,000(1) |
|
— |
|
37.63 |
|
3/22/2020 |
|
|
|
|
|
|
|
|
|
|
|
|
|
|
|
|
|
|
|
13,069(4) |
|
1,095,574 |
|
|
|
|
|
|
|
|
|
|
|
|
|
|
|
12,9825) |
|
1,088,281 |
|
|
|
|
|
|
|
|
|
|
|
|
|
|
|
5,250(6) |
|
440,108 |
|
|
|
|
|
|
|
|
|
|
|
|
|
|
|
2,500(6) |
|
209,575 |
|
|
|
|
|
|
|
|
|
|
|
|
|
|
|
3,575(7) |
|
299,693 |
|
|
|
|
|
|
|
|
|
|
|
|
|
|
|
|
|
|
|
6,534(9) |
|
547,756 |
|
(1) |
The stock option was granted pursuant to our 2007 Equity Incentive Plan and vests as to 12.5% on the date six months from the vesting commencement date and 1/48th of the shares subject to the stock option vest monthly thereafter. |
|
(2) |
The stock option was granted pursuant to our 2007 Equity Incentive Plan and vests as to 25% on the first anniversary of the grant date and 1/48th of the shares subject to the stock option vest monthly thereafter. |
|
(3) |
The stock option was granted pursuant to our 2016 Equity Incentive Plan and vests as to 25% on the first anniversary of the grant date and 1/4th of the shares subject to the stock option vest on January 31 of each year thereafter. |
|
(3) |
Amount reflects the number of shares multiplied by the closing price of Cavium’s common stock on December 29, 2017. |
|
(4) |
The restricted stock unit award was granted pursuant to our 2016 Equity Incentive Plan and vests as to 25% on each of January 31, 2018, 2019, 2020 and 2021. |
|
(5) |
The restricted stock unit award was granted pursuant to our 2007 Equity Incentive Plan and vests as to 25% on each of January 30, 2017, 2018, 2019 and 2020. |
|
(6) |
The restricted stock unit award was granted pursuant to our 2007 Equity Incentive Plan and vests as to 25% on each of January 30, 2016, 2017, 2018 and 2019. |
|
(7) |
The restricted stock unit award was granted pursuant to our 2007 Equity Incentive Plan and vests as to 25% on each of January 30, 2015, 2016, 2017 and 2018. |
|
(8) |
This amount represents the remaining earned shares under the 2015 two year revenue PRSU which vest on January 31, 2018. |
|
(9) |
These amounts represent the maximum number of shares that could be earned under the 2017 Adjusted EPS PRSUs. The awards shall vest as to 50% on each of January 31, 2018 and January 31, 2019 if earned and upon certification of the performance condition by the Compensation Committee. |
|
(10) |
This represents the target number of shares that could be earned under the 2017 relative TSR PRSU. The award shall fully vest as of February 10, 2020 if earned and upon certification of the performance condition by the Compensation Committee. |
102
|
(11) |
This represents the target number of shares that could be earned under the 2016 relative TSR PRSU. The award shall fully vest as of February 11, 2019 if earned and upon certification of the performance condition by the Compensation Committee. |
|
(12) |
This amount represents the target number of shares that could be earned under the PRSU. The award shall fully vest for the target number of shares if the Company’s stock price closes on the Nasdaq Stock Market at or above $78.58 for any 30-day average within four years of the date of grant. An additional 15,395 shares shall fully vest if the Company’s stock price closes on the Nasdaq Stock Market at or above $94.29 for any 30-day average within four years of the date of grant. 1/4 of the award shall vest as of January 31, 2016 if earned and 1/4 of any shares which vest will be delivered on January 31, 2017, 2018 and 2019. If the stock price contingent criteria is achieved following any scheduled January 31st vesting date (but on or prior to February 16, 2019) then (i) no shares will vest on any scheduled January 31st vesting date prior to such achievement date, (ii) the shares which would have vested on each scheduled January 31st vesting date prior to such achievement date will vest within ten days following such achievement date, and (iii) 1/4th of the applicable amount of shares will vest on January 31st of each year thereafter (up to and including January 31, 2019). |
Certain of the options and restricted stock unit awards awarded to each of our named executive officers will vest on an accelerated basis upon certain prescribed circumstances. Additional information regarding the vesting acceleration provisions applicable to equity awards granted to our named executive officers is included below under the heading “Employee Agreements and Potential Payments Upon Termination or Change in Control.”
103
OPTION EXERCISES AND STOCK VESTED
The following table shows for the fiscal year ended December 31, 2017, certain information regarding option exercises and stock vested during the fiscal year with respect to the named executive officers:
OPTION EXERCISES AND STOCK VESTED IN FISCAL 2017
|
|
|
Option Awards |
|
Stock Awards |
||||
|
Name |
|
Number of Shares Acquired on Exercise |
|
Value Realized on Exercise |
|
Number of Shares Acquired on Vesting |
|
Value Realized on Vesting |
|
Syed B. Ali |
|
- |
|
- |
|
88,105 |
|
5,833,432 |
|
M. Raghib Hussain |
|
57,500 |
|
1,888,400 |
|
54,123 |
|
3,583,484 |
|
Arthur D. Chadwick |
|
- |
|
- |
|
34,695 |
|
2,297,156 |
|
Anil K. Jain |
|
- |
|
- |
|
31,933 |
|
2,114,284 |
|
Vincent P. Pangrazio |
|
60,000 |
|
2,170,200 |
|
21,823 |
|
1,444,901 |
|
(1) |
The value realized on exercise represents the difference between the exercise price per share of the stock option and the fair market value of our common stock as reported by NASDAQ on the date of exercise multiplied by the number of shares acquired on exercise. The value realized was determined without considering any taxes that may have been owed. |
|
(2) |
The value realized on vesting represents the number of shares acquired on vesting multiplied by the fair market value of our common stock as reported by NASDAQ on the date of vesting. |
We do not currently maintain a qualified or non-qualified defined benefit plan, nor do we currently maintain nonqualified defined contribution plans or other deferred compensation plans.
RATIO OF 2017 COMPENSATION OF CHIEF EXECUTIVE OFFICER TO THAT OF THE MEDIAN EMPLOYEE
In August 2015 pursuant to a mandate of the Dodd-Frank Act, the SEC adopted a rule requiring annual disclosure of the ratio of the principal executive officer’s annual total compensation to the median employee’s annual total compensation. The disclosure is required for fiscal years beginning on or after January 1, 2017.
Our principal executive officer is our President and Chief Executive Officer, or CEO. Our CEO to median employee pay ratio is calculated in accordance with Item 402(u) of Regulation S-K. We identified the median employee by examining the W-2 income from January 1, 2017 to November 5, 2017 for U.S. employees and for reasons relating to payroll timing, from January 1, 2017 to October 31, 2017 for non-U.S. employees, for all individuals who were employed by the Company on December 31, 2017 other than our CEO. For non-U.S. employees W-2-equivalent income was used. We included all employees, whether employed on a full-time, part-time or seasonal basis, but excluded employees who were not employed during the entire consideration period. We did not make other any assumptions, adjustments or estimates with respect to the W-2 (or equivalent) compensation.
After identifying the median employee based on W-2 (or equivalent) income, we calculated the annual total compensation for such employee using the same methodology we use for our named executive officers as required to be set forth in the Summary Compensation Table included in this Annual Report. Using this methodology, our CEO’s annual total compensation in 2017 was $8,113,638 and our median employee’s annual total compensation in 2017 was $168,047. As a result, our 2017 CEO to median employee pay ratio was approximately 49:1.
Employee Agreements And Potential Payments Upon Termination Or Change In Control
The following summaries set forth the employment agreements and potential payments payable to our named executive officers upon termination of employment or a change in control under their current employment agreements and our other compensation programs.
We believe that the severance benefits we provide for our named executive officers are appropriate and provide us with greater flexibility to make changes in our executive management if the changes are in the stockholders’ best interests. This flexibility is provided by already having in place certain mutually agreed upon severance packages so that parties are aware of and have agreed upon the payments that would occur upon various termination events. In addition to the potential payments set forth below, each of the named executive officers, as employees, may be entitled to certain benefits under the 2007 Equity Incentive Plan and 2016 Equity Incentive Plan relating to a change in control or other corporate transaction.
Syed B. Ali. In January 2001, we entered into an employment agreement with Mr. Ali, our President and Chief Executive Officer. In December 2008, we entered into an amendment to the employment agreement to comply with the requirements of Section 409A of
104
the Internal Revenue Code of 1986, as amended. Mr. Ali’s agreement provides that he is an at-will employee and his employment may be terminated at any time by us or Mr. Ali. If we terminate Mr. Ali’s employment without cause (as defined in his employment agreement) or Mr. Ali is constructively terminated (as defined in his employment agreement), and Mr. Ali executes a release of claims against Cavium, Mr. Ali will be entitled to receive $14,583 (less applicable withholding taxes) per month for a period of 12 months and reimbursement for health care continuation coverage for the same period. If, during that 12-month period, Mr. Ali obtains full time employment (or its equivalent), then Mr. Ali’s severance payments will be decreased by the salary or fees paid for such work (but not decreased by more than $50,000 in the aggregate) and his health care continuation reimbursements will cease if he has been provided with substantially similar coverage. For a period of 18 months after his termination of employment, Mr. Ali will be subject to certain restrictions on competition with Cavium and on the solicitation of employees, customers and clients. Mr. Ali is also eligible to participate in our general employee benefit plans in accordance with the terms and conditions of the plans.
M. Raghib Hussain. In July 2016, we entered into an amended and restated offer letter with Mr. Hussain, our Chief Operating Officer. Mr. Hussain’s offer letter provides that he is an at-will employee and his employment may be terminated at any time by us or Mr. Hussain. If we terminate Mr. Hussain’s employment without cause (as defined in his offer letter) or Mr. Hussain resigns for good reason (as defined in his offer letter), he is entitled to receive 12 months of his base salary in a lump sum and 12 months of COBRA premiums. If during that 12 month period Mr. Hussain obtains health benefits from a new employer, his COBRA premiums will cease. Mr. Hussain is also eligible to participate in our general employee benefit plans in accordance with the terms and conditions of the plans.
Arthur D. Chadwick. In December 2004, we entered into an employment offer letter with Mr. Chadwick, our Vice President of Finance & Administration and Chief Financial Officer. Mr. Chadwick’s offer letter provides that he is an at-will employee and his employment may be terminated at any time by us or Mr. Chadwick. If we terminate Mr. Chadwick’s employment without cause (as defined in his offer letter) or Mr. Chadwick resigns for good reason (as defined in his offer letter), one half of his unvested Cavium stock and stock options will become vested. Additionally, Mr. Chadwick’s unvested Cavium stock and stock options will fully vest if we terminate Mr. Chadwick’s employment or Mr. Chadwick resigns for good reason within three months prior to or 12 months following a change in control (as defined in his offer letter) or Mr. Chadwick is not offered the position of chief financial officer of the surviving or continuing entity within three months following the change in control. In addition, in the event of a change in control, Mr. Chadwick has agreed to assist Cavium with the transition following a change in control for up to six months. Mr. Chadwick is also eligible to participate in our general employee benefit plans in accordance with the terms and conditions of the plans.
Anil K. Jain. In January 2001, we entered into an employment offer letter with Mr. Jain, our Vice President of IC Engineering. In December 2008, we entered into an amendment to the employment offer letter to comply with the requirements of Section 409A of the Internal Revenue Code of 1986, as amended. Mr. Jain’s offer letter provides that Mr. Jain is an at-will employee and his employment may be terminated at any time by us or Mr. Jain. If we terminate Mr. Jain’s employment for any reason, Mr. Jain is entitled to receive his salary as well as benefits for three months after termination. Mr. Jain is also eligible to participate in our general employee benefit plans in accordance with the terms and conditions of the plans.
Vincent P. Pangrazio. In February 2011, we entered into an employment offer letter with Mr. Pangrazio, our Senior Vice President and General Counsel. Mr. Pangrazio’s offer letter provides that Mr. Pangrazio is an at-will employee and his employment may be terminated at any time by us or Mr. Pangrazio. If we terminate Mr. Pangrazio’s employment without cause (as defined in his offer letter) or Mr. Pangrazio resigns for good reason (as defined in his offer letter), two thirds of his unvested Cavium stock and stock options will become vested and Mr. Pangrazio will receive in a lump sum six months of his base salary, half of his target cash bonus if applicable and six months of COBRA premiums. If, during that six-month period, Mr. Pangrazio obtains health benefits comparable to the COBRA benefits from a new employer, his COBRA premiums will cease. Additionally, Mr. Pangrazio’s unvested Cavium stock and stock options will fully vest if we terminate Mr. Pangrazio’s employment or Mr. Pangrazio resigns for good reason within three months prior to or 12 months following a change in control (as defined in his offer letter) or Mr. Pangrazio is not offered a similar position of responsibility within the surviving or continuing entity within three months following the change in control. In addition, in the event of a change in control, Mr. Pangrazio has agreed to assist Cavium with the transition following a change in control for up to three months. Mr. Pangrazio is also eligible to participate in our general employee benefit plans in accordance with the terms and conditions of the plans.
105
In February 2014, 2015, 2016 and 2017, the Compensation Committee granted equity incentive plan awards to its named executive officers. In the event there is a change in control (as defined in the stock option agreements), 100% of each of the option grants and restricted stock unit awards granted to Messrs. Ali, Hussain, Chadwick, Jain, and Pangrazio in February 2014 will immediately vest if any of the following events occur: (i) the employee is terminated by Cavium without cause (as defined in the stock option agreements) within 12 months following the change in control, or (ii) the employee resigns for good reason (as defined in the stock option agreements) within 12 months following the change in control. In the event there is a change in control (as defined in the stock option agreements), 100% of each of the option grants and restricted stock unit awards granted to Messrs. Ali, Hussain, Chadwick, Jain, and Pangrazio in February 2015, 2016 and 2017 will immediately vest if any of the following events occur: (i) the employee is terminated by Cavium without cause (as defined in the stock option agreements) within 3 months prior to or 12 months following the change in control, or (ii) the employee resigns for good reason (as defined in the stock option agreements) within 3 months prior to or 12 months following the change in control.
In February 2017, the Compensation Committee granted PRSUs to the named executive officers. In the event there is a change in control (as defined in the stock award agreements) prior to January 31, 2018, one half of the target shares for Messrs. Ali, Hussain, Chadwick, Jain and Pangrazio shall vest and be delivered on January 31, 2018 and the other half will be delivered on January 31, 2019, subject to their continuous service through those dates. In the event there is a change in control (as defined in the stock award agreements) prior to January 31, 2018 and: (i) the employee is terminated by Cavium without cause (as defined in the stock award agreements) prior to January 31, 2018, or (ii) the employee resigns for good reason (as defined in the stock award agreements) prior to January 31, 2018, then the target shares shall be delivered on the date of such termination or resignation.
For Mr. Ali’s 2017 PRSU with a relative TSR target, in the event there is a change of control (as defined in the stock award agreement) on or prior to February 10, 2020, then the performance period will be deemed to end upon the completion of the change of control and the number of PRSUs that vest will be determined based on a comparison of the Cavium TSR to the S&P Semiconductor Select Industry Index TSR for the 30 trading days prior to the first date of the performance period and the 30 trading days immediately prior to the change in control (the “Change in Control RSUs”). A pro rata portion of the shares subject to the Change in Control RSUs will vest upon such change of control. The remaining unvested shares subject to the Change in Control RSUs will vest in equal annual installments during the performance period. If, following such change of control and on or prior to February 10, 2020, either (i) Mr. Ali’s employment with Cavium is terminated without cause (as defined in the award agreement) or (ii) Mr. Ali resigns for good reason (as defined in the award agreement), then any remaining unvested PRSUs will vest on the date of such termination or resignation.
For Mr. Ali’s 2016 PRSU with a relative TSR target, in the event there is a change of control (as defined in the stock award agreement) on or prior to February 11, 2019, then the performance period will be deemed to end upon the completion of the change of control and a pro rata portion of the shares subject to the PRSU award will vest upon such change of control. The remaining unvested shares subject to the PRSU award will vest in equal annual installments during the performance period; provided, however, if following such change of control and on or prior to February 12, 2019 either (i) Mr. Ali’s employment with Cavium is terminated without cause (as defined in the award agreement) or (ii) Mr. Ali resigns for good reason (as defined in the award agreement), the PRSUs will vest at target on the date of such termination or resignation.
For Mr. Ali’s 2015 PRSU with a stock price contingent target, in the event there is a change of control (as defined in the stock option agreement) on or prior to January 31, 2019 and (i) neither of the stock price contingent criteria are achieved prior to such change of control, and (ii) following such change of control (but in any case on or prior to January 31, 2019), either (x) Mr. Ali’s employment with Cavium is terminated without cause (as defined in the stock option agreement) or (y) Mr. Ali resigns for good reason (as defined in the stock option agreement), then a number of shares equal to the target shares will vest on the date of such termination or resignation.
106
The amount of potential compensation and benefits payable to each named executive officer in various termination and change in control situations has been estimated in the table below and assumes that the event occurred on December 29, 2017, the last business day of Cavium’s last fiscal year. The amounts below assume that the change in control is not in connection with the agreement Cavium signed with Marvell Technology Group Ltd. in November 2017.
|
Named Executive Officer |
|
Termination or Change in Control Event |
|
Cash Severance Payment ($) |
|
Continuation of Medical Benefits($) |
|
Acceleration of Vesting of Stock Options ($)(1) |
|
Acceleration of Vesting of Stock Awards ($)(1) |
|
Total Termination Benefits ($) |
|
Syed B. Ali(2) |
|
Termination without cause or constructive termination, no change in control |
|
174,996 |
|
25,952 |
|
- |
|
- |
|
200,948 |
|
|
|
Termination without cause or resignation for good reason within 12 months following a change in control |
|
174,996 |
|
25,952 |
|
2,204,472 |
|
20,425,934 |
|
22,831,354 |
|
|
|
Termination without cause or resignation for good reason within 3 months prior to a change in control |
|
174,996 |
|
25,952 |
|
2,051,108 |
|
18,958,909 |
|
21,210,965 |
|
|
|
|
|
|
|
|
|
|
|
|
|
|
|
M. Raghib Hussain(3) |
|
Termination without cause or resignation for good reason, no change in control |
|
450,000 |
|
25,952 |
|
- |
|
- |
|
475,952 |
|
|
|
Termination without cause or resignation for good reason within 12 months following a change in control |
|
450,000 |
|
25,952 |
|
1,330,322 |
|
7,999,562 |
|
9,805,836 |
|
|
|
Termination without cause or resignation for good reason within 3 months prior a change in control |
|
450,000 |
|
25,952 |
|
1,282,390 |
|
7,307,964 |
|
9,066,306 |
|
|
|
|
|
|
|
|
|
|
|
|
|
|
|
Arthur D. Chadwick |
|
Termination without cause or resignation for good reason, no change in control |
|
- |
|
- |
|
424,625 |
|
2,645,423 |
|
3,070,048 |
|
|
|
Termination or resignation for good reason within 3 months prior to or 12 months following a change in control or not offered position of CFO within 3 months following the change in control |
|
- |
|
- |
|
849,249 |
|
5,290,847 |
|
6,140,096 |
|
|
|
|
|
|
|
|
|
|
|
|
|
|
|
Anil K. Jain |
|
Termination for any reason, no change in control |
|
93,750 |
|
4,875 |
|
- |
|
- |
|
98,625 |
|
|
|
Termination without cause or resignation for good reason within 12 months following a change in control |
|
93,750 |
|
4,875 |
|
704,288 |
|
4,390,429 |
|
5,193,342 |
|
|
|
Termination without cause or resignation for good reason within 3 months prior a change in control |
|
93,750 |
|
4,875 |
|
683,174 |
|
3,883,257 |
|
4,665,056 |
|
|
|
|
|
|
|
|
|
|
|
|
|
|
|
Vincent P. Pangrazio (4) |
|
Termination without cause or resignation for good reason, no change in control |
|
142,500 |
|
12,976 |
|
361,451 |
|
2,332,263 |
|
2,849,190 |
|
|
|
Termination or resignation for good reason within 3 months prior to or 12 months following a change in control or if not offered a similar position of responsibility with the surviving entity within 3 months following the change in control |
|
142,500 |
|
12,976 |
|
542,177 |
|
3,498,394 |
|
4,196,047 |
|
(1) |
The value of stock option and stock award vesting acceleration is based on the closing stock price of $83.83 per share for our common stock as reported on The NASDAQ Global Market on December 29, 2017 and, with respect to in-the-money unvested stock option shares, minus the exercise price of the unvested option shares. |
|
(2) |
If, during the 12-month period, Mr. Ali obtains full time employment (or its equivalent), then Mr. Ali’s severance payments will be decreased by the salary or fees paid for such work (but not decreased by more than $50,000) and his health care continuation reimbursements will cease if he is provided with substantially similar coverage. |
|
(3) |
If, during that 12 month period, Mr. Hussain obtains health benefits comparable to the COBRA benefits from a new employer, his COBRA premiums will cease. |
107
|
(4) |
If, during that six-month period, Mr. Pangrazio obtains health benefits comparable to the COBRA benefits from a new employer, his COBRA premiums will cease. |
DIRECTOR COMPENSATION
The following table shows for the fiscal year ended December 31, 2017 certain information with respect to the compensation of all non-employee directors of Cavium. Mr. Syed Ali, our one employee director, did not receive any cash compensation for his services as a member of our Board of Directors in 2017.
DIRECTOR COMPENSATION FOR FISCAL 2017
|
Name |
|
Fees Earned or Paid in Cash ($) |
|
Stock Awards ($)(1) |
|
Total ($) |
|
Brad W. Buss (2) |
|
62,500 |
|
249,972 |
|
312,472 |
|
Edward H. Frank (3) |
|
57,500 |
|
249,972 |
|
307,472 |
|
Sanjay Mehrotra (4) |
|
62,500 |
|
249,972 |
|
312,472 |
|
Madhav Rajan (5) |
|
72,500 |
|
249,972 |
|
322,472 |
|
C.N. Reddy (6) |
|
- |
|
- |
|
- |
|
Anthony S. Thornley (7) |
|
92,500 |
|
249,972 |
|
342,472 |
|
(1) |
The dollar amounts in this column represent the aggregate full grant date fair value calculated in accordance with FASB ASC Topic 718 for stock awards granted during the fiscal year ended December 31, 2017. |
|
(2) |
As of December 31, 2017, Mr. Buss held 3,803 unvested restricted stock units. |
|
(3) |
As of December 31, 2017, Dr. Frank held 3,803 unvested restricted stock units. |
|
(4) |
As of December 31, 2017, Mr. Mehrotra held unexercised options to purchase 39,500 shares and 3,803 unvested restricted stock units. |
|
(5) |
As of December 31, 2017, Mr. Rajan held unexercised options to purchase 31,000 shares and 3,803 unvested restricted stock units. |
|
(6) |
Mr. Reddy ceased to be a member of our Board of Directors and the Nominating Committee upon commencement of the 2017 Annual Meeting. |
|
(7) |
As of December 31, 2017, Mr. Thornley held unexercised options to purchase 39,500 shares and 3,803 unvested restricted stock units. |
Our Board of Directors believes that a combination of cash and equity is the best way to attract and retain non-employee directors with the background, experience and skills necessary for a company such as ours. The Board works with Compensia, its independent compensation consultant, to design and update the non-employee director compensation program to keep our compensation levels and structures competitive. In making decisions regarding non-employee director compensation, our Board periodically considers data provided by Compensia about non-employee director compensation at the companies in our compensation peer group (the composition of our compensation peer group is described above in our Compensation Discussion and Analysis). In February 2016, Compensia provided the Board with an analysis of our director compensation program compared to the competitive market. At such time, our Board reviewed the total compensation opportunity for non-employee directors individually and in the aggregate in light of our desire to retain our board members, attract potential new directors and provide competitive consideration for the directors’ services. As a result of the review, the Board of Directors approved a new non-employee director compensation policy, or the director policy, in April 2016.
The cash compensation to be paid annually pursuant to the director policy is as follows: $45,000 per year for service on the Board of Directors, plus an additional $17,500 per year for the lead director; $10,000 per year for service on the audit committee, plus an additional $15,000 per year for the chairperson; $7,500 per year for service on the compensation committee, plus an additional $10,000 for the chairperson; and $5,000 per year for service on the nominating and corporate governance committee, plus an additional $5,000 for the chairperson. This cash compensation is paid on, or soon after, the date of our annual meeting of stockholders each year and is paid for the director’s service for the twelve months following the annual meeting of stockholders.
108
In addition, the director policy provides that each individual who is first elected or appointed as a non-employee director of the Board of Directors will automatically be granted a restricted stock unit award covering shares of common stock with an aggregate fair market value of $250,000 on the date of grant on the date of his or her initial election or appointment to be a director. If an individual is appointed for the first time to be a non-employee director of the Board of Directors other than at an annual meeting of stockholders, such individual’s initial grant will be pro-rated for the number of days remaining until the next anticipated annual meeting of stockholders.
The director policy also provides that on the date of each annual meeting of stockholders, each individual who is then a non-employee director of the Board of Directors and will be continuing as a non-employee director following the date of such annual meeting (other than any individual receiving an initial grant on the date of such annual meeting) will automatically be granted a restricted stock unit award covering shares of common stock with an aggregate fair market value of $250,000 on the date of grant.
All of the shares subject to the initial and annual grants vest on April 30th in the year following the year of the date of grant. The initial and annual grants may accelerate in the event the non-employee directors’ service terminates in connection with a change in control as the term is defined in the director policy.
We make the grants because we believe that long-term performance from our non-employee directors should be encouraged and rewarded through a culture of stock ownership. Therefore, our long-term equity incentive compensation for non-employee directors is currently in the form of restricted stock unit awards. The 2007 Equity Incentive Plan and 2016 Equity Incentive Plan were established to provide our employees, named executive officers, and our non-employee directors with equity incentives to help align their incentives with the interests of our stockholders.
Compensation Committee Interlocks and Insider Participation
None of the members of our Compensation Committee during 2017 was an officer or employee of Cavium. None of our executive officers serve as a member of the board of directors or compensation committee of any entity that has one or more executive officers who serve on our Board of Directors or Compensation Committee.
Compensation Committee Report1
The Compensation Committee has reviewed and discussed with management the Compensation Discussion and Analysis (“CD&A”) contained in this Annual Report on Form 10-K. Based on this review and discussion, the Compensation Committee has recommended to the Board of Directors that the CD&A be included in this Annual Report on Form 10-K.
Madhav V. Rajan (Chair)
Brad Buss
Edward H. Frank
Sanjay Mehrotra
|
|
1 |
The material in this report is not “soliciting material,” is furnished to, but not deemed “filed” with, the Commission and is not deemed to be incorporated by reference in any filing of Cavium under the Securities Act or the Exchange Act, whether made before or after the date hereof and irrespective of any general incorporation language in any such filing. |
109
Item 12. Security Ownership of Certain Beneficial Owners and Management and Related Stockholder Matters
Security Ownership of
Certain Beneficial Owners and Management
The following table sets forth certain information regarding the ownership of Cavium’s common stock as of February 16, 2018 by: (i) each director; (ii) each of the executive officers named in the Summary Compensation Table (referred to in this Annual Report on Form 10-K as our “named executive officers”); (iii) all executive officers and directors of Cavium as a group; and (iv) all those known by Cavium to be beneficial owners of more than five percent of its common stock.
|
|
|
Beneficial Ownership(1) |
||
|
Beneficial Owner |
|
Number of Shares |
|
Percent of Total |
|
FMR LLC(2) |
|
6,677,439 |
|
9.57 |
|
The Vanguard Group(3) |
|
5,434,310 |
|
7.79 |
|
Syed B. Ali(4) |
|
2,285,504 |
|
3.25 |
|
M. Raghib Hussain(5) |
|
337,884 |
|
* |
|
Arthur D. Chadwick(6) |
|
75,638 |
|
* |
|
Anil K. Jain(7) |
|
100,885 |
|
* |
|
Vincent P. Pangrazio (8) |
|
52,490 |
|
* |
|
Brad Buss |
|
7,700 |
|
* |
|
Edward H. Frank |
|
5,200 |
|
* |
|
Sanjay Mehrotra(9) |
|
108,708 |
|
* |
|
Madhav V. Rajan(10) |
|
57,208 |
|
* |
|
Anthony Thornley(11) |
|
44,708 |
|
* |
|
All executive officers and directors as a group (10 persons)(12) |
|
3,075,925 |
|
4.38% |
|
* |
Less than one percent. |
|
(1) |
This table is based upon information supplied by officers, directors, principal stockholders and Schedules 13G filed with the SEC on or prior to February 14, 2018. Unless otherwise indicated in the footnotes to this table and subject to community property laws where applicable, Cavium believes that each of the stockholders named in this table has sole voting and investment power with respect to the shares indicated as beneficially owned. Applicable percentages are based on 69,800,725 shares outstanding on February 16, 2018, adjusted as required by rules promulgated by the SEC. The information provided in the Schedules 13G report beneficial ownership as of December 31, 2017 and so change of beneficial ownership, if any, between that date and February 16, 2018 is not reflected in the table. |
|
(2) |
FMR LLC has sole power to vote or direct the vote of 2,660,424 shares and the sole power to dispose of or to direct the disposition of all of these shares. The address for FMR LLC is 245 Summer Street, Boston, Massachusetts 02210. |
|
(3) |
The Vanguard Group has sole power to vote or direct the vote of 38,012 shares and the sole power to dispose of or to direct the disposition of 5,393,255 shares. The Vanguard Group has shared power to vote or direct the vote of 8,424 shares and shared power to dispose of or direct the disposition of 41,055 shares. The address for The Vanguard Group is 100 Vanguard Blvd., Malvern, Pennsylvania 19355. |
|
(4) |
Includes 498,759 shares that Mr. Ali has a right to acquire within 60 days of February 16, 2018 pursuant to outstanding options. |
|
(5) |
Includes (a) 36,000 shares held through family trusts, and (b) 73,186 shares that Mr. Hussain has a right to acquire within 60 days of February 16, 2018 pursuant to outstanding options. |
|
(6) |
Includes 49,436 shares that Mr. Chadwick has a right to acquire within 60 days of February 16, 2018 pursuant to outstanding options. |
|
(7) |
Includes 48,205 shares that Mr. Jain has a right to acquire within 60 days of February 16, 2018 pursuant to outstanding options. |
|
(8) |
Includes 35,321 shares that Mr. Pangrazio has a right to acquire within 60 days of February 16, 2018 pursuant to outstanding options. |
|
(9) |
Includes 39,500 shares that Mr. Mehrotra has a right to acquire within 60 days of February 16, 2018 pursuant to outstanding options. |
|
(10) |
Includes 31,000 shares that Mr. Rajan has a right to acquire within 60 days of February 16, 2018 pursuant to outstanding options. |
|
(11) |
Includes 39,500 shares that Mr. Thornley has a right to acquire within 60 days of February 16, 2018 pursuant to outstanding options. |
|
(12) |
Includes an aggregate of 814,907 shares that our directors and executive officers have a right to acquire within 60 days of February 16, 2018 pursuant to outstanding options. |
110
Equity Compensation Plan Information
The following table provides certain information with respect to all of Cavium’s equity compensation plans in effect as of December 31, 2017:
|
Plan Category |
|
Number of Securities to be Issued upon Exercise of Outstanding Options, Warrants and Rights |
|
Weighted Average Exercise Price of Outstanding Options, Warrants and Rights |
|
Number of Securities Remaining Available for Future Issuance Under Equity Compensation Plans (Excluding Securities Reflected in the first Column) |
|||
|
Equity compensation plans approved by security holders: |
|
|
|
|
|
|
|
|
|
|
2001 Stock Incentive Plan (1) |
|
|
— |
|
|
— |
|
|
— |
|
2007 Equity Incentive Plan (2) |
|
|
2,129,012 |
|
$ |
19.20 |
|
|
— |
|
2016 Equity Incentive Plan (3) |
|
|
979,657 |
|
$ |
9.78 |
|
|
2,421,854 |
|
QLogic 2005 Performance Incentive Plan (4) |
|
|
1,644,171 |
|
$ |
0.00 |
|
|
1,200,046 |
|
Equity compensation |
|
|
— |
|
|
— |
|
|
— |
|
TOTAL: |
|
|
4,752,840(5) |
|
$ |
10.62 |
|
|
3,621,900 |
|
(1) |
In February 2001, we adopted the 2001 Stock Incentive Plan, or 2001 Plan. A total of 10,258,479 shares of common stock are reserved for issuance under the 2001 Plan. As a result of our initial public offering and the adoption of the 2007 Equity Incentive Plan, Cavium no longer grants awards under the 2001 Plan; however, all outstanding options issued pursuant to the 2001 Plan continue to be governed by their existing terms. |
|
(2) |
In February 2007, we adopted the 2007 Equity Incentive Plan, or 2007 Plan, which became effective in May 2007 in connection with our initial public offering. A total of 5,000,000 shares of common stock were initially authorized for issuance under the 2007 Incentive Plan. As a result of our adoption of the 2016 Equity Incentive Plan, Cavium no longer grants awards under the 2007 Plan; however, all outstanding options and restricted stock unit awards issued pursuant to the 2007 Plan continue to be governed by their existing terms. |
|
(3) |
In June 2016, we adopted the 2016 Equity Incentive Plan, or 2016 Plan. A total of 3,600,000 shares of common stock were initially authorized for issuance under the 2016 Plan. |
|
(4) |
In August 2016, in connection with our acquisition of QLogic Corporation, we assumed the QLogic 2005 Performance Incentive Plan, or QLogic Plan. A total of 3,612,039 shares of common stock were authorized for issuance under the QLogic Plan at the time we assumed it. |
|
(5) |
Consists of 3,622,824 shares granted as restricted stock unit awards and options to purchase 1,130,016 shares. |
111
Item 13. Certain Relationships and Related Transactions, and Director Independence.
Code of Conduct Policy and Procedures
Cavium has a written Code of Conduct, or Code of Conduct, that sets forth Cavium’s policies and procedures regarding the identification, review, consideration and approval or ratification of related person transactions with employees, directors and consultants. Pursuant to our written Code of Conduct, our executive officers and directors are not permitted to enter into such related person transactions without the approval of either our Audit Committee or our Board of Directors. Our Audit Committee and/or Board of Directors shall approve only those related person transactions that, in light of known circumstances, are in, or are not inconsistent with, our best interests, which our Audit Committee or Board of Directors determines in the good faith exercise of its discretion. Our Code of Conduct also prohibits employees from entering into transactions that are a “conflict of interest,” such as those in which a person’s private interest interferes in any way with Cavium’s interests, without the approval of our designated compliance officer.
Certain Related-Person Transactions
Cavium has entered into indemnity agreements with certain officers and directors which provide, among other things, that Cavium will indemnify the officer or director, under the circumstances and to the extent provided for therein, for expenses, damages, judgments, fines and settlements he or she may be required to pay in actions or proceedings which he or she is or may be made a party by reason of his or her position as a director, officer or other agent of Cavium, and otherwise to the fullest extent permitted under Delaware law and Cavium’s Bylaws.
Independence of the Board of Directors
As required under the Nasdaq Stock Market (“NASDAQ”) listing standards, a majority of the members of a listed company’s board of directors must qualify as “independent,” as affirmatively determined by the board of directors. Cavium’s Board of Directors consults with Cavium’s counsel to ensure that the Board of Directors’ determinations are consistent with relevant securities and other laws and regulations regarding the definition of “independent,” including those set forth in pertinent listing standards of NASDAQ, as in effect from time to time.
Consistent with these considerations, after review of all relevant identified transactions or relationships between each director, or any of his or her family members, and Cavium, its senior management and its independent auditors, the Board of Directors has affirmatively determined that the following current five directors are independent directors within the meaning of the applicable NASDAQ listing standards: Dr. Frank and Messrs. Buss, Mehrotra, Rajan, and Thornley. In making this determination, the Board of Directors found that none of these directors or nominees for director had a material or other disqualifying relationship with Cavium. Mr. Ali, Cavium’s President and Chief Executive Officer, is not an independent director by virtue of his employment with Cavium.
112
Item 14. Principal Accounting Fees and Services.
In connection with the audit of the 2017 financial statements, Cavium entered into an engagement agreement with PricewaterhouseCoopers LLP which sets forth the terms by which PricewaterhouseCoopers LLP will perform audit services for Cavium.
The following table represents aggregate fees billed to Cavium for the fiscal years ended December 31, 2016 and 2017, respectively, by PricewaterhouseCoopers LLP, Cavium’s principal accountant.
|
|
|
Fiscal Year Ended December 31, |
||
|
|
|
2016 |
|
2017 |
|
|
|
($) |
|
($) |
|
|
|
(In thousands) |
||
|
Audit Fees(1) |
|
2,575 |
|
2,397 |
|
Audit-related Fees(2) |
|
593 |
|
1,364 |
|
Tax Fees(3) |
|
54 |
|
- |
|
All Other Fees(4) |
|
40 |
|
36 |
|
Total Fees |
|
3,262 |
|
3,797 |
|
(1) |
Audit Fees consist of fees incurred for professional services rendered for the audit of our annual consolidated financial statements, review of our quarterly consolidated financial statements, other services normally provided by PricewaterhouseCoopers LLP in connection with regulatory filings, and for the audit of the effectiveness of our internal control over financial reporting. |
|
(2) |
Audit-related Fees consist of fees for audit services related to acquisitions and audit services related to one of Cavium’s subsidiaries. |
|
(3) |
Tax Fees consist of fees for professional services for tax compliance, tax advice and tax planning. |
|
(4) |
All Other Fees consist of fees for professional services other than the services reported above, including permissible consulting services. |
All fees described above were approved by the Audit Committee.
113
Item 15. Exhibits, Financial Statement Schedules
Index to Consolidated Financial Statements
a. The following documents are filed as part of this report:
|
1. |
54 |
|
|
|
See Index to Financial Statements in Item 8 of this Annual Report on Form 10-K, which is incorporated herein by reference. |
|
|
2. |
87 |
|
|
|
Schedule II - Valuation and Qualifying Accounts |
|
|
3. |
117 |
|
|
|
The exhibits listed in the accompanying index to exhibits are filed or incorporated by reference as a part of this Annual Report on Form 10-K. |
|
114
|
|
|
|
|
Incorporated by Reference |
|
||||||
|
Exhibit |
|
Description |
|
Schedule |
|
File |
|
Exhibit |
|
Filing |
|
|
2.1** |
|
|
8-K |
|
001-33435 |
|
2.1 |
|
11/22/2017 |
|
|
|
|
|
|
|
|
|
|
|
|
|
|
|
|
2.2** |
|
|
8-K |
|
001-33435 |
|
2.1 |
|
6/15/2016 |
|
|
|
|
|
|
|
|
|
|
|
|
|
|
|
|
2.3** |
|
|
10-Q |
|
001-33435 |
|
2.1 |
|
8/1/2014 |
|
|
|
|
|
|
|
|
|
|
|
|
|
|
|
|
2.4** |
|
|
10-Q |
|
001-33435 |
|
2.2 |
|
10/31/2014 |
|
|
|
|
|
|
|
|
|
|
|
|
|
|
|
|
2.5** |
|
|
8-K |
|
001-33435 |
|
2.1 |
|
4/3/2015 |
|
|
|
|
|
|
|
|
|
|
|
|
|
|
|
|
2.6** |
|
|
8-K |
|
000-23298 |
|
2.1 |
|
1/25/2012 |
|
|
|
|
|
|
|
|
|
|
|
|
|
|
|
|
2.7** |
|
|
8-K |
|
000-23298 |
|
2.1 |
|
3/13/2014 |
|
|
|
|
|
|
|
|
|
|
|
|
|
|
|
|
3.1 |
|
|
8-K |
|
001-33435 |
|
3.2 |
|
6/20/2011 |
|
|
|
|
|
|
|
|
|
|
|
|
|
|
|
|
3.2 |
|
|
S-1/A |
|
333-140660 |
|
3.5 |
|
4/13/2007 |
|
|
|
|
|
|
|
|
|
|
|
|
|
|
|
|
4.1 |
|
|
|
|
|
|
|
|
|
|
|
|
|
|
|
|
|
|
|
|
|
|
|
|
|
4.2 |
|
|
S-1/A |
|
333-140660 |
|
4.2 |
|
4/24/2007 |
|
|
|
|
|
|
|
|
|
|
|
|
|
|
|
|
10.1 |
|
|
10-Q |
|
001-33435 |
|
10.1 |
|
4/29/2016 |
|
|
|
|
|
|
|
|
|
|
|
|
|
|
|
|
10.2† |
|
|
10-Q |
|
001-33435 |
|
10.1 |
|
11/7/2016 |
|
|
|
|
|
|
|
|
|
|
|
|
|
|
|
|
10.3† |
|
Form of Option Grant Notice and Option Agreement under QLogic 2005 Performance Incentive Plan |
|
10-Q |
|
001-33435 |
|
10.2 |
|
11/7/2016 |
|
|
|
|
|
|
|
|
|
|
|
|
|
|
|
10.4† |
|
|
10-Q |
|
001-33435 |
|
10.3 |
|
11/7/2016 |
|
|
|
|
|
|
|
|
|
|
|
|
|
|
|
|
10.5† |
|
|
8-K |
|
001-33435 |
|
10.1 |
|
6/15/16 |
|
|
|
|
|
|
|
|
|
|
|
|
|
|
|
|
10.6† |
|
Form of Option Grant Notice and Option Agreement under 2016 Equity Incentive Plan |
|
10-Q |
|
001-33435 |
|
10.4 |
|
11/7/2016 |
|
|
|
|
|
|
|
|
|
|
|
|
|
|
|
10.7† |
|
|
10-Q |
|
001-33435 |
|
10.5 |
|
11/7/2016 |
|
|
|
|
|
|
|
|
|
|
|
|
|
|
|
|
10.8† |
|
2001 Stock Incentive Plan and forms of agreements thereunder |
|
S-1 |
|
333-140660 |
|
10.2 |
|
2/13/2007 |
|
|
|
|
|
|
|
|
|
|
|
|
|
|
|
10.9† |
|
|
10-Q |
|
001-33435 |
|
10.1 |
|
5/2/2014 |
|
|
|
|
|
|
|
|
|
|
|
|
|
|
|
|
10.10† |
|
|
10-Q |
|
001-33435 |
|
10.24 |
|
5/2/2008 |
|
|
|
|
|
|
|
|
|
|
|
|
|
|
|
|
10.11† |
|
Form of Option Grant Notice and Form of Exercise Notice under 2007 Equity Incentive Plan |
|
S-1 |
|
333-140660 |
|
10.4 |
|
2/13/2007 |
|
|
|
|
|
|
|
|
|
|
|
|
|
|
115
116
|
|
|
|
|
Incorporated by Reference |
|
||||||
|
Exhibit |
|
Description |
|
Schedule |
|
File |
|
Exhibit |
|
Filing |
|
|
10.33 |
|
|
8-K |
|
001-33435 |
|
10.1 |
|
11/22/2017 |
|
|
|
|
|
|
|
|
|
|
|
|
|
|
|
|
10.34 |
|
|
8-K |
|
001-33435 |
|
10.2 |
|
11/22/2017 |
|
|
|
|
|
|
|
|
|
|
|
|
|
|
|
|
|
|
|
|
|
|
|
|
|
|
||
|
|
|
|
|
|
|
|
|
|
|
|
|
|
21.1* |
|
|
|
|
|
|
|
|
|
|
|
|
|
|
|
|
|
|
|
|
|
|
|
|
|
23.1* |
|
Consent of PricewaterhouseCoopers LLP, independent registered public accounting firm |
|
|
|
|
|
|
|
|
|
|
|
|
|
|
|
|
|
|
|
|
|
|
|
31.1* |
|
|
|
|
|
|
|
|
|
|
|
|
|
|
|
|
|
|
|
|
|
|
|
|
|
31.2* |
|
|
|
|
|
|
|
|
|
|
|
|
|
|
|
|
|
|
|
|
|
|
|
|
|
32.1* |
|
|
|
|
|
|
|
|
|
|
|
|
|
|
|
|
|
|
|
|
|
|
|
|
|
101.INS |
|
XBRL Instance Document |
|
|
|
|
|
|
|
|
|
|
|
|
|
|
|
|
|
|
|
|
|
|
|
101.SCH |
|
XBRL Taxonomy Extension Schema Document |
|
|
|
|
|
|
|
|
|
|
|
|
|
|
|
|
|
|
|
|
|
|
|
101.CAL |
|
XBRL Taxonomy Extension Calculation Linkbase Document |
|
|
|
|
|
|
|
|
|
|
|
|
|
|
|
|
|
|
|
|
|
|
|
101.DEF |
|
XBRL Taxonomy Extension Definition Linkbase |
|
|
|
|
|
|
|
|
|
|
|
|
|
|
|
|
|
|
|
|
|
|
|
101.LAB |
|
XBRL Taxonomy Extension Labels Linkbase Document |
|
|
|
|
|
|
|
|
|
|
|
|
|
|
|
|
|
|
|
|
|
|
|
101.PRE |
|
XBRL Taxonomy Extension Presentation Linkbase Document |
|
|
|
|
|
|
|
|
|
|
* |
Filed herewith |
|
** |
Certain schedules related to identified agreements have been omitted pursuant to Item 601(b)(2) of Regulation S-K. The Registrant undertakes to furnish supplemental copies of any omitted schedules upon request by the SEC. |
|
# |
Confidential treatment has been requested with respect to certain portions of this exhibit. Omitted portions have been filed separately with the Securities and Exchange Commission. |
|
† |
Management contract or compensatory plan or arrangement. |
117
SIGNATURES
Pursuant to the requirements of Section 13 or 15(d) of the Securities Exchange Act of 1934, the Registrant has duly caused this report to be signed on its behalf by the undersigned, thereunto duly authorized, on March 1, 2018.
|
|
Cavium, Inc. |
|
By |
/s/ Syed Ali |
|
|
Syed Ali |
|
|
President and Chief Executive Officer |
|
By |
/s/ Arthur Chadwick |
|
|
Arthur Chadwick |
|
|
Chief Financial Officer, Vice President of Finance and Administration |
Pursuant to the requirements of the Securities Exchange Act of 1934, this report has been signed below by the following persons on behalf of the registrant and in the capacities and on the dates indicated.
|
Signature |
|
Title |
|
Date |
|
/s/ Syed Ali |
President, Chief Executive Officer and Director (Principal Executive Officer) |
March 1, 2018 |
||
|
Syed Ali |
||||
|
/s/ Arthur Chadwick |
Chief Financial Officer, Vice President of Finance and Administration (Principal Financial and Accounting Officer) |
March 1, 2018 |
||
|
Arthur Chadwick |
||||
|
/s/ Brad Buss |
Director |
March 1, 2018 |
||
|
Brad Buss |
||||
|
/s/ Edward Frank |
Director |
March 1, 2018 |
||
|
Edward Frank |
||||
|
/s/ Sanjay Mehrotra |
|
Director |
|
March 1, 2018 |
|
Sanjay Mehrotra |
||||
|
/s/ Madhav Rajan |
Director |
March 1, 2018 |
||
|
Madhav Rajan |
||||
|
/s/ Anthony Thornley |
Director |
March 1, 2018 |
||
|
Anthony Thornley |
118