Attached files
| file | filename |
|---|---|
| EX-32.1 - EX-32.1 - Trade Desk, Inc. | ttd-ex321_10.htm |
| EX-31.2 - EX-31.2 - Trade Desk, Inc. | ttd-ex312_9.htm |
| EX-31.1 - EX-31.1 - Trade Desk, Inc. | ttd-ex311_6.htm |
| EX-23.1 - EX-23.1 - Trade Desk, Inc. | ttd-ex231_8.htm |
| EX-21.1 - EX-21.1 - Trade Desk, Inc. | ttd-ex211_7.htm |
UNITED STATES
SECURITIES AND EXCHANGE COMMISSION
Washington, D.C. 20549
FORM 10-K
(Mark One)
|
☒ |
ANNUAL REPORT PURSUANT TO SECTION 13 OR 15(d) OF THE SECURITIES EXCHANGE ACT OF 1934 |
For the fiscal year ended December 31, 2017
OR
|
☐ |
TRANSITION REPORT PURSUANT TO SECTION 13 OR 15(d) OF THE SECURITIES EXCHANGE ACT OF 1934 |
For the transition period from to
Commission File Number 001-37879
THE TRADE DESK, INC.
(Exact name of registrant as specified in its charter)
|
Delaware |
|
27-1887399 |
|
(State or other jurisdiction of incorporation or organization) |
|
(I.R.S. Employer Identification No.) |
42 N. Chestnut Street
Ventura, California 93001
(Address of principal executive offices, including zip code)
(805) 585-3434
(Registrant’s telephone number, including area code)
Securities registered pursuant to Section 12(b) of the Act:
|
Title of each class |
|
Name of each exchange on which registered |
|
Class A Common Stock, par value $0.000001 per share |
|
NASDAQ Stock Market LLC (NASDAQ Global Market) |
Securities registered pursuant to Section 12(g) of the Act: None
Indicate by check mark if the registrant is a well-known seasoned issuer, as defined in Rule 405 of the Securities Act. Yes ☒ No ☐
Indicate by check mark if the registrant is not required to file reports pursuant to Section 13 or 15(d) of the Act. Yes ☐ No ☒
Indicate by check mark whether the registrant: (1) has filed all reports required to be filed by Section 13 or 15(d) of the Securities Exchange Act of 1934 during the preceding 12 months (or for such shorter period that the registrant was required to file such reports), and (2) has been subject to such filing requirements for the past 90 days. Yes ☒ No ☐
Indicate by check mark whether the registrant has submitted electronically and posted on its corporate Web site, if any, every Interactive Data File required to be submitted and posted pursuant to Rule 405 of Regulation S-T (§232.405 of this chapter) during the preceding 12 months (or for such shorter period that the registrant was required to submit and post such files). Yes ☒ No ☐
Indicate by check mark if disclosure of delinquent filers pursuant to Item 405 of Regulation S-K (§229.405 of this chapter) is not contained herein, and will not be contained, to the best of registrant’s knowledge, in definitive proxy or information statements incorporated by reference in Part III of this Form 10-K or any amendment to this Form 10-K. ☒
Indicate by check mark whether the registrant is a large accelerated filer, an accelerated filer, a non-accelerated filer, smaller reporting company or an emerging growth company. See the definition of “large accelerated filer,” “accelerated filer,” “smaller reporting company,” and “emerging growth company” in Rule 12b-2 of the Exchange Act. (Check one):
|
Large accelerated filer |
|
☒ |
|
Accelerated filer |
|
☐ |
|
Non-accelerated filer |
|
☐ (Do not check if a small reporting company) |
|
Smaller reporting company |
|
☐ |
|
Emerging growth company |
|
☐ |
|
|
|
|
If an emerging growth company, indicate by check mark if the registrant has elected not to use the extended transition period for complying with any new or revised financial accounting standards provided pursuant to Section 13(a) of the Exchange Act. ☐
Indicate by check mark whether the registrant is a shell company (as defined in Rule 12b-2 of the Exchange Act). Yes ☐ No ☒
The aggregate market value of the voting and non-voting common equity held by non-affiliates of the registrant as of June 30, 2017, based on the closing sales price for the Registrant’s Class A common stock, as reported on the NASDAQ Global Market, was approximately $1,543,997,839. As of January 31, 2018, there were 32,695,082 shares of the registrant’s Class A common stock outstanding and 9,155,054 shares of the registrant’s Class B common stock outstanding.
DOCUMENTS INCORPORATED BY REFERENCE
Portions of the registrant’s Proxy Statement for the 2018 Annual Meeting of Stockholders are incorporated by reference in Part III of this Annual Report on Form 10-K to the extent stated herein. Such proxy statement will be filed with the Securities and Exchange Commission within 120 days of the registrant’s fiscal year ended December 31, 2017.
ANNUAL REPORT ON FORM 10-K
FOR THE FISCAL YEAR ENDED DECEMBER 31, 2017
|
|
|
|
Page |
|
|
|
3 |
|||
|
|
|
|
|
|
|
Part I |
|
|
|
|
|
Item 1. |
|
|
4 |
|
|
Item 1A. |
|
|
12 |
|
|
Item 1B. |
|
|
31 |
|
|
Item 2. |
|
|
32 |
|
|
Item 3. |
|
|
32 |
|
|
Item 4. |
|
|
32 |
|
|
|
|
|
|
|
|
Part II |
|
|
|
|
|
Item 5. |
|
|
33 |
|
|
Item 6. |
|
|
35 |
|
|
Item 7. |
|
Management’s Discussion and Analysis of Financial Condition and Results of Operations |
|
37 |
|
Item 7A. |
|
|
51 |
|
|
Item 8. |
|
|
52 |
|
|
Item 9. |
|
Changes in and Disagreements with Accountants on Accounting and Financial Disclosure |
|
78 |
|
Item 9A. |
|
|
78 |
|
|
Item 9B. |
|
|
79 |
|
|
|
|
|
|
|
|
Part III |
|
|
|
|
|
Item 10. |
|
|
80 |
|
|
Item 11. |
|
|
80 |
|
|
Item 12. |
|
Security Ownership of Certain Beneficial Owners and Management and Related Stockholder Matters |
|
80 |
|
Item 13. |
|
Certain Relationships and Related Transactions, and Director Independence |
|
80 |
|
Item 14. |
|
|
80 |
|
|
|
|
|
|
|
|
Part IV |
|
|
|
|
|
Item 15. |
|
|
81 |
|
|
Item 16. |
|
|
82 |
|
|
|
|
|
|
|
|
|
83 |
|||
2
SPECIAL NOTE ABOUT FORWARD-LOOKING STATEMENTS
This Annual Report on Form 10-K contains forward-looking statements within the meaning of Section 27A of the Securities Act of 1933, as amended, and Section 21E of the Securities Exchange Act of 1934, as amended. Forward-looking statements generally relate to future events or our future financial or operating performance and may include statements concerning, among other things, our business strategy (including anticipated trends and developments in, and management plans for, our business and the markets in which we operate), financial results, operating results, revenues, operating expenses, and capital expenditures, sales and marketing initiatives and competition. In some cases, you can identify forward-looking statements because they contain words such as “may,” “might,” “will,” “should,” “expects,” “plans,” “anticipates,” “could,” “intends,” “target,” “projects,” “contemplates,” “believes,” “estimates,” “predicts,” “suggests,” “potential” or “continue” or the negative of these words or other similar terms or expressions that concern our expectations, strategy, plans or intentions. These statements are not guarantees of future performance; they reflect our current views with respect to future events and are based on assumptions and are subject to known and unknown risks, uncertainties and other factors that may cause our actual results, performance or achievements to be materially different from expectations or results projected or implied by forward-looking statements.
We discuss many of these risks in Item 1A of this Annual Report on Form 10-K in greater detail under the heading “Risk Factors” and in other filings we make from time to time with the Securities and Exchange Commission, or SEC. Also, these forward-looking statements represent our estimates and assumptions only as of the date of this Annual Report on Form 10-K, which are inherently subject to change and involve risks and uncertainties. Unless required by federal securities laws, we assume no obligation to update any of these forward-looking statements, or to update the reasons actual results could differ materially from those anticipated, to reflect circumstances or events that occur after the statements are made. Given these uncertainties, investors should not place undue reliance on these forward-looking statements.
Investors should read this Annual Report on Form 10-K and the documents that we reference in this report and have filed with the SEC completely and with the understanding that our actual future results may be materially different from what we expect. We qualify all of our forward-looking statements by these cautionary statements.
3
Overview
We are a global technology company that empowers ad buyers by providing a self-service omnichannel software platform that enables our clients to purchase and manage data-driven digital advertising campaigns. Our platform allows clients to manage integrated advertising campaigns across various advertising channels and formats, including connected TV (CTV), mobile, video, audio, display, social and native, on a multitude of devices, including smart TVs, computers, and various mobile devices including phones and tablets.
We commercially launched our platform in 2011 targeting display advertising. We have since extended our platform to address additional advertising formats, and in 2017, approximately 62% of gross spend on our platform was for mobile, video, audio, social, and native.
Our clients are the advertising agencies and other service providers for advertisers, with whom we enter into ongoing master services agreements, or MSAs. We generate revenue by charging our clients a platform fee based on a percentage of a client’s total spend on advertising, data and other features through our platform.
The Trade Desk, Inc. is a Delaware corporation established in 2009, headquartered in Ventura, California.
Our Industry
We believe that several trends in the advertising industry, happening in parallel, are driving a shift to programmatic advertising – the selling and buying of advertising inventory electronically.
Some of the key industry trends are:
Media is Becoming Digital. Media is increasingly becoming digital as a result of advances in technology and changes in consumer behavior. This shift has enabled unprecedented options for advertisers to target and measure their advertising campaigns across nearly every media channel and device. The digital advertising market is a significant and growing part of the total advertising market. According to International Data Corporation, or IDC, global advertising spend was estimated to be approximately $672 billion in 2017 and is expected to grow to $764 billion in 2021, a compound annual growth rate of 3.3%. Also, according to IDC, global digital advertising spend was $229 billion in 2017 and is expected to grow to $360 billion in 2021, a compound annual growth rate of 11.9%. We believe that the market is evolving and that advertisers will shift more spend to digital media. Since media is becoming increasingly digital, decisions based on consumer and behavioral data are more prevalent.
Fragmentation of Audience. As digital media grows, audience fragmentation is accelerating. A growing “long tail” of websites and content presents a challenge for advertisers trying to reach a large audience. Audience fragmentation has substantially impacted TV content distribution, perhaps more than any other channel, which we believe is setting up a significant change in how TV advertising inventory is monetized. Mirroring the fragmentation occurring in content, the number of devices used by individual consumers has increased. Both of these fragmentation trends are opportunities for technology companies that can consolidate and simplify media buying options for advertisers and their agencies.
Increased Use of Data. Advances in software and hardware and the growing use of the Internet have made it possible to collect and rapidly process massive amounts of user data. Data vendors are able to collect user information across a wide range of Internet properties and connected devices, aggregate it and combine it with other data sources. This data is then made non-identifiable and available within seconds based on specific parameters and attributes. Advertisers can integrate this targeting data with their own or an agency’s proprietary data relating to client attributes, the advertisers’ own store locations and other related characteristics. Through the use of these data sources, together with real-time feedback on consumer reactions to the ads, programmatic advertising increases the value of impressions for advertisers, inventory owners and viewers who receive more relevant ads.
Automation of Ad Buying. The growing complexity of digital advertising has increased the need for automation. Technology that enables fast, accurate and cost-effective decision-making through the application of computer algorithms that use extensive data sets has become critical for the success of digital advertising campaigns. Using programmatic inventory buying tools, advertisers are able to automate their campaigns, providing them with better price discovery, on an impression-by-impression basis. As a result, advertisers are able to bid and purchase the advertising inventory they value the most, pay less for advertising inventory they do not value as much, and abstain from buying advertising inventory that does not fit their campaign parameters.
4
Digital Advertising Eco-System
The digital advertising eco-system is divided into buyers, sellers and marketplaces, which can be further segmented on the basis of whether participants provide services or technology. We believe that participants on the buy-side or sell-side should be advocates for their buyers or sellers, while those in the market business should act as a referee or have market-driven incentives to protect or enhance the integrity of the marketplace. We believe that there are inherent conflicts of interest when market participants serve both buyers and sellers.
What We Do
We empower ad buyers, by providing a self‑service omnichannel software platform that enables our clients to purchase and manage data‑driven digital advertising campaigns. Our platform allows clients to manage integrated advertising campaigns across various advertising channels and formats, including CTV, mobile, video, audio, display, social and native, on a multitude of devices, including smart TVs, computers, and various mobile devices including phones and tablets.
|
|
• |
We Are Exclusively Focused on the Buy-Side. We focus on buyers since they control the advertising budgets. Also, the supply of digital advertising inventory exceeds demand, and accordingly, we believe it is a buyer’s market. We also believe that by aligning our business only with buyers, we are able to avoid inherent conflicts of interest that exist when serving both the buy-side and sell-side. This focus allows us to build trust with clients, many of whom incorporate their proprietary data into our platform. That trust and ability to use their own data on our platform, without worrying about it being used by other participants, enables our clients and their advertisers to achieve better results. This trust provides us the benefit of long-term and stable relationships with our clients. |
|
|
• |
We Are an Enabler, Not a Disruptor. With our platform, we enable advertising agencies and service providers. We generally do not compete with advertising agencies and refrain from directly serving advertisers who have a relationship with one of our advertising clients. Advertisers can benefit from a comprehensive solution that combines our platform with the services provided by advertising agencies. |
|
|
• |
We Are Data-Driven. Our platform was founded on the principle that data-driven decisions will be the future of advertising. We built a data management platform first, before building our ad buying technology. While data from disparate third-party data providers can improve campaign performance, our clients’ success often relies largely on our ability to ingest proprietary data directly from brands and their agencies to enable intelligent decisioning that optimizes advertising campaigns. Given our independent, buy-side focused approach, and our strict protocol of carefully earmarking all client first-party data we ingest onto our data management platform, our clients trust us with their most granular and expressive data. Our technology platform enables the effective use of this granular data, which allows our clients to run more effective and precisely targeted advertising campaigns that maximize their return on advertising investments. Additionally, we are able to better optimize campaigns by using the data streams that we capture across different devices, so that data from one channel can be used to inform another. The breadth of data that we collect from a multitude of data sources across channels gives our clients a holistic view of their target audiences, enabling more effective targeting across different channels. |
|
|
• |
We Do Not Arbitrage Advertising Inventory. To further align our interests with those of our clients, we do not buy advertising inventory in order to resell it to our clients for a profit. Instead, we provide our clients with a platform that allows them to manage their omnichannel advertising campaigns, on a self-serve basis with full reporting transparency. With our platform, our clients control their campaign spend and are able to access and choose from many inventory sources. |
|
|
• |
We Have Ongoing Relationships with Clients. We derive substantially all of our revenue from ongoing MSAs with our clients rather than episodic insertion orders. We believe that this approach helps us strengthen our relationships with our clients and grow their use of our platform over the long term, providing us with a highly scalable business model. |
|
|
• |
We Are a Clear Box, Not a Black Box. Our platform is transparent and shows our clients their costs of advertising inventory, data, our platform fee and detailed performance metrics on their advertising campaigns. Our clients directly access and execute campaigns on our platform, control all facets of inventory purchasing decisions, and receive detailed, real-time reporting on all their advertising campaigns. By providing transparent information on our platform, our clients are able to continually compare results and target their budgets to the most effective advertising inventory, data providers and channels. |
|
|
• |
We Are an Open Platform. Clients can customize and build their own features on top of our platform. Clients may use our application programming interfaces, or APIs, to, for example, design their own user interface, bulk manage advertising campaigns, and link other systems including ad servers or reporting tools. As of December 31, 2017, all of our top 10 clients used our APIs and nearly half of our clients have customized our APIs. Using our APIs or by working with our engineering team, clients invest their own resources to build their own proprietary tools in areas including reporting, campaign strategy, custom algorithms or proprietary data use cases. Our open platform approach enables our advertising agency and service provider clients to provide differentiated offerings to their clients, which we believe leads to long-term relationships and increased use of our platform. |
5
Our platform enables a media planner or buyer at an advertising agency to:
|
|
• |
purchase digital media programmatically on various media exchanges and sell-side platforms; |
|
|
• |
acquire and use third-party data to optimize and measure digital advertising campaigns; |
|
|
• |
integrate and deploy their proprietary first-party data with our platform in order to optimize campaign efficacy; |
|
|
• |
monitor and manage ongoing digital advertising campaigns on a real-time basis; |
|
|
• |
link digital campaigns to offline sales results or other business objectives; |
|
|
• |
access other services such as our data management platform and publisher management platform marketplace; and |
|
|
• |
use our user interface and APIs to build their own proprietary technology on top of our platform. |
At the core of our platform is our bid-factor based architecture, which we believe has advantages over line-item based architectures that other buy-side systems use. Our bid-factor based system allows users to define desirable factors and the value associated with those factors. Based on these factors, our platform can compute in real-time the value of impressions and bid only for optimal impressions. Because of the granularity of the bid factors, users of our platform can rapidly create billions of different bid permutations with only a few clicks. This expressiveness enables better targeting, pricing and campaign results.
Our platform is useful and user-friendly based on the following:
|
|
• |
Easy to Use, Open and Customizable. Our platform provides multiple, easy-to-use automation tools that help our users focus on managing the key factors affecting their campaigns. Our platform also enables clients to integrate custom features and interfaces for their own use through our APIs. |
|
|
• |
Expressive. Our platform allows clients to easily define and manage advertising campaigns with multiple targeting parameters that may result in quadrillions of permutations, which we refer to as expressiveness. We believe that expressiveness provides clients with the ability to target audiences with an extremely high level of precision and thus obtain higher returns on their advertising spend. |
|
|
• |
Integrated, Omnichannel and Cross-device. Our platform provides integrated access to a wide range of omnichannel inventory and data sources, as well as third-party services such as ad servers, ad verification services and survey vendors. Our platform’s integration of these sources and services enables our clients to deploy their budgets through a wide variety of channels, media screens and formats, targeted in their desired manner, through a single platform. |
Some of the key features of our platform are:
|
|
• |
Auto-Optimization. We provide auto-optimization features which allow buyers to automate their campaigns and support them with computer generated modeling and decision making. In addition, by giving clients full reporting, budgeting, and bidding transparency, clients can take control of targeting variables when desired, and apply algorithmic automation when appropriate. |
|
|
• |
Advanced Reporting and Analytics Tools. We provide a comprehensive view of consumers’ interactions with the ads purchased through our platform with robust reporting of performance insights across multiple variables, such as audience characteristics, ad format, site category, website, device, creative type, and geography. Better reporting results in better learning, often leading to better campaign optimization and outcomes. |
|
|
• |
Data Management. Our platform enables clients to license a broad selection of data from third-party vendors in a seamless and easy manner, allowing them to further optimize their campaigns with the most relevant data. |
|
|
• |
Private Marketplace Support. For clients who wish to transact directly with individual publishers, we offer a comprehensive user interface for discovering and transacting via a wide variety of private pricing contracts. Additionally, we offer direct tags that advertisers can use when they negotiate deals with publishers through advertising agencies. |
6
The core elements of our technology are:
|
|
• |
Scalable Architecture. Our platform infrastructure is hosted in 13 data centers. On average, our real-time bidding technology evaluates more than 580 billion ad opportunities per day, reaching over 430 million devices per day on a global basis. Our core bidding architecture is easily adaptable to a variety of inventory formats, allowing our platform to communicate with many different inventory sources. |
|
|
• |
Predictive Models. We use the massive data captured by our platform to build predictive models around user characteristics, such as demographic, purchase intent or interest data. Data from our platform is continually fed back into these models, which enables them to improve over time as the use of our platform increases. |
|
|
• |
Performance Optimization. During campaign execution, our optimization engine continually scores a variety of attributes of each impression, such as website, industry vertical or geography, for their likelihood to achieve campaign performance goals. Our bidding engine then shifts bids and budgets in real-time to deliver optimal performance. Additionally, our platform enables clients to set multiple, simultaneous optimization goals for their advertising. |
|
|
• |
Real-time Analytics. Our platform continuously collects data regarding inventory availability. Real-time campaign delivery and spend totals are used to manage campaign budgets and goal caps, as well as campaign reporting. This data is fed back into our optimization engine to improve campaign performance, and into machine-learning models for user demographic predictive modeling. |
Our Growth Strategy
The key elements of our long-term growth strategy include:
|
|
• |
Increase Our Share of Existing Clients’ Digital Advertising Spend. Many advertisers are moving a greater percentage of their advertising budgets to programmatic channels. We believe that this shift will provide us with the opportunity to capture a larger share of the overall advertising spend by our existing clients. Additionally, we plan to promote additional services and data to our clients, helping us grow our business. |
|
|
• |
Grow Our Client Base. We have extensive relationships with many advertising agencies and service providers, and believe that, given the decentralized nature of the advertising industry, we have the opportunity to expand our relationships within these agencies and with additional agencies and service providers. We expect to continue making investments in growing our sales and client service team to support this strategy. |
|
|
• |
Expand Our Omnichannel Capabilities. We believe offering clients capabilities across all media channels and devices enables advertisers to manage omnichannel campaigns and use data from each channel to inform decisions in other channels. We believe these capabilities will continue to further strengthen our relationships with our clients. We intend to continue to invest in innovation across all channels, including the integration of new inventory sources within CTV, digital radio, social and native. |
|
|
• |
Extend Our Reach in CTV. Television is the largest category of advertising spend, and we believe that the future of television is in streaming media and video on demand through subscription services and connected devices. We plan to invest significant resources in technology, sales and support staff related to our CTV growth initiatives. |
|
|
• |
Continue to Innovate in Technology and Data. We intend to continue to innovate in technology to improve our platform and enhance its features and functionalities. We view data as one of our key competitive advantages. We will continue to invest resources in growing our data offerings, both from third-party providers as well as our proprietary data. |
|
|
• |
Expand Our International Presence. Many of our clients serve advertisers on a global basis and we intend to expand our presence outside of the United States, or U.S., to serve the needs of those advertisers in additional geographies. As we expand relationships with our existing clients, we are investing in select regions in Europe and Asia. In particular, we believe that China and Indonesia may represent substantial growth opportunities, and we are investing in developing our business in those markets. |
Our Clients
Our clients consist of purchasers of programmatic advertising inventory and data. As of December 31, 2017, we had approximately 657 clients, consisting primarily of advertising agencies or groups within advertising agencies that have independent relationships with us, manage budgets independently of one-another, are based in different jurisdictions, and are served by unique Trade Desk teams. Many of these agencies are owned by holding companies, where decision-making is decentralized such that purchasing decisions are made, and relationships with advertisers are located, at the agency, local branch or division level. Our client count includes only those parties which have signed MSAs with us and have spent more than $20,000 on our platform.
7
If all of our individual client contractual relationships were aggregated at the holding company level, two clients would have each represented more than 10% of our gross billings in 2015, three clients would have each represented more than 10% of our gross billings in 2016, and three clients would have each represented more than 10% of our gross billings in 2017. Our contractual and billing arrangement with Omnicom Group Inc. is at the holding company level and accounted for 12% of our gross billings in 2015, 13% in 2016 and 11% in 2017. For WPP plc and Publicis Groupe, we enter into separate contracts and billing relationships with various of its individual agencies and account for them as separate clients. We do not have any contractual relationship with the holding company WPP plc or Publicis Groupe. Mindshare, which is affiliated with WPP plc, accounted for 12% of our gross billings in 2015, 11% in 2016 and 10% in 2017. VivaKi, Inc., which is affiliated with Publicis Groupe, accounted for 15% of our gross billings in 2016 and 22% in 2017.
Our clients typically enter into MSAs with us that give users constant access to our platform. The MSAs do not contain any material commitments on behalf of clients to use our platform to purchase ad inventory, data or other features. These MSAs typically have one-year terms that renew automatically for additional one-year periods, unless earlier terminated. The MSAs are typically terminable at any time upon 60 days’ notice by either party.
Our clients are loyal, as reflected by our client retention rate of over 95% in 2015, 2016 and 2017. In addition, our clients typically grow their use of our platform over time.
Our Advertising and Data Inventory Suppliers
For suppliers of programmatic advertising inventory and data, we believe that we are an important business client, as we represent one of the largest sources of buy-side demand within the digital advertising industry.
We obtain digital advertising inventory from over 70 ad exchanges, supply-side platforms, publishers and ad networks, providing us with access to a breadth of programmatic advertising inventory across computers, smartphones, audio devices and CTV. On average each day, our platform provides our clients with access to over 580 billion ad impressions per day, reaching over 430 million devices per day on a global basis.
For third-party data vendors, we believe that we represent an important distribution channel. As of December 31, 2017, we have integrated our platform with over 135 third-party data vendors whose products we make available for purchase through our platform.
Sales and Marketing
Given our self-serve business model, we focus on supporting, advising and training our clients to use our platform independently as soon as they are ready to transact.
Once a new client has access to our platform, they work closely with our client service teams as they onboard the new client and provide continuous support throughout the early campaigns. Typically, once a client has gained some initial experience, it will move to a fully self-serve model and request support as needed.
To help train our clients, suppliers and other digital media participants, we have created an e-learning program called The Trading Academy. We believe that this initiative is an important component in our strategy of enabling rapid onboarding to our platform.
Our marketing efforts are focused on increasing awareness for our brand, executing thought-leadership initiatives, supporting our sales team and generating new leads. We seek to accomplish these objectives by presenting at industry conferences, hosting client conferences, publishing white papers and research, public relations activities, social media presence and advertising campaigns.
Technology and Development
Rapid innovation is a core driver of our business success and our corporate culture. We prioritize and align our product roadmap with our clients’ needs, and we generally refresh our platform on a weekly basis. Our development teams are intentionally lean and nimble in nature, providing for transparency and accountability.
We expect technology and development expense to increase as we continue to invest in the development of our platform to support additional features and functions, increase the number of advertising and data inventory suppliers and ramp up the volume of advertising spending on our platform. We also intend to invest in technology to further automate our business processes. Our technology development expense totaled $12.8 million in 2015, $27.3 million in 2016 and $52.8 million in 2017.
8
In the advertising industry, companies commonly experience seasonal fluctuations in revenue. For example, many advertisers allocate the largest portion of their budgets to the fourth quarter of the calendar year in order to coincide with increased holiday purchasing. Historically, the fourth quarter of the year reflects our highest level of advertising activity and the first quarter reflects the lowest level of such activity. We expect our revenue to continue to fluctuate based on seasonal factors that affect the advertising industry as a whole.
Our Competition
Our industry is highly competitive and fragmented. We compete with other demand-side platform providers which are mostly smaller, privately-held companies, but we also compete with divisions of large, well-established companies such as Google and Adobe. We believe that we compete primarily based on the performance, capabilities and transparency of our platform and our focus on the buy-side. We generally do not compete with advertising agencies and refrain from directly serving advertisers who have a relationship with one of our advertising agency clients. We believe that we are differentiated from our competitors in the following areas:
|
|
• |
we are an independent technology company exclusively focused on serving advertising agencies and the buy-side of our industry; |
|
|
• |
our client relationships are based on master service agreements as opposed to campaign-specific insertion orders; |
|
|
• |
our platform provides comprehensive access to a wide range of inventory types and third-party data vendors; |
|
|
• |
our platform allows clients to build proprietary advantages by integrating custom features and interfaces for their own use through our APIs; and |
|
|
• |
our technology provides highly expressive targeting. |
In addition, we believe that new entrants would find it difficult to gain direct access to inventory providers, given their limited scale and the costs that additional integrations impose on inventory providers.
Our Employees and Culture
We have employees and offices around the world to serve advertisers’ desire to communicate with consumers worldwide.
Our business and our culture is anchored on four core principles:
|
|
• |
No company can effect global change without passionate forward‑thinking people as both employees and clients. |
|
|
• |
By preserving an honest and transparent culture and avoiding client conflict, we can exert exponentially less effort to grow our business. |
|
|
• |
We have committed to our clients and employees that we will never stop innovating. |
|
|
• |
Being profitable and changing the world can co‑exist and is more likely to happen when striving for both simultaneously. |
We believe we attract talented employees to our company and sophisticated ad buyers to our platform in large part because of our vision and unwavering commitment to empower the buy‑side of advertising.
As of December 31, 2017, we had 713 employees, of whom 502 are in the U.S. Our team draws from a broad spectrum of backgrounds and experiences, across technology, advertising and securities trading and other areas. We foster an entrepreneurial culture so that we may remain focused and innovative over time, as we strive to serve our clients with openness, transparency and humility.
Development of International Markets
We have been increasing our focus on markets outside the U.S. to serve the global needs of our clients. We believe that the global opportunity for programmatic advertising is significant, and should continue to expand as publishers and advertisers outside the U.S. seek to adopt the benefits that programmatic advertising provides. To capitalize on this opportunity, we intend to continue investing in our presence internationally, and we expect our growth internationally to continue outpacing our domestic growth. Our growth and the success of our initiatives in newer markets will depend on the continued adoption of our platform by our existing clients, as well as new clients, in these markets. Information about our geographic gross billings is set forth in Note 12 of “Item 8. Financial Statements and Supplementary Data” in this Annual Report on Form 10-K.
9
The protection of our technology and intellectual property is an important component of our success. We rely on intellectual property laws, including trade secret, copyright and trademark laws in the U.S. and abroad, and use contracts, confidentiality procedures, non-disclosure agreements, employee disclosure and invention assignment agreements and other contractual rights to protect our intellectual property. We do not hold any patents because we believe our proprietary technology is best protected by keeping our technology architecture, trade secrets, and engineering roadmap private. We believe our platform is difficult to replicate and would be expensive to build. We also believe that a critical protection in digital advertising technology is the ability to execute and deliver new functionality quickly, and are continually developing new intellectual property as we innovate.
Privacy and Data Protection Legislation and Regulation
Privacy and data protection legislation and regulation play a significant role in our business. We and our clients use pseudonymous and anonymous data about Internet users on our platform to manage and execute digital advertising campaigns in a variety of ways, including delivering advertisements to Internet users based on their geographic locations, the type of device they are using, or their interests as inferred from their web browsing or app usage activity, or that clients infer from their relationships with users. We do not use this data to identify specific individuals, and we do not seek to associate this data with information that can be used to identify specific individuals. We take steps not to collect or store personally identifiable information – information that directly identifies individuals – from any source. The definition of what data is personal or identifiable, however, varies by jurisdiction and continues to evolve. As a result, our platform and business practices must be assessed regularly in each jurisdiction where we do business to avoid violating applicable legislation and regulation.
Our ability, like those of other advertising technology companies, to collect, augment, analyze, use and share data collected through cookies and similar technologies is governed by U.S. and foreign laws and regulations which change from time to time, such as those regulating the level of consumer notice and consent required before a company can employ cookies or other electronic tools to collect data about interactions with users online. In the United States, both state and federal legislation govern activities such as the collection and use of data, and privacy in the advertising technology industry has frequently been subject to review by the Federal Trade Commission, or the FTC, U.S. Congress, and individual states. Much of the federal oversight on digital advertising in the United States has come from the FTC, which has primarily relied upon Section 5 of the Federal Trade Commission Act, which prohibits companies from engaging in “unfair” or “deceptive” trade practices, including alleged violations of representations concerning privacy protections and acts that allegedly violate individuals’ privacy interests.
As our business is global, our activities are also subject to foreign legislation and regulation. In the European Union (including the European Economic Area, or EEA, countries of Iceland, Liechtenstein and Norway), or EU, separate laws and regulations (and member states’ implementations thereof) govern the protection of consumers and of electronic communications, and these laws and regulations continue to evolve. The General Data Protection Regulation, or GDPR, which was adopted by the EU in 2016 and becomes effective May 25, 2018, will generally harmonize data privacy laws across EU countries. The GDPR creates new regulations relating to the collection and use of data typically leveraged on our platform and by others in the digital advertising industry, including IP addresses, cookie identifiers, and device identifiers for advertising purposes, and enhances data protection obligations for controllers of personal data and service providers processing personal data. These enhancements will bring about significant changes in the way the advertising technology industry operates in the EU. Preparing to meet the GDPR’s requirements before it becomes effective, and maintaining compliance with the GDPR thereafter, will require significant time, resources and expense, and significant changes in our business operations.
Additionally in the EU, EU Directive 2002/58/EC (as amended by Directive 2009/136/EC), commonly referred to as the Cookie Directive, directs EU member states to ensure that accessing information on an Internet user’s computer, such as through a cookie and other similar technologies, is allowed only if the Internet user has been informed about such access, and provided consent. A replacement for the Cookie Directive is currently under discussion by EU member states to complement and bring electronic communication services in line with the GDPR and force a harmonized approach across EU member states. Although it remains under debate, recent drafts of the new ePrivacy Regulation would extend the strict opt-in marketing rules with limited exceptions to business-to-business communications, alter rules on third-party cookies, web beacons and similar technology, and significantly increase penalties for non-compliance. We cannot yet determine the impact such future laws, regulations, and standards may have on our business.
For the transfer of personal data from the EU to the U.S., we rely upon, and are currently certified under, the EU-U.S. and Swiss-U.S. Privacy Shield Frameworks. The Privacy Shield Framework, however, is facing criticism from privacy advocates in the EU and is also subject to pending legal challenges in the General Court of the Court of Justice of the European Union. Other EU mechanisms for adequate data transfer to the U.S. such as the standard contractual clauses are also being challenged in the EU courts. These challenges to the Privacy Shield and model clauses may lead to changes in the law, governmental enforcement actions, litigation, fines and penalties or adverse publicity which could have an adverse effect on our reputation and business. We may find it
10
necessary to establish systems to maintain personal data originating from the EU in the EU, which may involve substantial expense and may cause us to need to divert resources from other aspects of our business.
In prior years, some government regulators and privacy advocates advocated vigorously for a “Do Not Track” standard that would allow Internet users to express a preference, independent of cookie settings in their browser, not to have their online browsing activities tracked. Efforts in this direction have largely gone dormant. However, in the EU, the Article 29 Working Party, a body made up of EU national data protection authorities, recently recommended that the proposed e-Privacy Regulation require browsers to implement technical mechanisms such as the “Do Not Track” standard to give users additional control over the collection of data about their Internet activity. We do not know whether such requirement will be included in the final e-Privacy Regulation or what effect such requirement may have on our business.
We participate in several industry self-regulatory programs, mainly initiated by the Network Advertising Initiative, or NAI, the Digital Advertising Alliance, or DAA, and their international counterparts. Under such programs, in addition to other compliance obligations, we provide consumers with notice about our use of cookies and similar technologies, and our collection and use of data in connection with the delivery of targeted advertising. We also allow consumers to opt out from the use of data we collect for the delivery of targeted advertising, and we provide consumers notice regarding how to exercise such choice. We believe that this user-centric approach to addressing consumer privacy empowers consumers to make informed decisions on the use of their data.
Available Information
We file Annual Reports on Form 10-K, Quarterly Reports on Form 10-Q, Current Reports on Form 8-K, proxy statements, and related amendments and other information with the Securities and Exchange Commission, or the SEC. You may access and read our filings without charge through the SEC’s website at www.sec.gov or through our website at http://investors.thetradedesk.com, as soon as reasonably practicable after such materials are electronically filed with or furnished to the SEC pursuant to Section 13(a) or 15(d) of the Securities Exchange Act of 1934, as amended, or the Exchange Act.
Website addresses referred to in this Annual Report on Form 10-K are not intended to function as hyperlinks, and the information contained on our website is not incorporated into, and does not form a part of this Annual Report on Form 10-K or any other report or documents we file with or furnish to the SEC.
11
Investing in our Class A common stock involves a high degree of risk. You should consider carefully the risks and uncertainties described below, together with all of the other information contained in this annual report, including the consolidated financial statements and the related notes and Management’s Discussion and Analysis of Financial Condition and Results of Operations, before making investment decisions related to our Class A common stock. If any of the following risks is realized, our business, financial condition, results of operations and prospects could be materially and adversely affected. In that event, the market price of our Class A common stock could decline and you could lose part or all of your investment.
Risks Related to Our Business and Industry
We have a limited operating history, which makes it difficult to evaluate our business and prospects and may increase the risks associated with your investment.
We were incorporated in 2009 and, as a result, have only a limited operating history upon which our business and prospects may be evaluated. Although we have experienced substantial revenue growth in our limited operating history, we may not be able to sustain this rate of growth or maintain our current revenue levels. We have encountered and will continue to encounter risks and challenges frequently experienced by growing companies in rapidly developing industries, including risks related to our ability to:
|
|
• |
build a reputation for providing a superior platform and client service, and for creating trust and long-term relationships with clients; |
|
|
• |
distinguish ourselves from competitors; |
|
|
• |
develop and offer a competitive platform that meets our clients’ needs as they change; |
|
|
• |
scale our business efficiently to keep pace with demand for our platform; |
|
|
• |
maintain and expand our relationships with suppliers of quality advertising inventory and data; |
|
|
• |
respond to evolving industry standards and government regulation that impact our business, particularly in the areas of data collection and consumer privacy; |
|
|
• |
prevent or mitigate failures or breaches of security; |
|
|
• |
expand our business internationally; and |
|
|
• |
hire and retain qualified and motivated employees. |
We cannot assure you that we will be successful in addressing these and other challenges we may face in the future. If we are unable to do so, our business may suffer, our revenue and operating results may decline and we may not be able to achieve further growth or sustain profitability.
Our failure to maintain and grow our client base and spend through our platform may negatively impact our revenue and business.
To sustain or increase our revenue, we must regularly add new clients and encourage existing clients to maintain or increase the amount of advertising inventory purchased through our platform and adopt new features and functionalities that we add to our platform. If competitors introduce lower cost or differentiated offerings that compete with or are perceived to compete with ours, our ability to sell access to our platform to new or existing clients could be impaired. We have spent significant effort in cultivating our relationships with advertising agencies, which has resulted in an increase in the budgets allocated to, and the amount of advertising purchased on, our platform. However, it is possible that we may reach a point of saturation at which we cannot continue to grow our revenue from such agencies because of internal limits that advertisers may place on the allocation of their advertising budgets to digital media to a particular provider or otherwise. While we generally have master services agreements in place for our clients, such agreements allow our clients to change the amount of spend through our platform or terminate our services with limited notice. Our clients typically have relationships with different providers and there is limited cost to moving budgets to our competitors. As a result, we may have limited visibility as to our future advertising revenue streams. We cannot assure you that our clients will continue to use our platform or that we will be able to replace, in a timely or effective manner, departing clients with new clients that generate comparable revenue. If a major client representing a significant portion of our business decides to materially reduce its use of our platform or to cease using our platform altogether, it is possible that our revenue or revenue growth rate could be significantly reduced and our business negatively impacted.
12
The loss of advertising agencies as clients could significantly harm our business, operating results and financial condition.
Our client base consists primarily of advertising agencies. We do not have exclusive relationships with advertising agencies and we depend on agencies to work with us as they embark on advertising campaigns for advertisers.
The loss of agencies as clients could significantly harm our business, operating results and financial condition. If we fail to maintain satisfactory relationships with an advertising agency, we risk losing business from the advertisers represented by that agency.
Advertisers may change advertising agencies. If an advertiser switches from an agency that utilizes our platform to one that does not, we will lose revenue from that advertiser. In addition, some advertising agencies have their own relationships with suppliers of advertising inventory and can directly connect advertisers with such suppliers. Our business may suffer to the extent that advertising agencies and inventory suppliers purchase and sell advertising inventory directly from one another or through intermediaries other than us.
We had approximately 657 clients, consisting primarily of advertising agencies, as of December 31, 2017. Many of these agencies are owned by holding companies, where decision making is decentralized such that purchasing decisions are made, and relationships with advertisers, are located, at the agency, local branch or division level. If all of our individual client contractual relationships were aggregated at the holding company level, Omnicom Group Inc., WPP plc and Publicis Groupe would each represent more than 10% of our gross billings for 2017.
In most cases, we enter into separate contracts and billing relationships with the individual agencies and account for them as separate clients. However, some holding companies for these agencies may choose to exert control over the individual agencies in the future. If so, any loss of relationships with such holding companies and, consequently, of their agencies, local branches or divisions, as clients could significantly harm our business, operating results and financial condition.
If we fail to innovate and make the right investment decisions in our offerings and platform, we may not attract and retain advertisers and advertising agencies and our revenue and results of operations may decline.
Our industry is subject to rapid and frequent changes in technology, evolving client needs and the frequent introduction by our competitors of new and enhanced offerings. We must constantly make investment decisions regarding offerings and technology to meet client demand and evolving industry standards. We may make bad decisions regarding these investments. If new or existing competitors have more attractive offerings, we may lose clients or clients may decrease their use of our platform. New client demands, superior competitive offerings or new industry standards could require us to make unanticipated and costly changes to our platform or business model. If we fail to adapt to our rapidly changing industry or to evolving client needs, demand for our platform could decrease and our business, financial condition and operating results may be adversely affected.
Failure to manage our growth effectively could cause our business to suffer and have an adverse effect on our financial condition and operating results.
We have experienced significant growth in a short period of time. To manage our growth effectively, we must continually evaluate and evolve our organization. We must also manage our employees, operations, finances, technology and development and capital investments efficiently. Our efficiency, productivity and the quality of our platform and client service may be adversely impacted if we do not train our new personnel, particularly our sales and support personnel, quickly and effectively, or if we fail to appropriately coordinate across our organization. Additionally, our rapid growth may place a strain on our resources, infrastructure and ability to maintain the quality of our platform. You should not consider our revenue growth and levels of profitability in recent periods as indicative of future performance. In future periods, our revenue or profitability could decline or grow more slowly than we expect. Failure to manage our growth effectively could cause our business to suffer and have an adverse effect on our financial condition and operating results.
The market for programmatic buying for advertising campaigns is relatively new and evolving. If this market develops slower or differently than we expect, our business, growth prospects and financial condition would be adversely affected.
The substantial majority of our revenue has been derived from clients that programmatically purchase advertising inventory through our platform. We expect that spending on programmatic ad buying will continue to be our primary source of revenue for the foreseeable future, and that our revenue growth will largely depend on increasing spend through our platform. The market for programmatic ad buying is an emerging market, and our current and potential clients may not shift as quickly as we expect to programmatic ad buying from other buying methods, reducing our growth potential. If the market for programmatic ad buying deteriorates or develops more slowly than we expect, it could reduce demand for our platform, and our business, growth prospects and financial condition would be adversely affected.
13
In addition, our revenue may not necessarily grow at the same rate as spend on our platform. Growth in spend may outpace growth in our revenue as the market for programmatic buying for advertising matures due to a number of factors including quantity discounts and product, media, client and channel mix shifts. A significant change in revenue as a percentage of spend could reflect an adverse change in our business and growth prospects. In addition, any such fluctuations, even if they reflect our strategic decisions, could cause our performance to fall below the expectations of securities analysts and investors, and adversely affect the price of our common stock.
The market in which we participate is intensely competitive, and we may not be able to compete successfully with our current or future competitors.
We operate in a highly competitive and rapidly changing industry. With the introduction of new technologies and the influx of new entrants to the market, we expect competition to persist and intensify in the future, which could harm our ability to increase revenue and maintain profitability. New technologies and methods of buying advertising present a dynamic competitive challenge, as market participants offer multiple new products and services, such as analytics, automated media buying and exchanges, aimed at capturing advertising spend. In addition to existing competitors and intermediaries, we may also face competition from new companies entering the market, which may include large established companies, all of which currently offer, or may in the future offer, products and services that result in additional competition for advertising spend or advertising inventory.
We may also face competition from companies that we do not yet know about or do not yet exist. If existing or new companies develop, market or resell competitive high-value marketing products or services, acquire one of our existing competitors or form a strategic alliance with one of our competitors, our ability to compete effectively could be significantly compromised and our results of operations could be harmed.
Our current and potential competitors may have significantly more financial, technical, marketing and other resources than we have, allowing them to devote greater resources to the development, promotion, sale and support of their products and services. They may also have more extensive advertiser bases and broader publisher relationships than we have, and may be better positioned to execute on advertising conducted over certain channels such as social media, mobile and video. Some of our competitors may have longer operating histories and greater name recognition. As a result, these competitors may be better able to respond quickly to new technologies, develop deeper advertiser relationships or offer services at lower prices. Any of these developments would make it more difficult for us to sell our platform and could result in increased pricing pressure, increased sales and marketing expense or the loss of market share.
Economic downturns and market conditions beyond our control could adversely affect our business, financial condition and operating results.
Our business depends on the overall demand for advertising and on the economic health of advertisers that benefit from our platform. Economic downturns or unstable market conditions may cause advertisers to decrease their advertising budgets, which could reduce spend though our platform and adversely affect our business, financial condition and operating results. As we explore new countries to expand our business, economic downturns or unstable market conditions in any of those countries could result in our investments not yielding the returns we anticipate.
We may experience fluctuations in our operating results, which could make our future operating results difficult to predict or cause our operating results to fall below analysts’ and investors’ expectations.
Our quarterly and annual operating results have fluctuated in the past and we expect our future operating results to fluctuate due to a variety of factors, many of which are beyond our control. Fluctuations in our operating results could cause our performance to fall below the expectations of analysts and investors, and adversely affect the price of our common stock. Because our business is changing and evolving rapidly, our historical operating results may not be necessarily indicative of our future operating results. Factors that may cause our operating results to fluctuate include the following:
|
|
• |
changes in demand for our platform, including related to the seasonal nature of our clients’ spending on digital advertising campaigns; |
|
|
• |
changes in our pricing policies, the pricing policies of our competitors and the pricing or availability of inventory, data or other third-party services; |
|
|
• |
changes in our client base and platform offerings; |
|
|
• |
the addition or loss of advertising agencies and advertisers as clients; |
|
|
• |
changes in advertising budget allocations, agency affiliations or marketing strategies; |
|
|
• |
changes to our product, media, client or channel mix; |
14
|
|
• |
changes and uncertainty in the regulatory environment for us, advertisers or others in the advertising industry; |
|
|
• |
changes in the economic prospects of advertisers or the economy generally, which could alter advertisers’ spending priorities, or could increase the time or costs required to complete advertising inventory sales; |
|
|
• |
changes in the availability of advertising inventory through real-time advertising exchanges or in the cost of reaching end consumers through digital advertising; |
|
|
• |
disruptions or outages on our platform; |
|
|
• |
the introduction of new technologies or offerings by our competitors; |
|
|
• |
changes in our capital expenditures as we acquire the hardware, equipment and other assets required to support our business; |
|
|
• |
timing differences between our payments for advertising inventory and our collection of related advertising revenue; |
|
|
• |
the length and unpredictability of our sales cycle; and |
|
|
• |
costs related to acquisitions of businesses or technologies, or employee recruiting. |
Based upon the factors above and others beyond our control, we have a limited ability to forecast our future revenue, costs and expenses, and as a result, our operating results may, from time to time, fall below our estimates or the expectations of analysts and investors.
We often have long sales cycles, which can result in significant time between initial contact with a prospect and execution of a client agreement, making it difficult to project when, if at all, we will obtain new clients and when we will generate revenue from those clients.
Our sales cycle, from initial contact to contract execution and implementation can take significant time. Our sales efforts involve educating our clients about the use, technical capabilities and benefits of our platform. Some of our clients undertake an evaluation process that frequently involves not only our platform but also the offerings of our competitors. As a result, it is difficult to predict when we will obtain new clients and begin generating revenue from these new clients. Even if our sales efforts result in obtaining a new client, under our usage-based pricing model, the client controls when and to what extent it uses our platform. As a result, we may not be able to add clients, or generate revenue, as quickly as we may expect, which could harm our revenue growth rates.
We are subject to payment-related risks and, if our clients do not pay or dispute their invoices, our business, financial condition and operating results may be adversely affected.
Many of our contracts with advertising agencies provide that if the advertiser does not pay the agency, the agency is not liable to us, and we must seek payment solely from the advertiser, a type of arrangement called sequential liability. Contracting with these agencies, which in some cases have or may develop higher-risk credit profiles, may subject us to greater credit risk than if we were to contract directly with advertisers. This credit risk may vary depending on the nature of an advertising agency’s aggregated advertiser base. We may also be involved in disputes with agencies and their advertisers over the operation of our platform, the terms of our agreements or our billings for purchases made by them through our platform. If we are unable to resolve disputes with our clients, we may lose clients or clients may decrease their use of our platform and our financial performance and growth may be adversely affected. If we are unable to collect or make adjustments to bills to clients, we could incur write-offs for bad debt, which could harm our results of operations. In the future, bad debt may exceed reserves for such contingencies and our bad debt exposure may increase over time. Any increase in write-offs for bad debt could harm our business, financial condition and operating results. Even if we are not paid by our clients on time or at all, we are still obligated to pay for the advertising we have purchased for the advertising campaign, and as a consequence, our results of operations and financial condition would be adversely impacted.
A substantial portion of our business is from advertising agencies that do not pay us until they receive payment from the advertiser, resulting in an increased length of time between our payment for media inventory and our receipt of payment for use of our platform, and our ability to collect for non-payment may be limited to the advertiser, thereby increasing our risk of non-payment.
Substantially all of the spend on our platform is from advertising agencies. Generally, we are contractually required to pay advertising inventory and data suppliers within a negotiated period of time, regardless of whether our clients pay us on time, or at all. Additionally, while we attempt to negotiate long payment periods with our suppliers and shorter periods from our clients, we are not always successful. As a result, we often face a timing issue with our accounts payable on shorter cycles than our accounts receivables, requiring us to remit payments from our own funds, and accept the risk of bad debt.
15
This collections and payments cycle will increasingly consume working capital if we continue to be successful in growing our business. In addition, we typically experience slow payment by advertising agencies as is common in our industry. If we are unable to borrow against these receivables on commercially acceptable terms, our working capital availability could be reduced, and as a consequence, our results of operations and financial condition would be adversely impacted.
Due to this timing imbalance in collections and payments, we rely on our credit facility to partially or completely fund our working capital requirements. We cannot assure you that as we continue to grow, our business will generate sufficient cash flow from operations or that future borrowings will be available to us under the credit facility in an amount sufficient to fund our working capital needs. If our cash flows and credit facility borrowings are insufficient to fund our working capital requirements, we may not be able to grow at the rate we currently expect or at all. In addition, in the absence of sufficient cash flows from operations, we might be unable to meet our obligations under our credit facility and we may therefore be at risk of default thereunder. We cannot assure you that we would be able to locate additional financing or increase amounts borrowed under our existing credit facility on commercially reasonable terms or at all.
Our business is primarily dependent on advertisers buying mobile, display and video advertising. A decrease in the use of these advertising channels would harm our business, growth prospects, financial condition and results of operations.
Historically, our clients have predominantly used our platform to purchase mobile, display and video advertising inventory. We expect that these will continue to be significant channels used by our clients for digital advertising. Should our clients lose confidence in the value or effectiveness of mobile, display and video advertising, the demand for our platform could decline.
We have been, and are continuing to, enhance our social, native, audio and CTV offerings. We refer to the ability to provide offerings across multiple advertising channels as omnichannel. We may not be able to maintain or grow advertising inventory for some of our omnichannels and some of our omnichannel offerings may not gain market acceptance. A decrease in the use of mobile, display and video advertising, or our inability to further penetrate these and other advertising channels, would harm our growth prospects, financial condition and results of operations.
If our access to quality advertising inventory is diminished, our revenue could decline and our growth could be impeded.
We must maintain a consistent supply of attractive ad inventory. Our success depends on our ability to secure quality inventory on reasonable terms across a broad range of advertising networks and exchanges, video, CTV, audio and mobile inventory, and social media platforms. The amount, quality and cost of inventory available to us can change at any time. A few inventory suppliers hold a significant portion of the programmatic inventory either generally or concentrated in a particular channel, such as audio and social media. In addition, we compete with companies with which we have business relationships. For example, Google is one of our largest advertising inventory suppliers in addition to being one of our competitors. If Google or any other company with attractive advertising inventory limits our access to its advertising inventory, our business could be adversely affected. If our relationships with any of our suppliers were to cease, or if the material terms of these relationships were to change unfavorably, our business would be negatively impacted. Our suppliers are generally not bound by long-term contracts. As a result, there is no guarantee that we will have access to a consistent supply of quality inventory on favorable terms. If we are unable to compete favorably for advertising inventory available on real-time advertising exchanges, or if real-time advertising exchanges decide not to make their advertising inventory available to us, we may not be able to place advertisements or find alternative sources of inventory with comparable traffic patterns and consumer demographics in a timely manner. Furthermore, the inventory that we access through real-time advertising exchanges may be of low quality or misrepresented to us, despite attempts by us and our suppliers to prevent fraud and conduct quality assurance checks.
Inventory suppliers control the bidding process for the inventory they supply, and their processes may not always work in our favor. For example, suppliers may place restrictions on the use of their inventory, including prohibiting the placement of advertisements on behalf of specific advertisers. Through the bidding process, we may not win the right to deliver advertising to the inventory that is selected through our platform and may not be able to replace inventory that is no longer made available to us.
As new types of inventory, such as CTV, become available, we will need to expend significant resources to ensure we have access to such new inventory. Although television advertising is a large market, only a very small percentage of it is currently purchased through digital advertising exchanges. We are investing heavily in our programmatic television offering, including by increasing our workforce and by adding new features, functions and integrations to our platform. If the CTV market does not grow as we anticipate or we fail to successfully serve such market, our growth prospects could be harmed.
Our success depends on consistently adding valued inventory in a cost-effective manner. If we are unable to maintain a consistent supply of quality inventory for any reason, client retention and loyalty, and our financial condition and operating results could be harmed.
16
Seasonal fluctuations in advertising activity could have a negative impact on our revenue, cash flow and operating results.
Our revenue, cash flow, operating results and other key operating and performance metrics may vary from quarter to quarter due to the seasonal nature of our clients’ spending on advertising campaigns. For example, clients tend to devote more of their advertising budgets to the fourth calendar quarter to coincide with consumer holiday spending. Moreover, advertising inventory in the fourth quarter may be more expensive due to increased demand for advertising inventory. Political advertising could also cause our revenue to increase during election cycles and decrease during other periods. Our historical revenue growth has masked the impact of seasonality, but if our growth rate declines or seasonal spending becomes more pronounced, seasonality could have a more significant impact on our revenue, cash flow and operating results from period to period.
As our costs increase, we may not be able to generate sufficient revenue to sustain profitability.
We have expended significant resources to grow our business in recent years by increasing the offerings of our platform, growing our number of employees and expanding internationally. We anticipate continued growth that could require substantial financial and other resources to, among other things:
|
|
• |
develop our platform, including by investing in our engineering team, creating, acquiring or licensing new products or features, and improving the availability and security of our platform; |
|
|
• |
continue to expand internationally by growing our sales force and client services team in an effort to increase our client base and spend through our platform, and by adding inventory and data from countries our clients are seeking; |
|
|
• |
improve our technology infrastructure, including investing in internal technology development and acquiring outside technologies; |
|
|
• |
expand our platform’s reach in new and growing channels such as CTV, including expanding the supply of CTV inventory; |
|
|
• |
cover general and administrative expenses, including legal, accounting and other expenses necessary to support a larger organization; |
|
|
• |
cover sales and marketing expenses, including a significant expansion of our direct sales organization; |
|
|
• |
cover expenses relating to data collection and consumer privacy compliance, including additional infrastructure, automation and personnel; and |
|
|
• |
explore strategic acquisitions. |
Investing in the foregoing, however, may not yield anticipated returns. Consequently, as our costs increase, we may not be able to generate sufficient revenue to sustain profitability.
We have identified a material weakness in our internal control over financial reporting and, if our remediation of this material weakness is not effective, or if we fail to maintain an effective system of internal control over financial reporting in the future, we may not be able to accurately or timely report our financial condition or results of operations. If our internal control over financial reporting is not effective, it may adversely affect investor confidence in us and the price of our common stock.
As a public company, we are required to maintain internal control over financial reporting and to report any material weaknesses in such internal control. Section 404 of the Sarbanes-Oxley Act of 2002, or the Sarbanes-Oxley Act, requires that we evaluate and determine the effectiveness of our internal control over financial reporting and, beginning with this annual report on Form 10-K, provide a management report on internal control over financial reporting. A material weakness is a deficiency, or combination of deficiencies, in internal control over financial reporting, such that there is a reasonable possibility that a material misstatement of our financial statements will not be prevented or detected on a timely basis.
As described in “Item 9A. Controls and Procedures” in this Annual Report on Form 10-K, during the quarter ended December 31, 2017, we completed the remediation measures including the validation, testing of design and concluding on the operating effectiveness of our controls related to certain of our previously reported material weaknesses in internal control over financial reporting. However, we have not completed remediation measures related to our previously reported material weakness resulting from an absence of certain information technology general controls (“ITGCs”) related to our platform system applications. As a result, management has concluded that our internal control over financial reporting was not effective as of December 31, 2017.
17
Certain ITGCs related to our platform system applications were not fully implemented or have not been in place for a sufficient period of time to adequately evaluate whether the related material weakness has been completely remediated as of December 31, 2017. These internal controls will require further evaluation, including testing the operating effectiveness of these internal controls over a sustained period of financial reporting cycles.
While we believe that these efforts will improve our internal control over financial reporting, the implementation of these measures is ongoing and will require validation and testing of the design and operating effectiveness of internal controls over a sustained period of financial reporting cycles. We cannot assure you that the measures we have taken to date, and are continuing to implement, will be sufficient to remediate the material weakness we have identified or avoid potential future material weaknesses. If the steps we take do not correct the material weakness in a timely manner, we will be unable to conclude that we maintain effective internal controls over financial reporting. Accordingly, there could continue to be a reasonable possibility that these deficiencies or others could result in a misstatement of our accounts or disclosures that would result in a material misstatement of our financial statements that would not be prevented or detected on a timely basis.
The process of designing and implementing internal control over financial reporting required to comply with Section 404 of the Sarbanes-Oxley Act is time consuming, costly and complicated. If during the evaluation and testing process, we identify one or more other material weaknesses in our internal control over financial reporting or determine that the existing material weakness has not been remediated, our management will be unable to assert that our internal control over financial reporting is effective. Even if our management concludes that our internal control over financial reporting is effective, our independent registered public accounting firm may conclude that there are material weaknesses with respect to our internal controls or the level at which our internal controls are documented, designed, implemented or reviewed. If we are unable to assert that our internal control over financial reporting is effective, or if our independent registered public accounting firm is unable to express an opinion as to the effectiveness of our internal control over financial reporting, investors may lose confidence in the accuracy and completeness of our financial reports, the market price of our common stock could be adversely affected and we could become subject to litigation or investigations by the stock exchange on which our securities are listed, the SEC or other regulatory authorities, which could require additional financial and management resources.
We allow our clients to utilize application programming interfaces, or APIs, with our platform, which could result in outages or security breaches and negatively impact our business, financial condition and operating results.
The use of APIs by our clients has significantly increased in recent years. Our APIs allow clients to build their own media buying and data management interface by using our APIs to develop custom integration of their business with our platform. The increased use of APIs increases security and operational risks to our systems, including the risk for intrusion attacks, data theft, or denial of service attacks. Furthermore, while APIs allow clients greater ease and power in accessing our platform, they also increase the risk of overusing our systems, potentially causing outages. We have experienced system slowdowns due to client overuse of our systems through our APIs. While we have taken measures intended to decrease security and outage risks associated with the use of APIs, we cannot guarantee that such measures will be successful. Our failure to prevent outages or security breaches resulting from API use could result in government enforcement actions against us, claims for damages by consumers and other affected individuals, costs associated with investigation and remediation damage to our reputation and loss of goodwill, any of which could harm our business, financial condition and operating results.
We may experience outages and disruptions on our platform if we fail to maintain adequate security and supporting infrastructure as we scale our platform, which may harm our reputation and negatively impact our business, financial condition and operating results.
As we grow our business, we expect to continue to invest in technology services and equipment, including data centers, network services and database technologies, as well as potentially increase our reliance on open source software. Without these improvements, our operations might suffer from unanticipated system disruptions, slow transaction processing, unreliable service levels, impaired quality or delays in reporting accurate information regarding transactions in our platform, any of which could negatively affect our reputation and ability to attract and retain clients. In addition, the expansion and improvement of our systems and infrastructure may require us to commit substantial financial, operational and technical resources, with no assurance our business will increase. If we fail to respond to technological change or to adequately maintain, expand, upgrade and develop our systems and infrastructure in a timely fashion, our growth prospects and results of operations could be adversely affected. The steps we take to increase the reliability, integrity and security of our platform as it scales are expensive and complex, and our execution could result in operational failures and increased vulnerability to cyber-attacks. Such cyber-attacks could include denial-of-service attacks impacting service availability (including the ability to deliver ads) and reliability, tricking company employees into releasing control of their systems to a hacker, or the introduction of computer viruses or malware into our systems with a view to steal confidential or proprietary data. Cyber-attacks of increasing sophistication may be difficult to detect and could result in the theft of our intellectual property and data from our platform. We are also vulnerable to unintentional errors or malicious actions by persons with authorized access to our systems that exceed the scope of their access rights, distribute data erroneously, or, unintentionally or intentionally, interfere with the intended operations of our platform. Moreover, we could be adversely impacted by outages and disruptions in the online platforms of our
18
inventory and data suppliers, such as real-time advertising exchanges. Outages and disruptions of our platform, including due to cyber-attacks, may harm our reputation and negatively impact our business, financial condition and results of operations.
Operational and performance issues with our platform, whether real or perceived, including a failure to respond to technological changes or to upgrade our technology systems, may adversely affect our business, financial condition and operating results.
We depend upon the sustained and uninterrupted performance of our platform to manage our inventory supply; bid on inventory for each campaign; collect, process and interpret data; and optimize campaign performance in real time and provide billing information to our financial systems. If our platform cannot scale to meet demand, if there are errors in our execution of any of these functions on our platform, or if we experience outages, then our business may be harmed. We may also face material delays in introducing new services, products and enhancements. If competitors introduce new products and services using new technologies or if new industry standards and practices emerge, our existing proprietary technology and systems may become obsolete.
Our platform is complex and multifaceted, and operational and performance issues could arise both from the platform itself and from outside factors. Errors, failures, vulnerabilities or bugs have been found in the past, and may in the future, be found. Our platform also relies on third-party technology and systems to perform properly, and our platform is often used in connection with computing environments utilizing different operating systems, system management software, equipment and networking configurations, which may cause errors in, or failures of, our platform or such other computing environments. Operational and performance issues with our platform could include the failure of our user interface, outages, errors during upgrades or patches, discrepancies in costs billed versus costs paid, unanticipated volume overwhelming our databases, server failure, or catastrophic events affecting one or more server farms. While we have built redundancies in our systems, full redundancies do not exist. Some failures will shut our platform down completely, others only partially. Partial failures, which we have experienced in the past, could result in unauthorized bidding, cessation of our ability to bid or deliver impressions or deletion of our reporting, in each case resulting in unanticipated financial obligations or impact.
Operational and performance issues with our platform could also result in negative publicity, damage to our brand and reputation, loss of or delay in market acceptance of our platform, increased costs or loss of revenue, loss of the ability to access our platform, loss of competitive position or claims by clients for losses sustained by them. Alleviating problems resulting from such issues could require significant expenditures of capital and other resources and could cause interruptions, delays or the cessation of our business, any of which may adversely affect our business, financial condition and operating results.
Legislation and regulation of online businesses, including privacy and data protection regimes, could create unexpected costs, subject us to enforcement actions for compliance failures, or cause us to change our platform or business model, which may have a material adverse effect on our business.
U.S. and foreign governments have enacted or are considering enacting legislation related to digital advertising and we expect to see an increase in, or changes to, legislation and regulation related to our industry, including the use of geo-location data to inform advertising, the collection and use of non-identifiable or identifiable Internet user data and unique device identifiers, such as IP address or mobile unique device identifiers, and other data protection and privacy-related regulation.
Additionally, industry groups in the U.S., such as the Digital Advertising Alliance, or DAA, and the Network Advertising Initiative, or NAI, and their international counterparts have self-regulatory guidelines that are subject to periodic updates to which we have agreed to adhere. Such legislation and regulation could cause us to incur unexpected compliance costs and adversely affect demand for our platform, or otherwise harm our business, results of operation and financial condition.
For instance, a wide variety of local, state, national and international laws and regulations apply to the collection, use, retention, protection, disclosure, transfer (including transfer across national boundaries) and other processing of data collected from or about consumers and devices. While we have not collected data that is traditionally considered personal data, such as an individual’s name, email address, address, phone numbers, social security numbers, or credit card numbers, we typically do collect and store IP addresses and other device identifiers (such as unique cookie identifiers and mobile app identifiers), which are or may be considered personal data in some jurisdictions or otherwise may be the subject of legislation or regulation.
Additionally, evolving definitions of what is considered personal data within the European Union (including the European Economic Area, or EEA, countries of Iceland, Liechtenstein and Norway), or EU, and elsewhere may also impact us. On October 19, 2016, the Court of Justice of the European Union ruled that IP addresses in certain circumstances are “personal data” under current EU law, at least when such IP addresses collected by website operators can be combined with information held by ISPs and other companies that have the ability to identify a user’s real-life identity. In addition, the General Data Protection Regulation, which applies to any company inside or outside the EU that collects and uses personal data in connection with the offering of goods or services to individuals in the EU or the monitoring of the behavior of individuals in the EU, will come into effect on May 25, 2018. The GDPR clarifies that the definition of “personal data” under the current EU data protection framework includes online identifiers provided by individuals’ devices, apps, and protocols (such as IP addresses, mobile device IDs, cookie strings) and individuals’ location data, if there is potential that individuals can be identified by such data. The GDPR also enhances data protection obligations for controllers of personal data and for service providers processing personal data. These enhancements may bring about significant
19
changes in the way the advertising technology industry operates in the EU, and some companies may have difficulty adapting their businesses and technology. Non-compliance with the GDPR can trigger steep fines of up to the greater of €20 million or 4% of total worldwide annual turnover. Preparing to meet the GDPR’s requirements before it becomes effective, and maintaining compliance with the GDPR thereafter, requires significant time, resources and expense to change our business practices and our backend configuration, and may increase operating costs, or limit our ability to operate or expand our business.
For the transfer of personal data from the EU to the U.S., we rely upon, and are currently certified under, the EU-U.S. and Swiss-U.S. Privacy Shield Frameworks. The Privacy Shield Framework, however, continue to face criticism from privacy advocates in the EU, and is also subject to pending legal challenges in the General Court of the Court of Justice of the European Union. Other EU mechanisms for adequate data transfer such as the standard contractual clauses are also being challenged in the EU courts. These challenges to the legal means used to transfer data may lead to governmental enforcement actions, litigation, fines and penalties or adverse publicity, which could have an adverse effect on our reputation and business. We may find it necessary to establish systems to maintain personal data originating from the EU in the EU, which may involve substantial expense and may cause us to divert resources from other aspects of our business, all of which may adversely affect our business.
We take commercially reasonable measures to protect the security of information that we collect, use and disclose in the operation of our business, and to offer privacy protections with respect to such information, including conducting third-party audits of our privacy practices and review our privacy policy. Such measures, however, may not always be effective and may not identify data security or privacy related risks or inadequate or inappropriate practices we have used or adopted.
Additionally, as the advertising industry evolves, and new ways of collecting, combining and using data are created, governments may enact legislation that could result in our having to re-design features or functions of our platform, therefore incurring unexpected compliance costs. For example, the Federal Trade Commission, or the FTC, has examined, and likely will continue to examine, the privacy issues that arise as marketers track consumers across several devices, otherwise known as cross-device tracking. The FTC may promulgate guidance regarding cross-device tracking, may encourage legislation governing these practices, and may use its enforcement powers under Section 5 of the Federal Trade Commission Act (which prohibits “unfair” and “deceptive” trade practices) to investigate companies engaging in cross-device tracking. Similarly, evolving privacy regulation and self-regulation could affect our growth in omnichannel products.
While we contractually prohibit our clients and inventory and data suppliers from supplying personally identifiable information or other sensitive information to our system, we may inadvertently receive such information, which may result in us breaching privacy-related legislation or regulations. Additionally, we have contractual obligations to indemnify and hold harmless some of our clients and suppliers for the costs or consequences of our failure to comply with privacy-related legislation and regulations, which may be triggered by such inadvertent ingestion of personally identifiable information in our platform.
In addition to government regulation, the DAA, NAI, and other privacy advocates and industry groups, may propose new and different self-regulatory standards that either legally or contractually apply to us. We also expect that there will continue to be new proposed laws and regulations concerning privacy, data protection and information security, and we cannot yet determine the impact such future laws, regulations and standards may have on our business. Future laws, regulations, standards and other obligations, and changes in the interpretation and enforcement of existing laws, regulations, standards and other obligations, as well as increased enforcement by industry groups or data protection authorities, could require changes to our practices or impair our or our clients’ ability to collect, use or disclose information relating to consumers, which could decrease demand for our platform, increase our costs and impair our ability to maintain and grow our client base and increase our revenue. New laws, amendments to or re-interpretations of existing laws and regulations, industry standards, contractual obligations and other obligations may require us to incur additional costs and restrict our business operations. Because the interpretation and application of laws, contractual obligations and other obligations relating to privacy and data protection are still uncertain, it is possible that these laws and other obligations may be interpreted and applied in a manner that is inconsistent with our existing data management practices or the features of our platform. If so, in addition to the possibility of fines, lawsuits and other claims, we could be required to fundamentally change our business activities and practices or modify our products, which could have an adverse effect on our business. We may be unable to make such changes and modifications in a commercially reasonable manner or at all, and our ability to develop new products and features could be limited.
Data protection and privacy concerns are an important part of the programmatic advertising buying industry. Even the perception of privacy concerns, whether or not valid, may harm our reputation and inhibit use of our platform by current and future clients. For example, claims or adverse publicity could result from the perception of pharmaceuticals or medical advertisements targeting conditions. Our failure or perceived failure to comply with applicable laws and regulations could result in enforcement actions against us, including fines, imprisonment of our officers and public censure, claims for damages by consumers and other affected individuals, damage to our reputation and loss of goodwill, any of which could have a material adverse impact on our business, financial condition and operating results.
20
If the use of “third-party cookies” or other tracking technology is rejected by Internet users, restricted or otherwise subject to unfavorable regulation, or the ability to use data on our platform is otherwise restricted, our performance may decline and we may lose advertisers and revenue.
Digital advertising mostly relies on the use of cookies, pixels and other similar technology, which we refer to collectively as cookies, to collect data about interactions with users and devices. To provide our platform, we utilize third-party cookies, which are cookies owned and used by parties other than the owners of the website or app visited by the Internet user. Our cookies are used to record information tied to a random unique identifier, including such information as when an Internet user views an ad, clicks on an ad or visits one of our advertiser’s websites through a browser while the cookie is active. We use cookies to help us achieve our advertisers’ campaign goals on the web, to limit the instances that an Internet user sees the same advertisement, to report information to our advertisers regarding the performance of their advertising campaigns and to detect and prevent malicious behavior and invalid traffic throughout our network of inventory. We also use data from cookies to help our clients decide whether to bid on, and how to price, an opportunity to place an advertisement in a specific location, at a given time, in front of a particular Internet user. Additionally, our clients use cookies and other technologies to add information they have collected or acquired about users into our platform. Without such data, our clients may not have sufficient insight into an Internet user’s activity, which may compromise their and our ability to determine which inventory to purchase for a specific campaign, and undermine the effectiveness of our platform.
Cookies may be deleted or blocked by Internet users who do not want information to be collected about them. The most commonly used Internet browsers—Chrome, Firefox, Internet Explorer and Safari—allow Internet users to modify their browser settings to prevent cookies from being accepted by their browsers. Additionally, the Safari browser currently blocks some third-party cookies by default and has recently added controls that algorithmically block or limit some cookies. Other browsers could add similar controls. In addition, Internet users can delete cookies from their computers at any time. Some Internet users also download free or paid ad blocking software that not only prevents third-party cookies from being stored on a user’s computer, but also blocks all interaction with a third-party ad server. Google has introduced ad blocking software in its Chrome web browser that will block certain ads based on quality standards established under a multi-stakeholder coalition. Additionally, the DAA, NAI and our company have certain opt-out mechanisms for users to opt out of the collection of their information via cookies. If more Internet users adopt these settings or delete their cookies more frequently than they currently do, or restrictions are imposed by advertisers and publishers, there are changes in technology or new developments in laws, regulations or industry standards around cookies, our business could be harmed.
For in-app advertising, data regarding interactions between users and devices are tracked mostly through stable, pseudonymous identifiers that are built into the device operating system with privacy controls that allow users to express a preference with respect to data collection for advertising, including to disable the identifier. These identifiers and privacy controls are defined by the developers of the mobile platforms and could be changed by the mobile platforms in a way that may negatively impact our business. Privacy aspects of other channels for programmatic advertising, such as CTVs or over-the-top video, are still developing. Technical or policy changes, including regulation or industry self-regulation, could harm our growth in those channels.
In addition, in the EU, Directive 2002/58/EC (as amended by Directive 2009/136/EC), commonly referred to as the Cookie Directive, directs EU member states to ensure that accessing information on an Internet user’s computer, such as through a cookie and other similar technologies, is allowed only if the Internet user has been informed about such access and given his or her consent. A replacement for the Cookie Directive is currently under discussion by EU member states to complement and bring electronic communication services in line with the GDPR and force a harmonized approach across EU member states. Like the GDPR, the proposed ePrivacy Regulation has extra-territorial application as it applies to businesses established outside the EU who provide publicly-available electronic communications services to, or gather data from the devices of, users in the EU. Though still subject to debate, the proposed ePrivacy Regulation is expected to do away with implied consent pop ups and banners used to meet the current requirements of the Cookie Directive and instead required explicit user consent. The fines and penalties for breach of the proposed ePrivacy Regulation may be significant. Limitations on the use or effectiveness of cookies, or other limitations on our, or our clients’, ability to collect and use data for advertising, whether imposed by EU member state implementations of the Cookie Directive, by the new ePrivacy Regulation, or otherwise, may impact the performance of our platform. We may be required to, or otherwise may determine that it is advisable to, make significant changes in our business operations and product and services to obtain user opt-in for cookies and use of cookie data, or develop or obtain additional tools and technologies to compensate for a lack of cookie data. We may not be able to make the necessary changes in our business operations and products and services to obtain user opt-in for cookies and use of cookie data, or develop, implement or acquire additional tools that compensate for a lack of cookie data. Moreover, even if we are able to do so, such additional products and tools may be subject to further regulation, time consuming to develop or costly to obtain, and less effective than our current use of cookies.
21
Potential “Do Not Track” standards or government regulation could limit our or our clients’ access to the user data that informs the advertising campaigns we run and, as a result, undermine the effectiveness of our platform.
As the use of cookies has received ongoing media attention over the past several years, some government regulators, such as the FTC, and privacy advocates have suggested creating a “Do Not Track” standard that would allow Internet users to express a preference, independent of cookie settings in their browser, not to have their online browsing activities tracked. Similar standards have been set at device-level so that activities on mobile devices, including browsing and app uses, are not tracked. The major Internet browsers have implemented some version of a “Do Not Track” setting. The potential regulatory and self-regulatory landscape is inherently uncertain, as there is no definition of tracking, no consensus regarding what message is conveyed by a “Do Not Track” setting and no industry standards regarding how to respond to a “Do Not Track” preference. The World Wide Web Consortium, or W3C, chartered a “Tracking Protection Working Group” in 2011 to convene a multi-stakeholder group of academics, thought leaders, companies, industry groups and consumer advocacy organizations, to create a voluntary “Do Not Track” standard for the World Wide Web. The group has yet to agree upon a standard and has considered disbanding due to uncertainty regarding the implementation of a “Do Not Track” standard. Work in the group has significantly slowed, and participation has declined to only a few participants. Despite the lack of consensus in this arena, the FTC, as it has suggested in the past, or other US federal or state government regulators, may pursue legislation if the industry cannot agree upon a standard. In the EU, the Article 29 Working Party recommended in an Opinion issued on April 4, 2017 that the proposed ePrivacy Regulation require terminal equipment and software to offer privacy protective settings by default with the ability for users to adjust these settings during setup, browser settings that enable users to signal specific consent, and mandatory adherence to “Do Not Track” to give users additional control over the collection of their Internet activity data. If a “Do Not Track” browser setting is adopted by many Internet users or if a “Do Not Track” standard imposed by state or federal or foreign legislation (such as the proposed ePrivacy Regulation), or agreed upon by standard setting groups, which prohibits us from using data as we currently do, we may have to change our business practices, our clients may reduce their use of our platform, and our business, financial condition and operating results could be adversely affected.
Failure to comply with industry self-regulation could harm our brand, reputation and business.
We have committed to comply with the NAI’s Code of Conduct and the DAA’s Self-Regulatory Principles for Online Behavioral Advertising in the U.S., as well as similar self-regulatory principles in Europe and Canada adopted by the local Digital Advertising Alliance. Our efforts to comply with these self-regulatory principles include offering Internet users notice and transparency when advertising is served to them based, in part, on browsing data recorded by cookies. We also offer Internet users the ability to opt out of receiving interest-based advertisements. If we make mistakes in our implementation of these principles, or if self-regulatory bodies expand these guidelines or government authorities issue different guidelines regarding Internet-based advertising, or our opt out mechanisms fail to work as designed, or if Internet users misunderstand our technology or our commitments with respect to these principles, we may, as a result, be subject to negative publicity, government investigation, government or private litigation, or investigation by self-regulatory bodies or other accountability groups. Any such action against us, or investigations, even if meritless, could be costly and time consuming, require us to change our business practices, cause us to divert management’s attention and our resources and be damaging to our brand, reputation and business.
Our failure to meet content and inventory standards and provide services that our advertisers and inventory suppliers trust, could harm our brand and reputation and negatively impact our business, financial condition and operating results.
We do not provide or control either the content of the advertisements we serve or that of the websites providing the inventory. Advertisers provide the advertising content and inventory suppliers provide the inventory. Both advertisers and inventory suppliers are concerned about being associated with content they consider inappropriate, competitive or inconsistent with their brands, or illegal and they are hesitant to spend money without guaranteed brand security. Additionally, advertisers may seek to display advertising campaigns in jurisdictions that do not permit such advertising (for example, pharmaceutical advertising is not permitted in many countries). Consequently, our reputation depends in part on providing services that our advertisers and inventory suppliers trust, and we have contractual obligations to meet content and inventory standards. We contractually prohibit the misuse of our platform by agencies (and their advertiser clients) and inventory suppliers. Additionally, we use our proprietary technology and third-party services to, and we participate in industry co-ops that work to, detect malware and other content issues as well as click fraud (whether by humans or software known as “bots”) and to block fraudulent inventory, including “tool bar” inventory, which is inventory that appears within an application and displaces any advertising that would otherwise be displayed on the website. Despite such efforts, our clients may inadvertently purchase inventory that proves to be unacceptable for their campaigns, in which case, we may not be able to recoup the amounts paid to inventory suppliers. Preventing and combating fraud is an industry-wide issue that requires constant vigilance, and we cannot guarantee that we will be fully successful in doing so. There are other means we could use, such as human review of content we serve, that some of our competitors undertake, but because our platform is self-service, and because such means are cost-intensive, we do not utilize all means available to decrease this risk. We may provide access to inventory that is objectionable to our advertisers or we may serve advertising that contains malware or objectionable content to our inventory suppliers, which could harm our or our clients’ brand and reputation, and negatively impact our business, financial condition and operating results.
22
If we fail to offer sufficient client training and support, our business and reputation would suffer.
Because we offer a self-serve platform, client training and support is important for the successful marketing and continued use of our platform and for maintaining and increasing spend through our platform from existing and new clients. Providing this training and support requires that our platform operations personnel have specific domain knowledge and expertise, making it more difficult for us to hire qualified personnel and to scale up our support operations due to the extensive training required. The importance of high-quality client service will increase as we expand our business and pursue new clients. If we are not responsive and proactive regarding our clients’ advertising needs, or do not provide effective support for our clients’ advertising campaigns, our ability to retain our existing clients would suffer and our reputation with existing or potential clients would be harmed, which would negatively impact our business.
If the non-proprietary technology, software, products and services that we use are unavailable, have future terms we cannot agree to, or do not perform as we expect, our business, financial condition and operating results could be harmed.
We depend on various technology, software, products and services from third parties or available as open source, including for critical features and functionality of our platform, data centers and API technology, payment processing, payroll and other professional services. For example, in order for clients to target ads in ways they desire and otherwise optimize and verify campaigns, our platform must have access to data regarding Internet user behavior and reports with demographic information regarding Internet users. Identifying, negotiating, complying with and integrating with third-party terms and technology are complex, costly and time-consuming matters. Failure by third-party providers to maintain, support or secure their technology either generally or for our accounts specifically, or downtime, errors or defects in their products or services, could adversely impact our platform, our administrative obligations or other areas of our business. Having to replace any third-party providers or their technology, products or services could result in outages or difficulties in our ability to provide our services. For example, we rely upon third-party co-location providers for our data centers, and we are dependent on these third parties to provide continuous power, cooling, Internet connectivity and physical and technological security for our servers. In the event that these third-party providers experience any interruption in operations or cease business for any reason, or if we are unable to agree on satisfactory terms for continued hosting relationships, we would be forced to enter into a relationship with other service providers or assume some hosting responsibilities ourselves. In addition, even a disruption as brief as a few minutes could have a negative impact on marketplace activities and could result in a loss of revenue. If we are unsuccessful in establishing or maintaining our relationships with our third-party providers or otherwise need to replace them, internal resources may need to be diverted and our business, financial condition and operating results could be harmed.
We face potential liability and harm to our business based on the human factor of inputting information into our platform.
Campaigns are set up using several variables available to our clients on our platform. While our platform includes several checks and balances, it is possible for human error to result in significant over-spending. The system requires a daily cap at the ad group level. We also provide for the client to input daily and overall caps at the advertising inventory campaign level at their discretion. Additionally, we set a credit limit for each user so that they cannot spend beyond the level of credit risk we are willing to accept. Despite these protections, the ability for overspend exists. For example, campaigns which last for a period of time can be set to pace evenly or as quickly as possible. If a client with a high credit limit enters the wrong daily cap with a campaign set to a rapid pace, it is possible for a campaign to accidently go significantly over budget. While our client contracts state that clients are responsible for media purchased through our platform, we are ultimately responsible for paying the inventory providers and we may be unable to collect for such issues.
International expansion subjects us to additional costs and risks that can adversely affect our business, financial condition and operating results.
International expansion subjects us to many challenges associated with supporting a rapidly growing business across a multitude of cultures, customs, monetary, legal and regulatory systems and commercial infrastructures. We have a limited operating history outside of the U.S., and our ability to manage our business and conduct our operations internationally requires considerable attention and resources.
We currently have sales, account management, inventory, and other personnel in countries within Europe, Asia, and Australia, and we anticipate expanding our international operations in the future. Some of the countries into which we are, or potentially may, expand score unfavorably on the Corruption Perceptions Index, or CPI, of the Transparency International. Our teams outside the U.S. are substantially smaller than our teams in the U.S. To the extent we are unable to effectively engage with non-U.S. advertising agencies or international divisions of U.S. agencies due to our limited sales force capacity, or we are unable to secure quality non-U.S. ad inventory and data on reasonable terms due to our limited inventory and data team capacity, we may be unable to effectively grow in international markets.
23
Our international operations subject us to a variety of additional risks, including:
|
|
• |
increased management, travel, infrastructure and legal compliance costs associated with having multiple international operations; |
|
|
• |
long payment cycles; |
|
|
• |
potential complications in enforcing contracts and collections; |
|
|
• |
increased financial accounting and reporting burdens and complexities; |
|
|
• |
concerns regarding negative, unstable or changing economic conditions in the countries and regions where we operate; |
|
|
• |
increased administrative costs and risks associated with compliance with local laws and regulations, including relating to privacy and data security; |
|
|
• |
regulatory and legal compliance, including with anti-bribery laws, import and export control laws, economic sanctions and other regulatory limitations or obligations on our operations; |
|
|
• |
heightened risks of unfair or corrupt business practices and of improper or fraudulent sales arrangements; |
|
|
• |
difficulties in invoicing and collecting in foreign currencies and associated foreign currency exposure; |
|
|
• |
difficulties in repatriating or transferring funds from or converting currencies; |
|
|
• |
administrative difficulties, costs and expenses related to various local languages, cultures and political nuances; |
|
|
• |
varied labor and employment laws, including those relating to termination of employees; |
|
|
• |
reduced protection for intellectual property rights in some countries and practical difficulties of enforcing rights abroad; and |
|
|
• |
compliance with the laws of numerous foreign taxing jurisdictions, including withholding obligations, and overlapping of different tax regimes. |
We may incur significant operating expenses as a result of our international expansion, and it may not be successful. Our international business also subjects us to the impact of global and regional recessions and economic and political instability, differing regulatory requirements, costs and difficulties in managing a distributed workforce, potentially adverse tax consequences in the U.S. and abroad and restrictions on the repatriation of funds to the U.S. In addition, advertising markets outside of the U.S. are not as developed as those within the U.S., and we may be unable to grow our business sufficiently. Our failure to manage these risks and challenges successfully could adversely affect our business, financial condition and operating results.
Exposure to foreign currency exchange rate fluctuations could negatively impact our operating results.
While the majority of the transactions through our platform are denominated in U.S. dollars, we have transacted in foreign currencies for both inventory and for payments by clients from use of our platform, including principally the Euro, the Canadian Dollar, British Pound, Australian Dollar, Japanese Yen and Indonesian Rupiah. Given our anticipated international growth, we expect the number of transactions in foreign currencies to continue to grow in the future. While we do require a fee from our clients that pay in non-U.S. currency, this fee may not always cover foreign currency exchange rate fluctuations. We currently have a program to hedge exposure to foreign currency fluctuations. However, the use of hedging instruments may not be available for all currencies, or may not always offset losses resulting from foreign currency exchange rate fluctuations. Moreover, the use of hedging instruments can itself result in losses if we are unable to structure effective hedges with such instruments.
Future acquisitions, strategic investments or alliances could disrupt our business and harm our business, financial condition and operating results.
We may in the future explore potential acquisitions of companies or technologies, strategic investments, or alliances to strengthen our business. However, we have limited experience in acquiring and integrating businesses, products and technologies. Even if we identify an appropriate acquisition candidate, we may not be successful in negotiating the terms or financing of the acquisition, and our due diligence may fail to identify all of the problems, liabilities or other shortcomings or challenges of an acquired business, product or technology, including issues related to intellectual property, product quality or architecture, regulatory compliance practices, revenue recognition or other accounting practices or employee or client issues. Acquisitions involve numerous risks, any of which could harm our business, including:
|
|
• |
regulatory hurdles; |
|
|
• |
anticipated benefits may not materialize; |
24
|
|
• |
diversion of management time and focus from operating our business to addressing acquisition integration challenges; |
|
|
• |
retention of employees from the acquired company; |
|
|
• |
cultural challenges associated with integrating employees from the acquired company into our organization; |
|
|
• |
integration of the acquired company’s products and technology; |
|
|
• |
integration of the acquired company’s accounting, management information, human resources and other administrative systems; |
|
|
• |
the need to implement or improve controls, procedures and policies at a business that prior to the acquisition may have lacked effective controls, procedures and policies; |
|
|
• |
coordination of product development and sales and marketing functions; |
|
|
• |
liability for activities of the acquired company before the acquisition, including relating to privacy and data security, patent and trademark infringement claims, violations of laws, commercial disputes, tax liabilities and other known and unknown liabilities; and |
|
|
• |
litigation or other claims in connection with the acquired company, including claims from terminated employees, users, former stockholders or other third parties. |
Failure to appropriately mitigate these risks or other issues related to such acquisitions and strategic investments could result in reducing or completely eliminating any anticipated benefits of transactions, and harm our business generally. Future acquisitions could also result in dilutive issuances of our equity securities, the incurrence of debt, contingent liabilities, amortization expenses or the impairment of goodwill, any of which could harm our business, financial condition and operating results.
We may not be able to secure additional financing on favorable terms, or at all, to meet our future capital needs, which may in turn impair our growth.
We intend to continue to grow our business, which will require additional capital to develop new features or enhance our platform, improve our operating infrastructure, finance working capital requirements or acquire complementary businesses and technologies. Accordingly, we may need to engage in additional equity or debt financings to secure additional capital. If we raise additional funds through future issuances of equity or convertible debt securities, our existing stockholders could suffer significant dilution, and any new equity securities we issue could have rights, preferences and privileges superior to those of holders of our common stock. Any debt financing that we secure in the future could involve restrictive covenants relating to our capital raising activities and other financial and operational matters, which may make it more difficult for us to obtain additional capital and to pursue business opportunities. If we are unable to secure additional funding on favorable terms, or at all, when we require it, our ability to continue to grow our business to react to market conditions could be impaired and our business may be harmed.
Our credit facility contains operating and financial covenants that restrict our business and financing activities.
Our credit facility contains restrictions that limit our flexibility in operating our business. In March 2016, we entered into a loan and security agreement with a syndicate led by Citibank, N.A., which we refer to as our credit facility. In May 2017, terms of our credit facility were amended and restated, and subject to certain customary conditions, we now have access to borrow up to $200.0 million aggregate principal amount of revolver borrowings. The amount of borrowing availability under our credit facility is based on our accounts receivable balance, reduced by certain reserves. As of December 31, 2017, the outstanding principal balance under our credit facility was $27.0 million, and in January 2018, we repaid this balance. Our credit facility also contains various covenants that limit our ability to engage in specified types of transactions. Subject to limited exceptions, these covenants limit our ability to, among other things:
|
|
• |
sell assets or make changes to the nature of our business; |
|
|
• |
engage in mergers or acquisitions; |
|
|
• |
incur, assume or permit additional indebtedness and guarantees; |
|
|
• |
make restricted payments, including paying dividends on, repurchasing, redeeming or making distributions with respect to our capital stock; |
|
|
• |
make specified investments; |
|
|
• |
engage in transactions with our affiliates; and |
|
|
• |
make payments in respect of subordinated debt. |
25
In addition, our credit facility contains a fixed charge coverage ratio which, if our excess availability under the credit facility is less than the greater of (1) $15.0 million and (2) 12.5% of the lesser of (a) the borrowing base then in effect and (b) the commitments under the credit facility then in effect, requires us to maintain a certain ratio of our earnings to principal and interest payable under the credit facility in a given period. Our obligations under the credit facility are collateralized by a pledge of substantially all of our assets, including accounts receivable, deposit accounts, intellectual property, investment property and equipment. The covenants in our credit facility may limit our ability to take actions and, in the event that we breach one or more covenants, our lenders may choose to declare an event of default and require that we immediately repay all amounts outstanding, terminate the commitment to extend further credit and foreclose on the collateral granted to them to collateralize such indebtedness, which includes our intellectual property. In addition, if we fail to meet the required covenants, we will not have access to further draw-downs under the credit facility.
Our future success depends on the continuing efforts of our key employees, including Jeff T. Green and David R. Pickles, and our ability to attract, hire, retain and motivate highly skilled employees in the future.
Our future success depends on the continuing efforts of our executive officers and other key employees, including our two founders, Jeff T. Green, our Chief Executive Officer, and David R. Pickles, our Chief Technology Officer. We rely on the leadership, knowledge and experience that our executive officers provide. They foster our corporate culture, which has been instrumental to our ability to attract and retain new talent. We also rely on employees in our product development, support and sales teams to attract and keep key clients.
The market for talent in our key areas of operations, including California and New York, is intensely competitive, which could increase our costs to attract and retain talented employees. As a result, we may incur significant costs to attract and retain employees, including significant expenditures related to salaries and benefits and compensation expenses related to equity awards, and we may lose new employees to our competitors or other companies before we realize the benefit of our investment in recruiting and training them. New employees often require significant training and, in many cases, take significant time before they achieve full productivity. Our account managers, for instance, need to be trained quickly on the features of our platform since failure to offer high-quality support may adversely affect our relationships with our clients. Technology companies like ours compete to attract the best talent. Additionally, we have little experience with recruiting in geographies outside of the U.S., and may face additional challenges in attracting and retaining international employees.
Employee turnover, including changes in our management team, could disrupt our business. None of our founders or other key employees has an employment agreement for a specific term, and any of our employees may terminate his or her employment with us at any time. The loss of one or more of our executive officers, especially our two founders, or our inability to attract and retain highly skilled employees could have an adverse effect on our business, financial condition and operating results.
Our management team has limited experience managing a public company.
We became a public company in September 2016. Most members of our management team have limited or no experience managing a publicly-traded company, interacting with public company investors, and complying with the increasingly complex laws, rules and regulations that govern public companies. As a public company, we are now subject to significant obligations relating to reporting, procedures and internal controls, and our management team may not successfully or efficiently manage such obligations. These new obligations and scrutiny will require significant attention from our management and could divert their attention away from the day-to-day management of our business, which could adversely affect our business, financial condition and operating results.
If we do not effectively grow and train our sales and support teams, we may be unable to add new clients or increase sales to our existing clients and our business will be adversely affected.
We are substantially dependent on our sales and support teams to obtain new clients and to increase spend by our existing clients. We believe that there is significant competition for sales personnel with the skills and technical knowledge that we require. Our ability to achieve revenue growth will depend, in large part, on our success in recruiting, training, integrating and retaining sufficient numbers of sales personnel to support our growth. Due to the complexity of our platform, new hires require significant training and it may take significant time before they achieve full productivity. Our recent and planned hires may not become productive as quickly as we expect, and we may be unable to hire or retain sufficient numbers of qualified individuals in the markets where we do business or plan to do business. If we are unable to hire and train sufficient numbers of effective sales personnel, or the sales personnel are not successful in obtaining new clients or increasing our existing clients’ spend with us, our business will be adversely affected.
26
Our corporate culture has contributed to our success and, if we are unable to maintain it as we grow, our business, operating results and financial condition could be harmed.
We have experienced and may continue to experience rapid expansion of our employee ranks. We believe our corporate culture has been a key element of our success. However, as our organization grows, it may be difficult to maintain our culture, which could reduce our ability to innovate and operate effectively. The failure to maintain the key aspects of our culture as our organization grows could result in decreased employee satisfaction, increased difficulty in attracting top talent, increased turnover and could compromise the quality of our client service, all of which are important to our success and to the effective execution of our business strategy. In the event we are unable to maintain our corporate culture as we grow to scale, our business, operating results and financial condition could be harmed.
Our proprietary rights may be difficult to enforce, which could enable others to copy or use aspects of our technology without compensating us, thereby eroding our competitive advantages and harming our business.
We rely upon a combination of trade secrets, third-party confidentiality and non-disclosure agreements, additional contractual restrictions on disclosure and use, and trademark, copyright and other intellectual property laws to establish and protect our proprietary rights. These laws, procedures and restrictions provide only limited protection. We currently have “theTradeDesk” and variants registered as a trademark or pending registration in the U.S. and certain foreign countries. We also rely on copyright laws to protect computer programs related to our platform and our proprietary technologies, although to date we have not registered for statutory copyright protection. We have registered numerous Internet domain names in the U.S. and certain foreign countries related to our business in order to protect our proprietary interests. We endeavor to enter into agreements with our employees and contractors in order to limit access to and disclosure of our proprietary information, as well as to clarify rights to intellectual property associated with our business. Protecting our intellectual property is a challenge, especially after our employees or our contractors end their relationship with us, and, in some cases, decide to work for our competitors. Our contracts with our employees and contractors that relate to intellectual property issues generally restrict the use of our confidential information solely in connection with our services, and strictly prohibit reverse-engineering. However, reverse engineering our software or the theft or misuse of our proprietary information could occur by employees or other third parties who have access to our technology. Enforceability of the non-compete agreements that we have in place is not guaranteed, and contractual restrictions could be breached without discovery or adequate remedies. Further, because we believe our proprietary technology is better protected by keeping our technology architecture, trade secrets, and engineering roadmap private, we have not patented our proprietary technology and cannot look to patent enforcement rights to protect our proprietary technology.
Policing unauthorized use of our technology is difficult. In addition, the laws of some foreign countries may not be as protective of intellectual property rights as those of the U.S., and mechanisms for enforcement of our proprietary rights in such countries may be inadequate. If we are unable to protect our proprietary rights (including in particular, the proprietary aspects of our platform) we may find ourselves at a competitive disadvantage to others who have not incurred the same level of expense, time and effort to create and protect their intellectual property.
We may be sued by third parties for alleged infringement of their proprietary rights, which would result in additional expense and potential damages.
There is significant patent and other intellectual property development activity in the digital advertising industry. Third-party intellectual property rights may cover significant aspects of our technologies or business methods or block us from expanding our offerings. Our success depends on the continual development of our platform. From time to time, we may receive claims from third parties that our platform and underlying technology infringe or violate such third parties’ intellectual property rights. To the extent we gain greater public recognition, we may face a higher risk of being the subject of intellectual property claims. The cost of defending against such claims, whether or not the claims have merit, is significant, regardless of whether we are successful in our defense, and could divert the attention of management, technical personnel and other employees from our business operations. Litigation regarding intellectual property rights is inherently uncertain due to the complex issues involved, and we may not be successful in defending ourselves in such matters. Additionally, we may be obligated to indemnify our clients or inventory and data suppliers in connection with any such litigation. If we are found to infringe these rights, we could potentially be required to cease utilizing portions of our platform. We may also be required to develop alternative non-infringing technology, which could require significant time and expense. Alternatively, we could be required to pay royalty payments, either as a one-time fee or ongoing, as well as damages for past use that was deemed to be infringing. If we cannot license or develop technology for any allegedly infringing aspect of our business, we would be forced to limit our service and may be unable to compete effectively. Any of these results could harm our business.
27
We face potential liability and harm to our business based on the nature of our business and the content on our platform.
Advertising often results in litigation relating to copyright or trademark infringement, public performance royalties or other claims based on the nature and content of advertising that is distributed through our platform. Though we contractually require agencies to represent to us that they have the rights necessary to serve advertisements through our platform, we do not independently verify whether we are permitted to deliver, or review the content of, such advertisements. If any of these representations are untrue, we may be exposed to potential liability and our reputation may be damaged. While our clients are typically obligated to indemnify us, such indemnification may not fully cover us, or we may not be able to collect. In addition to settlement costs, we may be responsible for our own litigations costs, which can be extensive.
We are subject to anti-bribery, anti-corruption and similar laws and non-compliance with such laws can subject us to criminal penalties or significant fines and harm our business and reputation.
We are subject to anti-bribery and similar laws, such as the U.S. Foreign Corrupt Practices Act of 1977, as amended, or the FCPA, the U.S. domestic bribery statute contained in 18 U.S.C. § 201, the USA PATRIOT Act, U.S. Travel Act, the U.K. Bribery Act 2010 and Proceeds of Crime Act 2002, and possibly other anti-corruption, anti-bribery and anti-money laundering laws in countries in which we conduct activities. Anti-corruption laws have been enforced with great rigor in recent years and are interpreted broadly and prohibit companies and their employees and their agents from making or offering improper payments or other benefits to government officials and others in the private sector. As we increase our international sales and business, particularly in countries with a low score on the CPI by Transparency International, and increase our use of third parties such as sales agents, distributors, resellers or consultants, our risks under these laws will increase. We adopt appropriate policies and procedures and conduct training, but cannot guarantee that improprieties will not occur. Noncompliance with these laws could subject us to investigations, sanctions, settlements, prosecution, other enforcement actions, disgorgement of profits, significant fines, damages, other civil and criminal penalties or injunctions, suspension and/or debarment from contracting with specified persons, the loss of export privileges, reputational harm, adverse media coverage, and other collateral consequences. Any investigations, actions and/or sanctions could have a material negative impact on our business, operating results and financial condition.
We are subject to governmental economic sanctions requirements and export and import controls that could impair our ability to compete in international markets or subject us to liability if we are not in compliance with applicable laws.
As a U.S. company, we are subject to U.S. export control and economic sanctions laws and regulations, and we are required to export our technology and services in compliance with those laws and regulations, including the U.S. Export Administration Regulations and economic embargo and trade sanction programs administered by the Treasury Department’s Office of Foreign Assets Control. U.S. economic sanctions and export control laws and regulations prohibit the shipment of specified products and services to countries, governments and persons targeted by U.S. sanctions. While we are currently taking precautions to prevent doing any business, directly or indirectly, with countries, governments and persons targeted by U.S. sanctions and to ensure that our technology and services are not exported or used by countries, governments and persons targeted by U.S. sanctions, such measures may be circumvented. There can be no assurance that we will be in compliance with U.S. export control or economic sanctions laws and regulations in the future. Any such violation could result in significant criminal or civil fines, penalties or other sanctions and repercussions, including reputational harm that could materially adversely impact our business.
Furthermore, if we export our technology, the exports may require authorizations, including a license, a license exception or other appropriate government authorization. Complying with export control and sanctions regulations may be time-consuming and may result in the delay or loss of opportunities.
In addition, various countries regulate the import of encryption technology, including the imposition of import permitting and licensing requirements, and have enacted laws that could limit our ability to offer our platform or could limit our clients’ ability to use our platform in those countries. Changes in our platform or future changes in export and import regulations may create delays in the introduction of our platform in international markets or prevent our clients with international operations from deploying our platform globally. Any change in export or import regulations, economic sanctions or related legislation, or change in the countries, governments, persons, or technologies targeted by such regulations, could result in decreased use of our platform by, or in our decreased ability to export our technology and services to, existing or potential clients with international operations. Any decreased use of our platform or limitation on our ability to export our platform would likely adversely affect our business operating results and financial condition.
28
Our tax liabilities may be greater than anticipated.
The U.S. and non-U.S. tax laws applicable to our business activities are subject to interpretation and are changing. We are subject to audit by the Internal Revenue Service and by taxing authorities of the state, local and foreign jurisdictions in which we operate. Our tax obligations are based in part on our corporate operating structure, including the manner in which we develop, value, and use our intellectual property, the jurisdictions in which we operate, how tax authorities assess revenue-based taxes such as sales and use taxes, the scope of our international operations and the value we ascribe to our intercompany transactions. Taxing authorities may challenge, and have challenged, our tax positions and methodologies for valuing developed technology or intercompany arrangements, as well as our positions regarding the collection of sales and use taxes and the jurisdictions in which we are subject to taxes, which could expose us to additional taxes. Any adverse outcomes of such challenges to our tax positions could result in additional taxes for prior periods, interest and penalties, as well as higher future taxes. In addition, our future tax expense could increase as a result of changes in tax laws, regulations or accounting principles, or as a result of earning income in jurisdictions that have higher tax rates. An increase in our tax expense could have a negative effect on our financial position and results of operations. Moreover, the determination of our provision for income taxes and other tax liabilities requires significant estimates and judgment by management, and the tax treatment of certain transactions is uncertain. Although we believe we will make reasonable estimates and judgments, the ultimate outcome of any particular issue may differ from the amounts previously recorded in our financial statements and any such occurrence could materially affect our financial position and results of operations.
Risks Related to Ownership of Our Class A Common Stock
The market price of our Class A common stock may be volatile or may decline regardless of our operating performance, and you may not be able to resell your shares at or above your purchase price.
The market price of our stock and of equity securities of technology companies has historically experienced high levels of volatility. If you purchase shares of our Class A common stock, you may not be able to resell those shares at or above your purchase price. The market price of our Class A common stock has fluctuated and may fluctuate significantly in response to numerous factors, some of which are beyond our control and may not be related to our operating performance, including:
|
|
• |
announcements of new offerings, products, services or technologies, commercial relationships, acquisitions or other events by us or our competitors; |
|
|
• |
price and volume fluctuations in the overall stock market from time to time; |
|
|
• |
significant volatility in the market price and trading volume of technology companies in general and of companies in the digital advertising industry in particular; |
|
|
• |
fluctuations in the trading volume of our shares or the size of our public float; |
|
|
• |
actual or anticipated changes or fluctuations in our operating results; |
|
|
• |
whether our operating results meet the expectations of securities analysts or investors; |
|
|
• |
actual or anticipated changes in the expectations of investors or securities analysts; |
|
|
• |
litigation involving us, our industry, or both; |
|
|
• |
regulatory developments in the U.S., foreign countries, or both; |
|
|
• |
general economic conditions and trends; |
|
|
• |
major catastrophic events; |
|
|
• |
sales of large blocks of our common stock; |
|
|
• |
departures of key employees; or |
|
|
• |
an adverse impact on the company from any of the other risks cited herein. |
In addition, if the stock market for technology companies, or the stock market generally, experiences a loss of investor confidence, the trading price of our Class A common stock could decline for reasons unrelated to our business, operating results or financial condition. Stock prices of many technology companies have fluctuated in a manner unrelated or disproportionate to the operating performance of those companies. The trading price of our Class A common stock might also decline in reaction to events that affect other companies in our industry even if these events do not directly affect us. In the past, stockholders have filed securities class action litigation following periods of market volatility. If we were to become involved in securities litigation, it could subject us to substantial costs, divert resources and the attention of management from our business, and adversely affect our business.
29
Substantial future sales of shares of our common stock could cause the market price of our Class A common stock to decline.
The market price of our Class A common stock could decline as a result of substantial sales of our common stock, particularly sales by our directors, executive officers, and significant stockholders or the perception in the market that holders of a large number of shares intend to sell their shares.
Additionally, the shares of common stock subject to outstanding options, restricted stock awards and restricted stock units under our equity incentive plans and the shares reserved for future issuance under our equity incentive plans will become eligible for sale in the public market in the future, subject to certain legal and contractual limitations.
Certain holders of our common stock have rights, subject to some conditions, to require us to file registration statements covering their shares or to include their shares in registration statements that we may file for ourselves or our stockholders.
Insiders have substantial control over our company, including as a result of the dual class structure of our common stock, which could limit your ability to influence the outcome of key decisions, including a change of control.
Our Class B common stock has ten votes per share, and our Class A common stock, which is the stock we offered in our initial public offering, or IPO, has one vote per share. Because of the ten-to-one voting ratio between our Class B and Class A common stock, the holders of our Class B common stock collectively continue to control a majority of the combined voting power of our common stock and therefore are able to control all matters submitted to our stockholders for approval so long as the shares of Class B common stock represent at least 9.1% of all outstanding shares of our Class A and Class B common stock. Stockholders who hold shares of Class B common stock, including our executive officers, employees, and directors and their affiliates, together hold approximately 74% of the voting power of our outstanding capital stock as of December 31, 2017. This concentrated control limits or precludes your ability to influence corporate matters for the foreseeable future. These stockholders are able to influence or control matters requiring approval by our stockholders, including the election of directors and the approval of mergers, acquisitions or other extraordinary transactions. Their interests may differ from yours and they may vote in a manner that is adverse to your interests. This ownership concentration may deter, delay or prevent a change of control of our company, deprive our stockholders of an opportunity to receive a premium for their common stock as part of a sale of our company and may ultimately affect the market price of our common stock.
Future transfers by holders of Class B common stock will generally result in those shares converting to Class A common stock, subject to limited exceptions, such as transfers effected for estate planning or charitable purposes. The conversion of Class B common stock to Class A common stock will have the effect, over time, of increasing the relative voting power of those holders of Class B common stock who retain their shares in the long term.
The requirements of being a public company may strain our resources, divert our management’s attention and affect our ability to attract and retain qualified board members.
As a public company, we are subject to the reporting requirements of the Exchange Act, and are required to comply with the applicable requirements of the Sarbanes-Oxley Act and the Dodd-Frank Wall Street Reform and Consumer Protection Act, the listing requirements of NASDAQ, and other applicable securities rules and regulations. Compliance with these rules and regulations increases our legal and financial compliance costs, make some activities more difficult, time-consuming or costly and increase demand on our systems and resources. Among other things, the Exchange Act requires that we file annual, quarterly and current reports with respect to our business and operating results and maintain effective disclosure controls and procedures and internal controls over financial reporting. Significant resources and management oversight are required to maintain and, if required, improve our disclosure controls and procedures and internal controls over financial reporting to meet this standard. As a result, management’s attention may be diverted from other business concerns, which could harm our business and operating results. Although we have already hired additional employees to comply with these requirements, we may need to hire even more employees in the future, which will increase our costs and expenses.
Being a public company may make it more expensive for us to obtain director and officer liability insurance, and we may be required to accept reduced coverage or incur substantially higher costs to obtain coverage. The heightened risks faced by directors and officers of a public company could also make it more difficult for us to attract and retain qualified members of our board of directors, particularly to serve on our audit committee and compensation committee, and qualified executive officers.
30
Our charter documents and Delaware law could discourage takeover attempts and other corporate governance changes.
Our certificate of incorporation and bylaws contain provisions that could delay or prevent a change in control of our company. These provisions could also make it difficult for stockholders to elect directors that are not nominated by the current members of our board of directors or take other corporate actions, including effecting changes in our management. These provisions include the following provisions:
|
|
• |
permit the board of directors to establish the number of directors and fill any vacancies and newly created directorships; |
|
|
• |
provide that our board of directors will be classified into three classes with staggered, three year terms and that directors may only be removed for cause; |
|
|
• |
require super-majority voting to amend certain provisions in our certificate of incorporation and bylaws; |
|
|
• |
authorize the issuance of “blank check” preferred stock that our board of directors could use to implement a stockholder rights plan; |
|
|
• |
eliminate the ability of our stockholders to call special meetings of stockholders; |
|
|
• |
specify that special meetings of our stockholders can be called only by our board of directors, the chairman of our board of directors, or our chief executive officer; |
|
|
• |
prohibit stockholder action by written consent, which requires all stockholder actions to be taken at a meeting of our stockholders; |
|
|
• |
provide that the board of directors is expressly authorized to make, alter or repeal our bylaws; |
|
|
• |
provide that vacancies on our board of directors may be filled only by a majority of directors then in office, even though less than a quorum; |
|
|
• |
prohibit cumulative voting in the election of directors; |
|
|
• |
restrict the forum for certain litigation against us to Delaware; |
|
|
• |
permit our board of directors to alter our bylaws without obtaining stockholder approval; |
|
|
• |
reflect the dual class structure of our common stock, as discussed above; and |
|
|
• |
establish advance notice requirements for nominations for election to our board of directors or for proposing matters that can be acted upon by stockholders at annual stockholder meetings. |
In addition, as a Delaware corporation, we are subject to Section 203 of the Delaware General Corporation Law. These provisions may prohibit large stockholders, in particular those owning 15% or more of our outstanding voting stock, from merging or combining with us for a period of time.
Our certificate of incorporation provides that the Court of Chancery of the State of Delaware is the exclusive forum for substantially all disputes between us and our stockholders, which limits our stockholders’ ability to choose other forums for disputes with us or our directors, officers or employees.
Our certificate of incorporation provides that the Court of Chancery of the State of Delaware is the sole and exclusive forum for: (1) any derivative action or proceeding brought on our behalf; (2) any action asserting a claim of breach of a fiduciary duty by any of our directors, officers, employees or our stockholders owed to us or our stockholders; (3) any action asserting a claim arising pursuant to any provision of the Delaware General Corporation Law, our certificate of incorporation or our bylaws, or as to which the Delaware General Corporation Law confers jurisdiction on the Court of Chancery of the State of Delaware; or (4) any action asserting a claim governed by the internal affairs doctrine. This choice of forum provision may limit a stockholder’s ability to bring a claim in other judicial forums for disputes with us or our directors, officers or other employees, which may discourage lawsuits against us and our directors, officers and other employees in jurisdictions other than Delaware. Alternatively, if a court were to find the choice of forum provision contained in our certificate of incorporation to be inapplicable or unenforceable in an action, we may incur additional costs associated with resolving such action in other jurisdictions, which could have a material adverse effect our business, financial condition or results of operations.
Item 1B. Unresolved Staff Comments
None.
31
We maintain our principal offices in Ventura, California, totaling approximately 25,000 square feet, under two leases that expire in September 2020 and February 2022. We also lease offices in various cities within the U.S., Europe, Asia and Australia. We believe that our facilities are adequate to meet our needs for the immediate future and that, should it be needed, we will be able to secure additional space to accommodate expansion of our operations.
We are not currently a party to any legal proceedings, litigation or claims, which, if determined adversely to us, would have a material adverse effect on our business, operating results, financial condition or cash flows. We may from time to time, be party to litigation and subject to claims incident to the ordinary course of business. Regardless of the outcome, litigation can have an adverse impact on us because of defense and settlement costs, diversion of management resources and other factors.
Item 4. Mine Safety Disclosures
Not applicable.
32
Item 5. Market for Registrant’s Common Equity, Related Stockholder Matters and Issuer Purchases of Equity Securities
Our Class A common stock began trading on the NASDAQ Global Market on September 21, 2016 under the symbol “TTD”. Prior to this date, there was no public trading market for our Class A common stock. There is no public trading market for our Class B common stock. The following table sets forth, for the indicated periods, the intraday high and low sales prices per share of our Class A common stock as reported on the NASDAQ Global Market.
|
|
|
High |
|
|
Low |
|
||
|
Year Ended December 31, 2016 |
|
|
|
|
|
|
|
|
|
Third quarter (commencing September 21, 2016) |
|
$ |
33.40 |
|
|
$ |
26.84 |
|
|
Fourth quarter |
|
$ |
31.43 |
|
|
$ |
22.00 |
|
|
|
|
|
|
|
|
|
|
|
|
Year Ended December 31, 2017 |
|
|
|
|
|
|
|
|
|
First quarter |
|
$ |
46.21 |
|
|
$ |
26.40 |
|
|
Second quarter |
|
$ |
57.57 |
|
|
$ |
35.04 |
|
|
Third quarter |
|
$ |
62.86 |
|
|
$ |
46.49 |
|
|
Fourth quarter |
|
$ |
67.30 |
|
|
$ |
43.44 |
|
As of January 31, 2018, there were approximately 14 holders of record of our Class A common stock and 46 holders of record of our Class B common stock. The actual number of stockholders is greater than this number of record holders and includes stockholders who are beneficial owners but whose shares are held in street name by brokers and other nominees. This number of holders also does not include stockholders whose shares may be held in trust by other entities.
Dividend Policy
We have never declared or paid any dividends on our Class A or Class B common stock, and we do not anticipate paying any cash dividends in the foreseeable future. We currently intend to retain any earnings to finance the operation and expansion of our business. Any future determination to pay dividends will be at the discretion of our board of directors and will be dependent upon then-existing conditions, including our earnings, capital requirements, results of operations, financial condition, business prospects and other factors that our board of directors considers relevant. See “Item 7. Management’s Discussion and Analysis of Financial Condition and Results of Operations” for additional information regarding our financial condition. In addition, our credit facility contains restrictions on our ability to pay dividends.
Purchases of Equity Securities by the Issuer and Affiliated Purchasers
None.
Recent Sales of Unregistered Securities
None.
Stock Performance Graph
This performance graph shall not be deemed “soliciting material” or to be “filed” with the SEC for purposes of Section 18 of the Exchange Act, or otherwise subject to the liabilities under that Section, and shall not be deemed to be incorporated by reference into any filing of ours under the Securities Act of 1933, as amended, except as shall be expressly set forth by specific reference in such filing.
33
The following graph compares the cumulative total stockholder return on an initial investment of $100 in our Class A common stock between September 21, 2016 (our initial trading day) and December 31, 2017, with the comparative cumulative total returns of the Standard & Poor’s (S&P) 500 Index, Russell 2000 Index and NASDAQ 100 Index over the same period. As previously discussed, we have not paid any cash dividends and, therefore, the cumulative total return calculation for us is based solely upon stock price appreciation (depreciation) and not reinvestment of cash dividends, whereas the data for the S&P 500 Index, Russell 2000 Index and NASDAQ 100 Index assumes reinvestments of dividends. The graph assumes the closing market price on September 21, 2016 of $30.10 per share as the initial value of our Class A common stock. The returns shown are based on historical results and are not necessarily indicative of, nor intended to forecast, future stock price performance. For the fiscal year 2017, we added the NASDAQ 100 Index because the companies which comprise the NASDAQ 100 index align with our growing business.
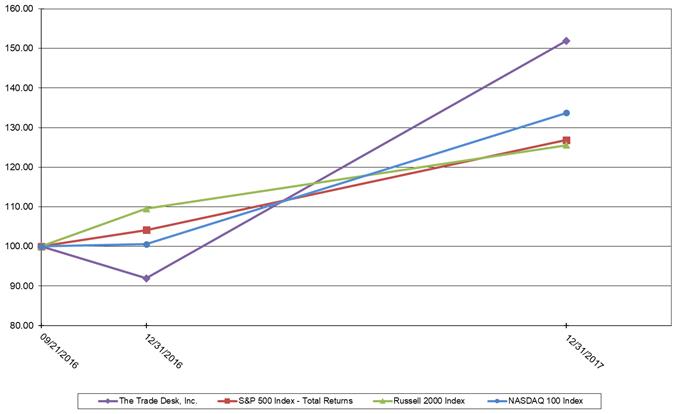
34
Item 6. Selected Financial Data
The following tables set forth our selected consolidated financial data for the periods indicated. We have derived the selected consolidated statements of operations data for 2015, 2016, and 2017 and the selected consolidated balance sheet data as of December 31, 2016 and 2017 from our audited consolidated financial statements included elsewhere in this Annual Report on Form 10-K. The selected consolidated statements of operations data for 2014 and the selected consolidated balance sheet data as of December 31, 2014 and 2015 were derived from our audited consolidated financial statements that are not included in this Annual Report on Form 10-K.
The following selected consolidated financial data should be read in conjunction with “Item 7. Management’s Discussion and Analysis of Financial Condition and Results of Operations” and our consolidated financial statements and the related notes appearing in “Item 8. Financial Statements and Supplementary Data” in this Annual Report on Form 10-K. Our historical results are not necessarily indicative of our future results.
|
|
|
Year Ended December 31, |
|
|||||||||||||
|
|
|
2014 |
|
|
2015 |
|
|
2016 |
|
|
2017 |
|
||||
|
|
|
(in thousands, except per share data) |
|
|||||||||||||
|
Consolidated Statements of Operations Data: |
|
|
|
|
|
|
|
|
|
|
|
|
|
|
|
|
|
Revenue |
|
$ |
44,548 |
|
|
$ |
113,836 |
|
|
$ |
202,926 |
|
|
$ |
308,217 |
|
|
Operating expenses (1): |
|
|
|
|
|
|
|
|
|
|
|
|
|
|
|
|
|
Platform operations |
|
|
12,559 |
|
|
|
22,967 |
|
|
|
39,876 |
|
|
|
66,230 |
|
|
Sales and marketing |
|
|
14,590 |
|
|
|
26,794 |
|
|
|
46,056 |
|
|
|
61,379 |
|
|
Technology and development |
|
|
7,250 |
|
|
|
12,819 |
|
|
|
27,313 |
|
|
|
52,806 |
|
|
General and administrative |
|
|
9,385 |
|
|
|
13,276 |
|
|
|
32,163 |
|
|
|
58,446 |
|
|
Total operating expenses |
|
|
43,784 |
|
|
|
75,856 |
|
|
|
145,408 |
|
|
|
238,861 |
|
|
Income from operations |
|
|
764 |
|
|
|
37,980 |
|
|
|
57,518 |
|
|
|
69,356 |
|
|
Total other expense, net |
|
|
1,707 |
|
|
|
8,125 |
|
|
|
13,684 |
|
|
|
5,731 |
|
|
Income (loss) before income taxes |
|
|
(943 |
) |
|
|
29,855 |
|
|
|
43,834 |
|
|
|
63,625 |
|
|
Provision for (benefit from) income taxes |
|
|
(948 |
) |
|
|
13,926 |
|
|
|
23,352 |
|
|
|
12,827 |
|
|
Net income |
|
$ |
5 |
|
|
$ |
15,929 |
|
|
$ |
20,482 |
|
|
$ |
50,798 |
|
|
Net income (loss) attributable to common stockholders (2) |
|
$ |
— |
|
|
$ |
8,764 |
|
|
$ |
(26,727 |
) |
|
$ |
50,798 |
|
|
Net income (loss) per share attributable to common stockholders–basic (2) |
|
$ |
— |
|
|
$ |
0.85 |
|
|
$ |
(1.46 |
) |
|
$ |
1.26 |
|
|
Net income (loss) per share attributable to common stockholders–diluted (2) |
|
$ |
— |
|
|
$ |
0.39 |
|
|
$ |
(1.46 |
) |
|
$ |
1.15 |
|
|
|
|
Year Ended December 31, |
|
|||||||||||||
|
|
|
2014 |
|
|
2015 |
|
|
2016 |
|
|
2017 |
|
||||
|
|
|
(in thousands) |
|
|||||||||||||
|
Non-GAAP Financial and Operating Data: |
|
|
|
|
|
|
|
|
|
|
|
|
|
|
|
|
|
Gross spend (3) |
|
$ |
211,266 |
|
|
$ |
552,325 |
|
|
$ |
1,027,984 |
|
|
$ |
1,555,856 |
|
|
Gross billings (4) |
|
$ |
201,804 |
|
|
$ |
529,975 |
|
|
$ |
990,561 |
|
|
$ |
1,491,742 |
|
|
|
|
As of December 31, |
|
|
|||||||||||||
|
|
|
2014 |
|
|
2015 |
|
|
2016 |
|
|
2017 |
|
|
||||
|
|
|
(in thousands) |
|
|
|||||||||||||
|
Consolidated Balance Sheet Data: |
|
|
|
|
|
|
|
|
|
|
|
|
|
|
|
|
|
|
Cash and cash equivalents |
|
$ |
17,315 |
|
|
$ |
4,047 |
|
|
$ |
133,400 |
|
|
$ |
155,950 |
|
|
|
Accounts receivable, net |
|
|
78,364 |
|
|
|
191,943 |
|
|
|
377,240 |
|
|
|
599,565 |
|
|
|
Total assets |
|
|
102,238 |
|
|
|
210,231 |
|
|
|
537,596 |
|
|
|
797,164 |
|
|
|
Accounts payable |
|
|
58,293 |
|
|
|
108,461 |
|
|
|
321,163 |
|
|
|
490,377 |
|
|
|
Long-term debt, net of current portion |
|
|
16,493 |
|
|
|
45,918 |
|
|
|
25,847 |
|
|
|
27,000 |
|
(5) |
|
Total liabilities |
|
|
80,372 |
|
|
|
171,885 |
|
|
|
373,216 |
|
|
|
551,581 |
|
|
|
Convertible preferred stock |
|
|
27,997 |
|
|
|
24,204 |
|
|
|
— |
|
|
|
— |
|
|
|
Total stockholders’ equity (deficit) |
|
|
(6,131 |
) |
|
|
14,142 |
|
|
|
164,380 |
|
|
|
245,583 |
|
|
|
(1) |
Includes stock-based compensation expense as follows: |
35
|
|
|
Year Ended December 31, |
|
|||||||||||||
|
|
|
2014 |
|
|
2015 |
|
|
2016 |
|
|
2017 |
|
||||
|
|
|
(in thousands) |
|
|||||||||||||
|
Platform operations |
|
$ |
14 |
|
|
$ |
71 |
|
|
$ |
756 |
|
|
$ |
2,674 |
|
|
Sales and marketing |
|
|
50 |
|
|
|
127 |
|
|
|
1,707 |
|
|
|
6,261 |
|
|
Technology and development |
|
|
909 |
|
|
|
85 |
|
|
|
1,513 |
|
|
|
6,661 |
|
|
General and administrative |
|
|
3,572 |
|
|
|
91 |
|
|
|
1,080 |
|
|
|
5,721 |
|
|
Total |
|
$ |
4,545 |
|
|
$ |
374 |
|
|
$ |
5,056 |
|
|
$ |
21,317 |
|
See Note 10 to our audited consolidated financial statements for more information regarding stock-based compensation expense.
|
(2) |
See Note 3 to our audited consolidated financial statements for a description of the net income (loss) attributable to common stockholders and net income (loss) per share attributable to common stockholders—basic and diluted computations. |
|
(3) |
Gross spend includes the value of a client’s purchases through our platform plus our platform fee, which is a percentage of a client’s purchases through the platform. We review gross spend for internal management purposes to assess market share and scale, and to plan for optimal levels of support for our clients. Some companies in our industry report revenue on a gross basis or use similar metrics, so tracking our gross spend allows us to compare our results to the results of those companies. Gross spend does not represent our revenue reported on a GAAP basis. Our gross spend is influenced by the volume and characteristics of bids for advertising inventory won through our platform. We expect our revenue as a percentage of gross spend, which is sometimes referred to as take rate, to fluctuate due to the types of services and features selected by our clients through our platform and certain volume discounts. We track gross spend based on the location of our office servicing the respective clients. Other companies, including companies in our industry, may calculate gross spend or similarly titled measures differently, which reduces its usefulness as a comparative measure. |
|
(4) |
Gross billings represents the amount we invoice our clients, net of allowances. As some of our clients have payment relationships directly with advertising inventory suppliers for the amount of advertising inventory the clients purchase through our platform, we do not invoice these clients for this spend, and we only invoice such clients for data, other services and our platform fee. Accordingly, gross billings are less than gross spend and represent gross spend, less platform discounts and less the value of advertising inventory and data that our clients purchase directly from publishers through our platform. We report revenue on a net basis which represents gross billings net of amounts we pay suppliers for the cost of advertising inventory, data and add-on features. We expect our revenue as a percentage of gross billings to fluctuate due to the types of services and features selected by our clients through our platform and certain volume discounts. We review gross billings for internal management purposes to adequately plan for our working capital needs and monitor collection risk. We track gross billings based on the billing address of the client. In many cases, international clients are serviced from our U.S. offices resulting in gross billings exceeding gross spend for international clients. |
|
(5) |
In January 2018, we repaid the outstanding principal and accrued interest. |
36
Item 7. Management’s Discussion and Analysis of Financial Condition and Results of Operations
You should read the following discussion and analysis of our financial condition and results of operations together with the consolidated financial statements and the related notes to those statements included in Item 8 to this Annual Report on Form 10-K. In addition to historical financial information, the following discussion contains forward-looking statements that reflect our plans, estimates, beliefs, and expectations, and involve risks and uncertainties. Factors that could cause or contribute to these differences include those discussed below and elsewhere in this Annual Report on Form 10-K, particularly in the section titled “Item 1A. Risk Factors” and the “Special Note About Forward-Looking Statements”.
References to “Notes” are notes included in our consolidated financial statements appearing elsewhere in this Annual Report on Form 10-K.
Overview
We are a global technology company that empowers ad buyers by providing a self-service omnichannel software platform that enables our clients to purchase and manage data-driven digital advertising campaigns. Our platform allows clients to manage integrated advertising campaigns across various advertising channels and formats, including connected TV (CTV), mobile, video, audio, display, social and native, on a multitude of devices, including smart TVs, computers, and various mobile devices including phones and tablets.
We commercially launched our platform in 2011 targeting display advertising. We have since extended our platform to address additional advertising formats, and in 2017, approximately 62% of gross spend on our platform was for mobile, video, audio, social, and native.
Our clients are the advertising agencies and other service providers for advertisers, with whom we enter into ongoing master services agreements, or MSAs. We generate revenue by charging our clients a platform fee based on a percentage of a client’s total spend on advertising, data and other features through our platform.
Highlights
For the years ended December 31, 2016 and 2017:
|
|
• |
our revenue was $202.9 million and $308.2 million, respectively, representing an increase of 52%; and |
|
|
• |
our net income was $20.5 million and $50.8 million, respectively. |
Trends, Opportunities and Challenges
The growing digitization of media and fragmentation of audiences has increased the complexity of advertising, and thereby increased the need for automation in ad buying, which we provide on our platform. In order to grow, we will need to continue to develop our platform’s programmatic capabilities and advertising inventory. We believe that key opportunities include our ongoing global expansion, continuing development of our CTV, native, audio and video ad inventory, and continuing development of our data usage and advertising targeting capabilities.
We believe that growth of the programmatic advertising market is important for our ability to grow our business. Adoption of programmatic advertising by advertisers allows us to acquire new clients and grow revenue from existing clients. Although our clients include some of the largest advertising agencies in the world, we believe there is significant room for us to expand further within these clients and gain a larger amount of their advertising spend through our platform. We also believe that the industry trends noted above will lead to advertisers adopting programmatic advertising through platforms such as ours.
Similarly, the adoption of programmatic advertising by inventory owners and content providers allows us to expand the volume and type of advertising inventory that we present to our clients. For example, we have expanded our CTV, native and audio advertising offerings through our recent integrations with supply-side partners.
37
We plan to invest for long-term growth. We anticipate that our operating expenses will increase significantly in the foreseeable future as we invest in platform operations and technology and development to enhance our product features, including programmatic buying of CTV ad inventory, and in sales and marketing to acquire new clients and reinforce our relationships with existing clients. In addition, we expect to continue making investments in our infrastructure, including our information technology, financial and administrative systems and controls, to support our operations.
In addition, we believe the markets outside of the U.S. offer an opportunity for growth, and we intend to make additional investments in sales and marketing and product development to expand in these markets, including China, where we are making significant investments in launching our platform and growing our team.
We believe that these investments will contribute to our long-term growth, although they may negatively impact profitability in the near term.
Our business model has allowed us to grow significantly, and we believe that our operating leverage enables us to support future growth profitably.
Factors Affecting Our Performance
Growth in and Retention of Client Spend
Our recent growth has been driven by expanding our share of spend by our existing clients and adding new clients. Our clients include some of the largest advertising agencies in the world, and we believe there is significant room for us to expand further within these clients. As a result, future revenue growth depends upon our ability to retain our existing clients and to gain a larger amount of their advertising spend through our platform.
In order to analyze the contribution to the growth of our business driven by the increase in gross spend from existing clients, we measure annual gross spend for the set of clients, or cohort, that commenced spending on our platform in a specific year relative to subsequent periods. The gross spend from each of our cohorts has increased over subsequent periods. However, over time we will likely lose clients from each cohort, clients may spend less on our platform and the growth rate of gross spend may change. Any such change could have a significant negative impact on gross spend and operating results.
Ability to Expand our Omnichannel Reach, Including CTV and Digital Radio
We enable the purchase of advertising inventory in a wide variety of formats. Although display advertising represented 38% of our gross spend in 2017, non-display advertising such as mobile, video and social are significant and increasing components of our gross spend. Our future growth will depend on our ability to maintain and grow the inventory of, and spend on, other channels. In addition, we believe that our ability to integrate and offer CTV and digital radio advertising inventory for purchase through our platform, and in particular our ability to manage the increased costs that will accompany these purchases, will impact the future growth of our business.
Growth of the Programmatic Advertising Market
Our operating results and prospects will be impacted by the overall adoption of programmatic advertising by inventory owners and content providers, as well as advertisers and the agencies and service providers that represent them. Programmatic advertising has grown rapidly in recent years, and any acceleration, or slowing, of this growth would affect our operating and financial performance. In addition, even if the programmatic advertising market continues to grow at its current rate, our ability to position ourselves within the market will impact the future growth of our business.
Development of International Markets
We have been increasing our focus on markets outside the U.S. to serve the global needs of our clients. We believe that the global opportunity for programmatic advertising is significant due to the growing middle class abroad, and should continue to expand as publishers and advertisers outside the U.S. seek to adopt the benefits that programmatic advertising provides. To capitalize on this opportunity, we intend to continue investing in our presence internationally, and we expect our growth internationally to continue outpacing our domestic growth. Our growth and the success of our initiatives in newer markets will depend on the continued adoption of our platform by our existing clients, as well as new clients, in these markets. Information about geographic gross billings is set forth in Note 12 to our audited consolidated financial statements included elsewhere in this Annual Report on Form 10-K.
38
In the advertising industry, companies commonly experience seasonal fluctuations in revenue. For example, many advertisers allocate the largest portion of their budgets to the fourth quarter of the calendar year in order to coincide with increased holiday purchasing. Historically, the fourth quarter of the year reflects our highest level of advertising activity and the first quarter reflects the lowest level of such activity. We expect our revenue to continue to fluctuate based on seasonal factors that affect the advertising industry as a whole, and events such as the U.S. election cycle and the Olympics.
Components of Our Results of Operations
We have one primary business activity and operate in one operating and reportable segment.
Revenue
We generate revenue from clients who enter into agreements with us to use our platform to purchase advertising inventory, data and other add-on features.
We report revenue on a net basis which represents gross billings net of amounts we pay suppliers for the cost of advertising inventory, data and add-on features. Our accounts receivable are recorded at the amount of gross billings to clients, net of allowances, for the amounts we are responsible to collect, and our accounts payable are recorded at the amount payable to suppliers. Accordingly, both accounts receivable and accounts payable appear large in relation to revenue reported on a net basis.
Revenue as a percentage of gross spend may fluctuate from period to period due to a number of factors, such as changes in the proportion of spend represented by our larger customers with the lowest platform fees, our clients’ use of platform features and volume discounts. We expect that our revenue as a percentage of gross spend will fluctuate in the future, especially as we introduce and as our clients select new platform features, expand our omnichannel capabilities, extend our reach to TV inventory and add additional clients whose businesses may have different underlying business models.
See “Critical Accounting Policies and Estimates—Revenue Recognition” below for a description of our revenue recognition policies.
Operating Expenses
We classify our operating expenses into the following four categories:
Platform Operations. Platform operations expense consists of expenses related to hosting our platform, which includes “internet traffic” associated with the viewing of available impressions or queries per second (QPS) and providing support to our clients. Platform operations expense includes hosting costs, personnel costs, and amortization of acquired technology and capitalized software costs for the development of our platform, including allocated overhead. Personnel costs included in platform operations include salaries, bonuses, stock-based compensation, and employee benefit costs, and are primarily attributable to personnel who provide our clients with support using our platform and the network operations group that supports our platform. We capitalize certain costs associated with the development of our platform and amortize these costs in platform operations over their estimated useful lives. We allocate overhead such as information technology infrastructure, rent and occupancy charges based on headcount.
We expect platform operations expenses to increase in absolute dollars in future periods as we continue to experience increased volumes of QPS through our platform and hire additional personnel to support our clients.
Sales and Marketing. Sales and marketing expense consists primarily of personnel costs, including salaries, bonuses, stock-based compensation, employee benefits costs and commission costs for our sales and marketing personnel. Sales and marketing expense also includes costs for market development programs, advertising, promotional and other marketing activities, and allocated overhead. We allocate overhead such as information technology infrastructure, rent and occupancy charges based on headcount. Commissions costs are expensed as incurred.
Our sales organization focuses on marketing our platform to increase its adoption by existing and new clients. We are also focused on expanding our international business by growing our sales teams in countries in which we currently operate, as well as establishing a presence in additional countries. As a result, we expect sales and marketing expenses to increase in absolute dollars in future periods. Sales and marketing expense as a percentage of revenue may fluctuate from period to period based on revenue levels and the timing of our investments in our sales and marketing functions as these investments may vary in scope and scale over periods and are impacted by the revenue seasonality in our industry and business.
39
Technology and Development. Our technology and development expense consists primarily of personnel costs, including salaries, bonuses, stock-based compensation and employee benefits costs, third-party consultant costs associated with the ongoing development and maintenance of our platform, amortization of capitalized third-party software used in the development of our platform and allocated overhead. We allocate overhead such as information technology infrastructure, rent and occupancy charges based on headcount. Technology and development costs are expensed as incurred, except to the extent that such costs are associated with software development that qualifies for capitalization, which are then recorded as capitalized software development costs included in other assets, non-current on our consolidated balance sheet. We amortize capitalized software development costs relating to our platform to platform operations expense.
We believe that continued investment in our platform is critical to attaining our strategic objectives and long-term growth. We therefore expect technology and development expense to increase as we continue to invest in the development of our platform to support additional features and functions, increase the number of advertising and data inventory suppliers and ramp up the volume of advertising spending on our platform. Our development efforts also include additional platform functionality to support our international expansion. We also intend to invest in technology to further automate our business processes.
General and Administrative. Our general and administrative expense consists primarily of personnel costs, including salaries, bonuses, stock-based compensation, and employee benefits costs associated with our executive, finance, legal, human resources, compliance, and other administrative personnel, as well as accounting and legal professional services fees, bad debt expense and allocated overhead. We allocate overhead such as information technology infrastructure, rent and occupancy charges based on headcount.
We expect to continue to invest in corporate infrastructure to support growth. We expect general and administrative expenses to increase in absolute dollars in future periods.
Interest Expense. Interest expense is mainly related to our debt, which carries a variable interest rate.
Change in Fair Value of Convertible Preferred Stock Warrant Liabilities. Prior to our IPO, we had two outstanding warrants to purchase shares of our convertible preferred stock. These convertible preferred stock warrants were subject to re-measurement at each balance sheet date, and any change in fair value was recognized as a component of other expense, net. In connection with the closing of our IPO, the warrants converted into warrants to purchase shares of common stock and were net exercised by the holders. As a result, we no longer re-measure the value of warrants after our IPO.
Foreign Currency Exchange Loss, Net. Foreign currency exchange loss, net consists primarily of gains and losses on foreign currency transactions. We have foreign currency exposure related to our accounts receivable and, to a much lesser extent, accounts payable that are denominated in currencies other than the U.S. Dollar, principally the Euro, the Canadian Dollar, British Pound, Australian Dollar, Japanese Yen and Indonesian Rupiah.
The provision for income taxes consists primarily of federal, state, and foreign income taxes. Our income tax provision may be significantly affected by changes to our estimates for tax in jurisdictions in which we operate and other estimates utilized in determining the global effective tax rate. Actual results may also differ from our estimates based on changes in economic conditions. Such changes could have a substantial impact on the income tax provision. We reevaluate the judgments surrounding our estimates and make adjustments, as appropriate, each reporting period.
Our effective tax rate differs from the U.S. federal statutory income tax rate due to stock-based compensation, research and development tax credits, federal and foreign tax rate differences, state taxes, fair value adjustments associated with our warrant liabilities, and adjustments to our valuation allowance.
Realization of our deferred tax assets is dependent primarily on the generation of future taxable income. In considering the need for a valuation allowance, we consider our historical, as well as future, projected taxable income along with other objectively verifiable evidence. Objectively verifiable evidence includes our realization of tax attributes, assessment of tax credits and utilization of net operating loss carryforwards during the year.
In 2017, we released all of our valuation allowance previously established against our U.K. net deferred tax assets of $0.3 million. Our decision to release the valuation allowance on our U.K. deferred tax assets was due to, among other reasons, our three-year cumulative pre-tax income adjusted for permanent items realized in U.K. jurisdictions and significant forecasted U.K. taxable income.
40
On December 22, 2017, "H.R.1," known as the "Tax Cuts and Jobs Act," was signed into law. The primary impact of H.R.1 on our consolidated results from operations for the year ended December 31, 2017 and consolidated balance sheet as of December 31, 2017 was the revaluation of deferred taxes by $0.6 million resulting from the reduction in the U.S. federal corporate income tax rate from 35% to 21%. Given cumulative overseas deficits, no liability for foreign earnings and profits has been established.
Results of Operations
The following tables set forth our consolidated results of operations and our consolidated results of operations as a percentage of revenue for the periods presented:
|
|
|
For the year ended December 31, |
|
|||||||||
|
|
|
2015 |
|
|
2016 |
|
|
2017 |
|
|||
|
|
|
(in thousands) |
|
|||||||||
|
Revenue |
|
$ |
113,836 |
|
|
$ |
202,926 |
|
|
$ |
308,217 |
|
|
Operating expenses: |
|
|
|
|
|
|
|
|
|
|
|
|
|
Platform operations |
|
|
22,967 |
|
|
|
39,876 |
|
|
|
66,230 |
|
|
Sales and marketing |
|
|
26,794 |
|
|
|
46,056 |
|
|
|
61,379 |
|
|
Technology and development |
|
|
12,819 |
|
|
|
27,313 |
|
|
|
52,806 |
|
|
General and administrative |
|
|
13,276 |
|
|
|
32,163 |
|
|
|
58,446 |
|
|
Total operating expenses |
|
|
75,856 |
|
|
|
145,408 |
|
|
|
238,861 |
|
|
Income from operations |
|
|
37,980 |
|
|
|
57,518 |
|
|
|
69,356 |
|
|
Total other expense, net |
|
|
8,125 |
|
|
|
13,684 |
|
|
|
5,731 |
|
|
Income before income taxes |
|
|
29,855 |
|
|
|
43,834 |
|
|
|
63,625 |
|
|
Provision for income taxes |
|
|
13,926 |
|
|
|
23,352 |
|
|
|
12,827 |
|
|
Net income |
|
$ |
15,929 |
|
|
$ |
20,482 |
|
|
$ |
50,798 |
|
|
|
|
For the Year Ended December 31, |
|
|||||||||
|
|
|
2015 |
|
|
2016 |
|
|
2017 |
|
|||
|
|
(as a percentage of revenue*) |
|
||||||||||
|
Revenue |
|
|
100 |
% |
|
|
100 |
% |
|
|
100 |
% |
|
Operating expenses: |
|
|
|
|
|
|
|
|
|
|
|
|
|
Platform operations |
|
|
20 |
|
|
|
20 |
|
|
|
21 |
|
|
Sales and marketing |
|
|
24 |
|
|
|
23 |
|
|
|
20 |
|
|
Technology and development |
|
|
11 |
|
|
|
13 |
|
|
|
17 |
|
|
General and administrative |
|
|
12 |
|
|
|
16 |
|
|
|
19 |
|
|
Total operating expenses |
|
|
67 |
|
|
|
72 |
|
|
|
77 |
|
|
Income from operations |
|
|
33 |
|
|
|
28 |
|
|
|
23 |
|
|
Total other expense, net |
|
|
7 |
|
|
|
7 |
|
|
|
2 |
|
|
Income before income taxes |
|
|
26 |
|
|
|
22 |
|
|
|
21 |
|
|
Provision for income taxes |
|
|
12 |
|
|
|
12 |
|
|
|
4 |
|
|
Net income |
|
|
14 |
% |
|
|
10 |
% |
|
|
16 |
% |
|
* |
Percentages may not sum due to rounding. |
Comparison of the Years Ended December 31, 2015, 2016 and 2017
Revenue
|
|
|
Year Ended December 31, |
|
|
2016 vs 2015 Change |
|
|
2017 vs 2016 Change |
|
|||||||||||||||||||
|
|
|
2015 |
|
|
2016 |
|
|
2017 |
|
|
$ |
|
|
% |
|
|
$ |
|
|
% |
|
|||||||
|
|
|
(in thousands, except percentages) |
|
|||||||||||||||||||||||||
|
Revenue |
|
$ |
113,836 |
|
|
$ |
202,926 |
|
|
$ |
308,217 |
|
|
$ |
89,090 |
|
|
|
78 |
% |
|
$ |
105,291 |
|
|
|
52 |
% |
2016 Compared to 2015
The increase in revenue was primarily due to an 86% increase in gross spend on our platform. Gross spend on our platform by existing clients added prior to 2016 increased by 71% in the aggregate in 2016, and these existing clients represented approximately 91% of the total gross spend in 2016. In 2016, 55% of existing clients added prior to 2016 increased their gross spend on our platform and their average increase in gross spend was approximately $2.1 million.
41
The increase in revenue was primarily due to a 51% increase in gross spend on our platform. Gross spend on our platform by existing clients added prior to 2017 increased by 40% in the aggregate in 2017, and these existing clients represented approximately 91% of the total gross spend in 2017. In 2017, 59% of existing clients added prior to 2017 increased their gross spend on our platform and their average increase in gross spend was approximately $2.0 million.
Revenue as a percentage of gross spend in the aggregate may fluctuate from period to period based on our client mix and the extent to which clients utilize our platform’s features.
Platform Operations
|
|
|
Year Ended December 31, |
|
|
2016 vs 2015 Change |
|
|
2017 vs 2016 Change |
|
|||||||||||||||||||
|
|
|
2015 |
|
|
2016 |
|
|
2017 |
|
|
$ |
|
|
% |
|
|
$ |
|
|
% |
|
|||||||
|
|
|
(in thousands, except percentages) |
|
|||||||||||||||||||||||||
|
Platform operations |
|
$ |
22,967 |
|
|
$ |
39,876 |
|
|
$ |
66,230 |
|
|
$ |
16,909 |
|
|
|
74 |
% |
|
$ |
26,354 |
|
|
|
66 |
% |
|
Percent of revenue |
|
|
20 |
% |
|
|
20 |
% |
|
|
21 |
% |
|
|
|
|
|
|
|
|
|
|
|
|
|
|
|
|
2016 Compared to 2015
The increase in platform operations expense was primarily due to increases of $11.5 million in hosting costs and $4.2 million in personnel costs, including $0.7 million of stock-based compensation. The increase in hosting costs was primarily attributable to supporting the increased use of our platform by our clients. The increase in personnel costs was primarily due to an increase in headcount for our client support team.
2017 Compared to 2016
The increase in platform operations expense was primarily due to increases of $17.6 million in hosting costs, $6.6 million in personnel costs, including $1.9 million of stock-based compensation, and $1.3 million in allocated facilities costs. The increase in hosting costs was primarily attributable to supporting the increased use of our platform by our clients. The increase in personnel costs was primarily due to an increase in headcount for our client support team. The increase in allocated facilities costs was primarily driven by an increase in rent expense associated with new operating leases to support our growth.
We expect platform operations expenses to increase in absolute dollars in future periods as we continue to experience increased volumes of transactions through our platform and hire additional personnel to support our clients.
Sales and Marketing
|
|
|
Year Ended December 31, |
|
|
2016 vs 2015 Change |
|
|
2017 vs 2016 Change |
|
|||||||||||||||||||
|
|
|
2015 |
|
|
2016 |
|
|
2017 |
|
|
$ |
|
|
% |
|
|
$ |
|
|
% |
|
|||||||
|
|
|
(in thousands, except percentages) |
|
|||||||||||||||||||||||||
|
Sales and marketing |
|
$ |
26,794 |
|
|
$ |
46,056 |
|
|
$ |
61,379 |
|
|
$ |
19,262 |
|
|
|
72 |
% |
|
$ |
15,323 |
|
|
|
33 |
% |
|
Percent of revenue |
|
|
24 |
% |
|
|
23 |
% |
|
|
20 |
% |
|
|
|
|
|
|
|
|
|
|
|
|
|
|
|
|
2016 Compared to 2015
The increase in sales and marketing expense was primarily due to increases of $11.3 million in personnel costs, including $1.6 million of stock-based compensation, $5.2 million in marketing expenses and $2.5 million in allocated facilities costs. The increase in personnel costs was primarily due to an increase in sales and marketing headcount in order to support our sales efforts and to continue to develop and maintain relationships with our clients. The increase in overall marketing expenses was mainly related to our participation in industry events, tradeshows and related public relations activities. The increase in allocated facilities costs was primarily driven by an increase in rent expense associated with new operating leases to support our growth.
2017 Compared to 2016
The increase in sales and marketing expense was primarily due to increases of $15.6 million in personnel costs, including $4.6 million of stock-based compensation, and $2.4 million in allocated facilities costs, partially offset by a decrease of $2.8 million in marketing expenses. The increase in personnel costs was primarily due to an increase in sales and marketing headcount in order to support our sales efforts and to continue to develop and maintain relationships with our clients. The increase in allocated facilities costs was primarily driven by an increase in rent expense associated with new operating leases to support our growth. The decrease in marketing costs was mainly related to a shift in our participation in industry events, tradeshows and related public relations activities.
42
We expect sales and marketing expenses to increase in absolute dollars in future periods, as we focus on increasing the adoption of our platform with existing and new clients and expanding our international business.
Technology and Development
|
|
|
Year Ended December 31, |
|
|
2016 vs 2015 Change |
|
|
2017 vs 2016 Change |
|
|||||||||||||||||||
|
|
|
2015 |
|
|
2016 |
|
|
2017 |
|
|
$ |
|
|
% |
|
|
$ |
|
|
% |
|
|||||||
|
|
|
(in thousands, except percentages) |
|
|||||||||||||||||||||||||
|
Technology and development |
|
$ |
12,819 |
|
|
$ |
27,313 |
|
|
$ |
52,806 |
|
|
$ |
14,494 |
|
|
|
113 |
% |
|
$ |
25,493 |
|
|
|
93 |
% |
|
Percent of revenue |
|
|
11 |
% |
|
|
13 |
% |
|
|
17 |
% |
|
|
|
|
|
|
|
|
|
|
|
|
|
|
|
|
2016 Compared to 2015
The increase in technology and development expense was primarily due to increases of $10.1 million in personnel costs, including $1.4 million of stock-based compensation, $2.9 million in allocated facilities costs and $1.4 million in contractor and temporary staff costs. The increases in personnel costs and contractor and temporary staff costs were primarily attributable to increased headcount and use of contractor and temporary staff to maintain and support our technology and development efforts. The increase in allocated facilities costs was primarily driven by an increase in rent expense associated with new operating leases to support our growth.
2017 Compared to 2016
The increase in technology and development expense was primarily due to increases of $21.0 million in personnel costs, including $5.1 million of stock-based compensation, $3.5 million in allocated facilities costs and $1.0 million in contractor and temporary staff costs. The increases in personnel costs and contractor and temporary staff costs were primarily attributable to increased headcount and use of contractor and temporary staff to maintain and support our technology and development efforts. The increase in allocated facilities costs was primarily driven by an increase in rent expense associated with operating leases to support our growth.
We expect technology and development expense to increase in absolute dollars as we continue to invest in the development of our platform to support additional features and functions, increase the number of advertising and data inventory suppliers and ramp up the volume of advertising spending on our platform. We also intend to invest in technology to further automate our business processes.
General and Administrative
|
|
|
Year Ended December 31, |
|
|
2016 vs 2015 Change |
|
|
2017 vs 2016 Change |
|
|||||||||||||||||||
|
|
|
2015 |
|
|
2016 |
|
|
2017 |
|
|
$ |
|
|
% |
|
|
$ |
|
|
% |
|
|||||||
|
|
|
(in thousands, except percentages) |
|
|||||||||||||||||||||||||
|
General and administrative |
|
$ |
13,276 |
|
|
$ |
32,163 |
|
|
$ |
58,446 |
|
|
$ |
18,887 |
|
|
|
142 |
% |
|
$ |
26,283 |
|
|
|
82 |
% |
|
Percent of revenue |
|
|
12 |
% |
|
|
16 |
% |
|
|
19 |
% |
|
|
|
|
|
|
|
|
|
|
|
|
|
|
|
|
2016 Compared to 2015
The increase in general and administrative expense was primarily due to increases of $9.0 million in personnel costs, including $1.0 million of stock-based compensation, $4.9 million in professional services fees, $1.4 million in contractor and temporary staff costs and $1.3 million in bad debt expense. The increase in personnel costs and professional services fees was primarily related to finance and legal services to support our growth and in preparation for our IPO. The increase in contractor and temporary staff costs was primarily related to supplementing our finance headcount in preparation for our IPO. The increase in bad debt expense was primarily attributable to a reserve established for one client.
43
The increase in general and administrative expense was primarily due to increases of $18.1 million in personnel costs, including $4.6 million of stock-based compensation, $3.9 million in professional services fees, $2.4 million in bad debt expense and $1.9 million in allocated facilities costs. The increase in personnel costs was primarily related to finance, human resources and legal headcount to support our growth. The increase in bad debt expense was primarily attributable to specific client reserves. The increase in allocated facilities costs was primarily driven by an increase in rent expense associated with operating leases to support our growth. The increase in third-party professional services fees was primarily related to finance and legal services to support our growth, including $1.5 million in legal, accounting, printing and other costs related to the secondary offerings completed in March and June 2017.
We expect to continue to invest in corporate infrastructure to support growth. We expect general and administrative expenses to increase in absolute dollars in future periods.
Other Expense, Net
|
|
|
Year Ended December 31, |
|
|
2016 vs 2015 |
|
|
2017 vs 2016 |
|
|||||||||||
|
|
|
2015 |
|
|
2016 |
|
|
2017 |
|
|
$ Change |
|
|
$ Change |
|
|||||
|
|
|
(in thousands) |
|
|||||||||||||||||
|
Total other expense, net |
|
$ |
8,125 |
|
|
$ |
13,684 |
|
|
$ |
5,731 |
|
|
$ |
5,559 |
|
|
$ |
(7,953 |
) |
2016 Compared to 2015
The increase in other expense, net was primarily related to an increase in the fair value of our convertible preferred stock warrant liabilities of $3.5 million and an increase in interest expense of $1.9 million. The increase in the fair value of our convertible preferred stock warrant liabilities was primarily due to an increase in the valuation of our preferred stock. The increase in interest expense was primarily attributable to an increase in our debt borrowings and the liquidation fee of $0.8 million paid at the closing of our IPO related to our prior debt facility.
2017 Compared to 2016
The decrease in other expense, net was primarily due to decreases of $9.5 million in expense related to the fair value of our convertible preferred stock warrant liabilities, which were exercised as part of our IPO in September 2016, and $1.3 million in interest expense attributable to a reduction in our debt borrowings and the aforementioned liquidation fee. These decreases were partially offset by an increase in foreign currency exchange losses of $2.8 million resulting from higher foreign denominated accounts receivable and accounts payable balances in 2017 compared to 2016.
|
|
|
Year Ended December 31, |
|
|||||||||
|
|
|
2015 |
|
|
2016 |
|
|
2017 |
|
|||
|
|
|
(in thousands, except percentages) |
|
|||||||||
|
Provision for income taxes |
|
$ |
13,926 |
|
|
$ |
23,352 |
|
|
$ |
12,827 |
|
|
Effective tax rate |
|
|
46.6 |
% |
|
|
53.3 |
% |
|
|
20.2 |
% |
The difference between the effective tax rate in 2015 of 46.6% and the federal statutory income tax rate of 35% was mainly due to state taxes, net of federal benefit, and a change in the fair value of our warrant liabilities.
The difference between the effective tax rate in 2016 of 53.3% and the federal statutory income tax rate of 35% was primarily due to higher non-deductible preferred stock warrant expense and stock-based compensation expense.
The difference between the effective tax rate in 2017 of 20.2% and the federal statutory income tax rate of 35% was primarily due to discrete benefits of $19.9 million associated with disqualifying dispositions of incentive stock options, partially offset by the impact of higher pre-tax income in U.S. jurisdictions.
44
Quarterly Results of Operations
The following tables set forth our quarterly unaudited consolidated statements of operations data in dollars and as a percentage of total revenue for each of the eight quarters in the period ended December 31, 2017. We have prepared the quarterly unaudited consolidated statements of operations data on a basis consistent with the audited consolidated financial statements included in “Item 8. Financial Statements and Supplementary Data” of this Annual Report on Form 10-K. In the opinion of management, the financial information in these tables reflects all adjustments, consisting only of normal recurring adjustments, which management considers necessary for a fair statement of this data. This information should be read in conjunction with the audited consolidated financial statements and related notes included in “Item 8. Financial Statements and Supplementary Data” of this Annual Report on Form 10-K. The results of historical periods are not necessarily indicative of the results for any future period.
|
|
|
Three Months Ended |
|
|||||||||||||||||||||||||||||
|
|
|
Mar 31, |
|
|
Jun 30, |
|
|
Sept 30, |
|
|
Dec 31, |
|
|
Mar 31, |
|
|
Jun 30, |
|
|
Sept 30, |
|
|
Dec 31, |
|
||||||||
|
|
|
2016 |
|
|
2016 |
|
|
2016 |
|
|
2016 |
|
|
2017 |
|
|
2017 |
|
|
2017 |
|
|
2017 |
|
||||||||
|
|
|
(in thousands) |
|
|||||||||||||||||||||||||||||
|
Revenue |
|
$ |
30,378 |
|
|
$ |
47,182 |
|
|
$ |
52,956 |
|
|
$ |
72,410 |
|
|
$ |
53,352 |
|
|
$ |
72,804 |
|
|
$ |
79,413 |
|
|
$ |
102,648 |
|
|
Operating expenses: |
|
|
|
|
|
|
|
|
|
|
|
|
|
|
|
|
|
|
|
|
|
|
|
|
|
|
|
|
|
|
|
|
|
Platform operations |
|
|
7,513 |
|
|
|
8,682 |
|
|
|
10,422 |
|
|
|
13,259 |
|
|
|
12,549 |
|
|
|
15,151 |
|
|
|
17,397 |
|
|
|
21,133 |
|
|
Sales and marketing |
|
|
8,431 |
|
|
|
11,251 |
|
|
|
11,600 |
|
|
|
14,774 |
|
|
|
12,476 |
|
|
|
14,166 |
|
|
|
16,200 |
|
|
|
18,537 |
|
|
Technology and development |
|
|
4,639 |
|
|
|
5,763 |
|
|
|
7,292 |
|
|
|
9,619 |
|
|
|
10,461 |
|
|
|
12,135 |
|
|
|
13,181 |
|
|
|
17,029 |
|
|
General and administrative |
|
|
6,399 |
|
|
|
6,452 |
|
|
|
8,591 |
|
|
|
10,721 |
|
|
|
15,930 |
|
|
|
11,658 |
|
|
|
14,227 |
|
|
|
16,631 |
|
|
Total operating expenses |
|
|
26,982 |
|
|
|
32,148 |
|
|
|
37,905 |
|
|
|
48,373 |
|
|
|
51,416 |
|
|
|
53,110 |
|
|
|
61,005 |
|
|
|
73,330 |
|
|
Income from operations |
|
|
3,396 |
|
|
|
15,034 |
|
|
|
15,051 |
|
|
|
24,037 |
|
|
|
1,936 |
|
|
|
19,694 |
|
|
|
18,408 |
|
|
|
29,318 |
|
|
Total other expense, net |
|
|
5,264 |
|
|
|
1,260 |
|
|
|
6,087 |
|
|
|
1,073 |
|
|
|
792 |
|
|
|
1,303 |
|
|
|
2,354 |
|
|
|
1,282 |
|
|
Income (loss) before income taxes |
|
|
(1,868 |
) |
|
|
13,774 |
|
|
|
8,964 |
|
|
|
22,964 |
|
|
|
1,144 |
|
|
|
18,391 |
|
|
|
16,054 |
|
|
|
28,036 |
|
|
Provision for (benefit from) income taxes |
|
|
(828 |
) |
|
|
6,176 |
|
|
|
5,320 |
|
|
|
12,684 |
|
|
|
(3,765 |
) |
|
|
(458 |
) |
|
|
5,825 |
|
|
|
11,225 |
|
|
Net income (loss) |
|
$ |
(1,040 |
) |
|
$ |
7,598 |
|
|
$ |
3,644 |
|
|
$ |
10,280 |
|
|
$ |
4,909 |
|
|
$ |
18,849 |
|
|
$ |
10,229 |
|
|
$ |
16,811 |
|
|
Net income (loss) attributable to common stockholders |
|
$ |
(48,249 |
) |
|
$ |
2,392 |
|
|
$ |
972 |
|
|
$ |
10,280 |
|
|
$ |
4,909 |
|
|
$ |
18,849 |
|
|
$ |
10,229 |
|
|
$ |
16,811 |
|
|
Net income (loss) per share attributable to common stockholders: |
|
|
|
|
|
|
|
|
|
|
|
|
|
|
|
|
|
|
|
|
|
|
|
|
|
|
|
|
|
|
|
|
|
Basic |
|
$ |
(4.45 |
) |
|
$ |
0.22 |
|
|
$ |
0.08 |
|
|
$ |
0.27 |
|
|
$ |
0.13 |
|
|
$ |
0.47 |
|
|
$ |
0.25 |
|
|
$ |
0.41 |
|
|
Diluted |
|
$ |
(4.45 |
) |
|
$ |
0.15 |
|
|
$ |
0.06 |
|
|
$ |
0.24 |
|
|
$ |
0.11 |
|
|
$ |
0.43 |
|
|
$ |
0.23 |
|
|
$ |
0.38 |
|
The following table sets forth our unaudited consolidated results of operations for the specified periods as a percentage of our revenue for those periods.
|
|
|
Three Months Ended |
|
|||||||||||||||||||||||||||||
|
|
|
Mar 31, |
|
|
Jun 30, |
|
|
Sept 30, |
|
|
Dec 31, |
|
|
Mar 31, |
|
|
Jun 30, |
|
|
Sept 30, |
|
|
Dec 31, |
|
||||||||
|
|
|
2016 |
|
|
2016 |
|
|
2016 |
|
|
2016 |
|
|
2017 |
|
|
2017 |
|
|
2017 |
|
|
2017 |
|
||||||||
|
|
|
(as a percentage of revenue*) |
|
|||||||||||||||||||||||||||||
|
Revenue |
|
|
100 |
% |
|
|
100 |
% |
|
|
100 |
% |
|
|
100 |
% |
|
|
100 |
% |
|
|
100 |
% |
|
|
100 |
% |
|
|
100 |
% |
|
Operating expenses: |
|
|
|
|
|
|
|
|
|
|
|
|
|
|
|
|
|
|
|
|
|
|
|
|
|
|
|
|
|
|
|
|
|
Platform operations |
|
|
25 |
|
|
|
18 |
|
|
|
20 |
|
|
|
18 |
|
|
|
24 |
|
|
|
21 |
|
|
|
22 |
|
|
|
21 |
|
|
Sales and marketing |
|
|
28 |
|
|
|
24 |
|
|
|
22 |
|
|
|
20 |
|
|
|
23 |
|
|
|
19 |
|
|
|
20 |
|
|
|
18 |
|
|
Technology and development |
|
|
15 |
|
|
|
12 |
|
|
|
14 |
|
|
|
13 |
|
|
|
20 |
|
|
|
17 |
|
|
|
17 |
|
|
|
17 |
|
|
General and administrative |
|
|
21 |
|
|
|
14 |
|
|
|
16 |
|
|
|
15 |
|
|
|
30 |
|
|
|
16 |
|
|
|
18 |
|
|
|
16 |
|
|
Total operating expenses |
|
|
89 |
|
|
|
68 |
|
|
|
72 |
|
|
|
67 |
|
|
|
96 |
|
|
|
73 |
|
|
|
77 |
|
|
|
71 |
|
|
Income from operations |
|
|
11 |
|
|
|
32 |
|
|
|
28 |
|
|
|
33 |
|
|
|
4 |
|
|
|
27 |
|
|
|
23 |
|
|
|
29 |
|
|
Total other expense, net |
|
|
17 |
|
|
|
3 |
|
|
|
11 |
|
|
|
1 |
|
|
|
1 |
|
|
|
2 |
|
|
|
3 |
|
|
|
1 |
|
|
Income (loss) before income taxes |
|
|
(6 |
) |
|
|
29 |
|
|
|
17 |
|
|
|
32 |
|
|
|
2 |
|
|
|
25 |
|
|
|
20 |
|
|
|
27 |
|
|
Provision for (benefit from) income taxes |
|
|
(3 |
) |
|
|
13 |
|
|
|
10 |
|
|
|
18 |
|
|
|
(7 |
) |
|
|
(1 |
) |
|
|
7 |
|
|
|
11 |
|
|
Net income (loss) |
|
|
(3 |
)% |
|
|
16 |
% |
|
|
7 |
% |
|
|
14 |
% |
|
|
9 |
% |
|
|
26 |
% |
|
|
13 |
% |
|
|
16 |
% |
|
* |
Percentages may not sum due to rounding. |
45
Liquidity and Capital Resources
At December 31, 2017, we had cash and cash equivalents of $156.0 million, including cash of $15.1 million held by our international subsidiaries, and working capital of $247.3 million.
We believe our existing cash and cash equivalents, cash flow from operations, and our undrawn available balance under our amended credit facility (see the section captioned “Amended Revolving Credit Agreement” below) will be sufficient to meet our working capital requirements for at least the next 12 months. Our current credit facility matures in May 2022. Our future capital requirements and the adequacy of available funds will depend on many factors, including those set forth under “Risk Factors” within this Annual Report on Form 10-K.
In the future, we may attempt to raise additional capital through the sale of equity securities or through equity-linked or debt financing arrangements. If we raise additional funds by issuing equity or equity-linked securities, the ownership of our existing stockholders will be diluted. If we raise additional financing by the incurrence of additional indebtedness, we may be subject to increased fixed payment obligations and could also be subject to additional restrictive covenants, such as limitations on our ability to incur additional debt, and other operating restrictions that could adversely impact our ability to conduct our business. Any future indebtedness we incur may result in terms that could be unfavorable to equity investors.
There can be no assurances that we will be able to raise additional capital. The inability to raise capital would adversely affect our ability to achieve our business objectives. In addition, if our operating performance during the next 12 months is below our expectations, our liquidity and ability to operate our business could be adversely affected.
Amended Revolving Credit Agreement
On May 9, 2017, we, a syndicate of banks, led by Citibank, N.A., and Citibank, N.A., as agent, entered into an Amended and Restated Loan and Security Agreement, which we refer to as the Amended Revolving Credit Agreement. The Amended Revolving Credit Agreement, among other things, provides for an increase of $75.0 million in the aggregate principal amount of commitments available under our senior secured asset-based revolving credit facility, or Revolving Credit Facility, and provides us greater flexibility with respect to working capital, acquisitions and general corporate purposes. Available funding commitments under the Revolving Credit Facility, subject to certain conditions, total up to $200.0 million, with a $20.0 million sublimit for swingline borrowings and a $15.0 million sublimit for the issuance of letters of credit. Under certain circumstances, we have the right to increase the Revolving Credit Facility by an amount not to exceed $100.0 million. Any borrowings under the Revolving Credit Facility are due in full in May 2022. We may prepay the borrowings without penalty at any time. The Revolving Credit Agreement is collateralized by substantially all of our assets, including a pledge of certain of our accounts receivable, deposit accounts, intellectual property, investment property, and equipment, and availability under the Amended Revolving Credit Agreement is based on a percentage of eligible accounts receivable, as reduced by certain reserves. As of December 31, 2017, our outstanding principal balance under the Revolving Credit Facility was $27.0 million, and in January 2018, we repaid this balance.
For additional information regarding the Amended Revolving Credit Agreement, refer to Note 8—Debt.
Cash Flows
The following table summarizes our cash flows for the periods presented:
|
|
|
Year Ended December 31, |
|
|||||||||
|
|
|
2015 |
|
|
2016 |
|
|
2017 |
|
|||
|
|
|
(in thousands) |
|
|||||||||
|
Cash flows provided by (used in) operating activities |
|
$ |
(36,560 |
) |
|
$ |
75,031 |
|
|
$ |
31,224 |
|
|
Cash flows used in investing activities |
|
|
(6,376 |
) |
|
|
(9,221 |
) |
|
|
(16,064 |
) |
|
Cash flows provided by financing activities |
|
|
29,668 |
|
|
|
63,543 |
|
|
|
7,390 |
|
|
Increase (decrease) in cash and cash equivalents |
|
$ |
(13,268 |
) |
|
$ |
129,353 |
|
|
$ |
22,550 |
|
Operating Activities
Our cash flows from operating activities are primarily influenced by growth in our operations, increases or decreases in collections from our clients and related payments to our suppliers of advertising inventory and data. The timing of cash receipts from clients and payments to suppliers can significantly impact our cash flows from operating activities. We typically pay suppliers in advance of collections from our clients. Our collection and payment cycles can vary from period to period. In addition, we expect seasonality to impact cash flows from operating activities on a sequential quarter basis.
46
In 2015, cash used in operating activities of $36.6 million resulted from a net decrease in our working capital of $61.7 million, partially offset by our net income of $15.9 million and adjustments to add back non-cash expenses of $9.2 million. The net decrease in working capital was primarily related to an increase in accounts receivable of $114.2 million, partially offset by an increase in accounts payable of $50.0 million. The increase in accounts receivable was primarily due to the increase in spend through our platform and the timing of cash receipts from clients and the increase in accounts payable was primarily due to the timing of payments to suppliers.
In 2016, cash provided by operating activities of $75.0 million resulted from a net increase in our working capital of $33.8 million, net income of $20.5 million and adjustments to add back non-cash expenses of $20.7 million. The net increase in working capital was primarily related to an increase in accounts payable of $209.5 million, partially offset by an increase in accounts receivable of $187.7 million. The increase in accounts payable was primarily due to the increased volume of transactions with suppliers and an improvement in matching the timing of our supplier payments to contractual terms. The increase in accounts receivable was primarily due to the increase in spend through our platform and the timing of cash receipts from clients.
In 2017, cash provided by operating activities of $31.2 million resulted from a net decrease in our working capital of $49.5 million, partially offset by our net income of $50.8 million and adjustments to add back non-cash expenses of $29.9 million. The net decrease in working capital was primarily related to an increase in accounts receivable of $224.6 million, partially offset by an increase in accounts payable of $171.8 million. The increase in accounts receivable was primarily due to the increase in spend through our platform and the timing of cash receipts from clients and the increase in accounts payable was primarily due to the timing of payments to suppliers.
Our primary investing activities have consisted of purchases of property and equipment in support of our expanding headcount as a result of our growth, and capital expenditures to develop our software in support of enhancing our technology platform. Purchases of property and equipment may vary from period-to-period due to the timing of the expansion of our operations, the addition of headcount and the development cycles of our software development. As our business grows, we expect our capital expenditures and our investment activity to continue to increase.
In 2015, we used $6.4 million of cash in investing activities, consisting of $5.1 million to purchase property and equipment and $1.8 million of investments in capitalized software, partially offset by $0.6 million associated with the proceeds from the redemption of a short-term certificate of deposit.
In 2016, we used $9.2 million of cash in investing activities, consisting of $6.9 million to purchase property and equipment and $2.3 million of investments in capitalized software.
In 2017, we used $16.1 million of cash in investing activities, consisting of $10.1 million to purchase property and equipment, $3.0 million of investments in capitalized software, and $3.0 million for certain assets accounted for as a business acquisition.
Financing Activities
Our financing activities consisted primarily of proceeds from the issuance of convertible preferred stock, borrowings and repayments of our debt, proceeds from our equity compensation plans, and proceeds from the issuance of Class A common stock as part of our IPO. Net cash provided by financing activities has been and will be used to finance our operations, capital expenditures, platform development and rapid growth.
In 2015, cash provided by financing activities of $29.7 million was primarily due to proceeds from borrowings of $45.0 million, partially offset by repayments of prior borrowings of $15.0 million.
In 2016, cash provided by financing activities of $63.5 million was primarily driven by net proceeds from our IPO of $73.8 million, proceeds from our line of credit of $75.8 million and proceeds from the issuance of Series C convertible preferred stock of $60.0 million. Cash provided by these financing activities was partially offset by repayments on our line of credit and debt of $95.0 million and the repurchase of preferred and common stock of $54.0 million.
In 2017, cash provided by financing activities of $7.4 million was primarily due to proceeds from the employee stock purchase plan of $7.0 million and proceeds from stock option exercises of $2.6 million, partially offset by repayments under financing obligations of $1.0 million and taxes paid related to net settlement of restricted stock of $1.0 million.
47
Off-Balance Sheet Arrangements
We do not have any relationships with other entities or financial partnerships, such as entities often referred to as structured finance or special purpose entities that have been established for the purpose of facilitating off-balance sheet arrangements or other contractually narrow or limited purposes. We did not have any other off-balance sheet arrangements at December 31, 2017 other than operating leases and the indemnification agreements described in Note 13 of “Item 8. Financial Statements and Supplementary Data” in this Annual Report on Form 10-K.
Contractual Obligations and Known Future Cash Requirements
Our principal commitments consist of our debt obligations and non-cancelable leases for our various office facilities. In certain cases, the terms of the lease agreements provide for rental payments on a graduated basis.
The following table summarizes our contractual obligations, including interest, at December 31, 2017:
|
|
|
Payments Due by Period |
|
|||||||||||||||||
|
|
|
|
|
|
|
Less than |
|
|
1-3 |
|
|
3-5 |
|
|
More than |
|
||||
|
|
|
Total |
|
|
1 Year |
|
|
Years |
|
|
Years |
|
|
5 Years |
|
|||||
|
|
|
(in thousands) |
|
|||||||||||||||||
|
Debt obligations (1) |
|
$ |
31,185 |
|
|
$ |
961 |
|
|
$ |
1,925 |
|
|
$ |
28,299 |
|
|
$ |
— |
|
|
Operating lease obligations |
|
|
31,753 |
|
|
|
7,570 |
|
|
|
15,111 |
|
|
|
8,861 |
|
|
|
211 |
|
|
Other contractual commitments |
|
|
36,999 |
|
|
|
27,914 |
|
|
|
9,085 |
|
|
|
— |
|
|
|
— |
|
|
Total minimum payments |
|
$ |
99,937 |
|
|
$ |
36,445 |
|
|
$ |
26,121 |
|
|
$ |
37,160 |
|
|
$ |
211 |
|
|
(1) |
Includes $27.0 million of principal obligations pursuant to our revolving credit facility as of December 31, 2017. Our revolving credit facility matures in May 2022. Interest on the principal balance was estimated from January 1, 2018 to the maturity date using the LIBOR rate as of December 31, 2017 (1.6%) plus the applicable margin (2.0%). In January 2018, we repaid the outstanding principal and accrued interest in the aggregate amount of $27.1 million. |
As of December 31, 2017, our total amount of gross unrecognized tax benefits was $3.1 million before netting with deferred tax assets for tax credit carryforwards and is considered a long-term obligation. Due to their nature, there is a high degree of uncertainty regarding the time of future cash outflows and other events that extinguish these liabilities.
In the ordinary course of business, we enter into agreements in which we may agree to indemnify clients, suppliers, vendors, lessors, business partners, lenders, stockholders and other parties with respect to certain matters, including losses resulting from claims of intellectual property infringement, damages to property or persons, business losses, or other liabilities. Generally, these indemnity and defense obligations relate to our own business operations, obligations, and acts or omissions. However, under some circumstances, we agree to indemnify and defend contract counterparties against losses resulting from their own business operations, obligations, and acts or omissions, or the business operations, obligations, and acts or omissions of third parties. These indemnity provisions generally survive termination or expiration of the agreements in which they appear. In addition, we have entered into indemnification agreements with our directors, executive officers and other officers that will require us to indemnify them against liabilities that may arise by reason of their status or service as directors, officers or employees. No demands have been made upon us to provide indemnification under such agreements and there are no claims that we are aware of that could have a material effect on our consolidated financial statements.
Critical Accounting Policies and Estimates
Our consolidated financial statements are prepared in accordance with GAAP. The preparation of these consolidated financial statements requires us to make estimates and assumptions that affect the reported amounts of assets, liabilities, revenue, expenses and related disclosures. We evaluate our estimates and assumptions on an ongoing basis. Our estimates are based on historical experience and various other assumptions that we believe to be reasonable under the circumstances. Our actual results could differ from these estimates.
We believe that the assumptions and estimates associated with the evaluation of revenue recognition criteria, including the determination of revenue recognition as net versus gross in our revenue arrangements, the assumptions used in the valuation models to determine the fair value of stock options and stock-based compensation expense, and income taxes have the greatest potential impact on our consolidated financial statements. Therefore, we consider these to be our critical accounting policies and estimates.
48
We generate revenue from clients who enter into agreements with us to use our platform to purchase advertising inventory, data and other add-on features. We charge our clients a platform fee, which is a percentage of a client’s purchases through the platform. In addition, we invoice our clients for the cost of advertising inventory purchased, plus data and any add-on features purchased through the platform.
We generate revenue from buyers of advertising inventory through our platform. We maintain separate arrangements with each client and supplier in the form of MSAs, which set out the terms of the relationship and access to our platform. We recognize revenue when four basic criteria are met: (1) persuasive evidence of an arrangement exists; (2) delivery has occurred or services have been rendered; (3) the fees are fixed or determinable; and (4) collectability is reasonably assured. In applying the foregoing criteria, we recognize revenue upon the completion of a transaction, that is, when a bid is won, subject to satisfying these criteria.
Subsequent to a bid being won through our platform, the associated fees are generally not subject to adjustment or refund. Historically, any refunds and adjustments have not been material. We assess collectability based on a number of factors, including the creditworthiness of a client and related payment history. We generally bill buyers for the gross amount of advertising inventory, data or other add-on features they purchase through our platform plus our platform fees, although some of our clients have payment relationships directly with advertising inventory suppliers, in which case we only bill the clients for data, other services and our platform fees.
We report revenue net of amounts we pay suppliers for the cost of advertising inventory, data and add-on features in conformity with Accounting Standards Codification 605-45, Revenue Recognition—Principal Agent Considerations. The determination of whether we are the principal or agent, and hence whether to report revenue on a gross basis for the amount of the advertising inventory, third-party data and other add-on features the buyers purchase using the platform plus our platform fees or on a net basis for the amount of platform fees charged to the buyer, requires us to evaluate a number of indicators, none of which is presumptive or determinative. We determined that we are not the primary obligor for the purchase of advertising inventory, third-party data and other add-on features but rather the primary obligor to provide a platform that enables buyers to bid on advertising inventory, and use data and other add-on features in designing and executing their campaigns. We do not have pricing latitude with respect to cost of advertising inventory, third-party data and other add-on features purchased by clients through our platform. The fee we charge clients is a percentage of their spend through the platform, similar to a commission, and our fee is not contingent on the results of an advertising campaign. The client can select the advertising inventory supplier, third-party data and other add-on features through the platform. We have credit risk on the spend through our platform as we are required to pay suppliers irrespective of whether we collect from clients.
As a result of these and other factors, we have determined we are not the principal in the purchase and sale of advertising inventory, data and other add-on features in all of our arrangements and we therefore report revenue on a net basis for the fees we charge clients.
Stock-Based Compensation
Compensation expense related to stock options, restricted stock awards and units, which we refer to, collectively, as restricted stock, and awards granted under our employee stock purchase plan, or ESPP, is measured and recognized in our consolidated financial statements based on the fair value of the awards granted. The fair value of each option award is estimated on the grant date using the Black-Scholes option-pricing model. The fair value of restricted stock is calculated using the closing market price of our common stock on the date of grant. Stock-based compensation expense related to stock options and restricted stock is recognized on a straight-line basis over the requisite service periods of the awards, which is generally four years. Stock-based compensation expense for ESPP awards is recognized on a graded-vesting attribution basis over the requisite service period of each award.
Stock options granted to non-employees are accounted for at fair value determined by using the Black-Scholes option-pricing model. We believe that the fair value of the stock options is more reliably measured than the fair value of the services received. The fair value of the non-employee stock options is re-measured each period until a commitment date is reached, which is generally the vesting date.
Determining the fair value of stock options and ESPP awards requires judgment. Our use of the Black-Scholes option pricing model requires the input of subjective assumptions, including the fair value of the underlying common stock for periods prior to the completion of our IPO, the expected term of the option, the expected volatility of our common stock, risk-free interest rates, and the expected dividend yield of our common stock. The assumptions used in our option-pricing model represent our best estimates. These estimates involve inherent uncertainties and the application of our judgment. If factors change and different assumptions are used, our stock-based compensation expense could be materially different in the future.
49
These assumptions and estimates are as follows:
Fair Value of Common Stock. For stock options granted subsequent to our IPO and ESPP awards, the fair value of common stock is based on the closing price of our common stock as reported on the NASDAQ Global Market stock exchange on the grant date. Prior to our IPO, the board of directors determined the fair value of the common stock at the time of the grant of options by considering a number of objective and subjective factors including our actual operating and financial performance, market conditions and performance of comparable publicly traded companies, developments and milestones in our business, the likelihood of achieving a liquidity event and transactions involving our preferred or common stock, among other factors. The fair value was determined in accordance with applicable elements of the practice aid issued by the American Institute of Certified Public Accountants, Valuation of Privately Held Company Equity Securities Issued as Compensation.
Risk -Free Interest Rate. The risk-free interest rate is based on the yields of U.S. Treasury securities with maturities approximating the expected term of the awards.
Expected Term. Given insufficient historical data relating to stock option exercises, to determine the expected term, we apply the simplified approach, in which the expected term of an award is presumed to be the mid-point between the vesting date and the expiration date of the award. For ESPP awards, the expected term is the time period from the grant date to the respective purchase dates included within each offering period.
Volatility. Because we have a short trading history for our common stock, we determine the price volatility based on the historical volatilities of a publicly traded peer group based on daily price observations over a period equivalent to the expected term of the award, and during the year ended December 31, 2017, we began to include a blend of implied volatilities from our traded options.
Dividend Yield. The dividend yield assumption is based on our history and current expectations of dividend payouts. We have never declared or paid any cash dividends on our common stock and we do not anticipate paying any cash dividends in the foreseeable future, so we used an expected dividend yield of zero.
The following table summarizes the weighted-average assumptions used in the Black-Scholes option-pricing model to determine the fair value of our stock options:
|
|
|
Year Ended December 31, |
|
|||||||||
|
|
|
2015 |
|
|
2016 |
|
|
2017 |
|
|||
|
Expected term (in years) |
|
|
6.0 |
|
|
|
6.0 |
|
|
|
6.0 |
|
|
Expected volatility |
|
|
64.5 |
% |
|
|
58.1 |
% |
|
|
52.6 |
% |
|
Risk-free interest rate |
|
|
1.62 |
% |
|
|
1.62 |
% |
|
|
2.03 |
% |
|
Estimated dividend yield |
|
|
— |
% |
|
|
— |
% |
|
|
— |
% |
During the year ended December 31, 2016, we early adopted Accounting Standards Update, or ASU, No. 2016-09, Compensation—Stock Compensation (Topic 718): Improvements to Employee Share—Based Payment Accounting and changed our policy from estimating forfeitures to recording forfeitures when they occur. The impact of forfeitures on our historical consolidated financial statements was not material. However, since we account for forfeitures when they occur rather than estimating for the purposes of determining our stock-based compensation expense, our operating results may be impacted in the period in which significant forfeitures occur.
Income Taxes
Our income tax provision may be significantly affected by changes to our estimates for tax in jurisdictions in which we operate and other estimates utilized in determining the global effective tax rate. Actual results may also differ from our estimate based on changes in economic conditions. Such changes could have a substantial impact on the income tax provision. We reevaluate the judgments surrounding our estimates and make adjustments, as appropriate, each reporting period.
Deferred income tax assets and liabilities are determined based upon the net effects of the differences between the consolidated financial statements carrying amounts and the tax basis of assets and liabilities and are measured using the enacted tax rate expected to apply to taxable income in the years in which the differences are expected to be reversed. A valuation allowance is used to reduce some or all of the deferred tax assets if, based upon the weight of available evidence, it is more likely than not that those deferred tax assets will not be realized.
50
We recognize the tax benefit from an uncertain tax position only if it is more likely than not that the tax position will be sustained on examination by the taxing authorities, based on the technical merits of the position. The tax benefits recognized in the consolidated financial statements from such positions are then measured based on the largest benefit that has a greater than 50% likelihood of being realized. We recognize interest and penalties accrued related to our uncertain tax positions in our income tax provision in the accompanying consolidated statement of operations.
On December 22, 2017, "H.R.1," known as the "Tax Cuts and Jobs Act," was signed into law. The primary impact of H.R.1 on our consolidated results from operations for the year ended December 31, 2017 and consolidated balance sheet as of December 31, 2017 was the revaluation of deferred taxes by $0.6 million resulting from the reduction in the U.S. federal corporate income tax rate from 35% to 21%. Given cumulative overseas deficits, no liability for foreign earnings and profits has been established.
Recently Issued Accounting Pronouncements
For information regarding recent accounting pronouncements, refer to Note 2 of “Item 8. Financial Statements and Supplementary Data” included in this Annual Report on Form 10-K.
Item 7A. Quantitative and Qualitative Disclosure about Market Risk
We have operations both within the U.S. and internationally, and we are exposed to market risks in the ordinary course of our business. These risks include primarily interest rate, foreign currency exchange and inflation risks.
Interest Rate Risk
We are exposed to market risk from changes in interest rates on our credit facility, which accrues interest at a variable rate. We have not used any derivative financial instruments to manage our interest rate risk exposure. Based upon the principal balance owed on our revolving credit facility as of December 31, 2017, a hypothetical one percentage point increase or decrease in the interest rate under our revolving credit facility would result in a corresponding increase or decrease in interest expense of approximately $0.3 million annually.
Foreign Currency Exchange Risk
We have foreign currency risks related to our revenue and expenses denominated in currencies other than the U.S. Dollar, principally the Euro, the Canadian Dollar, British Pound, Australian Dollar, Japanese Yen and Indonesian Rupiah. The volatility of exchange rates depends on many factors that we cannot forecast with reliable accuracy. We have experienced and will continue to experience fluctuations in our net income as a result of transaction gains and losses related to translating cash balances, trade accounts receivable and payable balances that are denominated in currencies other than the U.S. Dollar. The effect of an immediate 10% adverse change in foreign exchange rates on foreign-denominated accounts at December 31, 2017, would result in a foreign currency loss of approximately $9.2 million. In the event our non-U.S. Dollar denominated sales and expenses increase, our operating results may be more greatly affected by fluctuations in the exchange rates of the currencies in which we do business.
From time to time we may enter into forward contracts or other derivative transactions in an attempt to hedge our foreign currency risk. There can be no assurance that such transactions will be effective in hedging some or all of our foreign currency exposures and under some circumstances could generate losses for us.
Inflation Risk
We do not believe that inflation has had a material effect on our business, financial condition or results of operations. If our costs were to become subject to significant inflationary pressures, we might not be able to fully offset such higher costs through price increases. Our inability or failure to do so could harm our business, financial condition and results of operations.
51
Item 8. Financial Statements and Supplementary Data
THE TRADE DESK, INC.
INDEX TO CONSOLIDATED FINANCIAL STATEMENTS
|
|
|
Page |
|
|
|
|
|
53 |
|
|
|
|
|
55 |
|
|
|
|
|
56 |
|
|
|
Consolidated Statements of Convertible Preferred Stock and Stockholders’ Equity (Deficit) |
|
|
57 |
|
|
|
|
58 |
|
|
|
|
|
59 |
|
|
The supplementary financial information required by this Item 8 is included in Item 7 under the caption “Quarterly Results of Operations,” which is incorporated herein by reference.
52
REPORT OF INDEPENDENT REGISTERED PUBLIC ACCOUNTING FIRM
To the Board of Directors and Stockholders of The Trade Desk, Inc.
Opinions on the Financial Statements and Internal Control over Financial Reporting
We have audited the accompanying consolidated balance sheets of The Trade Desk, Inc. and its subsidiaries as of December 31, 2017 and 2016, and the related consolidated statements of operations, of convertible preferred stock and stockholders’ equity (deficit) and of cash flows for each of the three years in the period ended December 31, 2017, including the related notes (collectively referred to as the “consolidated financial statements”). We also have audited the Company's internal control over financial reporting as of December 31, 2017, based on criteria established in Internal Control - Integrated Framework (2013) issued by the Committee of Sponsoring Organizations of the Treadway Commission (COSO).
In our opinion, the consolidated financial statements referred to above present fairly, in all material respects, the financial position of the Company as of December 31, 2017 and 2016, and the results of their operations and their cash flows for each of the three years in the period ended December 31, 2017 in conformity with accounting principles generally accepted in the United States of America. Also in our opinion, the Company did not maintain, in all material respects, effective internal control over financial reporting as of December 31, 2017, based on criteria established in Internal Control - Integrated Framework (2013) issued by the COSO because a material weakness in internal control over financial reporting related to an absence of information technology general controls over certain financially significant applications existed as of that date.
A material weakness is a deficiency, or a combination of deficiencies, in internal control over financial reporting, such that there is a reasonable possibility that a material misstatement of the annual or interim financial statements will not be prevented or detected on a timely basis. The material weakness referred to above is described in Management's Report on Internal Control over Financial Reporting appearing under Item 9A. We considered this material weakness in determining the nature, timing, and extent of audit tests applied in our audit of the 2017 consolidated financial statements, and our opinion regarding the effectiveness of the Company’s internal control over financial reporting does not affect our opinion on those consolidated financial statements.
Basis for Opinions
The Company's management is responsible for these consolidated financial statements, for maintaining effective internal control over financial reporting, and for its assessment of the effectiveness of internal control over financial reporting included in management's report referred to above. Our responsibility is to express opinions on the Company’s consolidated financial statements and on the Company's internal control over financial reporting based on our audits. We are a public accounting firm registered with the Public Company Accounting Oversight Board (United States) ("PCAOB") and are required to be independent with respect to the Company in accordance with the U.S. federal securities laws and the applicable rules and regulations of the Securities and Exchange Commission and the PCAOB.
We conducted our audits in accordance with the standards of the PCAOB. Those standards require that we plan and perform the audits to obtain reasonable assurance about whether the consolidated financial statements are free of material misstatement, whether due to error or fraud, and whether effective internal control over financial reporting was maintained in all material respects.
Our audits of the consolidated financial statements included performing procedures to assess the risks of material misstatement of the consolidated financial statements, whether due to error or fraud, and performing procedures that respond to those risks. Such procedures included examining, on a test basis, evidence regarding the amounts and disclosures in the consolidated financial statements. Our audits also included evaluating the accounting principles used and significant estimates made by management, as well as evaluating the overall presentation of the consolidated financial statements. Our audit of internal control over financial reporting included obtaining an understanding of internal control over financial reporting, assessing the risk that a material weakness exists, and testing and evaluating the design and operating effectiveness of internal control based on the assessed risk. Our audits also included performing such other procedures as we considered necessary in the circumstances. We believe that our audits provide a reasonable basis for our opinions.
53
Definition and Limitations of Internal Control over Financial Reporting
A company’s internal control over financial reporting is a process designed to provide reasonable assurance regarding the reliability of financial reporting and the preparation of financial statements for external purposes in accordance with generally accepted accounting principles. A company’s internal control over financial reporting includes those policies and procedures that (i) pertain to the maintenance of records that, in reasonable detail, accurately and fairly reflect the transactions and dispositions of the assets of the company; (ii) provide reasonable assurance that transactions are recorded as necessary to permit preparation of financial statements in accordance with generally accepted accounting principles, and that receipts and expenditures of the company are being made only in accordance with authorizations of management and directors of the company; and (iii) provide reasonable assurance regarding prevention or timely detection of unauthorized acquisition, use, or disposition of the company’s assets that could have a material effect on the financial statements.
Because of its inherent limitations, internal control over financial reporting may not prevent or detect misstatements. Also, projections of any evaluation of effectiveness to future periods are subject to the risk that controls may become inadequate because of changes in conditions, or that the degree of compliance with the policies or procedures may deteriorate.
/s/ PricewaterhouseCoopers LLP
Los Angeles, California
February 27, 2018
We have served as the Company’s auditor since 2015.
54
(In thousands, except par values)
|
|
|
As of December 31, |
|
|||||
|
|
|
2016 |
|
|
2017 |
|
||
|
ASSETS |
|
|
|
|
|
|
|
|
|
Current assets: |
|
|
|
|
|
|
|
|
|
Cash and cash equivalents |
|
$ |
133,400 |
|
|
$ |
155,950 |
|
|
Accounts receivable, net |
|
|
377,240 |
|
|
|
599,565 |
|
|
Prepaid expenses and other current assets |
|
|
5,763 |
|
|
|
10,298 |
|
|
TOTAL CURRENT ASSETS |
|
|
516,403 |
|
|
|
765,813 |
|
|
Property and equipment, net |
|
|
14,779 |
|
|
|
17,405 |
|
|
Deferred income taxes |
|
|
1,778 |
|
|
|
3,359 |
|
|
Other assets, non-current |
|
|
4,636 |
|
|
|
10,587 |
|
|
TOTAL ASSETS |
|
$ |
537,596 |
|
|
$ |
797,164 |
|
|
LIABILITIES AND STOCKHOLDERS’ EQUITY |
|
|
|
|
|
|
|
|
|
LIABILITIES |
|
|
|
|
|
|
|
|
|
Current liabilities: |
|
|
|
|
|
|
|
|
|
Accounts payable |
|
$ |
321,163 |
|
|
$ |
490,377 |
|
|
Accrued expenses and other current liabilities |
|
|
22,973 |
|
|
|
28,155 |
|
|
TOTAL CURRENT LIABILITIES |
|
|
344,136 |
|
|
|
518,532 |
|
|
Debt, net |
|
|
25,847 |
|
|
|
27,000 |
|
|
Other liabilities, non-current |
|
|
3,233 |
|
|
|
6,049 |
|
|
TOTAL LIABILITIES |
|
|
373,216 |
|
|
|
551,581 |
|
|
Commitments and contingencies (Note 13) |
|
|
|
|
|
|
|
|
|
STOCKHOLDERS’ EQUITY |
|
|
|
|
|
|
|
|
|
Preferred stock, par value $0.000001; 100,000 shares authorized, zero shares issued and outstanding as of December 31, 2016 and 2017 |
|
|
— |
|
|
|
— |
|
|
Common stock, par value $0.000001; 1,000,000 Class A shares authorized as of December 31, 2016 and 2017; 10,071 and 32,486 shares issued and outstanding as of December 31, 2016 and 2017, respectively; 95,000 Class B shares authorized as of December 31, 2016 and 2017; 29,060 and 9,155 shares issued and outstanding as of December 31, 2016 and 2017, respectively |
|
|
— |
|
|
|
— |
|
|
Additional paid-in capital |
|
|
179,198 |
|
|
|
209,603 |
|
|
Retained earnings (accumulated deficit) |
|
|
(14,818 |
) |
|
|
35,980 |
|
|
TOTAL STOCKHOLDERS’ EQUITY |
|
|
164,380 |
|
|
|
245,583 |
|
|
TOTAL LIABILITIES AND STOCKHOLDERS’ EQUITY |
|
$ |
537,596 |
|
|
$ |
797,164 |
|
The accompanying Notes to Consolidated Financial Statements are an integral part of these statements.
55
CONSOLIDATED STATEMENTS OF OPERATIONS
(In thousands, except per share amounts)
|
|
|
Year Ended December 31, |
|
|||||||||
|
|
|
2015 |
|
|
2016 |
|
|
2017 |
|
|||
|
Revenue |
|
$ |
113,836 |
|
|
$ |
202,926 |
|
|
$ |
308,217 |
|
|
Operating expenses: |
|
|
|
|
|
|
|
|
|
|
|
|
|
Platform operations |
|
|
22,967 |
|
|
|
39,876 |
|
|
|
66,230 |
|
|
Sales and marketing |
|
|
26,794 |
|
|
|
46,056 |
|
|
|
61,379 |
|
|
Technology and development |
|
|
12,819 |
|
|
|
27,313 |
|
|
|
52,806 |
|
|
General and administrative |
|
|
13,276 |
|
|
|
32,163 |
|
|
|
58,446 |
|
|
Total operating expenses |
|
|
75,856 |
|
|
|
145,408 |
|
|
|
238,861 |
|
|
Income from operations |
|
|
37,980 |
|
|
|
57,518 |
|
|
|
69,356 |
|
|
Interest expense |
|
|
1,141 |
|
|
|
3,075 |
|
|
|
1,791 |
|
|
Change in fair value of preferred stock warrant liabilities |
|
|
5,961 |
|
|
|
9,458 |
|
|
|
— |
|
|
Foreign currency exchange loss, net |
|
|
1,023 |
|
|
|
1,151 |
|
|
|
3,940 |
|
|
Total other expense, net |
|
|
8,125 |
|
|
|
13,684 |
|
|
|
5,731 |
|
|
Income before income taxes |
|
|
29,855 |
|
|
|
43,834 |
|
|
|
63,625 |
|
|
Provision for income taxes |
|
|
13,926 |
|
|
|
23,352 |
|
|
|
12,827 |
|
|
Net income |
|
$ |
15,929 |
|
|
$ |
20,482 |
|
|
$ |
50,798 |
|
|
Net income (loss) attributable to common stockholders |
|
$ |
8,764 |
|
|
$ |
(26,727 |
) |
|
$ |
50,798 |
|
|
Net income (loss) per share attributable to common stockholders: |
|
|
|
|
|
|
|
|
|
|
|
|
|
Basic |
|
$ |
0.85 |
|
|
$ |
(1.46 |
) |
|
$ |
1.26 |
|
|
Diluted |
|
$ |
0.39 |
|
|
$ |
(1.46 |
) |
|
$ |
1.15 |
|
|
Weighted average shares outstanding: |
|
|
|
|
|
|
|
|
|
|
|
|
|
Basic |
|
|
10,290 |
|
|
|
18,280 |
|
|
|
40,262 |
|
|
Diluted |
|
|
16,779 |
|
|
|
18,280 |
|
|
|
44,056 |
|
The accompanying Notes to Consolidated Financial Statements are an integral part of these statements.
56
CONSOLIDATED STATEMENTS OF CONVERTIBLE PREFERRED STOCK AND
STOCKHOLDERS’ EQUITY (DEFICIT)
(In thousands)
|
|
|
|
|
|
|
|
|
|
|
|
|
|
|
|
|
|
|
|
|
|
|
Retained |
|
|
Total |
|
||
|
|
|
Convertible |
|
|
Class A and B |
|
|
Additional |
|
|
Earnings |
|
|
Stockholders’ |
|
|||||||||||||
|
|
|
Preferred Stock |
|
|
Common Stock (1) |
|
|
Paid-In |
|
|
(Accumulated |
|
|
Equity |
|
|||||||||||||
|
|
|
Shares |
|
|
Amount |
|
|
Shares |
|
|
Amount |
|
|
Capital |
|
|
Deficit) |
|
|
(Deficit) |
|
|||||||
|
Balance as of December 31, 2014 |
|
|
66,330 |
|
|
$ |
27,997 |
|
|
|
10,166 |
|
|
$ |
— |
|
|
$ |
488 |
|
|
$ |
(6,619 |
) |
|
$ |
(6,131 |
) |
|
Modification to Series B participation rights |
|
|
— |
|
|
|
(3,793 |
) |
|
|
— |
|
|
|
— |
|
|
|
— |
|
|
|
3,793 |
|
|
|
3,793 |
|
|
Exercise of common stock options |
|
|
— |
|
|
|
— |
|
|
|
711 |
|
|
|
— |
|
|
|
166 |
|
|
|
— |
|
|
|
166 |
|
|
Issuance of common stock to employee |
|
|
— |
|
|
|
— |
|
|
|
7 |
|
|
|
— |
|
|
|
— |
|
|
|
— |
|
|
|
— |
|
|
Stock-based compensation |
|
|
— |
|
|
|
— |
|
|
|
— |
|
|
|
— |
|
|
|
385 |
|
|
|
— |
|
|
|
385 |
|
|
Net income |
|
|
— |
|
|
|
— |
|
|
|
— |
|
|
|
— |
|
|
|
— |
|
|
|
15,929 |
|
|
|
15,929 |
|
|
Balance as of December 31, 2015 |
|
|
66,330 |
|
|
|
24,204 |
|
|
|
10,884 |
|
|
|
— |
|
|
|
1,039 |
|
|
|
13,103 |
|
|
|
14,142 |
|
|
Exercise of common stock options |
|
|
— |
|
|
|
— |
|
|
|
785 |
|
|
|
— |
|
|
|
488 |
|
|
|
— |
|
|
|
488 |
|
|
Stock-based compensation |
|
|
— |
|
|
|
— |
|
|
|
— |
|
|
|
— |
|
|
|
5,144 |
|
|
|
— |
|
|
|
5,144 |
|
|
Issuance of series C convertible preferred stock, net of issuance costs |
|
|
11,501 |
|
|
|
59,871 |
|
|
|
— |
|
|
|
— |
|
|
|
— |
|
|
|
— |
|
|
|
— |
|
|
Reclassification of preferred stock warrant liability upon net exercise of warrant |
|
|
789 |
|
|
|
3,789 |
|
|
|
— |
|
|
|
— |
|
|
|
— |
|
|
|
— |
|
|
|
— |
|
|
Repurchase of convertible preferred stock |
|
|
(12,384 |
) |
|
|
(4,623 |
) |
|
|
— |
|
|
|
— |
|
|
|
(1,168 |
) |
|
|
(46,041 |
) |
|
|
(47,209 |
) |
|
Repurchase and retirement of common stock |
|
|
— |
|
|
|
— |
|
|
|
(189 |
) |
|
|
— |
|
|
|
— |
|
|
|
(2,362 |
) |
|
|
(2,362 |
) |
|
Issuance of Class A common stock upon IPO, net of underwriters’ commissions and offering costs of $10,366 |
|
|
— |
|
|
|
— |
|
|
|
4,667 |
|
|
|
— |
|
|
|
73,634 |
|
|
|
— |
|
|
|
73,634 |
|
|
Conversion of convertible preferred stock to Class B common stock in connection with IPO |
|
|
(66,236 |
) |
|
|
(83,241 |
) |
|
|
22,079 |
|
|
|
— |
|
|
|
83,241 |
|
|
|
— |
|
|
|
83,241 |
|
|
Conversion of warrant for convertible preferred stock to a warrant for Class B common stock in connection with IPO |
|
|
— |
|
|
|
— |
|
|
|
— |
|
|
|
— |
|
|
|
12,596 |
|
|
|
— |
|
|
|
12,596 |
|
|
Net exercise of warrant to purchase Class B common stock |
|
|
— |
|
|
|
— |
|
|
|
449 |
|
|
|
— |
|
|
|
— |
|
|
|
— |
|
|
|
— |
|
|
Issuance of common stock under employee stock purchase plan |
|
|
— |
|
|
|
— |
|
|
|
276 |
|
|
|
— |
|
|
|
4,224 |
|
|
|
— |
|
|
|
4,224 |
|
|
Grants of restricted stock |
|
|
— |
|
|
|
— |
|
|
|
180 |
|
|
|
— |
|
|
|
— |
|
|
|
— |
|
|
|
— |
|
|
Net income |
|
|
— |
|
|
|
— |
|
|
|
— |
|
|
|
— |
|
|
|
— |
|
|
|
20,482 |
|
|
|
20,482 |
|
|
Balance as of December 31, 2016 |
|
|
— |
|
|
|
— |
|
|
|
39,131 |
|
|
|
— |
|
|
|
179,198 |
|
|
|
(14,818 |
) |
|
|
164,380 |
|
|
Exercise of common stock options |
|
|
— |
|
|
|
— |
|
|
|
1,932 |
|
|
|
— |
|
|
|
2,565 |
|
|
|
— |
|
|
|
2,565 |
|
|
Stock-based compensation |
|
|
— |
|
|
|
— |
|
|
|
— |
|
|
|
— |
|
|
|
21,860 |
|
|
|
— |
|
|
|
21,860 |
|
|
Issuance of common stock under employee stock purchase plan |
|
|
— |
|
|
|
— |
|
|
|
433 |
|
|
|
— |
|
|
|
6,997 |
|
|
|
— |
|
|
|
6,997 |
|
|
Restricted stock, net of forfeitures and shares withheld for taxes |
|
|
— |
|
|
|
— |
|
|
|
145 |
|
|
|
— |
|
|
|
(1,017 |
) |
|
|
— |
|
|
|
(1,017 |
) |
|
Net income |
|
|
— |
|
|
|
— |
|
|
|
— |
|
|
|
— |
|
|
|
— |
|
|
|
50,798 |
|
|
|
50,798 |
|
|
Balance as of December 31, 2017 |
|
|
— |
|
|
$ |
— |
|
|
|
41,641 |
|
|
$ |
— |
|
|
$ |
209,603 |
|
|
$ |
35,980 |
|
|
$ |
245,583 |
|
|
(1) |
See Note 9-Capitalization for discussion of the establishment of the Company’s two classes of common stock and the reclassification of its common stock into Class B common stock prior to the Company’s initial public offering (“IPO”) in September 2016. |
The accompanying Notes to Consolidated Financial Statements are an integral part of these statements.
57
CONSOLIDATED STATEMENTS OF CASH FLOWS
(In thousands)
|
|
|
Year Ended December 31, |
|
|||||||||
|
|
|
2015 |
|
|
2016 |
|
|
2017 |
|
|||
|
OPERATING ACTIVITIES: |
|
|
|
|
|
|
|
|
|
|
|
|
|
Net income |
|
$ |
15,929 |
|
|
$ |
20,482 |
|
|
$ |
50,798 |
|
|
Adjustments to reconcile net income to net cash provided by (used in) operating activities: |
|
|
|
|
|
|
|
|
|
|
|
|
|
Depreciation and amortization |
|
|
1,828 |
|
|
|
3,798 |
|
|
|
7,209 |
|
|
Stock-based compensation |
|
|
374 |
|
|
|
5,056 |
|
|
|
21,317 |
|
|
Change in fair value of preferred stock warrant liabilities |
|
|
5,961 |
|
|
|
9,458 |
|
|
|
— |
|
|
Deferred income taxes |
|
|
338 |
|
|
|
(607 |
) |
|
|
(1,581 |
) |
|
Bad debt expense |
|
|
542 |
|
|
|
1,890 |
|
|
|
4,289 |
|
|
Other |
|
|
176 |
|
|
|
1,160 |
|
|
|
(1,303 |
) |
|
Changes in operating assets and liabilities: |
|
|
|
|
|
|
|
|
|
|
|
|
|
Accounts receivable |
|
|
(114,170 |
) |
|
|
(187,736 |
) |
|
|
(224,636 |
) |
|
Prepaid expenses and other assets |
|
|
(3,040 |
) |
|
|
(2,675 |
) |
|
|
(5,033 |
) |
|
Accounts payable |
|
|
50,021 |
|
|
|
209,483 |
|
|
|
171,793 |
|
|
Accrued expenses and other liabilities |
|
|
5,481 |
|
|
|
14,722 |
|
|
|
8,371 |
|
|
Net cash provided by (used in) operating activities |
|
|
(36,560 |
) |
|
|
75,031 |
|
|
|
31,224 |
|
|
INVESTING ACTIVITIES: |
|
|
|
|
|
|
|
|
|
|
|
|
|
Purchases of property and equipment |
|
|
(5,128 |
) |
|
|
(6,884 |
) |
|
|
(10,110 |
) |
|
Capitalized software development costs |
|
|
(1,799 |
) |
|
|
(2,337 |
) |
|
|
(2,954 |
) |
|
Business acquisition |
|
|
— |
|
|
|
— |
|
|
|
(3,000 |
) |
|
Redemption of short-term investment |
|
|
551 |
|
|
|
— |
|
|
|
— |
|
|
Net cash used in investing activities |
|
|
(6,376 |
) |
|
|
(9,221 |
) |
|
|
(16,064 |
) |
|
FINANCING ACTIVITIES: |
|
|
|
|
|
|
|
|
|
|
|
|
|
Proceeds from line of credit |
|
|
30,000 |
|
|
|
75,847 |
|
|
|
— |
|
|
Repayment on line of credit |
|
|
(15,000 |
) |
|
|
(65,000 |
) |
|
|
— |
|
|
Proceeds from term debt |
|
|
15,000 |
|
|
|
— |
|
|
|
— |
|
|
Repayment of term debt |
|
|
— |
|
|
|
(30,000 |
) |
|
|
— |
|
|
Payment of debt financing costs |
|
|
(190 |
) |
|
|
(976 |
) |
|
|
(154 |
) |
|
Payment of financing obligations |
|
|
(109 |
) |
|
|
(550 |
) |
|
|
(1,001 |
) |
|
Proceeds from issuance of Series C convertible preferred stock |
|
|
— |
|
|
|
60,000 |
|
|
|
— |
|
|
Repurchase of preferred stock and common stock |
|
|
— |
|
|
|
(54,000 |
) |
|
|
— |
|
|
Proceeds from exercise of stock options |
|
|
166 |
|
|
|
488 |
|
|
|
2,565 |
|
|
Proceeds from employee stock purchase plan |
|
|
— |
|
|
|
4,224 |
|
|
|
6,997 |
|
|
Taxes paid related to net settlement of restricted stock |
|
|
— |
|
|
|
— |
|
|
|
(1,017 |
) |
|
Payment of stock repurchase costs |
|
|
(39 |
) |
|
|
(155 |
) |
|
|
— |
|
|
Payment of Series C convertible preferred stock offering cost |
|
|
— |
|
|
|
(129 |
) |
|
|
— |
|
|
Proceeds from the issuance of Class A common stock in initial public offering, net of underwriting commissions |
|
|
— |
|
|
|
78,120 |
|
|
|
— |
|
|
Payment of offering costs—initial public offering |
|
|
(160 |
) |
|
|
(4,326 |
) |
|
|
— |
|
|
Net cash provided by financing activities |
|
|
29,668 |
|
|
|
63,543 |
|
|
|
7,390 |
|
|
Increase (decrease) in cash and cash equivalents |
|
|
(13,268 |
) |
|
|
129,353 |
|
|
|
22,550 |
|
|
Cash and cash equivalents—Beginning of year |
|
|
17,315 |
|
|
|
4,047 |
|
|
|
133,400 |
|
|
Cash and cash equivalents—End of year |
|
$ |
4,047 |
|
|
$ |
133,400 |
|
|
$ |
155,950 |
|
|
SUPPLEMENTAL CASH FLOW INFORMATION: |
|
|
|
|
|
|
|
|
|
|
|
|
|
Cash paid for income taxes |
|
$ |
12,931 |
|
|
$ |
16,740 |
|
|
$ |
19,163 |
|
|
Cash paid for interest |
|
$ |
895 |
|
|
$ |
1,696 |
|
|
$ |
1,320 |
|
|
Capitalized assets financed by accounts payable |
|
$ |
88 |
|
|
$ |
3,490 |
|
|
$ |
701 |
|
|
Tenant improvements paid by lessor |
|
$ |
— |
|
|
$ |
— |
|
|
$ |
640 |
|
|
Debt financing costs included in debt, net |
|
$ |
— |
|
|
$ |
— |
|
|
$ |
1,153 |
|
|
Stock-based compensation included in capitalized software development costs |
|
$ |
11 |
|
|
$ |
88 |
|
|
$ |
543 |
|
|
Conversion of convertible preferred stock to Class B common stock |
|
$ |
— |
|
|
$ |
83,241 |
|
|
$ |
— |
|
|
Conversion of warrant for convertible preferred stock to a warrant for Class B common stock and net exercise of warrant to purchase Class B common stock |
|
$ |
— |
|
|
$ |
12,596 |
|
|
$ |
— |
|
|
Deferred initial public offering costs and stock repurchase costs included in accounts payable |
|
$ |
58 |
|
|
$ |
— |
|
|
$ |
— |
|
|
Net exercise of warrants to purchase Series Seed convertible preferred stock |
|
$ |
— |
|
|
$ |
3,789 |
|
|
$ |
— |
|
|
Asset retirement obligation |
|
$ |
— |
|
|
$ |
354 |
|
|
$ |
— |
|
The accompanying Notes to Consolidated Financial Statements are an integral part of these statements.
58
NOTES TO CONSOLIDATED FINANCIAL STATEMENTS
The Trade Desk, Inc. (the “Company”) was formed in November 2009 as a Delaware corporation. The Company is headquartered in Ventura, California and has offices in various cities in the United States (“U.S.”), Europe, Asia and Australia. The Company is a global technology company that empowers ad buyers by providing a self-service omnichannel software platform that enables its clients to purchase and manage data-driven digital advertising campaigns across various advertising channels and formats.
Risks
The Company is subject to certain business risks, including dependence on key employees, competition, market acceptance of the Company’s platform, ability to source demand from buyers of advertising inventory, availability of equity or debt financings and dependence on growth to achieve its business plan.
Note 2—Basis of Presentation and Summary of Significant Accounting Policies
Basis of Presentation and Principles of Consolidation
The accompanying consolidated financial statements are prepared in accordance with accounting principles generally accepted in the United States of America (“GAAP”) and include the operations of the Company and its wholly owned subsidiaries. All intercompany transactions have been eliminated in consolidation. The Company has no components of other comprehensive income (loss), and accordingly, the Company’s comprehensive income is the same as its net income for all periods presented.
Reverse Stock Split
On September 2, 2016, the Company effected a 1-for-3 reverse stock split of its outstanding common stock and a proportional adjustment to the then existing conversion ratios for each series of convertible preferred stock. Accordingly, all share and per share amounts for all periods presented in these consolidated financial statements and notes thereto, have been adjusted retrospectively, where applicable, to reflect this reverse stock split and adjustment of the preferred stock conversion ratios.
Use of Estimates
The preparation of consolidated financial statements in conformity with GAAP requires management to make estimates and assumptions that affect the reported amounts of assets and liabilities and disclosures of contingent assets and liabilities at the date of the consolidated financial statements and the reported amounts of revenue and expenses during the reporting period. Actual results could differ materially from these estimates.
On an on-going basis, management evaluates its estimates, primarily those related to: (1) revenue recognition criteria, including the determination of revenue reporting as net versus gross in the Company’s revenue arrangements, (2) allowances for doubtful accounts, (3) the useful lives of property and equipment and capitalized software development costs, (4) income taxes, (5) assumptions used in the Black-Scholes option pricing model to determine the fair value of stock-based compensation, (6) the recognition and disclosure of contingent liabilities and (7) the assumptions used in valuing acquired assets and assumed liabilities in business combinations. These estimates are based on historical data and experience, as well as, various other factors that management believes to be reasonable under the circumstances, the results of which form the basis for making judgments about the carrying value of assets and liabilities that are not readily apparent from other sources. Prior to the IPO, the Company used estimates to determine the value of common and preferred stock which required the selection of appropriate valuation methodologies and models, and significant judgment in evaluating ranges of assumptions and financial inputs. Actual results may differ materially from those estimates under different assumptions or circumstances.
Revenue Recognition
The Company generates revenue from clients who enter into agreements to use the Company’s platform to purchase advertising inventory, data and other add-on features. The Company charges clients a platform fee, which is a percentage of a client’s purchases through the platform. In addition, the Company invoices clients for the cost of advertising inventory purchased, plus data and any add-on features purchased through the platform less any advertising inventory that clients purchase directly from suppliers through the Company’s platform. The Company maintains agreements with each client and supplier in the form of master service agreements, which set out the terms of the relationship and access to the Company’s platform.
59
The Company recognizes revenue when four basic criteria are met: (1) persuasive evidence of an arrangement exists; (2) delivery has occurred or services have been rendered; (3) the fees are fixed or determinable, and (4) collectability is reasonably assured. In applying the foregoing criteria, the Company recognizes revenue upon the completion of a transaction, that is, when a bid is won, subject to satisfying these criteria. Subsequent to a bid being won through the Company’s platform, the associated fees are generally not subject to adjustment or refund. Historically, any refunds and adjustments have not been material. The Company assesses collectability based on a number of factors, including the creditworthiness of a client or advertiser and related payment history. The Company generally bills clients for the gross amount of advertising inventory, data or other add-on features they purchase through the Company’s platform plus the Company’s platform fees, although some of the Company’s clients have payment relationships directly with advertising inventory suppliers in which case the Company only bills the clients for data, other services and the Company’s platform fees.
The Company reports revenue net of amounts it pays suppliers for the cost of advertising inventory, data and add-on features in conformity with Accounting Standards Codification (“ASC”) 605-45, Revenue Recognition -Principal Agent Considerations. The determination of whether the Company is the principal or agent, and hence whether to report revenue on a gross basis for the amount of the advertising inventory, third-party data and other add-on features the clients purchase using the platform plus the Company’s platform fees or on a net basis for the amount of platform fees charged to the client, requires the Company to evaluate a number of indicators, none of which is presumptive or determinative. The Company determined that it is not the primary obligor for the purchase of advertising inventory, third-party data and other add-on features but rather the primary obligor to provide a platform that enables clients to bid on advertising inventory, and use data and other add-on features in designing and executing their campaigns. The Company does not have pricing latitude with respect to the cost of advertising inventory, third-party data and other add-on features purchased by clients through the Company’s platform. The fee the Company charges clients is a percentage of their purchases through the Company’s platform, similar to a commission, and the Company’s fee is not contingent on the results of an advertising campaign. The client has supplier selection for the advertising inventory, third-party data and other add-on features through the platform. The Company has credit risk on the gross spend through the Company’s platform, which includes the amounts due to suppliers for purchases through the Company’s platform plus the Company’s platform fees, as the Company is required to pay suppliers irrespective of whether the Company collects from clients.
Based on these and other factors, the Company has determined it is not the principal in the purchase and sale of advertising inventory, data and other add-on features in all of the Company’s arrangements and therefore reports revenue on a net basis for the fees the Company charges clients.
The Company’s accounts receivable are recorded at the amount of gross billings to clients, net of allowances (“Gross Billings”), for the amounts it is responsible to collect, and accounts payable are recorded at the net amount payable to suppliers. Accordingly, both accounts receivable and accounts payable appear large in relation to revenue reported on a net basis.
Operating Expenses
The Company classifies its operating expenses into four categories:
Platform Operations. Platform operations expense consists of expenses related to hosting the Company’s platform, which includes “internet traffic” associated with the viewing of available impressions or queries per second (QPS) and providing support to clients. Platform operations expense includes hosting costs, personnel costs, and amortization of acquired technology and capitalized software costs for the development of the Company’s platform, including allocated overhead. Personnel costs included in platform operations include salaries, bonuses, stock-based compensation, and employee benefit costs, and are primarily attributable to personnel who provide the Company’s clients with support using the Company’s platform and the Company’s network operations group, who support the Company’s platform. The Company capitalizes certain costs associated with the development of the Company’s platform and amortizes these costs over their estimated useful lives in platform operations expense. The Company allocates overhead such as information technology infrastructure, rent and occupancy charges based on headcount.
Sales and Marketing. Sales and marketing expense consists primarily of personnel costs, including salaries, bonuses, stock-based compensation, employee benefits costs and commission costs for the Company’s sales and marketing personnel. Sales and marketing expense also includes costs for market development programs, advertising, promotional and other marketing activities, and allocated overhead. The Company allocates overhead such as information technology infrastructure, rent and occupancy charges based on headcount. Commissions costs are expensed as incurred.
60
Technology and Development. The Company’s technology and development expenses consist primarily of personnel costs, including salaries, bonuses, stock-based compensation and employee benefits costs, third-party consultant costs associated with the ongoing development and maintenance of the Company’s platform, amortization of capitalized third-party software used in the development of the Company’s platform and allocated overhead. The Company allocates overhead such as information technology infrastructure, rent and occupancy charges based on headcount. Technology and development costs are expensed as incurred, except to the extent that such costs are associated with software development that qualify for capitalization, which are then recorded as capitalized software development costs included in other assets, non-current on the Company’s consolidated balance sheet. The Company amortizes capitalized software development costs relating to the Company’s platform to platform operations expense.
General and Administrative. The Company’s general and administrative expenses consist primarily of personnel costs, including salaries, bonuses, stock-based compensation, and employee benefits costs associated with the Company’s executive, finance, legal, human resources, compliance, and other administrative personnel, as well as accounting and legal professional services fees, bad debt expense and allocated overhead. The Company allocates overhead such as information technology infrastructure, rent and occupancy charges based on headcount.
Stock-Based Compensation
Compensation expense related to stock options, restricted stock awards and units, which are referred to collectively as restricted stock, and awards granted under the Company’s employee stock purchase plan (“ESPP”), is measured and recognized in the consolidated financial statements based on the fair value of the awards granted. The fair value of each option award is estimated on the grant date using the Black-Scholes option-pricing model. The fair value of restricted stock is calculated using the closing market price of the Company’s common stock on the date of grant. Stock-based compensation expense related to stock options and restricted stock is recognized on a straight-line basis over the requisite service periods of the awards, which is generally four years. Stock-based compensation expense for ESPP awards is recognized on a graded-vesting attribution basis over the requisite service period of each award.
Stock options granted to non-employees are accounted for at fair value determined by using the Black-Scholes option-pricing model. The Company believes that the fair value of the stock options is more reliably measured than the fair value of the services received. The fair value of the non-employee stock options is re-measured each period until a commitment date is reached, which is generally the vesting date.
Determining the fair value of stock options and ESPP awards requires judgment. The Company’s use of the Black-Scholes option pricing model requires the input of subjective assumptions, including the fair value of the underlying common stock for periods prior to the completion of the Company’s IPO, the expected term of the option, the expected volatility of the Company’s common stock, risk-free interest rates, and the expected dividend yield of the Company’s common stock. The assumptions used in the Company’s option-pricing model represent management’s best estimates. These estimates involve inherent uncertainties and the application of management’s judgment.
These assumptions and estimates are as follows:
Fair Value of Common Stock. For stock options granted subsequent to the Company’s IPO and ESPP awards, the fair value of common stock is based on the closing price of its common stock as reported on the NASDAQ Global Market on the grant date. Prior to the IPO, the board of directors determined the fair value of the common stock at the time of the grant of options by considering a number of objective and subjective factors including the Company’s actual operating and financial performance, market conditions and performance of comparable publicly traded companies, developments and milestones in the Company, the likelihood of achieving a liquidity event and transactions involving the Company’s preferred or common stock, among other factors. The fair value was determined in accordance with applicable elements of the practice aid issued by the American Institute of Certified Public Accountants, Valuation of Privately Held Company Equity Securities Issued as Compensation.
Risk -Free Interest Rate. The risk-free interest rate is based on the yields of U.S. Treasury securities with maturities approximating the expected term of the awards.
Expected Term. Given insufficient historical data relating to stock option exercises, to determine the expected term, the Company applies the simplified approach, in which the expected term of an award is presumed to be the mid-point between the vesting date and the expiration date of the award. For ESPP awards, the expected term is the time period from the grant date to the respective purchase dates included within each offering period.
61
Volatility. Because the Company has a short trading history for its common stock, the Company determines the price volatility based on the historical volatilities of a publicly traded peer group based on daily price observations over a period equivalent to the expected term of the award, and during the year ended December 31, 2017, the Company began to include a blend of implied volatilities from its traded options.
Dividend Yield. The dividend yield assumption is based on the Company’s history and current expectations of dividend payouts. The Company has never declared or paid any cash dividends on its common stock and does not anticipate paying any cash dividends in the foreseeable future, so the Company used an expected dividend yield of zero.
During the year ended December 31, 2016, the Company early adopted Accounting Standards Update (“ASU”) No. 2016-09, Compensation—Stock Compensation (Topic 718): Improvements to Employee Share—Based Payment Accounting and changed its policy from estimating forfeitures to recording forfeitures when they occur. The impact of forfeitures on the Company’s historical consolidated financial statements was not material and the Company’s adoption of this guidance was also not material. The change in accounting policy to record forfeitures when they occur and the requirement to record excess tax benefits when they occur in the statement of operations has resulted in a reduction in the Company’s effective tax rate and may result in volatility in earnings in the future.
The Company will continue to use judgment in evaluating the assumptions related to the Company’s stock-based compensation. Future expense amounts for any particular period could be affected by changes in the Company’s assumptions or market conditions.
Income Taxes
Deferred income tax assets and liabilities are determined based upon the net tax effects of the differences between the Company’s consolidated financial statements carrying amounts and the tax basis of assets and liabilities and are measured using the enacted tax rate expected to apply to taxable income in the years in which the differences are expected to be reversed. A valuation allowance is used to reduce some or all of the deferred tax assets if, based upon the weight of available evidence, it is more likely than not that those deferred tax assets will not be realized.
The Company recognizes the tax benefit from an uncertain tax position only if it is more likely than not that the tax position will be sustained on examination by the taxing authorities, based on the technical merits of the position. The tax benefits recognized in the consolidated financial statements from such positions are then measured based on the largest benefit that has a greater than 50% likelihood of being realized. The Company recognizes interest and penalties accrued related to its uncertain tax positions in its income tax provision in the accompanying consolidated statements of operations.
On December 22, 2017, "H.R.1," known as the "Tax Cuts and Jobs Act," was signed into law. The primary impact of H.R.1 on the Company’s consolidated results from operations for the year ended December 31, 2017 and consolidated balance sheet as of December 31, 2017 was the revaluation of deferred taxes by $0.6 million resulting from the reduction in the U.S. federal corporate income tax rate from 35% to 21%, effective January 1, 2018. Given cumulative overseas deficits, no liability for foreign earnings and profits has been established.
Net Income (Loss) Per Share Attributable to Common Stockholders
Basic net income (loss) per share attributable to common stockholders is calculated by dividing the net income (loss) attributable to common stockholders by the weighted-average number of shares of common stock outstanding. The Company applies the two-class method to allocate net income (loss) between common and other participating securities based on their participation rights. Prior to the conversion of preferred stock to common stock concurrent with the IPO and because the holders of the Company’s convertible preferred stock were entitled to participate in dividends, the Company allocated net income to common and preferred stock based on their respective rights to receive dividends, whether or not declared. For 2015, the adjustment to the carrying value of the Series B preferred stock (Note 9) has been recorded as a benefit to net income attributable to common stockholders. For 2016, the excess of the repurchase price of preferred stock over its carrying value (Note 9) has been recorded as a reduction to net income to determine net loss attributable to common stockholders.
Diluted net income (loss) per share attributable to common stockholders adjusts the basic net income (loss) per share attributable to common stockholders and the weighted-average number of shares of common stock outstanding for the potentially dilutive impact of stock options, restricted stock, ESPP and warrants, using the treasury-stock method, and convertible preferred stock using the as-if-converted method.
62
The Company considers all short-term highly liquid investments with an original maturity of three months or less to be cash equivalents. Cash equivalents, consisting of money market funds, are carried at fair value. Refer to Note 6—Fair Value Measurements for additional information regarding the fair value of cash equivalents.
Accounts Receivable and Allowance for Doubtful Accounts
Accounts receivable are recorded at the invoiced amount, are unsecured and do not bear interest. The Company performs ongoing credit evaluations of its clients and certain advertisers when the Company’s agreements with its clients contain sequential liability terms that provide that the client payments are not due to the Company until the client has received payment from its customers who are advertisers. The allowance for doubtful accounts is based on the best estimate of the amount of probable credit losses in existing accounts receivable. The allowance for doubtful accounts is determined based on historical collection experience and the review in each period of the status of the then-outstanding accounts receivable, while taking into consideration current client information, subsequent collection history and other relevant data. The Company reviews the allowance for doubtful accounts on a quarterly basis. Account balances are charged off against the allowance when the Company believes it is probable the receivable will not be recovered.
The following table presents changes in the allowance for doubtful accounts (in thousands):
|
|
|
Year Ended December 31, |
|
|||||||||
|
|
|
2015 |
|
|
2016 |
|
|
2017 |
|
|||
|
Beginning balance |
|
$ |
172 |
|
|
$ |
686 |
|
|
$ |
2,574 |
|
|
Add: bad debt expense |
|
|
542 |
|
|
|
1,890 |
|
|
|
4,289 |
|
|
Less: write-offs, net of recoveries |
|
|
(28 |
) |
|
|
(2 |
) |
|
|
(4,606 |
) |
|
Ending balance |
|
$ |
686 |
|
|
$ |
2,574 |
|
|
$ |
2,257 |
|
Property and equipment are recorded at historical cost, less accumulated depreciation and amortization. Depreciation is computed using the straight-line method based upon the following estimated useful lives:
|
|
|
Years |
|
|
|
Computer equipment |
|
|
2 |
|
|
Purchased software |
|
|
5 |
|
|
Furniture, fixtures and office equipment |
|
|
5 |
|
|
Leasehold improvements |
|
* |
|
|
|
|
* |
Leasehold improvements are amortized on a straight-line basis over the term of the lease, or the useful life of the assets, whichever is shorter. |
Repair and maintenance costs are charged to expense as incurred, while renewals and improvements are capitalized. When assets are retired or otherwise disposed of, the cost and related accumulated depreciation are removed from the accounts and any resulting gain or loss is reflected in the Company’s operating results.
Capitalized Software Development Costs
The Company capitalizes certain costs associated with creating and enhancing internally developed software related to the Company’s technology infrastructure. These costs include personnel and related employee benefits expenses for employees who are directly associated with and who devote time to software development projects, and external direct costs of materials and services consumed in developing or obtaining the software. Software development costs that do not qualify for capitalization, as further discussed below, are expensed as incurred and recorded in technology and development expenses in the consolidated statements of operations.
63
Software development activities typically consist of three stages: (1) the planning phase; (2) the application and infrastructure development stage; and (3) the post implementation stage. Costs incurred in the planning and post implementation phases, including costs associated with the post-configuration training and repairs and maintenance of the developed technologies, are expensed as incurred. The Company capitalizes costs associated with software developed when the preliminary project stage is completed, management implicitly or explicitly authorizes and commits to funding the project and it is probable that the project will be completed and perform as intended. Costs incurred in the application and infrastructure development phases, including significant enhancements and upgrades, are capitalized. Capitalization ends once a project is substantially complete and the software is ready for its intended purpose. Software development costs are amortized using a straight-line method over the estimated useful life of two years, commencing when the software is ready for its intended use. The straight-line recognition method approximates the manner in which the expected benefit will be derived.
The Company does not transfer ownership of its internally developed software, or lease its software, to third parties.
The results of a business acquired in a business combination are included in the Company’s consolidated financial statements from the date of the acquisition. Purchase accounting results in assets and liabilities of an acquired business generally being recorded at their estimated fair values on the acquisition date. Any excess consideration over the fair value of assets acquired and liabilities assumed is recognized as goodwill.
Transaction costs associated with business combinations are expensed as incurred and are included in general and administrative expenses in the consolidated statements of operations.
The Company performs valuations of assets acquired and liabilities assumed and allocates the purchase price to its respective assets and liabilities. Determining the fair value of assets acquired and liabilities assumed may require management to use significant judgment and estimates, including the selection of valuation methodologies, estimates of future revenue, costs and cash flows, discount rates, and selection of comparable companies. The Company engages the assistance of valuation specialists in concluding on fair value measurements in connection with determining fair values of assets acquired and liabilities assumed in a business combination.
In October 2017, the Company paid $3.0 million in cash for certain assets of a data company accounted for as a business combination. These assets primarily consisted of acquired technology and goodwill which are included in other assets, non-current.
Operating Leases
The Company records rent expense for operating leases, some of which have escalating rent payments, on a straight-line basis over the lease term. The Company begins recognition of rent expense on the date of initial possession, which is generally when the Company enters the leased premises and begins to make improvements in preparation for its intended use. Some of the Company’s lease arrangements provide for concessions by the landlords, including payments for leasehold improvements and rent-free periods. The Company accounts for the difference between the straight-line rent expense and rent paid as deferred rent.
Debt Issuance Costs
Debt issuance costs related to the term loans have been recorded as a reduction of the carrying amount of the debt and are amortized to interest expense using the effective interest method. Debt financing costs associated with credit facilities have been deferred and recorded in other assets, non-current and are amortized to interest expense on a straight-line basis over the term of the credit facilities.
Preferred Stock Warrant Liabilities
Prior to the completion of the Company’s IPO, warrants to purchase preferred stock of the Company were accounted for as liabilities at fair value because the underlying shares of convertible preferred stock were contingently redeemable, including in the case of a deemed liquidation, which could have obligated the Company to transfer assets to the preferred stockholders. The preferred stock warrants were recorded at fair value at each balance sheet date and changes in the fair value of the preferred stock warrants during each reporting period were recorded in the Company’s consolidated statements of operations until the earlier of the exercise or expiration of the warrants or the warrants’ conversion to warrants to purchase common stock, at which time any remaining liability was reclassified to additional paid-in capital. Immediately prior to the completion of the Company’s IPO, all of the Company’s then-outstanding convertible preferred stock warrants were remeasured to fair value and automatically converted and reclassified into Class B common stock warrants and all remaining warrants were net exercised.
64
Fair Value of Financial Instruments
Fair value is defined as the exchange price that would be received for an asset or paid to transfer a liability (an exit price) in the principal or most advantageous market for the asset or liability in an orderly transaction between market participants on the measurement date. Valuation techniques used to measure fair value must maximize the use of observable inputs and minimize the use of unobservable inputs. Fair value measurements are based on a fair value hierarchy, based on three levels of inputs, of which the first two are considered observable and the last unobservable, which are the following:
Level 1—Quoted prices (unadjusted) in active markets for identical assets or liabilities that the Company has the ability to access at the measurement date.
Level 2—Inputs other than quoted prices included within Level 1 that are observable for the asset or liability, either directly or indirectly, such as quoted market prices for similar assets and liabilities; quoted prices in markets that are not active; or other inputs that are observable or can be corroborated by observable market data for substantially the full term of the asset or liability.
Level 3—Unobservable inputs.
Observable inputs are based on market data obtained from independent sources.
The carrying amounts of accounts receivable, accounts payable, accrued expenses and other current liabilities approximate fair value due to the short-term nature of these instruments. The carrying value of the line of credit and term loans approximates fair value based on borrowing rates currently available to the Company for financing with similar terms and were determined to be Level 2.
The Company’s convertible preferred stock warrants were measured using unobservable inputs that required a high level of judgment to determine fair value, and were thus classified as Level 3.
Certain long lived assets including capitalized software development costs are also subject to measurement at fair value on a non-recurring basis if they are deemed to be impaired as a result of an impairment review. To date, no material impairments have been recorded on those assets.
Concentration of Risk
Financial instruments that potentially subject the Company to concentration of credit risk consist principally of cash and cash equivalents and accounts receivable. The Company maintains its cash and cash equivalents with financial institutions and its cash levels exceed the Federal Deposit Insurance Corporation (FDIC) federally insured limits.
For 2015, two clients each accounted for 12% of Gross Billings. For 2016, three clients accounted for 15%, 13% and 11%, respectively, of Gross Billings. For 2017, three clients accounted for 22%, 11% and 10%, respectively, of Gross Billings.
As of December 31, 2016, three clients accounted for 27%, 13% and 12%, respectively, of consolidated accounts receivable. As of December 31, 2017, three clients accounted for 33%, 14% and 11%, respectively, of consolidated accounts receivable.
As of December 31, 2016, one supplier accounted for 10% of consolidated accounts payable. As of December 31, 2017, one supplier accounted for 12% of consolidated accounts payable.
Foreign Currency Transactions and Translation
The Company has entities operating in various countries. Each of these entities’ functional currency is the U.S. Dollar. Transactions in foreign currencies are translated into U.S. Dollars at the rates of exchange in effect at the date of the transaction. Net transaction losses were approximately $1.0 million, $1.2 million, and $3.9 million for the years ended December 31, 2015, 2016 and 2017, respectively, and are included in foreign currency exchange loss, net in the accompanying consolidated statements of operations.
Commencing in 2015 the Company entered into forward contracts to hedge foreign currency exposures related primarily to the Company’s foreign currency denominated accounts receivable. The Company does not designate the foreign exchange forward contracts as hedges for accounting purposes and changes in the fair value of the foreign exchange forward contracts are recorded in foreign exchange loss, net in the accompanying consolidated statements of operations. As of December 31, 2016 and 2017, the Company had open forward contracts with aggregate notional amounts of $27.1 million and $58.4 million, respectively. The fair value of the open forward contracts was not material. The Company’s forward contracts generally have terms of 30-210 days.
65
Recent Accounting Pronouncements
In May 2014, the Financial Accounting Standards Board (“FASB”) issued ASU No. 2014-09, Revenue from Contracts with Customers (Topic 606), which amends the existing accounting standards for revenue recognition. Under ASU 2014-09, a company will recognize revenue when it transfers promised goods or services to customers in an amount that reflects the consideration to which it expects to be entitled in exchange for those goods or services. Additionally, the guidance requires improved disclosures to help users of financial statements better understand the nature, amount, timing, and uncertainty of revenue and cash flows arising from contracts with customers. In August 2015, the FASB approved the deferral of the new standard by one year, which defers the effective date of ASU 2014-09 by one year. In 2016, the FASB issued additional amendments to the new revenue guidance. This guidance is effective for annual reporting periods beginning after December 31, 2017, including interim periods within that reporting period. The guidance permits the use of either the retrospective or cumulative effect transition method. The Company used the modified retrospective approach transition method to adopt this guidance on January 1, 2018 and has determined that adoption of this guidance does not have an impact on its consolidated results of operations, financial position or cash flows.
In February 2016, the FASB issued ASU No. 2016-02, Leases, which requires an entity to recognize right-of-use assets and lease liabilities on its balance sheet and disclose key information about leasing arrangements. The guidance offers specific accounting guidance for a lessee, lessor, and sale and leaseback transactions. Lessees and lessors are required to disclose qualitative and quantitative information about leasing arrangements to enable a user of the financial statements to assess the amount, timing and uncertainty of cash flows arising from leases. Leases will be classified as either finance or operating, with the classification affecting the pattern of expense recognition in the income statement. This guidance is effective for annual reporting periods beginning after December 15, 2018, including interim periods within that reporting period, and requires a modified retrospective adoption, with early adoption permitted. Although the Company is currently evaluating the impact of this guidance on its consolidated financial statements, the Company expects that most of its operating lease commitments will be recognized as operating lease liabilities and right-of-use assets upon adoption of the new guidance.
In June 2016, the FASB issued ASU No. 2016-13, Financial Instruments-Credit Losses (Topic 326): Measurement of Credit Losses on Financial Instruments, which is intended to provide more decision-useful information about expected credit losses on financial instruments and other commitments to extend credit held by a reporting entity at each reporting date. ASU 2016-13 revises the impairment model to utilize an expected loss methodology in place of the currently used incurred loss methodology, which will result in more timely recognition of losses on financial instruments, including, but not limited to, available for sale debt securities and accounts receivable. This guidance is effective for annual reporting periods beginning after December 15, 2019, including interim periods within that reporting period. Early adoption is permitted. The Company is currently evaluating the impact of this guidance on its consolidated financial statements.
In August 2016, the FASB issued ASU No. 2016-15, Statement of Cash Flows (Topic 230), Classification of Certain Cash Receipts and Cash Payments, which addresses eight specific cash flow issues with the objective of reducing the existing diversity in practice. This guidance is effective for annual reporting periods beginning after December 15, 2017, including interim periods within that reporting period. Early adoption is permitted, including adoption in an interim period. If adopted in an interim period, any adjustments should be reflected as of the beginning of the fiscal year that includes such interim period. The adoption of ASU 2016-15 should be applied using a retrospective transition method to each period presented, unless impracticable to do so. The Company does not expect that the adoption of this guidance will have a material impact on its consolidated statement of cash flows.
In May 2017, the FASB issued ASU No. 2017-09, Compensation—Stock Compensation: Scope of Modification Accounting, which provides guidance on the types of changes to the terms or conditions of a share-based payment award to which an entity would be required to apply modification accounting in FASB Accounting Standards Codification Topic 718, Compensation—Stock Compensation. This guidance is effective for annual reporting periods beginning after December 15, 2017, including interim periods within that reporting period. The Company does not expect that the adoption of this guidance will have a material impact on its consolidated financial statements.
Note 3—Net Income (Loss) Per Share Attributable to Common Stockholders
The Company has two classes of common stock, Class A and Class B. Basic and diluted net income (loss) per share attributable to common stockholders for Class A and Class B common stock were the same because they were entitled to the same liquidation and dividend rights.
66
The computations of the numerators and denominators of the basic and diluted net income (loss) per share attributable to common stockholders are as follows (in thousands, except per share amounts):
|
|
|
Year Ended December 31, |
|
|||||||||
|
|
|
2015 |
|
|
2016 |
|
|
2017 |
|
|||
|
Net income (loss) per share attributable to common stockholders—basic: |
|
|
|
|
|
|
|
|
|
|
|
|
|
Numerator: |
|
|
|
|
|
|
|
|
|
|
|
|
|
Net income |
|
$ |
15,929 |
|
|
$ |
20,482 |
|
|
$ |
50,798 |
|
|
Less: Income attributable to convertible preferred stock |
|
|
(10,958 |
) |
|
|
— |
|
|
|
— |
|
|
Add: Preferred stock modification |
|
|
3,793 |
|
|
|
— |
|
|
|
— |
|
|
Less: Premium on repurchase of convertible preferred stock |
|
|
— |
|
|
|
(47,209 |
) |
|
|
— |
|
|
Net income (loss) attributable to common stockholders |
|
$ |
8,764 |
|
|
$ |
(26,727 |
) |
|
$ |
50,798 |
|
|
Denominator: |
|
|
|
|
|
|
|
|
|
|
|
|
|
Weighted-average shares outstanding |
|
|
10,290 |
|
|
|
18,280 |
|
|
|
40,262 |
|
|
Net income (loss) per share attributable to common stockholders—basic |
|
$ |
0.85 |
|
|
$ |
(1.46 |
) |
|
$ |
1.26 |
|
|
Net income (loss) per share attributable to common stockholders—diluted: |
|
|
|
|
|
|
|
|
|
|
|
|
|
Numerator: |
|
|
|
|
|
|
|
|
|
|
|
|
|
Net income (loss) attributable to common stockholders—basic |
|
$ |
8,764 |
|
|
$ |
(26,727 |
) |
|
$ |
50,798 |
|
|
Add: Income attributable to dilutive convertible preferred stock |
|
|
1,624 |
|
|
|
— |
|
|
|
— |
|
|
Less: Preferred stock modification |
|
|
(3,793 |
) |
|
|
— |
|
|
|
— |
|
|
Net income (loss) attributable to common stockholders—diluted |
|
$ |
6,595 |
|
|
$ |
(26,727 |
) |
|
$ |
50,798 |
|
|
Denominator: |
|
|
|
|
|
|
|
|
|
|
|
|
|
Weighted-average shares outstanding |
|
|
10,290 |
|
|
|
18,280 |
|
|
|
40,262 |
|
|
Dilutive convertible preferred stock |
|
|
2,790 |
|
|
|
— |
|
|
|
— |
|
|
Options to purchase common stock |
|
|
3,699 |
|
|
|
|
|
|
|
3,415 |
|
|
Employee stock purchase plan shares |
|
|
— |
|
|
|
— |
|
|
|
268 |
|
|
Restricted stock |
|
|
— |
|
|
|
— |
|
|
|
111 |
|
|
Weighted-average shares outstanding—diluted |
|
|
16,779 |
|
|
|
18,280 |
|
|
|
44,056 |
|
|
Net income (loss) per share attributable to common stockholders—diluted |
|
$ |
0.39 |
|
|
$ |
(1.46 |
) |
|
$ |
1.15 |
|
The following table presents the anti-dilutive shares excluded from the calculation of diluted net income (loss) per share attributable to common stockholders (in thousands):
|
|
|
Year Ended December 31, |
|
|||||||||
|
|
|
2015 |
|
|
2016 |
|
|
2017 |
|
|||
|
Anti-dilutive equity awards under stock-based award plans |
|
|
248 |
|
|
|
6,069 |
|
|
|
1,246 |
|
|
Common shares issuable upon conversion of convertible preferred stock |
|
|
19,320 |
|
|
|
— |
|
|
|
— |
|
|
Common shares issuable upon conversion of preferred stock warrants |
|
|
547 |
|
|
|
— |
|
|
|
— |
|
|
Total shares excluded from net income (loss) per share attributable to common stockholders—diluted |
|
|
20,115 |
|
|
|
6,069 |
|
|
|
1,246 |
|
67
Note 4—Property and Equipment, Net
Major classes of property and equipment were as follows (in thousands):
|
|
|
As of December 31, |
|
|||||
|
|
|
2016 |
|
|
2017 |
|
||
|
Computer equipment |
|
$ |
2,542 |
|
|
$ |
4,520 |
|
|
Purchased software |
|
|
6,686 |
|
|
|
7,735 |
|
|
Furniture and fixtures |
|
|
2,563 |
|
|
|
4,306 |
|
|
Construction in progress |
|
|
2,319 |
|
|
|
102 |
|
|
Leasehold improvements |
|
|
4,374 |
|
|
|
9,645 |
|
|
|
|
|
18,484 |
|
|
|
26,308 |
|
|
Less: Accumulated depreciation |
|
|
(3,705 |
) |
|
|
(8,903 |
) |
|
|
|
$ |
14,779 |
|
|
$ |
17,405 |
|
Depreciation expense for 2015, 2016 and 2017 was $1.0 million, $2.4 million and $5.3 million respectively.
The Company has purchased software under a financing arrangement where the Company makes installment payments over a four-year period. The Company has taken possession of the software and runs the software on its own equipment. As of December 31, 2016 and 2017, the software had a cost basis of $1.8 million. Accumulated depreciation on this software as of December 31, 2016 and 2017 was $0.9 million and $1.2 million, respectively. Depreciation expense on this software was $0.4 million for 2015, 2016 and 2017.
To date, there have been no impairment charges to property and equipment.
Note 5—Capitalized Software Development Costs
Capitalized software development costs, included in other assets, non-current, were as follows (in thousands):
|
|
|
As of December 31, |
|
|||||
|
|
|
2016 |
|
|
2017 |
|
||
|
Capitalized software development costs, gross |
|
$ |
4,280 |
|
|
$ |
6,133 |
|
|
Less: Accumulated amortization |
|
|
(1,520 |
) |
|
|
(1,734 |
) |
|
Capitalized software development costs, net |
|
$ |
2,760 |
|
|
$ |
4,399 |
|
The Company capitalized $1.8 million, $2.4 million and $3.5 million of software development costs in 2015, 2016 and 2017, respectively. Amortization expense was $0.9 million, $1.4 million and $1.9 million for 2015, 2016 and 2017, respectively. Based on the Company’s capitalized software development costs ready for intended use as of December 31, 2017, estimated amortization expense of $1.9 million and $0.8 million is expected to be recognized in 2018 and 2019, respectively. Amortization has not started on $1.7 million of capitalized software development costs that are not yet ready for intended use as of December 31, 2017.
Note 6—Fair Value Measurements
At December 31, 2017, cash equivalents of $5.0 million consisted of money market funds, which were classified as Level 1 of the fair value hierarchy and are valued using quoted market prices in active markets. The Company had no cash equivalents at December 31, 2016. The Company had no other material financial instruments that were measured at fair value at December 31, 2016 and 2017.
68
The Company’s preferred stock warrants are recorded at fair value and were determined to be Level 3 fair value items. The changes in the fair value of preferred stock warrants are summarized below (in thousands):
|
|
|
Year Ended December 31, |
|
|||||
|
|
|
2015 |
|
|
2016 |
|
||
|
Beginning balance |
|
$ |
966 |
|
|
$ |
6,927 |
|
|
Change in value of preferred stock warrants recorded in other expense, net |
|
|
5,961 |
|
|
|
9,458 |
|
|
Reclassification to convertible preferred stock upon net exercise of Series Seed warrant in February 2016 |
|
|
— |
|
|
|
(3,789 |
) |
|
Conversion of preferred stock warrants to common stock warrants upon the closing of the Company’s IPO on September 26, 2016 |
|
|
— |
|
|
|
(12,596 |
) |
|
Ending balance |
|
$ |
6,927 |
|
|
$ |
— |
|
In connection with the IPO, outstanding warrants exercisable for 1,382,505 shares of convertible preferred stock were automatically converted into warrants exercisable for 460,834 shares of Class B common stock and net exercised resulting in the issuance of 448,545 shares of Class B common stock based on the IPO price of $18.00 per share and taking into account the 1-for-3 reverse stock split. The aggregate fair value of these warrants upon the closing of the IPO was $12.6 million, which was reclassified from liabilities to additional paid-in capital.
The Company determined the fair value of the preferred stock warrants utilizing the Black-Scholes model with the following assumptions:
|
|
|
Series Seed |
|
|
Series A-3 |
|
||||||||||
|
|
|
As of |
|
|
As of |
|
||||||||||
|
|
|
Dec 31, 2015 |
|
|
Sept 26, 2016 |
|
|
Dec 31, 2015 |
|
|
Sept 26, 2016 |
|
||||
|
Contractual term (years) |
|
|
5.7 |
|
|
|
4.9 |
|
|
|
7.2 |
|
|
|
6.5 |
|
|
Expected volatility |
|
|
60.3 |
% |
|
|
59.1 |
% |
|
|
61.3 |
% |
|
|
59.1 |
% |
|
Risk-free interest rate |
|
|
1.84 |
% |
|
|
1.12 |
% |
|
|
2.09 |
% |
|
|
1.34 |
% |
|
Estimated dividend yield |
|
|
— |
% |
|
|
— |
% |
|
|
— |
% |
|
|
— |
% |
Note 7—Accounts Payable
Accounts payable included the following (in thousands):
|
|
|
As of December 31, |
|
|||||
|
|
|
2016 |
|
|
2017 |
|
||
|
Accounts payable–media and data |
|
$ |
307,018 |
|
|
$ |
477,716 |
|
|
Accounts payable–other |
|
|
14,145 |
|
|
|
12,661 |
|
|
Total |
|
$ |
321,163 |
|
|
$ |
490,377 |
|
Note 8—Debt
Amended Revolving Credit Agreement
On May 9, 2017, the Company, a syndicate of banks, led by Citibank, N.A., and Citibank, N.A., as agent, entered into an amended and restated loan and security agreement (the “Amended Revolving Credit Agreement”). Among other things, the Amended Revolving Credit Agreement provides for an increase of $75.0 million in the aggregate principal amount of commitments available under the Company’s senior secured asset-based revolving credit facility (the “Revolving Credit Facility”) and provides the Company with greater flexibility with respect to working capital, acquisitions and general corporate purposes. Available funding commitments to the Company under the Revolving Credit Facility, subject to certain conditions, total up to $200.0 million, with a $20.0 million sublimit for swingline borrowings and a $15.0 million sublimit for the issuance of letters of credit. Under certain circumstances and subject to certain conditions, the Company has the right to increase the Revolving Credit Facility by an additional amount not to exceed $100.0 million. Any borrowings under the Revolving Credit Facility are due in full in May 2022. The Company may prepay the borrowings without penalty at any time. The Amended Revolving Credit Agreement is collateralized by substantially all of the Company’s assets, including a pledge of certain of the Company’s accounts receivable, deposit accounts, intellectual property, investment property, and equipment. Availability under the Revolving Credit Facility was $168.1 million at December 31, 2017, and is based on a percentage of eligible accounts receivable, as reduced by certain reserves.
69
Loans under the Revolving Credit Facility bear interest through maturity at a variable rate based upon, at the Company’s option, an annual rate of either a Base Rate or a LIBOR rate, plus an applicable margin (“Base Rate Borrowings” and “LIBOR Rate Borrowings”). The Base Rate is defined as a fluctuating interest rate equal to the greatest of (1) the federal funds rate plus 0.50%, (2) Citibank, N.A.’s prime rate, and (3) one month LIBOR rate plus 2.0%. The applicable margin is defined as a rate between 1.0% to 1.5% for Base Rate Borrowings and between 2.0% and 2.5% for LIBOR Rate Borrowings, depending on the amount of average excess availability on the Revolving Credit Facility. The fee for undrawn amounts ranges from 0.325% to 0.375%. Interest is payable either (a) monthly for Base Rate Borrowings or (b) for LIBOR Rate Borrowings, on the earlier of (1) the last day of the interest period which can be one, two, three or six months as selected by the Company or (2) the last day of each three month interval. The Company will also be required to pay customary letter of credit fees, as necessary.
The Amended Revolving Credit Agreement contains customary conditions to borrowings, events of default and covenants, including covenants that restrict the Company’s ability to sell assets, make changes to the nature of its business, engage in mergers or acquisitions, incur, assume or permit to exist additional indebtedness and guarantees, create or permit to exist liens, pay dividends, issue equity instruments, make distributions or redeem or repurchase capital stock or make other investments, engage in transactions with affiliates and make payments in respect of subordinated debt. The Amended Revolving Credit Agreement also requires that if the Company’s excess availability is less than the greater of (a) $15.0 million and (b) 12.5% of the lesser of (1) the borrowing base then in effect and (2) the commitments under the Revolving Credit Facility then in effect, the Company will maintain a consolidated fixed charge coverage ratio of at least 1.15 to 1.00. As of December 31, 2017, the Company was in compliance with all covenants.
The Revolving Credit Facility matures and all outstanding amounts become due and payable on May 9, 2022. Under the Revolving Credit Facility, the Company had an outstanding debt, net balance of $27.0 million that bore interest at weighted average rate of 3.6% as of December 31, 2017. In January 2018, the Company repaid the outstanding principal and accrued interest in the aggregate amount of $27.1 million.
In connection with the Company’s prior debt facility, the Company was required to pay a fee of $0.8 million upon the occurrence of the IPO. This liquidation fee was paid upon the completion of the IPO and recorded as a component of interest expense in the consolidated statements of operations for the year ended December 31, 2016.
Note 9—Capitalization
In September 2016, and in preparation of the IPO and the establishment of two classes of common stock, each share of the then outstanding common stock was reclassified to Class B common stock. The Company sold Class A common stock in the IPO. The Class A and Class B have the same rights and preferences including rights to dividends, except the Class B is entitled to ten votes per share and the Class A is entitled to one vote per share. Each share of Class B common stock is convertible at any time at the option of the holder into one share of Class A common stock. In addition, each share of Class B common stock will convert automatically into one share of Class A common stock upon any transfer, except for certain transfers described in the Company’s restated certificate of incorporation, including, without limitation, certain transfers for tax and estate planning purposes. During the period from September 2016 through December 2016, 4.2 million shares of Class B common stock were converted to Class A common stock, and during the year ended December 31, 2017, 21.8 million shares of Class B common stock were converted to Class A common stock. In addition, upon the earlier of (1) the date on which the outstanding shares of Class B common stock represent less than 10% of the aggregate number of the then outstanding shares of Class A common stock and Class B common stock and (2) the affirmative vote or written consent of the holders of at least 66 2 ⁄ 3 % of the outstanding shares of Class B common stock, all outstanding shares of Class B common stock will convert automatically into Class A common stock, and no additional shares of Class B common stock will be issued. Prior to the reclassification of existing common stock to Class B common stock, the existing common stock was entitled to one vote per share.
As of December 31, 2017, the Company is authorized to issue 1,095,000,000 shares of common stock, par value $0.000001 per share, and 100,000,000 shares of preferred stock, par value, $0.000001 per share. The authorized common stock consists of 1,000,000,000 shares of Class A common stock and 95,000,000 shares of Class B common stock.
No shares of preferred stock are outstanding as of December 31, 2016 and 2017. The Company’s board of directors has the discretion to determine the rights, preferences, privileges and restrictions, including voting rights, dividend rights, conversion rights, redemption privileges and liquidation preferences, of each series of preferred stock.
70
On September 26, 2016, the Company completed its IPO whereby 4,666,667 shares of Class A common stock were issued and sold by the Company and 700,000 shares of Class A common stock were sold by selling stockholders, pursuant to the underwriters’ exercise of their over-allotment option, at the IPO price of $18.00 per share. The Company received net proceeds from the offering of approximately $78.1 million after deducting underwriting discounts and commissions of $5.9 million, but before deducting offering costs of $4.5 million. The Company did not receive any proceeds from the sales of shares by the selling stockholders. In connection with the Company’s IPO: (1) all shares of the Company’s outstanding Series Seed, A-1, A-2, A-3, B and C convertible preferred stock automatically converted into an aggregate 22,078,637 shares of Class B common stock on a one for one-third basis and (2) warrants exercisable for 1,382,505 shares of convertible preferred stock were automatically converted into warrants exercisable for 460,834 shares of Class B common stock and net exercised resulting in the issuance of 448,545 shares of Class B common stock based on the IPO price of $18.00 per share and taking into account the 1-for-3 reverse stock split.
In addition, upon completion of the IPO, costs associated with the IPO of $4.5 million were reclassified from other assets, non-current to additional paid-in capital.
Secondary Offerings
In March 2017, the Company completed a secondary offering (the “March 2017 Offering”) in which a total of 7,281,789 shares of Class A common stock were sold by certain selling stockholders to the public at a price of $35.50 per share, including 949,798 shares of Class A common stock sold to the underwriters pursuant to an option to purchase additional shares granted to them.
In June 2017, the Company completed another secondary offering (the “June 2017 Offering”) in which a total of 4,846,600 shares of Class A common stock were sold by certain selling stockholders to the public at a price of $52.00 per share, including 530,148 shares of Class A common stock sold to the underwriters pursuant to an option to purchase additional shares granted to them.
The Company did not receive any proceeds from either the March 2017 Offering or the June 2017 Offering. The Company incurred $0.9 million and $0.6 million in offering costs related to the March 2017 Offering and the June 2017 Offering, respectively, and these costs were included within general and administrative expenses in the condensed consolidated statements of operations during the first and second quarters of 2017, respectively.
Convertible Preferred Stock
In February 2016, the Company issued 11,500,587 shares of Series C convertible preferred stock for $60.0 million and used $54.0 million of the proceeds to repurchase 3,897,928 and 8,485,350 shares of Series Seed preferred stock (including shares issued upon exercise of warrant described below) and Series A preferred stock (comprising shares of Series A-1, A-2 and A-3), respectively, each at 80% of the Series C offering price per share of $5.22, and 188,786 shares of common stock at a price per share of $12.51. Warrants to purchase 808,135 shares of Seed preferred stock were net exercised, resulting in the issuance of 788,755 shares of Series Seed preferred stock of which 614,052 shares were then repurchased.
The repurchase price of the convertible preferred stock, including legal costs, of $51.8 million exceeded the carrying value of $4.6 million at the date of repurchase. The repurchase price in excess of the then carrying value of the preferred stock of $47.2 million was recorded as a reduction to additional paid-in capital of $1.2 million and a reduction to retained earnings of $46.0 million. For the computation of net loss per share attributable to common stockholders for the year ended December 31, 2016, the repurchase price in excess of the then carrying value of the preferred stock of $47.2 million was recorded as a reduction to net income in computing net loss attributable to common stockholders.
All shares of the Company’s outstanding Series Seed, A-1, A-2, A-3, B and C convertible preferred stock automatically converted into an aggregate 22,078,637 shares of Class B common stock on a one for one-third basis upon the completion of the Company’s IPO.
Modification of Series B Preferred Stock
In 2015, the Series B preferred stockholders agreed to modify the then liquidation rights and preference of the Series B preferred stock. The Company recorded the modification as an extinguishment as the fair value of the Series B preferred stock immediately before and immediately after the modification were substantially different (i.e., more than10%). The Company recorded the difference between the carrying value of the Series B preferred stock and the fair value after the modification, of $3.8 million, as a reduction to the carrying value of the Series B preferred stock and a reduction to accumulated deficit. The $3.8 million has been recorded as an adjustment to the net income attributable to common stockholders in accordance with ASC 260, Earnings per Share.
71
Rights and Preferences of Convertible Preferred Stock
Prior to the Company’s IPO, the Company’s convertible preferred stock had voting rights that allowed the holder to vote the number of common stock equal to which such shares of preferred stock could be converted; entitled the preferred stockholders to certain dividend right; entitled the holders to preference in payment upon a liquidation event, including upon a change in control, prior to the common stock holders equal to the greater of the original purchase price plus any dividends or such amount per share as would have been payable had all shares of the preferred stock been converted into common stock; and were convertible at the option of the holder at any time or automatically upon a qualified IPO.
Note 10—Stock-Based Compensation
Total stock-based compensation expense, by operating expense category, recorded in the consolidated statements of operations was as follows (in thousands):
|
|
|
Year Ended December 31, |
|
|||||||||
|
|
|
2015 |
|
|
2016 |
|
|
2017 |
|
|||
|
Platform operations |
|
$ |
71 |
|
|
$ |
756 |
|
|
$ |
2,674 |
|
|
Sales and marketing |
|
|
127 |
|
|
|
1,707 |
|
|
|
6,261 |
|
|
Technology and development |
|
|
85 |
|
|
|
1,513 |
|
|
|
6,661 |
|
|
General and administrative |
|
|
91 |
|
|
|
1,080 |
|
|
|
5,721 |
|
|
Total |
|
$ |
374 |
|
|
$ |
5,056 |
|
|
$ |
21,317 |
|
Stock-Based Award Plans
The Company is authorized to issue stock options, restricted stock awards, restricted stock units, stock appreciation rights and other stock-based and cash-based awards under its 2016 Incentive Award Plan. As of December 31, 2017, 3.5 million shares remained available for grant under the Company’s 2016 Incentive Award Plan. The number of shares authorized for grant is subject to increase each year on January 1, equal to the lesser of (a) 4% of the common stock outstanding (on an as-converted basis) on the final day of the immediately preceding calendar year and (b) such smaller number of shares as determined by the board of directors.
Stock options granted under the Company’s stock incentive plans generally vest over four years, subject to the holder’s continued service through the vesting date, and expire no later than 10 years from the date of grant. Restricted stock awards and units, which are referred to collectively as restricted stock, generally vest over four years, subject to the holder’s continued service through the vesting date.
Stock Option Information
The following summarizes stock option activity:
|
|
|
Shares Under Option (in thousands) |
|
|
Weighted- Average Exercise Price |
|
|
Weighted-Average Contractual Life (years) |
|
|
Aggregate Intrinsic Value (in thousands) |
|
||||
|
Outstanding as of December 31, 2016 (1) |
|
|
5,429 |
|
|
$ |
4.94 |
|
|
|
|
|
|
|
|
|
|
Granted |
|
|
1,473 |
|
|
|
44.20 |
|
|
|
|
|
|
|
|
|
|
Exercised |
|
|
(1,932 |
) |
|
|
1.33 |
|
|
|
|
|
|
|
|
|
|
Cancelled |
|
|
(225 |
) |
|
|
18.49 |
|
|
|
|
|
|
|
|
|
|
Outstanding as of December 31, 2017 (2) |
|
|
4,745 |
|
|
$ |
17.96 |
|
|
|
7.4 |
|
|
$ |
136,085 |
|
|
Exercisable as of December 31, 2017 |
|
|
2,242 |
|
|
$ |
4.81 |
|
|
|
5.9 |
|
|
$ |
91,829 |
|
|
(1) |
Includes options to purchase 389 and 5,040 shares of Class A and Class B common stock, respectively. |
|
(2) |
Includes options to purchase 1,780 and 2,965 shares of Class A and Class B common stock, respectively. |
72
The fair value of options on the date of grant is estimated based on the Black-Scholes option pricing model. The weighted average assumptions used to value options granted to employees for the periods presented were as follows:
|
|
|
Year Ended December 31, |
|
|||||||||
|
|
|
2015 |
|
|
2016 |
|
|
2017 |
|
|||
|
Expected term (years) |
|
|
6.0 |
|
|
|
6.0 |
|
|
|
6.0 |
|
|
Expected volatility |
|
|
64.5 |
% |
|
|
58.1 |
% |
|
|
52.6 |
% |
|
Risk-free interest rate |
|
|
1.62 |
% |
|
|
1.62 |
% |
|
|
2.03 |
% |
|
Estimated dividend yield |
|
|
— |
% |
|
|
— |
% |
|
|
— |
% |
The weighted average grant date fair value per share of stock options granted for the years ended December 31, 2015, 2016 and 2017 and were $1.12, $11.61 and $22.48, respectively. The total intrinsic value of options exercised during the years ended December 31, 2015, 2016 and 2017 were $1.9 million, $13.7 million and $84.8 million, respectively.
Stock-based compensation expense related to stock options was $0.4 million, $1.7 million and $7.9 million for the years ended December 31, 2015, 2016 and 2017, respectively. At December 31, 2017, the Company had unrecognized employee stock-based compensation relating to stock options of approximately $36.7 million, which is expected to be recognized over a weighted-average period of 2.8 years.
On January 1, 2018, the number of shares authorized for grant under the Company’s 2016 Incentive Award Plan was increased by 1.7 million shares in accordance with plan provisions.
Restricted Stock and Restricted Stock Units
The following summarizes restricted stock activity:
|
|
|
Shares (in thousands) |
|
|
Weighted- Average Grant Date Fair Value Per Share |
|
||
|
Unvested as of December 31, 2016 |
|
|
193 |
|
|
$ |
29.65 |
|
|
Granted |
|
|
307 |
|
|
|
43.76 |
|
|
Vested |
|
|
(54 |
) |
|
|
30.06 |
|
|
Forfeited |
|
|
(28 |
) |
|
|
29.97 |
|
|
Unvested as of December 31, 2017 |
|
|
418 |
|
|
$ |
39.95 |
|
Stock-based compensation expense related to restricted stock was $0.1 million and $2.7 million for the years ended December 31, 2016 and 2017, respectively. At December 31, 2017, the Company had unrecognized employee stock-based compensation relating to restricted stock of approximately $15.6 million, which is expected to be recognized over a weighted-average period of 3.4 years.
Employee Stock Purchase Plan
In September 2016, the Company established an ESPP with 800,000 shares of Class A common stock available for issuance. As of December 31, 2017, 0.5 million shares remained available for grant under this plan. The number of shares authorized for grant is subject to increase each year on January 1, equal to the lesser of (a) 800,000 shares, (b) 1% of the common stock outstanding (on an as-converted basis) on the final day of the immediately preceding calendar year, and (c) such smaller number of shares as determined by the Company’s board of directors.
Under the ESPP, all eligible employees were auto-enrolled upon the IPO and each eligible employee was then permitted to authorize payroll deductions of up to 100% of their compensation to purchase shares of Class A common stock, subject to applicable ESPP and statutory limits. The ESPP provides for offering periods generally up to two years, with purchases occurring and new offering periods commencing generally every six months. The first ESPP purchase (pursuant to a truncated purchase period starting on the Company’s IPO) occurred on December 29, 2016, and subsequent purchases will generally occur on May 15th and November 15th each year. At each purchase date, employees are able to purchase shares at 85% of the lower of (1) the closing market price per share of Class A common stock on the employee’s enrollment into the applicable offering period and (2) the closing market price per share of Class A common stock on the purchase date. The ESPP has an automatic reset feature, whereby the offering period resets if the fair value of the Company’s common stock on a purchase date is less than that on the original offering date.
73
The fair value of ESPP shares was estimated using the Black-Scholes option pricing model with the following weighted-average assumptions:
|
|
|
Year ended December 31, |
|
|||||
|
|
|
2016 |
|
|
2017 |
|
||
|
Expected term (years) |
|
|
0.8 |
|
|
|
0.9 |
|
|
Expected volatility |
|
|
48.9 |
% |
|
|
45.9 |
% |
|
Risk-free interest rate |
|
|
0.69 |
% |
|
|
1.22 |
% |
|
Estimated dividend yield |
|
|
— |
% |
|
|
— |
% |
The first offering period allowed for cash contributions in addition to payroll deductions, and as a result, stock-based compensation expense for this offering period was marked-to-market. On December 14, 2016, the cash contribution feature was removed and the final mark-to-market adjustment was recorded as of this date. The ESPP has a six month holding period (12 months for the first offering period) with respect to common stock purchases. Due to the holding period, the Company applies a discount to reflect the non-transferability of the shares. Stock-based compensation expense related to ESPP totaled $3.3 million and $10.7 million for the years ended December 31, 2016 and 2017, respectively, and stock-based compensation related to the first offering period was $3.3 million and $10.1 million for the years ended December 31, 2016 and 2017, respectively. The first offering period is scheduled to expire immediately following the November 15, 2018 purchase date. At December 31, 2017, the Company had unrecognized employee stock-based compensation relating to ESPP awards of approximately $6.6 million, which is expected to be recognized over a weighted-average period of 0.7 years.
On January 1, 2018, the number of shares available for issuance under the Company’s Employee Stock Purchase Plan was increased by 0.4 million shares in accordance with plan provisions.
Note 11—Income Taxes
The following are the domestic and foreign components of the Company’s income (loss) before income taxes (in thousands):
|
|
|
Year Ended December 31, |
|
|||||||||
|
|
|
2015 |
|
|
2016 |
|
|
2017 |
|
|||
|
Domestic |
|
$ |
29,224 |
|
|
$ |
45,904 |
|
|
$ |
66,148 |
|
|
International |
|
|
631 |
|
|
|
(2,070 |
) |
|
|
(2,523 |
) |
|
Income before income taxes |
|
$ |
29,855 |
|
|
$ |
43,834 |
|
|
$ |
63,625 |
|
The following are the components of the provision for (benefit from) income taxes (in thousands):
|
|
|
Year Ended December 31, |
|
|||||||||
|
|
|
2015 |
|
|
2016 |
|
|
2017 |
|
|||
|
Current: |
|
|
|
|
|
|
|
|
|
|
|
|
|
Federal |
|
$ |
11,123 |
|
|
$ |
18,300 |
|
|
$ |
9,944 |
|
|
State and local |
|
|
2,325 |
|
|
|
5,595 |
|
|
|
3,906 |
|
|
Foreign |
|
|
140 |
|
|
|
64 |
|
|
|
558 |
|
|
Total current provision |
|
|
13,588 |
|
|
|
23,959 |
|
|
|
14,408 |
|
|
Deferred: |
|
|
|
|
|
|
|
|
|
|
|
|
|
Federal |
|
|
197 |
|
|
|
(68 |
) |
|
|
(172 |
) |
|
State and local |
|
|
141 |
|
|
|
(539 |
) |
|
|
(1,382 |
) |
|
Foreign |
|
|
— |
|
|
|
— |
|
|
|
(27 |
) |
|
Total deferred (benefit) provision |
|
|
338 |
|
|
|
(607 |
) |
|
|
(1,581 |
) |
|
Total provision for income taxes |
|
$ |
13,926 |
|
|
$ |
23,352 |
|
|
$ |
12,827 |
|
74
A reconciliation of the statutory tax rate to the effective tax rate for the periods presented is as follows:
|
|
|
Year Ended December 31, |
|
|||||||||
|
|
|
2015 |
|
|
2016 |
|
|
2017 |
|
|||
|
U.S. federal statutory income tax rate |
|
|
35.0 |
% |
|
|
35.0 |
% |
|
|
35.0 |
% |
|
State and local income taxes, net of federal benefit |
|
|
5.4 |
|
|
|
7.5 |
|
|
|
2.6 |
|
|
Foreign income at other than U.S. rates |
|
|
(0.3 |
) |
|
|
1.1 |
|
|
|
2.7 |
|
|
Stock-based compensation |
|
|
0.4 |
|
|
|
3.8 |
|
|
|
(19.0 |
) |
|
Meals and entertainment |
|
|
0.2 |
|
|
|
0.3 |
|
|
|
0.4 |
|
|
Change in value of preferred stock warrant liabilities |
|
|
7.0 |
|
|
|
7.6 |
|
|
|
— |
|
|
Research and development credit |
|
|
(1.0 |
) |
|
|
(3.1 |
) |
|
|
(2.8 |
) |
|
Federal deferred tax asset revaluation |
|
|
— |
|
|
|
— |
|
|
|
0.9 |
|
|
Other permanent items |
|
|
(0.1 |
) |
|
|
0.4 |
|
|
|
0.9 |
|
|
Change in valuation allowance |
|
|
— |
|
|
|
0.7 |
|
|
|
(0.5 |
) |
|
Effective income tax rate |
|
|
46.6 |
% |
|
|
53.3 |
% |
|
|
20.2 |
% |
Set forth below are the tax effects of temporary differences that give rise to a significant portion of the deferred tax assets and deferred tax liabilities (in thousands):
|
|
|
As of December 31, |
|
|||||
|
|
|
2016 |
|
|
2017 |
|
||
|
Deferred tax assets (liabilities): |
|
|
|
|
|
|
|
|
|
Reserves and allowances |
|
$ |
1,774 |
|
|
$ |
1,804 |
|
|
Accrued expenses |
|
|
2,651 |
|
|
|
1,810 |
|
|
Net operating losses |
|
|
326 |
|
|
|
— |
|
|
Research and development tax credit |
|
|
280 |
|
|
|
774 |
|
|
Stock-based compensation |
|
|
126 |
|
|
|
1,722 |
|
|
Other |
|
|
760 |
|
|
|
971 |
|
|
Prepaid expenses |
|
|
(484 |
) |
|
|
(580 |
) |
|
Property and equipment |
|
|
(2,254 |
) |
|
|
(2,026 |
) |
|
Capitalized software development costs |
|
|
(1,075 |
) |
|
|
(1,116 |
) |
|
Valuation allowance |
|
|
(326 |
) |
|
|
— |
|
|
Total deferred tax assets, net |
|
$ |
1,778 |
|
|
$ |
3,359 |
|
As of each reporting date, the Company’s management considers new evidence, both positive and negative, that could impact management’s view with regard to future realization of deferred tax assets. During 2016, management recorded a valuation allowance of $0.3 million against its U.K. net deferred tax assets, based on the previous history of cumulative losses and the conclusion that future taxable profit may not be available for the utilization of the deferred tax assets for U.K. income tax purposes. During 2017, management released the valuation allowance due to, among other reasons, three years of cumulative pre-tax income. Management determined that sufficient positive evidence existed to conclude that it is more likely than not there will be full utilization of the deferred tax assets in the U.K.; therefore, the entire valuation allowance of $0.3 million was released during 2017.
As of December 31, 2017, the Company had state research and development tax credits of approximately $1.3 million, which carry forward indefinitely.
As of December 31, 2017, unremitted earnings of the subsidiaries outside of the U.S. were approximately $4.8 million, on which no state taxes have been paid. The Company’s intention is to indefinitely reinvest these earnings outside the U.S. Upon distribution of those earnings in the form of a dividend or otherwise, the Company would be subject to both state income taxes and withholding taxes payable to various foreign countries. The amounts of such tax liabilities that might be payable upon repatriation of foreign earnings are not material.
As of December 31, 2016 and 2017, the Company had gross unrecognized tax benefits of approximately $1.0 million and $3.1 million, respectively, which would affect the Company’s effective tax rate if recognized. The Company classifies liabilities for unrecognized tax benefits in other liabilities, non-current.
75
A reconciliation of the beginning and ending amounts of gross unrecognized tax benefits is as follows (in thousands):
|
Balance at December 31, 2015 |
|
$ |
— |
|
|
Increases related to current year tax positions |
|
|
605 |
|
|
Increases related to prior year tax positions |
|
|
402 |
|
|
Balance at December 31, 2016 |
|
|
1,007 |
|
|
Increases related to current year tax positions |
|
|
1,971 |
|
|
Increases related to prior year tax positions |
|
|
123 |
|
|
Balance at December 31, 2017 |
|
$ |
3,101 |
|
Interest and penalties related to the Company’s unrecognized tax benefits accrued as of December 31, 2017 were not material.
The Company is currently under examination by the Internal Revenue Service for the years ended December 31, 2014 and 2015. The examination is in the preliminary stage and therefore, the Company does not expect significant changes to the unrecognized tax benefits during the next twelve months.
The Company is subject to examination by taxing authorities in the U.S. federal, state and various foreign jurisdictions. For federal and state income taxes, the Company remains subject to examination for 2010 and subsequent years. The majority of the Company’s foreign subsidiaries remain subject to examination by the local taxing authorities for 2013 and subsequent periods.
Note 12—Segment and Geographic Information
The Company has determined that it operates as one operating segment. The Company’s chief operating decision maker reviews financial information on a consolidated basis, together with certain operating and performance measures principally to make decisions about how to allocate resources and measure performance.
Gross Billings, based on the billing address of the clients or client affiliates, were as follows (in thousands):
|
|
|
Year Ended December 31, |
|
|||||||||
|
|
|
2015 |
|
|
2016 |
|
|
2017 |
|
|||
|
US |
|
$ |
477,585 |
|
|
$ |
868,877 |
|
|
$ |
1,270,116 |
|
|
International |
|
|
52,390 |
|
|
|
121,684 |
|
|
|
221,626 |
|
|
Total |
|
$ |
529,975 |
|
|
$ |
990,561 |
|
|
$ |
1,491,742 |
|
The Company’s property and equipment, net located outside the U.S. was $2.5 million and $3.6 million as of December 31, 2016 and 2017, respectively.
Note 13—Commitments and Contingencies
The Company has various non-cancelable operating leases primarily for its corporate and international offices. As of December 31, 2017, the Company’s non-cancelable minimum lease commitments were as follows (in thousands):
|
Year |
|
Amount |
|
|
|
2018 |
|
$ |
7,570 |
|
|
2019 |
|
|
7,724 |
|
|
2020 |
|
|
7,387 |
|
|
2021 |
|
|
6,309 |
|
|
2022 |
|
|
2,552 |
|
|
Thereafter |
|
|
211 |
|
|
|
|
$ |
31,753 |
|
Rent expense for non-cancelable operating leases was $2.2 million, $4.8 million and $8.2 million for the years ended December 31, 2015, 2016 and 2017, respectively.
76
As of December 31, 2017, the Company has non-cancelable commitments to its hosting services providers, marketing contracts and commitments to providers of software as a service. As of December 31, 2017, the Company’s purchase obligations were as follows (in thousands):
|
Year |
|
Amount |
|
|
|
2018 |
|
$ |
27,914 |
|
|
2019 |
|
|
8,871 |
|
|
2020 |
|
|
214 |
|
|
|
|
$ |
36,999 |
|
Guarantees and Indemnification
In the ordinary course of business, the Company may provide indemnifications of varying scope and terms to clients, vendors, lessors, business partners, and other parties with respect to certain matters, including, but not limited to, losses arising out of breach of such agreements, services to be provided by the Company or from intellectual property infringement claims made by third parties. In addition, the Company has entered into indemnification agreements with directors and certain officers and employees that will require the Company, among other things, to indemnify them against certain liabilities that may arise by reason of their status or service as directors, officers or employees. No demands have been made upon the Company to provide indemnification under such agreements, and thus there are no claims that the Company is aware of that could have a material effect on the Company’s balance sheet, statement of operations or statement of cash flows. Accordingly, no amounts for any obligation have been recorded as of December 31, 2016 and 2017.
From time to time, the Company is subject to various legal proceedings and claims, either asserted or unasserted, that arise in the ordinary course of business. Although the outcome of the various legal proceedings and claims cannot be predicted with certainty, management does not believe that any of these proceedings or other claims will have a material adverse effect on the Company’s business, financial condition, results of operations or cash flows.
Employment Contracts
The Company has entered into agreements with severance terms with certain employees and officers, all of whom are employed on an at-will basis, subject to certain severance obligations in the event of certain involuntary terminations. The Company may be required to accelerate the vesting of certain stock options in the event of changes in control, as defined and involuntary terminations.
Note 14—Related Party Transactions
From January to May 2015, the Company processed $0.2 million of spend through its platform with Falk Technologies GmbH. Thomas Falk, one of the Company’s directors, was previously the chief executive officer of Falk Technologies GmbH during such period.
77
Item 9. Changes in and Disagreements with Accountants on Accounting and Financial Disclosure
None.
Item 9A. Controls and Procedures
Evaluation of Disclosure Controls and Procedures
Our management, with the participation of our Chief Executive Officer (“CEO”) and Chief Financial Officer (“CFO”), evaluated the effectiveness of our disclosure controls and procedures as defined in Rules 13a-15(e) and 15d-15(e) under the Securities Exchange Act of 1934, as amended (the “Exchange Act”), as of December 31, 2017. Our disclosure controls and procedures are designed to provide reasonable assurance that information we are required to disclose in the reports we file or submit under the Exchange Act is accumulated and communicated to our management, including our CEO and CFO, as appropriate to allow timely decisions regarding required disclosures, and is recorded, processed, summarized, and reported within the time periods specified in the SEC’s rules and forms. Based on this evaluation, our CEO and CFO have concluded that, due to the material weakness in our internal control over financial reporting as described below, our disclosure controls and procedures were not effective at the reasonable assurance level as of December 31, 2017.
Our management, including our CEO and CFO, has concluded that, notwithstanding the material weakness in our internal control over financial reporting, the consolidated financial statements in this Annual Report on Form 10-K fairly present, in all material respects, our financial position, results of operations and cash flows for the periods presented in conformity with U.S. GAAP.
Management’s Report on Internal Control over Financial Reporting
Management is responsible for establishing and maintaining adequate internal control over financial reporting, as defined in Rules 13a-15(f) and 15d-15(f) under the Exchange Act. Our internal control over financial reporting is a process designed to provide reasonable assurance regarding the reliability of financial reporting and the preparation of our financial statements for external purposes in accordance with generally accepted accounting principles.
Management assessed the effectiveness of our internal control over financial reporting as of December 31, 2017 using the criteria set forth by the Committee of Sponsoring Organizations of the Treadway Commission in Internal Control—Integrated Framework (2013). Based on its assessment, our management, including our CEO and CFO, has concluded that our internal control over financial reporting was not effective as of December 31, 2017 due to a material weakness in our internal control over financial reporting resulting from an absence of information technology general controls (“ITGCs”) over certain financially significant applications. These control deficiencies resulted in an immaterial adjustment which was identified and corrected in the same period. Additionally, these control deficiencies could impact the effectiveness of information technology dependent controls which could result in material misstatements of the consolidated financial statements and disclosures that would not be prevented or detected. Accordingly, our management has determined that these control deficiencies constitute a material weakness.
A material weakness is a deficiency, or a combination of deficiencies, in internal control over financial reporting, such that there is a reasonable possibility that a material misstatement of our annual or interim financial statements will not be prevented or detected on a timely basis.
The effectiveness of our internal control over financial reporting as of December 31, 2017 has been audited by PricewaterhouseCoopers LLP, our independent registered public accounting firm, as stated in their report, which appears in Item 8 of this Annual Report on Form 10-K.
Completion of Remediation Measures
During the quarter ended December 31, 2017, we completed the remediation measures including the validation, testing of the design and concluding on the operating effectiveness of our controls related to the following previously reported material weaknesses in internal control over financial reporting:
|
|
• |
our failure to maintain a sufficient complement of resources with an appropriate level of accounting knowledge, experience and training commensurate with our structure and financial reporting requirements; |
|
|
• |
the absence of formalized policies and controls designed to address accounting policies and procedures across multiple processes; and |
\
|
|
• |
the lack of formal policies and procedures around segregation of duties. |
78
Regarding the previously reported material weakness resulting from the absence of ITGCs over certain financially significant applications, during the quarter ended December 31, 2017, we completed the remediation measures including validation, testing of the design and concluding on the operating effectiveness of ITGCs over our financially significant applications, with the exception of our platform system applications as discussed below.
We have not completed the remediation measures related to certain ITGCs over our platform system applications as of December 31, 2017. Certain ITGCs related to our platform system applications were not fully implemented or have not been in place for a sufficient period of time to adequately evaluate whether the related material weakness has been completely remediated as of December 31, 2017. During the quarter ended December 31, 2017, we implemented certain controls over our platform system applications related to restricted access and change management.
These internal controls will require further evaluation, including testing the operating effectiveness of these internal controls over a sustained period of financial reporting cycles.
The actions that we are taking are subject to ongoing review by our management, including our CEO and CFO, as well as audit committee oversight. As we continue to evaluate and work to remediate the control deficiencies that gave rise to the material weakness, we may also conclude that additional measures may be required to remediate the material weakness in our internal control over financial reporting, which may necessitate additional time. We will continue to assess the effectiveness of our internal control over financial reporting and take steps to remediate our material weakness expeditiously.
Changes in Internal Control over Financial Reporting
During the quarter ended December 31, 2017, we implemented certain controls over our platform system applications related to restricted access and change management that have materially affected, or are reasonably likely to materially affect, our internal control over financial reporting.
Inherent Limitations on Effectiveness of Controls
Management recognizes that a control system, no matter how well conceived and operated, can provide only reasonable, not absolute, assurance that the objectives of the control system are met. Further, the design of a control system must reflect the fact that there are resource constraints, and the benefits of controls must be considered relative to their costs. Because of the inherent limitations in all control systems, no evaluation of controls can provide absolute assurance that all control issues and instances of fraud or error, if any, have been detected. These inherent limitations include the realities that judgments in decision making can be faulty, and that breakdowns can occur because of a simple error or mistake. Additionally, controls can be circumvented by the individual acts of some persons, by collusion of two or more people, or by management override of the controls. The design of any system of controls also is based in part upon certain assumptions about the likelihood of future events, and there can be no assurance that any design will succeed in achieving its stated goals under all potential future conditions; over time, controls may become inadequate because of changes in conditions, or the degree of compliance with policies or procedures may deteriorate. Because of the inherent limitations in a cost-effective control system, misstatements due to error or fraud may occur and not be detected.
None.
79
Item 10. Directors, Executive Officers and Corporate Governance
The information required by this item in our proxy statement relating to our 2018 annual meeting of stockholders to be filed by us with the Securities and Exchange Commission no later than 120 days after the close of our fiscal year ended December 31, 2017 (the "Proxy Statement") and is incorporated herein by reference.
We have a code of business ethics and conduct that applies to all of our employees, including our Principal Executive Officer, Principal Financial Officer, Principal Accounting Officer, and our Board of Directors. A copy of this code, "Code of Business Conduct and Ethics", is available on our website at http://investors.thetradedesk.com. We intend to satisfy the disclosure requirement under Item 5.05 of Form 8-K regarding amendment to, or waiver from, a provision of our Code of Business Conduct and Ethics by posting such information on our investor relations website under the heading "Leadership & Governance" at http://investors.thetradedesk.com.
Item 11. Executive Compensation
The information required by this item will be included in the Proxy Statement and is incorporated herein by reference.
Item 12. Security Ownership of Certain Beneficial Owners and Management and Related Stockholder Matters
The information required by this item will be included in the Proxy Statement and is incorporated herein by reference.
Item 13. Certain Relationships and Related Transactions, and Director Independence
The information required by this item will be included in the Proxy Statement and is incorporated herein by reference.
Item 14. Principal Accounting Fees and Services
The information required by this item will be included in the Proxy Statement and is incorporated herein by reference.
80
Item 15. Exhibits and Financial Statement Schedules
(a) We have filed the following documents as part of this Annual Report on Form 10-K:
1. Consolidated Financial Statements
See Index to Consolidated Financial Statements in Item 8 herein.
2. Financial Statement Schedules
No financial statement schedules are provided because the information called for is not required or is shown in the financial statements of the notes thereto.
3. Exhibits
Exhibits required to be filed as part of this report are:
|
Exhibit |
|
|
|
Incorporated by Reference |
|
|
Filed |
||||
|
Number |
|
Exhibit Description |
|
Form |
|
Filing Date |
|
Number |
|
|
Herewith |
|
|
|
|
|
|
|
|
|
|
|
|
|
|
3.1 |
|
|
S-1/A |
|
9/6/2016 |
|
3.2 |
|
|
|
|
|
|
|
|
|
|
|
|
|
|
|
|
|
|
3.2 |
|
|
S-1 |
|
8/22/2016 |
|
3.4 |
|
|
|
|
|
|
|
|
|
|
|
|
|
|
|
|
|
|
4.1 |
|
|
|
|
|
|
|
|
|
|
|
|
|
|
|
|
|
|
|
|
|
|
|
|
|
4.2 |
|
|
S-1/A |
|
9/6/2016 |
|
4.2 |
|
|
|
|
|
|
|
|
|
|
|
|
|
|
|
|
|
|
4.3 |
|
|
S-8 |
|
9/22/2016 |
|
4.4 |
|
|
|
|
|
|
|
|
|
|
|
|
|
|
|
|
|
|
10.1 |
|
|
S-1/A |
|
9/6/2016 |
|
10.1 |
|
|
|
|
|
|
|
|
|
|
|
|
|
|
|
|
|
|
10.2(a) |
|
|
S-1/A |
|
9/6/2016 |
|
10.2 |
|
|
|
|
|
|
|
|
|
|
|
|
|
|
|
|
|
|
10.2(b) |
|
|
10-Q |
|
5/11/2017 |
|
10.1 |
|
|
|
|
|
|
|
|
|
|
|
|
|
|
|
|
|
|
10.3(a)+ |
|
|
S-1/A |
|
9/6/2016 |
|
10.5 |
(a) |
|
|
|
|
|
|
|
|
|
|
|
|
|
|
|
|
|
10.3(b)+ |
|
Form of Stock Option Agreement under The Trade Desk, Inc. 2010 Stock Plan. |
|
S-1/A |
|
9/6/2016 |
|
10.5 |
(b) |
|
|
|
|
|
|
|
|
|
|
|
|
|
|
|
|
10.3(c)+ |
|
|
S-1/A |
|
9/6/2016 |
|
10.5 |
(c) |
|
|
|
|
|
|
|
|
|
|
|
|
|
|
|
|
|
10.4(a)+ |
|
|
S-1/A |
|
9/6/2016 |
|
10.6 |
(a) |
|
|
|
|
|
|
|
|
|
|
|
|
|
|
|
|
|
10.4(b)+ |
|
First Amendment to The Trade Desk, Inc. 2015 Equity Incentive Plan |
|
S-8 |
|
9/22/2016 |
|
99.2 |
|
|
|
|
|
|
|
|
|
|
|
|
|
|
|
|
|
10.4(c)+ |
|
Form of Stock Option Agreement under The Trade Desk, Inc. 2015 Equity Incentive Plan. |
|
S-1/A |
|
9/6/2016 |
|
10.6 |
(b) |
|
|
|
|
|
|
|
|
|
|
|
|
|
|
|
|
10.4(d)+ |
|
|
S-1/A |
|
9/6/2016 |
|
10.6 |
(c) |
|
|
|
|
|
|
|
|
|
|
|
|
|
|
|
|
|
10.4(e)+ |
|
Exercise Notice under The Trade Desk, Inc. 2015 Equity Incentive Plan. |
|
S-1/A |
|
9/6/2016 |
|
10.6 |
(d) |
|
|
|
|
|
|
|
|
|
|
|
|
|
|
|
|
10.5(a)+ |
|
|
S-1 |
|
8/22/2016 |
|
10.7 |
(a) |
|
|
|
|
|
|
|
|
|
|
|
|
|
|
|
|
|
10.5(b)+ |
|
Form of Stock Option Agreement under The Trade Desk, Inc. 2016 Equity Incentive Plan. |
|
S-1 |
|
8/22/2016 |
|
10.7 |
(b) |
|
|
81
|
+ |
Indicates a management contract or compensatory plan or arrangement. |
|
(1) |
The information in this exhibit is furnished and deemed not filed with the Securities and Exchange Commission for purposes of section 18 of the Securities Exchange Act of 1934, as amended, or the Exchange Act, and is not to be incorporated by reference into any filing of The Trade Desk, Inc. under the Securities Act of 1933, as amended, of the Securities Act, or the Exchange Act, whether made before or after the date hereof, regardless of any general incorporation language in such filing. |
None.
82
Pursuant to the requirements of Section 13 or 15(d) of the Securities Exchange Act of 1934, the registrant has duly caused this Annual Report on Form 10-K to be signed on its behalf by the undersigned, thereunto duly authorized, in Ventura, California, on the 27th day of February, 2018.
|
THE TRADE DESK, INC. |
||
|
|
|
|
|
By: |
|
/s/ PAUL E. ROSS |
|
|
|
Paul E. Ross |
KNOW ALL PERSONS BY THESE PRESENTS, that each person whose signature appears below constitutes and appoints Jeff T. Green and Paul E. Ross, jointly and severally, as his or her true and lawful attorneys-in-fact and agents, with full power of substitution and resubstitution, for him or her and in his or her name, place and stead, in any and all capacities, to sign any and all amendments to this Annual Report on Form 10-K, and to file the same, with all exhibits thereto, and other documents in connection therewith, with the Securities and Exchange Commission, granting unto said attorneys-in-fact and agents, and each of them, full power and authority to do and perform each and every act and thing requisite and necessary to be done in connection therewith, as fully to all intents and purposes as he or she might or could do in person, hereby ratifying and confirming that all said attorneys-in-fact and agents, or any of them or their or his or her substitute or substitutes, may lawfully do or cause to be done by virtue hereof.
Pursuant to the requirements of the Securities Exchange Act of 1934, this Annual Report on Form 10-K has been signed by the following persons on behalf of the Registrant and in the capacities and on the dates indicated:
|
Signature |
|
Title |
|
Date |
|
|
|
|
|
|
|
/s/ JEFF T. GREEN |
|
Chief Executive Officer, Director (principal |
|
February 27, 2018 |
|
Jeff T. Green |
|
executive officer) |
|
|
|
|
|
|
|
|
|
/s/ PAUL E. ROSS |
|
Chief Financial Officer (principal financial |
|
February 27, 2018 |
|
Paul E. Ross |
|
officer and principal accounting officer) |
|
|
|
|
|
|
|
|
|
/s/ ROBERT D. PERDUE |
|
Chief Operating Officer, Director |
|
February 27, 2018 |
|
Robert D. Perdue |
|
|
|
|
|
|
|
|
|
|
|
/s/ KATHRYN E. FALBERG |
|
Director |
|
February 27, 2018 |
|
Kathryn E. Falberg |
|
|
|
|
|
|
|
|
|
|
|
/s/ THOMAS FALK |
|
Director |
|
February 27, 2018 |
|
Thomas Falk |
|
|
|
|
|
|
|
|
|
|
|
/s/ ERIC B. PALEY |
|
Director |
|
February 27, 2018 |
|
Eric B. Paley |
|
|
|
|
|
|
|
|
|
|
|
/s/ JUAN N. VILLALONGA |
|
Director |
|
February 27, 2018 |
|
Juan N. Villalonga |
|
|
|
|
|
|
|
|
|
|
|
/s/ DAVID B. WELLS |
|
Director |
|
February 27, 2018 |
|
David B. Wells |
|
|
|
|
83