Attached files
| file | filename |
|---|---|
| EX-32.1 - EXHIBIT 32.1 - Element Solutions Inc | pah10-k20171231ex321.htm |
| EX-31.2 - EXHIBIT 31.2 - Element Solutions Inc | pah10-k20171231ex312.htm |
| EX-31.1 - EXHIBIT 31.1 - Element Solutions Inc | pah10-k20171231ex311.htm |
| EX-24.1 - EXHIBIT 24.1 - Element Solutions Inc | pah10-k20171231ex241.htm |
| EX-23.1 - EXHIBIT 23.1 - Element Solutions Inc | pah10-k20171231ex231.htm |
| EX-21.1 - EXHIBIT 21.1 - Element Solutions Inc | pah10-k20171231ex211.htm |
| EX-10.22 - EXHIBIT 10.22 - Element Solutions Inc | pah10-k20171231ex1022.htm |
UNITED STATES
SECURITIES AND EXCHANGE COMMISSION
Washington, D.C. 20549
FORM 10-K
ý ANNUAL REPORT PURSUANT TO SECTION 13 OR 15(d) OF THE SECURITIES EXCHANGE ACT OF 1934
For the fiscal year ended December 31, 2017
OR
o TRANSITION REPORT PURSUANT TO SECTION 13 OR 15(d) OF THE SECURITIES EXCHANGE ACT OF 1934
For the transition period from ________ to _______
Commission file number: 001-36272

(Exact name of Registrant as specified in its charter)
Delaware | 37-1744899 |
(State or other jurisdiction of incorporation or organization) | (I.R.S. Employer Identification No.) |
1450 Centrepark Boulevard, Suite 210 West Palm Beach, Florida | 33401 (Zip Code) |
(Address of principal executive offices) | |
Registrant’s telephone number, including area code: (561) 207-9600
Securities registered pursuant to Section 12(b) of the Act:
Title of Each Class | Name of Each Exchange on Which Registered |
Common Stock, par value $0.01 per share | The New York Stock Exchange |
Securities registered pursuant to Section 12(g) of the Act:
None
Indicate by check mark if the registrant is a well-known seasoned issuer, as defined in Rule 405 of the Securities Act. Yes ý No o
Indicate by check mark if the registrant is not required to file reports pursuant to Section 13 or Section 15(d) of the Exchange Act. Yes o No ý
Indicate by check mark whether the registrant (1) has filed all reports required to be filed by Section 13 or 15(d) of the Securities Exchange Act of 1934 during the preceding 12 months (or for such shorter period that the registrant was required to file such reports), and (2) has been subject to such filing requirements for the past 90 days. Yes ý No o
Indicate by check mark whether the registrant has submitted electronically and posted on its corporate Web site, if any, every Interactive Data File required to be submitted and posted pursuant to Rule 405 of Regulation S-T during the preceding 12 months (or for such shorter period that the registrant was required to submit and post such files).Yes ý No o
Indicate by check mark if disclosure of delinquent filers pursuant to Item 405 of Regulation S-K is not contained herein, and will not be contained, to the best of registrant’s knowledge, in definitive proxy or information statements incorporated by reference in Part III of this Form 10-K or any amendment to this Form 10-K. o
Indicate by check mark whether the registrant is a large accelerated filer, an accelerated filer, a non-accelerated filer, or a smaller reporting company. See the definitions of “large accelerated filer,” “accelerated filer,” and “smaller reporting company” in Rule 12b-2 of the Exchange Act.
Large accelerated filer x | Accelerated filer o | Non-Accelerated filer o | Smaller reporting company o |
Emerging growth company o | |||
If an emerging growth company, indicate by check mark if the registrant has elected not to use the extended transition period for complying with any new or revised financial accounting standards provided pursuant to Section 13(a) of the Exchange Act. o
Indicate by check mark whether the registrant is a shell company (as defined in Rule 12b-2 of the Exchange Act) Yes o No ý
The number of shares of common stock outstanding as of February 23, 2018 was 288,028,893. The aggregate market value of the common stock held by non-affiliates as of June 30, 2017 was approximately $2.94 billion, based upon the last reported sales price for such date on the NYSE. All (i) executive officers and directors of the registrant and (ii) all persons who hold 10% or more of the registrant’s outstanding common stock have been deemed, solely for the purpose of the foregoing calculation, to be “affiliates” of the registrant.
Documents Incorporated By Reference
Portions of the registrant’s definitive proxy statement for its 2018 annual meeting of stockholders, which 2018 Proxy Statement will be filed no later than 120 days after the close of the registrant’s fiscal year ended December 31, 2017, are hereby incorporated by reference in Part III of this 2017 Annual Report on Form 10-K.
Platform Specialty Products Corporation
ANNUAL REPORT ON FORM 10-K
For the year ended December 31, 2017
Table of Contents
Glossary | Page | ||
GLOSSARY OF DEFINED TERMS
Terms | Definitions | |
Platform; Successor; We; Us; Our; the Company | Platform Specialty Products Corporation, a Delaware corporation, and its subsidiaries, collectively, for all periods subsequent to the MacDermid Acquisition. | |
Acquisitions | Agriphar Acquisition, Alent Acquisition, Arysta Acquisition, CAS Acquisition, MacDermid Acquisition, OMG Acquisition and OMG Malaysia Acquisition, collectively. | |
Agriphar | Percival S.A., a formerly Belgium société anonyme, and its agrochemical business, Agriphar. | |
Agriphar Acquisition | Acquisition of a 100% interest in Agriphar, completed on October 1, 2014. | |
AIs | Active ingredients. | |
Alent | Alent plc, a formerly public limited company registered in England and Wales. | |
Alent Acquisition | Acquisition of a 100% interest in Alent, completed on December 1, 2015 under the U.K. Companies Act 2006, as amended. | |
Amended and Restated Credit Agreement | Platform's Second Amended and Restated Credit Agreement, dated as of August 6, 2014, among, inter alia, Platform, MacDermid Holdings, LLC, MacDermid, the subsidiaries of Platform and MacDermid Holdings, LLC from time to time parties thereto, the lenders from time to time parties thereto and Barclays Bank PLC, as administrative agent and collateral agent, as amended and restated from time to time. | |
Arysta | Arysta LifeScience Limited, formerly an Irish private limited company. | |
Arysta Acquisition | Acquisition of a 100% interest in Arysta, completed on February 13, 2015. | |
Arysta Seller | Nalozo, L.P., an affiliate of Nalozo S.à.r.l., a Luxembourg limited liability company and the original seller in the Arysta Acquisition. | |
ASC | Accounting Standard Codification. | |
ASU | Accounting Standards Update. | |
Board | Platform’s board of directors. | |
Bribery Act | The United Kingdom Bribery Act 2010. | |
CAS | Chemtura AgroSolutions business of Chemtura. | |
CAS Acquisition | Acquisition of a 100% interest in CAS, completed on November 3, 2014. | |
Chemtura | Chemtura Corporation, a Delaware corporation. | |
Credit Facilities | The First Lien Credit Facility and the Revolving Credit Facility, collectively, available under the Amended and Restated Credit Agreement. | |
EBITDA | Earnings before interest, taxes, depreciation and amortization. | |
ESPP | Platform Specialty Products Corporation 2014 Employee Stock Purchase Plan. | |
E.U. | European Union. | |
Exchange Act | Securities Exchange Act of 1934, as amended. | |
FASB | Financial Accounting Standard Board. | |
FCPA | Foreign Corrupt Practices Act of 1977. | |
February 2015 Notes Offering | Platform's private offering of $1.10 billion aggregate principal amount of 6.50% USD Notes due 2022 and €350 million aggregate principal amount of 6.00% EUR Notes due 2023, completed on February 2, 2015. | |
First Lien Credit Facility | First lien credit facility available under the Amended and Restated Credit Agreement. | |
Founder Entities | Mariposa Acquisition, LLC and Berggruen Holdings Ltd. and its affiliates, collectively. | |
GAAP | Generally Accepted Accounting Principles in the United States. | |
June 2015 Equity Offering | Platform's public offering of 18,226,414 shares of its common stock at a public offering price of $26.50 per share, which closed on June 29, 2015, raising gross proceeds of approximately $483 million. | |
MacDermid | MacDermid, Incorporated, a Connecticut corporation. | |
MacDermid Acquisition | Platform’s acquisition on October 31, 2013 of substantially all of the equity of MacDermid Holdings, LLC, which, at the time, owned approximately 97% of MacDermid. Platform acquired the remaining 3% of MacDermid on March 4, 2014, pursuant to the terms of the Exchange Agreement, dated October 25, 2013, between Platform and the fiduciaries of the MacDermid, Incorporated Profit Sharing and Employee Savings Plan. | |
MacDermid Printing | MacDermid Printing Solutions LLC, now known as MacDermid Graphics Solutions LLC. | |
G- 1
GLOSSARY OF DEFINED TERMS
Terms | Definitions | |
November 2015 Notes Offering | Platform's private offering of $500 million aggregate principal amount of 10.375% USD Notes due 2021, completed on November 10, 2015. | |
NYSE | New York Stock Exchange. | |
OEM | Original Equipment Manufacturer. | |
OMG | OM Group, Inc. (NYSE:OMG), a Delaware corporation. | |
OMG Businesses | OMG's Electronic Chemicals and Photomasks businesses, collectively, other than their Malaysian subsidiary acquired separately. | |
OMG Acquisition | Platform's acquisition of the OMG Businesses completed on October 28, 2015. | |
OMG Malaysia | OMG Electronic Chemicals (M) Sdn Bhd, a subsidiary of OMG located in Malaysia, acquired separately by Platform in the OMG Malaysia Acquisition. | |
OMG Malaysia Acquisition | Platform's acquisition of 100% interest in OMG Malaysia completed on January 31, 2016. | |
PCAOB | Public Company Accounting Oversight Board. | |
PDH | Platform Delaware Holdings, Inc., a subsidiary of Platform. | |
PDH Common Stock | Shares of common stock of PDH. | |
Predecessor | MacDermid and its subsidiaries, collectively, for all periods prior to the MacDermid Acquisition. | |
Predecessor 2013 Period | Ten-month period from January 1, 2013 through October 31, 2013. | |
Prior Senior Notes | Platform's 6.00% EUR Notes due 2023 and 6.50% USD Notes due 2022, collectively. | |
Proposed Separation | Platform's proposed separation of its Agricultural Solutions and Performance Solutions businesses which we expect to complete in 2018. | |
Retaining Holder | Each Holder of an equity interest of MacDermid Holdings, LLC immediately prior to the closing of the MacDermid Acquisition, not owned by Platform, who executed a RHSA. | |
Revolving Credit Facility | Revolving Credit Facility (in U.S. dollars or multicurrency) available under the Amended and Restated Credit Agreement. | |
RHSA | Retaining Holder Securityholders’ Agreement, dated as of October 31, 2013, entered into by and between Platform and each Retaining Holder pursuant to which they agreed to exchange their respective interests in MacDermid Holdings, LLC for shares of PDH Common Stock, at an exchange rate of $11.00 per share plus (i) a proportionate share of the $100 million contingent consideration and (ii) an interest in certain MacDermid pending litigation. | |
ROA | Return on assets. | |
RSUs | Restricted stock units issued by Platform from time to time under the 2013 Plan. | |
SEC | Securities and Exchange Commission. | |
Securities Act | Securities Act of 1933, as amended. | |
Senior Notes | Platform's 5.875% USD Notes due 2025, 6.00% EUR Notes due 2023 and 6.50% USD Notes due 2022, collectively. | |
September 2016 Equity Offering | Platform's public offering of 48,787,878 shares of its common stock at a public offering price of $8.25 per share, which closed on September 21, 2016, raising gross proceeds of approximately $402.5 million. | |
Series A Preferred Stock | Platform's 2,000,000 shares of Series A convertible preferred stock, which are convertible into shares of Platform’s common stock, on a one-for-one basis, at any time at the option of the Founder Entities. | |
Series B Convertible Preferred Stock | Platform's 600,000 shares of Series B convertible preferred stock issued to the Arysta Seller in connection with the Arysta Acquisition. At December 31, 2016, none of the Series B Convertible Preferred Stock remained outstanding. | |
SERP | Supplemental Executive Retirement Plan for executive officers of Platform. | |
Successor | Platform and its subsidiaries, collectively, for all periods subsequent to the MacDermid Acquisition. | |
Successor 2013 Period | Period from April 23, 2013 (inception) through December 31, 2013. | |
TCJA | Tax Cuts and Jobs Act of 2017. | |
USD Incremental Term Loan | Incremental term loan under the Incremental Amendment to the Amended and Restated Credit Agreement in an aggregate principal amount of $300 million used to finance the Agriphar Acquisition. | |
WACC | Weighted Average Cost of Capital. | |
G- 2
GLOSSARY OF DEFINED TERMS
Terms | Definitions | |
2013 Plan | Platform Specialty Products Corporation Amended and Restated 2013 Incentive Compensation Plan. | |
2017 Annual Report | This annual report on Form 10-K for the fiscal year ended December 31, 2017. | |
2017 Notes Offerings | Platform's private offering of $550 million aggregate principal amount of 5.875% USD Notes due 2025, completed on November 24, 2017, and tack-on private offering of $250 million aggregate principal amount of additional 5.875% USD Notes due 2025, completed on December 8, 2017, collectively. | |
2018 Proxy Statement | Platform’s definitive proxy statement for its 2018 annual meeting of stockholders expected to be filed no later than 120 days after December 31, 2017. | |
5.875% USD Notes Indenture | The indenture, dated as of November 24, 2017, governing the 5.875% USD Notes due 2025. | |
5.875% USD Notes due 2025 | Platform's 5.875% senior notes due 2023, denominated in U.S. dollars, issued in the 2017 Notes Offering. | |
6.00% EUR Notes due 2023 | Platform’s 6.00% senior notes due 2023, denominated in euros, issued in the February 2015 Notes Offering. | |
6.50% USD Notes due 2022 | Platform’s 6.50% senior notes due 2022, denominated in U.S. dollars, issued in the February 2015 Notes Offering. | |
10.375% USD Notes Indenture | The indenture, dated November 10, 2015, as amended from time to time, governing the 10.375% USD Notes due 2021. | |
10.375% USD Notes due 2021 | Platform's 10.375% senior notes due 2021, denominated in U.S. dollars, issued in the November 2015 Notes Offering. As of December 31, 2017, none of the 10.375% USD Notes due 2021 remained outstanding. | |
G- 3
Forward-Looking Statements
This 2017 Annual Report contains forward-looking statements that can be identified by words such as "expect," "anticipate," "project," "will," "should," "believe," "intend," "plan," "estimate," "predict," "believe," "seek," "continue," "outlook," "may," "might," "should," "can have," "likely," "potential," "target," and variations of such words and similar expressions. Examples of forward-looking statements include, but are not limited to, statements, beliefs, projections and expectations regarding the Proposed Separation and its anticipated benefits, costs related to the Proposed Separation, the impact of new accounting standards and accounting changes, the impact of the TCJA, our dividend policy, the effects of global economic conditions on our business and financial condition, our hedging activities, results of legal matters, our goodwill and other intangible assets, price volatility and cost environment, our liquidity, our funding sources, our capital expenditures, our debt, off-balance sheet arrangements and contractual obligations, general views about future operating results, our risk management program, our business and management strategies, future prospects, and other events or developments that we expect or anticipate will occur in the future.
Forward-looking statements are not guarantees of future performance, actions or events, and are subject to risks and uncertainties. If one or more of these risks or uncertainties materialize, or if management’s underlying beliefs and assumptions prove to be incorrect, actual results may differ materially from those contemplated by these statements. Forward-looking statements regarding the anticipated impact of the TCJA on the Company's businesses consist of provisional amounts, which are based on currently available information as well as management's current interpretations, assumptions and expectations relating to the TCJA, and subject to change, possibly materially, as the Company completes its analysis. A discussion of such risks and uncertainties include, without limitation, the risks set forth in Part I, Item 1A, "Risk Factors" in this 2017 Annual Report. Any forward-looking statement made by us in this 2017 Annual Report is based only on information currently available to us and speaks only as of the date on which it is made. We undertake no obligation to update or revise any forward-looking statement, whether as a result of new information, future events or otherwise. Please consult any further disclosures we make on related subjects in the Company’s Form 10-K, 10-Q and 8-K reports filed with the SEC.
Non-GAAP Financial Measures
This 2017 Annual Report contains the following non-GAAP financial measures: Adjusted EBITDA, operating results on a constant currency basis and organic sales growth. Non-GAAP financial measures should not be considered in isolation from, as a substitute for, or superior to performance measures calculated in accordance with GAAP. For definitions of these non-GAAP financial measures and additional information on why we present them, their respective limitations and reconciliations to the most comparable applicable GAAP measures, see "Non-GAAP Financial Measures" in the Management's Discussion and Analysis of Financial Condition and Results of Operations section in Part II, Item 7, and Note 23, Segment Information, to the Consolidated Financial Statements, all included in this 2017 Annual Report.
1
Part I
Item 1. Business
Unless the context otherwise indicates or requires, all product names and trade names used in this 2017 Annual Report are our trademarks, some of which may be registered in certain jurisdictions. Although we have omitted the “®” and “TM” trademark designations for some of these marks, all rights to such trademarks are nevertheless reserved. This 2017 Annual Report contains additional trade names of other companies. We do not intend our use or display of such other companies’ trade names to imply a relationship with, or endorsement or sponsorship of us by, these other companies. Unless otherwise specified in this 2017 Annual Report, all references to currency, monetary values and dollars set forth herein shall mean U.S. dollars.
Business Overview
Platform, incorporated in Delaware in January 2014, is a global and diversified producer of high-technology specialty chemical products. Our business involves the blending of a number of key ingredients to produce proprietary formulations. Utilizing our strong industry insight, process know-how, and creative research and development, we partner with our customers to provide innovative and differentiated solutions that are integral to their finished products. We operate in a wide variety of attractive niche markets across multiple industries, including automotive, agricultural, animal health, electronics, graphics, and offshore oil and gas production and drilling. We believe the majority of our operations hold strong positions in the markets they serve. Our product innovations and product extensions are expected to continue to drive sales growth in both new and existing markets, while also expanding margins by continuing to offer high-customer-value propositions.
Platform has strong market positions in niche segments of high-growth markets. We continually seek opportunities to enhance our growth and strategic position through inorganic initiatives, focusing on specialty chemical businesses or assets within our existing or complementary end-markets, particularly those meeting our “Asset-Lite, High-Touch” philosophy, which involves the following core elements:
•prioritizing resources to research and development;
•offering highly technical sales and customer service; and
•managing conservatively our capital investments.
We regularly review acquisition opportunities and may acquire businesses that meet our acquisition criteria when we deem it to be financially prudent.
We manage our business in two segments: Performance Solutions and Agricultural Solutions, which are each described below under "Business Segments." Both segments share a common focus on attractive niche markets, which we believe will grow faster than the diverse end-markets each segment serves. In 2017, we achieved sales of $3.78 billion, to which our Performance and Agricultural Solutions segments each contributed approximately 50%.
For financial information about our operating segments and the geographic areas in which we do business, please see Note 23, Segment Information, to the Consolidated Financial Statements included in this 2017 Annual Report.
Proposed Separation of Agricultural Solutions
In August 2017, we announced our intention to separate our Agricultural Solutions and Performance Solutions businesses. We believe this Proposed Separation, which we expect to complete in 2018, should maximize long-term value for our stockholders by enabling investors to focus on our specific different and differentiated high-quality businesses that serve two distinct segments of the specialty chemicals industry. However, this Proposed Separation, and any related transactions that we may decide to pursue in anticipation of the Proposed Separation, remain subject to final approval by the Board, as well as a number of conditions and variables, including financial market conditions and volatility, legal, tax or regulatory requirements, the establishment of the necessary corporate infrastructure and processes, and/or the possibility of more attractive strategic options arising in the future.
Acquisitions
OMG Malaysia Acquisition - On January 31, 2016, we completed the OMG Malaysia Acquisition for approximately $124 million, net of acquired cash and closing working capital adjustments. We acquired OMG Malaysia to further enhance our Performance Solutions business segment in which OMG Malaysia is included.
1
Alent Acquisition - On December 1, 2015, we completed the Alent Acquisition for approximately $1.74 billion in cash, net of acquired cash, and 18,419,738 shares of our common stock issued to Alent shareholders. Legacy Alent was a global supplier of specialty chemicals and engineered materials used primarily in electronics, automotive and industrial applications, and a supplier of high performance consumable products and services. Alent's business is included in our Performance Solutions business segment.
OMG Acquisition - On October 28, 2015, we completed the OMG Acquisition for a total purchase price of approximately $239 million in cash, net of acquired cash and purchase price adjustments. The acquired OMG Businesses are included in our Performance Solutions business segment. OMG’s Electronic Chemicals business is similar to the legacy MacDermid electronic chemical and surface treatment businesses, as it develops, produces and supplies chemicals for electronic and industrial applications. OMG’s Photomasks products are used by customers to produce semiconductors and related products.
Arysta Acquisition - On February 13, 2015, we completed the Arysta Acquisition for approximately $3.50 billion, consisting of $2.86 billion in cash, net of acquired cash and closing working capital and other adjustments, and the issuance of $600 million of Platform’s Series B Convertible Preferred Stock. The legacy Arysta business, which is included in our Agricultural Solutions business segment, has a solutions-oriented business model which focuses on product innovation to address grower needs. We acquired Arysta to expand our presence in the agrochemical business and our offering of Crop Protection solutions, including BioSolutions and Seed Treatment products, to growers worldwide.
CAS Acquisition - On November 3, 2014, we completed the CAS Acquisition for $1.04 billion, consisting of $983 million in cash, net of acquired cash, after certain post-closing working capital and other adjustments, and 2,000,000 shares of our common stock. Legacy CAS was a niche provider of seed treatments and agrochemical products for a wide variety of crop protection applications in numerous geographies and is included in our Agricultural Solutions business segment.
Agriphar Acquisition - On October 1, 2014, we completed the Agriphar Acquisition for a purchase price of approximately €300 million ($370 million), consisting of $350 million in cash, net of acquired cash and certain post-closing working capital and other adjustments, and 711,551 restricted shares of our common stock, which become unrestricted beginning January 2, 2018. Legacy Agriphar was a European crop protection group supported by a team of researchers and regulatory experts which provided a wide range of fungicides, herbicides and insecticides with end markets primarily across Europe. The legacy Agriphar business is included in our Agricultural Solutions business segment.
Business Segments
We generate revenue through the formulation and sale of our dynamic chemistry solutions in our two business segments: Performance Solutions and Agricultural Solutions. In addition, our personnel work closely with our customers on an ongoing basis to ensure that the functional performance of our intricate chemical compositions is maintained as intended and that these products are applied safely and effectively. For example, a customer in our Performance Solutions segment will engage us to provide a multi-step chemical process for circuit boards that they are producing for end use in the automotive industry in order to enhance the overall performance of that customer’s circuit boards. Customers derive value from the performance of the innovative formulation itself, as well as from the on-site technical service we provide to assure consistent process quality. Another example from our Agricultural Solutions segment is our “Aplique Bem” stewardship program which focuses on teaching growers to apply agrochemicals safely and cost-efficiently. This program, which started in Brazil in 2007 in partnership with the Institute of Agriculture, Campinas (IC), has since expanded to Bolivia, Colombia, Mexico, West Africa and Vietnam. This high quality customer service and stewardship program is also supported by our local technical teams and our local infrastructure, such as our field research stations, enabling the development of unique solutions to meet grower needs. Our specialty chemicals and processes, together with our field technical and sales staff, are seen as integral to our customer’s product performance.
Performance Solutions
Overview
Our Performance Solutions segment, which employs approximately 4,350 people, combines the legacy MacDermid operations with Alent Enthone Surface Chemistries, Alpha Assembly Materials businesses, the OMG Businesses and OMG Malaysia. By pooling these businesses, we were able to expand our product offerings, geographic footprint and market share position but also unify sales strategies for improved processes and enhanced innovative capability, allowing us to deliver high-quality products and services at every stage of our customers' supply chains.
Performance Solutions formulates and markets dynamic chemistry solutions that are used in automotive production, electronics, commercial packaging and printing, and oil and gas production and drilling. Our products include chemicals for metal deposition,
2
functional conversion coatings, electronic assembly materials, water-based hydraulic control fluids, photopolymers, and other specialty chemistries that modify surfaces. In conjunction with the sale of our products, the segment provides extensive technical service and support to ensure functional performance of the processes used at our customer manufacturing locations. We leverage our close customer relationships to execute our growth strategy by working directly with our customers to identify opportunities for new products. These new products are developed and created by drawing upon our intellectual property portfolio and technical expertise. Our focus on constant innovation serves as a catalyst to drive specification change and to capitalize on adjacent market opportunities in our industry. We also have strong collaborative relationships with OEMs who specify to us which specialty materials, chemistries and technologies they need in their products. We leverage these relationships to increase OEM specification of our products. We believe that our customers place significant value on our brands, which we capitalize on through significant market share, brand loyalty and supply chain access.
Our Performance Solutions segment provides specialty chemicals through the following five businesses:
Assembly Solutions - representing approximately 34% of the segment's 2017 net sales. As a large supplier of solder, solder pastes and attachment materials for the electronics assembly industry, we develop, manufacture, and sell innovative interconnect materials, primarily in the electronics market, used to assemble printed circuit boards, integrated circuit substrates and advanced semiconductor packaging. Within this business, we also focus on the semiconductor packaging industry and offer a water treatment product line.
Electronics Solutions - representing approximately 29% of the segment's 2017 net sales. As a global supplier of chemical compounds to the electronics interconnection industry, we design and formulate a complete line of proprietary, dynamic “wet” chemistries used by our customers to process the surface of printed circuit board materials and other electronic components they manufacture. Our product portfolio is focused on specialized consumable chemical processes, such as solderable finishes, conductor metallization, and circuit formation. Our process chemistries comprise a small portion of the total cost of our customers’ finished device, but they are a critical component for maintaining the end product's performance. Our customer base includes companies in the following end markets: aerospace; audio visual; automotive; computers; medical devices; and telecommunications. We believe our growth in this business will be driven by demand in telecommunication, wireless devices and computers, and the increasing use of electronics in automobiles. .
Industrial Solutions - representing approximately 26% of the segment's 2017 net sales. As a global supplier of industrial metal and plastic finishing chemistries, our dynamic chemical systems are used for depositing metals, cleaning substrates, and providing protective coatings for a broad range of metal and non-metal surfaces. These coatings may have functional uses, including improving wear and tear, such as hard chrome plating of shock absorbers for cars and special drills used for oil and gas exploration, or providing corrosion resistance for appliance parts. Alternatively, our chemistries may have decorative performance, such as the application of gloss finishes for parts used in automotive interiors or fashion finishes used on jewelry surfaces. Our industrial customer base is highly diverse and includes customers in the following end markets: appliances and electronics equipment; automotive parts; industrial parts; plumbing goods; and transportation equipment. We believe our growth in this industry will be primarily driven by increased worldwide automobile production with elevated fashion elements and content per vehicle.
Graphics Solutions - representing approximately 8% of the segment's 2017 net sales. As a supplier of consumable materials used to transfer images to printed substrates, our products are used to improve print quality and printing productivity. We produce and market photopolymers through an extensive line of flexographic plates that are used in the commercial packaging and printing industries. Photopolymers are molecules that change properties upon exposure to light. Flexography is a printing process that utilizes flexible printing plates made of rubber or other flexible plastics. We believe growth in this business will be driven by consumer demand and market shifts that favor the use of our package imaging technologies that offer a lower cost of ownership to our customers.
Offshore Solutions - representing approximately 4% of the segment's 2017 net sales. As a global supplier of specialized fluids to the offshore energy industry, we produce, market, and support water-based hydraulic control fluids for major oil and gas companies and drilling contractors for offshore deep water production and drilling applications. Our current customer base is weighted primarily in the production area of this business. Although the recent declines in oil and gas industry investments have impacted the short-term growth, we believe the industry has stabilized and capital expenditure investments are increasing in both offshore drilling and new sub-sea wells.
3
Products
Our Performance Solutions segment offers a wide range of specialty chemicals comprised of surface and coating materials, functional conversion coatings, electronic assembly materials, water-based hydraulic control fluids, and photopolymers. We review our portfolio of products regularly to identify and replace low margin products with higher margin products. Accordingly, our product mix may frequently change depending upon customer demand, and the cost and selling prices related to any given technical system. A selection of Performance Solutions' product offerings is presented below:
Assembly Solutions | |||
Electronic Assembly Materials | Assembly Solutions focuses on the development, manufacture, and sale of innovative interconnect materials, primarily into the electronic market by providing specialized fluxes, solder spheres, organic encapsulants, and die attach materials that enable successful interconnection of semiconductor devices. We also offer metal reclaim systems, primarily for tin, used in electronic assembly. | ||
Water Treatment | Fernox is our water treatment product line used for the filtration and conditioning of water in residential boiler systems. | ||
Electronic Solutions | |||
Plating Products | Plating products are used to plate holes drilled through printed circuit boards to connect opposite sides of the board and the different layers of multi-layer printed circuit boards. Our key products include the MacuSpec, M-Copper and M-System. | ||
Solderable Finishes | Solderable finishing formulations are used to deposit coatings on printed circuit boards to preserve the solderability of the finished boards. | ||
Circuit Formation Products | Circuit formation products represent an assortment of products for defining circuit patterns and bonding conductors to insulating materials. | ||
Semiconductor Materials & Packaging | Our Viaform product family of copper damascene chemistry is used in semiconductor plating applications for creating conductors as narrow as 10 nanometers. Our Microfab family of plating chemistry is used in wafer level packaging applications, including copper pillar, redistribution layers (RDLs), nickel, tin bump, gold bump and thru-silicon via (TSV) applications. | ||
Functional Conversion Coatings | Our products plate various parts that are used in automotive and aerospace equipment, appliances, computer hard disks and other electronic products. | ||
Industrial Solutions | |||
Electroless Nickel | Electroless nickel is applied to a variety of metal and plastic surfaces to enhance corrosion resistance, wear resistance, solderability (from Electronic Solutions), and to repair worn or over-machined surfaces in a variety of applications. | ||
Plating Products | The CuMac range of products for applications such as plating on aluminum wheels, plastic substrates and zinc-based die castings, and the ChromKlad and ANKOR range of hard chromium plating processes are utilized in various industrial finishing applications. | ||
Pre-treatment and Cleaning Solutions | Pre-treatment and cleaning solutions are applied to prepare the surfaces of a wide variety of industrial products for additional treatment. We have a complete line of aqueous and semi-aqueous pre-treatment and cleaning products. | ||
Functional Conversion Coatings | Functional conversion coatings are applied to metals to enhance corrosion resistance and paint adhesion in a wide spectrum of industrial applications where heavy duty usage and exposure to unfavorable environments are anticipated. | ||
Hard-coated Films | Hard-coated films are used for the membrane switch in the touch screen applications. | ||
Graphic Solutions | |||
Solid Sheet Printing Elements | Solid sheet printing elements are digital and analog printing sheets, used in the flexographic printing and platemaking processes. Our extensive line of Lux flexographic plates are used in the commercial packaging letterpress newspaper and publication industries. | ||
Liquid Imaging Products | Liquid products are liquid photopolymers used to produce printing plates for transferring images onto commercial packaging. Our key products are MWH photopolymer, MWB 50 photopolymer, and M Stamp 40 photopolymer. We also offer products that are used in the production of liquid photopolymer plates such as substrate, coverfilms and detergents. | ||
Offshore Solutions | |||
Offshore Fluids | Production fluids are used to operate valves for the deep water oil extraction and transportation process, and drilling fluids are used to operate valves for drilling rigs on the ocean floor. Production and drilling fluids are water-based hydraulic fluids used in subsea control systems. | ||
4
Seasonality
The Performance Solutions segment is not subject to significant seasonality.
Agricultural Solutions
Overview
Our Agricultural Solutions segment, which employs approximately 3,300 people, consists of legacy Arysta which was combined with two additional Crop Protection chemical companies acquired in 2014, Agriphar and CAS. By combining these businesses, we were able to gain further access to the large agricultural markets globally, including the United States (through the CAS Acquisition) and Europe (through the Agriphar Acquisition). Additionally, we gained formulation expertise and wider product portfolio which allowed us to better serve our existing clients.
Agricultural Solutions specializes in the development, formulation, registration, marketing and distribution of differentiated Crop Protection solutions, including BioSolutions and Seed Treatments, for a variety of crops and applications. Our diverse Crop Protection chemicals control biotic stresses, such as diseases (fungicides), weeds (herbicides) and insects (insecticides). Our portfolio of proven BioSolutions is comprised of BioStimulants, which are derived from natural substances applied to plants, seeds or the soil in order to enhance yields and help crops withstand abiotic stress, such as drought or cold, and BioControl products, which perform the same task as conventional Crop Protection products with, in many cases, the added benefit of reduced chemical residues. Our solutions are offered in multiple forms, such as foliar applications (direct application to leaves), furrow treatment (treatment of soil trenches or grooves wherein seeds are sown) or Seed Treatment (seed coating prior to planting). Our products are utilized by farmers through the entire growing cycle: from burn-down through pre-emergence to pre-harvest. Our products allow us to partner with growers to address the ever-increasing need for higher crop yield and food quality.
Our focus on specialty applications (formerly referred to as our H3 priority markets and differentiated local solutions) and local grower needs demands a high degree of technical expertise and customer proximity. Our teams of local agronomists work together with our local marketing and commercial teams to develop tailored local products primarily targeting these applications. These products and solutions consist of one or more formulated, ready to use mixtures of different active ingredients, or AIs, to solve the needs of growers in a particular crop and in a specific country. Our local teams, especially in niche markets, allow us to better understand specific market trends and farmer requirements, which enable us to better innovate and address local needs faster and more efficiently. Specialty applications include Crop Protection solutions for niche and specialty crops like fruits and vegetables, products for underserved or hard-to-control pests affecting commodity grain crops, alternative application methods like seed and soil applied technologies, and bio-based products that are used as alternatives or additions to conventional chemical applications. We believe that the markets for these specialty applications are growing faster than the rest of the Crop Protection market and offer better opportunities for attractive margins given the superior value provided to the grower. As part of our specialty application focus, we have developed a growing BioSolutions and Seed Treatment business, organically and through acquisitions. Our BioSolutions business is focused on BioStimulants, Innovative Nutrition products, and BioControl products.
We remain focused on expanding our presence in worldwide targeted markets by developing or acquiring crop protection products and obtaining registrations for new products, new uses for existing products, and uses of existing products in new countries.
Products
Our Agricultural Solutions segment offers a broad range of proven Crop Protection solutions to growers worldwide, across foliar, in-furrow and Seed Treatment applications. We categorize our products in three core portfolios: Crop Protection (fungicides, herbicides, and insecticides); BioSolutions; and Seed Treatment.
These portfolios are each described below:
Crop Protection | We are one of the largest Crop Protection chemical companies by revenue. Our diverse Crop Protection chemicals control biotic stresses, such as diseases (fungicides), weeds (herbicides) and insects (insecticides). | |
Fungicides | Fungicides prevent the spread of fungal diseases in crops. Our fungicides products include Evito, Fortix, Kasumin and Proplant. | |
Herbicides | Herbicides are used to control unwanted plants while leaving the targeted crops to grow unharmed. We offer total, non-selective and selective, herbicides with a variety of formulations for many temperate and tropical crops such as soybeans, corn, wheat, oil seed rape/canola, vegetables and sugar cane. Our main herbicide products are Dinamic, Everest, Pantera and Select. | |
5
Insecticides | Our insecticides, such as Cythrin Max, Orthene and Talisma, are products used against insect pests at different stages of the pest life cycle, from egg and larvae to nymph and adult. These products can have both crop and public health applications. Acaricides or miticides control a variety of mite pests on crops. These products are primarily targeted at tree fruit and nut, vine, ornamental and selected row crop applications for effective mite control programs. Our main miticide products, such as Acramite, Floramite and Omite, are sold globally. | |
BioSolutions | We believe we are have a strong position as innovator in BioSolutions and BioStimulants. These products are derived from natural sources that fall into several categories described below. This portfolio is highly differentiated through innovative technologies and mixtures and primarily protected by trade secrets. | |
BioStimulants | Biostimulants (biological stimulants) enhance crop vigor, yield and/or quality through physiological stimuli. Our BioStimulant products include Biozyme, BM Start and Appetizer. | |
Innovative Nutrition | Innovative nutrition products optimize the nutrition in plants by enhancing nutrient availability or use efficiency. Our Innovative Nutrition products include the Poliquel line. | |
BioControl | BioControl (biological control) products operate as conventional Crop Protection products with, in many cases, reduced residues of a synthetic origin. Our BioControl products, mainly biofungicides and bioinsecticides, include Ph-D, Carpovirusine, Vacciplant, Noctovi and a wide line of natural enemies and beneficial insects for Integrated Pest Management solutions in Japan. | |
Seed Treatment | Our diverse Seed Treatment portfolio encompasses products, such as Rancona and Vitavax. Our Seed Treatments are applied before planting by coating the seed in order to protect it during germination and the plant during its initial growth phases. We anticipate growth in Seed Treatments as a result of the increasing value of seeds and the use of higher-value GM seeds. | |
We consider these portfolios to be key pillars for our sustainable growth. We sell our products in specific regions and niche crop markets directly to seed breeders, growers, government entities, co-operatives, branded retailers and leading national and regional distributors. Our products are sold individually or combined within our "ProNutiva" program which integrates BioSolutions with either Crop Protection or Seed Treatment products. By combining BioSolutions with conventional protection products, ProNutiva aims at addressing the full spectrum of protection, nutrition and yield enhancement needs of farmers, often with lower residue levels, addressing safety concerns of end-consumers and resulting in enhanced farm economics for growers.
Seasonality
Our Agricultural Solutions segment is seasonal in nature and corresponds to agricultural cycles within each region in which we operate. The geographic spread of our products can result in significant variations in earnings and cash flow during such cycles. Crop Protection and Seed Treatment chemicals and BioSolutions sales typically begin ahead of the growing season and peak in the middle of the season. In the northern hemisphere, farmers purchase the majority of their Crop Protection chemical inputs during the first half of the calendar year from distributors which we start to supply during the fourth quarter of the previous year. Growers in the southern hemisphere purchase the majority of their products in the second half of the year. As a result, we have historically experienced fluctuations in quarterly sales. For example, due to the size of our market in Latin America, we typically generate greater net sales in the second half of the calendar year.
Weather conditions and natural disasters such as drought and floods in a particular region, storms, hurricanes, tsunamis, hail, tornadoes, freezing conditions or extreme heat in a particular region affect decisions by our customers and end-users about the types and amounts of products to purchase and the timing of use of such products. The high degree of correlation between sales patterns and unpredictable weather conditions makes drawing conclusions from quarterly sales difficult.
Competitive Strengths of Platform
We believe the following competitive strengths differentiate us from our competitors and contribute to the ongoing success of both of our segments:
• | “Asset-Lite, High-Touch” Business Model. Our businesses are evidenced by high margins and low capital expenditures which translates into high cash flow margins and returns on capital. Over 40% of our employees are in either technological innovation or sales and services areas; hence “high-touch.” Our commitment to technological innovation and our extensive intellectual property portfolio enables us to develop our cutting-edge products. In order to continue to provide innovative products and highly specialized technical service to our customers, we place a premium on maintaining an expert and qualified employee base. Our business involves the formulation of a broad range of specialty chemicals, created by blending raw materials or developing new uses for existing AIs. This model allows us to conservatively manage our investments in fixed assets to both maintain and grow our businesses. Our existing fixed asset base is modern and well-maintained and, accordingly, requires low capital expenditures for maintenance. |
6
• | Industry Leading Positions. Our businesses strategically focus on acquiring and maintaining leading positions in niche sectors of high-growth markets by offering high value-added services to our customers. We believe our scale and global reach in product development, marketing, and formulation provides us with advantages over many of our competitors, allowing us to maintain strong market share positions and drive profitable growth. Our strong market positions contribute to our ability to attract new customers and successfully enter new end-markets. |
• | Customer Driven Innovation and Partnerships. We frequently work alongside our customers and other industry participants to develop new products and identify new market opportunities. We participate in a variety of dynamic end-markets where new unmet needs are always materializing. Our large sales and technical service teams provide continuous insights that help ensure our research and development efforts are appropriately focused. Customer requirements can lead to improved or uniquely tailored formulations of existing product offerings or to the development of completely new products to satisfy previously unmet needs. Tailoring products for specific OEMs or specific localized growing regions leads to sticky sales and significant customer switching costs. In our Agricultural Solutions business, we also frequently partner with molecule discovery focused companies to source new and complementary AIs for our portfolio. We believe these companies value our vast knowledge of local markets, regulations and distribution channels as they look to establish post-patent management strategies for their existing molecules. |
• | Strong Expertise in Registration and Distribution. Product registration is complex and crucial, particularly in the agrochemical space. Our Agricultural Solutions segment has a large team of specialists dedicated to the regulatory process across various jurisdictions, and we believe we are well-experienced in obtaining and defending the required registrations for our products in each country in which they are sold and for each crop on which they are applied. Once obtained, these registrations provide a right to use a product for a specified crop in that country or region for a number of years. In addition, our Agricultural Solutions segment has a strong network of distributors, which currently reaches over 100 countries and jurisdictions. Our large distribution network enables us to focus on profitable niche applications, which we believe are less sensitive to competitive pricing pressures. This distribution network, together with our geographical footprint, also allows us to attract licensing and resale opportunities from partner companies for new products, technologies, and applications. |
• | Comprehensive Product Offering. We provide our customers with a comprehensive offering of products that meet many of their specialty chemical needs. In many cases, we offer a full suite of products with complementary capabilities that provide a complete functional solution to the customer. We believe the ability to provide a “top-to-bottom” product offering is a significant competitive advantage over many of our smaller and regional competitors. We also believe that our existing product offerings offer many opportunities for growth in adjacent end-markets. |
• | Performance-Driven Culture and Board with Proven Track Record. We believe we have outstanding people who can deliver superior performance under the tutelage and oversight of proven and experienced leadership. Our culture is performance-focused and driven by empowering team members and then holding them accountable for their outcomes. We measure people on financial results, safety, customer satisfaction and commitments, legal compliance, and environmental stewardship. We measure our performance against benchmarks and drive operational excellence through continuous improvement. Our experienced management team is complemented by an experienced Board, which includes individuals with proven track records of successfully acquiring and managing businesses. Our business segments are also led by executives that have extensive experience in their respective fields. |
Business Strategies
We aim to build a best-in-class, global formulator, marketer, and distributor of specialty chemical products. Our primary measure of success is long-term intrinsic shareholder value creation, which we hope to achieve through profitable sales growth and continuous cost improvement. We seek to develop and engineer new products and processes, leverage our global scale to enter new markets and optimally manage our existing portfolio of specialty chemical businesses. Our efforts are directed by the following key business strategies:
• | Expand our Core Businesses. We believe that we can capitalize on our existing capabilities to further enhance our technical capabilities, sophisticated process know-how, solutions orientation, strong customer relationships and deep industry knowledge. The Acquisitions enhanced the growth of each of our segments by extending their respective products breadth and expanding their international reach. We intend to further extend many of our product offerings through the development of new applications for our existing products or through synergistic combinations, and to target geographies with attractive market fundamentals where our strengths in marketing, portfolio development, regulation and customer education can add value for our customers. |
• | Focused Investment in Product Innovation. We place a strong emphasis on innovation. New products are developed and created by drawing upon our significant intellectual property portfolio and technical expertise. Building on our core competencies in product innovation, applications development, and technical services, we intend to drive organic |
7
growth by reaching new high-growth markets and expanding upon our existing technologies to develop new products for existing and adjacent markets.
• | Leverage Customer Relationships. We intend to continue to leverage our close customer relationships to execute our growth strategy by working directly with our customers to identify opportunities for new products. We also have strong collaborative relationships with OEMs who specify which specialty materials, chemistries, and technologies they need in their products. Working directly with our customers allows us to increase OEM qualification of our products and identify opportunities to grow with our customers. Such close customer relationships also provide a solid barrier to entry for competition. |
• | Pursue Strategic Inorganic Growth. Our founder, Martin E. Franklin and our Chief Executive Officer, Rakesh Sachdev have significant experience and expertise and have been highly successful in acquiring, integrating, and growing value-added businesses. We intend to pursue further inorganic initiatives as a way to enhance our growth and strategic position. We intend to focus primarily on businesses or assets within our existing end-markets that share our “Asset-Lite, High-Touch” philosophy, with product offerings that provide geographic or product complementarity. We expect to achieve commercial and distribution efficiencies by expanding into related categories that can be marketed through our existing distribution channels or provide us with new distribution channels for our existing products. We plan to only pursue opportunities that we believe meet our acquisition criteria and when we deem it to be financially prudent. |
• | Focus on Human Capital. The success of our business depends on our ability to continue to capitalize on our technical capabilities, unique process know-how, strong customer relationships, and industry knowledge. The technical expertise and history of innovation demonstrated by our employees reflect the specialized and highly skilled nature of our research and development personnel. As such, we intend to focus on attracting, retaining, and developing the best human capital across all levels of our organization, which is key to our ability to successfully operate and grow our business. |
Customers
We have a diverse customer base, as we sell our products either directly to end-user customers or through intermediaries, such as independent, third-party distributors, agricultural cooperatives, retailers, and government agencies. We also have collaborative relationships with many OEMs and industry partners, who specify our chemistries and technologies for use in their products or grant us development rights of their intellectual property. A significant portion of our sales are through such intermediaries.
Within each segment, we rely on independent representatives and distributors to distribute our products and to assist us with the marketing and sale of certain of our products. We believe that we are able to attract new customers successfully through our international reach, coupled with our local knowledge and on-the-ground presence, which enables us to meet the needs of our customers. We have a global network of 54 manufacturing sites, 11 of which include research facilities, and 16 stand-alone research centers, all supported by a direct sales force in nearly 70 countries. Our flexible manufacturing base allows for "just in time" supply chain management. We operate a relatively large number of small and medium-sized facilities located close to our customers throughout the world's major economic regions. This close proximity to our global customers' local sites enables access to all key growth markets.
We believe that our business is not materially dependent upon a single customer. Although no customer or distributor constitutes 10% or more of our consolidated net sales, we do have some customers and distributors, the loss of which may impair our results of operations, for certain business lines, for the affected earnings periods.
Due to the relatively short cycle times in our business, our order backlog levels are minimal.
Selling & Marketing
We employ a customer-centric sales and marketing force of professionals worldwide. These professionals have strong technical expertise, local market knowledge and intimate customer relationships. Our local sales and marketing teams closely monitor their market trends and maintain active dialogue with our customers to assess and understand their constantly evolving challenges. We use this feedback from our local sales teams to anticipate future needs, respond rapidly to changing market conditions, and deliver customized, value-added solutions for our customers. This feedback loop is an important source of new product ideas and helps guide our capital allocation decisions and research and development plans. We leverage local market intelligence to develop new and innovative products that are then marketed by our local sales and marketing teams throughout the markets we serve.
8
Performance Solutions
In our Performance Solutions segment, methods for selling and marketing our proprietary products vary slightly by geographic region. In total, we generate business through the efforts of regional sales, technical and service personnel, as well as distributors. In addition to regional sales and service staff, we maintain a group of global personnel focused on coordinating sales projects and obtaining design specifications for complex projects involving multiple customers within the manufacturing supply chain.
Agricultural Solutions
In our Agricultural Solutions segment, our products are sold in over 100 countries globally and reach growers through a wide variety of market channels. Our sales, marketing, and go-to-market strategies vary significantly by territory and depend to a large extent on the existing distribution infrastructure and market practices in each particular region. We work with national and regional distributors, retailers, co-ops, government entities and directly with growers to promote and sell our solutions. We have loyalty programs in place for distributors and engage in active grower education to promote our products and brands. Our global presence and local capabilities make us a partner of choice for other Crop Protection chemical companies, who often enter into exclusive distribution or license agreements with us. These agreements give us the exclusive right to distribute or formulate their products in, or with respect to, specified territories, crops, applications, channels and formulations.
Employees
In order to ensure that we are able to continue to provide innovative products and highly technical service to our customers, we place a premium on maintaining a highly specialized and qualified employee base. At December 31, 2017, we employed approximately 7,850 full-time employees in approximately 70 countries, including approximately 3,400 research and development chemists, experienced technical service, and technical sales personnel.
In addition, many of our full-time employees are employed outside the United States. In certain countries where we operate, our employees are also members of unions or are represented by works councils as required by law. We are required to consult and seek the consent or advice of these unions and/or works councils for any changes to our activities or employee benefits.
Our management believes that our relationships with our employees and collective bargaining unions are satisfactory.
Research and Development
Continued investment in research and development ensures that we remain ahead of emerging trends, delivering solutions to strengthen our strong market positions in terms of innovation and product development in our market niches. Our research and development activities are also focused on developing products, and improving formulations and processes that will drive growth or otherwise add value to our core business operations. We accelerate market introductions and increase the impact of our product offerings through collaboration with partners in the commercial sector (customers and value-chain partners) and by working with distributors, OEMs, governments and local communities around the world. We plan to continue to make significant investments in a broad range of research and development efforts.
Performance Solutions
With respect to our Performance Solutions segment, our commitment to technological innovation and our extensive intellectual property portfolio enables us to develop differentiated products at the forefront of the technology. Research resulting in new, proprietary formulations is performed principally in Germany, Great Britain, India, Japan, and the United States. During 2017, the segment's research and development expenses totaled $46.4 million, which represented 2.5% of Performance Solutions' total net sales. Substantially all research and development activity was performed internally.
Agricultural Solutions
Within our Agricultural Solutions segment, our global and regional marketing teams conduct a rigorous process for identifying key AIs with proven technical efficacy, which can be brought to market through our formulation, marketing, and distribution capabilities, in order to address strategic gaps in our portfolio. Our experienced regulatory team has a strong and successful track record of obtaining product registrations expeditiously to support this product strategy. During 2017, the segment invested $92.5 million in research and development, of which $40.5 million was capitalized and $52.0 million was expensed. In 2017, research and development investments represented approximately 5% of Agricultural Solutions' total net sales.
9
Competitive Environment
Our markets are consolidating, highly competitive, and subject to rapid changes in technology. Broadly speaking, we compete in the specialty chemicals market. On a more narrow scale, we compete in markets for specialty chemicals for Crop Protection, BioSolutions and Seed Treatment chemicals, and electronic applications, general metal and plastic finishing, oil and gas exploration and production, and printing. Some of our competitors may have greater financial, technical and marketing resources than we do and may be able to devote greater resources to promoting and selling certain products.
The competitive environment of each of our segments is described below:
Performance Solutions
Our Performance Solutions segment provides a broad line of proprietary chemical compounds and supporting services, and broadly competes within the specialty chemicals industry. Although competition varies by end-market and geography, our most significant competitors are Atotech Inc., and DowDupont Inc., across its industrial and electronics chemicals businesses, as well as Asahi, Senju, Tamura, and Flint Group. We compete primarily on the basis of quality, technology, performance, reliability, brand, reputation, range of products and services, and service and support. We maintain extensive support, technical and testing services for our customers, and are continuously developing new products. Further consolidation within our industry or other changes in the competitive environment, such as the recent creation of DowDupont Inc., as a result of the merger of E.I. du Pont de Nemours and Company and The Dow Chemical Company, could result in larger competitors that compete with us on several levels. We believe, however, that our combined abilities to manufacture, sell, service, and develop new products and applications, enable us to compete successfully both locally and internationally. Some large competitors operate globally, as we do, but most operate only locally or regionally. We also face competition from many smaller companies that specialize in particular segments of the markets in which we compete.
Agricultural Solutions
The Crop Protection and Seed Treatment chemical sector is a highly developed and competitive industry with a wide range of established competitors that offer a broad variety of competing products. Our main competitors include multi-national participants in this market, such as Syngenta AG, now owned by ChemChina, Bayer AG, BASF SE, DowDuPont and FMC, as well as a number of Japanese participants.
The BioSolutions sector is a newer and less mature market than the Crop Protection market; however, we still face significant competition from various competitors seeking to offer competing products and solutions to our customers. As a result, the BioSolutions landscape is highly fragmented, with a large number of small participants who have developed a niche product offering as well as a range of biotech companies focusing on research addressing new or early-stage technologies. Customer education and corresponding demand creation is a critical element of competing within the BioSolutions sector, especially for BioStimulants and Innovative Nutrition. Customer acceptance and adoption levels may vary widely and, in some cases, can be minimal for new and emerging technologies. Our current competitors include Novozymes Biopharma A/S, Verdesian LifeSciences LLC, Bayer Crop Science Inc. (AgraQuest, Inc.), Valagro SpA, BASF SE (Becker Underwood Inc.), Koppert Biological Systems and various others. Potential new competitors include entry by existing Crop Protection companies as well as the formation of new BioSolutions companies.
Raw Materials and Sourcing of Products
In our Performance Solutions segment, our business involves the manufacture of a broad range of specialty chemicals, which we create by blending raw materials, and the incorporation of these chemicals into multi-step technological processes. Our manufacturing operations depend upon obtaining adequate supplies of raw materials on a timely basis. We typically purchase our major raw materials on an as-needed basis from outside sources, and the raw materials that are of greatest importance to our global operations are, in most cases, obtainable from multiple sources worldwide.
In our Agricultural Solutions segment, we rely on contract manufacturers, both domestically and internationally, to produce certain inputs or key components for our product formulations. These inputs, which are generally a combination of technical grade AIs, semi-finished goods, inerts and packaging materials, are typically sourced close to where we ultimately formulate and sell our products. We source almost all of our AIs from third-party manufacturers, which represent a relatively limited number of key suppliers. We strive to maintain multiple high-quality supply sources for each AI; however, due to the proprietary nature of some of our products, finding alternative new sources can be challenging. Our goal is to maximize our sourcing of raw materials from quality suppliers in countries with generally low manufacturing costs, such as China, Eastern Europe, and India.
10
We formulate and package our products in-house or through tolling and other third-party manufacturing and formulation arrangements. We balance our in-house formulation with third-party arrangements to limit our exposure to utilization drop-offs, facility closures, and certain manufacturing-related environmental risks which helps optimize our cost structure.
Within certain portions of our BioSolutions portfolio, we manage an end-to-end supply chain. We purchase natural raw materials, such as plant extracts and seaweed, to extract AIs for our BioSolutions products.
Patents, Trademarks and Proprietary Products
Our intellectual property and other proprietary rights are important to our business and are protected by a combination of patents, trade secrets, trademarks, data exclusivity, and other marketing exclusivity rights, exclusive or semi-exclusive manufacturing arrangements, and other non-patent strategies. We seek intellectual property and other proprietary rights in major markets and other commercially-relevant jurisdictions worldwide. We implement confidentiality procedures and contractual exclusivity and seek other rights necessary to protect our intellectual property, proprietary formulations, processes, and other product-related rights. We rely on trade secrets and know-how confidentiality agreements to protect our processes, natural product composition/origin, and formulations. We also enter into invention or patent assignment agreements, when applicable, with our employees, consultants, contractors, and other third-parties who may be engaged in discovery or development of intellectual property and other proprietary rights. Finally, we seek to include provisions in our material transfer agreements, license and development agreements, and other agreements that provide for the transfer of intellectual property rights back to us to the greatest extent possible under the circumstances of any specific transaction and development project.
Performance Solutions
In our Performance Solutions segment, at December 31, 2017, we owned, had applications pending, or licensed the rights to approximately 2,000 domestic and foreign patents, which have remaining lives of varying duration. Although certain of these patents are important to our business, we believe that our ability to provide technical and testing services to our customers and meet their rapid delivery requirements is equally, if not more, important to our business. No specific group or groups of intellectual property rights are material to our business. However, we have many proprietary products which are not covered by patents and which are responsible for a large component of our total sales. Further, we hold a number of domestic and foreign trade names and trademark registrations and applications for registration, which we consider to be of value in identifying our products. We do not hold nor have we granted any franchises.
Agricultural Solutions
In our Agricultural Solutions segment, at December 31, 2017, we owned, had applications pending, licensed or had freedom-to-operate rights under, approximately 800 domestic and foreign patents, and approximately 6,800 product registrations. This number includes multiple patents and applications with similar claims, filed in various countries. Where our rights to patents or applications are licensed, those rights may be exclusive or non-exclusive depending on such factors as which other AIs the product is formulated with and the field of use in which the product is applied. As part of our intellectual property strategy, we in-license or acquire patents from other Crop Protection chemicals and BioSolutions companies and pursue other patents not related to composition of matter, such as use extensions, formulations, mixtures and manufacturing processes. Certain of our products have multiple patents associated with their AIs, composition of matter, combinations with other AIs, methods of use, delivery technology, and manufacturing and formulation processes. We also differentiate with value-added mixtures and novel formulations, with launches prior to the expiration of the AIs' patent protection, to secure market position.
Government and Environmental Regulation
We develop, produce and market our chemical products in a number of jurisdictions throughout the world and are subject to extensive federal, regional, national and local laws and regulations in each country in which we operate. These laws and regulations govern, among other things, the Company’s manufacture, use, labeling, packaging, storage and distribution of chemicals and hazardous substances, which are subject to strict quality and regulatory standards. We are required to meet these strict standards which, in recent years, have become increasingly stringent. However, no portion of our business is subject to re-negotiation of profits or termination of material contracts or subcontracts at the election of the governments in the countries in which we operate.
We are subject to the FCPA, which prohibits U.S. persons, U.S. issuers and U.S. companies and their intermediaries from making direct or indirect improper payments to non-U.S. government officials for the purpose of obtaining or retaining business or securing an improper advantage. We are also subject to similar anti-bribery laws in the jurisdictions in which we operate, including the Bribery Act, which also prohibits commercial bribery, solicitation of bribery, and makes it a crime for certain commercial organizations to fail to prevent bribery. These laws are complex and far-reaching in nature and, as a result, we may be required
11
in the future to alter one or more of our policies or practices to be in compliance with these laws or any changes in these laws or the interpretation thereof. As previously disclosed, in connection with the implementation of internal controls, policies and procedures at Arysta, following the acquisition of that business in 2015, we discovered that certain payments made to third-party agents in connection with Arysta’s government tender business in West Africa might have been illegal or otherwise inappropriate. We have conducted an investigation and voluntarily informed the SEC and the U.S. Department of Justice of this matter. After reviewing the matter, the SEC and the U.S. Department of Justice both advised that they had closed out the matter and declined to take any action. We consider the matter closed.
We maintain a Business Conduct and Ethics Policy and a Foreign Corrupt Practices Act/Anti-Corruption Policy, applicable to all our directors, officers and employees. In addition, our CEO and CFO are bound by the provisions of a Code of Ethics for Senior Financial Officers. The Business Conduct and Ethics Policy, the Foreign Corrupt Practices Act/Anti-Corruption Policy and the Code of Ethics for Senior Financial Officers were both approved by our Board and cover compliance with the FCPA and similar anti-corruption laws, as well as other legal areas applicable to our operations.
Our business and our customers also may be subject to significant requirements under the European Community Regulation (EC) No 1907/2006 of the European Parliament and the Council dated December 18, 2006 relating to the Registration, Evaluation, Authorization and Restriction of Chemicals, effective June 1, 2007 (or REACH). REACH, adopted in December 2006, imposes obligations on E.U. manufacturers and importers of chemicals and other products into the E.U. to compile and file comprehensive reports, including testing data, on each chemical substance, and perform chemical safety assessments. Active substances and co-formulants used in plant protection products (pesticides) are generally exempt from REACH as they are considered as already registered under the Plant Protection Products Directive 91/414/EEC. However, certain exceptions may apply that would require the active substance or co-formulant to be registered, particularly if the substance has a non-plant protection use. While we have registered and continue to register substances as required, the registration process is lengthy and registration of certain of our substances may not be immediately effective. The cost estimates could vary based on the number of substances requiring registration, data availability and cost. The implementation of the REACH registration process may affect our ability to manufacture and sell certain products in the future.
As a manufacturer and distributor of Crop Protection products and BioSolutions, we are subject to extensive U.S. and foreign laws and regulations relating to environmental protection and worker health and safety, including those governing discharges of pollutants into the air and water, the management and disposal of hazardous substances and wastes, the cleanup of contaminated properties and occupational safety and health matters. In the United States, the Environmental Protection Agency (or EPA) regulates our Agricultural Solutions products under the Federal Insecticide, Fungicide and Rodenticide Act and related legislation such as the Food Quality Protection Act of 1996, or FQPA. In addition to EPA approval, we are required to obtain regulatory approval from the appropriate state regulatory authority in individual states. Many BioSolutions products, especially those classified as fertilizers, are not regulated at the federal level, but only at the state level. The FQPA requires a review of residue tolerances, based on assessment of aggregate risk for a single Crop Protection product and cumulative risk for Crop Protection products with similar modes of toxic action.
Governments in all countries have established legislation and systems for the review and approval of Crop Protection products. These laws require the preparation of comprehensive registration dossiers that must be submitted to the relevant authority in each country before sales can proceed. Once a Crop Protection product is registered in a country, it may generally be sold in such country for use on the crops for which it has been approved, subject to any specific use conditions. The global registration landscape is varied. Many countries have highly sophisticated registration systems and take two to four years to review a Crop Protection product before approving it for sale; in some countries, such as Brazil and India, the registration process can take longer (five to seven years). Some developing countries and countries with economies in transition base their approval on those granted in the more developed countries.
This highly-regulated environment represents both a challenge (cost, time, risk of failure or non-compliance) and an opportunity (to be more efficient and effective than our competitors). In recent years, there has been a significant increase in the stringency of environmental regulation and enforcement of environmental standards, and the costs of compliance have risen significantly. We expect that the trend of increased regulation will continue in the future. In response to this increased government attention to environmental matters worldwide, we continue to develop proprietary products designed to reduce the discharge of pollutant materials into the environment and eliminate the use of certain targeted raw materials while enhancing the efficiency of customer chemical processes. In addition, while regulation substantially increases the time and cost associated with bringing our products to market, we believe that our management team’s significant experience in bringing our and other companies’ technologies through regional, national and local regulatory approval processes, our efficient development process, and our ability to leverage our strategic collaborations to assist with registrations, particularly in Europe and Latin America, will enable us to overcome these challenges. We have and may in the future incur significant costs, including cleanup costs, fines and sanctions and third-party claims for property or natural resource damage or personal injuries as a result of past or future violations of, or liabilities under,
12
such laws and regulations. At December 31, 2017, we believe we had appropriate liabilities recorded for our various environmental matters.
Available Information
Our internet website address is www.platformspecialtyproducts.com. We make available free of charge, through our website, our annual reports on Form 10-K, quarterly reports on Form 10-Q, current reports on Form 8-K, all amendments to those reports filed pursuant to Section 13(a) or 15(d) of the Exchange Act, and proxy statements for our annual meeting of stockholders, as soon as reasonably practicable after each such material is electronically filed with or furnished to the SEC. In addition, information concerning purchases and sales of our equity securities by our executive officers and directors is posted on our website by the end of the business day after filing with the SEC.
You may also read and copy any document that we file, including this 2017 Annual Report, at the SEC’s Public Reference Room at 100 F Street, N.E., Washington, D.C. 20549. Call the SEC at 1-800-SEC-0330 for information on the operation of the Public Reference Room. In addition, the SEC maintains an Internet site at www.sec.gov that contains reports, proxy and information statements, and other information regarding issuers, including Platform, that are electronically filed with the SEC.
Our website includes the following corporate governance materials under the tab “Investor Relations—Corporate Governance:” Board of Directors Governance Principles and Code of Conduct; Insider Trading Policy; Stock Ownership Guidelines; Business Conduct and Ethics Policy - Employees/Directors; Business Conduct and Ethics Policy - Contractors/Consultants; Code of Ethics for Senior Financial Officers; Foreign Corrupt Practices Act/Anti-Corruption Policy; Conflict Minerals Policy and the related Form SD; Platform Data Protection and Privacy Policy; Management, Board of Directors and Committee Composition; and the charters of each committee of our Board of Directors. These corporate governance materials are also available in print upon request by any stockholder to our Investor Relations department.
The information included on our website does not constitute part of this 2017 Annual Report.
In addition to the information included in this Part I, Item 1, see Part II, Item 7, Management’s Discussion and Analysis of Financial Condition and Results of Operations, and Part II, Item 8, as well as Note 1, Background and Basis of Presentation, and Note 23, Segment Information, to the Consolidated Financial Statements, all included in this 2017 Annual Report, for financial and other information concerning our operating segments and the geographic areas in which we do business.
Corporate Information
Our principal executive offices are located at 1450 Centrepark Boulevard, Suite 210, West Palm Beach, Florida 33401 and our telephone number is (561) 207-9600.
Senior Management of Platform
Set forth below is certain information concerning our senior management:
Name | Title | |
Rakesh Sachdev | Chief Executive Officer | |
John P. Connolly | Chief Financial Officer | |
John E. Capps | Executive Vice President - General Counsel and Secretary | |
Benjamin Gliklich | Executive Vice President - Operations and Strategy | |
J. David Tolbert | Chief Human Resources Officer | |
Scot R. Benson | President - Performance Solutions | |
Diego Lopez Casanello | President - Agricultural Solutions | |
Rakesh Sachdev, age 62, is Chief Executive Officer of Platform. Mr. Sachdev joined Platform in January 2016. Prior to joining Platform, Mr. Sachdev served as President and Chief Executive Officer of Sigma-Aldrich Corporation, or Sigma-Aldrich, beginning in 2010. Mr. Sachdev joined Sigma-Aldrich in 2008 as Chief Financial Officer and took on the additional role of Chief Administrative Officer with direct oversight of Sigma-Aldrich’s international business in 2009. He was Senior Vice President and President Asia Pacific of ArvinMeritor, Inc., or ArvinMeritor, a global supplier of engineered systems to the automotive industry, from 2007 to 2008. At ArvinMeritor, Mr. Sachdev also served in other leadership roles, including Interim Chief Financial Officer, Senior Vice President Strategy and Corporate Development and Vice President and General Manager of several of
13
ArvinMeritor’s global businesses from 1999 to 2007. Prior to joining ArvinMeritor, he worked for Cummins Inc., a global manufacturer of engines and other industrial products in various leadership roles, including Chief Financial Officer for one of its largest business units, and as Managing Director of its Mexican operations. Mr. Sachdev is also a director of Regal-Beloit Corporation and Edgewell Personal Care Company and serves on the Board of Trustees of Washington University in St. Louis. Mr. Sachdev holds an M.B.A. from Indiana University, a Masters in Mechanical Engineering from the University of Illinois and a Bachelor’s degree in Mechanical Engineering from the Indian Institute of Technology in New Delhi.
John P. Connolly, age 52, is Chief Financial Officer of Platform. Prior to being promoted to this role in March 2017, Mr. Connolly served as Vice President, Corporate Controller and Chief Accounting Officer since joining Platform in August 2016. Before joining Platform, Mr. Connolly served as Vice President, Controller and Chief Accounting Officer at Xylem Inc., a spun-off water technology company from ITT Corporation, or ITT, from October 2011 to August 2016. Prior to joining Xylem Inc., Mr. Connolly spent five years at ITT during which time he held key roles as Director, Financial Planning & Analysis, and Director of Accounting. Previously, Mr. Connolly spent 10 years at IBM in roles of increasing responsibility including Manager of Financial Planning & Analysis, Controller of a software division, and Head of Pricing & Licensing Strategy across IBM’s software business, as well as seven years at PricewaterhouseCoopers LLP reaching the level of Manager. Mr. Connolly is a Certified Public Accountant and holds an M.B.A. in Finance from the Lubin School of Business at Pace University.
John E. Capps, age 53, is Executive Vice President - General Counsel and Secretary of Platform. Mr. Capps joined Platform in May 2016. Prior to joining Platform, Mr. Capps was with Jarden Corporation, a Fortune 500 broad-based consumer products company, where he most recently served as Executive Vice President - Administration, General Counsel and Secretary until April 2016 when Jarden Corporation merged with Newell Brands Inc. From 2003 to 2005, Mr. Capps was with American Household, Inc. which was acquired by Jarden Corporation in January 2005. Previously, Mr. Capps worked as a private lawyer with the firm Sullivan & Cromwell LLP. Mr. Capps holds a J.D. from the University of Texas and a B.A. and M.B.A. from Vanderbilt University.
Benjamin Gliklich, age 33, is Executive Vice President - Operations and Strategy of Platform. Mr. Gliklich was appointed in this role in April 2016, after having served as Chief Operating Officer from October 2015 to April 2016; Vice President – Corporate Development, Finance and Investor Relations of Platform from January 2015 to October 2015 and as Director of Corporate Development from May 2014 to January 2015. Prior to joining Platform, Mr. Gliklich was a member of the investments team at General Atlantic, a global growth-oriented private equity firm. Earlier in his career, Mr. Gliklich worked in the investment banking division of Goldman Sachs & Co. Mr. Gliklich holds an A.B. Cum Laude from Princeton University and an M.B.A with distinction from Columbia Business School.
J. David Tolbert, age 56, is Chief Human Resources Officer of Platform. Mr. Tolbert has served in this role since December 2016, after serving as a human resources consultant to Platform from April 2016 to December 2016. Prior to joining Platform, Mr. Tolbert was with Jarden Corporation where he served as Senior Vice President, Human Resources and Corporate Risk from September 2001 to September 2014. From October 2014 to December 2015, Mr. Tolbert served as a human resources advisor for Jarden Corporation. Since 1993, Mr. Tolbert had served in various management and executive roles in the areas of human resources, administration and corporate risk for Jarden Corporation. From 1987 to 1993, Mr. Tolbert served in various human resources and operating positions at Ball Corporation. Mr. Tolbert holds a B.S. and M.B.A. from Ball State University.
Scot R. Benson, age 56, is President of the Performance Solutions segment of Platform. Mr. Benson joined MacDermid in 1999. His previous positions at MacDermid included President of MacDermid Advanced Surface Finishes and Graphics Solutions from January 2013 until February 2015. Mr. Benson also served as President of MacDermid Graphics Solutions from 2010 to 2013. Mr. Benson attended the University of Wisconsin - Stevens Point.
Diego Lopez Casanello, age 44, is President of the Agricultural Solutions segment of Platform. Prior to joining Platform in February 2016, Mr. Lopez Casanello served as Senior Vice President and head of the Agricultural Products Division, Asia Pacific at BASF from February 2015 to January 2016. His previous positions at BASF included Senior Vice President of the Performance Chemicals Division, North America from April 2012 to January 2015 as well as CEO and Managing Director of BASF Argentina from November 2008 to March 2012. Mr. Lopez Casanello has held numerous other roles within the Agricultural Products Division of BASF, including Head of Global Marketing for Seed Treatment, Global Manager of New Business Development and Business Director for South Europe. Mr. Lopez Casanello holds a Bachelor's degree in Business Administration from the University of Hagen, Hagen, Germany.
14
Item 1A. Risk Factors
The ownership of our securities involves a number of risks and uncertainties. Potential investors should carefully consider the risks and uncertainties described below and the other information in this 2017 Annual Report before deciding whether to invest in our Company. Our business, financial condition or results of operations could be materially adversely affected by any of these risks. The risks described below are not the only ones facing us. Additional risks that are currently unknown to us or that we currently consider to be immaterial may also impair our business or adversely affect our financial condition or results of operations.
Risk Related to the Proposed Separation of Agricultural Solutions
The Proposed Separation of our Agricultural Solutions business is contingent upon the satisfaction of a number of conditions and involves significant time of our management and expenses, which could disrupt or adversely affect our business.
The Proposed Separation of our Agricultural Solutions and Performance Solutions businesses is expected to be completed in 2018. However, we could be delayed or prevented from completing the Proposed Separation, or complete it on terms or conditions that are less favorable and/or different than expected, for a variety of reasons, including but not limited to:
• | market conditions and volatility; |
• | inability or delays in obtaining any legal or regulatory approvals; |
• | inability or difficulty in refinancing our Credit Facilities and other material indebtedness, including our Prior Senior Notes; |
• | challenges in establishing infrastructure or processes; and |
• | the possibility of more attractive strategic options arising in the future. |
In addition, the terms of the 5.875% USD Notes Indenture require that certain conditions, including both secured and total leverage ratio tests, be met in order to complete the designation of the subsidiaries that comprise the Agricultural Solutions business as unrestricted subsidiaries under that indenture. In order to comply with these conditions, additional equity contributions, refinancing of both our Amended and Restated Credit Agreement and our Prior Senior Notes and certain other related financings may be required. There can be no assurance that these financing or refinancings will occur or that the conditions set forth in the 5.875% USD Notes Indenture relating to the designation of our Agricultural Solutions subsidiaries as unrestricted subsidiaries will be satisfied.
Whether or not we complete the Proposed Separation, our ongoing businesses may be adversely affected and we may be subject to certain risks and consequences as a result of pursuing the Proposed Separation, including the following:
• | execution of the Proposed Separation requires and will continue to require significant time and attention from management, which may distract management from the operation of our businesses and the execution of other initiatives that may have been beneficial to us; |
• | our employees may also be distracted due to uncertainty about their future roles with us and Agricultural Solutions pending the completion of the Proposed Separation; |
• | some of our suppliers or customers may delay or defer decisions or may end their relationships with us or our Agricultural Solutions business; and |
• | we expect to incur incremental costs and expenses relating to the Proposed Separation, such as legal, accounting, tax and other professional fees. |
We may also experience negative reactions from the financial markets if we fail to complete the Proposed Separation. Any of these factors could have a material adverse effect on our business, financial condition, results of operations and/or price of our common stock.
Failure to maintain our credit ratings could adversely affect our liquidity, capital position, borrowing costs and access to capital markets.
Our credit risk is evaluated by the major independent rating agencies. In connection with the Proposed Separation, as we are designing and implementing the transaction structure and related financings, there can be no assurance that we will be able to maintain our current credit ratings. Any actual or anticipated changes or downgrades in our credit ratings, including any announcement that our ratings are under further review for a downgrade, may impact our reputation, and adversely affect our liquidity, capital position, borrowing costs and access to capital markets.
15
We may be unable to achieve some or all of the benefits that we expect to achieve from the Proposed Separation.
The Proposed Separation may not provide the results on the scope or on the scale we anticipate, and we may not realize all, or any, of the intended benefits. In addition, we will incur one-time costs and ongoing costs in connection with, or as a result of, the Proposed Separation, including costs of operating as separate companies that the two businesses will no longer be able to share.
Those costs may exceed our estimates or could negate some of the benefits we expect to realize. If we do not realize the intended benefits or if our costs exceed our estimates, our business, financial condition, results of operations and trading price may be adversely impacted.
If the Proposed Separation is completed, the trading price of our shares of common stock may decline or experience greater volatility.
If the Proposed Separation is completed, the trading price of our shares of common stock immediately following the Proposed Separation may decline or experience greater volatility as our business profile and market capitalization may no longer match some of our stockholders’ investment strategies in diversified companies, which could cause these investors to sell their shares of Platform’s common stock and/or to not invest in the Agricultural Solutions business as a separate public company. Excessive selling pressure could cause the market price of Platform’s common stock and, if publicly listed, the common stock of Agricultural Solutions, to decrease following the completion of the Proposed Separation. Similarly, following the Proposed Separation, our shares of common stock and those of the Agricultural Solutions business may collectively trade at a value less than the price at which our shares of common stock might have traded had the Proposed Separation not occurred as a result of the future performance of either us or the Agricultural Solutions business as separate companies, as well as the future stockholder base, market and trading price for our respective shares.
We may incur additional costs in connection with the Proposed Separation, which could adversely affect our business, financial condition or results of operations.
To the extent it becomes a public company, we may incur incremental costs in assisting the Agricultural Solutions business comply with its public reporting requirements and financial presentations as a separate business from Platform following the Proposed Separation. Fulfilling our public reporting requirements and creating additional costs for the Company in connection with the Agricultural Solutions business’ reporting requirements would likely be time-consuming and expensive. We cannot quantify or predict the increased costs to us as a result of the Proposed Separation.
In addition, other significant changes may occur in our cost structure, management, financing and business operations as a result of operating as a company separate from the Agricultural Solutions business following the Proposed Separation.
We may be subject to third-party claims in the event that Agricultural Solutions is not successful as a separate entity.
Following the Proposed Separation, we cannot guarantee that Agricultural Solutions will be successful as a separate entity. In the event that Agricultural Solutions is not successful, it is possible that third parties could assert a variety of claims against us. Depending on their nature and number, such claims could have a material adverse effect on our business, financial condition or results of operations.
We could be exposed to claims from Agricultural Solutions or third parties under our agreements with Agricultural Solutions or otherwise.
In connection with the Proposed Separation, we may enter into agreements with Agricultural Solutions including, among others, a separation agreement, transition services agreement and registration rights agreement. Our agreements with Agricultural Solutions may not reflect terms that would have resulted from negotiations between unaffiliated parties and, in certain instances, may relate to the continuation of certain business arrangements among us and Agricultural Solutions in existence prior to the Proposed Separation. Such provisions may include, among other things, indemnification rights and obligations, the allocations of liabilities, payment obligations and other obligations between us and Agricultural Solutions. There can be no assurance that any remedies available under these arrangements will be sufficient to us in the event of a dispute or non-performance.
In addition, there can be no assurance that the attention we must pay, and resources we must devote, to our obligations under one or more of these agreements, or the results of any failure to perform those obligations, or claim by Agricultural Solutions that we have failed to perform those obligations, will not have a material impact on our own business performance. Under the separation agreement, Agricultural Solutions will agree to indemnify us for certain liabilities. However, third parties could seek to hold us responsible for such liabilities and there can be no assurance that the indemnity from Agricultural Solutions will be sufficient to
16
fully protect us from such liabilities. The transition services agreement will provide for the performance by us of certain services for Agricultural Solutions, through and following the Proposed Separation. We will rely on Agricultural Solutions to satisfy its performance and payment obligations under these and all other agreements entered into in connection with the Proposed Separation. Agricultural Solutions' failure to satisfy such obligations may have a material adverse effect on our financial condition or results of operations.
The tax treatment of the Proposed Separation remains uncertain.
The tax treatment of the Proposed Separation will depend on several factors, including the settlement of inter-company balances, restructuring of outstanding debt, and the value of the Agricultural Solutions business at the time of the Proposed Separation for U.S. federal income tax and financial statement purposes. Preliminary tax analysis indicates that it is likely that the Proposed Separation will be a taxable event. However, pending resolution of these factors, conclusion on the tax treatment of the Proposed Separation, including whether this transaction will result in any tax liabilities, remains uncertain. Further, an analysis of the impact of the recently passed TCJA as it relates to the Proposed Separation is ongoing. As described below, the TCJA significantly reforms the Internal Revenue Code of 1986, as amended, and tax consequences for our business and contemplated transactions also remain uncertain.
Risks Relating to our Business
Acquisitions are an important part of our growth strategy.
Part of our key strategy is to grow through acquisitions. We have completed several acquisitions in the past and routinely review additional opportunities. This strategy presents certain risks including, without limitation, the potential for:
• | increasing debt levels to fund sizable acquisitions, resulting in additional liabilities, constraints and requirements on our business and financial performance; |
• | the acquired businesses failing to provide, or delays in realizing, the benefits originally anticipated by management; |
• | potential disruption of our businesses, tax costs or inefficiencies, inconsistencies or deficiencies in standards, controls (including internal control over financial reporting, environmental compliance and health and safety compliance), information technology systems, procedures and policies; |
• | difficulties managing tax costs or inefficiencies associated with integrating our operations following completion of acquisitions; |
• | difficulties in integrating the operations and systems of the acquired businesses and in realizing operating synergies by identifying and eliminating redundant operations and assets; |
• | difficulties in assimilating and retaining key employees, customers, suppliers and other partners of the acquired companies; |
• | challenges related to the lack of experience in operating in the geographical or product markets of the acquired business; |
• | management’s attention being diverted to the integration of the acquired businesses or acceptance of the acquired technology; |
• | rising interest rates on debt needed or dilution resulting from equity issuances to provide cash to fund the purchase price of acquisitions; and |
• | unanticipated contract or regulatory issues and the assumption of, and exposure to, unknown or contingent liabilities of the acquired businesses. |
If an acquisition is not successfully completed or integrated into our existing operations or does not result in the benefits we expect, as a result of the factors mentioned above or otherwise, our business, financial condition or results of operations may be adversely affected. In addition, failure to integrate successfully or realize the anticipated business opportunities and growth prospects from our acquisitions, including the Acquisitions, could result in unanticipated expenses and losses and may require significant financial resources that would otherwise be available for the ongoing development or expansion of our existing operations. Accordingly, in connection with any acquisition, there can be no assurance as to whether or when any benefits or cost synergies we hope to achieve will occur, or the extent to which they actually will be achieved. Finally, future business acquisitions or other material strategic initiatives, including, without limitation, the Proposed Separation, could compound the difficulty in making comparisons between prior, current and future periods because these events, which are not made in ordinary course of business, also affect our gross profit margins and our overall operating results.
17
Our substantial indebtedness may adversely affect our cash flow and our ability to operate our business and fulfill our obligations under our outstanding debt.
At December 31, 2017, our total indebtedness was approximately $5.48 billion. Such substantial indebtedness could have the following material consequences:
• | require us to dedicate a substantial portion of our cash flow from operations to payments on our indebtedness, thereby reducing the availability of our cash flow to fund acquisitions, working capital, capital expenditures, dividends, research and development efforts and other general corporate purposes; |
• | increase the amount of our interest expense, because our borrowings include instruments with variable rates of interest, which, if interest rates increase, would result in higher interest expense; |
• | increase our vulnerability to general adverse economic and industry conditions; |
• | limit our flexibility in planning for, or reacting to, changes in our business and the industry in which we operate; |
• | limit our ability to make strategic acquisitions, introduce new technologies or exploit business opportunities; |
• | place us at a competitive disadvantage compared to our competitors that have less indebtedness; and |
• | limit, among other things, our ability to borrow additional funds. |
In addition, our Credit Facilities and other agreements governing our outstanding debt contain covenants that restrict, among other things, our ability to incur additional debt, grant liens, pay cash dividends, enter new lines of business, repurchase our shares of common stock, make certain investments and engage in certain merger, consolidation or asset sale transactions. These restrictions could limit our ability to plan for or react to market conditions, meet extraordinary capital needs or otherwise take actions that we believe are in the best interest of our business. In addition, the terms of our Credit Facilities and these agreements allow us to issue and incur additional debt but only upon satisfaction of certain conditions. We anticipate that any future acquisitions we pursue as part of our growth strategy may be financed through a combination of cash on hand, operating cash flow, availability under our Credit Facilities and new capital markets offerings. If new debt is added to current debt levels, the related risks described above could increase.
Our ability to satisfy our debt obligations and to fund any planned capital expenditures, dividends and other cash needs also depends in part upon the future financial and operating performance of our subsidiaries and upon our ability to renew or refinance borrowings. Prevailing economic conditions and financial, business, competitive, legislative, regulatory and other factors, many of which beyond our control, will affect our ability to make these payments. If we are unable to make payments or refinance our debt, obtain waivers or new financing, or if holders of indebtedness elect to declare all borrowed funds due and/or to terminate their commitments for future funding, those holders could exercise their rights, including assuming control over our deposit accounts and/or commencing foreclosure proceedings against our assets, and we could be forced into bankruptcy or liquidation.
A change in our estimates and underlying assumptions regarding the future performance of our businesses could result in an impairment charge, which could materially affect our results of operations.
In accordance with GAAP, we account for our acquisitions using the purchase method of accounting and, historically, the Acquisitions have resulted in significant goodwill and other intangible assets being recognized in our Consolidated Financial Statements. We are required under GAAP to review our amortizable intangible assets for impairment when events or changes in circumstances indicate the carrying value may not be recoverable, and are also required to conduct impairment tests on goodwill and other indefinite-lived intangible assets annually or more frequently, if circumstances indicate that the carrying value may not be recoverable or that an other-than-temporary impairment exists. Other than the goodwill impairments we recorded in the Agro Business reporting unit within our Agricultural Solutions segment in 2017 and the Offshore Solutions reporting unit within our Performance Solutions segment in 2016, there were no impairments of goodwill or other intangible assets in 2017, 2016 or 2015. In 2017, however, our Graphics Solutions and Offshore Solutions reporting units within our Performance Solutions segment, as well as other indefinite-lived intangible assets, each had fair values that were not substantially in excess of their respective carrying values. Any changes in estimates or underlying assumptions regarding the future performance of our businesses could adversely affect our results of operations. Factors that could result in an impairment include, but are not limited to significant negative economic or industry trends or competitive operating conditions; significant macroeconomic conditions that may result in a future increase in the weighted-average cost of capital used to estimate fair value; and significant changes in the nature and timing of decisions regarding assets or markets that do not perform consistently with our expectations, including factors we use to estimate future levels of sales, Adjusted EBITDA or cash flows. Future impairment charges, if any, could have a material adverse effect on our results of operations in the periods recognized.
18
We are exposed to fluctuations in currency exchange rates, which may adversely affect our operating results and may significantly affect the comparability of our results between financial periods.
We have significant operations outside the United States, the financial results of which are maintained in the local currency and then translated in U.S. dollars at applicable exchange rates for inclusion in our consolidated financial statements. The exchange rates between these currencies and the U.S. dollar have fluctuated and will likely continue to do so in the future. Changes in exchange rates between these local currencies and the U.S. dollar will affect the recorded levels of sales, profitability, assets or liabilities. In addition, translated U.S. dollar amounts reflected in our financial statements may obscure underlying financial trends that would be apparent in financial statements prepared on a constant currency basis or affect the comparability of our results between financial periods. In addition, as a result of our international operations, our business and financing arrangements are conducted in a variety of currencies resulting in transactional currency risk. Although we may employ at times a variety of techniques to mitigate the impact of exchange rate fluctuations, including a limited number of foreign currency hedging activities, we cannot guarantee that such risk management strategies will be effective, and our financial condition, or results of operations could be adversely impacted.
In addition, the June 2016 national referendum in the United Kingdom, commonly referred to as "Brexit," whereby a majority of voters elected to withdraw the United Kingdom from the E.U. caused further volatility in global stock markets and currency exchange rate fluctuations that resulted in the strengthening of the U.S. dollar against foreign currencies. The strengthening of the U.S. dollar may adversely affect our business, financial condition or results of operations, and expose us to gains and losses on non-U.S. currency transactions. Further, a potential devaluation of the local currencies of our customers relative to the U.S. dollar could impair their purchasing power and cause them to decrease or cancel orders or default on payment. This volatility in foreign currencies is expected to continue as the United Kingdom negotiates and executes its exit from the E.U. but it is uncertain over what time period this will occur. Any of these effects of Brexit, among others, could adversely affect our business, financial condition, or results of operations.
The failure to attract and retain key personnel, including our executive officers, or effectively manage succession, could have an adverse impact on our business, financial condition or results of operations.
Our business involves complex operations and therefore demands a leadership team and employee workforce that is knowledgeable and expert in many areas necessary for our operations. The failure to attract and retain key personnel, or effectively manage succession, could have an adverse material impact on our result of operations. In addition, we are highly dependent on the experience and track records of our management, particularly Martin E. Franklin and Rakesh Sachdev, in successfully acquiring and managing businesses. If one or more of our executive officers were to cease to be employed by us, or if we were unable to replace them in a timely manner, our business, financial condition or results of operations could be adversely affected.
In addition, as a company focused on manufacturing and highly technical customer service, we rely on our ability to attract and retain skilled employees, including our specialized research and development, and sales and service personnel, in order to maintain our efficient production processes, drive innovation in our product offerings and maintain our deep customer relationships. The departure of a significant number of our highly skilled employees, or of one or more employees who hold key management positions, could have an adverse impact on our operations, including customers choosing to follow an employee or manager to one of our competitors.
If we fail to establish and maintain adequate internal controls over financial reporting, we may not be able to report our financial results in a timely and reliable manner, which could harm our business and impact the value of our securities.
We are required by the SEC to establish and maintain adequate internal control over financial reporting that provides reasonable assurance regarding the reliability of our financial reporting and the preparation of financial statements in accordance with GAAP. We are likewise required, on a quarterly basis, to evaluate the effectiveness of our internal controls and to disclose any material changes and material weaknesses in those internal controls.
As discussed in this 2017 Annual Report in Part II, Item 9A, we have identified material weaknesses in the past and, as of December 31, 2017, a material weakness in our internal control over financial reporting related to the accounting for income taxes had not been fully remediated. As a result, we have concluded, based on management's assessment, that our internal control and procedures were ineffective at December 31, 2017 as it relates to the accounting for income taxes. Effective internal controls are necessary for us to provide reliable and timely financial reports and to effectively prevent fraud. If we cannot provide reliable financial reports and effectively prevent fraud, our reputation and operating results could be harmed. Likewise, if our financial statements are not filed on a timely basis as required by the SEC and the NYSE, we could face severe consequences from those authorities. Inferior internal controls could also cause investors to lose confidence in our reported financial information, which could affect our stock price.
19
Even effective internal controls have inherent limitations including the possibility of human error, the circumvention or overriding of controls, or fraud. Therefore, even effective internal controls can provide only reasonable assurance with respect to the preparation and fair presentation of financial statements. In addition, projections of any evaluation of effectiveness of internal control over financial reporting in future periods are subject to the risk that the control may become inadequate because of changes in conditions or a deterioration in the degree of compliance with the policies or procedures.
Finally, our business strategy contemplates the acquisition of businesses and the operation of subsidiaries whose financial results are consolidated into our financial statements and operating reporting. Effective internal control over financial reporting must be established and maintained in connection with these acquisitions, if any, in order for us to produce accurate and timely financial reports. Failure to do so could result in our inability to report our financial results accurately and on a timely basis, and possibly lead to other deficiencies, which would also likely have a negative impact on our stock price.
We have identified material weaknesses in the past and we have a remaining material weakness in our internal control over financial reporting which, if not remediated, could affect the accuracy and timeliness of our financial reporting and result in misstatements in our financial statements.
Our management is responsible for establishing and maintaining adequate internal control over our financial reporting, as defined in Rule 13a-15(f) under the Exchange Act. As previously reported, we have identified material weaknesses in the past and in connection with its evaluation related to this 2017 Annual Report, management concluded that our internal control over financial reporting as it relates to the accounting for incomes taxes was ineffective at December 31, 2017.
A material weakness is defined as a deficiency, or combination of deficiencies, in internal controls over financial reporting, such that there is a reasonable possibility that a material misstatement of our annual or interim financial statements will not be prevented or detected on a timely basis.
As previously reported and discussed in this 2017 Annual Report in Part II, Item 9A, we have taken, and continue to take, numerous steps to remediate this material weakness and improve our internal controls over financial reporting. However, there can be no assurance that the measures we have taken to date, and are continuing to take, will be sufficient to remediate this material weakness or avoid potential future material weaknesses. If our remedial measures are insufficient to address this material weakness, or if additional material weaknesses or significant deficiencies in our internal controls are discovered or occur in the future, or if we are not able to comply with the requirements of Section 404 of Sarbanes-Oxley Act of 2002 in a timely manner, our financial statements for one or more periods may contain material misstatements and we could be required to restate previously issued financial statements for past periods, which may have a material adverse effect on our stock price and our ability to access capital and lending markets.
Our substantial international operations subject us to risks not faced by domestic competitors.
Our business involves significant international operations which, accordingly, subject us to risks related to the different legal, political, social and regulatory requirements and economic conditions of many foreign jurisdictions. Risks inherent to our international operations include the following:
• | fluctuations in currency values and foreign currency exchange rates; |
• | increased credit risk and different financial conditions, which may necessitate longer payment cycles of accounts receivable or result in increased bad debt write-offs (including due to bankruptcy) or additions to reserves; |
• | additional withholding taxes or other taxes on foreign income, tariffs, duties, export controls, import restrictions or other restrictions on foreign trade or investment, including currency exchange controls; |
• | foreign exchange controls or other currency restrictions and limitation on the movement of funds, including the prohibition of the repatriation of funds into the United States, which may result in adverse tax consequences and tax inefficiencies; |
• | export licenses may be difficult to obtain, and the transportation of our products may be delayed or interrupted; |
• | general economic and political conditions in the countries in which we operate, including devaluation or fluctuations in the value of currencies, gross domestic product, interest rates, market demand, labor costs and other factors beyond our control; |
• | unexpected adverse changes in foreign laws or foreign regulatory requirements, including in laws or regulatory requirements pertaining to employee benefits, the environment and health and safety, such as China's latest environmental crackdown; |
• | protectionist policies, which may restrict or impair the manufacturing, sales or import and export of our products; |
• | new restrictions on access to markets, such as adverse trade policies or trade barriers; |
20
• | a lack of or inadequate infrastructure; |
• | political crises; |
• | uncertainties as to the enforceability of contract rights and reduced protection of intellectual property rights in some countries; |
• | expropriation of assets or forced relocations of operations; |
• | inflation and hyperinflationary economic conditions and adverse economic effects resulting from governmental attempts to control inflation, such as imposition of wage and price controls and higher interest rates; |
• | business cultures accepting of various levels of corruption; |
• | the requirement to comply with a wide variety of foreign and U.S. laws and regulations that apply to international operations, including, without limitation, economic sanctions regulations, labor laws, import and export regulations, anti-corruption and anti-bribery laws; |
• | challenges in maintaining an effective internal control environment with operations in multiple international locations, including language and cultural differences, varying levels of GAAP expertise and internal control over financial reporting in international locations and multiple financial information systems; |
• | difficulties managing and administering an internationally dispersed business, as the management of our personnel across many countries can present legal, logistical and managerial challenges; and |
• | labor disruptions, civil unrest, significant social, political or economic instability, wars or other armed conflict or acts of terrorism. |
Any of these risks could impact our ability to manufacture, source, sell or export our products or repatriate profits. We could also experience a loss of sales and profitability from our international operations, and/or a substantial impairment or loss of assets, any of which could have a material adverse impact on our business, financial condition or results of operations.
In addition, we have been taking steps to increase our presence in new markets, including emerging markets and less developed countries. However, there is no guarantee that our efforts to expand sales in these markets will succeed. In these markets, we are subject to a variety of risks in addition to those described above, including global financial instability, consumers with limited or fluctuating discretionary spending, unstable governments and privatization, changes in customs or tax regimes or other government actions affecting the flow of goods and currency. Any of these risks could materially adversely affect our business, financial condition or results of operations.
Furthermore, some of our international operations are conducted in parts of the world that experience corruption to some degree. Although we have policies and procedures in place that are designed to promote legal and regulatory compliance (including with respect to the FCPA and the Bribery Act as further described below), our employees, suppliers, distributors and wholesalers could take actions in contravention of our policies and procedures that violate applicable anti-corruption laws or regulations. Violations of these laws, or allegations of such violations, could have a material adverse effect on our reputation, or our business, financial condition, or results of operations.
The withdrawal of the United Kingdom from the E.U. may have a negative effect on global economic conditions, financial markets and our business.
We are a multinational company with worldwide operations, including significant business operations in Europe. Subsequent to Brexit, in February 2017, the British Parliament voted in favor of allowing the British government to begin negotiating the terms of the United Kingdom's withdrawal from the E.U. and in March 2017, the British government officially triggered the process to formally initiate negotiations for the terms of separation from the E. U. by April 2019. In June 2017, the British government began negotiations to leave the E. U. This will be either accompanied or followed by additional negotiations between the EU and the United Kingdom concerning the future relations between the parties, including the terms of trade between the parties. While the ultimate effect of Brexit are difficult to predict, the withdrawal process has created significant uncertainty about the future relationship between the United Kingdom and the E.U., and has given rise to calls for certain regions within the United Kingdom to preserve their place in the E.U. by separating from the United Kingdom as well as for the governments of other E.U. member states to consider withdrawal.
These developments, or the perception that any of them could occur, have had and may continue to have a material adverse effect on global economic conditions and the stability of global financial markets, and could significantly reduce global market liquidity and restrict the ability of key market participants to operate in certain financial markets. Asset valuations, currency exchange rates and credit ratings may be especially subject to increased market volatility. Lack of clarity about future United Kingdom laws and regulations as the United Kingdom determines which E.U. laws to replace or replicate in the event of a withdrawal, including
21
financial laws and regulations, tax and free trade agreements, intellectual property rights, supply chain logistics, environmental, health and safety laws and regulations, immigration laws and employment laws, could decrease foreign direct investment in the United Kingdom, increase costs, depress economic activity and restrict our access to capital. If the United Kingdom and the E.U. are unable to negotiate acceptable withdrawal terms or if other E.U. member states pursue withdrawal, barrier-free access between the United Kingdom and other E.U. member states, or among the European economic area overall, could be diminished or eliminated. Any of these factors could have a material adverse effect on our business, financial condition or results of operations.
We have made investments in, and are expanding our business into, emerging markets and less-developed countries, which exposes us to certain additional risks.
We have been taking steps to increase our presence in emerging markets and less developed countries. However, there is no guarantee that our efforts to expand sales in these markets will succeed. In these markets, we are subject to a variety of additional risks including global financial instability, consumers with limited or fluctuating discretionary spending on which the end users of our products depend, weak legal systems which may affect our ability to enforce our intellectual property and contractual rights, exchange controls, unstable governments and privatization, changes in customs or tax regimes, or other government actions affecting the flow of goods and currency. Accordingly, changes in any of those areas may have significant negative impacts on our business, financial condition, or results of operations. Other risks inherent in operations in emerging markets include, for example, unpredictable changes in relative prices and rates of economic growth; currency exchange fluctuations; unpredictable tax policies and trade regulations; restrictions on repatriation of cash and other exchange controls; less developed and less reliable judicial and administrative systems, which can render contractual rights unenforceable; the imposition of trade sanctions, resulting in lost access to customers and suppliers in the targeted countries; increased prevalence of bribery and other forms of corruption, and the costs associated with implementing and maintaining effective compliance programs; labor strikes; unsettled political, social, or economic conditions; public health issues or epidemics; war, terrorist activities, or other armed conflict; any of which could adversely affect our business, financial condition or results of operations.
Adverse weather conditions, including those resulting from climate change and natural disasters, as well as seasonality, may negatively impact the operations and operating results of our Agricultural Solutions business.
Sales volumes for agrochemical products are subject to the sector’s dependency on weather and disease and pest infestation conditions. Adverse weather conditions and natural disasters such as drought and floods in a particular region, storms, hurricanes, tsunamis, hail, tornadoes, freezing conditions or extreme heat could have a material adverse effect on our Agricultural Solutions business. The agricultural industry, including our Agricultural Solutions business, may also be adversely affected by global climate change and its impact on weather conditions such as changes in precipitation patterns and the increased frequency of extreme weather events.
In addition, unfavorable weather conditions and natural disasters can reduce acreage planted, lead to modified crop selection by growers, and affect the incidence (or timing) of certain weeds, crop diseases or pest infestations, each of which may reduce or otherwise alter demand for our products and adversely affect our business and results of operations. Weather conditions and natural disasters also affect decisions of our distributors, direct customers, and end-users about the types and amounts of products to purchase and the timing of use of such products. Delays by growers in planting or harvesting can result in deferral of orders to a future quarter, or decisions to forgo orders altogether in a particular growing season, either of which would negatively affect our sales. Climatic and weather conditions and other variables that are difficult to forecast can lead to changes in planting and growing seasons with the result that sales of our products may vary substantially from year to year and quarter to quarter and from our internal forecasts.
In addition, our agrochemical operations are seasonal, with a greater portion of total net revenue and Adjusted EBITDA occurring in the second and fourth quarters. As a result, any factors that would negatively affect our second and fourth quarter results in any year, including severe weather conditions and natural disasters, could affect decisions by our customers and end-users about the types and amounts of agrochemicals and BioSolutions products to purchase and the timing of use of such products, which in turn could have an adverse impact on the results of operations, financial condition and results of operations of our Agricultural Solutions business for the entire year.
Volatility and increases in the price of raw materials, energy and transportation could harm our profits.
We use a variety of specialty and commodity chemicals in our formulation processes, and such formulation operations depend upon obtaining adequate supplies of raw materials on a timely basis. We typically purchase our major raw materials on a contract or as needed basis from outside sources. The availability and prices of raw materials may be subject to curtailment or change due to, among other things, the financial stability of our suppliers, suppliers’ allocations to other purchasers, interruptions in production by suppliers, new laws or regulations (for example, increasingly restrictive environmental regulations applicable to manufacturers
22
in China), protectionist nationalistic trade policies and practices, changes in exchange rates and worldwide price levels (especially for raw materials derived from petrochemical based and element based feedstocks). In some cases, we are limited in our ability to purchase certain raw materials from other suppliers by our supply agreements which contain certain minimum purchase requirements.
Similarly, commodities and energy prices are subject to volatility caused by market fluctuations, supply and demand, currency fluctuations, production and transportation disruptions, and other world events. As we source many of our raw materials globally to help ensure quality control, if the cost of energy, shipping or transportation increases and we are unable to pass along those costs to our customers, our profit margins would be adversely impacted. Furthermore, increasing our prices to our customers could result in long-term sales declines or loss of market share if our customers find alternative suppliers or choose to reformulate their consumer products to use fewer ingredients, which could have an adverse long-term impact on our results of operations.
Our reliance on a limited base of key customers, contract manufacturers, suppliers or independent distributors could adversely affect our overall sales and profitability.
In our Performance Solutions segment, we have key customers, the loss of which may impair our results of operations for the affected earnings periods. The principal products purchased by such customers are surface finishing chemicals and solid sheet printing elements. In addition, in our Agricultural Solutions segment, we rely on unaffiliated contract manufacturers, both domestically and internationally, to produce certain products or key components of products. There is limited available manufacturing capacity that meets our quality standards and regulatory requirements. If we are unable to arrange for sufficient production capacity among our contract manufacturers or if our contract manufacturers encounter production, quality, financial, or other difficulties (including labor or geopolitical disturbances), we may encounter difficulty in meeting customer demands as the manufacture of our products may not be easily transferable to other sites. In addition, many of our products are developed or distributed through strategic partnerships. Some of our existing formulated products and others currently under development include combinations of proprietary AIs or combinations of AIs with proprietary safeners or adjuvants. Some of these proprietary AIs, safeners, and adjuvants are owned by third-parties, and the development and commercialization of such products are carried out through contractual strategic arrangements with such third-parties. We may also be dependent on a limited number of key suppliers for AIs. In addition, we generally do not have long-term supply contracts with AI suppliers for our regional portfolio. If our sources of AI supplies are terminated or affected by adverse prices or other concerns, we may not be able to identify alternate sources of AI supplies to sustain our sales volumes on commercially reasonable terms, or at all.
We also rely on independent distributors within each segment to distribute our products and to assist us with the marketing and sale of certain of our products. There can be no assurance that our distributors will focus adequate resources on selling our products to end users, or will be successful in selling our products, which could materially adversely affect our business.
If we are unable to protect our intellectual property rights, our business, financial condition or results of operations could be adversely affected.
Our success depends to a significant degree upon our ability to protect and preserve our intellectual property rights and the rights to our proprietary processes, methods, compounds and other technology. Failure to protect our existing intellectual property rights may result in the loss of valuable technologies and our competitors offering similar products, potentially resulting in the loss of one or more competitive advances and decreased sales. In addition, the laws of other countries may not protect our intellectual property rights to the same extent as the laws of the United States. In addition, a vigorous prosecution of an infringement claim is not always cost effective or practical.
In some cases, we rely upon unpatented proprietary manufacturing expertise, continuing technological innovation and other trade secrets to develop and maintain our competitive position. While we generally enter into confidentiality agreements with our employees and third-parties to protect our intellectual property, our confidentiality agreements could be breached and may not provide meaningful protection for or adequate remedies to protect our trade secrets or proprietary manufacturing expertise in the event of unauthorized use or disclosure of information.
Despite efforts to protect our proprietary rights, existing trade secret, copyright, patent and trademark laws afford us only limited protection. Others may attempt to copy or re-engineer aspects of our products or obtain and use information that we regard as proprietary. Accordingly, we may not be able to prevent misappropriation of our products or trade secrets, or deter others from developing similar products. Further, monitoring the unauthorized use of our products and other proprietary rights is difficult. Litigation may be necessary to enforce our intellectual property rights or to determine the validity and scope of the proprietary rights of others. Litigation of this type could also result in substantial costs and diversion of resources and could significantly harm our results of operations and reputation.
23
We may experience claims that our products infringe the intellectual property rights of others, which may cause us to incur unexpected costs or prevent us from selling our products.
We seek to improve our business processes and develop new products and applications. Many of our competitors have a substantial amount of intellectual property that we must continually monitor to avoid infringement. We may experience claims that our processes and products infringe issued patents (whether present or future) or other intellectual property rights belonging to others. From time to time, we oppose patent applications that we consider overbroad or otherwise invalid in order to maintain the ability to operate freely in our various business lines without the risk of being sued for patent infringement. If, however, patents are subsequently issued on any such applications by other parties, or if patents belonging to others already exist that cover our products, processes or technologies, we could experience claims of infringement or have to take other remedial or curative actions to continue our production and sales activities with respect to one or more products. Further, intellectual property litigation is expensive and time-consuming, regardless of the merits of any claim, and could divert our management’s attention from operating our business.
In addition, many of our products directly or indirectly are offered as presenting critical performance attributes, which expose us to a greater risk of product liability claims. If a person were to bring a product liability suit against one of our customers, that customer may in turn attempt to seek damage compensation from us. A person may also bring a product liability claim directly against us. A successful product liability claim or series of claims against us in excess of our insurance coverage for payments could have a material adverse effect on our financial condition or results of operations. While we endeavor to protect ourselves from such claims and exposures in our contractual negotiations (including through indemnification provisions), we cannot assure you that our efforts in this regard will ultimately protect us from any such claims.
If we experience a significant disruption in our information technology systems or if we fail to implement new systems and software successfully, our business operations could be adversely affected.
We depend on information technology systems throughout the Company to control our manufacturing processes, process orders, manage inventory, process and bill shipments to and collect cash from our customers, respond to customer inquiries, contribute to our overall internal control processes, maintain records of our property, plant and equipment and record and pay amounts due to vendors and other creditors. We are or will be implementing new enterprise resource planning software for our Agricultural Solutions segment and other software applications to manage certain business operations going forward. As we upgrade or change systems, we may suffer interruptions in service, loss of data or reduced functionality and other problems could arise that we have not foreseen. Such problems could adversely impact our ability to provide quotes, take customer orders and otherwise run our business in a timely manner. In addition, if our new systems fail to provide accurate and increased visibility into pricing and cost structures, it may be difficult to improve or maximize our profit margins. As a result, our results of operations could be adversely affected.
Our business operations and internal control processes could also be disrupted if our information technology systems fail to perform adequately. The efficient operation of our business depends on our information technology systems, some of which are managed by third-party service providers. The failure of our information technology systems to perform as we anticipate could disrupt our business and could result in transaction errors, processing inefficiencies, and the loss of sales and customers, causing our business, financial condition and results of operations to suffer.
Changes in data privacy and data protection laws and regulations, or any failure to comply with such laws and regulations, could adversely impact our business.
Our business is subject to a wide variety of laws and regulations in the U.S. and internationally designed to protect the privacy of clients, customers, employees and other third parties. The interpretation and application of such laws and regulations is uncertain and evolving and it is possible that these laws may be interpreted and applied in a manner that is inconsistent with our data practices. For example, the E.U. General Data Protection Regulation, or GDPR, which will take effect in May 2018, creates a range of new compliance obligations and increases financial penalties for non-compliance and extends the scope of the E.U. data protection law to all companies processing data of E.U. residents, regardless of the company’s location. Complying with the GDPR and other privacy and data protection laws could cause us to incur substantial costs or require us to change our business practices in a manner adverse to our business. In addition, if we fail to comply with these laws or regulations, we could be subject to significant litigation, monetary damages, regulatory enforcement actions or fines in one or more jurisdictions.
Despite our efforts to protect sensitive information and confidential and personal data and to comply with and implement data security measures, our facilities and systems may be vulnerable to security breaches and other data loss, including cyber-attacks. In addition, it is not possible to predict the impact on our business of the future loss, alteration or misappropriation of information in our possession related to us, our employees, former employees, customers or suppliers. Depending on their nature and scope, these threats could potentially lead to improper use of our systems and networks, manipulation and destruction of proprietary or
24
key data or product non-compliance. Breaches of our security measures or the accidental loss, inadvertent disclosure, or unapproved dissemination of proprietary information or sensitive or confidential information about the Company, our employees, former employees, customers or suppliers could result in legal claims or proceedings, damage to or inaccessibility of critical systems, manufacture of defective products, production downtimes, operational disruptions and other significant costs, which could adversely affect our reputation, financial condition and results of operations.
Our net sales and gross profit have varied depending on our product, customer and geographic mix for any given period, which makes it difficult to forecast future operating results.
Our net sales and gross profit vary among our products, customers and markets, and therefore may be different in future periods from historic or current periods. Overall gross profit margins in any given period are dependent in large part on the product, customer and geographic mix reflected in that period’s net sales. Market trends, competitive pressures, commoditization of products, increased component or shipping costs, regulatory conditions, severe or adverse weather and other factors may also result in reductions in revenue or pressure on the gross profit margins of certain segments in a given period.
The varying nature of our product, customer and geographic mix between periods, including the historically seasonable nature of our agrochemical operations, has materially impacted our net sales and gross profit between periods during certain recessionary times and may lead to difficulties in measuring the potential impact of market, regulatory and other factors on our business. As a result, we may be challenged in our ability to forecast our future operating results.
Global economic conditions may adversely affect our net sales, gross profit and financial condition and result in delays or reductions in spending, which could have a material adverse effect on us.
Our products are sold in industries that are sensitive to changes in general economic conditions, including agricultural, animal health, electronics, graphics, plating, and offshore oil and gas production and drilling industries. Accordingly, our net sales, gross profit and financial condition depend significantly on general economic conditions and the demand for our products and services in the markets in which we compete. In particular, weak economic conditions in parts of China and South America may have an adverse effect on our results. A delay or a reduction in customer spending due to an economic downturn would reduce demand for our products and services and, consequently, could have a material adverse effect on our business, financial condition, or results of operations.
Industry and consumer trends may cause significant fluctuations in our results of operations and have a material adverse effect on our financial condition.
We believe that the specialty chemical industry in general, and the printing industry in particular, are cyclical and subject to constant and rapid technological change, product obsolescence, price erosion, evolving standards, short product lifecycles, raw material price fluctuations and changes in product supply and demand. The specialty chemical industry is currently being affected by globalization and a shift in customers’ businesses while the printing industry is currently shrinking. The trends and characteristics in these industries may cause significant fluctuations in our results of operations and have a material adverse effect on our financial condition.
Our specialty chemicals are used for a broad range of applications by our customers. Changes, including technological changes, in our customers’ products or processes may make our specialty chemicals unnecessary, which would reduce the demand for those chemicals. We have had, and may continue to have, customers that find alternative materials or processes and therefore no longer require our products, which had and may continue to have a material adverse effect on our business, financial condition or results of operations. Similarly, demand for our products could be affected by consumer concerns regarding the health effects of ingredients as concerns continue to mount about food safety and genetically modified organisms or other product ingredients issues.
The high level of competition in our industries may lead to pricing pressure, reduced margins, or the inability of our products to achieve market acceptance.
We operate in intensely competitive markets that experience rapid technological developments, changes in industry standards, changes in customer requirements, and frequent new product introductions and improvements. We also encounter competition from numerous and varied competitors in all areas of our business. Many of our competitors have longer operating histories, significantly greater resources, greater brand recognition, and a larger base of customers than we do. As a result, they may be able to devote greater resources to the research and development, manufacturing, formulation, promotion, or sale of their products, receive greater resources and support from independent distributors, initiate or withstand substantial price competition, more readily take advantage of acquisition or other opportunities, and withstand adverse changes in conditions within the relevant industry, the prices of raw materials and energy or general economic conditions, or changes in the competitive environment, which
25
could result in larger competitors.
We expect our competitors to continue to develop and introduce new products and to enhance their existing products, which may cause a decline in market acceptance of our products. Our competitors may also improve their processes or expand their manufacturing or formulation capacity, which could make it more difficult or expensive for us to compete successfully. In addition, our competitors could enter into exclusive arrangements with our existing or potential customers or suppliers, which could limit our ability to acquire necessary raw materials or to generate sales and/or significantly increase costs. At the same time, an increasing number of our products are coming off patent and are thus available to generic manufacturers to produce. As a result, we anticipate that we will continue to face new and different competitive challenges.
Our operating results are also influenced in part by our ability to introduce new products and services that offer distinct value to our customers, particularly prior to our competitors' ability to introduce equivalent products. We seek to provide tailored products for our customers’ often unique problems, which require an ongoing level of innovation. Even where we devote significant human and financial resources to develop new technologically advanced products and services, we may not be successful in these efforts. If we are not able to continue technological innovation and successful commercial introduction of new products, our customers may turn to other producers to meet their requirements. Furthermore, if our competitors are able to introduce equivalent products before we are able to bring new products to market, we may lose market shares to our competitors. Any of these factors may impact our business, financial condition, or results of operations. In addition, if we are unable to adapt to changes in market needs, our future ability to penetrate markets and sustain our market position could be adversely affected.
Chemical manufacturing is inherently hazardous and may result in accidents, which may disrupt our operations or expose us to significant losses or liabilities.
The hazards associated with chemical manufacturing and the related storage and transportation of raw materials, products and wastes are inherent in our operations.
Our research and development, manufacturing, formulating and packaging activities involve the use of hazardous materials and the generation of hazardous waste. We cannot eliminate the risk of accidental contamination, discharge or injury resulting from those materials. Also, our suppliers or contract manufacturers may use and/or generate hazardous materials in connection with producing our products. We may be required to indemnify our suppliers, contract manufacturers or waste disposal contractors against damages and other liabilities arising out of the production, handling or storage of our products or raw materials or the disposal of related wastes. Potential risks include explosions and fires, chemical spills and other discharges or releases of toxic or hazardous substances or gases, and pipeline and storage tank leaks and ruptures. Those hazards may result in personal injury and loss of life, damage to property and contamination of the environment, which may result in a suspension of operations and the imposition of civil or criminal fines, penalties and other sanctions, cleanup costs, and claims by governmental entities or third-parties. We are dependent on the continued operation of our production facilities (including third-party manufacturing on a tolling basis), and the loss or shutdown of operations over an extended period could have a material adverse effect on our financial condition, or results of operations.
Our operations currently use, and have historically used, hazardous materials and generate, and have historically generated, quantities of hazardous waste. For example, we are subject to regulatory oversight and investigation, remediation, and monitoring obligations at its current and former Superfund sites, as well as third-party disposal sites, under federal laws and their state and local analogues, including the Resource Conservation and Recovery Act (RCRA), the Clean Water Act, the Clean Air Act, and the Comprehensive Environmental Response, Compensation and Liability Act (CERCLA), as well as analogous foreign laws. In particular, we are subject to ongoing obligations at active sites in the United States and are conducting closure activities pursuant to the RCRA at several sites in the United States. The costs and liabilities associated with these issues may be substantial and may materially impact the financial health of our company.
We may incur material costs relating to environmental and health and safety requirements or liabilities, which could have a negative impact on our financial condition or results of operations.
We are subject to extensive federal, state, local and foreign environmental, health and safety laws and regulations concerning the environment and the generation, use, handling, storage, transportation, treatment and disposal of hazardous waste and other materials. Our operations bear the risk of violations of those laws and sanctions for violations such as clean-up and removal costs, long-term monitoring and maintenance costs, costs of waste disposal, fines for natural resource damage, and payments for property damage and personal injury. Additionally, those requirements, and enforcement of those requirements, may become more stringent in the future. The ultimate cost of compliance with any such requirements could be material. We have incurred, are incurring and will in the future incur, costs and capital expenditures in complying with environmental, health and safety laws and regulations.
26
Although it is our policy to comply with such laws and regulations, it is possible that we have not been or may not be at all times in material compliance with all of those requirements.
At any given time, we may be involved in claims, litigation, administrative proceedings, settlements and investigations of various types in a number of jurisdictions involving potential environmental liabilities. In particular, we are currently involved in various investigations due to historic operations. Liability under some environmental laws relating to contaminated sites can be joint and several and imposed retroactively, regardless of fault or the legality of the activities that gave rise to the contamination. Some of our formulating and manufacturing facilities have an extended history of chemical formulating and manufacturing operations or other industrial activities, and contaminants have been detected at some of our sites and offsite disposal locations. Ultimate environmental costs are difficult to predict and may vary from current estimates and liabilities. The discovery of additional contaminants, the inability or failure of other liable parties to satisfy their obligations, the imposition of additional cleanup obligations, or the commencement of related third-party claims could result in significant additional costs.
Our offshore oil industry products are subject to the hazards inherent in the offshore oil production and drilling industry, and we may incur substantial liabilities or losses as a result of these hazards.
We produce water-based hydraulic control fluids for major oil companies and drilling contractors to be used for potentially hazardous offshore deep water production and drilling applications. Offshore deep water oil production and drilling are subject to hazards that include blowouts, explosions, fires, collisions, capsizing, sinking and damage or loss to pipeline, subsea or other facilities from severe weather conditions. Those hazards could result in personal injury and loss of life, severe damage to or destruction of property and equipment, pollution or environmental damage and suspension of operations. A catastrophic occurrence at a location where our products are used may expose us to substantial liability for personal injury, wrongful death, product liability or commercial claims. To the extent available, we maintain insurance coverage that we believe is customary in our industry. Such insurance does not, however, provide coverage for all liabilities, and we cannot assure you that our insurance coverage will be adequate to cover claims that may arise or that we will be able to maintain adequate insurance at rates we consider reasonable. The occurrence of a significant offshore deep water oil production or drilling event that results in liability to us that is not fully insured could have a material and adverse effect on our financial condition, or results of operations.
Certain of our products may be subject to various export control regulations and exports may require a license from the U.S. Department of State or the U.S. Department of Commerce.
Companies must comply with various laws and regulations relating to the export of products, services, and technology. In the United States, these laws include, among others, the U.S. Export Administration Regulations (EAR) administered by the U.S. Department of Commerce’s Bureau of Industry and Security and the International Traffic in Arms Regulations (ITAR), administered by the U.S. Department of State’s Directorate of Defense Trade Controls. Some of our products or technology may have military or strategic applications governed by the ITAR or represent so-called “dual use” items governed by the EAR. As a result, these products may require government licenses to be exported to certain jurisdictions or persons. Any failure to comply with these laws and regulations could result in civil or criminal penalties, fines, investigations, adverse publicity and restrictions on our ability to export our products, which could result in a material adverse effect on our business, financial condition, or results of operations.
The recently passed comprehensive U.S. tax reform bill could adversely affect our business and financial condition.
On December 22, 2017, the TCJA, was signed into law. The TCJA significantly reforms the Internal Revenue Code of 1986, as amended. The TCJA, among other things, contains significant changes to corporate taxation, including reduction of the corporate tax rate from a top marginal rate of 35% to a flat rate of 21%, limitation of the tax deduction for interest expense to 30% of adjusted earnings (except for certain small businesses), limitation of the deduction for net operating losses to 80% of current year taxable income and elimination of net operating loss carrybacks, one time taxation of offshore earnings at reduced rates regardless of whether they are repatriated, new taxes on certain foreign-sourced earnings, immediate deductions for certain new investments instead of deductions for depreciation expense over time, and modification or repeal of many business deductions and credits. We continue to examine the impact this tax reform legislation may have on our business. Notwithstanding the reduction in the corporate income tax rate, the overall impact of the TCJA is uncertain and our business and financial condition could be adversely affected. The impact of this tax reform on holders of our common stock is also uncertain and could be adverse. This 2017 Annual Report does not discuss the manner in which the TCJA might affect purchasers of our common stock. We urge stockholders and potential investors of our common stock to consult with their legal and tax advisors with respect to the TCJA and the potential tax consequences of investing in our common stock.
27
Fluctuations in our tax obligations and effective tax rate may have a negative effect on our results of operations.
Our products are manufactured and formulated, distributed or sold in more than 100 countries and jurisdictions. As a result, we are subject to tax laws and regulations of various federal, state and local governments in the United States, as well as outside of the United States, and to the continual examination of our income tax returns by the Internal Revenue Service and foreign tax authorities in those countries in which we operate. We record tax expense based on our estimates of future payments, which includes reserves for uncertain tax provisions in multiple tax jurisdictions. Significant judgment is required in determining our worldwide provision for income taxes, income taxes payable, and net deferred tax position. There are many transactions where the ultimate tax determination is uncertain. As a result, we expect that throughout the year there could be ongoing variability in our quarterly tax rates as events occur and exposures are evaluated. Future changes in our mix of business activities, or in tax laws or their application with respect to matters such as transfer pricing, intra-group dividends, or a restriction in tax relief allowed on interest (including both the deductibility of interest payments, and certain reductions or exemptions from withholding taxes), could increase our effective tax rate and adversely affect our business, results of operations and financial condition. Further, our effective tax rate in a given financial period may be materially impacted by changes to existing accounting rules and regulations. Tax legislation enacted in the future, in the United States or in foreign countries and jurisdictions, could also negatively impact our current or future tax structure and effective tax rates. For example, the TCJA, recently passed in the United States as described above, or the Anti-Tax Avoidance Directive, which is required to be implemented by all E.U. member states by January 1, 2019, may have possible implications for, and affect the tax treatment of, the Company.
In addition, we are subject to the continual examination of our income tax returns by the Internal Revenue Service and foreign tax authorities in the countries and jurisdiction in which we operate and we may be subject to assessments or audits in the future. Although we believe our tax estimates are reasonable, the final determination of tax audits and any related litigation could be materially different from that which is reflected in our historical financial statements. An audit or litigation can result in significant additional income taxes payable in the jurisdictions in which we operate which could have an adverse impact on our financial condition and results of operations. Certain of our subsidiaries, primarily in our Agricultural Solutions segment, have historically received tax assessments for significant amounts from the tax authorities of the countries in which they operate, especially in Brazil. We are currently contesting tax assessments in several administrative and legal proceedings, and our challenges are at various stages. If determined adversely, these proceedings, or any additional material tax assessments that we may contest in the future, can result in significant income taxes payable in the jurisdictions in which we operate, which may have an adverse impact on our business, financial condition, or results of operations. In addition, in some jurisdictions, challenges to tax assessments require the posting of a bond or security for the contested amount, which may reduce our flexibility in operating our agrochemicals business.
Failure to comply with the FCPA and other similar anti-corruption laws could subject us to penalties and damage our reputation.
The global nature of our business, the significance of our international revenue and our presence in emerging markets create various domestic and local regulatory challenges and subject us to risks associated with our international operations. The FCPA, the Bribery Act, and other anti-corruption laws generally prohibit companies, directors, officers, employees, and their intermediaries from making corrupt payments to foreign officials for the purpose of obtaining or retaining business or securing an improper advantage. Under many of these laws, companies may also be held liable for actions taken by third-parties acting on their behalf, such as strategic or local partners or representatives. Certain anti-corruption laws, including the Bribery Act, also prohibit commercial bribery and the receipt of bribes, while others, such as the FCPA, require companies to maintain accurate books and records and adequate internal controls. Certain of the jurisdictions in which we conduct business are perceived to have a heightened risk for corruption, extortion, bribery, pay-offs, theft and other improper practices. We also count governments among our customers, which increases our risks under the FCPA, the Bribery Act and other laws. Our businesses prohibit bribery and unethical conduct, but these policies may not prevent our employees or agents from violating these laws. Failure by us or our intermediaries to comply with applicable anti-corruption laws, governmental authorities in the United States or elsewhere, as applicable, may result in civil and/or criminal penalties against us, our officers or our employees, prohibition on the conduct of our business, which could all damage our reputation and have a material adverse effect on our business, financial condition and results of operations.
Our products are subject to numerous, complex government regulations dealing with the production and sale of chemicals and compliance with these regulations could require us to incur additional costs or to reformulate or discontinue certain of our products.
We are subject to extensive federal, state, local and foreign customs regulations, imports and international trade laws, export control, antitrust laws, environmental and chemicals manufacturing, global climate change, health and safety requirements and zoning and occupancy laws that regulate manufacturers generally or govern the importation, promotion and sale of our products, the operation of factories and warehouse facilities and our relationship with our customers, suppliers and competitors. Our products and manufacturing processes are also subject to ongoing reviews by certain governmental authorities.
28
Numerous laws regulating the production and marketing of chemical substances apply to us. Dozens of substances manufactured, imported, and used by us are regulated under the European Union REACH (Registration, Evaluation, Authorization, and Restriction of Chemicals) regulation and similar laws in other jurisdictions. We will need to submit a registration for many of these substances between now and June 1, 2018, which will require time and incremental costs. Moreover, if a registration application was, or in the future is, not submitted by any applicable deadline, our ability to sell those products may be negatively impacted until the registration process has been completed. In addition, we manufacture, process and/or use substances being evaluated under the REACH regulation’s Substances of Very High Concern (SVHC) program. Impacts under this program could include requirements to discontinue certain product lines and to reformulate others, which could materially alter our marketplace position or otherwise have a material financial effect on our revenues. We also have several product lines that currently rely on lead-based solder and many others that historically did so. Legal claims have been brought alleging harmful exposures or contamination as a result of lead-based solder, and it is possible that we may face additional claims in the future.
Additionally, those requirements, and enforcement of those requirements, may become more stringent in the future. The ultimate cost of compliance with any such requirements could be material. Changes in environmental and climate laws or regulations, such as China's latest environmental crackdown, could lead to new or additional investment in production designs and could increase environmental compliance expenditures, for us and our suppliers. Changes in climate change concerns, or in the regulation of such concerns, including greenhouse gas emissions, could subject us to additional costs and restrictions, including increased energy and raw materials costs. Additionally, we cannot assure you that we will not be required to expend significant funds to comply with, or discharge liabilities arising in the future under, environmental laws, regulations and permits, or that we will not be exposed to material environmental, health or safety litigation. Some of our formulating and manufacturing facilities have an extended history of chemical formulating and manufacturing operations or other industrial activities, and contaminants have been detected at some of our sites and offsite disposal locations. Ultimate environmental costs are difficult to predict and may vary from current estimates and liabilities. The discovery of additional contaminants, the inability or failure of other liable parties to satisfy their obligations, the imposition of additional cleanup obligations, or the commencement of related third-party claims could result in significant additional costs.
Our Agricultural Solutions products are subject to periodic technical review and approval by government authorities in each country where we wish to sell our products. The regulatory requirements are complex and vary from country to country. They are also subject to frequent changes as new data requirements arise in response to scientific developments, which require the provision of new data and the conduct of more complex risk assessments. The outcome of technical reviews of existing registrations cannot be guaranteed; registrations may be modified or canceled. In addition, each country also has its own legislative process and specific requirements in order to determine if identified risks are acceptable and can be managed in the local context. Although the approval process, referred to as “registration,” varies from country to country, all processes generally mandate periodic product reviews, referred to as “re-registration,” which can often result in the requirement to generate new data and could result in either restrictions being placed on the permissible uses of the product going forward or in a refusal by the relevant government authority to grant a re-registration for the product altogether. Notably, scientific developments often result in new data requirements under these regulatory directives, laws and/or regulations, thereby impacting both the scope and timing of the process as well as the likelihood of a registration or re-registration being granted by the relevant government authority. Globally, a large number of AIs in our agrochemical products are currently or will soon be subject to such re-registration processes which may result in products having their approval for sale withdrawn in some countries. Registrations or re-registrations may not be granted to us on a timely basis, or at all. Any delay in obtaining, or any failure to obtain or maintain those registrations, would adversely affect our ability to generate revenue from those products. In addition, since all government regulatory authorities have the right to review existing registrations at any time, the sustainability of the existing portfolio cannot be guaranteed. Existing registrations may be lost at any time, resulting in an immediate impact on sales.
Compliance with government regulations regarding the use of “conflict minerals” may result in increased costs and risks.
As part of the Dodd-Frank Wall Street Reform and Consumer Protection Act of 2010, the SEC has promulgated disclosure requirements regarding the use of certain minerals, known as "conflict minerals," which are mined from the Democratic Republic of Congo and adjoining countries. In addition, the E.U. adopted a E.U.-wide conflict minerals rule under which most E.U. importers of tin, tungsten, tantalum, gold and their ores will have to conduct due diligence to ensure the minerals do not originate from conflict zones and do not fund armed conflicts. Compliance with the regulation is required by January 1, 2021. Our material sourcing is broad-based and multi-tiered, and due to the complexity of our supply chain we may not be able to easily verify the origins of conflict minerals used in the products we sell. The implementation of these requirements could affect the sourcing and availability of minerals used in the manufacture of our products. As a result, there may only be a limited pool of suppliers who provide conflict-free metals, and no assurance can be provided that we will be able to obtain products in sufficient quantities or at competitive prices. Future regulations may become more stringent or costly and our compliance costs and potential liabilities could increase, which may harm our business. In addition, any non-compliance with the applicable standards or regulations may result in reputational challenges, which could also affect our business, financial condition, or results of operations.
29
We may be unable to ensure compliance with international trade restrictions and economic sanctions laws and regulations, which could adversely affect our business, financial condition or results of operations.
We have operations, assets and/or make sales in countries all over the world, including countries that are or may become the target of the United States and other countries’ trade restrictions, including economic sanctions, which we refer to collectively as “Economic Sanctions Laws.” Economic Sanctions Laws are complex and change with time as international relationships and confrontations between and among nations evolve. For example, the U.S. Department of the Treasury’s Office of Foreign Assets Control (OFAC) and the U.S. State Department administer certain laws and regulations that impose penalties upon U.S. persons and entities and, in some instances, non-U.S. entities, for conducting activities or transacting business with certain countries, governments, entities, or individuals subject to U.S. Economic Sanctions Laws. We do not conduct business in any of the countries subject to such sanctions, such as Cuba, Iran, Syria or North Korea but given the breadth of our international operations and the scope of our sales globally, including via third-party distributors over whom we may have limited or no control, coupled with the complexity and ever-changing nature of Economic Sanctions Laws, there can be no assurance that we have been in the past or will at all times in the future be in full compliance. If we fail to comply with Economic Sanctions Laws, investigations and/or actions could be taken against us that could materially and adversely affect our reputation or have a material and adverse effect on our business, financial condition, or results of operations.
Risks Relating to Ownership of our Common Stock and Senior Notes
We have numerous equity instruments outstanding that could require us to issue additional shares of common stock. The future issuance of additional shares could result in significant dilution of ownership interests and have an adverse effect on our stock price.
We have a number of equity instruments outstanding that could require us to issue additional shares of our common stock. Depending on the equity instrument, these additional shares may either be issued for no additional consideration or based on a fixed amount of additional consideration. Specifically, at December 31, 2017, we had outstanding the following:
• | 2,000,000 shares of Series A Preferred Stock which are convertible into shares of our common stock, on a one-for-one basis, at any time at the option of the holder; |
• | 4,812,742 exchange rights which require us to issue shares of our common stock in exchange for shares of common stock of our subsidiary, PDH, on a one-for-one basis, at any time at the option of the holder; |
• | approximately 732,197 options which are exercisable to purchase shares of our common stock, on a one-for-one basis, at any time at the option of the holder, of which 557,197 shares were issued under the 2013 Plan; and |
• | approximately 2,943,529 RSUs which were granted to employees under our 2013 Plan. Each RSU represents a contingent right to receive one (1) share of our common stock. |
We have approximately 11,503,071 shares of our common stock currently available under the 2013 Plan, net of the outstanding RSUs and options noted above (subject to increase in accordance with the terms of such plan), and 496,203 shares issued under the 2013 Plan, and an additional 4,848,689 shares of our common stock currently available under the ESPP.
In addition, the holders of our Series A Preferred Stock are entitled to receive an annual dividend on their Series A Preferred Stock in the form of shares of our common stock. For 2017, no stock dividend was declared with respect to the Series A Preferred Stock. Since December 31, 2014, the dividend amount is calculated based on the appreciated stock price compared to the highest dividend price (calculated based upon the average of the last ten trading days of the year’s volume weighted average share prices) previously used in calculating the Series A Preferred Stock dividends, which currently is $22.85. The issuance of common stock as stock dividends in the future could have a dilutive impact on, and reduce the value of, our outstanding common stock.
We may issue preferred stock in the future, and the terms of the preferred stock may reduce the value of our common stock.
Our Board is authorized to create and issue one or more additional series of preferred stock, and, with respect to each series, to determine the number of shares constituting the series and the designations and the powers, preferences and rights, and the qualifications, limitations and restrictions thereof, which may include dividend rights, conversion or exchange rights, voting rights, redemption rights and terms and liquidation preferences, without stockholder approval. If we create and issue one or more additional series of preferred stock, it could affect your rights or reduce the value of our outstanding common stock. Our Board could, without stockholder approval, issue preferred stock with voting and other rights that could adversely affect the voting power of the holders of our common stock and which could have certain anti-takeover effects.
30
There can be no assurance that we will declare dividends or have the available cash to make dividend payments.
To the extent we intend to pay dividends on our common stock, we will pay such dividends at such times (if any) and in such amounts (if any) as our Board determines appropriate and in accordance with applicable law. In addition, we are subject to certain restrictions in our financing arrangements which may prohibit or limit our ability to pay dividends. There is therefore no assurance that we will be able to pay dividends going forward or as to the amount of such dividends, if any.
We operate as a holding company and our principal source of operating cash is income received from our subsidiaries.
We are a holding company and do not have any material assets or operations other than ownership of equity interests of our subsidiaries. Our operations are conducted almost entirely through our subsidiaries, and our ability to generate cash to meet our obligations or to pay dividends is highly dependent on the earnings of, and receipt of funds from, our subsidiaries through dividends or intercompany loans. As a result, we are dependent on the income generated by our subsidiaries to meet our expenses and operating cash requirements. The amount of distributions and dividends, if any, which may be paid to us from each of our subsidiaries will depend on many factors, including the results of operations and financial condition, limits on dividends under applicable law, such subsidiary's constitutional documents, documents governing any indebtedness of such subsidiary, and other factors which may be outside our control. If our subsidiaries are unable to generate sufficient cash flow, we may be unable to pay our expenses or make distributions and dividends on our shares of common stock.
We are governed by Delaware law, which has anti-takeover implications.
We are governed by Delaware law, the application of which may have the effect of deterring hostile takeover attempts or a change in control. In particular, Section 203 of the Delaware General Corporation Law imposes certain restrictions on merger, business combinations and other transactions between us and holders of 15% or more of our common stock. A Delaware corporation may opt out of that provision either with an express provision in its original certificate of incorporation or in an amendment to its certificate of incorporation or by-laws approved by its stockholders. We have not opted out of this provision. Section 203 could prohibit or delay mergers or other takeover or change in control attempts and, accordingly, may discourage attempts to acquire us, which may negatively affect our stock price.
Volatility of our stock price could adversely affect our stockholders.
The market price of our common stock could fluctuate significantly as a result of:
• | quarterly variations in our operating results; |
• | changes in the market’s expectations about our operating results; |
• | our operating results failing to meet the expectation of management, securities analysts or investors in a particular period; |
• | the failure to remediate identified material weaknesses; |
• | changes in financial estimates and recommendations by securities analysts concerning our Company or our industry in general; |
• | operating and securities price performance of companies that investors deem comparable to us; |
• | news reports and publication of research reports relating to our business or trends in our markets; |
• | changes in laws and regulations affecting our businesses; |
• | announcements of strategic developments, including the Proposed Separation, or potential future acquisitions or other material events by us or our competitors; |
• | sales of substantial amounts of common stock by our directors, executive officers or significant stockholders or the perception that such sales could occur; |
• | adverse market reaction to any additional debt we incur in the future; |
• | the failure to identify and complete acquisitions in the future or unexpected difficulties or developments related to the integration of recently completed, pending or future acquisitions; |
• | actions by institutional stockholders; |
• | general economic and political conditions such as recessions and acts of war or terrorism; and |
• | the risk factors set forth in this 2017 Annual Report and other matters discussed herein. |
Fluctuations in the price of our common stock could contribute to the loss of all or part of a stockholder’s investment in our Company. Many of the factors listed above are beyond our control. These factors may cause the market price of our common
31
stock to decline, regardless of the financial condition, results of operations, business or prospects of us and our subsidiaries. There can be no assurance that the market price of our common stock will not fall in the future.
Future sales, or the perception of future sales, of our common stock may depress the price of our common stock.
If we or any of our stockholders sell a large number of shares of our common stock, or if we issue a large number of shares of common stock in connection with future acquisitions, financings or other circumstances, the market price of our common stock could decline significantly. Moreover, the perception in the public market that we or our stockholders might sell shares of common stock could depress the market price of those shares.
We cannot predict the size of future issuances of our shares of common stock or the effect, if any, that future issuances or sales of our shares will have on the market price of such shares. Sales of substantial amounts of our shares, including sales by significant stockholders, and shares issued in connection with any pending or future acquisition, or the perception that such sales could occur, may adversely affect prevailing market prices for our shares of common stock. Possible sales also may make it more difficult for us to sell equity or equity-related securities in the future at a time and price we deem necessary or appropriate.
We have redeemed in the past, and may continue to redeem or repurchase, outstanding series of debt securities, which could impact the market for our Senior Notes and/or negatively affect our liquidity.
We may from time to time, in connection with the Proposed Separation or otherwise, seek to repurchase, redeem or refinance our outstanding Senior Notes in open market purchases, accelerated repurchase programs, privately negotiated transactions, tender offers, partial or full calls for redemption or otherwise. Any such repurchases or redemptions and the timing and amount thereof would depend on prevailing market conditions, liquidity requirements, contractual restrictions and other factors. Depending on such timing and amount, our liquidity could be negatively affected.
Item 1B. Unresolved Staff Comments
None.
Item 2. Properties
Our corporate offices are located in a leased facility in West Palm Beach, Florida. At December 31, 2017, our physical presence included 54 manufacturing sites, 11 of which include research facilities, and 16 stand-alone research centers. Of our manufacturing facilities, 7 are located in the United States with the remaining international facilities located primarily in Asia and Europe. We own 34 of our manufacturing facilities, 8 of our manufacturing facilities that include research facilities and 7 of our stand-alone research centers. In addition to the remaining manufacturing and research facilities, we lease the majority of our office, warehouse and other physical locations. Among our two business segments, Performance Solutions and Agricultural Solutions utilize 41 and 13 of our manufacturing facilities, respectively.
We believe that all of our facilities and equipment are in good condition, well-maintained, adequate for our present operations, and utilized for their intended purposes. See Note 7, Property, Plant and Equipment, to the Consolidated Financial Statements included in this 2017 Annual Report for amounts invested in land, buildings, machinery, and equipment, and Note 17, Operating Lease Commitments, to the Consolidated Financial Statements included in this 2017 Annual Report, for information about our operating lease commitments.
Item 3. Legal Proceedings
In the ordinary course of business, we are involved in various legal disputes, investigations and claims and other legal proceedings, including, but not limited to, product liability claims, contractual disputes, premises claims, and employment, environmental, and health and safety matters. Where appropriate, we may establish liabilities for such proceedings. We also maintain insurance to mitigate certain of such risks. Although we cannot predict with certainty the ultimate resolution of lawsuits, investigations and claims asserted against us, we believe that the resolution of these claims, net of established liabilities, will not, individually or in the aggregate, have a material adverse effect on our business, financial condition or results of operations. Due to their inherent uncertainty, however, there can be no assurance as to the ultimate outcome of current or future litigation, proceedings, investigations or claims and it is possible that a resolution of one or more such proceedings could result in fines and penalties that could adversely affect our business, financial condition or results of operations.
32
In addition, we are involved in various claims relating to environmental matters at a number of current and former plant sites and waste management sites. We engage or participate in remedial and other environmental compliance activities at certain of these sites. At other sites, we have been named as a “potential responsible party” (PRP) pursuant to the federal Superfund Act and/or state Superfund laws comparable to the federal law for site remediation. Based on currently available information, we do not anticipate any material losses in excess of the liabilities recorded. However, it is possible that, as additional information becomes available, the impact of an adverse determination could have a different effect. For additional information regarding environmental matters and liabilities, see Note 18, Contingencies, Environmental and Legal Matters, to the Consolidated Financial Statements included in this 2017 Annual Report.
From time to time, in the ordinary course of business, we contest tax assessments received by our subsidiaries in various jurisdictions. For a discussion of certain tax matters relating to Arysta in Brazil, see Note 18, Contingencies, Environmental and Legal Matters, to the Consolidated Financial Statements included in this 2017 Annual Report.
Item 4. Mine Safety Disclosure
Not applicable.
33
Part II
Item 5. Market for Registrant’s Common Equity, Related Stockholder Matters and Issuer Purchases of Equity Securities
Market for our Common Stock
Our common stock is traded on the NYSE under the symbol “PAH.” On February 23, 2018, there were approximately 334 registered holders of record of our common stock, par value $0.01 per share. On February 23, 2018, the closing price of our common stock was $10.50.
The following table sets forth the closing high and low sales prices of our common stock as reported on the NYSE for the periods indicated:
2017 | 2016 | |||||||||||||||
Period | High | Low | High | Low | ||||||||||||
First Quarter | $ | 13.47 | $ | 9.83 | $ | 12.22 | $ | 5.55 | ||||||||
Second Quarter | 14.32 | 12.11 | 10.77 | 7.99 | ||||||||||||
Third Quarter | 14.58 | 10.92 | 9.73 | 8.06 | ||||||||||||
Fourth Quarter | 11.70 | 9.45 | 10.40 | 7.17 | ||||||||||||
Dividends
We have never declared or paid any cash dividends on our common stock and do not intend to pay cash dividends on our common stock in the foreseeable future. We anticipate that we will retain all of our future earnings, if any, for use in the development and expansion of our business, including future acquisitions, and for general corporate purposes, including for the repayment of debt. Our Amended and Restated Credit Agreement and the indentures governing our Senior Notes also contain restrictions which may prohibit or limit our ability to pay dividends. As a holding company, our ability to pay dividends is highly dependent on receipts of funds from our subsidiaries. See Part I, Item 1A.—Risk Factors— "We operate as a holding company and our principal source of operating cash is income received from our subsidiaries."
The holders of our Series A Preferred Stock are entitled to receive an annual dividend on their Series A Preferred Stock in the form of shares of our common stock. For 2017, 2016 and 2015, no stock dividend was declared with respect to the Series A Preferred Stock. Since December 31, 2014, the dividend amount is calculated based on the appreciated stock price compared to the highest dividend price (calculated based upon the average of the last ten trading days of the year’s volume weighted average share prices) previously used in calculating the Series A Preferred Stock dividends. In 2014, the dividend price, which was the only dividend price used to date, was $22.85.
In addition to the restrictions described above, we may become subject to additional covenants should we incur any additional indebtedness, which may prohibit or further limit our ability to pay dividends.
Performance Graph
The following performance graph and related information shall not be deemed "soliciting material" or to be "filed" with the SEC, nor shall such information be incorporated by reference into any future filing under the Securities Act or Exchange Act, except to the extent that the Company specifically incorporates it by reference into such filing.
This graph compares cumulative total stockholder return on our common stock from January 23, 2014 (our first day of trading on the NYSE) through December 31, 2017 with the cumulative total return of (i) the Standard and Poor's 500 Index, and (ii) the S&P 500 Specialty Chemicals Index, assuming a $100 investment made on January 23, 2014. The stock performance shown on this graph is based on historical data and is not indicative of, or intended to forecast, possible future performance of our common stock.
34
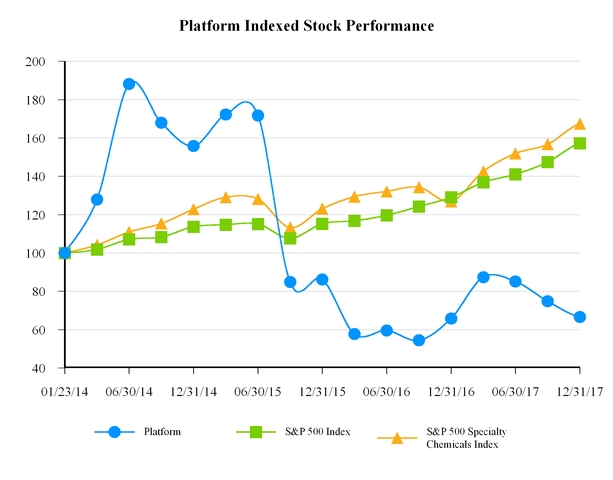
Equity Compensation Plan Information
Information regarding our equity compensation plans, including both stockholder approved plans and plans not approved by stockholders, is incorporated by reference from Part III, Item 12 of this 2017 Annual Report.
Recent Sales of Unregistered Securities
None.
Recent Purchases of our Registered Equity Securities by the Issuer and Affiliated Purchases
None.
35
Item 6. Selected Financial Data
Platform’s Selected Consolidated Financial Information
The following table presents selected consolidated historical financial data for us and our Predecessor as of the dates and for each of the periods indicated. The selected consolidated historical data at and for the years ended December 31, 2017, 2016, 2015 and 2014, and the Successor 2013 Period have been derived from our audited consolidated financial statements. The selected consolidated historical data at and for the Predecessor 2013 Period has been prepared in accordance with GAAP, is unaudited and was derived from the Predecessor's historical financial statements, which were not audited by PricewaterhouseCoopers LLP. The selected consolidated historical financial data presented below contain all normal recurring adjustments that, in the opinion of management, are necessary to present fairly our financial position and results of operations at and for the periods presented. The selected historical consolidated financial data included below and elsewhere in this 2017 Annual Report are not necessarily indicative of future results and should be read in conjunction with the section entitled “Financial Statements and Supplementary Data” included in Part II, Item 8 of this 2017 Annual Report, and the section entitled “Management’s Discussion and Analysis of Financial Condition and Results of Operations” included in Part II, Item 7 of this 2017 Annual Report.
($ amounts in millions, except per share data) | Year Ended December 31, 2017 (1) | Year Ended December 31, 2016 (2) | Year Ended December 31, 2015 (3) | Year Ended December 31, 2014 (4) | Period from Inception (April 23, 2013) through December 31, 2013 (5) | Period from January 1, 2013 through October 31, 2013 (6) | |||||||||||||||||||
(Successor) | (Successor) | (Successor) | (Successor) | (Successor) | (Predecessor) | ||||||||||||||||||||
Statement of Operations Data | |||||||||||||||||||||||||
Net sales | $ | 3,775.9 | $ | 3,585.9 | $ | 2,542.3 | $ | 843.2 | $ | 118.2 | $ | 627.7 | |||||||||||||
Gross profit | 1,589.0 | 1,507.7 | 991.9 | 396.6 | 35.7 | 322.8 | |||||||||||||||||||
Operating profit (loss) | 221.3 | 253.4 | 71.6 | 9.5 | (195.6 | ) | 91.7 | ||||||||||||||||||
(Loss) income before income taxes, non-controlling interests and dividends on preferred shares | (289.0 | ) | (48.1 | ) | (229.3 | ) | (30.9 | ) | (201.4 | ) | 26.5 | ||||||||||||||
Income tax (expense) benefit | (6.6 | ) | (28.6 | ) | (75.1 | ) | 6.7 | 5.8 | (13.0 | ) | |||||||||||||||
Net (loss) income | (295.6 | ) | (76.7 | ) | (304.4 | ) | (24.2 | ) | (195.6 | ) | 13.5 | ||||||||||||||
Basic loss per share | (1.04 | ) | (0.17 | ) | (1.52 | ) | (1.94 | ) | (2.10 | ) | n/a | ||||||||||||||
Diluted loss per share | (1.04 | ) | (0.65 | ) | (1.52 | ) | (1.94 | ) | (2.10 | ) | n/a | ||||||||||||||
Adjusted EBITDA (7) | 820.9 | 769.5 | 567.7 | 212.2 | 27.4 | n/a | |||||||||||||||||||
December 31, 2017 (1) | December 31, 2016 (2) | December 31, 2015 (3) | December 31, 2014 (4) | December 31, 2013 (5) | October 31, 2013 (6) | ||||||||||||||||||||
(Successor) | (Successor) | (Successor) | (Successor) | (Successor) | (Predecessor) | ||||||||||||||||||||
Balance Sheet Data | |||||||||||||||||||||||||
Cash and cash equivalents | $ | 477.8 | $ | 422.6 | $ | 432.2 | $ | 397.3 | $ | 123.0 | $ | 87.1 | |||||||||||||
Working capital (8) | 1,248.8 | 988.5 | 1,175.2 | 1,355.8 | 263.8 | 170.1 | |||||||||||||||||||
Total assets | 10,252.4 | 10,054.1 | 10,190.2 | 4,547.3 | 2,258.5 | 1,172.0 | |||||||||||||||||||
Total debt | 5,479.5 | 5,239.0 | 5,228.3 | 1,405.6 | 750.6 | 1,107.4 | |||||||||||||||||||
Total equity (deficit) | 2,860.0 | 2,889.8 | 2,273.3 | 2,552.6 | 1,115.1 | (200.0 | ) | ||||||||||||||||||
Comparability of the financial data within the table above is affected by the following acquisitions: OMG Malaysia in January 2016, Alent in December 2015, OMG Businesses in October 2015, Arysta in February 2015, CAS in November 2014, Agriphar in October 2014, and MacDermid in October 2013. See Note 4, Acquisitions of Businesses, to the Consolidated Financial Statements included in this 2017 Annual Report.
36
(1) | The results presented include the following significant items affecting comparability for the year ended December 31, 2017: |
• | Goodwill impairment charge of $160 million related to our Agro Business reporting unit in our Agricultural Solutions segment; |
• | Foreign exchange loss on foreign denominated external and internal long-term debt of $103 million; |
• | Debt refinancing charges of $83.2 million; |
• | Restructuring costs of $30.8 million, primarily related to severance; |
• | Costs related to our Proposed Separation of $12.1 million; |
• | Pension plan settlement and curtailment costs of $10.5 million; |
• | Net interest expense of $342 million, primarily related to interest charges resulting from incremental debt facilities, including term loans, bonds and revolving credit borrowings, impacted by the repricing of our term debt; and |
• | Effective tax rate changed from (59.5)% for 2016 to (2.3)% for 2017 primarily due to the increased level of goodwill impairment in 2017 as compared to 2016 for which there was no corresponding tax benefit, the benefit for the provisional estimate of the TCJA, the 2016 settlement gain of the Series B Convertible Preferred Stock which was treated as a non-taxable purchase price adjustment, and favorable reductions in foreign tax rates for changes in tax law. |
(2) | In addition to the impact of the 2016 and 2015 acquisitions and related valuation of intangible assets, the results presented include the following significant items affecting comparability for the year ended December 31, 2016: |
• | Goodwill impairment charge of $46.6 million related to Performance Solutions' Offshore Solutions reporting unit; |
• | Amortization of inventory step-up of $11.7 million charged to cost of sales; |
• | Acquisition and integration related costs of $33.4 million, primarily comprised of professional fees; |
• | Restructuring costs of $31.1 million, primarily related to severance; |
• | Net interest expense of $376 million, primarily related to interest charges resulting from incremental debt facilities, including term loans, bonds and revolving credit borrowings, used to fund the acquisitions; |
• | Gains relating to the amendment of the Series B Convertible Preferred Stock and the related execution of a settlement agreement totaling $32.9 million and $103 million, respectively; |
• | Foreign exchange loss on foreign denominated external and internal long-term debt of $33.9 million; |
• | Debt refinancing charges of $19.7 million; and |
• | Income tax expense which included a $34.3 million benefit related to the settlement of Series B Convertible Preferred Stock, a $24.5 million benefit related to the impact of transaction costs, and a $24.1 million benefit related to a net change in tax reserves, partially offset by $68.4 million of expense related to a change in valuation allowances and $26.8 million of expense related to an increase in the provision for tax on undistributed foreign earnings. |
(3) | In addition to the impact of the 2015 and 2014 acquisitions and related valuation of intangible assets, the results presented include the following significant items affecting comparability for the year ended December 31, 2015: |
• | Amortization of inventory step-up of $76.5 million charged to cost of sales; |
• | Acquisition and integration related costs of $122 million, primarily comprised of professional fees; |
• | Restructuring costs of $25.3 million, primarily related to severance, professional and consulting fees; |
• | Net interest expense of $214 million, primarily related to interest charges resulting from incremental debt facilities, including term loans, bonds and revolving credit borrowings, used to fund the acquisitions; |
• | Fair value loss on foreign exchange forward contract related to the Alent Acquisition of $73.7 million charged to other expense; |
• | Foreign exchange loss on foreign denominated external and internal long-term debt of $46.4 million; and |
• | Income tax expense which included $72.6 million of expense related to a change in valuation allowances, $40.5 million of expense related to non-deductible transaction costs, and $27.5 million of expense related to a net change in tax reserves. |
(4) | In addition to the impact of the 2014 and 2013 acquisitions and related valuation of intangible assets, the results presented include the following significant items affecting comparability for the year ended December 31, 2014: |
• | Amortization of inventory step-up of $35.5 million charged to cost of sales; |
• | Acquisition and integration related costs of $47.8 million, primarily comprised of professional fees; |
37
• | Net interest expense of $37.9 million' primarily related to interest charges resulting from incremental debt facilities, including term loans, bonds and revolving credit borrowings, used to fund acquisitions; and |
• | Non-cash mark-to-market charge related to the contingent consideration in connection with the MacDermid acquisition of $29.1 million. |
(5) | The results presented include the following significant items affecting comparability in the Successor 2013 Period: |
• | Non-cash charge related to the preferred share dividend rights of the Founders Entities of $172 million; |
• | Amortization of inventory step-up of $23.9 million charged to cost of sales; and |
• | Transaction related costs, primarily comprised of professional fees, of $15.2 million. |
(6) | The results presented include the following significant items affecting comparability in the Predecessor 2013 Period: |
• | Transaction related costs, primarily for professional fees, and fees paid to Predecessor stockholders resulting from management fees payable in conjunction with consummation of the MacDermid Acquisition of $16.9 million; and |
• | Deemed compensation expense related to pre-acquisition share awards of approximately $9.3 million. |
(7) | Adjusted EBITDA is a non-GAAP financial measure and as such, should not be considered in isolation from, as a substitute for, or superior to performance measures calculated in accordance with GAAP. For a definition of Adjusted EBITDA and additional information on why we present this measure, its limitations and a reconciliation to the most comparable applicable GAAP measure, see "Non-GAAP Financial Measures" in the Management's Discussion and Analysis of Financial Condition and Results of Operations section included in Part II, Item 7, and Note 23, Segment Information, to the Consolidated Financial Statements, all included in this 2017 Annual Report. |
(8) | Working capital is defined as current assets less current liabilities. |
38
Item 7. Management’s Discussion and Analysis of Financial Condition and Results of Operations
This Management's Discussion and Analysis of Financial Condition and Results of Operations section should be read in conjunction with “Financial Statements and Supplementary Data” included in Part II, Item 8 of this 2017 Annual Report, “Selected Financial Data” included in Part II, Item 6 of this 2017 Annual Report, and our audited Consolidated Financial Statements and notes thereto included elsewhere in this 2017 Annual Report. The following “Overview” section below is a brief presentation of our business and certain significant items addressed in this section or elsewhere in this 2017 Annual Report. You should read this section and the relevant portions of this 2017 Annual Report for a complete discussion of the events and items summarized below.
Overview of our Business
Platform, incorporated in Delaware in January 2014, is a global and diversified producer of high technology specialty chemical products. Our business involves the blending of a number of key ingredients to produce proprietary formulations. Utilizing our strong industry insight, process know-how, and creative research and development, we also partner with our customers to provide innovative and differentiated solutions that are integral to their finished products. We operate in a wide variety of attractive niche markets across multiple industries, including automotive, agriculture, animal health, electronics, graphics, and offshore oil and gas production and drilling, and we believe that the majority of our operations hold strong positions in the product markets they serve. Our product innovations and product extensions are expected to continue to drive sales growth in both new and existing markets, while also expanding margins by continuing to offer high customer value propositions.
We have strong market positions in niche segments of high-growth markets and continually seek opportunities to act as an acquirer and consolidator of specialty chemical businesses, particularly those meeting our “Asset-Lite, High-Touch” philosophy, which involves prioritizing resources to research and development and offering highly technical sales and customer service, while managing conservatively our investments in fixed assets and capital expenditures. We regularly review acquisition opportunities and may acquire businesses that meet our acquisition criteria when we deem it to be financially prudent.
We generate revenue through the formulation and sale of our dynamic chemistries and by providing highly technical service to our customers through our extensive global network of specially-trained service personnel. Our personnel follow up closely with our customers to ensure that the functional performance of our intricate chemical composition is maintained as intended and that these products are applied safely and effectively. Our specialty chemicals and processes, together with our field technical and sales staff, are seen as integral to our customer’s product performance. We leverage these close customer relationships to execute our growth strategy and identify opportunities for new products. These new products are developed and created by drawing upon our intellectual property portfolio and technical expertise. We believe that our customers place significant value on our brands, which we capitalize on through innovation, product leadership and customer service.
We manage our business in two reportable segments: Performance Solutions and Agricultural Solutions.
Performance Solutions – Our Performance Solutions segment formulates and markets dynamic chemistry solutions that are used in automotive production, electronics, commercial packaging and printing, and offshore oil and gas production and drilling. Our products include surface and coating materials, water-based hydraulic control fluids and photopolymers. In conjunction with the sale of these products, we provide extensive technical service and support when necessary to ensure superior performance of their application. While our dynamic chemistries typically represent only a small portion of our customers’ costs, we believe that they are critical to our customers’ manufacturing processes and overall product performance. Further, operational risks and switching costs make it difficult for our customers to change suppliers and allow us to retain customers and maintain our market positions. The segment employs approximately 4,350 people which operate mainly in the Americas, Asia/Pacific region and Europe.
Agricultural Solutions – Our Agricultural Solutions segment specializes in the development, formulation, registration, marketing and distribution of differentiated Crop Protection solutions, including BioSolutions and Seed Treatment, for a variety of crops and applications. Our diverse Crop Protection chemicals control biotic stresses, such as weeds (herbicides), insects (insecticides) and diseases (fungicides). Our portfolio of proven BioSolutions includes BioStimulants, which are derived from natural substances applied to plants, seeds or the soil in order to enhance yields and help crops withstand abiotic stress, such as drought or cold, and BioControl products, which perform the same task as conventional Crop Protection products with, in many cases, the added benefit of reduced chemical residues. Our solutions are offered in multiple forms, such as foliar applications (direct application to leaves), furrow treatment (treatment of soil trenches or grooves wherein seeds are sown) or Seed Treatment (seed coating prior to planting). Our products allow us to partner with growers to address the ever-increasing need for higher crop yield and food quality. The segment employs approximately 3,300 people, with a significant presence in high-growth regions such as Africa & Middle East, Asia, Latin America and Central and Eastern Europe.
39
Our operating segments include significant foreign operations. There are certain risks associated with our foreign operations. See Part I, Item 1A. Risk Factors— "Our substantial international operations subject us to risks not faced by domestic competitors." and "We are exposed to fluctuations in currency exchange rates, which may adversely affect our operating results and may significantly affect the comparability of our results between financial periods."
Proposed Separation of Agricultural Solutions
The Proposed Separation of our Agricultural Solutions and Performance Solutions businesses. We believe this Proposed Separation, which we expect to complete in 2018, should maximize long-term value for our stockholders by enabling investors to focus on our specific different and differentiated high-quality businesses that serve two distinct segments of the specialty chemicals industry. However, this Proposed Separation, and any related transactions that we may decide to pursue in anticipation of the Proposed Separation, remain subject to final approval by the Board, as well as a number of conditions and variables, including financial market conditions and volatility, legal, tax or regulatory requirements, the establishment of the necessary corporate infrastructure and processes, and/or the possibility of more attractive strategic options arising in the future.
Acquisitions
Consistent with our acquisition strategy, we intend to focus primarily on businesses or assets within our existing end-markets with product offerings that provide geographic or product complementarity. We expect to achieve commercial and distribution efficiencies by expanding into related categories that can be marketed through our existing distribution channels or provide us with new distribution channels for our existing products. Furthermore, to the extent we pursue future acquisitions, we expect that acquisition candidates would demonstrate a combination of attractive margins, strong cash flow characteristics, niche leading positions and products that generate recurring revenue. We believe the diversity of the niche-end markets we serve will enable us to continue our growth and maintain strong cash flow generation throughout economic cycles and mitigate the impact of a downturn in any single market. We will only pursue a candidate when it is deemed to be fiscally prudent and that meets our acquisition criteria. We anticipate that any future acquisitions would be financed through a combination of cash on hand, operating cash flow, availability under our Amended and Restated Credit Agreement and/or new debt or equity offerings.
For further information on our historical Acquisitions, see "Acquisitions" in Item 1. Business included in Part I, Item I of this 2017 Annual Report, and Note 4, Acquisitions of Businesses, to the Consolidated Financial Statements included in this 2017 Annual Report.
Summary of Significant 2017 Activities
• | In April 2017, we completed the repricing of $1.93 billion of existing term loans through Amendment No. 7 to the Second Amended and Restated Credit Agreement which, among other things, provided for the prepayment in full of previously existing term loans denominated in U.S. dollars and in euros with the aggregate proceeds of newly created term loans denominated in U.S. dollars in an aggregate principal amount of $1.23 billion and term loans denominated in euros in an aggregate principal amount of €650 million. The amendment effectively reduced interest rates by 100 basis points across both the U.S. dollar and euro tranches. In addition, the EURIBOR floor was reduced from 1.00% to 0.75% on the new euro denominated term loans. At the close of this refinancing, the reduced interest rates were expected to generate annual cash savings of approximately $20.0 million, based on foreign exchange rates then in effect. |
• | In June 2017, MacDermid Printing and E.I. du Pont de Nemours and Company, now known as DowDuPont Inc. ("DuPont"), settled all outstanding litigation between them, as well as MacDermid Printing's lawsuit against Cortron. In connection with this settlement, DuPont made a payment of $20.0 million to MacDermid Printing, and we recorded a net settlement gain of $10.8 million. |
• | In October 2017, we completed the repricing of $1.40 billion of existing term loans through Amendment No. 8 to the Second Amended and Restated Credit Agreement which, among other things, provided for the prepayment in full of previously existing term loans denominated in U.S. dollars and in euros with the aggregate proceeds of newly created term loans denominated in U.S. dollars in an aggregate principal amount of $680 million and term loans denominated in euros in an aggregate principal amount of €630 million. This amendment effectively reduced interest rates by 100 basis points across both the U.S. dollar and euro tranches from a combination of reduced spread and reduced EURIBOR floor from 1.00% to 0.75% on the new euro denominated term loans. At the close of this refinancing, the reduced interest rates were expected to generate annual cash savings of approximately $14.0 million, based on foreign exchange rates then in effect. |
40
• | In November 2017, we completed a private offering of $550 million aggregate principal amount of 5.875% USD Notes due 2025. The proceeds from this offering were used to pay the consideration of the below-mentioned cash tender offer and consent solicitation for, as well as redemption of, any and all of our then outstanding 10.375% USD Notes due 2021, plus accrued and unpaid interest on the 10.375% USD Notes due 2021, along with fees and expenses. |
• | In December 2017, we completed a tack-on private offering of $250 million aggregate principal amount of additional 5.875% USD Notes due 2025. The additional notes have the same terms as, and are fungible and form a single series with, the 5.875% USD Notes due 2025 issued in November 2017. The proceeds from this offering were used to repay a portion of our existing terms loans under our Amended and Restated Credit Agreement. The 5.875% USD Notes Indenture provides that in connection with the satisfaction of certain financial covenants and other conditions, all of the then direct and indirect subsidiaries constituting our Agricultural Solutions business may be designated as unrestricted subsidiaries and, as applicable, released from their guarantees of the 5.875% USD Notes due 2025. |
• | In December 2017, we completed the cash tender offer and consent solicitation for, as well as the redemption of, any and all of our then outstanding 10.375% USD Notes due 2021. The tender offer and consent solicitation, as well as the redemption, were financed with the proceeds of the November offering of 5.875% USD Notes due 2025 described above. |
Global Economic and Industry Conditions
Our products are sold in industries that we believe are sensitive to changes in general economic conditions. Accordingly, net sales, gross profit, and financial condition depend significantly on general economic conditions and the impact of these conditions on demand for our dynamic chemistries and services in the markets in which we compete. In particular, weak economic conditions in parts of Asia and South America may have an adverse effect on our results. Our business is also particularly impacted by demand for chemistry products utilized in the automotive, printed circuit board, offshore oil and gas production, commercial packaging, and crop protection industries. Our business may further be influenced by trends in the broader specialty chemical industry. We believe that these industries are cyclical and subject to constant and rapid technological change, product obsolescence, price erosion, evolving standards, finite product life-cycles, raw material price fluctuations and changes in product supply and demand.
Performance Solutions - Our Performance Solutions segment continues to be affected by globalization and a shift in customers’ businesses out of traditional geographic markets and into high-growth, emerging markets. The increased use of electronics, particularly in automotive and industrial applications, is expected to drive the need for new product development and demand for faster electronic processing. Continued growth in the consumption of consumer packaged goods is expected to drive increased demand for liquid plate and other packaging technologies. While demand in offshore oil production has been impacted by global economic activity and geopolitical tensions, we believe our business is well positioned to recover as conditions improve.
Net sales in future periods will depend, among other factors, upon a continued general improvement in global economic conditions, our continued ability to meet unscheduled or temporary changes in demand, and our continued ability to penetrate new markets with strategic product initiatives in specific targeted markets.
Agricultural Solutions - Our Agricultural Solutions segment is supported by strong global fundamentals that create a critical need to increase crop yields. These include the need to feed a growing population with limited land and competition from biofuels, in addition to a change in dietary standards in emerging markets. These needs are met through the use of agrochemicals, including Seed Treatment, to protect the crop, and BioSolutions offerings (especially BioStimulants and Innovative Nutrition), among other technologies, for crop enhancement. The expansion of the middle class is a particularly strong catalyst for growth, particularly in Brazil, China, India, Russia and South Africa. In addition, demand growth combined with rapid urbanization has led to a continual decrease in land available per capita for production. This creates strong incentives for farmers to invest in high technology inputs (agrochemicals, seed) and equipment to maximize yields, increase productivity and protect harvests.
Despite improving macro trends for the industry, net sales in future periods can depend, among other factors, on general economic conditions, commodity prices, foreign exchange volatility, climate conditions and the development of new technologies, such as genetically modified (GM) seeds, that can partially substitute the need for agrochemicals. Disruptions in the Agrochemicals market may create additional opportunities for high value, niche applications that many of our products provide.
41
Foreign Currency Exposure
During 2017, 2016 and 2015, approximately 83%, 80% and 81%, respectively, of our net sales originated outside of the United States and were denominated in numerous currencies, including the euro, Brazilian Real, Chinese Yuan, British Pound Sterling, and Japanese Yen. Therefore, changes in foreign exchange rates in any given reporting period may positively or negatively impact our financial performance. During 2017, foreign exchange translation positively impacted net sales performance by approximately 1%.
In addition, our foreign subsidiaries are subject to foreign currency risk relating to receipts from customers, payments to suppliers, and intercompany transactions that are not in their functional currency, which is typically their local currency. As a result, our foreign subsidiaries enter into foreign exchange hedges from time to time and on an on-going basis to protect against transaction exposures. We actively assess our hedging programs in order to mitigate foreign exchange risk exposures. This includes programs to hedge our foreign currency denominated balance sheet exposures as well as foreign currency anticipated cash flows. Periodically, we also enter into deal specific foreign exchange hedges to mitigate our acquisition-related foreign exchange exposure.
Critical Accounting Estimates
The preparation of financial statements in conformity with GAAP requires management to make estimates and judgments regarding uncertainties, and as a result, may significantly impact our financial results. We base our estimates and judgments on historical experience, current conditions as well as other reasonable factors and assumptions. Several of the estimates and assumptions we are required to make relate to matters that are inherently uncertain as they pertain to future events. Actual results may differ from these estimates and assumptions and could be material to our financial statements.
We consider the accounting estimates discussed below to be critical to the understanding of our financial statements and involve difficult, subjective or complex judgments that could potentially affect reported results. See Note 2, Summary of Significant Accounting Policies, to the Consolidated Financial Statements included in this 2017 Annual Report for a detailed discussion of the application of these and other accounting policies.
Revenue Recognition
We recognize revenue either upon shipment or delivery of product depending on when it is reasonably assured that both title and the risks and rewards of ownership have been passed on to our customer. Estimates for sales rebates, incentives and discounts as well as sales returns and allowances, are accounted for as a reduction of revenue when the earnings process is complete. Sales rebates, incentives and discounts are typically earned by customers based on annual sales volume targets, which vary by each of our segments. We record an estimate for these accruals based on contract terms and our historical experience with similar programs. We record an estimate for future expected sales returns based on historical experience with product returns; however, additional allowances may be required if the historical data we use to calculate these estimates does not approximate future sales returns. Differences between estimated expense and actual costs are normally immaterial and are recognized in earnings in the period such differences are determined.
On a limited and discretionary basis, we allow certain distributors within the Agricultural Solutions segment extensions of credit on a portion of our sales to them during a purchasing cycle, which remain in the distributor’s inventory. The extension of credit is not a right to return, and distributors must pay unconditionally when the extended credit period expires.
Receivables and Allowance for Doubtful Accounts
We determine our allowance for doubtful accounts using a combination of factors to reduce our trade receivable balances to their estimated net realizable amount. We maintain an allowance for doubtful accounts based on a variety of factors, including the length of time receivables are past due, macroeconomic trends and conditions, significant one-time events, historical experience and the financial condition of customers. In addition, we record a specific reserve for individual accounts when we become aware of specific customer circumstances, such as in the case of bankruptcy filings or deterioration in the customer’s operating results or financial position. The past due or delinquency status of a receivable is based on the contractual payment terms of the receivable. If circumstances related to the specific customer change, we adjust estimates of the recoverability of receivables as appropriate. Credit risk with respect to accounts receivable is generally diversified due to the large number of entities comprising our customer base and their dispersion across many different geographical regions. We perform ongoing credit evaluations of the financial condition of our third-party distributors and other customers and require collateral, such as letters of credit and bank guarantees, in certain circumstances. At December 31, 2017 and 2016, we did not believe that we had any significant concentrations of credit risk that could materially impact our results of operations.
42
Inventories
Inventories are stated at the lower of cost or net realizable value with cost being determined by the first-in/first-out and average costs methods. Inventories in excess of one year of forecasted sales are classified in the Consolidated Balance Sheets as non-current "Other assets." We regularly review inventories for obsolescence and excess quantities and calculate reserves based on historical write-offs, customer demand, product evolution, usage rates and quantities of stock on hand. Additional obsolescence reserves may be required if actual sales are less favorable than those projected.
Business Combinations
Purchase price allocations of acquisitions to tangible and intangible assets acquired, liabilities assumed, and noncontrolling interests in the acquiree are based on estimated fair value at the acquisition date. The excess of the acquisition price over those estimated fair values is recorded as goodwill. Changes to the acquisition date provisional fair values prior to the end of the measurement period, are recorded as an adjustment to the associated goodwill. Acquisition-related expenses and restructuring costs, if any, are recognized separately from the business combination and are expensed as incurred.
Goodwill
Goodwill is tested for impairment at the reporting unit level annually in the fourth quarter, or when events or changes in circumstances indicate that goodwill might be impaired. Our six reporting units are determined based upon our organizational structure in place at the date of the goodwill impairment test. During the fourth quarter of 2017, we elected to early adopt ASU No. 2017-04, “Simplifying the Test for Goodwill Impairment” which eliminates "Step 2" from the goodwill impairment test, but still requires us to perform "Step 1" of impairment testing. In the first step of impairment testing, the fair value of each reporting unit is compared to its carrying value. The fair value of each reporting unit is determined based on the present value of discounted future cash flows. The discounted cash flows are prepared based upon cash flows at the reporting unit level. The cash flow model involves significant judgments related to future growth rates, discount rates and tax rates, among other considerations from the vantage point of a market participant.
The primary components of and assumptions used in the assessment consist of the following:
• | Valuation Techniques - we use a discounted cash flow analysis, which requires assumptions about short and long-term net cash flows, growth rates, as well as discount rates. Additionally, we consider guideline company and guideline transaction information, where available, to aid in the valuation of the reporting units. |
• | Growth Assumptions - Multi-year financial forecasts are developed for each reporting unit by considering several key business drivers such as new business initiatives, client service and retention standards, market share changes, historical performance, and industry and economic trends, among other considerations. We typically forecast revenue and the resulting cash flows for periods of five to seven years and include an estimated terminal growth rate at the end of the forecasted period. |
• | Discount Rate Assumptions - Discount rates are estimated based on the WACC, which combines the required return on equity and considers the risk-free interest rate, market risk premium, small stock risk premium and a company specific risk premium, with the cost of debt, based on BBB-rated corporate bonds, adjusted using an income tax factor. |
• | Estimated Fair Value and Sensitivities - The estimated fair value of each reporting unit is derived from the valuation techniques described above. The estimated fair value of each reporting unit is analyzed in relation to numerous market and historical factors, including current economic and market conditions, company-specific growth opportunities, and guideline company information. |
If the fair value of a reporting unit exceeds the carrying value of the net assets assigned to that reporting unit, goodwill is not impaired and no further testing is required. Beginning with the 2017 goodwill impairment test, subsequent to the early adoption of the new guidance, if the carrying value of the net assets assigned to the reporting unit exceeds the fair value of the reporting unit, the goodwill impairment loss is calculated as the difference between these amounts, limited to the amount of goodwill allocated to the reporting unit. For the 2016 goodwill impairment test, prior to the early adoption of the new guidance, if the carrying value of the net assets assigned to the reporting unit exceeded the fair value of the reporting unit, the second step of the impairment test was performed to determine the implied fair value of the reporting unit’s goodwill. If the carrying value of the reporting unit’s goodwill exceeded its implied fair value, an impairment charge was recorded equal to the difference.
During the fourth quarter of 2017, we performed our annual goodwill impairment test and determined that the carrying value of the Agro Business reporting unit within our Agricultural Solutions segment exceeded its fair value by $160 million. An impairment charge equal to this amount was recorded in the Statement of Operations for 2017, with a corresponding benefit of $7.4 million attributable to non-controlling interest holders. This impairment charge was driven primarily by a reduction in the estimated fair
43
value of this reporting unit based on the impact of a delayed agricultural market recovery which resulted in lower expectations for future revenue, profitability and cash flows as compared to the expectations at the time of of the 2016 annual goodwill impairment test. Future impairments of this reporting unit may occur if the business continues to experience a delayed agricultural market recovery or macroeconomic conditions result in an increase in the WACC used to estimate fair value.
In addition, we determined that the excess of the fair values of the Graphics and Offshore Solutions reporting units within our Performance Solutions segment exceeded their carrying values by approximately 20% and less than 5%, respectively, in 2017. Goodwill assigned to the Graphics and Offshore Solutions reporting units totaled $223 million and $281 million, respectively, as of the assessment date. The estimated fair value of these reporting units are highly sensitive to changes in these estimates and assumptions; therefore, in some instances, changes in these assumptions may impact whether the fair value of a reporting unit is greater than its carrying value. We performed sensitivity analysis around these assumptions in order to assess the reasonableness of the assumptions and the resulting estimated fair values. Based on a sensitivity analysis performed for the Graphics Solutions reporting unit, a 100 basis point increase in the WACC or 100 basis decrease in the terminal growth rate, without any other changes to the valuation, would not result in the carrying value being greater than the fair value. The fair value of the Offshore Solutions reporting unit continues to remain slightly above to its carrying value following the impairment charge of $46.6 million recorded in conjunction with the annual goodwill impairment test performed in 2016. As a result, a 100 basis point increase in the WACC or 100 basis decrease in the terminal growth rate, without any other changes to the valuation, would result in the carrying value being greater than the fair value. Future impairments of these reporting units may occur if the businesses does not achieve its expected cash flows or macroeconomic conditions result in an increase in the WACC used to estimate fair value.
In 2017, we also determined that the fair values of the Surface Chemistries and Assembly Solutions reporting units within our Performance Solutions segment and the Agricultural Animal Health reporting unit within our Agricultural Solutions segment were each significantly in excess of their respective carrying values.
As noted above, a goodwill impairment charge totaling $46.6 million was recorded during 2016, related to Performance Solutions' Offshore Solutions reporting unit. This impairment charge was the result of previously weak oil prices. We experienced the impact on our results, which slightly lagged the overall industry, as this ultimately caused the industry to depress its overall investments. The fair value was determined using a combination of an income approach derived from a discounted cash flow model as well as market multiples. No impairments of goodwill were identified during the 2015.
See Note 8, Goodwill and Intangible Assets, to the Consolidated Financial Statements included in this 2017 Annual Report for additional information.
Indefinite-Lived Intangible Assets
Indefinite-lived intangible assets are reviewed for potential impairment on an annual basis, in the fourth quarter, or more frequently when events or circumstances indicate that such assets may be impaired, by comparing their estimated fair values to their carrying values. An impairment charge is recognized when the carrying value of an indefinite-lived intangible asset exceeds its estimated fair value. We use the “relief from royalty” method to estimate the fair value of trade name intangible assets for impairment. The primary assumptions used to estimate the present value of cash flows from such assets include sales projections and growth rates being applied to a prevailing market-based royalty rate, the effects of which are then tax effected, and discounted using the WACC from the vantage point of a market participant. Assumptions concerning sales projections are impacted by the uncertain nature of global and local economic conditions in the various markets we serve.
No impairments of indefinite-lived intangible assets were identified during 2017, 2016 and 2015.
Long-Lived Assets Including Finite-Lived Intangible Assets
Finite-lived intangible assets are amortized on a straight-line basis over their estimated useful lives, which currently range from 8 to 30 years for customer lists, 5 to 14 years for developed technology, 5 to 20 years for trade names, and up to 5 years for non-compete agreements. If circumstances require a long-lived asset group to be tested for possible impairment, we first determine whether the estimated undiscounted pre-tax future cash flows expected to result from the use of the asset plus the net proceeds expected from disposition of the asset, if any, are less than the carrying value of the asset. When an impairment is identified, the carrying value of the asset is reduced to its estimated fair value based on a discounted cash flow approach or, when available and appropriate, to comparable market values.
No impairments of long-lived assets, including finite-lived intangible assets, were identified during 2017, 2016 and 2015.
44
Employee Benefits and Pension Obligations
Amounts recognized in our audited Consolidated Financial Statements related to pension and other post-retirement benefits are determined from actuarial valuations. Inherent in such valuations are assumptions including expected return on plan assets, discount rates at which the liabilities could be settled, rates of increase in future compensation levels, and mortality rates. These assumptions are updated annually and are disclosed in Note 10, Pension, Post-Retirement and Post-Employment Plans, to the Consolidated Financial Statements included in this 2017 Annual Report. In accordance with GAAP, actual results that differ from the assumptions are accumulated in other comprehensive income and amortized over future periods and, therefore, affect expense recognized.
We consider a number of factors in determining and selecting assumptions for the overall expected long-term rate of return on plan assets. We consider the historical long-term return experience of our assets, the current and expected allocation of our plan assets, and expected long-term rates of return. We derive these expected long-term rates of return with the assistance of our investment advisors. We base our expected allocation of plan assets on a diversified portfolio consisting of domestic and international equity securities, fixed income, real estate and alternative asset classes. The measurement date used to determine pension and other post-retirement benefits is December 31, at which time the minimum contribution level for the following year is determined.
With respect to U.S. plans, our investment policies incorporate an asset allocation strategy that emphasizes the long-term growth of capital and acceptable asset volatility as long as it is consistent with the volatility of the relevant market indexes. The investment policies attempt to achieve a mix of approximately 50% of plan investments for long-term growth, 49% for liability-matching assets and 1% for near-term benefit payments. We believe this strategy is consistent with the long-term nature of plan liabilities and ultimate cash needs of the plans. Plan assets consist primarily of corporate bond mutual funds, limited partnership interests, listed stocks and cash. The corporate bond mutual funds held by the pension plan include primarily corporate bonds from companies from diversified industries located in the United States. The listed stocks are investments in large-cap and mid-cap companies located in the United States. The assets from the limited partnership investments primarily include listed stocks located in the United States. The weighted average asset allocation of the Pension Plan was 49% fixed income mutual fund holdings, 27% equity securities, 19% limited partnership interests and managed equity funds, 4% collective investment funds and 1% cash at December 31, 2017. ROA assumptions are determined annually based on a review of the asset mix as well as individual ROA performances, benchmarked against indexes such as the S&P 500 Index and the Russell 2000 Index. In determining an assumed rate of return on plan assets, we consider past performance and economic forecasts for the types of investments held by the Pension Plan. The asset allocation strategy and ROA assumptions for the non-U.S. plans are determined based on similar set of criteria adapted for local investments, inflation rates and in certain cases specific government requirements.
Stock-based Compensation
We expense employee stock-based compensation over the requisite service period based on the estimated grant-date fair value of the awards. The fair value of RSU awards is determined using Monte Carlo simulations for market-based RSU awards, and the closing price of our common stock on the date of grant for all other RSU awards. The fair value of stock options is determined using the Black-Scholes option pricing model. The assumptions used in calculating the fair value of stock-based awards represent our best estimates and involve inherent uncertainties and the application of judgment. Inputs in the model include assumptions related to stock price volatility, award terms, and judgments as to whether performance targets will be achieved.
Compensation costs for RSU awards reflects the number of awards expected to vest and is ultimately adjusted in future periods to reflect the actual number of vested awards. Compensation costs for awards with performance conditions are only recognized if and when it becomes probable that the performance condition will be achieved. The probability of vesting is reassessed at the end of each reporting period and the compensation costs are adjusted accordingly, with the cumulative effect of such a change on current and prior periods being recognized in compensation cost in the period of the change. Compensation costs for stock options and market-based RSU awards are recorded ratably over the vesting term of the options, effected for forfeitures as they occur.
Environmental Matters
We accrue for environmental matters when it is probable that a liability has been incurred and the amount of the liability can be reasonably estimated based on current laws and existing technologies. The accruals are adjusted periodically as assessment and remediation efforts progress or as additional technical or legal information becomes available. Accruals for environmental liabilities are included in the Consolidated Balance Sheets in “Accrued expenses and other current liabilities” and “Other liabilities” at undiscounted amounts. Accruals for related insurance or other third-party recoveries for environmental liabilities are recorded when it is probable that a recovery will be realized and are included in the Consolidated Balance Sheets as “Other current assets" and "Other assets."
45
We capitalize environmental costs in instances where the costs extend the life of the property, increase its capacity, and/or mitigate or prevent contamination from future operations. Environmental costs are also capitalized in recognition of legal asset retirement obligations resulting from the acquisition, construction and/or normal operation of a long-lived asset. Costs related to environmental contamination treatment and cleanup are charged to expense. Estimated future incremental operations, maintenance and management costs directly related to remediation are accrued when such costs are probable and reasonably estimable.
Income Taxes
We recognize deferred tax assets and liabilities based on the differences between the financial statement basis and the tax bases of assets, liabilities, net operating losses and tax credit carryforwards. A valuation allowance is required to be recognized to reduce the recorded deferred tax asset to the amount that will more likely than not be realized. The ultimate realization of deferred tax assets is dependent upon the generation of future taxable income by jurisdiction during the periods in which those temporary differences become deductible or when carryforwards can be utilized. We consider the scheduled reversal of deferred tax liabilities, projected future taxable income and tax planning strategies in this assessment. If these estimates and related assumptions change in the future, we may be required to record additional valuation allowances against our deferred tax assets resulting in additional income tax expense. Deferred tax assets and liabilities are measured using the enacted tax rates expected to apply to taxable income in the years in which those temporary differences and carryforwards are expected to be recovered or settled. The effect on deferred tax assets and liabilities of a change in tax rates is recognized in income in the period that includes the enactment date of such change. Considering that the TCJA was enacted on December 22, 2017, the effect would normally be required to be recognized in the fourth quarter of 2017. The SEC staff issued Staff Accounting Bulletin 118 (“SAB 118”) to address the application of GAAP in situations where a registrant does not have the necessary information available, prepared or analyzed (including computations) in reasonable detail to complete the accounting for certain income tax effects of the TCJA.
In particular, SAB 118 clarifies that the impact of the TCJA must be accounted for and reported in one of three ways: (1) by reflecting the tax effects of the TCJA for which the accounting is complete; (2) by reporting provisional amounts for those specific income tax effects of the TCJA for which the accounting is incomplete but a reasonable estimate can be determined, with such provisional amounts (or adjustments to provisional amounts) identified in the measurement period, as defined therein, being included as an adjustment to tax expense in the period the amounts are determined; or (3) where the income tax effects cannot be reasonably estimated, no provisional amounts should be reported and the registrant should continue to apply the accounting standard for income taxes based on the provisions of the tax laws that were in effect immediately prior to the enactment of the TCJA. SAB 118 allows companies to record provisional amounts during a one year measurement period.
We are subject to income taxes in the United States and in various states and foreign jurisdictions. Significant judgment is required in evaluating our uncertain tax positions and determining our provision for income taxes. The first step in evaluating the tax position for recognition is to determine the amount of evidence that supports a favorable conclusion for the tax position upon audit. In order to recognize the tax position, we must determine whether it is more likely than not that the position is sustainable. The final evaluation step is to measure the tax benefit as the largest amount that has a more than 50% chance of being realized upon final settlement. Although we believe that the positions taken on income tax matters are reasonable, we establish tax reserves in recognition that various taxing authorities may challenge certain of those positions taken, potentially resulting in additional tax liabilities.
Recent Accounting Pronouncements
A summary of recent accounting pronouncements is included in Note 3, Recent Accounting Pronouncements, to the Consolidated Financial Statements included in this 2017 Annual Report.
46
Results of Operations
The following table summarizes our results of operations for 2017, 2016 and 2015:
% Change - 2017 vs 2016 | % Change - 2016 vs 2015 | |||||||||||||||||||||||
($ amounts in millions) | 2017 | 2016 | Reported | Constant Currency | Organic | 2015 | Reported | Constant Currency | Organic | |||||||||||||||
Net sales | $ | 3,775.9 | $ | 3,585.9 | 5% | 4% | 4% | $ | 2,542.3 | 41% | 43% | 2% | ||||||||||||
Cost of sales | 2,186.9 | 2,078.2 | 5% | 4% | 1,550.4 | 34% | 36% | |||||||||||||||||
Gross profit | 1,589.0 | 1,507.7 | 5% | 5% | 991.9 | 52% | 55% | |||||||||||||||||
Selling, technical, general and administrative | 1,109.3 | 1,123.3 | (1)% | (2)% | 857.5 | 31% | 33% | |||||||||||||||||
Research and development | 98.4 | 84.4 | 17% | 15% | 62.8 | 34% | 35% | |||||||||||||||||
Goodwill impairment | 160.0 | 46.6 | (nm) | (nm) | — | (nm) | (nm) | |||||||||||||||||
Operating profit | 221.3 | 253.4 | (13)% | (9)% | 71.6 | (nm) | (nm) | |||||||||||||||||
Interest expense, net | (341.6 | ) | (375.7 | ) | (9)% | (213.9 | ) | 76% | ||||||||||||||||
Other (expense) income, net | (168.7 | ) | 74.2 | (nm) | (87.0 | ) | (nm) | |||||||||||||||||
Loss before income taxes and non-controlling interest | (289.0 | ) | (48.1 | ) | (nm) | (229.3 | ) | (79)% | ||||||||||||||||
Income tax expense | (6.6 | ) | (28.6 | ) | (77)% | (75.1 | ) | (62)% | ||||||||||||||||
Net loss | $ | (295.6 | ) | $ | (76.7 | ) | (nm) | $ | (304.4 | ) | (75)% | |||||||||||||
Adjusted EBITDA (1) | $ | 820.9 | $ | 769.5 | 7% | 7% | $ | 567.7 | 36% | 38% | ||||||||||||||
(nm) Calculation not meaningful.
(1) Adjusted EBITDA is a non-GAAP financial measure and as such, should not be considered in isolation from, as a substitute for, or superior to performance measures calculated in accordance with GAAP. For a definition of Adjusted EBITDA and additional information on why we present this measure, its limitations and a reconciliation to the most comparable applicable GAAP measure, see "—Non-GAAP Financial Measures" below, and Note 23, Segment Information, to the Consolidated Financial Statements, all included in this 2017 Annual Report.
Non-GAAP Financial Measures
To supplement our financial results presented in accordance with GAAP in this Management’s Discussion and Analysis of Financial Condition and Results of Operations section, we present certain non-GAAP financial measures, such as Adjusted EBITDA, operating results on a constant currency basis and organic sales growth. Management internally reviews each of these non-GAAP measures to evaluate performance on a comparative period-to-period basis in terms of absolute performance, trends, and expected future performance with respect to our business. We believe these non-GAAP financial measures, which are each further described below, provide investors with an additional perspective on trends and underlying operating results on a period-to-period comparable basis. We also believe that investors find this information helpful in understanding the ongoing performance of our operations separate from items that may have a disproportionate positive or negative impact on our financial results in any particular period or are considered to be costs associated with our capital structure.
These non-GAAP financial measures, however, have limitations as analytical tools, and should not be considered in isolation from, or a substitute for, or superior to, the related financial information that we report in accordance with GAAP. The principal limitations of these non-GAAP financial measures is that they exclude significant expenses and income that are required by GAAP to be recorded in the Company’s financial statements, and may not be comparable to similarly titled measures of other companies due to potential differences in the method of calculation between companies. In addition, these measures are subject to inherent limitations as they reflect the exercise of judgment by management about which items are excluded or included in determining these non-GAAP financial measures. Investors are encouraged to review the reconciliations of these non-GAAP financial measures to their most comparable GAAP financial measures included in this 2017 Annual Report, and not to rely on any single financial measure to evaluate the Company’s businesses.
Adjusted EBITDA
We define Adjusted EBITDA as EBITDA (earnings before interest, provision for income taxes, depreciation and amortization), excluding the impact of additional items included in earnings, which we believe are not representative or indicative of our ongoing business or are considered to be part of our capital structure. Management believes Adjusted EBITDA provides investors with a
47
more complete understanding of the long-term profitability trends of our business, and facilitates comparisons of our profitability to prior and future periods.
For a reconciliation of "Net loss attributable to common stockholders" to Adjusted EBITDA and more information about the adjustments made, see Note 23, Segment Information, to the Consolidated Financial Statements included in this 2017 Annual Report.
Constant Currency
We disclose operating results from net sales through operating profit on a constant currency basis by adjusting to exclude the impact of changes due to the translation of foreign currencies of our international locations into U.S. dollars. Management believes this non-GAAP financial information facilitates period-to-period comparison in the analysis of trends in business performance, thereby providing valuable supplemental information regarding our results of operations, consistent with how we internally evaluate our financial results.
The impact of foreign currency translation is calculated by converting our current-period local currency financial results into U.S. dollars using the prior period's exchange rates and comparing these adjusted amounts to our prior period reported results. The difference between actual growth rates and constant currency growth rates represents the impact of foreign currency translation.
Organic Results
Organic sales growth is defined as net sales excluding the impact of foreign currency translation, changes due to the price of certain metals, acquisitions and/or divestitures. Management believes this non-GAAP financial measure provides investors with a more complete understanding of the underlying net sales trends by providing comparable sales over differing periods on a consistent basis.
The following tables reconcile GAAP net sales growth to organic sales growth for 2017 and 2016:
Year ended December 31, 2017 | |||||||||
Reported Net Sales Growth | Impact of Currency | Metals | Acquisitions/Disposition | Organic Sales Growth | |||||
Performance Solutions | 6% | —% | (1)% | —% | 4% | ||||
Agricultural Solutions | 4% | (2)% | —% | —% | 3% | ||||
Total | 5% | (1)% | (1)% | —% | 4% | ||||
Year ended December 31, 2016 | |||||||||
Reported Net Sales Growth | Impact of Currency | Metals | Acquisitions/Disposition | Organic Sales Growth | |||||
Performance Solutions | 121% | 2% | (2)% | (120)% | 1% | ||||
Agricultural Solutions | 4% | 2% | —% | (3)% | 3% | ||||
Total | 41% | 2% | —% | (40)% | 2% | ||||
NOTE: Totals may not sum due to rounding.
For 2017, metals pricing and acquisitions benefited our Performance Solutions and consolidated results by $23.6 million and $2.8 million, respectively.
For 2016, metals pricing and acquisitions benefited our Performance Solutions and consolidated results by $12.6 million and $965 million, respectively. Additionally, Agricultural Solutions and our consolidated results benefited from acquisitions and dispositions by $87.5 million and $32.1 million, respectively.
When comparing 2016 and 2015, we also presented gross profit, selling, technical, general and administrative expense, research and development expense, and operating profit on an organic basis. These results excluded the impact of foreign currency translation and were adjusted for the impact of the Alent and OMG Acquisitions in 2016 in Performance Solutions and for the impact of the Arysta Acquisition, completed in February 2015, as well as a divestiture completed in 2015, in Agricultural Solutions.
48
Year Ended December 31, 2017 Compared to the Year Ended December 31, 2016
Net Sales
Year ended December 31, | Change | ||||||||||||
($ amounts in millions) | 2017 | 2016 | Reported | Constant Currency | Organic | ||||||||
Performance Solutions | $ | 1,878.6 | $ | 1,770.1 | 6% | 6% | 4% | ||||||
Agricultural Solutions | 1,897.3 | 1,815.8 | 4% | 3% | 3% | ||||||||
Total | $ | 3,775.9 | $ | 3,585.9 | 5% | 4% | 4% | ||||||
Performance Solutions' net sales for 2017 increased by 6% (6% on a constant currency and 4% on an organic basis). Organic sales growth was driven primarily by strength in our Assembly and Industrial Solutions businesses, which contributed approximately 3% and 2% of growth to the segment, respectively. Organic sales growth in Assembly Solutions reflected higher sales volume across several product lines, including solder paste. Our Industrial Solutions’ organic sales growth was driven by higher sales volume across all regions, most notably in Europe and Asia. In addition, organic sales growth in our Electronics Solutions business contributed approximately 1% of growth to the segment, driven primarily by strong performance in the Asian smart phone and memory disk markets. Organic sales growth was partially offset by continued volume declines of flexographic printing plates within our Graphics Solutions business, which reduced organic segment sales growth by approximately 1%.
Agricultural Solutions' net sales for 2017 increased by 4% (3% on a constant currency and organic basis). The organic sales increase was driven by a combination of our successful geographic expansion into various European markets, most notably in parts of Eastern Europe, Germany and UK, as well as continued volume growth, notably from our BioSolutions portfolio, and new product introductions across Europe and parts of Asia and Latin America, particularly in Japan, Brazil, Mexico and China. These gains were partially offset by declines resulting from changes in our West Africa selling strategies, pricing pressure on certain products, mostly impacting Latin America and the U.S., and lower volumes in southern Asia and North America.
Gross Profit
Year ended December 31, | Change | ||||||||||
($ amounts in millions) | 2017 | 2016 | Reported | Constant Currency | |||||||
Gross profit | |||||||||||
Performance Solutions | $ | 813.8 | $ | 776.8 | 5% | 5% | |||||
Agricultural Solutions | 775.2 | 730.9 | 6% | 5% | |||||||
Total | $ | 1,589.0 | $ | 1,507.7 | 5% | 5% | |||||
Gross margin | |||||||||||
Performance Solutions | 43.3% | 43.9% | (57) bps | (49) bps | |||||||
Agricultural Solutions | 40.9% | 40.3% | 61 bps | 95 bps | |||||||
Total | 42.1% | 42.0% | 4 bps | 24 bps | |||||||
Performance Solutions' gross profit for 2017 increased by 5% on a reported and constant currency basis. The constant currency increase in gross profit was primarily driven by higher net sales volume in our Assembly and Industrial Solutions businesses and $11.7 million in inventory step-up amortization in the prior year which did not recur in 2017. The increase was partially offset by higher raw material costs in our Graphics business and metals prices across our businesses. Gross margin erosion was primarily driven by declines in our Graphics Solutions business, as well as product mix and higher raw material and metals costs in our Assembly Solutions business.
Agricultural Solutions' gross profit for 2017 increased by 6% (5% at constant currency). The constant currency increase was largely a result of overall top line growth, particularly in the fourth quarter, an increased focus on selling higher-margin products, notably from our BioSolutions portfolio, in Europe, Latin America and North America, a change in our selling strategy of certain lower-margin businesses in West Africa, as well as new geographic expansions, primarily in Europe. Gross margin expansion was largely the result of higher-margin new product introductions, particularly in Latin America and North America, and cost savings associated with sourcing raw materials, partially offset by the pricing pressures in Latin America and the U.S.
49
Selling, Technical, General and Administrative Expense (STG&A)
Year ended December 31, | Change | ||||||||||
($ amounts in millions) | 2017 | 2016 | Reported | Constant Currency | |||||||
STG&A | |||||||||||
Performance Solutions | $ | 504.1 | $ | 504.3 | —% | —% | |||||
Agricultural Solutions | 525.3 | 518.1 | 1% | (1)% | |||||||
Corporate | 79.9 | 100.9 | (21)% | (21)% | |||||||
Total | $ | 1,109.3 | $ | 1,123.3 | (1)% | (2)% | |||||
STG&A as % of net sales | |||||||||||
Performance Solutions | 26.8% | 28.5% | (165) bps | (169) bps | |||||||
Agricultural Solutions | 27.7% | 28.5% | (85) bps | (103) bps | |||||||
Total | 29.4% | 31.3% | (195) bps | (204) bps | |||||||
Performance Solutions' STG&A for 2017 was flat on a reported and constant currency basis, as operating cost inflation was essentially offset by realized cost savings from integration activities and lower bad debt expense.
Agricultural Solutions' STG&A for 2017 increased by 1% (decreased by 1% at constant currency). The constant currency decrease was primarily due to cost reduction initiatives in Europe and Latin America, offset by higher costs associated with non-recourse factoring programs, costs associated with the termination of a supply agreement related to the CAS Acquisition, and costs associated with expansion of certain European markets.
Corporate STG&A for 2017 decreased by 21% on a reported and constant currency basis. The decrease was primarily due to lower acquisition and integration costs associated with previous Acquisitions, and legal expenses which did not recur in 2017, partially offset by costs associated with the Proposed Separation of our Agricultural Solutions business.
Research and Development (R&D)
Year ended December 31, | Change | ||||||||||
($ amounts in millions) | 2017 | 2016 | Reported | Constant Currency | |||||||
R&D | |||||||||||
Performance Solutions | $ | 46.4 | $ | 45.0 | 3% | 4% | |||||
Agricultural Solutions | 52.0 | 39.4 | 32% | 28% | |||||||
Total | $ | 98.4 | $ | 84.4 | 17% | 15% | |||||
R&D as % of net sales | |||||||||||
Performance Solutions | 2.5% | 2.5% | (7) bps | (5) bps | |||||||
Agricultural Solutions | 2.7% | 2.2% | 57 bps | 53 bps | |||||||
Total | 2.6% | 2.4% | 25 bps | 24 bps | |||||||
Performance Solutions' R&D for 2017 increased by 3% (4% at constant currency) due to timing of various projects.
Agricultural Solutions' R&D for 2017 increased by 32% (28% at constant currency), driven primarily by investments in new development projects aimed at enhancing our product portfolio in targeted areas of focus.
50
Goodwill impairment
Year Ended December 31, | |||||||
($ amounts in millions) | 2017 | 2016 | |||||
Goodwill impairment | |||||||
Performance Solutions | $ | — | $ | 46.6 | |||
Agricultural Solutions | 160.0 | — | |||||
Total | $ | 160.0 | $ | 46.6 | |||
As a result of our annual goodwill impairment test in 2017, we recorded an impairment charge in the Agricultural Solutions segment of $160 million related to our Agro Business reporting unit. This charge was driven by the impact of a delayed agricultural market recovery, which resulted in lower expectations for future profitability and cash flows as compared to the expectations of the 2016 annual goodwill impairment test.
As a result of our annual goodwill impairment test in 2016, we recorded an impairment charge in the Performance Solutions segment of $46.6 million related to the Offshore Solutions reporting unit as a result of previously weak oil prices.
Operating Profit
Year ended December 31, | Change | ||||||||||
($ amounts in millions) | 2017 | 2016 | Reported | Constant Currency | |||||||
Operating profit | |||||||||||
Performance Solutions | $ | 263.2 | $ | 180.9 | 45% | 46% | |||||
Agricultural Solutions | 38.0 | 173.4 | (78)% | (74)% | |||||||
Corporate | (79.9 | ) | (100.9 | ) | (21)% | (21)% | |||||
Total | $ | 221.3 | $ | 253.4 | (13)% | (9)% | |||||
Operating Margin | |||||||||||
Performance Solutions | 14.0% | 10.2% | 379 bps | 389 bps | |||||||
Agricultural Solutions | 2.0% | 9.5% | (755) bps | (711) bps | |||||||
Total | 5.9% | 7.1% | (121) bps | (94) bps | |||||||
Performance Solutions' operating profit for 2017 increased by 45% (46% at constant currency), representing an operating margin of 14.0%. The constant currency increase was driven by top line growth in our Assembly, Industrial and Electronic Solutions businesses, the goodwill impairment charge of $46.6 million recorded in 2016 mentioned above, as well as cost savings from integration activities of approximately $18 million. The increase was partially offset by the previously noted gross margin erosion from declines in our Graphics Solutions business.
Agricultural Solutions' operating profit for 2017 decreased by 78% (74% at constant currency), representing an operating margin of 2.0%. The decrease in constant currency operating profit and margin was driven primarily by the goodwill impairment charge of $160 million. Excluding the goodwill impairment impact, operating profit increased as a result of top line growth in all regions and the gross profit improvements noted above, partially offset by higher R&D costs.
51
Other (Expense) Income, net
Year Ended December 31, | |||||||
($ amounts in millions) | 2017 | 2016 | |||||
Interest expense, net | $ | (341.6 | ) | $ | (375.7 | ) | |
Foreign exchange loss | (107.5 | ) | (14.1 | ) | |||
Other (expense) income, net | (61.2 | ) | 88.3 | ||||
Total | $ | (510.3 | ) | $ | (301.5 | ) | |
Interest Expense, Net
For 2017 and 2016, net interest expense totaled $342 million and $376 million, respectively, representing a decrease of $34.1 million. The decrease in net interest expense is primarily due to the repricing of our term debt, which decreased the weighted average effective interest rate on our term loans from approximately 5.64% at December 31, 2016 to 4.53% at December 31, 2017.
Foreign Exchange Loss
For 2017 and 2016, foreign exchange loss totaled $108 million and $14.1 million, respectively, representing an increase of $93.4 million. The increase in foreign exchange losses is primarily due to the remeasurement of foreign denominated debt and intercompany balances to U.S. dollar and pertained primarily to the euro and British pound.
Other (expense) income, net
For 2017 and 2016, other (expense) income, net totaled $(61.2) million and $88.3 million, respectively, representing a year over year negative impact to profits of $150 million. The decrease is primarily related to the prior-year net gain of $98.0 million associated with the settlement of our Series B Convertible Preferred Stock and $61.1 million of charges in 2017 related to extinguishment of debt, partially offset by the $10.8 million net gain related to a legal settlement agreement.
Income Tax
Year Ended December 31, | |||||||
($ amounts in millions) | 2017 | 2016 | |||||
Income tax expense | $ | (6.6 | ) | $ | (28.6 | ) | |
Effective tax rate | (2.3 | )% | (59.5 | )% | |||
The income tax expense for 2017 totaled $6.6 million, as compared to $28.6 million for 2016. The change in the effective tax rate is primarily attributable to the increased level of goodwill impairment in 2017 as compared to 2016 for which there was no corresponding tax benefit, the benefit for the provisional estimate of the TCJA, the 2016 settlement gain of the Series B Convertible Preferred Stock which was treated as a non-taxable purchase price adjustment, and favorable reductions in foreign tax rates for changes in tax law.
Other Comprehensive (Loss) Income
Other comprehensive income for 2017 totaled $256 million, as compared to $214 million of income in the prior year. The change was driven primarily by foreign currency translation gains associated with the euro, Canadian Dollar and Chinese Yuan, partially offset by losses primarily associated with the British Pound.
Segment Performance
Our operations are organized into two reportable segments: Performance Solutions and Agricultural Solutions. Both segments share a common focus on attractive niche markets, which we believe will grow faster than the diverse end-markets we serve. For additional information regarding our segments, see Item 7, Management’s Discussion and Analysis of Financial Condition and Results of Operations, under the heading "Our Business," and Note 23, Segment Information, to our Consolidated Financial Statements included in this 2017 Annual Report.
52
Adjusted EBITDA
We utilize Adjusted EBITDA as one of the measures to evaluate the performance of our operating segments. Adjusted EBITDA for each segment includes an allocation of corporate costs, such as compensation expense and professional fees. See Note 23, Segment Information, to our Consolidated Financial Statements included in this 2017 Annual Report, for more information and a reconciliation of Adjusted EBITDA to net income.
Year Ended December 31, | Change | ||||||||||
($ amounts in millions) | 2017 | 2016 | Reported | Constant Currency | |||||||
Adjusted EBITDA: | |||||||||||
Performance Solutions | $ | 432.7 | $ | 401.3 | 8% | 8% | |||||
Agricultural Solutions | 388.2 | 368.2 | 5% | 6% | |||||||
Total | $ | 820.9 | $ | 769.5 | 7% | 7% | |||||
For 2017 and 2016, corporate costs allocated to each segment totaled $31.4 million and $32.8 million, respectively.
Performance Solutions' Adjusted EBITDA for 2017 increased 8% on a reported and constant currency basis. The increase was primarily driven by growth of our Assembly, Industrial and Electronic Solutions businesses resulting in higher gross profits, as well as cost savings from integration synergies, partially offset by the impact of volume declines in our Graphics Solutions business.
Agricultural Solutions' Adjusted EBITDA for 2017 increased 5% (6% at constant currency). The constant currency increase was primarily driven by an increase from market expansion in Europe and new product launches in Asia and Latin America, volume growth in higher-margin products and cost reduction initiatives in Europe and Latin America. These increases were partially offset by a change in our selling strategy of certain lower-margin businesses in West Africa, and investments made in STG&A, as noted above.
Year Ended December 31, 2016 Compared to Year Ended December 31, 2015
Net Sales
Year ended December 31, | Change | ||||||||||||
($ amounts in millions) | 2016 | 2015 | Reported | Constant Currency | Organic | ||||||||
Performance Solutions | $ | 1,770.1 | $ | 800.8 | 121% | 123% | 1% | ||||||
Agricultural Solutions | 1,815.8 | 1,741.5 | 4% | 6% | 3% | ||||||||
Total | $ | 3,585.9 | $ | 2,542.3 | 41% | 43% | 2% | ||||||
Performance Solutions' net sales for 2016 increased by 121% (123% on a constant currency and 1% on an organic basis) compared to the prior period. The increase in organic net sales was driven by growth in global paste solder product demand in Assembly Solutions, share gains in industrial product offerings sold into the automotive supply chain in Asia, specifically in China, and a recovery of product demand in Electronic Solutions in the second half of 2016. Organic sales growth in these businesses was partially offset by under-performance in Offshore Solutions due to softness in the oil and gas end market as declines in oil prices resulted in reduced capital investment and project startup delays. The impact of oil prices was twofold: (1) reduced demand for offshore production control and drilling fluids, and (2) reduced demand for plating chemistry sold into the supply chain for onshore oil production rigs and stripping/cleaning chemistry utilized in polyethylene terephthalate recycling.
Agricultural Solutions' net sales for 2016 increased by 4% (6% on a constant currency and 3% on an organic basis) compared to the prior period. The increase in organic net sales was driven by volume growth in our insecticide and herbicide businesses in Latin America and Europe, our anti-malarial insecticides in Africa, and our BioSolutions business. The volume growth was primarily boosted by several new product launches and continued focus on promoting proprietary brands. These effects were partially offset by lower volumes in North America, mainly due to low commodity prices, declining farmer incomes and soft demand for crop protection products, as well as our continued integration efforts to reduce volumes related to low-margin products across geographic markets. Additionally, although generic competition and low commodity prices led to some pricing pressure, overall Agricultural Solutions achieved an improvement in pricing driven primarily by Latin America and Europe.
53
Gross Profit
Year ended December 31, | Change | ||||||||||||
($ amounts in millions) | 2016 | 2015 | Reported | Constant Currency | Organic | ||||||||
Gross profit | |||||||||||||
Performance Solutions | $ | 776.8 | $ | 387.9 | 100% | 103% | 1% | ||||||
Agricultural Solutions | 730.9 | 604.0 | 21% | 23% | 19% | ||||||||
Total | $ | 1,507.7 | $ | 991.9 | 52% | 55% | 12% | ||||||
Gross margin | |||||||||||||
Performance Solutions | 43.9% | 48.4% | (455) bps | (441) bps | (91) bps | ||||||||
Agricultural Solutions | 40.3% | 34.7% | 557 bps | 554 bps | 554 bps | ||||||||
Total | 42.0% | 39.0% | 303 bps | 309 bps | 381 bps | ||||||||
Performance Solutions' gross profit for 2016 increased by 100% (103% at constant currency and 1% on an organic basis). The organic gross profit increase was driven by gross margin expansion resulting from lower raw material costs, some of which were achieved through synergies, as well as favorable product mix, partially offset by lower sales volume from Offshore Solutions. The most significant growth came from our higher-margin advanced Electronics Solutions and Industrials Solutions product lines, particularly in Asia.
Agricultural Solutions' gross profit for 2016 increased by 21% (23% at constant currency and 19% on an organic basis). The increase was largely a result of $58.0 million of inventory step-up amortization in 2015 which did not recur in 2016. The gross profit increase was also driven by a broad increase in sales volumes, including higher relative growth in our BioSolutions products, which generate, on average, higher margins, as well as procurement savings, driven by our ongoing integration and synergy efforts. We continued to see favorable effects from improved procurement trends, product mix, the impact of our proprietary product portfolio, and growth in the niche markets in which we operate.
Selling, Technical, General and Administrative Expense (STG&A)
Year ended December 31, | Change | ||||||||||||
($ amounts in millions) | 2016 | 2015 | Reported | Constant Currency | Organic | ||||||||
STG&A | |||||||||||||
Performance Solutions | $ | 504.3 | $ | 242.6 | 108% | 110% | 13% | ||||||
Agricultural Solutions | 518.1 | 488.5 | 6% | 9% | 3% | ||||||||
Corporate | 100.9 | 126.4 | (20)% | (20)% | (20)% | ||||||||
Total | $ | 1,123.3 | $ | 857.5 | 31% | 33% | 2% | ||||||
STG&A as % of net sales | |||||||||||||
Performance Solutions | 28.5% | 30.3% | (180) bps | (177) bps | 286 bps | ||||||||
Agricultural Solutions | 28.5% | 28.1% | 48 bps | 67 bps | 67 bps | ||||||||
Total | 31.3% | 33.7% | (240) bps | (233) bps | (30) bps | ||||||||
Performance Solutions' STG&A for 2016 increased by 108% (110% at constant currency and 13% on an organic basis). The organic increase was driven by charges associated with integration activities and higher debt refinancing costs.
Agricultural Solutions' STG&A for 2016 increased by 6% (9% at constant currency and 3% on an organic basis). The increase was driven primarily by a modest increase due to price inflation related to wages in developing markets, investments in infrastructure in support of growth in the business, continued integration expenses, and higher costs associated with non-recourse factoring programs. The increase was partially offset by savings from headcount reductions associated with synergies achieved in our operations in Africa and Europe and a decline in restructuring expenses related to the acquisitions within this segment.
Corporate STG&A for 2016 decreased by 20% on a reported, constant currency and organic basis. The decline was primarily due to a significant reduction in acquisition-related and restructuring costs, partially offset by increases in costs associated with
54
headcount additions, equity compensation, infrastructure spending on integration activities, and debt modification costs associated with the term loan refinancing completed in October and December 2016.
Research and Development Expense
Year ended December 31, | Change | ||||||||||||
($ amounts in millions) | 2016 | 2015 | Reported | Constant Currency | Organic | ||||||||
R&D | |||||||||||||
Performance Solutions | $ | 45.0 | $ | 25.4 | 77% | 78% | (12)% | ||||||
Agricultural Solutions | 39.4 | 37.4 | 5% | 5% | (4)% | ||||||||
Total | $ | 84.4 | $ | 62.8 | 34% | 35% | (7)% | ||||||
R&D as % of net sales | |||||||||||||
Performance Solutions | 2.5% | 3.2% | (63) bps | (64) bps | (47) bps | ||||||||
Agricultural Solutions | 2.2% | 2.1% | 2 bps | (2) bps | (2) bps | ||||||||
Total | 2.4% | 2.5% | (12) bps | (15) bps | (23) bps | ||||||||
Performance Solutions' R&D for 2016 increased by 77% (78% at constant currency and decreased by 12% on an organic basis). The organic decrease was driven by integration activities which have reduced research and innovation-related operating costs.
Agricultural Solutions' R&D for 2016 increased by 5% (5% at constant currency and decreased by 4% on an organic basis). The decrease was driven in part the phasing of studies in the segment's development pipeline.
Goodwill Impairment
Year Ended December 31, | |||||||
($ amounts in millions) | 2016 | 2015 | |||||
Goodwill impairment | $ | 46.6 | $ | — | |||
Based on the result of our annual goodwill impairment test, we recorded an impairment charge in the Performance Solutions segment of $46.6 million related to the Offshore Solutions reporting unit as a result of previously weak oil prices. We experienced the impact on our results, which slightly lagged the overall industry, as this ultimately caused the industry to depress its overall investments.
Operating Profit
Year ended December 31, | Change | ||||||||||||
($ amounts in millions) | 2016 | 2015 | Reported | Constant Currency | Organic | ||||||||
Operating profit | |||||||||||||
Performance Solutions | $ | 180.9 | $ | 119.9 | 51% | 55% | (50)% | ||||||
Agricultural Solutions | 173.4 | 78.6 | 120% | 121% | 134% | ||||||||
Corporate | (100.9 | ) | (126.9 | ) | (20)% | (20)% | (20)% | ||||||
Total | $ | 253.4 | $ | 71.6 | 253% | 260% | 77% | ||||||
Operating Margin | |||||||||||||
Performance Solutions | 10.2% | 15.0% | (475) bps | (460) bps | (967) bps | ||||||||
Agricultural Solutions | 9.5% | 4.5% | 504 bps | 486 bps | 486 bps | ||||||||
Total | 7.1% | 2.8% | 425 bps | 427 bps | 245 bps | ||||||||
Performance Solutions' operating profit for 2016 increased by 51% (55% at constant currency and decreased 50% on an organic basis), representing an operating margin of 10.2%. The decrease in organic operating profit was due primarily to the 2016 Offshore
55
Solutions goodwill impairment charge of $46.6 million, and higher STG&A expenses, partially offset by the aforementioned gross profit increases.
Agricultural Solutions' operating profit for the 2016 increased by 120% (121% at constant currency and 134% on an organic basis), representing an operating margin of 9.5%. The increase in operating profit was due in part to $58.0 million of inventory step-up amortization in 2015 which did not recur in 2016. Operating profit improvements were driven primarily by the increase in gross profits resulting from management's continued focus on sales of higher margin products.
Other (Expense) Income, net
Year Ended December 31, | |||||||
($ amounts in millions) | 2016 | 2015 | |||||
Interest expense, net | $ | (375.7 | ) | $ | (213.9 | ) | |
Foreign exchange loss | (14.1 | ) | (43.4 | ) | |||
Other income (expense), net | 88.3 | (43.6 | ) | ||||
Total | $ | (301.5 | ) | $ | (300.9 | ) | |
Interest Expense, Net
Net interest expense for 2016 totaled $376 million, as compared to $214 million for 2015, representing an increase of $162 million. The increase related primarily to interest charges resulting from incremental debt facilities used to fund the Alent Acquisition. The increase was also driven by a full quarter of interest expense in the first quarter of 2016 related to incremental debt facilities used to fund the Arysta Acquisition completed on February 13, 2015.
Foreign Exchange Loss
Foreign exchange losses for 2016 and 2015 totaled $14.1 million, and $43.4 million, respectively, representing a decrease of $29.3 million. The year-over-year change is due primarily to the remeasurement of foreign denominated debt to U.S. dollar and transactional foreign exchange on intercompany balances.
Other Income (Expense), Net
Other income, net for 2016 totaled $88.3 million, as compared to other expense, net of $43.6 million for 2015, representing an increase of $132 million. The increase was primarily driven by the recognition of a gain of $103 million from the settlement agreement with the Arysta Seller in 2016, which was partially offset by a $5.0 million loss associated with the remeasurement of the Series B Convertible Preferred Stock redemption liability and $11.3 million of expense related to the write-off of deferred financing fees and original issuance discount from the refinancing of our term loans in the fourth quarter of 2016. Additionally, during 2015 there was a $73.7 million loss associated with a deal-contingent forward contract settlement in 2015, which was partially offset by a legal settlement gain totaling $17.7 million.
Income Tax Expense
Year Ended December 31, | |||||||
($ amounts in millions) | 2016 | 2015 | |||||
Income tax expense | $ | (28.6 | ) | $ | (75.1 | ) | |
Effective tax rate | (59.5 | )% | (32.8 | )% | |||
The income tax expense for 2016 totaled $28.6 million, as compared to $75.1 million for 2015. Our effective tax rate for 2016 was (59.5)% on pre-tax losses of $48.1 million. The difference between the statutory and effective tax rates for 2016 primarily related to $68.4 million of tax expense for an increase in valuation allowances, $29.0 million on tax expense for earnings of foreign subsidiaries taxable in the U.S. and $26.8 million of tax expense for undistributed foreign earnings. Offsetting these items were $34.3 million of tax benefit related to the settlement gain of the Series B Convertible Preferred Stock, which was treated as a non-taxable purchase price adjustment, $24.5 million for the impact of transaction costs and a $24.1 million reduction in tax reserves for prior period positions based on a reassessment of the uncertainty. The difference between the statutory and effective tax rates
56
for 2015 primarily related to $72.6 million of tax expense for an increase in valuation allowances, non-deductible transaction-related costs of $40.5 million and $27.5 million of tax expense for an increase in tax reserves for tax uncertainties.
The change in the effective tax rate from (32.8)% for 2015 to (59.5)% for 2016 was attributable to the disproportionate change in pre-tax income, the net change in tax uncertainties, the net change in valuation allowances, the settlement gain of the Series B Convertible Preferred Stock and the expense attributable to undistributed foreign earnings.
Other Comprehensive (Loss) Income
Other comprehensive income for 2016 totaled $214 million, as compared to other comprehensive losses of $796 million in the prior year. The change was driven primarily by foreign currency translation gains associated with the Brazilian Real, British Pound, and Japanese Yen, partially offset by adverse effects associated with changes in the Mexican Peso and Chinese Yuan.
Adjusted EBITDA
Year Ended December 31, | Change | ||||||||||||
($ amounts in millions) | 2016 | 2015 | Reported | Constant Currency | Organic | ||||||||
Adjusted EBITDA: | |||||||||||||
Performance Solutions | $ | 401.3 | $ | 224.3 | 79% | 86% | 9% | ||||||
Agricultural Solutions | 368.2 | 343.4 | 7% | 7% | 6% | ||||||||
Total | $ | 769.5 | $ | 567.7 | 36% | 38% | 8% | ||||||
For 2016, corporate costs allocated to each segment totaled $32.8 million. For 2015, corporate allocations totaled $12.0 million for Performance Solutions and $36.0 million for Agricultural Solutions.
Performance Solutions' Adjusted EBITDA for 2016 increased by 79% (86% at constant currency and 9% on an organic basis). The organic increase was driven primarily by gross margin expansion resulting from lower raw material costs, some of which were achieved through synergies, as well as favorable product mix, partially offset by lower sales volume from Offshore Solutions.
Agricultural Solutions' Adjusted EBITDA for 2016 increased by 7% (7% at constant currency and 6% on an organic basis) due primarily to volume growth in Latin America and Europe, including higher relative growth in our higher margin BioSolutions products. The increase was also driven by favorable effects from improved procurement trends, product mix, the impact of our proprietary product portfolio, and growth in the certain niche markets. These increases were partially offset by lower demand in North America driven by weaker market conditions.
Liquidity and Capital Resources
At December 31, 2017, our indebtedness totaled $5.48 billion, primarily as a result of our historical acquisition activity, with expected interest payments in the range of approximately $275 million per year over the next two years. Our first significant principal debt payments, totaling $1.33 billion, are due in 2020 and represent principal payments at maturity associated with a portion of our outstanding term loans under our Amended and Restated Credit Agreement. Our primary sources of liquidity during 2017 were periodic borrowings under our Revolving Credit facility and available cash generated from operations. Our primary uses of cash and cash equivalents were to fund operations, working capital, capital expenditures, and debt service obligations. We believe that our cash and cash equivalents and cash generated from operations, supplemented by our availability under our lines of credit, including our Revolving Credit Facility, will be sufficient to meet our working capital needs, interest payments, capital expenditures, and other business requirements for at least the next twelve months. However, working capital cycles and future acquisitions may require future debt and/or equity offerings. Our long-term liquidity may be influenced by our ability to borrow additional funds, renegotiate existing debt and raise equity under terms that are favorable to us.
During 2017, approximately 83% of our revenue was generated from non-U.S. operations. We expect to continue to generate significant revenue from non-U.S. operations and expect a substantial portion of our cash to be held predominantly by our foreign subsidiaries. We expect to manage our worldwide cash requirements considering available funds among the many subsidiaries through which we conduct business and the cost effectiveness with which those funds can be accessed. We may transfer cash from certain international subsidiaries to the U.S. and other international subsidiaries when we believe it is cost effective to do so.
57
We continually review our domestic and foreign cash profile, expected future cash generation and investment opportunities, which support our current designation of a portion of these funds as being indefinitely reinvested and reassess whether there is a demonstrated need to repatriate funds held internationally. If, as a result of our review, it is determined that all or a portion of the funds require repatriation, we may be required to accrue additional foreign taxes. Of our $478 million of cash and cash equivalents at December 31, 2017, $431 million was held by our foreign subsidiaries. See Note 11, Income Taxes, to our Consolidated Financial Statements for further discussion of income taxes on remaining undistributed foreign earnings.
We may from time to time seek to retire or purchase our outstanding debt, including, but not limited to, our Senior Notes, through cash purchases and/or exchanges for equity securities, in open market purchases, privately negotiated transactions or otherwise. Such repurchases or exchanges, if any, will depend on prevailing market conditions, our liquidity requirements, contractual restrictions, applicable restrictions under our various financing arrangements, and other factors.
The following is a summary of our cash flows provided by (used in) operating, investing and financing activities during the periods indicated:
Year Ended December 31, | ||||||||||||
($ amounts in millions) | 2017 | 2016 | 2015 | |||||||||
Cash and cash equivalents, beginning of the period | $ | 422.6 | $ | 432.2 | $ | 397.3 | ||||||
Cash provided by operating activities | 182.1 | 184.8 | 320.9 | |||||||||
Cash used in investing activities | (92.6 | ) | (74.7 | ) | (4,256.5 | ) | ||||||
Cash (used in) provided by financing activities | (67.4 | ) | (102.2 | ) | 4,001.2 | |||||||
Exchange rate impact on cash and cash equivalents | 33.1 | (17.5 | ) | (30.7 | ) | |||||||
Cash and cash equivalents, end of the period | $ | 477.8 | $ | 422.6 | $ | 432.2 | ||||||
Year Ended December 31, 2017 compared to the Year Ended December 31, 2016
Operating Activities
For 2017, we generated cash flows from operating activities of $182 million, compared to $185 million in cash for 2016. Higher cash operating profits (net loss adjusted for non-cash items), which included $43.7 million of cash outflows related to a tender offer premium on our 2017 Notes Offerings, were partially offset by higher working capital requirements. The increase in working capital was due, in part, to the buildup of inventory in connection with Performance Solution's facility rationalization initiatives, as well as increases due to stronger fourth quarter sales in our Agricultural Solutions business in 2017, partially offset by the impact of a new factoring program in Europe.
Investing Activities
Net cash flows used in investing activities for 2017 totaled $92.6 million, compared to $74.7 million for 2016. The increase was driven primarily by capital expenditures related to our Performance Solutions' facility integration initiatives and Agricultural Solutions' investments in products registration rights, which, combined, increased by $7.2 million over 2016. The increase was also driven by higher restricted cash balances of $4.7 million.
Financing Activities
Net cash flows used in financing activities for 2017 totaled $67.4 million, compared to $102 million for 2016. The decrease was driven primarily by the settlement of our make-whole obligation in 2016 related to our Series B Convertible Preferred Stock with a cash payment of $460 million to the Series B Convertible Preferred Stockholders, offset, in part, by the September 2016 Equity Offering which raised net proceeds of $392 million. In addition, for 2017, net payments on our various lines of credit, short-term debt facilities and overdraft facilities totaled $58.8 million, as compared to net draws totaling $54.0 million in 2016. Our decreased on-balance sheet factoring activity increased financing cash flows year-over-year by $40.6 million, as did the net change in our long-term debt balance,which impacted financing cash flows by $59.8 million.
58
Year Ended December 31, 2016 Compared to Year Ended December 31, 2015
Operating Activities
For 2016, we generated cash flows from operating activities of $185 million, compared to $321 million in cash for 2015. This year-over-year change was driven primarily by higher cash operating profits (net loss adjusted for non-cash items), partially offset by an increased use of cash in working capital as well as higher interest and tax payments. The increase in working capital, largely due to accounts payable, was primarily due to the timing of the close of the Arysta Acquisition in February 2015 and the working capital seasonality in the Agricultural Solutions segment. Typically, the segment's working capital is a use of cash at the beginning of the year and a source of cash at the end of the year.
Investing Activities
Net cash flows used in investing activities for 2016 totaled $74.7 million, compared to $4.26 billion for 2015. During 2015, we used net cash of $4.60 billion to fund the Arysta, Alent and OMG Acquisitions. Additional acquisition-related activity during 2015 included a $600 million release of restricted cash, partially offset by a note in the amount of $125 million issued to an unrelated third-party and an unfavorable settlement of foreign exchange contracts for $73.7 million, which effectively increased the purchase price of Alent. There was no significant, comparable acquisition-related activity during 2016. Capital expenditures increased by approximately $8.4 million during 2016 compared to 2015, primarily in support of operational expansion, and there was a $2.0 million decline in investments in, and renewals of, product registrations.
Financing Activities
Net cash flows used in financing activities for 2016 totaled $102 million, compared to $4.00 billion of cash generated for 2015. The primary sources of cash from financing activity during 2016 were proceeds from Amendments No. 5 and 6 to our Amended and Restated Credit Agreement of $3.30 billion and the September 2016 Equity Offering of 48,787,878 shares of our common stock which raised net proceeds of $392 million. These proceeds were used for the refinancing of our term loans of $3.31 billion and for the settlement of our previously-disclosed make-whole obligation related to our Series B Convertible Preferred Stock with a cash payment of $460 million to the Series B Convertible Preferred Stock holders. The primary sources of cash from financing activity during 2015 were $3.92 billion from the extension of new term loans and the issuance of our Senior Notes, and $470 million as net proceeds from the June 2015 Equity Offering of 18,226,414 shares of our common stock, offset in part by $87.0 million of financing fees paid. These proceeds were used to fund our 2015 acquisition activity. Additionally, for 2016, we had net draws on our various lines of credit, short-term debt facilities, and overdraft facilities of $54.0 million, compared to net payments of $12.4 million in 2015.
Pension Plans
We maintain "Domestic Pension Plans," which consist of a non-contributory domestic defined benefit pension plan and a SERP plan. These plans are closed to new participants and plan benefits associated with all current participants have been frozen. We also maintain "Foreign Pension Plans," which consist retirement and death benefit plans covering employees in Taiwan and certain former employees in Germany, as well as longevity plans covering employees in France, which have been deemed immaterial, individually and in the aggregate.
The expected long-term rate of return on assets assumption is developed with reference to historical returns, forward-looking return expectations, the Domestic and Foreign Pension Plans' investment allocations, and peer comparisons. We used a long-term rate of return on plan assets of 5.9% and 2.3% for our Domestic and Foreign Pension Plans, respectively to determine our net periodic pension expense for 2017. The discount rate used to value the pension obligation was developed with reference to a number of factors, including the current interest rate environment, benchmark fixed-income yields, peer comparisons, and expected future pension benefit payments. Discount rates of 3.7% and 3.0% were established for the Domestic Pension Plan and Foreign Pension Plans, respectively, at December 31, 2017, compared to rates of 4.2% and 2.3% established for those respective plans at December 31, 2016. We evaluate the Pension Plans' actuarial assumptions on an annual basis, including the expected long-term rate of return on assets and discount rates. A one percent increase in the discount rate would increase (decrease) the pension plan expense and pension benefit obligation by approximately $0.9 million and $(28.3) million, respectively, whereas a one percent decrease in the discount rate would (decrease) increase the pension plan expense and pension benefit obligation by approximately $(0.4) million and $34.5 million, respectively.
Our Domestic Pension Plans' investment policies incorporate an asset allocation strategy that emphasizes long-term growth of capital and acceptable asset volatility as long as such volatility remains consistent with the volatility of the indexes of relevant
59
markets. Our investment policies attempt to achieve a mix of approximately 50% of plan investments for long-term growth, 49% for liability-matching assets and 1% for near-term benefit payments. The weighted average asset allocation of the Domestic Pension Plans was 49% fixed income mutual fund holdings, 27% equity securities, 19% limited partnership interests and managed equity funds, 4% collective investment funds and 1% cash at December 31, 2017.
The Domestic Pension Plans were underfunded by $26.6 million at December 31, 2017 compared to $36.9 million at December 31, 2016. The improved funding position of $10.3 million was primarily driven by a $29.8 million gain on plan assets and a $3.1 million employer contribution, partially offset by $13.8 million of actuarial loss due to plan experience and $8.8 million of interest costs.
The Foreign Pension Plans were underfunded by $21.2 million at December 31, 2017 compared to $18.0 million at December 31, 2016, representing a decrease in funding status of $3.2 million.
Contributions to the Pension Plans during 2018 are not expected to be material. While we do not currently anticipate any, additional future material contributions may be required in order to maintain appropriate funding levels within our plans.
Financial Borrowings
Credit Facilities
At December 31, 2017, we had $5.48 billion of indebtedness, which primarily included:
• | $2.28 billion of Senior Notes; |
• | $3.15 billion of term debt arrangements outstanding under our First Lien Credit Facility; and |
• | $28.5 million of borrowings under local and revolving lines of credit. |
Availability under our Revolving Credit Facility and various lines of credit and overdraft facilities totaled $606 million at December 31, 2017 (including $18.6 million of stand-by letters of credit which reduced the borrowings available under our Revolving Credit Facility).
Covenants
Our Credit Facilities contain various affirmative and negative covenants, including limitations on additional indebtedness, dividends and other distributions, entry into new lines of business, use of loan proceeds, capital expenditures, restricted payments, restrictions on liens, transactions with affiliates, amendments to organizational documents, accounting changes, sale and leaseback transactions, and dispositions. Our Revolving Credit Facility requires compliance with certain financial covenants, including a first lien net leverage ratio of no greater than 6.25 to 1.0, as defined in the Amended and Restated Credit Agreement. In addition, our Amended and Restated Credit Agreement requires a prepayment percentage in the case of excess cash flow, both calculated as set forth in the Amended and Restated Credit Agreement, of 75% with step-downs to 50%, 25% and 0% based on the applicable first lien net leverage ratio on the prepayment date. At December 31, 2017, we were in compliance with the debt covenants contained in our Credit Facilities.
60
Contractual Obligations and Commitments
We own most of our major manufacturing facilities, but we do lease certain offices, manufacturing factories, warehouse spaces and land, as well as other equipment primarily under non-cancelable operating leases.
Summarized in the table below are our obligations and commitments at December 31, 2017:
Payment Due by Period | ||||||||||||||||||||||||||||||
($ amounts in millions) | 2018 | 2019 | 2020 | 2021 | 2022 | Thereafter | Total | |||||||||||||||||||||||
Long-term debt | (1) | $ | — | $ | — | $ | 1,330.8 | $ | 1,854.4 | $ | 1,100.0 | $ | 1,219.9 | $ | 5,505.1 | |||||||||||||||
Operating leases | (2) | 33.0 | 25.0 | 19.6 | 13.9 | 12.1 | 28.9 | 132.5 | ||||||||||||||||||||||
Interest payments (net of interest rate swap effects) | (3) | 276.7 | 276.7 | 247.6 | 212.2 | 111.0 | 155.1 | 1,279.3 | ||||||||||||||||||||||
Long-term contingent consideration | (4) | — | — | — | 100.0 | — | — | 100.0 | ||||||||||||||||||||||
Principal payments on capital leases | 0.7 | 0.6 | 0.5 | 0.5 | 0.4 | 1.6 | 4.3 | |||||||||||||||||||||||
Purchase obligations | (5) | 72.2 | 1.1 | 0.2 | — | — | — | 73.5 | ||||||||||||||||||||||
Other long term obligations | (6) | 8.9 | 4.2 | — | — | — | 13.3 | 26.4 | ||||||||||||||||||||||
Total cash contractual obligations | $ | 391.5 | $ | 307.6 | $ | 1,598.7 | $ | 2,181.0 | $ | 1,223.5 | $ | 1,418.8 | $ | 7,121.1 | ||||||||||||||||
(1) | Reflects the principal payments on long-term debt. In the event the Company is able to prepay, redeem or otherwise retire and/or refinance in full its $1.1 billion, 6.50% USD Notes due 2022, as permitted under the Amended and Restated Credit Agreement, on or prior to November 2, 2021, the maturity date of approximately $1.85 billion of first lien debt will be extended to June 7, 2023 from November 2, 2021, as currently presented in the table above. |
(2) | Reflects periodic payments made in accordance with operating lease agreements. |
(3) | Amounts are based on currently applicable interest rates in the case of variable interest rate debt and associated floating and floor legs of the interest rate swaps. |
(4) | Reflects the maximum payout in 2021 of 100% of long-term contingent consideration related to the MacDermid Acquisition. At December 31, 2017, the long-term contingent consideration related to the MacDermid Acquisition was valued at $79.2 million. See Note 13, Financial Instruments, to the Consolidated Financial Statements included in this 2017 Annual Report for additional information. |
(5) | Purchase obligations represent amounts committed under legally enforceable supply agreements and non-cancelable purchase contracts. We do not include purchase obligations that can be canceled with a nominal fee. |
(6) | Other long-term obligations consist of asset retirement obligations, or AROs. |
Benefit payments related to our defined benefit plans are included in Note 10, Pension, Post-Retirement and Post Employment Plans, to the Consolidated Financial Statements included in this 2017 Annual Report, and are excluded from the table above.
To the extent we can reliably determine when payments will occur pertaining to our $90.3 million unrecognized tax benefit liabilities and $28.3 million environmental liability, the related amounts will be included in the table above. However, due to the high degree of uncertainty regarding the timing of potential future cash flows associated with such liabilities at December 31, 2017, we are unable to make a reliable estimate as to the timing of such payments, and are therefore excluded from the table above.
Off-Balance Sheet Transactions
We use customary off-balance sheet arrangements, such as letters of credit, non-recourse factoring arrangements, and operating leases to finance our business. For additional information regarding letters of credit and non-recourse factoring arrangements, see Note 12, Debt, Factoring and Customer Financing Arrangements, to the Consolidated Financial Statements included in this 2017 Annual Report, under the headings "Lines of Credit and Other Debt Facilities" and "Accounts Receivable Factoring Arrangements." For additional information regarding operating leases, see Note 17, Operating Lease Commitments, to the Consolidated Financial Statements included in this 2017 Annual Report. As a result of ASU No. 2016-02, “Leases,” for fiscal years and interim periods beginning in 2019, we will be required to record lease liabilities and right-of-use assets for all of our qualifying operating leases that are currently treated as off-balance sheet transactions.
There are no other arrangements that have, or are reasonably likely to have, a current or future material effect on our financial condition, changes in financial condition, revenues or expenses, results of operations, liquidity, capital expenditures or capital resources.
61
Item 7A. Quantitative and Qualitative Disclosures about Market Risk
Foreign Currency Risk
We conduct a significant portion of our business in currencies other than the U.S. dollar, our financial reporting currency. In 2017, approximately 83% of our net sales were generated outside of the United States. Generally, our foreign subsidiaries use their local currency as their functional currency; the currency in which they incur operating expenses and collect accounts receivable. Our business is exposed to foreign currency risk from changes in the exchange rate primarily between the U.S. dollar and the following currencies: euro, Brazilian Real, Chinese Yuan, British Pound Sterling, and Japanese Yen. As a result, our operating results could be affected by foreign currency exchange rate volatility relative to the U.S. dollar. We are not able to project, in any meaningful way, the possible effect of these foreign currency fluctuations on translated amounts or future earnings.
We actively assess our foreign exchange risk exposure and may enter into foreign exchange hedges to mitigate such risk and protect ourselves against transaction exposures. Our hedging programs include strategies to hedge our foreign currency denominated balance sheet exposures as well as foreign currency anticipated cash flows. At December 31, 2017, the aggregate U.S. dollar notional amount of foreign currency forward contracts, none of which were designated as hedges for accounting purposes, totaled $615 million. The market value of the foreign currency forward contracts at December 31, 2017 was a $1.3 million current liability, and net realized and unrealized losses on such contracts for 2017 totaled $9.4 million.
Our policies prohibit us from speculating in financial instruments for profit on exchange rate price fluctuations, from trading in currencies for which there are no underlying exposures, and from entering into trades for any currency to intentionally increase the underlying exposure.
Interest Rate Risk
We are exposed to interest rate risk associated with our cash and cash equivalents, long-term debt, and other financing commitments. At December 31, 2017, we had cash and cash equivalents of $478 million and total debt of $5.48 billion, including approximately $3.18 billion of variable interest rate debt based on either the one-month LIBOR or the one-month EURIBOR. In August 2015, we entered into a series of pay-fixed, receive-floating interest rate swaps with respect to a portion of our indebtedness. The swaps effectively fix the floating rate portion of the interest payments on approximately $1.14 billion of our USD denominated debt and €279 million of our euro denominated debt at 1.96% and 1.20%, respectively, through June 2020. Our remaining $1.71 billion of variable interest rate debt continues to be subject to interest rate risk, as interest payments fluctuate with market changes in the underlying interest rates. A 100 basis point increase in the one-month LIBOR and one-month EURIBOR would result in a higher interest expense of approximately $6.4 million annually with respect to our remaining variable interest rate debt.
Counterparty Risk
Outstanding financial derivative instruments expose us to credit loss in the event of non-performance by our counterparties. The credit exposure related to these financial instruments is considered in the fair values of such contracts. We review the credit ratings of our counterparties and adjust our exposure as deemed appropriate on a periodic basis. At December 31, 2017, we believe that our exposure to counterparty risk was immaterial.
Commodity Price Risk
Some raw materials and supplies are subject to price and supply fluctuations caused by market dynamics. Our strategic sourcing initiatives are focused on mitigating the impact of commodity price risk. Although some of our commercial agreements allow us to pass on certain unusual increases in component and raw material costs to our customers in limited situations, we may not be fully compensated for such increased costs. To a lesser extent, we are also exposed to fluctuations in the prices of certain utilities and services, such as electricity, natural gas, and freight.
Periodically, we may employ forward metals contracts or other financial instruments to hedge commodity price or other price risks. Such contracts are generally designated as normal purchases and accounted for similar to other inventory purchases. We continue to review a full range of business options focused on strategic risk management for all raw material commodities. Any failure by our suppliers to provide acceptable raw materials or supplies could adversely affect our production schedules and contract profitability. We assess qualification of suppliers and continually monitor them to control risk associated with such supply base reliance. At December 31, 2017, the aggregate U.S. dollar notional amount of metals futures contracts to purchase and sell, none of which were designated as hedges for accounting purposes, totaled $41.5 million, which includes embedded derivatives associated with supply agreements. Net realized and unrealized losses on such contracts for 2017 totaled $2.5 million.
62
Item 8. Financial Statements and Supplementary Data
See “Index to Consolidated Financial Statements” in this 2017 Annual Report.
Item 9. Changes in and Disagreements with Accountants on Accounting and Financial Disclosure
None.
Item 9A. Controls and Procedures
Evaluation of Disclosure Controls and Procedures
As required by Rule 13a-15 under the Exchange Act, management carried out an evaluation, under the supervision and with the participation of our CEO and CFO, of the effectiveness of the design and operation of our disclosure controls and procedures (as such term is defined in Rules 13a-15(e) and 15d-15(e) under the Exchange Act) at December 31, 2017. Based on this evaluation, our CEO and CFO have concluded that our disclosure controls and procedures were not effective at December 31, 2017 due to the previously-reported material weakness in our internal control over financial reporting relating to the accounting for income taxes, as described below.
In light of this material weakness, prior to the filing of this 2017 Annual Report, management performed additional substantive and analytical procedures, including validating the completeness and accuracy of the underlying data used to support the amounts reported in our financial statements. These activities and other substantive and analytical procedures have allowed us to conclude that, notwithstanding the material weakness described below, the Consolidated Financial Statements included in this 2017 Annual Report fairly present, in all material respects, our financial position, results of operations, and cash flows for the periods presented in conformity with GAAP. Based in part on these additional efforts, our CEO and CFO have included their Sarbanes-Oxley Act of 2002 Sections 302 and 906 certifications as exhibits to this 2017 Annual Report.
Management’s Report on Internal Control Over Financial Reporting
Our management is responsible for establishing and maintaining adequate internal control over financial reporting (as defined in Rules 13a-15(f) and 15d-15(f) under the Exchange Act). Our internal control over financial reporting is designed to provide reasonable assurance regarding the reliability of financial reporting and the preparation of financial statements for external purposes in accordance with GAAP. Our internal control over financial reporting includes those policies and procedures that:
• | pertain to the maintenance of records that in reasonable detail accurately and fairly reflect the transactions and dispositions of our assets; |
• | provide reasonable assurance that transactions are recorded as necessary to permit preparation of our financial statements in accordance with GAAP, and that receipts and expenditures are being made only in accordance with authorizations of our management and directors; and |
• | provide reasonable assurance regarding prevention or timely detection of unauthorized acquisition, use or disposition of our assets that could have a material effect on our financial statements. |
Because of its inherent limitations, internal control over financial reporting may not prevent or detect misstatements. Also, projections of any evaluation of effectiveness to future periods are subject to the risk that controls may become inadequate because of changes in conditions, or that the degree of compliance with the policies or procedures may deteriorate. As required by Rule 13a-15 under the Exchange Act, management assessed the effectiveness of our internal control over financial reporting at December 31, 2017. In making this assessment, management used the criteria set forth in the Internal Control - Integrated Framework (2013) issued by the Committee of Sponsoring Organizations of the Treadway Commission (COSO).
A material weakness is defined as a deficiency, or combination of deficiencies, in internal control over financial reporting, such that there is a reasonable possibility that a material misstatement of our annual or interim financial statements will not be prevented or detected on a timely basis. In connection with the preparation of this 2017 Annual Report, management concluded that we did not design and maintain effective controls over completeness, existence and accuracy related to the accounting for income taxes.
This material weakness resulted in the restatement of the unaudited interim financial statements previously issued in our quarterly report on Form 10-Q for the periods ended March 31, 2015 and September 30, 2015. The material weakness described above
63
could result in material misstatements of our annual or interim consolidated financial statements that would not be prevented or detected.
As a result of this material weakness, management concluded that, at December 31, 2017, our internal control over financial reporting was not effective as it relates to the accounting for income taxes. The effectiveness of our internal control over financial reporting at December 31, 2017 has been audited by PricewaterhouseCoopers LLP, as stated in their report, which appears in this 2017 Annual Report.
Remediation of Previously-Reported Material Weaknesses
We have completed the documentation and testing of the corrective actions described below and, at December 31, 2017, have concluded that the remediation activities completed are sufficient to allow us to conclude that the previously-reported material weakness related to complement of personnel, accounting for acquired businesses and Agricultural Solutions close process have been remediated.
Complement of Personnel
We have remediated this previously-reported material weakness associated with maintaining a sufficient complement of personnel with an appropriate level of accounting knowledge, experience and training commensurate with our financial reporting requirements by adding further qualified resources to our corporate and segment staff and enhancing the controllership function in our newly-acquired businesses.
Accounting for Acquired Businesses
We have remediated this previously-reported material weakness related to the accounting for acquired businesses, and specifically to the design and maintenance of effective controls to evaluate the reliability of information and assumptions used in purchase accounting and in the goodwill, indefinite-lived intangible asset, and long-lived asset impairment analysis by:
• | implementing a global consolidation and planning system; |
• | implementing control processes relating to newly-acquired businesses and non-routine transactions; |
• | implementing enhanced monitoring controls relating to the financial reporting and performance of our newly-acquired businesses; and |
• | enhancing our financial planning and analysis function within our businesses and at the corporate level. |
Agricultural Solutions Close Process
We have remediated this previously-reported material weakness associated with maintaining effective controls over the financial close process for the Agricultural Solutions segment by designing and maintaining effective business performance review controls to assess the completeness and accuracy of financial reporting within the Agricultural Solutions segment and the timely and complete reconciliation of accounts for the CAS and Agriphar businesses.
Management's Remediation Initiatives of the Remaining Material Weakness
Over the course of the 2017 fiscal year, we continued to take substantial measures to remediate our material weakness related to the accounting for income taxes. We have added significant resources with an appropriate level of accounting knowledge, experience and training in the application of GAAP. We plan to continue our ongoing remediation efforts in order to improve, design and implement integrated processes to enhance our internal control over the accounting for income taxes by:
• | improving the overall tax provision process; and |
• | enhancing our income tax controls to include specific activities to assess the accounting for significant complex transactions and other tax related judgments. |
While we believe that significant progress has been made, additional time is necessary to fully implement and demonstrate the effectiveness of these remediation initiatives and until remediated, the material weakness described above could result in material misstatements of our annual or interim consolidated financial statements that would not be prevented or detected. We are committed to operating effective controls, and management continues to regularly assess the progress and sufficiency of the ongoing initiatives and make adjustments as and when necessary. Our remediation efforts are also subject to ongoing Audit Committee oversight. Our goal is to remediate this material weakness concurrently with the filing of our annual report on Form 10-K for the year ended December 31, 2018.
64
Changes to Internal Control Over Financial Reporting
As required by Rule 13a-15(d) under the Exchange Act, our management, including our CEO and CFO, has evaluated the Company’s internal control over financial reporting to determine whether any changes occurred during the quarter covered by this 2017 Annual Report have materially affected, or are reasonably likely to materially affect, our internal control over financial reporting.
There have been no significant changes in our internal control over financial reporting during the quarter ended December 31, 2017 that have materially affected, or are reasonably likely to materially affect, our internal control over financial reporting.
Item 9B. Other Information
Item 1.01. Entry into a Material Definitive Agreement.
On February 26, 2018, Platform entered into amended change in control agreements with each of its executive officers and other officers who were party to existing change in control agreements, namely Rakesh Sachdev, John P. Connolly, John E. Capps, Benjamin Gliklich, J. David Tolbert, Scot R. Benson and Diego Lopez Casanello. The amendments to the existing change in control agreements were made to correct drafting and typographical errors found in these existing change in control agreements, a form of which was previously filed with the SEC. A form of the amended change in control agreements is attached as Exhibit 10.22 to this 2017 Annual Report, and is incorporated herein by reference.
65
Part III
Item 10. Directors, Executive Officers and Corporate Governance
Codes of Ethics
We maintain a Business Conduct and Ethics Policy applicable to all directors and employees of Platform and its subsidiaries. The Policy is located on our website at www.platformspecialtyproducts.com under “Investor Relations – Corporate Governance.” We intend to provide disclosure of any amendment to or waiver of our Business Conduct and Ethics Policy on our website within four business days following the date of such amendment or waiver.
We also maintain a Code of Ethics for Senior Financial Officers applicable to our CEO and CFO. The Code of Ethics is located on our website at www.platformspecialtyproducts.com under “Investor Relations – Corporate Governance.” We intend to provide disclosure of any amendment to or waiver of our Code of Ethics for Senior Financial Officers on our website within four business days following the date of such amendment or waiver.
Section 16(a) Beneficial Ownership Reporting Compliance
Section 16(a) of the Exchange Act requires our directors and executive officers and any persons who own more than 10% of our capital stock to file with the SEC and the NYSE various reports as to ownership of such capital stock.
Based solely upon reports and representations submitted by these persons, we believe that all Forms 3, 4 and 5 showing ownership of, and changes of ownership in, our capital stock during the 2017 fiscal year were appropriately filed with the SEC and the NYSE, except for Scot R. Benson's Form 3 filed on April 8, 2016 which was timely filed but, due to a clerical error, reported an incorrect number of performance RSUs beneficially held by Mr. Benson. A Form 5 was filed with the SEC on February 9, 2018 to correct this clerical error. The correct number of performance RSUs beneficially owned by Mr. Benson was, however, reported in Platform's proxy statement filed with the SEC on April 15, 2016.
The remaining information required by Item 10, including information regarding executive officers, directors, membership and function of the audit committee of the Board and the financial expertise of its members, appearing under the headings "Executive Officers of the Company" and "Proposal 1 - Election of Directors" in the 2018 Proxy Statement is incorporated by reference in this section. The information under the heading "Corporate Governance" in the 2018 Proxy Statement is also incorporated by reference in this section. Platform intends to file the 2018 Proxy Statement with the SEC no later than 120 days after December 31, 2017.
Item 11. Executive Compensation
The information required by Item 11 appearing in the 2018 Proxy Statement under the headings "Director Compensation," "Compensation Discussion and Analysis," "Report of the Compensation Committee," and "Executive Compensation Tables" is incorporated by reference in this section. Platform intends to file the 2018 Proxy Statement with the SEC no later than 120 days after December 31, 2017.
Item 12. Security Ownership of Certain Beneficial Owners and Management and Related Stockholder Matters
The information required by Item 12 appearing under the headings "Security Ownership" and "Executive Compensation Tables - Equity Compensation Plan Information" in the 2018 Proxy Statement is incorporated herein by reference. Platform intends to file the 2018 Proxy Statement with the SEC no later than 120 days after December 31, 2017.
Item 13. Certain Relationships and Related Transactions, and Director Independence
The information appearing in the 2018 Proxy Statement under the headings "Corporate Governance" and "Certain Relationships and Related Transactions" is incorporated by reference in this section. Platform intends to file the 2018 Proxy Statement with the SEC no later than 120 days after December 31, 2017.
66
Item 14. Principal Accounting Fees and Services
The information appearing in the 2018 Proxy Statement under the headings "Report of the Audit Committee" and "Proposal 3 - Ratification of Independent Registered Public Accounting Firm for 2018" is incorporated by reference in this section. Platform intends to file the 2018 Proxy Statement with the SEC no later than 120 days after December 31, 2017.
67
Part IV
Item 15. Exhibits, Financial Statement Schedules
(A) Exhibits
Incorporated by Reference | Included in this 2017 Annual Report | |||||||||||
Exhibit Nb. | Exhibit Description | Form | File Nb. | Exhibit Nb. | Filing Date | |||||||
2.1 | Settlement Agreement and Release, dated September 9, 2016, among Platform and MacDermid Agricultural Solutions, Inc. and Permira Advisers LLC, Nalozo S.à.r.l., and Nalozo L.P. | 8-K | 001-36272 | 2.1 | 9/12/2016 | |||||||
3.1 (a) | S-4 POS | 333-192778 | 3.1 | 1/24/2014 | ||||||||
3.1 (b) | 8-K | 001-36272 | 3.1 | 6/13/2014 | ||||||||
3.2 | 10-K | 001-36272 | 3.2 | 3/31/2014 | ||||||||
4.1 | S-4/A | 333-192778 | 4.1 | 1/2/2014 | ||||||||
4.2 | Indenture, dated as of February 2, 2015, among Escrow Issuer, the Trustee and the EUR Agent | 8-K | 001-36272 | 4.1 | 2/3/2015 | |||||||
4.3 | Supplemental Indenture, dated as of February 13, 2015, among Platform, the Initial Guarantors, the Trustee and the EUR Agent | 8-K | 001-36272 | 4.2 | 2/17/2015 | |||||||
4.4 | Second Supplemental Indenture, dated as of May 20, 2015, among Platform, the Subsequent Guarantors, the other Guarantors, the Trustee, and the EUR Agent | 10-K | 001-36272 | 4.4 | 3/11/2016 | |||||||
4.5 | Third Supplemental Indenture, dated as of January 26, 2016, among Platform, the Subsequent Guarantors, the Trustee, and the EUR Agent | 10-K | 001-36272 | 4.5 | 3/11/2016 | |||||||
4.6 | Fourth Supplemental Indenture, dated as of April 13, 2016, among Platform, the Subsequent Guarantors, the Trustee and the EUR Agent | 10-Q | 001-36272 | 4.1 | 8/9/2016 | |||||||
4.7 | 8-K | 001-36272 | A-1 to 4.1 | 2/3/2015 | ||||||||
4.8 | 8-K | 001-36272 | A-2 to 4.1 | 2/3/2015 | ||||||||
4.9 | Indenture, dated as of November 10, 2015, among PSPC Escrow II Corp. and the Trustee | 8-K | 001-36272 | 4.1 | 11/12/2015 | |||||||
4.10 | Supplemental Indenture, dated as of December 1, 2015, among Platform, the Initial Guarantors and the Trustee | 8-K | 001-36272 | 4.2 | 12/4/2015 | |||||||
4.11 | Second Supplemental Indenture, dated as of January 26, 2016, among Platform, the Subsequent Guarantors, and the Trustee | 10-K | 001-36272 | 4.10 | 3/11/2016 | |||||||
4.12 | Third Supplemental Indenture, dated as of April 13, 2016, among Platform, the Subsequent Guarantors and the Trustee | 10-Q | 001-36272 | 4.2 | 8/9/2016 | |||||||
68
Incorporated by Reference | Included in this 2017 Annual Report | |||||||||||
Exhibit Nb. | Exhibit Description | Form | File Nb. | Exhibit Nb. | Filing Date | |||||||
4.13 | Form of 10.375% senior notes due 2021 (Exhibit A) | 8-K | 001-36272 | A to 4.1 | 11/12/2015 | |||||||
4.14 | Indenture, dated as of November 24, 2017, among Platform, the guarantors named therein and the Trustee | 8-K | 001-36272 | 4.1 | 11/27/2017 | |||||||
4.15 | Form of 5.875% senior notes due 2025 (Exhibit A) | 8-K | 001-36272 | A to 4.01 | 11/27/2017 | |||||||
†10.1 | Employment Agreement, dated as of December 15, 2015, between Platform and Rakesh Sachdev (effective January 5, 2016) | 8-K | 001-36272 | 10.1 | 12/16/2015 | |||||||
†10.2 | Time and Performance-Based Restricted Stock Unit Award Agreement by and between Platform and Rakesh Sachdev (effective January 5, 2016) | 8-K | 001-36272 | 10.2 | 12/16/2015 | |||||||
†10.3 | 10-Q | 001-36272 | 10.6 | 5/9/2017 | ||||||||
10.4 | MacDermid, Incorporated Employees’ Pension Plan (as amended and restated generally effective January 1, 2009) | S-4 | 333-192778 | 10.6 | 12/11/2013 | |||||||
10.5 | Second Amendment to MacDermid, Incorporated Employees’ Pension Plan, 2009 Restatement (effective as of January 1, 2009) | S-4/A | 333-192778 | 10.8 | 1/2/2014 | |||||||
10.6 | Third Amendment to Amended and Restated MacDermid, Incorporated Employees’ Pension Plan (effective as of January 1, 2009) | S-4/A | 333-192778 | 10.21 | 1/2/2014 | |||||||
10.7 | MacDermid, Incorporated Supplemental Executive Retirement Plan, effective April 1, 1994, as amended on February 25, 2005, and as further amended on July 11, 2013 | S-4/A | 333-192778 | 10.7 | 1/2/2014 | |||||||
10.8 | Amendment No. 1, dated as of December 13, 2013, to MacDermid, Incorporated Supplemental Executive Retirement Plan (as Previously Amended and Restated) | S-4/A | 333-192778 | 10.9 | 1/2/2014 | |||||||
†10.9 | Platform Specialty Products Corporation Employee Savings and 401(k) Plan, effective as of January 1, 2014 | S-8 | 333-205340 | 4.2(a) | 6/29/2015 | |||||||
†10.10 | Amendment No. 2 to Platform Specialty Products Corporation Employee Savings and 401(k) Plan, dated as of September 8, 2014 | S-8 | 333-205340 | 4.2(b) | 6/29/2015 | |||||||
†10.11 | Amendment No. 3 to Platform Specialty Products Corporation Employee Savings and 401(k) Plan, dated as of November 17, 2014 | S-8 | 333-205340 | 4.2(c) | 6/29/2015 | |||||||
†10.12 | Amendment No. 4 to Platform Specialty Products Corporation Employee Savings and 401(k) Plan, dated as of February 10, 2015 | S-8 | 333-205340 | 4.2(d) | 6/29/2015 | |||||||
†10.13 | Amendment No.5 to Platform Specialty Products Corporation Employee Savings and 401(k) Plan, dated October 31, 2105 | 10-Q | 001-36272 | 10.1 | 8/9/2016 | |||||||
69
Incorporated by Reference | Included in this 2017 Annual Report | |||||||||||
Exhibit Nb. | Exhibit Description | Form | File Nb. | Exhibit Nb. | Filing Date | |||||||
†10.14 | 10-Q | 001-36272 | 10.2 | 8/9/2016 | ||||||||
†10.15 | Platform Specialty Products Corporation Amended and Restated 2013 Incentive Compensation Plan (Appendix A) (effective as of November 1, 2013) | DEF14A | 001-36272 | Appendix A | 4/25/2014 | |||||||
†10.16 | Platform Specialty Products Corporation 2014 Employee Stock Purchase Plan (Appendix B) (effective as of March 6, 2014) | DEF14A | 001-36272 | Appendix B | 4/25/2014 | |||||||
†10.17 | Form of Restricted Stock Unit Agreement – Platform Specialty Products Corporation Amended and Restated 2013 Incentive Compensation Plan | S-4 | 333-192778 | 10.11 | 1/2/2014 | |||||||
†10.18 | Form of Performance-Based Restricted Stock Unit Award Agreement – Platform Specialty Products Corporation Amended and Restated 2013 Incentive Compensation Plan | 8-K | 001-36272 | 10.2 | 3/25/2016 | |||||||
†10.19 | Form of Non-Qualified Stock Option Agreement – Platform Specialty Products Corporation Amended and Restated 2013 Incentive Compensation Plan | 8-K | 001-36272 | 10.3 | 3/25/2016 | |||||||
10.20 | Form of Long Term Cash Bonus Award Agreement – Platform Specialty Products Corporation Amended and Restated 2013 Incentive Compensation Plan | 10-K | 001-36272 | 10.24 | 3/11/2016 | |||||||
†10.21 | S-4/A | 333-192778 | 10.12 | 1/2/2014 | ||||||||
†10.22 | X | |||||||||||
10.23 | Amended and Restated Credit Agreement, dated as of October 31, 2013, among, inter alia, Platform Acquisition Holding Limited, MacDermid Holdings, LLC, Matrix Acquisition Corp., MacDermid, Incorporated (as successor to Matrix Acquisition Corp., the borrower), the subsidiaries of the borrower from time to time parties thereto, the lenders from time to time parties thereto and Credit Suisse AG, as administrative agent and as collateral agent | S-4/A | 333-192778 | 10.13 | 1/2/2014 | |||||||
10.24 | Second Amended and Restated Credit Agreement, dated as of August 6, 2014, among, inter alia, the Company, MacDermid Holdings, LLC, MacDermid, Incorporated, the subsidiaries of the borrower from time to time parties thereto, the lenders from time to time parties thereto and Barclays Bank PLC, as administrative agent and collateral agent | 8-K | 001-36272 | 10.1 | 8/8/2014 | |||||||
70
Incorporated by Reference | Included in this 2017 Annual Report | |||||||||||
Exhibit Nb. | Exhibit Description | Form | File Nb. | Exhibit Nb. | Filing Date | |||||||
10.25 | Amendment No. 2, dated as of August 6, 2014, among, inter alia, the Company, MacDermid Holdings, LLC, MacDermid, Incorporated, the subsidiaries of the borrower from time to time parties thereto, the lenders from time to time parties thereto, and Barclays Bank PLC, as administrative agent and collateral agent | 8-K | 001-36272 | 10.2 | 8/8/2014 | |||||||
10.26 | Incremental Amendment No. 1, dated as of October 1, 2014, among the Company, MacDermid, Incorporated, MacDermid Holdings, LLC, certain subsidiaries of MacDermid Holdings, LLC and Platform party thereto, Barclays Bank PLC, as collateral agent and administrative agent, and the lenders party thereto | 8-K | 001-36272 | 10.1 | 10/1/2014 | |||||||
10.27 | Amendment No.3, dated February 13, 2015, among, inter alia, Platform, Holdings, MacDermid, the subsidiaries of the borrower from time to time parties thereto, the lenders from time to time parties thereto, and Barclays Bank PLC, as administrative agent and collateral agent | 8-K | 001-36272 | 10.1 | 2/17/2015 | |||||||
10.28 | Amendment No. 4, dated December 3, 2015, among, inter alia, Platform, MacDermid, the subsidiaries of the borrowers from time to time parties thereto, the lenders from time to time parties thereto, and Barclays Bank PLC, as administrative agent and collateral agent | 8-K | 001-36272 | 10.3 | 12/4/2015 | |||||||
10.29 | Amendment No. 5, dated October 14, 2016, among, inter alios, Platform, MacDermid, the subsidiaries of the borrowers from time to time parties thereto, the lenders from time to time parties thereto, and Barclays Bank PLC, as administrative agent and collateral agent | 8-K | 001-36272 | 10.1 | 10/17/2016 | |||||||
10.30 | Amendment No. 6, dated December 6, 2016, among, inter alios, Platform, MacDermid, the subsidiaries of the borrowers from time to time parties thereto, the lenders from time to time parties thereto, and Barclays Bank PLC, as administrative agent and collateral agent | 8-K | 001-36272 | 10.1 | 12/7/2016 | |||||||
10.31 | Amendment No. 7, dated April 18, 2017, among, inter alios, Platform, MacDermid, the subsidiaries of the borrowers from time to time parties thereto, the lenders from time to time parties thereto, and Barclays Bank PLC, as administrative agent and collateral agent | 8-K | 001-36272 | 10.1 | 4/18/2017 | |||||||
10.32 | Amendment No. 8, dated October 3, 2017, among, inter alios, Platform, MacDermid, the subsidiaries of the borrowers from time to time parties thereto, the lenders from time to time parties thereto, and Barclays Bank PLC, as administrative agent and collateral agent | 8-K | 001-36272 | 10.1 | 10/3/2017 | |||||||
71
Incorporated by Reference | Included in this 2017 Annual Report | |||||||||||
Exhibit Nb. | Exhibit Description | Form | File Nb. | Exhibit Nb. | Filing Date | |||||||
10.33 | Amended and Restated Pledge and Security Agreement, amended and restated as of October 31, 2013, among Platform, MacDermid Holdings, LLC, MacDermid, Incorporated and the subsidiaries of the borrowers from time to time parties thereto in favor of Barclays Bank PLC, as collateral agent | 10-K | 001-36272 | 10.25 | 3/31/2014 | |||||||
10.34 | S-4/A | 333-192778 | 10.14 | 1/2/2014 | ||||||||
10.35 | Advisory Services Agreement, dated October 31, 2013, by and between Platform Specialty Products Corporation and Mariposa Capital, LLC | S-4/A | 333-192778 | 10.15 | 1/2/2014 | |||||||
10.36 | Letter Agreement with respect to Supplemental Executive Retirement Plan payment, dated as of October 29, 2013, between Platform Acquisition Holdings Limited and Daniel H. Leever | S-4/A | 333-192778 | 10.16 | 1/2/2014 | |||||||
10.37 | S-4/A | 333-192778 | 10.17 | 1/2/2014 | ||||||||
10.38 | Registration Rights Agreement, dated as of May 20, 2014, between Platform Specialty, the placement agents thereto and the Investors stated therein | 8-K | 001-36272 | 10.1 | 5/21/2014 | |||||||
10.39 | 8-K | 001-36272 | 10.3 | 10/8/2014 | ||||||||
14.1 | 10-K | 001-36272 | 14.1 | 3/31/2014 | ||||||||
21.1 | X | |||||||||||
23.1 | X | |||||||||||
24.1 | X | |||||||||||
31.1 | X | |||||||||||
31.2 | X | |||||||||||
32.1* | X | |||||||||||
101.INS | XBRL Instance Document | X | ||||||||||
101.SCH | XBRL Taxonomy Extension Schema Document | X | ||||||||||
101.CAL | XBRL Extension Calculation Linkbase Document | X | ||||||||||
101.DEF | XBRL Taxonomy Extension Definition Linkbase Document | X | ||||||||||
101.LAB | XBRL Taxonomy Extension Label Linkbase Document | X | ||||||||||
101.PRE | XBRL Taxonomy Extension Presentation Linkbase Document | X | ||||||||||
72
* | Furnished herewith. | |
† | This Exhibit represents a management contract or a compensatory plan. | |
(B) Financial Statement Schedule
Schedule II — Valuation and Qualifying Accounts and Reserves
73
SIGNATURES
Pursuant to the requirements of Section 13 or 15(d) of the Securities Exchange Act of 1934, the Registrant has duly caused this report to be signed on its behalf by the undersigned, thereunto duly authorized.
PLATFORM SPECIALTY PRODUCTS CORPORATION | ||||||
By: | /s/ John P. Connolly | |||||
Name: John P. Connolly | ||||||
Title: Chief Financial Officer | ||||||
Date: | February 28, 2018 | |||||
Pursuant to the requirements of the Securities Exchange Act of 1934, this report has been signed below by the following persons on behalf of the registrant and in the capacities and on the dates indicated.
Signature | Title | Date | |
/s/ Rakesh Sachdev | Director and Chief Executive Officer | February 28, 2018 | |
Rakesh Sachdev | (Principal Executive Officer) | ||
/s/ John P. Connolly | Chief Financial Officer | February 28, 2018 | |
John P. Connolly | (Principal Financial and Accounting Officer) | ||
/s/ Martin E. Franklin | Chairman of the Board | February 28, 2018 | |
Martin E. Franklin | |||
/s/ Ian G.H. Ashken | Director | February 28, 2018 | |
Ian G.H. Ashken | |||
/s/ Nicolas Berggruen | Director | February 28, 2018 | |
Nicolas Berggruen | |||
/s/ Michael F. Goss | Director | February 28, 2018 | |
Michael F. Goss | |||
/s/ Ryan Israel | Director | February 28, 2018 | |
Ryan Israel | |||
/s / E. Stanley O’Neal | Director | February 28, 2018 | |
E. Stanley O’Neal | |||
74
Index to Consolidated Financial Statements
Page | ||
Consolidated Financial Statements: | ||
Years Ended December 31, 2017, 2016 and 2015 | ||
Years Ended December 31, 2017, 2016 and 2015 | ||
December 31, 2017 and 2016 | ||
Years Ended December 31, 2017, 2016 and 2015 | ||
Years Ended December 31, 2017, 2016 and 2015 | ||
Financial Statement Schedule: | ||
Years Ended December 31, 2017, 2016 and 2015 | ||
75
Report of Independent Registered Public Accounting Firm
To the Board of Directors and Stockholders of Platform Specialty Products Corporation
Opinions on the Financial Statements and Internal Control over Financial Reporting
We have audited the accompanying consolidated balance sheets of Platform Specialty Products Corporation and its subsidiaries as of December 31, 2017 and 2016, and the related consolidated statements of operations, comprehensive income (loss), changes in stockholders’ equity and cash flows for each of the three years in the period ended December 31, 2017, including the related notes and financial statement schedule listed in the accompanying index (collectively referred to as the “consolidated financial statements”). We also have audited the Company's internal control over financial reporting as of December 31, 2017, based on criteria established in Internal Control - Integrated Framework (2013) issued by the Committee of Sponsoring Organizations of the Treadway Commission (COSO).
In our opinion, the consolidated financial statements referred to above present fairly, in all material respects, the financial position of the Company as of December 31, 2017 and 2016, and the results of its operations and its cash flows for each of the three years in the period ended December 31, 2017 in conformity with accounting principles generally accepted in the United States of America. Also in our opinion, the Company did not maintain, in all material respects, effective internal control over financial reporting as of December 31, 2017, based on criteria established in Internal Control - Integrated Framework (2013) issued by the COSO because a material weakness in internal control over financial reporting existed as of that date, as the Company did not design and maintain effective controls over the completeness, existence and accuracy related to the accounting for income taxes.
A material weakness is a deficiency, or a combination of deficiencies, in internal control over financial reporting, such that there is a reasonable possibility that a material misstatement of the annual or interim financial statements will not be prevented or detected on a timely basis. The material weakness referred to above is described in Management’s Report on Internal Control Over Financial Reporting appearing under Item 9A. We considered this material weakness in determining the nature, timing, and extent of audit tests applied in our audit of the 2017 consolidated financial statements, and our opinion regarding the effectiveness of the Company’s internal control over financial reporting does not affect our opinion on those consolidated financial statements.
Basis for Opinions
The Company's management is responsible for these consolidated financial statements, for maintaining effective internal control over financial reporting, and for its assessment of the effectiveness of internal control over financial reporting included in management's report referred to above. Our responsibility is to express opinions on the Company’s consolidated financial statements and on the Company's internal control over financial reporting based on our audits. We are a public accounting firm registered with the Public Company Accounting Oversight Board (United States) ("PCAOB") and are required to be independent with respect to the Company in accordance with the U.S. federal securities laws and the applicable rules and regulations of the Securities and Exchange Commission and the PCAOB.
We conducted our audits in accordance with the standards of the PCAOB. Those standards require that we plan and perform the audits to obtain reasonable assurance about whether the consolidated financial statements are free of material misstatement, whether due to error or fraud, and whether effective internal control over financial reporting was maintained in all material respects.
Our audits of the consolidated financial statements included performing procedures to assess the risks of material misstatement of the consolidated financial statements, whether due to error or fraud, and performing procedures that respond to those risks. Such procedures included examining, on a test basis, evidence regarding the amounts and disclosures in the consolidated financial statements. Our audits also included evaluating the accounting principles used and significant estimates made by management, as well as evaluating the overall presentation of the consolidated financial statements. Our audit of internal control over financial reporting included obtaining an understanding of internal control over financial reporting, assessing the risk that a material weakness exists, and testing and evaluating the design and operating effectiveness of internal control based on the assessed risk. Our audits also included performing such other procedures as we considered necessary in the circumstances. We believe that our audits provide a reasonable basis for our opinions.
Definition and Limitations of Internal Control over Financial Reporting
A company’s internal control over financial reporting is a process designed to provide reasonable assurance regarding the reliability of financial reporting and the preparation of financial statements for external purposes in accordance with generally accepted accounting principles. A company’s internal control over financial reporting includes those policies and procedures that (i) pertain to the maintenance of records that, in reasonable detail, accurately and fairly reflect the transactions and dispositions of the assets
F-1
of the company; (ii) provide reasonable assurance that transactions are recorded as necessary to permit preparation of financial statements in accordance with generally accepted accounting principles, and that receipts and expenditures of the company are being made only in accordance with authorizations of management and directors of the company; and (iii) provide reasonable assurance regarding prevention or timely detection of unauthorized acquisition, use, or disposition of the company’s assets that could have a material effect on the financial statements.
Because of its inherent limitations, internal control over financial reporting may not prevent or detect misstatements. Also, projections of any evaluation of effectiveness to future periods are subject to the risk that controls may become inadequate because of changes in conditions, or that the degree of compliance with the policies or procedures may deteriorate.
/s/ PricewaterhouseCoopers LLP
New York, New York
February 28, 2018
We have served as the Company’s auditor since 2013.
F-2
PLATFORM SPECIALTY PRODUCTS CORPORATION AND SUBSIDIARIES
CONSOLIDATED STATEMENTS OF OPERATIONS
(In millions, except per share amounts)
Year Ended December 31, | ||||||||||||
2017 | 2016 | 2015 | ||||||||||
Net sales | $ | 3,775.9 | $ | 3,585.9 | $ | 2,542.3 | ||||||
Cost of sales | 2,186.9 | 2,078.2 | 1,550.4 | |||||||||
Gross profit | 1,589.0 | 1,507.7 | 991.9 | |||||||||
Operating expenses: | ||||||||||||
Selling, technical, general and administrative | 1,109.3 | 1,123.3 | 857.5 | |||||||||
Research and development | 98.4 | 84.4 | 62.8 | |||||||||
Goodwill impairment | 160.0 | 46.6 | — | |||||||||
Total operating expenses | 1,367.7 | 1,254.3 | 920.3 | |||||||||
Operating profit | 221.3 | 253.4 | 71.6 | |||||||||
Other (expense) income: | ||||||||||||
Interest expense, net | (341.6 | ) | (375.7 | ) | (213.9 | ) | ||||||
Foreign exchange loss | (107.5 | ) | (14.1 | ) | (43.4 | ) | ||||||
Other (expense) income, net | (61.2 | ) | 88.3 | (43.6 | ) | |||||||
Total other expense | (510.3 | ) | (301.5 | ) | (300.9 | ) | ||||||
Loss before income taxes and non-controlling interests | (289.0 | ) | (48.1 | ) | (229.3 | ) | ||||||
Income tax expense | (6.6 | ) | (28.6 | ) | (75.1 | ) | ||||||
Net loss | (295.6 | ) | (76.7 | ) | (304.4 | ) | ||||||
Net (income) loss attributable to the non-controlling interests | (0.6 | ) | 3.0 | (4.2 | ) | |||||||
Net loss attributable to stockholders | (296.2 | ) | (73.7 | ) | (308.6 | ) | ||||||
Gain on amendment of Series B Convertible Preferred Stock | — | 32.9 | — | |||||||||
Net loss attributable to common stockholders | $ | (296.2 | ) | $ | (40.8 | ) | $ | (308.6 | ) | |||
Loss per share | ||||||||||||
Basic | $ | (1.04 | ) | $ | (0.17 | ) | $ | (1.52 | ) | |||
Diluted | $ | (1.04 | ) | $ | (0.65 | ) | $ | (1.52 | ) | |||
Weighted average common shares outstanding | ||||||||||||
Basic | 286.1 | 243.3 | 203.2 | |||||||||
Diluted | 286.1 | 272.3 | 203.2 | |||||||||
See accompanying notes to consolidated financial statements.
F-3
PLATFORM SPECIALTY PRODUCTS CORPORATION AND SUBSIDIARIES
CONSOLIDATED STATEMENTS OF COMPREHENSIVE INCOME (LOSS)
(In millions)
Year Ended December 31, | ||||||||||||
2017 | 2016 | 2015 | ||||||||||
Net loss | $ | (295.6 | ) | $ | (76.7 | ) | $ | (304.4 | ) | |||
Other comprehensive income (loss) | ||||||||||||
Foreign currency translation adjustments | 241.1 | 204.6 | (777.1 | ) | ||||||||
Pension and post-retirement plans: | ||||||||||||
Other comprehensive income (loss), net of tax (expense) benefit of $(2.2), ($0.9) and $3.2 for 2017, 2016 and 2015, respectively | 2.5 | 7.5 | (11.4 | ) | ||||||||
Reclassifications, net of tax expense of $2.1 for 2017, $0.0 for 2016 and 2015 | 8.4 | — | — | |||||||||
Total pension and post-retirement plans | 10.9 | 7.5 | (11.4 | ) | ||||||||
Unrealized (loss) gain on available for sale securities: | ||||||||||||
Other comprehensive (loss) income, net of tax benefit (expense) of $0.4, $0.6 and ($0.6) for 2017, 2016 and 2015, respectively | (2.2 | ) | (0.8 | ) | 1.1 | |||||||
Reclassifications, net of tax expense of $0.0 for 2017, 2016 and 2015 | 0.5 | — | — | |||||||||
Total unrealized (loss) gain on available for sale securities | (1.7 | ) | (0.8 | ) | 1.1 | |||||||
Derivative financial instrument revaluation: | ||||||||||||
Other comprehensive loss before reclassifications, net of tax (expense) benefit of $(4.3), $0.0 and $4.4 for 2017, 2016 and 2015, respectively | (4.6 | ) | (9.6 | ) | (8.1 | ) | ||||||
Reclassifications, net of tax expense of $0.0 for 2017, 2016 and 2015 | 10.4 | 11.9 | — | |||||||||
Total unrealized gain (loss) arising on qualified hedging derivatives | 5.8 | 2.3 | (8.1 | ) | ||||||||
Other comprehensive income (loss) | 256.1 | 213.6 | (795.5 | ) | ||||||||
Comprehensive (loss) income | (39.5 | ) | 136.9 | (1,099.9 | ) | |||||||
Comprehensive (income) loss attributable to the non-controlling interests | (4.3 | ) | 1.0 | 35.8 | ||||||||
Comprehensive income (loss) attributable to stockholders | $ | (43.8 | ) | $ | 137.9 | $ | (1,064.1 | ) | ||||
See accompanying notes to consolidated financial statements.
F-4
PLATFORM SPECIALTY PRODUCTS CORPORATION AND SUBSIDIARIES
CONSOLIDATED BALANCE SHEETS
(In millions)
December 31, | ||||||||
2017 | 2016 | |||||||
Assets | ||||||||
Cash & cash equivalents | $ | 477.8 | $ | 422.6 | ||||
Accounts receivable, net | 1,156.0 | 1,054.8 | ||||||
Inventories | 490.4 | 416.4 | ||||||
Prepaid expenses | 42.8 | 71.3 | ||||||
Other current assets | 173.6 | 106.1 | ||||||
Total current assets | 2,340.6 | 2,071.2 | ||||||
Property, plant & equipment, net | 452.3 | 460.5 | ||||||
Goodwill | 4,201.2 | 4,178.9 | ||||||
Intangible assets, net | 3,137.3 | 3,233.3 | ||||||
Other assets | 121.0 | 110.2 | ||||||
Total assets | $ | 10,252.4 | $ | 10,054.1 | ||||
Liabilities & stockholders' equity | ||||||||
Accounts payable | $ | 461.8 | $ | 383.6 | ||||
Current installments of long-term debt and revolving credit facilities | 38.9 | 116.1 | ||||||
Accrued expenses and other current liabilities | 591.1 | 583.0 | ||||||
Total current liabilities | 1,091.8 | 1,082.7 | ||||||
Debt and capital lease obligations | 5,440.6 | 5,122.9 | ||||||
Pension and post-retirement benefits | 69.0 | 73.8 | ||||||
Deferred income taxes | 579.6 | 663.2 | ||||||
Contingent consideration | 79.2 | 75.8 | ||||||
Other liabilities | 132.2 | 145.9 | ||||||
Total liabilities | 7,392.4 | 7,164.3 | ||||||
Commitments and contingencies (Note 18) | ||||||||
Stockholders' equity | ||||||||
Preferred stock - Series A | — | — | ||||||
Common stock, 400.0 shares authorized (2017: 287.4 shares issued; 2016: 284.2 shares issued) | 2.9 | 2.8 | ||||||
Treasury stock (2017: 0.0 shares; 2016: 0.0 shares) | (0.1 | ) | — | |||||
Additional paid-in capital | 4,032.0 | 3,981.3 | ||||||
Accumulated deficit | (869.7 | ) | (573.5 | ) | ||||
Accumulated other comprehensive loss | (422.0 | ) | (674.5 | ) | ||||
Total stockholders' equity | 2,743.1 | 2,736.1 | ||||||
Non-controlling interests | 116.9 | 153.7 | ||||||
Total equity | 2,860.0 | 2,889.8 | ||||||
Total liabilities and stockholders' equity | $ | 10,252.4 | $ | 10,054.1 | ||||
See accompanying notes to consolidated financial statements.
F-5
PLATFORM SPECIALTY PRODUCTS CORPORATION AND SUBSIDIARIES
CONSOLIDATED STATEMENTS OF CASH FLOWS
(In millions)
Year Ended December 31, | ||||||||||||
2017 | 2016 | 2015 | ||||||||||
Cash flows from operating activities: | ||||||||||||
Net loss | $ | (295.6 | ) | $ | (76.7 | ) | $ | (304.4 | ) | |||
Reconciliations of net loss to net cash flows provided by operating activities: | ||||||||||||
Depreciation and amortization | 354.2 | 342.3 | 251.0 | |||||||||
Deferred income taxes | (126.6 | ) | (57.4 | ) | (45.5 | ) | ||||||
Amortization of inventory step-up | — | 11.7 | 76.5 | |||||||||
Foreign exchange loss | 114.0 | 43.8 | 97.3 | |||||||||
Goodwill impairment | 160.0 | 46.6 | — | |||||||||
Gain on settlement agreement related to Series B Convertible Preferred Stock | — | (103.0 | ) | — | ||||||||
Other, net | 89.9 | 85.2 | 36.6 | |||||||||
Changes in assets and liabilities, net of acquisitions: | ||||||||||||
Accounts receivable | (53.1 | ) | (18.9 | ) | 66.7 | |||||||
Inventory | (30.3 | ) | 70.4 | (7.3 | ) | |||||||
Accounts payable | 49.8 | (67.3 | ) | 83.2 | ||||||||
Accrued expenses | (9.2 | ) | 25.4 | 51.5 | ||||||||
Prepaid expenses and other current assets | (27.0 | ) | (0.4 | ) | (20.3 | ) | ||||||
Other assets and liabilities | (44.0 | ) | (116.9 | ) | 35.6 | |||||||
Net cash flows provided by operating activities | 182.1 | 184.8 | 320.9 | |||||||||
Cash flows from investing activities: | ||||||||||||
Capital expenditures | (59.4 | ) | (56.3 | ) | (47.9 | ) | ||||||
Investment in registrations of products | (40.5 | ) | (36.4 | ) | (34.4 | ) | ||||||
Proceeds from disposal of property, plant and equipment | 17.5 | 20.6 | 25.8 | |||||||||
Acquisition of business, net of cash acquired | (0.5 | ) | 1.3 | (4,600.3 | ) | |||||||
Restricted cash | (5.2 | ) | (0.5 | ) | 599.7 | |||||||
Note receivable | — | — | (125.0 | ) | ||||||||
Settlement of foreign exchange contracts in connection with acquisition | — | — | (73.1 | ) | ||||||||
Other, net | (4.5 | ) | (3.4 | ) | (1.3 | ) | ||||||
Net cash flows used in investing activities | (92.6 | ) | (74.7 | ) | (4,256.5 | ) | ||||||
Cash flows from financing activities: | ||||||||||||
Debt proceeds, net of discount and premium | 4,142.7 | 3,300.9 | 3,921.8 | |||||||||
Repayments of borrowings | (4,122.1 | ) | (3,340.1 | ) | (283.7 | ) | ||||||
Change in lines of credit, net | (58.8 | ) | 54.0 | (12.4 | ) | |||||||
Proceeds from issuance of common stock, net | 1.4 | 391.5 | 469.5 | |||||||||
Change in on-balance sheet factoring arrangements | (3.5 | ) | (44.1 | ) | (3.9 | ) | ||||||
Payment of financing fees | (13.8 | ) | (1.1 | ) | (87.0 | ) | ||||||
Settlement of Series B Convertible Preferred Stock | — | (460.0 | ) | — | ||||||||
Other, net | (13.3 | ) | (3.3 | ) | (3.1 | ) | ||||||
Net cash flows (used in) provided by financing activities | (67.4 | ) | (102.2 | ) | 4,001.2 | |||||||
Effect of exchange rate changes on cash and cash equivalents | 33.1 | (17.5 | ) | (30.7 | ) | |||||||
Net increase (decrease) in cash and cash equivalents | 55.2 | (9.6 | ) | 34.9 | ||||||||
Cash and cash equivalents at beginning of period | 422.6 | 432.2 | 397.3 | |||||||||
Cash and cash equivalents at end of period | $ | 477.8 | $ | 422.6 | $ | 432.2 | ||||||
Supplemental disclosure information: | ||||||||||||
Cash paid for interest | $ | 322.8 | $ | 360.1 | $ | 147.6 | ||||||
Cash paid for income taxes | $ | 145.0 | $ | 121.2 | $ | 73.3 | ||||||
See accompanying notes to consolidated financial statements.
F-6
PLATFORM SPECIALTY PRODUCTS CORPORATION AND SUBSIDIARIES
CONSOLIDATED STATEMENT OF CHANGES IN STOCKHOLDERS’ EQUITY
(In millions, except share and per share amounts)
Preferred Stock | Common Stock | Additional Paid-in Capital | Treasury Stock | Accumulated Deficit | Accumulated other Comprehensive (Loss) Income | Total Stockholders' Equity | Non- controlling Interest | Total Equity | ||||||||||||||||||||||||||||||||||||
Shares | Amount | Shares | Amount | Shares | Amount | |||||||||||||||||||||||||||||||||||||||
Balance at December 31, 2016 | 2,000,000 | $ | — | 284,221,168 | $ | 2.8 | $ | 3,981.3 | — | $ | — | $ | (573.5 | ) | $ | (674.5 | ) | $ | 2,736.1 | $ | 153.7 | $ | 2,889.8 | |||||||||||||||||||||
Net (loss) income | — | — | — | — | — | — | — | (296.2 | ) | — | (296.2 | ) | 0.6 | (295.6 | ) | |||||||||||||||||||||||||||||
Other comprehensive income, net of taxes | — | — | — | — | — | — | — | — | 252.5 | 252.5 | 3.6 | 256.1 | ||||||||||||||||||||||||||||||||
Exercise/ vesting of share based compensation | — | — | 122,769 | — | 0.1 | 6,618 | (0.1 | ) | — | — | — | — | — | |||||||||||||||||||||||||||||||
Conversion of PDH Common Stock into common stock | — | — | 2,923,436 | 0.1 | 35.6 | — | — | — | — | 35.7 | (35.7 | ) | — | |||||||||||||||||||||||||||||||
Issuance of common stock under ESPP | — | — | 138,566 | — | 1.3 | — | — | — | — | 1.3 | — | 1.3 | ||||||||||||||||||||||||||||||||
Equity compensation expense | — | — | — | 11.7 | — | — | — | — | 11.7 | — | 11.7 | |||||||||||||||||||||||||||||||||
Changes in non-controlling interests | — | — | — | — | 2.0 | — | — | — | — | 2.0 | (5.3 | ) | (3.3 | ) | ||||||||||||||||||||||||||||||
Balance at December 31, 2017 | 2,000,000 | $ | — | 287,405,939 | $ | 2.9 | $ | 4,032.0 | 6,618 | $ | (0.1 | ) | $ | (869.7 | ) | $ | (422.0 | ) | $ | 2,743.1 | $ | 116.9 | $ | 2,860.0 | ||||||||||||||||||||
See accompanying notes to consolidated financial statements.
F-7
PLATFORM SPECIALTY PRODUCTS CORPORATION AND SUBSIDIARIES
CONSOLIDATED STATEMENT OF CHANGES IN STOCKHOLDERS’ EQUITY (continued)
(In millions, except share and per share amounts)
Preferred Stock | Common Stock | Additional Paid-in Capital | Treasury Stock | Accumulated Deficit | Accumulated other Comprehensive (Loss) Income | Total Stockholders' Equity | Non- controlling Interest | Total Equity | ||||||||||||||||||||||||||||||||||||
Shares | Amount | Shares | Amount | Shares | Amount | |||||||||||||||||||||||||||||||||||||||
Balance at December 31, 2015 | 2,000,000 | $ | — | 229,464,157 | $ | 2.3 | $ | 3,520.4 | — | $ | — | $ | (532.7 | ) | $ | (886.1 | ) | $ | 2,103.9 | $ | 169.4 | $ | 2,273.3 | |||||||||||||||||||||
Net loss | — | — | — | — | — | — | — | (73.7 | ) | — | (73.7 | ) | (3.0 | ) | (76.7 | ) | ||||||||||||||||||||||||||||
Other comprehensive income | — | — | — | — | — | — | — | — | 211.6 | 211.6 | 2.0 | 213.6 | ||||||||||||||||||||||||||||||||
Issuance of common stock to former non-founder director for exercise of stock options | — | — | 7,642 | — | — | — | — | — | — | — | — | — | ||||||||||||||||||||||||||||||||
Conversion of PDH Common Stock into common stock | — | — | 325,431 | — | 3.8 | — | — | — | — | 3.8 | (3.8 | ) | — | |||||||||||||||||||||||||||||||
Issuance of common stock under ESPP | — | — | 136,060 | — | 0.9 | — | — | — | — | 0.9 | — | 0.9 | ||||||||||||||||||||||||||||||||
Equity compensation expense | — | — | — | — | 7.4 | — | — | — | — | 7.4 | — | 7.4 | ||||||||||||||||||||||||||||||||
Issuance of common stock at $8.25 per share in the September 2016 Equity Offering | — | — | 48,787,878 | 0.5 | 402.0 | — | — | — | — | 402.5 | — | 402.5 | ||||||||||||||||||||||||||||||||
Issuance costs in connection with the September 2016 Equity Offering | — | — | — | — | (11.9 | ) | — | — | — | — | (11.9 | ) | — | (11.9 | ) | |||||||||||||||||||||||||||||
Series B Convertible Preferred Stock settlement | — | — | 5,500,000 | — | 54.9 | — | — | 32.9 | — | 87.8 | — | 87.8 | ||||||||||||||||||||||||||||||||
Changes in non-controlling interests | — | — | — | — | 3.8 | — | — | — | 3.8 | (10.9 | ) | (7.1 | ) | |||||||||||||||||||||||||||||||
Balance at December 31, 2016 | 2,000,000 | $ | — | 284,221,168 | $ | 2.8 | $ | 3,981.3 | — | $ | — | $ | (573.5 | ) | $ | (674.5 | ) | $ | 2,736.1 | $ | 153.7 | $ | 2,889.8 | |||||||||||||||||||||
See accompanying notes to consolidated financial statements.
F-8
PLATFORM SPECIALTY PRODUCTS CORPORATION AND SUBSIDIARIES
CONSOLIDATED STATEMENT OF CHANGES IN STOCKHOLDERS’ EQUITY (continued)
(In millions, except share and per share amounts)
Preferred Stock | Common Stock | Additional Paid-in Capital | Treasury Stock | Accumulated Deficit | Accumulated Other Comprehensive Loss | Total Stockholders' Equity | Non- controlling Interests | Total Equity | ||||||||||||||||||||||||||||||||||||
Shares | Amount | Shares | Amount | Shares | Amount | |||||||||||||||||||||||||||||||||||||||
Balance at December 31, 2014 | 2,000,000 | $ | — | 182,066,980 | $ | 1.9 | $ | 2,812.4 | — | $ | — | $ | (224.1 | ) | $ | (130.6 | ) | $ | 2,459.6 | $ | 93.0 | $ | 2,552.6 | |||||||||||||||||||||
Net (loss) income | — | — | — | — | — | — | — | (308.6 | ) | — | (308.6 | ) | 4.2 | (304.4 | ) | |||||||||||||||||||||||||||||
Other comprehensive loss | — | — | — | — | — | — | — | — | (755.5 | ) | (755.5 | ) | (40.0 | ) | (795.5 | ) | ||||||||||||||||||||||||||||
Issuance of common stock to Founder Entities as stock dividend to Series A Preferred Stock declared on December 31, 2014 | — | — | 10,050,290 | — | — | — | — | — | — | — | — | — | ||||||||||||||||||||||||||||||||
Issuance of common stock to former non-founder director for exercise of stock options | — | — | 75,000 | — | 0.9 | — | — | — | — | 0.9 | — | 0.9 | ||||||||||||||||||||||||||||||||
Conversion of PDH Common Stock into common stock | — | — | 578,874 | — | 6.6 | — | — | — | — | 6.6 | (6.6 | ) | — | |||||||||||||||||||||||||||||||
Issuance of common stock under ESPP | — | — | 44,361 | — | 0.7 | — | — | — | — | 0.7 | — | 0.7 | ||||||||||||||||||||||||||||||||
Equity compensation expense | — | — | — | — | 0.9 | — | — | — | — | 0.9 | — | 0.9 | ||||||||||||||||||||||||||||||||
Acquisition of non-controlling interest with Arysta Acquisition | — | — | — | — | — | — | — | — | — | — | 125.4 | 125.4 | ||||||||||||||||||||||||||||||||
Issuance of common stock at $26.50 per share in June 2015 Equity Offering | — | — | 18,226,414 | 0.2 | 482.7 | — | — | — | — | 482.9 | — | 482.9 | ||||||||||||||||||||||||||||||||
Issuance costs in connection with June 2015 Equity Offering | — | — | — | — | (15.0 | ) | — | — | — | — | (15.0 | ) | — | (15.0 | ) | |||||||||||||||||||||||||||||
Issuance of common shares to non-employee | — | — | 2,500 | — | — | — | — | — | — | — | — | — | ||||||||||||||||||||||||||||||||
Acquisition of remaining interest in Arysta Colombia | — | — | — | — | — | — | — | — | — | — | (3.3 | ) | (3.3 | ) | ||||||||||||||||||||||||||||||
Issuance of common shares at $12.56 per share in connection with Alent acquisition on December 1, 2015 | — | — | 18,419,738 | 0.2 | 231.2 | — | — | — | — | 231.4 | — | 231.4 | ||||||||||||||||||||||||||||||||
Sale of 50.65% ownership in Arysta Toyo Green Co LTD, including maintenance subsidiary | — | — | — | — | — | — | — | — | — | — | (1.7 | ) | (1.7 | ) | ||||||||||||||||||||||||||||||
Distribution to non-controlling interests | — | — | — | — | — | — | — | — | — | — | (1.6 | ) | (1.6 | ) | ||||||||||||||||||||||||||||||
Balance at December 31, 2015 | 2,000,000 | $ | — | 229,464,157 | $ | 2.3 | $ | 3,520.4 | — | $ | — | $ | (532.7 | ) | $ | (886.1 | ) | $ | 2,103.9 | $ | 169.4 | $ | 2,273.3 | |||||||||||||||||||||
See accompanying notes to consolidated financial statements.
F-9
PLATFORM SPECIALTY PRODUCTS CORPORATION AND SUBSIDIARIES
NOTES TO CONSOLIDATED FINANCIAL STATEMENTS
1. BACKGROUND AND BASIS OF PRESENTATION
Background – Platform Specialty Products Corporation was incorporated in Delaware in January 2014 and its common stock, par value $0.01 per share, trades on the NYSE under the ticker symbol “PAH.”
Platform is a global and diversified producer of high-technology specialty chemical products. Platform's business involves the blending of a number of key ingredients to produce proprietary formulations. The Company operates in a wide variety of niche markets across multiple industries, including automotive, agricultural, animal health, electronics, graphics, and offshore oil and gas production and drilling. Platform delivers its products to customers through its sales and service workforce, regional distributors and manufacturing representatives.
Platform has leading positions in niche segments of high-growth markets. The Company continually seeks opportunities to grow and enhance its strategic position by pursuing inorganic initiatives, focusing on specialty chemical businesses or assets within its existing or complementary end-markets, particularly those meeting its “Asset-Lite, High-Touch” philosophy, which involves prioritizing resources to research and development, offering highly technical sales and customer service, and managing conservatively its capital investments. Platform regularly reviews acquisition opportunities and may acquire businesses that meet its acquisition criteria when it deems it to be financially prudent.
The Company's operations are organized into two reportable segments: Performance Solutions and Agricultural Solutions. The reporting segments represent businesses for which separate financial information is utilized by the chief operating decision maker, or CODM, for purpose of allocating resources and evaluating performance. Each of the reportable segments has its own president who reports to the CODM.
Performance Solutions – The Performance Solutions segment formulates and markets dynamic chemistry solutions worldwide which are used in automotive production, electronics, commercial packaging and printing, and oil and gas production and drilling. Its products include chemicals for metal deposition, functional conversion coatings, electronics assembly materials, water-based hydraulic control fluids, photopolymers, and other specialty chemistries that modify surfaces. In conjunction with the sale of its products, the segment provides extensive technical service and support to assure functional performance of the process used at its customer manufacturing locations. The segment provides specialty chemical solutions through the following five businesses: Assembly Solutions, Electronics Solutions, Industrial Solutions, Graphic Solutions and Offshore Solutions.
Agricultural Solutions – The Agricultural Solutions segment specializes in the development, formulation, registration, marketing and distribution of differentiated Crop Protection solutions, including BioSolutions and Seed Treatments, for a variety of crops and applications. Its diverse Crop Protection chemicals control biotic stresses, such as weeds (herbicides), insects (insecticides) and diseases (fungicides). Its portfolio of proven BioSolutions is comprised of BioStimulants, which are derived from natural substances applied to plants, seeds or the soil in order to enhance yields and help crops withstand abiotic stress, such as drought or cold, and BioControl products, which perform the same task as conventional Crop Protection products with, in many cases, the added benefit of reduced chemical residues. The solutions are offered in multiple forms, such as foliar applications (direct application to leaves), furrow treatment (treatment of soil trenches or grooves wherein seeds are sown) or Seed Treatment (seed coating prior to planting). Its products allow it to partner with growers to address the ever-increasing need for higher crop yield and food quality.
Basis of Presentation – The accompanying Consolidated Financial Statements are prepared in accordance with GAAP and include the accounts of Platform and all of its controlled subsidiaries. The Company consolidates the income, expenses, assets, liabilities and cash flows of its subsidiaries from the date it acquires control or becomes the primary beneficiary. All intercompany accounts and transactions have been eliminated upon consolidation. In August 2017, the Company announced its intention to separate its Agricultural Solutions business into a standalone, independent company. The Agricultural Solutions business continues to be reported as part of the Company's continuing operations as the criteria for discontinued operations were not met at December 31, 2017.
In preparing the Consolidated Financial Statements in conformity with GAAP, management must use estimates and assumptions that affect the reported amounts of assets and liabilities, the disclosure of contingent assets and liabilities at the date of the financial statements and the reported amounts of revenue and expenses during the reporting period. The Company applies judgment based
F-10
on its understanding and analysis of the relevant circumstances, and by their nature, these judgments are subject to an inherent degree of uncertainty. Accordingly, actual results could differ significantly from the estimates applied.
Certain prior year amounts have been reclassified to conform to the current year’s presentation.
2. SUMMARY OF SIGNIFICANT ACCOUNTING POLICIES
Cash and Cash Equivalents – The Company considers all highly liquid instruments purchased with an original maturity of three months or less to be cash equivalents.
Receivables and Allowance for Doubtful Accounts – The Company determines its allowance for doubtful accounts using a combination of factors to reduce trade receivable balances to their estimated net realizable amount. The Company maintains an allowance for doubtful accounts based on a variety of factors, including the length of time receivables are past due, macroeconomic trends and conditions, significant one-time events, historical experience and the financial condition of customers. In addition, the Company records a specific reserve for individual accounts when it becomes aware of specific customer circumstances, such as in the case of bankruptcy filings or deterioration in the customer’s operating results or financial position. The past due or delinquency status of a receivable is based on the contractual payment terms of the receivable. If circumstances related to the specific customer change, the Company adjusts estimates of the recoverability of receivables as appropriate. Credit risk with respect to accounts receivable is generally diversified due to the large number of entities comprising the Company's customer base and its dispersion across many different geographical regions. The Company performs ongoing credit evaluations of the financial condition of its third-party distributors and other customers, and requires collateral, such as letters of credit and bank guarantees, in certain circumstances. At December 31, 2017 and 2016, the Company did not believe that it had any significant concentrations of credit risk that could materially impact its results of operations.
Inventories – Inventories are stated at the lower of cost or net realizable value with cost being determined by the first-in/first-out and average costs methods. Inventories in excess of one year of forecasted sales are classified in the Consolidated Balance Sheets as non-current "Other assets." The Company regularly reviews inventories for obsolescence and excess quantities and calculates reserves based on historical write-offs, customer demand, product evolution, usage rates and quantities of stock on hand. Additional obsolescence reserves may be required if actual sales are less favorable than those projected.
Property, Plant and Equipment – Property, plant and equipment is stated at cost less accumulated depreciation. Equipment under capital lease arrangements is stated at the net present value of minimum lease payments. The Company records depreciation on a straight-line basis over the estimated useful life of each asset.
Estimated useful lives by asset class are as follows:
Average useful life (in years) | ||||||
Buildings and building improvements | 5 | to | 20 | |||
Machinery, equipment and fixtures | 3 | to | 15 | |||
Computer hardware and software | 3 | to | 7 | |||
Furniture and automobiles | 3 | to | 7 | |||
Leasehold improvements | Lesser of useful life or lease term | |||||
Maintenance and repair costs are charged directly to expense; renewals and improvements which significantly extend the useful life of the asset are capitalized and expensed over remaining useful life. Costs and accumulated depreciation on assets retired or disposed of are removed from the accounts and any resulting gains or losses are recorded to earnings in the period of disposal.
Business Combinations – The Company allocates the purchase price of acquisitions to tangible and intangible assets acquired, liabilities assumed and non-controlling interests in the acquiree based on their estimated fair values at the acquisition date. The excess of the acquisition price over those estimated fair values is recorded as goodwill. Changes to the acquisition date provisional fair values prior to the end of the measurement period, are recorded as an adjustment to the associated goodwill. Acquisition-related expenses and restructuring costs, if any, are recognized separately from the business combination and are expensed as incurred.
F-11
PLATFORM SPECIALTY PRODUCTS CORPORATION AND SUBSIDIARIES
NOTES TO CONSOLIDATED FINANCIAL STATEMENTS
Goodwill – Goodwill is tested for impairment at the reporting unit level annually in the fourth quarter, or when events or changes in circumstances indicate that goodwill might be impaired. The Company's reporting units are determined based upon its organizational structure in place at the date of the goodwill impairment test.
During the fourth quarter of 2017, the Company elected to early adopt ASU No. 2017-04, “Simplifying the Test for Goodwill Impairment” which eliminates "Step 2" from the goodwill impairment test, but still requires the Company to perform "Step 1" of impairment testing. In the first step of impairment testing, the fair value of each reporting unit is compared to its carrying value. The fair value of each reporting unit is determined based on the present value of discounted future cash flows. Excluding certain nonrecurring charges, the discounted cash flows are prepared based upon cash flows at the reporting unit level. The cash flow model utilized in the goodwill impairment test involves significant judgments related to future growth rates, discount rates and tax rates, among other considerations from the vantage point of a market participant. If the fair value of a reporting unit exceeds the carrying value of the net assets assigned to that reporting unit, goodwill is not impaired and no further testing is required. If the carrying value of the net assets assigned to the reporting unit exceeds the fair value of the reporting unit, the goodwill impairment loss is calculated as the difference between these amounts, limited to the amount of goodwill allocated to the reporting unit. Prior to the early adoption of this ASU, if the carrying value of the net assets assigned to the reporting unit exceeded the fair value of the reporting unit, the second step of the impairment test was performed to determine the implied fair value of the reporting unit’s goodwill. If the carrying value of the reporting unit’s goodwill exceeded its implied fair value, an impairment charge was recorded equal to the difference.
The primary components of and assumptions used in the assessment consist of the following:
• | Valuation Techniques - the Company uses a discounted cash flow analysis, which requires assumptions about short and long-term net cash flows, growth rates, as well as discount rates. Additionally, it considers guideline company and guideline transaction information, where available, to aid in the valuation of the reporting units. |
• | Growth Assumptions - Multi-year financial forecasts are developed for each reporting unit by considering several key business drivers such as new business initiatives, client service and retention standards, market share changes, historical performance, and industry and economic trends, among other considerations. |
• | Discount Rate Assumptions - Discount rates are estimated based on the WACC, which combines the required return on equity and considers the risk-free interest rate, market risk premium, small stock risk premium and a company specific risk premium, with the cost of debt, based on rated corporate bonds, adjusted using an income tax factor. |
• | Estimated Fair Value and Sensitivities - The estimated fair value of each reporting unit is derived from the valuation techniques described above. The estimated fair value of each reporting unit is analyzed in relation to numerous market and historical factors, including current economic and market conditions, company-specific growth opportunities and guideline company information. |
Indefinite-Lived Intangible Assets - Indefinite-lived intangible assets are reviewed for potential impairment on an annual basis, in the fourth quarter, or more frequently when events or circumstances indicate that such assets may be impaired, by comparing their estimated fair values to their carrying values. An impairment charge is recognized when the carrying value of an indefinite-lived intangible asset exceeds its estimated fair value. The Company uses the “relief from royalty” method to estimate the fair value of trade name intangible assets for impairment. The primary assumptions used to estimate the present value of cash flows from such assets include sales projections and growth rates being applied to a prevailing market-based royalty rate, the effects of which are then tax effected, and discounted using the WACC from the vantage point of a market participant. Assumptions concerning sales projections are impacted by the uncertain nature of global and local economic conditions in the various markets it serves.
Finite-Lived Intangible Assets – Finite-lived intangible assets are amortized on a straight-line basis over their estimated useful lives, which currently range from 8 to 30 years for customer lists, 5 to 14 years for developed technology, 5 to 20 years for trade names and up to 5 years for non-compete agreements. If circumstances require a long-lived asset group to be tested for possible impairment, the Company first determines if the estimated undiscounted future pre-tax cash flows expected to result from the use of the asset plus net proceeds expected from disposition of the asset, if any, are less than the carrying value of the asset. When an impairment is identified, the carrying value of the asset is reduced to its estimated fair value based on a discounted cash flow approach or, when available and appropriate, to comparable market values.
Product Registrations – Product registrations represent external costs incurred to obtain distribution rights from regulatory bodies for certain products in the Company's Agricultural Solutions segment. These costs include laboratory testing, legal, regulatory filing and other costs. Only costs associated with products that are probable of generating future cash flows are capitalized. The capitalized costs are amortized, on a straight line basis, over the useful lives of the registrations, which currently range from 12 to
F-12
PLATFORM SPECIALTY PRODUCTS CORPORATION AND SUBSIDIARIES
NOTES TO CONSOLIDATED FINANCIAL STATEMENTS
14 years, and are included in "Selling, technical, general and administrative" expenses in the Consolidated Statement of Operations. Product registrations are evaluated for impairment in the same manner as finite-lived intangible assets.
Asset Retirement Obligations (AROs) – The Company records the fair value of legal obligations associated with the retirement of tangible long-lived assets in the period in which they are incurred, if a reasonable estimate of fair value can be made. Upon initial recognition of a liability, the Company capitalizes the cost of the AROs by increasing the carrying amount of the related long-lived asset. Over time, the liability is increased for changes in its present value as accretion through interest expense and the capitalized cost is depreciated over the useful life of the related asset.
Contingencies and Commitments - The Company records accruals for loss contingencies and commitments which are both probable and reasonably estimable. Significant judgment is required to determine both probability and the estimated amount of loss. The Company reviews accruals on a quarterly basis and adjusts, as necessary, to reflect the impact of negotiations, settlements, rulings, advice of legal counsel, and other current information.
Environmental Matters - The Company accrues for environmental matters when it is probable that a liability has been incurred and the amount of the liability can be reasonably estimated based on current laws and existing technologies. The accruals are adjusted periodically as assessment and remediation efforts progress or as additional technical or legal information becomes available. Accruals for environmental liabilities are included in the Consolidated Balance Sheets as “Accrued expenses and other current liabilities” and “Other liabilities” at undiscounted amounts. Accruals for related insurance or other third-party recoveries for environmental liabilities are recorded when it is probable that a recovery will be realized and are included in the Consolidated Balance Sheets as “Other current assets" and "Other assets."
Environmental costs are capitalized in instances where the costs extend the life of the property, increase its capacity and/or mitigate or prevent contamination from future operations. Environmental costs are also capitalized in recognition of legal asset retirement obligations resulting from the acquisition, construction and/or normal operation of a long-lived asset. Costs related to environmental contamination treatment and cleanup are charged to expense. Estimated future incremental operations, maintenance and management costs directly related to remediation are accrued when such costs are probable and reasonably estimable.
Employee Benefits – Amounts recognized in the Company's Consolidated Financial Statements related to pension and other post-retirement benefits are determined from actuarial valuations. Inherent in such valuations are assumptions including expected return on plan assets, discount rates at which the liabilities could be settled, rates of increase in future compensation levels and mortality rates. These assumptions are updated annually and are disclosed in Note 10, Pension, Post-Retirement and Post-Employment Plans, to the Consolidated Financial Statements included in this 2017 Annual Report. In accordance with GAAP, actual results that differ from the assumptions are accumulated in other comprehensive income and amortized over future periods and, therefore, affect expense recognized.
The Company considers a number of factors in determining and selecting assumptions for the overall expected long-term rate of return on plan assets. The Company considers the historical long-term return experience of its assets, the current and expected allocation of its plan assets and expected long-term rates of return. Expected long-term rates of return are derived with the assistance of investment advisors. The Company bases its expected allocation of plan assets on a diversified portfolio consisting of domestic and international equity securities, fixed income, real estate and alternative asset classes. The measurement date used to determine pension and other post-retirement benefits is December 31, at which time the minimum contribution level for the following year is determined.
Derivatives – The Company operates internationally and uses certain financial instruments to manage its foreign currency exposures. To designate a derivative for hedge accounting at inception and throughout the hedge period, the Company formally documents the nature and relationships between hedging instrument and hedged item, as well as its risk-management objectives and strategies for undertaking various hedge transactions, and the method of assessing hedge effectiveness. Additionally, for hedges of forecasted transactions, the significant characteristics and expected terms of forecasted transactions are specifically identified, and the likelihood of each forecasted transaction occurring is deemed probable. If it is determined that a forecasted transaction will not occur, a gain or loss is recognized in current earnings. Financial instruments qualifying for hedge accounting must maintain a specified level of effectiveness between the hedging instrument and the item being hedged, both at inception and throughout the hedged period. The Company does not engage in trading or other speculative uses of financial instruments. It is the Company's policy to disclose the fair value of derivative instruments that are subject to master netting arrangements on a gross basis in the Consolidated Balance Sheets.
F-13
PLATFORM SPECIALTY PRODUCTS CORPORATION AND SUBSIDIARIES
NOTES TO CONSOLIDATED FINANCIAL STATEMENTS
The Company has used, and may use in the future, forward contracts and options to mitigate its exposure to changes in foreign currency exchange rates on third-party and intercompany forecasted transactions. If hedge accounting is applied, the effective portion of unrealized gains and losses associated with forward contracts and the intrinsic value of option contracts are deferred as a component of accumulated other comprehensive income until the underlying hedged transactions are reported in the Company’s Consolidated Statements of Operations. For derivative contracts not designated as hedging instruments, the Company records changes in the net fair value of the such contracts in "Other (expense) income, net" in the Consolidated Statements of Operations.
The Company has also used, and may use in the future, contracts and options to mitigate its exposure to commodity prices in the precious metals markets. Metal contracts that qualify as normal purchases are accounted for as executory contracts rather than as derivatives. Metals contracts that meet the definition of a derivative are recorded as a derivative asset or liability in the Consolidated Balance Sheets and are subsequently marked-to-market every reporting period. The Company has not designated these derivatives as hedging instruments and, accordingly, records changes in the fair value of the commodities futures contracts in "Other (expense) income, net" in the Consolidated Statements of Operations.
Financial Instruments – The Company’s financial instruments consist primarily of cash and cash equivalents, restricted cash, accounts receivable, investments, accounts payable, contingent consideration and debt. The Company believes that the carrying value of the cash and cash equivalents, restricted cash, accounts receivable and accounts payable are representative of their respective fair values because of their short maturities. Available for sale equity investments are carried at fair value with net unrealized gains or losses included in "Accumulated other comprehensive loss" in the stockholders’ equity section of the Consolidated Balance Sheets. See Note 13, Financial Instruments, to the Consolidated Financial Statements.
Equity Securities – Equity securities that have readily determinable fair values are classified as available for sale and are carried at fair value. Unrealized holding gains and losses are included in "Accumulated other comprehensive loss" in the stockholders’ equity section of the Consolidated Balance Sheets. Equity securities which do not have readily determinable fair values are recorded at cost and are evaluated whenever events or changes in circumstances indicate that the carrying values of such investments may be impaired. Equity securities are included in the Consolidated Balance Sheets as "Other assets."
Equity Method Investments – Investments over which the Company has the ability to exercise significant influence, but which the Company does not control, are accounted for under the equity method of accounting and are included in the Consolidated Balance Sheets as "Other assets." Significant influence generally exists when the Company holds between 20% and 50% of the voting power of another entity. Investments are initially recognized at cost. The Consolidated Financial Statements include the Company's share of net earnings or losses from the date that significant influence commences until the date that significant influence ceases. When the Company's share of losses exceeds its interest in an equity investment, the carrying amount of that interest is reduced to zero, and the recognition of further losses is discontinued, except to the extent that the Company has an obligation or has made payments on behalf of the investee.
Foreign Currency Translation – The Company’s foreign subsidiaries primarily use their local currency as their functional currency. The assets and liabilities of the Company’s foreign subsidiaries are translated into U.S. dollars using foreign currency exchange rates prevailing at the balance sheet dates. Revenue and expense accounts are translated at average foreign currency exchange rates for the periods presented. Cumulative currency translation adjustments are included in "Accumulated other comprehensive loss" in the stockholders’ equity section of the Consolidated Balance Sheets. Net gains and losses from transactions denominated in currencies other than the functional currency of the entity are included in "Foreign exchange loss" in the Consolidated Statements of Operations.
Revenue Recognition – The Company recognizes revenue either upon shipment or delivery of product depending on when it is reasonably assured that both title and the risks and rewards of ownership have been passed on to the customer. Estimates for sales rebates, incentives and discounts, as well as sales returns and allowances, are accounted for as a reduction of revenue when the earnings process is complete. Sales rebates, incentives and discounts are typically earned by customers based on annual sales volume targets, which vary by each segment. The Company records an estimate for these accruals based on contract terms and our historical experience with similar programs. An estimate for future expected sales returns is recorded based on historical experience with product returns; however, additional allowances may be required if the historical data used to calculate these estimates does not approximate future sales returns. Differences between estimated expense and actual costs are normally immaterial and are recognized in earnings in the period such differences are determined.
On a limited and discretionary basis, the Company allows certain distributors within the Agricultural Solutions segment extensions of credit on a portion of the sales to them during a purchasing cycle, which remain in the distributor’s inventory. The extension of credit is not a right to return, and distributors must pay unconditionally when the extended credit period expires.
F-14
PLATFORM SPECIALTY PRODUCTS CORPORATION AND SUBSIDIARIES
NOTES TO CONSOLIDATED FINANCIAL STATEMENTS
Research and Development – Research and development costs, which primarily relate to internal salaries, are expensed as incurred.
Income Taxes – The Company recognizes deferred tax assets and liabilities based on the differences between the financial statement basis and the tax bases of assets, liabilities, net operating losses and tax credit carryforwards. A valuation allowance is required to be recognized to reduce the recorded deferred tax asset to the amount that will more likely than not be realized. The ultimate realization of deferred tax assets is dependent upon the generation of future taxable income by jurisdiction during the periods in which those temporary differences become deductible or when carryforwards can be utilized. The Company considers the scheduled reversal of deferred tax liabilities, projected future taxable income and tax planning strategies in this assessment. If these estimates and related assumptions change in the future, the Company may be required to record additional valuation allowances against its deferred tax assets resulting in additional income tax expense. Deferred tax assets and liabilities are measured using the enacted tax rates expected to apply to taxable income in the years in which those temporary differences and carryforwards are expected to be recovered or settled. The effect on deferred tax assets and liabilities of a change in tax rates is recognized in income in the period that includes the enactment date of such change. Considering that the TCJA was enacted on December 22, 2017, the effect would normally be required to be recognized in the fourth quarter of 2017. The SEC staff issued Staff Accounting Bulletin 118 (“SAB 118”) to address the application of GAAP in situations where a registrant does not have the necessary information available, prepared or analyzed (including computations) in reasonable detail to complete the accounting for certain income tax effects of the TCJA.
In particular, SAB 118 clarifies that the impact of the TCJA must be accounted for and reported in one of three ways: (1) by reflecting the tax effects of the TCJA for which the accounting is complete; (2) by reporting provisional amounts for those specific income tax effects of the TCJA for which the accounting is incomplete but a reasonable estimate can be determined, with such provisional amounts (or adjustments to provisional amounts) identified in the measurement period, as defined therein, being included as an adjustment to tax expense in the period the amounts are determined; or (3) where the income tax effects cannot be reasonably estimated, no provisional amounts should be reported and the registrant should continue to apply the accounting standard for income taxes based on the provisions of the tax laws that were in effect immediately prior to the enactment of the TCJA. SAB 118 allows companies to record provisional amounts during a one year measurement period.
The Company is subject to income taxes in the United States and in various states and foreign jurisdictions. Significant judgment is required in evaluating uncertain tax positions and determining provisions for income taxes. The first step in evaluating the tax position for recognition is to determine the amount of evidence that supports a favorable conclusion for the tax position upon audit. In order to recognize the tax position, the Company must determine whether it is more likely than not that the position is sustainable. The final evaluation step is to measure the tax benefit as the largest amount that has a more than 50% chance of being realized upon final settlement. Although the Company believes that the positions taken on income tax matters are reasonable, it establishes tax reserves in recognition that various taxing authorities may challenge certain of those positions taken, potentially resulting in additional tax liabilities.
Stock-Based Compensation Plans – Stock-based compensation expense is recognized primarily within selling, technical, general and administrative expenses and is based on the value of the portion of equity-based awards that are ultimately expected to vest. The Company expenses employee stock-based compensation over the requisite service period based on the estimated grant-date fair value of the awards. The fair value of RSU awards is determined using Monte Carlo simulations for market-based RSU awards, and the closing price of Platform's common stock on the date of grant for all other RSU awards. The fair value of stock options is determined using the Black-Scholes option pricing model. The assumptions used in calculating the fair value of stock-based awards represent the Company's best estimates and involve inherent uncertainties and the application of judgment. Inputs in the model include assumptions related to stock price volatility, award terms and judgments as to whether performance targets will be achieved.
Compensation costs for RSU awards reflects the number of awards expected to vest and is ultimately adjusted in future periods to reflect the actual number of vested awards. Compensation costs for awards with performance conditions are only recognized if and when it becomes probable that the performance condition will be achieved. The probability of vesting is reassessed at the end of each reporting period and the compensation costs are adjusted accordingly, with the cumulative effect of such a change on current and prior periods being recognized in compensation cost in the period of the change. Compensation costs for stock options and market-based RSUs are recorded ratably over the vesting term of the options, effected for forfeitures as they occur.
Earnings (Loss) Per Common Share – Basic earnings (loss) per common share excludes dilution and is computed by dividing net income (loss) attributable to common stockholders by the weighted-average number of common shares outstanding during the period. Diluted earnings (loss) per common share assumes the issuance of all potentially dilutive share equivalents using the if-converted or treasury stock method, provided that the effects of which are not anti-dilutive. For stock options and RSUs, it is
F-15
PLATFORM SPECIALTY PRODUCTS CORPORATION AND SUBSIDIARIES
NOTES TO CONSOLIDATED FINANCIAL STATEMENTS
assumed that the proceeds will be used to buy back shares. For stock options, such proceeds equal the average unrecognized compensation plus the assumed exercise of weighted average number of options outstanding. For unvested RSUs, the assumed proceeds equal the average unrecognized compensation expense.
Fair Value Measurements - The Company determines fair value as the price that would be received to sell an asset or paid to transfer a liability in an orderly transaction between market participants at the measurement date. Inputs used in the valuation techniques to derive fair values are classified based on a three-level hierarchy. The basis for fair value measurements for each level within the hierarchy is described below, with Level 1 having the highest priority and Level 3 having the lowest. The three levels of the fair value hierarchy are as follows:
• | Level 1 – inputs are quoted prices (unadjusted) in active markets for identical assets or liabilities. |
• | Level 2 – inputs are quoted prices for similar instruments in active markets; quoted prices for identical or similar instruments in non-active markets; and model-derived valuations whose inputs are observable or whose significant valuation drivers are observable. |
• | Level 3 – inputs to valuation models are unobservable and/or reflect the Company’s market assumptions. |
The fair value hierarchy is based on maximizing the use of observable inputs and minimizing the use of unobservable inputs when measuring fair value. Classification within the fair value hierarchy is based on the lowest level of input that is significant to the fair value measurement. The Company transfers the fair value of an asset or liability between levels of the fair value hierarchy at the end of the reporting period during which a significant change in the inputs used to determine the fair value has occurred.
NAV Practical Expedient is the measure of fair value using the net asset value, or NAV, per share (or its equivalent) as an alternative to the fair value hierarchy discussed above.
Out of Period Adjustments
During 2017, the Company identified and corrected out-of-period errors originating in 2016 associated with income taxes. The impact of these errors was the overstatement of net loss in 2016 and the understatement of net loss in 2017 of $9.3 million.
During 2016, the Company identified and corrected out of period errors originating in 2015 associated with income taxes, specifically the tax accounting for one of Arysta’s foreign subsidiary’s net operating loss carry-forwards in which the local tax law limited their use over time. The impact of this error ($9.5 million) and other immaterial errors was the understatement of net loss in 2015 and the overstatement of net loss in 2016 of approximately $9.3 million.
As previously disclosed in the Company's quarterly report on Form 10-Q for the quarter ended September 30, 2016, the Company identified and corrected an error that effected prior periods related to the allocation of expenses to non-controlling interests. On a cumulative basis since the first quarter of 2015, the Company determined $6.1 million of expenses were not properly allocated to its non-controlling interests resulting in an overstatement of “Non-controlling interests” and “Accumulated deficit” in the Company’s Consolidated Balance Sheets and an understatement of “Net loss attributable to non-controlling interests” and overstatement of “Net loss attributable to stockholders” in the Company's Consolidated Statements of Operations.
Additionally, in connection with the preparation of the Company’s 2016 Consolidated Financial Statements, the Company identified and corrected an error in its 2015 Consolidated Financial Statements. This error was related to the original purchase accounting for the Arysta Acquisition. The Company used the foreign currency exchange rates at January 31, 2015 rather than February 13, 2015, the date of the acquisition, to translate the balance sheet. Accordingly, within the Consolidated Balance Sheet at December 31, 2016, “Goodwill” was increased by $15.1 million with a corresponding offset to “Foreign Currency Translation Adjustments” within “Accumulated Other Comprehensive Income (Loss).”
The Company evaluated the errors impacting 2017, 2016 and 2015 individually and in the aggregate in relation to the quarterly and annual periods in which they originated and the quarterly and annual periods in which they were corrected. Management concluded that these adjustments were not material to the Company’s 2017, 2016 or 2015 Consolidated Financial Statements.
F-16
PLATFORM SPECIALTY PRODUCTS CORPORATION AND SUBSIDIARIES
NOTES TO CONSOLIDATED FINANCIAL STATEMENTS
3. RECENT ACCOUNTING PRONOUNCEMENTS
Recently Adopted Accounting Pronouncements
Intangibles - Goodwill and Other (Topic 350) - In January 2017, the FASB issued ASU No. 2017-04, “Simplifying the Test for Goodwill Impairment.” This ASU simplifies the testing for goodwill impairments by eliminating "Step 2" from the goodwill impairment test. Under the new guidance, goodwill impairment losses are calculated based on the "Step 1" computation with the impairment loss being equal to the amount by which a reporting unit's carrying amount exceeds its implied fair value, limited to the amount of goodwill allocated to the reporting unit. The guidance is effective prospectively as of January 1, 2020, with early adoption permitted. The Company elected to early adopt this guidance in connection with its 2017 annual impairment test. See Note 8, Goodwill and Intangible Assets, for more information.
Recently Issued Accounting Pronouncements Not Yet Adopted
Revenue from Contracts with Customers (Topic 606) - In May 2014, the FASB issued ASU 2014-09, "Revenue from Contracts with Customers," as a new Topic, ASC Topic 606. The core principle of the guidance is that a company should recognize revenue to depict the transfer of promised goods or services in an amount that reflects the consideration to which the entity expects to be entitled in exchange for those goods and services. The new guidance requires expanded disclosure of qualitative and quantitative information about the Company's revenues from contracts with customers.
The Company assembled a project implementation team to assess the impact of the guidance by reviewing its current accounting policies and practices to identify potential differences that would result from applying the new requirements to its revenue contracts, including evaluating its performance obligations, principal versus agent considerations, contract costs, and variable consideration. The Company has completed its contract reviews and evaluation of impact and has concluded this guidance will not have a material impact on its financial statements upon adoption since the timing and pattern of revenue recognition will predominantly continue to be recognized as the Company’s performance obligation to ship or deliver its products is completed and the transfer of control has passed to the customer in accordance with the new standard. The Company will adopt the new guidance effective January 1, 2018 using the modified retrospective method.
Statement of Cash Flows (Topic 230) - In August 2016, the FASB issued ASU No. 2016-15, "Classification of Certain Cash Receipts and Cash Payments." This ASU, which will be retrospectively adopted by the Company as of January 1, 2018, was issued to reduce diversity in practice for how certain cash receipts and cash payments are classified and presented in the statement of cash flows. Upon adoption of the new guidance, the Company will retrospectively report its 2017 and 2016 Consolidated Statements of Cash Flows for the following items:
• | Arrangements whereby the Company sells trade receivables to third parties without recourse and receives beneficial interests for a portion of these receivables, the proceeds of which are currently included in “Operating Activities” in the Condensed Consolidated Statements of Cash Flows. Under the new guidance, approximately $69.0 million and $3.9 million of beneficial interests will be disclosed as a non-cash activity, with cash receipts of approximately $44.3 million and $3.4 million classified as cash inflows from "Investing Activities" in the Consolidated Statements of Cash Flows for 2017 and 2016, respectively. |
• | Cash payments for debt prepayments and debt extinguishment costs of approximately $8.8 million and $8.4 million will be reclassified from "Operating Activities" to "Financing Activities" in the Consolidated Statements of Cash Flows for 2017 and 2016, respectively. |
Income Taxes (Topic 740) - In October 2016, the FASB issued ASU No. 2016-16, "Intra-Entity Transfers of Assets Other than Inventory." This ASU requires the recognition of income tax consequences of intra-entity transfers of assets other than inventory when the transfer occurs and removes the exception to postpone recognition until the asset has been sold to an outside party. The guidance is effective on a modified retrospective basis through a cumulative-effect adjustment to retained earnings as of January 1, 2018. The Company does not expect this ASU to have a material impact on its financial statements.
Leases (Topic 842) - In February 2016, the FASB issued ASU No. 2016-02, “Leases.” This ASU requires lessees to recognize most leases in their balance sheets, but record expenses on their income statements in a manner similar to current accounting. For lessors, the guidance modifies the classification criteria and the accounting for sales-type and direct financing leases. The guidance is effective on a modified retrospective basis as of January 1, 2019, with early adoption permitted. The Company continues to evaluate the impact of this ASU. See Note 17, Operating Lease Commitments, to the Consolidated Financial Statements.
F-17
PLATFORM SPECIALTY PRODUCTS CORPORATION AND SUBSIDIARIES
NOTES TO CONSOLIDATED FINANCIAL STATEMENTS
Derivatives and Hedging (Topic 815) - In August 2017, the FASB issued ASU No. 2017-12, “Targeted Improvements to Accounting for Hedging Activities.” This ASU improves the financial reporting of hedge relationships by updating hedging designation and measurement guidance. The update also simplifies the application of existing hedge accounting guidance related to assessing hedge effectiveness. The guidance is effective prospectively as of January 1, 2019, and is applied to contracts in existence at the date of adoption, with the effects of which reflected as of January 1 of the year of adoption. Early adoption is permitted. The Company is evaluating the impact of this ASU.
4. ACQUISITIONS OF BUSINESSES
2016 Activity
OMG Malaysia Acquisition
On January 31, 2016, Platform completed the OMG Malaysia Acquisition for approximately $124 million, net of acquired cash and closing working capital adjustments. The Company acquired OMG Malaysia by issuing a note payable for $125 million which was offset against a note receivable from the seller of the same amount.
The Company acquired OMG Malaysia to further enhance its Performance Solutions business segment in which OMG Malaysia is included.
2015 Activity
Alent Acquisition
On December 1, 2015, Platform completed the Alent Acquisition for approximately $1.74 billion in cash, net of acquired cash, and 18,419,738 shares of the Company's common stock at $12.56 per share, issued to Alent shareholders.
The Company acquired Alent to expand its product capabilities and offerings and improve the geographic range in surface treatments. Legacy Alent was a global supplier of specialty chemicals and engineered materials used primarily in electronics, automotive, industrial applications, and high performance consumable products and services. Alent is included in the Company's Performance Solutions business segment.
OMG Acquisition
On October 28, 2015, Platform completed the OMG Acquisition for approximately $239 million in cash, net of acquired cash and purchase price adjustments.
The Company acquired the highly-synergistic OMG Businesses to bolster its Performance Solutions business segment. Legacy OMG’s Electronic Chemicals business developed, produced and supplied chemicals for electronic and industrial applications. Legacy OMG’s Photomasks products were used by customers to produce semiconductors and related products.
Arysta Acquisition
On February 13, 2015, Platform completed the Arysta Acquisition for approximately $3.50 billion, consisting of $2.86 billion in cash, net of acquired cash and closing working capital adjustments, and including transaction expenses paid by Platform, and the issuance to the Arysta Seller of $600 million of Platform’s Series B Convertible Preferred Stock with a fair value of $646 million. On December 13, 2016, Platform settled all of its Series B Convertible Preferred Stock obligations under a certain settlement agreement entered into with the Arysta Seller in September 2016. See Note 14, Stockholders' Equity, to the Consolidated Financial Statements, under the heading "Series B Convertible Preferred Stock."
The Company acquired Arysta to expand its presence in the agrochemical business, complementing the Agriphar and CAS acquisitions. Legacy Arysta provided a product offering of Crop Protection solutions, including BioSolutions and Seed Treatment products, to growers worldwide. Arysta is included in the Company's Agricultural Solutions business segment.
F-18
PLATFORM SPECIALTY PRODUCTS CORPORATION AND SUBSIDIARIES
NOTES TO CONSOLIDATED FINANCIAL STATEMENTS
Acquisition Net Sales and Net Income (Loss)
During the year of their respective acquisitions, net sales and net income (loss) contributed by the Company's Acquisitions were as follows:
($ amounts in millions) | Year of Acquisition | Net Sales | Net Income (Loss) | |||||||
OMG Malaysia | 2016 | $ | 30.9 | $ | 3.2 | |||||
Alent | 2015 | 70.8 | (12.4 | ) | ||||||
OMG | 2015 | 20.7 | (0.4 | ) | ||||||
Arysta | 2015 | 1,197.0 | (86.7 | ) | ||||||
As the integration continued to progress for the (i) OMG Malaysia, Alent, and OMG Acquisitions within the Company's Performance Solutions business segment, and the (ii) Arysta Acquisition within the Agricultural Solutions business segment, discrete results reported by the acquired companies have been impacted by the integration initiatives and have become less comparable to prior periods. Therefore, it is impracticable to report discrete Acquisition-level results beyond the initial year of acquisition.
Purchase Price Allocation
The following table summarizes the consideration transferred and transaction costs incurred related to its acquisition in 2016 as well as the applicable amounts of identified assets acquired and liabilities assumed at the applicable acquisition date:
($ amounts in millions) | OMG Malaysia | |||
Consideration | ||||
Cash, net | $ | (1.3 | ) | |
Note receivable settlement | 125.0 | |||
Total consideration | $ | 123.7 | ||
Acquisition costs | $ | 0.5 | ||
Identifiable assets acquired and liabilities assumed | ||||
Accounts receivable | $ | 4.3 | ||
Inventories | 6.4 | |||
Other current assets | 0.2 | |||
Property, plant and equipment | 4.7 | |||
Identifiable intangible assets | 43.9 | |||
Current liabilities | (3.5 | ) | ||
Non-current deferred tax liability | (11.3 | ) | ||
Total identifiable net assets | 44.7 | |||
Goodwill | 79.0 | |||
Total purchase price | $ | 123.7 | ||
The excess of the cost of the OMG Malaysia Acquisition over the net of amounts assigned to the fair values of the assets acquired and the liabilities assumed was recorded as goodwill and represented the value of estimated synergies and the assembled workforces resulting from the Acquisition. The $79.0 million goodwill recorded in connection with the OMG Malaysia Acquisition is expected to be deductible for tax purposes.
F-19
PLATFORM SPECIALTY PRODUCTS CORPORATION AND SUBSIDIARIES
NOTES TO CONSOLIDATED FINANCIAL STATEMENTS
Identifiable intangible assets recorded in conjunction with the OMG Malaysia Acquisition were as follows:
OMG Malaysia | ||||||
($ amounts in millions) | Fair Value | Weighted average useful life (years) | ||||
Customer lists | $ | 41.0 | 15.0 | |||
Developed technology | 2.9 | 5.0 | ||||
Total | $ | 43.9 | 14.3 | |||
Unaudited Pro Forma Net Sales and Net (Loss) Income Attributable to Stockholders
2016 Activity
The OMG Malaysia Acquisition was not material for purposes of pro forma presentation in the Company's Consolidated Financial Statements.
2015 Activity
The following unaudited pro forma summary presents consolidated information of the Company as if the Alent, OMG, and Arysta Acquisitions had occurred on January 1, 2014:
Year Ended December 31, | ||||
($ amounts in millions) | 2015 | |||
Pro forma net sales | $ | 3,582.4 | ||
Pro forma net loss attributable to stockholders | (328.1 | ) | ||
In 2015, the Company incurred $35.9 million of acquisition-related expenses, net of taxes, which have been excluded from the 2015 pro forma net loss above in order to present such pro forma net loss as if the Alent, OMG, and Arysta Acquisitions had occurred on January 1, 2014. These pro forma results have been prepared to reflect fair value adjustments to intangible assets and the related amortization expense, net of tax, from January 1, 2014, as well as the post-acquisition capital structure.
5. ACCOUNTS AND NOTES RECEIVABLE
Accounts Receivable
December 31, | ||||||||
($ amounts in millions) | 2017 | 2016 | ||||||
Total accounts receivable, net | $ | 1,157.7 | $ | 1,058.0 | ||||
Non-current accounts receivable, net | (1.7 | ) | (3.2 | ) | ||||
Current accounts receivable, net | $ | 1,156.0 | $ | 1,054.8 | ||||
Total accounts receivables are net of an allowance for doubtful accounts of $47.6 million and $36.7 million at December 31, 2017 and 2016, respectively. Accounts receivables classified as non-current at December 31, 2017 and 2016 were recorded in the Consolidated Balance Sheets as "Other assets."
Notes Receivable
On October 28, 2015, the Company extended a short-term, recourse loan of $125 million to an unrelated third-party. The loan earned interest at an annual rate of 11% from inception through its settlement in January 2016. During 2015, the Company recognized interest income on the loan of $2.4 million.
F-20
PLATFORM SPECIALTY PRODUCTS CORPORATION AND SUBSIDIARIES
NOTES TO CONSOLIDATED FINANCIAL STATEMENTS
6. INVENTORIES
The major components of inventory, on a net basis, were as follows:
December 31, | ||||||||
($ amounts in millions) | 2017 | 2016 | ||||||
Finished goods | $ | 328.9 | $ | 273.8 | ||||
Work in process | 28.8 | 37.1 | ||||||
Raw materials and supplies | 149.8 | 135.9 | ||||||
Total inventory, net | 507.5 | 446.8 | ||||||
Non-current inventory, net | (17.0 | ) | (30.4 | ) | ||||
Current inventory, net | $ | 490.4 | $ | 416.4 | ||||
Inventory classified as non-current at December 31, 2017 and 2016 was recorded in the Consolidated Balance Sheets as "Other assets."
In connection with Platform's acquisitions, the value of finished goods inventory was increased at the respective dates of acquisition to reflect fair value. During 2016 and 2015, the Company amortized $11.7 million and $76.5 million, respectively, of the inventory step-up to "Cost of sales" in the Consolidated Statements of Operations based on inventory turnover of the various Acquisitions.
7. PROPERTY, PLANT AND EQUIPMENT
The major components of property, plant and equipment were as follows:
December 31, | ||||||||
($ amounts in millions) | 2017 | 2016 | ||||||
Land and leasehold improvements | $ | 108.8 | $ | 109.2 | ||||
Buildings and improvements | 149.8 | 141.8 | ||||||
Machinery, equipment, fixtures, and software | 344.6 | 293.2 | ||||||
Construction in process | 34.3 | 36.7 | ||||||
Total property, plant and equipment | 637.5 | 580.9 | ||||||
Accumulated depreciation | (185.2 | ) | (120.4 | ) | ||||
Property, plant and equipment, net | $ | 452.3 | $ | 460.5 | ||||
For 2017, 2016 and 2015, the Company recorded depreciation expense of $78.3 million, $75.0 million and $48.9 million, respectively.
F-21
PLATFORM SPECIALTY PRODUCTS CORPORATION AND SUBSIDIARIES
NOTES TO CONSOLIDATED FINANCIAL STATEMENTS
8. GOODWILL AND INTANGIBLE ASSETS
Goodwill
The changes in the carrying amount of goodwill by segment were as follows:
($ amounts in millions) | Performance Solutions | Agricultural Solutions | Total | |||||||||
Balance, December 31, 2015 | ||||||||||||
Goodwill | $ | 2,147.2 | $ | 1,874.7 | $ | 4,021.9 | ||||||
Accumulated impairment losses | — | — | — | |||||||||
2,147.2 | 1,874.7 | 4,021.9 | ||||||||||
Addition from acquisitions | 66.9 | — | 66.9 | |||||||||
Purchase accounting adjustments | 29.7 | 15.1 | 44.8 | |||||||||
Impairment write-off | (46.6 | ) | — | (46.6 | ) | |||||||
Foreign currency translation and other | (64.8 | ) | 156.7 | 91.9 | ||||||||
Balance, December 31, 2016 | ||||||||||||
Goodwill, gross | 2,179.0 | 2,046.5 | 4,225.5 | |||||||||
Accumulated impairment losses | (46.6 | ) | — | (46.6 | ) | |||||||
2,132.4 | 2,046.5 | 4,178.9 | ||||||||||
Impairment write-off | — | (160.0 | ) | (160.0 | ) | |||||||
Foreign currency translation and other | 120.2 | 62.1 | 182.3 | |||||||||
Balance, December 31, 2017 | ||||||||||||
Goodwill, gross | 2,299.2 | 2,108.6 | 4,407.8 | |||||||||
Accumulated impairment losses | (46.6 | ) | (160.0 | ) | (206.6 | ) | ||||||
$ | 2,252.6 | $ | 1,948.6 | $ | 4,201.2 | |||||||
If the fair value of a reporting unit exceeds the carrying value of the net assets assigned to that reporting unit, goodwill is not impaired and no further testing is required. Beginning with the 2017 goodwill impairment test, subsequent to the early adoption of the new guidance, if the carrying value of the net assets assigned to the reporting unit exceeds the fair value of the reporting unit, the goodwill impairment loss is calculated as the difference between these amounts, limited to the amount of goodwill allocated to the reporting unit. For the 2016 goodwill impairment test, prior to the early adoption of the new guidance, if the carrying value of the net assets assigned to the reporting unit exceeded the fair value of the reporting unit, the second step of the impairment test was performed to determine the implied fair value of the reporting unit’s goodwill. If the carrying value of the reporting unit’s goodwill exceeded its implied fair value, an impairment charge was recorded equal to the difference.
During the fourth quarter of 2017, we performed our annual goodwill impairment test and determined that the carrying value of the Agro Business reporting unit within our Agricultural Solutions segment exceeded its fair value by $160 million. An impairment charge equal to this amount was recorded in the Consolidated Statement of Operations for 2017. This impairment charge was driven primarily by a reduction in the estimated fair value of this reporting unit based on the impact of a delayed agricultural market recovery which resulted in lower expectations for future revenue, profitability and cash flows as compared to the expectations at the time of the 2016 annual goodwill impairment test.
During 2016, a goodwill impairment charge totaling $46.6 million was recorded, related to Performance Solutions' Offshore Solutions reporting unit. This impairment charge was the result of previously weak oil prices. We experienced the impact on our results, which slightly lagged the overall industry, as this ultimately caused the industry to depress its overall investments. The fair value was determined using a combination of an income approach derived from a discounted cash flow model as well as market multiples. No impairments of goodwill were identified during the year ended December 31, 2015.
Indefinite-Lived Intangible Assets
The carrying value of indefinite-lived intangible assets, other than goodwill, which consists solely of trade names, was $386 million and $377 million at December 31, 2017 and 2016, respectively. The Company found no indications of impairment related to its indefinite-lived intangible assets as a result of its annual impairment review.
F-22
PLATFORM SPECIALTY PRODUCTS CORPORATION AND SUBSIDIARIES
NOTES TO CONSOLIDATED FINANCIAL STATEMENTS
Finite-Lived Intangible Assets
Intangible assets subject to amortization were as follows:
December 31, 2017 | December 31, 2016 | |||||||||||||||||||||||
($ amounts in millions) | Gross Carrying Amount | Accumulated Amortization | Net Book Value | Gross Carrying Amount | Accumulated Amortization | Net Book Value | ||||||||||||||||||
Customer lists | $ | 1,303.3 | $ | (263.5 | ) | $ | 1,039.8 | $ | 1,245.9 | $ | (174.5 | ) | $ | 1,071.4 | ||||||||||
Developed technology (1) | 2,250.7 | (557.0 | ) | 1,693.7 | 2,022.1 | (254.9 | ) | 1,767.2 | ||||||||||||||||
Trade names | 30.3 | (13.8 | ) | 16.5 | 25.1 | (8.2 | ) | 16.9 | ||||||||||||||||
Non-compete agreement | 2.8 | (1.3 | ) | 1.5 | 1.9 | (1.1 | ) | 0.8 | ||||||||||||||||
Total | $ | 3,587.1 | $ | (835.6 | ) | $ | 2,751.5 | $ | 3,295.0 | $ | (438.7 | ) | $ | 2,856.3 | ||||||||||
(1) Includes in-process registration rights awaiting completion before amortization commences.
For 2017, 2016, and 2015, the Company recorded amortization expense on intangible assets of $276 million, $267 million and $202 million, respectively.
Estimated future amortization of intangible assets for each of the next five years is as follows:
($ amounts in millions) | Amortization Expense | |||
2018 | $ | 282.6 | ||
2019 | 282.4 | |||
2020 | 277.9 | |||
2021 | 269.5 | |||
2022 | 254.9 | |||
9. LONG-TERM COMPENSATION PLANS
In June 2014, the Company's stockholders adopted the 2013 Plan, which is administered by the compensation committee of the Board, except as otherwise expressly provided in the 2013 Plan. The Board approved a maximum of 15,500,000 shares of common stock, which were reserved and made available for issuance under the 2013 Plan.
For 2017, 2016 and 2015, compensation expense associated with the Company's long-term compensation plans was as follows:
Year Ended December 31, | ||||||||||||
($ amounts in millions) | 2017 | 2016 | 2015 | |||||||||
Equity classified RSUs | $ | 10.4 | $ | 6.5 | $ | 0.8 | ||||||
Liability classified share-based payments | 0.6 | 0.4 | (0.1 | ) | ||||||||
Stock options | 0.8 | 0.5 | — | |||||||||
Long-term cash bonus plans | — | (0.1 | ) | 0.1 | ||||||||
Total | $ | 11.8 | $ | 7.3 | $ | 0.8 | ||||||
Unrecognized compensation expense for awards expected to vest | $ | 22.2 | ||||||||||
Weighted average remaining vesting period (months) | 19.1 | |||||||||||
F-23
PLATFORM SPECIALTY PRODUCTS CORPORATION AND SUBSIDIARIES
NOTES TO CONSOLIDATED FINANCIAL STATEMENTS
At December 31, 2017, a total of 496,203 shares of common stock had been issued, and 3,500,726 RSUs and stock options were outstanding under the 2013 Plan.
Total | RSUs | Stock Options (1) | ||||||||||
Equity Classified | Liability Classified | |||||||||||
Outstanding at December 31, 2016 | 3,003,003 | 2,117,493 | 320,312 | 565,198 | ||||||||
Granted | 1,373,921 | 1,117,719 | — | 256,202 | ||||||||
Exercised/Issued | (122,769 | ) | (107,450 | ) | — | (15,319 | ) | |||||
Forfeited | (578,429 | ) | (503,911 | ) | (634 | ) | (73,884 | ) | ||||
Outstanding at December 31, 2017 | 3,675,726 | 2,623,851 | 319,678 | 732,197 | ||||||||
(1) Includes 175,000 stock options not issued under the 2013 Plan.
The total fair value of RSUs which vested during 2017 was $1.4 million based on market prices on the vesting dates.
Equity Classified RSUs
The Company granted the following equity classified RSUs under the 2013 Plan:
Year of Issuance: | RSUs | Weighted average grant date fair value | Weighted average vesting period (months) | ||||||
2017 | 1,117,719 | $ | 16.08 | 31.2 | |||||
2016 | 1,754,868 | 10.85 | 33.8 | ||||||
2015 | 453,260 | 24.55 | 54.6 | ||||||
Certain of the RSUs granted during the period contain performance or market vesting conditions in addition to a service vesting condition. RSUs granted with service or performance vesting conditions were valued at the grant date stock price. The grant date fair value of RSUs containing a market vesting condition were estimated using a Monte Carlo simulation of the performance of the Company's common stock relative to the S&P MidCap 400. Certain of the RSUs with performance or market vesting conditions also contain provisions for additional share awards in the event certain performance or market conditions are met at the end of certain applicable measurement periods. These conditions are generally based on return on invested capital ("ROIC") or total stockholder return ('TSR") targets.
The following table provides the range of assumptions used in valuing RSUs containing market vesting conditions:
Year Ended December 31, | ||||
2017 | 2016 | |||
Weighted average expected term (years) (1) | 3.00 | 3.00 | ||
Expected volatility (2) | 52.1% | 53.0% | ||
Risk-free rate (3) | 1.50% | 1.05% | ||
(1) | Weighted average expected term is calculated based on the award vesting period. |
(2) | Expected volatility is calculated based on a blend of the implied and historical equity volatility of an index of comparable companies over a period equal to the expected term. |
(3) | Risk-free rate of return is based on an interpolation of U.S. Treasury rates to reflect an expected term of three years at the date of grant. |
F-24
PLATFORM SPECIALTY PRODUCTS CORPORATION AND SUBSIDIARIES
NOTES TO CONSOLIDATED FINANCIAL STATEMENTS
At December 31, 2017, the following equity classified RSUs were outstanding:
December 31, 2017 | ||||||||
Vesting Conditions: | Outstanding | Weighted average remaining vesting period (months) | Potential additional awards | |||||
Service-based | 931,906 | 16.9 | — | |||||
Performance-based | 947,013 | 17.7 | 617,020 | |||||
Market-based | 744,932 | 21.0 | 1,443,238 | |||||
Total | 2,623,851 | 18.4 | 2,060,258 | |||||
In addition, the Board has approved 83,333 RSUs under the 2013 Plan which vesting is conditioned upon the achievement of certain 2018 Adjusted EBITDA performance targets, with a maximum payoff of 100%. This performance target will be established as a part of the 2018 planning process. As a result, these RSUs are and will be excluded from the above grant activity until the performance target is set.
For all equity classified RSUs, shares are issued immediately upon satisfaction of vesting conditions.
Liability Classified Share-Based Payments
During 2014, the Company granted to certain employees RSUs that vest on December 31, 2020. These RSUs are subject to an Adjusted EBITDA performance condition and share price market condition. Additionally, the number of shares of common stock to be issued was limited to a maximum cash value, requiring these awards to be classified as liabilities. Compensation expense (income) was calculated based on a market value that is remeasured each reporting period.
Stock Options
The Company granted the following non-qualified stock options under the 2013 Plan:
Year of Issuance: | Stock Options | Weighted average strike price per share | Weighted average grant date fair value per share | ||||||||
2017 | 256,202 | $ | 13.30 | $ | 6.05 | ||||||
2016 | 390,198 | 8.05 | 4.35 | ||||||||
Stock options are subject to graded-vesting over a three-year period and have contractual lives of ten years from the grant date. The fair value of the grants is calculated using the Black-Scholes option pricing model at the grant date.
The following table provides the range of assumptions used in valuing stock options:
Year Ended December 31, | ||||
2017 | 2016 | |||
Weighted average expected term (years) (1) | 6.0 | 6.0 | ||
Expected volatility (2) | 45.0% | 53.0% | ||
Risk-free rate (3) | 2.09% | 1.52% to 1.56% | ||
Expected dividend rate | —% | —% | ||
(1) | Weighted average expected term is calculated based on the simplified method for plain vanilla options. |
(2) | Expected volatility is calculated based on a blend of the implied and historical equity volatility of an index of comparable companies over a period equal to the expected term. |
(3) | Risk-free rate of return is based on an interpolation of U.S. Treasury rates to reflect an expected term of six years at the date of grant. |
F-25
PLATFORM SPECIALTY PRODUCTS CORPORATION AND SUBSIDIARIES
NOTES TO CONSOLIDATED FINANCIAL STATEMENTS
At December 31, 2017, there were 175,000 outstanding stock options with a weighted average exercise price of $11.50, which were considered exercisable and out-of-the-money, 110,662 outstanding stock options which were vested and in-the-money, with an aggregate intrinsic value of $0.2 million, and 446,535 outstanding stock options which were unvested, with an aggregate intrinsic value of $0.4 million.
Long-Term Cash Bonus Plan (LTCB)
During 2015, the Company established the LTCB under the 2013 Plan. At December 31, 2017, the plan provided participants the potential right to receive bonuses totaling $6.5 million. Benefits under the plan vest over periods ranging from 36 to 62.5 months and include Adjusted EBITDA performance targets, which were subject to appropriate and equitable adjustments by the Board's compensation committee in order to reflect any subsequent acquisition, divestiture or other corporate reorganizations, as necessary. In 2016, the Company assessed that the performance conditions associated with the LTCB were not probable of being met during the specified measurement period. As a result, the Company ceased accruing compensation expense associated with these awards and reversed the previously recorded compensation expense. At December 31, 2017, the Company maintains that the performance conditions associated with the LTCB are not probable of being met and therefore has not accrued any related expense during the year.
10. PENSION, POST-RETIREMENT AND POST-EMPLOYMENT PLANS
The Company has multiple deferred compensation arrangements, as described below, which include defined benefit pension plans for certain domestic and foreign employees, a SERP for certain executive officers and a post-retirement medical and dental plan for certain domestic employees. Aggregate (losses) income reported in net earnings for these plans by the Company for 2017, 2016 and 2015 totaled $(12.8) million, $(4.1) million and $1.0 million, respectively.
Domestic Defined Benefit Pension Plan
This domestic non-contributory defined benefit pension plan is closed to new participants. Pursuant to this plan, retirement benefits are provided based upon years of service and compensation levels. An investment committee, appointed by the Board, manages the plan and its assets in accordance with the plan’s investment policies. The Company’s investment policies incorporate an asset allocation strategy that emphasizes the long-term growth of capital and acceptable asset volatility as long as it is consistent with the volatility of the relevant market indexes. The investment policies attempt to achieve a mix of approximately 50% of plan investments for long-term growth, 49% for liability-matching assets and 1% for near-term benefit payments. The Company believes this strategy is consistent with the long-term nature of plan liabilities and ultimate cash needs of the plans. Plan assets consist primarily of limited partnership interests, listed stocks, equity security funds, and a short-term Treasury bond mutual fund. The weighted average asset allocation of this pension plan was 49% fixed income mutual fund holdings, 27% equity securities, 19% limited partnership interests, 4% collective investment funds and 1% cash at December 31, 2017.
Actual pension expense and future contributions required to fund this pension plan will depend on future investment performance, changes in future discount rates, the level of Company contributions and various other factors related to the populations participating in this pension plan. The Company evaluates the plan's actuarial assumptions on an annual basis, including the expected long-term rate of return on assets and discount rate, and adjusts the assumptions, as necessary, to ensure proper funding levels are maintained so that the plan can meet obligations as they become due.
At December 31, 2017 and 2016, the projected benefit obligation for this pension plan was $218 million and $206 million, respectively.
Supplemental Executive Retirement Plan
The Company sponsors a SERP that entitles certain executive officers to the difference between the benefits actually paid to them and the benefits they would have received under the pension plan described above were it not for certain restrictions imposed by the Internal Revenue Service Code. Covered compensation under the SERP includes an employee’s annual salary and bonus. At December 31, 2017 and 2016, the projected benefit obligation for the SERP was $8.5 million and $7.9 million, respectively.
F-26
PLATFORM SPECIALTY PRODUCTS CORPORATION AND SUBSIDIARIES
NOTES TO CONSOLIDATED FINANCIAL STATEMENTS
Foreign Pension Plans
The Company's U.K. Pension Plan, which was comprised of a defined benefit plan and a defined contribution plan providing retirement and death benefit plans to employees in the U.K., was transferred to Pension Insurance Corporation plc, or PIC, as of December 31, 2017, in accordance with an agreement entered in to by the plan trustees in October 2014, and the related plan liabilities were settled. For 2017, the Company reclassified $9.8 million from accumulated other comprehensive income (loss) to reflect the settlement of the pension obligation.
The Company has other international benefit plans, including in Taiwan, Germany and France. These plans, which are included in the tables presented below, are not significant, individually or in the aggregate, to the Company's consolidated financial position, results of operations or cash flows. Certain other foreign subsidiaries maintain benefit plans that are consistent with statutory practices, but do not meet the criteria for pension or post-retirement accounting. These benefit plans had obligation balances of $7.7 million and $5.1 million at December 31, 2017 and 2016, respectively, which were recorded in the Consolidated Balance Sheets as "Pension and post-retirement benefits," and were excluded from from the tables presented below.
Domestic Defined Benefit Post-Retirement Medical and Dental Plan
The Company sponsors defined benefit post-retirement medical and dental plans that covers all of its MacDermid domestic full-time employees, hired prior to April 1, 1997, who retire after age 55, with at least ten to twenty years of service (depending upon the date of hire). Eligible employees receive a subsidy from the Company towards the purchase of their retiree medical benefits based on the date of retirement. The annual increase in the Company’s costs for post-retirement medical benefits is subject to a limit of 5%. Retirees are required to contribute to the plan costs in excess of their respective Company limits in addition to their other required contributions. The projected benefit obligation for the post-retirement plan at December 31, 2017 comprised 35% retirees, 39% fully eligible active participants and 26% other participants. The actuarial determination of the Company's accumulated benefit obligation associated with the plan for post-retirement medical benefits assumes annual cost increases of 2% and 4%, based on the date of retirement. As a result of the above mentioned plan limits, the effect of an increase in the healthcare cost trend on the Company's accumulated benefit obligation and the service and interest costs associated therewith is limited to an immaterial amount.
The components of net periodic benefit cost of the Domestic and Foreign Pension Plans and Post-retirement Medical Benefits were as follows:
Year Ended December 31, | ||||||||||||||||||||||||
2017 | 2016 | 2015 | ||||||||||||||||||||||
($ amounts in millions) | Domestic | Foreign | Domestic | Foreign | Domestic | Foreign | ||||||||||||||||||
Pension and SERP Benefits | ||||||||||||||||||||||||
Service cost | $ | — | $ | 2.1 | $ | — | $ | 1.8 | $ | — | $ | 1.4 | ||||||||||||
Interest cost on the projected benefit obligation | 8.8 | 2.3 | 10.1 | 3.1 | 6.8 | 2.8 | ||||||||||||||||||
Expected return on plan assets | (10.1 | ) | (1.9 | ) | (11.6 | ) | (2.6 | ) | (9.9 | ) | (2.7 | ) | ||||||||||||
Amortization of prior service cost | — | — | — | 0.6 | — | — | ||||||||||||||||||
Amortization of actuarial net loss | — | 0.1 | — | 0.2 | — | — | ||||||||||||||||||
Plan curtailment | — | 0.3 | — | (0.1 | ) | — | — | |||||||||||||||||
Plan settlement | — | 10.2 | 1.7 | 0.2 | — | — | ||||||||||||||||||
Net periodic (benefit) cost | $ | (1.3 | ) | $ | 13.1 | $ | 0.2 | $ | 3.2 | $ | (3.1 | ) | $ | 1.5 | ||||||||||
Post-retirement Medical Benefits | ||||||||||||||||||||||||
Service cost | $ | — | $ | 0.1 | $ | — | $ | 0.1 | $ | 0.1 | $ | 0.1 | ||||||||||||
Interest cost on the projected benefit obligation | 0.4 | 0.4 | 0.4 | 0.2 | 0.3 | 0.1 | ||||||||||||||||||
Amortization of net loss | — | 0.1 | — | — | — | — | ||||||||||||||||||
Net periodic cost | $ | 0.4 | $ | 0.6 | $ | 0.4 | $ | 0.3 | $ | 0.4 | $ | 0.2 | ||||||||||||
F-27
PLATFORM SPECIALTY PRODUCTS CORPORATION AND SUBSIDIARIES
NOTES TO CONSOLIDATED FINANCIAL STATEMENTS
The weighted average key assumptions used to determine the net periodic benefit cost of the Domestic and Foreign Pension Plans are as follows:
Year Ended December 31, | ||||||||||||||||||
2017 | 2016 | 2015 | ||||||||||||||||
Domestic | Foreign | Domestic | Foreign | Domestic | Foreign | |||||||||||||
Pension and SERP Benefits | ||||||||||||||||||
Discount rate | 4.2 | % | 2.3 | % | 4.6 | % | 2.8 | % | 4.2 | % | 2.5 | % | ||||||
Rate of compensation increase | 3.5 | % | 3.3 | % | 3.5 | % | 3.3 | % | 3.5 | % | 2.9 | % | ||||||
Long-term rate of return on assets | 5.9 | % | 2.3 | % | 6.5 | % | 2.9 | % | 7.4 | % | 2.5 | % | ||||||
Post-retirement Medical Benefits | ||||||||||||||||||
Discount rate | 4.2 | % | 12.2 | % | 4.4 | % | 14.0 | % | 4.2 | % | 14.5 | % | ||||||
The expected long-term rate of return on assets assumption is developed with reference to historical returns, forward-looking return expectations, the Domestic and Foreign Pension Plans' investment allocations, and peer comparisons.
The following tables summarize changes in benefit obligation, plan assets and funded status of the Company’s plans:
Pension and SERP Benefits | Post-retirement Medical Benefits | |||||||||||||||||||||||||||||||
2017 | 2016 | 2017 | 2016 | |||||||||||||||||||||||||||||
($ amounts in millions) | Domestic | Foreign | Domestic | Foreign | Domestic | Foreign | Domestic | Foreign | ||||||||||||||||||||||||
Change in Benefit Obligation: | ||||||||||||||||||||||||||||||||
Beginning of period balance | $ | 213.5 | $ | 103.0 | $ | 230.5 | $ | 112.7 | $ | 9.6 | $ | 3.1 | $ | 9.4 | $ | 1.4 | ||||||||||||||||
Additions | — | 0.6 | — | 2.7 | — | — | — | — | ||||||||||||||||||||||||
Service cost | — | 2.1 | — | 1.8 | — | 0.1 | 0.1 | 0.1 | ||||||||||||||||||||||||
Plan amendments | — | — | — | (6.9 | ) | — | — | — | — | |||||||||||||||||||||||
Interest cost | 8.8 | 2.3 | 10.1 | 3.1 | 0.4 | 0.4 | 0.4 | 0.2 | ||||||||||||||||||||||||
Plan curtailment | — | (0.1 | ) | — | (0.1 | ) | — | — | — | — | ||||||||||||||||||||||
Employee contributions | — | — | — | — | — | — | 0.3 | — | ||||||||||||||||||||||||
Actuarial (gain) loss due to assumption change | — | (1.4 | ) | — | 14.5 | — | 0.3 | — | 0.5 | |||||||||||||||||||||||
Actuarial loss (gain) due to plan experience | 13.8 | 0.3 | 5.0 | (2.1 | ) | 0.2 | 0.9 | 0.2 | 0.6 | |||||||||||||||||||||||
Benefits and expenses paid | (9.9 | ) | (6.5 | ) | (9.2 | ) | (6.6 | ) | (0.5 | ) | (0.2 | ) | (0.8 | ) | (0.1 | ) | ||||||||||||||||
Settlement | — | (72.2 | ) | (22.9 | ) | (2.5 | ) | — | — | — | — | |||||||||||||||||||||
Foreign currency translation | — | 6.1 | — | (13.6 | ) | — | (0.1 | ) | — | 0.4 | ||||||||||||||||||||||
End of period balance | $ | 226.2 | $ | 34.2 | $ | 213.5 | $ | 103.0 | $ | 9.7 | $ | 4.5 | $ | 9.6 | $ | 3.1 | ||||||||||||||||
Change in Plan Assets: | ||||||||||||||||||||||||||||||||
Beginning of period balance | $ | 176.6 | $ | 85.0 | $ | 184.5 | $ | 93.7 | $ | — | $ | — | $ | — | $ | — | ||||||||||||||||
Additions | — | 0.5 | — | — | — | — | — | — | ||||||||||||||||||||||||
Actual return on plan assets, net of expenses | 29.8 | 0.5 | 17.9 | 11.3 | — | — | — | — | ||||||||||||||||||||||||
Employer contributions | 3.1 | 1.8 | 6.2 | 2.5 | 0.5 | 0.2 | 0.5 | 0.1 | ||||||||||||||||||||||||
Employee contributions | — | — | — | — | — | — | 0.3 | — | ||||||||||||||||||||||||
Benefits paid | (9.9 | ) | (6.5 | ) | (9.1 | ) | (6.6 | ) | (0.5 | ) | (0.2 | ) | (0.8 | ) | (0.1 | ) | ||||||||||||||||
Settlement | — | (72.2 | ) | (22.9 | ) | (2.5 | ) | — | — | — | — | |||||||||||||||||||||
Foreign currency translation | — | 3.9 | — | (13.4 | ) | — | — | — | — | |||||||||||||||||||||||
End of period balance | $ | 199.6 | $ | 13.0 | $ | 176.6 | $ | 85.0 | $ | — | $ | — | $ | — | $ | — | ||||||||||||||||
Funded Status | ||||||||||||||||||||||||||||||||
Funded status of plan | $ | (26.6 | ) | $ | (21.2 | ) | $ | (36.9 | ) | $ | (18.0 | ) | $ | (9.7 | ) | $ | (4.5 | ) | $ | (9.6 | ) | $ | (3.1 | ) | ||||||||
F-28
PLATFORM SPECIALTY PRODUCTS CORPORATION AND SUBSIDIARIES
NOTES TO CONSOLIDATED FINANCIAL STATEMENTS
The aggregate accumulated benefit obligation for all defined benefit pension plans was $244 million and $300 million at December 31, 2017 and 2016, respectively. At December 31, 2017, the aggregate accumulated benefit obligation and aggregate fair value of plan assets for plans with accumulated benefit obligations in excess of plan assets were $244 million and $209 million, respectively. At December 31, 2016, the aggregate accumulated benefit obligation and aggregate fair value of plan assets for plans with accumulated benefit obligations in excess of plan assets were $228 million and $186 million, respectively.
Weighted average key assumptions used to determine the benefit obligations in the actuarial valuations of the pension and post-retirement benefit liabilities are as follows:
Pension and SERP Benefits | Post-retirement Medical Benefits | |||||||||||||||||||||||
2017 | 2016 | 2017 | 2016 | |||||||||||||||||||||
Domestic | Foreign | Domestic | Foreign | Domestic | Foreign | Domestic | Foreign | |||||||||||||||||
Discount rate | 3.7 | % | 3.0 | % | 4.2 | % | 2.3 | % | 3.7 | % | 9.9 | % | 4.2 | % | 12.2 | % | ||||||||
Rate of compensation increase | 3.5 | % | 3.4 | % | 3.5 | % | 3.0 | % | N/A | N/A | N/A | N/A | ||||||||||||
(N/A) Not applicable as compensation rates are not used in the determination of benefit obligations under the post-retirement benefit plans.
Amounts recognized in the Consolidated Balance Sheets and Accumulated Other Comprehensive Income (Loss) consist of the following:
Pension and SERP Benefits | Post-retirement Medical Benefits | |||||||||||||||||||||||||||||||
2017 | 2016 | 2017 | 2016 | |||||||||||||||||||||||||||||
($ amounts in millions) | Domestic | Foreign | Domestic | Foreign | Domestic | Foreign | Domestic | Foreign | ||||||||||||||||||||||||
Balance Sheet | ||||||||||||||||||||||||||||||||
Other assets | $ | — | $ | 3.6 | $ | — | $ | 4.0 | $ | — | $ | — | $ | — | $ | — | ||||||||||||||||
Accrued expenses and other current liabilities | 1.1 | 0.7 | 0.7 | 0.6 | 0.6 | 0.2 | 0.6 | 0.2 | ||||||||||||||||||||||||
Pension and post-retirement benefits | 25.5 | 24.1 | 36.2 | 21.4 | 9.1 | 4.3 | 9.0 | 2.9 | ||||||||||||||||||||||||
Accumulated Other Comprehensive Income (Loss) Balance Sheet | ||||||||||||||||||||||||||||||||
Net actuarial loss | $ | (7.0 | ) | $ | (3.1 | ) | $ | (12.8 | ) | $ | (12.3 | ) | $ | (0.8 | ) | $ | (2.2 | ) | $ | (0.6 | ) | $ | (1.1 | ) | ||||||||
Prior service costs | (0.1 | ) | — | (0.1 | ) | (0.3 | ) | N/A | N/A | N/A | N/A | |||||||||||||||||||||
The amount of estimated prior service costs for the Company's Pension Plans and SERP plans that will be reclassified from "Accumulated other comprehensive loss" into net periodic cost over the next 12 months is immaterial.
F-29
PLATFORM SPECIALTY PRODUCTS CORPORATION AND SUBSIDIARIES
NOTES TO CONSOLIDATED FINANCIAL STATEMENTS
The following table presents the fair value of plan assets:
December 31, | ||||||||||
($ amounts in millions) | Classification | 2017 | 2016 | |||||||
Asset Category | ||||||||||
Domestic equities | Level 1 | $ | 31.8 | $ | 31.1 | |||||
Foreign equities | Level 1 | 18.3 | — | |||||||
Mutual funds holding domestic securities | Level 1 | 4.0 | 5.5 | |||||||
U.S. Treasuries | Level 2 | 14.6 | 4.9 | |||||||
Mutual funds holding U.S. Treasury Securities | Level 1 | 9.2 | 12.0 | |||||||
Mutual funds holding fixed income securities | Level 1 | 74.6 | 14.6 | |||||||
Insurance "Buy-In" Policy (a) | Level 3 | — | 70.2 | |||||||
Foreign public bonds | Level 2 | 5.3 | 5.1 | |||||||
Corporate bonds | Level 2 | — | 1.2 | |||||||
Cash and cash equivalents | Level 1 | 10.1 | 15.1 | |||||||
Sub-Total | 167.9 | 159.7 | ||||||||
Assets using net asset value (or NAV) as a practical expedient | 44.7 | 101.9 | ||||||||
Total | $ | 212.6 | $ | 261.6 | ||||||
(a) | This category represents assets in the U.K. Pension Plan invested in insurance contract with PIC in connection with the “Buy-In” of the U.K. Pension Plan, which was transferred to PIC, as of December 31, 2017. |
Assets using NAV as a practical expedient include limited partnership interests and commingled funds that are not actively traded or whose underlying investments are valued using observable marketplace inputs.
At December 31, 2017, expected future benefit payments related to the Company’s defined benefit plans were as follows:
Pension and SERP Benefits | Post-retirement Medical Benefits | Total | ||||||||||||||
($ amounts in millions) | Domestic | Foreign | ||||||||||||||
2018 | $ | 12.0 | $ | 1.6 | $ | 0.7 | $ | 14.3 | ||||||||
2019 | 12.0 | 1.8 | 0.8 | 14.6 | ||||||||||||
2020 | 12.2 | 1.7 | 0.8 | 14.7 | ||||||||||||
2021 | 12.1 | 1.8 | 0.8 | 14.7 | ||||||||||||
2022 | 12.7 | 1.9 | 0.8 | 15.4 | ||||||||||||
Subsequent five years | 64.1 | 11.1 | 4.0 | 79.2 | ||||||||||||
Total | $ | 125.1 | $ | 19.9 | $ | 7.9 | $ | 152.9 | ||||||||
The measurement date used to determine pension and other post-retirement medical benefits was December 31, 2017, at which time the minimum contribution level for the following year was determined. The Company's expected contribution to the pension and other post-retirement plans is $3.4 million in 2018.
11. INCOME TAXES
Tax Reform
On December 22, 2017, the TCJA was enacted into law in the United States. The legislation contains several key tax provisions including the reduction of the corporate income tax rate to 21% effective January 1, 2018, and a one-time transition tax on foreign earnings which have not previously been subject to tax in the United States, as well as a variety of other changes, including limitation of the tax deductibility of interest expense, limitations for the deduction for net operating losses, new taxes on certain foreign-sourced earnings, and modification or repeal of many business deductions and credits.
The SEC staff issued SAB 118 which allows companies to record provisional amounts during a one-year measurement period. At December 31, 2017, the Company has not completed its accounting for the tax effects of the enactment of the TCJA; however,
F-30
PLATFORM SPECIALTY PRODUCTS CORPORATION AND SUBSIDIARIES
NOTES TO CONSOLIDATED FINANCIAL STATEMENTS
the Company estimated what it believes to be the effects of the TCJA on its existing deferred tax balances, unrecognized tax benefits and the one-time transition tax, and recorded a provisional estimate for these tax effects.
The Company recognized a provisional $46.3 million income tax benefit in 2017 as a result of remeasuring U.S. federal deferred taxes for the change in the statutory tax rate and a partial release of the U.S. federal valuation allowance due to changes in the carryforward period and limitation on the utilization of future net operating losses. The valuation allowance analysis is subject to significant judgment and may change as the Company completes its analysis of the impacts of the enactment of the TCJA. The Company also made a reasonable estimate of the impact of the one-time transition tax on foreign earnings which have not previously been subject to tax in the United States. The Company believes foreign tax credits will be utilized to offset the one-time transition tax. Significant technical analysis is required to further substantiate the foreign earnings subject to the one-time transition tax as well as the utilization of foreign tax credits. The Company will continue to review the technical tax interpretations associated with the underlying law, monitor state legislative changes, and review U.S. federal and state guidance as it is issued. These items could significantly impact the Company’s provisional estimate of the one-time transition tax.
The TCJA subjects a U.S. shareholder to tax on global intangible low-taxed income (GILTI) earned by certain foreign subsidiaries for which an entity can make an accounting policy election to either recognize deferred taxes for temporary basis differences expected to reverse as GILTI in future years or provide for the tax expense related to GILTI in the year the tax is incurred. Given the complexity of the GILTI provisions, the Company is still evaluating the effects of the GILTI provisions and has not yet determined its accounting policy. At December 31, 2017, because the Company is still evaluating the GILTI provisions and its analysis of future taxable income that is subject to GILTI, the Company is unable to make a reasonable estimate and has therefore not reflected any adjustments related to GILTI in its Consolidated Financial Statements.
The Company will continue to assess the impact of the TCJA on its business and its Consolidated Financial Statements and provide updates in subsequent filings.
Income Taxes
(Loss) income before income taxes and non-controlling interests was as follows:
Year Ended December 31, | ||||||||||||
($ amounts in millions) | 2017 | 2016 | 2015 | |||||||||
Domestic | $ | (331.0 | ) | $ | (229.1 | ) | $ | (290.8 | ) | |||
Foreign | 42.0 | 181.0 | 61.5 | |||||||||
Total | $ | (289.0 | ) | $ | (48.1 | ) | $ | (229.3 | ) | |||
Income tax expense (benefit) consisted of the following:
Year Ended December 31, | ||||||||||||
($ amounts in millions) | 2017 | 2016 | 2015 | |||||||||
Current: | ||||||||||||
U.S.: | ||||||||||||
Federal | $ | (1.2 | ) | $ | 0.1 | $ | 0.7 | |||||
State and local | 1.0 | 0.4 | (0.2 | ) | ||||||||
Foreign | 133.4 | 85.5 | 120.1 | |||||||||
Total current | 133.2 | 86.0 | 120.6 | |||||||||
Deferred: | ||||||||||||
U.S.: | ||||||||||||
Federal | (48.7 | ) | 1.9 | 6.4 | ||||||||
State and local | 0.4 | (0.2 | ) | (5.2 | ) | |||||||
Foreign | (78.3 | ) | (59.1 | ) | (46.7 | ) | ||||||
Total deferred | (126.6 | ) | (57.4 | ) | (45.5 | ) | ||||||
Income tax expense | $ | 6.6 | $ | 28.6 | $ | 75.1 | ||||||
F-31
PLATFORM SPECIALTY PRODUCTS CORPORATION AND SUBSIDIARIES
NOTES TO CONSOLIDATED FINANCIAL STATEMENTS
Income tax expense (benefit) differed from the amounts computed by applying the U.S. federal statutory tax rate to pre-tax loss, as a result of the following:
Year Ended December 31, | ||||||||||||
($ amounts in millions) | 2017 | 2016 | 2015 | |||||||||
U.S. federal statutory tax rate | 35.0 | % | 35.0 | % | 35.0 | % | ||||||
Taxes computed at U.S. statutory rate | $ | (101.2 | ) | $ | (16.8 | ) | $ | (80.3 | ) | |||
State income taxes, net of federal benefit | 0.9 | 0.1 | (3.6 | ) | ||||||||
Foreign tax on foreign operations | (3.9 | ) | (17.2 | ) | (25.3 | ) | ||||||
U.S. tax on foreign operations | 46.7 | 29.0 | 31.1 | |||||||||
Net change in reserve | (8.1 | ) | (24.1 | ) | 27.5 | |||||||
Change in valuation allowances | 83.2 | 68.4 | 72.6 | |||||||||
Provision for tax on undistributed foreign earnings | (1.0 | ) | 26.8 | 5.0 | ||||||||
Change of tax rate | (19.4 | ) | 11.8 | (1.0 | ) | |||||||
Impact of transaction costs | — | (24.5 | ) | 40.5 | ||||||||
Settlement of Series B Convertible Preferred Stock | — | (34.3 | ) | — | ||||||||
Goodwill impairment | 53.4 | 6.2 | — | |||||||||
Provisional estimate of TCJA | (46.3 | ) | — | — | ||||||||
Other, net | 2.3 | 3.2 | 8.6 | |||||||||
Income tax expense | $ | 6.6 | $ | 28.6 | $ | 75.1 | ||||||
Effective tax rate | (2.3 | )% | (59.5 | )% | (32.8 | )% | ||||||
The Company has provided foreign taxes on previously unremitted earnings of certain foreign subsidiaries from 2015 and for other foreign subsidiaries from 2016. At December 31, 2017, the Company maintains a deferred tax liability of $21.9 million relating to income and withholding taxes upon distribution of earnings from non-U.S. subsidiaries to certain foreign holding companies. No additional income taxes have been provided for any remaining undistributed foreign earnings not subject to the transition tax, or any additional outside basis difference inherent in these entities, as these amounts continue to be indefinitely reinvested in foreign operations. Determining the amount of unrecognized deferred tax liability related to any remaining undistributed foreign earnings not subject to the transition tax and additional outside basis difference in these entities (i.e., basis difference in excess of that subject to the one-time transition tax) is not practicable. Due to the changes associated with the TCJA, the Company is still evaluating its assertion for foreign earnings.
F-32
PLATFORM SPECIALTY PRODUCTS CORPORATION AND SUBSIDIARIES
NOTES TO CONSOLIDATED FINANCIAL STATEMENTS
The components of deferred income taxes at December 31, 2017 and 2016 were as follows:
December 31, | ||||||||
($ amounts in millions) | 2017 | 2016 | ||||||
Deferred tax assets: | ||||||||
Net operating losses | $ | 323.0 | $ | 355.7 | ||||
Tax credits | 62.0 | 49.2 | ||||||
Interest carryforward | 44.4 | 34.2 | ||||||
Employee benefits | 40.3 | 56.2 | ||||||
Accrued liabilities | 25.9 | 50.6 | ||||||
Financing activities | 24.3 | 3.5 | ||||||
Goodwill | 19.5 | 31.4 | ||||||
Accounts receivable | 19.1 | 19.8 | ||||||
Research and development costs | 10.3 | 15.2 | ||||||
Inventory | 4.6 | 8.5 | ||||||
Other | 20.7 | 24.1 | ||||||
Total deferred tax assets | 594.1 | 648.4 | ||||||
Valuation allowance | (391.7 | ) | (383.3 | ) | ||||
Total gross deferred tax assets | 202.4 | 265.1 | ||||||
Deferred tax liabilities: | ||||||||
Intangibles | 710.4 | 831.9 | ||||||
Plant and equipment | 24.8 | 33.9 | ||||||
Undistributed foreign earnings | 21.9 | 36.8 | ||||||
Other | 0.4 | 6.9 | ||||||
Total gross deferred tax liabilities | 757.5 | 909.5 | ||||||
Net deferred tax liability | $ | 555.1 | $ | 644.4 | ||||
Deferred tax assets are included in the Consolidated Balance Sheets as "Other assets" at December 31, 2017 and 2016.
The presentation of the deferred tax balances at December 31, 2016 in the above table have been revised to correct immaterial prior year errors primarily related to intangibles, interest carryforward, goodwill, other assets, employee benefits and related valuation allowances. There was no impact to net deferred tax liabilities in the Consolidated Balance Sheet as the net impact of these adjustments was offset with a corresponding $20.1 million adjustment to related valuation allowances.
Valuation allowances reflect the Company's assessment that it is more likely than not that certain federal, state and foreign deferred tax assets, primarily net operating losses, will not be realized. The assessment of the need for a valuation allowance requires management to make estimates and assumptions about future earnings, reversal of existing temporary differences and available tax planning strategies. If actual experience differs from these estimates and assumptions, the recorded deferred tax asset may not be fully realized, resulting in an increase to income tax expense in Platform's results of operations. The valuation allowance for deferred tax assets was $392 million and $383 million at December 31, 2017 and 2016, respectively. During 2017, the valuation allowance increased by $8.4 million primarily due to foreign operating losses offset by the reductions in the U.S. valuation allowance following enactment of the TCJA.
At December 31, 2017, the Company had federal, state and foreign net operating loss carryforwards of approximately $591 million, $841 million and $774 million, respectively. The U.S. federal net operating loss carryforwards expire between the years 2021 and 2036. The majority of the state net operating loss carryforwards expire between the years 2018 and 2037. The foreign tax net operating loss carryforwards expire between the years 2018 through 2037 or may be carried forward indefinitely. In addition, at December 31, 2017, the Company had approximately $43.2 million, $17.8 million and $6.5 million of foreign tax credits, research and development credits, and other tax credits, respectively, available for carryforward. These carryforward periods range from ten years to an unlimited period of time.
Section 382 of the Internal Revenue Code imposes an annual limitation on the amount of a corporation's U.S. federal taxable income that can be offset by net operating losses if it experiences an "ownership change." The Company experienced ownership
F-33
PLATFORM SPECIALTY PRODUCTS CORPORATION AND SUBSIDIARIES
NOTES TO CONSOLIDATED FINANCIAL STATEMENTS
changes in 2013 and 2015 with respect to the acquisition of various companies. Accordingly, the use of the Company's net operating losses generated prior to these ownership changes is subject to an annual limitation. If certain changes in the Company's ownership occur prospectively, there could be an additional annual limitation on the amount of utilizable carryforwards.
Tax Uncertainties
The following table summarizes the activity related to the Company’s unrecognized tax benefits:
Year Ended December 31, | ||||||||||||
($ amounts in millions) | 2017 | 2016 | 2015 | |||||||||
Unrecognized tax benefits at beginning of period | $ | 128.3 | $ | 112.2 | $ | 27.7 | ||||||
Additions based on current year tax positions | 6.5 | 76.2 | 20.7 | |||||||||
Additions based upon prior year tax positions (including acquired uncertain tax positions) | 4.0 | 1.7 | 72.2 | |||||||||
Reductions due to closed statutes | (6.3 | ) | (9.9 | ) | (2.9 | ) | ||||||
Reductions for prior period positions | (38.0 | ) | (51.9 | ) | — | |||||||
Reductions for settlements and payments | (4.2 | ) | — | (5.5 | ) | |||||||
Total unrecognized tax benefits at end of period | $ | 90.3 | $ | 128.3 | $ | 112.2 | ||||||
At December 31, 2017, the Company had $90.3 million of total unrecognized tax benefits, of which $39.8 million, if recognized, would impact the Company’s effective tax rate. Due to enactment of the TCJA, the Company recorded a provisional estimate for remeasuring federal unrecognized tax benefits of $28.7 million included in the reductions of prior period positions disclosure above for which the Company expects it will be able to reduce tax attribute carryforwards upon settlement of the uncertain tax position. As noted previously, the Company will continue to assess the impact of the TCJA on its business and its Consolidated Financial Statements, including the impact on the U.S. unrecognized tax benefits. Due to expected settlements and statute of limitations expirations, the Company estimates that $4.2 million of the total unrecognized benefits will reverse within the next twelve months.
The Company recognizes interest and/or penalties related to income tax matters as part of income tax (benefit) expense, which totaled $(1.2) million, $(5.5) million and $4.9 million, for 2017, 2016 and 2015, respectively. The Company's accrual for interest and penalties totaled $13.0 million and $13.3 million at December 31, 2017 and 2016, respectively.
At December 31, 2017, the following tax years remained subject to examination by the major tax jurisdictions indicated below:
Major Jurisdictions | Open Years | |||
Belgium | 2010 | through current | ||
Brazil | 2011 | through current | ||
Canada | 2012 | through current | ||
China | 2011 | through current | ||
France | 2011 | through current | ||
Germany | 2013 | through current | ||
Japan | 2012 | through current | ||
Mexico | 2012 | through current | ||
Netherlands | 2013 | through current | ||
South Africa | 2013 | through current | ||
Taiwan | 2012 | through current | ||
United Kingdom | 2008 and 2015 | through current | ||
United States | 2015 | through current | ||
The Company is subject to taxation in the United States and in various states and foreign jurisdictions. During 2017, the U.S. federal tax authorities concluded their audit of the income tax returns through the tax year ended December 31, 2014. With few exceptions, at December 31, 2017, the Company was no longer subject to state and local or foreign examinations by tax authorities for years before 2010. The Company is currently undergoing tax examinations in several foreign jurisdictions. The Company
F-34
PLATFORM SPECIALTY PRODUCTS CORPORATION AND SUBSIDIARIES
NOTES TO CONSOLIDATED FINANCIAL STATEMENTS
believes it has appropriately accrued for the expected outcome of uncertain tax matters and believes such liabilities represent a reasonable provision for taxes ultimately expected to be paid. However, the Company's liability may need to be adjusted as new information becomes available and as tax examinations continue to progress.
12. DEBT, FACTORING AND CUSTOMER FINANCING ARRANGEMENTS
The Company’s debt and capital lease obligations consisted of the following:
($ amounts in millions) | Maturity Date | Interest Rate | December 31, 2017 | December 31, 2016 | ||||||||
USD Senior Notes (1) | 2022 | 6.50% | $ | 1,086.1 | $ | 1,083.2 | ||||||
EUR Senior Notes (1) | 2023 | 6.00% | 415.1 | 362.4 | ||||||||
USD Senior Notes (1) | 2021 | 10.375% | — | 489.0 | ||||||||
USD Senior Notes (1) | 2025 | 5.875% | 783.2 | — | ||||||||
First Lien Credit Facility - USD Term Loans (2) | 2020 | > of 4.50% or LIBOR plus 3.50% | — | 582.5 | ||||||||
First Lien Credit Facility - USD Term Loans (2) | 2020 | > of 3.50% or LIBOR plus 2.50% | 620.4 | — | ||||||||
First Lien Credit Facility - USD Term Loans (2) (3) | 2021 | > of 5.00% or LIBOR plus 4.00% | — | 1,444.2 | ||||||||
First Lien Credit Facility - USD Term Loans (2) (3) | 2021 | > of 4.00% or LIBOR plus 3.00% | 1,121.2 | — | ||||||||
First Lien Credit Facility - Euro Term Loans (2) | 2020 | > of 4.25% or EURIBOR plus 3.25% | — | 726.5 | ||||||||
First Lien Credit Facility - Euro Term Loans (2) | 2020 | > of 3.25% or EURIBOR plus 2.50% | 694.3 | — | ||||||||
First Lien Credit Facility - Euro Term Loans (2) (3) | 2021 | > of 4.75% or EURIBOR plus 3.75% | — | 450.7 | ||||||||
First Lien Credit Facility - Euro Term Loans (2) (3) | 2021 | > of 3.50% or EURIBOR plus 2.75% | 716.0 | — | ||||||||
Borrowings under the Revolving Credit Facility | LIBOR plus 3.00% | — | — | |||||||||
Borrowings under lines of credit (4) | 28.5 | 86.0 | ||||||||||
Capital leases and other | 14.7 | 14.5 | ||||||||||
Total debt and capital lease obligations | 5,479.5 | 5,239.0 | ||||||||||
Less: current installments of long-term debt and revolving credit facilities | 38.9 | 116.1 | ||||||||||
Total long-term debt and capital lease obligations | $ | 5,440.6 | $ | 5,122.9 | ||||||||
(1) | Net of unamortized premium, discounts and debt issuance costs of $35.5 million and $33.4 million at December 31, 2017 and 2016, respectively. Weighted average effective interest rate of 6.53% and 7.81% at December 31, 2017 and 2016, respectively. |
(2) First Lien Credit Facility term loans net of unamortized discounts and debt issuance costs of $33.3 million and $64.0 million at December 31, 2017 and 2016, respectively. Weighted average effective interest rate of 4.53% and 5.64% at December 31, 2017 and 2016, respectively, including the effects of interest rate swaps. See Note 13, Financial Instruments, to the Consolidated Financial Statements for further information regarding the Company's interest rate swaps.
(3) The maturity date will extend to June 7, 2023, provided that the Company is able to prepay, redeem or otherwise retire and/or refinance in full its 1.10 billion, 6.50% USD Notes due 2022, as permitted under the Amended and Restated Credit Agreement, on or prior to November 2, 2021.
(4) Weighted average interest rate of 3.51% and 4.48% at December 31, 2017 and 2016, respectively.
F-35
PLATFORM SPECIALTY PRODUCTS CORPORATION AND SUBSIDIARIES
NOTES TO CONSOLIDATED FINANCIAL STATEMENTS
Minimum future principal payments on long-term debt and capital lease obligations were as follows:
($ amounts in millions) | Long-Term Debt | Capital Leases | Total | |||||||||||
2018 | $ | — | $ | 0.7 | $ | 0.7 | ||||||||
2019 | — | 0.6 | 0.6 | |||||||||||
2020 | 1,330.8 | 0.5 | 1,331.3 | |||||||||||
2021 | (*) | 1,854.4 | 0.5 | 1,854.9 | ||||||||||
2022 | 1,100.0 | 0.4 | 1,100.4 | |||||||||||
Thereafter | 1,219.9 | 1.6 | 1,221.5 | |||||||||||
Total | $ | 5,505.1 | $ | 4.3 | $ | 5,509.4 | ||||||||
(*) In the event the Company is able to prepay, redeem or otherwise retire and/or refinance in full its $1.10 billion, 6.50% USD Notes due 2022, as permitted under the Amended and Restated Credit Agreement, on or prior to November 2, 2021, the maturity date of approximately $1.85 billion of first lien debt will be extended to June 7, 2023 from November 2, 2021.
Amended and Restated Credit Agreement
The Company is party to the Amended and Restated Credit Agreement, which governs the First Lien Credit Facility and the Revolving Credit Facility (in U.S. dollar or multicurrency). A portion of the Revolving Credit Facility not in excess of $30.0 million is available for the issuance of letters of credit. At December 31, 2017, the maximum borrowing capacity under the Amended and Restated Credit Agreement totaled $500 million, which consists of (i) an aggregate principal amount of up to $250 million under the Revolving Credit Facility to be denominated in U.S. dollars, and (ii) an aggregate principal amount of up to $250 million under the Revolving Credit Facility to be denominated in multicurrency. Loans under the Revolving Credit Facility bear interest at a rate per annum equal to 3.00% plus an adjusted eurocurrency rate, or 2.00% plus an adjusted base rate, each as calculated as set forth in the Amended and Restated Credit Agreement. Approximately $15.0 million of our total borrowing capacity of $500 million under the Revolving Credit Facility matures on June 7, 2018. The remainder of our Revolving Credit Facility matures on June 7, 2019, representing lenders who consented to an extension. The Company is required to pay a quarterly commitment fee of 0.50% on the unused balance of the Revolving Credit Facility.
The Amended and Restated Credit Agreement also provides the Company the ability to incur certain amounts of additional incremental term loans in the future, subject to pro-forma compliance with a financial maintenance covenant and certain other requirements.
The Company entered into Amendment No. 7 on April 18, 2017 and Amendment No. 8 on October 3, 2017 to its Second Amended and Restated Credit Agreement. These amendments, collectively, and among other things, refinanced the Company’s then existing U.S. dollar tranche B-4 and B-5 term loans, and euro tranche C-3 and C-4 term loans by creating new U.S. dollar tranche B-6 and B-7 term loans and new euro tranche C-5 and C-6 term loans. The proceeds of newly created U.S. dollar and euro denominated term loans, each as further described below, were used to prepay in full, and effectively reduce the interest rates of, the then existing term loans. In connection with the term loan refinancings, the Company wrote-off $18.9 million, consisting primarily of deferred financing fees and original issuance discounts on the modification of the existing debt, which was recorded in "Total other expense" in the Consolidated Statement of Operations, and expensed $8.8 million of debt issuance costs, which was recorded in "Selling, technical, general and administrative" expense in the Consolidated Statement of Operations.
F-36
PLATFORM SPECIALTY PRODUCTS CORPORATION AND SUBSIDIARIES
NOTES TO CONSOLIDATED FINANCIAL STATEMENTS
The effects of the term loan refinancings resulting from Amendments No. 7 and 8 were as follows:
($ amounts in millions) | Balance before refinancing | Refinancing | Balance after refinancing | |||||||||
U.S. Dollar Tranche B-4 Term Loan due 2021 | $ | 1,467.6 | $ | (1,467.6 | ) | $ | — | |||||
U.S. Dollar Tranche B-6 Term Loan due 2021 | — | 1,231.0 | 1,231.0 | |||||||||
U.S. Dollar Tranche B-5 Term Loan due 2020 | 603.9 | (603.9 | ) | — | ||||||||
U.S. Dollar Tranche B-7 Term Loan due 2020 | — | 680.0 | 680.0 | |||||||||
Euro Tranche C-3 Term Loan due 2021 | 462.3 | (462.3 | ) | — | ||||||||
Euro Tranche C-5 Term Loan due 2021 | — | 697.5 | 697.5 | |||||||||
Euro Tranche C-4 Term Loan due 2020 | 814.0 | (814.0 | ) | — | ||||||||
Euro Tranche C-6 Term Loan due 2020 | — | 740.0 | 740.0 | |||||||||
Totals repriced first lien debt | $ | 3,347.8 | $ | 0.7 | $ | 3,348.5 | ||||||
In connection with the April 2017 refinancing of the Company's previously-existing U.S. dollar denominated B-4 and euro denominated C-3 term loan tranches, Amendment No. 7 effectively reduced interest rates by 100 basis points for each of the new U.S. dollar denominated term loans and the new euro denominated term loans. In addition, the EURIBOR floor was reduced from 1.00% to 0.75% on the new euro denominated term loans. The new tranche B-6 term loans bear interest at 3.00% per annum, plus an applicable eurocurrency rate, or 2.00% plus an applicable base rate, and the new euro tranche C-5 term loans bear interest at 2.75% per annum, plus an applicable eurocurrency rate, in each case as calculated in the Amended and Restated Credit Agreement.
Except as set forth in Amendment No. 7 and above, the U.S. dollar tranche B-6 term loans have identical terms as the U.S. dollar denominated tranche B-5 term loans and the euro tranche C-5 term loans have identical terms as the euro denominated tranche C-4 term loans and are, in each case, otherwise subject to the provisions of the Amended and Restated Credit Agreement.
In connection with the October 2017 refinancing of the Company's previously-existing U.S. dollar denominated B-5 and euro denominated C-4 term loan tranches, Amendment No. 8 effectively reduced interest rates by 100 basis points for each of the new U.S. dollar denominated term loans and the new euro denominated term loans. In addition, the EURIBOR floor was reduced from 1.00% to 0.75% on the new euro denominated term loans. The new U.S. dollar tranche B-7 term loans bear interest at 2.50% per annum, plus an applicable eurocurrency rate, or 1.50% plus an applicable base rate, and the new euro tranche C-6 term loans bear interest at 2.50% per annum, plus an applicable eurocurrency rate, in each case as calculated in the Amended and Restated Credit Agreement. The new term loans mature in June 2020, which is unchanged from the refinanced U.S. dollar denominated B-5 and euro denominated C-4 term loan tranches.
Except as set forth in Amendment No. 8 and above, the U.S. dollar tranche B-7 term loans have identical terms as the U.S. dollar denominated tranche B-6 term loans and the euro tranche C-6 term loans have identical terms as the euro denominated tranche C-5 term loans and are, in each case, otherwise subject to the provisions of the Amended and Restated Credit Agreement.
The obligations incurred under the Amended and Restated Credit Agreement are guaranteed by substantially all of the Company’s domestic subsidiaries, and with respect to the obligations denominated in euros, the Company and certain of its international subsidiaries. Substantially all of the Company’s domestic subsidiaries, and certain of its international subsidiaries, have also granted security interests in substantially all of their assets in connection with such guarantees, including, but not limited to, the equity interests and personal property of such subsidiaries.
Covenants, Events of Default and Provisions
The Amended and Restated Credit Agreement contains customary representations and warranties, and affirmative and negative covenants, including limitations on additional indebtedness, dividends, and other distributions, entry into new lines of business, use of loan proceeds, capital expenditures, restricted payments, restrictions on liens, transactions with affiliates, amendments to organizational documents, accounting changes, sale and leaseback transactions, and dispositions. In particular, the Revolving Credit Facility imposes a financial covenant to maintain a first lien net leverage ratio of 6.25 to 1.0, subject to a right to cure. A violation of this financial covenant can become an event of default under the Credit Facilities and result in the acceleration of all of the Company's indebtedness. Borrowings under the Amended and Restated Credit Agreement are subject to mandatory prepayment from the proceeds of certain dispositions of assets and from certain insurance and condemnation proceeds, excess cash flow and debt incurrences, in each case, subject to customary carve-outs and exceptions. Borrowings under the Amended
F-37
PLATFORM SPECIALTY PRODUCTS CORPORATION AND SUBSIDIARIES
NOTES TO CONSOLIDATED FINANCIAL STATEMENTS
and Restated Credit Agreement are also subject to mandatory prepayment provisions in the case of excess cash flow, calculated as set forth in the Amended and Restated Credit Agreement, of 75% with step-downs to 50%, 25% and 0% based on the applicable first lien net leverage ratio on the prepayment date.
The Amended and Restated Credit Agreement also contains customary events of default that include, among others, non-payment of principal, interest or fees, violation of certain covenants, inaccuracy of representations and warranties, failure to make payment on, or defaults with respect to, certain other material indebtedness, bankruptcy and insolvency events, material judgments and change of control provisions. Upon the occurrence of an event of default, and after the expiration of any applicable grace period, payment of any outstanding loans under the Amended and Restated Credit Agreement may be accelerated and the Company's lenders could foreclose on their security interests in the Company's assets, which may have a material adverse effect on the consolidated financial condition, results of operation or cash flows of the Company.
In addition, the Amended and Restated Credit Agreement contains a yield protection provision wherein the yield on any current indebtedness issued under the Amended and Restated Credit Agreement would be increased to within 50 basis points of the yield on any additional incremental term loan(s), in the event the incremental term loan(s) provided an initial yield, including original issuance discounts, subject to the yield calculation provisions, as defined, is in excess of 50 basis points of the yield on existing term loan indebtedness.
At December 31, 2017, the Company was in compliance with the debt covenants contained in its Credit Facilities and, in accordance with applicable debt covenants, had full availability of its unused borrowing capacity of $481 million, net of letters of credit, under the Revolving Credit Facility.
Senior Notes
2017 Notes Offerings
On November 24, 2017, the Company completed a private offering of $550 million aggregate principal amount of 5.875% senior notes due December 1, 2025, raising gross proceeds of approximately $546 million. Interest on these notes is payable semi-annually in arrears, on June 1 and December 1 of each year, beginning on June 1, 2018. The proceeds from this offering were used to pay the consideration of the cash tender offer and consent solicitation for, as well as redemption of, any and all of the Company's then outstanding 10.375% USD Notes due 2021, described under "Cash Tender Offer and Redemption" below.
On December 8, 2017, the Company completed a tack-on private offering of $250 million aggregate principal amount of additional 5.875% USD Notes due 2025, raising gross proceeds of approximately $250 million. The additional notes have the same terms as, and are fungible and form a single series with, the 5.875% USD Notes due 2025 issued in November 2017. The Company used the proceeds from this offering to repay a portion of its existing terms loans under the Amended and Restated Credit Agreement, and, as a result, it wrote-off $2.7 million of deferred financing fees and original issuance discounts on the modification of the existing debt, which was recorded in "Other (expense) income, net" in the Consolidated Statement of Operations
Indentures
The Senior Notes are governed by indentures which provide, among other things, for customary affirmative and negative covenants, events of default, and other customary provisions. The Company also has the option to redeem the Senior Notes prior to their maturity, subject to, in certain cases, the payment of an applicable make-whole premium. The Senior Notes are unsecured and are fully and unconditionally guaranteed on a senior unsecured basis by generally all of the Company’s domestic subsidiaries that guarantee the Amended and Restated Credit Agreement.
In addition, the 5.875% USD Notes Indenture provides that, in connection with the satisfaction of certain financial covenants and other conditions, all of the then direct and indirect subsidiaries constituting Platform's Agricultural Solutions business may be designated as unrestricted subsidiaries and, as applicable, released from their guarantees of the 5.875% senior notes due 2025. Subsequent to such "Arysta Unrestricted Designation," a sale of Platform's Agricultural Solutions business through the sale of capital stock or assets may be considered a “Qualified Arysta Equity Offering.” In general, Platform may have the right to use an aggregate amount of net cash proceeds from a Qualified Arysta Equity Offering, not to exceed 50% of such net cash proceeds, for permitted restricted payments (including dividends and repurchases of capital stock) to the extent that an equal amount of net cash proceeds is used to permanently reduce debt in accordance with the 5.875% USD Notes Indenture. In addition, after or contemporaneously with the Arysta Unrestricted Designation, any dividend or distribution of common shares of unrestricted
F-38
PLATFORM SPECIALTY PRODUCTS CORPORATION AND SUBSIDIARIES
NOTES TO CONSOLIDATED FINANCIAL STATEMENTS
subsidiaries constituting all or part of Platform's Agricultural Solutions business in connection with any cashless spin-off transaction shall not be considered an Asset Sale.
Cash Tender Offer and Redemption
On December 8, 2017, the Company completed the cash tender offer and consent solicitation for, as well as the redemption of, any and all of its then outstanding 10.375% USD Notes due 2021. None of the 10.375% USD Notes due 2021 remain outstanding. In connection with the cash tender offer and redemption, the Company expensed $52.8 million, consisting of a tender offer premium of $43.7 million, and the write-off of deferred financing fees and original issue premiums on the extinguishment of the existing note of $9.1 million, which was recorded in "Other (expense) income, net" in the Consolidated Statement of Operations.
Lines of Credit and Other Debt Facilities
The Company has access to various revolving lines of credit, short-term debt facilities, and overdraft facilities worldwide which are used to fund short-term cash needs. At December 31, 2017 and 2016, the aggregate principal amount outstanding under such facilities totaled $28.5 million and $86.0 million, respectively. The Company also had letters of credit outstanding of $29.5 million and $32.6 million at December 31, 2017 and 2016, respectively, of which $18.6 million and $11.8 million at December 31, 2017 and 2016, respectively, reduced the borrowings available under the various facilities. At December 31, 2017 and 2016, the availability under these facilities was approximately $606 million and $561 million, respectively, net of outstanding letters of credit.
Accounts Receivable Factoring Arrangements
Off-balance sheet arrangements
The Company has arrangements to sell trade receivables to third parties without recourse to the Company. Under these arrangements, the Company had capacity to sell approximately $236 million and $151 million of eligible trade receivables at December 31, 2017 and 2016, respectively. The Company had utilized approximately $124 million and $73.9 million of these arrangements at December 31, 2017 and 2016, respectively. The receivables under these arrangements are excluded from the Consolidated Balance Sheets and the proceeds are included in "Operating Activities" in the Consolidated Statements of Cash Flows. Costs associated with these programs are included in "Selling, technical, general and administrative" expense in the Consolidated Statements of Operations.
On-balance sheet arrangements
The Company has arrangements to sell trade receivables to a third party with recourse to the Company. Under these arrangements, the Company had capacity to sell approximately $71.1 million and $65.3 million of eligible trade receivables at December 31, 2017 and 2016, respectively. The Company had utilized approximately $34.6 million and $38.3 million of these arrangements at December 31, 2017 and 2016, respectively. The proceeds from these arrangements are accounted for as "Financing Activities" in the Consolidated Statements of Cash Flows. Costs associated with these programs are included in "Interest expense, net," in the Consolidated Statements of Operations.
Precious Metals Contracts
Some of the Company’s subsidiaries in the United States and the Netherlands periodically enter into arrangements with financial institutions for consignment and/or purchase of precious metals. The present and future indebtedness and liability relating to such arrangements are guaranteed by the Company. The Company’s maximum guarantee liability under these arrangements is limited to an aggregate of $18.0 million.
13. FINANCIAL INSTRUMENTS
Derivatives and Hedging
In the normal course of business, the Company is exposed to risks relating to changes in foreign currency exchange rates, interest rates and commodity prices. Derivative financial instruments, such as foreign currency exchange forward contracts, interest rate swaps, and commodities futures contracts are used to manage the risks associated with changes in the conditions of those markets. All derivatives are recognized in the Consolidated Balance Sheets at fair value. The counterparties to the Company’s derivative
F-39
PLATFORM SPECIALTY PRODUCTS CORPORATION AND SUBSIDIARIES
NOTES TO CONSOLIDATED FINANCIAL STATEMENTS
agreements are primarily major international financial institutions. The Company continually monitors its derivative positions and the credit ratings of its counterparties and does not anticipate nonperformance by the counterparties.
Foreign Currency
The Company conducts a significant portion of its business in currencies other than the U.S. dollar and a portion of its business in currencies other than the functional currencies of its subsidiaries. As a result, the Company’s operating results are impacted by foreign currency exchange rate volatility.
At December 31, 2017, the Company held foreign currency forward contracts to purchase and sell various currencies to mitigate foreign currency exposure primarily with U.S. dollars and euro. The Company has not designated any foreign currency exchange forward contracts as eligible for hedge accounting, and as a result, changes in the fair value of foreign currency forward contracts are recorded in "Other (expense) income, net" in the Consolidated Statements of Operations. The total notional value of foreign currency exchange forward contracts held at December 31, 2017 was approximately $615 million, and generally have settlement dates within one year. The total notional value of foreign currency exchange forward contracts held at December 31, 2016 was approximately $552 million.
Interest Rates
The Company entered into interest rate swaps to effectively fix the floating base rate portion of its interest payments on approximately $1.14 billion of U.S. dollar denominated debt and €279 million of euro denominated debt at 1.96% and 1.20%, respectively, through June 2020.
Changes in fair values of derivatives that are designated as, and meet all the required criteria of, cash flow hedges are recorded in "Other comprehensive income (loss)" and reclassified from "Accumulated other comprehensive loss" into earnings as the underlying hedged items affects earnings. Amounts reclassified into earnings related to the Company's interest rate swaps are included in "Interest expense, net" in the Consolidated Statements of Operations.
During 2017, the Company's interest rate swaps were deemed highly effective utilizing the dollar-offset method of assessing hedge effectiveness. The Company repriced a portion of its euro denominated debt during the fourth quarter of 2017, which resulted in a mis-match of critical terms which had an immaterial effect on its results of operations. The Company expects to reclassify $2.8 million from "Accumulated other comprehensive loss" to "Interest expense, net" in its Consolidated Statement of Operations during 2018.
Commodities
As part of its risk management policy, the Company enters into commodity futures contracts for the purpose of mitigating its exposure to fluctuations in prices of certain metals it uses in the production of its finished goods. The Company held futures contracts to purchase and sell various metals, primarily tin and silver, for a notional amount of $31.8 million and $42.0 million at December 31, 2017 and 2016, respectively. Substantially all contracts outstanding at December 31, 2017 have delivery dates within one year. The Company has not designated these derivatives as hedging instruments and, accordingly, records changes in their fair values in "Other (expense) income, net" in the Consolidated Statements of Operations.
Certain subsidiaries of the Company have entered into supply agreements with a third-party that have been deemed to constitute financing agreements with embedded derivative features whose fair values are determined by changes in the market values of the underlying metals between delivery and measurement dates. Amounts associated with these supply agreements, primarily related to gold and palladium, which serve as the notional values of the embedded derivatives, have been recorded in the Consolidated Balance Sheets as "Inventories" and "Current installments of long-term debt and revolving credit facilities" and totaled $9.7 million and $9.9 million at December 31, 2017 and 2016, respectively. The fair value of these contracts has been bifurcated and recorded in the Consolidated Balance Sheets as "Accrued expenses and other current liabilities" and were immaterial at December 31, 2017 and 2016.
F-40
PLATFORM SPECIALTY PRODUCTS CORPORATION AND SUBSIDIARIES
NOTES TO CONSOLIDATED FINANCIAL STATEMENTS
For 2017 and 2016, the Company recorded the following realized and unrealized losses associated with derivative contracts not designated as hedging instruments:
($ amounts in millions) | December 31, | |||||||||
Derivatives not designated as hedging instruments: | Location on Condensed Consolidated Statement of Operations: | 2017 | 2016 | |||||||
Foreign exchange and metals contracts | Other (expense) income, net | $ | (9.5 | ) | $ | (12.5 | ) | |||
Master Netting Arrangements
In the normal course of business, the Company enters into contracts with certain counterparties to purchase and sell foreign currency exchange forwards and metal futures that contain master netting arrangements, typically in the form of an International Swaps and Derivatives Association (ISDA) or similar agreements. Although the right to offset within these agreements exists under certain termination events, such as bankruptcy or default, it is the Company's accounting policy to present derivative assets and liabilities under such master netting arrangements on a gross basis in the Consolidated Balance Sheets.
The following table provides information on the Company's derivative positions at December 31, 2017 and 2016, subject to master netting arrangements as if they were presented on a net basis, allowing for the right of offset by counterparty and cash collateral:
December 31, 2017 | December 31, 2016 | |||||||||||||||
($ amounts in millions) | Asset | Liability | Asset | Liability | ||||||||||||
Gross amounts | $ | 5.5 | $ | 6.2 | $ | 6.3 | $ | 8.9 | ||||||||
Gross amount subject to offset in master netting arrangements that are not offset | (1.0 | ) | (2.0 | ) | (2.5 | ) | (2.6 | ) | ||||||||
Cash collateral paid | — | (0.4 | ) | — | (1.0 | ) | ||||||||||
Net | $ | 4.5 | $ | 3.8 | $ | 3.8 | $ | 5.3 | ||||||||
Collateral paid to counterparties is recorded in the Consolidated Balance Sheets as "Other current assets."
Fair Value Measurements
The following tables present the Company’s financial assets and liabilities that are measured at fair value on a recurring basis:
December 31, | ||||||||||||
($ amounts in millions) | Balance sheet location | Classification | 2017 | 2016 | ||||||||
Asset Category | ||||||||||||
Foreign exchange and metals contracts not designated as hedging instruments | Other current assets | Level 2 | 5.5 | 8.5 | ||||||||
Available for sale equity securities | Other assets | Level 1 | 3.7 | 5.1 | ||||||||
Interest rate swaps designated as cash flow hedging instruments | Other assets | Level 2 | 3.4 | — | ||||||||
Available for sale equity securities | Other assets | Level 2 | 0.6 | 0.6 | ||||||||
Total | $ | 13.2 | $ | 14.2 | ||||||||
Liability Category | ||||||||||||
Interest rate swaps designated as cash flow hedging instruments | Accrued expenses and other liabilities | Level 2 | $ | 2.8 | $ | 10.2 | ||||||
Foreign exchange and metals contracts not designated as hedging instruments | Accrued expenses and other liabilities | Level 2 | 7.3 | 10.7 | ||||||||
Interest rate swaps designated as cash flow hedging instruments | Other liabilities | Level 2 | 0.8 | — | ||||||||
Long-term contingent consideration | Contingent consideration | Level 3 | 79.2 | 75.8 | ||||||||
Total | $ | 90.1 | $ | 96.7 | ||||||||
F-41
PLATFORM SPECIALTY PRODUCTS CORPORATION AND SUBSIDIARIES
NOTES TO CONSOLIDATED FINANCIAL STATEMENTS
The following methods and assumptions were used to estimate the fair value of each class of the Company’s financial assets and liabilities:
Available for sale equity securities - Available for sale equity securities classified as Level 1 assets are measured using quoted market prices at the reporting date multiplied by the quantity held. Available for sales equity securities classified as Level 2 assets are measured using quoted prices for similar instruments in active markets.
Derivatives - Derivative assets and liabilities include foreign currency, metals, and interest rate derivatives. The values are determined using pricing models based upon observable market inputs, such as market spot and futures prices on over-the-counter derivative instruments, market interest rates, and consideration of counterparty credit risk.
Long-term contingent consideration - The long-term contingent consideration represents a potential liability of up to $100 million tied to the achievement of certain Adjusted EBITDA and common stock trading price performance metrics over a seven-year period ending December 2020 which was agreed upon in connection with the MacDermid Acquisition. The estimated fair value of the Adjusted EBITDA performance metric is derived using the income approach with unobservable inputs, based on future forecasts and present value assumptions, which include a discount rate of approximately 9.5%, and expected future value of payments of $60.0 million calculated using a probability weighted Adjusted EBITDA assessment with higher probability associated with the Company achieving the maximum Adjusted EBITDA targets. The common stock performance metric has been satisfied. Changes in the estimated fair value of the long-term contingent consideration are recorded in "Selling, technical, general and administrative expenses" in the Consolidated Statements of Operations. Relative to the share price metric, an increase or decrease in the discount rate of 1% changes the fair value measure of the metric by approximately $1.2 million. Relative to the Adjusted EBITDA metric, an increase or a decrease in the discount rate of 1.5%, within a range of probability between 80% and 100%, changes the estimated fair value measure of the metric by approximately $2.2 million. During 2017, the only change to the long-term contingent consideration liability was to adjust the instrument to its estimated fair value.
There were no significant transfers between the fair value hierarchy levels during 2017.
The carrying value and estimated fair value of the Company’s long-term debt and capital lease obligations totaled $5.44 billion and $5.58 billion, respectively, at December 31, 2017, and $5.14 billion and $5.35 billion, respectively, at December 31, 2016. The carrying values noted above include unamortized premiums, discounts and debt issuance costs. The estimated fair value of long-term debt and capital lease obligations is measured using quoted market prices at the reporting date multiplied by the gross carrying amount of the related debt, which excludes unamortized premiums, discounts and debt issuance costs. Such instruments are valued using Level 2 inputs.
Nonrecurring Fair Value Measurements
As a result of the 2017 annual goodwill impairment test, the Agricultural Solutions segment recorded an impairment charge of $160 million to reduce the carrying value of the Agro Business reporting unit to its fair value. As a result of the 2016 annual goodwill impairment test, Performance Solutions segment recorded an impairment charge of $46.6 million to reduce the carrying value of the Offshore Solutions reporting unit to its fair value. These measurements were performed on a non-recurring basis using significant unobservable inputs (Level 3). See Note 8, Goodwill and Intangible Assets, to the Consolidated Financial Statements for further information.
14. STOCKHOLDERS’ EQUITY
Registered Underwritten Public Offerings
On September 21, 2016, the Company completed the September 2016 Equity Offering of 48,787,878 shares of its common stock at a public offering price of $8.25 per share. This offering resulted in gross proceeds to Platform of approximately $402.5 million, before underwriting discounts and commissions and offering expenses of $11.9 million.
On June 29, 2015, the Company completed the June 2015 Equity Offering of 18,226,414 shares of its common stock at a public offering price of $26.50 per share. The offering resulted in gross proceeds to Platform of approximately $483 million, before underwriting discounts, commissions and offering expenses of $15.0 million.
F-42
PLATFORM SPECIALTY PRODUCTS CORPORATION AND SUBSIDIARIES
NOTES TO CONSOLIDATED FINANCIAL STATEMENTS
Preferred Stock
The Company is authorized to issue 5,000,000 shares of preferred stock. The Board had designated 2,000,000 of those shares as "Series A Preferred Stock." At December 31, 2017 and 2016, a total of 2,000,000 shares of Series A Preferred Stock were issued and outstanding. The Board had also designated 600,000 of those shares as "Series B Convertible Preferred Stock." At December 31, 2017 and 2016, all shares of Series B Convertible Preferred Stock were either converted or subsequently canceled and retired as noted below. Shares of preferred stock have no voting rights, except in respect of any amendment to the Company's Certificate of Incorporation, as amended, that would alter or change their rights or privileges.
Series A Preferred Stock
The Founder Entities are current holders of Platform's outstanding 2,000,000 shares of Series A Preferred Stock and are entitled to receive an annual dividend on such Series A Preferred Stock in the form of shares of the Company's common stock. On December 31, 2014, the Board approved a stock dividend of 10,050,290 shares of Platform's common stock with respect to its outstanding Series A Preferred Stock, which represented 20% of the appreciation of the market price of the Company's common stock over the May 22, 2013 initial public offering price of Platform's stock on the London Stock Exchange of $10.00 multiplied by the total of shares offered in this initial public offering. The dividend price was $22.85 and the shares were issued on January 2, 2015 based on the volume weighted average price of $23.16 on December 31, 2014. Starting with fiscal year 2015, the dividend amount is calculated based on the appreciated stock price compared to the highest dividend price previously used in calculating the Series A Preferred Stock dividends. Based on the dividend price of $22.85 used in 2014, no stock dividends were declared in 2017, 2016 and 2015 with respect to the Series A Preferred Stock.
Each share of Series A Preferred Stock is convertible into one share of common stock of Platform at the option of the holder until December 31, 2020. All outstanding shares of Series A Preferred Stock will be automatically converted into shares of common stock on a one-for-one basis (i) in the event of a change of control of the Company following an acquisition, or (ii) on December 31, 2020 (which may be extended by the Board for three additional years).
Series B Convertible Preferred Stock
On December 13, 2016, in accordance with a settlement agreement dated September 9, 2016, as amended, the Company settled all of its obligations with respect to its then outstanding 600,000 shares of Series B Convertible Preferred Stock, issued to the Arysta Seller in connection with the Arysta Acquisition, and the related make whole payment obligation, as described in the settlement agreement, in exchange for a cash payment of $460 million and the issuance of 5,500,000 shares of its common stock upon conversion of the corresponding shares of Series B Convertible Preferred Stock. The remaining shares of Series B Convertible Preferred Stock were subsequently canceled and retired.
As a result of the settlement agreement, for accounting purposes, the Series B Convertible Preferred Stock had been deemed an extinguishment in exchange for the issuance of another financial instrument. During 2016, the Company recognized a gain of $103 million in "Other (expense) income, net" in the Consolidated Statement of Operations and a gain of $32.9 million in "Net loss attributable to common stockholders." The Company elected the fair value option to measure the preferred stock redemption liability subsequent to the date of the settlement agreement as it most accurately reflected the economics of the transaction and the value of the preferred stock redemption liability. During 2016, the Company recorded a $5.0 million loss associated with the remeasurement of the preferred stock redemption liability, which was recorded to "Other (expense) income, net" in the Consolidated Statement of Operations.
Issuance of Common Stock in Connection with Acquisitions
In connection with the Alent Acquisition, on December 2, 2015, the Company issued 18,419,738 shares of its common stock to Alent shareholders. The shares were issued in reliance upon an exemption from the registration requirements of the Securities Act set forth in Section 3(a)(10) thereof and began trading on the NYSE upon their issuance.
F-43
PLATFORM SPECIALTY PRODUCTS CORPORATION AND SUBSIDIARIES
NOTES TO CONSOLIDATED FINANCIAL STATEMENTS
Non-Controlling Interest
In connection with the MacDermid Acquisition, approximately $97.5 million was raised in new equity consisting of 8,774,527 shares of PDH Common Stock. The PDH Common Stock is classified in the Consolidated Balance Sheets as "Non-controlling interests"at December 31, 2017 and 2016 and will continue to be classified as such until it is fully converted into shares of the Company's common stock. Of the shares initially issued, 3,961,785 have been converted and a like number of shares of the Company's common stock have been issued through December 31, 2017. Non-controlling interest at December 31, 2017, 2016 and 2015, totaled 3.83%, 6.01% and 6.25%, respectively.
During 2017, 2016 and 2015, approximately $2.1 million, $(5.9) million and $(1.4) million, respectively, of net income (loss) has been allocated to the Retaining Holders, as included in the Consolidated Statements of Operations.
15. ACCUMULATED OTHER COMPREHENSIVE (LOSS) INCOME
Changes in each component of accumulated other comprehensive (loss) income, net of tax, during 2017, 2016 and 2015 were as follows:
($ amounts in millions) | Foreign Currency Translation Adjustments | Pension and Post-retirement Plans | Unrealized Gain (Loss) on Available for Sale Securities | Derivative Financial Instrument Revaluation | Non-Controlling Interests | Accumulated Other Comprehensive (Loss) Income | ||||||||||||||||||
Balance at December 31, 2014 | $ | (122.2 | ) | $ | (14.9 | ) | $ | 0.1 | $ | — | $ | 6.4 | $ | (130.6 | ) | |||||||||
Other comprehensive (loss) income before reclassifications, net | (777.1 | ) | (10.9 | ) | 1.1 | (8.1 | ) | 40.0 | (755.0 | ) | ||||||||||||||
Reclassifications, pretax | — | — | — | — | — | — | ||||||||||||||||||
Tax benefit reclassified | — | (0.5 | ) | — | — | — | (0.5 | ) | ||||||||||||||||
Balance at December 31, 2015 | (899.3 | ) | (26.3 | ) | 1.2 | (8.1 | ) | 46.4 | (886.1 | ) | ||||||||||||||
Other comprehensive income (loss) before reclassifications, net | 204.6 | 8.3 | (0.8 | ) | (9.6 | ) | (2.0 | ) | 200.5 | |||||||||||||||
Reclassifications, pretax | — | (0.8 | ) | — | 11.9 | — | 11.1 | |||||||||||||||||
Tax (benefit) expense reclassified | — | — | — | — | — | — | ||||||||||||||||||
Balance at December 31, 2016 | (694.7 | ) | (18.8 | ) | 0.4 | (5.8 | ) | 44.4 | (674.5 | ) | ||||||||||||||
Other comprehensive income (loss) before reclassifications, net | 241.1 | 2.5 | (2.2 | ) | (4.6 | ) | (3.6 | ) | 233.2 | |||||||||||||||
Reclassifications, pretax | — | 10.5 | 0.5 | 10.4 | — | 21.4 | ||||||||||||||||||
Tax (benefit) expense reclassified | — | (2.1 | ) | — | — | — | (2.1 | ) | ||||||||||||||||
Balance at December 31, 2017 | $ | (453.6 | ) | $ | (7.9 | ) | $ | (1.3 | ) | $ | — | $ | 40.8 | $ | (422.0 | ) | ||||||||
F-44
PLATFORM SPECIALTY PRODUCTS CORPORATION AND SUBSIDIARIES
NOTES TO CONSOLIDATED FINANCIAL STATEMENTS
16. LOSS PER SHARE
A computation of weighted average shares of common stock outstanding and loss per share for 2017, 2016 and 2015 follows:
Year Ended December 31, | ||||||||||||
($ amounts in millions, except per share amounts) | 2017 | 2016 | 2015 | |||||||||
Net loss attributable to common stockholders | $ | (296.2 | ) | $ | (40.8 | ) | $ | (308.6 | ) | |||
Numerator adjustments for diluted loss per share: | ||||||||||||
Gain on settlement agreement related to Series B Convertible Preferred Stock | — | (103.0 | ) | — | ||||||||
Gain on amendment of Series B Convertible Preferred Stock | — | (32.9 | ) | — | ||||||||
Remeasurement adjustment associated with the Preferred Series B redemption liability | — | 5.0 | — | |||||||||
Loss allocated to PDH non-controlling interest | — | (5.9 | ) | — | ||||||||
Net loss attributable to common stockholders for diluted loss per share | $ | (296.2 | ) | $ | (177.6 | ) | $ | (308.6 | ) | |||
Basic weighted average common stock outstanding | 286.1 | 243.3 | 203.2 | |||||||||
Denominator adjustments for diluted loss per share: | ||||||||||||
Conversion related to the amendment of the Series B Convertible Preferred Stock - assumed at beginning of reporting period | — | 15.3 | — | |||||||||
Settlement of preferred stock redemption liability - assumed at beginning of reporting period | — | 5.7 | — | |||||||||
Conversion of PDH non-controlling interest | — | 8.0 | — | |||||||||
Share adjustments | — | 29.0 | — | |||||||||
Dilutive weighted average common stock outstanding | 286.1 | 272.3 | 203.2 | |||||||||
Loss per share attributable to common stockholders: | ||||||||||||
Basic | $ | (1.04 | ) | $ | (0.17 | ) | $ | (1.52 | ) | |||
Diluted | $ | (1.04 | ) | $ | (0.65 | ) | $ | (1.52 | ) | |||
Dividends per share paid to common stockholders | $ | — | $ | — | $ | — | ||||||
For 2017, 2016 and 2015, the following securities were not included in the computation of diluted shares outstanding because the effect would be anti-dilutive, or because performance targets and/or market conditions were not yet met for awards contingent upon such measures:
Year Ended December 31, | |||||||||
(amounts in thousands) | 2017 | 2016 | 2015 | ||||||
Shares issuable for the contingent consideration | 7,421 | 8,553 | 4,640 | ||||||
Shares issuable upon conversion of PDH Common Stock | 5,967 | — | 8,318 | ||||||
Shares issuable upon conversion of Series A Preferred Stock | 2,000 | 2,000 | 2,000 | ||||||
Shares issuable upon vesting of RSUs | 842 | 147 | 74 | ||||||
Shares issuable upon vesting and exercise of stock options | 51 | — | 55 | ||||||
Shares issuable under the ESPP | 3 | 2 | 1 | ||||||
Shares issuable upon conversion of Series B Convertible Preferred Stock | — | — | 19,443 | ||||||
Shares contingently issuable to Founder Entities as stock dividend to Series A Preferred Stock | — | — | 1,239 | ||||||
Total shares excluded | 16,284 | 10,702 | 35,770 | ||||||
F-45
PLATFORM SPECIALTY PRODUCTS CORPORATION AND SUBSIDIARIES
NOTES TO CONSOLIDATED FINANCIAL STATEMENTS
17. OPERATING LEASE COMMITMENTS
The Company leases certain land, office space, warehouse space and equipment under agreements which are classified as operating leases for financial statement purposes. Certain of these leases provide for payment of real estate taxes, common area maintenance, insurance and certain other expenses. Lease terms may have escalating rent provisions and rent holidays which are recognized on a straight-line basis over the term of the lease. The leases expire at various dates through 2055.
Total operating lease rental expense for 2017, 2016 and 2015 was $40.2 million, $36.7 million and $22.9 million, respectively.
Minimum future non-cancelable operating lease commitments were as follows:
($ amounts in millions) | Operating Lease Commitments | |||
Year ending December 31, | ||||
2018 | $ | 33.0 | ||
2019 | 25.0 | |||
2020 | 19.6 | |||
2021 | 13.9 | |||
2022 | 12.1 | |||
Thereafter | 28.9 | |||
Total | $ | 132.5 | ||
The fixed operating lease commitments detailed above assume that the Company continues the leases through their initial lease terms.
18. CONTINGENCIES, ENVIRONMENTAL, AND LEGAL MATTERS
Asset Retirement Obligations
The Company has recognized AROs for properties where it can make a reasonable estimate of the future expenditures necessary to satisfy the related obligations. When calculating its ARO liability, the Company considers identified legally-enforceable obligations, estimated settlement dates and appropriate discount and inflation rates.
The Company's ARO liability is included in the Consolidated Balance Sheets as "Accrued expenses and other current liabilities" and "Other liabilities" and totaled $22.3 million and $19.8 million at December 31, 2017 and 2016, respectively.
Environmental Liabilities
The Company is involved in various claims relating to environmental matters at a number of current and former plant sites and waste management sites. The Company engages or participates in remedial and other environmental compliance activities at certain of these sites. At other sites, it has been named as a potential responsible party pursuant to the federal Superfund Act and/or state Superfund laws comparable to the federal law for site remediation. The Company analyzes each individual site, considering the number of parties involved, the level of its potential liability or contribution relating to the other parties, the nature and magnitude of the hazardous wastes involved, the method and extent of remediation, the potential insurance coverage, the estimated legal and consulting expense with respect to each site, and the time period over which any costs would likely be incurred. Based on this analysis, the Company estimates the clean-up costs and related claims for each site. The estimates are based in part on discussions with other potential responsible parties, governmental agencies, and engineering firms.
The Company accrues for environmental matters when it is probable that a liability has been incurred and the amount of the liability can be reasonably estimated based on current laws and existing technologies. The accruals are adjusted periodically as assessment and remediation efforts progress or as additional technical or legal information becomes available. While uncertainty exists with respect to the amount and timing of its ultimate environmental liabilities, the Company does not currently anticipate any material losses in excess of the amount recorded. However, it is possible that new information about these sites, such as results of investigations, could make it necessary for the Company to reassess its potential exposure related to these environmental matters.
F-46
PLATFORM SPECIALTY PRODUCTS CORPORATION AND SUBSIDIARIES
NOTES TO CONSOLIDATED FINANCIAL STATEMENTS
The Company's environmental liability is included in the Consolidated Balance Sheets as "Accrued expenses and other current liabilities" and "Other liabilities," and totaled $28.3 million and $32.6 million at December 31, 2017 and 2016, respectively, primarily in connection with environmental remediation, clean-up costs, and monitoring of sites that were either closed or disposed of in prior years by Alent plc, which the Company acquired in December 2015. As of the date hereof, management does not believe it is possible to develop an estimate of the range of reasonably possible environmental loss in excess of the Company's recorded liabilities, and is unable to ascertain the ultimate aggregate amount of monetary liability or financial impact with respect to these matters.
Legal Proceedings
From time to time, the Company is involved in various legal proceedings in the normal course of its business. The Company believes that the resolution of these claims, to the extent not covered by insurance, will not individually or in the aggregate, have a material adverse effect on the Company's consolidated financial position, results of operations or cash flows.
In June 2009, a private lawsuit was filed in the District Court for the City of Ulianópolis in the State of Pará, Brazil against Arysta LifeScience do Brasil Industria Química e Agropecuária Ltda, or Arysta Brazil, and 25 other defendants in connection with materials sent by Arysta Brazil and others to an incineration site owned and operated by an unaffiliated third-party in the state of Pará, Brazil. In November 2011, the City of Ulianópolis also filed a claim in the District Court for the City of Ulianópolis, against Arysta Brazil and five other defendants on the same grounds. Arysta Brazil was summoned and has filed its answer in connection with both cases. Proceedings have been suspended indefinitely in order for the Pará State Attorney to determine the extent of contamination, the appropriate remediation, and the potentially responsible parties. Damages sought in the private lawsuit include a penalty of BRL 50.0 million ($15.1 million), plus interest and the cost of remediation. The cost of remediation in the case brought by the City of Ulianopolis was previously estimated by the City to be BRL 70.9 million ($21.4 million). In addition, in March 2014 and December 2015, an aggregate number of 29 former employees of the incineration facility brought actions in the Labor Court of Paragominas in the State of Pará, Brazil naming 80 defendants, including Arysta Brazil, seeking compensation in an aggregate amount of BRL 387 million ($117 million) for health problems allegedly contracted as a result of their employment at the incineration site.
The Company is currently contesting several tax assessments in Brazil at various stages of the applicable administrative and judicial processes, with a combined amount at issue, including interest and penalties, of approximately BRL 90.6 million ($27.4 million). Brazil's tax regime is complex, and the administrative and judicial procedures for resolving disputed tax assessments are expensive and time-consuming. Because tax matters in Brazil historically take many years to resolve, it is very difficult to estimate when these matters will be finally resolved. Based on management's judgments, the Company does not expect it will incur a material loss in excess of accrued liabilities.
As previously disclosed, MacDermid Printing has been involved in various lawsuits with DuPont and Cortron involving MacDermid Printing's flexographic printing technology and related business. On June 27, 2017, MacDermid Printing and DuPont reached an agreement to settle and dismiss all their respective lawsuits against each other, as well as MacDermid Printing's lawsuit against Cortron. In connection with the settlement, on July 14, 2017, DuPont made a payment of $20.0 million to MacDermid Printing, and the Company recorded a net settlement gain of $10.8 million in "Other (expense) income, net" in the Consolidated Statement of Operations. This settlement resolves all outstanding litigation between MacDermid Printing, DuPont, and Cortron. Proceeds from the settlement agreement are subject to the pending litigation provisions of the Business Combination Agreement and Plan of Merger dated as of October 10, 2013.
In February 2015, MacDermid, as plaintiff, settled a litigation with Cookson Group plc, Enthone Inc., Cookson Electronics and David North, as defendants, for $25.0 million. The litigation related to certain corporate activities that occurred between MacDermid and the defendants in 2006 and 2007. On April 3, 2015, MacDermid received part of the settlement in the amount of $16.0 million and placed the remainder, net of legal costs, into escrow for future distribution in accordance with the pending litigation provisions of the Business Combination Agreement and Plan of Merger dated as of October 10, 2013.
F-47
PLATFORM SPECIALTY PRODUCTS CORPORATION AND SUBSIDIARIES
NOTES TO CONSOLIDATED FINANCIAL STATEMENTS
19. RELATED PARTY TRANSACTIONS
RHSA
Immediately prior to the closing of the MacDermid Acquisition, each Retaining Holder entered into a RHSA pursuant to which they agreed to exchange their respective interests in MacDermid Holdings for shares of PDH Common Stock, at an exchange rate of $11.00 per share plus, with respect to certain equity interests of MacDermid Holdings held by the Retaining Holder, (i) a proportionate share of a contingent interest in certain pending litigation, and (ii) a proportionate share of up to $100 million of contingent purchase price payable upon the attainment of certain EBITDA and stock trading price performance metrics during the seven-year period following the closing of the MacDermid Acquisition. The resulting non-controlling interest percentage for the Retaining Holders was 3.83% and 6.01% at December 31, 2017 and 2016, respectively.
Since October 31, 2017, all outstanding shares of PDH Common Stock are convertible, at the option of the holder, into a like number of shares of the Company's common stock.
Advisory Services Agreement
The Company is party to an Advisory Services Agreement with Mariposa Capital, LLC, an affiliate of one of the Company's founder directors. Under this agreement, Mariposa Capital, LLC provides certain advisory services to the Company and is entitled to receive an annual fee equal to $2.0 million, which is accrued quarterly and payable in quarterly installments. This agreement is automatically renewed for successive one-year terms unless either party notifies the other party in writing of its intention not to renew no later than 90 days prior to the expiration of the applicable term. This agreement may only be terminated by the Company upon a vote of a majority of its directors. In the event that this agreement is terminated by the Company, the effective date of the termination will be six months following the expiration of the applicable term. Under this agreement, the Company incurred advisory fees totaling $2.0 million during 2017, 2016 and 2015.
Issuance of Common Stock to the Arysta Seller
On December 13, 2016, Platform settled all of its obligations with respect to the Series B Convertible Preferred Stock and the related make-whole payment obligation in exchange for a cash payment of $460 million and the issuance of 5.5 million shares of its common stock to the Arysta Seller or one or more of its affiliates. See Note 14, Stockholders' Equity, to the Consolidated Financial Statements, under the heading "Series B Convertible Preferred Stock."
20. RESTRUCTURING
The Company continuously evaluates its operations in an effort to identify opportunities to improve profitability by leveraging existing infrastructure to reduce operating costs and respond to overall economic conditions.
Restructuring expenses were recorded as follows in each of the Company's business segments:
Year Ended December 31, | ||||||||||||
($ amounts in millions) | 2017 | 2016 | 2015 | |||||||||
Performance Solutions | $ | 23.5 | $ | 25.0 | $ | 6.9 | ||||||
Agricultural Solutions | 7.3 | 6.1 | 18.4 | |||||||||
Total restructuring | $ | 30.8 | $ | 31.1 | $ | 25.3 | ||||||
At December 31, 2017 and 2016, the Company’s restructuring liability was not material.
2017 and 2016 Activity
The restructuring plans initiated within the Performance Solutions segment primarily relate to headcount reductions associated with the integration of the Alent, OMG and OMG Malaysia Acquisitions. The restructuring plans initiated within the Agricultural Solutions segment primarily relate to cost saving opportunities associated with the integration of the Arysta, CAS and Agriphar Acquisitions. There are no material additional costs expected to be incurred related to these discrete restructuring activities.
F-48
PLATFORM SPECIALTY PRODUCTS CORPORATION AND SUBSIDIARIES
NOTES TO CONSOLIDATED FINANCIAL STATEMENTS
2015 Activity
The restructuring activity initiated by the Company's Performance Solutions segment primarily related to cost saving opportunities associated with a realignment of the segment's footprint in the United States, which included the sale of one of its legacy manufacturing sites during the third quarter of 2015, and cost saving opportunities associated with the integration of the Alent Acquisition. The restructuring plans initiated by the Company's Agricultural Solutions segment primarily related to cost saving opportunities associated with the integration of the Arysta, CAS and Agriphar Acquisitions. Both segments also incurred expenses related to several overhead cost reduction initiatives. There are no material additional costs expected to be incurred related to these discrete restructuring activities.
Restructuring expenses were recorded as follows in the Consolidated Statements of Operations:
Year Ended December 31, | ||||||||||||
($ amounts in millions) | 2017 | 2016 | 2015 | |||||||||
Cost of sales | $ | 0.9 | $ | 0.9 | $ | 6.3 | ||||||
Selling, technical, general and administrative | 29.9 | 30.2 | 19.0 | |||||||||
Total restructuring | $ | 30.8 | $ | 31.1 | $ | 25.3 | ||||||
21. OTHER (EXPENSE) INCOME, NET
"Other (expense) income, net," as reported in the Consolidated Statements of Operations, consisted of the following:
Year Ended December 31, | ||||||||||||
($ amounts in millions) | 2017 | 2016 | 2015 | |||||||||
Loss on debt extinguishments | $ | (72.3 | ) | $ | (11.3 | ) | $ | — | ||||
Loss on derivative contracts | (9.5 | ) | (12.5 | ) | (74.0 | ) | ||||||
Non-cash change in fair value of preferred stock redemption liability | — | (5.0 | ) | — | ||||||||
Gain on settlement agreement related to Series B Convertible Preferred Stock | — | 103.0 | — | |||||||||
Legal settlements | 10.8 | — | 17.7 | |||||||||
Sale of intellectual property and product rights | 2.2 | 4.4 | 6.1 | |||||||||
Other income, net | 7.6 | 9.7 | 6.6 | |||||||||
Total | $ | (61.2 | ) | $ | 88.3 | $ | (43.6 | ) | ||||
22. ACCRUED EXPENSES AND OTHER CURRENT LIABILITIES
"Accrued expenses and other current liabilities," as reported in the Consolidated Balance Sheets, consisted of the following:
December 31, | ||||||||
($ amounts in millions) | 2017 | 2016 | ||||||
Accrued customer rebates and sales incentives | $ | 127.7 | $ | 120.7 | ||||
Accrued salaries, wages and employee benefits | 117.0 | 103.5 | ||||||
Accrued income taxes payable | 73.1 | 82.5 | ||||||
Accrued interest | 47.8 | 49.2 | ||||||
Other current liabilities | $ | 225.5 | $ | 227.1 | ||||
Total | $ | 591.1 | $ | 583.0 | ||||
F-49
PLATFORM SPECIALTY PRODUCTS CORPORATION AND SUBSIDIARIES
NOTES TO CONSOLIDATED FINANCIAL STATEMENTS
23. SEGMENT INFORMATION
The Company's operations are organized into two reportable segments: Performance Solutions and Agricultural Solutions. The reporting segments represent businesses for which separate financial information is utilized by the CODM for purpose of allocating resources and evaluating performance. Each of the reportable segments has its own president, who reports to the CODM.
The Company allocates resources and evaluates the performance of its operating segments based primarily on net sales and Adjusted EBITDA. Adjusted EBITDA for each segment is defined as earnings before interest, taxes, depreciation and amortization, as further adjusted for additional items included in earnings that are not considered to be representative or indicative of each segment's ongoing business or considered to be costs associated with the Company's capital structure. Adjusted EBITDA for each segment also includes an allocation of corporate costs, such as compensation expense and professional fees, which totaled $31.4 million and $32.8 million during 2017 and 2016, respectively. During 2015, Performance Solutions and Agricultural Solutions were allocated corporate costs of $12.0 million and $36.0 million, respectively.
The following table summarizes financial information regarding each reportable segment’s results of operations:
Year Ended December 31, | ||||||||||||
(amounts in millions) | 2017 | 2016 | 2015 | |||||||||
Net Sales: | ||||||||||||
Performance Solutions | $ | 1,878.6 | $ | 1,770.1 | $ | 800.8 | ||||||
Agricultural Solutions | 1,897.3 | 1,815.8 | 1,741.5 | |||||||||
Total | $ | 3,775.9 | $ | 3,585.9 | $ | 2,542.3 | ||||||
Depreciation and amortization: | ||||||||||||
Performance Solutions | $ | 155.0 | $ | 156.5 | $ | 80.0 | ||||||
Agricultural Solutions | 199.2 | 185.8 | 171.0 | |||||||||
Total | $ | 354.2 | $ | 342.3 | $ | 251.0 | ||||||
Capital expenditures and product registrations: | ||||||||||||
Performance Solutions | $ | 29.3 | $ | 29.3 | $ | 17.6 | ||||||
Agricultural Solutions | 70.6 | 63.4 | 64.7 | |||||||||
Total | $ | 99.9 | $ | 92.7 | $ | 82.3 | ||||||
Adjusted EBITDA: | ||||||||||||
Performance Solutions | $ | 432.7 | $ | 401.3 | $ | 224.3 | ||||||
Agricultural Solutions | 388.2 | 368.2 | 343.4 | |||||||||
Total | $ | 820.9 | $ | 769.5 | $ | 567.7 | ||||||
F-50
PLATFORM SPECIALTY PRODUCTS CORPORATION AND SUBSIDIARIES
NOTES TO CONSOLIDATED FINANCIAL STATEMENTS
The following table reconciles "Net loss attributable to common stockholders" to Adjusted EBITDA:
Year Ended December 31, | ||||||||||||
($ amounts in millions) | 2017 | 2016 | 2015 | |||||||||
Net loss attributable to common stockholders | $ | (296.2 | ) | $ | (40.8 | ) | $ | (308.6 | ) | |||
Add (subtract): | ||||||||||||
Gain on amendment of Series B Convertible Preferred Stock | — | (32.9 | ) | — | ||||||||
Net income (loss) attributable to the non-controlling interests | 0.6 | (3.0 | ) | 4.2 | ||||||||
Income tax expense | 6.6 | 28.6 | 75.1 | |||||||||
Interest expense, net | 341.6 | 375.7 | 213.9 | |||||||||
Depreciation expense | 78.3 | 75.0 | 48.9 | |||||||||
Amortization expense | 275.9 | 267.3 | 202.1 | |||||||||
EBITDA | 406.8 | 669.9 | 235.6 | |||||||||
Adjustments to reconcile to Adjusted EBITDA: | ||||||||||||
Restructuring expense | 30.8 | 31.1 | 25.3 | |||||||||
Amortization of inventory step-up | — | 11.7 | 76.5 | |||||||||
Acquisition and integration costs | 4.8 | 33.4 | 122.4 | |||||||||
Non-cash change in fair value of contingent consideration | 3.4 | 5.1 | 6.8 | |||||||||
Legal settlements | (10.8 | ) | (2.8 | ) | (16.0 | ) | ||||||
Foreign exchange loss on foreign denominated external and internal long-term debt | 102.5 | 33.9 | 46.4 | |||||||||
Debt refinancing costs | 83.2 | 19.7 | — | |||||||||
Fair value loss on foreign exchange forward contract | — | — | 73.7 | |||||||||
Goodwill impairment | 160.0 | 46.6 | — | |||||||||
Gain on settlement agreement related to Series B Convertible Preferred Stock | — | (103.0 | ) | — | ||||||||
Non-cash change in fair value of preferred stock redemption liability | — | 5.0 | — | |||||||||
Costs related to Proposed Separation | 12.1 | — | — | |||||||||
Pension plan settlement and curtailment | 10.5 | 1.8 | — | |||||||||
Other, net | 17.6 | 17.1 | (3.0 | ) | ||||||||
Adjusted EBITDA | $ | 820.9 | $ | 769.5 | $ | 567.7 | ||||||
Total Net Sales by Major Country
A major country is defined as one with total net sales by geographic area based on the country where sales were generated greater than 10% of the total consolidated net sales in any of the years presented.
Year Ended December 31, | ||||||||||||
(amounts in millions) | 2017 | 2016 | 2015 | |||||||||
United States | $ | 654.7 | $ | 725.4 | $ | 474.6 | ||||||
Brazil | 476.7 | 463.0 | 380.6 | |||||||||
Other countries | 2,644.5 | 2,397.5 | 1,687.1 | |||||||||
Total | $ | 3,775.9 | $ | 3,585.9 | $ | 2,542.3 | ||||||
F-51
PLATFORM SPECIALTY PRODUCTS CORPORATION AND SUBSIDIARIES
NOTES TO CONSOLIDATED FINANCIAL STATEMENTS
Long-Lived Assets by Major Country
A major country is defined as one with long-lived assets greater than 10% of the total long-lived assets, net in any of the years presented. Long-lived assets represent property, plant and equipment, net.
December 31, | ||||||||
(amounts in millions) | 2017 | 2016 | ||||||
United States | $ | 122.2 | $ | 137.4 | ||||
France | 48.2 | 47.2 | ||||||
China | 42.0 | 47.3 | ||||||
Other countries | 239.9 | 228.6 | ||||||
Total | $ | 452.3 | $ | 460.5 | ||||
Total assets by reportable segment at December 31, 2017 and 2016 are not presented as they are not utilized by the CODM, for purposes of allocating resources and evaluating performance.
The following table shows the Company's external party sales by product category for the periods presented:
Year Ended December 31, | ||||||||||||
(amounts in millions) | 2017 | 2016 | 2015 | |||||||||
Performance Solutions | ||||||||||||
Assembly Solutions | $ | 629.7 | $ | 554.5 | $ | 41.1 | ||||||
Electronics Solutions | 538.7 | 525.9 | 198.8 | |||||||||
Industrial Solutions | 482.2 | 445.0 | 287.8 | |||||||||
Graphics Solutions | 153.4 | 171.8 | 173.9 | |||||||||
Offshore Solutions | 74.6 | 72.9 | 99.2 | |||||||||
Performance Solutions sales | 1,878.6 | 1,770.1 | 800.8 | |||||||||
Agricultural Solutions | ||||||||||||
Agricultural Solutions | 1,873.9 | 1,794.3 | 1,727.9 | |||||||||
Animal Health | 23.4 | 21.5 | 13.6 | |||||||||
Agricultural Solutions | 1,897.3 | 1,815.8 | 1,741.5 | |||||||||
Total | $ | 3,775.9 | $ | 3,585.9 | $ | 2,542.3 | ||||||
24. SUPPLEMENTARY DATA
2017 | ||||||||||||||||
($ amounts in millions, except per share amounts) | First Quarter | Second Quarter | Third Quarter | Fourth Quarter | ||||||||||||
Selected Quarterly Financial Data (Unaudited) | ||||||||||||||||
Net sales | $ | 861.8 | $ | 941.1 | $ | 904.3 | $ | 1,068.7 | ||||||||
Gross profit | 378.4 | 399.9 | 371.1 | 439.6 | ||||||||||||
Net loss attributable to stockholders | (24.4 | ) | (61.1 | ) | (69.2 | ) | (141.5 | ) | ||||||||
Net loss attributable to common stockholders | (24.4 | ) | (61.1 | ) | (69.2 | ) | (141.5 | ) | ||||||||
Loss per share | ||||||||||||||||
Basic | $ | (0.09 | ) | $ | (0.21 | ) | $ | (0.24 | ) | $ | (0.49 | ) | ||||
Diluted | (0.09 | ) | (0.21 | ) | (0.24 | ) | (0.49 | ) | ||||||||
F-52
PLATFORM SPECIALTY PRODUCTS CORPORATION AND SUBSIDIARIES
NOTES TO CONSOLIDATED FINANCIAL STATEMENTS
2016 | ||||||||||||||||
($ amounts in millions, except per share amounts) | First Quarter | Second Quarter | Third Quarter | Fourth Quarter | ||||||||||||
Selected Quarterly Financial Data (Unaudited) | ||||||||||||||||
Net sales | $ | 823.8 | $ | 921.6 | $ | 890.5 | $ | 950.0 | ||||||||
Gross profit | 356.0 | 380.6 | 375.1 | 396.0 | ||||||||||||
Net (loss) income attributable to stockholders | (134.8 | ) | (8.8 | ) | 71.8 | (1.9 | ) | |||||||||
Net (loss) income attributable to common stockholders | (134.8 | ) | (8.8 | ) | 104.7 | (1.9 | ) | |||||||||
(Loss) earnings per share | ||||||||||||||||
Basic | $ | (0.59 | ) | $ | (0.04 | ) | $ | 0.45 | $ | (0.01 | ) | |||||
Diluted | (0.59 | ) | (0.04 | ) | (0.15 | ) | (0.01 | ) | ||||||||
F-53
Schedule II
Platform Specialty Products Corporation
Valuation and Qualifying Accounts and Reserves
(amounts in millions) | Balance at beginning of period | Charges to costs and expense | Deductions from reserves and other (1) | Balance at end of period | ||||||||||||
Reserves against accounts receivable: | ||||||||||||||||
2017 | $ | (36.7 | ) | $ | (10.0 | ) | $ | (0.9 | ) | $ | (47.6 | ) | ||||
2016 | (14.4 | ) | (19.0 | ) | (3.3 | ) | (36.7 | ) | ||||||||
2015 | (9.6 | ) | (9.2 | ) | 4.4 | (14.4 | ) | |||||||||
(1) | Other activity consists primarily of currency translation effects. |
F-54