Attached files
| file | filename |
|---|---|
| EX-32.2 - EX-32.2 - ICF International, Inc. | icfi-ex322_7.htm |
| EX-32.1 - EX-32.1 - ICF International, Inc. | icfi-ex321_8.htm |
| EX-31.2 - EX-31.2 - ICF International, Inc. | icfi-ex312_6.htm |
| EX-31.1 - EX-31.1 - ICF International, Inc. | icfi-ex311_10.htm |
| EX-23.1 - EX-23.1 - ICF International, Inc. | icfi-ex231_9.htm |
| EX-21.0 - EX-21.0 - ICF International, Inc. | icfi-ex210_11.htm |
UNITED STATES
SECURITIES AND EXCHANGE COMMISSION
Washington, D.C. 20549
Form 10-K
(Mark One)
|
☒ |
ANNUAL REPORT PURSUANT TO SECTION 13 OR 15(d) OF THE SECURITIES EXCHANGE ACT OF 1934 |
For the fiscal year ended December 31, 2017
Commission File Number: 001-33045
ICF INTERNATIONAL, INC.
(Exact name of Registrant as specified in its charter)
|
Delaware |
|
22-3661438 |
|
(State or other jurisdiction of incorporation or organization) |
|
(IRS Employer Identification Number) |
|
|
|
|
|
9300 Lee Highway Fairfax, VA |
|
22031 |
|
(Address of principal executive offices) |
|
(Zip Code) |
Registrant’s telephone number, including area code:
(703) 934-3000
Securities Registered Pursuant to Section 12(b) of the Act:
|
Title of Each Class |
|
Name of Exchange on which Registered |
|
Common Stock, $0.001 par value |
|
The NASDAQ Stock Market LLC |
Indicate by check mark if the registrant is a well-known seasoned issuer, as defined in Rule 405 of the Securities Act. Yes ☐ No ☒
Indicate by check mark if the registrant is not required to file reports pursuant to Section 13 or Section 15(d) of the Act. Yes ☐ No ☒
Indicate by check mark whether the registrant: (1) has filed all reports required to be filed by Section 13 or 15(d) of the Securities Exchange Act of 1934 during the preceding 12 months (or for such shorter period that the Registrant was required to file such reports), and (2) has been subject to such filing requirements for the past 90 days. Yes ☒ No ☐
Indicate by check mark whether the registrant has submitted electronically and posted on its corporate website, if any, every Interactive Data File required to be submitted and posted pursuant to Rule 405 of Regulation S-T (§232.405 of this chapter) during the preceding 12 months (or for such shorter period that the registrant was required to submit and post such files). Yes ☒ No ☐
Indicate by check mark if disclosure of delinquent filers pursuant to Item 405 of Regulation S-K is not contained herein, and will not be contained, to the best of registrant’s knowledge, in definitive proxy or information statements incorporated by reference in Part III of this Form 10-K or any amendment to this Form 10-K. ☐
Indicate by check mark whether the registrant is a large accelerated filer, an accelerated filer, a non-accelerated filer, a smaller reporting company or emerging growth company. See the definitions of “large accelerated filer,” “accelerated filer,” “smaller reporting company” and “emerging growth company” in Rule 12b-2 of the Exchange Act. (Check one):
|
Large accelerated filer |
☒ |
|
Accelerated filer |
☐ |
|
Non-accelerated filer |
☐ |
|
Smaller reporting company |
☐ |
|
|
|
|
Emerging growth company |
☐ |
If an emerging growth company, indicate by check mark if the registrant has elected not to use the extended transition period for complying with any new or revised financial accounting standards provided pursuant to Section 13(a) of the Ex-change Act. ☐
Indicate by check mark whether the registrant is a shell company (as defined in Rule 12b-2 of the Exchange Act). Yes ☐ No ☒
The aggregate market value of the voting and non-voting common equity held by non-affiliates of the Registrant as of the last business day of the Registrant’s most recently completed second fiscal quarter was approximately $855 million based upon the closing price per share of $47.10, as quoted on the NASDAQ Global Select Market on June 30, 2017. Shares of the outstanding common stock held by each executive officer and director have been excluded in that such persons may be deemed to be affiliates. This determination of affiliate status is not necessarily a conclusive determination for other purposes.
As of February 23, 2018, 18,620,794 shares of the Registrant’s common stock, $0.001 par value, were outstanding.
DOCUMENTS INCORPORATED BY REFERENCE
Part III incorporates information by reference from the Proxy Statement for the 2018 Annual Meeting of Stockholders expected to be held in May 2018.
|
|
|
|
|
|
4 |
|||
|
|
|
||
|
ITEM 1. |
|
4 |
|
|
|
|
|
|
|
ITEM 1A. |
|
15 |
|
|
|
|
|
|
|
ITEM 1B. |
|
27 |
|
|
|
|
|
|
|
ITEM 2. |
|
27 |
|
|
|
|
|
|
|
ITEM 3. |
|
27 |
|
|
|
|
|
|
|
ITEM 4. |
|
27 |
|
|
|
|
|
|
|
|
|||
|
28 |
|||
|
|
|
||
|
ITEM 5. |
|
28 |
|
|
|
|
|
|
|
ITEM 6. |
|
31 |
|
|
|
|
|
|
|
ITEM 7. |
|
Management’s Discussion and Analysis of Financial Condition and Results of Operations |
32 |
|
|
|
|
|
|
ITEM 7A. |
|
47 |
|
|
|
|
|
|
|
ITEM 8. |
|
47 |
|
|
|
|
|
|
|
ITEM 9. |
|
Changes in and Disagreements with Accountants on Accounting and Financial Disclosure |
47 |
|
|
|
|
|
|
ITEM 9A. |
|
48 |
|
|
|
|
|
|
|
ITEM 9B. |
|
48 |
|
|
|
|
|
|
|
|
|||
|
49 |
|||
|
|
|
||
|
ITEM 10. |
|
49 |
|
|
|
|
|
|
|
ITEM 11. |
|
49 |
|
|
|
|
|
|
|
ITEM 12. |
|
Security Ownership of Certain Beneficial Owners and Management and Related Stockholder Matters |
49 |
|
|
|
|
|
|
ITEM 13. |
|
Certain Relationships and Related Transactions, and Director Independence |
49 |
|
|
|
|
|
|
ITEM 14. |
|
49 |
|
|
|
|
|
|
|
|
|||
|
50 |
|||
|
|
|
||
|
ITEM 15. |
|
50 |
|
2
Some of the statements in this Annual Report on Form 10-K constitute forward-looking statements as defined in the Private Securities Litigation Reform Act of 1995, as amended. These statements involve known and unknown risks, uncertainties, and other factors that may cause our actual results, levels of activity, performance, or achievements to be materially different from any future results, levels of activity, performance, or achievements expressed or implied by such forward-looking statements. In some cases, you can identify these statements by forward-looking words such as “anticipate,” “believe,” “could,” “estimate,” “expect,” “intend,” “may,” “plan,” “potential,” “should,” “will,” “would,” or similar words. You should read statements that contain these words carefully. The risk factors described in Item 1A of Part I of this Annual Report on Form 10-K captioned “Risk Factors,” or otherwise described in our filings with the Securities and Exchange Commission (“SEC”), as well as any cautionary language in this Annual Report on Form 10-K, provide examples of risks, uncertainties, and events that may cause our actual results to differ materially from the expectations we describe in our forward-looking statements, including, but not limited to:
|
|
• |
Our dependence on contracts with United States (“U.S.”) federal, state and local, and international governments, agencies and departments for the majority of our revenue; |
|
|
• |
Changes in federal government budgeting and spending priorities; |
|
|
• |
Failure by Congress or other governmental bodies to approve budgets in a timely fashion and reductions in government spending including, but not limited to, budgetary cuts resulting from automatic sequestration under the Budget Control Act of 2011, which was impacted in a positive way for us by the Bipartisan Budget Act of 2018 that became law on February 9, 2018; |
|
|
• |
Uncertainties concerning the impact of the Tax Cuts and Jobs Act enacted in late 2017; |
|
|
• |
Results of routine and non-routine government audits and investigations; |
|
|
• |
Dependence of our commercial work on certain sectors of the global economy that are highly cyclical; |
|
|
• |
Failure to receive the full amount of our backlog; |
|
|
• |
Difficulties in integrating acquisitions generally; |
|
|
• |
Risks resulting from expanding our service offerings and client base; |
|
|
• |
The lawsuit filed by the State of Louisiana seeking approximately $220.2 million in alleged overpayments from the Road Home contract; and |
|
|
• |
Additional risks as a result of having international operations. |
Our forward-looking statements are based on the beliefs and assumptions of our management and the information available to our management at the time these disclosures were prepared. Although we believe the expectations reflected in these statements are reasonable, we cannot guarantee future results, levels of activity, performance, or achievements. You should not place undue reliance on these forward-looking statements, which apply only as of the date of this Annual Report on Form 10-K. We undertake no obligation to update these forward-looking statements, even if our situation changes in the future.
The terms “we,” “our,” “us,” and “the Company,” as used throughout this Annual Report on Form 10-K, refer to ICF International, Inc. and its consolidated subsidiaries, unless otherwise indicated. The term “federal” or “federal government” refers to the U.S. federal government, and “state and local” or “state and local government” refers to U.S. state and local governments, unless otherwise indicated.
3
COMPANY OVERVIEW
We provide professional services and technology-based solutions to government and commercial clients, including management, marketing, technology, and policy consulting and implementation services. We help our clients conceive, develop, implement, and improve solutions that address complex business, natural resource, social, technological, and public safety issues. Our services primarily support clients that operate in four key markets:
|
|
• |
Energy, Environment, and Infrastructure, |
|
|
• |
Health, Education, and Social Programs, |
|
|
• |
Safety and Security, and |
|
|
• |
Consumer and Financial. |
We provide services across these four markets that deliver value throughout the entire life cycle of a policy, program, project, or initiative. Our primary services include:
|
|
• |
Advisory Services. We research critical policy, industry, and stakeholder issues, trends, and behavior. We measure and evaluate results and their impact and, based on those assessments, provide strategic planning and advice to our clients on how to navigate societal, market, business, communication, and technology challenges. |
|
|
• |
Program Implementation Services. We identify, define, and implement policies, plans, programs, and business tools that make our clients’ organizations more effective and efficient. Our comprehensive, end-to-end solutions are implemented through a wide range of standard and customized methodologies designed to match our clients’ business context. |
|
|
• |
Analytics Services. We conduct survey research and collect and analyze wide varieties and large volumes of data to understand critical issues and options for our clients and provide actionable business intelligence. We provide information and data management solutions that allow for integrated, purpose-driven data usage. |
|
|
• |
Digital Services. We design, develop, and implement cutting-edge technology systems and business tools that are key to our clients’ mission or business performance, and include solutions to optimize the customer and citizen experience for our clients. We provide cybersecurity solutions that support the full range of cybersecurity missions and protect evolving IT infrastructures in the face of relentless threats. |
|
|
• |
Engagement Services. We inform and engage our clients’ constituents, customers, and employees to drive behavior and outcomes through public relations, branding and marketing, multichannel and strategic communications, and reputation issues management. Our engagement services frequently rely on our digital design and implementation skills, such as web and app development. |
We perform work for both government and commercial clients. Our government clients include U.S. federal clients, state and local clients, as well as governments outside the U.S. Our commercial clients include both U.S. and international clients. Our clients utilize our services because we offer a combination of deep subject matter expertise, technical solutions, and institutional experience which ensures that our solutions are beneficial. We believe that our domain expertise and the program knowledge developed from our advisory engagements further position us to provide our full suite of services.
We report operating results and financial data in one operating and reportable segment. We generated revenue of $1,229.2 million, $1,185.1 million, and $1,132.2 million in 2017, 2016, and 2015, respectively. Our total backlog was approximately $2,051.4 million, $2,122.7 million, and $1,817.4 million as of December 31, 2017, 2016, and 2015, respectively.
As of December 31, 2017, we had more than 5,500 employees around the globe, including many recognized as thought leaders in their respective fields. We serve clients globally from our headquarters in the Washington, D.C. metropolitan area, our more than 59 regional offices throughout the U.S., and more than 23 offices outside the U.S., including offices in the United Kingdom (“U.K.”), Belgium, China, India and Canada.
4
OUR COMPANY INFORMATION
ICF International, Inc. began as a Delaware limited liability company formed in 1999 under the name ICF Consulting Group Holdings, LLC. It was formed to purchase our principal operating subsidiary, which was founded in 1969, from a larger services organization. A number of our current senior managers participated in this transaction, along with private equity investors. We converted to a Delaware corporation in 2003 and changed our name to ICF International, Inc. in 2006. We completed our initial public offering in October 2006.
Our principal executive office is located at 9300 Lee Highway, Fairfax, Virginia 22031, and our telephone number is (703) 934-3000. We maintain an internet website at www.icf.com. We make available our Annual Reports on Form 10-K, Quarterly Reports on Form 10-Q, Current Reports on Form 8-K, and amendments to such reports filed or furnished pursuant to Section 13(a) or 15(d) of the Securities Exchange Act of 1934, as amended (the “Exchange Act”), and other information related to us, free of charge, on this site as soon as reasonably practicable after we electronically file those documents with, or otherwise furnish them to, the SEC. Our internet website and the information contained therein or connected thereto are not intended to be incorporated into this Annual Report on Form 10-K.
MARKET OPPORTUNITY, SERVICES, AND SOLUTIONS
Complex, long-term market factors, which include geopolitical, environmental and demographic trends, are changing the way people live and the way government and industry operate and interact. Some of these factors have significant impacts on the markets in which our clients operate.
In the energy, environment, and infrastructure market, these factors include: the changing mix of sources used to generate electricity and the related policy and infrastructure issues resulting from those changes; the changing position of the U.S. in the world’s energy markets overall; an ongoing focus on renewables, energy efficiency, climate change, and resilience; an aging transportation infrastructure; increasing drought and need to invest in water infrastructure and conservation; and environmental degradation.
In the health, education, and social programs market, these factors include: the increasing level of healthcare expenditures and efforts at healthcare reform; global public health and health security issues, including potential global epidemics; aging populations across the globe; increasing military and veteran health demands; continued focus on disease prevention; the perceived declining performance of the U.S. educational system compared to other countries; and the desire to find more efficient means to deliver social and educational programs.
In the safety and security market, these factors include: the continuing spectrum of all-hazard threats, including cybersecurity threats, terrorism, severe weather and climatological changes, as well as infrastructure protection.
In the consumer and financial market, these factors include increased use of interactive data technologies to link organizations with consumers and other stakeholders in more varied and personalized ways, and less reliance on traditional print and television marketing; changing industry structures in marketing and advertising services; the desire for greater return on marketing investment; and the continued elevation of data analytics as a business management and marketing tool.
In addition to these market-based factors, trends across all of our markets are increasing the demand for advisory services that drive our business. These trends include: increased government focus on efficiency and mission performance management; generational changes; the emphasis on transparency and accountability; and an increased demand for combining domain knowledge of client mission and programs with innovative technology-enabled solutions. We see growth opportunities for technology-based solutions involving digital services and strategic communications across all of our markets.
We believe that demand for our services will continue as government, industry, and other stakeholders seek to understand and respond to these and other factors. We expect that our government clients will continue to utilize professional services firms with relevant domain expertise to assist with designing new programs, enhancing existing ones, offering transformational solutions, and deploying innovative information and communications technology. In addition, commercial organizations affected by these programs will need to understand such changes, as well as their implications, in order for them to plan appropriately. More broadly, we believe our commercial clients will demand innovative services and solutions that can help them connect with customers and stakeholders in
5
an increasingly connected and crowded marketplace. We believe that our institutional knowledge and subject matter expertise are a distinct competitive advantage in providing our clients with practical, innovative solutions, which are directly applicable to their mission or business, and deploying them quickly with the right resources. Moreover, we believe we will be able to leverage the domain expertise and program knowledge we have developed through advisory assignments and our experience with program management, technology-based solutions, and engagement projects to win larger engagements, which generally lead to increasing returns on business development investment and promote higher employee utilization. Rapid changes in technology, including the omnipresent influence of mobile, social, and cloud technologies, also demand new ways of communicating, evaluating and implementing programs, and we are focused on leveraging our expertise in technology to capitalize on those changes.
Our future results will depend on the success of our strategy to capitalize on our competitive strengths, including our success in maintaining our long-standing client relationships, to seek larger engagements across the program life cycle and to complete and successfully integrate strategic acquisitions. We will continue to focus on building scale in vertical and horizontal domain expertise; developing business with both our government and commercial clients; and replicating our business model geographically in selected regions of the world. In doing so, we will continue to evaluate strategic acquisition opportunities that enhance our subject matter knowledge, broaden our service offerings, and/or provide scale in specific geographies.
Energy, Environment, and Infrastructure
For decades, we have advised on energy and environmental issues, including the impact of human activity on natural resources, and have helped develop solutions for infrastructure-related challenges. In addition to addressing government policy and regulation in these areas, our work focuses on industries that are affected by these policies and regulations - particularly those industries most heavily involved in the use and delivery of energy. Significant factors affecting suppliers, users, and regulators of energy are driving private and public sector demand for professional services firms, including:
|
|
• |
Changing power markets, increasingly diverse sources of supply, and an increased demand for alternative sources of energy and/or energy storage; |
|
|
• |
Ongoing efforts to upgrade energy infrastructure to meet new power, transmission, environmental, and cybersecurity requirements and to enable more distributed forms of generation; and |
|
|
• |
The need to manage energy demand and increase efficient energy use in an era of environmental concerns, especially regarding carbon and other emissions. |
We assist energy enterprises worldwide in their efforts to analyze, develop, and implement strategies related to their business operations and the interrelationships of those operations with the environment and applicable government regulations. We utilize our policy expertise, deep industry knowledge, and proprietary modeling tools to advise government and commercial clients on key topics related to electric power, traditional fuels, and renewable sources of energy. Our areas of expertise include power market analysis and modeling, transmissions analysis, electric system reliability standards, energy asset valuation and due diligence, regulatory and litigation support, fuels market analysis, air regulatory strategy, and renewable energy and green power.
We also assist commercial and government clients in designing, implementing, and evaluating demand side management programs both for residential and for commercial and industrial sectors. Utility companies must balance the changing demand for energy with a price-sensitive, environmentally conscious consumer base. We help utilities meet these needs, guiding them through the entire life cycle of energy efficiency and related demand side management programs, including policy and planning, determining technical requirements, and program implementation and improvement.
Carbon emissions have been an important focus of federal government regulation, international governments, many state and local governments, and multinational corporations around the world. Reducing or offsetting greenhouse gas (“GHG”) emissions continues to be the subject of both public and private sector interest, and the regulatory landscape in this area is still evolving. The need to address carbon and other harmful emissions has significantly changed the way the world’s governments and industries interact and continues to be one of the drivers of interest in energy efficiency. Moreover, how government and business adapt to the effects of climate change continues to be of global importance. We support governments at the federal and state and local level, including providing comprehensive support to NASA’s Global Change Research Program. Additionally, we support ministries and agencies of the government of the U.K. and European Commission, as well as commercial clients, on these and related issues.
6
We also have decades of experience in designing, evaluating, and implementing environmental policies and environmental compliance programs for transportation (including aviation) and other infrastructure projects. A number of key issues are driving increased demand for the services we provide in these areas, including:
|
|
• |
Increased focus on the proper stewardship of natural resources; |
|
|
• |
Aging water, energy, and transportation infrastructure, particularly in the U.S.; |
|
|
• |
The increasing exposure of infrastructure to damage and interference by severe weather events influenced by a changing climate; |
|
|
• |
Under-investment historically in transportation infrastructure; and |
|
|
• |
Changing patterns of economic development that require transportation systems and energy infrastructure to adapt to new patterns of demand. |
By leveraging our interdisciplinary skills, which range from finance and economics to earth and life sciences, information technology, and program management, we are able to provide a wide range of services that include complex environmental impact assessments, environmental management information systems, air quality assessments, program evaluation, transportation and aviation planning and operational improvement, strategic communications, and regulatory reinvention. We help clients deal specifically with the interrelated environmental, business, and social implications of issues surrounding all transportation modes and infrastructure. From the environmental management of complex infrastructure engagements to strategic and operational concerns of airlines and airports, our solutions draw upon our expertise and institutional knowledge in transportation, urban and land use planning, industry management practices, financial analysis, environmental sciences, and economics.
Health, Education, and Social Programs
We also apply our expertise across our full suite of services in the areas of health, education, and social programs. We believe that a confluence of factors will drive an increased need for public and private focus on these areas, including, among others:
|
|
• |
Expanded healthcare services to underserved segments of the population; |
|
|
• |
Rising healthcare expenditures, which require the evaluation of the effectiveness and efficiency of current and new programs; |
|
|
• |
Growing awareness of the threats from the global spread of disease; |
|
|
• |
The emphasis on improving the effectiveness of the U.S. and other countries’ educational systems; |
|
|
• |
The need for greater transparency and accountability of public sector programs; |
|
|
• |
A continued high need for social support systems; |
|
|
• |
The need to recover from natural disasters such as hurricanes, wildfires, and earthquakes; |
|
|
• |
A changing regulatory environment; and |
|
|
• |
Military personnel returning home from active duty with health and social service needs. |
We believe we are well positioned to provide our services to help our clients develop and manage effective programs in the areas of health, education, and social programs at the international, regional, national, and local levels. Our subject matter expertise includes public health, mental health, international health and development, health communications and associated interactive technologies, education, child and family welfare needs, housing and communities, and substance abuse. Our combination of domain knowledge and our experience in information technology-based applications provides us with strong capabilities in health and social programs informatics and analytics, which we believe will be of increasing importance as the need to manage information grows. We partner with our clients in the government and commercial sectors to increase their knowledge base, support program development, enhance program operations, evaluate program results, and improve program effectiveness.
In the area of public health, we support many agencies and programs within the U.S. Department of Health and Human Services (“HHS”) (including the National Institutes of Health (“NIH”) and the Centers for Disease Control and Prevention (“CDC”)) by conducting primary data collection and analyses, assisting in
7
designing, delivering and evaluating programs, managing technical assistance centers, providing instructional systems, developing information technology applications, and managing information clearinghouse operations. Increasingly, we provide multichannel communications and messaging for public health programs using capabilities similar to our commercial marketing business. We also provide training and technical assistance for early care and educational programs (such as Head Start), and health and demographic surveys in developing countries for the U.S. Department of State (“DOS”). In the area of social programs, we provide extensive training, technical assistance, and program analysis and support services for a number of the housing and disaster recovery programs of the U.S. Department of Housing and Urban Development (“HUD”) and state and local governments. In addition, we provide research, program design, evaluation, and training for educational initiatives at the federal and state level. We provide similar services to a variety of U.K. ministries, as well as several Directorates-General of the European Commission.
Safety and Security
Safety and security programs continue to be a critical priority of the federal government, state and local governments, international governments (especially in Europe), and in the commercial sector. We believe we are positioned to meet the following key safety concerns:
|
|
• |
Vulnerability of critical infrastructure to cyber and terrorist threats; |
|
|
• |
Increasing risks to enterprises’ reputations in the wake of a cyber-attack; |
|
|
• |
Broadened homeland security concerns that include areas such as health, food, energy, water, and transportation; |
|
|
• |
Reassessment of the emergency management functions of homeland security in the face of natural disasters; |
|
|
• |
Safety issues around crime and at-risk behavior; |
|
|
• |
Increased dependence on private sector personnel and organizations in emergency response; and |
|
|
• |
The need to ensure that critical functions and sectors are resilient and able to recover quickly after attacks or disasters. |
These security concerns create demand for government programs that can identify, prevent, and mitigate key cybersecurity and disaster impacts and the societal issues they cause.
In addition, the U.S. Department of Defense (“DoD”) is undergoing major transformations in its approach to strategies, processes, organizational structures, and business practices due to several complex, long-term factors, including:
|
|
• |
The changing nature of global security threats, including cybersecurity threats; |
|
|
• |
Family issues associated with globally-deployed armed forces; |
|
|
• |
The increasing use of commercial cloud computing infrastructure and services to support the DoD enterprise; and |
|
|
• |
The increasing need for real-time information sharing and logistics modernization and network-centric planning requirements, and the global nature of conflict arenas. |
We provide key services to DoD, the U.S. Department of Homeland Security (“DHS”), U.S. Department of Justice (“DOJ”), and analogous Directorates-General at the European Commission. We support DoD by providing high-end strategic planning, analysis, and technology-based solutions in the areas of logistics management, operational support, command and control, and cybersecurity. We also provide the defense sector with critical infrastructure protection, environmental management, human capital assessment, military community research, and technology-enabled solutions. At DHS, we assist in shaping and managing critical programs to ensure the safety of communities, developing critical infrastructure protection plans and processes, establishing goals and capabilities for national preparedness at all levels of government in the U.S., and managing the national program to test radiological emergency preparedness at the state and local government levels in communities adjacent to nuclear power facilities. At DOJ, we provide technical and communications assistance to programs that help victims of crime and at-risk youths. At the European Commission, we provide support and analytical services related to justice and home affairs issues within the European context.
8
Consumer and Financial Markets
In the area of consumer and financial markets, we combine our expertise in strategic communications, marketing and creative services and public relations with our strengths in interactive and mobile technologies to help companies develop stronger relationships and engage with their customers and stakeholders across all channels, whether via traditional or digital media, to drive better operating results. In an effort to enhance our positioning and build awareness outside of our traditional client set, we have combined capabilities from strategic acquisitions to create a full-service, technology-rooted advertising agency that guides brands digitally through informed strategy, inspired creative design, and technical know-how. We have the capability to complete projects big or small across all channels (including web, social, mobile, intranet and emerging platforms) through end-to-end technology-based implementations for local and global clients. Target customer areas include airlines, airports, electric and gas utilities, oil companies, banks and other financial services companies, transportation, travel and hospitality firms, non-profits/associations, law firms, manufacturing firms, retail chains, and distribution companies.
COMPETITIVE STRENGTHS
We possess the following key business strengths:
We have a highly-educated professional staff with deep subject matter knowledge
We possess strong intellectual capital that provides us with a deep understanding of policies, processes, and programs across our major markets. Our thought leadership is based on years of training, experience, and education. We are able to apply our in-depth knowledge of our subject matter experts and our experience developed over 40 years of providing advisory services to address the problems and issues our clients are facing. As of December 31, 2017, approximately 33% of our benefits-eligible staff held post-graduate degrees in diverse fields such as the social sciences, business and management, physical sciences, public policy, human capital, information technology, mathematics, engineering, planning, economics, life sciences, and law. These qualifications, and the complementary nature of our markets, enable us to deploy multi-disciplinary teams to identify, develop, and implement solutions that are creative, pragmatic, and tailored to our clients’ specific needs.
We believe our diverse range of markets, services, and projects provide a stimulating work environment for our employees that enhances their professional development. The use of multi-disciplinary teams provides our staff the opportunity to develop and refine common skills required in many types of engagements. Our approach to managing human resources fosters collaboration and significant cross-utilization of the skills and experience of both industry experts and other personnel who can develop creative solutions by drawing upon their different experiences. The types of services we provide, and the manner in which we do so, enable us to attract and retain talented professionals from a variety of backgrounds while maintaining a culture that fosters teamwork and excellence.
We have strong, long-standing relationships with clients across a diverse set of markets
The long-term relationships we maintain with many of our clients reflect our successful track record of fulfilling our clients’ needs. We have advised both the U.S. Environmental Protection Agency (“EPA”) and HHS for more than 30 years, the U.S. Department of Energy (“DOE”) for more than 25 years, DoD for more than 20 years, certain commercial clients in our energy markets for more than 20 years, the European Commission for more than 15 years, and we have multi-year relationships with many of our other clients in both our government and commercial client base. We have numerous contacts at various levels within our clients’ organizations, ranging from key decision-makers to functional managers. The long-standing nature and breadth of our client relationships adds greatly to our institutional knowledge, which, in turn, helps us carry out our client engagements more effectively and maintain and expand such relationships. Our extensive experience and client contacts, together with our prime-contractor position on a substantial majority of our contracts and experience working alongside our clients, gives us clearer visibility into future opportunities and emerging requirements. We believe our balance between government civilian and defense agencies, our commercial presence, and the diversity of markets in which our clients operate help mitigate the impact of policy or political shifts, as well as annual shifts in our clients’ budgets and priorities.
9
Our advisory services position us to capture a full range of engagements
We believe our advisory approach, which is based on our subject matter expertise combined with an understanding of our clients’ requirements and objectives, is a significant competitive differentiator that helps us gain access to key client decision-makers during the initial phases of a policy, program, project, or initiative. We use our expertise and understanding to formulate customized recommendations for our clients. We believe this domain expertise and the program knowledge developed from our advisory engagements further position us to provide a full suite of services across the entire life cycle of a particular policy, program, project, or initiative. As a result, we are able to understand our clients’ requirements and objectives as they evolve over time. We then use this knowledge to provide continuous improvement across our entire range of services, which maintains the relevance of our recommendations.
Our technology-enabled solutions are driven by our subject matter expertise and creativity
Government and commercial decision-makers have become increasingly aware that, to be effective, technology-based solutions need to be seamlessly integrated with people and processes. We possess strong knowledge in information technology and a thorough understanding of organizational behavior and human decision processes. This combination of skills, along with our domain knowledge, allows us to deliver technology-enabled solutions tailored to our clients’ business and organizational needs with less start-up time required to understand client issues. In addition, many of our clients seek to deploy cutting-edge solutions to communicate and transact with citizens, stakeholders, and customers in a multichannel environment, and doing so takes both our constantly-refreshed technical know-how and world-class creativity.
Our proprietary tools, analytics and methods allow us to deliver superior solutions to our clients
We believe our innovative, and often proprietary, analytics and methods are key competitive differentiators because they enhance our ability to deliver customized solutions to our clients, and enable us to deliver services in a more cost-effective manner than our competitors. For example, we have developed industry-standard energy and environmental models that are used by governments and commercial entities around the world for energy planning and air quality analyses, and have also developed a suite of proprietary climate change tools to help the private sector develop strategies for complying with GHG emission reduction requirements. Our loyalty marketing services are often provided via our proprietary Tally® software. We maintain proprietary databases that we continually refine and that are available to be incorporated quickly into our analyses on client engagements. In addition, we also have proprietary program management methodologies and services that we believe can help governments improve performance measurement, support chief information officer and science and engineering program activities, and reduce security risks.
We are led by an experienced management team
Our management team, consisting of approximately 271 officers with the title of vice president or higher, possesses extensive industry experience and had an average tenure of 13 years with us as of December 31, 2017 (including prior service with companies we have acquired). This low turnover allows us to retain institutional knowledge. Our managers are experienced both in marketing efforts and in successfully managing and executing our key services. Our management team also has experience in acquiring other businesses and integrating those operations with our own. A number of our managers are industry-recognized thought leaders. We believe that our management’s successful past performance and deep understanding of our clients’ needs have been differentiating factors in competitive situations.
We have a broad global presence
We serve our clients with a global network of more than 59 regional offices throughout the U.S., and more than 23 offices in key markets outside the U.S., including offices in the U.K., Belgium, China, India and Canada. Our global presence also gives us access to many of the leading experts on a variety of issues from around the world, allowing us to expand our knowledge base and areas of functional expertise. Over the past year, we worked in dozens of countries, helping government and commercial clients with energy, environment, infrastructure, healthcare, marketing, interactive technology/e-commerce, and air transport matters.
10
STRATEGY
Our strategy to increase our revenue and shareholder value involves the following key elements:
Expand our commercial businesses
We plan to continue to pursue higher-margin commercial projects. We believe we have strong, global client relationships in both the commercial energy and air transport markets, where our margins have historically been higher than those in our government market. We continue to see growth opportunities in our current commercial business in the utility sector, as well as significant potential for us to expand our business in other commercial areas, such as aviation and digital marketing and strategic communications services, both domestically and internationally.
We view the energy industry as a particularly attractive market for us over the next decade due to concerns over controlling energy costs and limiting climate and environmental impacts, increased state and federal regulation, the need for cleaner and more diverse sources of energy, and the concomitant need for infrastructure to transport, store, and/or convert those new energy sources. We also believe that the combination of our vertical domain expertise with our digital marketing expertise makes us a provider of choice for high value-added assignments in that arena. Although we believe the utility industry will continue to be a strong market for advisory services, particularly in light of the changing focus on regulatory actions and alternative energy sources, we intend to leverage our existing relationships and institutional expertise to pursue and capture additional, typically higher-margin opportunities. For example, we believe we can continue to expand our program and technology-based services in areas such as assisting with the implementation of energy efficiency programs, information technology applications, and environmental management services for larger utilities. In addition, the growth of interest in sustainability and energy efficiency issues has created opportunities to offer these types of services to new clients beyond our traditional sectors. We believe these factors, coupled with our expansive national and global footprint, will result in a greater number of engagements that will also be larger in size and scope.
We expect other sectors, such as information service providers and travel and tourism, to continue to expand their interest in these services as these industries better understand their energy consumption options and the positive benefits of demonstrating environmental stewardship. Our broad range of services to the aviation industry makes us well positioned to capitalize on significant industry changes, including substantial airline equipment upgrades to newer, more efficient aircraft models in a cost-constrained environment; renovations of older airports to adapt to newer aircraft; and changes to airport business models and strategy as they place increasing importance on passenger experience.
Our engagement services, including marketing, interactive technology, and strategic communications offerings, are well-positioned to support the continuing growth of multichannel engagement and e-commerce. We have broadened our client offerings, particularly in the areas of content management, marketing and digital services. We can now offer complete end-to-end solutions for chief marketing officers, chief communications officers, and chief technology officers as they invest in digital marketing platforms and solutions. We deliver cutting-edge digital strategy support, as well as the creative services that help brands, products and services succeed in a crowded marketplace.
Replicate our business model across government and industry in selected geographies
We believe the services we provide to our energy, environment, and infrastructure market have strong growth potential in selected geographies. Our domain expertise is well suited in Europe to meet the need for cutting-edge climate change, energy and environmental solutions and to increasing, in particular, our offerings to the U.K. government and European Commission. We have also focused our geographic footprint by selectively closing or reducing the size of offices which appear to be unlikely to generate profitable growth in the near to medium term, generally in nations or regions undergoing either economic or political challenges.
Strengthen our technology-based offerings
We continue to strengthen our services in the fields of content and customer relationship management, loyalty marketing, and end-to-end e-commerce. We are positioned to increase these services by expanding the technological underpinnings of our business, while bringing these marketing and e-commerce solutions, as well as expanded data management and analytics offerings, to our clients to better link them with consumers and other stakeholders.
11
Leverage advisory work into full life cycle solutions
We plan to continue to leverage our advisory services and strong client relationships to increase our revenue by winning longer term engagements. These engagements could include: information services and technology-based solutions, project and program management, business process solutions, marketing and communications delivery, strategic communications, and technical assistance and training. Our advisory services provide us with insight and understanding of our clients’ missions and goals. We believe the domain expertise and program knowledge we develop from these advisory assignments position us to capture a greater portion of the resulting larger engagements. However, we will need to undertake such expansion carefully to avoid actual, potential, and perceived conflicts of interest.
Defend, expand, and deepen our presence in core U.S. federal and state and local government markets
Changing political priorities at the U.S. federal and state and local government levels have created challenging market conditions for all competitors in the government services sector. We will focus not only on defending our current market footprint, but also on innovating to continue expanding across key growth markets, such as U.S. federal government health-related and cybersecurity initiatives, digital services, and disaster recovery work for state and local governments. We will continue to provide innovative solutions that help our public sector clients do more with less. We will specifically target deeper penetration of those agencies that currently procure services only from one or two of our service areas. We believe we can leverage many of our long-term client relationships by introducing these existing clients, where appropriate, to our other services. For example, we plan to introduce many of our advisory clients to our capabilities to provide associated information technology, cybersecurity, large-scale program management, and strategic communications and digital services. We can also offer clients our extensive performance measurement, program evaluation, and performance management services. Finally, having more than 59 offices across the U.S allows us to focus more of our business development efforts on addressing the needs of U.S. federal and state and local government agencies with operations outside of the Washington, D.C. metropolitan area.
Pursue larger prime contract opportunities
We believe that continuing to expand our client engagements into services we offer as part of our end-to-end client solutions enables us to pursue larger prime contract opportunities, which should provide a greater return on our business development efforts and allow for increased employee utilization. We plan to continue to target larger and longer-term opportunities through greater emphasis on early identification of opportunities, strategic capture and positioning, and enhanced brand recognition. We believe that the resulting increase in the scale, scope, and duration of our contracts will help us continue to grow our business.
Pursue strategic acquisitions
We plan to augment our organic growth, where appropriate, with selective, strategic acquisitions when the target company will enable us to obtain new clients, increase our presence in attractive markets, and/or obtain capabilities that complement our existing portfolio of services, provided that the target company has a cultural compatibility and we expect that that the acquisition will have a positive financial impact.
These elements of our strategy span all of the Company and are ultimately focused on the overall long-term growth of the organization.
CLIENT AND CONTRACT MIX
Government clients (including U.S. federal, state and local, and international governments) accounted for approximately 62%, 65%, and 65% of our 2017, 2016, and 2015 revenue, respectively. Commercial clients (including U.S. and international clients) accounted for approximately 38%, 35%, and 35% of our 2017, 2016, and 2015 revenue, respectively. Our clients span a broad range of civilian and defense agencies and commercial enterprises. Commercial clients include non-profit organizations and universities, while government clients include the World Bank and the United Nations. In general, a client is considered to be a government client if its primary funding is from a government agency or institution. If we are a subcontractor, we classify the revenue based on the nature of the ultimate client receiving the services.
12
In the fiscal years 2017, 2016, and 2015, our three largest clients were HHS, DOS, and DoD. The following table summarizes the percentage of our total revenue for each of these.
|
|
|
Year ended December 31, |
|
|||||||||
|
|
|
2017 |
|
|
2016 |
|
|
2015 |
|
|||
|
Department of Health and Human Services |
|
|
20 |
% |
|
|
19 |
% |
|
|
18 |
% |
|
Department of State |
|
|
6 |
% |
|
|
6 |
% |
|
|
8 |
% |
|
Department of Defense |
|
|
5 |
% |
|
|
5 |
% |
|
|
5 |
% |
|
Total |
|
|
31 |
% |
|
|
30 |
% |
|
|
31 |
% |
Most of our revenue is derived from prime contracts, which accounted for approximately 90%, 89%, and 85% of our revenue for 2017, 2016, and 2015, respectively. Unless the context otherwise requires, we use the term “contracts” to refer to contracts and any task orders or delivery orders issued under a contract.
Our contract periods typically extend from one month to five years, including option periods. Many of our government contracts provide for option periods that may be exercised by the client. In 2017, 2016, and 2015, no single contract accounted for more than 3% of our revenue. Our 10 largest contracts by revenue collectively accounted for approximately 15%, 14%, and 15% of our revenue in 2017, 2016, and 2015, respectively.
Our international operations may pose special country-specific risks, while helping to diversify our client base. The table below details information on our domestic and international revenues for each of the three years presented. Revenue is attributed to location based on the geographic areas from which a contract is awarded.
International revenues have increased by $10.0 million for the year ended December 31, 2017 compared to the year ended December 31, 2016 due to increases in our international government client services in the energy, environment and infrastructure and in the health, education, and social program client markets partially offset by a decline in the consumer and financial client market. In addition, as explained above, we have also focused our geographic footprint by selectively closing or reducing the size of offices which appear to be unlikely to generate profitable growth in the near to medium term, generally in nations or regions undergoing either economic or political challenges.
|
|
|
Year ended December 31, |
|
|||||||||
|
|
|
2017 |
|
|
2016 |
|
|
2015 |
|
|||
|
|
|
(in thousands) |
|
|||||||||
|
U.S. |
|
$ |
1,104,437 |
|
|
$ |
1,070,336 |
|
|
$ |
1,011,877 |
|
|
International |
|
|
124,725 |
|
|
|
114,761 |
|
|
|
120,355 |
|
|
Total |
|
$ |
1,229,162 |
|
|
$ |
1,185,097 |
|
|
$ |
1,132,232 |
|
CONTRACT BACKLOG
We define total backlog as the future revenue we expect to receive from our contracts and other engagements. We generally include in our total backlog the estimated revenue represented by contract options that have been priced, but not exercised. We do not include any estimate of revenue relating to potential future delivery orders that might be awarded under our U.S. General Services Administration Multiple Award Schedule (“GSA Schedule”) contracts, other Indefinite Delivery/Indefinite Quantity (“IDIQ”) contracts, Master Service Agreements (“MSAs”), or other contract vehicles that are also held by a large number of firms and under which potential future delivery orders or task orders might be issued by any of a large number of different agencies, and are likely to be subject to a competitive bidding process. We do, however, include potential future work expected to be awarded under IDIQ contracts that are available to be utilized by a limited number of potential clients and are held either by us alone or by a limited number of firms.
We include expected revenue in funded backlog when we have been authorized by the client to proceed under a contract up to the dollar amount specified by our client, and this amount will be owed to us under the contract after we provide the services pursuant to the authorization. If we do not provide services authorized by a client prior to the expiration of the authorization, we remove amounts corresponding to the expired authorization from funded backlog. We do include expected revenue under an engagement in funded backlog when we do not have a signed contract, but only in situations when we have received client authorization to begin or continue working and we
13
expect to sign a contract for the engagement. In this case, the amount of funded backlog is limited to the amount authorized. Our funded backlog does not represent the full revenue potential of our contracts because many government clients, and sometimes other clients, authorize work under a particular contract on a yearly or more frequent basis, even though the contract may extend over several years. Most of the services we provide to commercial clients are provided under contracts or task orders under MSAs with relatively short durations. As a consequence, our backlog attributable to these clients is typically reflected in funded backlog and not in unfunded backlog.
We define unfunded backlog as the difference between total backlog and funded backlog. Our estimate of unfunded backlog for a particular contract is based, to a large extent, on the amount of revenue we have recently recognized on that contract, our experience in utilizing contract capacity on similar types of contracts, and our professional judgment. Accordingly, our estimate of total backlog for a contract included in unfunded backlog is sometimes lower than the revenue that would result from our client utilizing all remaining contract capacity.
Although we expect our total backlog to result in revenue, the timing of revenue associated with both funded and unfunded backlog will vary based on a number of factors, and we may not recognize revenue associated with a particular component of backlog when anticipated, or at all. Our government clients generally have the right to cancel any contract, or ongoing or planned work under any contract, at any time. In addition, there can be no assurance that revenue from funded or unfunded backlog will have similar profitability to previous work or will be profitable at all. Generally speaking, we believe the risk that a particular component of backlog will not result in future revenue is higher for unfunded backlog than for funded backlog.
Our funded and estimates of unfunded and total backlog were as follows at December 31:
|
|
|
2017 |
|
|
2016 |
|
|
2015 |
|
|||
|
|
|
(in millions) |
|
|||||||||
|
Funded |
|
$ |
1,038.4 |
|
|
$ |
1,020.3 |
|
|
$ |
791.9 |
|
|
Unfunded |
|
|
1,013.0 |
|
|
|
1,102.4 |
|
|
|
1,025.5 |
|
|
Total backlog |
|
$ |
2,051.4 |
|
|
$ |
2,122.7 |
|
|
$ |
1,817.4 |
|
There were no awards included in our 2017, 2016 or 2015 backlog amounts that were under protest.
BUSINESS DEVELOPMENT
Our business development efforts are critical to our organic growth. Our business development processes and systems are designed to enable agility and speed-to-market over the business development life cycle, especially given the distinctions between commercial and public sectors. Business development efforts in priority market areas, which include some of our largest federal agency accounts (HHS, DOS, DOE, U.S. Department of Transportation and EPA), are executed through account teams, each of which is headed by a corporate account executive and supported by dedicated corporate business development professionals and senior staff from the relevant operational area. Each account executive has significant authority and accountability to set priorities and bring to bear the appropriate resources, focusing on larger and strategically important pursuits. Each team participates in regular executive reviews. Our non-federal government clients are served by account leaders from operating units and coordinated by senior executives within industry sectors (e.g. energy) where such coordination is deemed appropriate to enhance our business development opportunities. This account-based approach allows deep insight into the needs of our clients. It also helps us anticipate our clients’ evolving requirements over the coming 12 to 18 months and position ourselves to meet those requirements. Each of our operational areas is responsible for maximizing sales in our existing accounts and finding opportunities in closely-related accounts.
The corporate business development function also includes a market research and competitive intelligence group, a proposal group, a marketing group, a communications group, and a strategic capture unit. The marketing group engages in brand marketing and strategic marketing program development and execution to raise awareness of our services and solutions across our markets, and to generate leads for further pursuit by sales personnel. Our contracts and administration function leads our pricing decisions in partnership with the business development account teams and operational areas.
14
COMPETITION
We operate in a highly competitive and fragmented marketplace and compete against a number of firms in each of our clients’ key markets. Some of our principal competitors include: Abt Associates Inc.; AECOM Technology Corporation; Alliance Data Systems Corporation; Booz Allen Hamilton Holding Corporation; CACI International Inc.; Cambridge Systematics, Inc.; CRA International, Inc.; CSRA Inc.; Deloitte LLP; Eastern Research Group, Inc.; Cardno ENTRIX, Inc.; L-3 Communications Corporation; Leidos Holdings, Inc.; Lockheed Martin Corporation; ManTech International Corporation; Navigant Consulting, Inc.; Northrop Grumman Corporation; Omnicom Group Inc.; PA Consulting Group; PricewaterhouseCoopers (PwC); Publicis Group; Science Applications International Corp; Research Triangle Institute; Tetra Tech Inc.; Westat, Inc., and WPP Plc. In addition, within each of our key markets, we have numerous smaller competitors, many of which have narrower service offerings and serve niche markets. Some of our competitors are significantly larger than we are and have greater access to resources and stronger brand recognition than we do.
We consider our principal competitive discriminators to be long-standing client relationships, good reputation and past performance of the firm, client references, technical knowledge and industry expertise of employees, quality of services and solutions, scope and scale of our service offerings, and pricing.
INTELLECTUAL PROPERTY
We own a number of trademarks and copyrights that help maintain our business and competitive position. Sales and licenses of our intellectual property do not currently comprise a substantial portion of our revenue or profit. We rely on the technology and models, proprietary processes, and other intellectual property we own or have rights to use in our analyses and other work we perform for our clients. We use these innovative, and often proprietary, software, analytical models and tools throughout our service offerings. Our staff regularly maintains, updates, and improves these software, models, and tools based on our corporate experience. In addition, we sometimes retain limited rights in software applications we develop for clients. We use a variety of means to protect our intellectual property.
EMPLOYEES
As of December 31, 2017, we had more than 5,500 benefits-eligible (full-time and regular part-time) employees, approximately 33% of whom held post-graduate degrees in diverse fields such as social sciences, business and management, physical sciences, public policy, human capital, information technology and mathematics, engineering, planning, economics, life sciences, and law. Approximately 68% of our employees held a bachelor’s degree or equivalent or higher. Our professional environment encourages advanced training to acquire industry-recognized certifications, rewards strong job performance with advancement opportunities, and fosters ethical and honest conduct. Our salary structure, incentive compensation, and benefit packages are competitive within our industry.
The following discussion of “risk factors” sets forth some of the most significant factors that may adversely affect our business, operations, financial position or future financial performance, reputation and/or value of our stock. This information should be read in conjunction with Management’s Discussion and Analysis and the consolidated financial statements and related notes incorporated by reference into this Annual Report on Form 10-K. Because of the following factors, as well as other factors, whether known or unknown, affecting our business, operations, financial position or future financial performance, reputation and/or value of our stock, past financial performance should not be considered to be a reliable indicator of future performance, and investors should not use historical trends to anticipate results or trends in future periods.
RISKS RELATED TO OUR INDUSTRY
The failure of Congress to approve appropriations bills in a timely manner for the federal government agencies and departments we support, or the failure of the President and Congress to reach an agreement on fiscal issues, could delay and reduce spending, cause us to lose revenue and profit, and affect our cash flow.
On an annual basis, Congress is required to approve appropriations bills that govern spending by each of the federal government agencies and departments we support. When Congress is unable to agree on budget priorities,
15
and thus is unable to pass annual appropriations bills on a timely basis, it typically enacts a continuing resolution. Continuing resolutions generally allow federal government agencies and departments to operate at spending levels based on the previous fiscal year. When agencies and departments operate on the basis of a continuing resolution, funding we expect to receive from clients for work we are already performing and for new initiatives may be delayed or cancelled. Thus, the failure by Congress to approve appropriations bills in a timely manner can result in the loss of revenue and profit when federal government agencies and departments are required to cancel or change existing or new initiatives or the deferral of revenue and profit to later periods due to delays in implementing existing or new initiatives. There is also the possibility that Congress will not enact appropriations bills or a continuing resolution in a timely manner. Furthermore, the federal government may not be able to fund its operations due to a failure by Congress to raise the U.S. debt ceiling. In such events, many parts of the federal government, including agencies, departments, programs, and projects we support, may “shut down,” which could have a substantial negative affect on our revenue, profit, and cash flows. The budgets of many of our state and local government clients are also subject to similar processes, and, as a result, subject us to similar risks and uncertainties.
In addition, in an effort to control the federal government deficit, Congress passed the Budget Control Act of 2011 (the “Budget Act”), which mandated the reduction of discretionary spending by the federal government by $1.2 trillion over 10 years. While some of these reductions have been rescinded, the spending caps through 2021 remain in place and, unless they are also rescinded, could continue to constrain federal discretionary spending for the services we provide. Because we derive a significant portion of our revenue from contracts with federal government clients, a decline in federal government expenditures and/or a shift of expenditures away from programs we support, whether as a result of the Budget Act or otherwise, would likely have a negative impact on our business and results. The Bipartisan Budget Act of 2018 set higher spending caps for Fiscal Years 2018 and 2019 than would otherwise have been allowed by the Budget Control Act, more commonly known as the “sequester”. The Bipartisan Budget Act of 2018 also lifts the debt ceiling restriction on federal borrowing through March 1, 2019. These changes positively affect the likelihood that Congress will pass an Omnibus Appropriations Act to provide government funding through the remainder of fiscal year 2018 as well as enact the necessary appropriations bills in a timely manner for fiscal year 2019, which begins on October 1, 2018.
Government budgeting and spending priorities may change in a manner adverse to our business.
We derived approximately 45%, 48%, and 48% of our revenue in 2017, 2016, and 2015, respectively, from contracts with federal government clients, and approximately 17%, 17%, and 17% of our revenue from contracts with state and local governments and international governments in 2017, 2016, and 2015, respectively. The current presidential administration has announced and implemented some measures designed to reduce federal government regulation, which could have an impact on future revenue. Expenditures by our federal government clients may be restricted or reduced by these presidential or congressional actions, by action of the Office of Management and Budget, by action of individual agencies or departments, or by other actions. In addition, many state and local governments are not permitted to operate with budget deficits and nearly all state and local governments face considerable challenges in balancing their budgets. Accordingly, we expect, due to changing government budgeting and spending priorities, that some of our government clients in the future may delay payments due to us, may eventually fail to pay what they owe us, and/or may delay certain programs and projects. For some government clients, we may face a difficult choice: turn down (or stop) work due to budget uncertainty with the risk of damaging a valuable client relationship, or perform work with the risk of not getting paid in a timely fashion or perhaps at all. Federal and/or state and local government elections could also affect spending priorities and budgets at all levels of government. In addition, increased deficits and debt at all levels of government, both domestic and international, may lead to reduced spending by agencies and departments on projects or programs we support.
Our failure to comply with complex laws, rules, and regulations could cause us to lose business and subject us to a variety of penalties and sanctions.
We must comply with laws, rules, and regulations that affect how we do business with our government clients and impose added costs on our business. Each government client has its own laws, rules, and regulations that affect its contracts. Some of the more significant laws and regulations affecting the formation, administration, and performance of government contracts include:
|
|
• |
U.S. Federal Acquisition Regulation as well as Cost Accounting Standards, and agency and department regulations analogous or supplemental to federal regulation; |
16
|
|
• |
U.S. Foreign Corrupt Practices Act; |
|
|
• |
U.S. Truthful Cost or Pricing Data Statue (formerly known as the Truth in Negotiations Act); |
|
|
• |
U.K. Bribery Act; |
|
|
• |
E.U General Data Protection Regulation (“GDPR”); |
|
|
• |
U.S. Procurement Integrity Act; |
|
|
• |
U.S. Civil False Claims Act and the False Statements Act; and |
|
|
• |
U.S. laws, rules and regulations restricting (i) the use and dissemination of information classified for national security purposes, (ii) the exportation of specified products, technologies, and technical data, and (iii) the use and dissemination of sensitive but unclassified data. |
Any failure to comply with applicable federal, and/or state and local government laws, rules and regulations could subject us to civil and criminal penalties and administrative sanctions, including termination of contracts, repayment of amounts already received under contracts, forfeiture of profits, suspension of payments, fines, and suspension or debarment from doing business with federal and/or state and local government agencies and departments, any of which could adversely affect our reputation, our revenue, our operating results, and/or the value of our stock.
In addition, the federal government and other governments with which we do business may change their procurement practices or adopt new contracting laws, rules, or regulations that could be costly to satisfy or that could impair our ability to obtain new contracts and reduce our revenue and profit, for example, by curtailing the use of services firms or increasing the use of firms with a “preferred status,” such as small businesses.
In addition to our U.S. operations, we also have a significant presence in key markets outside the U.S., including offices in the U.K., Belgium, China, India and Canada. Failure to abide by laws, rules and regulations applicable to our work outside the U.S. could have similar effects to those described above.
We are subject to various routine and non-routine governmental and other reviews, audits and investigations, and unfavorable audit results could force us to adjust previously reported operating results, could affect future operating results, and could subject us to a variety of penalties and sanctions.
Federal government departments and agencies and many state government clients audit and review our contract performance, pricing practices, cost structure, financial capability, and compliance with applicable laws, rules, and regulations. Audits could raise issues that have significant adverse effects, including, but not limited to, substantial adjustments to our previously reported operating results and substantial effects on future operating results. If a government audit, review, or investigation uncovers improper or illegal activities, we may be subject to civil and criminal penalties and administrative sanctions, including termination of contracts, repayment of amounts already received under contracts, forfeiture of profits, suspension of payments, fines, and suspension or debarment from doing business with federal and state and local government agencies and departments, any of which could adversely affect our reputation, our revenue, our operating results, and/or the value of our stock. We may also lose business if we are found not to be sufficiently able to meet ongoing cash flows and financial obligations on a timely basis. In addition, we could suffer serious harm to our reputation and our stock price could decline if allegations of impropriety are made against us, whether true or not. Federal government audits have been completed on our incurred contract costs only through 2007 and audits for costs incurred on work performed since then have not yet been completed. In addition, non-audit reviews by federal and state and local governments may still be conducted on all our government contracts, even for periods before 2007.
Our contracts may contain provisions that are unfavorable to us and permit our clients to, among other things, terminate our contracts partially or completely at any time prior to completion.
Our contracts may contain provisions that allow our clients to terminate or modify these contracts at their convenience upon short notice. If a client terminates one of our contracts for convenience, we may only bill the client for work completed prior to the termination, plus any commitments and settlement expenses the client agrees to pay, but not for any work not yet performed. In addition, many of our government contracts and task and delivery orders are incrementally funded as appropriated funds become available. The reduction or elimination of such funding can result in contract options not being exercised and further work on existing contracts and orders being
17
curtailed. In any such event, we would have no right to seek lost fees or other damages. In addition, certain contracts with international government clients may have more severe and/or different contract clauses than what we are accustomed to with federal and state and local government clients, such as penalties for any delay in performance. If a client were to terminate, decline to exercise options under, or curtail further performance under one or more of our major contracts, our revenue and operating results could be adversely affected.
Our commercial work depends on certain sectors of the global economy that are highly cyclical, which can lead to substantial variations in our revenue and profit from period to period.
In recent years, we have expanded our work with commercial clients. Our commercial clients, which include clients outside the U.S., generated approximately 38%, 35%, and 35% of our revenue in 2017, 2016, and 2015, respectively. This increased reliance on commercial clients presents new risks and challenges. For example, our commercial work is heavily concentrated in cyclical industries such as energy, air transportation, environmental, health, retail and financial services. Demand for our services from our commercial clients has historically declined when their industries have experienced downturns, and we expect a decline in demand for our services when these industries experience downturns in the future.
RISKS RELATED TO OUR BUSINESS
Recent changes to U.S. tax laws may adversely affect our financial condition or results of operation and create the risk that we may need to adjust our accounting for these changes.
The Tax Cuts and Jobs Act (the “Tax Act”), enacted in late 2017, makes significant changes to U.S. tax laws and includes numerous provisions that affect businesses, including ours. For instance, as a result of lower corporate tax rates, the Tax Act tends to reduce both the value of deferred tax assets and the amount of deferred tax liabilities. It also limits interest rate deductions and the amount of net operating losses that can be used each year and alters the expensing of capital expenditures. Other provisions have international tax consequences for businesses like ours that operate internationally. The Tax Act is unclear in certain respects and will require interpretations and implementing regulations by the Internal Revenue Service, as well as state tax authorities, and the Tax Act could be subject to amendments and technical corrections, any of which could lessen or increase the adverse (and positive) impacts of the Tax Act. The accounting treatment of these tax law changes is complex, and some of the changes may affect both current and future periods. Others will primarily affect future periods. As discussed elsewhere in this Report on Form 10-K, we believe our analysis and computations of the tax effects of the Tax Act on us is substantially, but not entirely, complete. Consistent with guidance from the SEC, our financial statements reflect our estimates of the tax effects of the Tax Act on us. Although we believe these estimates are reasonable, they are provisional and may be adjusted prior to the end of 2018. Any such estimates could affect our current or future financial statements, or both.
Maintaining our client relationships and professional reputation are critical to our ability to successfully win new contracts and renew expired contracts.
Our client relationships and professional reputation are key factors in maintaining and growing our business, revenue and profit levels under contracts with our clients. We continually bid for and execute new contracts, and our existing contracts continually become subject to re-competition and expiration. If we are not able to replace the revenue from these contracts, either through follow-on contracts or new contracts for those requirements or for other requirements, our revenue and operating results may be adversely affected. Upon the expiration of a contract, we typically seek a new contract or subcontractor role relating to that client to replace the revenue generated by the expired contract. There can be no assurance that those expiring contracts we are servicing will continue after their expiration, that the client will re-procure those requirements, that any such re-procurement will not be restricted in a way that would eliminate us from the competition (e.g., set asides for small businesses), or that we will be successful in any such re-procurements or in obtaining subcontractor roles. Any factor that diminishes our reputation or client relationships with federal, state and local and international government clients, as well as commercial clients, could make it substantially more difficult for us to compete successfully for new engagements and qualified employees. To the extent our reputation and/or client relationships deteriorate, our revenue and operating results could be adversely affected.
18
Our reliance on GSA Schedule and other IDIQ contracts creates the risk of volatility in our revenue and profit levels.
We believe that one of the elements of our success is our position as a prime contractor under GSA Schedule contracts and other IDIQ contracts and we believe this position is important to our ability to sell our services to federal government clients. However, these contract vehicles require us to compete for each delivery order and task order, rather than having a more predictable stream of activity during the term of a multi-year contract. In addition, we may spend considerable cost and managerial time and effort to prepare bids and proposals for contracts, delivery orders or task orders that we may not win. There can be no assurance that we will continue to obtain revenue from such contracts at current levels, or in any amount, in the future. To the extent that federal government agencies and departments choose to employ GSA Schedule contracts and other IDIQ contracts encompassing activities for which we are not able to compete or provide services, we could lose business, which would negatively affect our revenue and profitability.
We may not receive revenue corresponding to the full amount of our backlog, or may receive it later than we expect, which could adversely affect our revenue and operating results.
The calculation of backlog is highly subjective and conditioned on numerous uncertainties and estimates, and there can be no assurance that we will in fact receive the amounts we have included in our backlog. Our assessment of a contract’s potential value is based on factors such as the amount of revenue we have recently recognized on that contract, our experience in utilizing contract capacity on similar types of contracts, and our professional judgment. In the case of contracts that may be renewed at the option of the client, we generally calculate backlog by assuming that the client will exercise all of its renewal options; however, the client may elect not to do so. In addition, federal government contracts rely on congressional appropriation of funding, which is typically provided only partially at any point during the term of federal government contracts, and all or some of the work to be performed under a contract may require future appropriations by Congress and the subsequent allocation of funding by the procuring agency or department to the contract. Protests of contracts continue to be common in our industry. We do not include contract awards that are subject to a pending protest in our calculation of backlog. If a contract previously included in backlog becomes the subject of a protest, we would adjust backlog to remove that amount and reassess following resolution of the protest. Our estimate of the portion of backlog that we expect to recognize as revenue in any future period may differ from actual results because the receipt and timing of this revenue often depends on subsequent appropriation and allocation of funding and is subject to various contingencies, such as timing of task orders and delivery orders, many of which are beyond our control. In addition, we may never receive revenue from some of the engagements that are included in our backlog, and this risk is greater with respect to unfunded backlog. Although we adjust our backlog to reflect modifications to or renewals of existing contracts, awards of new contracts, or approvals of expenditures, if we subsequently fail to realize revenue corresponding to our backlog, our revenue and operating results could be adversely affected.
Failure to identify, hire, train and retain talented employees who are committed to our mission and vision could have a negative effect on our reputation and our business.
Our business, which entails the provision of professional services to government and commercial clients, largely depends on our ability to attract and retain qualified employees. Additionally, as our business continues to evolve, as we acquire new businesses, and as we provide a wider range of services, we become increasingly dependent on the capabilities of our employees in order to meet the needs of our diverse client base. If we are unable to recruit and retain a sufficient number of qualified employees that are committed to our mission and vision, we may incur higher costs related to an increase in subcontractors, hiring, training and retention. Effective succession planning is also important to our long-term success. Failure to ensure effective transfer of knowledge and smooth transitions involving key employees could hinder our strategic planning and execution. Additionally, the loss of key personnel could impair our ability to effectively serve our clients and maintain and grow our business, and our future revenue and operating results could be adversely affected.
Because much of our work is performed under task orders and delivery orders and, on certain occasions, other short-term assignments, we are exposed to the risk of not having sufficient work for our staff, which can affect revenue and profit.
We perform some of our work under short-term contracts. Even under many of our longer-term contracts, we perform much of our work under individual task orders and delivery orders, many of which are awarded on a
19
competitive basis. If we cannot obtain new work in a timely fashion, whether through new contracts, task orders, or delivery orders, modifications to existing contracts, or otherwise, we may not be able to keep our staff profitably utilized, which may result in challenges related to retaining talented members of our staff and also adversely impact our financial results. There can be no assurance that we can profitably manage the utilization of, or retain, our staff.
If we are unable to accurately estimate and control our contract costs, then we may incur losses on our contracts, which could decrease our operating margins and reduce our profits. In particular, our fixed-price contracts could increase the unpredictability of our earnings if we cannot accurately estimate and control our contract costs.
It is important for us to accurately estimate and control our contract costs so that we can maintain positive operating margins and profitability. As described elsewhere in this Form 10-K, we generally enter into three principal types of contracts with our clients: fixed-price, time-and-materials and cost-plus.
We derived 39%, 39%, and 38% of our revenue from fixed-price contracts 2017, 2016, and 2015, respectively. Under fixed-price contracts, we receive a fixed price irrespective of the actual costs we incur and, consequently, we are exposed to a number of risks. We realize a profit on fixed-price contracts only if we can control our costs and prevent cost overruns on our contracts. Fixed-price contracts require cost and scheduling estimates that are based on a number of assumptions, including those about future economic conditions, costs, and availability of labor, equipment and materials, and other exigencies. We could experience cost overruns if these estimates are inaccurate as a result of errors or ambiguities in the contract specifications, or become inaccurate as a result of a change in circumstances following the submission of the estimate due to, among other things, unanticipated technical problems, difficulties in obtaining permits or approvals, changes in local laws or labor conditions, weather delays, or the inability of our vendors or subcontractors to perform. If cost overruns occur, we could experience reduced profits or, in some cases, a loss for that project. If a project is significant, or if there are one or more common issues that impact multiple projects, costs overruns could increase the unpredictability of our earnings, as well as have an adverse impact on our business and earnings.
We provide digital marketing services in highly competitive and constantly evolving markets. Our success in these markets depends upon our ability to develop and integrate new technologies into our business and enhance our existing products and services, as well as our ability to respond to rapid changes in technology in order to remain competitive.
In our consumer and financial market, we provide digital marketing services in highly competitive markets. We compete principally with large systems consulting and implementation firms, traditional and digital advertising and marketing agencies, offshore consulting and outsourcing companies, and clients’ internal information systems departments. To a lesser extent, other competitors include boutique consulting firms that maintain specialized skills and/or are geographically focused. We expect these competitors to devote significant effort to maintaining and growing their respective market shares. If we cannot respond effectively to advances by our competitors in this market, or grow our own business efficiently, our overall business and operating results could be adversely affected.
Our success in this competitive market depends in part on our ability to adapt to rapid technological advances and evolving standards in computer hardware and software development and media infrastructure, changing and increasingly sophisticated customer needs, newly-developed digital marketing services and platform introductions and enhancements. If, within this market, we are unable to develop new or sufficiently differentiated products and services, to enhance and improve our products and support services in a timely manner or to position and/or price our products and services to meet demand, our overall business and operating results could be adversely affected.
Litigation, claims, disputes, audits, reviews, and investigations in connection with the completed Road Home contract expose us to many different types of liability, may divert management attention, and could increase our costs.
In June 2006, our subsidiary, ICF Emergency Management Services, LLC (“ICF Emergency”), was awarded the Road Home contract by the State of Louisiana, Office of Community Development (the “OCD”), to manage a program designed primarily to help homeowners and landlords of small rental properties affected by Hurricanes Rita and Katrina by providing them compensation for the uninsured, uncompensated damages they suffered from the hurricanes (the “Program”). With an aggregate value of $912 million, the Road Home contract was our largest contract throughout its three-year duration, which ended on June 11, 2009.
20
The Road Home contract provided us with significant opportunities, but also created substantial risks. A number of these risks continued beyond the term of the contract. We still have lawsuits pending, and other claims have been made against us in connection with this contract. New lawsuits may be filed and new claims may be made against us in the future including, but not limited to, claims by subcontractors and others who are dissatisfied with the amount of money they have received from, or their treatment under, the Program. We have defended such lawsuits and claims vigorously and plan to continue to do so, but we may not prevail in future cases. Although the contract provides that, with several exceptions, we are allowed to charge, as an expense under the contract, reasonable costs and fees incurred in defending and paying claims brought by third parties arising out of our performance, there can be no assurance that our legal costs and fees will be reimbursed. The State of Louisiana has not reimbursed us for the majority of such costs or fees and has not reimbursed any such costs or fees since 2008. The outstanding contract receivables related to defending and paying claims were fully reserved as of December 31, 2017.
In addition and as discussed in “Note 17—Commitments and Contingencies – Road Home Contract” in our financial statements, on June 10, 2016, the OCD filed a written administrative demand (the “Administrative Demand”) with the Louisiana Commissioner of Administration against ICF Emergency in connection with the administration of the Program. In its administrative demand, the OCD sought approximately $200.8 million in alleged overpayments to Program grant recipients. The OCD separately supplemented the amount of recovery it is seeking in total approximately $220.2 million. The State of Louisiana, through the Division of Administration, also filed suit (the “Proceeding”) in Louisiana state court on June 10, 2016 broadly alleging and seeking recoupment for the same claim made in the Administrative Demand. On September 21, 2016, the Commissioner of the Division of Administration notified the OCD and the Company of his decision to defer jurisdiction of the Administrative Demand. In so doing, the Commissioner declined to reach a decision on the merits, stated that his deferral would not be deemed to grant or deny any portion of the OCD’s claim, and authorized the parties to proceed on the matter in the Proceeding. The Company continues to believe that neither the Administrative Demand nor the Proceeding has any merit, intends to vigorously defend its position, and has therefore not recorded a liability as of December 31, 2017.
As discussed above, the Road Home contract has been, and we expect it to continue to be, audited, investigated, reviewed, and monitored frequently by federal and state government authorities and their representatives. These activities may consume significant management time and effort. Further, the contract provides that we are subject to audits for a period after the date of the last payment made under the contract. Findings from any audit, investigation, review, monitoring, or similar activity could subject us to civil and criminal penalties and administrative sanctions from federal and state government authorities, which could substantially adversely affect our reputation, our revenue, our operating results, and the value of our stock.
We derive significant revenue and profit from contracts awarded through a competitive bidding process, which can impose substantial costs on us, and we will lose revenue and profit if we fail to compete effectively.
We derive significant revenue and profit from contracts that are awarded through a competitive bidding process. Competitive bidding imposes substantial costs and presents a number of risks, including the:
|
|
• |
Substantial cost and managerial time and effort that we spend to prepare bids and proposals; |
|
|
• |
Need to estimate accurately the resources and costs that will be required to service any contracts we are awarded, sometimes in advance of the final determination of their full scope; |
|
|
• |
Expense and delay that may arise if our competitors protest or challenge awards made to us pursuant to competitive bidding, as discussed in the risk factor below; and |
|
|
• |
Opportunity cost of not bidding on and winning other contracts we may have otherwise pursued. |
To the extent we engage in competitive bidding and are unable to win particular contracts, we not only incur substantial costs in the bidding process that negatively affect our operating results, but we may lose the opportunity to operate in the market for the services provided under those contracts for a number of years. Even if we win a particular contract through competitive bidding, our profit margins may be depressed or we may even suffer losses as a result of the costs incurred through the bidding process and the need to lower our prices to overcome competition.
21
Our business could be adversely affected by delays caused by our competitors protesting contract awards received by us, which could stop our work. Likewise, we may protest the contracts awarded to some of our competitors, a process that takes the time and energy of our management and we may incur additional legal and consultant costs.
Due in part to the competitive bidding process under which government contracts are awarded, we are at risk of incurring expenses and delays if one or more of our competitors protest contracts awarded to us. Contract protests remain common in our industry and may result in a requirement to resubmit offers for the protested contract or in the termination, reduction, or modification of the awarded contract. It can take many months to resolve contract protests and, in the interim, the contracting government agency or department may suspend our performance under the contract pending the outcome of the protest. Even if we prevail in defending the contract award, the resulting delay in the startup and funding of the work under these contracts may adversely affect our operating results.
Moreover, in order to protect our competitive position, we may protest the contract awards of our competitors. This process takes the time and energy of our executives and employees, is likely to divert management’s attention from other important matters, and could cause us to incur additional legal and consultant costs.
Our international operations pose additional risks to our profitability and operating results.
We have offices in the U.K., Belgium, China, India and Canada, among others, and expect to continue to have international operations and offices, some of which are in underdeveloped countries that do not have a well-established business infrastructure. We also perform work in some countries where we do not have a physical office. Some of the countries in which we work have a history of political instability or may expose our employees and subcontractors to physical danger. Expansion into selective new geographic regions requires considerable management and financial resources, the expenditure of which may negatively impact our results, and we may never see any return on our investment.
Geopolitical events in the European Union ("E.U.") may also adversely impact our business. Following a referendum on June 23, 2016 in which voters in the U.K. approved an exit from the E.U. On March 29, 2017 the U.K. initiated the process under Article 50 of the Treaty of the European Union, commencing a period of up to two years for the E.U. and other E.U. member states to negotiate the terms of a withdrawal (often referred to as “Brexit”). Such an exit from the E.U. is unprecedented, and it is still unclear how the U.K.’s access to the E.U. Single Market, and the wider commercial, legal and regulatory environment in which we, our customers and our counterparties operate, will be impacted. Our U.K. and Belgian operations have traditionally serviced most of our European clients, including the EU, and these operations could be disrupted by Brexit, particularly if there is a change in the U.K.’s relationship to the EU Single Market. The uncertainty surrounding the terms of the U.K.’s exit and its consequences could adversely impact customer and investor confidence, result in additional market volatility and adversely affect our businesses and results of operations.
Other member states or portions thereof may conduct similar referenda leading to an exit from the EU, resulting in a reduction in funding for the European Commission that could lead to a decrease in the funding and scope of our work for that client. In addition, security and sovereignty issues resulting from geopolitical events, or the EU negotiations driven by those events, could change the current balance of responsibility established between the European Commission and member nations, which could also reduce the funding and scope of our work for that client.
Our international operations are subject to risks associated with operating in, and selling to and in, countries other than the U.S., that could, directly or indirectly, adversely affect our international and domestic operations and our overall revenue, profit, and operating results including, but not limited to:
|
|
• |
Compliance with the laws, rules, regulations, policies, legal standards, and enforcement mechanisms of the U.S. and the other countries in which we operate, including bribery and anti-corruption laws, economic sanctions, trade restrictions, local tax and income laws, and local labor and employment laws, which are sometimes inconsistent; |
|
|
• |
Restrictions on the ability to repatriate profits to the U.S. or otherwise move funds; |
|
|
• |
Potential personal injury to personnel who may be exposed to military conflicts and other hostile situations in foreign countries; |
22
|
|
• |
Expropriation and nationalization of our assets or those of our subcontractors, and other inabilities to protect our property rights; and/or |
|
|
• |
Difficulties in managing and staffing such operations, including obtaining work permits or visas, identifying qualified local employees, operating according to different local labor laws and regulations, dealing with different local business cultures and practices, and collecting contract receivables. |
In addition, because of our work with international clients, certain of our revenues and costs are denominated in other currencies, then translated to U.S. dollars for financial reporting purposes. Our revenues and profits may decrease as a result of currency fluctuations and devaluations and limitations on the conversion of foreign currencies into U.S. dollars and in the conversion between foreign currencies. We currently have forward contract agreements (“hedges”) related to our operations in the E.U. hedging the translation between the Euro and the pound sterling. We recognize changes in the fair-value of the hedges in our results of operations. We may increase the number, size and scope of our hedges as we analyze options for mitigating our foreign exchange risk. We cannot be sure that our hedges will be successful in reducing the risks to us of our exposure to foreign currency fluctuations and, in fact, the hedges may adversely affect our operating results.
As we develop new services, clients and practices, enter new lines of business, and focus more of our business on providing a full range of client solutions, our operating risks increase.
As part of our corporate strategy, we are attempting to leverage our advisory services to sell our full suite of services across the life cycle of a policy, program, project, or initiative, and we are regularly searching for ways to provide new services to clients. In addition, we plan to extend our services to new clients, into new lines of business, and into new selected geographic locations. As we focus more on our delivery of a full range of consulting services from advisory through implementation and attempt to develop new services, clients, practice areas and lines of business these efforts could be unsuccessful and adversely affect our results of operations.
Such growth efforts place substantial additional demands on our management and staff, as well as on our information, financial, administrative and operational systems. We may not be able to manage these demands successfully. Growth may require increased recruiting efforts, business development, and selling, marketing and other actions that are expensive and increase risk. We may need to invest more in our people and systems, controls, compliance efforts, policies and procedures than we anticipate. Further, we may need to enhance or modify our systems or processes, or transition to more efficient or effective ones, and these changes and how we handle them may impact the business in short- or long-term. Therefore, even if we do grow, the demands on our people and systems, controls, compliance efforts, policies and procedures may be sufficiently great that the quality of our work, our operating margins, and our operating results suffer, at least in the short-term, and perhaps in the long-term.
Efforts involving a different focus, new services, new clients, new practice areas, and new lines of business, include risks associated with our inexperience and competition from mature participants in those areas. Our expansion of services may result in decisions that could harm our profit and operating results. In particular, implementation and improvement services often relate to the development, implementation and improvement of critical infrastructure or operating systems that our clients may view as “mission critical,” and if we fail to satisfy the needs of our clients in providing these services, our clients could incur significant costs and losses for which they could seek compensation from us.
The diversity of the services we provide, and the clients we serve, may create actual, potential, and perceived conflicts of interest and conflicts of business that limit our growth and could lead to potential liabilities for us.
Because we provide services to a wide array of both government and commercial clients, occasions arise where, due to actual, potential, or perceived conflicts of interest or business conflicts, we cannot perform work for which we are qualified. A number of our contracts contain limitations on the work we can perform for others, such as, for example, when we are assisting a government agency or department in developing regulations or enforcement strategies. Actual, potential, and perceived conflicts limit the work we can do and, consequently, can limit our growth and adversely affect our operating results. In addition, if we fail to address actual or potential conflicts properly, or even if we simply fail to recognize a perceived conflict, we may be in violation of our existing contracts, may otherwise incur liability, may lose future business for not preventing the conflict from arising, and our reputation may suffer. Particularly as we continue to grow our commercial business, we anticipate that conflicts of interest and business conflicts will pose a greater risk.
23
Our relationships with other contractors are important to our business and, if disrupted, could cause us damage.
We derive a portion of our revenue from contracts under which we act as a subcontractor or from “teaming” arrangements in which we and other contractors jointly bid on particular contracts, projects, or programs. As a subcontractor or team member, we often lack control over fulfillment of a contract, and poor performance on the contract, whether resulting from our performance or the performance of another contractor, could tarnish our reputation, result in a reduction of the amount of our work under, or termination of, that contract or other contracts, and cause us not to obtain future work, even when we perform as required. Moreover, our revenue, profit and operating results could be adversely affected if any prime contractor or teammate does not pay our invoices in a timely fashion, chooses to offer products or services of the type that we provide, teams with other companies to provide such products or services, or otherwise reduces its reliance upon us for such products or services.
We depend on our intellectual property and our failure to protect it could harm our competitive position.
Our success depends in part upon our internally-developed technology and models, proprietary processes, and other intellectual property that we incorporate in our products and utilize to provide our services. If we fail to protect our intellectual property, our competitors could market services or products similar to our services and products, which could reduce demand for our offerings. Government clients typically retain a perpetual, worldwide, royalty-free right to use the intellectual property we develop for them in a manner defined within government regulations, including providing it to other government agencies or departments, as well as to our competitors in connection with their performance of government contracts. When necessary, we seek authorization to use intellectual property developed for the government or to secure export authorization. Government clients may grant us the right to commercialize software developed with government funding, but they are not required to do so. If we improperly use intellectual property that was even partially funded by government clients, these clients could seek damages and royalties from us, sanction us, and prevent us from working on future government contracts. Actions could also be taken against us if we improperly use intellectual property belonging to others besides our government clients. In addition, there can be substantial costs associated with protecting our intellectual property, which can also have an adverse effect on our results of operations.
We may be harmed by intellectual property infringement claims.
We have been subject to claims, and are likely to be subject to future claims, that the intellectual property we use in delivering services and business solutions to our clients infringes upon the intellectual property rights of others. Our employees develop much of the intellectual property that we use to provide our services and business solutions to our clients, but we also acquire or obtain rights to use intellectual property through mergers or acquisitions of other companies, engage third parties to assist us in the development of intellectual property and license technology from other vendors. If our vendors, our employees or third parties assert claims that we or our clients are infringing on their intellectual property, we could incur substantial costs to defend those claims, even if we prevail. In addition, if any of these infringement claims are ultimately successful, we could be required to:
|
|
• |
Pay substantial damages; |
|
|
• |
Cease selling and using products and services that incorporate the challenged intellectual property; |
|
|
• |
Obtain a license or additional licenses from our vendors or other third parties, which may not be available on commercially reasonable terms or at all; and |
|
|
• |
Re-design our products and services that rely on the challenged intellectual property, which may be very expensive or commercially impractical. |
Any of these outcomes could further adversely affect our operating results.
Systems and/or service failures could interrupt our operations, leading to reduced revenue and profit.
Any interruption in our operations or any systems’ failures, including, but not limited to: (i) the inability of our staff to perform their work in a timely fashion, whether caused by limited access to and/or closure of our and/or our clients’ offices or otherwise; (ii) the failure of network, software and/or hardware systems; and (iii) other interruptions and failures, whether caused by us, a third-party service provider, unauthorized intruders and/or hackers, computer viruses, natural disasters, power shortages, terrorist attacks or otherwise, could cause loss of data
24
and interruptions or delays in our business or that of our clients, or both. In addition, the failure or disruption of mail, communications and/or utilities could cause an interruption or suspension of our operations or otherwise harm our reputation or business. Our property and business interruption insurance may be inadequate to compensate us for all losses that may occur as a result of any system or operational failure or disruption and, as a result, revenue, profits and operating results could be adversely affected.
Improper disclosure of confidential and personal data could result in liability and harm our reputation.
We store and process increasingly large amounts of confidential information concerning our employees, customers and vendors, as well as confidential information on behalf of our customers (such as information regarding applicants in programs on which we perform services through our contractual relationships with customers). Therefore, we must ensure that we are at all times compliant with the various privacy laws, rules, and regulations in all of the countries within which we are operating. These laws, rules, and regulations can vary significantly from country to country, with many being more onerous than those in the U.S. Moreover, we must ensure that all of our vendors who have access to such information also have the appropriate privacy policies, procedures and protections in place. There can be substantial costs associated with protecting confidential information and maintaining compliance with the various privacy laws, rules and regulations, which could have an adverse effect on our results of operations.
Although we believe we take measures to protect such information that are appropriate given the size and nature of our business, the continued occurrence of high-profile data breaches of other companies provides evidence of an external environment increasingly hostile to information security. In particular, cybersecurity attacks are evolving, and we face the constant risk of cybersecurity threats, whether from deliberate attacks or unintentional events, including computer viruses, attacks by computer hackers, phishing attacks, and other electronic security breaches that could lead to disruptions in critical systems, unauthorized release of confidential or otherwise protected information and/or corruption of data. In particular, as a federal government contractor, we face a heightened risk of a security breach or disruption with respect to personally identifiable, sensitive but unclassified, classified, or otherwise protected data resulting from an attack by computer hackers, foreign governments and/or cyber terrorists. Improper disclosure of this information could harm our reputation and affect our relationships with business partners, lead to legal exposure, or subject us to liability under laws, rules and regulations that protect personal or other confidential data, resulting in increased costs or loss of revenue. With the passage and upcoming enforcement of the GDPR, we are subject to stricter regulations surrounding our E.U. privacy, and could be subject to fines for failures to adhere to the new standards. In addition, any failure of third-party systems, which are outside of our control but still impact us, could have similar adverse effects.
RISKS RELATED TO ACQUISITIONS
When we undertake acquisitions, they may present integration challenges, fail to perform as expected, increase our liabilities, and/or reduce our earnings.
One of our growth strategies is to make strategic acquisitions. When we complete acquisitions, it may be challenging and costly to integrate the acquired businesses due to operating and integrating new accounting systems, differences in the locations of personnel and facilities, differences in corporate cultures, disparate business models, or other reasons. If we are unable to successfully integrate acquired companies, our revenue and operating results could suffer. In addition, we may not successfully achieve the anticipated cost efficiencies and synergies from these acquisitions. Also, our costs for managerial, operational, financial, and administrative systems may increase and be higher than anticipated. During and following the integration of an acquired business, we may experience attrition, including losing key employees and/or clients of the acquired business, which could adversely affect our future revenue and operating results and prevent us from achieving the anticipated benefits of the acquisition.
Businesses we acquire may have liabilities or adverse operating issues, or both, that we either fail to discover through due diligence or underestimate prior to the consummation of the acquisition. These liabilities and/or issues may include the acquired business’ failure to comply with, or other violations of, applicable laws, rules, or regulations or contractual or other obligations or liabilities. As the successor owner, we may be financially responsible for, and may suffer harm to our reputation or otherwise be adversely affected by, such liabilities and/or issues. An acquired business also may have problems with internal controls over financial reporting, which could in turn cause us to have significant deficiencies or material weaknesses in our own internal controls over financial reporting. These and any other costs, liabilities, issues, and/or disruptions associated with any past or future acquisitions, and the related integration, could harm our operating results.
25
As a result of our acquisitions, we have substantial amounts of goodwill and intangible assets, and changes in business conditions could cause these assets to become impaired, requiring write-downs that would adversely affect our operating results.
All of our acquisitions have involved purchase prices well in excess of tangible asset values net of liabilities assumed, resulting in the creation of a significant amount of goodwill and other intangible assets. As of December 31, 2017, goodwill and purchased intangibles accounted for approximately 62% and 3%, respectively, of our total assets. Under U.S. generally accepted accounting principles (“GAAP”), we do not amortize goodwill and intangible assets acquired in a purchase business combination that are determined to have indefinite useful lives. Instead, we review them for impairment annually (or more frequently if impairment indicators arise). Although we have to date determined that such assets have not been impaired, future events or changes in circumstances that result in an impairment of goodwill or other intangible assets would have a negative impact on our profitability and operating results.
RISKS RELATED TO OUR CORPORATE AND CAPITAL STRUCTURE
Provisions of our charter documents and Delaware law may prevent or deter potential acquisition bids to acquire us and other actions that stockholders may consider favorable, and the market price of our common stock may be lower as a result.
Our charter documents contain the following provisions that could have an anti-takeover effect:
|
|
• |
Our board of directors is divided into three classes, making it more difficult for stockholders to change the composition of the board; |
|
|
• |
Directors may be removed only for cause; |
|
|
• |
Our stockholders are not permitted to call a special meeting of the stockholders; |
|
|
• |
All stockholder actions are required to be taken by a vote of the stockholders at an annual or special meeting or by a written consent signed by all of our stockholders; |
|
|
• |
Our stockholders are required to comply with advance notice procedures to nominate candidates for election to our board of directors or to place stockholders’ proposals on the agenda for consideration at stockholder meetings; and |
|
|
• |
The approval of the holders of capital stock representing at least two-thirds of our voting power is required to amend our indemnification obligations, director classifications, stockholder proposal requirements, and director candidate nomination requirements set forth in our amended and restated certificate of incorporation and amended and restated bylaws. |
In addition, we are subject to the anti-takeover provisions of Section 203 of the Delaware General Corporation Law, which regulates corporate acquisitions. These provisions could discourage potential acquisition proposals; delay or prevent a change-in-control transaction; discourage others from making tender offers for our common stock; and/or prevent changes in our management.
There are risks associated with our outstanding and future indebtedness which could reduce our profitability, limit our ability to pursue certain business opportunities and reduce the value of our stock.
As of December 31, 2017, we had an aggregate of $206.3 million of outstanding indebtedness under a credit facility that will mature on May 17, 2022. Subject to the limits contained in the agreements governing our outstanding debt, we may incur additional debt in the future. Our ability to pay interest and repay the principal for our indebtedness, as well as meet our debt and operations covenant requirements, is dependent upon our ability to, among other things, manage our business operations, and generate sufficient cash flows to service such debt. If we are unable to comply with the terms of our financing agreements or obtain additional required financing, this could ultimately result in a significant adverse effect on our financial results and the value of our stock. Among other things, our debt could:
|
|
• |
Make it difficult to obtain additional financing for working capital, capital expenditures, acquisitions, or other general corporate purposes; |
26
|
|
• |
Result in a substantial portion of our cash flows from operations being dedicated to the payment of the principal and interest on our debt, as well as used to make debt service payments; |
|
|
• |
Limit our flexibility in planning for, and reacting to, changes in our business and the marketplace; |
|
|
• |
Place us at a competitive disadvantage relative to other less leveraged firms; and |
|
|
• |
Increase our vulnerability to economic downturns and rises in interest rates. |
Should any of these or other unforeseen consequences arise, they could have an adverse effect on our business, financial condition, results of operations, future business opportunities and/or ability to satisfy our obligations under our debt.
We cannot assure you that we will pay special or regular dividends on our stock in the future.
The board of directors has authorized and declared a regular dividend on February 27, 2018 for the first time in the Company’s history. The declaration of any future dividends and the establishment of the per share amount, record dates and payment dates for any such future dividends are subject to the discretion of the board of directors taking into account future earnings, cash flows, net income, dividend yield and other factors. Authorization of dividends by the Board is subject to adherence/compliance with the Company’s credit facility. There can be no assurance that the board of directors will declare any dividends in the future. To the extent that expectations by market participants regarding the potential payment, or amount, of any special or regular dividend prove to be incorrect, the price of our common stock may be materially and negatively affected and investors that bought shares of our common stock based on those expectations may suffer a loss on their investment.
None.
We lease our offices and do not own any real estate. As of December 31, 2017, we leased approximately 313,658 square feet of office space at our corporate headquarters at 9300/9302 Lee Highway, Fairfax, Virginia (in the Washington, D.C. metropolitan area) through December 2022 (the “Fairfax Offices”). The Fairfax Offices house a portion of our operations and almost all of our corporate functions, including most of our staff within executive management, treasury, accounting, legal, human resources, business and corporate development, facilities management, information services, and contracts.
As of December 31, 2017, we had leases in place for approximately 1.2 million square feet of office space in more than 82 office locations throughout the U.S. and around the world, with various lease terms expiring over the next 10 years. As of December 31, 2017, approximately 23,716 square feet of the space we leased was subleased to other parties. We believe that our current office space, as well as other office space we expect to be able to lease, will meet our needs for the next several years. Lastly, a portion of our operations staff is housed at client-provided facilities, pursuant to the terms of a number of our client contracts.
We are involved in various legal matters and proceedings arising in the ordinary course of business. While these matters and proceedings cause us to incur costs, including, but not limited to, attorneys’ fees, we currently believe that any ultimate liability arising out of these matters and proceedings will not have a material adverse effect on our financial position, results of operations, or cash flows.
An update on litigation related to our Road Home contract is discussed in “Note 17— Commitments and Contingencies — Road Home Contract” in our financial statements.
Not applicable.
27
|
ITEM 5. |
MARKET FOR REGISTRANT’S COMMON EQUITY, RELATED STOCKHOLDER MATTERS AND ISSUER PURCHASES OF EQUITY SECURITIES |
Market Information
Our common stock trades on the NASDAQ Global Select Market under the symbol “ICFI.” The high and low sales prices per share of our common stock for each quarter of 2017 and 2016 were as follows:
|
|
|
Sales Price Per Share |
|
|||||
|
|
|
(in dollars) |
|
|||||
|
|
|
High |
|
|
Low |
|
||
|
2017 Fourth Quarter |
|
$ |
56.20 |
|
|
$ |
50.85 |
|
|
2017 Third Quarter |
|
$ |
56.55 |
|
|
$ |
41.10 |
|
|
2017 Second Quarter |
|
$ |
49.00 |
|
|
$ |
40.20 |
|
|
2017 First Quarter |
|
$ |
57.95 |
|
|
$ |
40.20 |
|
|
2016 Fourth Quarter |
|
$ |
59.55 |
|
|
$ |
43.66 |
|
|
2016 Third Quarter |
|
$ |
45.44 |
|
|
$ |
38.64 |
|
|
2016 Second Quarter |
|
$ |
42.80 |
|
|
$ |
34.16 |
|
|
2016 First Quarter |
|
$ |
35.75 |
|
|
$ |
31.26 |
|
Holders
As of February 23, 2018, there were 34 registered holders of record of our common stock. This number is not representative of the number of beneficial holders because many of the shares are held by depositories, brokers, or nominees.
Dividends
On February 27, 2018, the Company’s board of directors declared a $0.14 per share cash dividend. The dividend is payable on April 16, 2018 to shareholders of record as of the close of business on March 30, 2018. The declaration and payment of any dividends is at the sole discretion of the board of directors and is not guaranteed. The Company’s amended credit facility contains certain restrictions related to the payment of cash dividends, requiring the Company to meet certain covenants prior to and after the declaration of any dividend.
Stock Performance Graph
The following graph compares the cumulative total stockholder return on our common stock from December 31, 2012 through December 31, 2017, with the cumulative total return on (i) the NASDAQ Composite, (ii) the Russell 2000 stock index, and (iii) the Company’s 2017 peer group composed of other governmental and commercial service providers: Booz Allen Hamilton Holding Corporation; CACI International Inc.; CBIZ, Inc.; Convergys Corporation; CRA International, Inc.; Exponent Inc.; FTI Consulting, Inc.; GP Strategies Corporation; Huron Consulting Group Inc.; ManTech International Corporation; Maximus, Inc.; Navigant Consulting, Inc.; Resources Connection, Inc.; Science Applications International Corporation; Tetra Tech, Inc.; Unisys Corporation; and VSE Corporation (the “2017 Peer Group”). As part of the annual process of reviewing the peer group, management ensures that the selected companies remain aligned with the Company’s evolving business strategy. With respect to our 2017 Peer Group, there were four companies that were on the 2016 peer group that have been removed due to mergers and acquisition activities during the year: The Advisory Board Company, CDI Corporation, CEB, Inc., Gartner Inc., Leidos Holdings, Inc. and NCI, Inc. The comparison below assumes an initial investment of $100.00 on December 31, 2012 in which all dividends (if any) are reinvested and all returns are market-cap weighted. The historical information set forth below is not necessarily indicative of future performance.
28
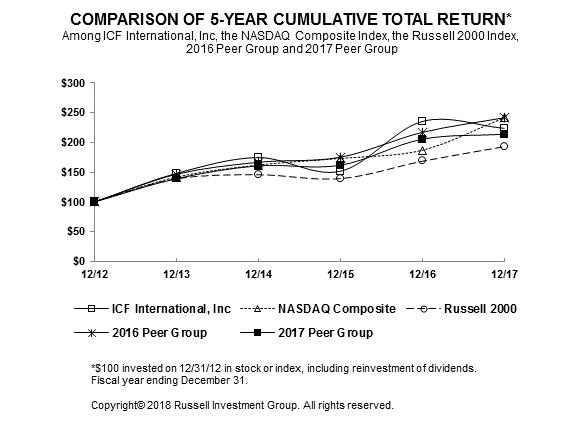
|
|
|
Year Ended December 31, |
|
|||||||||||||||||
|
|
|
2013 |
|
|
2014 |
|
|
2015 |
|
|
2016 |
|
|
2017 |
|
|||||
|
ICF International, Inc. |
|
$ |
148.08 |
|
|
$ |
174.83 |
|
|
$ |
151.71 |
|
|
$ |
235.49 |
|
|
$ |
223.98 |
|
|
NASDAQ Composite |
|
|
141.63 |
|
|
|
162.09 |
|
|
|
173.33 |
|
|
|
187.19 |
|
|
|
242.29 |
|
|
Russell 2000 Index |
|
|
138.82 |
|
|
|
145.62 |
|
|
|
139.19 |
|
|
|
168.85 |
|
|
|
193.58 |
|
|
2016 Peer Group |
|
|
146.58 |
|
|
|
166.93 |
|
|
|
175.36 |
|
|
|
217.13 |
|
|
|
241.76 |
|
|
2017 Peer Group |
|
|
139.28 |
|
|
|
160.96 |
|
|
|
161.82 |
|
|
|
205.62 |
|
|
|
213.91 |
|
Recent Sales of Unregistered Securities
During the three months ended December 31, 2017, the Company issued the following securities that were not registered under the Securities Act of 1933, as amended (the “Securities Act”). No underwriters were involved in the following issuances of securities.
(a) Issuances of Common Stock:
For the three months ended December 31, 2017, a total of 3,092 shares of unregistered common stock, valued at an aggregate of $170,215 were issued to seven of the Company’s directors on October 4, 2017 for director-related compensation.
Each of these issuances was made in reliance on the exemption from registration provisions of the Securities Act, set forth in Section 4(2) thereof relative to sales by an issuer not involving any public offering and the rules and regulations thereunder. The recipients of securities in each case acquired the securities for investment only and not with a view to the distribution thereof. Each of the recipients of securities in these transactions was an accredited or sophisticated person and had adequate access, through employment, business, or other relationships, to information about the Company.
29
Purchases of Equity Securities by Issuer
The following table summarizes the share repurchase activity for the three months ended December 31, 2017 for our share repurchase plan and shares purchased in satisfaction of employee tax withholding obligations.
|
Period |
|
Total Number of Shares Purchased (a) |
|
|
Average Price Paid per Share (a) |
|
|
Total Number of Shares Purchased as Part of Publicly Announced Plans or Programs (b) |
|
|
Approximate Dollar Value of Shares that May Yet Be Purchased Under the Plans or Programs (b) |
|
||||
|
October 1 – October 31 |
|
|
— |
|
|
$ |
— |
|
|
|
— |
|
|
$ |
25,732,466 |
|
|
November 1 – November 30 |
|
|
3,399 |
|
|
$ |
52.46 |
|
|
|
— |
|
|
$ |
100,000,000 |
|
|
December 1 – December 31 |
|
|
— |
|
|
$ |
— |
|
|
|
— |
|
|
$ |
100,000,000 |
|
|
Total |
|
|
3,399 |
|
|
$ |
52.46 |
|
|
|
— |
|
|
|
|
|
|
(a) |
The total number of shares purchased of 3,399 includes shares repurchased pursuant to our share repurchase program described further in footnote (b) below, as well as shares purchased from employees to pay required withholding taxes related to the settlement of restricted stock units in accordance with our applicable long-term incentive plan. During the three months ended December 31, 2017, the Company repurchased 3,399 shares of common stock from employees in satisfaction of tax withholding obligations at an average price of $52.46 per share. |
|
(b) |
In the third quarter of 2017, the Company’s board of directors approved a new share repurchase plan, effective November 4, 2017, and expiring on November 4, 2019 that authorizes share repurchases in the aggregate up to $100.0 million, not to exceed the amount allowed under our revolving line of credit. The Credit Facility, which the Company entered into on May 17, 2017, placed a limit on the Company’s Leverage Ratio, prior to and after giving effect to any repurchase, to be no greater than 3.25 to 1.00. During the three months ended December 31, 2017, the Company did not repurchase shares under this program. |
30
The following table presents selected historical financial data derived from our audited consolidated financial statements and other information for each of the five years presented. This information should be read in conjunction with “Management’s Discussion and Analysis of Financial Condition and Results of Operations” and our audited financial statements and the related notes included elsewhere in this Annual Report. The financial information below reflects the results or impact of our acquisitions since the date the entities were purchased.
|
|
|
Year Ended December 31, |
|
|||||||||||||||||
|
|
|
2017 |
|
|
2016 |
|
|
2015 |
|
|
2014 |
|
|
2013 |
|
|||||
|
|
|
(in thousands, except per share amounts) |
|
|||||||||||||||||
|
Statement of Earnings Data: |
|
|
|
|
|
|
|
|
|
|
|
|
|
|
|
|
|
|
|
|
|
Revenue |
|
$ |
1,229,162 |
|
|
$ |
1,185,097 |
|
|
$ |
1,132,232 |
|
|
$ |
1,050,134 |
|
|
$ |
949,303 |
|
|
Direct costs |
|
|
771,725 |
|
|
|
745,137 |
|
|
|
694,436 |
|
|
|
654,946 |
|
|
|
591,516 |
|
|
Operating costs and expenses: |
|
|
|
|
|
|
|
|
|
|
|
|
|
|
|
|
|
|
|
|
|
Indirect and selling expenses |
|
|
346,440 |
|
|
|
328,048 |
|
|
|
329,159 |
|
|
|
302,020 |
|
|
|
272,387 |
|
|
Depreciation and amortization |
|
|
17,691 |
|
|
|
16,638 |
|
|
|
16,222 |
|
|
|
13,369 |
|
|
|
11,238 |
|
|
Amortization of intangible assets |
|
|
10,888 |
|
|
|
12,481 |
|
|
|
17,184 |
|
|
|
10,437 |
|
|
|
9,477 |
|
|
Total operating costs and expenses |
|
|
375,019 |
|
|
|
357,167 |
|
|
|
362,565 |
|
|
|
325,826 |
|
|
|
293,102 |
|
|
Operating income |
|
|
82,418 |
|
|
|
82,793 |
|
|
|
75,231 |
|
|
|
69,362 |
|
|
|
64,685 |
|
|
Interest expense |
|
|
(8,553 |
) |
|
|
(9,470 |
) |
|
|
(10,072 |
) |
|
|
(4,254 |
) |
|
|
(2,447 |
) |
|
Other income (expense) |
|
|
121 |
|
|
|
1,184 |
|
|
|
(1,559 |
) |
|
|
(958 |
) |
|
|
(12 |
) |
|
Income before income taxes |
|
|
73,986 |
|
|
|
74,507 |
|
|
|
63,600 |
|
|
|
64,150 |
|
|
|
62,226 |
|
|
Provision for income taxes |
|
|
11,110 |
|
|
|
27,923 |
|
|
|
24,231 |
|
|
|
24,120 |
|
|
|
22,896 |
|
|
Net income |
|
$ |
62,876 |
|
|
$ |
46,584 |
|
|
$ |
39,369 |
|
|
$ |
40,030 |
|
|
$ |
39,330 |
|
|
|
|
|
|
|
|
|
|
|
|
|
|
|
|
|
|
|
|
|
|
|
|
Earnings per share (“EPS”)(1): |
|
|
|
|
|
|
|
|
|
|
|
|
|
|
|
|
|
|
|
|
|
Basic |
|
$ |
3.35 |
|
|
$ |
2.45 |
|
|
$ |
2.04 |
|
|
$ |
2.04 |
|
|
$ |
1.99 |
|
|
Diluted |
|
$ |
3.27 |
|
|
$ |
2.40 |
|
|
$ |
2.00 |
|
|
$ |
2.00 |
|
|
$ |
1.95 |
|
|
Weighted-average shares: |
|
|
|
|
|
|
|
|
|
|
|
|
|
|
|
|
|
|
|
|
|
Basic |
|
|
18,766 |
|
|
|
18,989 |
|
|
|
19,335 |
|
|
|
19,608 |
|
|
|
19,755 |
|
|
Diluted |
|
|
19,244 |
|
|
|
19,416 |
|
|
|
19,663 |
|
|
|
19,997 |
|
|
|
20,186 |
|
|
|
|
|
|
|
|
|
|
|
|
|
|
|
|
|
|
|
|
|
|
|
|
|
|
As of December 31, |
|
|||||||||||||||||
|
|
|
2017 |
|
|
2016 |
|
|
2015 |
|
|
2014 |
|
|
2013 |
|
|||||
|
Consolidated balance sheet data: |
|
|
|
|
|
|
|
|
|
|
|
|
|
|
|
|
|
|
|
|
|
Cash and cash equivalents |
|
$ |
11,809 |
|
|
$ |
6,042 |
|
|
$ |
7,747 |
|
|
$ |
12,122 |
|
|
$ |
8,953 |
|
|
Total assets |
|
|
1,110,255 |
|
|
|
1,085,571 |
|
|
|
1,080,290 |
|
|
|
1,110,340 |
|
|
|
700,914 |
|
|
Long-term debt |
|
|
206,250 |
|
|
|
259,389 |
|
|
|
311,532 |
|
|
|
350,052 |
|
|
|
40,000 |
|
|
Total stockholders’ equity |
|
|
616,030 |
|
|
|
566,004 |
|
|
|
523,276 |
|
|
|
500,689 |
|
|
|
474,091 |
|
|
(1) |
No cash dividends were paid in the years ended December 31, 2017, 2016, 2015, 2014, and 2013. |
31
The following discussion and analysis should be read in conjunction with the “Selected Financial Data” and the consolidated financial statements and related notes included elsewhere in this Annual Report on Form 10-K. This discussion and analysis contains forward-looking statements that involve risks, uncertainties, and assumptions, such as statements of our plans, objectives, expectations, and intentions. The cautionary statements made in this Annual Report on Form 10-K should be read as applying to all related forward-looking statements wherever they appear in this Annual Report on Form 10-K. Our actual results could differ materially from those anticipated in the forward-looking statements. Factors that could cause or contribute to our actual results differing materially from those anticipated include those discussed in “Risk Factors” and elsewhere in this Annual Report on Form 10-K.
OVERVIEW AND OUTLOOK
We provide professional services and technology-based solutions to government and commercial clients, including management, marketing, technology, and policy consulting and implementation services. We help our clients conceive, develop, implement, and improve solutions that address complex natural resource, social, and public safety issues. Our clients operate in four key markets: energy, environment, and infrastructure; health, education, and social programs; safety and security; and consumer and financial. We provide services that deliver value throughout the entire life cycle of a policy, program, project, or initiative, from initial research, analysis, assessment and advice to design and implementation of programs and technology-based solutions, and the provision of engagement services and programs.
Our clients utilize our services because we combine diverse institutional knowledge and experience with the deep subject matter expertise of our highly educated staff which we deploy in multi-disciplinary teams. We have successfully worked with many of our clients for decades, with the result that we have an unusually knowledgeable perspective on their needs. We categorize our clients into two classifications: government and commercial. Within the government classification, we present three client sub-classifications: U.S. federal government, state and local government, and international government.
Our largest clients are U.S. federal government departments and agencies. In fact, our federal government clients have included every cabinet-level department, most significantly HHS, DOS, and DoD. Federal government clients generated approximately 45%, 48%, and 48% of our revenue in 2017, 2016, and 2015, respectively. State and local government clients generated approximately 10%, 11%, and 10% of our revenue in 2017, 2016, and 2015, respectively. International government clients generated approximately 7%, 6%, and 7% of our revenue in 2017, 2016, and 2015, respectively.
We also serve a variety of commercial clients worldwide, including: airlines, airports, electric and gas utilities, oil companies, hospitals, health insurers and other health-related companies, banks and other financial services companies, transportation, travel and hospitality firms, non-profits/associations, law firms, manufacturing firms, retail chains, and distribution companies. Our commercial clients, which include clients outside the U.S., generated approximately 38%, 35%, and 35% of our revenue in 2017, 2016, and 2015, respectively.
We report operating results and financial data as a single segment based on the consolidated information used by our chief operating decision-maker in evaluating the financial performance of our business and allocating resources. Our single segment represents our core business—professional services for government and commercial clients. Although we describe our multiple service offerings to clients that operate in four markets to provide a better understanding of the scope and scale of our business, we do not manage our business or allocate our resources based on those service offerings or client markets.
In 2017, we saw growth in commercial client revenue and international government revenue which was partially offset by lower U.S. federal and state and local government revenue. Our total revenue increased to $1,229.2 million, an increase of $44.1 million, or 3.7%, for the year ended December 31, 2017 compared to the prior year. Operating income decreased $0.4 million, or 0.5%, to $82.4 million for the year ended December 31, 2017 compared to the prior year due to the increase in indirect expenses, offset by lower amortization of intangible assets. Indirect expenses increased compared to the prior year primarily due to the current year effect of cost-saving actions to drive long-term profitability and an increase in the portion of incentive compensation to be paid as cash bonus expense which enabled us to include this additional cash expense in the tax provision. Net income increased $16.3 million, or 35.0%, to $62.9 million, largely driven by a $16.8 million decrease in the tax provision due to the enactment in December 2017 the Tax Act.
32
We believe that demand for our services will continue to grow as government, industry, and other stakeholders seek to address critical long-term societal and natural resource issues due to heightened concerns about clean energy and energy efficiency; health promotion, treatment, and cost control; and ongoing homeland security threats. We also see significant opportunity to further leverage our digital and client engagement capabilities across our commercial and government client base. Our future results will depend on the success of our strategy to enhance our client relationships and seek larger engagements that span the entire program life cycle, and to complete and successfully integrate additional strategic acquisitions. We will continue to focus on broadening domain expertise and building scale in key client markets and geographies by developing business with existing and new government and commercial clients, and replicating our business model in selective geographies. In doing so, we will continue to evaluate strategic acquisition opportunities, seeking acquisitions that promote the achievement of strategic objectives like enhancing our subject matter knowledge, broadening our service offerings, and/or providing scale in specific geographies, and from which we believe that we can earn an acceptable return.
U.S. federal government revenue was 45% of our total revenue for the year ended December 31, 2017. While we continue to see favorable long-term market opportunities, there are certain near-term challenges facing all government service providers, including top-line legislative constraints on federal government discretionary spending; actions by Congress could result in a delay or reduction to our revenue, profit and cash flows and could have a negative impact on our business and results of operations. However, we believe we are well positioned in budget areas that will continue to be priorities to the federal government.
We believe that the combination of internally-generated funds, available bank borrowings, and cash and cash equivalents on hand will provide the required liquidity and capital resources necessary to fund on-going operations, potential acquisitions, customary capital expenditures, and other working capital requirements.
Our results of operations and cash flows may vary significantly from quarter to quarter depending on a number of factors, including, but not limited to:
|
|
• |
Progress of contract performance; |
|
|
• |
Extraordinary economic events and natural disasters; |
|
|
• |
Number of billable days in a quarter; |
|
|
• |
Timing of client orders; |
|
|
• |
Timing of award fee notices; |
|
|
• |
Changes in the scope of contracts; |
|
|
• |
Variations in purchasing patterns under our contracts; |
|
|
• |
U.S. federal and state and local governments’ and other clients’ spending levels; |
|
|
• |
Timing of billings to, and payments by clients; |
|
|
• |
Timing of receipt of invoices from, and payments to, employees and vendors; |
|
|
• |
Commencement, completion, and termination of contracts; |
|
|
• |
Strategic decisions, such as acquisitions, consolidations, divestments, spin-offs, joint ventures, strategic investments, and changes in business strategy; |
|
|
• |
Timing of significant costs and investments (such as bid and proposal costs and the costs involved in planning or making acquisitions); |
|
|
• |
Timing of events related to discrete tax items; |
|
|
• |
Our contract mix and use of subcontractors or the timing of other direct costs for which we may earn lower contract margin; |
|
|
• |
Changes in contract margin performance due to performance risks; |
|
|
• |
Additions to, and departures of, staff; |
|
|
• |
Changes in staff utilization; |
33
|
|
• |
Paid time off taken by our employees; |
|
|
• |
Level and cost of our debt; |
|
|
• |
Changes in accounting principles and policies; and/or |
|
|
• |
General market and economic conditions. |
Because a significant portion of our expenses (such as personnel, facilities, and related costs) are fixed in the short term, contract performance and variation in the volume of activity, as well as in the number and volume of contracts commenced or completed during any year, may cause significant variations in operating results from year to year. We generally have been able to price our contracts in a manner that accommodates the rates of inflation experienced in recent years, although we cannot ensure that we will be able to do so in the future.
ACQUISITIONS AND BUSINESS COMBINATIONS
A key element of our growth strategy is to pursue acquisitions. In 2016 we added Trade NTE and, subsequent to year end in January 2018, we acquired The Future Customer.
Trade NTE. In November 2016, we acquired certain contracts of Trade NTE, a Georgia-based company specializing in strategic marketing and branding services. The acquisition enhanced our branding services through existing engagements and relationships with its clients and customers. The acquisition was immaterial to our financial statements taken as a whole.
The Future Customer. In January 2018, we acquired The Future Customer, a leading boutique loyalty strategy and marketing company based in London. The Future Customer will operate as part of our 1to1 loyalty and customer relationship marketing practice. The acquisition was immaterial to our financial statements taken as a whole.
CRITICAL ACCOUNTING POLICIES
The preparation of our financial statements in accordance with GAAP requires that we make estimates and judgments that affect the reported amount of assets, liabilities, revenue and expenses, as well as the disclosure of contingent liabilities. If any of these estimates or judgments prove to be incorrect, our reported results could be materially affected. Actual results may differ significantly from our estimates under different assumptions or conditions. We believe that the estimates, assumptions and judgments involved in the accounting practices described below have the greatest potential impact on our financial statements and therefore consider them to be critical accounting policies. Significant accounting policies, including the critical accounting policies listed below, are more fully described and discussed in “Note 2—Summary of Significant Accounting Policies” in the “Notes to Consolidated Financial Statements.”
Revenue Recognition
We recognizes revenue when persuasive evidence of an arrangement exists, services have been rendered, the contract price is fixed or determinable and collectability is reasonably assured. We enters into three types of contracts: time-and-materials, cost-based and fixed-price.
|
|
• |
Time-and-Materials Contracts. Revenue for time-and-materials contracts is recorded on the basis of labor hours worked multiplied by the contract-defined billing rates, plus the costs of other items used in the performance of the contract. Profits and losses on time-and-materials contracts result from the difference between the cost of services performed and the contract-defined billing rates for these services. |
|
|
• |
Cost-Based Contracts. Revenue under cost-based contracts is recognized as costs are incurred. Applicable estimated profit, if any, is included in earnings in the proportion that incurred costs bear to total estimated costs. Incentives, award fees, or penalties related to performance are also considered in estimating revenue and profit rates based on actual and anticipated awards, taking into consideration factors such as our prior award experience and communications with the customer regarding performance. |
34
|
|
• |
Fixed-Price Contracts. Revenue for fixed-price contracts is recognized when earned, generally as work is performed. Services performed vary from contract to contract and are not always uniformly performed over the term of the arrangement. We recognize revenue in a number of different ways on fixed-price contracts based on the nature of the services to be provided and an assessment of what best mirrors the pattern of performance for the deliverable/contract, including: |
|
|
• |
Proportional Performance: Revenue on certain fixed-price contracts is recognized based on proportional performance when the provision of services extends beyond an accounting period with more than one discrete performance act, and progress towards completion can be measured based on a reliable output or input. Under this method, revenue is recorded each period based upon certain contract performance input measures incurred (labor hours, labor costs, or total costs) or output measures completed, expressed as a proportion of a total project estimate. Progress on a contract is monitored regularly to ensure that revenue recognized reflects project status. When hours or costs incurred are used as the basis for revenue recognition, the hours or costs incurred represent a reasonable surrogate for output measures of contract performance, including the presentation of deliverables to the client. Clients are obligated to pay as services are performed, and, in the event that a client cancels the contract, payment for services performed through the date of cancellation is typically negotiated with the client. |
|
|
• |
Specific Performance: When the services to be performed consist of a single act, revenue is recognized at the time the act is performed or at the completion of the single service. |
|
|
• |
Straight-Line: When services are performed or are expected to be performed consistently throughout an arrangement, or when we are compensated on a retainer or fixed-fee basis, revenue is recognized ratably over the period benefited. |
|
|
• |
Completed Contract: Revenue and costs on certain fixed-price contracts are recognized at completion if the final act is so significant to the arrangement that value is deemed to be transferred only at completion. |
Revenue recognition requires us to use judgment relative to assessing risks, estimating contract revenue and costs or other variables, and making assumptions for scheduling and technical issues. Due to the size and nature of many of our contracts, the estimation of revenue and estimates at completion can be complicated and subject to many variables. Contract costs include labor, subcontractor costs, and other direct costs, as well as an allocation of indirect costs. At times, we must also make assumptions regarding the length of time to complete the contract because costs include expected increases in wages, prices for subcontractors, and other direct costs. From time to time, we obtain new information which causes us to revise our estimated total costs or hours to fulfill contract requirements and thus the associated revenue earned on a contract. To the extent that a revised estimate affects contract profit or revenue previously recognized, we record the cumulative effect of the revision in the period in which the facts requiring the revision become known. A provision for the full amount of an anticipated loss on any type of contract is recognized in the period in which the anticipated loss becomes probable and can be reasonably estimated. As a result, operating results could be affected by revisions to prior accounting estimates.
Contractual arrangements are evaluated to assess whether revenue should be recognized on a gross versus net basis. Management’s assessment when determining gross versus net revenue recognition is based on several factors, such as whether we serve as the primary service provider, has autonomy in selecting subcontractors, or has credit risk, all of which are primary indicators that we serve as the principal to the transaction. In such cases, revenue is recognized on a gross basis. When such indicators are not present and we are primarily functioning as an agent under an arrangement, revenue is recognized on a net basis.
Payments to us on cost-based contracts with the U.S. federal government are provisional payments subject to audit and adjustment by the government. Indirect costs applied to government contracts are also subject to audit and adjustment and such audits have been finalized only through December 31, 2007. Contract revenue has been recorded in amounts that are expected to be realized on final audit and settlement of costs.
We prepare client invoices in accordance with the terms of the applicable contract, and billing terms may not be directly related to the performance of services. Unbilled receivables are invoiced based on the achievement of specific events as defined by each contract, including deliverables, timetables, and incurrence of certain costs. Unbilled receivables are classified as a current asset. Advanced billings to clients in excess of revenue earned are recorded as deferred revenue until the revenue recognition criteria are met. Reimbursements of out-of-pocket expenses are included in revenue with corresponding costs incurred by us included in the cost of revenue. We record revenue net of taxes collected from clients when the taxes are to be remitted to governmental authorities.
35
We may proceed with work based on client direction prior to the completion and signing of formal contract documents. We have a review process for approving any such work. Revenue associated with such work is recognized only when it can be reliably estimated and realization is probable. We base our estimates on a variety of factors, including previous experiences with the client, communications with the client regarding funding status, and its knowledge of available funding for the contract.
Goodwill and Other Intangible Assets
The purchase price of an acquired business is allocated to the tangible assets and separately identifiable intangible assets acquired, less liabilities assumed, based on their respective fair values, with the excess recorded as goodwill. Goodwill represents the excess of costs over the fair value of net assets of businesses acquired. Goodwill and intangible assets acquired in a purchase business combination and determined to have an indefinite useful life are not amortized, but instead reviewed annually for impairment, or more frequently if impairment indicators arise. Intangible assets with estimable useful lives are amortized over such lives and reviewed for impairment if impairment indicators arise. As of December 31, 2017, goodwill and intangibles assets were $686.1 million and $35.3 million, respectively.
During the fourth quarter of 2017, we elected to early adopt the Accounting Standards Update 2017-04, Intangibles—Goodwill and Other (Topic 350) (ASU 2017-04) issued by the Financial Accounting Standards Board (the “FASB”). ASU 2017-04 simplified the calculation and recognition of impairment of goodwill if there is evidence of an impairment based on qualitative or quantitative assessments by eliminating Step 2 of the two step impairment test required by the prior accounting standard. We do not believe that the early adoption of ASU 2017-04 had a material impact on our financial statements.
For the purpose of performing the annual goodwill impairment review as of October 1, 2017, we have one reporting unit. For the goodwill impairment test, we opted to perform a qualitative assessment of whether it is more likely than not that the reporting unit's fair value is less than its carrying amount. If, after completing the qualitative assessment, we determine that it is more likely than not that the estimated fair value of the reporting unit exceeded the carrying amount, we may conclude that no impairment exists. If we conclude otherwise, a goodwill impairment test must be performed, which includes a comparison of the fair value of the reporting unit to its carrying amount and recognizing as an impairment loss the difference of the estimated fair value of the reporting unit over its carrying amount.
Our qualitative analysis as of October 1, 2017 included macroeconomic and industry and market-specific considerations, financial performance indicators and measurements, and other factors. Based on this qualitative assessment, we determined that it is more likely than not that the fair value of our one reporting unit exceeded its carrying amount, and thus the impairment test was not required to be performed. Therefore, based on management’s review, no goodwill impairment charge was required as of October 1, 2017. Historically, we have not recorded any goodwill impairment charges.
We are required to review long-lived assets and certain identifiable intangibles for impairment whenever events or changes in circumstances indicate that the carrying amount of an asset might not be recoverable. Recoverability of assets to be held and used is measured by a comparison of the carrying amount of an asset to future undiscounted net cash flows expected to be generated by the asset. If such assets are considered to be impaired, the impairment to be recognized is measured by the amount by which the carrying amount of the asset exceeds its fair value. Assets to be disposed of are reported at the lower of the carrying amount or fair value, less cost to sell.
Accounting for Income Taxes
Our provisions for federal, state, and foreign income taxes are calculated from consolidated income based on current tax laws and any changes in tax rates from the rates used previously in determining the deferred tax assets and liabilities from temporary differences between financial statement carrying amounts and amounts on our tax returns.
36
We recognize deferred tax assets and liabilities for the expected future tax consequences of temporary differences between the financial statement carrying amounts of existing assets and liabilities and their respective tax bases. Deferred tax assets and liabilities are measured using enacted tax rates in effect for the year in which those temporary differences are expected to be recovered or settled. We evaluate our ability to benefit from all deferred tax assets and establish valuation allowances for amounts we believe are not more likely than not to be realized.
We use a more-likely-than-not recognition threshold based on the technical merits of the income tax position taken to evaluate uncertain tax positions. Uncertain tax positions that meet the more-likely-than-not recognition threshold are measured in order to determine the tax benefit recognized in the financial statements. Penalties, if probable and reasonably estimable, and interest expense related to uncertain tax positions are not recognized as a component of income tax expense but recorded separately in indirect expenses or interest expense, respectively.
On December 20, 2017 the United States House of Representatives and the Senate passed the Tax Act which was signed into law on December 22, 2017 and is generally effective beginning January 1, 2018. We will be impacted in several ways as a result of the Tax Act including, but not limited to, provisions which include a permanent reduction in the U.S. federal corporate income tax rate from 35% to 21%, the revaluation of deferred tax assets and liabilities that is required as a result of the tax rate change and the application of a mandatory one-time “transition tax” on unremitted earnings of certain foreign subsidiaries that were previously tax deferred.
We have not completed the accounting for the tax effects of enactment of the Tax Act; however, in certain cases, as described below, we have made a provisional estimate of the effects on our existing deferred tax balances and the one-time transition tax. We have recognized the provisional estimate as a reduction in the provision for income taxes, which is included as a component of income tax expense from continuing operations.
We re-measured certain deferred tax assets and liabilities based upon the rates at which they are expected to reverse in the future, which is generally 21%. However, we are still analyzing certain aspects of the Tax Act and refining our calculations, which could potentially affect the measurement of these balances or potentially give rise to new deferred tax amounts. Pursuant to Staff Accounting Bulletin (“SAB”) 118, the provisional amount recorded related to the re-measurement of our deferred tax balance was a net tax benefit of $17.6 million in 2017.
The one-time “transition tax” is based upon our total post-1986 earnings and profits (E&P) which we have previously deferred from U.S. income taxation. Pursuant to SAB 118, we have recorded a provisional estimate of approximately $1.4 million, net of related foreign tax credits, for our one-time transition tax liability for our foreign subsidiaries, resulting in an increase in income tax expense. We have not yet completed our calculation of the total post-1986 foreign E&P and related foreign tax pools for these foreign subsidiaries. Further, the transition tax is based in part on the amount of those earnings held in cash and other specified assets. This amount, as well as the related foreign tax credit utilization, may change when we finalize the calculation of post-1986 foreign E&P and related foreign tax pools previously deferred from U.S. federal taxation and finalize the amounts held in cash or other specified assets. Similarly, our cumulative foreign tax credit carry forward balance as of December 31, 2017 and any valuation allowance required (as applicable) may also change. No additional income taxes have been provided for any remaining undistributed foreign earnings not subject to the transition tax and any additional outside basis difference inherent in these entities as these amounts continue to be permanently reinvested in foreign operations.
Although we have not yet completed a comprehensive analysis of the Tax Act and cannot determine the full extent of its impact on our consolidated financial statements and related disclosures, we expect that the Tax Act will have some favorable impact on its annual effective income tax rate in fiscal year 2018. This expected favorable impact is due to the Tax Act’s lower corporate tax rate which will be effective for our fiscal year 2018, as well as expected impacts resulting from one-time events required by the Tax Act in fiscal year 2018. The net impacts of these one-time events are primarily driven by the anticipated favorable impacts as a result of our revaluation of deferred tax assets and liabilities, which is expected to be offset by the unfavorable impacts of the transition tax. The impact of the transition tax is a preliminary estimate and will not be finalized until the later part of 2018. We continue to evaluate the impact of the Tax Act and anticipates that any material adjustment will be made with the completion of our extended tax return.
37
Stock-based Compensation
The ICF International, Inc. 2010 Omnibus Incentive Plan (as amended, the “Omnibus Plan”) provides for the granting of options, stock appreciation rights, restricted stock, restricted stock units (“RSUs”), performance shares, performance units, cash-based awards, and other stock-based awards to all officers, key employees, and non-employee directors. As of December 31, 2017, there were approximately 1.9 million shares available for grant under the Omnibus Plan.
We utilize cash-settled RSUs (“CSRSUs”) which are settled only in cash payments. The cash payment is calculated by multiplying the number of CSRSUs vested by our closing stock price on the vesting date, subject to a maximum payment cap and a minimum payment floor. CSRSUs have no impact on the shares available for grant under the Omnibus Plan, and have no impact on the calculated shares used in earnings per share (“EPS”) calculations.
We also grant awards of unregistered shares to non-employee directors under the Annual Equity Election program. The awards are issued from treasury stock and have no impact on the shares available for grant under the Omnibus Plan.
We recognized total compensation expense relating to stock-based compensation of $17.5 million, $15.9 million, and $14.7 million for the years ended December 31, 2017, 2016, and 2015, respectively. We recognize stock-based compensation expense for stock options, restricted stock awards, RSUs and CSRSUs on a straight-line basis over the requisite service period, which is generally the vesting period, and adjusted for the stock price at the balance sheet date. We recognize expense for performance-based share awards (“PSAs”), which are subject to a performance condition and a market condition, on a straight-line basis over the performance period. Non-employee director awards do not include vesting conditions and are expensed over the performance period.
Stock-based compensation expense is based on the estimated fair value of these instruments and the estimated number of shares ultimately expected to vest. The calculation of the fair value of the awards requires certain inputs that are subjective and changes to the estimates used will cause the fair value of stock awards and related stock-based compensation expense to vary. The fair value of stock options, restricted stock awards, RSUs, PSAs and non-employee director awards is estimated based on the fair value of a share of common stock at the grant date. We have elected to use the Black-Scholes-Merton option pricing model to determine the fair value of stock options. The fair value of a stock option award is affected by the price of our stock on the date of grant, as well as other assumptions used as inputs in the valuation model. These assumptions include the estimated volatility of the price of our stock over the term of the awards, the estimated period of time that we expect employees will hold stock options, and the risk-free interest rate. The fair value of PSAs is estimated using a Monte Carlo simulation model. We treat CSRSUs as liability-classified awards, and accounts for them at fair value based on the closing price of our stock at the balance sheet date.
We are required to adjust stock-based compensation expense for the effects of estimated forfeitures of awards over the expense recognition period. We estimate the rate of future forfeitures based on factors which include our historical experience, but the amount of actual forfeitures may differ from current estimates particularly if the rate of future forfeitures is different from previous experience. In addition, the estimation of PSAs that will ultimately vest requires judgment in terms of estimates of future performance. To the extent actual performance or updated performance estimates differ from current estimates, such expense amounts are recorded as a cumulative adjustment in the period the estimates are revised. See “Note 13—Accounting for Stock-based Compensation” in the “Notes to Consolidated Financial Statements” for further discussion.
Recent Accounting Pronouncements
New accounting standards are discussed in “Note 2—Summary of Significant Accounting Policies” in the “Notes to Consolidated Financial Statements.”
SELECTED KEY METRICS
In order to evaluate operations, we track revenue by key metrics that provide useful information about the nature of our operations. Client markets provide insight into the breadth of our expertise. Client mix is an indicator of the diversity of our client base. Revenue by contract mix provides insight in terms of the degree of performance risk that we have assumed. Significant variances in the key metrics tables that are provided below are discussed under the revenue section of the results of operations.
38
Client markets
The following table shows revenue generated from client markets as a percent of total revenue for the periods indicated. For each client, we have attributed all revenue from that client to the market we consider to be the client’s primary market, even if a portion of that revenue relates to a different market. Certain minor revenue amounts reported in prior years have been reclassified within key market categories based on our current view of the client’s primary market in order to increase comparability of the current year to prior years.
|
|
Year ended December 31, 2017 |
|
|
Year ended December 31, 2016 |
|
|
Year ended December 31, 2015 |
|
||||||||||||
|
|
Dollars |
|
Percent |
|
|
Dollars |
|
Percent |
|
|
Dollars |
|
Percent |
|
||||||
|
Energy, environment, and infrastructure |
$ |
493,676 |
|
|
40 |
% |
|
$ |
457,992 |
|
|
39 |
% |
|
$ |
419,387 |
|
|
37 |
% |
|
Health, education, and social programs |
|
514,403 |
|
|
42 |
% |
|
|
508,903 |
|
|
43 |
% |
|
|
503,793 |
|
|
45 |
% |
|
Safety and security |
|
102,379 |
|
|
8 |
% |
|
|
98,358 |
|
|
8 |
% |
|
|
92,650 |
|
|
8 |
% |
|
Consumer and financial |
|
118,704 |
|
|
10 |
% |
|
|
119,844 |
|
|
10 |
% |
|
|
116,402 |
|
|
10 |
% |
|
Total |
$ |
1,229,162 |
|
|
100 |
% |
|
$ |
1,185,097 |
|
|
100 |
% |
|
$ |
1,132,232 |
|
|
100 |
% |
Our primary clients are the agencies and departments of the federal government and commercial clients. Most of our revenue is from contracts on which we are the prime contractor, which we believe provides us strong client relationships. In 2017, 2016, and 2015, approximately 90%, 89%, and 85% of our revenue, respectively, was from prime contracts.
Client type
The table below shows our revenue by type of client as a percentage of total revenue for the periods indicated. Certain immaterial revenue amounts in prior years have been reclassified due to minor adjustments and reclassification within client type.
|
|
Year ended December 31, 2017 |
|
|
Year ended December 31, 2016 |
|
|
Year ended December 31, 2015 |
|
||||||||||||
|
|
Dollars |
|
Percent |
|
|
Dollars |
|
Percent |
|
|
Dollars |
|
Percent |
|
||||||
|
U.S. federal government |
$ |
550,331 |
|
|
45 |
% |
|
$ |
563,498 |
|
|
48 |
% |
|
$ |
540,805 |
|
|
48 |
% |
|
U.S. state and local government |
|
127,914 |
|
|
10 |
% |
|
|
132,287 |
|
|
11 |
% |
|
|
110,760 |
|
|
10 |
% |
|
International government |
|
90,583 |
|
|
7 |
% |
|
|
75,636 |
|
|
6 |
% |
|
|
81,845 |
|
|
7 |
% |
|
Government |
|
768,828 |
|
|
62 |
% |
|
|
771,421 |
|
|
65 |
% |
|
|
733,410 |
|
|
65 |
% |
|
Commercial |
|
460,334 |
|
|
38 |
% |
|
|
413,676 |
|
|
35 |
% |
|
|
398,822 |
|
|
35 |
% |
|
Total |
$ |
1,229,162 |
|
|
100 |
% |
|
$ |
1,185,097 |
|
|
100 |
% |
|
$ |
1,132,232 |
|
|
100 |
% |
Contract mix
Contract mix varies from year to year due to numerous factors, including our business strategies and the procurement activities of our clients. Unless the context requires otherwise, we use the term “contracts” to refer to contracts and any task orders or delivery orders issued under a contract. There are three main types of contracts: time-and-materials contracts, fixed-price contracts, and cost-based contracts. See detailed discussion of contract types in Critical Accounting Policies - Revenue Recognition above.
The following table shows the approximate percentage of our revenue for each of these types of contracts for the periods indicated. Certain immaterial revenue amounts in prior years have been reclassified due to minor adjustments and reclassification within contract type.
|
|
Year ended December 31, 2017 |
|
|
Year ended December 31, 2016 |
|
|
Year ended December 31, 2015 |
|
||||||||||||
|
|
Dollars |
|
Percent |
|
|
Dollars |
|
Percent |
|
|
Dollars |
|
Percent |
|
||||||
|
Time-and-materials |
$ |
528,232 |
|
|
43 |
% |
|
$ |
511,747 |
|
|
43 |
% |
|
$ |
484,738 |
|
|
43 |
% |
|
Fixed-price |
|
480,769 |
|
|
39 |
% |
|
|
456,065 |
|
|
39 |
% |
|
|
434,263 |
|
|
38 |
% |
|
Cost-based |
|
220,161 |
|
|
18 |
% |
|
|
217,285 |
|
|
18 |
% |
|
|
213,231 |
|
|
19 |
% |
|
Total |
$ |
1,229,162 |
|
|
100 |
% |
|
$ |
1,185,097 |
|
|
100 |
% |
|
$ |
1,132,232 |
|
|
100 |
% |
39
Payments to us on cost-based contracts with the federal government are provisional payments subject to adjustment upon audit by the government. Such audits have been finalized through December 31, 2007, and any adjustments have been immaterial. Contract revenue for subsequent periods has been recorded in amounts that are expected to be realized on final audit and settlement of costs in those years.
RESULTS OF OPERATIONS
The following table sets forth certain items from our consolidated statements of comprehensive income, expresses these items as a percentage of revenue for the periods indicated and the period-over-period rate of change in each of them.
Years Ended December 31, 2017, 2016, and 2015
(dollars in thousands)
|
|
|
Year Ended December 31, |
|
|
|
Year to Year Change |
|
||||||||||||||||||||||||||||||||||||
|
|
|
2017 |
|
|
2016 |
|
|
2015 |
|
|
|
2017 |
|
|
2016 |
|
|
2015 |
|
|
|
2016 to 2017 |
|
|
|
2015 to 2016 |
|
||||||||||||||||
|
|
|
Dollars |
|
|
|
Percentages |
|
|
|
Dollars |
|
|
Percent |
|
|
|
Dollars |
|
|
Percent |
|
||||||||||||||||||||||
|
Revenue |
|
$ |
1,229,162 |
|
|
$ |
1,185,097 |
|
|
$ |
1,132,232 |
|
|
|
|
100.0 |
% |
|
|
100.0 |
% |
|
|
100.0 |
% |
|
|
$ |
44,065 |
|
|
|
3.7 |
% |
|
|
$ |
52,865 |
|
|
|
4.7 |
% |
|
Direct Costs |
|
|
771,725 |
|
|
|
745,137 |
|
|
|
694,436 |
|
|
|
|
62.8 |
% |
|
|
62.9 |
% |
|
|
61.4 |
% |
|
|
|
26,588 |
|
|
|
3.6 |
% |
|
|
|
50,701 |
|
|
|
7.3 |
% |
|
Operating Costs and Expenses |
|
|
|
|
|
|
|
|
|
|
|
|
|
|
|
|
|
|
|
|
|
|
|
|
|
|
|
|
|
|
|
|
|
|
|
|
|
|
|
|
|
|
|
|
Indirect and selling expenses |
|
|
346,440 |
|
|
|
328,048 |
|
|
|
329,159 |
|
|
|
|
28.2 |
% |
|
|
27.7 |
% |
|
|
29.1 |
% |
|
|
|
18,392 |
|
|
|
5.6 |
% |
|
|
|
(1,111 |
) |
|
|
(0.3 |
)% |
|
Depreciation and amortization |
|
|
17,691 |
|
|
|
16,638 |
|
|
|
16,222 |
|
|
|
|
1.4 |
% |
|
|
1.4 |
% |
|
|
1.4 |
% |
|
|
|
1,053 |
|
|
|
6.3 |
% |
|
|
|
416 |
|
|
|
2.6 |
% |
|
Amortization of intangible assets |
|
|
10,888 |
|
|
|
12,481 |
|
|
|
17,184 |
|
|
|
|
0.9 |
% |
|
|
1.0 |
% |
|
|
1.5 |
% |
|
|
|
(1,593 |
) |
|
|
(12.8 |
)% |
|
|
|
(4,703 |
) |
|
|
(27.4 |
)% |
|
Total Operating Costs and Expenses |
|
|
375,019 |
|
|
|
357,167 |
|
|
|
362,565 |
|
|
|
|
30.5 |
% |
|
|
30.1 |
% |
|
|
32.0 |
% |
|
|
|
17,852 |
|
|
|
5.0 |
% |
|
|
|
(5,398 |
) |
|
|
(1.5 |
)% |
|
Operating Income |
|
|
82,418 |
|
|
|
82,793 |
|
|
|
75,231 |
|
|
|
|
6.7 |
% |
|
|
7.0 |
% |
|
|
6.6 |
% |
|
|
|
(375 |
) |
|
|
(0.5 |
)% |
|
|
|
7,562 |
|
|
|
10.1 |
% |
|
Interest expense |
|
|
(8,553 |
) |
|
|
(9,470 |
) |
|
|
(10,072 |
) |
|
|
|
(0.7 |
)% |
|
|
(0.8 |
)% |
|
|
(0.9 |
)% |
|
|
|
917 |
|
|
|
(9.7 |
)% |
|
|
|
602 |
|
|
|
(6.0 |
)% |
|
Other income (expense) |
|
|
121 |
|
|
|
1,184 |
|
|
|
(1,559 |
) |
|
|
|
— |
|
|
|
0.1 |
% |
|
|
(0.1 |
)% |
|
|
|
(1,063 |
) |
|
|
(89.8 |
)% |
|
|
|
2,743 |
|
|
|
(175.9 |
)% |
|
Income Before Income Taxes |
|
|
73,986 |
|
|
|
74,507 |
|
|
|
63,600 |
|
|
|
|
6.0 |
% |
|
|
6.3 |
% |
|
|
5.6 |
% |
|
|
|
(521 |
) |
|
|
(0.7 |
)% |
|
|
|
10,907 |
|
|
|
17.1 |
% |
|
Provision for Income Taxes |
|
|
11,110 |
|
|
|
27,923 |
|
|
|
24,231 |
|
|
|
|
0.9 |
% |
|
|
2.4 |
% |
|
|
2.1 |
% |
|
|
|
(16,813 |
) |
|
|
(60.2 |
)% |
|
|
|
3,692 |
|
|
|
15.2 |
% |
|
Net Income |
|
$ |
62,876 |
|
|
$ |
46,584 |
|
|
$ |
39,369 |
|
|
|
|
5.1 |
% |
|
|
3.9 |
% |
|
|
3.5 |
% |
|
|
$ |
16,292 |
|
|
|
35.0 |
% |
|
|
$ |
7,215 |
|
|
|
18.3 |
% |
Year ended December 31, 2017 compared to year ended December 31, 2016
Revenue. Revenue for the year ended December 31, 2017, was $1,229.2 million, compared to $1,185.1 million for the year ended December 31, 2016, representing an increase of $44.1 million or 3.7%. The increase in revenue was attributable to increases in commercial revenue of $46.7 million, partially offset by a decrease in government revenue of $2.6 million compared to the prior year. The growth in commercial revenue was driven by our energy, environment, and infrastructure clients and by health, education, and social programs clients. The decline in government revenues is due to a decrease in health, education, and social programs clients; partially offset by increases in our energy, environment, and infrastructure and safety and security projects for government clients. As a result of these changes the governmental and commercial revenues as a percent of total revenue were 62% and 38% for the year ended December 31, 2017 compared with 65% and 35% for the prior year.
Direct costs. Direct costs for the year ended December 31, 2017, were $771.7 million compared to $745.1 million for the year ended December 31, 2016, an increase of $26.6 million or 3.6%. The increase in direct costs year-over-year was attributable to an increase in both subcontractor and other direct costs of $24.6 million and an increase in direct labor and related fringe costs of $2.0 million. Direct costs as a percent of revenue decreased -0.1% to 62.8% for the year ended December 31, 2017, compared to 62.9% for the prior year. This decrease was due to the decrease in direct labor and related fringe costs (a 1.1% decrease as a percent of revenue), offset by an increase in subcontractor and other direct costs (a 1.0% increase as a percent of revenue). The decrease in direct labor and fringe costs is the result of a change in our labor allocation. Effective January 1, 2017, in order to be consistent with updated cost accounting requirements under U.S. government cost accounting standards, we changed our labor cost allocation methodology for all contracts which resulted in the classification of certain labor and associated fringe costs as indirect and selling expenses rather than direct costs. In comparing the results of operations for the year ended December 31, 2017 to the prior year, this change in labor allocation methodology resulted in the classification of an estimated $9.5 million of indirect and selling expenses as direct costs in the prior year.
Changes in the mix of services and other direct costs provided under our contracts can result in variability in our direct costs as a percentage of revenue. For example, when we perform work in the area of systems implementation, we expect that more of our services will be performed in client-provided facilities. Such work generally has a higher staff utilization than much of our current advisory work since the staff are dedicated to a single longer-term project, and we anticipate decreased indirect expenses since our staff are working at the client facilities. In addition, to the extent we are successful in winning larger contracts in general, while staff utilization
40
generally increases, our own labor services component will generally decrease because larger contracts typically are broader in scope and require more diverse capabilities, potentially resulting in more subcontracted effort, more other direct costs, and lower margins. Although the duration of our contracts and type of work may impact the ratio of direct costs as a percentage of revenue or gross margins, the economics of these larger jobs are, nonetheless, generally favorable because they tend to increase income, broaden our revenue base, and have a favorable return on invested capital.
Indirect and selling expenses. Indirect and selling expenses for the year ended December 31, 2017, were $346.4 million compared to $328.0 million for the prior year, an increase of $18.4 million or 5.6%. Indirect and selling expenses increased due to an increase in indirect labor and fringe of $12.0 million, which was due, in part, to the change in labor cost allocation described above, as well as an increase in incentive compensation of $4.4 million, of which $3.0 million was an increase in cash bonuses to take advantage of tax rate differentials, and an increase in other indirect costs of $2.0 million. In response to the Tax Act that was passed in December 2017, we increased the portion of bonuses that will be paid in cash, which resulted in an acceleration of incentive compensation expense for the year as opposed to recording the expense as equity awards vest. The increase in cash bonus expense as a proportion of incentive compensation will increase the amount that can be deducted for income tax purposes for 2017 due to the higher corporate tax rate. The increase in other indirect costs was primarily due to $1.7 million of facility consolidations related to reductions in office space utilized at our corporate and U.K offices. Indirect and selling expenses as a percent of revenue increased to 28.2% for the year ended December 31, 2017, compared to 27.7% for the year ended December 31, 2016.
Indirect and selling expenses generally include our management, facilities, and infrastructure costs for all employees and the salaries and wages related to indirect activities, including stock-based and cash based incentive compensation provided to employees whose compensation and other benefit costs are included in indirect and selling expenses, plus associated fringe benefits not directly related to client engagements.
Depreciation and amortization. Depreciation and amortization was $17.7 million for the year ended December 31, 2017, compared to $16.6 million for the prior year, an increase of $1.1 million or 6.3%. Depreciation and amortization increased due to higher levels of depreciation and amortization from the continued investment in capital expenditures of property and equipment and costs of internal use software.
Amortization of intangible assets. Amortization of intangible assets for the year ended December 31, 2017 was $10.9 million compared to $12.5 million for the prior year. The $1.6 million decrease was primarily due to reduced levels of intangible asset amortization associated with prior acquisitions.
Operating income. For the year ended December 31, 2017, operating income was $82.4 million compared to $82.8 million for the prior year, a decrease of $0.4 million or 0.5%. Operating income as a percent of revenue was 6.7% for the year ended December 31, 2017 compared to 7.0% for the prior year largely due to the increase in indirect expenses offset by lower amortization of intangible assets.
Interest expense. For the year ended December 31, 2017, interest expense was $8.6 million, compared to $9.5 million for the prior year, a decrease of $0.9 million or 9.7%. The decrease was primarily due to lower average debt balances outstanding for the year compared to the prior year, partially offset by a slight increase in our weighted average interest rate compared to the same period in 2016 and additional amortization of unamortized loan costs related to the Credit Facility modification.
Other income (expense). For the year ended December 31, 2017, other income was $0.1 million compared to other income of $1.2 million for the prior year. Other income for the year ended December 31, 2017, which primarily represents foreign currency gains primarily offset by the loss on disposal of fixed assets, compared to other income for the prior year. The net gain on a corporate owned insurance policy impacted other income during the prior year.
Provision for income taxes. The effective income tax rate for the years ended December 31, 2017 and December 31, 2016, was 15.0% and 37.5%, respectively. The decrease in the rate for 2017 was primarily related to favorable net adjustments of $16.2 million related to the enactment of the Tax Act in December 2017. As a result, we were required to make favorable provisional adjustments for revaluing our deferred tax assets and liabilities and permanent non-taxable income that were partially offset by the “transition tax” and establishment of a valuation allowance on certain deferred tax assets. Our effective tax rate, including state and foreign taxes net of federal benefit, for the year ended December 31, 2017 was lower than the statutory tax rate for the year primarily due to the net favorable adjustments for the impact of the Tax Act, tax benefits for stock-based compensation, permanently
41
non-taxable income, and state tax credits partially offset by the establishment of a valuation allowance on certain deferred tax assets, permanent differences related to compensation costs and other expenses not deductible for tax purposes. We account for the expected impact of discrete tax items once we determine that they are both reasonably quantified and we are confident they will be realized due to the associated event occurring (such as the filing of an amended tax return, enactment of tax legislation, or the closure of an audit examination).
Year ended December 31, 2016 compared to year ended December 31, 2015
Revenue. Revenue for the year ended December 31, 2016, was $1,185.1 million, compared to $1,132.2 million for the prior year, representing an increase of $52.9 million or 4.7%. The increase in revenue was attributable to increases in governmental revenue of $33.9 million and commercial revenue of $19.0 million for the year ended December 31, 2016 compared to the prior year. The growth in governmental revenue included a $22.4 million increase in federal government revenue and a $20.8 million increase in state and local government revenue for the year ended December 31, 2016 compared to the prior year. The increase in federal government revenue was primarily from health, education, and social programs. The increase in state and local government revenue was primarily from programs in the energy, environment, and infrastructure markets. Increases in federal government revenue and state and local government revenue were partially offset by a $9.3 million decrease in international government revenue, primarily due to declines in health, education, and social programs. The increase in commercial revenue was primarily in commercial energy markets. The governmental and commercial revenues remained relatively consistent as a percent of revenue at 65% and 35% for both years ended December 31, 2016 and 2015, respectively.
Direct costs. Direct costs for the year ended December 31, 2016, were $745.1 million compared to $694.4 million for the prior year, an increase of $50.7 million or 7.3%. The increase in direct costs was attributable to increases in both subcontractor and other direct costs and direct labor and related fringe costs. Direct costs as a percent of revenue increased to 62.9% for the year ended December 31, 2016, compared to 61.4% for the prior year due to a larger increase in subcontractor and other direct costs over the increase in direct labor and related fringe costs. We generally expect the ratio of direct costs as a percentage of revenue to increase when our own labor costs decreases relative to subcontracted labor costs.
Indirect and selling expenses. Indirect and selling expenses for the year ended December 31, 2016, were $328.0 million compared to $329.2 million for the prior year, a decrease of $1.1 million or 0.3%. Indirect and selling expenses include our management, facilities, and infrastructure costs for all employees and the salaries and wages related to indirect activities, including stock-based compensation provided to employees whose compensation and other benefit costs are included in indirect and selling expenses, plus associated fringe benefits for employee effort not directly related to client engagements. Indirect and selling expenses as a percent of revenue decreased to 27.7% for the year ended December 31, 2016, compared to 29.1% for the prior year.
Depreciation and amortization. Depreciation and amortization was $16.6 million for the year ended December 31, 2016, compared to $16.2 million for the prior year, an increase of $0.4 million or 2.6%. Depreciation and amortization includes depreciation of property and equipment and the amortization of the costs of internal use software.
Amortization of intangible assets. Amortization of intangible assets for the year ended December 31, 2016 was $12.5 million compared to $17.2 million for the prior year. The $4.7 million decrease was primarily due to reduced levels of intangible asset amortization associated with prior acquisitions.
Operating income. For the year ended December 31, 2016, operating income was $82.8 million compared to $75.2 million for the prior year, an increase of $7.6 million or 10.1%. Operating income as a percent of revenue was 7.0% for the year ended December 31, 2016 compared to 6.6% for the prior year largely due to lower amortization of intangible assets.
Interest expense. For the year ended December 31, 2016, interest expense was $9.5 million, compared to $10.1 million for the prior year due to lower average debt balances outstanding.
Other income (expense). For the year ended December 31, 2016, other income was $1.2 million compared to other expense of $1.6 million for the prior year. Other income for the year ended December 31, 2016 primarily represents the net gain on a corporate owned insurance policy. Other expense for the prior year primarily represents the reclassification of foreign currency translation losses from accumulated other comprehensive loss into earnings as a result of closing certain international offices as part of actions taken to improve our cost structure and operations.
42
Provision for income taxes. The effective income tax rate for the year ended December 31, 2016 and December 31, 2015, was 37.5% and 38.1%, respectively. The decrease in the rate was related to favorable adjustments for the adoption of new accounting guidance related to tax benefits for stock-based compensation, permanently non-taxable income, and the release of a valuation allowance on certain foreign deferred tax assets. Our effective tax rate, including state and foreign taxes net of federal benefit, for the year ended December 31, 2016 was lower than the statutory tax rate for the year primarily due to favorable adjustments for the adoption of new accounting guidance related to tax benefits for stock-based compensation, permanently non-taxable income, the true-up of our 2015 tax provision, state tax credits and the release of a valuation allowance on certain foreign deferred tax assets, partially offset by unrecognized tax benefits, permanent differences related to compensation costs and other expenses not deductible for tax purposes. We account for the expected impact of discrete tax items once we determine that they are both reasonably quantified and when we are confident they will be realized due to the associated event occurring, such as the filing of an amended tax return, enactment of tax legislation, or the closure of an audit examination.
NON-GAAP MEASURES
These following non-GAAP tables provide reconciliations of non-GAAP financial measures to the most applicable GAAP numbers. While we believe that these non-GAAP financial measures may be useful in evaluating our financial information, they should be considered supplemental in nature and not as a substitute for financial information prepared in accordance with GAAP. Other companies may define similarly titled non-GAAP measures differently and, accordingly, care should be exercised in understanding how we define these measures.
Service Revenue. Service revenue represents revenue less subcontractor and other direct costs (which include third-party materials and travel expenses). Service revenue is not a recognized term under U.S. GAAP and should not be considered an alternative to revenue as a measure of operating performance. This presentation of service revenue may not be comparable to other similarly titled measures used by other companies because other companies may use different methods to prepare similarly titled measures. We believe service revenue is a useful measure to investors since, as a consulting firm, a key source of our profit is revenue obtained from the services that we provide to our clients through our employees.
The table below presents a reconciliation of revenue to service revenue for the periods indicated:
|
|
|
Year ended December 31, |
|
|||||||||
|
|
|
2017 |
|
|
2016 |
|
|
2015 |
|
|||
|
Revenue |
|
$ |
1,229,162 |
|
|
$ |
1,185,097 |
|
|
$ |
1,132,232 |
|
|
Subcontractor and other direct costs |
|
|
(344,913 |
) |
|
|
(320,332 |
) |
|
|
(283,110 |
) |
|
Service revenue |
|
$ |
884,249 |
|
|
$ |
864,765 |
|
|
$ |
849,122 |
|
EBITDA and Adjusted EBITDA. EBITDA, or earnings before interest and other income and/or expense, tax, and depreciation and amortization, is a measure that we use to evaluate our performance. We believe EBITDA is useful to investors because similar measures are frequently used by securities analysts, investors, and other interested parties in evaluating companies in our industry. Adjusted EBITDA is EBITDA further adjusted to eliminate the impact of certain items that we do not consider to be indicative of the performance of our ongoing operations. We evaluate these adjustments on an individual basis based on both the quantitative and qualitative aspects of each respective item, which include its size and whether or not we expect it to occur as part of our normal business on a regular basis. We believe that the adjustments applied in calculating adjusted EBITDA are reasonable and appropriate to provide additional information to investors.
EBITDA and adjusted EBITDA are not recognized terms under U.S. GAAP and do not purport to be an alternative to net income as a measure of operating performance, or to cash flows from operating activities as a measure of liquidity. Because not all companies use identical calculations, this presentation of EBITDA and adjusted EBITDA may not be comparable to other similarly-titled measures used by other companies. EBITDA and adjusted EBITDA are not intended to be a measure of free cash flow for management’s discretionary use, as they do not consider certain cash requirements, such as interest payments, tax payments, capital expenditures, and debt service.
43
A reconciliation of net income to EBITDA and adjusted EBITDA follows:
|
|
|
Year ended December 31, |
|
|||||||||
|
|
|
2017 |
|
|
2016 |
|
|
2015 |
|
|||
|
Net income |
|
$ |
62,876 |
|
|
$ |
46,584 |
|
|
$ |
39,369 |
|
|
Other income (expense) |
|
|
(121 |
) |
|
|
(1,184 |
) |
|
|
1,559 |
|
|
Interest expense |
|
|
8,553 |
|
|
|
9,470 |
|
|
|
10,072 |
|
|
Provision for income taxes |
|
|
11,110 |
|
|
|
27,923 |
|
|
|
24,231 |
|
|
Depreciation and amortization |
|
|
28,579 |
|
|
|
29,119 |
|
|
|
33,406 |
|
|
EBITDA |
|
|
110,997 |
|
|
|
111,912 |
|
|
|
108,637 |
|
|
Acquisition-related expenses (1) |
|
|
239 |
|
|
|
20 |
|
|
|
189 |
|
|
Special charges related to severance for staff realignment (2) |
|
|
1,583 |
|
|
|
1,701 |
|
|
|
1,118 |
|
|
Special charges related to office closures (3) |
|
|
2,060 |
|
|
|
258 |
|
|
|
796 |
|
|
Special charges due to additional cash bonus expense (4) |
|
|
3,000 |
|
|
|
— |
|
|
|
— |
|
|
Adjusted EBITDA |
|
$ |
117,879 |
|
|
$ |
113,891 |
|
|
$ |
110,740 |
|
|
(1) |
Acquisition-related expenses related to closed and anticipated-to-close acquisitions, consisting primarily of consultant and other outside third-party costs. |
|
(2) |
Special charges related to severance for staff realignment: These costs are either involuntary employee termination benefits for Company officers who have been terminated as part of a consolidation or reduction in operations, or collective termination benefits of an identifiable group of employees terminated as part of a discontinued service offering. |
|
(3) |
Special charges related to office closures: These costs are exit costs associated with terminated leases or full office closures. These exit costs include charges incurred under a contractual obligation that existed as of the date of the accrual and for which we will either continue to pay until the contractual obligation is satisfied but with no economic benefit to us. |
|
(4) |
Special charges due to additional cash bonus expense: In response to the Tax Act that was passed in December 2017 and will take effect in 2018, we increased the portion of bonuses that will be paid in cash, which will increase the amount that can be deducted for income tax purposes for 2017. |
Non-GAAP EPS. Non-GAAP EPS represents diluted EPS excluding the impact of certain items (such as special charges and acquisition-related expenses) that we do not consider to be indicative of the performance of our ongoing operations and are excluded from adjusted EBITDA as described above. Diluted EPS has also been adjusted to eliminate the impact of amortization of intangible assets related to our acquisitions since the impact is larger following an acquisition and, depending on when the acquisition occurred, impacts comparability. Non-GAAP EPS is not a recognized term under U.S. GAAP and does not purport to be an alternative to basic or diluted EPS. Because not all companies use identical calculations, the presentation of non-GAAP EPS may not be comparable to other similarly titled measures used by other companies. We believe that the supplemental adjustments applied in calculating non-GAAP EPS are reasonable and appropriate to provide additional information to investors.
A reconciliation of diluted EPS to non-GAAP EPS (including income tax effects calculated using an effective U.S. GAAP tax rate of 37.0% (the effective tax rate for the period prior to any adjustments for the new tax regulation), 37.5%, and 38.1%, respectively, follows:
|
|
|
Year ended December 31, |
|
|||||||||
|
|
|
2017 |
|
|
2016 |
|
|
2015 |
|
|||
|
Diluted EPS |
|
$ |
3.27 |
|
|
$ |
2.40 |
|
|
$ |
2.00 |
|
|
Acquisition-related expenses |
|
|
0.01 |
|
|
|
— |
|
|
|
0.01 |
|
|
Special charges related to severance for staff realignment |
|
|
0.08 |
|
|
|
0.09 |
|
|
|
0.06 |
|
|
Special charges related to office closures |
|
|
0.12 |
|
|
|
0.02 |
|
|
|
0.09 |
|
|
Special charges due to additional cash bonus expense |
|
|
0.16 |
|
|
|
— |
|
|
|
— |
|
|
Amortization of intangibles |
|
|
0.57 |
|
|
|
0.64 |
|
|
|
0.87 |
|
|
Income tax effects on amortization, special charges, and adjustments |
|
|
(0.35 |
) |
|
|
(0.28 |
) |
|
|
(0.39 |
) |
|
Adjustments for changes in the tax rate under new Tax Act |
|
|
(0.84 |
) |
|
|
— |
|
|
|
— |
|
|
Non-GAAP EPS |
|
$ |
3.02 |
|
|
$ |
2.87 |
|
|
$ |
2.64 |
|
44
LIQUIDITY AND CAPITAL RESOURCES
Liquidity and Borrowing Capacity. Our business generally requires minimal infrastructure investment because we are primarily a service provider for which facilities requirements are provided for under operating leases or on client premises. Short-term liquidity requirements are created by our use of funds for working capital, capital expenditures, and the need to provide any debt service. We expect to meet these requirements through a combination of cash flows from operations and borrowings under our Fifth Amended and Restated Business Loan and Security Agreement with a syndicate of twelve commercial banks (the “Credit Facility”).
We anticipate that our long-term liquidity requirements, including any future acquisitions, will be funded through a combination of cash flows from operations, borrowings under our Credit Facility, additional secured or unsecured debt, or the issuance or repurchase of common stock, each of which may be initially funded through borrowings under our Credit Facility.
We believe that the combination of internally generated funds, available bank borrowings under our Credit Facility, and cash and cash equivalents on hand will provide the required liquidity and capital resources necessary to fund on-going operations, customary capital expenditures, and other current working capital requirements. We are continuously analyzing our capital structure to ensure we have sufficient capital to fund future acquisitions and internal growth. We monitor the state of the financial markets on a regular basis to assess the availability and cost of additional capital resources both from debt and equity sources. We believe that we will be able to access these markets at commercially reasonable terms and conditions if we need additional borrowings or capital.
Financial Condition. There were several changes in our balance sheet during the year ended December 31, 2017. Cash and cash equivalents increased to $11.8 million on December 31, 2017, from $6.0 million on December 31, 2016. Restricted cash (current and non-current) increased to $12.5 million on December 31, 2017 compared to $1.8 million on December 31, 2016. The increase in restricted cash is due to funds held in escrow related to our pending acquisition that was completed in January, 2018 and is discussed in “Acquisitions and Business Combinations” section above.
Contract receivables are the principal component of our working capital and generally increase due to revenue growth and may be favorably or unfavorably impacted by our collections efforts and other short-term fluctuations related to the payment practices of our clients. Total accounts receivable consists of billed and unbilled receivables combined, net of allowance for doubtful accounts. We evaluate our collections efforts using the days sales outstanding ratio, or DSO, which we calculate by dividing total accounts receivable, net of deferred revenues, by revenue per day. DSO for the year ended December 31, 2017 improved to 71 days compared to 78 days during the prior year.
Accounts payable, accrued salaries and benefits, and accrued expenses and other current liabilities increased to $75.1 million, $45.6 million and $65.1 million, respectively, on December 31, 2017 from $70.6 million, $39.8 million and $52.6 million on December 31, 2016, respectively. The increases in the liabilities are due primarily to timing of payments in the fourth quarter of 2017 and increased accrued incentive compensation relative to the prior year. Long-term debt decreased to $206.3 million on December 31, 2017, from $259.4 million on December 31, 2016, due to net payments on our Credit Facility of $53.1 million.
Treasury stock increased to $121.5 million on December 31, 2017 from $88.7 million on December 31, 2016 primarily due to share buybacks under our share repurchase plan of $30.7 million. The $4.6 million increase in accumulated other comprehensive loss was driven by the devaluation of certain foreign currencies relative to the U.S. dollar (primarily the Euro, British Pound and Canadian dollar), partially offset by the change in the fair value of an interest rate hedging agreement as described below.
On August 31, 2017, we entered into a floating-to-fixed interest rate hedging agreement for an aggregate notional amount of $25.0 million to hedge a portion of our Credit Facility. We entered into the hedge to help manage the risk related to interest rate volatility and designated the swap as a cash flow hedge. The cash flows from the hedge begin on August 31, 2018 and the swap matures August 31, 2023.
45
We have explored various options of mitigating the risk associated with potential fluctuations in the foreign currencies in which we conduct transactions. We currently have hedges in an amount proportionate to work anticipated to be performed under certain contracts in Europe. We recognize changes in the fair-value of the hedges in our results of operations. We may increase the number, size and scope of our hedges as we analyze options for mitigating our foreign exchange and interest rate risk. The current impact of the foreign currency hedges to the consolidated financial statements is immaterial.
Cash Flows. We consider cash on deposit and all highly liquid investments with original maturities of three months or less when purchased to be cash and cash equivalents. The following table sets forth our sources and uses of cash for the following years.
|
|
|
Year ended December 31, |
|
|||||||||
|
(in thousands) |
|
2017 |
|
|
2016 |
|
|
2015 |
|
|||
|
Net cash provided by operating activities |
|
$ |
117,191 |
|
|
$ |
80,057 |
|
|
$ |
76,203 |
|
|
Net cash used in investing activities |
|
|
(14,604 |
) |
|
|
(13,891 |
) |
|
|
(14,500 |
) |
|
Net cash used in financing activities |
|
|
(87,300 |
) |
|
|
(66,974 |
) |
|
|
(64,448 |
) |
|
Effect of exchange rate changes on cash |
|
|
1,094 |
|
|
|
(416 |
) |
|
|
(1,746 |
) |
|
Increase (decrease) in cash, cash equivalents and restricted cash |
|
$ |
16,381 |
|
|
$ |
(1,224 |
) |
|
$ |
(4,491 |
) |
Our operating cash flows is primarily affected by the overall profitability of our contracts, our ability to invoice and collect from our clients in a timely manner, and the timing of vendor and subcontractor payments in accordance with negotiated payment terms. We bill most of our clients on a monthly basis after services are rendered.
Cash flows from operating activities for 2017 were positively impacted by net income, contract receivables and deferred revenue, accrued expenses, and accounts payable. As discussed above, cash flow from operations in 2017 was significantly improved due to the reduction of our DSO metric on a year over year basis. Cash flows from operating activities for 2016 were positively impacted by net income, accrued expenses, and accounts payable, partially offset by contract receivables and prepaid expenses and other assets. Cash flows from operating activities for 2015 were positively impacted by net income, income tax receivable and payable, and deferred revenue, partially offset by accrued salaries and benefits, accrued expenses, contract receivables, and accounts payable.
Our cash flows used in investing activities consists primarily of capital expenditures and acquisitions. During the year ended 2017, we purchased capital assets totaling $14.5 million. During the year ended 2016, we purchased capital assets totaling $13.8 million. During the year ended 2015, we purchased capital assets totaling $12.7 million and paid approximately $1.8 million related to a holdback adjustment for our 2014 acquisition of Olson.
Our cash flows used in and provided by financing activities consists primarily of debt and equity transactions. For the year ended 2017, cash flows used in financing activities were primarily due to net payments on our Credit Facility of $53.1 million, and share repurchases under our share repurchase plan of $30.7 million. For the year ended 2016, cash flows used in financing activities were primarily due to net payments on our Credit Facility of $52.1 million, and share repurchases under our share repurchase plan of $11.9 million. For the year ended 2015, cash flows used in financing activities were primarily due to net payments on our Credit Facility of $38.5 million, and share repurchases under our share repurchase plan of $22.3 million.
OFF-BALANCE SHEET ARRANGEMENTS
Contractual Obligations
We use off-balance sheet arrangements to finance the lease of office and storage facilities through operating leases. Operating leases are also used from time to time to finance the use of computers, servers, copiers, telephone systems, and, to a lesser extent, other fixed assets (such as furnishings). Additionally, we also may obtain additional operating leases in connection with business acquisitions. We generally assume the lease rights and obligations of businesses acquired in business combinations and continue financing facilities and equipment under operating leases until the end of the lease term following the acquisition date.
In addition, we also had twelve outstanding letters of credit provided for under our Credit Facility with a total value of $3.7 million, primarily related to deposits to support our facility leases.
46
The following table summarizes our contractual obligations as of December 31, 2017 that require us to make future cash payments. Our summary of contractual obligations includes payments that we have an unconditional obligation to make.
|
|
|
|
|
|
|
Payments due by Period |
|
|||||||||||||
|
|
|
|
|
|
|
Less than |
|
|
1 to 3 |
|
|
3 to 5 |
|
|
More than |
|
||||
|
(in thousands) |
|
Total |
|
|
1 year |
|
|
years |
|
|
years |
|
|
5 years |
|
|||||
|
Long-term debt obligation (1) |
|
$ |
233,157 |
|
|
$ |
6,153 |
|
|
$ |
12,305 |
|
|
$ |
214,699 |
|
|
$ |
— |
|
|
Rent of facilities |
|
|
190,953 |
|
|
|
34,944 |
|
|
|
64,605 |
|
|
|
60,407 |
|
|
|
30,997 |
|
|
Operating lease obligations |
|
|
2,817 |
|
|
|
1,295 |
|
|
|
1,077 |
|
|
|
445 |
|
|
|
— |
|
|
Capital expenditure obligations |
|
|
7,401 |
|
|
|
3,177 |
|
|
|
1,690 |
|
|
|
1,689 |
|
|
|
845 |
|
|
Total |
|
$ |
434,328 |
|
|
$ |
45,569 |
|
|
$ |
79,677 |
|
|
$ |
277,240 |
|
|
$ |
31,842 |
|
|
(1) |
Represents the obligation for principal and variable interest payments related to the Credit Facility assuming the principal amount outstanding and interest rates at December 31, 2017 remain fixed through maturity. These assumptions are subject to change in future periods. |
We are exposed to certain financial market risks, the most predominant being fluctuations in interest rates for borrowings under the Credit Facility and foreign exchange rate risk.
We monitor interest rate fluctuations and outlook as an integral part of our overall risk management program, which recognizes the unpredictability of financial markets and seeks to reduce potentially adverse effects of higher interest rates on our results of operations. As part of this strategy, we may use interest rate swap arrangements to hedge all or a portion of our interest rate risk by securing hedges that effectively convert our variable rate debt to fixed rate debt. We do not use such instruments for speculative or trading purposes. Our exposure to market risk includes changes in interest rates for borrowings under the Credit Facility. These borrowings accrue interest at variable rates. Based on our borrowings under this facility and amount of hedging in 2017, a 1% increase in interest rates would have increased interest expense by approximately $2.6 million, pre-tax, and would have decreased our annual net income and operating cash flows by a comparable amount.
As a result of conducting business in currencies other than the U.S. dollar, we are subject to market risk with respect to adverse fluctuations in currency exchange rates. In general, our currency risk is mitigated largely by matching costs with revenues in a given currency. However, our exposure to fluctuations in other currencies against the U.S. dollar increases as a greater portion of our revenue is generated in currencies other than the U.S. dollar. We currently have hedges in place to mitigate our foreign exchange risk related to our operations in Europe; however, given the amount of business conducted in Europe, there is some risk that revenue and profits will be affected by foreign currency exchange fluctuations. We use a sensitivity analysis to assess the impact of movement in foreign currency exchange rates on revenue. During the year ended December 31, 2017, 9.1% of our revenue was generated from our international operations based on the location to which a contract was awarded. As a result, a 10% increase or decrease in the value of the U.S. dollar against all currencies would have an estimated impact on revenue of approximately 0.9%, or $11.2 million. Actual gains and losses in the future could differ materially from this analysis based on the timing and amount of both foreign currency exchange rate movements and our actual exposure. As of December 31, 2017, we held approximately $10.4 million in cash in foreign bank accounts to be utilized on behalf of our foreign subsidiaries, thereby partially mitigating foreign currency conversion risks.
The consolidated financial statements of ICF International, Inc. and subsidiaries are provided in Part IV in this Annual Report on Form 10-K.
Not applicable.
47
Evaluation of Disclosure Controls and Procedures. Based on an evaluation under the supervision and with the participation of the Company’s management, the Company’s principal executive officer and principal financial officer have concluded that the Company’s disclosure controls and procedures as defined in Rules 13a-15(e) and 15d-15(e) under the Exchange Act were effective as of December 31, 2017 to provide reasonable assurance that information required to be disclosed by the Company in reports that it files or submits under the Exchange Act is (i) recorded, processed, summarized and reported within the time periods specified in the SEC rules and forms and (ii) accumulated and communicated to the Company’s management, including its principal executive officer and principal financial officer, as appropriate to allow timely decisions regarding required disclosure.
Management’s Annual Report on Internal Control Over Financial Reporting. The Company’s management is responsible for establishing and maintaining adequate internal control over financial reporting, as such term is defined in Exchange Act Rules 13a-15(f) and 15d-15(f). Management conducted an assessment of the effectiveness of the Company’s internal control over financial reporting based on the criteria set forth in the 2013 Internal Control—Integrated Framework issued by the Committee of Sponsoring Organizations of the Treadway Commission (COSO). Based on the assessment, management has concluded that its internal control over financial reporting was effective as of December 31, 2017. The Company’s independent registered public accounting firm, Grant Thornton LLP, has issued an audit report on the Company’s internal control over financial reporting, which appears on page F-2 of this Form 10-K.
The Company’s internal control over financial reporting is designed to provide reasonable assurance regarding the reliability of financial reporting, and the preparation of financial statements for external purposes in accordance with GAAP. The Company’s internal control over financial reporting includes those policies and procedures that (i) pertain to the maintenance of records that, in reasonable detail, accurately and fairly reflect the transactions and dispositions of the Company’s assets; (ii) provide reasonable assurance that transactions are recorded as necessary to permit preparation of financial statements in accordance with GAAP, (iii) that the Company’s receipts and expenditures are being made only in accordance with authorizations of the Company’s management and directors; and (iv) provide reasonable assurance regarding prevention or timely detection of unauthorized acquisition, use, or disposition of the Company’s assets that could have a material effect on the financial statements.
Changes in Internal Control Over Financial Reporting. There were no changes in our internal control over financial reporting during 2017, which were identified in connection with management’s evaluation required by paragraph (d) of Rules 13a-15 and 15d-15 under the Exchange Act, that have materially affected, or are reasonably likely to materially affect, the Company’s internal control over financial reporting.
Inherent Limitations Over Internal Controls. A control system, no matter how well designed and operated, can provide only reasonable, not absolute, assurance that the objectives of the control system are met. Further, the design of a control system must reflect the fact that there are resource constraints, and the benefits of controls must be considered relative to their costs. Because of the inherent limitations in all control systems, no evaluation of internal controls can provide absolute assurance that all control issues and instances of fraud, if any, have been detected. Because of the inherent limitations in any control system, misstatements due to error or fraud may occur and may not be detected. Also, any evaluations of the effectiveness of controls in future periods are subject to the risk that those internal controls may become inadequate because of changes in business conditions, or that the degree of compliance with the policies or procedures may deteriorate.
Not applicable.
48
The information required by this item will be included in our Proxy Statement for the 2018 Annual Meeting of Stockholders (the “2018 Proxy Statement”) and is incorporated herein by reference.
The information required by this item will be included in the 2018 Proxy Statement and is incorporated herein by reference.
|
ITEM 12. |
SECURITY OWNERSHIP OF CERTAIN BENEFICIAL OWNERS AND MANAGEMENT AND RELATED STOCKHOLDER MATTERS |
The information required by this item will be included in the 2018 Proxy Statement and is incorporated herein by reference.
The information required by this item will be included in the 2018 Proxy Statement and is incorporated herein by reference.
The information required by this item will be included in the 2018 Proxy Statement and is incorporated herein by reference.
49
(1) Financial Statements
|
|
|
Page |
|
|
|
|
F-1 |
|
|
Consolidated Balance Sheets as of December 31, 2017 and 2016 |
|
|
F-3 |
|
|
|
F-4 |
|
|
|
|
F-5 |
|
|
Consolidated Statements of Cash Flows for the Years Ended December 31, 2017, 2016, and 2015 |
|
|
F-6 |
|
|
|
F-7 |
|
|
|
|
F-29 |
|
(2) Financial Statement Schedules
None.
(3) Exhibits
The following exhibits are included with this report or incorporated herein by reference:
|
Exhibit Number |
|
Exhibit |
||
|
|
|
|
||
|
3.1 |
|
|||
|
|
|
|
||
|
3.2 |
|
|||
|
|
|
|
||
|
4.1 |
|
|||
|
|
|
|
||
|
4.2 |
|
See Exhibits 3.1 and 3.2, above, for provisions of the Amended and Restated Certificate of Incorporation and Amended and Restated Bylaws of the Company defining the rights of holders of common stock of the Company. |
||
|
|
|
|
||
|
10.1 |
|
|||
|
|
|
|
||
|
10.2 |
|
|||
|
|
|
|
||
|
10.3 |
|
|||
|
|
|
|
||
|
10.4 |
|
|||
|
|
|
|
||
|
10.5 |
|
|||
|
|
|
|
||
|
10.6 |
|
|||
50
|
Exhibit Number |
|
Exhibit |
||
|
|
|
|
||
|
10.7 |
|
|||
|
|
|
|
||
|
10.8 |
|
|||
|
|
|
|
||
|
10.9 |
|
|||
|
|
|
|
||
|
10.10 |
|
|||
|
|
|
|
||
|
10.11 |
|
|||
|
|
|
|
||
|
10.12 |
|
|||
|
|
|
|
||
|
10.13 |
|
|||
|
|
|
|
||
|
10.14 |
|
|||
|
|
|
|
||
|
10.15 |
|
|||
|
|
|
|
||
|
10.16 |
|
|||
|
|
|
|
||
|
10.17 |
|
|||
|
|
|
|
||
|
10.18 |
|
|||
|
|
|
|
||
|
10.19 |
|
|||
|
|
|
|
||
|
21.0 |
|
|||
|
|
|
|
||
|
23.1 |
|
|||
|
|
|
|
||
|
31.1 |
|
|||
|
|
|
|
||
|
31.2 |
|
|||
|
|
|
|
||
|
32.1 |
|
|||
|
|
|
|
||
|
32.2 |
|
|||
51
|
Exhibit Number |
|
Exhibit |
||
|
|
|
|
||
|
101 |
|
The following materials from the ICF International, Inc. Annual Report on Form 10-K for the year ended December 31, 2016 formatted in eXtensible Business Reporting Language (XBRL): (i) Consolidated Balance Sheets, (ii) Consolidated Statements of Comprehensive Income, (iii) Consolidated Statements of Stockholders’ Equity, (iv) Consolidated Statements of Cash Flows and (v) Notes to Consolidated Financial Statements. * |
||
|
(1) |
Certain confidential information contained in this exhibit was omitted by means of redacting a portion of the text and replacing it with an asterisk. This exhibit has been filed separately with the Secretary of the Securities and Exchange Commission without the redaction pursuant to a confidential treatment request under Rule 24b-2 of the Exchange Act. |
|
* |
Submitted electronically herewith. |
52
Pursuant to the requirements of Section 13 or 15(d) of the Securities Exchange Act of 1934, the registrant has duly caused this report to be signed on its behalf by the undersigned, thereunto duly authorized.
|
February 28, 2018 |
|
|
|
ICF INTERNATIONAL, INC. |
||
|
|
|
|
|
By: |
|
/s/ SUDHAKAR KESAVAN |
|
|
|
|
|
|
|
Sudhakar Kesavan |
|
|
|
|
|
|
|
Chairman and Chief Executive Officer |
Pursuant to the requirements of the Securities Exchange Act of 1934, this report has been signed below by the following persons on behalf of the registrant and in the capacities and on the dates indicated.
|
Signature |
|
Title |
|
Date |
|
|
|
|
|
|
|
/s/ SUDHAKAR KESAVAN |
|
Chairman, Chief Executive Officer and Director (Principal Executive Officer) |
|
February 28, 2018
|
|
Sudhakar Kesavan |
||||
|
|
|
|
||
|
/s/ JAMES MORGAN |
|
Chief Financial Officer (Principal Financial Officer) |
|
February 28, 2018
|
|
James Morgan |
||||
|
|
|
|
||
|
/s/ RICHARD TAYLOR |
|
Controller (Principal Accounting Officer) |
|
February 28, 2018
|
|
Richard Taylor |
||||
|
|
|
|
||
|
/s/ EILEEN O’SHEA AUEN |
|
Director |
|
February 28, 2018
|
|
Eileen O’Shea Auen |
||||
|
|
|
|
||
|
/s/ Dr. SRIKANT M. DATAR |
|
Director |
|
February 28, 2018
|
|
Dr. Srikant M. Datar |
||||
|
|
|
|
||
|
/s/ CHERYL GRISÉ |
|
Director |
|
February 28, 2018
|
|
Cheryl Grisé |
||||
|
|
|
|
||
|
/s/ SANJAY GUPTA |
|
Director |
|
February 28, 2018
|
|
Sanjay Gupta |
||||
|
|
|
|
||
|
/s/ PETER SCHULTE |
|
Director |
|
February 28, 2018
|
|
Peter Schulte |
||||
|
|
|
|
|
|
|
/s/ MICHAEL VAN HANDEL |
|
Director |
|
February 28, 2018
|
|
Michael Van Handel |
||||
|
|
|
|
||
|
/s/ RANDALL MEHL |
|
Director |
|
February 28, 2018
|
|
Randall Mehl |
||||
53
REPORT OF INDEPENDENT REGISTERED PUBLIC ACCOUNTING FIRM
Board of Directors and Stockholders
ICF International, Inc.
Opinion on the financial statements
We have audited the accompanying consolidated balance sheets of ICF International Inc. (a Delaware corporation) and subsidiaries (collectively, the “Company”) as of December 31, 2017 and 2016, the related consolidated statements of comprehensive income, changes in stockholders’ equity, and cash flows for each of the three years in the period ended December 31, 2017, and the related notes (collectively referred to as the “financial statements”). In our opinion, the financial statements present fairly, in all material respects, the financial position of the Company as of December 31, 2017 and 2016, and the results of its operations and its cash flows for each of the three years in the period ended December 31, 2017, in conformity with accounting principles generally accepted in the United States of America.
We also have audited, in accordance with the standards of the Public Company Accounting Oversight Board (United States) (“PCAOB”), the Company’s internal control over financial reporting as of December 31, 2017, based on criteria established in the 2013 Internal Control—Integrated Framework issued by the Committee of Sponsoring Organizations of the Treadway Commission (“COSO”), and our report dated February 28, 2018 expressed an unqualified opinion.
Basis for opinion
These financial statements are the responsibility of the Company’s management. Our responsibility is to express an opinion on the Company’s financial statements based on our audits. We are a public accounting firm registered with the PCAOB and are required to be independent with respect to the Company in accordance with the U.S. federal securities laws and the applicable rules and regulations of the Securities and Exchange Commission and the PCAOB.
We conducted our audits in accordance with the standards of the PCAOB. Those standards require that we plan and perform the audit to obtain reasonable assurance about whether the financial statements are free of material misstatement, whether due to error or fraud. Our audits included performing procedures to assess the risks of material misstatement of the financial statements, whether due to error or fraud, and performing procedures that respond to those risks. Such procedures included examining, on a test basis, evidence supporting the amounts and disclosures in the financial statements. Our audits also included evaluating the accounting principles used and significant estimates made by management, as well as evaluating the overall presentation of the financial statements. We believe that our audits provide a reasonable basis for our opinion.
/s/ GRANT THORNTON LLP
We have served as the Company’s auditor since 2000.
Arlington, Virginia
February 28, 2018
F-1
REPORT OF INDEPENDENT REGISTERED PUBLIC ACCOUNTING FIRM
Board of Directors and Stockholders
ICF International, Inc.
Opinion on internal control over financial reporting
We have audited the internal control over financial reporting of ICF International, Inc. (a Delaware corporation) and subsidiaries (collectively, the “Company”) as of December 31, 2017, based on criteria established in the 2013 Internal Control—Integrated Framework issued by the Committee of Sponsoring Organizations of the Treadway Commission (“COSO”). In our opinion, the Company maintained, in all material respects, effective internal control over financial reporting as of December 31, 2017, based on criteria established in the 2013 Internal Control—Integrated Framework issued by COSO.
We also have audited, in accordance with the standards of the Public Company Accounting Oversight Board (United States) (“PCAOB”), the consolidated financial statements of the Company as of and for the year ended December 31, 2017, and our report dated February 28, 2018 expressed an unqualified opinion on those financial statements.
Basis for opinion
The Company’s management is responsible for maintaining effective internal control over financial reporting and for its assessment of the effectiveness of internal control over financial reporting, included in the accompanying Management’s Annual Report on Internal Control over Financial Reporting. Our responsibility is to express an opinion on the Company’s internal control over financial reporting based on our audit. We are a public accounting firm registered with the PCAOB and are required to be independent with respect to the Company in accordance with the U.S. federal securities laws and the applicable rules and regulations of the Securities and Exchange Commission and the PCAOB.
We conducted our audit in accordance with the standards of the PCAOB. Those standards require that we plan and perform the audit to obtain reasonable assurance about whether effective internal control over financial reporting was maintained in all material respects. Our audit included obtaining an understanding of internal control over financial reporting, assessing the risk that a material weakness exists, testing and evaluating the design and operating effectiveness of internal control based on the assessed risk, and performing such other procedures as we considered necessary in the circumstances. We believe that our audit provides a reasonable basis for our opinion.
Definition and limitations of internal control over financial reporting
A company’s internal control over financial reporting is a process designed to provide reasonable assurance regarding the reliability of financial reporting and the preparation of financial statements for external purposes in accordance with generally accepted accounting principles. A company’s internal control over financial reporting includes those policies and procedures that (1) pertain to the maintenance of records that, in reasonable detail, accurately and fairly reflect the transactions and dispositions of the assets of the company; (2) provide reasonable assurance that transactions are recorded as necessary to permit preparation of financial statements in accordance with generally accepted accounting principles, and that receipts and expenditures of the company are being made only in accordance with authorizations of management and directors of the company; and (3) provide reasonable assurance regarding prevention or timely detection of unauthorized acquisition, use, or disposition of the company’s assets that could have a material effect on the financial statements.
Because of its inherent limitations, internal control over financial reporting may not prevent or detect misstatements. Also, projections of any evaluation of effectiveness to future periods are subject to the risk that controls may become inadequate because of changes in conditions, or that the degree of compliance with the policies or procedures may deteriorate.
/s/ GRANT THORNTON LLP
Arlington, Virginia
February 28, 2018
F-2
ICF International, Inc. and Subsidiaries
(in thousands, except share and per share amounts)
|
|
|
December 31, 2017 |
|
|
December 31, 2016 |
|
||
|
Assets |
|
|
|
|
|
|
|
|
|
Current Assets: |
|
|
|
|
|
|
|
|
|
Cash and cash equivalents |
|
$ |
11,809 |
|
|
$ |
6,042 |
|
|
Contract receivables, net |
|
|
291,515 |
|
|
|
281,365 |
|
|
Prepaid expenses and other |
|
|
11,327 |
|
|
|
11,724 |
|
|
Income tax receivable |
|
|
5,596 |
|
|
|
— |
|
|
Restricted cash - current |
|
|
11,191 |
|
|
|
— |
|
|
Total Current Assets |
|
|
331,438 |
|
|
|
299,131 |
|
|
Total Property and Equipment, net |
|
|
38,052 |
|
|
|
40,484 |
|
|
Other Assets: |
|
|
|
|
|
|
|
|
|
Goodwill |
|
|
686,108 |
|
|
|
683,683 |
|
|
Other intangible assets, net |
|
|
35,304 |
|
|
|
46,129 |
|
|
Restricted cash - non-current |
|
|
1,266 |
|
|
|
1,843 |
|
|
Other assets |
|
|
18,087 |
|
|
|
14,301 |
|
|
Total Assets |
|
$ |
1,110,255 |
|
|
$ |
1,085,571 |
|
|
|
|
|
|
|
|
|
|
|
|
Liabilities and Stockholders’ Equity |
|
|
|
|
|
|
|
|
|
Current Liabilities: |
|
|
|
|
|
|
|
|
|
Accounts payable |
|
$ |
75,074 |
|
|
$ |
70,586 |
|
|
Accrued salaries and benefits |
|
|
45,645 |
|
|
|
39,763 |
|
|
Accrued expenses and other current liabilities |
|
|
65,080 |
|
|
|
52,631 |
|
|
Deferred revenue |
|
|
38,571 |
|
|
|
29,394 |
|
|
Income tax payable |
|
|
— |
|
|
|
106 |
|
|
Total Current Liabilities |
|
|
224,370 |
|
|
|
192,480 |
|
|
Long-term Liabilities: |
|
|
|
|
|
|
|
|
|
Long-term debt |
|
|
206,250 |
|
|
|
259,389 |
|
|
Deferred rent |
|
|
15,119 |
|
|
|
15,600 |
|
|
Deferred income taxes |
|
|
33,351 |
|
|
|
39,114 |
|
|
Other |
|
|
15,135 |
|
|
|
12,984 |
|
|
Total Liabilities |
|
|
494,225 |
|
|
|
519,567 |
|
|
|
|
|
|
|
|
|
|
|
|
Commitments and Contingencies (Note 17) |
|
|
|
|
|
|
|
|
|
|
|
|
|
|
|
|
|
|
|
Stockholders’ Equity: |
|
|
|
|
|
|
|
|
|
Preferred stock, par value $.001 per share; 5,000,000 shares authorized; none issued |
|
|
— |
|
|
|
— |
|
|
Common stock, $.001 par value; 70,000,000 shares authorized; 22,019,315 and 21,663,432 shares issued; and 18,661,801 and 19,021,262 shares outstanding as of December 31, 2017 and December 31, 2016, respectively |
|
|
22 |
|
|
|
22 |
|
|
Additional paid-in capital |
|
|
307,821 |
|
|
|
292,427 |
|
|
Retained earnings |
|
|
434,766 |
|
|
|
371,890 |
|
|
Treasury stock |
|
|
(121,540 |
) |
|
|
(88,695 |
) |
|
Accumulated other comprehensive loss |
|
|
(5,039 |
) |
|
|
(9,640 |
) |
|
Total Stockholders’ Equity |
|
|
616,030 |
|
|
|
566,004 |
|
|
Total Liabilities and Stockholders’ Equity |
|
$ |
1,110,255 |
|
|
$ |
1,085,571 |
|
The accompanying notes are an integral part of these statements.
F-3
ICF International, Inc. and Subsidiaries
Consolidated Statements of Comprehensive Income
(in thousands, except per share amounts)
|
|
|
Years ended December 31, |
|
|||||||||
|
|
|
2017 |
|
|
2016 |
|
|
2015 |
|
|||
|
Revenue |
|
$ |
1,229,162 |
|
|
$ |
1,185,097 |
|
|
$ |
1,132,232 |
|
|
Direct costs |
|
|
771,725 |
|
|
|
745,137 |
|
|
|
694,436 |
|
|
Operating costs and expenses |
|
|
|
|
|
|
|
|
|
|
|
|
|
Indirect and selling expenses |
|
|
346,440 |
|
|
|
328,048 |
|
|
|
329,159 |
|
|
Depreciation and amortization |
|
|
17,691 |
|
|
|
16,638 |
|
|
|
16,222 |
|
|
Amortization of intangible assets |
|
|
10,888 |
|
|
|
12,481 |
|
|
|
17,184 |
|
|
Total operating costs and expenses |
|
|
375,019 |
|
|
|
357,167 |
|
|
|
362,565 |
|
|
Operating income |
|
|
82,418 |
|
|
|
82,793 |
|
|
|
75,231 |
|
|
Interest expense |
|
|
(8,553 |
) |
|
|
(9,470 |
) |
|
|
(10,072 |
) |
|
Other income (expense) |
|
|
121 |
|
|
|
1,184 |
|
|
|
(1,559 |
) |
|
Income before income taxes |
|
|
73,986 |
|
|
|
74,507 |
|
|
|
63,600 |
|
|
Provision for income taxes |
|
|
11,110 |
|
|
|
27,923 |
|
|
|
24,231 |
|
|
Net income |
|
$ |
62,876 |
|
|
$ |
46,584 |
|
|
$ |
39,369 |
|
|
|
|
|
|
|
|
|
|
|
|
|
|
|
|
Earnings per share: |
|
|
|
|
|
|
|
|
|
|
|
|
|
Basic |
|
$ |
3.35 |
|
|
$ |
2.45 |
|
|
$ |
2.04 |
|
|
Diluted |
|
$ |
3.27 |
|
|
$ |
2.40 |
|
|
$ |
2.00 |
|
|
|
|
|
|
|
|
|
|
|
|
|
|
|
|
Weighted-average common shares outstanding: |
|
|
|
|
|
|
|
|
|
|
|
|
|
Basic |
|
|
18,766 |
|
|
|
18,989 |
|
|
|
19,335 |
|
|
Diluted |
|
|
19,244 |
|
|
|
19,416 |
|
|
|
19,663 |
|
|
|
|
|
|
|
|
|
|
|
|
|
|
|
|
Other comprehensive income (loss), net of tax |
|
|
4,601 |
|
|
|
(2,149 |
) |
|
|
(5,010 |
) |
|
Comprehensive income, net of tax |
|
$ |
67,477 |
|
|
$ |
44,435 |
|
|
$ |
34,359 |
|
The accompanying notes are an integral part of these statements.
F-4
ICF International, Inc. and Subsidiaries
Consolidated Statements of Stockholders’ Equity
(in thousands)
|
|
|
Common Stock |
|
|
Additional Paid-in |
|
|
Retained |
|
|
Treasury Stock |
|
|
Accumulated Other Comprehensive |
|
|
|
|
|
|||||||||||||
|
|
|
Shares |
|
|
Amount |
|
|
Capital |
|
|
Earnings |
|
|
Shares |
|
|
Amount |
|
|
Loss |
|
|
Total |
|
||||||||
|
January 1, 2015 |
|
|
19,430 |
|
|
$ |
21 |
|
|
$ |
267,206 |
|
|
$ |
285,937 |
|
|
|
1,606 |
|
|
$ |
(49,994 |
) |
|
$ |
(2,481 |
) |
|
$ |
500,689 |
|
|
Net income |
|
|
— |
|
|
|
— |
|
|
|
— |
|
|
|
39,369 |
|
|
|
— |
|
|
|
— |
|
|
|
— |
|
|
|
39,369 |
|
|
Other comprehensive loss |
|
|
— |
|
|
|
— |
|
|
|
— |
|
|
|
— |
|
|
|
— |
|
|
|
— |
|
|
|
(5,010 |
) |
|
|
(5,010 |
) |
|
Equity compensation |
|
|
— |
|
|
|
— |
|
|
|
10,392 |
|
|
|
— |
|
|
|
— |
|
|
|
458 |
|
|
|
— |
|
|
|
10,850 |
|
|
Exercise of stock options |
|
|
44 |
|
|
|
— |
|
|
|
932 |
|
|
|
— |
|
|
|
— |
|
|
|
— |
|
|
|
— |
|
|
|
932 |
|
|
Issuance of shares pursuant to vesting of restricted stock units |
|
|
234 |
|
|
|
— |
|
|
|
— |
|
|
|
— |
|
|
|
— |
|
|
|
— |
|
|
|
— |
|
|
|
— |
|
|
Net payments for stock issuances and buybacks |
|
|
(676 |
) |
|
|
— |
|
|
|
276 |
|
|
|
— |
|
|
|
676 |
|
|
|
(25,137 |
) |
|
|
— |
|
|
|
(24,861 |
) |
|
Tax impact of stock option exercises and award vesting |
|
|
— |
|
|
|
— |
|
|
|
1,307 |
|
|
|
— |
|
|
|
— |
|
|
|
— |
|
|
|
— |
|
|
|
1,307 |
|
|
December 31, 2015 |
|
|
19,032 |
|
|
|
21 |
|
|
|
280,113 |
|
|
|
325,306 |
|
|
|
2,282 |
|
|
|
(74,673 |
) |
|
|
(7,491 |
) |
|
|
523,276 |
|
|
Net income |
|
|
— |
|
|
|
— |
|
|
|
— |
|
|
|
46,584 |
|
|
|
— |
|
|
|
— |
|
|
|
— |
|
|
|
46,584 |
|
|
Other comprehensive loss |
|
|
— |
|
|
|
— |
|
|
|
— |
|
|
|
— |
|
|
|
— |
|
|
|
— |
|
|
|
(2,149 |
) |
|
|
(2,149 |
) |
|
Equity compensation |
|
|
— |
|
|
|
— |
|
|
|
8,734 |
|
|
|
— |
|
|
|
— |
|
|
|
348 |
|
|
|
— |
|
|
|
9,082 |
|
|
Exercise of stock options |
|
|
128 |
|
|
|
1 |
|
|
|
3,033 |
|
|
|
— |
|
|
|
— |
|
|
|
— |
|
|
|
— |
|
|
|
3,034 |
|
|
Issuance of shares pursuant to vesting of restricted stock units |
|
|
221 |
|
|
|
— |
|
|
|
— |
|
|
|
— |
|
|
|
— |
|
|
|
— |
|
|
|
— |
|
|
|
— |
|
|
Net payments for stock issuances and buybacks |
|
|
(360 |
) |
|
|
— |
|
|
|
547 |
|
|
|
— |
|
|
|
360 |
|
|
|
(14,370 |
) |
|
|
— |
|
|
|
(13,823 |
) |
|
December 31, 2016 |
|
|
19,021 |
|
|
|
22 |
|
|
|
292,427 |
|
|
|
371,890 |
|
|
|
2,642 |
|
|
|
(88,695 |
) |
|
|
(9,640 |
) |
|
|
566,004 |
|
|
Net income |
|
|
— |
|
|
|
— |
|
|
|
— |
|
|
|
62,876 |
|
|
|
— |
|
|
|
— |
|
|
|
— |
|
|
|
62,876 |
|
|
Other comprehensive income |
|
|
— |
|
|
|
— |
|
|
|
— |
|
|
|
— |
|
|
|
— |
|
|
|
— |
|
|
|
4,601 |
|
|
|
4,601 |
|
|
Equity compensation |
|
|
— |
|
|
|
— |
|
|
|
9,985 |
|
|
|
— |
|
|
|
— |
|
|
|
306 |
|
|
|
— |
|
|
|
10,291 |
|
|
Exercise of stock options |
|
|
176 |
|
|
|
— |
|
|
|
4,722 |
|
|
|
— |
|
|
|
— |
|
|
|
— |
|
|
|
— |
|
|
|
4,722 |
|
|
Issuance of shares pursuant to vesting of restricted stock units |
|
|
180 |
|
|
|
— |
|
|
|
— |
|
|
|
— |
|
|
|
— |
|
|
|
— |
|
|
|
— |
|
|
|
— |
|
|
Net payments for stock issuances and buybacks |
|
|
(715 |
) |
|
|
— |
|
|
|
687 |
|
|
|
— |
|
|
|
715 |
|
|
|
(33,151 |
) |
|
|
— |
|
|
|
(32,464 |
) |
|
December 31, 2017 |
|
|
18,662 |
|
|
$ |
22 |
|
|
$ |
307,821 |
|
|
$ |
434,766 |
|
|
|
3,357 |
|
|
$ |
(121,540 |
) |
|
$ |
(5,039 |
) |
|
$ |
616,030 |
|
The accompanying notes are an integral part of these statements.
F-5
ICF International, Inc. and Subsidiaries
Consolidated Statements of Cash Flows
(in thousands)
|
|
|
Years ended December 31, |
|
|||||||||
|
|
|
2017 |
|
|
2016 |
|
|
2015 |
|
|||
|
Cash Flows from Operating Activities |
|
|
|
|
|
|
|
|
|
|
|
|
|
Net income |
|
$ |
62,876 |
|
|
$ |
46,584 |
|
|
$ |
39,369 |
|
|
Adjustments to reconcile net income to net cash provided by operating activities: |
|
|
|
|
|
|
|
|
|
|
|
|
|
Bad debt expense |
|
|
1,480 |
|
|
|
1,089 |
|
|
|
268 |
|
|
Deferred income taxes |
|
|
(7,390 |
) |
|
|
6,535 |
|
|
|
2,106 |
|
|
Non-cash equity compensation |
|
|
10,291 |
|
|
|
9,082 |
|
|
|
10,850 |
|
|
Depreciation and amortization |
|
|
28,579 |
|
|
|
29,119 |
|
|
|
33,406 |
|
|
Deferred rent |
|
|
(177 |
) |
|
|
(43 |
) |
|
|
1,002 |
|
|
Proceeds from hedge sale |
|
|
— |
|
|
|
3,600 |
|
|
|
— |
|
|
Facilities consolidation reserve |
|
|
1,479 |
|
|
|
— |
|
|
|
— |
|
|
Amortization of debt issuance costs |
|
|
673 |
|
|
|
532 |
|
|
|
532 |
|
|
Other adjustments, net |
|
|
275 |
|
|
|
(1,169 |
) |
|
|
1,254 |
|
|
Changes in operating assets and liabilities, net of the effect of acquisitions: |
|
|
|
|
|
|
|
|
|
|
|
|
|
Contract receivables |
|
|
(7,234 |
) |
|
|
(29,020 |
) |
|
|
(2,713 |
) |
|
Prepaid expenses and other assets |
|
|
(1,844 |
) |
|
|
(2,792 |
) |
|
|
(170 |
) |
|
Accounts payable |
|
|
3,631 |
|
|
|
8,941 |
|
|
|
(2,374 |
) |
|
Accrued salaries and benefits |
|
|
5,597 |
|
|
|
1,140 |
|
|
|
(13,208 |
) |
|
Accrued expenses and other current liabilities |
|
|
13,257 |
|
|
|
10,252 |
|
|
|
(4,522 |
) |
|
Deferred revenue |
|
|
8,341 |
|
|
|
(707 |
) |
|
|
2,367 |
|
|
Income tax receivable and payable |
|
|
(5,697 |
) |
|
|
(2,447 |
) |
|
|
8,356 |
|
|
Other liabilities |
|
|
3,054 |
|
|
|
(639 |
) |
|
|
(320 |
) |
|
Net Cash Provided by Operating Activities |
|
|
117,191 |
|
|
|
80,057 |
|
|
|
76,203 |
|
|
|
|
|
|
|
|
|
|
|
|
|
|
|
|
Cash Flows from Investing Activities |
|
|
|
|
|
|
|
|
|
|
|
|
|
Capital expenditures for property and equipment and capitalized software |
|
|
(14,513 |
) |
|
|
(13,791 |
) |
|
|
(12,682 |
) |
|
Payments for business acquisitions, net of cash received |
|
|
(91 |
) |
|
|
(100 |
) |
|
|
(1,818 |
) |
|
Net Cash Used in Investing Activities |
|
|
(14,604 |
) |
|
|
(13,891 |
) |
|
|
(14,500 |
) |
|
|
|
|
|
|
|
|
|
|
|
|
|
|
|
Cash Flows from Financing Activities |
|
|
|
|
|
|
|
|
|
|
|
|
|
Advances from working capital facilities |
|
|
590,225 |
|
|
|
478,584 |
|
|
|
381,745 |
|
|
Payments on working capital facilities |
|
|
(643,363 |
) |
|
|
(530,728 |
) |
|
|
(420,265 |
) |
|
Payments on capital expenditure obligations |
|
|
(4,808 |
) |
|
|
(4,041 |
) |
|
|
(3,289 |
) |
|
Debt issue costs |
|
|
(1,612 |
) |
|
|
— |
|
|
|
(17 |
) |
|
Proceeds from exercise of options |
|
|
4,722 |
|
|
|
3,034 |
|
|
|
932 |
|
|
Tax benefits of stock option exercises and award vesting |
|
|
— |
|
|
|
— |
|
|
|
1,307 |
|
|
Net payments for stockholder issuances and buybacks |
|
|
(32,464 |
) |
|
|
(13,823 |
) |
|
|
(24,861 |
) |
|
Net Cash Used in Financing Activities |
|
|
(87,300 |
) |
|
|
(66,974 |
) |
|
|
(64,448 |
) |
|
Effect of Exchange Rate Changes on Cash, Cash Equivalents, and Restricted Cash |
|
|
1,094 |
|
|
|
(416 |
) |
|
|
(1,746 |
) |
|
|
|
|
|
|
|
|
|
|
|
|
|
|
|
Increase (Decrease) in Cash, Cash Equivalents, and Restricted Cash |
|
|
16,381 |
|
|
|
(1,224 |
) |
|
|
(4,491 |
) |
|
Cash, Cash Equivalents, and Restricted Cash, Beginning of Period |
|
|
7,885 |
|
|
|
9,109 |
|
|
|
13,600 |
|
|
Cash, Cash Equivalents, and Restricted Cash, End of Period |
|
$ |
24,266 |
|
|
$ |
7,885 |
|
|
$ |
9,109 |
|
|
|
|
|
|
|
|
|
|
|
|
|
|
|
|
Supplemental disclosure of cash flow information: |
|
|
|
|
|
|
|
|
|
|
|
|
|
Cash paid during the period for: |
|
|
|
|
|
|
|
|
|
|
|
|
|
Interest |
|
$ |
7,922 |
|
|
$ |
8,937 |
|
|
$ |
9,845 |
|
|
Income taxes |
|
$ |
21,659 |
|
|
$ |
21,094 |
|
|
$ |
16,315 |
|
|
Non-cash investing and financing transactions: |
|
|
|
|
|
|
|
|
|
|
|
|
|
Capital expenditure obligations |
|
$ |
— |
|
|
$ |
— |
|
|
$ |
12,870 |
|
The accompanying notes are an integral part of these statements.
F-6
ICF International, Inc. and Subsidiaries
Notes to Consolidated Financial Statements
(dollar amounts in tables in thousands, except share and per share data)
NOTE 1—BASIS OF PRESENTATION AND NATURE OF OPERATIONS
Basis of Presentation and Nature of Operations
The accompanying consolidated financial statements include the accounts of ICF International, Inc. (“ICFI”) and its subsidiary, ICF Consulting Group, Inc. (“Consulting,” and together with ICFI, “the Company”), and have been prepared in accordance with U.S. generally accepted accounting principles. Consulting is a wholly owned subsidiary of ICFI. ICFI is a holding company with no operations or assets other than its investment in the common stock of Consulting. All other subsidiaries of the Company are wholly owned by Consulting. All significant intercompany transactions and balances have been eliminated.
Nature of Operations
The Company provides professional services and technology-based solutions to government and commercial clients, including management, technology, and policy consulting and implementation services, in the areas of energy, environment, and infrastructure; health, education, and social programs; safety and security; and consumer and financial. The Company offers a full range of services to these clients throughout the entire life cycle of a policy, program, project, or initiative, from research and analysis and assessment and advice to design and implementation of programs and technology-based solutions, and the provision of engagement services and programs.
The Company’s major clients are United States (“U.S.”) federal government departments and agencies, most significantly the Department of Health and Human Services, Department of State and Department of Defense. The Company also serves U.S. state and local government departments and agencies, international governments, and commercial clients worldwide. Commercial clients include airlines, airports, electric and gas utilities, oil companies, banks and other financial services companies, transportation, travel and hospitality firms, non-profits/associations, law firms, manufacturing firms, retail chains, and distribution companies. The term “federal” or “federal government” refers to the U.S. federal government, and “state and local” or “state and local government” refers to U.S. state and local governments, unless otherwise indicated.
The Company, incorporated in Delaware, is headquartered in Fairfax, Virginia. It maintains offices throughout the world, including over 59 offices in the U.S. and more than 23 offices in key markets outside the U.S., including offices in the United Kingdom, Belgium, China, India and Canada.
Reclassifications
Certain immaterial amounts in the 2016 and 2015 consolidated financial statements have been reclassified to conform to the current year presentation. To be consistent with the Company’s current presentation, the Company reclassified $4.3 million of amounts related to deferred compensation liabilities from accrued salaries and benefits to long-term as of December 31, 2016.
F-7
NOTE 2—SUMMARY OF SIGNIFICANT ACCOUNTING POLICIES
Use of Estimates
The preparation of financial statements in conformity with U.S. generally accepted accounting principles requires management to make estimates and assumptions that affect the reported amounts of assets, liabilities, and contingent liabilities at the date of the financial statements and the reported amounts of revenue and expenses during the reporting periods. Actual results could differ from those estimates.
Revenue Recognition
The Company recognizes revenue when persuasive evidence of an arrangement exists, services have been rendered, the contract price is fixed or determinable, and collectability is reasonably assured. The Company enters into three types of contracts: time-and-materials, cost-based, and fixed-price.
|
|
• |
Time-and-Materials Contracts. Revenue for time-and-materials contracts is recorded on the basis of labor hours worked multiplied by the contract-defined billing rates, plus the costs of other items used in the performance of the contract. Profits and losses on time-and-materials contracts result from the difference between the cost of services performed and the contract-defined billing rates for these services. |
|
|
• |
Cost-Based Contracts. Revenue under cost-based contracts is recognized as costs are incurred. Applicable estimated profit, if any, is included in earnings in the proportion that incurred costs bear to total estimated costs. Incentives, award fees, or penalties related to performance are also considered in estimating revenue and profit based on actual and anticipated awards, taking into consideration factors such as the Company’s prior award experience and communications with the customer regarding performance. |
|
|
• |
Fixed-Price Contracts. Revenue for fixed-price contracts is recognized when earned, generally as work is performed. Services performed vary from contract to contract and are not always uniformly performed over the term of the arrangement. The Company recognizes revenue in a number of different ways on fixed-price contracts based on the nature of the services to be provided and an assessment of which method best mirrors the pattern of performance for the deliverable/contract, including: |
|
|
• |
Proportional Performance: Revenue on certain fixed-price contracts is recognized based on proportional performance when the provision of services extends beyond an accounting period with more than one discrete performance act, and progress towards completion can be measured based on a reliable output or input. Under this method, revenue is recorded each period based on certain contract performance input measures incurred (labor hours, labor costs, or total costs) or output measures completed, expressed as a proportion of a total project estimate. Progress on a contract is monitored regularly to ensure that revenue recognized reflects project status. When hours or costs incurred are used as the basis for revenue recognition, the hours or costs incurred represent a reasonable surrogate for output measures of contract performance, including the presentation of deliverables to the client. Clients are obligated to pay as services are performed, and, in the event that a client cancels the contract, payment for services performed through the date of cancellation is typically negotiated with the client. |
|
|
• |
Specific Performance: When the services to be performed consist of a single act, revenue is recognized at the time the act is performed or at the completion of the single service. |
|
|
• |
Straight-Line: When services are performed or are expected to be performed consistently throughout an arrangement, or when the Company is compensated on a retainer or fixed-fee basis, revenue is recognized ratably over the period benefited. |
|
|
• |
Completed Contract: Revenue and costs on certain fixed-price contracts are recognized at completion if the final act is so significant to the arrangement that value is deemed to be transferred only at completion. |
Revenue recognition requires the Company to use judgment relative to assessing risks, estimating contract revenue and costs or other variables, and making assumptions for scheduling and technical issues. Due to the size and nature of many of the Company’s contracts, the estimation of revenue and the cost to perform for contracts in process can be complicated and subject to many variables. Contract costs include labor, subcontractor costs, and other direct costs, as well as an allocation of indirect costs. At times, the Company must also make assumptions regarding the length of time to complete the contract because costs include expected increases in wages, prices for subcontractors, and other direct costs. From time to time, the Company obtains new information which causes it to revise its estimated total costs or hours to fulfill contract requirements and thus the associated revenue earned on a contract. To the extent that a revised estimate affects contract profit or revenue previously recognized, the Company records the cumulative effect of the revision in the period in which the facts requiring the revision become known. A provision for the full amount of an anticipated loss on any type of contract is recognized in the period in which the anticipated loss becomes probable and can be reasonably estimated. As a result, operating results could be affected by revisions to prior accounting estimates.
F-8
Contractual arrangements are evaluated to assess whether revenue should be recognized on a gross versus net basis. Management’s assessment when determining gross versus net revenue recognition is based on several factors, such as whether the Company serves as the primary service provider, has autonomy in selecting subcontractors, or has credit risk, all of which are primary indicators that the Company serves as the principal to the transaction. In such cases, revenue is recognized on a gross basis. When such indicators are not present and the Company is primarily functioning as an agent under an arrangement, revenue is recognized on a net basis, being limited to fees earned for facilitating the transaction.
Payments to the Company on cost-based contracts with the U.S. federal government are provisional payments subject to audit and adjustment by the government. Indirect costs applied to government contracts are also subject to audit and adjustment and such audits have been finalized only through December 31, 2007. Contract revenue has been recorded in amounts that are expected to be realized on final audit and settlement of costs.
The Company prepares client invoices in accordance with the terms of the applicable contract, and billing terms may not be directly related to the performance of services. Unbilled receivables are invoiced based on the achievement of specific events as defined by each contract, including deliverables, timetables, and incurrence of certain costs. Unbilled receivables are classified as a current asset. Advanced billings to clients in excess of revenue earned are recorded as deferred revenue until the revenue recognition criteria are met. Reimbursements of out-of-pocket expenses are included in revenue when the corresponding costs are included in the cost of revenue. The Company records revenue net of taxes collected from clients when the taxes are to be remitted to governmental authorities.
The Company may proceed with work based on client direction prior to the completion and signing of formal contract documents. The Company has a review process for approving any such work. Revenue associated with such work is recognized only when it can be reliably estimated and realization is probable. The Company bases its estimates on a variety of factors, including previous experiences with the client, communications with the client regarding contract status, and its knowledge of the likelihood that contractual limits, or funding, will be increased.
Cash and Cash Equivalents
The Company considers cash on deposit and all highly liquid investments with original maturities of three months or less when purchased to be cash and cash equivalents.
Restricted Cash
The Company has restricted cash representing amounts held in escrow accounts and/or not readily available due to contractual restrictions.
Allowance for Doubtful Accounts
The Company considers a number of factors in its estimate of allowance for doubtful accounts, including the customer’s financial condition, historical collection experience, and other factors that may bear on collectability of the receivables. The Company writes off contract receivables when such amounts are determined to be uncollectible.
Property and Equipment
Property and equipment are carried at cost and are depreciated using the straight-line method over their estimated useful lives, which range from two to seven years. Leasehold improvements are amortized on a straight-line basis over the shorter of the economic life of the improvement or the related lease term.
Goodwill and Other Intangible Assets
The purchase price of an acquired business is allocated to the tangible assets and separately identifiable intangible assets acquired, less liabilities assumed, based on their respective fair values, with the excess recorded as goodwill. Goodwill represents the excess of costs over the fair value of net assets of businesses acquired. Goodwill and intangible assets acquired in a business combination and determined to have an indefinite useful life are not amortized, but instead are reviewed for impairment annually, or more frequently if impairment indicators arise. Intangible assets with estimable useful lives are amortized over such lives and reviewed for impairment if impairment indicators arise.
F-9
Impairment
The Company has historically performed its annual goodwill impairment test as of September 30 of each year. Effective for the annual goodwill impairment test for 2017, the Company performed the required annual test as of October 1. During the fourth quarter of 2017, the Company early adopted the Accounting Standards Update 2017-04, Intangibles—Goodwill and Other (Topic 350) (ASU 2017-04) issued by the Financial Accounting Standards Board (the “FASB”). ASU 2017-04 simplified the calculation and recognition of impairment of goodwill if there is evidence of an impairment based on qualitative or quantitative assessments by eliminating Step 2 of the two step impairment test required by the prior accounting standard.
For the purposes of performing the annual goodwill impairment test, the Company has one reporting unit. For the goodwill impairment test as of October 1, 2017, the Company opted to perform a qualitative assessment of whether it is more likely than not that its reporting unit's fair value is less than its carrying amount. If, after completing its qualitative assessment, the Company determines that it is more likely than not that the estimated fair value of the reporting unit exceeded its carrying amount, it may conclude that no impairment exists. If the Company concludes otherwise, a goodwill impairment test must be performed, which includes a comparison of the reporting unit’s fair value to the carrying amount and recognizing as an impairment loss the difference of the reporting unit’s fair value and the carrying amount of goodwill.
The Company’s qualitative analysis as of October 1, 2017 included macroeconomic, industry and market specific considerations, financial performance indicators and measurements, and other factors. Based on this qualitative assessment, the Company determined that it is more likely than not that the fair value of its reporting unit exceeded its carrying amount, and thus the impairment test was not required to be performed. Therefore, based on management’s review, a goodwill impairment loss was not required for 2017. Historically, the Company has not recorded any goodwill impairment losses.
The Company is required to review long-lived assets and certain identifiable intangibles for impairment whenever events or changes in circumstances indicate that the carrying amount of an asset might not be recoverable. Recoverability of assets to be held and used is measured by a comparison of the carrying amount of an asset to future undiscounted net cash flows expected to be generated by the asset. If such assets are considered to be impaired, the impairment to be recognized is measured by the amount by which the carrying amount of the asset exceeds its fair value. Assets to be disposed of are reported at the lower of the carrying amount or fair value, less cost to sell.
Capitalized Software
The Company capitalizes eligible costs to develop enhancements and upgrades to internal-use software that are incurred subsequent to the preliminary project stage. Amortization expense is recorded on a straight-line basis over the expected economic life of the software, typically lasting three to five years. During the years ended December 31, 2017, 2016, and 2015, the costs capitalized for the development of internal-use software were not material to the Company’s consolidated financial statements.
Deferred Rent
The Company recognizes rent expense on a straight-line basis over the non-cancellable term of each lease, including renewal option periods when renewal is reasonably assured or executed. Lease incentives or abatements received at or near the inception of leases are accrued and amortized ratably over the life of the lease.
Stock-based Compensation
The Company recognizes stock-based compensation expense related to share-based payments to employees, including grants of employee stock options, restricted stock awards, restricted stock units (“RSUs”), and cash-settled restricted stock units (“CSRSUs”) on a straight-line basis over the requisite service period, which is generally the vesting period. The Company recognizes expense for performance-based share awards (“PSAs”), which have both a performance and condition, on a straight-line basis over the three-year performance period. Non-employee director awards, which do not include vesting conditions, are for board-related services and therefore expensed when earned.
Stock-based compensation expense is based on the estimated fair value of the instruments on award and the estimated number of shares the Company ultimately expects will vest. The Company estimates the rate of future forfeitures based on factors such as historical experience and employee class. In addition, the estimation of PSAs that will ultimately vest requires judgment based on the performance and market conditions that will be achieved over the performance period. Changes to these estimates are recorded as a cumulative adjustment in the period estimates are revised.
The fair value of stock options, restricted stock awards, RSUs, PSAs, and non-employee director awards is estimated based on the fair value of a share of common stock at the grant date. The Company has elected to use the Black-Scholes-Merton option pricing model to determine the fair value of stock options. The fair value of PSAs is estimated using a Monte Carlo simulation model.
F-10
CSRSUs are settled only in cash payments. The cash payment is based on the fair value of the Company’s stock price at the vesting date, calculated by multiplying the number of CSRSUs vested by the Company’s closing stock price on the vesting date, subject to a maximum payment cap and a minimum payment floor. The Company treats these awards as liability-classified awards, and, therefore, accounts for them at fair value estimated based on the closing price of the Company’s stock at the reporting date.
Other Comprehensive Income (Loss)
Other comprehensive income (loss) represents foreign currency translation adjustments arising from the use of differing exchange rates from period to period and the gain on the sale of an interest rate hedge agreement. The financial positions and results of operations of the Company’s foreign subsidiaries are based on the local currency as the functional currency and are translated to U.S. dollars for financial reporting purposes. Assets and liabilities of the subsidiaries are translated at the exchange rate in effect at each balance sheet date. Income statement accounts are translated at the average rate of exchange prevailing during the period. Translation adjustments are reported in accumulated other comprehensive loss included in stockholders’ equity in the Company’s consolidated balance sheets. The activity included in other comprehensive income (loss), net of tax, in the Company’s consolidated statements of comprehensive income for each period reported is summarized below.
|
|
|
Year ended December 31, |
|
|||||||||
|
|
|
2017 |
|
|
2016 |
|
|
2015 |
|
|||
|
Foreign currency translation adjustments |
|
$ |
4,177 |
|
|
$ |
(4,321 |
) |
|
$ |
(5,676 |
) |
|
Foreign currency realized losses reclassified into earnings |
|
|
— |
|
|
|
(3 |
) |
|
|
666 |
|
|
Change in fair value of derivative designated as cash flow hedge |
|
|
441 |
|
|
|
— |
|
|
|
— |
|
|
Gain on sale of interest rate hedging agreement, net of tax(1) |
|
|
(17 |
) |
|
|
2,175 |
|
|
|
— |
|
|
Other comprehensive income (loss), net of tax(2) |
|
$ |
4,601 |
|
|
$ |
(2,149 |
) |
|
$ |
(5,010 |
) |
|
(1) |
On December 1, 2016, the Company sold the interest rate hedge agreement. The fair value of the interest rate hedge was recorded in other comprehensive income (loss), net of tax, and will be reclassified to earnings when earnings are impacted by the cash flows of the hedged items, the interest payments on the Credit Facility or its replacement from January 31, 2018 to January 31, 2023. See additional details on the hedge agreement in Note 9—Derivative Instruments and Hedging Activities. |
|
(2) |
Net of tax of $1.0 million, $2.2 million, and $1.0 million for the years ended December 31, 2017, 2016, and 2015, respectively. |
Derivative Instruments
Derivative instruments designated as cash flow hedges are recorded on the consolidated balance sheet at fair value as of the reporting date, and the effective portion of the hedge is recorded in other comprehensive income (loss) on the consolidated statement of comprehensive income and reclassified to earnings in the period that the hedged instruments affect earnings. Management reviews the effectiveness of the hedges on a quarterly basis.
Income Taxes
The Company recognizes deferred tax assets and liabilities for the expected future tax consequences of temporary differences between the financial statement carrying amounts of existing assets and liabilities and their respective tax bases. Deferred tax assets and liabilities are measured using enacted tax rates in effect for the year in which those temporary differences are expected to be recovered or settled. The Company evaluates its ability to benefit from all deferred tax assets and establishes valuation allowances for amounts it believes will more likely than not be unrealizable. For uncertain tax positions, the Company uses a more-likely-than-not recognition threshold based on the technical merits of the income tax position taken. Income tax positions that meet the more-likely-than-not recognition threshold are measured in order to determine the tax benefit recognized in the financial statements. Penalties, if probable and reasonably estimable, and interest expense related to uncertain tax positions are not recognized as a component of income tax expense but recorded separately in indirect expenses and interest expense, respectively.
Treasury Shares
Treasury shares are accounted for under the cost method.
Segment, Customer and Geographic Information
The Company operates in one segment based on the consolidated information used by its chief operating decision maker in evaluating the financial performance of its business and allocating resources. This single segment represents the Company’s core business which is providing professional services for government and commercial clients. Although, in order to provide insight into the breadth of its capabilities and diversity of its client base, the Company describes its clients’ four key market areas and evaluates its revenue based on the type of client served, the Company does not manage its business or allocate resources based on those service offerings or types of clients.
F-11
Approximately $550.3 million, $563.0 million, and $540.0 million of the Company’s revenue for the years 2017, 2016, and 2015, respectively, was derived under prime contracts and subcontracts with agencies and departments of the federal government representing 45%, 48%, and 48% of total revenue, respectively. No other customer accounted for 10% or more of the Company’s revenue during the years ended 2017, 2016, and 2015, respectively.
The Company’s international operations provide services to both commercial and international government clients. Revenue is attributed to a particular geographic area based on the administrative location of the client that awarded the contract. The Company’s revenue generated from international clients as a percentage of total revenue was approximately 9%, 10%, and 11% for the years 2017, 2016, and 2015, respectively.
At December 31, 2017 and 2016, long-lived assets held internationally were not material.
Risks and Uncertainties
Financial instruments that potentially subject the Company to concentrations of credit risk consist principally of cash and cash equivalents and contract receivables. The majority of the Company’s cash transactions are processed through one U.S. commercial bank. Cash held domestically in excess of daily requirements is used to reduce any amounts outstanding under the Company’s Credit Facility. As of December 31, 2017 and 2016, the Company held approximately $10.4 million and $5.4 million, respectively, of cash in foreign bank accounts. To date, the Company has not incurred losses related to cash and cash equivalents.
The Company’s contract receivables consist principally of receivables from agencies and departments of, as well as from prime contractors to, the U.S. federal, state and local, and international governments, as well as from commercial organizations. The Company believes that this credit risk with respect to federal and other governments, including when the Company is a subcontractor to a prime contractor, is limited due to the credit worthiness of the respective governmental entity. Receivables from commercial clients generally pose a greater credit risk than those from government agencies and departments, and, as a result, are subject to ongoing monitoring. The Company extends credit in the normal course of operations and does not require collateral from its clients.
The Company has historically been, and continues to be, heavily dependent on contracts with the federal government and is subject to audit, in particular, by agencies of the federal government. Such audits determine, among other things, whether an adjustment of invoices rendered to the government is appropriate under the underlying terms of the contracts. Management does not expect any significant adjustments as a result of government audits that will adversely affect the Company’s financial position.
Recent Accounting Pronouncements
Recent Accounting Pronouncements Adopted
Cash Receipts and Cash Payments
In August 2016, FASB issued Accounting Standard Update (“ASU”) 2016-15, Statement of Cash Flows (Topic 230): Classification of Certain Cash Receipts and Cash Payments that addressed eight specific cash flow issues to reduce the existing diversity in practice. During the third quarter of 2017, the Company elected to early adopt ASU 2016-15, which did not have a material impact on the Company’s consolidated financial statements.
F-12
Restricted Cash
In November 2016, the FASB issued ASU 2016-18, Statement of Cash Flows (Topic 230): Restricted Cash (a consensus of the FASB Emerging Issues Task Force), which requires entities to show the changes in the total of cash, cash equivalents, restricted cash, and restricted cash equivalents in the statement of cash flows. As a result, entities will no longer present transfers between cash and cash equivalents and restricted cash and cash equivalents in the statement of cash flows. During the third quarter of 2017, the Company elected to early adopt ASU 2016-18 retrospectively, with adjustments to the 2016 and 2015 fiscal years’ consolidated statements of cash flows. The impact of the adoption on the Company’s previously reported consolidated statements of cash flows is summarized as follows:
|
|
|
Year Ended December 31, 2016 |
|
|
Year Ended December 31, 2015 |
|
||||||||||
|
|
|
As Reported |
|
|
As Adjusted |
|
|
As Reported |
|
|
As Adjusted |
|
||||
|
Restricted cash |
|
$ |
(494 |
) |
|
$ |
— |
|
|
$ |
116 |
|
|
$ |
— |
|
|
Net Cash Provided by Operating Activities |
|
|
79,563 |
|
|
|
80,057 |
|
|
|
76,319 |
|
|
|
76,203 |
|
|
Effect of exchange rate changes on cash |
|
|
(403 |
) |
|
|
(416 |
) |
|
|
(1,746 |
) |
|
|
(1,746 |
) |
|
(Decrease) Increase in Cash and Cash Equivalents |
|
|
(1,705 |
) |
|
|
— |
|
|
|
(4,375 |
) |
|
|
— |
|
|
Increase in Cash, Cash Equivalents, and Restricted Cash |
|
|
— |
|
|
|
(1,224 |
) |
|
|
— |
|
|
|
(4,491 |
) |
|
Cash and Cash Equivalents, Beginning Period |
|
|
7,747 |
|
|
|
— |
|
|
|
12,122 |
|
|
|
— |
|
|
Cash, Cash Equivalents, and Restricted Cash, Beginning Period |
|
|
— |
|
|
|
9,109 |
|
|
|
— |
|
|
|
13,600 |
|
|
Cash and Cash Equivalents, End of Period |
|
|
6,042 |
|
|
|
— |
|
|
|
7,747 |
|
|
|
— |
|
|
Cash, Cash Equivalents, and Restricted Cash, End of Period |
|
|
— |
|
|
|
7,885 |
|
|
|
— |
|
|
|
9,109 |
|
Goodwill
In January 2017, the FASB issued ASU 2017-04, Intangibles – Goodwill and Other (Topic 350) (ASU 2017-04), which simplifies the measurement of goodwill during the execution of a goodwill impairment test in the event that there is evidence of an impairment based on qualitative or quantitative assessments. ASU 2017-04 does not change how the goodwill impairment is identified, and the Company will continue to perform a qualitative assessment annually to determine whether the two-step impairment test is required. The previous accounting standard required the impairment loss to be recognized under Step 2 of the impairment test. This required the Company to determine whether the carrying amount of the reporting unit’s goodwill exceeds its implied fair value. The implied fair value was calculated by assigning the fair value of the reporting unit to all of its assets and liabilities as if it had been acquired in a business combination. The new standard requires the Company to determine the fair value of the reporting unit and subtract the carrying amount from the fair value of the reporting unit to determine if there is any impairment. If the Company concludes that an impairment exists, an impairment loss will be recorded reflecting the difference of the reporting unit’s estimated fair value over its carrying amount. During the fourth quarter of 2017, the Company elected to early adopt ASU 2017-04, which did not have a material impact on the Company’s consolidated financial statements.
Derivative and Hedging
In August 2017, the FASB issued ASU 2017-12: Derivatives and Hedging (Topic 815) (ASU 2017-12). ASU 2017-12’s objective is to improve the financial reporting of an entity’s hedges and better aligns an entity’s hedge accounting with the entity’s risk management strategies, as well as simplify the current hedge accounting guidance. During the fourth quarter of 2017, the Company elected to early adopt ASU 2017-12, which did not have a material impact on the Company’s consolidated financial statements.
Recent Accounting Pronouncements Not Yet Adopted
Revenue Recognition
In May 2014, the FASB issued ASU 2014-09, Revenue from Contracts with Customers (Topic 606) (ASU 2014-09). ASU 2014-09 provides a single comprehensive revenue recognition framework and supersedes existing revenue recognition guidance. Included in the new principles-based revenue recognition model are changes to the basis for determining the timing for revenue recognition. In addition, the standard expands and improves revenue disclosures. In August 2015, the FASB issued ASU 2015-14 to amend ASU 2014-09 in order to defer the effective date of the new standard. In accordance with this update, the Company elected to adopt the requirements of the new standard effective January 1, 2018.
F-13
The Company has evaluated the impact of the new guidance on the timing of revenue and expanded disclosure requirements. The Company has concluded that, for the majority of its contracts, there is no material change in the timing of revenue recognition. However, the new standard will result in a change in revenue timing for performance incentives under certain contracts. Under the prior guidance, performance incentives were recognized as revenue when specific quantitative goals were achieved, generally at the end of a measurement period. Under the new standard, these incentives are considered variable consideration and the Company will include in revenue the most likely amount of the priced incentives to be earned as contract work is performed and recognize revenue associated with the incentives over the term of the agreement. This change is not expected to result in a material change to the Company’s annual revenue since most incentives have a one-year measurement period which is aligned with the Company’s fiscal year, but the change may accelerate revenue recognized on a quarterly basis.
As of January 1, 2018, the Company adopted the standard using the modified retrospective transition method. Under the modified retrospective method, the new standard applies to new contracts and those that were not completed as of January 1, 2018. For those contracts not completed as of January 1, 2018, the Company is finalizing the catch-up adjustment to retained earnings but does not expect the transition adjustment to be material to the consolidated financial statements. Total net cash provided by operating activities and net cash used by investing and financing activities will not be impacted by the adoption of the new standard. Prior periods will not be retrospectively adjusted, but the Company will maintain dual reporting for the year of initial application in order to disclose the effect on revenue of adopting the new guidance. Additional disclosures under the new standard will, among other required disclosures, disaggregate revenue into categories that reflect how the nature, amount, timing, and uncertainty of revenue and cash flows are affected by economic factors.
Leases
In February 2016, the FASB issued ASU 2016-02, Leases (Topic 842). This update revises an entity’s accounting for operating leases and requires lessees to recognize a right-of-use asset and lease liability for all leases with terms of more than 12 months. This update also requires that lessees recognize assets and liabilities on the balance sheet for the rights and obligations created by all such leases and requires disclosures designed to give financial statement users information on the amount and timing of lease expenses arising from such leases. These disclosures include certain qualitative and specific quantitative disclosures. For lessees, the new guidance is not expected to significantly change the recognition, measurement, and presentation of expenses arising from a lease. This update is effective for the first interim and annual periods beginning after December 15, 2018, with early adoption permitted. The Company continues to evaluate the impact of adopting ASU 2016-02, the elections to be made at adoption in a modified retrospective approach, the impact of future modifications to the new accounting pronouncement, our inventory of operating leases, the software options that will aid in the implementation and accounting under the new accounting pronouncement, and the timing of adoption.
Accumulated other comprehensive loss
In February 2018, the FASB issued ASU 2018-02: Income Statement – Reporting Comprehensive Income (Topic 220) (ASU 2018-02). ASU 2018-02’s objective is to address the application of ASC 740 to certain provisions of the new tax reform legislation commonly known as Tax Cuts and Jobs Act (the “Tax Act”). ASC 740 requires the effect of a change in tax rates on deferred assets and liabilities be included in income from continuing operations in the reporting period that contains the enactment date of the change. The guidance applies even in situations in which the tax effects were initially recognized directly in other comprehensive income at the previous rate, resulting in a stranded amount in accumulated other comprehensive income (loss) (AOCI) related to the income tax rate differential. ASU 2018-02 requires the Company to reclassify the amount of stranded taxes in AOCI to retained earnings. This update is effective for fiscal years beginning after December 15, 2018, including interim periods therein, and early adoption is permitted. The Company is currently evaluating the impact of the pronouncement on the consolidated financial statements.
NOTE 3—CONTRACT RECEIVABLES
Contract receivables, net of the established allowance, are stated at amounts expected to be realized in future periods. Unbilled receivables result from revenue that has been earned but cannot be billed yet under the terms of the contract. Unbilled receivables can be invoiced at contractually defined intervals or milestones, as well as on completion of the contract or government audits. The Company anticipates that the majority of unbilled receivables will be substantially billed and collected within one year, and therefore, classifies them as current assets in accordance with industry practice.
Contract receivables consisted of the following at December 31:
|
|
|
2017 |
|
|
2016 |
|
||
|
Billed |
|
$ |
169,027 |
|
|
$ |
168,012 |
|
|
Unbilled |
|
|
117,037 |
|
|
|
108,432 |
|
|
Retainages |
|
|
6,160 |
|
|
|
5,088 |
|
|
Other |
|
|
3,144 |
|
|
|
2,424 |
|
|
Allowance for doubtful accounts |
|
|
(3,853 |
) |
|
|
(2,591 |
) |
|
Contract receivables, net |
|
$ |
291,515 |
|
|
$ |
281,365 |
|
F-14
NOTE 4—PROPERTY AND EQUIPMENT
Property and equipment consisted of the following at December 31:
|
|
|
2017 |
|
|
2016 |
|
||
|
Leasehold improvements |
|
$ |
18,873 |
|
|
$ |
17,847 |
|
|
Software |
|
|
42,835 |
|
|
|
41,269 |
|
|
Furniture and equipment |
|
|
26,076 |
|
|
|
26,570 |
|
|
Computers |
|
|
28,826 |
|
|
|
28,874 |
|
|
|
|
|
116,610 |
|
|
|
114,560 |
|
|
Accumulated depreciation and amortization |
|
|
(78,558 |
) |
|
|
(74,076 |
) |
|
Total property and equipment, net |
|
$ |
38,052 |
|
|
$ |
40,484 |
|
Depreciation and amortization expense for the years ended December 31, 2017, 2016, and 2015, was approximately $17.7 million, $16.6 million, and $16.2 million, respectively.
NOTE 5—GOODWILL AND OTHER INTANGIBLE ASSETS
Goodwill
The changes in the carrying amount of goodwill for the fiscal years ended December 31 were as follows:
|
|
|
2017 |
|
|
2016 |
|
||
|
Balance as of January 1 |
|
$ |
683,683 |
|
|
$ |
687,404 |
|
|
Goodwill resulting from the Trade NTE business combination |
|
|
— |
|
|
|
191 |
|
|
Goodwill resulting from the Mostra business combination |
|
|
— |
|
|
|
654 |
|
|
Goodwill resulting from the Olson business combination |
|
|
— |
|
|
|
267 |
|
|
Effect of foreign currency translation |
|
|
2,425 |
|
|
|
(4,833 |
) |
|
Total goodwill |
|
$ |
686,108 |
|
|
$ |
683,683 |
|
Other Intangible Assets
Intangible assets with definite lives are primarily amortized over periods ranging from approximately 4 to 10 years. The weighted-average period of amortization for all intangible assets as of December 31, 2017 is 9.1 years. The customer-related intangible assets, which consist of customer contracts, backlog, and non-contractual customer relationships, are being amortized based on estimated cash flows and respective estimated economic benefit of the assets. The weighted-average period of amortization of the customer-related intangibles is 9.1 years. Intangible assets related to developed technology are being amortized on an accelerated basis over a weighted-average period of 5.5 years. Intangible assets with an indefinite life consist of a domain name.
Other intangibles consisted of the following at December 31:
|
|
|
2017 |
|
|||||||||
|
|
|
Gross Carrying Value |
|
|
Accumulated Amortization |
|
|
Net Carrying Value |
|
|||
|
Customer-related |
|
$ |
84,878 |
|
|
$ |
(49,782 |
) |
|
$ |
35,096 |
|
|
Developed technology |
|
|
1,463 |
|
|
|
(1,350 |
) |
|
|
113 |
|
|
Total amortizable intangible assets |
|
|
86,341 |
|
|
|
(51,132 |
) |
|
|
35,209 |
|
|
Intangible with indefinite life |
|
|
95 |
|
|
|
— |
|
|
|
95 |
|
|
Total other intangible assets |
|
$ |
86,436 |
|
|
$ |
(51,132 |
) |
|
$ |
35,304 |
|
|
|
|
2016 |
|
|||||||||
|
|
|
Gross Carrying Value |
|
|
Accumulated Amortization |
|
|
Net Carrying Value |
|
|||
|
Customer-related |
|
$ |
115,806 |
|
|
$ |
(70,090 |
) |
|
$ |
45,716 |
|
|
Developed technology |
|
|
1,463 |
|
|
|
(1,145 |
) |
|
|
318 |
|
|
Total amortizable intangible assets |
|
|
117,269 |
|
|
|
(71,235 |
) |
|
|
46,034 |
|
|
Intangible with indefinite life |
|
|
95 |
|
|
|
— |
|
|
|
95 |
|
|
Total other intangible assets |
|
$ |
117,364 |
|
|
$ |
(71,235 |
) |
|
$ |
46,129 |
|
F-15
Aggregate amortization expense for the years ended December 31, 2017, 2016, and 2015, was approximately $10.9 million, $12.5 million, and $17.2 million, respectively. The estimated future amortization expense relating to intangible assets is as follows:
|
|
|
|||
|
Year ending December 31, |
|
|
|
|
|
2018 |
|
$ |
8,441 |
|
|
2019 |
|
|
6,132 |
|
|
2020 |
|
|
4,532 |
|
|
2021 |
|
|
4,082 |
|
|
2022 |
|
|
4,125 |
|
|
Thereafter |
|
|
7,897 |
|
|
Total |
|
$ |
35,209 |
|
NOTE 6—ACCRUED SALARIES AND BENEFITS
Accrued salaries and benefits consisted of the following at December 31:
|
|
|
2017 |
|
|
2016 |
|
||
|
Accrued paid time off and leave |
|
$ |
11,904 |
|
|
$ |
11,342 |
|
|
Accrued salaries |
|
|
9,343 |
|
|
|
9,443 |
|
|
Accrued bonuses, liability-classified awards and commissions |
|
|
16,909 |
|
|
|
13,025 |
|
|
Accrued payroll taxes and withholdings |
|
|
2,557 |
|
|
|
1,948 |
|
|
Accrued medical |
|
|
3,720 |
|
|
|
3,026 |
|
|
Other |
|
|
1,212 |
|
|
|
979 |
|
|
Total accrued salaries and benefits |
|
$ |
45,645 |
|
|
$ |
39,763 |
|
NOTE 7—ACCRUED EXPENSES AND OTHER CURRENT LIABILITIES
Accrued expenses and other current liabilities consisted of the following at December 31:
|
|
|
2017 |
|
|
2016 |
|
||
|
Accrued subcontractor and other direct costs |
|
$ |
47,508 |
|
|
$ |
30,153 |
|
|
Deposits |
|
|
6,641 |
|
|
|
12,389 |
|
|
Accrued IT and software licensing costs |
|
|
2,261 |
|
|
|
5,349 |
|
|
Accrued taxes and insurance premiums |
|
|
1,963 |
|
|
|
1,306 |
|
|
Accrued lease exit and facilities costs |
|
|
1,591 |
|
|
|
77 |
|
|
Accrued interest |
|
|
705 |
|
|
|
841 |
|
|
Accrued professional services |
|
|
1,131 |
|
|
|
795 |
|
|
Other accrued expenses and current liabilities |
|
|
3,280 |
|
|
|
1,721 |
|
|
Total accrued expenses and other current liabilities |
|
$ |
65,080 |
|
|
$ |
52,631 |
|
NOTE 8—LONG-TERM DEBT
On May 17, 2017, the Company entered into a Fifth Amended and Restated Business Loan and Security Agreement with a syndication of 11 commercial banks (the “Credit Facility”). The Credit Facility: (i) includes modifications to the Company’s Fourth Amended and Restated Business Loan and Security Agreement, (ii) matures on May 17, 2022, (iii) increases the borrowing ceiling up to $600.0 million without a borrowing base requirement, taking into account financial, performance-based limitations, and (iv) provides for an “accordion,” which permits additional revolving credit commitments of up to $300.0 million, subject to lenders’ approval. While the modification of the Credit Facility did not increase the amount of outstanding, $106.0 million of funds from new syndicated borrowings was used to pay off or pay down borrowings from syndicate members prior to the loan modification and align the allocation of debt within the syndicate. These amounts were included within the “Advances from working capital facilities” and “Payments on working capital facilities” line items in the statement of cash flows for the year ended December 31, 2017.
F-16
The Company has the option to borrow funds under the Credit Facility at interest rates based on both LIBOR (1, 3, or 6 month rates) and the Base Rate, at its discretion, plus their applicable margins. Base Rates are fluctuating per annum rates of interest equal to the highest of (i) the Federal Funds Open Rate, plus 0.5%, (ii) the Prime Rate, and (iii) the daily LIBOR rate, plus a LIBOR Margin of between 1.00% and 2.00% based on our Leverage Ratio (as defined under the Credit Facility), 1.25% as of December 31, 2017. The interest accrued based on LIBOR rates is to be paid on the last business day of the interest period (1, 3, or 6 months), while interest accrued based on the Base Rates is to be paid in quarterly installments. The Credit Facility provides for letters of credit aggregating up to $60.0 million which reduce the funds available under the Credit Facility when issued. The Credit Facility is collateralized by substantially all of the assets of the Company and requires that the Company remain in compliance with certain financial and non-financial covenants. The financial covenants require, among other things, that the Company maintain at all times an Interest Coverage Ratio (as defined under the Credit Facility) of not less than 3.00 to 1.00 and a Leverage Ratio of not more than 3.75 to 1.00 (subject to adjustment, in certain circumstances) for each fiscal quarter. As of December 31, 2017, the Company was in compliance with its covenants under the Credit Facility.
The Credit Facility was subject to a commitment fee on the unused portion of the Credit Facility of between 0.13% and 0.25% per annum, based on our Leverage Ratio, 0.15% per annum at December 31, 2017 and 0.25% per annum at December 31, 2016.
As of December 31, 2017, the available borrowing capacity under the Credit Facility (excluding the accordion) was $390.0 million. Taking into account the financial and performance-based limitations, the available borrowing capacity (excluding the accordion) was $245.1 million as of December 31, 2017.
Long-term debt outstanding and the weighted average interest rate at December 31 is summarized as follows:
|
|
|
2017 |
|
|
2016 |
|
||||||||||
|
|
|
Debt Outstanding |
|
|
Weighted Average Interest Rate |
|
|
Debt Outstanding |
|
|
Weighted Average Interest Rate |
|
||||
|
Revolving Line of Credit/Swing Line |
|
$ |
206,250 |
|
|
|
2.65 |
% |
|
$ |
259,389 |
|
|
|
2.46 |
% |
Debt Issuance Cost
The Company’s debt issuance costs, which are included within other assets, are amortized over the term of indebtedness. Amortizable debt issuance costs were $6.9 million and $5.8 million as of December 31, 2017 and 2016, respectively. Accumulated amortization related to debt issuance costs were $4.7 million and $4.5 million, as of December 31, 2017 and 2016, respectively. Amortization expense of $0.7 million, $0.5 million, and $0.5 million was recorded for each of the years ended December 31, 2017, 2016, and 2015, respectively. The Company incurred $1.6 million in debt issuance costs for the year ended December 31, 2017.
Letters of Credit
At December 31, 2017 and 2016, the Company had twelve and nine outstanding letters of credit totaling approximately $3.7 million and $3.4 million, respectively. These letters of credit are renewed annually.
NOTE 9—DERIVATIVE INSTRUMENTS AND HEDGING ACTIVITIES
On August 31, 2017, the Company entered into a floating-to-fixed interest rate swap agreement for an aggregate notional amount of $25.0 million which hedged a portion of the Company’s floating rate indebtedness. The swap agreement requires the Company to pay a fixed rate of 1.8475% per annum plus the applicable margin pursuant to the Credit Facility. Notwithstanding the terms of the interest rate swap transaction, the Company is ultimately obligated for all amounts due and payable under the Credit Facility. The cash flows from the transaction begin August 31, 2018 and end on August 31, 2023. The Company has designated the swap as a cash flow hedge. On a quarterly basis, management evaluates the swap to determine its effectiveness or ineffectiveness. Management intends that the swap remain effective. Realized gains and losses in connection with each required interest payment will be reclassified from AOCI to interest expense.
On September 30, 2016, the Company entered into a floating-to-fixed interest rate hedge agreement for an aggregate notional amount of $100.0 million which hedged a portion of the Company’s floating rate indebtedness. The cash flows from the interest rate swap agreement begin on January 31, 2018 and end on January 31, 2023. The Company designated the swap as a cash flow hedge. On December 1, 2016, the Company sold the interest rate hedge agreement. The fair value of the interest rate hedge, as of the date of the sale, was recorded in other comprehensive income, net of tax. The gain from the sale will be recognized into earnings when earnings are impacted by the cash flows of the previously hedged items, as interest payments are made on the Credit Facility from January 31, 2018 to January 31, 2023.
As of December 31, 2017, the net amount of realized gains and losses from the hedge agreements expected to be reclassified from AOCI into earnings within the next 12 months is $0.7 million. The Company uses interest rate swap arrangements to manage or hedge its interest rate risk. The Company does not use such instruments for speculative or trading purposes.
F-17
NOTE 10—INCOME TAXES
The domestic and foreign components of income before provision for income taxes are as follows for the years ended December 31:
|
|
|
2017 |
|
|
2016 |
|
|
2015 |
|
|||
|
Domestic |
|
$ |
69,347 |
|
|
$ |
69,159 |
|
|
$ |
54,150 |
|
|
Foreign |
|
|
4,639 |
|
|
|
5,348 |
|
|
|
9,450 |
|
|
Income before income taxes |
|
$ |
73,986 |
|
|
$ |
74,507 |
|
|
$ |
63,600 |
|
Income tax expense consisted of the following for the years ended December 31:
|
|
|
2017 |
|
|
2016 |
|
|
2015 |
|
|||
|
Current: |
|
|
|
|
|
|
|
|
|
|
|
|
|
Federal |
|
$ |
12,995 |
|
|
$ |
12,979 |
|
|
$ |
14,797 |
|
|
State |
|
|
3,243 |
|
|
|
3,514 |
|
|
|
2,669 |
|
|
Foreign |
|
|
1,476 |
|
|
|
1,932 |
|
|
|
1,475 |
|
|
Total current |
|
|
17,714 |
|
|
|
18,425 |
|
|
|
18,941 |
|
|
Deferred: |
|
|
|
|
|
|
|
|
|
|
|
|
|
Federal |
|
|
(9,425 |
) |
|
|
8,872 |
|
|
|
4,562 |
|
|
State |
|
|
2,749 |
|
|
|
1,222 |
|
|
|
512 |
|
|
Foreign |
|
|
72 |
|
|
|
(596 |
) |
|
|
216 |
|
|
Total deferred |
|
|
(6,604 |
) |
|
|
9,498 |
|
|
|
5,290 |
|
|
Income tax expense |
|
$ |
11,110 |
|
|
$ |
27,923 |
|
|
$ |
24,231 |
|
Deferred income taxes reflect the net tax effects of temporary differences between the carrying amounts of assets and liabilities for financial reporting purposes and income tax purposes.
F-18
Deferred tax assets (liabilities) consisted of the following at December 31:
|
|
|
2017 |
|
|
2016 |
|
||
|
Deferred Tax Assets |
|
|
|
|
|
|
|
|
|
Allowance for bad debt |
|
$ |
1,003 |
|
|
$ |
1,008 |
|
|
Accrued paid time off |
|
|
1,624 |
|
|
|
2,592 |
|
|
Accrued bonus |
|
|
— |
|
|
|
55 |
|
|
Foreign net operating loss (NOL) carry forward |
|
|
1,301 |
|
|
|
1,371 |
|
|
Federal/state net operating loss (NOL) carry forward |
|
|
507 |
|
|
|
3,010 |
|
|
Stock option compensation |
|
|
2,726 |
|
|
|
4,292 |
|
|
Deferred rent |
|
|
3,355 |
|
|
|
5,423 |
|
|
Deferred compensation |
|
|
3,238 |
|
|
|
3,662 |
|
|
Foreign tax credits |
|
|
505 |
|
|
|
2,631 |
|
|
State tax credits |
|
|
1,785 |
|
|
|
1,784 |
|
|
Federal tax credits |
|
|
— |
|
|
|
225 |
|
|
Foreign exchange |
|
|
2,051 |
|
|
|
5,349 |
|
|
Accrued liabilities and other |
|
|
3,272 |
|
|
|
3,378 |
|
|
|
|
|
21,367 |
|
|
|
34,780 |
|
|
Less: Valuation Allowance |
|
|
(1,636 |
) |
|
|
(1,131 |
) |
|
Total Deferred Tax Assets |
|
|
19,731 |
|
|
|
33,649 |
|
|
|
|
|
|
|
|
|
|
|
|
Deferred Tax Liabilities |
|
|
|
|
|
|
|
|
|
Retention |
|
|
(1,375 |
) |
|
|
(1,684 |
) |
|
Prepaid expenses |
|
|
(1,045 |
) |
|
|
(1,654 |
) |
|
Payroll taxes |
|
|
(489 |
) |
|
|
(617 |
) |
|
Unbilled revenue |
|
|
(5,407 |
) |
|
|
(8,728 |
) |
|
Depreciation |
|
|
(4,773 |
) |
|
|
(6,664 |
) |
|
Amortization |
|
|
(39,993 |
) |
|
|
(51,842 |
) |
|
Deferred gain and other |
|
|
— |
|
|
|
(1,574 |
) |
|
Total Deferred Tax Liabilities |
|
|
(53,082 |
) |
|
|
(72,763 |
) |
|
Total Net Deferred Tax Liability |
|
$ |
(33,351 |
) |
|
$ |
(39,114 |
) |
On December 20, 2017, the U.S. Congress passed the “Tax Cuts and Jobs Act” (the “Tax Act”), which was signed into law on December 22, 2017 and is generally effective beginning January 1, 2018. The Company will be impacted in several ways as a result of the Tax Act, including, but not limited to, provisions which include a permanent reduction in the U.S. federal corporate income tax rate from 35% to 21%, the revaluation of deferred tax assets and liabilities required as a result of the tax rate change and the application of a mandatory one-time “transition tax” on unremitted earnings of certain foreign subsidiaries that were previously tax deferred.
The Company has not completed the accounting for the tax effects of enactment of the Tax Act; however, in certain cases, as described below, the Company has made a provisional estimate of the effects on our existing deferred tax balances and the one-time transition tax. The Company has recognized the provisional estimate as a reduction in the provision for income taxes, which is included as a component of income tax expense from continuing operations.
The Company re-measured certain deferred tax assets and liabilities based on the rates at which they are expected to reverse in the future, which is generally 21%. However, the Company is still analyzing certain aspects of the Tax Act and refining estimates, which could potentially affect the measurement of these balances or potentially give rise to new deferred tax amounts. Pursuant to SAB 118, the provisional amount recorded related to the re-measurement of the deferred tax balances was a net tax benefit of $17.6 million.
The one-time “transition tax” is based on the Company’s total post-1986 earnings and profits (E&P) which the Company has previously deferred from US income taxation. Pursuant to SAB 118, the Company recorded a provisional estimate of approximately $1.4 million, net of related foreign tax credits, for the one-time transition tax liability for the Company’s foreign subsidiaries, resulting in an increase in income tax expense. The Company has not yet completed the calculation of the total post-1986 foreign E&P and related foreign tax pools for these foreign subsidiaries. Further, the transition tax is based in part on the amount of those earnings held in cash and other specified assets. This amount, as well as the related foreign tax credit utilization, may change when the Company finalizes the calculation of post-1986 foreign E&P and related foreign tax pools that were previously deferred from US federal taxation and once the Company finalizes the amounts held in cash or other specified assets. Similarly, our cumulative foreign tax credit carry forward balance as of December 31, 2017 and any valuation allowance required (as applicable) may also change. No additional income taxes have been provided for any remaining undistributed foreign earnings not subject to the transition tax and any
F-19
additional outside basis difference inherent in these entities as these amounts continue to be permanently reinvested in foreign operations. The impact of the transition tax is a preliminary estimate and will not be finalized until the later part of 2018.
At both December 31, 2017 and 2016, the Company had net operating loss (“NOL”) carry-forwards for foreign income taxes of approximately $4.1 million and $4.1 million, respectively, all of which may be carried forward indefinitely.
At December 31, 2017, the Company had NOL carry-forwards for state income tax purposes of approximately $8.5 million, which expire in 2034. The Company acquired these NOLs as a result of its purchase of Olson in November 2014. Internal Revenue Code Section 382 imposes an annual limitation on the use of a corporation’s NOLs, tax credits and other carryovers after an “ownership change” occurs. Section 382 imposes an annual limitation on the amount of post-ownership change taxable income a corporation may offset with pre-ownership change NOLs and credits. In general, the annual limitation is determined by multiplying the value of the corporation’s stock immediately before the ownership change (subject to certain adjustments) by the applicable long-term tax-exempt rate. Any unused portion of the annual limitation is available for use in future years until such NOLs are scheduled to expire (in general, NOLs may be carried forward 20 years). The Company presently estimates that it will be able to fully utilize the remaining acquired NOLs prior to their expiration.
At December 31, 2017, the Company had gross state income tax credit carry-forwards of approximately $2.8 million, which expire between 2017 and 2026. A deferred tax asset of approximately $1.8 million (net of federal benefit) has been established related to these state income tax credit carry-forwards as of December 31, 2017.
The need to establish valuation allowances for deferred assets is based on a more-likely-than-not threshold that the benefit of such assets will be realized in future periods. Appropriate consideration has been given to all available evidence, including historical operating results, projections of taxable income, and tax planning alternatives. The Company concluded that a valuation allowance of approximately $1.1 million and $1.1 million was required for tax attributes related to specified foreign jurisdictions as of December 31, 2017 and 2016, respectively, and an additional $0.5 million valuation allowance was recorded against our US foreign tax credit carry forwards as a result of enactment of the Tax Act as of December 31, 2017. Due to the interplay of the “transition tax” referenced above and the utilization of foreign tax credits, the amount of valuation allowance recorded against our US foreign tax credit carry forwards as of December 31, 2017 is subject to change once the Company finalizes its calculations.
The total amount of unrecognized tax benefits as of December 31, 2017 and 2016, was $0.8 million and $1.2 million, respectively. Included in the balance as of December 31, 2017 and 2016, were $0.7 million and $1.0 million, respectively, of tax positions that, if recognized, would impact the effective tax rate.
The unrecognized tax benefit reconciliation, excluding penalty and interest, is as follows:
|
Unrecognized tax benefits at January 1, 2015 |
|
$ |
702 |
|
|
Decrease attributable to settlements |
|
|
(174 |
) |
|
Increase attributable to tax positions taken during a prior period |
|
|
12 |
|
|
Decrease attributable to lapse of statute of limitations |
|
|
(140 |
) |
|
Unrecognized tax benefits at December 31, 2015 |
|
400 |
|
|
|
Increase attributable to tax positions taken during a prior period |
|
|
925 |
|
|
Decrease attributable to lapse of statute of limitations |
|
|
(140 |
) |
|
Unrecognized tax benefits at December 31, 2016 |
|
|
1,185 |
|
|
Decrease attributable to lapse of statute of limitations |
|
|
(365 |
) |
|
Unrecognized tax benefits at December 31, 2017 |
|
$ |
820 |
|
The Company’s policy is not to recognize accrued interest and penalties related to unrecognized tax benefits as a component of tax expense. The Company had approximately $0.2 million and $0.2 million of accrued penalty and interest at December 31, 2017 and 2016, respectively.
The Company’s 2013 to 2016 tax years remain subject to examination by the Internal Revenue Service for federal tax purposes. Certain significant state and foreign tax jurisdictions are also either currently under examination or remain open under the statutes of limitation and subject to examination for the tax years from 2013 to 2016.
Although the Company believes it has adequately provided for all uncertain tax positions, amounts asserted by taxing authorities could be greater than the Company’s accrued position. Accordingly, additional provisions on federal, state and foreign income tax related matters could be recorded in the future as revised estimates are made or the underlying matters are effectively settled or otherwise resolved. Conversely, the Company could settle positions with the tax authorities for amounts lower than have been accrued. The Company believes it is reasonably possible that, during the next 12 months, the Company’s liability for uncertain tax positions may decrease by approximately $0.7 million.
F-20
The Company’s provision for income taxes differs from the federal statutory rate. The differences between the statutory rate and the Company’s provision are as follows:
|
|
|
2017 |
|
|
2016 |
|
|
2015 |
|
|||
|
Taxes at statutory rate |
|
|
35.0 |
% |
|
|
35.0 |
% |
|
|
35.0 |
% |
|
State taxes, net of federal benefit |
|
|
4.4 |
% |
|
|
3.9 |
% |
|
|
3.9 |
% |
|
Foreign tax rate differential |
|
|
(0.3 |
)% |
|
|
(0.1 |
)% |
|
|
(0.3 |
)% |
|
Tax legislation |
|
|
(22.6 |
)% |
|
|
— |
|
|
|
— |
|
|
Other permanent differences |
|
|
0.7 |
% |
|
|
0.8 |
% |
|
|
1.9 |
% |
|
Prior year tax adjustments |
|
|
(0.3 |
)% |
|
|
(1.0 |
)% |
|
|
(1.9 |
)% |
|
Unrecognized tax benefits |
|
|
0.1 |
% |
|
|
1.0 |
% |
|
|
— |
|
|
Valuation allowance |
|
|
0.7 |
% |
|
|
(0.3 |
)% |
|
|
— |
|
|
Equity-based compensation |
|
|
(2.1 |
)% |
|
|
(1.0 |
)% |
|
|
— |
|
|
Tax credits |
|
|
(0.6 |
)% |
|
|
(0.8 |
)% |
|
|
(0.5 |
)% |
|
Taxes at effective rate |
|
|
15.0 |
% |
|
|
37.5 |
% |
|
|
38.1 |
% |
NOTE 11—ACCUMULATED OTHER COMPREHENSIVE LOSS
As of December 31, 2017 and 2016, accumulated other comprehensive loss, net of tax, included the following:
|
|
|
2017 |
|
|
2016 |
|
||
|
Foreign currency translation adjustments |
|
$ |
7,638 |
|
|
$ |
11,815 |
|
|
Gain on sale of interest rate hedge agreement (1) |
|
|
(2,158 |
) |
|
|
(2,175 |
) |
|
Change in fair value on derivative designated as cash flow hedge(2) |
|
|
(441 |
) |
|
|
— |
|
|
Total |
|
$ |
5,039 |
|
|
$ |
9,640 |
|
|
(1) |
Represents the fair value of an interest rate hedge agreement, designated as a cash flow hedge, which was sold on December 1, 2016. The fair value of the interest rate hedge agreement was recorded in other comprehensive income, net of tax, and will be reclassified to earnings when earnings are impacted by the hedged items, as interest payments are made on the Credit Facility from January 31, 2018 to January 31, 2023. See additional details of the hedge agreement in Note 9—Derivative Instruments and Hedging Activities. |
|
(2) |
Represents the change in fair value of an interest rate hedge agreement designated as a cash flow hedge, and entered into on August 31, 2017. The fair value of the interest rate hedge agreement was recorded in other comprehensive income and will be reclassified to earnings when earnings are impacted by the hedged items, as interest payments are made on the Credit Facility from August 31, 2018 to August 31, 2023. See additional details of the hedge agreement in Note 9—Derivative Instruments and Hedging Activities. |
NOTE 12—RESTRICTED CASH
The following table provides a reconciliation of cash and cash equivalents, and restricted cash reported within the consolidated balance sheets at December 31, 2017 and 2016 to the total cash, cash equivalents, and restricted cash shown in the consolidated statements of cash flows for the years ended December 31, 2017, 2016, and 2015:
|
|
|
2017 |
|
|
2016 |
|
|
2015 |
|
|||||||||||||||
|
|
|
Beginning |
|
|
Ending |
|
|
Beginning |
|
|
Ending |
|
|
Beginning |
|
|
Ending |
|
||||||
|
Cash and cash equivalents |
|
$ |
6,042 |
|
|
$ |
11,809 |
|
|
$ |
7,747 |
|
|
$ |
6,042 |
|
|
$ |
12,122 |
|
|
$ |
7,747 |
|
|
Restricted cash - current (1) |
|
|
— |
|
|
|
11,191 |
|
|
|
— |
|
|
|
— |
|
|
|
— |
|
|
|
— |
|
|
Restricted cash - non-current |
|
|
1,843 |
|
|
|
1,266 |
|
|
|
1,362 |
|
|
|
1,843 |
|
|
|
1,478 |
|
|
|
1,362 |
|
|
Total cash, cash equivalents, and restricted cash shown in the consolidated statement of cash flows |
|
$ |
7,885 |
|
|
$ |
24,266 |
|
|
$ |
9,109 |
|
|
$ |
7,885 |
|
|
$ |
13,600 |
|
|
$ |
9,109 |
|
|
(1) |
Restricted cash – current for the year ended December 31, 2017 represents amounts held in an escrow account for a future acquisition. See Note 19 – Subsequent Events. |
F-21
NOTE 13—ACCOUNTING FOR STOCK-BASED COMPENSATION
Stock Incentive Plans
On June 5, 2015, the Company’s stockholders approved an amendment (the “Amendment”) to the ICF International, Inc. 2010 Omnibus Incentive Plan (as amended, the “Omnibus Plan”). The Amendment, among other items, increased the new shares available for issuance under the Omnibus Plan by 1,540,000 shares from 3,550,000 to 5,090,000 (for an aggregate 5,966,186 shares, which includes shares that remained available under the 2006 Long-Term Equity Incentive Plan when the Omnibus Plan was initially adopted). The Omnibus Plan provides for the granting of options, stock appreciation rights, restricted stock, restricted stock units, performance shares, performance units, cash-based awards, and other stock-based awards to all officers, key employees, and non-employee directors of the Company. Under the terms of the Omnibus Plan, shares awarded that are not stock options or stock appreciation rights, are counted as 1.93 shares deducted for every one share delivered under those awards. Shares awarded that are stock options or stock appreciation rights are counted as a single share deducted from the Omnibus Plan for every one share delivered under those awards. As of December 31, 2017, the Company had approximately 1.9 million shares available to grant under the Amended Plan. CSRSUs have no impact on the shares available for grant under the Omnibus Plan, and have no impact on the calculated shares used in earnings per share calculations.
The total stock-based compensation expense for the years ended December 31, 2017, 2016, and 2015, the unrecognized compensation expense at December 31, 2017, and the weighted-average period to recognize the remaining unrecognized shares are as follows:
|
|
|
Stock-Based Compensation Expense |
|
|||||||||||||||||
|
|
|
Recognized as of December 31, |
|
|
Unrecognized |
|
||||||||||||||
|
|
|
2017 |
|
|
2016 |
|
|
2015 |
|
|
December 31, 2017 |
|
|
Weighted-Average Period to Recognize (years) |
|
|||||
|
Stock Options |
|
$ |
164 |
|
|
$ |
909 |
|
|
$ |
1,546 |
|
|
$ |
— |
|
|
|
— |
|
|
Restricted Stock Units |
|
|
7,080 |
|
|
|
6,325 |
|
|
|
7,409 |
|
|
|
12,659 |
|
|
|
1.9 |
|
|
Cash-Settled Restricted Stock Units |
|
|
7,253 |
|
|
|
7,091 |
|
|
|
4,414 |
|
|
|
13,922 |
|
|
|
1.9 |
|
|
Non-Employee Director Awards |
|
|
671 |
|
|
|
741 |
|
|
|
645 |
|
|
|
— |
|
|
|
— |
|
|
Performance Shares |
|
|
2,376 |
|
|
|
877 |
|
|
|
727 |
|
|
|
2,717 |
|
|
|
1.5 |
|
|
Total |
|
$ |
17,544 |
|
|
$ |
15,943 |
|
|
$ |
14,741 |
|
|
$ |
29,298 |
|
|
|
|
|
The assumptions of employment termination forfeiture rates used in the determination of fair value of stock awards during the 2017 calendar year were based on the Company’s historical average of actual forfeitures from the previous 5 years preceding the reporting period. The expected annualized forfeiture rates used during the 2017 calendar year varied from 1.86% to 19.51%, and the Company does not expect these termination rates to vary significantly in the future.
F-22
Stock Options
Option awards are granted with an exercise price equal to the market value of the Company’s common stock on the date of grant. All options outstanding as of December 31, 2017 have a 10-year contractual term. Options generally have a vesting term of three or four years. There were no option awards granted during 2017, 2016, and 2015.
The following table summarizes the changes in outstanding stock options:
|
|
|
Number of Shares |
|
|
Weighted Average Exercise Price |
|
|
Aggregate Intrinsic Value |
|
|||
|
Outstanding at January 1, 2015 |
|
|
766,924 |
|
|
$ |
28.20 |
|
|
|
|
|
|
Exercised |
|
|
(43,919 |
) |
|
$ |
21.23 |
|
|
|
|
|
|
Granted |
|
|
— |
|
|
$ |
— |
|
|
|
|
|
|
Forfeited/Expired |
|
|
— |
|
|
$ |
— |
|
|
|
|
|
|
Outstanding at December 31, 2015 |
|
|
723,005 |
|
|
$ |
28.62 |
|
|
|
|
|
|
Exercised |
|
|
(128,301 |
) |
|
$ |
23.65 |
|
|
|
|
|
|
Granted |
|
— |
|
|
$ |
— |
|
|
|
|
|
|
|
Forfeited/Expired |
|
|
(7,297 |
) |
|
$ |
40.68 |
|
|
|
|
|
|
Outstanding at December 31, 2016 |
|
|
587,407 |
|
|
$ |
29.56 |
|
|
|
|
|
|
Exercised |
|
|
(175,909 |
) |
|
$ |
26.84 |
|
|
|
|
|
|
Granted |
|
|
— |
|
|
$ |
— |
|
|
|
|
|
|
Forfeited/Expired |
|
|
— |
|
|
$ |
— |
|
|
|
|
|
|
Outstanding at December 31, 2017 |
|
|
411,498 |
|
|
$ |
30.71 |
|
|
$ |
8,965 |
|
|
|
|
|
|
|
|
|
|
|
|
|
|
|
|
Vested plus expected to vest at December 31, 2017 |
|
|
411,498 |
|
|
$ |
30.71 |
|
|
$ |
8,965 |
|
|
Exercisable at December 31, 2017 |
|
|
411,498 |
|
|
$ |
30.71 |
|
|
$ |
8,965 |
|
The aggregate intrinsic value in the preceding table is based on the Company’s closing stock price of $52.50 as of December 31, 2017. The total intrinsic value of options exercised was $4.5 million, $2.5 million, and $0.8 million for the years ended December 31, 2017, 2016, and 2015, respectively. The fair value of shares vested was $1.9 million, $1.3 million, and $2.0 million for the years ended December 31, 2017, 2016, and 2015, respectively. As of December 31, 2017, the weighted-average remaining contractual term for options vested was 5.0 years and for exercisable options was 5.0 years.
Information regarding stock options outstanding as of December 31, 2017 is summarized below:
|
|
|
OPTIONS OUTSTANDING |
|
|
OPTIONS EXERCISABLE |
|
||||||||||||||
|
Range of Exercise Prices |
|
Number Outstanding As of December 31, 2017 |
|
|
Weighted Average Remaining Contractual Term |
|
|
Weighted Average Exercise Price |
|
|
Number Exercisable As of December 31, 2017 |
|
|
Weighted Average Exercise Price |
|
|||||
|
$21.77 to $25.00 |
|
|
62,917 |
|
|
|
3.3 |
|
|
$ |
21.77 |
|
|
|
62,917 |
|
|
$ |
21.77 |
|
|
$25.01 to $28.00 |
|
|
205,332 |
|
|
|
4.8 |
|
|
$ |
26.50 |
|
|
|
205,332 |
|
|
$ |
26.50 |
|
|
$28.01 to $40.68 |
|
|
143,249 |
|
|
|
6.1 |
|
|
$ |
40.68 |
|
|
|
143,249 |
|
|
$ |
40.68 |
|
|
$21.77 to $41.00 |
|
|
411,498 |
|
|
|
5.0 |
|
|
$ |
30.71 |
|
|
|
411,498 |
|
|
$ |
30.71 |
|
Restricted Stock Units
RSUs generally have a vesting term of three or four years. On vesting the employee is issued one share of stock for each RSU awarded. The fair value of shares vested was $6.3 million, $7.2 million, and $6.3 million for the years ended December 31, 2017, 2016, and 2015, respectively.
F-23
A summary of the Company’s RSUs is presented below.
|
|
|
Number of Shares |
|
|
Weighted- Average Grant Date Fair Value |
|
|
Aggregate Intrinsic Value |
|
|||
|
Non-vested RSUs at January 1, 2015 |
|
|
643,887 |
|
|
$ |
31.10 |
|
|
|
|
|
|
Granted |
|
|
250,159 |
|
|
$ |
39.04 |
|
|
|
|
|
|
Vested |
|
|
(233,899 |
) |
|
$ |
26.85 |
|
|
|
|
|
|
Cancelled |
|
|
(104,243 |
) |
|
$ |
36.76 |
|
|
|
|
|
|
Non-vested RSUs at December 31, 2015 |
|
|
555,904 |
|
|
$ |
35.40 |
|
|
|
|
|
|
Granted |
|
|
240,868 |
|
|
$ |
34.68 |
|
|
|
|
|
|
Vested |
|
|
(221,659 |
) |
|
$ |
32.45 |
|
|
|
|
|
|
Cancelled |
|
|
(67,115 |
) |
|
$ |
37.60 |
|
|
|
|
|
|
Non-vested RSUs at December 31, 2016 |
|
|
507,998 |
|
|
$ |
36.12 |
|
|
|
|
|
|
Granted |
|
|
194,227 |
|
|
$ |
41.41 |
|
|
|
|
|
|
Vested |
|
|
(179,974 |
) |
|
$ |
35.19 |
|
|
|
|
|
|
Cancelled |
|
|
(58,664 |
) |
|
$ |
36.04 |
|
|
|
|
|
|
Non-vested RSUs at December 31, 2017 |
|
|
463,587 |
|
|
$ |
38.71 |
|
|
$ |
24,338 |
|
|
RSUs expected to vest in the future |
|
|
463,587 |
|
|
$ |
38.71 |
|
|
$ |
24,338 |
|
The aggregate intrinsic value in the preceding table is based on the Company’s closing stock price of $52.50 per share as of December 31, 2017.
Cash-Settled Restricted Stock Units
CSRSUs generally have a vesting term of four years. A summary of the Company’s CSRSUs is presented below.
|
|
|
Number of Shares |
|
|
Weighted- Average Grant Date Fair Value |
|
|
Aggregate Intrinsic Value |
|
|||
|
Non-vested CSRSUs at January 1, 2015 |
|
|
537,119 |
|
|
$ |
36.36 |
|
|
|
|
|
|
Granted |
|
|
121,015 |
|
|
$ |
39.35 |
|
|
|
|
|
|
Vested |
|
|
(78,033 |
) |
|
$ |
33.29 |
|
|
|
|
|
|
Cancelled |
|
|
(133,438 |
) |
|
$ |
38.14 |
|
|
|
|
|
|
Non-vested CSRSUs at December 31, 2015 |
|
|
446,663 |
|
|
$ |
37.18 |
|
|
|
|
|
|
Granted |
|
|
233,790 |
|
|
$ |
34.29 |
|
|
|
|
|
|
Vested |
|
|
(146,619 |
) |
|
$ |
34.70 |
|
|
|
|
|
|
Cancelled |
|
|
(70,812 |
) |
|
$ |
37.55 |
|
|
|
|
|
|
Non-vested CSRSUs at December 31, 2016 |
|
|
463,022 |
|
|
$ |
35.96 |
|
|
|
|
|
|
Granted |
|
|
174,419 |
|
|
$ |
42.06 |
|
|
|
|
|
|
Vested |
|
|
(161,576 |
) |
|
$ |
40.78 |
|
|
|
|
|
|
Cancelled |
|
|
(83,949 |
) |
|
$ |
36.43 |
|
|
|
|
|
|
Non-vested CSRSUs at December 31, 2017 |
|
|
391,916 |
|
|
$ |
38.80 |
|
|
$ |
20,576 |
|
|
CSRSUs expected to vest in the future |
|
|
391,916 |
|
|
$ |
38.80 |
|
|
$ |
20,576 |
|
The aggregate intrinsic value in the preceding table is based on the Company’s closing stock price of $52.50 per share as of December 31, 2017. The fair value of CSRSUs vested and settled in cash for the years ended December 31, 2017, 2016, and 2015 was $6.9 million, $5.9 million and $2.9 million, respectively.
F-24
Non-Employee Director Awards
The Company grants awards of unregistered shares to its non-employee directors on a quarterly basis under its Annual Equity Election. The awards are issued from the Company’s treasury stock and have no impact on the shares available for grant under the Omnibus Plan. Non-employee director awards do not include vesting conditions; thus, there was no unrecognized expense related to these awards at December 31, 2017.
A summary of the Company’s non-employee director awards granted by fiscal year is presented below.
|
For the Year ended December 31, |
|
Number of shares Granted |
|
|
Weighted- Average Grant Date Fair Value |
|
||
|
2015 |
|
|
18,109 |
|
|
$ |
35.62 |
|
|
2016 |
|
|
15,299 |
|
|
$ |
39.32 |
|
|
2017 |
|
|
13,861 |
|
|
$ |
48.41 |
|
Performance Share Awards
In the first quarter of 2015, the Company’s Board of Directors approved a performance-based share program (the “Program”) that provides for the issuance of PSAs to its senior management. Under the Program, the number of PSAs that the participant will receive depends on the Company’s achievement of two performance goals during two performance periods. The performance goals under the Program are based on (i) the Company’s compounded annual growth rate in earnings per share (“EPS”) during a two-year performance period and (ii) the Company’s cumulative total shareholder return (“rTSR”) relative to its peer group during a performance period from the first day of the performance period (typically January 1 of the year awarded) to the last day of the third year of the performance period (typically December 31). The PSAs will only be eligible to vest only following the expiration of the three-year performance period. Actual shares vested will be subject to both continued employment by the Company (barring certain exceptions allowing for partial performance periods) and actual financial measures achieved. The actual number of shares of common stock that will be issued to each participant at the end of the applicable performance period will be determined by multiplying the award by the product of two percentages, one based on the Company’s EPS performance and a second one based on the Company’s rTSR performance, subject to a minimum and maximum performance level. As of December 31, 2017, shares granted during 2015, 2016, and 2017 are within year three, two, and one of the performance period, respectively, and therefore have not vested.
A summary of the Company’s PSAs is presented below.
|
|
|
Number of Shares |
|
|
Weighted-Average Grant Date Fair Value |
|
|
Aggregate Intrinsic Value |
|
|||
|
Non-vested PSAs at January 1, 2015 |
|
|
— |
|
|
$ |
— |
|
|
|
|
|
|
Granted |
|
|
58,822 |
|
|
$ |
44.21 |
|
|
|
|
|
|
Vested |
|
|
— |
|
|
$ |
— |
|
|
|
|
|
|
Cancelled |
|
|
— |
|
|
$ |
— |
|
|
|
|
|
|
Non-vested PSAs at December 31, 2015 |
|
|
58,822 |
|
|
$ |
44.21 |
|
|
|
|
|
|
Granted |
|
|
74,574 |
|
|
$ |
37.75 |
|
|
|
|
|
|
Vested |
|
|
— |
|
|
$ |
— |
|
|
|
|
|
|
Cancelled |
|
|
(3,422 |
) |
|
$ |
41.61 |
|
|
|
|
|
|
Non-vested PSAs at December 31, 2016 |
|
|
129,974 |
|
|
$ |
40.57 |
|
|
|
|
|
|
Granted |
|
|
60,929 |
|
|
$ |
38.81 |
|
|
|
|
|
|
Vested |
|
|
— |
|
|
$ |
— |
|
|
|
|
|
|
Cancelled |
|
|
(3,881 |
) |
|
$ |
42.83 |
|
|
|
|
|
|
Non-vested PSAs at December 31, 2017 |
|
|
187,022 |
|
|
$ |
39.95 |
|
|
$ |
9,819 |
|
|
PSAs expected to vest in the future |
|
|
126,846 |
|
|
$ |
38.09 |
|
|
$ |
6,659 |
|
The aggregate intrinsic value in the preceding table is based on the Company’s closing stock price of $52.50 per share as of December 31, 2017. The fair value of the awards is estimated on the grant date using a Monte Carlo simulation model due to the market condition for the rTSR component. The fair value assumptions using the Monte Carlo simulation model for awards granted in 2017, 2016, and 2015 were 0.0% for dividend yields; 31.3%, 30.9% and 29.3% for historical volatility, respectively; and 1.5%, 1.0%, and 1.0% both risk-free rate of returns, respectively.
F-25
NOTE 14—EARNINGS PER SHARE
EPS is computed by dividing reported net income by the weighted-average number of shares outstanding. Diluted EPS considers the potential dilution that could occur if common stock equivalents of stock options, RSUs, and PSAs were exercised or converted into stock. PSAs are included in the computation of diluted shares only to the extent that the underlying performance conditions (i) are satisfied as of the end of the reporting period or (ii) would be considered satisfied if the end of the reporting period were the end of the related performance period and the result would be dilutive under the treasury stock method. For the years ended December 31, 2017, 2016, and 2015, there were 142, 163,564 and 167,849, respectively, weighted-average shares excluded from the calculation of EPS because they were anti-dilutive.
The dilutive effect of stock options, RSUs, and performance shares for each period reported is summarized below:
|
(in thousands) |
|
2017 |
|
|
2016 |
|
|
2015 |
|
|||
|
Basic weighted-average shares outstanding |
|
|
18,766 |
|
|
|
18,989 |
|
|
|
19,335 |
|
|
Effect of potential exercise of stock options, RSUs, and performance shares |
|
|
478 |
|
|
|
427 |
|
|
|
328 |
|
|
Diluted weighted-average shares outstanding |
|
|
19,244 |
|
|
|
19,416 |
|
|
|
19,663 |
|
NOTE 15—SHARE REPURCHASE PROGRAM
In the third quarter of 2015, the Company’s board of directors approved the share repurchase plan effective in November 2015 that extended the share repurchase plan through November 2017 and authorized share repurchases in the aggregate up to $75.0 million, not to exceed limits under the Credit Facility. As part of the Company’s modification of the Credit Facility, the prior Credit Facility limits on share repurchases were eliminated to permit unlimited share repurchases, provided the Company’s Leverage Ratio, prior to and after giving effect to such repurchases, is not greater than 3.25 to 1.00. During September 2017, the board of directors approved a new repurchase program and repurchase plan effective November 4, 2017 through November 4, 2019 with a limit of $100.0 million. The limitation under the Credit Facility remains unchanged.
Purchases under this program may be made from time to time at prevailing market prices in open market purchases or in privately negotiated transactions pursuant to Rules 10b5-1 and 10b-18 under the Exchange Act and in accordance with applicable insider trading and other securities laws and regulations. The purchases are funded from existing cash balances and/or borrowings, and the repurchased shares are held in treasury and used for general corporate purposes. The timing and extent to which the Company repurchases its shares will depend on market conditions and other corporate considerations at the Company’s sole discretion.
During the year ended December 31, 2017, the Company repurchased 684,335 shares at a total cost of $30.7 million under this program. As of December 31, 2017, approximately $100.0 million remained available under the share repurchase plan.
NOTE 16—FAIR VALUE
The Company measures and reports certain financial assets and liabilities at fair value in accordance with ASC 820, Fair Value Measurements and Disclosures (“ASC 820”). Fair value is defined as the price that would be received to sell an asset or paid to transfer a liability in an orderly transaction between market participants on the measurement date. Generally, fair value is based on observable quoted market prices or derived from observable market data when such market prices or data are available. ASC 820 establishes a three-level hierarchy used to estimate fair value by which each level is categorized based on the priority of the inputs used to measure fair value:
|
|
• |
Level 1: Quoted prices that are available in active markets for identical assets or liabilities; |
|
|
• |
Level 2: Quoted prices for similar assets or liabilities in active markets, quoted prices for identical or similar assets or liabilities in markets that are not active; inputs other than quoted prices that are observable for the asset or liability (e.g., interest rates and yield curves that are observable at commonly quoted intervals, and implied volatilities); and inputs derived principally from or corroborated by observable market data by correlation or other means; and |
|
|
• |
Level 3: Uses inputs that are unobservable and require the Company to make certain assumptions and require significant estimation and judgment from management to use in pricing the fair value of the assets and liabilities. |
As of December 31, 2017 and 2016, there were no assets or liabilities measured at Level 3 on a recurring basis.
Certain financial instruments, including cash and cash equivalents, contract receivables, and accounts payable are carried at cost, which, due to their short maturities, approximates their fair values at December 31, 2017 and 2016. The carrying value of other long-term liabilities related to capital expenditure obligations approximates their fair value at December 31, 2017 and 2016 based on the current rates offered to the Company for similar instruments with comparable maturities (Level 2). The Company believes the carrying value of its Credit Facility at December 31, 2017 and 2016 approximates the estimated fair value for debt with similar terms, interest rates, and remaining maturities currently available to companies with similar credit ratings (Level 2). The Company applies the provisions of ASC 820 to its assets and liabilities that are required to be measured at fair value pursuant to other accounting
F-26
standards, including assets and liabilities resulting from the Company’s nonqualified deferred compensation plan, interest rate swap agreement (see Note 9—Derivative Instruments and Hedging Activities), and foreign currency forward contract agreements not eligible for hedge accounting. The impact of the amounts recorded for the nonqualified deferred compensation plan, interest rate swap agreement, and the forward contract agreements was immaterial to the consolidated financial statements.
NOTE 17—COMMITMENTS AND CONTINGENCIES
Litigation and Claims
The Company is involved in various legal matters and proceedings arising in the ordinary course of business. While these matters and proceedings cause it to incur costs, including, but not limited to, attorneys’ fees, the Company currently believes that any ultimate liability arising out of these matters and proceedings will not have a material adverse effect on the Company’s financial position, results of operations, or cash flows.
Road Home Contract
On June 10, 2016, the Office of Community Development (the “OCD”) of the State of Louisiana filed a written administrative demand with the Louisiana Commissioner of Administration against ICF Emergency Management Services, L.L.C. (“ICF Emergency”), a subsidiary of the Company, in connection with ICF Emergency’s administration of the Road Home Program (the “Program”). The Program contract was a three-year, $912 million contract awarded to the Company in 2006 and that ended, as scheduled, in 2009.
The Program was primarily intended to help homeowners and landlords of small rental properties affected by Hurricanes Rita and Katrina. In its administrative demand, the OCD sought approximately $200.8 million in alleged overpayments to Program grant recipients. The State separately supplemented the amount of recovery it is seeking in total approximately $220.2 million. The State of Louisiana, through the Division of Administration, also filed suit in Louisiana state court on June 10, 2016 broadly alleging and seeking recoupment for the same claim made in the administrative proceeding submission before the Louisiana Commissioner of Administration. On September 21, 2016, the Commissioner of the Division of Administration notified OCD and the Company of his decision to defer jurisdiction of the administrative demand filed by the OCD. In so doing, the Commissioner declined to reach a decision on the merits, stated that his deferral would not be deemed to grant or deny any portion of the OCD’s claim, and authorized the parties to proceed on the matter in the previously filed judicial proceeding. The Company continues to believe that this claim has no merit, intends to vigorously defend its position, and has therefore not recorded a liability as of December 31, 2017.
Operating Leases
On March 8, 2010, the Company entered into a new lease that replaced its prior headquarters lease, which was due to expire in October 2012. The new lease was initially for approximately 258,000 square feet, with approximately 72,000 square feet of additional space subsequently added. The lease commenced on April 1, 2010, and will expire on December 31, 2022. Base rent under the agreement is approximately $0.9 million per month with annual escalations fixed at 2.5% per year, yielding a total lease commitment of approximately $150.6 million over the twelve-year term of the lease.
The Company has entered into various other operating leases for equipment and office space. Certain facility leases may contain fixed escalation clauses, certain facility leases require the Company to pay operating expenses in addition to base rental amounts, and nine leases require the Company to maintain letters of credit. Future minimum rental payments under all non-cancelable operating leases are as follows:
|
Year ending December 31, |
|
(in thousands) |
|
|
|
2018 |
|
$ |
36,238 |
|
|
2019 |
|
|
34,223 |
|
|
2020 |
|
|
31,459 |
|
|
2021 |
|
|
31,091 |
|
|
2022 |
|
|
29,761 |
|
|
Thereafter |
|
|
30,998 |
|
|
|
|
$ |
193,770 |
|
Minimum lease payments have been reduced by minimum sublease rentals of $1.4 million due in the future under non-cancelable subleases.
F-27
Rent expense is recognized on a straight-line basis over the lease term, net of sublease payments. Rent expense consists of the following for the years ended December 31:
|
(in thousands) |
|
2017 |
|
|
2016 |
|
|
2015 |
|
|||
|
Rent |
|
$ |
36,269 |
|
|
$ |
39,537 |
|
|
$ |
40,009 |
|
|
Sublease income |
|
|
(142 |
) |
|
|
(147 |
) |
|
|
(32 |
) |
|
Total rent expense |
|
$ |
36,127 |
|
|
$ |
39,390 |
|
|
$ |
39,977 |
|
NOTE 18—EMPLOYEE BENEFIT PLANS
Retirement Savings Plan
Effective June 30, 1999, the Company established the ICF Consulting Group Retirement Savings Plan (the “Retirement Savings Plan”). The Retirement Savings Plan is a defined contribution profit sharing plan with a cash or deferred arrangement under Section 401(k) of the Internal Revenue Code. Participants in the Retirement Savings Plan are able to elect to defer up to 70% of their compensation subject to statutory limitations, and are entitled to receive 100% employer matching contributions for the first 3% and 50% for the next 2% of their compensation. Contribution expense related to the Retirement Savings Plan for the years ended December 31, 2017, 2016, and 2015, was approximately $15.1 million, $14.9 million, and $13.1 million, respectively.
Deferred Compensation Plan
Certain key employees of the Company are eligible to defer a specified percentage of their cash compensation by having it contributed to a nonqualified deferred compensation plan. Eligible employees may elect to defer up to 80% of their base salary and up to 100% of performance bonuses, reduced by any amounts withheld for the payment of taxes or other deductions required by law. Participants are at all times 100% vested in their account balances. The Company funds its deferred compensation liabilities by making cash contributions to a Rabbi Trust at the time the salary or bonus being deferred would otherwise be payable to the employee. The liability to plan participants is materially funded at all times and the plan does not have a material net impact on the Company’s results of operations.
Employee Stock Purchase Plan
The Company has a 2006 Employee Stock Purchase Plan (“ESPP”) under which one million shares have been authorized for issuance. The ESPP allows eligible employees to purchase shares of our common stock through payroll deductions up to $25,000 per calendar year over six-month offering periods at a discount not to exceed 5% of the market value on the date of each purchase period. For the year ended December 31, 2017, 27,285 shares were purchased by employees, at an average purchase price of $47.34, and 724,826 shares remain available for future issuance. The Company does not recognize compensation expense related to the ESPP.
NOTE 19—SUBSEQUENT EVENTS
In January 2018, the Company acquired The Future Customer, a leading boutique loyalty strategy and marketing company based in London. The acquisition was immaterial to the financial statements taken as a whole.
On February 27, 2018, the Company’s board of directors approved a $0.14 per share cash dividend. The dividend will be paid on April 16, 2018 to shareholders of record as of the close of business on March 30, 2018.
NOTE 20—SUPPLEMENTAL INFORMATION
Valuation and Qualifying Accounts
Allowance for Doubtful Accounts
|
|
|
2017 |
|
|
2016 |
|
|
2015 |
|
|||
|
Balance at beginning of period |
|
$ |
2,591 |
|
|
$ |
2,138 |
|
|
|
1,887 |
|
|
Bad debt expense |
|
|
1,480 |
|
|
|
1,089 |
|
|
|
268 |
|
|
Write-offs, net of recoveries |
|
|
(219 |
) |
|
|
(635 |
) |
|
|
(8 |
) |
|
Effect of foreign currency translation |
|
|
1 |
|
|
|
(1 |
) |
|
|
(9 |
) |
|
Balance at end of period |
|
$ |
3,853 |
|
|
$ |
2,591 |
|
|
$ |
2,138 |
|
F-28
Income Tax Valuation Allowance
|
|
|
2017 |
|
|
2016 |
|
|
2015 |
|
|||
|
Balance at beginning of period |
|
$ |
1,131 |
|
|
$ |
933 |
|
|
|
542 |
|
|
Provision for income taxes - valuation allowance |
|
|
505 |
|
|
|
198 |
|
|
|
391 |
|
|
Balance at end of period |
|
$ |
1,636 |
|
|
$ |
1,131 |
|
|
$ |
933 |
|
NOTE 21—SELECTED QUARTERLY FINANCIAL DATA (UNAUDITED)
|
|
|
2017 |
|
|
2016 |
|
||||||||||||||||||||||||||
|
|
|
1Q |
|
|
2Q |
|
|
3Q |
|
|
4Q |
|
|
1Q (1) |
|
|
2Q |
|
|
3Q |
|
|
4Q |
|
||||||||
|
Contract revenue |
|
$ |
296,295 |
|
|
$ |
306,392 |
|
|
$ |
305,301 |
|
|
$ |
321,174 |
|
|
$ |
283,599 |
|
|
$ |
305,419 |
|
|
$ |
306,520 |
|
|
$ |
289,559 |
|
|
Operating income |
|
$ |
16,633 |
|
|
$ |
22,208 |
|
|
$ |
23,396 |
|
|
$ |
20,181 |
|
|
$ |
17,694 |
|
|
$ |
19,358 |
|
|
$ |
23,776 |
|
|
$ |
21,965 |
|
|
Net income |
|
$ |
10,177 |
|
|
$ |
11,937 |
|
|
$ |
13,692 |
|
|
$ |
27,070 |
|
|
$ |
9,891 |
|
|
$ |
10,583 |
|
|
$ |
13,437 |
|
|
$ |
12,673 |
|
|
Earnings per share: |
|
|
|
|
|
|
|
|
|
|
|
|
|
|
|
|
|
|
|
|
|
|
|
|
|
|
|
|
|
|
|
|
|
Basic |
|
$ |
0.54 |
|
|
$ |
0.64 |
|
|
$ |
0.73 |
|
|
$ |
1.45 |
|
|
$ |
0.52 |
|
|
$ |
0.56 |
|
|
$ |
0.71 |
|
|
$ |
0.67 |
|
|
Diluted |
|
$ |
0.52 |
|
|
$ |
0.63 |
|
|
$ |
0.72 |
|
|
$ |
1.41 |
|
|
$ |
0.51 |
|
|
$ |
0.55 |
|
|
$ |
0.70 |
|
|
$ |
0.65 |
|
|
Weighted-average common shares outstanding (in thousands) |
|
|
|
|
|
|
|
|
|
|
|
|
|
|
|
|
|
|
|
|
|
|
|
|
|
|
|
|
|
|
|
|
|
Basic |
|
|
18,972 |
|
|
|
18,775 |
|
|
|
18,666 |
|
|
|
18,646 |
|
|
|
18,994 |
|
|
|
19,008 |
|
|
|
18,965 |
|
|
|
18,988 |
|
|
Diluted |
|
|
19,423 |
|
|
|
19,086 |
|
|
|
19,024 |
|
|
|
19,136 |
|
|
|
19,273 |
|
|
|
19,293 |
|
|
|
19,329 |
|
|
|
19,512 |
|
|
(1) |
Includes adjustments for the adoption ASU 2016-09 in the second quarter of 2016. |
F-29