Attached files
| file | filename |
|---|---|
| EX-31.B - CERTIFICATION OF CFO REQUIRED BY RULE 13A-14(A) OR RULE 15D-14(A) - Avanos Medical, Inc. | hyh2017form10kex31b.htm |
| EX-32.B - CERTIFICATION OF CFO REQUIRED BY RULE 13A-14(B) OR RULE 15D-14(B) - Avanos Medical, Inc. | hyh2017form10kex32b.htm |
| EX-32.A - CERTIFICATION OF CEO REQUIRED BY RULE 13A-14(B) OR RULE 15D-14(B) - Avanos Medical, Inc. | hyh2017form10kex32a.htm |
| EX-31.A - CERTIFICATION OF CEO REQUIRED BY RULE 13A-14(A) OR RULE 15D-14(A) - Avanos Medical, Inc. | hyh2017form10kex31a.htm |
| EX-24 - EXHIBIT 24 - Avanos Medical, Inc. | hyh2017form10kex24.htm |
| EX-23 - EXHIBIT 23 - Avanos Medical, Inc. | hyh2017form10kex23.htm |
| EX-21 - EXHIBIT 21 - Avanos Medical, Inc. | hyh2017form10kex21.htm |
| EX-12 - EXHIBIT 12 - Avanos Medical, Inc. | hyh2017form10kex12.htm |
UNITED STATES
SECURITIES AND EXCHANGE COMMISSION
WASHINGTON, D.C. 20549
FORM 10-K
(Mark One) | |
x | Annual Report Pursuant to Section 13 or 15(d) of the Securities Exchange Act of 1934 |
For the fiscal year ended December 31, 2017
OR
o | Transition Report Pursuant to Section 13 or 15(d) of the Securities Exchange Act of 1934 |
For the transition period from to
Commission file number: 001-36440 |

Halyard Health, Inc.
(Exact name of registrant as specified in its charter)
Delaware | 46-4987888 | |
(State or other jurisdiction of incorporation) | (I.R.S. Employer Identification No.) | |
5405 Windward Parkway Suite 100 South Alpharetta, Georgia | 30004 | |
(Address of principal executive offices) | (Zip Code) | |
Registrant’s telephone number, including area code: (678) 425-9273
Securities registered pursuant to Section 12(b) of the Act:
Common Stock—$0.01 Par Value | New York Stock Exchange | |
(Title of each class) | (Name of each exchange on which registered) | |
Securities registered pursuant to Section 12(g) of the Act: None
Indicate by check mark if the registrant is a well-known seasoned issuer, as defined in Rule 405 of the Securities Act. Yes x No o
Indicate by check mark if the registrant is not required to file reports pursuant to Section 13 or Section 15(d) of the Act. Yes o No x
Indicate by check mark whether the registrant (1) has filed all reports required to be filed by Section 13 or 15(d) of the Securities Exchange Act of 1934 during the preceding 12 months (or for such shorter period that the registrant was required to file such reports), and (2) has been subject to such filing requirements for the past 90 days. Yes x No o
Indicate by check mark whether the registrant has submitted electronically and posted on its corporate website, if any, every Interactive Data File required to be submitted and posted pursuant to Rule 405 of Regulation S-T (§232.405 of this chapter) during the preceding 12 months (or for such shorter period that the registrant was required to submit and post such files). Yes x No o
Indicate by check mark if disclosure of delinquent filers pursuant to Item 405 of Regulation S-K (§229.405 of this chapter) is not contained herein, and will not be contained, to the best of registrant’s knowledge, in definitive proxy or information statements incorporated by reference in Part III of this Form 10-K or any amendment to this Form 10-K. o
Indicate by check mark whether the registrant is a large accelerated filer, an accelerated filer, a non-accelerated filer, or a smaller reporting company. See the definitions of “large accelerated filer,” “accelerated filer” and “smaller reporting company” in Rule 12b-2 of the Exchange Act.
Large accelerated filer x | Accelerated filer o | |
Non-accelerated filer o (Do not check if a smaller reporting company) | Smaller reporting company o | |
Indicate by check mark whether the registrant is a shell company (as defined in Rule 12b-2 of the Act). Yes o No x
The aggregate market value of common stock held by non-affiliates or registrant on June 30, 2017 was $1,833,418,550.
As of February 21, 2018, there were 46,920,076 shares of Halyard Health, Inc. common stock outstanding.
DOCUMENTS INCORPORATED BY REFERENCE
Certain information contained in the definitive Proxy Statement for Halyard’s Annual Meeting of Stockholders to be held on April 26, 2018 is incorporated by reference into Part III.
HALYARD HEALTH, INC.
TABLE OF CONTENTS
Part I | Page | |
Item 1. | ||
Item 1A. | ||
Item 1B. | ||
Item 2. | ||
Item 3. | ||
Item 4. | ||
Part II | ||
Item 5. | ||
Item 6. | ||
Item 7. | ||
Item 7A. | ||
Item 8. | ||
Item 9. | ||
Item 9A. | ||
Item 9B. | ||
Part III | ||
Item 10. | ||
Item 11. | ||
Item 12. | ||
Item 13. | ||
Item 14. | ||
Part IV | ||
Item 15. | ||
PART I
ITEM 1. BUSINESS
Overview
Halyard Health, Inc. is a medical technology company focused on eliminating pain, speeding recovery and preventing infection for healthcare providers and patients in more than 90 countries. Headquartered in Alpharetta, Georgia, Halyard is committed to addressing some of today’s most important healthcare needs, such as reducing the use of opioids while helping patients move from surgery to recovery. Our Medical Devices business segment develops, manufactures and markets clinically superior solutions around the globe.
We provide a portfolio of innovative product offerings focused on respiratory and digestive health, along with surgical and interventional pain management to improve patient outcomes and reduce the cost of care. These products include post-operative pain management solutions, minimally invasive interventional (or chronic) pain therapies, closed airway suction systems and enteral feeding tubes. Products are sold under the ON-Q, COOLIEF, MICROCUFF, MIC-KEY, HOMEPUMP, CORTRAK and other brand names.
Unless the context indicates otherwise, the terms “Halyard,” “Company,” “we,” “our” and “us” refer to Halyard Health, Inc. and its consolidated subsidiaries.
On October 31, 2017, we entered into a Purchase Agreement (“Purchase Agreement”) by and among us and certain of our affiliates and Owens & Minor, Inc. (“Buyer”). The Purchase Agreement provides for the sale to the Buyer, subject to the terms and conditions of the Purchase Agreement, substantially all of our Surgical and Infection Prevention (“S&IP”) business, as well as our name “Halyard Health” (and all variations of our name and related intellectual property rights) and our information technology (“IT”) system (the “Divestiture”). The Divestiture is intended to accelerate our transformation into a pure-play medical devices business. See “Discontinued Operations” in Note 2 to the consolidated financial statements in Item 8 of this report.
As a focused Medical Devices business, Halyard will be operating in attractive end-markets. We will deploy a dual-track growth strategy focused on product development and M&A while right-sizing the cost structure of our operations to create a scalable and cost efficient infrastructure.
As a result of this planned Divestiture, the results of operations from our S&IP business are reported as “Income (Loss) from discontinued operations, net of tax” and the related assets and liabilities are classified as “held for sale” in the consolidated financial statements in Item 8 of this report. All discussion herein, unless otherwise noted, refers to our remaining operating segment after the Divestiture, the Medical Devices business.
On May 2, 2016, Halyard acquired all of the issued and outstanding capital stock of Medsystems Holdings, Inc. (“Medsystems”) a Delaware corporation. Medsystems owns and conducts its primary business through CORPAK Medsystems (“Corpak”). Corpak’s innovative enteral access feeding solutions and portfolio of nasogastric feeding tubes complement our existing enteral feeding products and create a complete offering of enteral feeding solutions within our Medical Devices segment. See “Business Acquisition” in Note 6 to the consolidated financial statements in Item 8 of this report.
On October 31, 2014, Kimberly-Clark Corporation (“Kimberly-Clark”) distributed all of our capital stock to its shareholders and completed a previously announced spin-off of its healthcare division (the “Spin-off”). Halyard was incorporated as a Delaware corporation in February 2014 in anticipation of that Spin-off and Kimberly-Clark transferred its Health Care business to us prior to the Spin-off.
The address of our principal executive offices is 5405 Windward Parkway, Suite 100 South, Alpharetta, Georgia 30004, and our telephone number is (678) 425-9273.
Sales and Marketing
We direct our primary sales and marketing efforts toward hospitals and other healthcare providers to highlight the unique benefits and competitive differentiation of our branded products. We work directly with physicians, nurses, professional societies, hospital administrators and healthcare group purchasing organizations (“GPOs”) to collaborate and educate on emerging practices and clinical techniques that eliminate pain, speed recovery and prevent infection. These marketing programs are delivered directly to healthcare providers. Additionally, we provide marketing programs to our strategic distribution partners throughout the world.
1 | ||
Distribution
While our products are generally marketed directly to hospitals and other healthcare providers, they are generally sold through third-party distribution channels.
Our products are sold principally through independent wholesale distributors, with some sales directly to healthcare facilities and other end-user customers. In 2017, approximately 49% of our net sales in North America were made through distributors. Globally, sales to Buyer, who is also one of our distributors, accounted for approximately 10% of our 2017 net sales. No other customer or distributor accounted for more than 10% of our net sales in 2017. Buyer purchases our products under standard terms and conditions of sale.
Approximately 40% of our 2017 global net sales, including sales to wholesale distributors, were contracted through four major national GPOs. Of these 2017 GPO-contracted sales, 29% were represented by contracts that will expire by the end of 2018, 54% were represented by contracts that will expire between 2019 and 2020 and 17% were represented by contracts that will expire between 2021 and 2022.
Outside North America, sales are made either directly to end-user customers or through distributors, depending on the market served. In 2017, approximately 83% of our net sales outside North America were made through wholesalers or distributors.
We have operated six major distribution centers located in North America, Europe, Australia and Japan that will transfer to Buyer upon closing of the Divestiture. We will continue to use such distribution centers following the closing of the Divestiture through the end of 2019 under a transition services agreement with Buyer as we develop a distribution network appropriate for our business.
No material portion of our business is subject to renegotiation of profits or termination of contracts at the election of the government.
Competition
While no single company competes with us across the breadth of our offerings, we face significant competition in U.S. and international markets.
There are a variety of treatment means and alternative clinical practices to address the management of surgical and interventional pain management and respiratory and digestive health. We face competition from these alternative treatments, as well as improvements and innovations in products and technologies by our competitors.
Competitors for our products are fragmented by particular product category, and the individual markets for these products are highly competitive. Major competitors include, among others:
• | Surgical Pain Management: B. Braun Medical Inc., Pacira Pharmaceuticals, Inc., Teleflex Incorporated, Ambu A/S and Baxter International, Inc. |
• | Interventional Pain Management: Boston Scientific Corporation, Abbott Laboratories and Stryker Corporation |
• | Respiratory: Becton, Dickinson and Company, Stryker Corporation and Smiths Medical |
• | Digestive Health: Boston Scientific Corporation, Cook Medical, and Applied Medical Technology, Inc. |
In developing and emerging markets, alternative clinical practices and different standards of care are our primary competition.
While we believe that the number of procedures using our products will grow due, in part, to increasing global access to healthcare, we expect that our ability to compete with other providers of similar products will be impacted by rapid technological advances, pricing pressures and third-party reimbursement practices. We continue to defend our market positions and have launched nine new products in 2017. We believe that our key product characteristics, such as proven efficacy, reliability and safety, coupled with our core competencies such as our innovative ability to launch new products, efficient manufacturing processes, established distribution network, field sales organization and customer service, are important factors that distinguish us from our competitors.
Research and Development
We continuously engage in research and development to commercialize new products and enhance the effectiveness, reliability and safety of our existing products. We incurred $38 million in 2017, $38 million in 2016 and $28 million in 2015 on research and development for new products and processes, and to improve existing products and processes. These amounts included
2 | ||
research and development costs that were historically presented as a component of the S&IP business and consisted primarily of salaries and related expenses for personnel, product trial costs, outside laboratory and license fees, the costs of laboratory equipment and facilities and asset write-offs for equipment that does not lead to success in product manufacturing certifications. We intend to increase our research and development efforts as a key strategy for growth.
We collaborate with physicians to develop solutions that seek to accelerate the global adoption of our therapies and procedures. We are investing to expand the indications for use of our pain products with clinical research and studies and associated new product developments. We are expanding our portfolio with customer-preferred product enhancements, such as next generation cooled radiofrequency generators and a full line of needles, kits and accessories for continuous peripheral nerve block procedures.
We are also investing in new categories and solutions that complement our technical expertise and existing intellectual property. We are particularly focused on those new categories that we believe will leverage our existing scalable technology platforms as well as our sales and marketing expertise.
Intellectual Property
Patents, trademarks and other proprietary rights are very important to our business. We also rely upon trade secrets, manufacturing know-how, continuing technological innovations and licensing opportunities to maintain and improve our competitive position. We review third-party proprietary rights, including patents and patent applications, as available, in an effort to develop an effective intellectual property strategy, avoid infringement of third-party proprietary rights, identify licensing opportunities and monitor the intellectual property owned by others.
We hold numerous patents and have numerous patent applications pending in the United States and other countries that relate to the technology used in many of our products. We utilize patents in our surgical pain management, interventional pain management, respiratory health and digestive health products. These patents generally expire between 2019 and 2035. None of the patents we license from third parties are material to our business.
Following the Divestiture, under an agreement that we have with Buyer, we may continue to distribute products bearing the “Halyard Health” or “Halyard” brands through the end of 2020 as we begin rebranding efforts to ensure our customers’ transition from the Halyard brand.
We consider the patents and trademarks which we own and the trademarks under which we sell certain of our products, as a whole, to be material to our business. However, we do not consider our business to be materially dependent upon any individual patent or trademark.
Raw Materials
We use a wide variety of raw materials and other inputs in our production processes. We base our purchasing decisions on quality assurance, cost effectiveness and regulatory requirements, and we work closely with our suppliers to assure continuity of supply while maintaining high quality and reliability. We primarily purchase these materials from external suppliers, some of which are single-source suppliers.
Regulatory Matters
The development, manufacture, marketing, sale, promotion and distribution of our products are subject to comprehensive government regulation. Government regulation by various national, regional, federal, state and local agencies, both in the United States and other countries, addresses (among other matters) inspection of, and controls over, research and laboratory procedures, clinical investigations, product approvals and manufacturing, labeling, packaging, marketing and promotion, pricing and reimbursement, sampling, distribution, quality control, post-market surveillance, record keeping, storage and disposal practices. Our operations are also affected by trade regulations in many countries that limit the import of raw materials and finished products and by laws and regulations that seek to prevent corruption and bribery in the marketplace (including the U.S. Foreign Corrupt Practices Act and the United Kingdom Bribery Act, which provide guidance on corporate interactions with government officials) and require safeguards for the protection of personal data. In addition, we are subject to laws and regulations pertaining to healthcare fraud and abuse, including state and federal anti-kickback and false claims laws in the United States.
Compliance with these laws and regulations is costly and materially affects our business. Among other effects, healthcare regulations substantially increase the time, difficulty and costs incurred in obtaining and maintaining approval to market newly developed and existing products. For example, in the United States, before we can market a new medical product, or market a
3 | ||
new use for, claim for or significant modification to an existing product, we generally must first receive clearance under Section 510(k) of the Food, Drug and Cosmetic Act (“510(k) clearance”) from the United States Food and Drug Administration (“FDA”). In order for us to obtain 510(k) clearance, the FDA must determine that our proposed product is substantially equivalent to a device legally on the market, known as a predicate device, with respect to intended use, technology, safety and effectiveness. Similarly, most major markets for medical devices outside the United States also require clearance, approval or compliance with certain standards before a product can be commercially marketed. For instance, the European Commission, or EC, has harmonized national regulations for the control of medical devices through European Medical Device Directives with which manufacturers must comply. Under these regulations, manufacturing plants must have received certification of conformity from a notified body in order to be able to sell products within the member states of the European Union. Certification allows manufacturers to stamp the products of certified plants with a “CE” mark. Products covered by the EC regulations that do not bear the CE mark may not be sold or distributed in the European Union.
We expect compliance with these regulations to continue to require significant technical expertise and capital investment to ensure compliance. Failure to comply can delay the release of a new product or result in regulatory and enforcement actions, the seizure or recall of a product, the suspension or revocation of the authority necessary for a product’s production and sale, and other civil or criminal sanctions, including fines and penalties.
In addition to regulatory initiatives, our business can be affected by ongoing studies of the utilization, safety, efficacy, and outcomes of healthcare products and their components that are regularly conducted by industry participants, government agencies, and others. These studies can call into question the utilization, safety, and efficacy of previously marketed products. In some cases, these studies have resulted, and may in the future result, in the discontinuance of, or limitations on, marketing of such products domestically or worldwide, and may give rise to claims for damages from persons who believe they have been injured as a result of their use.
Access to healthcare products continues to be a subject of investigation and action by governmental agencies, legislative bodies, and private organizations in the United States and other countries. A major focus is cost containment. Efforts to reduce healthcare costs are also being made in the private sector, notably by healthcare payors and providers, which have instituted various cost reduction and containment measures. We expect insurers and providers to continue attempts to reduce the cost of healthcare products. Outside the United States, many countries control the price of healthcare products directly or indirectly, through reimbursement, payment, pricing, coverage limitations, or compulsory licensing. Budgetary pressures in the United States and in other countries may also heighten the scope and severity of pricing pressures on our products for the foreseeable future.
We expect debate to continue during the next several years at all government levels worldwide over the marketing, availability, method of delivery, and payment for healthcare products and services. We believe that future legislation and regulation in the markets we serve could affect access to healthcare products and services, increase rebates, reduce prices or the rate of price increases for healthcare products and services, change healthcare delivery systems, create new fees and obligations, or require additional reporting and disclosure. It is not possible to predict the extent to which we or the healthcare industry in general might be affected by the matters discussed above.
Since we market our products worldwide, certain products of a local nature and variations of product lines must also meet other local regulatory requirements. Certain additional risks are inherent in conducting business outside the United States, including price and currency exchange controls, changes in currency exchange rates, limitations on participation in local enterprises, expropriation, nationalization, and other governmental action.
Demand for many of our existing and new medical devices is, and will continue to be, affected by the extent to which government healthcare programs and private health insurers reimburse our customers for patients’ medical expenses in the countries where we do business. Statutory and regulatory requirements for Medicaid, Medicare, and other government healthcare programs govern provider reimbursement levels. From time to time, legislative changes are made to government healthcare programs that impact our business, and the federal and/or state governments may continue to enact measures in the future aimed at containing or reducing reimbursement levels for medical expenses paid for in whole or in part with government funds. We cannot predict the nature of such measures or their impact on our business, results of operations, financial condition and cash flows. Any reduction in the amount of reimbursements received by our customers could harm our business by reducing their selection of our products and the prices they are willing to pay.
4 | ||
Employee and Labor Relations
In our worldwide operations, we had approximately 13,000 employees as of December 31, 2017, including employees in our S&IP business that will be transferred to the Buyer upon closing of the Divestiture. We believe that we have good relations with our employees.
Environmental, Health and Safety Matters
Our operations are subject to federal, state, provincial and local laws, regulations and ordinances relating to various environmental, health and safety matters. Our operations are in compliance with, or we are taking actions designed to ensure compliance with, these laws, regulations and ordinances. However, the nature of our operations exposes us to the risk of claims concerning non-compliance with environmental, health and safety laws or standards, and there can be no assurance that material costs or liabilities will not be incurred in connection with those claims. We are not currently named as a party in any judicial or administrative proceeding relating to environmental, health and safety matters.
While we have incurred in the past several years, and will continue to incur, capital and operating expenditures in order to comply with environmental, health and safety laws, regulations and ordinances, we believe that our future cost of compliance with environmental, health and safety laws, regulations and ordinances, and our exposure to liability for environmental, health and safety claims will not have a material adverse effect on our business, results of operations, financial condition or cash flows. However, future events, such as changes in existing laws and regulations, or contamination of sites owned, operated or used for waste disposal by us (including currently unknown contamination and contamination caused by prior owners and operators of such sites or other waste generators) may give rise to additional costs which could have a material adverse effect on our financial condition, results of operations or liquidity.
Available Information
We make financial information, news releases and other information available on our corporate website at www.halyardhealth.com. Our annual reports on Form 10-K, quarterly reports on Form 10-Q, current reports on Form 8-K, and any amendments to those reports filed or furnished pursuant to Section 13(a) or 15(d) of the Securities Exchange Act of 1934 are available free of charge on our corporate website as soon as reasonably practicable after we file these reports and amendments with, or furnish them to, the SEC. The information contained on or connected to our website is not incorporated by reference into this Annual Report on Form 10-K and should not be considered part of this or any other report filed with the SEC. Stockholders may also contact Stockholder Services, 5405 Windward Parkway, Suite 100 South, Alpharetta, Georgia 30004 or call (678) 425-9273 to obtain a hard copy of these reports without charge.
ITEM 1A. RISK FACTORS
Our business faces many risks and uncertainties. Any of the risks discussed below, as well as factors described in other places in this Annual Report on Form 10-K, or in our other filings with the SEC, could adversely affect our business, consolidated financial position, results of operations or cash flows. In addition, these items could cause our future results to differ from those in any of our forward-looking statements. These risks are not the only ones we face. Other risks that we do not presently know about or that we presently believe are not material could also adversely affect us.
Risks Related to our Business and Industry
We face strong competition. Our failure to compete effectively could have a material adverse effect on our business.
Our industry is highly competitive. We compete with many domestic and foreign companies ranging from small start-up enterprises that might sell only a single or limited number of competitive products or compete only in a specific market segment, to companies that are larger and more established than us, have a broad range of competitive products, participate in numerous markets and have access to significantly greater financial and marketing resources than we do. Competitive factors include price, alternative clinical practices, innovation, quality and reputation. Our failure to compete effectively could have a material adverse effect on our business, results of operations, financial condition and cash flows.
We may not be successful in developing, acquiring or marketing competitive products and technologies.
Our industry is characterized by extensive research and development and rapid technological advances. The future success of our business will depend, in part, on our ability to design, acquire and manufacture new competitive products and enhance existing products. Accordingly, we commit substantial time, funds and other resources to new product development, including research and development, acquisitions, licenses, clinical trials and physician education. We make these substantial
5 | ||
expenditures without any assurance that our products will obtain regulatory clearance or reimbursement approval, acquire adequate intellectual property protection or receive market acceptance. Development by our competitors of improved products, technologies or enhancements may make our products, or those we develop, license or acquire in the future, obsolete or less competitive which could negatively impact our net sales. Our failure to successfully develop, acquire or market competitive new products or enhance existing products could have a material adverse effect on our business, results of operations, financial condition and cash flows.
We cannot guarantee that any of our strategic acquisitions, investments or alliances will be successful.
We intend to supplement our growth through strategic acquisitions of, investments in and alliances with new medical technologies. The success of any acquisition, investment or alliance may be affected by a number of factors, including our ability to identify and then properly assess and value the potential business opportunity or to successfully integrate any business we may acquire into our existing business. These types of transactions may require more resources and investments than originally anticipated, may divert management’s attention from our existing business, may result in exposure to unexpected liabilities of the acquired business, and may not result in the expected benefits, savings or synergies. There can be no assurance that we will be able to identify and successfully make strategic acquisitions of, investments in and alliances with new medical technologies or that any past or future acquisition, investment or alliance will be cost-effective, profitable or successful.
We face significant uncertainty in the healthcare industry due to government healthcare reform in the United States and elsewhere.
In March 2010, comprehensive healthcare reform legislation was signed into law in the United States through the passage of the Patient Protection and Affordable Care Act and the Health Care and Education Reconciliation Act (the “PPACA”). Among other initiatives, the legislation implemented a 2.3% excise tax on the sales of certain medical devices in the United States, effective January 2013. In 2015, the excise tax had an impact on us of approximately $6 million, but was suspended for 2016. As a result of the passage of the Consolidated Appropriations Act in 2016, the medical device excise tax has been suspended for the 2017 and 2018 calendar years. In addition, the legislation implemented payment system reforms and significantly altered Medicare and Medicaid reimbursements for medical services and medical devices, which could result in downward pricing pressure and decreased demand for our products.
As additional provisions of healthcare reform are implemented, we anticipate that the U.S. Congress, regulatory agencies and certain state legislatures, as well as international legislators and regulators, will continue to review and assess alternative healthcare delivery systems and payment methods with an objective of ultimately reducing healthcare costs and expanding access. We cannot predict with certainty what healthcare initiatives, if any, will be implemented by states or foreign governments or what ultimate effect federal healthcare reform or any future legislation or regulation may have on our customers’ purchasing decisions regarding our products. However, the implementation of new legislation and regulation may lower reimbursements for our products, reduce medical procedure volumes and adversely affect our business, results of operations, financial condition and cash flows.
In addition, the United States Government is currently evaluating the potential repeal and potential replacement of all or parts of the PPACA. Any such repeal or replacement may have a material adverse effect on our business, results of operations, financial condition and cash flows.
Our customers depend on third-party coverage and reimbursements. The failure of healthcare programs to provide coverage and reimbursement, or reductions in levels of reimbursement, could have a material adverse effect on our business.
The ability of our customers to obtain coverage and reimbursements for products they purchase from us is important to our business. Demand for many of our existing and new medical products is, and will continue to be, affected by the extent to which government healthcare programs and private health insurers reimburse our customers for patients’ medical expenses in the countries where we do business. Any reduction in the amount of reimbursements received by our customers could harm our business by reducing their selection of our products and the prices they are willing to pay.
In addition, as a result of their purchasing power, third-party payors are implementing cost-cutting measures such as seeking discounts, price reductions or other incentives from medical products suppliers and imposing limitations on coverage and reimbursements for medical technologies and procedures. These trends could compel us to reduce prices for our existing products and potential new products and could cause a decrease in the size of the market or a potential increase in competition that could have a material adverse effect on our business, results of operations, financial condition and cash flows.
6 | ||
An inability to obtain key components, raw materials or manufactured products from third parties may have a material adverse effect on our business.
We depend on the availability of various components, raw materials and manufactured products supplied by others for our operations. If the capabilities of our suppliers and third-party manufacturers are limited or stopped, due to quality, regulatory or other reasons, it could negatively impact our ability to manufacture or deliver our products and could expose us to regulatory actions. Further, for quality assurance or cost effectiveness, we purchase from sole suppliers certain components and raw materials. Although there are other sources in the market place for these items, we may not be able to quickly establish additional or replacement sources for certain components or materials due to regulations and requirements of the FDA and other regulatory authorities regarding the manufacture of our products. The loss of any sole supplier or any sustained supply interruption that affects our ability to manufacture or deliver our products in a timely or cost effective manner could have a material adverse effect on our business, results of operations, financial condition and cash flows.
An interruption in our ability to manufacture products may have a material adverse effect on our business.
Many of our key products are manufactured at single locations, with limited alternate facilities, including in certain cases by third-party manufacturers. If one or more of these facilities experience damage, or if these manufacturing capabilities are otherwise limited or stopped due to quality, regulatory or other reasons, including natural disasters, prolonged power or equipment failures or labor dispute, it may not be possible to timely manufacture the relevant products at previous levels or at all. A reduction or interruption in any of these manufacturing processes could have a material adverse effect on our business, results of operations, financial condition and cash flows.
An interruption in distribution or transportation may have a material adverse effect on our business.
We rely on various transportation channels for global distribution of our products through shipping ports located throughout the world. Labor unrest, political instability, the outbreak of pandemics, trade restrictions, transport capacity and costs, port security, weather conditions, natural disasters or other events could slow port activities and could adversely affect our business by interrupting product shipments and may increase our transportation costs if we are forced to use more expensive shipping alternatives.
We are subject to extensive government regulation, which may require us to incur significant expenses to ensure compliance.
Many of our products are subject to extensive regulation in the United States by the FDA and other regulatory authorities and by comparable government agencies in other countries concerning the development, design, approval, manufacture, labeling, importing and exporting and sale and marketing of many of our products. Furthermore, our facilities are subject to periodic inspection by the FDA and other federal, state and foreign government authorities, which require manufacturers of medical devices to adhere to certain regulations, including the FDA’s Quality System Regulation, which requires periodic audits, design controls, quality control testing and documentation procedures, as well as complaint evaluations and investigation. Regulations regarding the development, manufacture and sale of medical products are evolving and subject to future change. We cannot predict what impact those regulatory changes may have on our business. Failure to comply with applicable regulations could lead to manufacturing shutdowns, product shortages, delays in product manufacturing, product seizures, recalls, operating restrictions, withdrawal or suspension of required licenses, and prohibitions against exporting of products to, or importing products from, countries outside the United States and may require significant resources to resolve. Any one or more of these events could have a material adverse effect on our business, results of operations, financial condition and cash flows.
We are subject to healthcare fraud and abuse laws and regulations that could result in significant liability, require us to change our business practices or restrict our operations in the future.
We are subject to various U.S. federal, state and local laws targeting fraud and abuse in the healthcare industry, including anti-kickback and false claims laws. Violations of these laws are punishable by criminal or civil sanctions, including substantial fines, imprisonment and exclusion from participation in healthcare programs such as Medicare and Medicaid. These laws and regulations are wide ranging and subject to changing interpretation and application, which could restrict our sales or marketing practices. Furthermore, since many of our customers rely on reimbursement from Medicare, Medicaid and other governmental programs to cover a substantial portion of their expenditures, our exclusion from such programs as a result of a violation of these laws could have a material adverse effect on our business, results of operations, financial condition and cash flows.
7 | ||
We must obtain clearance or approval from the appropriate regulatory authorities prior to introducing a new product or a modification to an existing product. The regulatory clearance process may result in substantial costs, delays and limitations on the types and uses of products we can bring to market, any of which could have a material adverse effect on our business.
In the United States, before we can market a new product, or a new use of, or claim for, or significant modification to, an existing product, we generally must first receive clearance or approval from the FDA and certain other regulatory authorities. Most major markets for medical devices outside the United States also require clearance, approval or compliance with certain standards before a product can be commercially marketed. The process of obtaining regulatory clearances and approvals to market a medical device can be costly and time consuming, involve rigorous pre-clinical and clinical testing, require changes in products or result in limitations on the indicated uses of products. There can be no assurance that these clearances and approvals will be granted on a timely basis, or at all. In addition, once a medical device has been cleared or approved, a new clearance or approval may be required before the medical device may be modified, its labeling changed or marketed for a different use. Medical devices are cleared or approved for one or more specific intended uses and promoting a device for an off-label use could result in government enforcement action. Furthermore, a product approval or clearance can be withdrawn or limited due to unforeseen problems with the medical device or issues relating to its application. The regulatory clearance and approval process may result in, among other things, delayed, if at all, realization of product net sales, substantial additional costs and limitations on the types of products we may bring to market or their indicated uses, any one of which could have a material adverse effect on our business, results of operations, financial condition and cash flows.
We may incur product liability losses, litigation liability, product recalls, safety alerts or regulatory action associated with our products which can be costly and disruptive to our business.
The risk of product liability claims is inherent in the design, manufacture and marketing of the medical products of the type we produce and sell. A number of factors could result in an unsafe condition or injury to, or death of, a patient with respect to the products that we manufacture or sell, including physician technique and experience in performing the relevant surgical procedure, component failures, manufacturing flaws, design defects or inadequate disclosure of product-related risks or information.
In addition to product liability claims and litigation, an unsafe condition or injury to, or death of, a patient associated with our products could lead to a recall of, or issuance of a safety alert relating to, our products, or suspension or delay of regulatory product approvals or clearances, product seizures or detentions, governmental investigations, civil or criminal sanctions or injunctions to halt manufacturing and distribution of our products. Any one of these could result in significant costs and negative publicity resulting in reduced market acceptance and demand for our products and harm our reputation. In addition, a recall or injunction affecting our products could temporarily shut down production lines or place products on a shipping hold.
All of the foregoing types of legal proceedings and regulatory actions are inherently unpredictable and, regardless of the outcome, could disrupt our business, result in substantial costs or the diversion of management attention and could have a material adverse effect on our business, results of operations, financial condition and cash flows.
Economic conditions have affected and may continue to adversely affect our business, results of operations, financial condition and cash flows.
Disruptions in the financial markets and other macro-economic challenges affecting the economy and the economic outlook of the United States, Europe, Japan, China and other parts of the world may have an adverse impact on our results of operations, financial condition and cash flows. Economic conditions and depressed levels of consumer and commercial spending have caused and may continue to cause our customers to reduce, modify, delay or cancel plans to purchase our products, and we have observed certain hospitals delaying and prioritizing purchasing decisions, which has had and may continue to have a material adverse effect on our business, results of operations, financial condition and cash flows.
In addition, as a result of economic conditions, our customers inside and outside the United States, including foreign governmental entities or other entities that rely on government healthcare systems or government funding, may be unable to pay their obligations on a timely basis or to make payment in full. If our customers’ cash flow or operating and financial performance deteriorate or fail to improve, or if our customers are unable to make scheduled payments or obtain credit, they may not be able to pay, or may delay payment of accounts receivable owed to us. These conditions also may have an adverse effect on certain of our suppliers who may reduce output or change terms of sales, which could cause a disruption in our ability to produce our products. Any inability of current and/or potential customers to pay us for our products or any demands by our suppliers for different payment terms may have a material adverse effect on our business, results of operations, financial condition and cash flows.
8 | ||
Currency exchange rate fluctuations could have a material adverse effect on our business and results of operations.
Due to our international operations, we transact business in many foreign currencies and are subject to the effects of changes in foreign currency exchange rates, including the Mexican peso, Japanese yen, Australian dollar and the Euro. Our financial statements are reported in U.S. dollars with international transactions being translated into U.S. dollars. If the U.S. dollar strengthens in relation to the currencies of other countries where we sell our products, our U.S. dollar reported net sales and income will decrease. Additionally, we incur significant costs in foreign currencies and a fluctuation in those currencies’ value can negatively impact manufacturing and selling costs. While we have in the past engaged, and may in the future engage, in various hedging transactions in attempts to minimize the effects of foreign currency exchange rate fluctuations, there can be no assurance that these hedging transactions will be effective. Changes in the relative values of currencies occur regularly and could have an adverse effect on our business, results of operations, financial condition and cash flows.
We are exposed to price fluctuations of key commodities, which may negatively impact our results of operations.
We rely on product inputs, such as polypropylene and other commodities in the manufacture of our products. Prices of oil and gas affect our distribution and transportation costs. Prices of these commodities are volatile and have fluctuated significantly in recent years, which has contributed to, and in the future may continue to contribute to, fluctuations in our results of operations. Our ability to hedge commodity price volatility is limited. Furthermore, due to competitive dynamics, the cost containment efforts of our customers and third-party payors, and contractual limitations, particularly with respect to products we sell under group purchasing agreements, which generally set pricing for a three-year term, we may be unable to pass along commodity-driven cost increases through higher prices. If we cannot fully offset cost increases through other cost reductions, or recover these costs through price increases or surcharges, we could experience lower margins and profitability which could have a material adverse effect on our business, results of operations, financial condition and cash flows.
Cost-containment efforts of our customers, healthcare purchasing groups, third-party payors and governmental organizations could adversely affect our sales and profitability.
Many of our customers are members of GPOs, or integrated delivery networks (“IDNs”). GPOs and IDNs negotiate pricing arrangements with healthcare product manufacturers and distributors and offer the negotiated prices to affiliated hospitals and other members. Although we are the sole contracted supplier to certain GPOs for certain product categories, members of the GPO are generally free to purchase from other suppliers, and such contract positions can offer no assurance that sales volumes of those products will be maintained. In addition, initiatives sponsored by government agencies and other third-party payors to limit healthcare costs, including price regulation and competitive bidding for the sale of our products, are ongoing in markets where we sell our products. Pricing pressure has also increased in our markets due to consolidation among healthcare providers, trends toward managed care, governments becoming payors of healthcare expenses and regulation relating to reimbursements. The increasing leverage of organized buying groups and consolidated customers and pricing pressure from third-party payors may reduce market prices for our products, thereby reducing our profitability and have a material adverse effect on our business, results of operations, financial condition and cash flows.
We are subject to political, economic and regulatory risks associated with doing business outside of the United States.
Most of our manufacturing facilities are outside the United States in Mexico, France, Germany and Tunisia. We also use contract manufacturers to manufacture products on our behalf in China, Indonesia and Malaysia and source many of our raw materials and components from foreign suppliers. We distribute and sell our products in over 90 countries. In 2017, approximately 23% of our net sales were generated outside of North America and we expect this percentage will grow over time. Our operations outside of the United States are subject to risks that are inherent in conducting business internationally, including compliance with both United States and foreign laws and regulations that apply to our international operations. These laws and regulations include robust data privacy requirements, labor relations laws that may impede employer flexibility, tax laws, anti-competition regulations, import, customs and trade restrictions, export requirements, economic sanction laws, environmental, health and safety laws, anti-bribery laws such as the U.S. Foreign Corrupt Practices Act and similar anti-bribery laws in other jurisdictions. Given the high level of complexity of these laws, there is a risk that some provisions may be violated inadvertently or through fraudulent or negligent behavior of individual employees, our failure to comply with certain formal documentation requirements or otherwise. In addition, these laws are subject to changes, which may require additional resources or make it more difficult for us to comply with these laws. Violations of the laws and regulations governing our international operations could result in fines or criminal sanctions against us, our officers or our employees, and prohibitions on the conduct of our business. Any such violations could include prohibitions on our ability to manufacture or distribute our products in one or more countries and could have a material adverse effect on our reputation, our brand, our international
9 | ||
expansion efforts, our ability to attract and retain employees, our business, results of operations, financial condition and cash flows. Our success depends, in part, on our ability to anticipate and prevent or mitigate these risks and manage difficulties as they arise.
We may be subject to trade protection measures that are being contemplated by the United States Government that may result in new or higher tariffs, import-export restrictions and taxes. Changes in, or revised interpretations of import-export laws or international trade agreements, along with new or increased tariffs, trade restrictions or taxation on income earned or goods manufactured outside the United States may have a material adverse effect on our business, financial condition, results of operations and cash flows.
In addition to the foregoing, engaging in international business inherently involves a number of other difficulties and risks, including:
• | different local medical practices, product preferences and product requirements, |
• | price and currency controls and exchange rate fluctuations, |
• | cost and availability of international shipping channels, |
• | longer payment cycles in certain countries other than the United States, |
• | minimal or diminished protection of intellectual property in certain countries, |
• | uncertainties regarding judicial systems, including difficulties in enforcing agreements through certain non-U.S. legal systems, |
• | political instability and actual or anticipated military or political conflicts, expropriation of assets, economic instability and the impact on interest rates, inflation and the credit worthiness of our customers, |
• | difficulties and costs of staffing and managing non-U.S. operations. |
These risks and difficulties, individually or in the aggregate, could have a material adverse effect on our business, results of operations, financial condition and cash flows.
We have a significant amount of debt that could adversely affect our business.
Our indebtedness includes $250 million of 6.25% senior unsecured notes and $339 million owed on a term loan. This debt could have important consequences to us and our investors, including:
• | requiring a substantial portion of our cash flow from operations to make interest payments on this debt, |
• | reducing the cash flow available to fund capital expenditures and other corporate purposes and to grow our business, |
• | increasing our vulnerability to general adverse economic and industry conditions, |
• | increasing the risk of a future downgrade of our credit rating, which could increase future debt costs and limit the future availability of debt financing, |
• | limiting our ability to borrow additional funds as needed or take advantage of business opportunities as they arise, and |
• | limiting our flexibility in planning for, or reacting to, changes in our business and the industry and placing us at a competitive disadvantage to our competitors that may not be as highly leveraged. |
To the extent that we incur additional indebtedness, the risks described above could increase. In addition, our actual cash requirements in the future may be greater than expected. Our cash flow from operations may not be sufficient to repay all of the outstanding debt as it becomes due, and we may not be able to borrow money, sell assets or otherwise raise funds on acceptable terms, or at all, to refinance our debt.
We may need additional financing in the future to meet our capital needs or to make acquisitions and such financing may not be available on favorable terms, if at all.
We intend to increase our investment in research and development activities and make acquisitions. Accordingly, we may need to seek additional debt or equity financing. We may be unable to obtain any desired additional financing on terms favorable to us, if at all. If we lose a previously assigned credit rating or adequate funds are not available on acceptable terms, we may be
10 | ||
unable to fund our expansion, successfully develop or enhance products or respond to competitive pressures, any of which could negatively affect our business.
We may be unable to protect our intellectual property rights or may infringe the intellectual property rights of others.
We rely on patents, trademarks, trade secrets and other intellectual property assets in the operation of our business. Our efforts to protect our intellectual property and proprietary rights may not be sufficient. We cannot be sure that pending patent applications will result in the issuance of patents or that patents issued or licensed to us will remain valid or prevent competitors from introducing similar competing technologies. Our ability to enforce and protect our intellectual property rights may be limited in certain countries outside of the United States in which we operate, which could make it easier for our competitors to develop or distribute similar competing technologies in those jurisdictions. In addition, our competitive position may be adversely affected by expirations of our significant patents, which would allow competitors to freely use our technology to compete with us.
We operate in an industry characterized by extensive patent litigation and competitors may claim that our products infringe their intellectual property rights. Resolution of patent litigation or other intellectual property claims is inherently unpredictable, typically time consuming and costly and can result in significant damage awards and injunctions that could prevent the manufacture and sale of the affected products or require us to make significant royalty payments in order to continue selling the affected products. Any one of these could have a material adverse effect on our business, results of operations, financial condition and cash flows. At any given time we are involved as either a plaintiff or a defendant in a number of patent infringement actions, the outcomes of which may not be known for prolonged periods of time. We can expect to face additional claims of patent infringement in the future.
We may be unable to attract and retain key employees necessary to be competitive.
Our ability to compete effectively depends upon our ability to attract and retain executives and other key employees, including people in technical, marketing, sales, and research and development positions. Competition for experienced employees, particularly for persons with specialized skills, can be intense. Our ability to recruit such talent will depend on a number of factors, including compensation and benefits, work location and work environment. If we cannot effectively recruit and retain qualified executives and employees, our business could be materially adversely affected.
Breaches of our information technology systems could have a material adverse effect on our business.
We rely on information technology systems to process, transmit and store electronic information in our day-to-day operations. Our information technology systems may be subjected to computer viruses or other malicious codes, unauthorized access attempts and cyber- or phishing-attacks. We also store certain information with third parties that could be subject to these types of attacks. These attacks could result in our intellectual property and other confidential information, including personal health information, being lost or stolen, disruption of our operations, loss of reputation and other negative consequences, such as increased costs for security measures or remediation costs and diversion of management attention. While we will continue to implement additional protective measures to reduce the risk of and detect future cyber incidents, cyber-attacks are becoming more sophisticated and frequent, and the techniques used in such attacks change rapidly. There can be no assurances that our protective measures will prevent future attacks that could have a material adverse effect on our business.
Risks Related to the Divestiture of our S&IP Business
We may not realize potential benefits from the Divestiture of the S&IP Business or the restructuring activities associated with the Divestiture.
There is no assurance that we will realize the potential benefits that we expect from the Divestiture or from the multi-phase restructuring plan (the “Plan”) that is associated with the Divestiture. The Divestiture is expected to provide the following benefits, among others: (i) giving Halyard the ability to focus on strategic and operational plans as a pure-play medical devices-only company; (ii) accelerating Halyard’s growth as a medical device company through the resources provided by the Divestiture; and (iii) allowing investors to evaluate the merits, performance and future prospects of Halyard as a growing medical device company. The Plan is intended to (i) align our organizational and management structure; (ii) enhance and restructure our information technology systems; and (iii) enhance and restructure our supply chain and go-to-market models.
Following the Divestiture and implementation of the Plan, we may not achieve these and other anticipated benefits for a variety of reasons, including, among others:
11 | ||
• | the separation of the S&IP business may require significant amounts of management’s time and effort, which may divert management’s attention away from Halyard’s Device business, |
• | the replacement of our information technology infrastructure may result in substantial additional costs and business interruptions, |
• | the replacement of our corporate brand name may result in substantial additional costs and may not be well received by our customers in the market place, |
• | our business will be significantly less diversified than prior to the Divestiture. |
If we fail to achieve some or all the benefits expected to result from the Divestiture and the Plan, or if such benefits are delayed, our business, financial condition, results of operations and cash flows could be adversely affected and the value of Halyard common stock could be adversely impacted.
As we build our information technology infrastructure and transition our data to our own systems, we could incur substantial additional costs and experience temporary business interruption.
Pursuant to the Purchase Agreement, we are transferring ownership of our existing information technology infrastructure to the Buyer and replacing such information technology infrastructure to support our critical business functions, including systems relating to accounting and reporting, manufacturing process control, customer service, inventory control and distribution. The replacement process involves technical risks and business uncertainties, including whether we have the technological capacity to replace the system in full and the financial and operational capacity to continue our business during the replacement process. Although we have conducted discreet tests of our ability to conduct the process, such risks remain and there can be no assurance that the replacement process will occur within the anticipated timing, or at all. We may incur temporary interruptions in business operations if we cannot effectively replace our existing transactional and operational systems and data centers. We may not be successful in effectively and efficiently implementing our replacement systems and transitioning our data, and we may incur substantially higher costs for replacement than currently anticipated. In addition, the replacement process may result in (i) disruption to unrelated parts of our business, (ii) loss of employees or customers, (iii) exposure to unanticipated liabilities or (iv) assumption of ongoing obligations and liabilities following the completion of the process. Our failure to avoid operational interruptions, losses of employees or customers, or unanticipated liabilities as we replace our information technology infrastructure could disrupt or have a material adverse effect on our business, financial condition, results of operations and cash flows.
Following the Divestiture, we will be required to rebrand the Company and many of our products which will likely involve substantial costs and may not be favorably received by our customers.
Following the Divestiture, we will no longer own the “Halyard Health” brand name, or any variation of the name, logos and related intellectual property rights. We will likely incur substantial costs to rebrand the Company and many of our products worldwide, which also requires regulatory product registration costs. Rebranding efforts may not be complete before the agreement with the Buyer allowing us to use the “Halyard” brand expires, potentially causing substantial inventory write-offs. In addition, we cannot assure you that our customers will be receptive to our proposed rebranding. A failure in our rebranding efforts may affect our ability to attract and retain customers following the Divestiture, resulting in reduced revenues.
The transition services to be provided to us by the Buyer for a limited time may be difficult for us to replace without operational problems or additional cost.
The Purchase Agreement provides for provision of transition services to us by the Buyer throughout a transition period. After the expiration of the transition services agreement, we may experience operational difficulties and increased costs if we are unable to perform those services or obtain them from a third party on reasonable terms and conditions.
The transition services to be provided by us to the Buyer for a limited time may draw attention and resources away from our ongoing business.
The Purchase Agreement requires our provision of transition services to the Buyer throughout a transition period, which will require significant time, attention and resources of our senior management and other employees within Halyard, potentially diverting their attention from other aspects of our business. We will be bound to comply with the terms of the transition services agreement, and at times compliance with this agreement will consume Halyard’s focus and resources that would otherwise be invested into maintaining and growing our business.
12 | ||
Some of the shared employees who are important to the remaining business will be transferred to the Buyer, which may require us to replace employees and incur consequent additional costs or experience operational difficulties.
We are dependent on the experience and industry knowledge of our officers and employees to execute our business plans. The Divestiture will require that we share certain employees with the Buyer during the term of the transition services agreement and the replacement of our information technology infrastructure and that we transfer certain employees to the Buyer both at the closing of the Divestiture and at the conclusion of the information technology process. There may be uncertainty around the duties of our shared employees, which may cause operational difficulties or may cause some of such shared employees to leave Halyard. Transfer of employees to the Buyer may cause loss of institutional knowledge and we may have difficulties finding employees to replace such transferred employees. Current and prospective employees of Halyard may experience uncertainty about their future roles as shared employees or transferred employees, which may adversely affect our ability to attract and retain talent going forward. Our success during and after the Divestiture will depend in part on our ability to effectively share certain employees, retain key management personnel and integrate future employees. The operational difficulties surrounding our use of shared employees and the loss of knowledge and employees and difficulties in hiring new employees could disrupt our business and could have a material adverse effect on our business, financial condition, results of operations and cash flows.
Following the Divestiture, we may experience increased costs resulting from decreased purchasing power, which could decrease our overall profitability and cash flow.
Prior to the Divestiture, we are able to take advantage of our size and purchasing power in procuring goods, services and technology, such as management information services, health insurance, employee benefits, payroll administration, risk management, tax and other services. Following the Divestiture, we may have to pay higher costs for certain materials used in our products or services necessary to operate our business due to a decline in purchasing scale if we are unable to obtain other similar goods, services and technology at prices or on terms as favorable as those obtained prior to the Divestiture.
Risks Related to Ownership of Halyard Common Stock
We cannot guarantee that our stock price will not decline or fluctuate significantly.
The price at which Halyard common stock trades has and may continue to fluctuate significantly. The market price, or fluctuations in price, for Halyard common stock may be negatively influenced by many factors, including:
• | actual or unanticipated fluctuations in our quarterly and annual operating results, |
• | our failure to achieve the quarterly financial results forecast provided from time to time by the securities analysts who cover our stock, |
• | the outcome of litigation and enforcement actions, |
• | developments generally affecting the healthcare industry, |
• | changes in market valuations of comparable companies, |
• | the amount of our indebtedness, |
• | general economic, industry and market conditions, |
• | the depth and liquidity of the market for Halyard common stock, |
• | price fluctuations in key commodities, |
• | fluctuations in interest and currency exchange rates, |
• | our dividend policy, and |
• | perceptions of or speculations by the press or investment community. |
These and other factors may lower the market price of Halyard common stock, regardless of our actual financial condition or operating performance.
We have no present intention to pay dividends on Halyard common stock.
We have no present intention to pay dividends on Halyard common stock. Any determination to pay dividends to holders of Halyard common stock will be at the discretion of our Board of Directors and will depend on many factors, including our
13 | ||
financial condition, results of operations, projections, liquidity, earnings, legal requirements, restrictions in our debt agreements and other factors that our Board of Directors deems relevant.
Your percentage of ownership in Halyard may be diluted in the future.
In the future, your percentage ownership in Halyard may be diluted because of equity issuances for acquisitions, capital market transactions or otherwise, including equity awards that we may grant to our directors, officers and employees. We also anticipate that our compensation committee will grant stock options or other equity based awards to our employees in the future. These awards will have a dilutive effect on existing stockholders and on our earnings per share, which could adversely affect the market price of shares of Halyard common stock.
In addition, our certificate of incorporation authorizes us to issue, without the approval of Halyard stockholders, one or more classes or series of preferred stock having such designation, powers, preferences and relative, participating, optional and other special rights, including preferences over Halyard common stock with respect to dividends and distributions, as our Board of Directors generally may determine. If our Board of Directors were to approve the issuance of preferred stock in the future, the terms of one or more classes or series of such preferred stock could dilute the voting power or reduce the value of Halyard common stock. Similarly, the repurchase or redemption rights or liquidation preferences we could assign to Halyard preferred stock could affect the residual value of Halyard common stock.
Certain provisions of our certificate of incorporation and by-laws and of Delaware law may make it difficult for stockholders to change the composition of our Board of Directors and may discourage hostile takeover attempts which some of our stockholders may consider to be beneficial.
Certain provisions contained in our certificate of incorporation and by-laws and those contained in Delaware law may have the effect of delaying or preventing changes in control if our Board of Directors determines that such changes in control are not in the best interests of us and our stockholders. These provisions include, among other things, the following:
• | the division of our Board of Directors into three classes, each with three-year staggered terms, |
• | the ability of our Board of Directors to issue shares of preferred stock and to determine the price and other terms, including preferences and voting rights, of those shares without stockholder approval, |
• | the inability of our stockholders to call a special meeting of stockholders, |
• | stockholder action may be taken only at a special or regular meeting of stockholders, |
• | advance notice procedures for nominating candidates to our Board of Directors or presenting matters at stockholder meetings, |
• | stockholder removal of directors only for cause and only by a supermajority vote, |
• | the ability of our Board of Directors, and not our stockholders, to fill vacancies on our Board of Directors, and |
• | supermajority voting requirements to amend our by-laws and certain provisions of our certificate of incorporation and to engage in certain types of business combinations. |
While these provisions have the effect of encouraging persons seeking to acquire control of our company to negotiate with our Board of Directors, they could enable the Board of Directors to hinder or frustrate a transaction that some, or a majority, of the stockholders might believe to be in their best interests and, in that case, may prevent or discourage attempts to remove and replace incumbent directors. We are also subject to Delaware laws that could have similar effects. One of these laws prohibits us from engaging in a business combination with a significant stockholder unless specific conditions are met.
ITEM 1B. UNRESOLVED STAFF COMMENTS
None.
ITEM 2. PROPERTIES
We own or lease operating facilities located throughout the world that handle manufacturing production, assembly, research, quality assurance testing, distribution and packaging of our products. We believe our facilities are suitable and adequate for our present operations. We lease our principal executive offices that are located in Alpharetta, Georgia. The locations of our principal medical device production facilities owned or leased by us around the world are as follows:
14 | ||
Location | Country | Owned/Leased | ||
Nogales | Mexico | Owned | ||
Nogales | Mexico | Leased | ||
Tucson, Arizona | USA | Leased | ||
Magdalena | Mexico | Leased | ||
Tijuana | Mexico | Leased | ||
Weinheim | Germany | Leased | ||
Marseille | France | Leased | ||
Sousse | Tunisia | Leased | ||
ITEM 3. LEGAL PROCEEDINGS
We are subject to various legal proceedings, claims and governmental inspections, audits or investigations pertaining to issues such as contract disputes, product liability, tax matters, patents and trademarks, advertising, governmental regulations, employment and other matters, including the matters described below. Under the terms of the distribution agreement we entered into with Kimberly-Clark prior to the Spin-off, legal proceedings, claims and other liabilities that are primarily related to our business are our responsibility and we are obligated to indemnify and hold Kimberly-Clark harmless for such matters (“Indemnification Obligation”). For the years ended December 31, 2017, 2016 and 2015, we have incurred $21 million, $20 million and $17 million, respectively, related to these matters.
Chondrolysis Litigation
An exception to our Indemnification Obligation relates to the pain pump litigation referenced in this paragraph. We are one of several manufacturers of continuous infusion medical devices, such as our ON-Q PAINBUSTER pain pumps, that are involved in several different pending or threatened litigation matters from multiple plaintiffs alleging that use of the continuous infusion device to deliver anesthetics directly into a synovial joint after surgery resulted in postarthroscopic glenohumeral chondrolysis, or a disintegration of the cartilage covering the bones in the joint (typically, in the shoulder). Plaintiffs generally seek monetary damages and attorneys’ fees. Although Kimberly-Clark generally retained the liabilities related to these matters, the distribution agreement between us and Kimberly-Clark provides that we will indemnify Kimberly-Clark for any such claims or causes of action arising after the Spin-off.
Surgical Gown Litigation and Related Matters
Bahamas Surgery Center
We have an Indemnification Obligation for, and have assumed the defense of, the matter styled Bahamas Surgery Center, LLC v. Kimberly-Clark Corporation and Halyard Health, Inc., No. 2:14-cv-08390-DMG-SH (C.D. Cal.) (“Bahamas”), filed on October 29, 2014. In that case, the plaintiff brought a putative class action asserting claims for common law fraud (affirmative misrepresentation and fraudulent concealment) and violation of California’s Unfair Competition Law (“UCL”) in connection with our marketing and sale of MicroCool surgical gowns.
On April 7, 2017, after a two-week trial, a jury returned a verdict for the plaintiff, finding that Kimberly-Clark was liable for $4 million in compensatory damages (not including prejudgment interest) and $350 million in punitive damages, and that Halyard was liable for $0.3 million in compensatory damages (not including prejudgment interest) and $100 million in punitive damages. Subsequently, the court also ruled on the plaintiff’s UCL claim and request for injunctive relief. The court found in favor of the plaintiff on the UCL claim but denied the plaintiff’s request for restitution. The court also denied the plaintiff’s request for injunctive relief.
On May 25, 2017, we filed three post-trial motions: a renewed motion for judgment as a matter of law; a motion to decertify the class; and a motion for new trial, remittitur, or amendment of the judgment. The renewed motion for judgment as a matter of law seeks to have the court reverse the jury’s verdict in whole or in part because it was based on insufficient facts and/or did not correctly apply the law. The motion to decertify the class seeks to have the court decertify the class on the basis that the evidence at trial did not support the Court’s initial class certification order and therefore the case should not have proceeded as a class action. The motion for new trial, remittitur or amendment of the judgment seeks, among other relief, to have the court reduce the jury’s punitive damages award because it was not supported by the facts and was excessive in violation of due process under the U.S. Constitution. The U.S. Supreme Court has stated that the Constitutional outer limit for the ratio between
15 | ||
punitive damages and compensatory damages in cases such as ours is approximately 9 to 1 or lower, and we believe that in a case such as ours that, if there is any award of punitive damages (a premise we dispute), the ratio should be 1 to 1. We intend to continue our vigorous defense of the Bahamas matter.
Kimberly-Clark Corporation
We have notified Kimberly-Clark that we have reserved our rights to challenge any purported obligation to indemnify Kimberly-Clark for the punitive damages awarded against them. In connection with our reservation of rights, on May 1, 2017, we filed a complaint in the matter styled Halyard Health, Inc. v. Kimberly-Clark Corporation, Case No. BC659662 (County of Los Angeles, Superior Court of California). In that case, we seek a declaratory judgment that we have no obligation, under the Distribution Agreement or otherwise, to indemnify, pay, reimburse, assume, or otherwise cover punitive damages assessed against Kimberly-Clark in Bahamas Surgery Center, LLC, et al. v. Kimberly-Clark Corporation and Halyard Health, Inc., No. 14-CV-08390 (C.D. Cal., originally filed on October 29, 2014), or any Expenses or Losses (as defined in the distribution agreement) associated with an award of punitive damages. On May 2, 2017, Kimberly-Clark filed a complaint in the matter styled Kimberly-Clark Corporation v. Halyard Health, Inc., Case No. 2017-0332-AGB (Court of Chancery of the State of Delaware). In that case, Kimberly-Clark seeks a declaratory judgment that (1) we must indemnify them for all damages, including punitive damages, assessed against them in the Bahamas matter, (2) we have anticipatorily and materially breached the Distribution Agreement by our failure to indemnify them, and (3) we are estopped from asserting, or have otherwise waived, any claim that we are not required to indemnify them for all damages, including punitive damages, that may be awarded in the Bahamas matter. On May 26, 2017, we moved to dismiss or stay Kimberly-Clark’s Delaware complaint, and on June 16, 2017, Kimberly-Clark moved for summary judgment. On September 12, 2017, the Delaware court granted our motion to stay Kimberly-Clark’s complaint and therefore did not take any action on Kimberly-Clark’s motion for summary judgment. We intend to vigorously pursue our case against Kimberly-Clark in California and to vigorously defend against their case against us.
Government Investigation
In June 2015, we were served with a subpoena from the Department of Veterans Affairs Office of the Inspector General (“VA OIG”) seeking information related to the design, manufacture, testing, sale and promotion of MicroCool and other Company surgical gowns, and, in July 2015, we also became aware that the subpoena and an earlier VA OIG subpoena served on Kimberly-Clark requesting information about gown sales to the federal government are related to a United States Department of Justice (“DOJ”) investigation. In May 2016 and April 2017, we received additional subpoenas from the DOJ seeking further information related to Company gowns. The Company is cooperating with the DOJ investigation.
Shahinian and Edgett
On October 12, 2016, after the DOJ and various States declined to intervene in two qui tam matters, both matters were unsealed and the complaints were subsequently served on Kimberly-Clark and Halyard, as applicable. One of those matters is U.S. ex rel. Shahinian, et al. v. Kimberly-Clark Corporation, No. 2:14-cv-08313-JAK-JPR (C. D. Cal.) (“Shahinian”), filed on October 27, 2014. The other matter is U.S. ex rel. Edgett, et al. v. Kimberly-Clark Corporation, Halyard Health, Inc., et al, No. 3:15-cv-00434-B (N.D. Tex.) (“Edgett”), filed on February 9, 2015. Both cases allege, among other things, violations of the federal and various state False Claims Acts in connection with the marketing and sale of certain surgical gowns.
Shahinian: On March 8, 2017, Kimberly-Clark moved to dismiss the Shahinian complaint, and on July 14, 2017, the California court granted Kimberly-Clark’s motion while also granting the plaintiff leave to amend his complaint. The plaintiff then filed a second amended complaint. On August 11, 2017, Kimberly-Clark moved to dismiss the complaint, and on November 30, 2017, the California court again granted Kimberly-Clark’s motion while also granting the plaintiff leave to amend his complaint. The plaintiff then filed a third amended complaint. On January 18, 2018, Kimberly-Clark moved to dismiss it.
Edgett: On May 17, 2017, Kimberly-Clark and Halyard moved to dismiss the Edgett complaint. On September 22, 2017, the court granted Kimberly-Clark’s and Halyard’s motions to dismiss, and on November 6, 2017, the court entered final judgment dismissing the Edgett complaint. The plaintiff did not appeal the entry of judgment.
We may have an Indemnification Obligation for the Shahinian and Edgett matters under the distribution agreement with Kimberly-Clark and have notified Kimberly-Clark that we reserve our rights to challenge the obligation to indemnify Kimberly-Clark for any damages or penalties which are not indemnifiable under applicable law or public policy. We intend to vigorously defend the remaining claims.
16 | ||
Kromenaker
On March 17, 2017, the DOJ submitted a filing declining to intervene in another qui tam matter, and the complaint was unsealed and subsequently served on Kimberly-Clark and Halyard. That matter is styled U.S. ex rel. Kromenaker v. Kimberly-Clark Corporation and Halyard Health, Inc., No. 1:15-cv-04413-SCJ (N. D. Ga.) (“Kromenaker”), filed on December 21, 2015. In that case, the plaintiff alleges, among other things, violations of the federal False Claims Act in connection with the marketing and sale of certain products, including feminine hygiene products, surgical gowns and endotracheal tubes. On June 12, 2017 Kimberly-Clark and Halyard moved to dismiss the complaint. On August 21, 2017, Kromenaker filed an amended complaint, and Kimberly-Clark and Halyard filed motions to dismiss the amended complaint on September 20, 2017. We may have an Indemnification Obligation for certain parts of this matter under the distribution agreement with Kimberly-Clark and have notified Kimberly-Clark that we reserve our rights to challenge the obligation to indemnify Kimberly-Clark for any damages or penalties which are not indemnifiable under applicable law or public policy. We intend to vigorously defend this matter.
Jackson
We were served with a complaint in a matter styled Jackson v. Halyard Health, Inc., Robert E. Abernathy, Steven E. Voskuil, et al., No. 1:16-cv-05093-LTS (S.D.N.Y.), filed on June 28, 2016. In that case, the plaintiff brings a putative class action against the Company, our Chief Executive Officer, our Chief Financial Officer and other defendants, asserting claims for violations of the Securities Exchange Act, Sections 10(b) and 20(a). The plaintiff alleges that the defendants made misrepresentations and failed to disclose certain information about the safety and effectiveness of our MicroCool gowns and thereby artificially inflated the Company’s stock prices during the respective class periods. The alleged class period for purchasers of Kimberly-Clark securities who subsequently received Halyard Health securities is February 25, 2013 to October 21, 2014, and the alleged class period for purchasers of Halyard Health securities is October 21, 2014 to April 29, 2016. On February 16, 2017, we moved to dismiss the case. We intend to continue our vigorous defense of this matter.
Richardson, Chiu and Pick
We were also served with a complaint in a matter styled Margaret C. Richardson Trustee of the Survivors Trust Dated 6/12/84 for the Benefit of the H&M Richardson Revocable Trust v. Robert E. Abernathy, Steven E. Voskuil, et al., No. 1:16-cv-06296 (S. D. N. Y.) (“Richardson”), filed on August 9, 2016. In that case, the plaintiff sues derivatively on behalf of Halyard Health, Inc., and alleges that the defendants breached their fiduciary duty, were unjustly enriched, and violated Section 14(A) of the Securities and Exchange Act in connection with Halyard Health, Inc.’s marketing and sale of MicroCool gowns. We were also served with a complaint in a matter styled Kai Chiu v. Robert E. Abernathy, Steven E. Voskuil, et al, No. 2:16-cv-08768 (C.D. Cal.), filed on November 23, 2016. In that case, the plaintiff sues derivatively on behalf of Halyard Health, Inc., and makes allegations and brings causes of action similar to those in Richardson, but the plaintiff also adds causes of action for abuse of control, gross mismanagement, and waste of corporate assets. We were also served with a complaint in a matter styled Lukas Pick v. Robert E. Abernathy, Steven E. Voskuil, et al. No. e:18-cv-00295 (D. Del.), filed of February 21, 2018. In that case, the plaintiff sues derivatively on behalf of Halyard Health, Inc., and makes allegations and brings causes of action similar to those in Richardson and Chiu. We intend to vigorously defend these matters.
Medline Industries
We were also served with a complaint in the matter styled Medline Industries, Inc. v. Kimberly-Clark Corporation, Halyard Health, Inc., et al., No. 2:16-cv-08571 (C. D. Cal.), filed on November 17, 2016. In that case, the plaintiff makes allegations similar to those in Bahamas, Shahinian, and Edgett, and brings causes of action under federal and state false advertising laws and state unfair competition laws. On March 31, 2017, we moved to dismiss certain of Medline’s claims and to transfer any surviving claims from California to Georgia. On June 2, 2017, the court granted our motion to transfer the case to Georgia and denied without prejudice our motion to dismiss. On June 30, 2017, now before the court in Georgia and with the case re-styled as Medline Industries, Inc. v. Kimberly-Clark Corporation, Halyard Health, Inc., et al., No. 1:17-cv-02032 (N. D. Ga.), Kimberly-Clark and Halyard filed renewed motions to dismiss certain of Medline’s claims. We may have an Indemnification Obligation for this matter under the distribution agreement with Kimberly-Clark and have notified Kimberly-Clark that we reserve our rights to challenge the obligation to indemnify Kimberly-Clark for any damages or penalties which are not indemnifiable under applicable law or public policy. We intend to vigorously defend this matter.
17 | ||
Naeyaert
On April 13, 2017, Kimberly-Clark was served with a complaint in the matter styled Christopher Naeyaert v. Kimberly-Clark Corporation, et al., No. PSC 1603503 (County of Riverside, Superior Court of California), filed on July 21, 2016. In that case, the plaintiff makes allegations similar to those in Bahamas and brings causes of action similar to those in Bahamas, except the allegations and causes of action relate to the Ultra surgical gown. On June 5, 2017, Kimberly-Clark moved to dismiss the complaint. On August 21, 2017, Naeyaert filed an amended complaint and on September 18, 2017, Kimberly-Clark filed a motion to dismiss the amended complaint. We may have an Indemnification Obligation for this matter under the distribution agreement with Kimberly-Clark and have notified Kimberly-Clark that we reserve our rights to challenge the obligation to indemnify Kimberly-Clark for any damages or penalties which are not indemnifiable under applicable law or public policy. We intend to vigorously defend this matter.
Patent Litigation
We operate in an industry characterized by extensive patent litigation and competitors may claim that our products infringe upon their intellectual property. Resolution of patent litigation or other intellectual property claims is typically time consuming and costly and can result in significant damage awards and injunctions that could prevent the manufacture and sale of the affected products or require us to make significant royalty payments in order to continue selling the affected products. At any given time we may be involved as either a plaintiff or a defendant in a number of patent infringement actions, the outcomes of which may not be known for prolonged periods of time.
General
While we maintain general and professional liability, product liability and other insurance, our insurance policies may not cover all of these matters and may not fully cover liabilities arising out of these matters. In addition, we may be obligated to indemnify our directors and officers against these matters.
Although the results of litigation and claims cannot be predicted with certainty, we believe that the ultimate resolution of these matters will not materially impact our liquidity, access to capital markets or ability to conduct our daily operations.
As of December 31, 2017, we have an accrued liability for the matters described herein. The accrued liability is included in “Accrued Expenses” in the consolidated balance sheet. Our estimate of these liabilities is based on facts and circumstances existing at this time, along with other variables. Factors that may affect our estimate include, but are not limited to: (i) changes in the number of lawsuits filed against us, including the potential for similar, duplicate or “copycat” lawsuits filed in multiple jurisdictions, including lawsuits that bring causes or action or allege violations of law with regard to additional products; (ii) changes in the legal costs of defending such claims; (iii) changes in the nature of the lawsuits filed against us, (iv) changes in the applicable law governing any legal claims against us; (v) a determination that our assumptions used in estimating the liability are no longer reasonable; and (vi) the uncertainties associated with the judicial process, including adverse judgments rendered by courts or juries. Thus, the actual amount of these liabilities for existing and future claims could be different than the accrued amount. Additionally, the above matters, regardless of the outcome, could disrupt our business and result in substantial costs and diversion of management attention.
Environmental Compliance
We are subject to federal, state and local environmental protection laws and regulations with respect to our business operations and are operating in compliance with, or taking action aimed at ensuring compliance with, these laws and regulations. None of our compliance obligations with environmental protection laws and regulations, individually or in the aggregate, is expected to have a material adverse effect on our business, financial condition, results of operations or liquidity.
ITEM 4. MINE SAFETY DISCLOSURES
Not applicable.
18 | ||
EXECUTIVE OFFICERS OF THE REGISTRANT
The names and ages of our executive officers as of February 27, 2018, together with certain biographical information, are as follows:
Name | Position | |
Joseph F. Woody | Chief Executive Officer | |
Rhonda D. Gibby | Senior Vice President and Chief Human Resources Officer | |
Warren J. Machan | Senior Vice President - Business Strategy | |
Steven E. Voskuil | Senior Vice President and Chief Financial Officer | |
John W. Wesley | Senior Vice President and General Counsel | |
Joseph F. Woody, age 52, was appointed as Chief Executive Officer on June 26, 2017. Mr. Woody has more than 20 years of experience in the healthcare sector. Prior to joining the Company, Mr. Woody served as Director, President and Chief Executive Officer of Acelity Holdings, Inc. (“Acelity”), a global advanced wound care and regenerative medicine company, from August 2015 until April 2017. Prior to that, Mr. Woody served as President and Chief Executive Officer for the combined organization of Kinetic Concepts, Inc. (“KCI”), LifeCell Corporation (“LifeCell”), and Systagenix Wound Management B.V., which became Acelity, from September 2013 until August 2015. Prior to that, Mr. Woody served in leadership roles at KCI and LifeCell from November 2011 until September 2013, having been promoted to President and Chief Executive Officer of KCI in January 2012 and interim Chief Executive Officer of LifeCell in April 2013. Previously, Mr. Woody served as global president of Vascular Therapies for Covidien plc, and global president for Smith & Nephew Advanced Wound Management, and he held other leadership positions at Alliance Imaging, Inc., Acuson and GE Medical Systems.
Rhonda D. Gibby, age 50, is our Senior Vice President and Chief Human Resources Officer. Prior to the Spin-off, she had been serving as Kimberly-Clark’s Vice President - Human Resources for its global business-to-business units (K-C Professional and Kimberly-Clark’s Health Care business) as well as the leader of Kimberly-Clark’s global labor relations since 2010. Prior to that, Ms. Gibby served as Kimberly-Clark’s Global Vice President of Talent Management from 2008 to 2010. Prior to joining Kimberly-Clark in 2005, Ms. Gibby held leadership roles in operations, sales and human resources in a variety of industries and employers, including most recently at Covidien, a global healthcare products company.
Warren J. Machan, age 52, is our Senior Vice President - Business Strategy. Prior to the Spin-off, he had been serving as Kimberly-Clark’s Senior Director of Strategy - Global Health Care since January 2012 and before that served as Senior Director of Finance for Kimberly-Clark’s Health Care business from 2008 to 2012. Mr. Machan served as Director of Finance and Strategic Planning for the Kimberly-Clark International business from 2004 to 2008. He joined Kimberly-Clark in 1987 and, while spending the majority of time in Kimberly-Clark’s Health Care business, he has also held roles in sales, marketing and finance for the K-C Professional, Personal Care and Family Care businesses.
Steven E. Voskuil, age 49, is our Senior Vice President and Chief Financial Officer. Prior to the Spin-off, he had been serving as Vice President - Finance for Kimberly-Clark International since September 2011 and previously served as Kimberly-Clark’s Vice President and Treasurer from January 2008 to September 2011. He joined Kimberly-Clark in 1991 in Finance and has held a variety of roles in business analysis, strategic analysis and treasury for Kimberly-Clark’s businesses worldwide.
John W. Wesley, age 59, is our Senior Vice President of Legal and Government Relations. Prior to the Spin-off, he had been serving as Kimberly-Clark’s Vice President, Deputy General Counsel and Corporate Secretary since 2009. He joined Kimberly-Clark in May 2000 as Senior Counsel, Corporate Affairs and has held a variety of positions, overseeing corporate transactions and corporate governance matters. Prior to joining Kimberly-Clark, he was a partner at the Dallas law firm of Carrington, Coleman, Sloman & Blumenthal, L.L.P., where he specialized in corporate, securities, corporate finance, mergers and acquisitions and general, commercial and business law.
19 | ||
PART II
ITEM 5. | MARKET FOR REGISTRANT’S COMMON EQUITY, RELATED STOCKHOLDER MATTERS AND ISSUER PURCHASES OF EQUITY SECURITIES |
Halyard common stock is listed on the New York Stock Exchange (“NYSE”) under the ticker symbol “HYH”. The following table sets forth the quarterly high and low sales prices per share of our common stock on the NYSE:
2017 | 2016 | ||||||||||||||
Three Months Ended: | High | Low | High | Low | |||||||||||
March 31 | $ | 41.84 | $ | 36.00 | $ | 33.73 | $ | 22.76 | |||||||
June 30 | 40.97 | 35.24 | 34.10 | 26.05 | |||||||||||
September 30 | 46.63 | 38.22 | 37.31 | 32.50 | |||||||||||
December 31 | 50.99 | 41.51 | 39.54 | 31.59 | |||||||||||
We did not pay any dividends on our common stock in the years ended December 31, 2017 and 2016 and we do not expect to pay any cash dividends on our common stock in the foreseeable future.
As of February 16, 2018, we had 14,470 holders of record of our common stock.
For information relating to securities authorized for issuance under equity compensation plans, see Part III, Item 12 of this Form 10-K.
Performance
The following graph compares the cumulative total return of our common stock from October 21, 2014, the first day of trading for our common stock on a when-issued basis, through December 31, 2017 with the cumulative return of companies comprising the Standard and Poor’s S&P MidCap 400 Index and the S&P 500 Health Care Equipment and Services Index. The graph plots the change in value of an initial investment of $100 in each of our common stock, the S&P MidCap 400 Index and the S&P 500 Health Care Equipment and Services Index over the indicated time periods and assumes reinvestment of all dividends, if any, paid on the securities. We have not paid any cash dividends, and therefore, the cumulative total return calculation for us is based solely upon stock price appreciation and not upon reinvestment of cash dividends. The stock price performance shown on the graph is not necessarily indicative of future price performance.
20 | ||
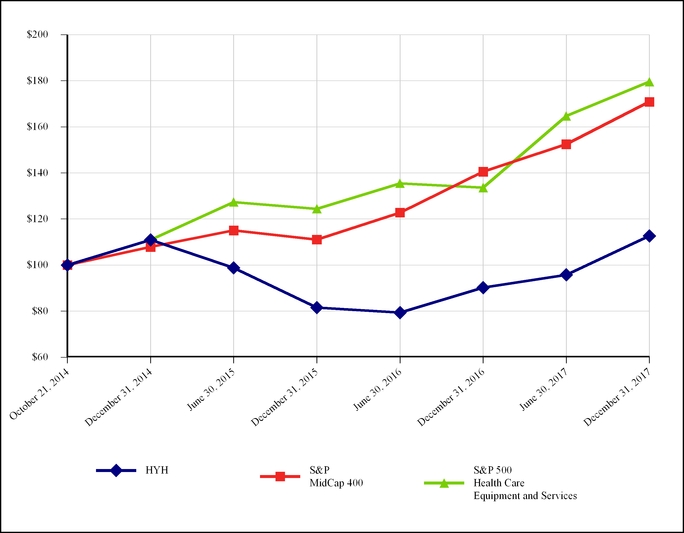
HYH | S&P MidCap 400 | S&P 500 Health Care Equipment and Services | ||||||
October 21, 2014 | 100.00 | 100.00 | 100.00 | |||||
December 31, 2014 | 110.90 | 107.89 | 110.93 | |||||
June 30, 2015 | 98.78 | 115.04 | 127.35 | |||||
December 31, 2015 | 81.49 | 111.07 | 124.40 | |||||
June 30, 2016 | 79.32 | 122.77 | 135.49 | |||||
December 31, 2016 | 90.20 | 140.54 | 133.59 | |||||
June 30, 2017 | 95.80 | 152.45 | 164.68 | |||||
December 31, 2017 | 112.63 | 170.88 | 179.53 | |||||
ITEM 6. | SELECTED FINANCIAL DATA |
The following Selected Financial Data has been revised to reflect discontinued operations (see “Discontinued Operations” in Note 2 to the consolidated financial statements in Item 8 of this report). The Selected Financial Data as of December 31, 2017 and 2016 and for each of the years ended December 31, 2017, 2016 and 2015 have been derived from our audited consolidated financial statements which are included in Item 8 of this report. Selected Financial Data as of December 31, 2015, 2014 and 2013 and for each of the years ended December 31, 2014 and 2013 has been derived from our consolidated financial
21 | ||
information but is not included in Item 8 of this report. The Selected Financial Data as of and for the years ended December 31, 2014 and 2013 is unaudited. The following Selected Financial Data is not necessarily indicative of future performance and should be read in conjunction with Item 7, “Management’s Discussion and Analysis of Financial Condition and Results of Operations” and Item 8, “Financial Statements and Supplementary Data” in this annual report on Form 10-K (in millions, except per-share amounts):
Year Ended December 31, | |||||||||||||||||||
2017 | 2016 | 2015 | 2014 (Unaudited) | 2013 (Unaudited) | |||||||||||||||
Income Statement Data: | |||||||||||||||||||
Net Sales | $ | 611.6 | $ | 566.2 | $ | 509.0 | $ | 501.6 | $ | 499.0 | |||||||||
Operating Profit (Loss) | (43.1 | ) | (107.1 | ) | (135.7 | ) | (12.3 | ) | 74.1 | ||||||||||
Income (Loss) from Continuing Operations | (32.1 | ) | (83.3 | ) | (101.2 | ) | (40.5 | ) | 43.7 | ||||||||||
Income (Loss) from Discontinued Operations, net of tax | 111.4 | 123.1 | (325.1 | ) | 67.6 | 110.9 | |||||||||||||
Net Income(a)(b)(c)(d) | 79.3 | 39.8 | (426.3 | ) | 27.1 | 154.6 | |||||||||||||
Basic Earnings (Loss) Per Share: | |||||||||||||||||||
Continuing Operations | $ | (0.69 | ) | $ | (1.79 | ) | $ | (2.17 | ) | $ | (0.87 | ) | $ | 0.94 | |||||
Discontinued Operations | 2.38 | 2.64 | (6.98 | ) | 1.45 | 2.38 | |||||||||||||
Basic Earnings (Loss) Per Share | 1.69 | 0.85 | (9.15 | ) | 0.58 | 3.32 | |||||||||||||
Diluted Earnings (Loss) Per Share: | |||||||||||||||||||
Continuing Operations | $ | (0.69 | ) | $ | (1.79 | ) | $ | (2.17 | ) | $ | (0.87 | ) | $ | 0.94 | |||||
Discontinued Operations | 2.38 | 2.64 | (6.98 | ) | 1.45 | 2.38 | |||||||||||||
Diluted Earnings (Loss) Per Share | 1.69 | 0.85 | (9.15 | ) | 0.58 | 3.32 | |||||||||||||
______________________________
(a) | Net income in 2017 includes $13 million, net of tax, of costs related to legal expenses and litigation (see “Commitments and Contingencies” in Note 13 to the consolidated financial statements in Item 8 of this report), $13 million, net of tax, of Divestiture-related charges, $5 million, net of tax, related to the integration of Corpak (see “Business Acquisition” in Note 6 to the consolidated financial statements in Item 8 of this report), $3 million, net of tax, of restructuring charges (see “Restructuring Activities” in Note 3 to the consolidated financial statements in Item 8 of this report) and a $10 million tax benefit as a result of recent passage of tax reform legislation (see “Income Taxes” in Note 9 to the consolidated financial statements in Item 8 of this report). |
(b) | Net income in 2016 includes $14 million, net of tax, of spin-related transition expenses, $13 million, net of tax, of costs related to legal expenses and litigation and $11 million, net of tax, of costs related to our acquisition of Corpak. |
(c) | Net loss in 2015 includes a $474 million goodwill impairment charge, $33 million, net of tax, of spin-related transition expenses and $11 million, net of tax, of costs related to legal expenses and litigation partially offset by a $8 million net gain on the disposal of one of our exam glove manufacturing facilities in Thailand. |
(d) | Net income in 2014 includes charges of $88 million, net of tax, related to the spin-off, $47 million, net of tax, related to strategic changes to our manufacturing footprint and $8 million, net of tax, of post spin-off transition charges. |
As of December 31, | |||||||||||||||||||
2017 | 2016 | 2015 | 2014 (Unaudited) | 2013 (Unaudited) | |||||||||||||||
Balance Sheet Data: | |||||||||||||||||||
Cash | $ | 219.7 | $ | 113.7 | $ | 129.5 | $ | 149.0 | $ | 44.1 | |||||||||
Property, Plant and Equipment, Net | 109.9 | 109.3 | 115.9 | 114.9 | 100.9 | ||||||||||||||
Total Assets | 2,195.9 | 2,071.8 | 2,000.2 | 2,517.9 | 2,484.0 | ||||||||||||||
Debt | $ | 580.9 | 579.0 | 578.1 | 626.5 | 11.9 | |||||||||||||
Stockholders’ Equity | 1,215.4 | 1,102.5 | 1,055.3 | 1,491.2 | — | ||||||||||||||
Kimberly-Clark’s Net Investment | — | — | — | — | 2,098.7 | ||||||||||||||
22 | ||
ITEM 7. | MANAGEMENT’S DISCUSSION AND ANALYSIS OF FINANCIAL CONDITION AND RESULTS OF OPERATIONS |
Introduction
Halyard is a medical technology company focused on eliminating pain, speeding recovery and preventing infection for healthcare providers and patients. We are committed to addressing some of today’s most important healthcare needs, such as reducing the use of opioids while helping patients move from surgery to recovery. Our Medical Devices business segment develops, manufactures and markets clinically superior solutions around the globe.
This Management’s Discussion and Analysis of Financial Condition and Results of Operations (“MD&A”) is intended to provide investors with an understanding of our recent performance, financial condition and prospects and should be read in conjunction with the consolidated financial statements contained in Item 8, “Financial Statements and Supplementary Data” in this annual report on Form 10-K. The following will be discussed and analyzed:
• | Divestiture of the Surgical and Infection Prevention (“S&IP”) Business |
• | Discontinued Operations |
• | Restructuring Activities |
• | Results of Operations and Related Information |
• | Unaudited Quarterly Data |
• | Liquidity and Capital Resources |
• | Critical Accounting Policies and Use of Estimates |
• | Legal Matters |
• | Information Concerning Forward Looking Statements |
Divestiture of the S&IP Business
On October 31, 2017, we entered into a Purchase Agreement (“Purchase Agreement”) by and among us and certain of our affiliates and Owens & Minor, Inc. (the “Buyer”). The Purchase Agreement provides for the sale to Buyer, subject to the terms and conditions of the Purchase Agreement, of substantially all of our S&IP business, as well as our name “Halyard Health” (and all variations of our name and related intellectual property rights) and our IT system (the “Divestiture”). The total price payable by the Buyer for the Divestiture is $710 million in cash, subject to certain adjustments as provided in the Purchase Agreement based on the cash, indebtedness and net working capital transferred to the Buyer and its affiliates at the closing. We expect the transaction to close early in the second quarter of 2018.
As a focused Medical Devices business, Halyard will be operating in attractive end-markets. We will deploy a dual-track growth strategy focused on product development and M&A while right-sizing the cost structure of our operations to create a scalable and cost efficient infrastructure. We have initiated a multi-year phased restructuring to reduce dis-synergies and corporate costs. See “Restructuring Activities” below for further discussion.
On or about the closing date, we will enter into certain commercial agreements, including a transition services agreement with the Buyer pursuant to which we and the Buyer, and each company’s respective affiliates, will provide to each other various transitional services. The services will generally commence on the closing date of the Divestiture and terminate no later than two years thereafter.
For the year ended December 31, 2017, we have incurred $20 million of costs related to the Divestiture, consisting primarily of professional fees for legal, due diligence, consulting, tax and accounting services and is included in “Selling and general expenses” in the consolidated income statement in Item 8 of this report.
Discontinued Operations
As a result of the pending Divestiture, the results of operations from our S&IP business are reported as “Income (Loss) from discontinued operations, net of tax” and the related assets and liabilities are classified as “held for sale” in the consolidated financial statements in Item 8 of this report. See “Discontinued Operations” in Note 2 to the consolidated financial statements in Item 8 of this report.
23 | ||
Net sales from discontinued operations were $1,013 million for the year ended December 31, 2017, compared to $1,026 million in 2016 and $1,065 million in 2015. Favorable volume and currency effects were offset by pricing pressure, resulting in a decrease in net sales in 2017. Price loss along with lower sales of rolled non-woven material were the primary drivers of the decline in net sales between 2015 and 2016.
Restructuring Activities
In December 2017, in conjunction with the Divestiture, we initiated the initial phase of a multi-year restructuring plan (the “Plan”). The initial phase of the Plan is intended to align our organizational and management structure with the our remaining Medical Devices business.
We expect to incur between $8 million and $10 million of pre-tax costs, of which $6 million to $7 million will be for employee severance and benefits and the remainder for third-party services and other related costs. These are mainly cash costs that will be incurred as we execute the Plan, which we expect to substantially complete by the end of 2019. We expect savings between $11 million and $13 million on an annualized basis once the initial phase of the Plan is completed.
We have incurred $5 million of costs, primarily for employee severance and benefits. These costs are included in “Cost of products sold” and “Selling and general” expenses in the consolidated income statement for the year ended December 31, 2017. For the year ended December 31, 2017, no severance and benefits payments have been made and the remaining liability in “Accrued expenses” for employee severance and benefits was $5 million in the accompanying consolidated balance sheet as of December 31, 2017.
Results of Operations and Related Information
Costs Included in Continuing Operations
The results of operations described below excludes the S&IP business, which is reported in “Income (Loss) from Discontinued Operations, net of tax” in the consolidated income statement for all periods presented. In accordance with accounting principles generally accepted in the United States (“GAAP”), only costs specifically identifiable and attributable to a business to be disposed may be allocated to discontinued operations. Accordingly, certain costs that were historically presented as a component of the S&IP business were included in continuing operations. These costs, on a pre-tax basis, were $116 million in the year ended December 31, 2017, $114 million in 2016 and $133 million in 2015.
Other items impacting operating results include:
Restructuring costs: As previously described under “Restructuring Activities,” we have incurred $5 million of costs related to the Plan for the year ended December 31, 2017.
Acquisition-related costs: Acquisition, integration and restructuring expenses related to our acquisition of Medsystems Holdings, Inc. (“Corpak”) were $8 million in the year ended December 31, 2017 and $18 million in 2016. See “Business Acquisition” in Note 6 to the consolidated financial statements in Item 8 of this report.
Spin-related costs: Spin-related activities were not material in 2017, but resulted in $14 million of costs primarily for rebranding activities in the year ended December 31, 2016 and $46 million in 2015.
Litigation and legal: We incurred $21 million, $20 million and $17 million of expenses for certain litigation matters in the years ended December 31, 2017, 2016 and 2015, respectively. See “Commitments and Contingencies” in Note 13 to the consolidated financial statements in Item 8 of this report.
24 | ||
Our net sales and operating profit (loss) is summarized in the following tables for the years ended December 31, 2017, 2016 and 2015 (in millions):
Net Sales
Year Ended December 31, | |||||||||||||||||
2017 | 2016 | Change | 2015 | Change | |||||||||||||
Net sales | $ | 611.6 | $ | 566.2 | 8.0 | % | $ | 509.0 | 11.2 | % | |||||||
Total | Volume(c) | Pricing/Mix | Currency | ||||||||||||||
Net Sales - percentage change 2017 vs. 2016 | 8 | % | 8 | % | — | % | — | % | |||||||||
Net Sales - percentage change 2016 vs. 2015 | 11 | % | 11 | % | — | % | — | % | |||||||||
______________________________
(a) | Volume includes incremental sales of Corpak products. |
Operating Profit (Loss)
Year Ended December 31, | |||||||||||||||||
2017 | 2016 | Change | 2015 | Change | |||||||||||||
Medical Devices operating profit(a) | $ | 155.2 | $ | 123.8 | 25.4 | % | $ | 107.8 | 14.8 | % | |||||||
Corporate and other costs(b)(c)(d) | (178.2 | ) | (211.2 | ) | N.M. | (227.3 | ) | N.M. | |||||||||
Other income and (expense), net(e) | (20.1 | ) | (19.7 | ) | N.M. | (16.2 | ) | N.M. | |||||||||
Operating loss | $ | (43.1 | ) | $ | (107.1 | ) | N.M. | $ | (135.7 | ) | N.M. | ||||||
_______________________________________________
(a) | In the years ended December 31, 2017 and 2016, and 2015, we recorded $21 million, $21 million and $25 million, respectively, of intangibles amortization expense. |
(b) | For the year ended December 31, 2017, Corporate and other costs included $116 million, respectively, of costs historically presented as a component of the S&IP business, $55 million of general expenses, $5 million of restructuring costs and $8 million of acquisition-related charges partially offset by a $6 million benefit related to realignment of internal policies for our post-divestiture business. |
(c) | For the year ended December 31, 2016, Corporate and other costs included $114 million of costs historically presented as a component of the S&IP business, $66 million of general expenses, $14 million of post spin-related costs $18 million, respectively, of acquisition-related charges. |
(d) | For the year ended December 31, 2015, Corporate and other costs included $133 million of costs historically presented as a component of the S&IP business, $49 million of general expenses and $46 million of post spin-related expenses. |
(e) | Other expense, net is primarily costs related to litigation and legal matters. |
N.M. - not meaningful
Results of Operations - 2017 Compared to 2016
Net sales increased by 8% to $612 million, driven by a 5% growth in volume across all product categories, with Corpak adding an additional 3% of volume. There is growing demand for our non-opioid pain products, On-Q for surgical pain and our Coolief interventional pain therapy. Other factors in improved volume include growth in our Corpak products and the conversion of a GPO contract for oral care products. Volume growth was also the primary driver in Medical Devices operating profit, along with lower selling and general expenses driven by synergies from our Corpak integration, resulting in a 25% increase compared to Medical Devices operating profit in 2016.
Results of Operations - 2016 Compared to 2015
Net sales increased 11% to $566 million for the year ended December 31, 2016 compared to 2015. The acquisition of Corpak provided $36 million, or 7% of the increase, and the remaining 4% is the result of improved sales volume across all product categories. Improved profitability in our Medical Devices business in 2016 compared to 2015 was likewise driven by incremental net sales provided by the Corpak acquisition and volume gains, but was partially offset by higher research and development spending and higher selling expenses.
25 | ||
Net Sales by Geographic Region
The factors causing volume growth were consistent throughout our geographic regions. Net sales by region is presented in the table below (in millions):
Year Ended December 31, | |||||||||||||||||
(in millions) | 2017 | 2016 | Change | 2015 | Change | ||||||||||||
North America | $ | 473.4 | $ | 436.1 | 8.6 | % | $ | 395.0 | 10.4 | % | |||||||
EMEA | 84.0 | 78.4 | 7.1 | 69.4 | 13.0 | ||||||||||||
Asia Pacific and Latin America | 54.2 | 51.7 | 4.8 | 44.6 | 15.9 | ||||||||||||
Total Net Sales | $ | 611.6 | $ | 566.2 | 8.0 | % | $ | 509.0 | 11.2 | % | |||||||
Interest Expense
Interest expense was $32 million in the year ended December 31, 2017 and $33 million in each of the years ended December 31, 2016 and 2015, respectively. Interest expense consists of interest accrued and amortization of debt discount and issuance costs on our senior secured term loan and our senior unsecured notes. See “Debt” in Note 8 to the consolidated financial statements in Item 8 of this report for further discussion of our indebtedness.
Provision for Income Taxes
On December 22, 2017, the Tax Cuts and Jobs Act of 2017 (the “Act”) was signed into law making significant changes to the Internal Revenue Code. Changes include, but are not limited to, a corporate tax rate decrease from 35% to 21% effective for tax years beginning after December 31, 2017, the transition of U.S international taxation from a worldwide tax system to a territorial system, and a one-time transition tax on the mandatory deemed repatriation of cumulative foreign earnings as of December 31, 2017. We have calculated our best estimate of the impact of the Act in our year end income tax provision in accordance with our understanding of the Act and guidance available as of the date of this filing and as a result have recorded $10 million as additional income tax benefit in the fourth quarter of 2017, the period in which the legislation was enacted. The provisional amount related to the re-measurement of certain deferred tax assets and liabilities, based on the rates at which they are expected to reverse in the future, was $16 million of benefit. The provisional amount related to the one-time transition tax on the mandatory deemed repatriation of foreign earnings was $7 million based on cumulative foreign earnings of $101 million. We also recorded a $1 million benefit related to the treatment of current year cash dividends in relation to the repatriation tax.
Our overall effective tax rate was a 56% benefit for the year ended December 31, 2017 compared to a benefit of 40% in each of the years ended December 31, 2016 and 2015, respectively. The primary driver in the change in our effective tax rate is the benefit from the Act, as discussed above. See “Income Taxes” in Note 9 to the consolidated financial statements in Item 8 of this report for further details regarding our income taxes.
26 | ||
Unaudited Quarterly Data
2017 | 2016 | ||||||||||||||||||||||||||||||
(in millions, except per-share amounts) | Fourth | Third | Second | First | Fourth | Third | Second | First | |||||||||||||||||||||||
Net Sales | $ | 166.3 | $ | 150.5 | $ | 149.1 | $ | 145.7 | $ | 153.5 | $ | 145.1 | $ | 141.2 | $ | 126.4 | |||||||||||||||
Gross Profit | 89.9 | 81.0 | 84.5 | 81.5 | 78.0 | 75.3 | 73.7 | 70.2 | |||||||||||||||||||||||
Operating (Loss) Profit (a)(b) | (3.0 | ) | (10.4 | ) | (12.1 | ) | (17.6 | ) | (30.4 | ) | (24.4 | ) | (33.0 | ) | (19.3 | ) | |||||||||||||||
Net Income (Loss) from continuing operations | 4.4 | (10.2 | ) | (11.4 | ) | (14.9 | ) | (21.9 | ) | (19.6 | ) | (25.5 | ) | (16.3 | ) | ||||||||||||||||
Income from Discontinued Operations, net of tax | 28.4 | 26.8 | 28.5 | 27.7 | 31.9 | 28.7 | 32.0 | 30.5 | |||||||||||||||||||||||
Net income | $ | 32.8 | $ | 16.6 | $ | 17.1 | $ | 12.8 | $ | 10.0 | $ | 9.1 | $ | 6.5 | $ | 14.2 | |||||||||||||||
Basic Earnings (Loss) Per Share: | |||||||||||||||||||||||||||||||
Continuing operations | $ | 0.09 | $ | (0.22 | ) | $ | (0.24 | ) | $ | (0.32 | ) | $ | (0.47 | ) | $ | (0.42 | ) | $ | (0.55 | ) | $ | (0.35 | ) | ||||||||
Discontinued operations | 0.61 | 0.57 | 0.61 | 0.59 | 0.68 | 0.61 | 0.69 | 0.65 | |||||||||||||||||||||||
Net income | 0.70 | 0.35 | 0.37 | 0.27 | 0.21 | 0.19 | 0.14 | 0.30 | |||||||||||||||||||||||
Diluted Earnings (Loss) Per Share: | |||||||||||||||||||||||||||||||
Continuing operations | $ | 0.09 | $ | (0.22 | ) | $ | (0.24 | ) | $ | (0.32 | ) | $ | (0.47 | ) | $ | (0.42 | ) | $ | (0.55 | ) | $ | (0.35 | ) | ||||||||
Discontinued operations | 0.60 | 0.57 | 0.61 | 0.59 | 0.68 | 0.61 | 0.69 | 0.65 | |||||||||||||||||||||||
Net income | 0.69 | 0.35 | 0.37 | 0.27 | 0.21 | 0.19 | 0.14 | 0.30 | |||||||||||||||||||||||
______________________________
(a) | Operating profit in 2017 includes $116 million of costs historically presented as a component of the S&IP business (see “Discontinued Operations” in Note 2 to the consolidated financial statements in Item 8 of this report), $21 million of expenses related to legal matters (see “Commitments and Contingencies” in Note 13 to the consolidated financial statements in Item 8 of this report), $8 million of acquisition-related expenses (see “Business Acquisition” in Note 6 to the consolidated financial statements in Item 8 of this report) and $5 million of restructuring charges (see “Restructuring” in Note 3 to the consolidated financial statements in Item 8 of this report), |
(b) | Operating profit in 2016 includes $114 million of costs historically presented as a component of the S&IP business, $20 million of expenses related to legal matters, $18 million of acquisition-related expenses and $14 million of post spin-related expenses. |
27 | ||
Liquidity and Capital Resources
General
Our primary sources of liquidity are cash on hand provided by operating activities and amounts available under our revolving credit facility. Cash provided by operations has been and is expected to remain a primary source of funds. Cash provided by operations has historically generated sufficient cash to fund our investments in working capital and capital expenditures. As of December 31, 2017, $106 million of our $220 million of cash and cash equivalents was held by foreign subsidiaries. We consider the undistributed earnings of our foreign subsidiaries to be indefinitely reinvested and currently do not have plans to repatriate such earnings. See further discussion below in “Critical Accounting Policies and Use of Estimates” under “Income Taxes.” We do not expect restrictions on repatriation of cash held outside of the United States to have a material effect on our overall liquidity, financial condition or results of operations for the foreseeable future. We believe that our ability to generate cash from domestic and international operations and the borrowing capacity under our available credit facilities are adequate to fund our requirements for working capital, capital expenditures and other investments necessary to grow our business for the foreseeable future for both our domestic and international operations.
As described earlier under “Divestiture of the S&IP Business”, we expect to close the Divestiture in the second quarter of 2018 and receive approximately $600 million of net proceeds from the sale which will be used to preserve our debt capacity and reinvest into the business through acquisition and organic growth.
Cash and equivalents increased by $106 million to $220 million as of December 31, 2017 compared to $114 million last year. The increase was driven by $144 million of cash flow from operations, $3 million from favorable currency exchange rates and $2 million from financing activities partially offset by $43 million of capital expenditures.
Cash and equivalents decreased by $16 million to $114 million as of December 31, 2016 compared to $130 million as of December 31, 2015. The decrease was driven by $175 million used in our acquisition of Corpak and $29 million of capital expenditures partially offset by $189 million of cash provided by operating activities.
Cash and equivalents decreased by $19 million to $130 million as of December 31, 2015 compared to $149 million as of December 31, 2014. The decrease was driven primarily by $51 million of debt repayments and $70 million of capital expenditures partially offset by $98 million of cash provided by operating activities.
Operating Activities
Operating activities provided $144 million in the year ended December 31, 2017 compared to $189 million last year. Changes in operating assets and liabilities used $4 million in 2017, driven by a build-up of inventories in anticipation of integrating the production from our Buffalo Grove facility into our other existing facilities and an increase in accounts receivable due to higher net sales. Changes in operating assets and liabilities improved in 2016, particularly inventories and accrued expenses, resulting in a $92 million benefit to operating cash flow.
Operating activities provided $189 million in the year ended December 31, 2016 compared to $98 million in 2015 primarily due to improvements in operating assets and liabilities.
Investing Activities
Investing activities consisted of $43 million of capital expenditures in the year ended December 31, 2017, compared to $201 million used in investing activities last year, which consisted of $175 million used to acquire Corpak and $29 million of capital expenditures partially offset by $3 million of proceeds from property disposals.
Investing activities used $63 million in the year ended December 31, 2015, driven by $70 million of capital expenditures partially offset by $8 million of proceeds from property disposals.
Financing Activities
Financing activities provided $2 million in the year ended December 31, 2017, consisting of $5 million cash received from the exercise of stock options partially offset by $3 million used to acquire treasury stock.
During 2016, we borrowed and repaid $72 million from our revolving credit facility and paid $1 million of debt issuance costs in conjunction with an amendment to our senior secured term loan facility (see discussion under “Long Term Debt” below).
In 2015, financing activities used $51 million, consisting primarily of debt repayments.
28 | ||
Long-Term Debt
As of December 31, 2017, total debt was $581 million, consisting of (i) $334 million, net of unamortized discount, on our senior secured term loan and (ii) $247 million, net of unamortized discount, on our senior unsecured notes.
Our senior secured term loan matures on October 31, 2021 (the “Term Loan Facility”) and is under a credit agreement that also includes a senior secured revolving credit facility that matures on October 31, 2019 which allows for borrowings up to $250 million, with a letter of credit sub-facility in an amount of $75 million and a swingline sub-facility in an amount of $25 million (the “Revolving Credit Facility” and along with the Term Loan Facility, the “Senior Credit Facilities”). The Senior Credit Facilities allow for floating rate LIBOR or base rate loans.
The credit agreement contains an excess cash flow provision that requires a mandatory principal prepayment of our Term Loan Facility if we generate cash in excess of a defined measure of cash flow. Accordingly, we are required to prepay $40 million under this prepayment requirement as we generated Excess Cash in the year ended December 31, 2017. This prepayment is classified as “Current portion of long-term debt” in the consolidated balance sheet in Item 8 of this report and will be paid in the first quarter of 2018.
Funds under our Revolving Credit Facility are available for acquisitions, working capital or other requirements. To the extent we remain in compliance with certain financial covenants in our credit agreement, funds under the revolving credit facility are available for our working capital and other liquidity requirements. As of December 31, 2017, we had no borrowings and letters of credit of $3 million outstanding under the Revolving Credit Facility.
We also have $250 million of senior unsecured notes that mature on October 15, 2022, bearing interest at a fixed interest rate of 6.25% per annum with interest payable semi-annually in arrears on April 15 and October 15 of each year.
For further information regarding our debt arrangements, see “Debt” in Note 8 to the consolidated financial statements in Item 8 of this report.
Obligations
The following table presents our total contractual obligations, including obligations related to discontinued operations (see “Discontinued Operations” in Note 2 to the consolidated financial statements in Item 8 of this report) for which cash flows are fixed or determinable as of December 31, 2017 (in millions):
Payments Due by Period | |||||||||||||||||||
Total | Less than 1 Year | 1-3 Years | 3-5 Years | More than 5 Years | |||||||||||||||
Debt | $ | 589.0 | $ | 39.8 | $ | — | $ | 549.2 | $ | — | |||||||||
Interest payments on long-term debt | 132.2 | 29.7 | 59.5 | 43.0 | — | ||||||||||||||
Operating leases | 103.2 | 18.0 | 26.8 | 19.2 | 39.2 | ||||||||||||||
Open purchase orders(a) | 294.8 | 265.8 | 28.6 | 0.4 | — | ||||||||||||||
Pension obligations | 7.0 | 0.3 | 1.1 | 1.0 | 4.6 | ||||||||||||||
Other commitments(b) | 70.1 | 16.2 | 25.7 | 14.2 | 14.0 | ||||||||||||||
Total contractual obligations | $ | 1,196.3 | $ | 369.8 | $ | 141.7 | $ | 627.0 | $ | 57.8 | |||||||||
______________________________
(a) | The open purchase orders displayed in the table represent amounts that we anticipate will become payable within the next year for goods and services that we have negotiated for delivery. The table does not include payments that are discretionary or for which timing is uncertain. |
(b) | Other commitments consists primarily of lease executory costs for insurance, maintenance and taxes on leased properties of $20 million, take or pay contracts of $47 million and uncertain tax positions of $3 million. See “Income Taxes” in Note 9 to the consolidated financial statements in Item 8 of this report. |
Critical Accounting Policies and Use of Estimates
The preparation of financial statements in conformity with accounting principles generally accepted in the United States of America (“GAAP”) requires management to make estimates and assumptions that affect the reported amounts of assets and liabilities at the date of the financial statements and the reported amounts of net sales and expenses during the reporting period. The critical accounting policies we used in the preparation of the consolidated and combined financial statements are those that are important both to the presentation of our financial condition and results of operations and require significant judgments by management with regard to estimates used. The critical judgments by management relate to distributor rebate accruals, future
29 | ||
cash flows associated with impairment testing for goodwill and long-lived assets, loss contingencies and deferred income taxes and potential tax assessments.
Recently Adopted and Issued Pronouncements
See “Accounting Policies” in Note 1 to the consolidated financial statements in Item 8 of this report for recently adopted and recently issued accounting pronouncements.
Use of Estimates
We prepare our consolidated financial statements in accordance with GAAP, which requires that we make estimates and assumptions that affect the reported amounts of assets and liabilities at the date of the financial statements and the reported amounts of net sales and expenses during the reporting periods. Estimates are used in accounting for, among other things, certain amounts included in discontinued operations, certain amounts included in assets and liabilities held for sale, distributor rebate accruals, future cash flows associated with impairment testing for goodwill and long-lived assets, loss contingencies, and deferred tax assets and potential income tax assessments. Actual results could differ from these estimates, and the effect of the change could be material to our financial statements. Changes in these estimates are recorded when known.
Revenue Recognition and Accounts Receivable
Sales revenue is recognized at the time of product shipment or delivery, depending on when title passes, to unaffiliated customers, and when all of the following have occurred: evidence of a sales arrangement is in place, pricing is fixed or determinable, and collection is reasonably assured. Sales are reported net of returns, rebates and freight allowed. Distributor rebates are estimated based on the historical cost difference between list prices and average end-user contract prices and the quantity of products expected to be sold to specific end users. We maintain liabilities at the end of each period for the estimated rebate costs incurred but unpaid for these programs. Differences between estimated and actual rebate costs are normally not material and are recognized in earnings in the period such differences are determined. Rebate accruals were $64 million and $56 million as of December 31, 2017 and 2016, respectively. Taxes imposed by governmental authorities on our revenue-producing activities with customers, such as sales taxes and value-added taxes, are excluded from net sales.
Goodwill and Other Intangible Assets
Goodwill is tested for impairment annually and whenever events and circumstances indicate that impairment may have occurred. We completed the required annual goodwill impairment test as of July 1, 2017, and the fair value was substantially in excess of net asset carrying value. See “Goodwill” in Note 4 to the consolidated financial statements in Item 8 of this report for further discussion.
The evaluation of goodwill involves comparing the current fair value of a reporting unit to its carrying value, including goodwill. We used a combination of income and market approaches to estimate the current fair value. The fair value determination utilized key assumptions regarding the growth of the business, each of which required management judgment, including estimated future sales volumes, selling prices and costs, changes in working capital and investments in property and equipment. These assumptions and estimates were based upon our historical experience and projections of future activity. In addition, the selection of the discount rate used to determine fair value was based upon a market participant’s view considering current market rates and our current cost of financing. There can be no assurance that the assumptions and estimates made for purposes of the annual goodwill impairment test will prove to be accurate. Volatility in the equity and debt markets, or increases in interest rates, could result in a higher discount rate. Changes in sales volumes, selling prices and costs of goods sold and increases in interest rates could cause changes in our forecasted cash flows. Unfavorable changes in any of the factors described above could result in a goodwill impairment charge in the future.
As of December 31, 2017, we had intangible assets with finite useful lives with a gross carrying amount of $422 million and a net carrying amount of $143 million. These intangibles are being amortized over their estimated useful lives and are tested for impairment whenever events or circumstances indicate that impairment may have occurred. If the carrying amount of an intangible asset is not recoverable based on estimated future undiscounted cash flows, an impairment loss would be indicated. The amount of the impairment loss to be recorded would be based on the excess of the carrying amount of the intangible asset over its fair value (based on discounted future cash flows). Judgment is used in assessing whether the carrying amount of intangible assets is not expected to be recoverable over their estimated remaining useful lives. The factors considered are similar to those outlined in the goodwill impairment discussion above.
30 | ||
Loss Contingencies
The outcome of loss contingencies and legal proceedings and claims brought against us is subject to uncertainty. An estimated loss contingency is accrued by a charge to earnings if it is probable that an asset has been impaired or a liability has been incurred and the amount can be reasonably estimated. Determination of whether to accrue a loss requires evaluation of the probability of an unfavorable outcome and the ability to make a reasonable estimate. Changes in these estimates could affect the timing and amount of accrual of loss contingencies.
Income Taxes
We recognize tax benefits in our financial statements when our uncertain tax positions are more likely than not to be sustained upon audit. The amount we recognize is measured as the largest amount of benefit that is greater than 50% likely of being realized upon ultimate settlement.
We recognize deferred tax assets for deductible temporary differences, operating loss carry-forwards and tax credit carry-forwards. We record valuation allowances to reduce deferred tax assets to amounts that are more likely than not to be realized. In assessing the need for a valuation allowance, we consider both positive and negative evidence related to the likelihood of realization of the deferred tax assets. The weight given to the positive and negative evidence is commensurate with the extent to which the evidence may be objectively verified. As such, it is generally difficult for positive evidence regarding projected future taxable income exclusive of reversing taxable temporary differences to outweigh objective negative evidence of recent financial reporting losses. This assessment, which is completed on a taxing jurisdiction basis, takes into account a number of types of evidence, including the nature, frequency, and severity of current and cumulative financial reporting losses, sources of future taxable income, taxable income in prior carryback year(s) and tax planning strategies.
If it is determined that we would be able to realize deferred tax assets in the future in excess of our net recorded amount, an adjustment to the net deferred tax asset would increase income in the period that such determination was made. Likewise, should we determine that we would not be able to realize all or part of the net deferred tax assets in the future, an adjustment to the net deferred tax asset would decrease income in the period such determination was made. We regularly evaluate the need for valuation allowances against its deferred tax assets.
On December 22, 2017, the Tax Cuts and Jobs Act of 2017 (the “Act”) was signed into law making significant changes to the Internal Revenue Code. Changes include, but are not limited to, a federal corporate tax rate decrease from 35% to 21% for tax years beginning after December 31, 2017, the transition of U.S international taxation from a worldwide tax system to a territorial system, and a one-time transition tax on the mandatory deemed repatriation of foreign earnings. We have estimated our provision for income taxes in accordance with the Act and guidance available as of the date of this filing and as a result have recorded $10 million as additional income tax benefit in the fourth quarter of 2017, the period in which the legislation was enacted. The provisional amount related to the re-measurement of certain deferred tax assets and liabilities, based on the rates at which they are expected to reverse in the future, was $16 million of benefit. The provisional amount related to the one-time transition tax on the mandatory deemed repatriation of foreign earnings was $7 million based on cumulative foreign earnings of $101 million. We also recorded a $1 million benefit related to the treatment of current year cash dividends in relation to the repatriation tax.
On December 22, 2017, Staff Accounting Bulletin No. 118 (“SAB 118”) was issued to address the application of US GAAP in situations when a registrant does not have the necessary information available, prepared, or analyzed (including computations) in reasonable detail to complete the accounting for certain income tax effects of the Act. In accordance with SAB 118, we have determined that the $16 million of the deferred tax benefit recorded in connection with the re-measurement of certain deferred tax assets and liabilities, the $7 million of current tax expense recorded in connection with the transition tax on the mandatory deemed repatriation of foreign earnings and the $1 million benefit related to the treatment of current year cash dividends in relation to the repatriation tax are provisional amounts and reasonable estimates at December 31, 2017. The impact of the Act may differ from this estimate, possibly materially, due to, among other things, changes in interpretations we have made, guidance that may be issued and actions we may take as a result of the Act. Additional work is necessary for a more detailed analysis of our deferred tax assets and liabilities and our historical foreign earnings as well as potential correlative adjustments. We have not accounted for the tax impacts related to the Global Intangible Low Tax Income, Base Erosion Anti Abuse Tax or Foreign Derived Intangible Income regimes or any of the other provisions of the tax legislation that are not effective until fiscal year 2018. Any subsequent adjustment to these amounts will be recorded to current tax expense in the quarter of 2018 when the analysis is complete.
31 | ||
At December 31, 2017, prior to the calculation of the transition tax on the mandatory deemed repatriation, U.S. income taxes and foreign withholding taxes had not been provided on $151 million of current and prior year undistributed earnings of subsidiaries operating outside the U.S. These earnings, which are considered to be invested indefinitely, would become subject to income tax if they were remitted as dividends, were lent to one of our U.S. entities or if we were to sell our stock in the subsidiaries.
While the provisional transition tax of approximately $7 million resulted in the reduction of the excess amount of financial reporting over the tax basis in our foreign subsidiaries, we have not completed our analysis of the Act’s impact as an actual repatriation from our non-U.S. subsidiaries could still be subject to additional foreign withholding taxes and U.S. state taxes. We have not completed our analysis of our global working capital and cash requirements and the potential tax liabilities attributable to a repatriation. Therefore, we have not made a provisional estimate of the deferred taxes attributable to repatriation. We will record the tax effects of any change in our prior assertion with respect to these investments, and disclose any unrecognized deferred tax liability for temporary differences related to our foreign investments, if practicable, in the period that we are first able to make a reasonable estimate, no later than December 2018. While we otherwise intend to maintain the indefinite reinvestment exception, we have provided for a deferred tax asset of $5 million representing our tax basis over book basis in certain investments in connection with the proposed divestiture of our S&IP business.
Legal Matters
A description of legal matters can be seen in Item 3. Legal Proceedings.
Information Concerning Forward-Looking Statements
This annual report on Form 10-K and other materials we have filed or furnished or will file or furnish with the SEC (as well as information included in our oral or other written statements) contain, or will contain, certain “forward-looking statements,” within the meaning of the Private Securities Litigation Reform Act of 1995, regarding business strategies, market potential, future financial performance and other matters. Forward-looking statements include all statements that do not relate solely to historical or current facts, and can generally be identified by the use of words such as “may,” “believe,” “will,” “expect,” “project,” “estimate,” “anticipate,” “plan” or “continue” and similar expressions, among others. The matters discussed in these forward-looking statements are based on the current plans and expectations of our management and are subject to certain risks and uncertainties that could cause actual results to differ materially from those projected, anticipated or implied in the forward-looking statements. These factors include, but are not limited to:
• | general economic conditions particularly in the United States, |
• | fluctuations in global equity and fixed-income markets, |
• | the competitive environment, |
• | the loss of current customers or the inability to obtain new customers, |
• | litigation and enforcement actions, |
• | price fluctuations in key commodities, |
• | fluctuations in currency exchange rates, |
• | disruption in supply of raw materials or the distribution of finished goods, |
• | changes in governmental regulations that are applicable to our business, |
• | changes in asset valuations including write-downs of assets such as inventory, accounts receivable or other assets for impairment or other reasons, and |
• | the other matters described under “Risk Factors” and “Management’s Discussion and Analysis of Financial Condition and Results of Operations.” |
Where, in any forward-looking statement, an expectation or belief as to future results or events is expressed, such expectation or belief is based on the current plans and expectations of our management and expressed in good faith and believed to have a reasonable basis, but there can be no assurance that the expectation or belief will result or be achieved or accomplished.
32 | ||
ITEM 7A. | QUANTITATIVE AND QUALITATIVE DISCLOSURES ABOUT MARKET RISK |
We are exposed to risks such as changes in foreign currency exchange rates and commodity prices. A variety of practices are employed to manage these risks, including derivative instruments where deemed appropriate. Derivative instruments are used only for risk management purposes and not for speculation. All foreign currency derivative instruments are entered into with major financial institutions. Our credit exposure under these arrangements is limited to agreements with a positive fair value at the reporting date. Credit risk with respect to the counterparties is actively monitored but is not considered significant.
Presented below is a description of our risk together with a sensitivity analysis, performed annually, based on selected changes in market rates and prices. These analyses reflect management’s view of changes which are reasonably possible to occur over a one-year period. Also included is a description of our commodity price risk.
Interest Rate Risk
Our Senior Secured Term Loan with a remaining face value of $339 million is subject to a variable interest rate based on LIBOR, subject to a floor of 0.75%. As of December 31, 2017, a one percentage point increase in LIBOR would result in $3 million of incremental interest expense.
Foreign Currency Risk
Foreign currency risk is managed by the systematic use of foreign currency forward and swap contracts for a limited portion of our exposure. The use of these instruments allows the management of transactional exposures to exchange rate fluctuations because the gains or losses incurred on the derivative instruments will offset, in whole or in part, losses or gains on the underlying foreign currency exposure.
Foreign currency contracts and transactional exposures are sensitive to changes in foreign currency exchange rates. An annual test is performed to quantify the effects that possible changes in foreign currency exchange rates would have on annual operating profit based on our foreign currency contracts and transactional exposures at the current year-end. The balance sheet effect is calculated by multiplying each affiliate’s net monetary asset or liability position by a 10% change in the foreign currency exchange rate versus the U.S. dollar. The results of these sensitivity tests are presented in the following paragraph.
As of December 31, 2017, a 10% unfavorable change in the exchange rate of the U.S. dollar against the prevailing market rates of foreign currencies involving balance sheet transactional exposures would have an effect of $3 million to our consolidated financial position, results of operations or cash flows. These hypothetical losses on transactional exposures are based on the difference between the December 31, 2017 rates and the assumed rates.
The translation of the balance sheets of non-U.S. operations from local currencies into U.S. dollars is also sensitive to changes in foreign currency exchange rates. Consequently, an annual test is performed to determine if changes in currency exchange rates would have a significant effect on the translation of the balance sheets of non-U.S. operations into U.S. dollars. These translation gains or losses are recorded as unrealized translation adjustments (“UTA”) within stockholders’ equity. The hypothetical change in UTA is calculated by multiplying the net assets of these non-U.S. operations by a 10% change in the currency exchange rates.
As of December 31, 2017, a 10% unfavorable change in the exchange rate of the U.S. dollar against the prevailing market rates of our foreign currency translation exposures would have reduced stockholders’ equity by approximately $28 million. These hypothetical adjustments in UTA are based on the difference between the December 31, 2017 exchange rates and the assumed rates. In the view of management, the above UTA adjustments resulting from these assumed changes in foreign currency exchange rates are not material to our consolidated financial position because they would not affect our cash flow.
Commodity Price Risk
We are subject to commodity price risk for certain raw materials used in the manufacture of our products. As previously discussed under “Risk Factors,” increases in commodities prices could adversely affect our earnings if selling prices are not adjusted or if such adjustments significantly trail the increases in commodities prices.
Our energy, manufacturing and transportation costs are affected by various market factors including the availability of supplies of particular forms of energy, energy prices and local and national regulatory decisions. As previously discussed in “Risk Factors,” there can be no assurance we will be fully protected against substantial changes in the price or availability of energy sources. In addition, we are subject to price risk for utilities and manufacturing inputs, which are used in our manufacturing operations.
33 | ||
ITEM 8. | FINANCIAL STATEMENTS AND SUPPLEMENTARY DATA |
HALYARD HEALTH, INC. AND SUBSIDIARIES
CONSOLIDATED INCOME STATEMENTS
(in millions, except per share amounts)
Year Ended December 31, | |||||||||||
2017 | 2016 | 2015 | |||||||||
Net Sales | $ | 611.6 | $ | 566.2 | $ | 509.0 | |||||
Cost of products sold | 274.7 | 269.0 | 251.2 | ||||||||
Gross Profit | 336.9 | 297.2 | 257.8 | ||||||||
Research and development | 38.2 | 38.4 | 27.6 | ||||||||
Selling and general expenses | 321.7 | 346.2 | 349.7 | ||||||||
Other expense, net | 20.1 | 19.7 | 16.2 | ||||||||
Operating Loss | (43.1 | ) | (107.1 | ) | (135.7 | ) | |||||
Interest income | 2.5 | 0.6 | 0.3 | ||||||||
Interest expense | (31.6 | ) | (32.7 | ) | (33.1 | ) | |||||
Loss Before Income Taxes | (72.2 | ) | (139.2 | ) | (168.5 | ) | |||||
Income tax benefit | 40.1 | 55.9 | 67.3 | ||||||||
Loss from Continuing Operations | (32.1 | ) | (83.3 | ) | (101.2 | ) | |||||
Income (loss) from discontinued operations, net of tax | 111.4 | 123.1 | (325.1 | ) | |||||||
Net Income (Loss) | $ | 79.3 | $ | 39.8 | $ | (426.3 | ) | ||||
Earnings (Loss) Per Share | |||||||||||
Basic: | |||||||||||
Continuing operations | $ | (0.69 | ) | $ | (1.79 | ) | $ | (2.17 | ) | ||
Discontinued operations | 2.38 | 2.64 | (6.98 | ) | |||||||
Basic Earnings (Loss) Per Share | $ | 1.69 | $ | 0.85 | $ | (9.15 | ) | ||||
Diluted: | |||||||||||
Continuing operations | $ | (0.69 | ) | $ | (1.79 | ) | $ | (2.17 | ) | ||
Discontinued operations | 2.38 | 2.64 | (6.98 | ) | |||||||
Diluted Earnings (Loss) Per Share | $ | 1.69 | $ | 0.85 | $ | (9.15 | ) | ||||
See Notes to the Consolidated Financial Statements.
34 | ||
HALYARD HEALTH, INC. AND SUBSIDIARIES
CONSOLIDATED STATEMENTS OF COMPREHENSIVE INCOME (LOSS)
(in millions)
Year Ended December 31, | |||||||||||
2017 | 2016 | 2015 | |||||||||
Net Income (Loss) | $ | 79.3 | $ | 39.8 | $ | (426.3 | ) | ||||
Other Comprehensive Income (Loss), Net of Tax | |||||||||||
Defined benefit plans | 0.5 | 0.6 | (1.3 | ) | |||||||
Unrealized currency translation adjustments | 17.1 | (8.3 | ) | (22.1 | ) | ||||||
Cash flow hedges | 1.2 | 0.8 | (.7 | ) | |||||||
Total Other Comprehensive Income (Loss), Net of Tax | 18.8 | (6.9 | ) | (24.1 | ) | ||||||
Comprehensive Income (Loss) | $ | 98.1 | $ | 32.9 | $ | (450.4 | ) | ||||
See Notes to the Consolidated Financial Statements.
35 | ||
HALYARD HEALTH, INC. AND SUBSIDIARIES
CONSOLIDATED BALANCE SHEETS
(in millions, except share data)
Year Ended December 31, | |||||||
2017 | 2016 | ||||||
ASSETS | |||||||
Current Assets | |||||||
Cash and cash equivalents | $ | 219.7 | $ | 113.7 | |||
Accounts receivable, net of allowances | 203.0 | 188.5 | |||||
Inventories | 91.1 | 80.7 | |||||
Prepaid and other current assets | 14.4 | 16.6 | |||||
Assets held for sale | 632.5 | 194.0 | |||||
Total Current Assets | 1,160.7 | 593.5 | |||||
Property, Plant and Equipment, net | 109.9 | 109.3 | |||||
Goodwill | 764.7 | 762.3 | |||||
Other Intangible Assets, net | 148.9 | 168.2 | |||||
Deferred Tax Assets | 7.6 | 8.6 | |||||
Other Assets | 4.1 | 3.0 | |||||
Assets held for sale | — | 426.9 | |||||
TOTAL ASSETS | $ | 2,195.9 | $ | 2,071.8 | |||
LIABILITIES AND STOCKHOLDERS’ EQUITY | |||||||
Current Liabilities | |||||||
Current portion of long-term debt | $ | 39.8 | $ | — | |||
Trade accounts payable | 171.2 | 160.6 | |||||
Accrued expenses | 144.9 | 138.4 | |||||
Liabilities held for sale | 33.9 | 25.4 | |||||
Total Current Liabilities | 389.8 | 324.4 | |||||
Long-Term Debt | 541.1 | 579.0 | |||||
Deferred Tax Liabilities | 17.8 | 35.4 | |||||
Other Long-Term Liabilities | 31.8 | 23.8 | |||||
Liabilities held for sale | — | 6.7 | |||||
Total Liabilities | 980.5 | 969.3 | |||||
Commitments and Contingencies | |||||||
Stockholders’ Equity | |||||||
Preferred stock - $0.01 par value - authorized 20,000,000 shares, none issued | — | — | |||||
Common stock - $0.01 par value - authorized 300,000,000 shares, 46,920,076 outstanding at December 31, 2017 and 46,681,798 outstanding at December 31, 2016 | 0.5 | 0.5 | |||||
Additional paid-in capital | 1,550.5 | 1,533.2 | |||||
Accumulated deficit | (299.9 | ) | (379.2 | ) | |||
Treasury stock | (4.4 | ) | (1.9 | ) | |||
Accumulated other comprehensive loss | (31.3 | ) | (50.1 | ) | |||
Total Stockholders’ Equity | 1,215.4 | 1,102.5 | |||||
TOTAL LIABILITIES AND STOCKHOLDERS’ EQUITY | $ | 2,195.9 | $ | 2,071.8 | |||
See Notes to the Consolidated Financial Statements.
36 | ||
HALYARD HEALTH, INC. AND SUBSIDIARIES
CONSOLIDATED STATEMENT OF STOCKHOLDERS’ EQUITY
(in millions, shares in thousands)
Common Stock Issued | Additional Paid-in Capital | Retained Earnings (Accumulated Deficit) | Treasury Stock | Accumulated Other Comprehensive Income (Loss) | Total Stockholders’ Equity | ||||||||||||||||||||||||
Shares | Amount | Shares | Amount | ||||||||||||||||||||||||||
Balance at December 31, 2014 | 46,536 | $ | 0.5 | $ | 1,502.5 | $ | 7.3 | — | $ | — | $ | (19.1 | ) | $ | 1,491.2 | ||||||||||||||
Net loss | — | — | — | (426.3 | ) | — | — | — | (426.3 | ) | |||||||||||||||||||
Issuance of common stock upon the exercise or redemption of share-based awards | 79 | — | 1.4 | — | — | — | — | 1.4 | |||||||||||||||||||||
Stock-based compensation expense | — | — | 14.1 | — | — | — | — | 14.1 | |||||||||||||||||||||
Purchases of treasury stock | — | — | — | — | 21 | (1.0 | ) | — | (1.0 | ) | |||||||||||||||||||
Other comprehensive loss, net of tax | — | — | — | — | — | — | (24.1 | ) | (24.1 | ) | |||||||||||||||||||
Balance at December 31, 2015 | 46,615 | 0.5 | 1,518.0 | (419.0 | ) | 21 | (1.0 | ) | (43.2 | ) | 1,055.3 | ||||||||||||||||||
Net income | — | — | — | 39.8 | — | — | — | 39.8 | |||||||||||||||||||||
Issuance of common stock upon the exercise or redemption of share-based awards | 67 | — | 0.4 | — | — | — | — | 0.4 | |||||||||||||||||||||
Stock-based compensation expense | — | — | 14.8 | — | — | — | — | 14.8 | |||||||||||||||||||||
Purchases of treasury stock | — | — | — | — | 32 | (0.9 | ) | — | (0.9 | ) | |||||||||||||||||||
Other comprehensive loss, net of tax | — | — | — | — | — | — | (6.9 | ) | (6.9 | ) | |||||||||||||||||||
Balance at December 31, 2016 | 46,682 | 0.5 | 1,533.2 | (379.2 | ) | 53 | (1.9 | ) | (50.1 | ) | 1,102.5 | ||||||||||||||||||
Net income | — | — | — | 79.3 | — | — | — | 79.3 | |||||||||||||||||||||
Issuance of common stock upon the exercise or redemption of share-based awards | 238 | — | 4.7 | — | — | — | — | 4.7 | |||||||||||||||||||||
Stock-based compensation expense | — | — | 12.6 | — | — | — | — | 12.6 | |||||||||||||||||||||
Purchases of treasury stock | — | — | — | — | 63 | (2.5 | ) | — | (2.5 | ) | |||||||||||||||||||
Other comprehensive income, net of tax | — | — | — | — | — | — | 18.8 | 18.8 | |||||||||||||||||||||
Balance at December 31, 2017 | 46,920 | $ | 0.5 | $ | 1,550.5 | $ | (299.9 | ) | 116 | $ | (4.4 | ) | $ | (31.3 | ) | $ | 1,215.4 | ||||||||||||
See Notes to the Consolidated Financial Statements.
37 | ||
HALYARD HEALTH, INC. AND SUBSIDIARIES
CONSOLIDATED CASH FLOW STATEMENTS
(in millions)
Year Ended December 31, | |||||||||||
2017 | 2016 | 2015 | |||||||||
Operating Activities | |||||||||||
Net income (loss) | $ | 79.3 | $ | 39.8 | $ | (426.3 | ) | ||||
Depreciation and amortization | 59.5 | 65.2 | 65.4 | ||||||||
Stock-based compensation | 12.6 | 14.8 | 14.1 | ||||||||
Goodwill impairment | — | — | 474.0 | ||||||||
Net losses (gains) on asset dispositions | 3.3 | 3.7 | (6.7 | ) | |||||||
Changes in operating assets and liabilities, net of acquisition | |||||||||||
Accounts receivable | (15.3 | ) | 8.4 | 9.0 | |||||||
Inventories, net of allowance | (16.8 | ) | 41.0 | (20.2 | ) | ||||||
Prepaid expenses and other assets | (2.3 | ) | 1.7 | (6.0 | ) | ||||||
Accounts payable | 18.8 | 6.5 | 14.7 | ||||||||
Accrued expenses | 11.3 | 34.0 | (14.5 | ) | |||||||
Deferred income taxes and other | (6.2 | ) | (26.3 | ) | (5.9 | ) | |||||
Cash Provided by Operating Activities | 144.2 | 188.8 | 97.6 | ||||||||
Investing Activities | |||||||||||
Capital expenditures | (43.2 | ) | (29.1 | ) | (70.4 | ) | |||||
Acquisition of business, net of cash acquired | — | (175.0 | ) | — | |||||||
Proceeds from dispositions of property | 0.1 | 3.2 | 7.8 | ||||||||
Cash Used in Investing Activities | (43.1 | ) | (200.9 | ) | (62.6 | ) | |||||
Financing Activities | |||||||||||
Line of credit facility proceeds | — | 72.0 | — | ||||||||
Line of credit facility repayments | — | (72.0 | ) | — | |||||||
Debt issuance costs | — | (0.9 | ) | — | |||||||
Debt repayments | — | — | (51.0 | ) | |||||||
Purchase of treasury stock | (2.5 | ) | (0.9 | ) | (1.0 | ) | |||||
Proceeds from the exercise of stock options and other | 4.7 | 0.4 | 1.4 | ||||||||
Cash Provided by (Used in) Financing Activities | 2.2 | (1.4 | ) | (50.6 | ) | ||||||
Effect of Exchange Rate Changes on Cash and Cash Equivalents | 2.7 | (2.3 | ) | (3.9 | ) | ||||||
Increase (Decrease) in Cash and Cash Equivalents | 106.0 | (15.8 | ) | (19.5 | ) | ||||||
Cash and Cash Equivalents - Beginning of Year | 113.7 | 129.5 | 149.0 | ||||||||
Cash and Cash Equivalents - End of Year | $ | 219.7 | $ | 113.7 | $ | 129.5 | |||||
Supplemental Cash Flow Disclosure: | |||||||||||
Cash paid for income taxes | $ | 21.4 | $ | 29.1 | $ | 43.3 | |||||
Cash paid for interest | $ | 28.7 | $ | 29.9 | $ | 32.6 | |||||
Supplemental Noncash Disclosure | |||||||||||
Capital expenditures included in accounts payable or accrued expenses | $ | 4.5 | $ | 5.8 | $ | 5.6 | |||||
See Notes to the Consolidated Financial Statements.
38 | ||
HALYARD HEALTH, INC. AND SUBSIDIARIES
NOTES TO THE CONSOLIDATED FINANCIAL STATEMENTS
Note 1. Accounting Policies
Background and Basis of Presentation
Halyard Health, Inc. is a medical technology company focused on eliminating pain, speeding recovery and preventing infection for healthcare providers and patients. We are committed to addressing some of today’s most important healthcare needs, such as reducing the use of opioids while helping patients move from surgery to recovery. We operate through our Medical Devices business segment. References to “Halyard,” “Company,” “we,” “our” and “us” refer to Halyard Health, Inc. and its consolidated subsidiaries.
Principles of Consolidation
The consolidated financial statements include our net assets, results of our operations and cash flows. All intercompany transactions and accounts within our consolidated businesses have been eliminated. The consolidated financial statements have been prepared in conformity with accounting principles generally accepted in the United States of America (“GAAP”).
Use of Estimates
Preparation of consolidated financial statements in accordance with GAAP requires us to make estimates and assumptions that affect the reported amounts of assets and liabilities at the date of the financial statements and the reported amounts of net sales and expenses during the reporting periods. Estimates are used in accounting for, among other things, distributor rebate accruals, future cash flows associated with impairment testing for goodwill and long-lived assets, loss contingencies, and deferred tax assets and potential income tax assessments. Actual results could differ from these estimates, and the effect of the change could be material to our financial statements. Changes in these estimates are recorded when known.
Cash Equivalents
Cash equivalents are short-term investments with an original maturity date of three months or less. We maintain cash balances and short-term investments in excess of insurable limits in a diversified group of major banks that are selected and monitored based on ratings by the major rating agencies in accordance with our treasury policy.
Inventories and Distribution Costs
Most U.S. inventories are valued at the lower of cost, using the Last-In, First-Out (“LIFO”) method, or market. The balance of the U.S. and non-U.S. inventories are valued at the lower of cost (determined on the First-In, First-Out (“FIFO”) or weighted-average cost methods) or market. Distribution costs are classified as cost of products sold.
Property, Plant and Equipment and Depreciation
Property, plant and equipment are stated at cost and depreciated on the straight-line method. Buildings are depreciated over their estimated useful lives, primarily 40 years. Machinery and equipment are depreciated over their estimated useful lives, primarily ranging from 16 to 20 years. Leasehold improvements are depreciated over the assets’ estimated useful lives, or the remaining lease term, whichever is shorter. Purchases of computer software, including external costs and certain internal costs (including payroll and payroll-related costs of employees) directly associated with developing significant computer software applications for internal use, are capitalized. Computer software costs are amortized on the straight-line method over the estimated useful life of the software, which is generally three to five years. Depreciation expense is recorded in cost of products sold, research and development and selling and general expenses.
Estimated useful lives are periodically reviewed, and when warranted, changes are made to them. Long-lived assets are reviewed for impairment whenever events or changes in circumstances indicate that their carrying amount may not be recoverable. An impairment loss would be indicated when estimated undiscounted future cash flows from the use and eventual disposition of an asset group, which are identifiable and largely independent of the cash flows of other asset groups, are less than the carrying amount of the asset group. Measurement of an impairment loss would be based on the excess of the carrying amount of the asset group over its fair value. Fair value is measured using discounted cash flows or independent appraisals, as appropriate. When property is sold or retired, the cost of the property and the related accumulated depreciation are removed from the consolidated balance sheet and any gain or loss on the transaction is included in income.
39 | ||
Goodwill and Other Intangible Assets
Goodwill is tested for impairment annually and whenever events and circumstances indicate that impairment may have occurred. The evaluation of goodwill involves comparing the current fair value of a reporting unit to its carrying value, including goodwill. We used a combination of income and market approaches to estimate current fair value. The fair value determination utilized key assumptions regarding the growth of the business, each of which required management judgment, including estimated future sales volumes, selling prices and costs, changes in working capital and investments in property and equipment. These assumptions and estimates were based upon our historical experience and projections of future activity. In addition, the selection of the discount rate used to determine fair value was based upon a market participant’s view considering current market rates and our current cost of financing. There can be no assurance that the assumptions and estimates made for purposes of the annual goodwill impairment test will prove to be accurate. Volatility in the equity and debt markets, or increases in interest rates, could result in a higher discount rate. Changes in sales volumes, selling prices and costs of goods sold and increases in interest rates could cause changes in our forecasted cash flows. Unfavorable changes in any of the factors described above could result in a goodwill impairment charge in the future. We completed the required annual goodwill impairment test as of July 1, 2017, and the fair value was substantially in excess of net asset carrying value.
Intangible assets with finite lives are amortized over their estimated useful lives and reviewed for impairment whenever events or changes in circumstances indicate that their carrying amount may not be recoverable. Estimated useful lives range from 7 to 30 years for trademarks, 7 to 17 years for patents and acquired technologies, and 2 to 16 years for other intangible assets. An impairment loss would be indicated when estimated undiscounted future cash flows from the use of the asset are less than its carrying amount. An impairment loss would be measured as the difference between the fair value (based on discounted future cash flows) and the carrying amount of the asset.
Revenue Recognition and Accounts Receivable
Sales revenue is recognized at the time of product shipment or delivery, depending on when title passes, to unaffiliated customers, and when all of the following have occurred: evidence of a sales arrangement is in place, pricing is fixed or determinable, and collection is reasonably assured. Sales are reported net of returns, rebates and freight allowed. Distributor rebates are estimated based on the historical cost difference between list prices and average end user contract prices and the quantity of products expected to be sold to specific end users. We maintain liabilities at the end of each period for the estimated rebate costs incurred but unpaid for these programs. Differences between estimated and actual rebate costs are normally not material and are recognized in earnings in the period such differences are determined. Taxes imposed by governmental authorities on our revenue-producing activities with customers, such as sales taxes and value-added taxes, are excluded from net sales.
Net sales to one customer accounted for 10%, 9% and 9%, respectively, of net sales in 2017, 2016 and 2015. No other customer accounted for more than 10% of net sales in any of the periods presented herein. As of each year ended December 31, 2017 and 2016, we had one customer who individually accounted for more than 10% of our consolidated accounts receivable balance. The allowances for doubtful accounts, sales discounts and returns were $2 million as of each year ended December 31, 2017 and 2016, respectively. The provision for doubtful accounts was not material for the years ended December 31, 2017, 2016 and 2015.
Foreign Currency Translation
The income statements of foreign operations are translated into U.S. dollars at rates of exchange in effect each month. The balance sheets of these operations are translated at period-end exchange rates, and the differences from historical exchange rates are reflected as unrealized translation adjustments in other comprehensive income.
Research and Development
Research and development expenses are expensed as incurred. Research and development expenses consist primarily of salaries and related expenses for personnel, product trial costs, outside laboratory and license fees, the costs of laboratory equipment and facilities and asset write-offs for equipment that does not reach success in product manufacturing certifications.
Stock-Based Compensation
We have a stock-based Equity Participation Plan and an Outside Directors’ Compensation Plan that provide for awards of stock options, stock appreciation rights, restricted stock (and in certain limited cases, unrestricted stock), restricted stock units, performance units and cash awards to eligible employees (including officers who are employees), directors, advisors and
40 | ||
consultants. Stock-based compensation is initially measured at the fair value of the awards on the grant date and is recognized in the financial statements over the period the employees are required to provide services in exchange for the awards. The fair value of option awards is measured on the grant date using a Black-Scholes option-pricing model. The fair value of time-based and some performance-based restricted share awards is based on the Halyard stock price at the grant date and the assessed probability of meeting future performance targets. For performance-based restricted share units for which vesting is conditioned upon achieving a measure of total shareholder return, fair value is measured using a Monte Carlo simulation. Generally, new shares are issued to satisfy vested restricted stock units and exercises of stock options. See Note 12, “Stock-Based Compensation.”
Income Taxes
We account for income taxes under the asset and liability method of accounting, which requires the recognition of deferred tax assets and liabilities for the expected future tax consequences of temporary differences between the carrying amounts and the tax bases of assets and liabilities. Under this method, changes in tax rates and laws are recognized in income in the period such changes are enacted. The provision for federal, state, and foreign income taxes is calculated on income before income taxes based on current tax law and includes the cumulative effect of any changes in tax rates from those used previously in determining deferred tax assets and liabilities. Such provision differs from the amounts currently payable because certain items of income and expense are recognized in different reporting periods for financial reporting purposes than for income tax purposes. Recording the provision for income taxes requires management to make significant judgments and estimates for matters whose ultimate resolution may not become known until the final resolution of an examination by the Internal Revenue Service (IRS) or state and foreign agencies. If it is more likely than not that some portion, or all, of a deferred tax asset will not be realized, a valuation allowance is recognized.
Recording liabilities for uncertain tax positions involves judgment in evaluating our tax positions and developing the best estimate of the taxes ultimately expected to be paid. We include any related tax penalties and interest in income tax expense.
On December 22, 2017, the Tax Cuts and Jobs Act of 2017 (the “Act”) was signed into law making significant changes to the Internal Revenue Code. Changes include, but are not limited to, a federal corporate tax rate decrease from 35% to 21% for tax years beginning after December 31, 2017, the transition of U.S international taxation from a worldwide tax system to a territorial system, and a one-time transition tax on the mandatory deemed repatriation of foreign earnings. We have estimated our provision for income taxes in accordance with the Act and guidance available as of the date of this filing and as a result have recorded $10 million as additional income tax benefit in the fourth quarter of 2017, the period in which the legislation was enacted. The provisional amount related to the re-measurement of certain deferred tax assets and liabilities, based on the rates at which they are expected to reverse in the future, was $16 million of benefit. The provisional amount related to the one-time transition tax on the mandatory deemed repatriation of foreign earnings was $7 million based on cumulative foreign earnings of $101 million. We also recorded a $1 million benefit related to the treatment of current year cash dividends in relation to the repatriation tax.
On December 22, 2017, Staff Accounting Bulletin No. 118 (“SAB 118”) was issued to address the application of US GAAP in situations when a registrant does not have the necessary information available, prepared, or analyzed (including computations) in reasonable detail to complete the accounting for certain income tax effects of the Act. In accordance with SAB 118, we have determined that the $16 million of the deferred tax benefit recorded in connection with the re-measurement of certain deferred tax assets and liabilities, the $7 million of current tax expense recorded in connection with the transition tax on the mandatory deemed repatriation of foreign earnings and the $1 million benefit related to the treatment of current year cash dividends in relation to the repatriation tax are provisional amounts and reasonable estimates at December 31, 2017. The impact of the Act may differ from this estimate, possibly materially, due to, among other things, changes in interpretations we have made, guidance that may be issued and actions we may take as a result of the Act. Additional work is necessary for a more detailed analysis of our deferred tax assets and liabilities and our historical foreign earnings as well as potential correlative adjustments. We have not accounted for the tax impacts related to the Global Intangible Low Tax Income, Base Erosion Anti Abuse Tax or Foreign Derived Intangible Income regimes or any of the other provisions of the tax legislation that are not effective until fiscal year 2018. Any subsequent adjustment to these amounts will be recorded to current tax expense in the quarter of 2018 when the analysis is complete.
At December 31, 2017, prior to the calculation of the transition tax on the mandatory deemed repatriation, U.S. income taxes and foreign withholding taxes had not been provided on $151 million of current and prior year undistributed earnings of subsidiaries operating outside the U.S. These earnings, which are considered to be invested indefinitely, would become subject
41 | ||
to income tax if they were remitted as dividends, were lent to one of our U.S. entities or if we were to sell our stock in the subsidiaries.
While the provisional transition tax of approximately $7 million resulted in the reduction of the excess amount of financial reporting over the tax basis in our foreign subsidiaries, we have not completed our analysis of the Act’s impact as an actual repatriation from our non-U.S. subsidiaries could still be subject to additional foreign withholding taxes and U.S. state taxes. We have not completed our analysis of our global working capital and cash requirements and the potential tax liabilities attributable to a repatriation. Therefore, we have not made a provisional estimate of the deferred taxes attributable to repatriation. We will record the tax effects of any change in our prior assertion with respect to these investments, and disclose any unrecognized deferred tax liability for temporary differences related to our foreign investments, if practicable, in the period that we are first able to make a reasonable estimate, no later than December 2018. While we otherwise intend to maintain the indefinite reinvestment exception, we have provided for a deferred tax asset of $5 million representing our tax basis over book basis in our investment in certain investments in connection with the proposed divestiture of our S&IP business.
Employee Defined Benefit Plans
We recognize the funded status of our defined benefit as an asset or a liability on our balance sheet. Actuarial gains or losses are a component of our other comprehensive income, which is then included in our accumulated other comprehensive income. Pension expenses are recognized over the period in which the employee renders service and becomes eligible to receive benefits. We make assumptions (including the discount rate and expected rate of return on plan assets) in computing the pension expense and obligations.
Recently Adopted Pronouncements
Effective January 1, 2017, we adopted Accounting Standards Update (“ASU”) No. 2016-09, Improvements to Employee Share-Based Payment Accounting, and elected to account for forfeitures as they occur rather than applying an estimated forfeiture rate. The adoption of this ASU did not have a material effect on our financial position, results of operations or cash flows.
Effective July 1, 2017, we adopted ASU No. 2017-04, Simplifying the Test for Goodwill Impairment, that replaced the two-step goodwill impairment test with a simplified one-step process. This ASU provides that goodwill impairment will be measured as the excess of the reporting unit’s carrying value over its fair value and abandons the second step that requires the measurement of goodwill impairment by comparing the implied value of a reporting unit’s goodwill to the goodwill’s carrying amount. Adoption of this ASU did not have a material effect on our financial position, results of operations or cash flows.
Recently Issued Pronouncements
In August 2017, the Financial Accounting Standards Board (“FASB”) issued ASU No. 2017-12, Derivatives and Hedging - Targeted Improvements to Accounting for Hedging Activities. This ASU is intended to improve the financial reporting and presentation of hedging relationships and the economic results of risk management activities in financial statements. The amendments in ASU 2017-12 better align risk management activities and financial reporting for hedging relationships through changes to both the designation and measurement guidance for qualifying hedging relationships and the presentation of hedge results. In addition, the amendments permit hedge accounting for risk components involving non-financial and interest rate risks and contains other targeted improvements to simplify the application of hedge accounting. This ASU is effective for annual periods, and interim periods within those annual periods beginning after December 15, 2018, with early adoption permitted in any interim period following the issuance of this ASU. The provisions of this ASU should be applied to existing hedging relationships as of the beginning of the fiscal year of adoption. All other presentation and disclosure requirements are to be applied prospectively. We do not expect adoption of this ASU to have a material effect on our financial position, results of operations or cash flows.
In May 2017, the FASB issued ASU No. 2017-09, Stock Compensation - Scope of Modification Accounting. This ASU is intended to provide clarity and reduce both (i) diversity in practice and (ii) cost and complexity when applying the modification accounting guidance in Topic 718, Compensation - Stock Compensation. Specifically, modification accounting is applied to any changes in stock-based awards unless (i) the fair value of the modified award is the same as the fair value of the original award immediately before modification, (ii) the vesting conditions of the modified award are the same as the original award before modification and (iii) the equity or liability classification of the modified award is the same as the original award. This ASU is to be prospectively applied for annual periods, and interim periods within those annual periods beginning after December 15, 2017, with early adoption permitted for any interim period for which financial statements have not yet been issued. As this ASU
42 | ||
is intended to bring consistency in practice but does not change any fair value measurement methodologies, it is not expected to have a material effect on our financial position, results of operations or cash flows.
In March 2017, the FASB issued ASU No. 2017-07, Improving the Presentation of Net Periodic Pension Cost and Net Periodic Post Retirement Benefit Cost. This ASU requires that current service cost be reported in the same line item as other compensation costs arising from services rendered by employees during the period. The other components of net benefit cost are to be presented separately in the income statement and below operating income, if operating income is presented. This ASU is effective for annual periods, and interim periods within those annual periods beginning after December 15, 2017, with retrospective application required. Earlier adoption is permitted in any interim or annual period for which financial statements have not yet been issued. The adoption of this ASU is not expected to have a material effect on our financial position, results of operations or cash flows.
In January 2017, the FASB issued ASU 2017-01, Clarifying the Definition of a Business, which provides guidance in evaluating whether transactions involve the acquisition (or disposal) of assets or a business. A business has been defined as having three elements: inputs, processes and outputs. While an integrated set of assets and activities (a “set”) that is a business usually has outputs, outputs are not required to be present. Additionally, the inputs and processes that a seller uses in operating a set are not required if market participants can acquire the set and continue to produce outputs. This ASU provides a screen to determine when a set is not a business. The screen requires that when substantially all of the fair value of the gross assets acquired (or disposed) is concentrated in a single identifiable asset or group of similar identifiable assets, the set is not a business. It is expected that this ASU will reduce the number of transactions that are treated as business combinations. This ASU is to be adopted prospectively for annual periods, and interim periods within those annual periods beginning after December 15, 2017. Adoption of the ASU is not expected to have a material effect on our financial position, results of operations or cash flows.
In August 2016, the FASB issued ASU No. 2016-15, Statement of Cash Flows - Classification of Certain Cash Receipts and Cash Payments. This ASU provides guidance on the presentation and classification of certain specific cash receipts and payments in the statement of cash flows and is intended to reduce diversity in practice. This ASU is effective for annual periods, and interim periods within those annual periods beginning after December 15, 2017, but earlier adoption is permitted. This ASU is to be adopted using a retrospective transition method to each period presented. Adoption of this ASU is not expected to have a material effect on our financial position, results of operations or cash flows.
In February 2016, the FASB issued ASU No. 2016-02, Leases. This ASU requires the recognition of assets and liabilities for leases with lease terms of more than twelve months. The recognition, measurement and presentation of expenses and cash flows arising from a lease will depend primarily on its classification as a finance or an operating lease, with the classification criteria for distinguishing between the two being similar to the classification criteria for distinguishing between capital and operating leases under current GAAP. However, unlike current GAAP, recognition of finance and operating leases on the balance sheet is required, and additional disclosures are required to help financial statement users to better understand the amount, timing and uncertainty of cash flows arising from leases. This ASU requires modified retrospective application for existing leases. This ASU will be effective for fiscal years, and interim periods within those fiscal years, beginning after December 15, 2018, however, earlier application is permitted. The adoption of this ASU will require us to recognize assets and liabilities for operating leases we have entered into for our principal executive offices as well as certain warehouse, manufacturing and distribution facilities globally. We have not yet determined the impact recognition of such assets and liabilities will have on our financial position, results of operations or cash flows.
In January 2016, the FASB issued ASU No. 2016-01, Recognition and Measurement of Financial Assets and Liabilities. This ASU requires equity investments, except those accounted for under the equity method or those that result in consolidation of the equity investee, to be measured at fair value with changes in fair value recognized in net income. However, equity investments without readily determinable fair values may be measured at cost less impairment, if any, plus or minus changes resulting from observable price changes in orderly transactions for identical or similar investments in the same issuer. In addition, this ASU provides for a qualitative impairment assessment for equity investments that do not have readily determinable fair values. This ASU also clarifies that entities should evaluate the need for a valuation allowance on a deferred tax asset related to available-for-sale securities in combination with the entity’s other deferred tax assets. This ASU should be applied by means of a cumulative-effect adjustment to the balance sheet as of the beginning of the fiscal year of adoption. The provisions related to equity investments that do not have readily determinable fair values should be applied prospectively to such equity investments that exist as of the date of adoption. This ASU will be effective for fiscal years, and interim periods within those fiscal years beginning after December 15, 2017. Early adoption of this ASU is permitted. The adoption of this ASU is not expected to have a material effect on our financial position, results of operations or cash flows.
43 | ||
In May 2014, the FASB issued ASU 2014-09, Revenue from Contracts with Customers, which, along with subsequent amendments, provides a single comprehensive model for entities to use in accounting for revenue arising from contracts with customers and will supersede most existing revenue recognition guidance. ASU 2014-09 provides for a principles-based, five-step approach to measure and recognize revenue from contracts with customers. ASU 2014-09 is effective for public entities for annual and interim periods beginning after December 15, 2017. Early adoption for periods beginning after December 15, 2016 is permitted. The guidance permits two implementation approaches, one requiring retrospective application of the new ASU with restatement of prior years and one requiring prospective application of the new ASU with disclosure of results under old standards. Based on the results of our review, we do not expect adoption of this ASU will have a material effect on our financial position, results of operations or cash flows. We will apply this ASU using the modified retrospective method.
Note 2. Discontinued Operations
On October 31, 2017, we entered into a Purchase Agreement (“Purchase Agreement”) by and among us and certain of our affiliates and Owens & Minor, Inc., (“Buyer”). The Purchase Agreement provides for the sale to Buyer, subject to the terms and conditions of the Purchase Agreement, of substantially all of our S&IP business, as well as our name “Halyard Health” (and all variations of our name and related intellectual property rights) and our IT system (the “Divestiture”). The total purchase price payable by the Buyer for the Divestiture is $710 million in cash, subject to certain adjustments as provided in the Purchase Agreement based on cash, indebtedness and net working capital transferred to the Buyer and its affiliates at the closing. We expect the transaction to close in the second quarter of 2018. The Divestiture is intended to accelerate our transformation into a pure-play medical devices business.
On or about the closing date, we will enter into certain commercial agreements, including a transition services agreement with the Buyer, pursuant to which we and the Buyer, and each company’s respective affiliates will provide to each other various transitional services, including an arrangement whereby we will remain a limited risk distributor for S&IP products on the Buyer’s behalf for sales outside of the United States and Canada. The services will generally commence on the closing date of the Divestiture and terminate no later than two years thereafter.
As a result of the Divestiture, the results of operations from our S&IP business are reported in the accompanying consolidated income statements as “Income (Loss) from discontinued operations” for the years ended December 31, 2017, 2016 and 2015, and the related assets and liabilities are classified as held-for-sale as of December 31, 2017 and 2016 in the accompanying balance sheet. The remaining business is managed with one operating segment, the Medical Devices business.
The following table summarizes the financial results of our discontinued operations for all periods presented herein (in millions):
Year Ended December 31, | |||||||||||
2017 | 2016 | 2015 | |||||||||
Net Sales | $ | 1,012.7 | $ | 1,026.1 | $ | 1,065.4 | |||||
Cost of products sold | 762.5 | 765.4 | 791.6 | ||||||||
Research and development | 2.9 | 2.7 | 4.7 | ||||||||
Selling, general and other expenses | 82.8 | 64.9 | 48.8 | ||||||||
Goodwill impairment | — | — | 474.0 | ||||||||
Other (income) expense, net | (1.6 | ) | (1.4 | ) | (11.7 | ) | |||||
Income (Loss) from discontinued operations before income taxes | 166.1 | 194.5 | (242.0 | ) | |||||||
Tax (provision) benefit from discontinued operations | (54.7 | ) | (71.4 | ) | (83.1 | ) | |||||
Income (Loss) from Discontinued Operations, net | $ | 111.4 | $ | 123.1 | $ | (325.1 | ) | ||||
In accordance with accounting principles generally accepted in the United States (“GAAP”), only expenses specifically identifiable and related to a business to be disposed may be allocated to discontinued operations. Accordingly, certain expenses that were historically presented as a component of the S&IP were kept in continuing operations. These expenses, on a pre-tax basis, were $116 million in the year ended December 31, 2017, $114 million in 2016 and $133 million in 2015.
Details on assets and liabilities classified as held for sale in the accompanying consolidated balance sheets are presented in the following table (in millions):
44 | ||
As of December 31, | |||||||
2017 | 2016 | ||||||
Assets held for sale - discontinued operations | |||||||
Accounts receivable, net of allowances | $ | 1.5 | $ | 1.6 | |||
Inventories | 198.3 | 191.8 | |||||
Prepaid and other current assets | 2.3 | 0.6 | |||||
Current assets held for sale - discontinued operations | 202.1 | 194.0 | |||||
Property, plant and equipment, net | 150.8 | 151.5 | |||||
Goodwill | 267.3 | 266.7 | |||||
Other intangible assets, net | 0.9 | 1.6 | |||||
Non-current deferred tax assets | 7.1 | 6.5 | |||||
Other assets | 0.4 | 0.6 | |||||
Total assets held for sale - discontinued operations | 628.6 | 620.9 | |||||
Other assets classified as held for sale | 3.9 | — | |||||
Total assets classified as held for sale | 632.5 | 620.9 | |||||
Liabilities held for sale - discontinued operations | |||||||
Accounts payable | $ | 15.5 | $ | 12.5 | |||
Accrued expenses | 11.2 | 12.9 | |||||
Current liabilities held for sale - discontinued operations | 26.7 | 25.4 | |||||
Deferred tax liabilities | 0.3 | 0.4 | |||||
Other long-term liabilities | 6.9 | 6.3 | |||||
Total liabilities held for sale - discontinued operations | $ | 33.9 | $ | 32.1 | |||
Assets and liabilities held for sale as of December 31, 2017 are classified as current since we expect the Divestiture to be completed within one year. In the prior year, the assets and liabilities held for sale are classified separately as current or noncurrent because the noncurrent assets and liabilities do not meet the criteria for current classification as of December 31, 2016. Other assets and liabilities held for sale that are not related to discontinued operations relates primarily to our IT system.
The following table provides operating and investing cash flow information for our discontinued operations (in millions):
Year Ended December 31, | |||||||||||
2017 | 2016 | 2015 | |||||||||
Operating Activities: | |||||||||||
Depreciation and amortization | $ | 20.0 | $ | 23.9 | $ | 23.2 | |||||
Stock-based compensation expense | 0.5 | 0.6 | 0.5 | ||||||||
Investing Activities: | |||||||||||
Capital expenditures | 1.6 | 1.3 | 1.6 | ||||||||
Note 3. Restructuring
In December 2017, in conjunction with the Divestiture (see Note 2, “Discontinued Operations”), we initiated the initial phase of a multi-year restructuring plan (the “Plan”). The initial phase of the Plan is intended to align our organizational and management structure with our remaining Medical Devices business.
We expect to incur between $8 million and $10 million of pre-tax costs, of which $6 million to $7 million is for employee severance and benefits and the remainder for third-party services and other related costs. These are cash costs that will be incurred as we execute the Plan, which we expect to substantially complete by the end of 2019.
45 | ||
We have incurred $5 million of costs, primarily for employee severance and benefits. These costs are included in “Cost of products sold” and “Selling and general” expenses in the accompanying consolidated income statement for the year ended December 31, 2017. For the year ended December 31, 2017, no severance and benefits payments have been made and the remaining liability in “Accrued expenses” and “Other long-term liabilities” for employee severance and benefits was $5 million in the accompanying consolidated balance sheet as of December 31, 2017.
Note 4. Goodwill
We test goodwill for impairment annually (as of July 1) or more frequently whenever events or circumstances more likely than not indicate that the fair value of the reporting unit may be below its carrying amount. The fair value of our reporting unit was estimated using a combination of income (discounted cash flow analysis) and market approaches. Both approaches are dependent upon several assumptions regarding future periods, including assumptions with respect to future sales growth, commodity costs and a terminal growth rate. A weighted average cost of capital (“WACC”) was used to discount future estimated cash flows to their present values. The WACC was based on externally observable data considering market participants’ cost of equity and debt, optimal capital structure and risk factors specific to our company. The market approach estimated the fair value of our business based on comparable publicly-traded companies in our industry. We completed the required annual goodwill impairment test as of July 1, 2017, and the fair value was substantially in excess of net asset carrying value.
The changes in the carrying amount of goodwill are as follows (in millions):
Balance at December 31, 2015 | $ | 678.4 | |
Goodwill acquired(a) | 84.1 | ||
Currency translation adjustment | (0.2 | ) | |
Balance at December 31, 2016 | 762.3 | ||
Currency translation adjustment | 2.4 | ||
Balance at December 31, 2017 | $ | 764.7 | |
_____________________________________________
(a) | We acquired $84 million of goodwill in conjunction with our acquisition of Corpak (see Note 6, “Business Acquisition”). |
Note 5. Supplemental Balance Sheet Information
Accounts Receivable
Accounts receivable consist of the following (in millions):
As of December 31, | |||||||
2017 | 2016 | ||||||
Accounts Receivable | $ | 204.9 | $ | 190.0 | |||
Allowances and doubtful accounts | (1.9 | ) | (1.5 | ) | |||
Accounts receivable, net | $ | 203.0 | $ | 188.5 | |||
46 | ||
Inventories
Inventories at the lower of cost (determined on the LIFO/FIFO or weighted-average cost methods) or market consists of the following (in millions):
As of December 31, | |||||||||||||||||||||||
2017 | 2016 | ||||||||||||||||||||||
LIFO | Non- LIFO | Total | LIFO | Non- LIFO | Total | ||||||||||||||||||
Raw Materials | $ | 26.6 | $ | 1.5 | $ | 28.1 | $ | 24.5 | $ | 0.8 | $ | 25.3 | |||||||||||
Work in process | 20.4 | 0.3 | 20.7 | 16.2 | 0.1 | 16.3 | |||||||||||||||||
Finished goods | 40.0 | 9.6 | 49.6 | 37.1 | 8.2 | 45.3 | |||||||||||||||||
Supplies and other | — | 5.7 | 5.7 | — | 5.8 | 5.8 | |||||||||||||||||
87.0 | 17.1 | 104.1 | 77.8 | 14.9 | 92.7 | ||||||||||||||||||
Excess of FIFO or weighted-average cost over LIFO cost | (13.0 | ) | — | (13.0 | ) | (12.0 | ) | — | (12.0 | ) | |||||||||||||
Total | $ | 74.0 | $ | 17.1 | $ | 91.1 | $ | 65.8 | $ | 14.9 | $ | 80.7 | |||||||||||
Property, Plant and Equipment
Property, plant and equipment consists of the following (in millions):
As of December 31, | |||||||
2017 | 2016 | ||||||
Land | $ | 1.0 | $ | — | |||
Buildings and leasehold improvements | 41.0 | 39.1 | |||||
Machinery and equipment | 124.4 | 136.8 | |||||
Construction in progress | 21.5 | 16.4 | |||||
187.9 | 192.3 | ||||||
Less accumulated depreciation | (78.0 | ) | (83.0 | ) | |||
Total | $ | 109.9 | $ | 109.3 | |||
There were $3 million and $5 million of capital expenditures in accounts payable as of December 31, 2017 and 2016, respectively.
As of the years ended December 31, 2017 and 2016, we held $57 million and $58 million, respectively, of net property, plant and equipment in the United States.
Depreciation expense was $19 million, $20 million and $17 million, respectively, in the years ended December 31, 2017, 2016 and 2015.
Intangible Assets
Intangible assets subject to amortization consist of the following (in millions):
As of December 31, | ||||||||||||||||||||||||
2017 | 2016 | |||||||||||||||||||||||
Gross Carrying Amount | Accumulated Amortization | Net Carrying Amount | Gross Carrying Amount | Accumulated Amortization | Net Carrying Amount | |||||||||||||||||||
Trademarks | $ | 125.9 | $ | (97.6 | ) | $ | 28.3 | $ | 125.9 | $ | (93.8 | ) | $ | 32.1 | ||||||||||
Patents and acquired technologies | 253.0 | (146.1 | ) | 106.9 | 251.8 | (131.1 | ) | 120.7 | ||||||||||||||||
Other | 43.1 | (35.1 | ) | 8.0 | 42.9 | (33.2 | ) | 9.7 | ||||||||||||||||
Total | $ | 422.0 | $ | (278.8 | ) | $ | 143.2 | $ | 420.6 | $ | (258.1 | ) | $ | 162.5 | ||||||||||
47 | ||
As of December 31, 2017, we had $6 million of indefinite-lived intangible assets that we acquired in connection with the Acquisition related to in-process research and development projects. Amortization expense for intangible assets was $21 million, $21 million and $25 million for the years ended December 31, 2017, 2016 and 2015, respectively.
We estimate amortization expense for the next five years and beyond will be as follows (in millions):
For the years ending December 31, | ||||
2018 | $ | 18.2 | ||
2019 | 15.3 | |||
2020 | 13.1 | |||
2021 | 10.9 | |||
2022 | 10.4 | |||
Thereafter | 75.3 | |||
Total | $ | 143.2 | ||
Accrued Expenses
Accrued expenses consist of the following (in millions):
As of December 31, | |||||||
2017 | 2016 | ||||||
Accrued rebates | $ | 64.4 | $ | 55.7 | |||
Accrued salaries and wages | 44.5 | 49.9 | |||||
Accrued taxes - income and other | 6.8 | 4.4 | |||||
Other | 29.2 | 28.4 | |||||
Total | $ | 144.9 | $ | 138.4 | |||
Other Long-Term Liabilities
Other long-term liabilities consist of the following (in millions):
As of December 31, | |||||||
2017 | 2016 | ||||||
Taxes payable | $ | 10.0 | $ | 3.4 | |||
Accrued compensation benefits | 4.6 | 4.4 | |||||
Other | 17.2 | 16.0 | |||||
Total | $ | 31.8 | $ | 23.8 | |||
Note 6. Business Acquisition
On May 2, 2016, Halyard acquired all of the issued and outstanding capital stock of Medsystems Holdings, Inc. (“Medsystems”) a Delaware corporation, for a purchase price of $175 million, net of cash acquired (the “Acquisition”). Medsystems owns and conducts its primary business through CORPAK Medsystems (Medsystems and CORPAK Medsystems hereinafter referred to as “Corpak”).
48 | ||
The allocation of the purchase price was as follows (in millions):
Purchase Price Allocation | |||
Current assets acquired net of liabilities assumed | $ | 14.1 | |
Property, plant and equipment | 4.4 | ||
Identifiable intangible assets, excluding IPR&D | 105.1 | ||
Identifiable IPR&D | 5.7 | ||
Deferred tax liabilities | (38.4 | ) | |
Goodwill | 84.1 | ||
Total | $ | 175.0 | |
Goodwill arising from the Acquisition is not fully tax deductible. The identifiable intangible assets, excluding IPR&D, include the following (in millions):
Fair Value | Weighted Average Useful Lives (Yrs) | ||||
Portfolio of disposables | $ | 102.9 | 15 | ||
Enteral access technology | 2.2 | 6 | |||
Total | $ | 105.1 | |||
Restructuring
In June 2016, we initiated a restructuring plan to close the Corpak corporate headquarters and operating facility in Buffalo Grove, Illinois and consolidate operations into our existing corporate and operational facilities. For the year ended December 31, 2017, we have incurred $8 million of costs that are included in “Cost of products sold” and “Selling and general expenses” in the accompanying consolidated income statements. In the year ended December 31, 2017, we have paid $3 million to affected employees and the remaining accrual for severance and employee benefits was not material as of December 31, 2017.
Note 7. Fair Value Information
The following fair value information is based on a fair value hierarchy that prioritizes the inputs to valuation techniques used to measure fair value. The three levels in the hierarchy used to measure fair value are:
Level 1: Unadjusted quoted prices in active markets accessible at the reporting date for identical assets and liabilities.
Level 2: Quoted prices for similar assets or liabilities in active markets. Quoted prices for identical or similar assets and liabilities in markets that are not considered active or financial instruments for which all significant inputs are observable, either directly or indirectly.
Level 3: Prices or valuations that require inputs that are significant to the valuation and are unobservable.
A financial instrument’s level within the fair value hierarchy is based on the lowest level of any input that is significant to the fair value measurement.
49 | ||
The following table includes the fair value of our financial instruments for which disclosure of fair value is required (in millions):
Fair Value Hierarchy Level | December 31, 2017 | December 31, 2016 | |||||||||||||||
Carrying Amount | Estimated Fair Value | Carrying Amount | Estimated Fair Value | ||||||||||||||
Assets | |||||||||||||||||
Cash and cash equivalents | 1 | $ | 219.7 | $ | 219.7 | $ | 113.7 | $ | 113.7 | ||||||||
Liabilities | |||||||||||||||||
Senior unsecured notes | 1 | 247.1 | 259.7 | 246.5 | 256.4 | ||||||||||||
Debt | 2 | 333.8 | 341.1 | 332.5 | 341.3 | ||||||||||||
Cash equivalents are recorded at cost, which approximates fair value due to their short-term nature.
The fair value of our senior unsecured notes is determined using observable market prices based on trading activity on a primary exchange. For the years ended December 31, 2017 and 2016, there were no transfers among Level 1, 2 or 3 fair value determinations. Transfers between levels occur when there are changes in the observability of inputs. Changes between levels are assumed to occur at the beginning of the year.
Note 8. Debt
As of December 31, 2017 and 2016, our debt balances were as follows (in millions):
Weighted- Average Interest Rate | Maturities | As of December 31, | |||||||||
2017 | 2016 | ||||||||||
Senior Secured Term Loan | 3.83% | 2021 | $ | 339.0 | $ | 339.0 | |||||
Senior Unsecured Notes | 6.25% | 2022 | 250.0 | 250.0 | |||||||
Total debt | 589.0 | 589.0 | |||||||||
Unamortized Debt Discounts and Issuance Costs | |||||||||||
Senior Secured Term Loan | (5.2 | ) | (6.5 | ) | |||||||
Senior Unsecured Notes | (2.9 | ) | (3.5 | ) | |||||||
Total Debt, net | 580.9 | 579.0 | |||||||||
Less current portion of long-term debt | 39.8 | — | |||||||||
Total long-term debt | $ | 541.1 | $ | 579.0 | |||||||
Senior Secured Term Loan and Revolving Credit Facility
The senior secured term loan (the “Term Loan Facility”) is under a credit agreement that also includes a senior secured revolving credit facility allowing borrowings of up to $250 million, with a letter of credit sub-facility in an amount of $75 million and a swingline sub-facility in an amount of $25 million (the “Revolving Credit Facility” and together with the Term Loan Facility, the “Senior Credit Facilities”). The Senior Credit Facilities are secured by substantially all of our assets located in the United States and a certain percentage of our foreign subsidiaries’ capital stock. Unamortized debt discount and issuance costs are being amortized to interest expense over the life of the Term Loan Facility using the interest method, resulting in an effective interest rate of 4.53% as of December 31, 2017.
The credit agreement contains an excess cash flow provision that requires a mandatory principal prepayment of our Term Loan Facility if we generate cash in excess of a defined measure of cash flow. Accordingly, we are required to prepay $40 million under this prepayment requirement as we generated Excess Cash in the year ended December 31, 2017. This prepayment is classified as “Current portion of long-term debt” in the accompanying consolidated balance sheet and will be paid in the first quarter of 2018.
50 | ||
Borrowings under the Term Loan Facility bear interest, at our option, at either (i) a reserve-adjusted LIBOR rate, subject to a floor of 0.75%, plus 2.75%, or (ii) a base rate, subject to a floor of 0.75%, (calculated as the greatest of (1) the prime rate, (2) the U.S. federal funds effective rate plus 0.50% or (3) the one month LIBOR Rate plus 1.00%) plus 1.75%. As of December 31, 2017, the interest rate in effect for the Term Loan Facility was 4.10%.
Borrowings under the Revolving Credit Facility will bear interest, at our option, at either (i) a reserve-adjusted LIBOR rate, plus a margin ranging between 1.75% to 2.50% per annum, depending on our consolidated total leverage ratio, or (ii) the base rate plus a margin ranging between 0.75% to 1.50% per annum, depending on our consolidated total leverage ratio. The unused portion of our Revolving Credit Facility will be subject to a commitment fee equal to (i) 0.25% per annum, when our consolidated total leverage ratio is less than 2.25 to 1.00 and (ii) 0.40% per annum, otherwise.
To the extent we remain in compliance with certain financial covenants in our credit agreement. we have the ability to access our Revolving Credit Facility. As of December 31, 2017, we had no borrowings and letters of credit of $3 million outstanding under the Revolving Credit Facility. The maturity date for the Revolving Credit Facility is October 31, 2019.
Senior Unsecured Notes
The Senior Unsecured Notes (“Notes”) will mature on October 15, 2022 and interest accrues at a rate of 6.25% per annum and is payable semi-annually in arrears on April 15 and October 15 of each year. The Notes are guaranteed, jointly and severally, by each of our domestic subsidiaries that guarantees the Senior Credit Facilities. Unamortized debt discount and issuance costs are being amortized to interest expense over the life of the credit agreement using the interest method, resulting in an effective interest rate of 6.53% as of December 31, 2017.
Debt Covenants
The senior secured term loan and the Notes are subject to similar covenants that, among other things, limit our ability and the ability of certain of our subsidiaries to:
• | incur additional indebtedness, guarantee indebtedness or issue disqualified stock or, in the case of our restricted subsidiaries, preferred stock; |
• | pay dividends on, repurchase or make distributions in respect of our capital stock; |
• | make certain investments or acquisitions; |
• | sell, transfer or otherwise convey certain assets; |
• | create liens; |
• | enter into agreements restricting certain subsidiaries’ ability to pay dividends or make other intercompany transfers; |
• | consolidate, merge, sell or otherwise dispose of all or substantially all of our and our subsidiaries’ assets; |
• | enter into transactions with affiliates; and |
• | prepay certain kinds of indebtedness. |
We have the ability to divest significant assets, such as the Divestiture described in “Discontinued Operations” in Note 2. The credit agreement allows re-investment of the proceeds into the business through acquisition of another business or through capital expenditures. However, if no investments are made within a specified period of time, the proceeds are to be used to reduce amounts owed under the Senior Credit Facilities and the Notes.
Pursuant to the restrictive covenants that limit our ability to pay dividends, we have the ability to pay dividends, repurchase stock and make investments up to an “Available Amount,” as defined in the credit agreement governing the Senior Credit Facilities, provided that we are in compliance with all required covenants, there are no events of default and upon meeting certain financial ratios.
As of December 31, 2017, we were in compliance with all of our debt covenants. As of December 31, 2017, our repayment requirements in the next five years includes a mandatory prepayment of $40 million on our Term Loan facility in the first quarter of 2018, with the remainder owed under our Term Loan Facility and the $250 million Notes due on their respective maturity dates, which are October 31, 2021 and October 15, 2022.
51 | ||
Note 9. Income Taxes
Our income taxes are calculated using the asset and liability method of accounting, which requires the recognition of deferred tax assets and liabilities for the expected future tax consequences of temporary differences between the carrying amounts and the tax bases of assets and liabilities.
The provision for income taxes includes federal, state and foreign taxes currently payable and those deferred because of net operating losses and temporary differences between the consolidated financial statements and tax bases of assets and liabilities.
The components of income (loss) before income taxes, and the provision (benefit) for income taxes are as follows (in millions):
Year Ended December 31, | |||||||||||
2017 | 2016 | 2015 | |||||||||
Income before income taxes | |||||||||||
United States | $ | (76.2 | ) | $ | (140.5 | ) | $ | (167.2 | ) | ||
Foreign | 4.0 | 1.3 | (1.3 | ) | |||||||
Total | (72.2 | ) | (139.2 | ) | (168.5 | ) | |||||
Income tax provision (benefit): | |||||||||||
Current: | |||||||||||
United States | (27.4 | ) | (30.6 | ) | (49.5 | ) | |||||
State | (4.6 | ) | (3.5 | ) | (4.2 | ) | |||||
Foreign | 1.4 | 0.7 | (0.2 | ) | |||||||
Total | (30.6 | ) | (33.4 | ) | (53.9 | ) | |||||
Deferred: | |||||||||||
United States | (9.0 | ) | (21.3 | ) | (12.5 | ) | |||||
State | (0.4 | ) | (1.0 | ) | (0.8 | ) | |||||
Foreign | (0.1 | ) | (0.2 | ) | (0.1 | ) | |||||
Total | (9.5 | ) | (22.5 | ) | (13.4 | ) | |||||
Total income tax benefit | $ | (40.1 | ) | $ | (55.9 | ) | $ | (67.3 | ) | ||
On December 22, 2017, the Tax Cuts and Jobs Act of 2017 (the “Act”) was signed into law making significant changes to the Internal Revenue Code. Changes include, but are not limited to, a corporate tax rate decrease from 35% to 21% effective for tax years beginning after December 31, 2017, the transition of U.S. international taxation from a worldwide tax system to a territorial system, and a one-time transition tax on the mandatory deemed repatriation of cumulative foreign earnings as of December 31, 2017. We have calculated our best estimate of the impact of the Act in its year end income tax provision in accordance with our understanding of the Act and guidance available as of the date of this filing and as a result have recorded $10 million as an additional income tax benefit in the fourth quarter of 2017, the period in which the legislation was enacted. The provisional amount related to the re-measurement of certain deferred tax assets and liabilities based on the rates at which they are expected to reverse in the future was $16 million of benefit. The provisional amount related to the one-time transition tax on the mandatory deemed repatriation of foreign earnings was $7 million based on cumulative foreign earnings of $101 million. We also recorded a $1 million benefit related to the treatment of current year cash dividends in relation to the repatriation tax.
On December 22, 2017, Staff Accounting Bulletin No. 118 (“SAB 118”) was issued to address the application of U.S. GAAP in situations when a registrant does not have the necessary information available, prepared, or analyzed (including computations) in reasonable detail to complete the accounting for certain income tax effects of the Act. In accordance with SAB 118, we have determined that the $16 million of deferred tax benefit recorded in connection with the re-measurement of certain deferred tax assets and liabilities, the $7 million of current tax expense recorded in connection with the transition tax on the mandatory deemed repatriation of foreign earnings and the $1 million benefit related to the treatment of current year cash dividends in relation to the repatriation tax are provisional amounts and reasonable estimates at December 31, 2017. The impact of the Act may differ from this estimate, possibly materially, due to, among other things, changes in interpretations we have made, guidance that may be issued and actions we may take as a result of the Act. Additional work is necessary for a more detailed
52 | ||
analysis of our deferred tax assets and liabilities and our historical foreign earnings as well as potential correlative adjustments. We have not accounted for the tax impacts related to the Global Intangible Low Tax Income, Base Erosion Anti Abuse Tax or Foreign Derived Intangible Income regimes or any of the other provisions of the tax legislation that are not effective until fiscal year 2018. Any subsequent adjustment to these amounts will be recorded to current tax expense in the quarter of 2018 when the analysis is complete.
At December 31, 2017, prior to the calculation of the transition tax on the mandatory deemed repatriation, U.S. income taxes and foreign withholding taxes had not been provided on $151 million of current and prior year undistributed earnings of subsidiaries operating outside the U.S. These earnings, which are considered to be invested indefinitely, would become subject to income tax if they were remitted as dividends, were lent to one of our U.S. entities or if we were to sell our stock in the subsidiaries.
While the provisional transition tax of approximately $7 million resulted in the reduction of the excess amount of financial reporting over the tax basis in our foreign subsidiaries, we have not completed our analysis of the Act’s impact as an actual repatriation from our non-U.S. subsidiaries could still be subject to additional foreign withholding taxes and U.S. state taxes. We have not completed our analysis of our global working capital and cash requirements and the potential tax liabilities attributable to a repatriation. Therefore, we have not made a provisional estimate of the deferred taxes attributable to repatriation. We will record the tax effects of any change in our prior assertion with respect to these investments, and disclose any unrecognized deferred tax liability for temporary differences related to our foreign investments, if practicable, in the period that we are first able to make a reasonable estimate, no later than December 2018. While we otherwise intend to maintain the indefinite reinvestment exception, we have provided for a deferred tax asset of $5 million representing our tax basis over book basis in our investment in certain investments in connection with the proposed divestiture of our S&IP business.
Major differences between the federal statutory rate and the effective tax rate are as follows:
Year Ended December 31, | ||||||||
2017 | 2016 | 2015 | ||||||
Federal statutory rate | 35.0 | % | 35.0 | % | 35.0 | % | ||
Rate of state income taxes, net of federal tax benefit | 4.5 | 2.8 | 2.0 | |||||
Statutory rate other than U.S. statutory rate | 0.1 | 0.4 | — | |||||
Sec. 987 regulation change, federal and state impact | — | 1.2 | — | |||||
U.S. federal research and development credit | 3.0 | 1.5 | 1.0 | |||||
Impacts of U.S. federal tax reform | 14.2 | — | — | |||||
Other, net | (1.2 | ) | (0.7 | ) | 1.9 | |||
Effective tax rate | 55.6 | % | 40.2 | % | 39.9 | % | ||
53 | ||
The following is a summary of the significant components of the Company’s deferred tax assets and liabilities (in millions):
As of December 31, | ||||||||
2017 | 2016 | |||||||
Deferred tax assets | ||||||||
Accrued liabilities | $ | 18.7 | $ | 34.1 | ||||
Investment in Joint Venture | 5.3 | — | ||||||
Stock-based compensation | 7.3 | 8.7 | ||||||
Transaction costs | 5.8 | — | ||||||
Other | 6.7 | 8.4 | ||||||
43.8 | 51.2 | |||||||
Valuation allowance | (1.3 | ) | (0.5 | ) | ||||
Total deferred assets | 42.5 | 50.7 | ||||||
Deferred tax liabilities | ||||||||
Intangibles, net | 10.2 | 17.7 | ||||||
Inventories | 12.8 | 13.0 | ||||||
Property, plant and equipment, net | 29.4 | 45.8 | ||||||
Other | 0.3 | 1.0 | ||||||
Total deferred tax liabilities | 52.7 | 77.5 | ||||||
Net deferred tax liabilities | $ | 10.2 | $ | 26.8 | ||||
Valuation allowances increased $0.8 million during the year ended December 31, 2017, primarily relating to net operating losses that we believe will not be realizable as a result of the proposed disposition of our S&IP business. Valuation allowances at the end of 2017 and 2016 primarily relate to tax credits and income tax loss carryforwards.
Realization of income tax loss carryforwards is dependent on generating sufficient taxable income prior to expiration of these carryforwards. Although realization is not assured, we believe it is more likely than not that all of the deferred tax assets, net of applicable valuation allowances, will be realized. The amount of the deferred tax assets considered realizable could be reduced or increased due to changes in the tax environment or if estimates of future taxable income change during the carryforward period.
At December 31, 2017, we have credit carryforwards for state income tax purposes of $3.0 million, all of which will expire in 2025. At December 31, 2017, certain foreign subsidiaries have net operating loss carryforwards for income tax purposes of $12 million, of which $7 million will expire in 2020. The remaining net operating losses are available for carryforward indefinitely.
In connection with the proposed disposition of our S&IP business, we have recognized a deferred tax asset for our tax basis over book basis of $5 million relating to certain investments.
A reconciliation of the beginning and ending amount of unrecognized tax benefit is as follows (in millions):
As of December 31, | |||||||
2017 | 2016 | ||||||
Beginning of year | $ | 2.7 | $ | 1.5 | |||
Gross increases for tax positions of prior years | 0.1 | 1.5 | |||||
Gross decreases for tax positions of prior years | — | (0.2 | ) | ||||
Decreases for settlements with taxing authorities | — | (0.1 | ) | ||||
Decreases for lapse of the applicable statute of limitations | (0.1 | ) | — | ||||
End of year | $ | 2.7 | $ | 2.7 | |||
54 | ||
The amount, if recognized, that would affect our effective tax rate as of December 31, 2017 and 2016 is $3 million and $2 million, respectively.
We classify interest and penalties on uncertain tax benefits as income tax expense. As of each year ended December 31, 2017 and 2016, before any tax benefits, we had $1 million of accrued interest and penalties on unrecognized tax benefits.
During the next twelve months, we do not expect the resolution of any tax audits which could potentially reduce unrecognized tax benefits by a material amount. In addition, no expiration of the statute of limitations for a tax year in which we have recorded uncertain tax benefits will occur in the next twelve months.
Federal and state income tax returns are generally subject to examination for a period of three to five years after filing of the respective returns. The state effect of any changes to filed federal positions remains subject to examination by various states for a period of up to two years after formal notification to the states. We have various federal and state income tax return positions in the process of examination, administrative appeals or litigation.
Note 10. Employee Benefit Plans
Defined Contribution Plans
Eligible employees participate in our defined contribution plans. Our 401(k) plan and supplemental plan provide for a matching contribution of a U.S. employee’s contributions and accruals, subject to predetermined limits. Halyard also has defined contribution pension plans for certain employees outside the U.S. in which eligible employees may participate. We recognized $7 million of expense for our matching contributions to the 401(k) plan in each of the years ended December 31, 2017, 2016 and 2015, respectively. Our matching contributions to the 401(k) plan are recognized in cost of products sold, research and development and selling and general expenses in our consolidated income statements.
Defined Benefit Plans
Certain plans in our international operations are our direct obligation, and therefore, the related funded status has been recorded within our consolidated balance sheet. These plans are primarily unfunded and the aggregated projected benefit obligation was $3 million and $2 million as of December 31, 2017 and 2016, respectively. Net periodic pension cost for each of the years ended December 31, 2017, 2016 and 2015 was $1 million. Over the next ten years, we expect gross benefit payments to be $1 million in total for the years 2018 through 2022, and $1 million in total for the years 2023 through 2027.
Note 11. Accumulated Other Comprehensive Income
The changes in the components of Accumulated Other Comprehensive Income (“AOCI”), net of tax, are as follows (in millions):
Unrealized Translation | Cash Flow Hedges | Defined Benefit Pension Plans | Accumulated Other Comprehensive Income | ||||||||||||
Balance, December 31, 2014 | $ | (18.3 | ) | $ | (0.5 | ) | $ | (0.3 | ) | $ | (19.1 | ) | |||
Other comprehensive loss | (22.1 | ) | (0.7 | ) | (1.3 | ) | (24.1 | ) | |||||||
Balance, December 31, 2015 | (40.4 | ) | (1.2 | ) | (1.6 | ) | (43.2 | ) | |||||||
Other comprehensive (loss) income | (8.3 | ) | 0.8 | 0.6 | (6.9 | ) | |||||||||
Balance, December 31, 2016 | (48.7 | ) | (0.4 | ) | (1.0 | ) | (50.1 | ) | |||||||
Other comprehensive (loss) income | 17.1 | 1.2 | 0.5 | 18.8 | |||||||||||
Balance, December 31, 2017 | $ | (31.6 | ) | $ | 0.8 | $ | (0.5 | ) | $ | (31.3 | ) | ||||
55 | ||
The net changes in the components of AOCI, including the tax effect, are as follows (in millions):
Year Ended December 31, | |||||||||||
2017 | 2016 | 2015 | |||||||||
Unrealized translation | $ | 17.1 | $ | (8.3 | ) | $ | (22.1 | ) | |||
Defined benefit pension plans | 0.6 | 0.7 | (1.9 | ) | |||||||
Tax effect | (0.1 | ) | (0.1 | ) | 0.6 | ||||||
Defined benefit pension plans, net of tax | 0.5 | 0.6 | (1.3 | ) | |||||||
Cash flow hedges | 1.5 | 1.0 | (1.0 | ) | |||||||
Tax effect | (0.3 | ) | (0.2 | ) | 0.3 | ||||||
Cash flow hedges, net of tax | 1.2 | 0.8 | (0.7 | ) | |||||||
Change in AOCI | $ | 18.8 | $ | (6.9 | ) | $ | (24.1 | ) | |||
Note 12. Stock-Based Compensation
The Halyard Health, Inc. Equity Participation Plan and the Halyard Health, Inc. Outside Directors’ Compensation Plan (together, the “Equity Plans”) provide for awards of stock options, stock appreciation rights, restricted stock (and in certain limited cases, unrestricted stock), restricted stock units, performance units and cash awards to eligible employees (including officers who are employees), directors, advisors and consultants of Halyard or its subsidiaries. A maximum of 4.9 million shares of Halyard common stock may be issued under the Equity Plans, and there are 1.9 million shares remaining available for issuance as of December 31, 2017.
Aggregate stock-based compensation expense under the Equity Plans was $13 million, $15 million and $14 million for the years ended December 31, 2017, 2016 and 2015, respectively, which includes amounts allocated to discontinued operations. Stock-based compensation expense included in continuing operations totals $12 million, $14 million and $13 million in the years ended December 31, 2017, 2016 and 2015, respectively. Stock-based compensation expense described by award type below refers to expense in continuing operations only. Stock-based compensation expense is included in cost of sales, research and development expenses and selling and general expenses.
Stock Options
Stock options are granted at an exercise price equal to the fair market value of Halyard’s common stock on the date of grant. Stock options are generally subject to graded vesting whereby options vest 30% at the end of each of the first two 12-month periods following the grant and 40% at the end of the third 12-month period and have a term of 10 years.
The fair value of stock option awards was determined using a Black-Scholes option-pricing model utilizing a range of assumptions related to volatility, risk-free interest rate, expected term and dividend yield. Expected volatility was based on historical weekly closing stock price volatility for a peer group of companies. The risk-free interest rate was based on the U.S. Treasury yield curve in effect at the time of grant. The expected term was based on historical observed settlement behavior. The dividend yield was based on the expectation that no dividends are expected to be paid on our common stock.
The weighted-average fair value of options granted in the years ended December 31, 2017, 2016 and 2015 was $9.07, $7.70 and $15.15, respectively, based on the following assumptions:
56 | ||
Year Ended December 31, | |||||
2017 | 2016(a) | 2015 | |||
Volatility | 24% to 25% | 26% | 25% to 34% | ||
Risk-free rate | 1.7% to 1.8% | 1.2% | 0.7% to 1.9% | ||
Expected term (Years) | 5 | 5 | 2 to 7 | ||
Dividend Yield | 0% | 0% | 0% | ||
________________________________________
(a) | In the year ended December 31, 2016, all stock options granted had uniform terms and were awarded on the same grant date. |
Stock-based compensation expense related to stock options was $3 million, $5 million and $6 million for the years ended December 31, 2017, 2016 and 2015, respectively.
A summary of stock option activity is presented below:
Shares (in thousands) | Weighted- Average Exercise Price | Weighted- Average Remaining Contractual Term (Years) | Aggregate Intrinsic Value (in millions) | |||||||||
Outstanding at December 31, 2016 | 1,526 | $ | 37.42 | |||||||||
Granted | 558 | 37.59 | ||||||||||
Exercises | (136 | ) | 34.80 | |||||||||
Forfeitures | (278 | ) | 40.38 | |||||||||
Outstanding at December 31, 2017 | 1,670 | $ | 37.20 | 6.9 | $ | 15.0 | ||||||
Vested and exercisable at December 31, 2017 | 949 | $ | 36.23 | 5.7 | $ | 9.4 | ||||||
The following table summarizes information about options outstanding as of December 31, 2017:
Options Outstanding | Options Exercisable | ||||||||||||
Range of Exercise Prices | Shares (in thousands) | Weighted-Average Remaining Contractual Term (Years) | Shares (in thousands) | Weighted-Average Exercise Price | |||||||||
$25.00 | to | $35.00 | 530 | 6.3 | 380 | $ | 30.29 | ||||||
$35.00 | to | $45.00 | 724 | 7.5 | 366 | 37.24 | |||||||
$45.00+ | 416 | 6.6 | 203 | 45.53 | |||||||||
1,670 | 6.9 | 949 | $ | 36.23 | |||||||||
In the year ended December 31, 2017, options with an aggregate intrinsic value of $1 million were exercised resulting in an excess tax benefit of $0.4 million. In the years ended December 31, 2016 and 2015, the intrinsic value of exercised options and the resulting excess tax benefit were not material. For stock options outstanding at December 31, 2017, we expect to recognize an additional $4 million of expense over the remaining average service period of one year.
Restricted Share Units
Restricted shares, time-vested restricted share units and performance-based restricted share units granted to employees and directors are valued at the closing market price of our common stock on the grant date with vesting conditions determined upon approval of the award.
Stock-based compensation expense related to restricted stock units was $4 million, $5 million and $8 million for the years ended December 31, 2017, 2016 and 2015, respectively. A summary of restricted share unit activity is presented below:
57 | ||
Shares (in thousands) | Weighted Average Fair Value | |||||
Outstanding at December 31, 2016 | 528 | $ | 39.12 | |||
Granted | 123 | 38.16 | ||||
Vested | (166 | ) | 37.99 | |||
Forfeited | (56 | ) | 40.51 | |||
Outstanding at December 31, 2017 | 429 | $ | 39.10 | |||
For restricted share units outstanding at December 31, 2017, we expect to recognize an additional $4 million of expense over the remaining average service period of one year.
We also issue restricted share units for which vesting is conditioned on meeting a defined measure of total shareholder return (“TSR units”) over a restricted period of three years. Total shareholder return is measured as our stock price performance over the restricted period compared to defined group of peer companies. The expense recognition for TSR units differs from awards with service or performance conditions in that the expense is recognized over the restricted period regardless of whether the total shareholder return target is met or not, while expense for awards with service and performance conditions is recognized based on the number of awards expected to vest. The fair value of TSR units is determined using a Monte Carlo simulation with a volatility assumption based on the average stock-price volatility for a peer group of companies over the restricted period. For awards granted in the years ended December 31, 2017 and 2016, the assumed volatility was 25% in each of the years and the weighted average fair value per TSR unit was $42.24 and $38.64, respectively. For the years ended December 31, 2017 and 2016, stock-based compensation expense related to TSR units was $5 million and $4 million, respectively. There were no TSR units awarded before 2016.
A summary of TSR unit activity is presented below.
Shares (in thousands) | Weighted Average Fair Value | |||||
Outstanding at December 31, 2016 | 224 | $ | 38.60 | |||
Granted | 231 | 42.24 | ||||
Forfeited | (57 | ) | 42.02 | |||
Outstanding at December 31, 2017 | 398 | $ | 40.22 | |||
For TSR units outstanding at December 31, 2017, we expect to recognize an additional $6 million of expense over the weighted average remaining restricted period of two years.
Note 13. Commitments and Contingencies
Legal Matters
We are subject to various legal proceedings, claims and governmental inspections, audits or investigations pertaining to issues such as contract disputes, product liability, tax matters, patents and trademarks, advertising, governmental regulations, employment and other matters, including the matters described below. Under the terms of the distribution agreement we entered into with Kimberly-Clark Corporation (“Kimberly-Clark”) prior to the Spin-off, legal proceedings, claims and other liabilities that are primarily related to our business are our responsibility and we are obligated to indemnify and hold Kimberly-Clark harmless for such matters (“Indemnification Obligation”). For the years ended December 31, 2017, 2016 and 2015, we have incurred $21 million, $20 million and $17 million, respectively, related to these matters.
Chondrolysis Litigation
An exception to our Indemnification Obligation relates to the pain pump litigation referenced in this paragraph. We are one of several manufacturers of continuous infusion medical devices, such as our ON-Q PAINBUSTER pain pumps, that are involved in several different pending or threatened litigation matters from multiple plaintiffs alleging that use of the continuous infusion device to deliver anesthetics directly into a synovial joint after surgery resulted in postarthroscopic glenohumeral chondrolysis, or a disintegration of the cartilage covering the bones in the joint (typically, in the shoulder). Plaintiffs generally seek monetary
58 | ||
damages and attorneys’ fees. Although Kimberly-Clark generally retained the liabilities related to these matters, the distribution agreement between us and Kimberly-Clark provides that we will indemnify Kimberly-Clark for any such claims or causes of action arising after the Spin-off.
Surgical Gown Litigation and Related Matters
Bahamas Surgery Center
We have an Indemnification Obligation for, and have assumed the defense of, the matter styled Bahamas Surgery Center, LLC v. Kimberly-Clark Corporation and Halyard Health, Inc., No. 2:14-cv-08390-DMG-SH (C.D. Cal.) (“Bahamas”), filed on October 29, 2014. In that case, the plaintiff brought a putative class action asserting claims for common law fraud (affirmative misrepresentation and fraudulent concealment) and violation of California’s Unfair Competition Law (“UCL”) in connection with our marketing and sale of MicroCool surgical gowns.
On April 7, 2017, after a two-week trial, a jury returned a verdict for the plaintiff, finding that Kimberly-Clark was liable for $4 million in compensatory damages (not including prejudgment interest) and $350 million in punitive damages, and that Halyard was liable for $0.3 million in compensatory damages (not including prejudgment interest) and $100 million in punitive damages. Subsequently, the court also ruled on the plaintiff’s UCL claim and request for injunctive relief. The court found in favor of the plaintiff on the UCL claim but denied the plaintiff’s request for restitution. The court also denied the plaintiff’s request for injunctive relief.
On May 25, 2017, we filed three post-trial motions: a renewed motion for judgment as a matter of law; a motion to decertify the class; and a motion for new trial, remittitur, or amendment of the judgment. The renewed motion for judgment as a matter of law seeks to have the court reverse the jury’s verdict in whole or in part because it was based on insufficient facts and/or did not correctly apply the law. The motion to decertify the class seeks to have the court decertify the class on the basis that the evidence at trial did not support the Court’s initial class certification order and therefore the case should not have proceeded as a class action. The motion for new trial, remittitur or amendment of the judgment seeks, among other relief, to have the court reduce the jury’s punitive damages award because it was not supported by the facts and was excessive in violation of due process under the U.S. Constitution. The U.S. Supreme Court has stated that the Constitutional outer limit for the ratio between punitive damages and compensatory damages in cases such as ours is approximately 9 to 1 or lower, and we believe that in a case such as ours that, if there is any award of punitive damages (a premise we dispute), the ratio should be 1 to 1. We intend to continue our vigorous defense of the Bahamas matter.
Kimberly-Clark Corporation
We have notified Kimberly-Clark that we have reserved our rights to challenge any purported obligation to indemnify Kimberly-Clark for the punitive damages awarded against them. In connection with our reservation of rights, on May 1, 2017, we filed a complaint in the matter styled Halyard Health, Inc. v. Kimberly-Clark Corporation, Case No. BC659662 (County of Los Angeles, Superior Court of California). In that case, we seek a declaratory judgment that we have no obligation, under the Distribution Agreement or otherwise, to indemnify, pay, reimburse, assume, or otherwise cover punitive damages assessed against Kimberly-Clark in Bahamas Surgery Center, LLC, et al. v. Kimberly-Clark Corporation and Halyard Health, Inc., No. 14-CV-08390 (C.D. Cal., originally filed on October 29, 2014), or any Expenses or Losses (as defined in the distribution agreement) associated with an award of punitive damages. On May 2, 2017, Kimberly-Clark filed a complaint in the matter styled Kimberly-Clark Corporation v. Halyard Health, Inc., Case No. 2017-0332-AGB (Court of Chancery of the State of Delaware). In that case, Kimberly-Clark seeks a declaratory judgment that (1) we must indemnify them for all damages, including punitive damages, assessed against them in the Bahamas matter, (2) we have anticipatorily and materially breached the Distribution Agreement by our failure to indemnify them, and (3) we are estopped from asserting, or have otherwise waived, any claim that we are not required to indemnify them for all damages, including punitive damages, that may be awarded in the Bahamas matter. On May 26, 2017, we moved to dismiss or stay Kimberly-Clark’s Delaware complaint, and on June 16, 2017, Kimberly-Clark moved for summary judgment. On September 12, 2017, the Delaware court granted our motion to stay Kimberly-Clark’s complaint and therefore did not take any action on Kimberly-Clark’s motion for summary judgment. We intend to vigorously pursue our case against Kimberly-Clark in California and to vigorously defend against their case against us.
Government Investigation
In June 2015, we were served with a subpoena from the Department of Veterans Affairs Office of the Inspector General (“VA OIG”) seeking information related to the design, manufacture, testing, sale and promotion of MicroCool and other Company
59 | ||
surgical gowns, and, in July 2015, we also became aware that the subpoena and an earlier VA OIG subpoena served on Kimberly-Clark requesting information about gown sales to the federal government are related to a United States Department of Justice (“DOJ”) investigation. In May 2016 and April 2017, we received additional subpoenas from the DOJ seeking further information related to Company gowns. The Company is cooperating with the DOJ investigation.
Shahinian and Edgett
On October 12, 2016, after the DOJ and various States declined to intervene in two qui tam matters, both matters were unsealed and the complaints were subsequently served on Kimberly-Clark and Halyard, as applicable. One of those matters is U.S. ex rel. Shahinian, et al. v. Kimberly-Clark Corporation, No. 2:14-cv-08313-JAK-JPR (C. D. Cal.) (“Shahinian”), filed on October 27, 2014. The other matter is U.S. ex rel. Edgett, et al. v. Kimberly-Clark Corporation, Halyard Health, Inc., et al, No. 3:15-cv-00434-B (N.D. Tex.) (“Edgett”), filed on February 9, 2015. Both cases allege, among other things, violations of the federal and various state False Claims Acts in connection with the marketing and sale of certain surgical gowns.
Shahinian: On March 8, 2017, Kimberly-Clark moved to dismiss the Shahinian complaint, and on July 14, 2017, the California court granted Kimberly-Clark’s motion while also granting the plaintiff leave to amend his complaint. The plaintiff then filed a second amended complaint. On August 11, 2017, Kimberly-Clark moved to dismiss the complaint, and on November 30, 2017, the California court again granted Kimberly-Clark’s motion while also granting the plaintiff leave to amend his complaint. The plaintiff then filed a third amended complaint. On January 18, 2018, Kimberly-Clark moved to dismiss it.
Edgett: On May 17, 2017, Kimberly-Clark and Halyard moved to dismiss the Edgett complaint. On September 22, 2017, the court granted Kimberly-Clark’s and Halyard’s motions to dismiss, and on November 6, 2017, the court entered final judgment dismissing the Edgett complaint. The plaintiff did not appeal the entry of judgment.
We may have an Indemnification Obligation for the Shahinian and Edgett matters under the distribution agreement with Kimberly-Clark and have notified Kimberly-Clark that we reserve our rights to challenge the obligation to indemnify Kimberly-Clark for any damages or penalties which are not indemnifiable under applicable law or public policy. We intend to vigorously defend the remaining claims.
Kromenaker
On March 17, 2017, the DOJ submitted a filing declining to intervene in another qui tam matter, and the complaint was unsealed and subsequently served on Kimberly-Clark and Halyard. That matter is styled U.S. ex rel. Kromenaker v. Kimberly-Clark Corporation and Halyard Health, Inc., No. 1:15-cv-04413-SCJ (N. D. Ga.) (“Kromenaker”), filed on December 21, 2015. In that case, the plaintiff alleges, among other things, violations of the federal False Claims Act in connection with the marketing and sale of certain products, including feminine hygiene products, surgical gowns and endotracheal tubes. On June 12, 2017, Kimberly-Clark and Halyard moved to dismiss the complaint. On August 21, 2017, Kromenaker filed an amended complaint, and Kimberly-Clark and Halyard filed motions to dismiss the amended complaint on September 20, 2017. We may have an Indemnification Obligation for certain parts of this matter under the distribution agreement with Kimberly-Clark and have notified Kimberly-Clark that we reserve our rights to challenge the obligation to indemnify Kimberly-Clark for any damages or penalties which are not indemnifiable under applicable law or public policy. We intend to vigorously defend this matter.
Jackson
We were served with a complaint in a matter styled Jackson v. Halyard Health, Inc., Robert E. Abernathy, Steven E. Voskuil, et al., No. 1:16-cv-05093-LTS (S.D.N.Y.), filed on June 28, 2016. In that case, the plaintiff brings a putative class action against the Company, our Chief Executive Officer, our Chief Financial Officer and other defendants, asserting claims for violations of the Securities Exchange Act, Sections 10(b) and 20(a). The plaintiff alleges that the defendants made misrepresentations and failed to disclose certain information about the safety and effectiveness of our MicroCool gowns and thereby artificially inflated the Company’s stock prices during the respective class periods. The alleged class period for purchasers of Kimberly-Clark securities who subsequently received Halyard Health securities is February 25, 2013 to October 21, 2014, and the alleged class period for purchasers of Halyard Health securities is October 21, 2014 to April 29, 2016. On February 16, 2017, we moved to dismiss the case. We intend to continue our vigorous defense of this matter.
Richardson, Chiu and Pick
We were also served with a complaint in a matter styled Margaret C. Richardson Trustee of the Survivors Trust Dated 6/12/84 for the Benefit of the H&M Richardson Revocable Trust v. Robert E. Abernathy, Steven E. Voskuil, et al., No. 1:16-cv-06296 (S.
60 | ||
D. N. Y.) (“Richardson”), filed on August 9, 2016. In that case, the plaintiff sues derivatively on behalf of Halyard Health, Inc., and alleges that the defendants breached their fiduciary duty, were unjustly enriched, and violated Section 14(A) of the Securities and Exchange Act in connection with Halyard Health, Inc.’s marketing and sale of MicroCool gowns. We were also served with a complaint in a matter styled Kai Chiu v. Robert E. Abernathy, Steven E. Voskuil, et al, No. 2:16-cv-08768 (C.D. Cal.), filed on November 23, 2016. In that case, the plaintiff sues derivatively on behalf of Halyard Health, Inc., and makes allegations and brings causes of action similar to those in Richardson, but the plaintiff also adds causes of action for abuse of control, gross mismanagement, and waste of corporate assets. We were also served with a complaint in a matter styled Lukas Pick v. Robert E. Abernathy, Steven E. Voskuil, et al. No. e:18-cv-00295 (D. Del.), filed of February 21, 2018. In that case, the plaintiff sues derivatively on behalf of Halyard Health, Inc., and makes allegations and brings causes of action similar to those in Richardson and Chiu. We intend to vigorously defend these matters.
Medline Industries
We were also served with a complaint in the matter styled Medline Industries, Inc. v. Kimberly-Clark Corporation, Halyard Health, Inc., et al., No. 2:16-cv-08571 (C. D. Cal.), filed on November 17, 2016. In that case, the plaintiff makes allegations similar to those in Bahamas, Shahinian, and Edgett, and brings causes of action under federal and state false advertising laws and state unfair competition laws. On March 31, 2017, we moved to dismiss certain of Medline’s claims and to transfer any surviving claims from California to Georgia. On June 2, 2017, the court granted our motion to transfer the case to Georgia and denied without prejudice our motion to dismiss. On June 30, 2017, now before the court in Georgia and with the case re-styled as Medline Industries, Inc. v. Kimberly-Clark Corporation, Halyard Health, Inc., et al., No. 1:17-cv-02032 (N. D. Ga.), Kimberly-Clark and Halyard filed renewed motions to dismiss certain of Medline’s claims. We may have an Indemnification Obligation for this matter under the distribution agreement with Kimberly-Clark and have notified Kimberly-Clark that we reserve our rights to challenge the obligation to indemnify Kimberly-Clark for any damages or penalties which are not indemnifiable under applicable law or public policy. We intend to vigorously defend this matter.
Naeyaert
On April 13, 2017, Kimberly-Clark was served with a complaint in the matter styled Christopher Naeyaert v. Kimberly-Clark Corporation, et al., No. PSC 1603503 (County of Riverside, Superior Court of California), filed on July 21, 2016. In that case, the plaintiff makes allegations similar to those in Bahamas and brings causes of action similar to those in Bahamas, except the allegations and causes of action relate to the Ultra surgical gown. On June 5, 2017, Kimberly-Clark moved to dismiss the complaint. On August 21, 2017, Naeyaert filed an amended complaint and on September 18, 2017, Kimberly-Clark filed a motion to dismiss the amended complaint. We may have an Indemnification Obligation for this matter under the distribution agreement with Kimberly-Clark and have notified Kimberly-Clark that we reserve our rights to challenge the obligation to indemnify Kimberly-Clark for any damages or penalties which are not indemnifiable under applicable law or public policy. We intend to vigorously defend this matter.
Patent Litigation
We operate in an industry characterized by extensive patent litigation and competitors may claim that our products infringe upon their intellectual property. Resolution of patent litigation or other intellectual property claims is typically time consuming and costly and can result in significant damage awards and injunctions that could prevent the manufacture and sale of the affected products or require us to make significant royalty payments in order to continue selling the affected products. At any given time we may be involved as either a plaintiff or a defendant in a number of patent infringement actions, the outcomes of which may not be known for prolonged periods of time.
General
While we maintain general and professional liability, product liability and other insurance, our insurance policies may not cover all of these matters and may not fully cover liabilities arising out of these matters. In addition, we may be obligated to indemnify our directors and officers against these matters.
Although the results of litigation and claims cannot be predicted with certainty, we believe that the ultimate resolution of these matters will not materially impact our liquidity, access to capital markets or ability to conduct our daily operations.
As of December 31, 2017, we have an accrued liability for the matters described herein. The accrued liability is included in “Accrued Expenses” in the accompanying consolidated balance sheet. Our estimate of these liabilities is based on facts and circumstances existing at this time, along with other variables. Factors that may affect our estimate include, but are not limited to: (i) changes in the number of lawsuits filed against us, including the potential for similar, duplicate or “copycat” lawsuits
61 | ||
filed in multiple jurisdictions, including lawsuits that bring causes or action or allege violations of law with regard to additional products; (ii) changes in the legal costs of defending such claims; (iii) changes in the nature of the lawsuits filed against us, (iv) changes in the applicable law governing any legal claims against us; (v) a determination that our assumptions used in estimating the liability are no longer reasonable; and (vi) the uncertainties associated with the judicial process, including adverse judgments rendered by courts or juries. Thus, the actual amount of these liabilities for existing and future claims could be different than the accrued amount. Additionally, the above matters, regardless of the outcome, could disrupt our business and result in substantial costs and diversion of management attention.
Environmental Compliance
We are subject to federal, state and local environmental protection laws and regulations with respect to our business operations and are operating in compliance with, or taking action aimed at ensuring compliance with, these laws and regulations. None of our compliance obligations with environmental protection laws and regulations, individually or in the aggregate, is expected to have a material adverse effect on our business, financial condition, results of operations or liquidity.
Operating Leases
We have entered into operating leases for principal executive offices, located in Alpharetta, Georgia, as well as certain warehouse, manufacturing and distribution facilities. The future minimum obligations under operating leases, including those associated with discontinued operations, having a non-cancelable term in excess of one year are as follows (in millions):
Year | Amount | |||
2018 | $ | 18.0 | ||
2019 | 15.6 | |||
2020 | 11.2 | |||
2021 | 10.0 | |||
2022 | 9.2 | |||
Thereafter | 39.2 | |||
Future minimum obligations | $ | 103.2 | ||
Rental expense under all operating leases, including those associated with discontinued operations, was $24 million, $22 million and $22 million in the years ended December 31, 2017, 2016 and 2015, respectively.
Note 14. Earnings Per Share (“EPS”)
Basic EPS is calculated by dividing net income by the weighted average number of common shares outstanding during each period. Diluted earnings per share is calculated by dividing net income by the number of common shares outstanding and the effect of all dilutive common stock equivalents outstanding during each period, as determined using the treasury stock method. The calculation of basic and diluted EPS for each of the three years ended December 31, 2017, 2016 and 2015 is set forth in the following table (in millions, except per share amounts):
62 | ||
Year Ended December 31, | |||||||||||
2017 | 2016 | 2015 | |||||||||
Net loss from continuing operations | $ | (32.1 | ) | $ | (83.3 | ) | $ | (101.2 | ) | ||
Net income (loss) from discontinued operations | 111.4 | 123.1 | (325.1 | ) | |||||||
Net income (loss) | $ | 79.3 | $ | 39.8 | $ | (426.3 | ) | ||||
Weighted Average Shares Outstanding: | |||||||||||
Basic weighted average shares outstanding | 46.8 | 46.6 | 46.6 | ||||||||
Dilutive effect of stock options and restricted share unit awards | — | — | — | ||||||||
Diluted weighted average shares outstanding | 46.8 | 46.6 | 46.6 | ||||||||
Earnings (Loss) Per Share: | |||||||||||
Basic: | |||||||||||
Continuing Operations | $ | (0.69 | ) | $ | (1.79 | ) | $ | (2.17 | ) | ||
Discontinued Operations | 2.38 | 2.64 | (6.98 | ) | |||||||
Basic Earnings (Loss) Per Share | $ | 1.69 | $ | 0.85 | $ | (9.15 | ) | ||||
Diluted: | |||||||||||
Continuing operations | $ | (0.69 | ) | $ | (1.79 | ) | $ | (2.17 | ) | ||
Discontinued operations | 2.38 | 2.64 | (6.98 | ) | |||||||
Diluted Earnings (Loss) Per Share | $ | 1.69 | $ | 0.85 | $ | (9.15 | ) | ||||
Restricted share units (“RSUs”) contain provisions allowing for the equivalent of any dividends paid on common stock during the restricted period to be reinvested into additional RSUs at the then fair market value of the common stock on the date dividends are paid. Such awards are to be included in the EPS calculation under the two-class method. Currently we do not anticipate any cash dividends for the foreseeable future and our outstanding RSU awards are not material in comparison to our weighted average shares outstanding. Accordingly, all EPS amounts reflect shares as if they were fully vested and the disclosures associated with the two-class method are not presented herein.
For the year ended December 31, 2017, 1 million of potentially dilutive stock options and restricted share unit awards were excluded from the computation of earnings per share as their effect would have been anti-dilutive.
Note 15. Business Segment Information
Our Medical Devices operating segment, which is also our reportable global business segment, was determined in accordance with how our executive managers currently develop and execute global strategies to drive growth and profitability.
The Medical Devices segment provides a portfolio of innovative product offerings focused on pain management and respiratory and digestive health to improve patient outcomes and reduce the cost of care. These products include post-operative pain management solutions, minimally invasive interventional (or chronic) pain therapies, closed airway suction systems and enteral feeding tubes.
63 | ||
Information concerning operations of our business segment is presented in the following table (in millions):
Year Ended December 31, | |||||||||||
2017 | 2016 | 2015 | |||||||||
Net Sales | |||||||||||
Medical Devices | $ | 611.6 | $ | 566.2 | $ | 509.0 | |||||
Corporate and Other | — | — | — | ||||||||
Total Net Sales | 611.6 | 566.2 | 509.0 | ||||||||
Operating Profit (Loss) | |||||||||||
Medical Devices | 155.2 | 123.8 | 107.8 | ||||||||
Corporate and Other(a)(b)(c) | (178.2 | ) | (211.2 | ) | (227.3 | ) | |||||
Other (expense) income, net(d) | (20.1 | ) | (19.7 | ) | (16.2 | ) | |||||
Total Operating Loss | (43.1 | ) | (107.1 | ) | (135.7 | ) | |||||
Interest income | 2.5 | 0.6 | 0.3 | ||||||||
Interest expense | (31.6 | ) | (32.7 | ) | (33.1 | ) | |||||
Loss before Income Taxes | $ | (72.2 | ) | $ | (139.2 | ) | $ | (168.5 | ) | ||
_______________________________________________
(a) | For the year ended December 31, 2017, Corporate and other costs included $116 million, respectively, of costs historically presented as a component of the S&IP business, $55 million of general expenses, $5 million of restructuring costs and $8 million of acquisition-related charges partially offset by a $6 million benefit related to realignment of internal policies for our post-divestiture business. |
(b) | For the year ended December 31, 2016, Corporate and other costs included $114 million of costs historically presented as a component of the S&IP business, $66 million of general expenses, $14 million of post spin-related costs $18 million, respectively, of acquisition-related charges. |
(c) | For the year ended December 31, 2015, Corporate and other costs included $133 million of costs historically presented as a component of the S&IP business, $49 million of general expenses and $46 million of post spin-related expenses. |
(d) | Other expense, net is primarily costs related to litigation and legal matters. |
For the year ended December 31, 2017, 2016 and 2015, products in our surgical pain, interventional pain, digestive health and respiratory health categories each accounted for more than 10% of our consolidated net sales. For the year ended December 31, 2017, 2016 and 2015, net sales to external customers in the United States were $467 million, $410 million and $389 million, respectively.
Depreciation, amortization and capital expenditures are as follows (in millions):
Year Ended December 31, | |||||||||||
2017 | 2016 | 2015 | |||||||||
Depreciation and Amortization | |||||||||||
Medical Devices | $ | 27.4 | $ | 30.4 | $ | 30.8 | |||||
Corporate and Other(a) | 32.1 | 34.8 | 34.6 | ||||||||
Total Depreciation and Amortization | 59.5 | 65.2 | 65.4 | ||||||||
Capital Expenditures | |||||||||||
Medical Devices | $ | 21.9 | $ | 17.7 | $ | 23.2 | |||||
Corporate and Other(b) | 21.3 | 11.4 | 47.2 | ||||||||
Total Capital Expenditures | $ | 43.2 | $ | 29.1 | $ | 70.4 | |||||
_______________________________________________
(a) | Depreciation and Amortization in Corporate and Other includes depreciation of corporate assets and depreciation and amortization of assets associated with discontinued operations (See “Discontinued Operations” in Note 2). |
(b) | Corporate and other capital expenditures includes expenditures for corporate assets and expenditures associated with discontinued operations. |
64 | ||
Information concerning assets by business segment is presented in the following table (in millions):
As of December 31, | |||||||
2017 | 2016 | ||||||
Assets | |||||||
Medical Devices | $ | 1,189.6 | $ | 1,197.2 | |||
Corporate and Other(a) | 1,006.3 | 874.6 | |||||
Total Assets | $ | 2,195.9 | $ | 2,071.8 | |||
_______________________________________________
(a) | Corporate and other assets includes corporate assets, certain current assets and liabilities associated with discontinued operations that we will retain after closing the Divestiture and assets held for sale. |
Note 16. Supplemental Guarantor Financial Information
In October 2014, Halyard Health, Inc. (referred to below as “Parent”) issued the Notes (described in Note 8, “Debt”). The Notes are guaranteed, jointly and severally by each of our domestic subsidiaries that guarantees the Senior Credit Facilities (each, a “Guarantor Subsidiary” and collectively, the “Guarantor Subsidiaries”). The guarantees are full and unconditional, subject to certain customary release provisions as defined in the Indenture dated October 17, 2014. Each Guarantor Subsidiary is directly or indirectly 100%-owned by Halyard Health, Inc. Each of the guarantees of the Notes is a general unsecured obligation of each Guarantor and ranks equally in right of payment with all existing and future indebtedness and all other obligations (except subordinated indebtedness) of each Guarantor.
The following condensed consolidating balance sheets as of December 31, 2017 and 2016 and the condensed consolidating statements of income and cash flows for the years ended December 31, 2017, 2016 and 2015 provide condensed consolidating financial information for Halyard Health, Inc. (“Parent”), the Guarantor Subsidiaries on a combined basis, the Non-Guarantor Subsidiaries on a combined basis and the Parent and its subsidiaries on a consolidating basis.
The Parent and the Guarantor Subsidiaries use the equity method of accounting to reflect ownership interests in subsidiaries which are eliminated upon consolidation. Eliminating entries in the following condensed consolidating financial information represent adjustments to (i) eliminate intercompany transactions between or among the Parent, the Guarantor Subsidiaries and the Non-Guarantor Subsidiaries and (ii) eliminate the investments in subsidiaries.
65 | ||
HALYARD HEALTH, INC. AND SUBSIDIARIES
CONDENSED CONSOLIDATING INCOME AND COMPREHENSIVE INCOME STATEMENTS
(in millions)
Year Ended December 31, 2017 | |||||||||||||||||||
Parent | Guarantor Subsidiaries | Non-Guarantor Subsidiaries | Eliminations | Consolidated | |||||||||||||||
Net Sales | $ | — | $ | 679.2 | $ | 306.9 | $ | (374.5 | ) | $ | 611.6 | ||||||||
Cost of products sold | — | 385.7 | 263.5 | (374.5 | ) | 274.7 | |||||||||||||
Gross Profit | — | 293.5 | 43.4 | — | 336.9 | ||||||||||||||
Research and development expenses | — | 38.2 | — | — | 38.2 | ||||||||||||||
Selling and general expenses | 29.9 | 249.7 | 42.1 | — | 321.7 | ||||||||||||||
Other expense (income), net | 0.7 | 34.5 | (15.1 | ) | — | 20.1 | |||||||||||||
Operating (Loss) Profit | (30.6 | ) | (28.9 | ) | 16.4 | — | (43.1 | ) | |||||||||||
Interest income | 0.9 | 0.1 | 4.5 | (3.0 | ) | 2.5 | |||||||||||||
Interest expense | (32.3 | ) | (2.2 | ) | (0.1 | ) | 3.0 | (31.6 | ) | ||||||||||
(Loss) Income Before Income Taxes | (62.0 | ) | (31.0 | ) | 20.8 | — | (72.2 | ) | |||||||||||
Income tax benefit (provision) | 20.0 | 23.2 | (3.1 | ) | — | 40.1 | |||||||||||||
Equity in earnings of consolidated subsidiaries | 125.1 | 32.6 | — | (157.7 | ) | — | |||||||||||||
Net Income (Loss) from Continuing Operations | 83.1 | 24.8 | 17.7 | (157.7 | ) | (32.1 | ) | ||||||||||||
(Loss) Income on discontinued operations, net of tax | (3.8 | ) | 86.0 | 29.2 | — | 111.4 | |||||||||||||
Net Income (Loss) | 79.3 | 110.8 | 46.9 | (157.7 | ) | 79.3 | |||||||||||||
Total other comprehensive income (loss), net of tax | 18.8 | 13.1 | 18.3 | (31.4 | ) | 18.8 | |||||||||||||
Comprehensive Income (Loss) | $ | 98.1 | $ | 123.9 | $ | 65.2 | $ | (189.1 | ) | $ | 98.1 | ||||||||
66 | ||
HALYARD HEALTH, INC. AND SUBSIDIARIES
CONDENSED CONSOLIDATING INCOME AND COMPREHENSIVE INCOME STATEMENTS
(in millions)
Year Ended December 31, 2016 | |||||||||||||||||||
Parent | Guarantor Subsidiaries | Non-Guarantor Subsidiaries | Eliminations | Consolidated | |||||||||||||||
Net Sales | $ | — | $ | 625.4 | $ | 250.0 | $ | (309.2 | ) | $ | 566.2 | ||||||||
Cost of products sold | — | 356.7 | 221.5 | (309.2 | ) | 269.0 | |||||||||||||
Gross Profit | — | 268.7 | 28.5 | — | 297.2 | ||||||||||||||
Research and development expenses | — | 38.0 | 0.4 | — | 38.4 | ||||||||||||||
Selling and general expenses | 37.2 | 274.2 | 34.8 | — | 346.2 | ||||||||||||||
Other (income) expense, net | (0.8 | ) | 36.4 | (17.5 | ) | 1.6 | 19.7 | ||||||||||||
Operating (Loss) Profit | (36.4 | ) | (79.9 | ) | 10.8 | (1.6 | ) | (107.1 | ) | ||||||||||
Interest income | 0.3 | 0.1 | 2.5 | (2.3 | ) | 0.6 | |||||||||||||
Interest expense | (33.1 | ) | (1.7 | ) | (0.2 | ) | 2.3 | (32.7 | ) | ||||||||||
(Loss) Income Before Income Taxes | (69.2 | ) | (81.5 | ) | 13.1 | (1.6 | ) | (139.2 | ) | ||||||||||
Income tax benefit (provision) | 25.5 | 33.9 | (3.5 | ) | — | 55.9 | |||||||||||||
Equity in earnings of consolidated subsidiaries | 85.3 | 22.3 | — | (107.6 | ) | — | |||||||||||||
Income (Loss) from Continued Operations | 41.6 | (25.3 | ) | 9.6 | (109.2 | ) | (83.3 | ) | |||||||||||
(Loss) Income from discontinued operations, net of tax | (1.8 | ) | 108.6 | 16.3 | — | 123.1 | |||||||||||||
Net Income (Loss) | 39.8 | 83.3 | 25.9 | (109.2 | ) | 39.8 | |||||||||||||
Total other comprehensive loss, net of tax | (6.9 | ) | (6.3 | ) | (7.2 | ) | 13.5 | (6.9 | ) | ||||||||||
Comprehensive Income | $ | 32.9 | $ | 77.0 | $ | 18.7 | $ | (95.7 | ) | $ | 32.9 | ||||||||
67 | ||
HALYARD HEALTH, INC. AND SUBSIDIARIES
CONDENSED COMBINED CONSOLIDATING INCOME AND COMPREHENSIVE INCOME STATEMENTS
(in millions)
Year Ended December 31, 2015 | |||||||||||||||||||
Parent | Guarantor Subsidiaries | Non-Guarantor Subsidiaries | Eliminations | Consolidated | |||||||||||||||
Net Sales | $ | — | $ | 591.2 | $ | 266.4 | $ | (348.6 | ) | $ | 509.0 | ||||||||
Cost of products sold | — | 338.8 | 261.0 | (348.6 | ) | 251.2 | |||||||||||||
Gross Profit | — | 252.4 | 5.4 | — | 257.8 | ||||||||||||||
Research and development expenses | — | 27.6 | — | — | 27.6 | ||||||||||||||
Selling and general expenses | 30.6 | 274.4 | 44.7 | — | 349.7 | ||||||||||||||
Other (income) expense, net | (0.8 | ) | 26.9 | (9.9 | ) | — | 16.2 | ||||||||||||
Operating Loss | (29.8 | ) | (76.5 | ) | (29.4 | ) | — | (135.7 | ) | ||||||||||
Interest income | 0.3 | — | 3.1 | (3.1 | ) | 0.3 | |||||||||||||
Interest expense | (33.8 | ) | (2.1 | ) | (0.3 | ) | 3.1 | (33.1 | ) | ||||||||||
Loss Before Income Taxes | (63.3 | ) | (78.6 | ) | (26.6 | ) | — | (168.5 | ) | ||||||||||
Income tax benefit (provision) | 24.3 | 44.7 | (1.7 | ) | — | 67.3 | |||||||||||||
Equity in (loss) earnings of consolidated subsidiaries | (389.5 | ) | 22.4 | — | 367.1 | — | |||||||||||||
(Loss) Income from Continued Operations | (428.5 | ) | (11.5 | ) | (28.3 | ) | 367.1 | (101.2 | ) | ||||||||||
Income (Loss) from discontinued operations, net of tax | 2.2 | (366.4 | ) | 39.1 | — | (325.1 | ) | ||||||||||||
Net (Loss) Income | (426.3 | ) | (377.9 | ) | 10.8 | 367.1 | (426.3 | ) | |||||||||||
Total other comprehensive loss, net of tax | — | (0.1 | ) | (24.0 | ) | — | (24.1 | ) | |||||||||||
Comprehensive (Loss) Income | $ | (426.3 | ) | $ | (378.0 | ) | $ | (13.2 | ) | $ | 367.1 | $ | (450.4 | ) | |||||
68 | ||
HALYARD HEALTH, INC. AND SUBSIDIARIES
CONDENSED CONSOLIDATING BALANCE SHEETS
(in millions)
As of December 31, 2017 | |||||||||||||||||||
Parent | Guarantor Subsidiaries | Non-Guarantor Subsidiaries | Eliminations | Consolidated | |||||||||||||||
ASSETS | |||||||||||||||||||
Current Assets | |||||||||||||||||||
Cash and cash equivalents | $ | 114.5 | $ | 16.0 | $ | 89.2 | $ | — | $ | 219.7 | |||||||||
Accounts receivable, net | 1.1 | 623.0 | 266.3 | (687.4 | ) | 203.0 | |||||||||||||
Inventories | — | 76.0 | 15.1 | — | 91.1 | ||||||||||||||
Prepaid and other current assets | 0.6 | 11.7 | 2.1 | — | 14.4 | ||||||||||||||
Assets held for sale | 0.3 | 546.7 | 85.5 | — | 632.5 | ||||||||||||||
Total Current Assets | 116.5 | 1,273.4 | 458.2 | (687.4 | ) | 1,160.7 | |||||||||||||
Property, Plant and Equipment, Net | — | 92.9 | 17.0 | — | 109.9 | ||||||||||||||
Investment in Consolidated Subsidiaries | 2,154.3 | 403.2 | — | (2,557.5 | ) | — | |||||||||||||
Goodwill | — | 738.1 | 26.6 | — | 764.7 | ||||||||||||||
Other Intangible Assets, net | — | 139.5 | 9.4 | — | 148.9 | ||||||||||||||
Other Assets | 0.3 | 6.0 | 5.4 | — | 11.7 | ||||||||||||||
TOTAL ASSETS | $ | 2,271.1 | $ | 2,653.1 | $ | 516.6 | $ | (3,244.9 | ) | $ | 2,195.9 | ||||||||
LIABILITIES AND EQUITY | |||||||||||||||||||
Current Liabilities | |||||||||||||||||||
Current portion of long-term debt | $ | 39.8 | $ | — | $ | — | $ | — | $ | 39.8 | |||||||||
Trade accounts payable | 454.0 | 347.0 | 49.8 | (679.6 | ) | 171.2 | |||||||||||||
Accrued expenses | 11.6 | 113.9 | 27.4 | (8.0 | ) | 144.9 | |||||||||||||
Liabilities held for sale | — | 7.8 | 26.1 | — | 33.9 | ||||||||||||||
Total Current Liabilities | 505.4 | 468.7 | 103.3 | (687.6 | ) | 389.8 | |||||||||||||
Long-Term Debt | 541.1 | — | — | — | 541.1 | ||||||||||||||
Other Long-Term Liabilities | 9.2 | 36.1 | 4.3 | — | 49.6 | ||||||||||||||
Total Liabilities | 1,055.7 | 504.8 | 107.6 | (687.6 | ) | 980.5 | |||||||||||||
Total Equity | 1,215.4 | 2,148.3 | 409.0 | (2,557.3 | ) | 1,215.4 | |||||||||||||
TOTAL LIABILITIES AND EQUITY | $ | 2,271.1 | $ | 2,653.1 | $ | 516.6 | $ | (3,244.9 | ) | $ | 2,195.9 | ||||||||
69 | ||
HALYARD HEALTH, INC. AND SUBSIDIARIES
CONDENSED CONSOLIDATING BALANCE SHEETS
(in millions)
As of December 31, 2016 | |||||||||||||||||||
Parent | Guarantor Subsidiaries | Non-Guarantor Subsidiaries | Eliminations | Consolidated | |||||||||||||||
ASSETS | |||||||||||||||||||
Current Assets | |||||||||||||||||||
Cash and cash equivalents | $ | 54.2 | $ | 9.5 | $ | 50.0 | $ | — | $ | 113.7 | |||||||||
Accounts receivable, net | 3.1 | 552.5 | 239.9 | (607.0 | ) | 188.5 | |||||||||||||
Inventories | — | 69.2 | 11.5 | — | 80.7 | ||||||||||||||
Prepaid and other current assets | 5.0 | 10.1 | 1.8 | (0.3 | ) | 16.6 | |||||||||||||
Assets held for sale | — | 162.3 | 31.7 | — | 194.0 | ||||||||||||||
Total Current Assets | 62.3 | 803.6 | 334.9 | (607.3 | ) | 593.5 | |||||||||||||
Property, Plant and Equipment, Net | — | 96.7 | 12.6 | — | 109.3 | ||||||||||||||
Investment in Consolidated Subsidiaries | 2,029.5 | 328.7 | — | (2,358.2 | ) | — | |||||||||||||
Goodwill | — | 736.1 | 26.2 | — | 762.3 | ||||||||||||||
Other Intangible Assets, net | — | 159.5 | 8.7 | — | 168.2 | ||||||||||||||
Other Assets | 0.7 | 7.7 | 3.2 | — | 11.6 | ||||||||||||||
Assets Held for Sale | 0.3 | 380.0 | 46.6 | — | 426.9 | ||||||||||||||
TOTAL ASSETS | $ | 2,092.8 | $ | 2,512.3 | $ | 432.2 | $ | (2,965.5 | ) | $ | 2,071.8 | ||||||||
LIABILITIES AND EQUITY | |||||||||||||||||||
Current Liabilities | |||||||||||||||||||
Trade accounts payable | $ | 398.3 | $ | 325.9 | $ | 38.3 | $ | (601.9 | ) | $ | 160.6 | ||||||||
Accrued expenses | 11.1 | 108.5 | 24.2 | (5.4 | ) | 138.4 | |||||||||||||
Liabilities held for sale | — | 8.3 | 17.1 | — | 25.4 | ||||||||||||||
Total Current Liabilities | 409.4 | 442.7 | 79.6 | (607.3 | ) | 324.4 | |||||||||||||
Long-Term Debt | 579.0 | — | — | — | 579.0 | ||||||||||||||
Other Long-Term Liabilities | 1.9 | 52.9 | 4.4 | — | 59.2 | ||||||||||||||
Liabilities Held for Sale | — | 1.5 | 5.2 | — | 6.7 | ||||||||||||||
Total Liabilities | 990.3 | 497.1 | 89.2 | (607.3 | ) | 969.3 | |||||||||||||
Total Equity | 1,102.5 | 2,015.2 | 343.0 | (2,358.2 | ) | 1,102.5 | |||||||||||||
TOTAL LIABILITIES AND EQUITY | $ | 2,092.8 | $ | 2,512.3 | $ | 432.2 | $ | (2,965.5 | ) | $ | 2,071.8 | ||||||||
70 | ||
HALYARD HEALTH, INC. AND SUBSIDIARIES
CONDENSED CONSOLIDATING STATEMENTS OF CASH FLOWS
(in millions)
Year Ended December 31, 2017 | |||||||||||||||||||
Parent | Guarantor Subsidiaries | Non-Guarantor Subsidiaries | Eliminations | Consolidated | |||||||||||||||
Operating Activities | |||||||||||||||||||
Cash (Used in) Provided by Operating Activities | $ | (43.3 | ) | $ | 137.2 | $ | 50.3 | $ | — | $ | 144.2 | ||||||||
Investing Activities | |||||||||||||||||||
Capital expenditures | — | (32.4 | ) | (10.8 | ) | — | (43.2 | ) | |||||||||||
Proceeds from dispositions of property | — | 0.1 | — | — | 0.1 | ||||||||||||||
Intercompany contributions | — | (98.8 | ) | — | 98.8 | — | |||||||||||||
Cash (Used in) Provided by Investing Activities | — | (131.1 | ) | (10.8 | ) | 98.8 | (43.1 | ) | |||||||||||
Financing Activities | |||||||||||||||||||
Intercompany contributions | 101.4 | — | (2.6 | ) | (98.8 | ) | — | ||||||||||||
Purchase of treasury stock | (2.5 | ) | — | — | — | (2.5 | ) | ||||||||||||
Proceeds and excess tax benefits from the exercise of stock options | 4.7 | — | — | — | 4.7 | ||||||||||||||
Cash Provided by (Used in) Financing Activities | 103.6 | — | (2.6 | ) | (98.8 | ) | 2.2 | ||||||||||||
Effect of Exchange Rate on Cash and Cash Equivalents | — | 0.4 | 2.3 | — | 2.7 | ||||||||||||||
Increase in Cash and Cash Equivalents | 60.3 | 6.5 | 39.2 | — | 106.0 | ||||||||||||||
Cash and Cash Equivalents, Beginning of Period | 54.2 | 9.5 | 50.0 | — | 113.7 | ||||||||||||||
Cash and Cash Equivalents, End of Period | $ | 114.5 | $ | 16.0 | $ | 89.2 | $ | — | $ | 219.7 | |||||||||
71 | ||
HALYARD HEALTH, INC. AND SUBSIDIARIES
CONDENSED CONSOLIDATING STATEMENTS OF CASH FLOWS
(in millions)
Year Ended December 31, 2016 | |||||||||||||||||||
Parent | Guarantor Subsidiaries | Non-Guarantor Subsidiaries | Eliminations | Consolidated | |||||||||||||||
Operating Activities | |||||||||||||||||||
Cash (Used in) Provided by Operating Activities | $ | (33.0 | ) | $ | 207.7 | $ | 15.8 | $ | (1.7 | ) | $ | 188.8 | |||||||
Investing Activities | |||||||||||||||||||
Capital expenditures | — | (22.7 | ) | (6.4 | ) | — | (29.1 | ) | |||||||||||
Acquisition of business, net of cash acquired | (175.0 | ) | — | — | — | (175.0 | ) | ||||||||||||
Proceeds from property dispositions | — | 3.2 | — | — | 3.2 | ||||||||||||||
Intercompany contributions | 0.5 | (177.9 | ) | 2.7 | 174.7 | — | |||||||||||||
Cash (Used in) Provided by Investing Activities | (174.5 | ) | (197.4 | ) | (3.7 | ) | 174.7 | (200.9 | ) | ||||||||||
Financing Activities | |||||||||||||||||||
Intercompany contributions | 170.8 | — | (0.3 | ) | (170.5 | ) | — | ||||||||||||
Line of credit facility proceeds | 72.0 | — | — | — | 72.0 | ||||||||||||||
Line of credit facility repayments | (72.0 | ) | — | — | — | (72.0 | ) | ||||||||||||
Debt issuance costs | (0.9 | ) | — | — | — | (0.9 | ) | ||||||||||||
Purchase of treasury stock | (0.9 | ) | — | — | — | (0.9 | ) | ||||||||||||
Proceeds and excess tax benefits from the exercise of stock options | 0.4 | — | — | — | 0.4 | ||||||||||||||
Cash Provided by (Used in) Financing Activities | 169.4 | — | (0.3 | ) | (170.5 | ) | (1.4 | ) | |||||||||||
Effect of Exchange Rate on Cash and Cash Equivalents | — | (0.8 | ) | (1.5 | ) | — | (2.3 | ) | |||||||||||
(Decrease) Increase in Cash and Cash Equivalents | (38.1 | ) | 9.5 | 10.3 | 2.5 | (15.8 | ) | ||||||||||||
Cash and Cash Equivalents, Beginning of Period | 92.3 | — | 39.7 | (2.5 | ) | 129.5 | |||||||||||||
Cash and Cash Equivalents, End of Period | $ | 54.2 | $ | 9.5 | $ | 50.0 | $ | — | $ | 113.7 | |||||||||
72 | ||
HALYARD HEALTH, INC. AND SUBSIDIARIES
CONDENSED COMBINED CONSOLIDATING STATEMENTS OF CASH FLOWS
(in millions)
Year Ended December 31, 2015 | |||||||||||||||||||
Parent | Guarantor Subsidiaries | Non-Guarantor Subsidiaries | Eliminations | Consolidated | |||||||||||||||
Operating Activities | |||||||||||||||||||
Cash (Used in) Provided by Operating Activities | $ | (44.7 | ) | $ | 110.5 | $ | 34.3 | $ | (2.5 | ) | $ | 97.6 | |||||||
Investing Activities | |||||||||||||||||||
Capital expenditures | — | (61.3 | ) | (9.1 | ) | — | (70.4 | ) | |||||||||||
Proceeds from property dispositions | — | — | 7.8 | — | 7.8 | ||||||||||||||
Intercompany contributions | 39.9 | (53.1 | ) | 1.3 | 11.9 | — | |||||||||||||
Cash Provided by (Used in) Investing Activities | 39.9 | (114.4 | ) | — | 11.9 | (62.6 | ) | ||||||||||||
Financing Activities | |||||||||||||||||||
Intercompany contributions | 46.5 | — | (34.6 | ) | (11.9 | ) | — | ||||||||||||
Debt repayments | (51.0 | ) | — | — | — | (51.0 | ) | ||||||||||||
Purchase of treasury stock | (1.0 | ) | — | — | — | (1.0 | ) | ||||||||||||
Proceeds and excess tax benefits from the exercise of stock options | 1.4 | — | — | — | 1.4 | ||||||||||||||
Cash Used in Financing Activities | (4.1 | ) | — | (34.6 | ) | (11.9 | ) | (50.6 | ) | ||||||||||
Effect of Exchange Rate on Cash and Cash Equivalents | — | — | (3.9 | ) | — | (3.9 | ) | ||||||||||||
Decrease in Cash and Cash Equivalents | (8.9 | ) | (3.9 | ) | (4.2 | ) | (2.5 | ) | (19.5 | ) | |||||||||
Cash and Cash Equivalents, Beginning of Period | 101.2 | 3.9 | 43.9 | — | 149.0 | ||||||||||||||
Cash and Cash Equivalents, End of Period | $ | 92.3 | $ | — | $ | 39.7 | $ | (2.5 | ) | $ | 129.5 | ||||||||
73 | ||
REPORT OF INDEPENDENT REGISTERED PUBLIC ACCOUNTING FIRM
To the Board of Directors and Stockholders of
Halyard Health, Inc.
Opinion on the Financial Statements
We have audited the accompanying consolidated balance sheets of Halyard Health, Inc. and subsidiaries (the "Company") as of December 31, 2017 and 2016, the related consolidated statements of income, comprehensive income (loss), stockholders' equity, and cash flows, for each of the three years in the period ended December 31, 2017, and the related notes (collectively referred to as the “financial statements”). In our opinion, the financial statements present fairly, in all material respects, the financial position of the Company as of December 31, 2017 and 2016, and the results of its operations and its cash flows for each of the three years in the period ended December 31, 2017, in conformity with accounting principles generally accepted in the United States of America.
We have also audited, in accordance with the standards of the Public Company Accounting Oversight Board (United States) (PCAOB), the Company’s internal control over financial reporting as of December 31, 2017, based on criteria established in Internal Control - Integrated Framework (2013) issued by the Committee of Sponsoring Organizations of the Treadway Commission and our report dated February 27, 2018, expressed an unqualified opinion on the Company's internal control over financial reporting.
Basis for Opinion
These financial statements are the responsibility of the Company's management. Our responsibility is to express an opinion on the Company's financial statements based on our audits. We are a public accounting firm registered with the PCAOB and are required to be independent with respect to the Company in accordance with the U.S. federal securities laws and the applicable rules and regulations of the Securities and Exchange Commission and the PCAOB.
We conducted our audits in accordance with the standards of the PCAOB. Those standards require that we plan and perform the audit to obtain reasonable assurance about whether the financial statements are free of material misstatement, whether due to error or fraud. Our audits included performing procedures to assess the risks of material misstatement of the financial statements, whether due to error or fraud, and performing procedures that respond to those risks. Such procedures included examining, on a test basis, evidence regarding the amounts and disclosures in the financial statements. Our audits also included evaluating the accounting principles used and significant estimates made by management, as well as evaluating the overall presentation of the financial statements. We believe that our audits provide a reasonable basis for our opinion.
/s/ DELOITTE & TOUCHE LLP |
Deloitte & Touche LLP |
Atlanta, Georgia |
February 27, 2018 |
We have served as the Company's auditor since 2013.
74 | ||
ITEM 9. | CHANGES IN AND DISAGREEMENTS WITH ACCOUNTANTS ON ACCOUNTING AND FINANCIAL DISCLOSURE |
None.
ITEM 9A. | CONTROLS AND PROCEDURES |
Disclosure Controls and Procedures
Our management, with the participation of our Chief Executive Officer and Chief Financial Officer, evaluated the effectiveness of our disclosure controls and procedures as of December 31, 2017. The term "disclosure controls and procedures," as defined in Rule 13a-15 under the Securities Exchange Act of 1934, as amended (or the “Exchange Act”), means controls and other procedures of a company that are designed to ensure that information required to be disclosed by a company in the reports that it files or submits under the Exchange Act is recorded, processed, summarized and reported, within the time periods specified in the SEC’s rules and forms. Disclosure controls and procedures include, without limitation, controls and procedures designed to ensure that information required to be disclosed by a company in the reports that it files or submits under the Exchange Act is accumulated and communicated to management, including our principal executive and principal financial officers, as appropriate to allow timely decisions regarding required disclosure.
Based on our evaluation, our chief executive officer and chief financial officer believe that, as of December 31, 2017, our disclosure controls and procedures were effective.
Management’s Annual Report on Internal Control Over Financial Reporting
Our management is responsible for establishing and maintaining adequate internal control over financial reporting as defined in Rule 13a-15(f) under the Securities Exchange Act of 1934. A company’s internal control over financial reporting is a process designed to provide reasonable assurance regarding the reliability of financial reporting and the preparation of financial statements for external purposes in accordance with generally accepted accounting principles. A company’s internal control over financial reporting includes those policies and procedures that (1) pertain to the maintenance of records that, in reasonable detail, accurately and fairly reflect the transactions and dispositions of the assets of the company; (2) provide reasonable assurance that transactions are recorded as necessary to permit preparation of financial statements in accordance with generally accepted accounting principles, and that receipts and expenditures of the company are being made only in accordance with authorizations of management and directors of the company; and (3) provide reasonable assurance regarding prevention or timely detection of unauthorized acquisition, use, or disposition of the company’s assets that could have a material effect on the financial statements.
Because of its inherent limitations, internal control over financial reporting may not prevent or detect misstatements. Also, projections of any evaluation of effectiveness to future periods are subject to the risk that controls may become inadequate because of changes in conditions, or that the degree of compliance with the policies or procedures may deteriorate.
Under the supervision and with the participation of our management, including our principal executive officer and principal financial officer, we conducted an evaluation of the effectiveness of our internal control over financial reporting as of December 31, 2017 based on the criteria related to internal control over financial reporting described in Internal Control - Integrated Framework (2013) issued by the Committee of Sponsoring Organizations of the Treadway Commission. Based on our evaluation, management concluded that our internal control over financial reporting was effective as of December 31, 2017.
Deloitte & Touche LLP, the independent registered public accounting firm that audited the consolidated financial statements included in this Form 10-K, has issued a report, included herein, on the effectiveness of the Company's internal control over financial reporting as of December 31, 2017.
Changes in Internal Control Over Financial Reporting
There have been no changes in our internal control over financial reporting that occurred during our fourth fiscal quarter that have materially affected, or are reasonably likely to materially affect, our internal control over financial reporting.
75 | ||
REPORT OF INDEPENDENT REGISTERED PUBLIC ACCOUNTING FIRM
To the Board of Directors and Stockholders of
Halyard Health, Inc.
Opinion on Internal Control over Financial Reporting
We have audited the internal control over financial reporting of Halyard Health, Inc. and subsidiaries (the “Company”) as of December 31, 2017, based on criteria established in Internal Control - Integrated Framework (2013) issued by the Committee of Sponsoring Organizations of the Treadway Commission (COSO). In our opinion, the Company maintained, in all material respects, effective internal control over financial reporting as of December 31, 2017, based on criteria established in Internal Control - Integrated Framework (2013) issued by COSO.
We have also audited, in accordance with the standards of the Public Company Accounting Oversight Board (United States) (PCAOB), the consolidated financial statements as of and for the year ended December 31, 2017, of the Company and our report dated February 27, 2018, expressed an unqualified opinion on those consolidated financial statements.
Basis for Opinion
The Company’s management is responsible for maintaining effective internal control over financial reporting and for its assessment of the effectiveness of internal control over financial reporting, included in the accompanying Management's Annual Report on Internal Control over Financial Reporting. Our responsibility is to express an opinion on the Company’s internal control over financial reporting based on our audit. We are a public accounting firm registered with the PCAOB and are required to be independent with respect to the Company in accordance with the U.S. federal securities laws and the applicable rules and regulations of the Securities and Exchange Commission and the PCAOB.
We conducted our audit in accordance with the standards of the PCAOB. Those standards require that we plan and perform the audit to obtain reasonable assurance about whether effective internal control over financial reporting was maintained in all material respects. Our audit included obtaining an understanding of internal control over financial reporting, assessing the risk that a material weakness exists, testing and evaluating the design and operating effectiveness of internal control based on the assessed risk, and performing such other procedures as we considered necessary in the circumstances. We believe that our audit provides a reasonable basis for our opinion.
Definition and Limitations of Internal Control over Financial Reporting
A company’s internal control over financial reporting is a process designed to provide reasonable assurance regarding the reliability of financial reporting and the preparation of financial statements for external purposes in accordance with generally accepted accounting principles. A company’s internal control over financial reporting includes those policies and procedures that (1) pertain to the maintenance of records that, in reasonable detail, accurately and fairly reflect the transactions and dispositions of the assets of the company; (2) provide reasonable assurance that transactions are recorded as necessary to permit preparation of financial statements in accordance with generally accepted accounting principles, and that receipts and expenditures of the company are being made only in accordance with authorizations of management and directors of the company; and (3) provide reasonable assurance regarding prevention or timely detection of unauthorized acquisition, use, or disposition of the company’s assets that could have a material effect on the financial statements.
Because of its inherent limitations, internal control over financial reporting may not prevent or detect misstatements. Also, projections of any evaluation of effectiveness to future periods are subject to the risk that controls may become inadequate because of changes in conditions, or that the degree of compliance with the policies or procedures may deteriorate.
/s/ DELOITTE & TOUCHE LLP |
Deloitte & Touche LLP |
Atlanta, Georgia |
February 27, 2018 |
76 | ||
ITEM 9B. OTHER INFORMATION
None.
PART III
ITEM 10. DIRECTORS, EXECUTIVE OFFICERS AND CORPORATE GOVERNANCE
The following sections of our 2018 Proxy Statement for the Annual Meeting of Stockholders (the “2018 Proxy Statement”) are incorporated in this Item 10 by reference:
• | “The Nominees” and “Directors Continuing in Office” under “Proposal 1. Election of Directors,” which identifies our directors and nominees for our Board of Directors. |
• | “Other Information—Section 16(a) Beneficial Ownership Reporting Compliance.” |
• | “Corporate Governance—Other Corporate Governance Policies and Practices–Code of Conduct,” which describes our Code of Conduct. |
• | “Other Information—Stockholder Nominations for Board of Directors,” which describes the procedures by which stockholders may nominate candidates for election to our Board of Directors. |
• | “Corporate Governance—Board Committees–Audit Committee,” which identifies members of the Audit Committee of our Board of Directors and an audit committee financial expert. |
Information regarding our executive officers is reported under the caption “Executive Officers of the Registrant” in Part I of this Report.
We believe we are in compliance with all applicable corporate governance requirements of the New York Stock Exchange, the Securities and Exchange Commission, the Sarbanes-Oxley Act of 2002 and the provisions of the Dodd-Frank Wall Street Reform and Consumer Protection Act of 2010 that have become effective as of the date of this Annual Report on Form 10-K.
ITEM 11. EXECUTIVE COMPENSATION
The information in the sections of the 2018 Proxy Statement captioned “Compensation Discussion and Analysis,” “Compensation Tables,” “Director Compensation” and “Corporate Governance—Compensation Committee Interlocks and Insider Participation” is incorporated in this Item 11 by reference.
ITEM 12. | SECURITY OWNERSHIP OF CERTAIN BENEFICIAL OWNERS AND MANAGEMENT AND RELATED STOCKHOLDER MATTERS |
The information in the section of the 2018 Proxy Statement captioned “Other Information—Security Ownership Information” is incorporated in this Item 12 by reference.
Equity Compensation Plan Information
The following table gives information about our common stock that may be issued upon the exercise of options, warrants and rights under all of our equity compensation plans as of December 31, 2017.
Number of securities to be issued upon exercise of outstanding options, warrants, and rights (in thousands) (a) | Weighted average exercise price of outstanding options, warrants, and rights (b) | Number of securities remaining available for future issuance under equity compensation plans (excluding securities reflected in column (a)) (in thousands) (c) | |||
Equity compensation plans approved by stockholders(1) | 2,497(2) | $37.20 | 1,902 | ||
(1) | Includes (a) the Halyard Health, Inc. Equity Participation Plan (the “Employee Plan”), effective November 1, 2014 and (b) the Halyard Health, Inc. Outside Directors’ Compensation Plan, effective November 1, 2014 (the “Director Plan”). |
(2) | Includes 736 restricted share units granted under the Employee Plan (including shares that may be issued pursuant to outstanding performance-based restricted share units, assuming the target award is met; actual shares issued may vary, depending on actual performance). Upon vesting, a share of |
77 | ||
Halyard common stock is issued for each restricted share unit. Column (a) also includes 91 restricted share units granted under the Director Plan. Under the Director Plan, upon retirement from, or any other termination of service from the Board, a share of Halyard common stock is issued for each restricted share unit. Column (b) does not take these awards into account because they do not have an exercise price.
Halyard Health, Inc. Outside Directors’ Compensation Plan
In 2014, our Board of Directors and our stockholders approved the Director Plan. A maximum of 400,000 shares of our common stock is available for grant under this plan. The Board may grant awards in the form of stock options, stock appreciation rights, restricted stock, restricted share units or any combination of cash, stock options, stock appreciation rights, restricted stock or restricted share units under this plan.
ITEM 13. CERTAIN RELATIONSHIPS AND RELATED TRANSACTIONS, AND DIRECTOR INDEPENDENCE
The information in the sections of the 2018 Proxy Statement captioned “Other Information—Transactions with Related Persons” and “Corporate Governance—Director Independence” is incorporated in this Item 13 by reference.
ITEM 14. PRINCIPAL ACCOUNTING FEES AND SERVICES
The information in the sections of the 2018 Proxy Statement captioned “Principal Accounting Firm Fees” and “Audit Committee Approval of Audit and Non-Audit Services” under “Proposal 2. Ratification of Auditors” is incorporated in this Item 14 by reference.
78 | ||
PART IV
ITEM 15. EXHIBITS, FINANCIAL STATEMENT SCHEDULES
(a) | Documents filed as part of this report. |
1. | Financial statements. |
The financial statements are set forth under Item 8 of this report on Form 10-K.
2. | Financial statement schedules. |
The following information is filed as part of this Form 10-K and should be read in conjunction with the financial statements contained in Item 8:
•Report of Independent Registered Public Accounting Firm
All other schedules have been omitted because they were not applicable or because the required information has been included in the financial statements or notes thereto.
3. | Exhibits |
Exhibit Number | Description | |
101.INS | XBRL Instance Document | |
101.SCH | XBRL Taxonomy Extension Schema Document | |
101.CAL | XBRL Taxonomy Extension Calculation Linkbase Document | |
101.DEF | XBRL Taxonomy Extension Definition Linkbase Document | |
101.LAB | XBRL Taxonomy Extension Label Linkbase Document | |
101.PRE | XBRL Taxonomy Extension Presentation Linkbase Document | |
79 | ||
SIGNATURES
Pursuant to the requirements of Section 13 or 15(d) of the Securities Exchange Act of 1934, the registrant has duly caused this report to be signed on its behalf by the undersigned, thereunto duly authorized.
HALYARD HEALTH, INC. | ||
February 27, 2018 | By: | /s/ Steven E. Voskuil |
Steven E. Voskuil | ||
Senior Vice President and | ||
Chief Financial Officer | ||
Pursuant to the requirements of the Securities Exchange Act of 1934, this report has been signed below by the following persons on behalf of the registrant and in the capacities and on the dates indicated.
/s/ Joseph F. Woody | Chief Executive Officer and Director (principal executive officer) | February 27, 2018 | |
Joseph F. Woody | |||
/s/ Steven E. Voskuil | Senior Vice President and Chief Financial Officer (principal financial officer) | February 27, 2018 | |
Steven E. Voskuil | |||
/s/ Renato Negro | Vice President and Controller (principal accounting officer) | February 27, 2018 | |
Renato Negro | |||
Directors
Gary D. Blackford |
John P. Byrnes |
Ronald W. Dollens |
Heidi Kunz |
William A. Hawkins III |
Patrick J. O’Leary |
Maria Sainz |
Dr. Julie Shimer |
By: | /s/ S. Ross Mansbach | February 27, 2018 | |
S. Ross Mansbach Attorney-in-Fact | |||
80 | ||