Attached files
| file | filename |
|---|---|
| EX-32.2 - EXHIBIT 32.2 CFO SOX - AdvanSix Inc. | a10k2018exhibit322_preston.htm |
| EX-32.1 - EXHIBIT 32.1 CEO SOX - AdvanSix Inc. | a10k2018exhibit321_kane.htm |
| EX-31.2 - EXHIBIT 31.2 CFO CERT - AdvanSix Inc. | a10k2018exhibit312_preston.htm |
| EX-31.1 - EXHIBIT 31.1 CEO CERT - AdvanSix Inc. | a10k2018exhibit311_ekane.htm |
| EX-23.1 - EXHIBIT 23.1 PWC CONSENT - AdvanSix Inc. | a10k2018exhibit231_pwccons.htm |
| EX-10.29 - EXHIBIT 10.29 8TH AMEND SHAW - AdvanSix Inc. | a10k2018exhibit1029_shaw8t.htm |
| EX-10.28 - EXHIBIT 10.28 7TH AMEND SHAW - AdvanSix Inc. | a10k2018exhibit1028_shaw7t.htm |
UNITED STATES
SECURITIES AND EXCHANGE COMMISSION
WASHINGTON, D.C. 20549
Form 10-K
ý ANNUAL REPORT PURSUANT TO SECTION 13 OR
15(d) OF THE SECURITIES EXCHANGE ACT OF 1934
For the fiscal year ended December 31, 2017
or
o TRANSITION REPORT PURSUANT TO SECTION 13 OR
15(d) OF THE SECURITIES EXCHANGE ACT OF 1934
For the transition period from ______ to ______
Commission file number 1-37774
AdvanSix Inc.
(Exact name of registrant as specified in its charter)
Delaware | 81-2525089 | |
(State or other jurisdiction of incorporation or organization) | (I.R.S. Employer Identification No.) | |
300 Kimball Drive, Suite 101 Parsippany, New Jersey | 07054 | |
(Address of principal executive offices) | (Zip Code) | |
Registrant’s telephone number, including area code (973) 526-1800
Securities registered pursuant to Section 12(b) of the Act:
Title of each class | Name of each exchange on which registered | |
Common Stock, par value $0.01 per share | New York Stock Exchange | |
Securities registered pursuant to Section 12(g) of the Act: None
Indicate by check mark if the registrant is a well-known seasoned issuer, as defined in Rule 405 of the Securities Act. Yes ý No o
Indicate by check mark if the registrant is not required to file reports pursuant to Section 13 or Section 15(d) of the Exchange Act. Yes o No ý
Indicate by check mark whether the Registrant (1) has filed all reports required to be filed by Section 13 or 15(d) of the Securities Exchange Act of 1934 during the preceding 12 months (or for such shorter period that the Registrant was required to file such reports), and (2) has been subject to such filing requirements for the past 90 days. Yes ý No o
Indicate by check mark whether the Registrant has submitted electronically and posted on its corporate Website, if any, every Interactive Data File required to be submitted and posted pursuant to Rule 405 of Regulation S-T (§ 232.405 of this chapter) during the preceding 12 months (or for such shorter period that the registrant was required to submit and post such files). Yes ý No o
1
Indicate by check mark if disclosure of delinquent filers pursuant to Item 405 of Regulation S-K is not contained herein, and will not be contained, to the best of Registrant’s knowledge, in definitive proxy or information statements incorporated by reference in Part III of this Form 10-K or any amendment to this Form 10-K. ý
Indicate by check mark whether the Registrant is a large accelerated filer, an accelerated filer, a non-accelerated filer, or a smaller reporting company. See definition of “accelerated filer,” “large accelerated filer,” and “smaller reporting company” in Rule 12b-2 of the Exchange Act. (Check One):
Large accelerated filer ý | Accelerated filer o | Non-accelerated filer o | Smaller reporting company o |
Emerging growth company o | |||
If an emerging growth company, indicate by check mark if the registrant has elected not to use the extended transition period for complying with any new or revised financial accounting standards provided pursuant to Section 13(a) of the Exchange Act. o
Indicate by check mark whether the Registrant is a shell company (as defined in Rule 12b-2 of the Act). Yes o No ý
The aggregate market value of common stock held by non-affiliates of the Registrant was approximately $952 million as of June 30, 2017. The market value held by non-affiliates excludes the value of those shares held by executive officers and directors of the Registrant.
There were 30,482,966 shares of common stock outstanding at February 1, 2018.
Documents Incorporated by Reference
Part III: Proxy Statement for Annual Meeting of Stockholders to be held June 14, 2018.
2
TABLE OF CONTENTS
3
PART I.
Item 1. Business
In this Annual Report on Form 10-K, unless the context otherwise dictates, “AdvanSix”, the “Company”, “we” or “our” means AdvanSix Inc. and its consolidated subsidiaries.
Separation from Honeywell
On October 1, 2016, Honeywell International Inc. (“Honeywell”) completed the previously announced separation of AdvanSix Inc. The separation was completed by Honeywell distributing (the “Distribution”) all of the then outstanding shares of common stock of AdvanSix on October 1, 2016 (the “Distribution Date”) through a dividend in kind of AdvanSix common stock, par value $0.01, to holders of Honeywell common stock as of the close of business on the record date of September 16, 2016 who held their shares through the Distribution Date (the “Spin-Off”). Each Honeywell stockholder who held their shares through the Distribution Date received one share of AdvanSix common stock for every 25 shares of Honeywell common stock held at the close of business on the record date of September 16, 2016. We filed our Form 10 describing the Spin-Off with the Securities and Exchange Commission (the “SEC”), which was declared effective by the SEC on September 8, 2016 (the “Form 10”). On October 3, 2016, AdvanSix stock began “regular-way” trading on the New York Stock Exchange under the “ASIX” stock symbol. The Spin-Off is further described in Note 1 to the Consolidated Financial Statements included in Item 8 of this Form 10-K.
Description of Business
AdvanSix Inc. is an integrated manufacturer of Nylon 6, a polymer resin which is a synthetic material used by our customers to produce engineered plastics, fibers, filaments and films that, in turn, are used in such end-products as automotive and electrical components, carpets, sports apparel, fishing nets and food and industrial packaging. As a result of our backward integration and the configuration of our manufacturing facilities, we also sell a variety of other products, all of which are produced as part of our integrated Nylon 6 resin manufacturing process including caprolactam, ammonium sulfate fertilizers, and other chemical intermediates:
• | Nylon – We sell our Nylon 6 resin globally, primarily under the Aegis® brand name. In addition, we use our Nylon 6 resin to produce nylon films which we primarily sell to our customers under the Capran® brand name. |
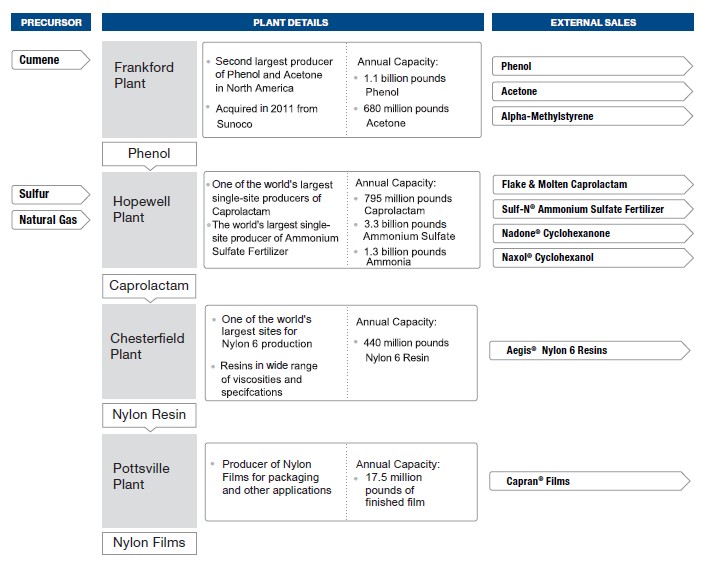
• | Caprolactam – Caprolactam is the key chemical compound used in the production of Nylon 6 resin. In recent years, approximately 60% of the caprolactam we have produced at our facility in Hopewell, Virginia has been shipped to our facility in Chesterfield, Virginia to manufacture Nylon 6 resin. We market and sell the caprolactam that is not consumed internally in Nylon 6 resin production to customers who use it to manufacture polymer resins to produce nylon fibers, films and other nylon products. Our Hopewell manufacturing facility is one of the world’s largest single-site producers of caprolactam as of December 31, 2017. |
• | Ammonium Sulfate Fertilizers – Ammonium sulfate fertilizers are derived from the caprolactam manufacturing process. Because of our Hopewell facility’s size, scale and technology design, we are the world’s largest single-site producer of ammonium sulfate fertilizer as of December 31, 2017. We market and sell ammonium sulfate primarily to North American and South American distributors, farm cooperatives and retailers to fertilize crops. |
• | Chemical Intermediates – We manufacture, market and sell a number of other chemical products that are derived from the chemical processes within our integrated supply chain. Most significant is acetone which is used by our customers in the production of adhesives, paints, coatings, solvents, herbicides and other engineered plastic resins. Other intermediate chemicals that we manufacture, market and sell include phenol, alpha-methylstyrene (“AMS”), cyclohexanone, methyl ethyl ketoxime (“MEKO”), cyclohexanol, acetaldehyde oxime, 2-pentanone oxime, sulfuric acid, ammonia and carbon dioxide. |
Each of these product lines represented the following approximate percentage of total sales:
4
Years Ended December 31, | |||||
2017 | 2016 | 2015 | |||
Nylon | 29% | 28% | 27% | ||
Caprolactam | 19% | 17% | 18% | ||
Ammonium Sulfate Fertilizers | 19% | 24% | 25% | ||
Chemical Intermediates | 33% | 31% | 30% | ||
100% | 100% | 100% | |||
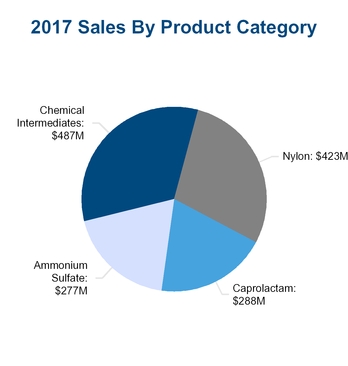
The following charts illustrate the distribution of our sales by product category and by region, measured by the destination of each sale, for the year ended December 31, 2017:
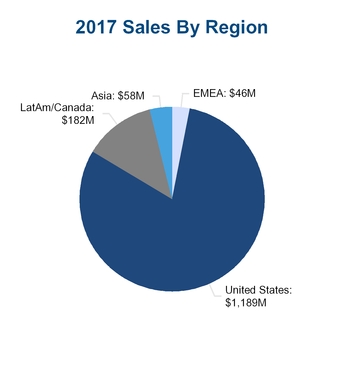
For information concerning revenues and assets by geographic region, see “Note 16 – Geographic Areas and Major Customers – Financial Data” to our Consolidated Financial Statements included in this Form 10-K, which information is incorporated here by reference.
Our manufacturing process is backward integrated. We use cumene, a chemical compound produced from benzene and propylene, to manufacture phenol, acetone and AMS, at our Frankford, Pennsylvania plant. The majority of the phenol we manufacture is further processed at our Hopewell facility through an integrated series of unit operations which also consume natural gas and sulfur, to produce caprolactam and ammonium sulfate. In recent years, approximately 60% of our caprolactam is then shipped to our Chesterfield plant, where it is polymerized into Nylon 6 resin. In addition, we use our Nylon 6 resin to produce nylon films at a facility located in Pottsville, Pennsylvania, which we primarily sell to our customers under the Capran® brand name.
5
Our integrated manufacturing process, scale and the quantity and range of our products make us one of the most efficient manufacturers in our industry. We consistently focus on and invest in improving production yields from our various manufacturing processes to build on our leading cost position. Our global logistics infrastructure enables a reliable intra-plant supply chain and consistent and timely delivery to our customers. In addition, we strive to understand the product applications and end-markets into which our products are sold, which helps us upgrade the quality, chemical properties or packaging of our products in ways to attract price premiums and greater demand.
We serve over 500 customers globally located in more than 40 countries. For the years ended December 31, 2017, 2016 and 2015, we had sales of $1,475 million, $1,192 million and $1,329 million with net income of $147 million, $34 million and $64 million, respectively. For the years ended December 31, 2017, 2016 and 2015, our international sales were $286 million, $216 million and $372 million, respectively.
AdvanSix is a single reportable segment, operating through four integrated U.S.-based manufacturing sites located in Frankford and Pottsville, Pennsylvania and Hopewell and Chesterfield, Virginia. The Company's headquarters is located in Parsippany, New Jersey.
Competitive Strengths
Large-Scale Single-Site Producer of Caprolactam and Ammonium Sulfate. We operate one of the world’s largest single-site caprolactam and ammonium sulfate production facilities, which is a competitive advantage in our fragmented industry. Our scale provides operating leverage and the opportunity to achieve stronger business performance than our competitors in several ways. Most fundamentally, it enables us to spread fixed and overhead costs across more pounds of production, thereby enabling us to produce caprolactam at a lower per pound cost than our competitors, as well as benefiting our procurement activities for raw materials and services. We believe that our reputation as one of the world’s largest producers of caprolactam, Nylon 6 resin, ammonium sulfate and associated chemical intermediates, encourages potential customers to approach us for stability of their supply requirements.
6
Low Cost Position Driven by Favorable Geographical Location, Integrated Manufacturing Footprint and High Utilization Rates. Our access to lower cost raw materials, backward integrated manufacturing facilities and high plant utilization rates help us maintain our position as the world’s lowest cost producer of caprolactam. First, the location of our manufacturing operations in the United States affords us access to the world’s lowest cost natural gas, which is a key raw material needed to manufacture the ammonia used in the production of caprolactam as well as the source of energy for our manufacturing operations. By contrast, a significant number of our competitors are located in geographic locations where energy prices are substantially higher. Second, we are backward integrated into several key feedstock materials necessary to produce caprolactam and Nylon 6 resin, particularly phenol, ammonia and oleum/sulfuric acid, which we believe is a unique advantage in our industry. Backward integration contributes to higher operating margins by lowering raw material transportation, handling and storage costs. It also allows us to remain flexible, while optimizing sales from our diverse portfolio of products. Finally, our long-term customer relationships and contracts enable us to maintain high plant utilization rates, which, along with our large scale, provide significant operating and purchasing leverage.
Global Reach. The global reach of our sales and marketing capabilities enables us to compete everywhere nylon resin, caprolactam, ammonium sulfate and chemical intermediates are consumed. In 2017, approximately 19% of our sales were outside the United States. Our freight and logistics capabilities and terminal locations position us well to serve global markets, including the dock and loading facility at our Hopewell facility which serves ocean-going freight vessels. Our global reach enables us to arbitrage geographic price variations to ensure we are receiving the highest value for our products.
Technical Know-how, Customer Intimacy and Application Development Capabilities. Intimate knowledge of our customers and end-market applications, combined with our technical know-how, enables us to develop specialty products that are often valued higher by customers compared to commodity products. We have an R&D department consisting of approximately 50 scientists and engineers with advanced degrees in polymer synthesis, catalysis and chemical engineering, who work not only on developing new products for nylon resins but also driving unique offerings for our chemical intermediates and ammonium sulfate customers. Our R&D team has expanded our capabilities to test and scale production of copolymer Nylon 6/6.6 resin, which is used in food packaging films and other applications. We also have R&D resources located in Shanghai, China that specialize in working with nylon resin customers to develop products for specialty applications. Further, our agronomists provide the latest scientific information on the importance of sulfur nutrition for crops and how to optimize the benefits of ammonium sulfate fertilizer to our global customers through a variety of channels including webinars, an “Ask the Agronomist” blog, technical training sessions for retailers and direct grower meetings.
Diverse Revenue Sources from the Sale of Fertilizer, Acetone and Other Chemical Intermediates. Due to our specific chemical manufacturing processes, backward integration and scale, we produce ammonium sulfate fertilizer, acetone and a wide range of other chemical intermediates that enable us to diversify our revenue sources. Most significantly, for every pound of caprolactam produced, we produce approximately four pounds of ammonium sulfate, a fertilizer used by farmers around the world. For the past two decades, we have employed agronomists to educate growers and retailers in the Americas on the yield value of using ammonium sulfate fertilizer on key crops including corn, wheat, coffee, sugar and cotton. Sales of ammonium sulfate in 2017 were $277 million and represented 19% of our total sales. We are among the most significant suppliers of acetone to a variety of end-markets in North America. Sales of acetone in 2017 were approximately $231 million and represented 16% of our total sales. In addition to fertilizer and acetone, other products from our manufacturing process include high-purity phenol, AMS, cyclohexanone, cyclohexanol, sulfuric acid, ammonia, MEKO and carbon dioxide. The diversity of our sales portfolio helps to mitigate, to some extent, the cyclicality in our end-markets.
Business Strategies
Build on our Low Cost Leadership Position. Through our size, access to low cost raw materials, backward integration and high utilization rates, we seek to expand operating margins by reducing our Nylon 6 resin, caprolactam and ammonium sulfate production costs. Our focus on operational excellence and ongoing productivity improvements concentrate on the following:
• | Increasing production volume through asset reliability, flexibility and capacity; |
• | Investing in intermediate chemical buffer storage capacity to mitigate the unfavorable impact of routine maintenance and unplanned interruptions; |
• | Energy and direct material initiatives aimed at increasing plant productivity and lowering costs; and |
• | Procurement processes, competitive bidding and supplier diversification to reduce raw material costs. |
Leverage our R&D Investments and Applications Expertise. Our customers typically buy caprolactam and nylon resin for compounding or extruding with additives and other materials, to increase strength or flexibility or to add color to make the resin more suitable for use in their end products such as textiles, packaging and industrial materials. We leverage our R&D investments, customer intimacy and knowledge of product applications to develop new formulations of resin products to better serve our customers and increase the value of our resin products portfolio. For example, engineered plastics that utilize Nylon 6 and Nylon 6.6 resin are being increasingly used in automobiles to reduce weight as automobile manufacturers
7
strive to meet stricter fuel efficiency standards. We work with our customers serving this market to develop resin products specifically tailored for these product applications. Likewise, we are working to develop and sell nylon resin products with differentiated characteristics for wire and cable applications and flexible food packaging. Another focus of our R&D initiatives includes nylon resin processing technologies that can produce existing high value resins at lower costs. Our R&D team works with existing and potential customers to understand end-use applications, build application development capabilities and protect the value proposition of our new products.
Selective Investments to Produce Higher Value Products. Historically, a significant portion of our Nylon 6 resin was sold as a commodity product and, as a result, was subject to cyclicality. Over the past several years, we have invested in capabilities to increase the value of our product portfolio. We installed a production line at our Chesterfield facility that is capable of producing multiple grades of higher value Nylon 6 resin as well as copolymer Nylon 6/6.6 resin, both of which are used in engineered plastics for the automotive industry, films for food packaging, as well as other higher value applications. Similarly, we will explore other investments that will enable us to produce products that meet customer specifications in certain high value industries.
Use of Toll Manufacturers to Produce Higher Margin, AdvanSix-Developed Specialty Products. We use our technical know-how and customer intimacy to develop products that blend our nylon resin with other types of nylon and non-nylon resin products and additives to produce higher value products. Where we do not have the in-house manufacturing capabilities to produce these products, we contract with third-party compounders to toll manufacture for us. Utilizing third party toll manufacturing has enabled the Company to diversify away from certain commodity end-markets, provide a low cost way to access certain geographic regions and, in some cases, explore new end-markets and applications with less risk.
Pursue a Highly-Selective Acquisition Strategy. We evaluate strategic acquisitions and alliances to supplement our organic sales by broadening our customer base, expanding our geographic reach and developing our technology and product portfolios.
Industry Overview
Nylon and Caprolactam. According to PCI Wood Mackenzie, estimated 2017 annual global demand for Nylon 6 resin was approximately 5,500 kMT, spanning a variety of end-uses such as engineered automotive plastics, carpets, textiles, industrial filament, and food and industrial films. The market growth typically tracks global growth but varies by end-use. Some of these end-markets, such as engineered automotive plastics, are experiencing increased demand due to trends in lightweighting to meet stricter fuel efficiency standards. We expect this trend of increasing demand to continue as our customers find new uses for Nylon 6 resin within existing and new applications.
Generally, prices for Nylon 6 resin and caprolactam reflect supply and demand in the marketplace as well as the value of the basic raw materials used in the production of caprolactam, consisting primarily of benzene and, depending on the manufacturing process utilized, natural gas and sulfur. The price of benzene is a key driver of caprolactam prices because it is the common chemical compound used in the petrochemical derivatives, such as phenol and cyclohexane, which are the key feedstock materials for caprolactam depending on the chosen manufacturing technology. As a result, the global prices for caprolactam typically track as a spread over the price of benzene. Generally, Nylon 6 resin prices track the cyclicality of caprolactam prices, although, to the extent Nylon 6 resin producers are able to manufacture specialized nylon resin products, prices set above the spread are achievable.
The global market for Nylon 6 resin and caprolactam has undergone significant change in the past seven years as Chinese manufacturers have entered the market and increased global supply at a time when demand growth has remained relatively stable. As a result of the increased capacity and competitive intensity, margins for Nylon 6 resin and caprolactam have declined to historic lows over this period. Throughout 2017, industry spreads fluctuated near marginal producer cost.
Ammonium Sulfate. Ammonium sulfate fertilizer products are primarily sold in North and South America. Ammonium sulfate is used as a nitrogen fertilizer on key crops that benefit from sulfur micronutrients and, as of December 31, 2017, accounts for approximately 5% of the global market for nitrogen fertilizer. Global prices for ammonium sulfate fertilizer are influenced by several factors including the price of urea, which is the most widely used source of nitrogen-based fertilizer in the world. Urea pricing has declined in recent years due to global production expansions outpacing demand. In late 2017, urea prices firmed as Chinese environmental regulations reduced exports. Another global factor driving demand for ammonium sulfate fertilizer is general agriculture trends including the price of crops.
Chemical Intermediates. Chemical intermediates are used as key inputs for a variety of end-market products including construction materials, paints and coatings, packaging and consumer applications. The prices for our chemical intermediates generally correlate to the prices of their underlying raw materials and supply and demand dynamics.
8
Competition
Competition across our product offerings is based on a variety of factors including price, reliability of supply, product innovation, and quality. Other competitive factors include breadth of product line, R&D efforts and technical and managerial capability. While the competitive position of our individual products varies, we believe we are a significant competitor in each major product class. AdvanSix competes with integrated manufacturers, such as BASF Corporation, Sinopec Limited, DOMO Chemicals GmbH, LANXESS AG and Ube Industries, Ltd. We also compete with manufacturers such as Li Peng Enterprise Co. Ltd. and Zig Sheng Industrial Co., Ltd. that produce only polymer resin; synthetic manufacturers of ammonium sulfate, such as Pasadena Commodities International; and phenol producers, such as Ineos. A number of our products are sold in markets with many competitors, some of whom have substantial financial resources and significant technological capabilities. Additionally, our competitors include companies with global operations as well as those operating only within specific geographic regions.
Product Overview
Nylon
We manufacture our Nylon 6 resin in our Chesterfield plant. We sell our Nylon 6 resin globally, primarily under the Aegis® brand name. In addition, we use our Nylon 6 resin to produce nylon films at our Pottsville plant, which is sold to our customers under the Capran® brand name. In 2017, our Nylon products generated $423 million of sales. In 2017, 2016 and 2015, Nylon sales were 29%, 28% and 27% of our total sales, respectively.
Caprolactam
We produce caprolactam, the key monomer used in the production of Nylon 6 resin, at our Hopewell plant using phenol produced at our Frankford plant and sulfur and natural gas obtained from third-party suppliers. In 2017, caprolactam generated $288 million of sales. In 2017, 2016 and 2015, caprolactam sales were 19%, 17% and 18% of our total sales, respectively.
Ammonium Sulfate
Ammonium sulfate fertilizer is produced simultaneously with caprolactam as part of our integrated caprolactam manufacturing process at our Hopewell plant. We manufacture these products in a ratio of approximately four pounds of ammonium sulfate to one pound of caprolactam. Our competitors typically produce approximately two pounds or less of ammonium sulfate for each pound of caprolactam. Approximately 60% of the ammonium sulfate we produce is in granular form. We sell ammonium sulfate under the brand name Sulf-N®, and in 2017, our ammonium sulfate products generated $277 million of sales. In 2017, 2016 and 2015, ammonium sulfate sales were 19%, 24% and 25% of our total sales, respectively.
Chemical Intermediates
We produce and sell chemical intermediates to a range of customers for use in many different types of end-products. In 2017, our chemical intermediates generated $487 million of sales, of which $399 million, or 82%, came from sales of acetone, phenol and cyclohexanone, and $88 million, or 18%, came from sales of our other chemical intermediates. In 2017, 2016 and 2015, sales of chemical intermediates were 33%, 31% and 30% of our total sales, respectively.
Phenol is a key chemical intermediate of caprolactam, and we produce the phenol we use in our caprolactam manufacturing process at our Frankford plant. Approximately 75% to 80% of the phenol we produce is used in production of caprolactam and other chemical intermediates at Hopewell, and approximately 20% to 25% of our phenol is sold to customers for use in their product applications such as resins, epoxies and Bisphenol A.
All our acetone is sold to customers for use in end-products such as adhesives, paints, coatings, solvents, herbicides and other engineered plastic resins. Acetone is typically used by our customers as a key raw material in the production of a variety of other chemicals which are then used in the applications listed above.
We also produce and sell alpha methylstyrene ("AMS"), methyl ethyl ketoxime ("MEKO"), cyclohexanone, cyclohexanol, acetaldehyde oxime and 2-pentanone oxime. We use some of these products in our manufacturing process and sell some to customers for use in end-products such as resins, inks, paints, coatings and agricultural chemical intermediates and detergents.
Raw Materials
9
The primary raw material used in our manufacturing process is cumene, which is produced from benzene and propylene. We purchase cumene from multiple suppliers to ensure stability of supply and optimal terms. Other important raw materials used in our manufacturing process are natural gas and sulfur, which are used to produce caprolactam and ammonium sulfate. We purchase natural gas and sulfur from a diverse set of suppliers.
Historically, we have been able to renew contracts with our suppliers and obtain sufficient quantities of cumene, sulfur, natural gas and any other key raw materials. Global supply and demand can significantly impact the price of our key raw materials, and historically prices have been cyclical. We primarily mitigate our exposure to commodity price risk through the use of long-term, formula-based price contracts with our suppliers and formula-based price agreements with customers. We continually seek to reduce costs of key raw materials and do not foresee any material constraints in the near term resulting from pricing or availability.
Sales, Marketing and Distribution
We have a global sales force with long-standing customer relationships and deep expertise with our products, product applications and end-markets. We predominantly sell directly to our customers, primarily under contracts but also through spot transactions under purchase orders.
Our products are supported by our global logistics capability that we employ to ensure reliable and timely delivery to our customers while maximizing distribution resources and efficiency.
Customers
Globally, we serve over 500 customers in a wide variety of industries located in more than 40 countries. In 2017, the Company's 10 largest customers accounted for approximately 44% of total sales. Our largest customer is Shaw Industries Group, Inc., one of the world’s largest consumers of caprolactam and Nylon 6 resin which we sell to them under a long-term contract. In 2017, 2016 and 2015, sales to Shaw were 22%, 17% and 16%, respectively, of our total sales. We typically sell to our other customers under short-term contracts, with one- to two-year terms, or by purchase orders. We have historically experienced low customer turnover.
Seasonality
Except for sales of our ammonium sulfate fertilizer products, which are influenced by seasonal growing patterns in North and South America, sales of most of our products are subject to minimal or no seasonality. We occasionally build up higher inventory balances because the production volumes are generally steady month-to-month rather than tied to seasonal demand for fertilizers.
Backlog
In general, the Company does not manufacture its products against a backlog of orders and does not consider backlog to be a significant indicator of the level of future sales activity. Therefore, the Company believes that backlog information is not material to understanding its overall business and should not be considered a reliable indicator of the Company’s ability to achieve any particular level of revenue or financial return. However, we do have long-term supply contracts that carry minimum order obligations.
Research & Development and Intellectual Property
We believe success in our industry is driven not only by operational excellence and cost position but also through technological strength and innovation. Our R&D activities focus on improving our chemical manufacturing processes to increase efficiency, capacity, and productivity, and lowering our production and operating costs, as well as innovating and developing new product applications.
We benefit from numerous patents and trademarks that we own. We sell our Nylon 6 resin under the Aegis® brand name, our nylon films under the Capran® brand name and our ammonium sulfate fertilizer under the Sulf-N® brand name. Chemical intermediates are sold under the brand names of Nadone®, Naxol® and EZ-Blox™. We also benefit from technology covered by trade secrets, including know-how and other proprietary information relating to many of our products, processes and technologies. We do not consider any individual patent, trademark or licensing or distribution rights related to a specific process or product to be of material importance in relation to our total business. In our judgment, our intellectual property rights are adequate for the conduct of our business. We intend to continue taking steps as necessary to protect our intellectual property, including when appropriate, filing patent applications for inventions that are deemed important to our business.
10
We conduct R&D at technology centers with approximately 50 researchers in total. We lease R&D space from Honeywell in Colonial Heights, Virginia and have R&D resources located in Shanghai, China. For the years ended December 31, 2017, 2016 and 2015, our R&D expenses were approximately $12.9 million, $13.8 million and $12.8 million, respectively.
Regulation and Environmental Matters
We are subject to various federal, state, local and foreign government requirements regarding protection of human health and the environment. Compliance with these laws and regulations results in higher capital expenditures and costs. We believe that, as a general matter, our policies, practices and procedures are properly designed to prevent unreasonable risk of environmental impact, and any resulting financial liability. Some risk of environmental impact is, however, inherent in some of our operations and products, as it is with other companies engaged in similar businesses.
We are and have been engaged in the handling, manufacture, use and disposal of many substances classified as hazardous by one or more regulatory agencies. It is possible that future knowledge or other developments, such as improved capability to detect substances in the environment or increasingly strict environmental laws, standards and enforcement policies, could bring into question our current or past handling, manufacture, use or disposal of these substances.
Among other environmental laws and regulations, we are subject to the Comprehensive Environmental Response, Compensation and Liability Act (“CERCLA” also known as the “Federal Superfund Law”); the Resource Conservation and Recovery Act (“RCRA”) and similar state, foreign and global laws for management and remediation of hazardous materials; the Clean Air Act (“CAA”) and the Clean Water Act, for protection of air and water resources; the Toxic Substance Control Act (“TSCA”), for regulation of chemicals in commerce and reporting of potential known adverse effects. There are also numerous other federal, state, local and foreign laws and regulations governing materials transport and packaging, under which we may be designated as a potentially responsible party liable for cleanup costs associated with current operating sites and various hazardous waste sites.
In July 2013, a consent decree was finalized among the United States, the Commonwealth of Virginia and AdvanSix regarding alleged violations of the CAA and the air operating permit at our manufacturing facility in Hopewell, Virginia. In the consent decree, we agreed to pay a civil penalty of $3 million and, among other things, install certain pollution control and other equipment in accordance with a schedule ending in 2019. In October 2015, a consent order was finalized between the Virginia Water Control Board and AdvanSix regarding alleged violations of Hopewell’s Virginia Pollutant Discharge Elimination System permit and other discharge requirements. In the consent order, we agreed to pay a civil penalty of $300,000 and, among other things, take corrective action with respect to process sewers and sumps at our Hopewell facility in accordance with a schedule ending in 2018.
Our business may be impacted by potential climate change legislation, regulation or international treaties or accords in the foreseeable future. We will continue to monitor emerging developments in this area.
Our accounting policy for environmental expenditures is discussed in “Note 2 – Summary of Significant Accounting Policies” to the audited Consolidated Financial Statements included elsewhere in this Form 10-K. We continuously seek to improve our environment, health and safety performance. We have expended funds to comply with environmental laws and regulations and expect to continue to do so.
Our Frankford and Hopewell facilities are regulated facilities under the Maritime Transportation Security Act of 2002 (“MTSA”) due to the nature of our operations and the proximity of the facilities to adjacent waterways. As a result, we are required to comply with numerous regulations administered by the Department of Homeland Security, including the development and implementation of compliant security procedures and protocols. Additionally, sales of acetone, which is a List II Chemical under the TSCA, are regulated by the Drug Enforcement Act. This classification subjects us to audits by the Drug Enforcement Administration and ongoing restrictions on our sales activities with respect to acetone.
See “Risk Factors – We are subject to extensive environmental, health and safety laws and regulations that may result in unanticipated loss or liability, which could adversely affect our business, financial condition and results of operations” in Item 1A.
Employees
As of December 31, 2017, the Company employed approximately 1,510 people. Of this total, approximately 590 are salaried employees and approximately 920 are hourly employees. Approximately 760 employees are covered under collective bargaining agreements that expire between 2018 and 2021.
11
Executive Officers of the Registrant
The executive officers of AdvanSix Inc., listed as follows, are appointed annually by the Board of Directors. Each of the individuals was first appointed as an executive officer in 2016.
There are no family relationships among them.
Name, Age | Position | Business Experience |
Erin N. Kane, 41 | Chief Executive Officer and Director | Prior to joining the Company, Ms. Kane served as vice president and general manager of Honeywell Resins and Chemicals since October 2014. She joined Honeywell in 2002 as a Six Sigma Blackbelt of Honeywell’s Specialty Materials business. In 2004, she was named product marketing manager of Honeywell’s Specialty Additives business. From 2006 until 2008, Ms. Kane served as global marketing manager of Honeywell’s Authentication Technologies business, and in 2008 she was named global marketing manager of Honeywell’s Resins and Chemicals business. In 2011, she was named business director of chemical intermediates of Honeywell’s Resins and Chemicals business. Prior to joining Honeywell, Ms. Kane held Six Sigma and process engineering positions at Elementis Specialties and Kvaerner Process. Ms. Kane brings to the Board her extensive leadership experience as well as knowledge of AdvanSix’s business, industry, health, safety and environmental (HSE), and operations. |
Michael Preston, 46 | Senior Vice President and Chief Financial Officer | Prior to joining the Company, Mr. Preston held a number of finance roles with Honeywell for over 15 years. Most recently, Mr. Preston served as vice president and chief financial officer for Honeywell’s UOP division (2013-2016). Prior to this role, Mr. Preston was vice president of business analysis & planning (2012–2013) with Honeywell corporate. Mr. Preston also held several finance leadership roles within businesses and Honeywell corporate, including chief financial officer for Fluorine Products, director of financial planning & analysis for Performance Materials and Technologies, and director of business analysis & planning for Honeywell corporate. Mr. Preston began his career with Honeywell in September of 2001 as manager of investor relations. Prior to joining Honeywell, he spent seven years in investor relations consulting. Mr. Preston was awarded the Chartered Financial Analyst designation in September of 2001 and is a member of CFA Institute and New York Society of Security Analysts. |
John M. Quitmeyer, 67 | Senior Vice President, General Counsel and Corporate Secretary | Prior to joining the Company, Mr. Quitmeyer served as vice president and general counsel of Honeywell’s Automation and Control Solutions strategic business group since 2005. He joined Honeywell in 1997 as general counsel of Honeywell’s safety restraint business. From 1997 until 1998, Mr. Quitmeyer served as general counsel of Honeywell’s automotive products group. From 1998 until 2000, Mr. Quitmeyer served as general counsel of Honeywell’s consumer products group. From 2000 until 2002, Mr. Quitmeyer was Honeywell’s chief litigation counsel. From 2002 until 2005, Mr. Quitmeyer served as general counsel of Honeywell’s Specialty Materials business. Prior to joining Honeywell, Mr. Quitmeyer was a litigation partner at Rogers & Wells. |
Jonathan Bellamy, 52 | Senior Vice President and Chief Human Resources Officer | Prior to joining the Company, Mr. Bellamy served as vice president of human resources of the Defense and Space business of Honeywell’s Aerospace division since 2015. He joined Honeywell in 1997 as human resources manager of the Turbo Technologies division. From March 2000 until February 2003, Mr. Bellamy served as human resources manager, then regional director of Honeywell’s Turbo Technologies division. From February 2003 until December 2004, he served as director of human resources of Honeywell Transportation Systems, Asia. From December 2004 until November 2005, Mr. Bellamy served as global human resources director of Honeywell’s Friction Materials division. From November 2005 until July 2010, Mr. Bellamy served as corporate human resources director. From 2010 to 2015, he was vice president of human resources of Honeywell UOP. Prior to joining Honeywell, Mr. Bellamy held human resources and operations positions at BTR Brook Hansen and N.S.K./RHP Bearings. |
12
Name, Age | Position | Business Experience |
Christopher Gramm, 48 | Vice President, Controller | Prior to joining the Company, Mr. Gramm served as vice president and controller of the aerospace and corporate government compliance divisions at Honeywell International Inc. From August 2014 to November 2015, Mr. Gramm served as vice president of finance for the integrated supply chain of the aerospace division at Honeywell International Inc. Beginning in March 2011, he was vice president and controller of the aerospace division at Honeywell International Inc. Over the course of the period from 1997 to March 2011, Mr. Gramm held several positions at Honeywell International Inc., including controller and chief financial officer of various divisions focused on areas including specialty materials and resins and chemicals. He joined Honeywell International Inc. in 1997 as a senior staff accountant. Before joining Honeywell International Inc., Mr. Gramm was a manager at Corning Life Sciences. |
Other Information
Our Annual Report on Form 10-K, Quarterly Reports on Form 10-Q, Current Reports on Form 8-K and any amendments to those reports are available free of charge on our website (www.AdvanSix.com) under the heading Investors (see SEC filings) immediately after they are filed with, or furnished to, the Securities and Exchange Commission (SEC). In addition, in this Form 10-K, the Company incorporates by reference certain information from parts of its Proxy Statement for the 2018 Annual Meeting of Stockholders, which will also be available free of charge on our website. Information contained on, or connected to, our website does not and will not constitute part of this Form 10-K.
We are a Delaware corporation that was incorporated on May 4, 2016. Effective February 1, 2017, our principal executive offices are located at 300 Kimball Drive, Suite 101, Parsippany, NJ 07054. Prior to February 1, 2017, our principal executive offices were located at 115 Tabor Road, Morris Plains, NJ 07950. Our telephone number is (973) 526-1800. Our website address is www.AdvanSix.com.
13
Item 1A. Risk Factors
Cautionary Statement Concerning Forward-Looking Statements
All statements other than statements of historical fact included in this Form 10-K including, without limitation, statements under “Item 7. Management’s Discussion and Analysis of Financial Condition and Results of Operations” and in other parts of this Form 10-K regarding our financial position, business strategy and the plans and objectives of management for future operations, are forward-looking statements within the meaning of Section 21E of the Securities Exchange Act of 1934, as amended. When used in this Form 10-K, words such as “anticipate,” “believe,” “estimate,” “expect,” “plan,” “intend” and similar expressions, as they relate to us or our management, identify forward-looking statements. Such forward-looking statements are based on the beliefs of management, as well as assumptions made by, and information currently available to, our management. They are not guarantees of future performance and actual results could differ materially from those contemplated by the forward-looking statements as a result of certain factors detailed in our filings with the SEC. All subsequent written or oral forward-looking statements attributable to us or persons acting on our behalf are qualified in their entirety by this paragraph. We do not undertake to update or revise any of our forward-looking statements. Our forward-looking statements are also subject to risks and uncertainties that can affect our performance in both the near-and long-term. These forward-looking statements should be considered in light of the information included in this Form 10-K, including, in particular, the factors discussed below. These factors may be revised or supplemented in subsequent reports on Forms 10-Q and 8-K.
Risk Factors
You should carefully consider all information in this Form 10-K and each of the risks described below, which we believe are the principal risks we face. Any of the following risks could materially and adversely affect our business, financial condition and results of operations and the actual outcome of matters as to which forward-looking statements are made in this Form 10-K.
Risks Relating to Our Business
Difficult and volatile conditions in the overall economy, particularly in the United States but also globally, and in the capital, credit and commodities markets could adversely affect our business, financial condition and results of operations.
Our business, financial condition and results of operations could be adversely affected by difficult global economic conditions and significant volatility in the capital, credit and commodities markets and in the overall economy. For example:
• | Weak economic conditions, especially in our key markets, could reduce demand for our products, impacting our sales and margins; |
• | As a result of volatility in commodity prices, we may encounter difficulty in achieving sustained market acceptance of past or future price increases; |
• | Under difficult market conditions, there can be no assurance that access to credit or the capital markets would be available or sufficient, and as such, we may not be able to successfully obtain additional financing on reasonable terms, or at all; |
• | Market conditions and credit availability could adversely affect the financial situation of key raw material suppliers’ ability to deliver key materials, thus impacting our ability to run our production facilities at the intended rates; and |
• | Market conditions could result in our key customers experiencing financial difficulties and/or electing to limit spending, which in turn could result in decreased sales and earnings for us. |
The industries in which we operate are highly competitive and experience cyclicality which can cause significant fluctuations in our cash flows. These industry dynamics may adversely affect our business, financial condition and results of operations.
Competition in the industries we serve is based on factors such as price, product quality and service. We face significant competition from major international and regional competitors. Our competitors may improve their competitive positions in our core markets by successfully introducing new products or innovations in their manufacturing processes or improving their cost structures. If we are unable to keep pace with our competitors’ product and manufacturing process innovations or cost position improvements, our business, financial condition and results of operations could be adversely affected.
14
Our historical operating results reflect the cyclical and sometimes volatile nature of the Nylon 6 resin, caprolactam and ammonium sulfate industries. We experience cycles of fluctuating supply and demand for each of the products we sell resulting in changes in selling prices and margins. Periods of high demand, tight supply and increasing operating margins tend to result in increases in capacity and production until supply exceeds demand, generally followed by periods of oversupply and declining prices. For example, in the past, nylon and caprolactam prices have experienced a cyclical period of downturn as the global market has experienced large increases in supply without a commensurate increase in demand. Decreases in the average selling prices of our products could have an adverse effect on our profitability. While we strive to maintain or increase our profitability by reducing costs through improving production efficiency, by emphasizing higher margin products and by controlling transportation, selling and administration expense, we cannot assure you that these efforts will be sufficient to offset fully the effect of possible decreases in pricing on operating results. Because of the cyclical nature of our businesses, we cannot assure you that pricing or profitability in the future will be comparable to any historical period, including the most recent period shown in our operating results.
Any significant unplanned downtime or material disruption at one of our production facilities or logistics operations may adversely affect our business, financial condition and results of operations.
We seek to run our complex production facilities on a nearly continuous basis for maximum efficiency and we rely on the integrity of our logistics operations for the uninterrupted operations of our business. While we have made significant annual capital improvements at our manufacturing plants, operational issues have occurred in the past and may occur in the future, which could cause damage to our manufacturing and production equipment and ancillary facilities. Unplanned interruptions in our production capabilities adversely affect our production costs, product lead times and earnings during the affected period.
Although our integrated manufacturing, scale and the quantity and range of our product offerings make us one of the most efficient manufacturers in our industry, the significant level of integration across our manufacturing facilities exposes us to increased risk associated with unplanned downtime or material disruptions at any one of our production facilities which could impact our supply chain and our manufacturing process.
We seek to mitigate the risk of unplanned downtime through regularly scheduled maintenance for both major and minor repairs at all of our production facilities. We also utilize maintenance excellence and mechanical integrity programs and maintain what we believe is an appropriate buffer inventory of intermediate chemicals necessary for our manufacturing process, both of which are intended to mitigate the extent of any production losses as a result of unplanned downtime. However, unplanned outages may still occur or we may not have enough intermediate chemical inventory at any given time to offset production losses. Moreover, taking our production facilities offline for regularly scheduled repairs can be an expensive and time-consuming operation with risk that discoverable items and delays during the repair process may cause additional unplanned downtime. Any such unplanned downtime at any of our production facilities may adversely affect our business, financial condition and results of operations.
Our production facilities and logistics operations are also subject to the risk of catastrophic loss and material disruptions due to unanticipated events, such as unexpected repairs or other operational and logistical problems, severe weather conditions, personal injury or major accidents, prolonged power failures, chemical spills, fires, explosions, acts of terrorism, earthquakes or other natural disasters, that we or a third-party on which we rely may experience. Depending on the nature, extent and length of any operational interruption from any such event, the results could adversely affect our business, financial condition and results of operations.
Raw material price fluctuations and the ability of key suppliers to meet delivery requirements can increase the cost of our products and services, impact our ability to meet commitments to customers and cause us to incur significant liabilities.
The cost of raw materials, including cumene, natural gas and sulfur, is a key element in the cost of our products. Our inability to offset material price inflation through increased prices to customers, formula-based or long-term fixed price contracts with suppliers, productivity actions or commodity hedges could adversely affect our business, financial condition and results of operations.
Although we believe that our sources of supply for raw materials are generally robust, it is difficult to predict what effects shortages of raw materials or price increases may have in the future. Our ability to manage inventory and meet delivery requirements may be constrained by our suppliers’ inability to scale production and adjust delivery of long lead-time products during periods of fluctuating demand. Our inability to fill our supply needs would jeopardize our ability to fulfill obligations under contracts, which could, in turn, result in reduced sales and profits, contract penalties or terminations and damage to customer relationships.
15
When possible, we have purchased, and we plan to continue to purchase, raw materials, including cumene, natural gas and sulfur, through negotiated medium- or long-term contracts. To the extent we have been able to achieve favorable terms in our existing negotiated contracts, we may not be able to renew such contracts at the current terms or at all, and this may adversely impact our results of operations. To the extent the markets for our raw materials significantly change, we may be bound by the terms of our existing supplier contracts and obligated to purchase raw materials at disadvantaged terms as compared to other market participants.
Our operations require substantial capital and we may not be able to obtain additional capital that we need in the future on favorable terms or at all.
Our industry is capital intensive, and we may require additional capital in the future to finance our growth and development, upgrade and improve our manufacturing capabilities, implement further marketing and sales activities, fund ongoing R&D activities, satisfy regulatory and environmental compliance obligations and meet general working capital needs. Our capital requirements will depend on many factors, including acceptance of and demand for our products, the extent to which we invest in new technology and R&D projects and the status and timing of these developments. We may need to seek additional capital in the future, and debt or equity financing may not be available to us on terms we find acceptable, if at all. If we incur additional debt or raise equity through the issuance of our preferred stock, the terms of the debt or our preferred stock may give the holders rights, preferences and privileges senior to those of holders of our common stock, particularly in the event of liquidation. If we raise funds through the issuance of additional common equity, ownership in AdvanSix would be diluted. Also, regardless of the terms of our debt or equity financing, our agreements and obligations under the Tax Matters Agreement entered into in connection with the Spin-Off that address compliance with Section 355(e) of the Internal Revenue Code of 1986, as amended (the “Code”), may limit our ability to issue stock. We believe that we have adequate capital resources to meet our projected operating needs, capital expenditures and other cash requirements. However, we may need additional capital resources in the future, and if we are unable to obtain sufficient resources for our operating needs, capital expenditures and other cash requirements for any reason, our business, financial condition and results of operations could be adversely affected.
Failure to develop and commercialize new products or technologies could adversely affect our business, financial condition and results of operations.
Our successful development and commercialization of new products and technologies are drivers to our future strategy. The development and commercialization of new products and technologies requires significant investment in research and development, capital expenditures, production and marketing. We cannot be certain that costs incurred by investing in new products and technologies will result in an increase in our revenues or profits. The success of any such new products and technologies is uncertain and could adversely affect our business, financial condition and results of operations.
Our operations are dependent on numerous required permits and approvals.
We hold numerous environmental and other governmental permits and approvals authorizing operations at each of our facilities. In addition, any expansion or major modification of our operations is dependent upon securing the necessary environmental or other permits or approvals. A decision by a government agency to deny or delay issuing a new or renewed material permit or approval, or to revoke or substantially modify an existing material permit or approval, could have an adverse effect on our ability to continue operations at the affected facility and on our business, financial condition and results of operations.
The loss of one or more of our significant customers could adversely affect our business, financial condition and results of operations.
Our business depends on significant customers, many of whom have been doing business with us for decades. The loss of one or several significant customers may have an adverse effect on our business, financial condition and results of operations. In 2017, our 10 largest customers accounted for approximately 44% of our total sales. Our largest customer is Shaw Industries Group, Inc. (“Shaw”), one of the world’s largest consumers of caprolactam and Nylon 6 resin, which we sell to them under a long-term contract. We typically sell to other customers under short-term contracts with one- to two-year terms or by purchase orders. If our sales to any of our significant customers were to decline, we may not be able to find other customers to purchase the excess supply of our products. The loss of one or several of our significant customers, or a significant reduction in purchase volume by any of them, or significant unfavorable changes to pricing or other terms in contracts with any of them, could have an adverse effect on our business, financial condition and results of operations. We are also subject to credit risk associated with customer concentration. If one or more of our largest customers were to become bankrupt or insolvent, or otherwise were unable to pay for our products, we may incur significant write-offs of accounts that may have an adverse effect on our business, financial condition and results of operations.
16
We are subject to risks related to adverse trade policies imposed against exports from the United States in certain important markets for our products.
As a U.S.-based producer, we are impacted by antidumping investigations which have had, and may continue to impose, significant antidumping duties on our products. Such duties place us at a significant competitive disadvantage in the applicable markets. In each case, we diligently evaluate our commercial and legal options to defend these investigations and their subsequent sunset reviews. Historically, we have successfully mitigated these risks through geographical mix management so that the imposition of duties does not materially affect our business results. However, such duties could have an adverse effect on the sales of key product lines and affect our business performance in the future.
There can be no assurance that, in the future, any governmental or international trade body will not institute trade policies or remedies that are adverse to exports from the United States. Any significant changes in international trade policies, practices or trade remedies, especially those instituted in our target markets or markets where our major customers are located, such as NAFTA, could potentially increase the price of our products relative to our competitors or decrease our customers’ demand for our products, which in turn may adversely affect our business, financial condition and results of operations.
We are subject to extensive environmental, health and safety laws and regulations that may result in unanticipated loss or liability, which could adversely affect our business, financial condition and results of operations.
Various federal, state, local and foreign governments regulate the discharge of materials into the environment and can impose substantial fines and criminal sanctions for violations and require installation of costly equipment or operational changes to limit emissions and/or decrease the likelihood of accidental hazardous substance releases. If we are found to be in violation of these laws or regulations, we may incur substantial costs, including fines, damages, criminal or civil sanctions and remediation costs, or experience interruptions in our operations. See “Item 1. Business - Regulation and Environmental Matters” for more information on the environmental laws and regulations to which we are subject.
Primarily because of past operations at our current manufacturing locations and other locations used in our operations as currently conducted, we may be subject to potentially material liabilities related to the remediation of environmental hazards and to claims of personal injuries or property damages that may have been or may be caused by hazardous substance releases and exposures or other hazardous conditions. Lawsuits, claims and costs involving these matters may arise in the future. In addition, changes in laws, regulations and enforcement of policies, the discovery of previously unknown contamination or other information related to individual sites, the establishment of stricter state or federal toxicity standards with respect to certain contaminants or the imposition of new clean-up requirements or remedial techniques could require us to incur additional costs in the future that would have a negative effect on our business, financial condition and results of operations.
Additionally, there are substantial uncertainties as to the nature, stringency and timing of any future regulations or changes in regulations, including greenhouse gas (“GHG”) and water nutrient regulations. More stringent regulations, especially of GHGs, may require us to make changes in our operating activities that would increase our operating costs, reduce our efficiency, limit our output, require us to make capital improvements to our facilities, increase our costs for or limit the availability of energy, raw materials or transportation or otherwise adversely affect our business, financial condition and results of operations. If enacted, more stringent GHG limitations are likely to have a significant impact on us because our production facilities emit GHGs such as carbon dioxide and nitrous oxide and because natural gas, a fossil fuel, is a primary raw material used in our production process. In addition, to the extent that GHG restrictions are not imposed in countries where our competitors operate or are less stringent than regulations that may be imposed in the United States, our competitors may have cost or other competitive advantages over us.
There is also a risk that one or more of our key raw materials or one or more of our products may be found to have, or be characterized as having, a toxicological or health-related impact on the environment or on our customers or employees, which could potentially result in us incurring liability in connection with such characterization and the associated effects of any toxicological or health-related impact. If such a discovery or characterization occurs, we may incur increased costs to comply with new regulatory requirements, or the relevant materials or products, including products of our customers that incorporate our materials or products, may be recalled or banned. Changes in laws and regulations, or their interpretations, and our customers’ perception of such changes or interpretations may also affect the marketability of certain of our products. Additionally, sales of acetone, which is a List II Chemical under TSCA, are regulated by the Drug Enforcement Act. This classification subjects us to periodic audits by the Drug Enforcement Administration and ongoing restrictions on our acetone sales activities.
Due to concerns related to terrorism, we are subject to various security laws including MTSA regulations. Our Frankford and Hopewell facilities are regulated facilities under MTSA due to the nature of our operations and the proximity of the facilities to adjacent waterways. Federal, state, local and foreign governments could implement new or impose more stringent
17
regulations affecting the security of our plants, terminals and warehouses or the transportation and use of fertilizers or other chemicals. These regulations could result in higher operating costs or limitations on the sale of our products and could result in significant unanticipated costs, lower sales and reduced profit margins. It is possible that federal, state, local and foreign governments could impose additional limitations on the use, sale or distribution of chemicals we produce and sell, thereby limiting our ability to manufacture or sell those products, or that illicit use of our products could result in liability for us.
Hazards associated with chemical manufacturing, storage and transportation could adversely affect our business, financial condition and results of operations.
There are hazards associated with chemical manufacturing and the related storage and transportation of raw materials, products and wastes. These hazards could lead to an interruption or suspension of operations and could have an adverse effect on the productivity and profitability of a particular manufacturing facility, or on us as a whole. While we endeavor to provide adequate protection for the safe handling of these materials, issues could be created by various events, including natural disasters, severe weather events, acts of sabotage and performance by third parties, and as a result, we could face potential hazards such as piping and storage tank leaks and ruptures, mechanical failure, employee exposure to hazardous substances and chemical spills and other discharges or releases of toxic or hazardous substances or gases.
These hazards may cause personal injury and loss of life, damage to property and contamination of the environment, which could lead to government fines, work stoppage injunctions, lawsuits by injured persons, damage to our public reputation and brand and diminished product acceptance. If such actions are determined to be adverse to us or there is an associated economic impact to our business, we may have inadequate insurance or cash flow to offset any associated costs. Such outcomes could adversely affect our business, financial condition and results of operations.
Our business, financial condition and results of operations could be adversely affected by litigation and other commitments and contingencies.
We face risks arising from various unasserted and asserted litigation matters, including, but not limited to, product liability and claims for third-party property damage or personal injury stemming from alleged environmental or other torts. We have noted a nationwide trend in purported class actions against chemical manufacturers generally seeking relief such as medical monitoring, property damages, off-site remediation and punitive damages arising from alleged environmental or other torts without claiming present personal injuries. We also have noted a trend in public and private nuisance suits being filed on behalf of states, counties, cities and utilities alleging harm to the general public.
Various factors or developments can lead to changes in current estimates of liabilities such as a final adverse judgment, significant settlement or changes in applicable law. An adverse outcome or unfavorable development in any one or more of these matters could be material to our financial results and could adversely impact the value of any of our brands associated with any such matters.
In the ordinary course of business, we may make certain commitments, including representations, warranties and indemnities relating to current and past operations, including those related to divested businesses, and issue guarantees of third-party obligations. Additionally, we will be required to indemnify Honeywell for amounts related to liabilities allocated to, or assumed by, us under each of the Separation and Distribution Agreement, the Employee Matters Agreement and the Tax Matters Agreement entered into in connection with the Spin-Off. If we are required to make any such payments, the payments could be significant and could exceed the amounts we have accrued with respect thereto, adversely affecting our business, financial condition and results of operations.
Any acquisition, strategic relationship, joint venture or investment could disrupt our business and harm our financial condition. Our inability to successfully acquire and integrate other businesses, assets, products or technologies or realize the financial and strategic goals that were contemplated at the time of any transaction could adversely affect our business, financial condition and results of operations.
We actively evaluate acquisitions, strategic relationships, joint ventures, collaborations, and strategic investments in businesses, products or technologies that we believe could complement or expand our business, broaden our technology and intellectual property, increase market share in our current markets or expand into adjacent markets or otherwise offer growth or cost-saving opportunities. Lack of control over the actions of our business partners in any strategic relationship, joint venture or collaboration, could significantly delay the introduction of planned products or otherwise make it difficult or impossible to realize the expected benefits of such relationship. Any transactions may be complex, time consuming and expensive, and may present numerous challenges and risks. An investment in, or acquisition of, complementary businesses, products or technologies in the future could materially decrease the amount of our available cash or require us to seek additional equity or debt financing. We may not be successful in negotiating the terms of any potential acquisition, conducting thorough due diligence, financing the acquisition or effectively integrating the acquired business, product or technology into
18
our existing business and operations. Our due diligence may fail to identify all of the problems, liabilities or other shortcomings or challenges of an acquired business, product or technology, including issues related to intellectual property, product quality or product architecture, regulatory compliance practices, revenue recognition or other accounting practices or employee or customer issues. Additionally, in connection with any acquisitions we complete, we may not achieve the synergies or other benefits we expected to achieve, and we may incur unanticipated expenses, write-downs, impairment charges or unforeseen liabilities that could negatively affect our business, financial condition and results of operations, have difficulty incorporating the acquired businesses, disrupt relationships with current and new employees, customers and vendors, incur significant debt or have to delay or not proceed with announced transactions. Further, contemplating or completing an acquisition and integrating an acquired business, product or technology could divert management and employee time and resources from other matters.
Failure to protect our intellectual property could adversely affect our business, financial condition and results of operations.
Intellectual property rights, including patents, trade secrets, confidential information, trademarks, trade names and trade dress, are important to our business. We will endeavor to protect our intellectual property rights in key jurisdictions in which our products are produced or used. However, we may be unable to obtain protection for our intellectual property in such key jurisdictions. Although we own and have applied for numerous patents and trademarks, we may have to rely on judicial enforcement of our patents and other proprietary rights. Our patents and other intellectual property rights may be challenged, invalidated, circumvented, and rendered unenforceable or otherwise compromised. If we must take legal action to protect, defend or enforce our intellectual property rights, any suits or proceedings could result in significant costs and diversion of our resources and our management’s attention, and we may not prevail in any such suits or proceedings. A failure to protect, defend or enforce our intellectual property could have an adverse effect on our business, financial condition and results of operations. Similarly, third parties may assert claims against us and our customers and distributors alleging our products infringe upon third-party intellectual property rights.
We also rely materially upon unpatented proprietary technology, know-how and other trade secrets to maintain our competitive position. While we maintain policies and internal security measures to protect our trade secrets and other intellectual property, failure to protect this intellectual property could negatively affect our future performance and growth.
We may be required to make significant cash contributions to our defined benefit pension plan.
After the Spin-Off, we sponsored a defined benefit pension plan under which certain eligible AdvanSix employees will earn pension benefits following the Spin-Off as if they remained employed by Honeywell. Significant changes in actual investment return on pension assets, discount rates, retirement rates and other factors could require cash pension contributions in future periods. Changes in discount rates and actual asset returns different from our anticipated asset returns can result in significant non-cash actuarial gains or losses. With regard to cash pension contributions, funding requirements for our pension plans are largely dependent upon interest rates, actual investment returns on pension assets and the impact of legislative or regulatory changes related to pension funding obligations. Our pension contributions may be material and could adversely impact our financial condition, cash flow and results of operations. We made pension contributions of approximately $17 million in 2017, and we plan to make pension contributions in future periods sufficient to satisfy funding requirements.
Some of our workforce is represented by labor unions and our business could be harmed in the event of a prolonged work stoppage.
Approximately 760 of our employees are unionized, which represents approximately 50% of our employee-base as of December 31, 2017. We cannot predict how stable our union relationships will be or whether we will be able to successfully negotiate successor agreements without impacting our financial condition. In addition, the presence of unions may limit our flexibility in dealing with our workforce. We may experience work stoppages, which could negatively impact our ability to manufacture our products on a timely basis and, ultimately, our business, financial condition and results of operations.
We depend on the recruitment and retention of qualified personnel, and our failure to attract and retain such personnel could adversely affect our business, financial condition and results of operations.
Due to the complex nature of our manufacturing business, our future performance is highly dependent upon the continued services of our key engineering personnel, scientists and senior management, the development of additional management personnel and the hiring of new qualified engineering, manufacturing, marketing, sales and management personnel for our operations. Competition for qualified personnel in our industry is intense, and we may not be successful in attracting or retaining qualified personnel. The loss of key employees, our inability to attract new, qualified employees or adequately train employees, or the delay in hiring key personnel, could negatively affect our business, financial condition and results of operations.
19
Cybersecurity incidents could disrupt business operations, result in the loss of critical and confidential information, and adversely impact our reputation and results of operations.
Global cybersecurity threats and incidents can range from uncoordinated individual attempts to gain unauthorized access to information technology (“IT”) systems to sophisticated and targeted measures known as advanced persistent threats, directed at AdvanSix, its plants and operations, its products, its customers and/or its third-party service providers including cloud providers. While we have experienced, and expect to continue to experience, these types of threats and incidents, none of them to date have been material to the Company. We are transitioning away from certain transition services provided by Honeywell with respect to our information technology infrastructure, including cybersecurity, which seeks to deploy comprehensive measures to deter, prevent, detect, respond and mitigate these threats including access controls, data encryption, vulnerability assessments, continuous monitoring of our IT networks and systems and maintenance of backup and protective systems. We are actively implementing such measures internally as we establish the information technology infrastructure needed to operate independently. Despite these efforts, cybersecurity incidents, depending on their nature and scope, could potentially result in the misappropriation, destruction, corruption or unavailability of critical data and confidential or proprietary information (our own or that of third parties) and the disruption of business operations. The potential consequences of a material cybersecurity incident include reputational damage, claims from and litigation with third parties, fines levied by governmental authorities, diminution in the value of our investment in research, development and engineering, and increased cybersecurity protection and remediation costs, which in turn could adversely affect our competitiveness and results of operations.
Failure to maintain effective internal controls could adversely impact our ability to meet our reporting requirements.
We are required, under the Sarbanes-Oxley Act of 2002 (the “Sarbanes-Oxley Act”), to maintain effective internal control over financial reporting and disclosure controls and procedures. This includes performing system and process evaluations and testing of our internal control over financial reporting to allow management and our independent registered public accounting firm to report on the effectiveness of our internal control over financial reporting, as required by the Sarbanes-Oxley Act, with auditor attestation of the effectiveness of our internal controls. If we are not able to comply with these requirements, or if we or our independent registered public accounting firm identify deficiencies in our internal control over financial reporting that are deemed to be material weaknesses, the market price of our common shares could decline and we could be subject to penalties or investigations by the NYSE, the SEC or other regulatory authorities, which would require additional financial and management resources.
Effective internal controls are necessary for us to provide reasonable assurance with respect to our financial reports, and to effectively prevent fraud. Internal controls over financial reporting may not prevent or detect misstatements because of inherent limitations, including the possibility of human error, the circumvention or overriding of controls, or fraud. Therefore, even effective internal controls can provide only reasonable assurance with respect to the preparation and fair presentation of financial statements. If we fail to maintain the effectiveness of our internal controls, including any failure to implement required new or improved controls, or if we experience difficulties in their implementation, our business and operating results could be harmed, we could fail to meet our reporting obligations, and there could be a material adverse effect on our stock price.
The ongoing process of implementing internal controls requires significant attention from management and we cannot be certain that these measures will ensure that we implement and maintain adequate controls over our financial processes and reporting in the future. Difficulties encountered in their implementation could harm our results of operations or cause us to fail to meet our reporting obligations. If we fail to obtain the quality of services necessary to operate effectively or incur greater costs in obtaining these services, our profitability, financial condition and results of operations may be materially and adversely affected.
Risks Relating to the Spin-Off
The Spin-Off could result in significant tax liability.
Completion of the Spin-Off was conditioned on Honeywell’s receipt of a written opinion of Cravath, Swaine & Moore LLP to the effect that the Distribution should qualify for non-recognition of gain and loss under Section 355 of the Code. The opinion of counsel did not address any U.S. state, local or foreign tax consequences of the Spin-Off. The opinion assumed that the Spin-Off was completed according to the terms of the Separation and Distribution Agreement and relied on the facts as stated in the Separation and Distribution Agreement, the Tax Matters Agreement, the other ancillary agreements, the Information Statement filed as Exhibit 99.1 to the Form 10 and a number of other documents. In addition, the opinion was based on certain representations as to factual matters from, and certain covenants by Honeywell and us. The opinion cannot be relied on if any of the assumptions, representations or covenants is incorrect, incomplete or inaccurate or is violated in any material
20
respect. The opinion of counsel is not binding on the Internal Revenue Service (“IRS”) or the courts, and there can be no assurance that the IRS or a court will not take a contrary position. Honeywell did not request a ruling from the IRS regarding the U.S. Federal income tax consequences of the Spin-Off.
If the Distribution were determined not to qualify for non-recognition of gain and loss under Section 355(e) of the Code, our U.S. stockholders could be subject to tax. In this case, each U.S. stockholder who received our common stock in the Distribution would generally be treated as having received a distribution in an amount equal to the fair market value of our common stock received, which would generally result in (1) a taxable dividend to the U.S. stockholder to the extent of that U.S. stockholder’s pro rata share of Honeywell’s current and accumulated earnings and profits; (2) a reduction in the U.S. stockholder’s basis (but not below zero) in its Honeywell common stock to the extent the amount received exceeds the stockholder’s share of Honeywell’s earnings and profits; and (3) a taxable gain from the exchange of Honeywell common stock to the extent the amount received exceeds the sum of the U.S. stockholder’s share of Honeywell’s earnings and profits and the U.S. stockholder’s basis in its Honeywell common stock. A discussion of the material U.S. federal income tax consequences of the Spin-Off can be found in the Form 10.
We could have an indemnification obligation to Honeywell if the Distribution were determined not to qualify for non-recognition treatment, which could adversely affect our business, financial condition and results of operations.
If, due to any of our representations being untrue or our covenants being breached, it were determined that the Distribution did not qualify for non-recognition of gain and loss under Section 355 of the Code, we could be required to indemnify Honeywell for the resulting taxes and related expenses. Any such indemnification obligation could adversely affect our business, financial condition and results of operations. In addition, Section 355(e) of the Code generally creates a presumption that the Distribution would be taxable to Honeywell, but not to stockholders, if we or our stockholders were to engage in transactions that result in a 50% or greater change by vote or value in the ownership of our stock during the four-year period beginning on the date that begins two years before the date of the Distribution, unless it were established that such transactions and the Distribution were not part of a plan or series of related transactions giving effect to such a change in ownership. If the Distribution were taxable to Honeywell due to such a 50% or greater change in ownership of our stock, Honeywell would recognize gain equal to the excess of the fair market value of our common stock distributed to Honeywell stockholders over Honeywell’s tax basis in our common stock and we generally would be required to indemnify Honeywell for the tax on such gain and related expenses. Any such indemnification obligation could adversely affect our business, financial condition and results of operations.
We are subject to numerous restrictions to preserve the non-recognition treatment of the Spin-Off, which may reduce our strategic and operating flexibility.
We are subject to covenants and indemnification obligations pursuant to the Tax Matters Agreement that address compliance with Section 355 of the Code and preserve the tax-free nature of the Spin-Off. These covenants include certain restrictions on our activity unless Honeywell gives its consent for us to take a restricted action, which Honeywell is permitted to grant or withhold at its sole discretion. These covenants and indemnification obligations may limit our ability to pursue strategic transactions or engage in new businesses or other transactions that may maximize the value of our business, and might discourage or delay a strategic transaction that our stockholders may consider favorable.
We have limited operating history as an independent, publicly-traded company, and our historical consolidated financial information is not necessarily representative of the results we would have achieved as an independent, publicly-traded company and may not be a reliable indicator of our future results.
We derived the historical consolidated financial information prior to the Spin-Off included in this Form 10-K from Honeywell’s consolidated financial statements, and this information does not necessarily reflect the results of operations and financial position we would have achieved as an independent, publicly-traded company during the periods presented, or those that we will achieve in the future. This is primarily because of the following factors:
• | Prior to the Spin-Off, we operated as part of Honeywell’s broader corporate organization, and Honeywell performed various corporate functions for us. Our historical consolidated financial information prior to the Spin-Off reflects allocations of corporate expenses from Honeywell for these and similar functions. These allocations may not reflect the costs we will incur for similar services in the future as an independent, publicly-traded company. |
• | We have entered into transactions with Honeywell that did not exist prior to the Spin-Off, such as Honeywell’s provision of transition and other services, which will cause us to incur new costs. See the section titled “Certain Relationships and Related Party Transactions” of the Company’s Information Statement filed as Exhibit 99.1 to the Form 10 and "Note 3 - Related Party Transactions with Honeywell" to our Consolidated Financial Statements included in this Form 10-K. |
21
• | Our historical consolidated financial information prior to the Spin-Off does not reflect changes that we expect to experience in the future as a result of our separation from Honeywell, including changes in the financing, cash management, operations, cost structure and personnel needs of our business. As part of Honeywell, there were certain benefits derived from Honeywell’s operating diversity, size, purchasing power, borrowing leverage and available capital for investments. As an independent entity, we may be unable to purchase goods, services and technologies, such as insurance and health care benefits and computer software licenses, or access capital markets on terms as favorable to us as those we obtained as part of Honeywell prior to the Spin-Off. In addition, our historical consolidated financial data does not include an allocation of interest expense comparable to the interest expense we will incur as a result of the series of internal transactions which were effected in order for us to hold, directly or through our subsidiaries, the businesses constituting Honeywell’s Resins and Chemicals business and related operations, and the Spin-Off, including interest expense in connection with the incurrence of indebtedness at AdvanSix. |
Following the Spin-Off, we are also responsible for the additional costs associated with being an independent, publicly-traded company, including costs related to corporate governance, investor and public relations and public reporting. While we have been profitable as part of Honeywell, we cannot assure you that our profits will continue at a similar level as an independent, publicly-traded company.
Risks Relating to the Indebtedness
We incurred indebtedness in connection with the Spin-Off, and our leverage could adversely affect our business, financial condition and results of operations.
In connection with the Spin-Off, we incurred indebtedness in the aggregate principal amount of approximately $270 million in the form of term loans. We also entered into a $155 million revolving facility to be available for our working capital and other cash needs. Following the Spin-Off, we are responsible for servicing our own debt and obtaining and maintaining sufficient working capital and other funds to satisfy our cash requirements.
Our ability to make payments on and to refinance our indebtedness, including the debt incurred in connection with the Spin-Off, as well as any future debt that we may incur, will depend on our ability to generate cash in the future from operations, financings or asset sales. Our ability to generate cash is subject to general economic, financial, competitive, legislative, regulatory and other factors that are beyond our control.
The terms of our indebtedness restrict our current and future operations, particularly our ability to incur debt that we may need to fund initiatives in response to changes in our business, the industries in which we operate, the economy and governmental regulations.
The terms of our indebtedness include a number of restrictive covenants that impose significant operating and financial restrictions on us and our subsidiaries and limit our ability to engage in actions that may be in our long-term best interests. These may restrict our and our subsidiaries’ ability to take some or all of the following actions:
• | Incur or guarantee additional indebtedness or sell disqualified or preferred stock; |
• | Pay dividends on, make distributions in respect of, repurchase or redeem capital stock; |
• | Make investments or acquisitions; |
• | Sell, transfer or otherwise dispose of certain assets; |
• | Create liens; |
• | Enter into sale/leaseback transactions; |
• | Enter into agreements restricting the ability to pay dividends or make other intercompany transfers; |
• | Consolidate, merge, sell or otherwise dispose of all or substantially all of our or our subsidiaries’ assets; |
• | Enter into transactions with affiliates; |
• | Prepay, repurchase or redeem certain kinds of indebtedness; |
22
• | Issue or sell stock of our subsidiaries; and/or |
• | Significantly change the nature of our business. |
As a result of all of these restrictions, we may be limited in how we conduct our business and pursue our strategy, unable to raise additional debt financing to operate during general economic or business downturns or unable to compete effectively or to take advantage of new business opportunities.
A breach of any of these covenants, if applicable, could result in an event of default under the terms of this indebtedness. If an event of default occurs, the lenders would have the right to accelerate the repayment of such debt and the event of default or acceleration may result in the acceleration of the repayment of any other debt to which a cross-default or cross-acceleration provision applies. Furthermore, the lenders of this indebtedness may require that we pledge our assets as collateral and, in the event we were unable to repay any amount of this indebtedness when due and payable, the lenders could proceed against the pledged collateral. In the event our creditors accelerate the repayment of our borrowings, we may not have sufficient assets to repay such indebtedness, which could adversely affect our business, financial condition and results of operations.
Risks Relating to Our Common Stock and the Securities Market
Our stock price may fluctuate significantly and investments in our stock could lose value.
The market price of our common stock may fluctuate widely, depending on many factors, some of which may be beyond our control, including:
• | Actual or anticipated fluctuations in our results of operations due to factors related to our business; |
• | Success or failure of our business strategies; |
• | Competition and industry capacity; |
• | Changes in interest rates and other factors that affect earnings and cash flow; |
• | Our level of indebtedness, our ability to make payments on or service our indebtedness and our ability to obtain financing as needed; |
• | Our ability to retain and recruit qualified personnel; |
• | Our quarterly or annual earnings, or those of other companies in our industry; |
• | Announcements by us or our competitors of significant acquisitions or dispositions; |
• | Changes in accounting standards, policies, guidance, interpretations or principles; |
• | Changes in earnings estimates by securities analysts or our ability to meet those estimates; |
• | The operating and stock price performance of other comparable companies; |
• | Investor perception of our company and our industry; |
• | Overall market fluctuations and volatility unrelated to our operating performance; |
• | Results from any material litigation or government investigation; |
• | Changes in laws and regulations (including tax laws and regulations) affecting our business; |
• | Changes in capital gains taxes and taxes on dividends affecting stockholders; and |
• | General economic conditions and other external factors. |
23
General or industry-specific market conditions, stock market performance or macroeconomic and geopolitical factors unrelated to our performance may also affect our stock price. For these reasons, investors should not rely on recent or historical trends to predict future stock prices, financial condition, results of operations or cash flows. Volatility in our stock price could expose us to litigation, which could result in substantial costs and the diversion of management time and resources.
We will evaluate whether to pay cash dividends on our common stock in the future, and the terms of our indebtedness will limit our ability to pay dividends on our common stock.
We will evaluate whether to pay cash dividends to our stockholders and the timing, declaration, amount and payment of future dividends to stockholders, if any, will fall within the discretion of our Board. Among the items we will consider when establishing a dividend policy will be the capital intensive nature of our business and opportunities to retain future earnings for use in the operation of our business and to fund future growth. Additionally, the terms of our indebtedness may limit our ability to pay cash dividends. There can be no assurance that we will pay a dividend in the future or continue to pay any dividend if we do commence paying dividends.
Stockholder percentage ownership in AdvanSix may be diluted in the future.
A stockholder’s percentage ownership in AdvanSix may be diluted in the future because of common stock-based equity awards that we have granted and expect to grant in the future to our directors, officers and other employees. In addition, we may issue equity as all or part of the consideration paid for acquisitions and strategic investments that we may make in the future or as necessary to finance our ongoing operations.
Certain provisions in our Amended and Restated Certificate of Incorporation and Amended and Restated By-laws and Delaware law may discourage takeovers.
Several provisions of our Amended and Restated Certificate of Incorporation, Amended and Restated By-laws and Delaware law may discourage, delay or prevent a merger or acquisition that is opposed by our Board. These include, among others, provisions that:
• | Provide for staggered terms for directors on our Board through our 2020 annual meeting of stockholders; |
• | Do not permit our stockholders to act by written consent and require that stockholder action must take place at an annual or special meeting of our stockholders; |
• | Establish advance notice requirements for stockholder nominations and proposals; |
• | Limit the persons who may call special meetings of stockholders; and |
• | Limit our ability to enter into business combination transactions with certain stockholders. |
These and other provisions of our Amended and Restated Certificate of Incorporation, Amended and Restated By-laws and Delaware law may discourage, delay or prevent certain types of transactions involving an actual or a threatened acquisition or change in control of AdvanSix, including unsolicited takeover attempts, even though the transaction may offer our stockholders the opportunity to sell their shares of our common stock at a price above the prevailing market price.
Our Amended and Restated Certificate of Incorporation designates the courts of the State of Delaware as the sole and exclusive forum for certain types of actions and proceedings that may be initiated by our stockholders, which could limit our stockholders’ ability to obtain a favorable judicial forum for disputes with us or our directors, officers or other employees.
Our Amended and Restated Certificate of Incorporation provides, unless we consent in writing to the selection of an alternative forum, the Court of Chancery located within the State of Delaware is the sole and exclusive forum for any derivative action or proceeding brought on behalf of AdvanSix, any action asserting a claim of breach of a fiduciary duty owed by any director, officer or other employee or stockholder of AdvanSix to AdvanSix or AdvanSix’s stockholders, any action asserting a claim arising pursuant to the Delaware General Corporate Law (“DGCL”) or as to which the DGCL confers jurisdiction on the Court of Chancery located in the State of Delaware or any action asserting a claim governed by the internal affairs doctrine. However, if the Court of Chancery within the State of Delaware does not have jurisdiction, the action may be brought in any other state or federal court located within the State of Delaware. Any person or entity purchasing or otherwise acquiring or holding any interest in shares of our capital stock will be deemed to have notice of and to have consented to these provisions. This provision may limit a stockholder’s ability to bring a claim in a judicial forum that it finds favorable for disputes with us or our directors, officers or other employees, which may discourage such lawsuits. Alternatively, if a court were to find this provision
24
of our Amended and Restated Certificate of Incorporation inapplicable to, or unenforceable in respect of, one or more of the specified types of actions or proceedings, we may incur additional costs associated with resolving such matters in other jurisdictions.
Item 1B. Unresolved Staff Comments
None.
Item 2. Properties
Effective February 1, 2017, our principal executive offices are located at 300 Kimball Drive, Suite 101, Parsippany, NJ 07054. Prior to February 1, 2017, our principal executive offices were located at 115 Tabor Road, Morris Plains, NJ 07950. We also own three production facilities located in Frankford, Pennsylvania, Chesterfield, Virginia and Hopewell, Virginia. In addition, we lease space at Honeywell’s facility in Pottsville, Pennsylvania and its R&D center in Colonial Heights, Virginia. Honeywell leases space in our Chesterfield, Virginia manufacturing site. We have entered into one or more site sharing and services agreements and transition agreements with Honeywell under which we and Honeywell will allow each other to use these shared R&D facilities and manufacturing sites for specified fees.
We consider the manufacturing facilities and technology centers and the other properties that we own or lease to be in good condition and generally suitable for the purposes for which they are used. Our manufacturing facilities are maintained through ongoing capital investments, regular maintenance and equipment upgrades. We believe our facilities are adequate for our current operations.
Item 3. Legal Proceedings
From time to time, we are involved in litigation relating to claims arising out of the ordinary course of our business operations. We are not a party to, and, to our knowledge, there are no threats of any claims or actions against us, the ultimate disposition of which would have a material adverse effect on our consolidated financial position, results of operations or liquidity.
Environmental Matters Involving Potential Monetary Sanctions in Excess of $100,000
The United States Environmental Protection Agency (“EPA”) notified the Company in December 2016 that alleged violations, involving the enhanced leak detection and repair program and emission testing requirements, at the Company’s manufacturing facility in Hopewell, Virginia, potentially may subject the Company to stipulated penalties under the 2013 consent decree among the Company, the U.S. and the Commonwealth of Virginia. The Company has discussed this matter with the EPA and negotiations to resolve it are ongoing. Although the outcome of the matter cannot be predicted with certainty, we do not believe that it will have a material adverse effect on our consolidated financial position, results of operations or operating cash flows.
Item 4. Mine Safety Disclosures
Not applicable.
25
PART II.
Item 5. Market for Registrant’s Common Equity, Related Stockholder Matters and Issuer Purchases of Equity Securities
Our common stock is traded on the New York Stock Exchange under the symbol “ASIX”. On February 1, 2018, there were 34,394 holders of record of our common stock and the closing price of our common stock on the New York Stock Exchange was $40.28 per share.
As of February 1, 2018, 30,482,966 shares of our common stock and 0 shares of our preferred stock were outstanding.
As described in Item 1, on October 1, 2016, Honeywell completed the previously announced separation of AdvanSix Inc. Following the Spin-Off, our authorized capital stock consisted of 200,000,000 shares of common stock, par value $0.01 per share, and 50,000,000 shares of preferred stock, par value $0.01 per share. The Spin-Off is further described in Note 1 to the Consolidated Financial Statements included in Item 8 of this Form 10-K.
The following table sets forth the high and low market prices of our common stock for the quarterly periods indicated since the first day of “regular-way” trading on the New York Stock Exchange on October 3, 2016:
Market Prices | |||||||
2017 | Low | High | |||||
Quarter ended December 31, 2017 | $ | 39.28 | $ | 46.51 | |||
Quarter ended September 30, 2017 | $ | 29.55 | $ | 40.34 | |||
Quarter ended June 30, 2017 | $ | 24.72 | $ | 33.67 | |||
Quarter ended March 31, 2017 | $ | 20.88 | $ | 30.21 | |||
2016 | |||||||
Quarter ended December 31, 2016 | $ | 13.70 | $ | 23.35 | |||
Dividends
We evaluate the payment of cash dividends to our stockholders and the timing, declaration, amount and payment of future dividends to stockholders, if any, will fall within the discretion of our Board. Holders of shares of our common stock will be entitled to receive dividends when and if declared by our Board at its discretion out of funds legally available for that purpose, subject to the preferential rights of any preferred stock that may be outstanding. The timing, declaration, amount and payment of the future dividends will depend on our financial condition, earnings, capital requirements and debt service obligations, as well as legal requirements, regulatory constraints, industry practice and other factors that our Board deems relevant.
We did not declare or pay any dividends during the year ended December 31, 2017 or during the fourth quarter of 2016.
Performance Graph
The following graph compares the cumulative total stockholder return on the Company’s common stock to the total returns on the Standard & Poor’s (S&P) Small Cap 600 Stock Index and the S&P Small Cap 600 Chemicals Index. The changes for the periods shown in the graph assume that $100 had been invested in AdvanSix stock and each index on October 3, 2016, the date that AdvanSix common stock began “regular-way” trading on the New York Stock Exchange, and that all dividends, if any, were reinvested. The share price performance in the graph is not necessarily indicative of future price performance.
26
COMPARISON OF CUMULATIVE TOTAL RETURN
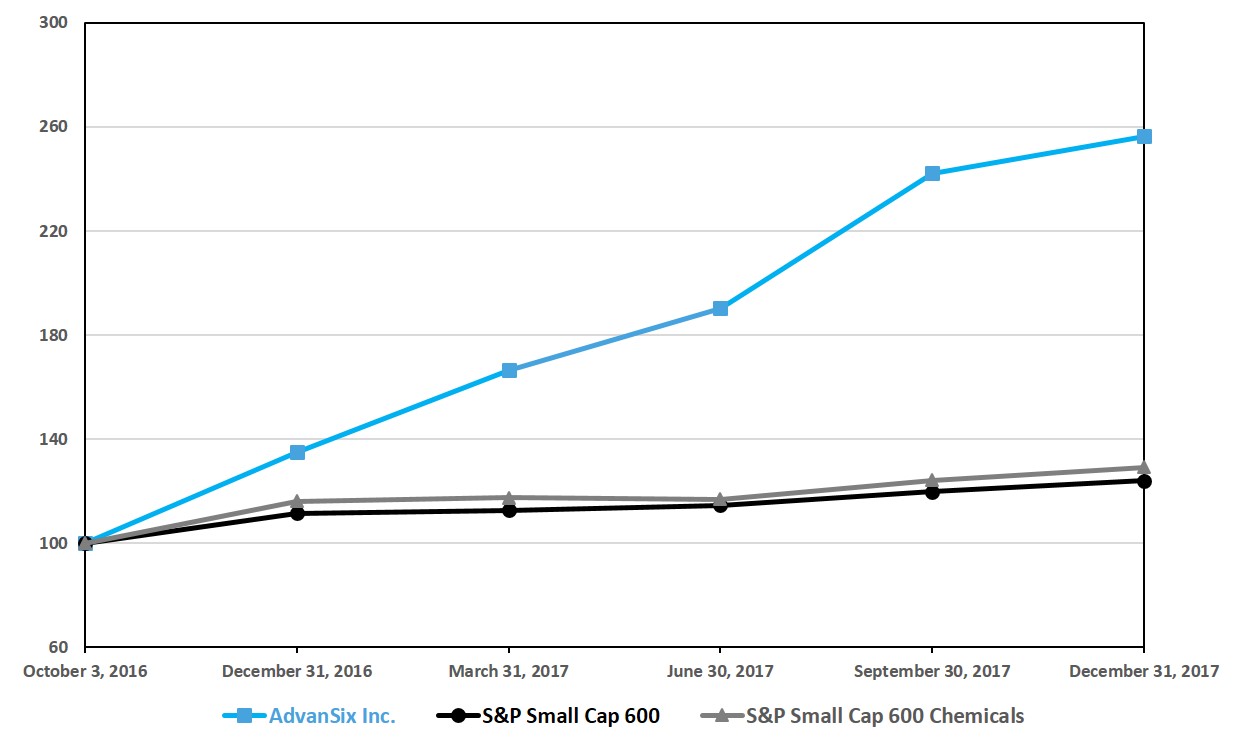
October 3, 2016 | December 31, 2016 | March 31, 2017 | June 30, 2017 | September 30, 2017 | December 31, 2017 | |
AdvanSix Inc. | 100 | 135 | 166 | 190 | 242 | 256 |
S&P Small Cap 600 | 100 | 112 | 113 | 115 | 121 | 126 |
S&P Small Cap 600 Chemicals | 100 | 116 | 117 | 117 | 126 | 131 |
Item 6. Selected Financial Data
Selected Historical Consolidated Financial Data
The following tables present certain selected historical consolidated financial information as of and for each of the years in the five-year period ended December 31, 2017. The selected historical consolidated financial data as of and for the years ended December 31, 2017, 2016, 2015, 2014 and 2013 are derived from our historical audited Consolidated Financial Statements. The selected historical data related to the balance sheet information for December 31, 2017 and 2016 and the statement of operations information for the years ended December 31, 2017, 2016 and 2015 are included in this Form 10-K. The selected historical data related to the balance sheet information for December 31, 2015, 2014 and 2013 and statement of operations information for the years ended December 31, 2014 and 2013 are not included in this Form 10-K.
The selected historical consolidated financial data presented below should be read in conjunction with “Management’s Discussion and Analysis of Financial Condition and Results of Operations” and our historical Consolidated Financial Statements and the accompanying Notes thereto included elsewhere in this Annual Report. For the periods presented, our business was wholly owned by Honeywell through October 1, 2016. The financial information included herein may not necessarily reflect our financial position, results of operations and cash flows in the future or what our financial position, results of operations and cash flows would have been had we been an independent, publicly-traded company during the periods presented prior to October 1, 2016. In addition, our historical consolidated financial information does not reflect changes as a result of our separation from Honeywell, including changes in the financing, operations, cost structure and personnel needs of our business. Further, the historical consolidated financial information includes allocations of certain Honeywell corporate expenses, as described in “Note 3 – Related Party Transactions with Honeywell” to the historical Consolidated Financial Statements. We believe the assumptions and methodologies underlying the allocation of these
27
expenses are reasonable. However, such expenses may not be indicative of the actual level of expenses that we would have incurred if we had operated as an independent, publicly-traded company or of the costs expected to be incurred in the future.
Year Ended December 31, | |||||||||||||||||||
Selected Statement of Operations Information (Dollars in thousands): | 2017 | 2016 | 2015 | 2014 | 2013 | ||||||||||||||
Sales | $ | 1,475,194 | $ | 1,191,524 | $ | 1,329,409 | $ | 1,790,372 | $ | 1,766,586 | |||||||||
Net Income | 146,699 | 34,147 | 63,776 | 83,858 | 118,746 | ||||||||||||||
As of December 31, | |||||||||||||||||||
Selected Balance Sheet Information (Dollars in thousands): | 2017 | 2016 | 2015 | 2014 | 2013 | ||||||||||||||
Total assets | $ | 1,050,274 | $ | 904,957 | $ | 840,986 | $ | 823,048 | $ | 733,981 | |||||||||
Total liabilities | 673,949 | 689,595 | 361,916 | 406,293 | 313,407 | ||||||||||||||
Total equity | 376,325 | 215,362 | 479,070 | 416,755 | 420,574 | ||||||||||||||
Earnings Per Common Share (a) | |||||||||||||||||||
Basic: | $ | 4.81 | $ | 1.12 | $ | 2.09 | $ | 2.75 | $ | 3.90 | |||||||||
Diluted: | 4.72 | 1.12 | 2.09 | 2.75 | 3.90 | ||||||||||||||
Weighted average common shares (a) | |||||||||||||||||||
Basic: | 30,482,966 | 30,482,966 | 30,482,966 | 30,482,966 | 30,482,966 | ||||||||||||||
Diluted: | 31,091,601 | 30,503,587 | 30,482,966 | 30,482,966 | 30,482,966 | ||||||||||||||
(a) | On October 1, 2016, the date of consummation of the Spin-Off, 30,482,966 shares of the Company’s common stock were distributed to Honeywell stockholders of record as of September 16, 2016. Basic and Diluted EPS for all periods prior to the Spin-Off reflect the number of distributed shares, or 30,482,966 shares. These shares were treated as issued and outstanding from January 1, 2013 for purposes of calculating historical basic earnings per share. No dividends have been paid by the Company from October 1, 2016 through December 31, 2017. |
Item 7. Management’s Discussion and Analysis of Financial Condition and Results of Operations
(Dollars in thousands, except per share data or unless otherwise noted)
The following Management’s Discussion and Analysis of the Company’s financial condition and results of operations discussion, which we refer to as our “MD&A,” should be read in conjunction with the Consolidated Financial Statements and the notes thereto contained in this Form 10-K.
Separation from Honeywell
On October 1, 2016, Honeywell International Inc. (“Honeywell”) completed the previously announced separation of AdvanSix Inc. The separation was completed by Honeywell distributing all of the then outstanding shares of common stock of AdvanSix on October 1, 2016 (the “Distribution Date”) through a dividend in kind of AdvanSix common stock, par value $0.01, to holders of Honeywell common stock as of the close of business on the record date of September 16, 2016 who held their shares through the Distribution Date (the “Spin-Off”). Each Honeywell stockholder who held their shares through the Distribution Date received one share of AdvanSix common stock for every 25 shares of Honeywell common stock held at the close of business on the record date of September 16, 2016. We filed our Form 10 describing the Spin-Off with the Securities and Exchange Commission (the “SEC”), which was declared effective by the SEC on September 8, 2016 (the “Form 10”). On October 3, 2016, AdvanSix stock began “regular-way” trading on the New York Stock Exchange under the “ASIX” stock symbol. The spin-off is further described in Note 1 to the Consolidated Financial Statements included in Item 8.
Business Overview
We produce and sell our Nylon 6 resin and caprolactam as commodity products, and also produce and sell our Nylon 6 resin as a specialized resin product. The production of these products is capital intensive, requiring ongoing investments to increase production capacity as well as investments to improve plant reliability and the quality of our products. Our results of operations
28
are primarily driven by production volume and the spread between the sales prices of our products and the costs of the underlying raw materials built into the market-based pricing models for most of our products. The global prices for nylon resin typically track a spread over the price of caprolactam, which in turn tracks as a spread over benzene because the key feedstock materials for caprolactam, phenol or cyclohexane, are derived from benzene. This price spread has historically experienced cyclicality as a result of global changes in supply and demand. Generally, Nylon 6 resin prices track the cyclicality of caprolactam prices, although prices set above the spread are achievable when nylon resin manufacturers like AdvanSix formulate and produce specialized nylon resin products. Our specialized Nylon 6 products are typically valued at a higher level than commodity resin products.
In recent years, nylon and caprolactam prices have experienced a cyclical period of downturn as the global market has experienced large increases in supply without a commensurate increase in demand. Most of this supply increase has been built by new Chinese manufacturers, resulting in margin compression for Nylon 6 resin and caprolactam in recent years to historic lows. Over the last year, capacity reductions by our competitors have occurred in North America and Europe improving supply/demand fundamentals in North America with continued dynamic conditions globally. We believe that, in addition to a potential recovery that has historically followed periods of oversupply and declining prices, Nylon 6 end-market growth will continue to generally track global GDP with certain applications growing at faster rates including engineered plastics and packaging. Additionally, one of our strategies is to continue developing specialty nylon and copolymer products that we believe will generate higher margins.
Our ammonium sulfate is used by customers as a fertilizer containing nitrogen and sulfur, two key crop nutrients. Global prices for ammonium sulfate fertilizer are influenced by several factors including the price of urea, which is the most widely used source of nitrogen-based fertilizer in the world. Another global factor driving demand for ammonium sulfate fertilizer is general agriculture trends, including the price of crops. We expect agriculture fundamentals to remain challenging through the 2018 planting season.
We produce ammonium sulfate fertilizer continuously throughout the year as part of our manufacturing process, but sales experience quarterly cyclicality based on the timing and length of the growing seasons in North and South America. Due to the ammonium sulfate fertilizer sales cycle, we occasionally build up higher inventory balances because our production is continuous and not tied to seasonal demand for fertilizers. Sales of most of our other products have generally been subject to minimal, or no, seasonality.
We seek to run our production facilities on a nearly continuous basis for maximum efficiency and several of our intermediate products are key feedstock materials for other products in our integrated manufacturing chain. We schedule several planned outages each year to conduct routine and major maintenance across our facilities, which are referred to as plant turnarounds. While we may experience unplanned interruptions from time to time, we seek to mitigate the risk through regularly scheduled maintenance both for major and minor repairs at all of our production facilities. We also utilize maintenance excellence and mechanical integrity programs and maintain appropriate buffer inventory of intermediate chemicals necessary for our manufacturing process, which are intended to mitigate the extent of any production losses as a result of planned and unplanned downtime.
While our integrated manufacturing, scale and the quantity and range of our product offerings make us one of the most efficient manufacturers in our industry, we are also exposed to increased risk associated with unplanned downtime or material disruptions at any one of our production facilities which could impact our supply chain to downstream plants in our manufacturing process. Unplanned outages may occur and we may not have enough intermediate chemical inventory at any given time to offset such production losses. Moreover, taking our production facilities offline for regularly scheduled repairs can be an expensive and time-consuming operation with risk that discoverable items and delays during the repair process may cause unplanned downtime as well. For a description of our principal risks, see “Risk Factors" in Item 1A.
Recent Developments
In January 2018, as previously announced, the Company experienced a temporary production issue at its Hopewell, Virginia facility related to severe winter weather. As a result of this unplanned interruption, caprolactam and resin production were reduced at our Hopewell and Chesterfield, Virginia manufacturing facilities. The Company expects to incur an approximately $30 million unfavorable impact to pre-tax income in the first quarter of 2018, including the unfavorable impact of fixed cost absorption, lost sales, maintenance expense and incremental raw material costs. The Company informed its customers of this force majeure event and acted to mitigate the impact of the reduced output on its customers’ operations. The unplanned interruption had no adverse impact on fourth quarter 2017 financial results.
29
On February 21, 2018 (the “Closing Date”), the Company and its lenders amended the Credit Agreement to provide the Company with additional operating flexibility and lower borrowing costs. Under the amended Credit Agreement, the Company has a single $425 million revolving credit facility which replaces the former $270 million term loan and $155 million revolving credit facility. On the Closing Date, the Company borrowed $242 million in loans under the revolving credit facility, and the proceeds of such loans were used to repay the outstanding term loan facility. For a discussion of the amendment to the Credit Agreement, please refer to Note 18. "Subsequent Events."
2016 Operational Events
On December 8, 2016, the Company announced that it experienced a temporary outage at its Hopewell, Virginia facility reducing caprolactam production and a resulting reduction in resin production at its downstream Chesterfield, Virginia polymerization plant. The Company had previously resumed operations on November 21, 2016 following additional, unplanned maintenance related to the extensive planned fourth quarter 2016 turnaround activities. Under normal conditions, buffer inventories through the supply chain mitigate the impact of temporary production disruptions on customers. Due to the timing of this disruption relative to the November 21 startup, where inventories were depleted by incremental downtime, buffer inventories through the supply chain were insufficient to offset the temporary outage.
On October 31, 2016, the Company announced that the planned fourth quarter 2016 turnaround activities would be extended due to additional, unplanned maintenance of its ammonia plant within its Hopewell, Virginia facility. The extensive planned turnaround activities, which were coordinated across numerous operating units within the Company’s Frankford, Hopewell and Chesterfield sites, began in early October. The ammonia plant turnaround began on October 17, 2016 and was planned to last for 20 days but continued for an additional two weeks to address the significant inspection findings regarding a code regulated pressure vessel. The Company worked with its customers and suppliers to mitigate the impact of the extended turnaround.
Consolidated Results of Operations for the Years Ended December 31, 2017, 2016 and 2015
(Dollars in thousands)
Sales
2017 | 2016 | 2015 | |||||||||
Sales | $ | 1,475,194 | $ | 1,191,524 | $ | 1,329,409 | |||||
% change compared with prior period | 23.8 | % | (10.4 | )% | (25.7 | )% | |||||
The change in sales is attributable to the following:
2017 versus 2016 | 2016 versus 2015 | ||||
Volume | 8.5 | % | (1.2 | )% | |
Price | 15.3 | % | (9.2 | )% | |
23.8 | % | (10.4 | )% | ||
2017 compared with 2016
Sales increased in 2017 compared to 2016 by $283.7 million, or approximately 24%, due primarily to higher sales prices (approximately 15%) and volume increases (approximately 9%) of chemical intermediates, caprolactam, ammonium sulfate and nylon. Sales prices increased due primarily to (i) higher prices of the raw materials, particularly benzene and propylene, used to manufacture nylon, caprolactam and chemical intermediates impacting formula-based pass-through pricing (approximately 12% favorable impact), and (ii) market-based pricing due primarily to improved industry conditions in nylon, caprolactam and chemical intermediates offset partially by lower prices of ammonium sulfate (approximately 3% favorable impact). Volume increased in 2017 due to improved plant production and the impacts of unplanned outages in the fourth quarter of 2016 discussed above.
2016 compared with 2015
Sales decreased in 2016 compared to 2015 by $137.9 million, or approximately 10%, due primarily to lower sales prices (9%) and lower volumes (1%) of caprolactam and nylon, and ammonium sulfate, partially offset by volume increases in chemical intermediates. Sales prices decreased due primarily to (i) lower prices of the raw materials used to manufacture
30
our intermediate chemicals, caprolactam and nylon impacting formula based pass-through pricing (approximately 4% impact), (ii) the impact of unfavorable industry conditions for nitrogen fertilizers on ammonium sulfate pricing (approximately 3% impact) and (iii) market based pricing pressure in the caprolactam and nylon end-markets (approximately 2% impact). Volumes decreased year over year due primarily to the extended outage activity in the fourth quarter of 2016 discussed above partially offset by year over year increased volumes from the first three quarters of 2016 due to improved production rates at our manufacturing locations.
Cost of Goods Sold
2017 | 2016 | 2015 | |||||||||
Cost of goods sold | $ | 1,249,014 | $ | 1,083,894 | $ | 1,179,651 | |||||
% change compared with prior period | 15.2 | % | (8.1 | )% | (26.6 | )% | |||||
Gross margin % | 15.3 | % | 9.0 | % | 11.3 | % | |||||
2017 compared with 2016
Costs of goods sold increased in 2017 compared to 2016 by $165.1 million, or approximately 15%, due primarily to higher prices of raw materials (approximately 14%), particularly benzene and propylene, and a one-time prior year benefit related to the termination of a long-term supply agreement in the three months ended March 31, 2016 (approximately 1% unfavorable).
Gross margin percentage increased by approximately 6% in 2017 compared to 2016 due primarily to higher sales and production volumes on a year-over-year basis (approximately 6%) offset partially by the termination of a long-term supply agreement in 2016 (approximately 1%).
2016 compared with 2015
Costs of goods sold decreased in 2016 compared to 2015 by $95.8 million, or approximately 8%, due primarily to (i) lower prices of raw materials (approximately 8%), (ii) lower costs due to the volume reductions discussed above (approximately 1%), and (iii) the termination of a long-term supply agreement in the first quarter of 2016 (approximately 1%) partially offset by the costs associated with the impact of the unplanned and extended plant turnarounds in the fourth quarter of 2016 (approximately 1%). Prices of raw materials decreased due primarily to cumene (approximately 4%), sulfur (approximately 2%) and natural gas (approximately 1% impact).
Gross margin percentage decreased by approximately 2% in 2016 compared to 2015 due primarily to (i) the net impact of sales pricing over raw material costs (approximately 2% unfavorable impact) and (ii) the impact of higher plant costs primarily associated with the unplanned and extended outages in the fourth quarter of 2016 described above (approximately 1%) partially offset from the benefits from the termination of a long-term supply agreement (approximately 1% favorable impact).
Selling, General and Administrative Expenses
2017 | 2016 | 2015 | |||||||||
Selling, general and administrative expense | $ | 72,815 | $ | 53,753 | $ | 52,398 | |||||
% of sales | 4.9 | % | 4.5 | % | 3.9 | % | |||||
Selling, general and administrative expenses increased in 2017 compared to 2016 by $19.1 million or approximately 35% due primarily to higher stand-alone costs incurred since the Spin-Off on October 1, 2016. These stand-alone costs are related primarily to workforce and other infrastructure including costs for transition services provided by Honeywell which were partially offset by the elimination of costs allocated in the prior year to the Company from Honeywell on the basis of sales. The incremental one-time and ongoing stand-alone costs to operate our business as an independent public company remain in line with the Company’s expectations as previously disclosed in our Form 10 filed with the SEC and are expected to exceed the historical allocations of expenses from Honeywell.
Changes in the Selling, general and administrative expenses were not significant when comparing 2016 with 2015.
31
Other Non-operating Expense (Income), Net
2017 | 2016 | 2015 | |||||||||
Other non-operating expense (income), net | $ | 8,733 | $ | 102 | $ | (2,877 | ) | ||||
The increase in Other non-operating expense (income), net in 2017 compared to 2016 was due primarily to higher interest expense for the full year in 2017 versus interest expense for only the fourth quarter in 2016 occurring in conjunction with the establishment of debt associated with the Spin-Off. For additional discussion of long-term debt, see “Note 9. Long-term Debt and Credit Agreement” in the Notes accompanying the audited Consolidated Financial Statements.
Changes in the Other non-operating expense (income), net were not material when comparing 2016 with 2015.
Income Tax Expense (Benefit)
2017 | 2016 | 2015 | |||||||||
Income tax expense (benefit) | $ | (2,067 | ) | $ | 19,628 | $ | 36,461 | ||||
Effective tax rate | (1.4 | )% | 36.5 | % | 36.4 | % | |||||
On December 22, 2017 the U.S. government enacted significant changes to federal tax law following the passage of the Tax Cuts and Jobs Act (the “2017 Act”). The 2017 Act significantly changes the U.S. corporate tax system. The Company has reasonably estimated the accounting for the effects of the 2017 Act during the year ended December 31, 2017. Our financial statements for the year ended December 31, 2017 reflect certain effects of the 2017 Act including a reduction in the corporate tax rate to 21% from 35% and changes made to executive compensation rules. As a result of these changes to tax laws and tax rates under the 2017 Act, the Company incurred a reduction in income tax expense of $53,424 primarily related to the reduction in the federal corporate tax rate to 21% during the year ended December 31, 2017.
The Company's income tax benefit for 2017 was $2,067. In the absence of the changes in the 2017 Act, tax expense for 2017 would have been $51,357.
Given the significant changes resulting from and complexities associated with the 2017 Act, the financial impacts for the fourth-quarter and full-year 2017 as well as the estimated impact on the 2018 effective tax rate are provisional and subject to further analysis, interpretation and clarification of the 2017 Act, which could result in changes to these estimates during 2018. The Company will reflect any adjustments to the provisional amounts within one year from the enactment date of the 2017 Act, if applicable.
The Company’s effective income tax rate for 2017 was lower compared to the U.S. Federal statutory rate of 35% due primarily to the enactment of the 2017 Act and the related remeasurement of deferred tax assets and liabilities. The Company also intends to make certain state tax apportionment elections in 2017 which results in a state income tax rate change that is expected to lower the Company’s overall state tax liability dependent upon the Company achieving minimum employment thresholds in tax years 2017 to 2019.
The Company’s effective income tax rates in 2016 and 2015 were higher compared to the U.S. Federal statutory tax rate of 35% due primarily to state taxes and, to a lesser extent, losses incurred in foreign jurisdictions with rates lower than the U.S. Federal statutory rate, partially offset by the federal tax credit for research activities and the U.S. manufacturing incentive credits.
For 2018, the Company expects an effective tax rate (including federal, state and foreign taxes) of approximately 25%. In the absence of the 2017 Act, the Company would have expected a 2018 overall effective tax rate of approximately 38%.
During the third and fourth quarters of 2017, the Company adjusted its deferred tax assets and liabilities to account for changes to the September 30, 2016 deferred tax balances related to the separation from Honeywell. The changes were attributable to the completion of Honeywell’s 2016 income tax return and related return to provision adjustment. The adjustment resulted in a $12.5 million decrease in Deferred income taxes and an increase in Additional paid in capital.
For 2017, 2016 and 2015, there were no unrecognized tax benefits recorded by the Company. Although there are no unrecognized income tax benefits, when applicable, the Company’s policy is to report interest expense related to unrecognized income tax benefits in the income tax provision.
32
For additional discussion of income taxes and the effective income tax rate, see “Note 4 – Income Taxes” in the Notes accompanying the audited Consolidated Financial Statements.
Net Income
2017 | 2016 | 2015 | |||||||||
Net income | $ | 146,699 | $ | 34,147 | $ | 63,776 | |||||
2017 compared with 2016
As a result of the factors described above, net income was $146.7 million in 2017 as compared to $34.1 million in 2016.
2016 compared with 2015
As a result of the factors described above, net income was $34.1 million in 2016 as compared to $63.8 million in 2015.
Non-GAAP Measures
The following tables set forth the non-GAAP financial measures of EBITDA and EBITDA margin. EBITDA is defined as Net Income before Interest, Income Taxes, Depreciation and Amortization. EBITDA margin is equal to EBITDA divided by Sales. The Company believes these non-GAAP financial measures provide meaningful supplemental information as they are used by the Company’s management to evaluate the Company’s operating performance, enhance a reader’s understanding of the financial performance of the Company, and facilitate a better comparison among fiscal periods and performance relative to its competitors, as the non-GAAP measures exclude items that are not considered part of the Company’s ongoing operations.
These non-GAAP results are presented for supplemental informational purposes only and should not be considered a substitute for the financial information presented in accordance with GAAP. Non-GAAP financial measures should be read only in conjunction with the comparable GAAP financial measures. The Company’s non-GAAP measures may not be comparable to other companies’ non-GAAP measures.
The following is a reconciliation between the non-GAAP financial measures of EBITDA and EBITDA margin to their most directly comparable GAAP financial measure:
(Dollars in thousands, except per share amounts or unless otherwise noted)
Years Ended December 31, | ||||||||||||
2017 | 2016 | 2015 | ||||||||||
Net income | $ | 146,699 | $ | 34,147 | $ | 63,776 | ||||||
Interest expense, net | 7,716 | 1,847 | — | |||||||||
Income tax expense (benefit) | (2,067 | ) | 19,628 | 36,461 | ||||||||
Depreciation and amortization | 48,455 | 40,329 | 36,410 | |||||||||
EBITDA (non-GAAP) | 200,803 | 95,951 | 136,647 | |||||||||
Prior-year one-time benefit (1) | — | 15,500 | — | |||||||||
EBITDA excluding prior-year one-time benefit (non-GAAP) | $ | 200,803 | $ | 80,451 | $ | 136,647 | ||||||
Sales | $ | 1,475,194 | $ | 1,191,524 | $ | 1,329,409 | ||||||
EBITDA margin % (non-GAAP) | 13.6 | % | 8.1 | % | 10.3 | % | ||||||
EBITDA margin % excluding prior year one-time benefit (non-GAAP) | 13.6 | % | 6.8 | % | 10.3 | % | ||||||
(1) Reflects a $15.5 million one-time benefit recognized in the first quarter of 2016 related to the termination of a long-term supply agreement.
33
The following are reconciliations between the non-GAAP financial measure of Net Income and EPS excluding the one-time net tax benefit to its most directly comparable GAAP financial measure of Net Income and EPS:
Years Ended December 31, | |||||||||||
2017 | 2016 | 2015 | |||||||||
Net Income | $ | 146,699 | $ | 34,147 | $ | 63,776 | |||||
One-time net tax benefit (2) | (53,424 | ) | — | — | |||||||
Net Income excluding one-time net tax benefit | $ | 93,275 | $ | 34,147 | $ | 63,776 | |||||
Years Ended December 31, | |||||||||||
2017 | 2016 | 2015 | |||||||||
Basic | |||||||||||
EPS | $ | 4.81 | $ | 1.12 | $ | 2.09 | |||||
One-time net tax benefit (2) | (1.75 | ) | — | — | |||||||
EPS excluding one-time net tax benefit | $ | 3.06 | $ | 1.12 | $ | 2.09 | |||||
Years Ended December 31, | |||||||||||
2017 | 2016 | 2015 | |||||||||
Diluted | |||||||||||
EPS | $ | 4.72 | $ | 1.12 | $ | 2.09 | |||||
One-time net tax benefit (2) | (1.72 | ) | — | — | |||||||
EPS excluding one-time net tax benefit | $ | 3.00 | $ | 1.12 | $ | 2.09 | |||||
(2) Reflects a $53,424 one-time net tax benefit recognized in the fourth quarter of 2017 related to the 2017 Act, which was signed and enacted effective December 22, 2017. The 2017 Act reduces the federal corporate tax rate to 21% from 35% for tax years beginning after December 31, 2017.
Liquidity and Capital Resources
Liquidity
We believe that cash balances and operating cash flows, together with available capacity under our credit agreement, will provide adequate funds to support our current annual operating and longer term strategic plans, subject to the risks and uncertainties outlined below and in the risk factors as previously disclosed in in Item 1A. Our principal source of liquidity is our cash flow generated from operating activities, which is expected to provide us with the ability to meet the majority of our short-term funding requirements. Our operating cash flows are affected by capital requirements and production volume as well as the prices of our raw materials and general economic and industry trends. We utilize a trade receivables discount arrangement with a third party financial institution which enhances liquidity and enables us to efficiently manage our working capital needs. In addition, we monitor the third-party depository institutions that hold our cash and cash equivalents. Our emphasis is primarily on safety of principal and secondarily on maximizing yield on those funds. We diversify our cash and cash equivalents among counterparties to minimize exposure to any one of these entities.
On a recurring basis, our primary future cash needs will be centered on operating activities, working capital, capital expenditures including high return growth and cost savings investments, environmental compliance costs, employee benefit obligations, interest payments, debt repayment and strategic acquisitions. We believe that our future cash from operations, together with our access to funds on hand and credit and capital markets, will provide adequate resources to fund our expected operating and financing needs. Our ability to fund our capital needs, however, will depend on our ongoing ability to generate cash from operations and access to credit and capital markets, which are subject to the risk factors previously disclosed in Item 1A as well as general economic, financial, competitive, regulatory and other factors that are beyond our control.
34
We assumed from Honeywell all health, safety and environmental (“HSE”) liabilities and compliance obligations related to the past and future operations of our business, as well as all HSE liabilities associated with our three owned manufacturing locations and the other locations used in our current operations, including any cleanup or other liabilities related to any contamination that may have occurred at such locations in the past. Honeywell retained all HSE liabilities related to former business locations or the operation of our former businesses. Although we have ongoing environmental remedial obligations at certain of our facilities, in the past three years, our remediation costs have not been material, and we do not expect our remediation costs to address known obligations to be material for 2018.
The Company made contributions to the defined benefit pension plan of $2.2 million in the first quarter of 2017, $1.6 million in the second quarter of 2017, $11.0 million in the third quarter of 2017 and $2.0 million in the fourth quarter of 2017 for a total of $16.8 million in full year 2017. The Company plans to make pension plan contributions during 2018 sufficient to satisfy pension funding requirements of approximately $8 to $10 million. The Company made a $2.0 million contribution in January 2018 and plans to make additional contributions in future years sufficient to satisfy pension funding requirements in those periods.
The Company made contributions to the defined contribution plan of $5.4 million for the year ended December 31, 2017.
We expect that our primary cash requirements for 2018 will be to fund our on-going operations, costs associated with planned plant outages, capital expenditures, pension benefit obligations and the amounts related to contractual obligations noted in the tables below. See the items noted below in “Contractual Obligations” and “Capital Expenditures” for more information.
Credit Agreement
On September 30, 2016, under the Credit Agreement, we incurred indebtedness in the aggregate principal amount of approximately $270.0 million in the form of a term loan, the net proceeds of which were distributed to Honeywell substantially concurrent with the consummation of the Spin-Off, and we also entered into a $155.0 million revolving credit facility to fund our working capital and other cash needs. For information regarding our Credit Agreement, refer to Note 9 – Long-term Debt and Credit Agreement to the Consolidated Financial Statements in Item 8 of this Form 10-K.
On February 21, 2018 (the “Closing Date”), the Company and its lenders amended the Credit Agreement to provide the Company with additional operating flexibility and lower borrowing costs. Under the amended Credit Agreement, the Company has a single $425 million revolving credit facility which replaces the former $270 million term loan and $155 million revolving credit facility. On the Closing Date, the Company borrowed $242 million in loans under the revolving credit facility, and the proceeds of such loans were used to repay the outstanding term loan facility under the Credit Agreement. For a discussion of the amendment to the Credit Agreement, please refer to Note 18. "Subsequent Events."
Under the terms of the Credit Agreement, we are subject to restrictive covenants that limit our ability, among other things, to incur additional indebtedness, pay dividends or make other distributions, and consolidate, merge, sell or otherwise dispose of assets, as well as financial covenants that require us to maintain interest coverage and leverage ratios at levels specified in the Credit Agreement. These covenants may limit how we conduct our business, and in the event of certain defaults, our repayment obligations may be accelerated. We were in compliance with all of our covenants at December 31, 2017 and, under the amended Credit Agreement, at February 21, 2018. As of December 31, 2017, $153.7 million is available for use out of the total credit of $425 million under the Credit Agreement. As of February 21, 2018, $181.7 million was available for use out of the total credit of $425 million under the amended Credit Agreement.
During the year ended December 31, 2017, we borrowed $308.5 million in the aggregate from our revolving credit facility to fund our working capital and other cash needs and these borrowings were fully repaid by December 31, 2017. The revolver amounts borrowed and repaid during each quarter are as follows:
(Dollars in millions) | 2017 | |||
Quarter ended December 31, 2017 | $ | — | ||
Quarter ended September 30, 2017 | $ | 32.5 | ||
Quarter ended June 30, 2017 | $ | 108.5 | ||
Quarter ended March 31, 2017 | $ | 167.5 | ||
As a result of our early payment made in 2016, no amounts were due during 2017 related to our term loan. We repaid the term loan in full in February 2018 in connection with the amendment to the Credit Agreement. Going forward, cash provided by operating activities will be needed to fund future interest payments in respect to our outstanding indebtedness.
35
Cash Flow Summary for the Years Ended December 31, 2017, 2016 and 2015
Our cash flows from operating, investing and financing activities for the years ended December 31, 2017, 2016 and 2015, as reflected in the audited Consolidated Financial Statements included in this Form 10-K, are summarized as follows:
Years Ended December 31, | |||||||||||
2017 | 2016 | 2015 | |||||||||
(Dollars in thousands) | |||||||||||
Cash provided by (used for): | |||||||||||
Operating activities | $ | 134,607 | $ | 113,740 | $ | 101,536 | |||||
Investing activities | (93,247 | ) | (86,381 | ) | (98,230 | ) | |||||
Financing activities | (127 | ) | (13,160 | ) | (3,306 | ) | |||||
Net increase in cash and cash equivalents | $ | 41,233 | $ | 14,199 | $ | — | |||||
2017 compared with 2016
Net cash provided by operating activities increased by $20.9 million for the year ended December 31, 2017 versus the prior year period due primarily to (i) a $112.6 million increase in Net income versus the prior year period due to significantly higher sales as a result of improved plant production and the impacts of unplanned outages in the fourth quarter of 2016 as previously discussed and a one-time tax benefit of $53.4 million resulting from the 2017 Act, (ii) a $9.5 million cash improvement in Other assets and liabilities related primarily to the completion of the Hopewell regional wastewater treatment facility project, timing of deferred charges and other factors, (iii) a $9.3 million increase in Accrued liabilities due to the timing of payments. This activity was offset partially by (i) a net $60.4 million unfavorable cash impact from Accounts and other receivables due primarily to increased sales, the timing of collections and an increase in income tax receivables, (ii) a $21.5 million unfavorable cash impact from inventory comparing 2017 and 2016 as inventory levels remained relatively flat in 2017 following a reduction in inventory in 2016, (iii) a $19.0 million reduction in Deferred income taxes versus the prior year due to the remeasurement of deferred tax accounts as a result of the 2017 Act and (iv) a $15.7 million increase in Accounts payable due to timing of payments.
Net cash used for investing activities increased by $6.9 million for the year ended December 31, 2017 versus the prior year period due primarily to an increase in cash paid for capital expenditures and other intangible assets.
Net cash from financing activities decreased by $13.0 million for the year ended December 31, 2017 versus the prior year due to a $7.3 million reduction in invested equity resulting from the completion of the Spin-Off from Honeywell. Cash provided by operating activities was sufficient to repay all current period borrowings under the revolving credit facility.
2016 compared with 2015
Net cash provided by operating activities in 2016 increased by $12.2 million compared to 2015 primarily due to (1) a $43.6 million favorable impact from net working capital outflows driven by the timing of payments on the accounts payables balance, (2) a $3.9 million increase in depreciation and amortization expense, (3) a $1.6 million net increase in deferred income taxes and (4) a $1.3 million increase in stock-based compensation expense which was partially offset by (A) a $29.6 million decrease in Net income and (B) a $9.1 million net decrease in Other assets and liabilities and accrued liabilities.
Net cash used for investing activities in 2016 decreased by $11.8 million compared to 2015 primarily due to a decrease in capital expenditures of $13.1 million.
Net cash used for financing activities in 2016 increased by $9.9 million compared to 2015 primarily due to $269.3 million distributed to Honeywell in connection with the Spin-Off, a $4.4 million larger reduction in invested equity, $3.0 million of financing fees related to the Credit Agreement and $3.4 million of term loan repayments, partially offset by $270.0 million proceeds from the term loan.
36
Contractual Obligations
(Dollars in thousands, unless otherwise noted)
Payments due by period | |||||||||||||||||||||||||||
Contractual Obligations | Total | 2018 | 2019 | 2020 | 2021 | 2022 | 2023 and Beyond | ||||||||||||||||||||
Long-term debt – principal repayments (1) | $ | 266,625 | $ | 16,875 | $ | 27,000 | $ | 27,000 | $ | 195,750 | $ | — | $ | — | |||||||||||||
Long-term debt – interest payments (1) | 40,185 | 11,377 | 11,621 | 10,312 | 6,875 | — | — | ||||||||||||||||||||
Transition services agreement (2) | 3,211 | 3,211 | — | — | — | — | — | ||||||||||||||||||||
Capitalized leases | 601 | 125 | 131 | 119 | 95 | 98 | 33 | ||||||||||||||||||||
Interest payments on capitalized leases | 55 | 22 | 16 | 9 | 5 | 3 | — | ||||||||||||||||||||
Minimum operating lease payments | 126,772 | 32,661 | 21,002 | 12,488 | 11,780 | 10,628 | 38,213 | ||||||||||||||||||||
Estimated environmental compliance costs (3) | 6,837 | 952 | 1,661 | 1,515 | 1,445 | 1,264 | — | ||||||||||||||||||||
Purchase obligations (4) | 314,429 | 83,793 | 46,798 | 37,705 | 37,525 | 17,668 | 90,940 | ||||||||||||||||||||
Postretirement benefit obligations (5) | 39,800 | 8,800 | 7,500 | 7,500 | 7,800 | 8,200 | — | ||||||||||||||||||||
Total contractual obligations | $ | 798,515 | $ | 157,816 | $ | 115,729 | $ | 96,648 | $ | 261,275 | $ | 37,861 | $ | 129,186 | |||||||||||||
(1) | Long-term Debt - Principal repayments: refer to Note 9--Long-term Debt and Credit Arrangements to the Consolidated Financial Statements in Item 8 of this Form 10-K. Interest payments are estimated based on the interest rate applicable as of December 31, 2017. |
(2) | Transition Services Agreement: On September 28, 2016, in connection with, and as a condition to the Spin-Off, Honeywell and AdvanSix Inc. entered into a Transition Services Agreement. Pursuant to the Transition Services Agreement, Honeywell agreed to provide AdvanSix Inc. with, among other things, certain information technology, human resources, financial, health, safety and environmental, sales, product stewardship, operations and manufacturing, procurement, customer support, legal and contractual, trade compliance, supply chain and logistics, and real estate services for a limited period of time after the consummation of the Spin-Off (ranging from two months to two years depending on the service), in exchange for the minimum fees set forth in the Transition Services Agreement. Additionally, AdvanSix Inc. entered into a separate agreement with Honeywell to provide similar services with respect to certain non-US premises of the Company. |
(3) | The payment amounts in the table only reflect the environmental compliance costs which we have accrued as probable and reasonably estimable as of December 31, 2017. |
(4) | Purchase obligations are entered into with various vendors in the normal course of business, which are consistent with our expected requirements and primarily relate to cumene, oleum, sulfur and natural gas, as well as a long-term agreement for loading, unloading and handling of a portion of our ammonium sulfate export volumes. |
(5) | Actual contribution payments will depend on several factors, including investment performance and discount rates, timing of benefits and changes in applicable local requirements. The Company plans to make pension plan contributions in future years sufficient to satisfy pension funding requirements in those periods. |
Capital Expenditures
Our operations are capital intensive, requiring ongoing investments that have consisted, and are expected to continue to consist, primarily of capital expenditures required to maintain and improve equipment reliability, expand production capacity and comply with environmental and safety regulations.
37
The following table summarizes ongoing and expansion capital expenditures.
Years Ended December 31, | |||||||||||
2017 | 2016 | 2015 | |||||||||
(Dollars in thousands) | |||||||||||
Purchases of property, plant and equipment | $ | 86,438 | $ | 84,009 | $ | 97,144 | |||||
Capital expenditures increased $2.4 million from 2016 to 2017 due primarily to continued emphasis on improving the infrastructure and reliability at our manufacturing sites. Capital expenditures decreased $13.1 million from 2015 to 2016 primarily due to higher growth capital expenditures related to increased resin production in 2015. For 2018, we expect our total capital expenditures to be approximately $110 million to $120 million, including $20 to $30 million incremental investments in high-return growth and cost savings projects. Capital expenditures are deployed for various ongoing investments and initiatives to improve reliability, yield and quality, expand production capacity and comply with health, safety and environmental ("HSE") regulations. For 2017, capital expenditures related to HSE were approximately $18 million and, for 2018, we expect capital expenditures related to HSE to be approximately $19 million.
Off-Balance Sheet Arrangements
At December 31, 2017 and December 31, 2016, the Company did not have any off-balance sheet arrangements or financing activities with special-purpose entities.
Critical Accounting Policies and Estimates (Dollars in thousands, unless otherwise noted)
The Company’s significant accounting policies are more fully described in Note 2 to the Consolidated Financial Statements. Management believes that the application of these policies on a consistent basis enables the Company to provide the users of the financial statements with useful and reliable information about the Company’s operating results and financial condition.
The preparation of the Consolidated Financial Statements in conformity with U.S. GAAP requires management to make estimates and assumptions that affect the reported amounts, including, but not limited to, inventory valuations, impairment of goodwill, stock-based compensation, long-term employee benefit obligations, income taxes and environmental matters. Management’s estimates are based on historical experience, facts and circumstances available at the time and various other assumptions that are believed to be reasonable. The Company reviews these matters and reflects changes in estimates as appropriate. Management believes that the following represents some of the more critical judgment areas in the applications of the Company’s accounting policies which could have a material effect on the Company’s financial position, results of operations or cash flows.
Cash and Cash Equivalents – Cash and cash equivalents include cash on hand and on deposit and highly liquid, temporary cash investments with an original maturity to the Company of three months or less. We reduce cash and extinguish liabilities when the creditor receives our payment and we are relieved of our obligation for the liability when checks clear the Company’s bank account. Liabilities to creditors to whom we have issued checks that remain outstanding aggregated $8.5 million at December 31, 2017 and are included in Cash and cash equivalents and Accounts payable in the Consolidated Balance Sheet.
Inventories – Substantially all of the Company's inventories are valued at the lower of cost or market using the last-in, first-out (“LIFO”) method. The Company includes spare and other parts in inventory which are used in support of production or production facilities operations and are valued based on weighted average cost.
Inventories valued at LIFO amounted to $129.2 million and $129.0 million at December 31, 2017 and 2016. Had such LIFO inventories been valued at current costs, their carrying values would have been approximately $28.3 million and $29.9 million higher at December 31, 2017 and 2016.
Property, Plant, Equipment – Property, plant, equipment are recorded at cost, including any asset retirement obligations, less accumulated depreciation. For financial reporting, the straight-line method of depreciation is used over the estimated useful lives of 30 to 50 years for buildings and improvements and 5 to 40 years for machinery and equipment. Our machinery and equipment includes (1) assets used in short production cycles or subject to high corrosion, such as instrumentation, controls and insulation systems with useful lives up to 15 years, (2) standard plant assets, such as boilers and railcars, with useful lives ranging from 15 to 30 years and (3) major process equipment that can be used for long durations with effective preventative maintenance and repair, such as cooling towers, compressors, tanks and turbines with useful lives ranging from 30 to 40 years. Recognition of the fair value of obligations associated with the retirement of tangible long-lived assets is
38
required when there is a legal obligation to incur such costs. Upon initial recognition of a liability, the cost is capitalized as part of the related long-lived asset and depreciated over the corresponding asset’s useful life.
Repairs and maintenance, including planned major maintenance, are expensed as incurred. Those costs which materially add to the value of the asset or prolong its useful life are capitalized and the assets replaced are retired. Expense for the years ended December 31, 2017, 2016 and 2015 was $60.9 million, $70.8 million and $56.2 million, respectively.
Goodwill – The Business had goodwill of $15,005 as of December 31, 2017 and 2016. Goodwill is subject to impairment testing annually as of March 31, or whenever events or changes in circumstances indicate that the carrying amount may not be fully recoverable. The Company first assesses qualitative factors as described in Accounting Standards Codification Topic 350 (“ASC 350”) to determine whether it is necessary to perform the quantitative goodwill impairment test discussed in ASC 350. The Company completed its annual goodwill impairment test as of March 31, 2017 and, based on the results of the Company's assessment of qualitative factors, it was determined that it was not necessary to perform the quantitative goodwill impairment test as prescribed by ASC 350.
Environmental – AdvanSix accrues costs related to environmental matters when it is probable that we have incurred a liability related to a contaminated site and the amount can be reasonably estimated.
Stock-Based Compensation Plans – The principal awards issued under our stock-based compensation plans, which are described in "Note 15 - Stock-Based Compensation Plans", are non-qualified stock options, performance share units and restricted stock units. The cost for such awards is measured at the grant date based on the fair value of the award. The value of the portion of the award that is ultimately expected to vest is recognized as expense over the requisite service periods (generally the vesting period of the equity award) and is included in selling, general and administrative expenses. Forfeitures are estimated at the time of grant to recognize expense for those awards that are expected to vest and are based on our historical forfeiture rates.
Pension Benefits – We have a defined benefit plan covering certain employees primarily in the U.S. The benefits are accrued over the employees’ service periods. We use actuarial methods and assumptions in the valuation of defined benefit obligations and the determination of net periodic pension income or expense. Differences between actual and expected results or changes in the value of defined benefit obligations and fair value of plan assets, if any, are not recognized in earnings as they occur but rather systematically over subsequent periods when net actuarial gains or losses are in excess of 10% of the greater of the fair value of plan assets or the plan’s projected benefit obligation.
A 25 basis point increase in the discount rate would result in a decrease of approximately $0.3 million to the net periodic benefit cost for 2018, while a 25 basis point decrease in the discount rate would result in an increase of approximately $0.3 million to the net periodic benefit cost for 2018. The resulting impact on the pension benefit obligation would be a decrease of $2.3 million and an increase of $2.5 million, respectively.
Income Taxes – We account for income taxes pursuant to the asset and liability method which requires us to recognize current tax liabilities or receivables for the amount of taxes we estimate are payable or refundable for the current year and deferred tax assets and liabilities for the expected future tax consequences attributable to temporary differences between the financial statement carrying amounts and their respective tax bases of assets and liabilities and the expected benefits of net operating loss and credit carryforwards. Deferred tax assets and liabilities are measured using enacted tax rates expected to apply to taxable income in the years in which those temporary differences are expected to be recovered or settled. The effect on deferred tax assets and liabilities of a change in tax rates is recognized in operations in the period enacted. A valuation allowance is provided when it is more likely than not that a portion or all of a deferred tax asset will not be realized. The ultimate realization of deferred tax assets is dependent upon the generation of future taxable income and the reversal of deferred tax liabilities during the period in which related temporary differences become deductible.
We adopted the provisions of ASC 740 related to the accounting for uncertainty in income taxes recognized in an enterprise’s consolidated financial statements. ASC 740 prescribes a comprehensive model for the financial statement recognition, measurement, presentation and disclosure of uncertain tax positions taken or expected to be taken in income tax returns.
The benefit of tax positions taken or expected to be taken in our income tax returns are recognized in the financial statements if such positions are more likely than not of being sustained upon examination by taxing authorities. Differences between tax positions taken or expected to be taken in a tax return and the benefit recognized and measured pursuant to the interpretation are referred to as “unrecognized benefits”. A liability is recognized (or amount of net operating loss carryover or amount of tax refundable is reduced) for an unrecognized tax benefit because it represents an enterprise’s potential future obligation to the taxing authority for a tax position that was not recognized as a result of applying the provisions of ASC 740. Interest costs and related penalties related to unrecognized tax benefits are required to be calculated, if applicable. Our policy is to
39
classify tax related interest and penalties, if any, as a component of income tax expense. No interest or penalties were recorded during the years ended December 31, 2017 and 2016. As of December 31, 2017 and December 31, 2016, no liability for unrecognized tax benefits was required to be reported. We do not expect any significant changes in our unrecognized tax benefits in the next year.
Prior to the Spin-Off, income taxes were calculated on a separate tax return basis modified to apply the benefits-for-loss approach and may not be reflective of the results that would have occurred if tax returns were filed on a stand-alone basis. In applying the benefits-for-loss methodology, the tax provision was computed as if the Business filed tax returns on a separate tax return basis independent of other Honeywell businesses with an adjustment to reflect a tax benefit for losses generated by the Business but utilized by other Honeywell businesses in a combined tax filing. Given that the taxpaying entities in which the Business operates were retained by Honeywell subsequent to the Spin-Off, all tax payables and attributes, such as tax credit and tax loss carryforwards, associated with these entities was also retained by Honeywell whether or not such attribute was generated in whole or in part by the Business. As a result, the taxes payable and attributes that relate to the Business’s operations were recorded and settled through intercompany accounts with Honeywell since they are attributable to the taxable entity to be retained by Honeywell. Accordingly, a tax attribute, such as a tax loss, generated by the Business but utilized by Honeywell, reduced the intercompany payable to Honeywell and be recorded as a current tax benefit in the calculation of the tax provision.
We believe applying the separate tax return method modified to apply the benefits-for-loss approach was more appropriate than carrying the tax attribute forward since the attribute no longer exists, nor was the attribute included in the assets and liabilities of the Business subsequent to the Spin-Off. Furthermore, the amount of the attributes that were generated by the Business but utilized by Honeywell were not material to the overall financial statements.
On December 22, 2017, the SEC staff issued Staff Accounting Bulletin No. 118 (SAB 118) to address the application of US GAAP in situations when a registrant does not have the necessary information available, prepared, or analyzed (including computations) in reasonable detail to complete the accounting for certain income tax effects of the 2017 Act. SAB 118 provides guidance for registrants under three scenarios where the measurement of certain tax items is either complete, can be reasonably estimated or cannot be reasonably estimated. The Company has evaluated the 2017 Act and based upon the information available has determined the impacts can be reasonably estimated. The impacts of those items have been reflected in our Consolidated Financial Statements as of December 31, 2017. The impacts of those changes are disclosed in “Note 4. Income Taxes”.
Earnings Per Share – Basic earnings per share is based on the weighted average number of common shares outstanding. Diluted earnings per share is based on the weighted average number of common shares outstanding and all dilutive potential common shares outstanding. On October 1, 2016, the date of consummation of the Spin-Off, 30,482,966 shares of the Company’s common stock were distributed to Honeywell stockholders of record as of September 16, 2016 who held their shares through the Distribution Date. Basic and diluted EPS for all periods prior to the Spin-Off reflect the number of distributed shares, or 30,482,966 shares. For 2016, the distributed shares were treated as issued and outstanding from January 1, 2016 for purposes of calculating historical basic earnings per share.
Use of Estimates – The preparation of the Consolidated Financial Statements in conformity with U.S. GAAP requires management to make estimates and assumptions that affect the reported amounts in the Consolidated Financial Statements and related disclosures in the accompanying Notes. Actual results could differ from those estimates. Estimates and assumptions are periodically reviewed and the effects of changes are reflected in the Consolidated Financial Statements in the period they are determined to be necessary.
Recent Accounting Pronouncements
See “Note 2 - Summary of Significant Accounting Policies” to the Consolidated Financial Statements included in Item 8 of this Form 10-K.
40
Item 7A. Quantitative and Qualitative Disclosures About Market Risk
Interest Rate Risk
Our exposure to risk based on changes in interest rates relates primarily to our Credit Agreement. We have not used derivative financial instruments in our investment portfolio. The Credit Agreement bears interest at floating rates. For variable rate debt, interest rate changes generally do not affect the fair market value of such debt assuming all other factors remain constant, but do impact future earnings and cash flows. Accordingly, we may be exposed to interest rate risk on borrowings under the Credit Agreement. Based on borrowing levels at December 31, 2017, a 25 basis point fluctuation in interest rates for the year ended December 31, 2017 would have resulted in an increase or decrease to our interest expense of approximately $0.7 million.
Market Risk
See “Note 11 Financial Instruments and Fair Value Measures” to the Consolidated Financial Statements, included in this Form 10-K, for a discussion relating to market risk.
41
Item 8. Financial Statements and Supplementary Data
ADVANSIX INC.
CONSOLIDATED STATEMENTS OF OPERATIONS
(Dollars in thousands, except share and per share amounts)
Years Ended December 31, | |||||||||||
2017 | 2016 | 2015 | |||||||||
Sales | $ | 1,475,194 | $ | 1,191,524 | $ | 1,329,409 | |||||
Costs, expenses and other: | |||||||||||
Costs of goods sold | 1,249,014 | 1,083,894 | 1,179,651 | ||||||||
Selling, general and administrative expenses | 72,815 | 53,753 | 52,398 | ||||||||
Other non-operating expense (income), net | 8,733 | 102 | (2,877 | ) | |||||||
1,330,562 | 1,137,749 | 1,229,172 | |||||||||
Income before taxes | 144,632 | 53,775 | 100,237 | ||||||||
Income tax expense (benefit) | (2,067 | ) | 19,628 | 36,461 | |||||||
Net income | $ | 146,699 | $ | 34,147 | $ | 63,776 | |||||
Earnings per common share | |||||||||||
Basic | $ | 4.81 | $ | 1.12 | $ | 2.09 | |||||
Diluted | $ | 4.72 | $ | 1.12 | $ | 2.09 | |||||
Weighted average common shares outstanding | |||||||||||
Basic | 30,482,966 | 30,482,966 | 30,482,966 | ||||||||
Diluted | 31,091,601 | 30,503,587 | 30,482,966 | ||||||||
The accompanying Notes to Consolidated Financial Statements are an integral part of this statement.
42
ADVANSIX INC.
CONSOLIDATED STATEMENTS OF COMPREHENSIVE INCOME
(Dollars in thousands)
Years Ended December 31, | |||||||||||
2017 | 2016 | 2015 | |||||||||
Net income | $ | 146,699 | $ | 34,147 | $ | 63,776 | |||||
Foreign exchange translation adjustment | 12 | 154 | (1,390 | ) | |||||||
Commodity hedges | — | (1,413 | ) | 2,865 | |||||||
Pension obligation adjustments | (6,023 | ) | 1,963 | — | |||||||
Other comprehensive income, net of tax | (6,011 | ) | 704 | 1,475 | |||||||
Comprehensive income | $ | 140,688 | $ | 34,851 | $ | 65,251 | |||||
The accompanying Notes to Consolidated Financial Statements are an integral part of this statement.
43
ADVANSIX INC.
CONSOLIDATED BALANCE SHEETS
(Dollars in thousands, except share and per share amounts)
December 31, | |||||||
2017 | 2016 | ||||||
ASSETS | |||||||
Current assets: | |||||||
Cash and cash equivalents | $ | 55,432 | $ | 14,199 | |||
Accounts and other receivables – net | 196,003 | 131,671 | |||||
Inventories – net | 129,208 | 128,978 | |||||
Other current assets | 7,130 | 7,690 | |||||
Total current assets | 387,773 | 282,538 | |||||
Property, plant and equipment – net | 612,612 | 575,375 | |||||
Goodwill | 15,005 | 15,005 | |||||
Other assets | 34,884 | 32,039 | |||||
Total assets | $ | 1,050,274 | $ | 904,957 | |||
LIABILITIES | |||||||
Current liabilities: | |||||||
Accounts payable | $ | 227,711 | $ | 222,929 | |||
Accrued liabilities | 35,013 | 25,396 | |||||
Income taxes payable | 1 | 86 | |||||
Deferred income and customer advances | 17,194 | 25,567 | |||||
Current portion of long-term debt | 16,875 | — | |||||
Total current liabilities | 296,794 | 273,978 | |||||
Deferred income taxes | 92,276 | 114,200 | |||||
Long-term debt | 248,339 | 264,838 | |||||
Postretirement benefit obligations | 33,396 | 33,544 | |||||
Other liabilities | 3,144 | 3,035 | |||||
Total liabilities | 673,949 | 689,595 | |||||
COMMITMENTS AND CONTINGENCIES (Note 12) | |||||||
STOCKHOLDERS' EQUITY | |||||||
Common stock, par value $0.01; 200,000,000 shares authorized and 30,482,966 shares issued and outstanding | 305 | 305 | |||||
Preferred stock, par value $0.01; 50,000,000 shares authorized and 0 shares issued and outstanding | — | — | |||||
Additional paid-in capital | 263,081 | 242,806 | |||||
Retained earnings (accumulated deficit) | 121,985 | (24,714 | ) | ||||
Accumulated other comprehensive loss | (9,046 | ) | (3,035 | ) | |||
Total stockholders' equity | 376,325 | 215,362 | |||||
Total liabilities and stockholders' equity | $ | 1,050,274 | $ | 904,957 | |||
The accompanying Notes to Consolidated Financial Statements are an integral part of this statement.
44
ADVANSIX INC.
CONSOLIDATED STATEMENTS OF CASH FLOWS
(Dollars in thousands)
Years Ended December 31, | |||||||||||
2017 | 2016 | 2015 | |||||||||
Cash flows from operating activities: | |||||||||||
Net income | $ | 146,699 | $ | 34,147 | $ | 63,776 | |||||
Adjustments to reconcile net income to net cash provided by operating activities: | |||||||||||
Depreciation and amortization | 48,455 | 40,329 | 36,410 | ||||||||
Loss on disposal of assets | 1,500 | 1,529 | 1,308 | ||||||||
Deferred income taxes | (7,513 | ) | 11,534 | 9,913 | |||||||
Stock based compensation | 7,742 | 1,327 | — | ||||||||
Accretion of deferred financing fees | 592 | 148 | — | ||||||||
Changes in assets and liabilities: | |||||||||||
Accounts and other receivables | (64,320 | ) | (3,948 | ) | 38,399 | ||||||
Inventories | (230 | ) | 21,253 | 5,021 | |||||||
Accounts payable | 8,172 | 23,846 | (38,689 | ) | |||||||
Income taxes payable | (85 | ) | 86 | — | |||||||
Accrued liabilities | 9,617 | 281 | 500 | ||||||||
Deferred income and customer advances | (8,373 | ) | 360 | (6,783 | ) | ||||||
Other assets and liabilities | (7,649 | ) | (17,152 | ) | (8,319 | ) | |||||
Net cash provided by operating activities | 134,607 | 113,740 | 101,536 | ||||||||
Cash flows from investing activities: | |||||||||||
Expenditures for property, plant and equipment | (86,438 | ) | (84,009 | ) | (97,144 | ) | |||||
Other investing activities | (6,809 | ) | (2,372 | ) | (1,086 | ) | |||||
Net cash used for investing activities | (93,247 | ) | (86,381 | ) | (98,230 | ) | |||||
Cash flows from financing activities: | |||||||||||
Proceeds from long-term debt | — | 270,000 | — | ||||||||
Payment of long-term debt | — | (3,375 | ) | — | |||||||
Payment of debt issuance costs | — | (1,881 | ) | — | |||||||
Borrowings under revolving credit facility | 308,500 | 58,000 | — | ||||||||
Payments of revolving credit facility | (308,500 | ) | (58,000 | ) | — | ||||||
Payment of revolving credit facility fees | — | (1,080 | ) | — | |||||||
Principal payments under capital lease | (127 | ) | (165 | ) | — | ||||||
Distribution to Honeywell in connection with Spin-Off | — | (269,347 | ) | — | |||||||
Net decrease in invested equity | — | (7,312 | ) | (2,936 | ) | ||||||
Other financing activities | — | — | (370 | ) | |||||||
Net cash used for financing activities | (127 | ) | (13,160 | ) | (3,306 | ) | |||||
Net increase in cash and cash equivalents | 41,233 | 14,199 | — | ||||||||
Cash and cash equivalents at beginning of year | 14,199 | — | — | ||||||||
Cash and cash equivalents at the end of year | $ | 55,432 | $ | 14,199 | $ | — | |||||
Supplemental non-cash investing activities: | |||||||||||
Capital expenditures included in accounts payable | $ | 25,222 | $ | 28,485 | $ | 22,282 | |||||
Supplemental cash investing activities: | |||||||||||
Cash paid for interest | $ | 7,236 | $ | 1,862 | $ | — | |||||
Cash paid for taxes | $ | 12,982 | $ | — | $ | — | |||||
The accompanying Notes to Consolidated Financial Statements are an integral part of this statement.
45
ADVANSIX INC.
CONSOLIDATED STATEMENTS OF STOCKHOLDERS’ EQUITY
(Dollars in thousands)
Common Stock | Additional Paid-In Capital | Retained Earnings (Accumulated Deficit) | Invested Equity | Accumulated Other Comprehensive Income (Loss) | Total Equity | |||||||||||||||||||||
Shares | Amount | |||||||||||||||||||||||||
Balance at December 31, 2014 | — | $ | — | $ | — | $ | — | $ | 421,969 | $ | (5,214 | ) | $ | 416,755 | ||||||||||||
Net Income | — | — | — | — | 63,776 | — | 63,776 | |||||||||||||||||||
Comprehensive income | ||||||||||||||||||||||||||
Foreign exchange translation adjustments | — | — | — | — | — | (1,390 | ) | (1,390 | ) | |||||||||||||||||
Commodity hedges | — | — | — | — | — | 2,865 | 2,865 | |||||||||||||||||||
Total comprehensive income (loss), net of tax | — | — | — | — | — | 1,475 | 1,475 | |||||||||||||||||||
Change in invested equity | — | — | — | — | (2,936 | ) | — | (2,936 | ) | |||||||||||||||||
Balance at December 31, 2015 | — | — | — | — | 482,809 | (3,739 | ) | 479,070 | ||||||||||||||||||
Net Income through September 30, 2016 | — | — | — | — | 58,861 | — | 58,861 | |||||||||||||||||||
Net Loss from October 1, 2016 | — | — | — | (24,714 | ) | — | — | (24,714 | ) | |||||||||||||||||
Comprehensive income | ||||||||||||||||||||||||||
Foreign exchange translation adjustments | — | — | — | — | — | 154 | 154 | |||||||||||||||||||
Commodity hedges | — | — | — | — | — | (1,413 | ) | (1,413 | ) | |||||||||||||||||
Pension obligation adjustments | — | — | — | — | — | 1,963 | 1,963 | |||||||||||||||||||
Total comprehensive income (loss), net of tax | — | — | — | — | — | 704 | 704 | |||||||||||||||||||
Change in invested equity | — | — | — | — | (299,886 | ) | — | (299,886 | ) | |||||||||||||||||
Issuance of common stock and reclassification of invested equity | 30,482,966 | 305 | 241,479 | — | (241,784 | ) | — | — | ||||||||||||||||||
Stock-based compensation | — | — | 1,327 | — | — | — | 1,327 | |||||||||||||||||||
Balance at December 31, 2016 | 30,482,966 | 305 | 242,806 | (24,714 | ) | — | (3,035 | ) | 215,362 | |||||||||||||||||
Net income | — | — | — | 146,699 | — | — | 146,699 | |||||||||||||||||||
Comprehensive income | ||||||||||||||||||||||||||
Foreign exchange translation adjustments | — | — | — | — | — | 12 | 12 | |||||||||||||||||||
Commodity hedges | — | — | — | — | — | — | — | |||||||||||||||||||
Pension obligation adjustments | — | — | — | — | — | (6,023 | ) | (6,023 | ) | |||||||||||||||||
Total comprehensive income (loss), net of tax | — | — | — | — | — | (6,011 | ) | (6,011 | ) | |||||||||||||||||
Spin-off deferred tax adjustments | — | — | 12,533 | — | — | — | 12,533 | |||||||||||||||||||
Stock-based compensation | — | — | 7,742 | — | — | — | 7,742 | |||||||||||||||||||
Balance at December 31, 2017 | 30,482,966 | $ | 305 | $ | 263,081 | $ | 121,985 | $ | — | $ | (9,046 | ) | $ | 376,325 | ||||||||||||
The accompanying Notes to Consolidated Financial Statements are an integral part of this statement.
46
ADVANSIX INC.
NOTES TO CONSOLIDATED FINANCIAL STATEMENTS
(Dollars in thousands, except share and per share amounts or unless otherwise noted)
Note 1. Organization, Operations and Basis of Presentation
Description of Business
AdvanSix Inc. (“AdvanSix”, the “Business”, the “Company”, “we” or “our”) is an integrated manufacturer of Nylon 6, a polymer resin which is a synthetic material used by our customers to produce engineered plastics, fibers, filaments and films that, in turn, are used in such end-products as automotive and electronic components, carpets, sports apparel, fishing nets and food and industrial packaging. As a result of our backward integration and the configuration of our manufacturing facilities, we also sell a variety of other products, all of which are produced as part of the Nylon 6 resin manufacturing process including caprolactam, ammonium sulfate fertilizers, and other chemical intermediates.
All of our manufacturing plants and operations are located in the United States. Globally, we serve over 500 customers in a wide variety of industries located in more than 40 countries.
For the years ended December 31, 2017, 2016 and 2015, we had sales of $1,475 million, $1,192 million and $1,329 million, respectively, and net income of $147 million, $34 million and $64 million, respectively.
Each of these product lines represented the following approximate percentage of total sales:
Years Ended December 31, | |||||
2017 | 2016 | 2015 | |||
Nylon | 29% | 28% | 27% | ||
Caprolactam | 19% | 17% | 18% | ||
Ammonium Sulfate Fertilizers | 19% | 24% | 25% | ||
Chemical Intermediates | 33% | 31% | 30% | ||
100% | 100% | 100% | |||
We evaluated segment reporting in accordance with Accounting Standards Codification Topic (“ASC”) 280. We concluded that AdvanSix is a single operating segment and a single reportable segment based on the operating results available which are evaluated regularly by the chief operating decision maker (“CODM”) to make decisions about resource allocation and performance assessment. AdvanSix operations are managed as one integrated process spread across four manufacturing sites, including centralized supply chain and procurement functions. The production process is dependent upon one key raw material, cumene, as the input to the manufacturing of all finished goods produced for sale through the sales channels and end-markets the Company serves. Production rates and output volumes are managed across all four plants jointly to align with the overall Company operating plan. The CODM makes operational performance assessments and resource allocation decisions on a consolidated basis, inclusive of all of the Company’s products.
AdvanSix operates through four integrated U.S.-based manufacturing sites located in Frankford and Pottsville, Pennsylvania, and Hopewell and Chesterfield, Virginia. The Company's headquarters is located in Parsippany, New Jersey.
Separation from Honeywell
On October 1, 2016, Honeywell International Inc. (“Honeywell”) completed the previously announced separation of AdvanSix. The separation was completed by Honeywell distributing all of the then outstanding shares of common stock of AdvanSix on October 1, 2016 (the “Distribution Date”) through a dividend in kind of AdvanSix common stock, par value $0.01, to holders of Honeywell common stock as of the close of business on the record date of September 16, 2016 who held their shares through the Distribution Date (the “Spin-Off”).
Each Honeywell stockholder who held their shares through the Distribution Date received one share of AdvanSix common stock for every 25 shares of Honeywell common stock held at the close of business on the record date of September 16, 2016. The separation was completed pursuant to a Separation and Distribution Agreement and other agreements with Honeywell related to the separation, including an Employee Matters Agreement, a Tax Matters Agreement and a Transition Services Agreement, each of which was filed as an exhibit to our Current Report on Form 8-K, filed with the Securities and
47
Exchange Commission (“SEC”) on September 28, 2016, as well as Site Sharing and Services Agreements for facilities located in Chesterfield, Colonial Heights and Pottsville, each of which was filed as an exhibit to our Current Report on Form 8-K, filed with the SEC on October 3, 2016. These agreements govern the relationship between AdvanSix and Honeywell following the separation and provide for the allocation of various assets, liabilities, rights and obligations. These agreements also include arrangements for transition services to be provided by Honeywell to AdvanSix and by AdvanSix to Honeywell. A description of the material terms and conditions of these agreements can be found in the section titled “Certain Relationships and Related Party Transactions” of the Company’s Information Statement filed as Exhibit 99.1 to Amendment No. 5 to the Registration Statement of AdvanSix Inc. on Form 10 dated and filed with the SEC on September 7, 2016 and declared effective by the SEC on September 8, 2016 (the “Form 10”).
On October 3, 2016, AdvanSix stock began “regular-way” trading on the New York Stock Exchange under the “ASIX” stock symbol.
Basis of Presentation
Unless the context otherwise requires, references in these Notes to Condensed Consolidated Financial Statements to “we,” “us,” “our,” “AdvanSix” and the “Company” refer to AdvanSix Inc. and its consolidated subsidiaries after giving effect to the Spin-Off. All intercompany transactions have been eliminated. As described in Note 3, all significant transactions between the Business and Honeywell prior to separation have been included in these Consolidated Financial Statements and are considered to be effectively settled for cash at the time the transaction was recorded. The total net effect of the settlement of these pre-separation transactions is reflected in the Consolidated Statements of Cash Flows as a financing activity and in the Consolidated Balance Sheets as invested equity.
Prior to the separation from Honeywell on October 1, 2016, these Consolidated Financial Statements were derived from the consolidated financial statements and accounting records of Honeywell. These Consolidated Financial Statements reflect the consolidated historical results of operations, financial position and cash flows of AdvanSix as they were historically managed in conformity with GAAP.
Prior to the Spin-Off, Honeywell provided certain services, such as legal, accounting, information technology, human resources and other infrastructure support, on behalf of the Business. The cost of these services has been allocated to the Business on a direct usage basis when identifiable, with the remainder allocated on the basis of revenues, headcount or other relevant measures. However, the financial information presented in these Consolidated Financial Statements may not reflect the financial position, operating results and cash flows of the Business had the Business been a separate stand-alone entity during the periods presented. Actual costs that would have been incurred if the Business had been a stand-alone company would depend on multiple factors, including organizational structure and strategic decisions made in various areas, including information technology and infrastructure. Both we and Honeywell consider the basis on which the expenses have been allocated to be a reasonable reflection of the utilization of services provided to or the benefits received by the Business during the periods presented. After the Spin-Off, a number of the above services will continue under a transition service agreement with Honeywell, which we will expense as incurred based on the contractual pricing terms.
Note 2. Summary of Significant Accounting Policies
Accounting Principles – The financial statements and accompanying Notes are prepared in accordance with accounting principles generally accepted in the United States of America. The following is a description of AdvanSix’s significant accounting policies.
Principles of Consolidation – The Consolidated Financial Statements include the accounts of AdvanSix Inc. and all of its subsidiaries in which a controlling financial interest is maintained. Our consolidation policy requires equity investments that we exercise significant influence over but do not control the investee and are not the primary beneficiary of the investee’s activities to be accounted for using the equity method. Investments through which we are not able to exercise significant influence over the investee and which we do not have readily determinable fair values are accounted for under the cost method. All intercompany transactions and balances are eliminated in consolidation.
Cash and Cash Equivalents – Cash and cash equivalents include cash on hand and on deposit and highly liquid, temporary cash investments with an original maturity to the Company of three months or less. We reduce cash and extinguish liabilities when the creditor receives our payment and we are relieved of our obligation for the liability when checks clear the Company’s bank account. Liabilities to creditors to whom we have issued checks that remain outstanding aggregated $8.5 million at December 31, 2017 and are included in Cash and cash equivalents and Accounts payable in the Consolidated Balance Sheet.
48
Commodity Price Risk Management – Our exposure to market risk for commodity prices can result in changes in our cost of production. We primarily mitigate our exposure to commodity price risk by using long-term, formula-based price contracts with our suppliers and formula-based price agreements with customers. Our customer agreements provide for price adjustments based on relevant market indices and raw material prices, and generally they do not include take-or-pay terms. Instead, each customer agreement, the majority of which have a term of at least one year, is typically determined by monthly or quarterly volume estimates. We also enter into forward commodity contracts with third parties designated as hedges of anticipated purchases of several commodities. Forward commodity contracts are marked-to-market, with the resulting gains and losses recognized in earnings, in the same category as the items being hedged, when the hedged transaction is recognized.
Inventories – Substantially all of the Company's inventories are valued at the lower of cost or market using the last-in, first-out (“LIFO”) method. The Company includes spare and other parts in inventory which are used in support of production or production facilities operations and are valued based on weighted average cost.
Inventories valued at LIFO amounted to $129.2 million and $129.0 million at December 31, 2017 and 2016. Had such LIFO inventories been valued at current costs, their carrying values would have been approximately $28.3 million and $29.9 million higher at December 31, 2017 and 2016.
Property, Plant, Equipment – Property, plant, equipment are recorded at cost, including any asset retirement obligations, less accumulated depreciation. For financial reporting, the straight-line method of depreciation is used over the estimated useful lives of 30 to 50 years for buildings and improvements and 5 to 40 years for machinery and equipment. Our machinery and equipment includes (1) assets used in short production cycles or subject to high corrosion, such as instrumentation, controls and insulation systems with useful lives up to 15 years, (2) standard plant assets, such as boilers and railcars, with useful lives ranging from 15 to 30 years and (3) major process equipment that can be used for long durations with effective preventative maintenance and repair, such as cooling towers, compressors, tanks and turbines with useful lives ranging from 5 to 40 years. Recognition of the fair value of obligations associated with the retirement of tangible long-lived assets is required when there is a legal obligation to incur such costs. Upon initial recognition of a liability, the cost is capitalized as part of the related long-lived asset and depreciated over the corresponding asset’s useful life.
Repairs and maintenance, including planned major maintenance, are expensed as incurred. Those costs which materially add to the value of the asset or prolong its useful life are capitalized and the assets replaced are retired. Expense for the years ended December 31, 2017, 2016 and 2015 was $60.9 million, $70.8 million and $56.2 million, respectively.
Long-Lived Assets – The Business evaluates the recoverability of the carrying amount of long-lived assets (including property, plant and equipment and intangible assets with determinable lives) whenever events or changes in circumstances indicate that the carrying amount of an asset may not be fully recoverable. The Business evaluates events or changes in circumstances based on several factors including operating results, business plans and forecasts, general and industry trends, and economic projections and anticipated cash flows. An impairment is assessed when the undiscounted expected future cash flows derived from an asset are less than its carrying amount. Impairment losses are measured as the amount by which the carrying value of an asset exceeds its fair value and are recognized in the Consolidated Statements of Operations. The Business also evaluates the estimated useful lives of long-lived assets if circumstances warrant and revises such estimates based on current events.
Goodwill – The Business had goodwill of $15,005 as of December 31, 2017 and 2016. Goodwill is subject to impairment testing annually as of March 31, or whenever events or changes in circumstances indicate that the carrying amount may not be fully recoverable. The Company first assesses qualitative factors as described in Accounting Standards Codification Topic 350 (“ASC 350”) to determine whether it is necessary to perform the quantitative goodwill impairment test discussed in ASC 350. The Company completed its annual goodwill impairment test as of March 31, 2017 and, based on the results of the Company's assessment of qualitative factors, it was determined that it was not necessary to perform the quantitative goodwill impairment test as prescribed by ASC 350.
Sales Recognition – Sales are recognized when persuasive evidence of an arrangement exists, product delivery has occurred, pricing is fixed or determinable, and collection is reasonably assured. AdvanSix is a ship and bill operation recognizing revenue generally when title transfers primarily at FOB shipping point. For domestic sales, title transfers at point of shipment. For international sales, title generally transfers at international border or from the port of departure to the customer’s location. Outbound shipping costs are incurred by the Company and included as freight expense in costs of goods sold in the Consolidated Statements of Operations.
49
Environmental – AdvanSix accrues costs related to environmental matters when it is probable that we have incurred a liability related to a contaminated site and the amount can be reasonably estimated.
Deferred Income and Customer Advances – AdvanSix has an annual pre-buy program for ammonium sulfate that is classified as deferred income and customer advances in the Consolidated Balance Sheets. Customers pay cash in advance to reserve capacity for ammonium sulfate to guarantee product availability during peak planting season. The Business recognizes a customer advance when cash is received for the advanced buy. Revenue is then recognized and the customer advance is relieved upon title transfer of ammonium sulfate.
Trade Receivables and Allowance for Doubtful Accounts – Trade accounts receivables are recorded at the invoiced amount as a result of transactions with customers. AdvanSix maintains allowances for doubtful accounts for estimated losses based on a customer’s inability to make required payments. AdvanSix estimates anticipated losses from doubtful accounts based on days past due, as measured from the contractual due date and historical collection history and incorporates changes in economic conditions that may not be reflected in historical trends such as customers in bankruptcy, liquidation or reorganization. Receivables are written-off against the allowance for doubtful accounts when they are determined uncollectible. Such determination includes analysis and consideration of the particular conditions of the account, including time intervals since last collection, customer performance against agreed upon payment plans, success of outside collection agencies activity, solvency of customer and any bankruptcy proceedings.
Research and Development – AdvanSix conducts research and development (“R&D”) activities, which consist primarily of the development of new products and product applications consisting primarily of labor costs and depreciation and maintenance costs. R&D costs are charged to expense as incurred. Such costs are included in costs of goods sold and were $12,913, $13,762, and $12,807 for the years ended December 31, 2017, 2016 and 2015, respectively.
Stock-Based Compensation Plans – The principal awards issued under our stock-based compensation plans, which are described in Note 15 Stock-Based Compensation Plans, are non-qualified stock options, performance share units and restricted stock units. The cost for such awards is measured at the grant date based on the fair value of the award. The value of the portion of the award that is ultimately expected to vest is recognized as expense over the requisite service periods (generally the vesting period of the equity award) and is included in selling, general and administrative expenses. Forfeitures are estimated at the time of grant to recognize expense for those awards that are expected to vest and are based on our historical forfeiture rates.
Pension Benefits – We have a defined benefit plan covering certain employees primarily in the U.S. The benefits are accrued over the employees’ service periods. We use actuarial methods and assumptions in the valuation of defined benefit obligations and the determination of net periodic pension income or expense. Differences between actual and expected results or changes in the value of defined benefit obligations and fair value of plan assets, if any, are not recognized in earnings as they occur but rather systematically over subsequent periods when net actuarial gains or losses are in excess of 10% of the greater of the fair value of plan assets or the plan’s projected benefit obligation.
Foreign Currency Translation – Assets and liabilities of subsidiaries operating outside the United States with a functional currency other than U.S. dollars are translated into U.S. dollars using year-end exchange rates. Sales, costs and expenses are translated at the average exchange rates in effect during the year. Foreign currency translation gains and losses are included as a component of Accumulated other comprehensive income (loss) in our Consolidated Balance Sheets.
Income Taxes – We account for income taxes pursuant to the asset and liability method which requires us to recognize current tax liabilities or receivables for the amount of taxes we estimate are payable or refundable for the current year and deferred tax assets and liabilities for the expected future tax consequences attributable to temporary differences between the financial statement carrying amounts and their respective tax bases of assets and liabilities and the expected benefits of net operating loss and credit carryforwards. Deferred tax assets and liabilities are measured using enacted tax rates expected to apply to taxable income in the years in which those temporary differences are expected to be recovered or settled. The effect on deferred tax assets and liabilities of a change in tax rates is recognized in operations in the period enacted. A valuation allowance is provided when it is more likely than not that a portion or all of a deferred tax asset will not be realized. The ultimate realization of deferred tax assets is dependent upon the generation of future taxable income and the reversal of deferred tax liabilities during the period in which related temporary differences become deductible.
We adopted the provisions of Accounting Standards Codification Topic 740 (“ASC 740”) related to the accounting for uncertainty in income taxes recognized in an enterprise’s consolidated financial statements. ASC 740 prescribes a comprehensive model for the financial statement recognition, measurement, presentation and disclosure of uncertain tax positions taken or expected to be taken in income tax returns.
50
The benefit of tax positions taken or expected to be taken in our income tax returns are recognized in the financial statements if such positions are more likely than not of being sustained upon examination by taxing authorities. Differences between tax positions taken or expected to be taken in a tax return and the benefit recognized and measured pursuant to the interpretation are referred to as “unrecognized benefits”. A liability is recognized (or amount of net operating loss carryover or amount of tax refundable is reduced) for an unrecognized tax benefit because it represents an enterprise’s potential future obligation to the taxing authority for a tax position that was not recognized as a result of applying the provisions of ASC 740. Interest costs and related penalties related to unrecognized tax benefits are required to be calculated, if applicable. Our policy is to classify tax related interest and penalties, if any, as a component of income tax expense. No interest or penalties were recorded during the years ended December 31, 2017 and 2016. As of December 31, 2017 and December 31, 2016, no liability for unrecognized tax benefits was required to be reported. We do not expect any significant changes in our unrecognized tax benefits in the next year.
Prior to the Spin-Off, income taxes as presented are calculated on a separate tax return basis modified to apply the benefits-for-loss approach and may not be reflective of the results that would have occurred if tax returns were filed on a stand-alone basis. In applying the benefits-for-loss methodology, the tax provision was computed as if the Business filed tax returns on a separate tax return basis independent of other Honeywell businesses with an adjustment to reflect a tax benefit for losses generated by the Business but utilized by other Honeywell businesses in a combined tax filing. Given that the taxpaying entities in which the Business operates were retained by Honeywell subsequent to the Spin-Off, all tax payables and attributes, such as tax credit and tax loss carryforwards, associated with these entities was also retained by Honeywell whether or not such attribute was generated in whole or in part by the Business. As a result, the taxes payable and attributes that relate to the Business’s operations were recorded and settled through intercompany accounts with Honeywell since they are attributable to the taxable entity to be retained by Honeywell. Accordingly, a tax attribute, such a tax loss, generated by the Business but utilized by Honeywell, reduced the intercompany payable to Honeywell and be recorded as a current tax benefit in the calculation of the tax provision.
We believe applying the separate tax return method modified to apply the benefits-for-loss approach was more appropriate than carrying the tax attribute forward since the attribute no longer exists, nor was the attribute included in the assets and liabilities of the Business subsequent to the Spin-Off. Furthermore, the amount of the attributes that were generated by the Business but utilized by Honeywell were not material to the overall financial statements.
On December 22, 2017, the SEC staff issued Staff Accounting Bulletin No. 118 (SAB 118) to address the application of US GAAP in situations when a registrant does not have the necessary information available, prepared, or analyzed (including computations) in reasonable detail to complete the accounting for certain income tax effects of the 2017 Act. SAB 118 provides guidance for registrants under three scenarios where the measurement of certain tax items is either complete, can be reasonably estimated or cannot be reasonably estimated. The Company has evaluated the 2017 Act and based upon the information available has determined the impacts can be reasonably estimated. The impacts of those items have been reflected in our Consolidated Financial Statements as of December 31, 2017. The impacts of those changes are disclosed in “Note 4. Income Taxes”.
Earnings Per Share – Basic earnings per share is based on the weighted average number of common shares outstanding. Diluted earnings per share is based on the weighted average number of common shares outstanding and all dilutive potential common shares outstanding. On October 1, 2016, the date of consummation of the Spin-Off, 30,482,966 shares of the Company’s common stock were distributed to Honeywell stockholders of record as of September 16, 2016 who held their shares through the Distribution Date. Basic and diluted EPS for all periods prior to the Spin-Off reflect the number of distributed shares, or 30,482,966 shares. For 2016, the distributed shares were treated as issued and outstanding from January 1, 2016 for purposes of calculating historical basic earnings per share.
Use of Estimates – The preparation of the Consolidated Financial Statements in conformity with U.S. GAAP requires management to make estimates and assumptions that affect the reported amounts in the Consolidated Financial Statements and related disclosures in the accompanying Notes. Actual results could differ from those estimates. Estimates and assumptions are periodically reviewed and the effects of changes are reflected in the Consolidated Financial Statements in the period they are determined to be necessary.
Reclassifications – Certain prior period amounts have been reclassified for consistency with the current period presentation.
Recent Accounting Pronouncements – We consider the applicability and impact of all recent accounting standards updates (“ASU’s”). ASU’s not listed below were assessed and determined to be either not applicable or are expected to have minimal impact on the Consolidated Financial Statements.
51
On December 22, 2017, the SEC staff issued Staff Accounting Bulletin No. 118 (SAB 118) to address the application of US GAAP in situations when a registrant does not have the necessary information available, prepared, or analyzed (including computations) in reasonable detail to complete the accounting for certain income tax effects of the 2017 Act. SAB 118 provides guidance for registrants under three scenarios where the measurement of certain tax items is either complete, can be reasonably estimated or cannot be reasonably estimated. The Company has evaluated the 2017 Act and based upon the information available has determined the impacts can be reasonably estimated. The impacts of those items have been reflected in our Consolidated Financial Statements as of December 31, 2017. The impacts of those changes are disclosed in “Note 4. Income Taxes”.
In March 2017, the Financial Accounting Standards Board (“FASB”) issued ASU 2017-07, Compensation - Retirement Benefits (Topic 715), in order to improve the presentation of net periodic pension and postretirement costs. The amendment requires that an employer report the service cost component in the same line item or items as other compensation costs arising from services rendered by the pertinent employees during the period. The other components of net benefit cost including interest cost, actual return on plan assets, gains or loss, amortization of prior service cost or credit, and amortization of the transition asset or obligation are required to be presented in the income statement separately from the service cost component and outside a subtotal of income from operations, if one is presented. The amendments in this ASU also allow only the service cost component to be eligible for capitalization when applicable. The amendments in this update related to income statement activity should be applied retrospectively whereas balance sheet activity should be applied prospectively. For public business entities, the effective date for ASU 2017-07 is annual periods beginning after December 15, 2017, including interim periods within those annual periods. We expect to adopt this guidance effective January 1, 2018 and no impact, other than expense classification, on the Company’s consolidated financial position and results of operations is expected upon adoption.
In January 2017, the FASB issued ASU 2017-04, Intangibles - Goodwill and Other (Topic 350): Simplifying the Test for Goodwill Impairment, which simplifies the accounting for goodwill impairment for all entities by requiring impairment charges to be based on the first step in today’s two-step impairment test under ASC 350. Under the new guidance, if a reporting unit’s carrying amount exceeds its fair value, an entity will record an impairment charge based on that difference. The impairment charge will be limited to the amount of goodwill allocated to that reporting unit. The amendment eliminates the requirement to calculate a goodwill impairment charge by comparing the implied fair value of goodwill with its carrying amount (i.e., Step 2 of today’s goodwill impairment test). The standard will be applied prospectively and is effective for annual and interim impairment tests performed in periods beginning after December 15, 2019. Early adoption is permitted for annual and interim goodwill impairment testing dates after January 1, 2017. The Company elected to adopt ASU 2017-04 early beginning in January 2017 and there was no impact on the Company’s consolidated financial position and results of operations upon adoption.
In January 2017, the FASB issued ASU 2017-01, Business Combinations (Topic 805): Clarifying the Definition of a Business, which clarifies the definition of a business to assist entities with evaluating whether transactions should be accounted for as acquisitions (or disposals) of assets or businesses. The definition of a business affects many areas of accounting including acquisitions, disposals, goodwill, and consolidation. The new guidance requires an entity to first evaluate whether substantially all of the fair value of the gross assets acquired is concentrated in a single identifiable asset or a group of similar identifiable assets. If this threshold is met, the set of transferred assets and activities is not a business. If the threshold is not met, the entity evaluates whether the set meets the requirement that a business include, at a minimum, an input and a substantive process that together significantly contribute to the ability to create outputs. For public business entities, the effective date for ASU 2017-01 was annual periods beginning after December 15, 2017, including interim periods within those periods. The Company elected to adopt ASU 2017-01 early beginning in January 2017 and there was no impact on the Company’s consolidated financial position and results of operations upon adoption.
In August 2016, the FASB issued ASU 2016-15, Statement of Cash Flows (Topic 230): Classification of Certain Cash Receipts and Cash Payments which clarifies how entities should classify certain cash receipts and cash payments on the statement of cash flows. The amended guidance addresses eight specific cash flow issues, including debt prepayment or extinguishment costs, and clarifies how the predominance principle should be applied when cash receipts and cash payments have aspects of more than one class of cash flows. The amended guidance will be effective for interim and annual periods beginning after December 15, 2017; entities will be required to apply the guidance retrospectively and provide the relevant disclosures in ASC 250, in the first interim and annual periods in which they adopt the guidance. The Company plans to adopt this standard effective January 1, 2018 and no impact, other than cash flow classification, on the Company’s consolidated financial position and results of operations is expected upon adoption.
In February 2016, the FASB issued ASU 2016-02, Leases (Topic 842), which requires lessees to recognize most leases on their balance sheets related to the rights and obligations created by those leases. The new standard also requires disclosures to help financial statement users better understand the amount, timing, and uncertainty of cash flows arising from leases. The leasing standard is applicable for most entities starting in 2019. Public business entities are required to apply the leasing
52
standard for annual reporting periods (including interim periods therein) beginning after December 15, 2018. Earlier application is permitted for all entities as of February 25, 2016, the issuance of the final standard. The new standard should be applied under a modified retrospective approach. We are continuing to evaluate the impact of the new standard on our Consolidated Financial Statements and related disclosures. Although we have not yet completed our assessment, adoption of this standard will substantially increase the Company's assets and liabilities due to the recognition of right-of-use assets and associated lease liabilities for all leases in the Consolidated Balance Sheets. However, we do not expect adoption of this standard to have a significant impact on the recognition, measurement or presentation of lease expenses within the Consolidated Statements of Operations or the Consolidated Statements of Cash Flows. Information about our undiscounted future lease payments and the timing of those payments is provided in "Note 8 - Lease Commitments." The Company plans to adopt this standard effective January 1, 2019.
In May 2014, the FASB issued ASU 2014-09, Revenue from Contracts with Customers (Topic 606), which replaces the existing accounting standards for revenue recognition with a single comprehensive five-step model eliminating industry-specific accounting rules. The core principle is to recognize revenue upon the transfer of goods or services to customers at an amount that reflects the consideration expected to be received. The guidance provides a five-step analysis of transactions to determine when and how revenue is recognized. Other major provisions include capitalization of certain contract costs, consideration of time value of money in the transaction price, and allowing estimates of variable consideration to be recognized before contingencies are resolved in certain circumstances. The guidance also requires enhanced disclosures regarding the nature, amount, timing and uncertainty of revenue and cash flows arising from an entity’s contracts with customers. The effective date was deferred for one year to the interim and annual periods beginning on or after December 15, 2017. Early adoption is permitted as of the original effective date – interim and annual periods beginning on or after December 15, 2016. The Company elected to use the retrospective method of transition. During 2017, the Company assessed its revenue streams covered by ASU 2014-09 by reviewing and documenting customer contracts and related transaction support to determine the impact on revenue recognition under the new standard. The Company updated its revenue recognition policies, assessed the design of internal controls and evaluated the expanded disclosure requirements. The Company will adopt this standard effective January 1, 2018 and does not expect any impact upon adoption. Based on the results of the assessment performed to date, the Company has concluded that revenue recognition from the Company's products and other revenue streams is expected to remain unchanged from the Company's current revenue recognition model.
Note 3. Related Party Transactions with Honeywell
The Consolidated Financial Statements have been prepared on a stand-alone basis and are derived in part from the Consolidated Financial Statements and accounting records of Honeywell.
Prior to consummation of the Spin-Off, Honeywell provided certain services, such as legal, accounting, information technology, human resources and other infrastructure support, on behalf of the Business. The cost of these services were allocated to the Business on a direct usage basis when identifiable, with the remainder allocated on the basis of revenues, headcount or other relevant measures. When not specifically identifiable, legal and accounting costs were allocated on the basis of revenues, information technology and human resources were allocated on the basis of headcount and other infrastructure support was allocated on the basis of revenue.
During the nine months ended September 30, 2016 and the year ended December 31, 2015, AdvanSix was allocated $31,877 and $49,292, respectively, of general corporate expenses incurred by Honeywell for certain services, such as legal, accounting, information technology, human resources, other infrastructure support and shared facilities, on behalf of the Business. These expenses have been reflected within Costs of goods sold and Selling, general and administrative expenses in the Consolidated Statements of Operations.
Sales to Honeywell during the nine months ended September 30, 2016 and the year ended were $5,955 and $9,071, respectively. Of these sales, during the nine months ended September 30, 2016 and the year ended December 31, 2015, $5,682 and $7,736, respectively, were sold to Honeywell at zero margin. Costs of goods sold to Honeywell during the nine months ended September 30, 2016 and the year ended December 31, 2015 were $5,842 and $288, respectively.
Purchases from Honeywell during the nine months ended September 30, 2016 and the year ended December 31, 2015 were $3,299 and $4,694, respectively. The total net effect of the settlement of these intercompany transactions, prior to the Spin-off, is reflected in the Consolidated Statements of Cash Flows as a financing activity and in the Consolidated Balance Sheets as Invested equity.
While we were owned by Honeywell, a centralized approach to cash management and financing of operations was used. Prior to consummation of the Spin-Off, the Business’s cash was transferred to Honeywell daily and Honeywell funded the
53
Business’s operating and investing activities as needed. Net transfers to and from Honeywell are included within Invested equity on the Consolidated Balance Sheets. The components of the net transfers to and from Honeywell as of December 31, 2016 and 2015 are as follows:
2016 | 2015 | |||||||
Cash pooling and general financing activities | $ | (73,534 | ) | $ | (84,312 | ) | ||
Distribution to Honeywell in connection with the Spin-Off | (269,347 | ) | — | |||||
Net contribution of assets and liabilities upon Spin-Off | (22,938 | ) | — | |||||
Sales to Honeywell | (5,955 | ) | (9,071 | ) | ||||
Purchases from Honeywell | 3,299 | 4,694 | ||||||
Corporate allocations | 31,877 | 49,292 | ||||||
Income tax expense | 36,712 | 36,461 | ||||||
Net decrease in invested equity | $ | (299,886 | ) | $ | (2,936 | ) | ||
Subsequent to the Spin-Off on October 1, 2016, Honeywell is no longer considered a related party.
Note 4. Income Taxes
2017 | 2016 | 2015 | |||||||||
Income (loss) before taxes | |||||||||||
U.S | $ | 144,499 | $ | 55,189 | $ | 103,115 | |||||
Non-U.S | 133 | (1,414 | ) | (2,878 | ) | ||||||
$ | 144,632 | $ | 53,775 | $ | 100,237 | ||||||
Income taxes
Income tax expense (benefit) consists of:
Years Ended December 31, | |||||||||||
2017 | 2016 | 2015 | |||||||||
Current Provision: | |||||||||||
Federal | $ | 3,682 | $ | 6,875 | $ | 23,023 | |||||
State | 1,743 | 1,290 | 4,241 | ||||||||
Non-U.S | 22 | (71 | ) | (716 | ) | ||||||
$ | 5,447 | $ | 8,094 | $ | 26,548 | ||||||
Deferred Provision: | |||||||||||
Federal | $ | (6,824 | ) | $ | 10,908 | $ | 8,372 | ||||
State | (700 | ) | 638 | 1,527 | |||||||
Non-U.S | 10 | (12 | ) | 14 | |||||||
(7,514 | ) | 11,534 | 9,913 | ||||||||
$ | (2,067 | ) | $ | 19,628 | $ | 36,461 | |||||
54
The U.S. federal statutory income tax rate is reconciled to the effective income tax rate as follows:
Years Ended December 31, | ||||||||
2017 | 2016 | 2015 | ||||||
U.S. federal statutory income tax rate | 35.0 | % | 35.0 | % | 35.0 | % | ||
2017 Act | (36.9 | )% | — | % | — | % | ||
U.S. state income taxes | 2.6 | % | 2.3 | % | 3.7 | % | ||
U.S. state income tax rate change | (1.7 | )% | — | % | — | % | ||
Manufacturing incentives | (0.3 | )% | (1.8 | )% | (2.6 | )% | ||
Tax rate differential on non-U.S. earnings | — | % | 0.8 | % | 0.3 | % | ||
Other, net | (0.1 | )% | 0.2 | % | — | |||
(1.4 | )% | 36.5 | % | 36.4 | % | |||
On December 22, 2017 the U.S. government enacted significant changes to federal tax law following the passage of the Tax Cuts and Jobs Act (the “2017 Act”). The 2017 Act significantly changes the U.S. corporate tax system. The Company has reasonably estimated the accounting for the effects of the 2017 Act during the year ended December 31, 2017. Our financial statements for the year ended December 31, 2017 reflect certain effects of the 2017 Act including a reduction in the corporate tax rate to 21% from 35% and changes made to executive compensation rules. As a result of these changes to tax laws and tax rates under the 2017 Act, the Company incurred a reduction in income tax expense of $53,424 primarily related to the reduction in the federal corporate tax rate to 21% during the year ended December 31, 2017.
Given the significant changes resulting from and complexities associated with the 2017 Act, the financial impacts for the fourth-quarter and full-year 2017 are provisional and subject to further analysis, interpretation and clarification of the 2017 Act, which could result in changes to these estimates during 2018. The Company will reflect any adjustments to provisional amounts within one year from the enactment date of the 2017 Act, if applicable.
The Company’s effective income tax rate for 2017 was lower compared to the U.S. Federal statutory rate of 35% due primarily to the enactment of the 2017 Act and the related remeasurement of deferred tax assets and liabilities. The Company also intends to make certain state tax apportionment elections in 2017 which results in a state income tax rate change that is expected to lower the Company’s overall state tax liability dependent upon the Company achieving minimum employment thresholds in tax years 2017 to 2019.
The Company’s effective income tax rates for 2016 and 2015 were higher compared to the U.S. Federal statutory rate of 35% due primarily to state taxes and, to a lesser extent, losses incurred in foreign jurisdictions with rates lower than the U.S. Federal statutory rate, partially offset by the federal tax credit for research activities and the U.S. manufacturing incentive credits.
During the third and fourth quarters of 2017, the Company adjusted its deferred tax assets and liabilities to account for changes to the September 30, 2016 deferred tax balances related to the separation from Honeywell. The changes were attributable to the completion of Honeywell’s 2016 income tax return and related return to provision adjustment. The adjustment resulted in a $12.5 million decrease in Deferred income taxes and an increase in Additional paid in capital.
For 2017, 2016 and 2015, there were no unrecognized tax benefits recorded by the Company. Although there are no unrecognized income tax benefits, when applicable, the Company’s policy is to report interest expense related to unrecognized income tax benefits in the income tax provision.
55
Deferred tax assets (liabilities)
The tax effects of temporary differences which give rise to future income tax benefits and expenses are as follows:
December 31, | |||||||
2017 | 2016 | ||||||
Deferred tax assets: | |||||||
Net Operating Loss | $ | 74 | $ | 12,560 | |||
Accruals and Reserves | 1,917 | 6,772 | |||||
Inventory | — | 215 | |||||
Pension Obligation | 7,251 | 13,086 | |||||
Equity Compensation | 1,052 | 513 | |||||
Other | — | 28 | |||||
Total gross deferred tax assets | 10,294 | 33,174 | |||||
Less: Valuation Allowance | — | — | |||||
Total deferred tax assets | $ | 10,294 | $ | 33,174 | |||
Deferred tax liabilities: | |||||||
Property, plant & equipment | $ | (91,985 | ) | $ | (145,712 | ) | |
Intangibles | (2,487 | ) | (1,262 | ) | |||
Inventory | (6,461 | ) | — | ||||
Other | (1,637 | ) | (400 | ) | |||
Total deferred tax liabilities | (102,570 | ) | (147,374 | ) | |||
Net deferred taxes | $ | (92,276 | ) | $ | (114,200 | ) | |
The net deferred taxes are primarily related to U.S. operations. As of December 31, 2017, the Company anticipates utilizing its entire federal net operating loss (“NOL”) carryforward from the prior year. The Company has a foreign NOL carryforward of $173 and $213, respectively, at December 31, 2017 and 2016 which is not subject to expiration. We also have remaining state NOL carryforwards of $462 in two jurisdictions at December 31, 2017 and $14,248 at December 31, 2016 most materially in Virginia. The state NOL carryforwards begin to expire in 2037. There were no material tax credit carryforwards at December 31, 2017 or 2016. We believe that the foreign and state NOL carryforwards and other deferred tax assets are more likely than not to be realized and we have not recorded a valuation allowance against the deferred tax assets.
As of December 31, 2017 and 2016, there were no undistributed earnings of the Business’ non-U.S. subsidiary and, as such, we have not provided a deferred tax liability for undistributed earnings.
Note 5. Accounts and Other Receivables – Net
December 31, | |||||||
2017 | 2016 | ||||||
Accounts receivables | $ | 188,477 | $ | 119,475 | |||
Other | 8,936 | 15,407 | |||||
197,413 | 134,882 | ||||||
Less – allowance for doubtful accounts | (1,410 | ) | (3,211 | ) | |||
Total accounts and other receivables – net | $ | 196,003 | $ | 131,671 | |||
56
The roll-forward of allowance for doubtful accounts are summarized in the table below:
Balance at Beginning of Year | Charged to Costs and Expenses | Charged to Other Accounts | Deductions | Balance at End of Year | |||||||||||||||
Year ended December 31, 2017 | $ | 3,211 | $ | 725 | $ | (34 | ) | $ | (2,492 | ) | $ | 1,410 | |||||||
Year ended December 31, 2016 | 2,875 | 334 | 74 | (72 | ) | 3,211 | |||||||||||||
Year ended December 31, 2015 | 484 | 2,477 | — | (86 | ) | 2,875 | |||||||||||||
Note 6. Inventories
December 31, | |||||||
2017 | 2016 | ||||||
Raw materials | $ | 48,502 | $ | 68,900 | |||
Work in progress | 50,511 | 47,759 | |||||
Finished goods | 35,430 | 19,069 | |||||
Spares and other | 23,091 | 23,129 | |||||
157,534 | 158,857 | ||||||
Reduction to LIFO cost basis | (28,326 | ) | (29,879 | ) | |||
Total inventories | $ | 129,208 | $ | 128,978 | |||
In the third quarter of 2017, the Company recognized the effects of an interim reduction of inventory levels which we did not expect to reinstate by year-end 2017 resulting in a pre-tax charge of approximately $4.4 million to income. Due to the timing of raw material purchases and fulfillment of customer orders in the fourth quarter of 2017, the third quarter charge was reversed because of higher than anticipated inventory levels at December 31, 2017. As a result, there were no reductions of LIFO inventories for the year ended December 31, 2017.
Note 7. Property, Plant, Equipment – Net
December 31, | |||||||
2017 | 2016 | ||||||
Land and improvements | $ | 6,396 | $ | 6,396 | |||
Machinery and equipment | 1,165,304 | 1,116,758 | |||||
Buildings and improvements | 165,612 | 155,749 | |||||
Construction in progress | 75,322 | 67,829 | |||||
1,412,634 | 1,346,732 | ||||||
Less – accumulated depreciation | (800,022 | ) | (771,357 | ) | |||
Total property, plant, equipment – net | $ | 612,612 | $ | 575,375 | |||
Capitalized interest was $3,637, $2,725 and $2,870 for the years ended December 31, 2017, 2016 and 2015, respectively.
Depreciation expense was $46,428, $39,304 and $35,703 for the years ended December 31, 2017, 2016 and 2015, respectively.
Note 8. Lease Commitments
The Company has entered into agreements to lease transportation equipment, storage facilities, office space, dock access and other equipment. The operating leases have initial terms of up to 20 years with some containing renewal options subject to customary conditions.
57
Future minimum lease payments under operating leases having an initial or remaining non-cancellable lease terms in excess of one year are as follows:
December 31, | |||
2018 | $ | 32,661 | |
2019 | 21,002 | ||
2020 | 12,488 | ||
2021 | 11,780 | ||
2022 | 10,628 | ||
Thereafter | 38,213 | ||
Total | $ | 126,772 | |
Rent expense was $19,912, $19,357 and $15,984 for the years ended December 31, 2017, 2016 and 2015, respectively.
Note 9. Long-term Debt and Credit Agreement
The Company’s debt at December 31, 2017 consisted of the following:
Total term loan outstanding | $ | 265,214 | |
Amounts outstanding under the Revolving Credit Facility | — | ||
Total outstanding indebtedness | 265,214 | ||
Less: amounts due within one year | 16,875 | ||
Total long term debt due after one year | $ | 248,339 | |
At December 31, 2017, the Company assessed the amount recorded under the Term Loan (defined below) and the Revolving Credit Facility (defined below) and determined that such amounts approximated fair value. The fair values of the debt are based on quoted inactive market prices and are therefore classified as Level 2 within the valuation hierarchy.
Scheduled principal repayments under the Term Loan subsequent to December 31, 2017 are as follows:
2018 | $ | 16,875 | |
2019 | 27,000 | ||
2020 | 27,000 | ||
2021 | 195,750 | ||
Total | $ | 266,625 | |
Credit Agreement
On September 30, 2016, in connection with the consummation of the Spin-Off, the Company as the borrower, entered into a Credit Agreement with Bank of America, as administrative agent (the “Credit Agreement”). The Credit Agreement consists of a $270.0 million term loan (the “Term Loan”) and a $155.0 million revolving loan facility (the “Revolving Credit Facility”). The Revolving Credit Facility includes a $25.0 million letter-of-credit sub-facility and a $20.0 million Swing-Line Loan sub-facility, issuances against which reduce the available capacity for borrowing. As of December 31, 2017, $266.6 million of the Term Loan was outstanding and there was $1.3 million of credit capacity utilized by letters of credit against which no funds have been drawn. There were no outstanding borrowings against the Revolving Credit Facility including the Swing-Line Loan sub-facility. The unutilized portion of the Revolving Credit Facility is subject to an annual commitment fee of 0.25% to 0.40% depending on the Company’s consolidated leverage ratio. The Term Loan and the Revolving Credit Facility both have a scheduled maturity date of September 30, 2021. The interest rates on borrowings under the facilities are based on, at the option of the Company, either: (a) the London Interbank Offered Rate (“LIBOR”), plus a margin of 2.25% to 3.00% depending on the Company’s consolidated leverage ratio, or (b) the higher of (i) the Federal Funds Rate plus 0.5%, (ii) Bank of America’s “prime rate”, and (iii) LIBOR plus 1.0%, plus a margin of 1.25% to 2.00% depending on the Company’s consolidated leverage ratio.
The proceeds of the Term Loan, net of adjustments for certain working capital and other items, were used to fund a cash distribution to Honeywell in connection with the Spin-Off. Amounts available under the Revolving Credit Facility may be used for working capital, general corporate purposes, and other uses, all as more fully set forth in the Credit Agreement.
58
The Company incurred approximately $1.9 million in debt issuance costs related to the Term Loan and $1.0 million in costs related to the Revolving Credit Facility. The debt issuance costs associated with the Term Loan were recorded as a reduction of the principal balance of the debt, and the Revolving Credit Facility costs were capitalized in Other assets. All issuance costs are being amortized through interest expense for the duration of each respective debt facility. The accretion in interest expense during the year ended December 31, 2017 was $0.6 million. At December 31, 2017, there was $1.4 million of unamortized deferred issuance costs netted against the Term-Loan.
The obligations under the Credit Agreement are secured by liens on substantially all of the assets of AdvanSix Inc.
The Credit Agreement contains customary covenants limiting the ability of the Company and its subsidiaries to, among other things, pay cash dividends, incur debt or liens, redeem or repurchase stock of the Company, enter into transactions with affiliates, make investments, make capital expenditures, merge or consolidate with others or dispose of assets. The Credit Agreement also contains financial covenants that require the Company to maintain a Consolidated Interest Coverage Ratio (as defined in the Credit Agreement) of not less than 3:00 to 1:00 and to maintain a Consolidated Leverage Ratio of (i) 3:00 to 1:00 or less for the fiscal quarter ending September 30, 2016, through and including the fiscal quarter ending March 31, 2018, (ii) 2:75 to 1:00 or less for the fiscal quarter ending June 30, 2018, through and including the fiscal quarter ending March 31, 2019, and (iii) 2:50 to 1:00 or less for the fiscal quarter ending June 30, 2019, and each fiscal quarter thereafter (subject to the Company’s option to elect a consolidated leverage ratio increase in connection with certain acquisitions). If the Company does not comply with the covenants in the Credit Agreement, the lenders may, subject to customary cure rights, require the immediate payment of all amounts outstanding under the Credit Agreement.
The Company had approximately $2.3 million of bilateral letter of credit agreements outstanding at December 31, 2017.
In February 2018, the Company entered into an amendment of the Credit Agreement. For a discussion of the amendment to the Credit Agreement, please refer to Note 18. "Subsequent Events."
Note 10. Postretirement Benefit Obligations
Defined Contribution Benefit Plan
On January 1, 2017, the Company established a defined contribution plan which covers all eligible U.S. employees. Our plan allows eligible employees to contribute a portion of their cash compensation to the plan on a tax-deferred basis to save for their future retirement needs. The Company matches 50% of the first 8% of contributions for employees covered by a collective bargaining agreement and matches 75% of the first 8% of the employee’s contribution election for all other employees. The plan’s matching contributions vest after three years of service with the Company. The Company may also provide an additional discretionary retirement savings contribution which is at the sole discretion of the Company. The Company made contributions to the defined contribution plan of $5,379 for the year ended December 31, 2017.
Defined Benefit Pension Plan
Prior to the Spin-Off certain of our employees participated in a defined benefit pension plan (the “Shared Plan”) sponsored by Honeywell which includes participants of other Honeywell subsidiaries and operations. We accounted for our participation in the Shared Plan as a multi-employer benefit plan. Accordingly, we did not record an asset or liability to recognize the funded status of the Shared Plan. The related pension expense was allocated based on annual service cost of active participants and reported within Costs of goods sold and Selling, general and administrative expenses in the Statements of Operations. The pension expense related to our participation in the Shared Plan for the nine months ended September 30, 2016 and year ended December 31, 2015 was $5,151 and $10,215, respectively.
As of the date of separation from Honeywell, these employees’ entitlement to benefits in Honeywell’s plans was frozen and they will accrue no further benefits in Honeywell’s plans. Honeywell retained the liability for benefits payable to eligible employees, which are based on age, years of service and average pay upon retirement.
Upon consummation of the Spin-Off, AdvanSix employees who were participants in a Honeywell defined benefit pension plan became participants in the AdvanSix defined benefit pension plan (“AdvanSix Retirement Earnings Plan”). The AdvanSix Retirement Earnings Plan has the same benefit formula as the Honeywell defined benefit pension plan. Moreover, vesting service, benefit accrual service and compensation credited under the Honeywell defined benefit pension plan apply to the determination of pension benefits under the AdvanSix Retirement Earnings Plan. Benefits earned under the AdvanSix Retirement Earnings Plan shall be reduced by the value of benefits accrued under the Honeywell plans.
59
The following tables summarize the balance sheet impact, including the benefit obligations, assets and funded status associated with the AdvanSix Retirement Earnings Plan.
Change in benefit obligation: | |||
Benefit obligation at January 1, 2017 | $ | 33,887 | |
Service Cost | 7,629 | ||
Interest Cost | 1,333 | ||
Actuarial losses (gains) | 8,190 | ||
Benefits Paid | (21 | ) | |
Benefit obligation at December 31, 2017 | $ | 51,018 | |
Change in plan assets: | |||
Fair value of plan assets at January 1, 2017 | $ | — | |
Actual return on plan assets | 592 | ||
Benefits paid | (21 | ) | |
Company contributions during 2017 | 16,750 | ||
Fair value of plan assets at December 31, 2017 | 17,321 | ||
Funded status of plan | $ | 33,697 | |
Amounts recognized in Balance Sheet consists of: | |||
Accrued pension liabilities-current (1) | $ | 301 | |
Accrued pension liabilities-noncurrent (2) | 33,396 | ||
Total pension liabilities recognized | $ | 33,697 | |
(1) | Included in accrued liabilities on Balance Sheet |
(2) | Included in postretirement benefit obligations on Balance Sheet |
Pension amount recognized in accumulated other comprehensive loss (income) associated with the Company's pension plan at December 31, 2017 are as follows:
Transition obligation | $ | — | |
Prior service cost | — | ||
Net actuarial loss | 4,743 | ||
Pension amounts recognized in other comprehensive loss (income) | $ | 4,743 | |
The components of net periodic benefit cost and other amounts recognized in other comprehensive income for our pension plan include the following components:
Years ended December 31, | ||||||||||||
2017 | 2016 | 2015 | ||||||||||
Net periodic pension cost (benefit) | ||||||||||||
Service cost | $ | 7,629 | $ | 1,796 | $ | — | ||||||
Interest cost | 1,333 | 315 | — | |||||||||
Expected return on plan assets | (302 | ) | — | — | ||||||||
Recognition of actuarial losses | — | — | — | |||||||||
Net periodic Pension Cost | 8,660 | 2,111 | — | |||||||||
Other changes in benefits obligations recognized in other comprehensive loss (income) | ||||||||||||
Actuarial losses (gains) | 7,902 | (3,159 | ) | — | ||||||||
Total recognized in other comprehensive income | 7,902 | (3,159 | ) | — | ||||||||
Total net periodic pension cost (benefit) recognized in Other comprehensive income | $ | 16,562 | $ | (1,048 | ) | $ | — | |||||
60
The estimated actuarial gain that will be amortized from accumulated other comprehensive income (loss) into net periodic benefit cost in 2017 is expected to be nil.
Significant actuarial assumptions used in determining the benefit obligations and net periodic benefit cost for our pension plan were as follows:
Key actuarial assumptions used to determine benefit obligations at December 31, | 2017 | 2016 | |
Effective discount rate for benefit obligation | 3.9% | 4.5% | |
Expected annual rate of compensation increase | 2.8% | 2.8% | |
Key actuarial assumptions used to determine the net periodic benefit cost for the years ended December 31, | 2017 | 2016 | |
Effective discount rate for service cost | 4.5% | 3.7% | |
Effective discount rate for interest cost | 4.0% | 3.6% | |
Expected long-term rate of return | 5.8% | 5.8% | |
Expected annual rate of compensation increase | 2.8% | 3.8% | |
The discount rate for our pension plan reflects the current rate at which the associated liabilities could be settled at the measurement date of December 31, 2017. To determine discount rates for our pension plan, we use a modeling process that involves matching the expected cash outflows of our benefit plan to a yield curve constructed from a portfolio of high quality, fixed-income debt instruments. We use the single weighted-average yield of this hypothetical portfolio as a discount rate benchmark.
The long-term expected rate of return on funded assets is developed by using forward-looking long-term return assumptions for each asset class. Management incorporates the expected future investment returns on current and planned asset allocations using information from external investment consultants as well as management judgment. A single rate is then calculated as the weighted average of the target asset allocation percentages and the long-term return assumption for each asset class.
The accumulated benefit obligation for our pension plan was $31.2 million and $31.2 million as of December 31, 2017 and December 31, 2016, respectively.
Benefit payments, including amounts to be paid from Company assets, and reflecting expected future service, as appropriate, are expected to be paid during the following years:
2018 | $ | 302 | |
2019 | 492 | ||
2020 | 702 | ||
2021 | 964 | ||
2022 | 1,159 | ||
2023–2027 | 9,444 | ||
Our general funding policy for our pension plan is to contribute amounts at least sufficient to satisfy regulatory funding standards. We plan to make estimated payments through such time as the plan is fully funded. The Company made pension plan contributions during 2017 sufficient to satisfy pension funding requirements under the AdvanSix Retirement Earnings Plan in the aggregate amount of approximately $16.8 million. The Company made pension plan contributions of $2.2 million in the first quarter of 2017, $1.6 million in the second quarter of 2017, $11.0 million in the third quarter of 2017 and $2.0 million in the fourth quarter of 2017. To date, Company made a $2.0 million contribution in January 2018. The Company plans to make pension plan contributions during 2018 sufficient to satisfy pension funding requirements aggregating approximately $8 to $10 million as well as additional contributions in future years sufficient to satisfy pension funding requirements in those periods. There were no pension plan contributions in 2016 and 2015.
Pension Plan Contributions | ||||||||
Years ended December 31, | ||||||||
2017 | 2016 | 2015 | ||||||
$ | 16,750 | — | — | |||||
61
The pension plan assets are invested through a master trust fund. The strategic asset allocation for the trust fund is selected by the Company's Investment Committee reflecting the results of comprehensive asset and liability modeling. The Investment Committee establishes strategic asset allocation percentage targets and appropriate benchmarks for significant asset classes with the aim of achieving a prudent balance between return and risk.
The target asset allocation % for the Company's pension plan assets is summarized as follows:
December 31, 2017 | |||
Cash and cash equivalents | 2% | ||
US and non-US equity securities | 65% | ||
Fixed income / real estate / other securities | 33% | ||
Total Pension Assets | 100% | ||
Fixed income and other securities include investment grade securities covering the Treasury, agency, asset-backed, mortgage-backed and credit sectors of the U.S. Bond Market, as well as listed real estate companies and real estate investment trusts located in both developed and emerging markets.
Fair Value at December 31, | |||||||||
Fair Value Measurements | 2017 | 2016 | 2015 | ||||||
Investments valued using NAV per share | |||||||||
Emerging Markets Region Equities | $ | 1,090 | $ | — | $ | — | |||
International Region Equities | 3,215 | — | — | ||||||
United States Equities | 7,273 | — | — | ||||||
United States Bonds | 4,723 | — | — | ||||||
Real Estate | 872 | — | — | ||||||
Cash Fund | 148 | — | |||||||
Total Pension Plan Assets at Fair Value | $ | 17,321 | $ | — | $ | — | |||
The pension plan assets are invested in collective investment trust funds as shown above. These investments are measured at fair value using the net asset value per share practical expedient and have not been classified in the fair value hierarchy.
Note 11. Financial Instruments and Fair Value Measures
Credit and Market Risk – Financial instruments, including derivatives, expose the Company to counterparty credit risk for non-performance and to market risk related to changes in commodity prices. The Company manages its exposure to counterparty credit risk through specific minimum credit standards, diversification of counterparties, and procedures to monitor concentrations of credit risk. The Company’s counterparties in derivative transactions are substantial investment and commercial banks with significant experience using such derivative instruments. The Company monitors the impact of market risk on the fair value and cash flows of its derivative and other financial instruments considering reasonably possible changes in exchange rates and restricts the use of derivative financial instruments to hedging activities.
The Company continually monitors the creditworthiness of its customers to which it grants credit terms in the normal course of Company. The terms and conditions of credit sales are designed to mitigate or eliminate concentrations of credit risk with any single customer. The Company has one major customer that accounts for approximately 33% and 16% of trade accounts receivable – net at December 31, 2017 and 2016, respectively.
Commodity Price Risk Management – The Company's exposure to market risk for commodity prices can result in changes in the cost of production. We primarily mitigate our exposure to commodity price risk through the use of long-term, formula-based price contracts with our suppliers and formula-based price agreements with customers. We also enter into forward commodity contracts with third parties designated as hedges of anticipated purchases of natural gas. Forward commodity contracts are marked-to-market, with the resulting gains and losses recognized in earnings, in the same category as the items being hedged, when the hedged transaction is recognized. At December 31, 2017 and 2016, we had no contracts with notional amounts related to natural gas forward commodity agreements.
62
Fair Value of Financial Instruments – The FASB’s accounting guidance defines fair value as the price that would be received to sell an asset or paid to transfer a liability in an orderly transaction between market participants at the measurement date (exit price). The FASB’s guidance classifies the inputs used to measure fair value into the following hierarchy:
Level 1 | Unadjusted quoted prices in active markets for identical assets or liabilities |
Level 2 | Unadjusted quoted prices in active markets for similar assets or liabilities, or |
Unadjusted quoted prices for identical or similar assets or liabilities in markets that are not active, or Inputs other than quoted prices that are observable for the asset or liability | |
Level 3 | Unobservable inputs for the asset or liability |
Financial and non-financial assets and liabilities are classified in their entirety based on the lowest level of input that is significant to the fair value measurement.
The carrying value of accounts receivables and payables contained in the Consolidated Balance Sheets approximates fair value.
Note 12. Commitments and Contingencies
Litigation
The Company is subject to a number of lawsuits, investigations and disputes (some of which involve substantial amounts claimed) arising out of the conduct of the Company or other third parties in the normal and ordinary course of business, including matters relating to commercial transactions. A liability is recognized for any contingency that is probable of occurrence and reasonably estimable. The Company continually assesses the likelihood of adverse judgments or outcomes in these matters, as well as potential ranges of possible losses (taking into consideration any insurance recoveries), based on an analysis of each matter with the assistance of legal counsel and, if applicable, other experts.
Given the uncertainty inherent in such lawsuits, investigations and disputes, the Company does not believe it is possible to develop estimates of reasonably possible loss in excess of current accruals for these matters. Considering the Company’s past experience and existing accruals, the Business does not expect the outcome of these matters, either individually or in the aggregate, to have a material adverse effect on the Company’s Consolidated Balance Sheets, results of operations or cash flows. Potential liabilities are subject to change due to new developments, changes in settlement strategy or the impact of evidentiary requirements, which could cause the Company to pay damage awards or settlements (or become subject to equitable remedies) that could have a material adverse effect on the Company’s consolidated results of operations, balance sheet and/or operating cash flows in the periods recognized or paid.
Unconditional Purchase Obligations:
In the normal course of business, the Company makes commitments to purchase goods with various vendors in the normal course of business which are consistent with our expected requirements and primarily relate to cumene, oleum, sulfur and natural gas as well as a long term agreement for loading, unloading and the handling of a portion of our ammonium sulfate export volumes.
Future minimum payments for these unconditional purchase obligations as of December 31, 2017 are as follows (dollars in thousands):
Year | Amount | ||
2018 | $ | 83,793 | |
2019 | 46,798 | ||
2020 | 37,705 | ||
2021 | 37,525 | ||
2022 | 17,668 | ||
Thereafter | 90,940 | ||
$ | 314,429 | ||
63
Note 13. Changes in Accumulated Other Comprehensive Income (Loss)
The components of accumulated other comprehensive income (loss) are as follows:
Currency Translation Adjustment | Postretirement Benefit Obligations Adjustment | Changes in Fair Value of Effective Cash Flow Hedges | Accumulated Other Comprehensive Income (loss) | ||||||||||||
Balance at December 31, 2014 | $ | (3,762 | ) | $ | — | $ | (1,452 | ) | $ | (5,214 | ) | ||||
Other comprehensive income (loss) | (1,390 | ) | — | 2,865 | 1,475 | ||||||||||
Amounts reclassified from accumulated other comprehensive income (loss) | — | — | — | — | |||||||||||
Income tax expense (benefit) | — | — | — | — | |||||||||||
Current period change | (1,390 | ) | — | 2,865 | 1,475 | ||||||||||
Balance at December 31, 2015 | (5,152 | ) | — | 1,413 | (3,739 | ) | |||||||||
Other comprehensive income (loss) | 154 | 3,159 | (1,413 | ) | 1,900 | ||||||||||
Amounts reclassified from accumulated other comprehensive income (loss) | — | — | — | — | |||||||||||
Income tax expense (benefit) | — | (1,196 | ) | — | (1,196 | ) | |||||||||
Current period change | 154 | 1,963 | (1,413 | ) | 704 | ||||||||||
Balance at December 31, 2016 | (4,998 | ) | 1,963 | — | (3,035 | ) | |||||||||
Other comprehensive income (loss) | 12 | (7,902 | ) | — | (7,890 | ) | |||||||||
Amounts reclassified from accumulated other comprehensive income (loss) | — | — | — | — | |||||||||||
Income tax expense (benefit) | — | 1,879 | — | 1,879 | |||||||||||
Current period change | 12 | (6,023 | ) | — | (6,011 | ) | |||||||||
Balance at December 31, 2017 | $ | (4,986 | ) | $ | (4,060 | ) | $ | — | $ | (9,046 | ) | ||||
Note 14. Earnings Per Share
On October 1, 2016, the date of consummation of the Spin-Off, 30,482,966 shares of the Company’s common stock were distributed to Honeywell stockholders of record as of September 16, 2016 who held their shares through the Distribution Date. Basic and Diluted EPS for all periods prior to the Spin-Off reflect the number of distributed shares, or 30,482,966 shares. For the 2016 year to date calculations, these shares are treated as issued and outstanding from January 1, 2016 for purposes of calculating historical basic earnings per share.
The details of the earnings per share calculations for the years ended December 31, 2017, 2016 and 2015 are as follows:
Years Ended December 31, | |||||||||||
2017 | 2016 | 2015 | |||||||||
Basic | |||||||||||
Net Income | $ | 146,699 | $ | 34,147 | $ | 63,776 | |||||
Weighted average common shares outstanding | 30,482,966 | 30,482,966 | 30,482,966 | ||||||||
EPS – Basic | $ | 4.81 | $ | 1.12 | $ | 2.09 | |||||
64
Years Ended December 31, | |||||||||||
2017 | 2016 | 2015 | |||||||||
Diluted | |||||||||||
Net Income | $ | 146,699 | $ | 34,147 | $ | 63,776 | |||||
Weighted average common shares outstanding – Basic | 30,482,966 | 30,482,966 | 30,482,966 | ||||||||
Dilutive effect of unvested equity awards | 608,635 | 20,621 | — | ||||||||
Weighted average common shares outstanding – Diluted | 31,091,601 | 30,503,587 | 30,482,966 | ||||||||
EPS – Diluted | $ | 4.72 | $ | 1.12 | $ | 2.09 | |||||
Diluted EPS is computed based upon the weighted average number of common shares outstanding for the year plus the dilutive effect of common stock equivalents using the treasury stock method and the average market price of our common stock for the year.
Note 15. Stock-Based Compensation Plans
On September 8, 2016, prior to the Spin-Off, our Board adopted, and Honeywell, as our sole stockholder, approved, the 2016 Stock Incentive Plan of AdvanSix Inc. (the “Equity Plan”). Following the Spin-Off, the material terms of performance-based compensation under the Equity Plan were approved by the Company's stockholders for tax purposes at our 2017 annual meeting of stockholders. The Equity Plan provides for the grant of stock options, stock appreciation rights, performance awards, restricted stock units, restricted stock, other stock-based awards and non-share-based awards. The maximum aggregate number of shares of our common stock that may be issued under all stock-based awards granted under the Equity Plan is 3,350,000. Of those shares, only 1,750,000 may be subject, on a one-for-one basis, to awards granted under the Equity Plan that are not stock options or stock appreciation rights (“full-value awards”). After the number of shares subject to full-value awards exceed such limit, each share subject to future full-value awards would reduce the number of shares available for grant under the Equity Plan by four shares, with the exception of awards to non-employee directors, which shall not count towards such limit and shares related to such awards shall always be counted on a one-for-one basis.
Under the terms of the Equity Plan, there were 2,085,212 shares of AdvanSix common stock available for future grants of full-value awards, of which 657,217 were available for awards other than full-value awards on a one-for-one basis, at December 31, 2017.
Since the Spin-Off on October 1, 2016, the Company has granted the following equity awards under the Equity Plan:
• | On October 3, 2016, 783,159 Restricted stock units ("RSUs") were granted to officers of AdvanSix with three-year vesting periods. |
• | On October 3, 2016, 36,564 RSUs were granted to members of our Board of Directors as director compensation with three-year vesting periods. |
• | On October 25, 2016, Honeywell RSU awards held by certain of our key employees who would otherwise forfeit prior Honeywell awards as a result of the Spin-Off were issued replacement grants in the amount of 88,817 RSUs with substantially the same vesting schedule as the forfeited awards. Compensation expense for these awards will continue to be recognized ratably over the remaining terms of the unvested awards, which ranged from 18 to 42 months. |
• | On March 8, 2017, the Company granted equity awards representing 333,719 shares of common stock to Company employees consisting of 175,026 stock options, 89,896 performance share units ("PSUs") (at target) and 68,797 RSUs. These equity awards have a per share strike price or grant date fair value per share of $26.66 with vesting periods ranging from 12 to 36 months. |
65
• | On June 1, 2017, the Company granted equity awards representing 28,856 shares of common stock to Company employees and the Company's Board of Directors consisting of RSUs. These equity awards have a grant date fair value per share of $29.25 with vesting periods ranging from 12 to 36 months. |
Restricted Stock Units – The Company granted RSUs to key management employees and directors that generally vest over periods ranging from 1 to 3 years. Upon vesting, the RSUs entitle the holder to receive one share of AdvanSix Inc. common stock for each RSU at time of vesting and are payable in AdvanSix common stock upon vesting. The fair value of all stock-settled RSUs is based upon the market price of the underlying common stock as of the grant date.
The following table summarizes information about RSU activity related to the Equity Plan:
Number of Restricted Stock Units (In Thousands) | Weighted Average Grant Date Fair Value (Per Share) | |||||
Non-vested at October 1, 2016 | — | $ | — | |||
Granted | 908 | 16.41 | ||||
Vested | — | — | ||||
Forfeited | — | — | ||||
Non-vested at December 31, 2016 | 908 | 16.41 | ||||
Granted | 98 | 27.43 | ||||
Vested | — | — | ||||
Forfeited | (2 | ) | 27.73 | |||
Non-vested at December 31, 2017 | 1,004 | $ | 17.46 | |||
As of December 31, 2017, there was approximately $10.0 million of total unrecognized compensation cost related to non-vested RSUs granted under the Equity Plan which is expected to be recognized over a weighted-average period of 1.8 years.
The following table summarizes information about the income statement impact from RSUs for the years ended December 31, 2017 and 2016:
Year Ended December 31, 2017 (In Thousands) | Year Ended December 31, 2016 (In Thousands) | |||||
Compensation expense | $ | 6,141 | $ | 1,327 | ||
Future income tax benefit recognized | $ | 755 | $ | 513 | ||
Stock Options – The exercise price, term and other conditions applicable to each option granted under the Equity Plan are generally determined by Compensation Committee of the Company's Board of Directors. The exercise price of stock options is set on the grant date and may not be less than the fair market value per share of our stock on that date. The fair value is recognized as an expense over the employee’s requisite service period (generally the vesting period of the award). Options generally vest over periods ranging from 1 to 3 years.
The following table summarizes information about the income statement impact from stock options for the year ended December 31, 2017. There were no stock options granted prior to 2017.
Year Ended December 31, 2017 (In Thousands) | |||
Compensation expense | $ | 969 | |
Future income tax benefit recognized | $ | 230 | |
The fair value related to stock options granted was determined using Black-Scholes option pricing model and the weighted average assumptions are shown in the table below:
66
Key Black-Scholes Assumptions | Year Ended December 31, 2017 |
Risk-free interest rate | 2.2% |
Expected term (years) | 6 |
Volatility | 37.0% |
Dividend yield | — |
Fair value per stock option | $10.48 |
The fair value of each option award is estimated on the date of grant using the Black-Scholes option pricing model. Volatility is determined based on the average volatility of peer companies with similar option terms. Expected term is determined using a simplified approach, calculated as the mid-point between the vesting period and the contractual term of the award. The risk-free interest rate is determined based upon the yield of an outstanding U.S. Treasury note with a term equal to the expected term of the option granted.
The following table summarizes information about stock option activity related to the Equity Plan:
Number of Shares (in thousands) | Weighted Average Exercise Price (per share) | Weighted Average Remaining Contractual Term (years) | Aggregate Intrinsic Value (in thousands) | ||||||||||
Outstanding at December 31, 2016 | — | $ | — | — | |||||||||
Granted | 175 | 10.48 | |||||||||||
Exercised | — | — | |||||||||||
Forfeited | (3 | ) | 10.48 | ||||||||||
Expired | — | — | |||||||||||
Outstanding at December 31, 2017 | 172 | $ | 10.48 | 9.31 | $ | 5,434 | |||||||
Exercisable at December 31, 2017 | — | $ | — | — | $ | — | |||||||
The aggregate intrinsic values in the table above represent the total pre-tax intrinsic value (the difference between the Company’s closing stock price on the last trading day of December 31, 2017 and the exercise price, multiplied by the number of in-the-money options) that would have been received had all option holders exercised their in-the-money options at year-end. The amount changes based on the fair market value of the Company’s stock.
As of December 31, 2017, there was $0.8 million of unrecognized stock-based compensation expense related to stock options that is expected to be recognized over a weighted average period of approximately 1.6 years.
Performance Stock Units – The Company has issued PSUs to key senior management employees which, upon vesting, convert one-for-one to AdvanSix common stock. The actual number of shares an employee receives for each PSU depends on the Company’s performance against Earnings Per Share and Return On Investment goals over three-year performance and vesting periods. Each grantee is granted a target level of PSUs and may earn between 0% and 200% of the target level depending on the Company’s performance against the financial goals.
The following table summarizes information about PSU activity related to the Equity Plan:
Number of Performance Stock Units (In Thousands) | Weighted Average Grant Date Fair Value (Per Share) | |||||
Non-vested at December 31, 2016 | — | $ | — | |||
Granted | 90 | 26.66 | ||||
Vested | — | — | ||||
Forfeited | (1 | ) | 26.66 | |||
Non-vested at December 31, 2017 | 89 | $ | 26.66 | |||
67
The fair value of the PSUs is based on the fair market value of the Company’s stock at the grant date. The number of underlying shares to be issued will be based on actual performance achievement over the performance period. The per unit weighted average fair value at the date of grant for PSUs granted during the year ended December 31, 2017 was $26.66. The fair value of each PSU grant is amortized monthly into compensation expense on a straight-line basis over a vesting period of 36 months. The accrual of compensation costs is based on our estimate of the final expected value of the award, and is adjusted as required for the performance-based condition. The Company assumes that forfeitures will be minimal, and estimates forfeitures at time of issuance, which results in a reduction in compensation expense. As the payout of PSUs includes dividend equivalents, no separate dividend yield assumption is required in calculating the fair value of the PSUs. The Company currently does not pay dividends.
As of December 31, 2017, there was approximately $1.6 million of total unrecognized compensation cost related to non-vested PSUs granted under the Equity Plan which is expected to be recognized over a weighted-average period of 2.2 years.
The following table summarizes information about the income statement impact from PSUs for the year ended December 31, 2017. There were no PSUs granted prior to 2017.
Year Ended December 31, 2017 (In Thousands) | |||
Compensation expense | $ | 632 | |
Future income tax benefit recognized | $ | 66 | |
Certain share-based compensation expense relates to stock options and RSUs awarded to key employees of the Business as part of Honeywell’s incentive compensation plans prior to the Spin-Off. Such share-based compensation expense was $538 and $562 for the nine months ended September 30, 2016 and the year ended December 31, 2015, respectively.
Note 16. Geographic Areas and Major Customers – Financial Data
Net Sales(1) | Long-lived Assets(2) | ||||||||||||||||||||||
Years Ended December 31, | 2017 | 2016 | 2015 | 2017 | 2016 | 2015 | |||||||||||||||||
United States | $ | 1,189 | $ | 976 | $ | 957 | $ | 613 | $ | 575 | $ | 527 | |||||||||||
International | 286 | 216 | 372 | — | — | 1 | |||||||||||||||||
Total | $ | 1,475 | $ | 1,192 | $ | 1,329 | $ | 613 | $ | 575 | $ | 528 | |||||||||||
(1) | International sales represent net sales made to customers outside the U.S. |
(2) | Long-lived assets are comprised of property, plant and equipment – net. |
In 2017, the Company's ten largest customers accounted for approximately 44% of our total sales with an average customer relationship of approximately 20 years. Our largest customer is Shaw Industries Group Inc. (“Shaw”), one of the world’s largest consumers of caprolactam and Nylon 6 resin. We sell Nylon 6 resin and caprolactam to Shaw under a long-term contract. In 2017, 2016 and 2015, our sales to Shaw were 22%, 17% and 16%, respectively, of our total sales. We typically sell to our other customers under short-term contracts with one- to two-year terms or by purchase orders.
Geographic Net Sales for the year ended December 31, 2015 have been corrected for an immaterial error.
Note 17. Unaudited Selected Quarterly Financial Data
The following tables show selected unaudited quarterly results of operations for 2017 and 2016. The quarterly data have been prepared on the same basis as the audited annual financial statements and include all adjustments, which include only normal recurring adjustments, necessary for the fair statement of our results of operations for these periods.
68
2017 | |||||||||||||||||||
March 31, | June 30, | September 30, | December 31, | Year Ended December 31, | |||||||||||||||
Net Sales | $ | 376,704 | $ | 361,441 | $ | 366,660 | $ | 370,389 | $ | 1,475,194 | |||||||||
Gross Profit | 62,587 | 61,922 | 57,031 | 44,640 | 226,180 | ||||||||||||||
Net Income (Loss) | 27,293 | 25,766 | 21,274 | 72,366 | 146,699 | ||||||||||||||
Earnings (loss) per share – basic(a) | 0.90 | 0.85 | 0.70 | 2.37 | 4.81 | ||||||||||||||
Earnings (loss) per share – diluted(a) | 0.88 | 0.83 | 0.68 | 2.31 | 4.72 | ||||||||||||||
2016 | |||||||||||||||||||
March 31, | June 30, | September 30, | December 31, | Year Ended December 31, | |||||||||||||||
Net Sales | $ | 299,830 | $ | 308,418 | $ | 323,953 | $ | 259,323 | $ | 1,191,524 | |||||||||
Gross Profit | 54,271 | 34,598 | 38,862 | (20,101 | ) | 107,630 | |||||||||||||
Net Income (Loss) | 27,393 | 15,008 | 16,460 | (24,714 | ) | 34,147 | |||||||||||||
Earnings (loss) per share – basic(a) | 0.90 | 0.49 | 0.54 | (0.81 | ) | 1.12 | |||||||||||||
Earnings (loss) per share – diluted(a) | 0.90 | 0.49 | 0.54 | (0.81 | ) | 1.12 | |||||||||||||
(a) | On October 1, 2016, the date of consummation of the Spin-Off, 30,482,966 shares of the Company’s common stock were distributed to Honeywell stockholders of record as of September 16, 2016. Basic and Diluted EPS for all periods prior to the Spin-Off reflect the number of distributed shares, or 30,482,966 shares. |
Note 18. Subsequent Events
In January 2018, as previously announced, the Company experienced a temporary production issue at its Hopewell, Virginia facility related to the recent severe winter weather. As a result of this unplanned interruption, caprolactam and resin production was reduced at their respective Hopewell and Chesterfield, Virginia manufacturing facilities. The Company expects to incur an approximately $30 million unfavorable impact to pre-tax income in the first quarter of 2018, including the unfavorable impact of fixed cost absorption, lost sales, maintenance expense and incremental raw material costs. The Company informed its customers of this force majeure event and acted to mitigate the impact of the reduced output on its customers’ operations. The unplanned interruption had no adverse impact on fourth quarter 2017 financial results.
On February 21, 2018 (the “Closing Date”), the Company entered into Amendment No. 1 (the “Amendment”) to the Credit Agreement, dated as of September 30, 2016, (the “Existing Credit Agreement”), among the Company, the guarantors, the lenders party thereto and Bank of America, N.A., as administrative agent (the Existing Credit Agreement, after giving effect to the Amendment, the “Amended and Restated Credit Agreement”).
The credit facilities under the Existing Credit Agreement consisted of a senior secured term loan in an aggregate principal amount of $270 million and a senior secured revolving credit facility in a principal amount of $155 million. Pursuant to the Amendment, (i) the term loan facility under the Existing Credit Agreement was terminated and all outstanding term loans thereunder were paid in full and (ii) the maximum aggregate principal amount of the senior secured revolving credit facility (the “Revolving Credit Facility”) was increased to $425 million.
On the Closing Date, the Company borrowed $242 million in loans under the Revolving Credit Facility. The proceeds of such loans were used to repay the outstanding term loan facility under the Existing Credit Agreement. The Revolving Credit Facility under the Amended and Restated Credit Agreement has a scheduled maturity date of February 21, 2023.
The Amended and Restated Credit Agreement permits the Company to utilize up to $40 million of the Revolving Credit Facility for the issuance of letters of credit and up to $40 million for swing line loans. The Company has the option to incur incremental term loans and/or increase the amount of the Revolving Credit Facility in an aggregate principal amount for all such incremental term loans and increases of the Revolving Credit Facility of up to the sum of (x) $175 million plus (y) an amount such that the Company’s Consolidated Senior Secured Leverage Ratio (as defined in the Amended and Restated Credit Agreement) would not be greater than 1.75 to 1.00, in each case, to the extent that any one or more lenders, whether or not currently
69
party to the Amended and Restated Credit Agreement, commits to be a lender for such amount. Borrowings under the Amended and Restated Credit Agreement bear interest at a rate equal to either the sum of a base rate plus a margin ranging from 0.50% to 1.50% or the sum of a Eurodollar rate plus a margin ranging from 1.50% to 2.50%, with either such margin varying according to the Company’s Consolidated Leverage Ratio (as defined in the Amended and Restated Credit Agreement). The Company is also required to pay a commitment fee in respect of unused commitments under the Revolving Credit Facility, if any, at a rate ranging from 0.20% to 0.40% per annum depending on the Company’s Consolidated Leverage Ratio. The initial margin under the Amended and Restated Credit Agreement is 0.75% for base rate loans and 1.75% for Eurodollar rate loans and the initial commitment fee rate is 0.25% per annum. Substantially all domestic tangible and intangible assets of the Company and its subsidiaries are pledged as collateral to secure the obligations under the Amended and Restated Credit Agreement.
The Amended and Restated Credit Agreement contains customary covenants limiting the ability of the Company and its subsidiaries to, among other things, pay cash dividends, incur debt or liens, redeem or repurchase stock of the Company, enter into transactions with affiliates, make investments, make capital expenditures, merge or consolidate with others or dispose of assets. The Amended and Restated Credit Agreement also contains financial covenants that require the Company to maintain a Consolidated Interest Coverage Ratio (as defined in the Amended and Restated Credit Agreement) of not less than 3:00 to 1:00 and to maintain a Consolidated Leverage Ratio of (i) 3:50 to 1:00 or less for the fiscal quarter ending March 31, 2018, through and including the fiscal quarter ending December 31, 2019, (ii) 3.25 to 1:00 or less for the fiscal quarter ending March 31, 2020, through and including the fiscal quarter ending December 31, 2020, (iii) 3:00 to 1:00 or less for the fiscal quarter ending March 31, 2021, through and including the fiscal quarter ending December 31, 2021, and (iv) 2.75 to 1:00 or less for the fiscal quarter ending March 31, 2022 and each fiscal quarter thereafter (subject to the Company’s option to elect a consolidated leverage ratio increase in connection with certain acquisitions). If the Company does not comply with the covenants in the Amended and Restated Credit Agreement, the lenders may, subject to customary cure rights, require the immediate payment of all amounts outstanding under the Revolving Credit Facility.
70
Report of Independent Registered Public Accounting Firm
To the Board of Directors and Stockholders of AdvanSix Inc.
Opinions on the Financial Statements and Internal Control over Financial Reporting
We have audited the accompanying consolidated balance sheets of AdvanSix Inc. and its subsidiaries ("the Company") as of December 31, 2017 and 2016, and the related consolidated statements of operations, comprehensive income, stockholders’ equity and cash flows for each of the three years in the period ended December 31, 2017, including the related notes (collectively referred to as the “consolidated financial statements”). We also have audited the Company's internal control over financial reporting as of December 31, 2017, based on criteria established in Internal Control - Integrated Framework (2013) issued by the Committee of Sponsoring Organizations of the Treadway Commission (COSO).
In our opinion, the consolidated financial statements referred to above present fairly, in all material respects, the financial position of the Company as of December 31, 2017 and 2016, and the results of their operations and their cash flows for each of the three years in the period ended December 31, 2017 in conformity with accounting principles generally accepted in the United States of America. Also in our opinion, the Company maintained, in all material respects, effective internal control over financial reporting as of December 31, 2017, based on criteria established in Internal Control - Integrated Framework (2013) issued by the COSO.
Basis for Opinions
The Company's management is responsible for these consolidated financial statements, for maintaining effective internal control over financial reporting, and for its assessment of the effectiveness of internal control over financial reporting, included in Management's Report on Internal Control over Financial Reporting appearing under Item 9A. Our responsibility is to express opinions on the Company’s consolidated financial statements and on the Company's internal control over financial reporting based on our audits. We are a public accounting firm registered with the Public Company Accounting Oversight Board (United States) ("PCAOB") and are required to be independent with respect to the Company in accordance with the U.S. federal securities laws and the applicable rules and regulations of the Securities and Exchange Commission and the PCAOB.
We conducted our audits in accordance with the standards of the PCAOB. Those standards require that we plan and perform the audits to obtain reasonable assurance about whether the consolidated financial statements are free of material misstatement, whether due to error or fraud, and whether effective internal control over financial reporting was maintained in all material respects.
Our audits of the consolidated financial statements included performing procedures to assess the risks of material misstatement of the consolidated financial statements, whether due to error or fraud, and performing procedures that respond to those risks. Such procedures included examining, on a test basis, evidence regarding the amounts and disclosures in the consolidated financial statements. Our audits also included evaluating the accounting principles used and significant estimates made by management, as well as evaluating the overall presentation of the consolidated financial statements. Our audit of internal control over financial reporting included obtaining an understanding of internal control over financial reporting, assessing the risk that a material weakness exists, and testing and evaluating the design and operating effectiveness of internal control based on the assessed risk. Our audits also included performing such other procedures as we considered necessary in the circumstances. We believe that our audits provide a reasonable basis for our opinions.
Definition and Limitations of Internal Control over Financial Reporting
A company’s internal control over financial reporting is a process designed to provide reasonable assurance regarding the reliability of financial reporting and the preparation of financial statements for external purposes in accordance with generally accepted accounting principles. A company’s internal control over financial reporting includes those policies and procedures that (i) pertain to the maintenance of records that, in reasonable detail, accurately and fairly reflect the transactions and dispositions of the assets of the company; (ii) provide reasonable assurance that transactions are recorded as necessary to permit preparation of financial statements in accordance with generally accepted accounting principles, and that receipts and expenditures of the company are being made only in accordance with authorizations of management and directors of the company; and (iii) provide reasonable assurance regarding prevention or timely detection of unauthorized acquisition, use, or disposition of the company’s assets that could have a material effect on the financial statements.
71
Because of its inherent limitations, internal control over financial reporting may not prevent or detect misstatements. Also, projections of any evaluation of effectiveness to future periods are subject to the risk that controls may become inadequate because of changes in conditions, or that the degree of compliance with the policies or procedures may deteriorate.
/s/ PricewaterhouseCoopers LLP
Florham Park, New Jersey
February 27, 2018
We have served as the Company’s auditor since 2015.
72
Item 9. Changes in and Disagreements with Accountants on Accounting and Financial Disclosure
Not Applicable.
Item 9A. Controls and Procedures
Evaluation of Disclosure Controls and Procedures
The Company maintains disclosure controls and procedures designed to provide reasonable assurance that information required to be disclosed in reports filed or submitted under the Securities Exchange Act of 1934, as amended (the “Exchange Act”), is recorded, processed, summarized and reported within the time periods specified in the rules and forms of the SEC and that such information is accumulated and communicated to management, including the Chief Executive Officer and Chief Financial Officer, as appropriate, to allow timely decisions regarding required disclosures.
Management recognizes that any disclosure controls and procedures, no matter how well designed and operated, can provide only reasonable assurance of achieving their objectives. Because there are inherent limitations in all control systems, no evaluation of controls can provide absolute assurance that all control issues and instances of fraud have been or will be detected.
Our Chief Executive Officer and Chief Financial Officer, with the assistance of other members of our management, conducted an evaluation of the effectiveness of the Company’s disclosure controls and procedures (as such term is defined in Rules 13a-15(e) and 15d-15(e) under the Exchange Act) as of the end of the period covered by this report. Based upon such evaluation, our Chief Executive Officer and Chief Financial Officer have concluded that our disclosure controls and procedures are effective at a reasonable assurance level as of December 31, 2017, the end of the period covered by this report.
Management’s Report on Internal Control over Financial Reporting
The Company’s management is responsible for establishing and maintaining adequate internal control over financial reporting as defined in Rules 13a-15(f) and 15d-15(f) under the Exchange Act, and for its assessment of the effectiveness of internal control over financial reporting. The Company’s internal control over financial reporting is a process designed to provide reasonable assurance regarding the reliability of financial reporting and the preparation of financial statements for external purposes in accordance with generally accepted accounting principles. The Company’s internal control over financial reporting includes those policies and procedures that (i) pertain to the maintenance of records that, in reasonable detail, accurately and fairly reflect the transactions and dispositions of the assets of the Company; (ii) provide reasonable assurance that transactions are recorded as necessary to permit preparation of financial statements in accordance with generally accepted accounting principles, and that receipts and expenditures of the Company are being made only in accordance with authorizations of management and directors of the Company; and (iii) provide reasonable assurance regarding prevention or timely detection of unauthorized acquisition, use, or disposition of Company assets that could have a material effect on the financial statements.
Because of its inherent limitations, internal control over financial reporting may not prevent or detect misstatements. Also, projections of any evaluation of effectiveness to future periods are subject to the risk that controls may become inadequate because of changes in conditions, or that the degree of compliance with the policies or procedures may deteriorate.
Management assessed the effectiveness of the Company’s internal control over financial reporting as of December 31, 2017. In making this assessment, management used the criteria set forth by the Committee of Sponsoring Organizations of the Treadway Commission (COSO) in Internal Control - Integrated Framework (2013).
Based on this assessment, management determined that the Company maintained effective internal control over financial reporting as of December 31, 2017.
PricewaterhouseCoopers LLP, the Company’s independent registered public accounting firm, has audited the effectiveness of the Company’s internal control over financial reporting as of December 31, 2017, as stated in their report, which is included in "Item 8. Financial Statements and Supplementary Data."
73
Changes in Internal Control over Financial Reporting
The implementation of a financial consolidation system designed to facilitate the preparation of consolidated financial statements is a change in the Company’s internal control over financial reporting that occurred during the quarter ended December 31, 2017 that has materially affected, or is reasonably likely to materially affect, the Company’s internal control over financial reporting. There were no other changes to the Company’s internal control over financial reporting that occurred during the quarter ended December 31, 2017 that have materially affected, or are reasonably likely to materially affect, the Company’s internal control over financial reporting.
Item 9B. Other Information
On February 22, 2018, the Company and Shaw Industries Group, Inc. entered into a Seventh Amendment and Eighth Amendment to the Amended and Restated Caprolactam and Polymer Supply Agreement, dated as of April 1, 2013, as previously amended by the First Amendment dated as of July 18, 2013, the Second Amendment dated as of November 15, 2013, the Third Amendment dated as of December 12, 2014, the Fourth Amendment dated as of January 13, 2016, the Fifth Amendment dated as of March 1, 2017, and the Sixth Amendment dated as of March 1, 2017. The Seventh Amendment and the Eighth Amendment each provide for adjusted pricing and volume terms. The foregoing description is qualified in its entirety by reference to the full terms of each of the Seventh Amendment and Eighth Amendment, which the Company is filing as Exhibits 10.28 and 10.29, respectively, to this Form 10-K, with certain portions omitted and filed separately with the SEC pursuant to a request for confidential treatment.
74
PART III.
Item 10. Directors and Executive Officers of the Registrant
Information relating to the Directors of the Company, as well as information relating to compliance with Section 16(a) of the Securities Exchange Act of 1934, as required by this Item 10, will be contained in our definitive Proxy Statement to be filed with the SEC in connection with our 2018 annual meeting of stockholders pursuant to Regulation 14A not later than 120 days after December 31, 2017 (the "2018 Proxy Statement"), and such information is incorporated herein by reference. Certain other information relating to the Executive Officers of AdvanSix appears in Part I of this Annual Report on Form 10-K under the heading Executive Officers of the Registrant.
The members of the Audit Committee of our Board of Directors are: Paul E. Huck (Chair), Darrell K. Hughes and Daniel F. Sansone. The Board has determined that Mr. Huck has been designated as the audit committee financial expert as defined by applicable SEC rules and that Mr. Huck, Mr. Hughes and Mr. Sansone satisfy the accounting or related financial management expertise criteria established by the NYSE. All members of the Audit Committee are independent as that term is defined in applicable SEC rules and NYSE listing standards.
AdvanSix’s corporate governance policies and procedures, including the Code of Business Conduct, Corporate Governance Guidelines and Charters of the Committees of the Board of Directors are available, free of charge, on our website under the heading Investor Relations (see Corporate Governance), or by writing to AdvanSix Inc., 300 Kimball Drive, Suite 101, Parsippany, New Jersey 07054, c/o Corporate Secretary. AdvanSix’s Code of Business Conduct applies to all AdvanSix directors, officers (including the Chief Executive Officer, Chief Financial Officer and Controller) and employees. Amendments to or waivers of the Code of Business Conduct granted to any of AdvanSix’s directors or executive officers will be published on our website within five business days of such amendment or waiver.
Item 11. Executive Compensation
Information relating to executive compensation and the Compensation Committee, as required by this Item 11, will be contained in the 2018 Proxy Statement, and such information is incorporated herein by reference.
Item 12. Security Ownership of Certain Beneficial Owners and Management and Related Stockholder Matters
Information relating to certain beneficial ownership of certain stockholders and management, as well as certain other information required by this Item 12, will be contained in the 2018 Proxy Statement, and such information is incorporated herein by reference.
Item 13. Certain Relationships and Related Transactions
Information relating to certain relationships and related transactions, as required by this Item 13, will be contained in the 2018 Proxy Statement, and such information is incorporated herein by reference.
Item 14. Principal Accounting Fees and Services
Information relating to fees paid to and services performed by PricewaterhouseCoopers LLP and our Audit Committee’s pre-approval policies and procedures with respect to non-audit services, as required by this Item 14, will be contained in the 2018 Proxy Statement, and such information is incorporated herein by reference.
75
PART IV.
Item 15. Exhibits and Financial Statement Schedules
(a)(1) Consolidated Financial Statements | Page Number | |
(a)(2) Financial Statement Schedules | ||
None | ||
(a)(3) Exhibits | ||
See the Exhibit Index of this Annual Report on Form 10-K | ||
Item 16. Form 10-K Summary
The Company has elected not to include a Form 10-K summary under this Item 16.
76
Signatures
Pursuant to the requirements of the Securities Exchange Act of 1934, the Registrant has duly caused this report to be signed on its behalf by the undersigned thereunto duly authorized.
ADVANSIX INC. | ||
Date: February 27, 2018 | By: | /s/ Michael Preston |
Michael Preston | ||
Senior Vice President and Chief Financial Officer (on behalf of the Registrant and as the Registrant’s Principal Financial Officer) | ||
POWER OF ATTORNEY
KNOW ALL PERSONS BY THESE PRESENTS, that each person whose signature appears below constitutes and appoints Erin N. Kane, Michael Preston, and John M. Quitmeyer, or any of them, his or her attorneys-in-fact, for such person in any and all capacities, to sign any amendments to this report and to file the same, with exhibits thereto, and other documents in connection therewith, with the Securities and Exchange Commission, hereby ratifying and confirming all that either of said attorneys-in-fact, or substitute or substitutes, may do or cause to be done by virtue hereof.
Pursuant to the requirements of the Securities Exchange Act of 1934, this annual report has been signed below by the following persons on behalf of the Registrant and in the capacities and on the date indicated:
/s/ Erin N. Kane Erin N. Kane Chief Executive Officer and Director (Principal Executive Officer) | /s/ Michael L. Marberry Michael L. Marberry Independent Chairman of the Board |
/s/ Paul E. Huck Paul E. Huck Director | /s/ Darrell K. Hughes Darrell K. Hughes Director |
/s/ Todd D. Karran Todd D. Karran Director | /s/ Daniel F. Sansone Daniel F. Sansone Director |
/s/ Sharon S. Spurlin Sharon S. Spurlin Director | |
/s/ Michael Preston Michael Preston Senior Vice President and Chief Financial Officer (Principal Financial Officer) | /s/ Christopher Gramm Christopher Gramm Vice President and Controller (Principal Accounting Officer) |
February 27, 2018 | |
77
EXHIBIT INDEX
Exhibit No. | Description |
2.1 | |
3.1 | |
3.2 | |
10.1 | |
10.2 | |
10.3 | |
10.4 | |
10.5 | |
10.6 | |
10.7 | |
10.8 | |
10.9 | |
10.10 | |
10.11 | |
78
Exhibit No. | Description |
10.12 | |
10.13 | |
10.14 | |
10.15 | |
10.16 | |
10.17 | |
10.18 | |
10.19 | |
10.20 | |
10.21 | |
10.22 | |
10.23 | |
10.24 | |
10.25 | |
10.26 | |
79
Exhibit No. | Description |
10.27 | |
10.28 | |
10.29 | |
21.1 | |
23.1 | |
24 | |
31.1 | |
31.2 | |
32.1 | |
32.2 | |
99.1 | |
99.2 | |
99.3 | |
101.INS | XBRL Instance Document |
101.SCH | XBRL Taxonomy Extension Schema |
101.CAL | XBRL Taxonomy Extension Calculation Linkbase |
101.DEF | XBRL Taxonomy Extension Definition Linkbase |
101.LAB | XBRL Taxonomy Extension Label Linkbase |
101.PRE | XBRL Taxonomy Extension Presentation Linkbase |
† | Indicates management contract or compensatory plan. | |
* | Confidential treatment has been granted for certain information contained in Exhibits 10.21, 10.22, 10.23, 10.24, 10,25, 10.26 and 10.27, and the omitted portions have been filed separately with the SEC. Portions of Exhibit 10.28 and 10.29 have been omitted pursuant to a request for confidential treatment, and the omitted portions have been filed separately with the SEC. | |
80