Attached files
| file | filename |
|---|---|
| EX-32.1 - EXHIBIT 32.1 - Continental Building Products, Inc. | exhibit321201710k.htm |
| EX-31.2 - EXHIBIT 31.2 - Continental Building Products, Inc. | exhibit312201710k.htm |
| EX-31.1 - EXHIBIT 31.1 - Continental Building Products, Inc. | exhibit311201710k.htm |
| EX-23.1 - EXHIBIT 23.1 - Continental Building Products, Inc. | exhibit231201710k.htm |
| EX-21.1 - EXHIBIT 21.1 - Continental Building Products, Inc. | exhibit211201710k.htm |
As filed with the Securities and Exchange Commission on February 23, 2018
UNITED STATES
SECURITIES AND EXCHANGE COMMISSION
WASHINGTON, D.C. 20549
FORM 10-K
(Mark One)
x ANNUAL REPORT PURSUANT TO SECTION 13 OR 15(d) OF THE SECURITIES EXCHANGE ACT OF 1934
For the fiscal year ended December 31, 2017
or
¨ TRANSITION REPORT PURSUANT TO SECTION 13 OR 15(d) OF THE SECURITIES EXCHANGE ACT OF 1934
For the transition period from __________ to __________.
Commission File Number: 001-36293

CONTINENTAL BUILDING PRODUCTS, INC. | ||
(Exact name of registrant as specified in its charter) | ||
Delaware | 61-1718923 | |
(State or other jurisdiction of incorporation) | (I.R.S Employer Identification No.) | |
12950 Worldgate Drive, Suite 700, Herndon, VA | 20170 | |
(Address of principal executive offices) | (Zip Code) | |
(703) 480-3800 | ||
(Registrant's telephone number, including the area code) | ||
Securities Registered Pursuant to Section 12(b) Act: | ||
Title of Each Class | Name of Exchange on Which Registered | |
Common Stock, $0.001 par value per share | New York Stock Exchange | |
Securities Registered Pursuant to Section 12(g) Act: | ||
Title of Each Class | Name of Exchange on Which Registered | |
None | n/a | |
Indicate by check mark if the registrant is a well-known seasoned issuer, as defined in Rule 405 of the Securities Act.
Yes ¨ No x
Indicate by check mark if the registrant is not required to file reports pursuant to Section 13 or Section 15(d) of the Act.
Yes ¨ No x
Indicate by check mark whether the registrant (1) has filed all reports required to be filed by Section 13 or 15(d) of the Securities Exchange Act of 1934 during the preceding 12 months (or for such shorter period that the registrant was required to file such reports), and (2) has been subject to such filing requirements for the past 90 days.
Yes x No ¨
Indicate by check mark whether the registrant has submitted electronically and posted on its corporate Web site, if any, every Interactive Data File required to be submitted and posted pursuant to Rule 405 of Regulation S-T (§ 232.405 of this chapter) during the preceding 12 months (or for such shorter period that the registrant was required to submit and post such files).
Yes x No ¨
Indicate by check mark if disclosure of delinquent filers pursuant to Item 405 of Regulation S-K (§ 229.405 of this chapter) is not contained herein, and will not be contained, to the best of registrant's knowledge, in definitive proxy or information statements incorporated by reference in Part III of this Form 10-K or any amendment to this Form 10-K. ¨
Indicate by check mark whether the registrant is a large accelerated filer, an accelerated filer, a non-accelerated filer, or a smaller reporting company. See the definitions of "large accelerated filer," "accelerated filer" and "smaller reporting company" in Rule 12b-2 of the Exchange Act.
Large accelerated filer x Accelerated filer ¨
Non-accelerated filer ¨ Smaller Reporting Company ¨
Emerging growth company ¨
If an emerging growth company, indicate by check mark if the registrant has elected not to use the extended transition period for complying with any new or revised financial accounting standards provided pursuant to Section 13(a) of the Exchange Act. ¨
Indicate by check mark whether the registrant is a shell company (as defined in Rule 12b-2 of the Act)
Yes ¨ No x
As of February 21, 2018, the registrant had outstanding 37,441,176 shares of the registrant's common stock, which amount excludes 6,890,717 shares of common stock held by the registrant as treasury shares.
The aggregate market value of the registrant's common stock, $0.001 par value, held by non-affiliates of the registrant, as of June 30, 2017, the last business day of the registrant's most recently completed second fiscal quarter, was approximately $900.7 million, based upon the last reported sales price for such date on the New York Stock Exchange.
DOCUMENTS INCORPORATED BY REFERENCE
Certain information called for by Part III is incorporated by reference to certain sections in the registrant's definitive proxy statement relating to the 2018 Annual Meeting of Stockholders, which will be filed with the Securities and Exchange Commission not later than 120 days after December 31, 2017.
1
Table of Contents to 2017 Form 10-K
2
Table of Contents to 2017 Form 10-K (continued)
3
PART I
Item 1. Business
On August 30, 2013, substantially all of the assets and liabilities related to our business were acquired from Lafarge North America Inc., or Lafarge, which we refer to as the Acquisition. Prior to the Acquisition, we operated as the gypsum division of Lafarge. Unless otherwise specified, references in this Annual Report on Form 10-K to "our," "we," "us," the "Company" and "our business" (i) for periods prior to the completion of the Acquisition, refer to the gypsum division of Lafarge, (ii) for periods after completion of the Acquisition but prior to the conversion refer to LSF8 Gypsum Holdings Company, LLC (the entity formed to complete the Acquisition that was converted into Continental Building Products, Inc.) and (iii) for the periods after the conversion, refer to Continental Building Products, Inc., in each case together with its consolidated subsidiaries. We are a holding company and have a relatively short operating history as a stand-alone company.
General
We are a leading, high margin manufacturer of gypsum wallboard and complementary finishing products. Gypsum wallboard is a low-cost, widely used building product for interior and exterior walls and ceilings in residential and commercial structures. It is highly regarded for its ease and speed of application and its superior performance in providing comfort, fire resistance and thermal and sound insulation. The principal sources of demand for gypsum wallboard are residential construction, repair and remodel ("R&R"), and commercial construction. The commercial construction market encompasses areas such as office, retail, healthcare, hospitality and government building projects.
Our manufacturing facilities and sales efforts are concentrated in the eastern United States and eastern Canada. We estimate that in December 31, 2017 our market share in the United States east of the Mississippi River, a market which accounted for more than 55% of total U.S. wallboard demand, was approximately 17%, and our share is significantly higher in many of the major metropolitan areas within a shipping radius of 300 miles of our facilities, which include New York, Miami, Tampa, Orlando, Cincinnati, Cleveland, Columbus, Indianapolis, Nashville, Jacksonville and Hartford.
We sell our products in the new residential, R&R and commercial construction markets. We estimate that new residential and R&R construction accounted for more than 80% of 2017 industry wallboard demand. Demand for gypsum wallboard is cyclical; and closely follows construction industry cycles, particularly housing construction. For example, U.S. housing starts fell from a peak of 2.1 million in 2005 to a 50-year low of 554,000 in 2009. Correspondingly, U.S. wallboard consumption declined by more than 50% from 36.2 billion square feet, or bsf, in 2005 to a low of 17.1 bsf in 2010. Recently, the U.S. housing market has experienced moderate growth. U.S. housing starts reached 1.11 million in 2015, 1.17 million in 2016 and 1.20 million in 2017, according to the U.S. Census Bureau, driving wallboard consumption to 22.1 bsf 24.7 bsf and 25.3 bsf, respectively. We believe that there is room for continued improvement in housing starts. Housing starts have averaged 1.44 million over the past 50 years, which is approximately 20% greater than the 2017 starts of 1.20 million.
The effects of market conditions on our operations are further discussed in Item 7. Management's Discussion and Analysis of Financial Condition and Results of Operations.
We strive to be a low cost producer of gypsum wallboard. We have adopted a strategy of lean manufacturing and continuous improvement, which we call the Bison Way, as one of the tools we use in attempting to eliminate waste and become more efficient in all aspects of our business.
The Acquisition
Lafarge founded its U.S. wallboard business in 1996 when it acquired two manufacturing facilities, including our Buchanan plant, from Georgia-Pacific. During the period from 2000 to 2010, Lafarge expanded its geographic footprint through acquisitions and the greenfield development of our Palatka and Silver Grove plants. During this period, Lafarge pursued a strategy of servicing customers from newer and more efficient plants by shuttering less efficient plants, investing in new facilities and modernizing existing facilities. These efforts culminated with the upgrade of the Buchanan plant in 2006 and the opening of the second production line at the Silver Grove plant in 2007, which we believe made the facility the largest in North America. These investments transformed Lafarge's gypsum division from a regional player in the northeast to a leading competitor across the eastern United States.
On August 30, 2013, Lone Star Fund VIII (U.S.), L.P., which we refer to in this Annual Report on Form 10-K, along with its affiliates and associates (excluding companies that it owns as a result of its investment activity), as Lone Star, acquired substantially all of the assets comprising Lafarge's North American gypsum business for a purchase price of approximately $703 million and the assumption of certain liabilities pursuant to the terms of the asset purchase agreement signed in
4
connection with the Acquisition. On March 18, 2016, Lone Star sold its remaining shares of our common stock and, to our knowledge, no longer holds any ownership interest in the Company.
Products and Customers
We offer our customers a full range of gypsum wallboard products, including LiftLite ®, our lightweight product designed to be easier to lift and install, our Mold Defense ® line of products designed for enhanced protection against mold and mildew, and our Weather Defense ® line of moisture and mold-resistant exterior sheathing. To complement our wallboard business and to better serve our customers, we also operate a finishing products business that manufactures a comprehensive line of joint compounds at our plant in Silver Grove (Kentucky) and our joint compound plant in Chambly (Quebec). We provide superior customer service based on customer needs, consistently delivering high quality finished product and providing orders accurately with fast delivery times. Certain customers and markets have also favored the use of synthetic gypsum products, which we manufacture, versus natural gypsum products for the additional benefit of receiving Leadership in Energy and Environmental Design, or LEED, ratings to support environmentally responsible initiatives.
Our marketing and sales strategy consists of targeted direct sales efforts to existing and potential customers using an experienced sales force. We operate a single centralized customer-service call center. We also have a centralized logistics team for all of our operations that manages freight, storage and other distribution-related tasks. As is customary in the industry, we do not enter into long-term agreements with our customers. To encourage our customers to order our products and to increase their loyalty, we offer incentive programs, which provide for customer rebates that are triggered when specified sales volumes or net sales are reached. We generally bear the cost of delivering our finished products to our customers. We deliver by truck and, in the case of our Silver Grove and Palatka plants, by truck and rail. At each of our facilities, we have one or two carriers under contract that provide the majority of our shipping services.
We regularly achieve high rankings in customer service surveys and have received numerous "supplier of the year" awards from major customers. We consistently provide a high level of service to our customers through a combination of product availability and quality, on-time delivery, and timely and accurate invoicing. We sell our products through several different channels, including gypsum wallboard distributors, buying groups, wholesalers and mass merchants. Lowes, our largest customer, represented 14%, 15% and 16% of our net sales in years ended December 31, 2017, 2016 and 2015, respectively. Foundation Building Materials represented 11% of our net sales in the year ended December 31, 2017, and no other customer represented more than 10% of our net sales for the years ended December 31, 2017, 2016, and 2015.
Manufacturing and Distribution
We operate highly efficient and automated manufacturing facilities in Silver Grove (Kentucky), Palatka (Florida) and Buchanan (New York) that produce a full range of gypsum wallboard products for our diversified customer base. We are committed to operational excellence and have invested heavily in our facilities, which we believe are among the newest, largest and most efficient wallboard plants in North America.
Gypsum wallboard is manufactured by mixing finely ground, partially dehydrated, or calcined, gypsum with water and forming the resulting slurry between two layers of continuous paperboard liner. It is allowed to harden briefly before being dried and cut to specification.
The manufacturing process is tightly controlled to achieve uniformity and desired board characteristics. Additives can be introduced to the slurry at the beginning of the process to give the resulting board enhanced properties. For instance, fiberglass can be added to enhance fire resistance or fungicides added to defend against mold. Additives are also used to control the manufacturing process and to counteract impurities occurring in the gypsum.
We use predominantly synthetic gypsum in our wallboard products, which we believe enhances our manufacturing quality and consistency, reduces production costs and provides important environmental benefits relative to natural gypsum. Synthetic gypsum is principally produced through a process known as flue gas desulfurization, or FGD. The FGD process typically takes place in scrubbing towers in coal-fired power plants. Our strategically positioned plants provide us with two key benefits: cost-effective access to our primary supplies of synthetic gypsum, which reduces our inbound transportation costs, and close proximity to many major metropolitan areas, which decreases our product delivery costs.
To secure our primary supplies, we have entered into long-term agreements with major suppliers with remaining terms (with extensions) ranging from approximately 9 years to 32 years. Our supply contracts provide for a base price with escalation provisions. Generally, these contracts are structured as "take-or-pay" arrangements, where the sellers are required to supply a specified annual amount of gypsum and we are required to buy a specified annual amount, or else, in either case, pay specified liquidated damages under the contracts.
5
Our Seven Hills joint venture with WestRock Company, or WestRock, provides us with a reliable source of high-quality paperboard liner required for consistent wallboard production. We therefore have a long-term supply agreement that fulfills most of our current paper requirements.
Our manufacturing processes utilize significant amounts of natural gas and electricity. We purchase both natural gas and electricity on the open market. We use derivative instruments to manage certain commodity price and interest rate exposures. We do not use derivative instruments for speculative trading purposes, and we typically do not hedge beyond one year. See Item 7A. Quantitative and Qualitative Disclosures About Market Risk, for additional information regarding our financial exposures.
Our wallboard facilities are located in close proximity to major metropolitan areas in the eastern United States and eastern Canada, lowering both our inbound and outbound transportation costs and facilitating timely delivery to our customers. Each of our facilities allows us to offer same-day delivery service to many of our key metropolitan markets, including our Buchanan plant, which provides same-day delivery service to customers in the New York City tri-state area, which management believes provides us with a competitive advantage.
Competition
The market for our wallboard and finishing products is highly competitive. We believe the key competitive factors in the market include:
• | price; |
• | service; |
• | product quality; and |
• | product range. |
There are currently seven gypsum wallboard manufacturers in the United States: USG, National Gypsum, Georgia-Pacific, CertainTeed, Eagle Materials, Pabco Gypsum, and us. Of these, we believe only six compete in the eastern United States. Gypsum wallboard has a high weight-to-value ratio, so it is advantageous to both source raw materials and produce gypsum wallboard in close proximity to where it is used. If manufacturing facilities are not located in close proximity to end markets, transportation costs can render the cost of finished goods uncompetitive compared to locally manufactured wallboard. Accordingly, competition in the industry occurs principally on a regional basis. Each competitive geographic region has a different group of manufacturers and customers and, as a result, a different competitive landscape. A number of our competitors are larger than us and may have greater resources or lower costs of capital than we do.
Although gypsum wallboard remains a regional industry, consolidation in the industry has resulted in increased market share for certain industry participants, including us. In 1997 there were thirteen gypsum wallboard producers, compared to seven in 2017. This consolidation has occurred almost entirely amongst the smaller producers. Since 1997, our national market share has grown from 3% to 10%.
Other Information
Because we fill orders upon receipt, we do not have any significant order backlog.
Our business does not have any special working capital requirements.
Spending on research and development was de minimis over the past three years.
No material part of our business is subject to renegotiation of profits or termination of contracts or subcontractors at the election of any government.
Sales of our wallboard products are, similar to many building products, seasonal in that sales are generally slightly higher from spring through autumn when construction activity is greatest in our markets.
Employees
We had 621 employees as of December 31, 2017. Some of our employees at our Buchanan wallboard plant, representing approximately 13% of our workforce, are represented by two unions. The collective bargaining agreements with these two unions will expire on November 30, 2020. Our remaining employees are non-union. We believe our relationships with both our union and non-union employees are good.
6
Intellectual Property
We maintain many trademarks for our wallboard and finishing products, including, among others, LiftLite ®, Firecheck ®, Mold Defense ® and Rapid Coat ®. We also rely on patents and trade secret law to protect some of our manufacturing processes. Loss of one or more of our patents, trademarks or licenses would not have a material impact on our business or our ability to continue our operations in the foreseeable future.
Environmental Matters
Our wallboard and finishing products businesses are subject to numerous federal, state and local laws and regulations pertaining to health, safety and the environment. Some of these laws, such as the federal Clean Air Act and the federal Clean Water Act (and analogous state laws), impose environmental permitting obligations and govern the nature and amount of emissions that may be generated. Some laws, such as the Federal Superfund law (and analogous state laws), impose obligations to clean up or remediate spills of hazardous materials into the environment. Some laws, such as the federal Resource Conservation and Recovery Act, or RCRA, (and analogous state laws), impose obligations on us with respect to the management of waste products. None of our operations are the subject of any material local, state or federal environmental proceedings or inquiries. We do not, and have not, used asbestos in any of our products.
Our manufacturing processes for wallboard use a significant amount of energy, especially natural gas. Increased regulation of energy use to address the possible emission of greenhouse gases and climate change could materially increase our manufacturing costs. The U.S. Congress and several states are considering or have adopted legislation to reduce emission of greenhouse gases, including carbon dioxide and methane. Enactment of new climate control legislation or other regulatory initiatives by the U.S. Congress or various states, or the adoption of additional regulations by the EPA and analogous state or Canadian governmental agencies that restrict emissions of greenhouse gases in areas in which we conduct business, could have a material adverse effect on our business, financial condition and results of operations. From time to time, legislation has been introduced proposing a "carbon tax" on energy use or establishing a so-called "cap and trade" system. Such legislation would likely increase the cost of energy and therefore could materially increase our manufacturing costs. See "Risk Factors".
Additional Information
See Note 18 to the Consolidated Financial Statements for financial information pertaining to our Wallboard segment and Item 1A. Risk Factors, for information regarding the possible effects that compliance with environmental laws and regulations may have on our business and operating results.
Available Information
Our website address is www.continental-bp.com. Information contained on our website or connected thereto does not constitute a part of this Annual Report on Form 10-K or any other filing we make with the Securities and Exchange Commission, or the SEC. We make available free of charge on our website our Annual Reports on Form 10-K, Quarterly Reports on Form 10-Q, Current Reports on Form 8-K, Proxy Statements on Schedule 14A and amendments or supplements to those reports filed or furnished pursuant to Section 13(a) or 15(d) of the Securities Exchange Act of 1934, as amended, or the Exchange Act, as soon as reasonably practical after we file such material with, or furnish it to, the SEC. Certain of these documents may also be obtained by calling the SEC at 1-800-SEC-0330. The SEC also maintains an Internet website that contains reports, and other information regarding issuers that file electronically with the SEC at www.sec.gov. We also make available free of charge on our website our Principles of Corporate Governance, our Code of Ethics and Business Conduct, and the Charters of our Audit Committee, Nominating and Corporate Governance Committee, and Compensation Committee of our Board of Directors.
7
Item 1A. Risk Factors
Our business, financial condition and results of operations are subject to various risks and uncertainties. We have described below significant factors that may adversely affect our business, financial condition and results of operations as well as our industry. You should carefully consider these factors, together with all of the other information in this Annual Report on Form 10-K and in other documents that we file with the SEC, before making any investment decision about our securities. Adverse developments or changes, including those related to any of the factors discussed below, could materially and adversely affect our business, financial condition and results of operations.
Risks Relating to Our Business and Industry
Demand for our products is closely related to construction activity, particularly new residential construction, which is cyclical.
Historically, demand for the products that we manufacture has been closely correlated with new residential construction in the United States and Canada and, to a lesser extent, commercial construction and R&R activity, which are cyclical in nature. Accordingly, our business is also cyclical and subject to changes in general economic conditions, and we may incur losses during cyclical downturns. For example, from 2008 to 2014, new residential construction activities were at their lowest levels since 1949 and, correspondingly, demand for the products that we manufacture was weak, and prices fell significantly across the industry. Although conditions have improved in recent years, there is uncertainty regarding the extent and sustainability of the current expansion in such construction activity and resulting product demand levels. Demand for new residential construction is influenced by mortgage availability and interest rates, employment levels, household formation rates, domestic population growth, immigration rates, residential vacancy and foreclosure rates, demand for second homes, existing home prices, rental prices, housing inventory levels, consumer confidence, seasonal weather factors and other general economic factors. Our growth prospects depend, to a significant extent, on the degree to which conditions in the residential construction market continue to improve in the future. We cannot control the foregoing and, as a result, our business, financial condition and results of operations may vary materially in response to market conditions and changes in the supply and demand balance for our primary products.
If we cannot effectively compete in our markets, our business, financial condition and results of operations may be materially and adversely affected.
Many of the wallboard products sold by our competitors are close substitutes for our products. Because of this substitutability, competition among manufacturers is based in large part on price, as well as service, quality and range of products. Actions of our competitors, or the entry of new competitors into our markets, could lead to lower pricing in an effort to maintain our customer base and could also lead to lower sales volumes. At times, the price for any one or more of the products that we produce may fall below our production costs, requiring us to either incur losses on product sales or cease production at one or more of our manufacturing facilities. There can be no assurance that prices for products sold by us will not decline in the future or that such declines will not have a material adverse effect on our business, financial condition and results of operations.
Some of our competitors are larger companies and, therefore, have access to greater financial and other resources than we do. These resources may afford those competitors greater purchasing power, increased financial flexibility and more capital resources for expansion and improvement, which may enable those competitors to compete more effectively than we can. If we fail to compete effectively, we could suffer a loss of sales.
If our coal-fired power plant synthetic gypsum suppliers switch to natural gas or cease operations, our supply of synthetic gypsum could be constrained and our business, financial condition and results of operations may be materially and adversely affected.
Almost all of the gypsum used in our plants is synthetic gypsum. Most synthetic gypsum is a coal-combustion residual, resulting from flue gas desulfurization, carried out by electric generation or industrial plants burning coal as a fuel, although other industrial activities can also produce synthetic gypsum. The suppliers of synthetic gypsum are primarily power companies. As a result of the increase in coal price relative to natural gas and other reasons, some power companies have ceased operations or reduced power generation at certain high cost coal fired plants or at plants that are not compliant with current or anticipated environmental laws or switched such plants to using natural gas instead of coal for their electric generation needs. On September 28, 2017, Seminole Electric Cooperative, Inc. announced plans to remove one of its two coal fired electrical generating units located at the plant that currently supplies our Palatka, Florida plant with synthetic gypsum, and to build a natural gas fired unit at its plant, effective approximately five years from the date of the announcement. Additionally, existing or future changes in environmental regulations could make it more difficult or costly for power providers or industrial plants to burn coal. In the event any of the power companies with which we have synthetic gypsum supply agreements, for these or other reasons, reduce their power generation, switch to using natural gas instead of coal or cease operations completely,
8
our access to synthetic gypsum may be constrained or the cost to obtain gypsum could increase. We could incur substantial costs in connection with any significant reduction in the availability of synthetic gypsum, including costs to install equipment capable of processing natural gypsum and costs to substitute natural gypsum for synthetic gypsum, which could have an adverse effect on our business, financial condition and results of operations. In that event, there can be no assurance that we could find alternative sources of synthetic gypsum in reasonable quantities or at reasonable prices.
Certain of our customers have significant buying power, which may materially and adversely affect our business, financial condition and results of operations.
Some of our customers are large companies with significant buying power. In addition, consolidation currently taking place in our distribution channel could enhance the ability of these customers to seek more favorable terms, including pricing, for the products they purchase from us. Accordingly, our ability to maintain or raise prices in the future may be limited, including during periods of raw material and other cost increases. If we are forced to reduce prices or to maintain prices during periods of increased costs, or if we lose customers because of pricing or other methods of competition, our business, financial condition and results of operations may be materially and adversely affected.
We do not have long-term contracts with our customers, and our sales volume could be reduced if our customers switch some or all of their business with us to other suppliers.
As is customary in the industry, we do not enter into long-term contracts with our customers. Our customers may choose to stop or reduce purchases of our products at any time in the future. A significant loss of our customers or a significant reduction in their purchases could have a material negative impact on our sales volume and business, or cause us to reduce our prices, any of which could have a material adverse effect on our business, financial condition and results of operations.
The loss of sales to Lowe's or Foundation Building Materials may have a material adverse effect on our business, financial condition and results of operations.
For the fiscal years ended December 31, 2017, 2016 and 2015, Lowe's accounted for 14%, 15% and 16% of our net sales, respectively. Foundation Building Materials accounted for 11% of our net sales in 2017. If either of these top two customers reduces, delays or cancels a substantial number of orders, our business, financial condition and results of operations may be materially and adversely affected, particularly for the period in which the reduction, delay or cancellation occurs and also possibly for subsequent periods.
Because we do not have binding long-term purchasing agreements with Lowe's or Foundation Building Materials, there can be no assurance that they will continue to purchase products from us at current levels or at all.
A material disruption at one of our manufacturing facilities or at one of our suppliers' facilities could prevent us from meeting customer demand, reduce our sales and/or negatively affect our financial results.
Any of our manufacturing facilities, or any of our machines within an otherwise operational facility, could cease operations unexpectedly due to a number of events, including but not limited to:
• | major equipment failure; |
• | fires, floods, earthquakes, hurricanes, environmental incidents or other catastrophes; |
• | utility and transportation infrastructure disruptions; |
• | labor difficulties; |
• | other operational problems; or |
• | war, acts of terrorism or other unexpected events, including cyber security attacks. |
Any downtime or facility damage could prevent us from meeting customer demand for our products or require us to make unplanned capital expenditures. If our machines or facilities were to incur significant downtime, our ability to satisfy customer requirements could be impaired, resulting in decreased customer satisfaction and lower sales and net income. Because we operate at a limited number of facilities, the effects of any particular shutdown or facility damage could be significant to our operations as a whole and pronounced in the markets near the facility affected.
In addition, our suppliers of synthetic gypsum and paperboard liner are subject to the manufacturing facility disruption risks noted above. Our suppliers' inability to produce the necessary raw materials for our manufacturing processes may adversely impact our business, financial condition and results of operations. Because we rely on a limited number of suppliers, a
9
disruption at any one of our suppliers' facilities could also have a significant impact on our business, financial condition and results of operations.
We are reliant on WestRock for paper and we may require additional supplies of paper if our current supply is disrupted or our utilization increases.
We currently purchase most of our paperboard liner from the Seven Hills joint venture with WestRock, and purchase the balance on the open market. While the joint venture has the capacity to supply us with approximately 80% of our paper needs at our full capacity and most of our needs at current capacity, supply disruptions or additional paper demand that cannot be fulfilled on the open market could adversely affect our business, financial condition and results of operations. Since we only have one major supplier of paper, our risk of supply disruption may be greater than that of some of our competitors. Paper is a significant component of our variable costs. To the extent we are required to purchase additional paper on the open market, such paper costs would be subject to market conditions and could increase, which could have a negative impact on our business, financial condition and results of operations.
If the cost of energy or other raw materials increases, our cost of goods sold will increase and our business, financial condition and results of operations may be materially and adversely affected.
Our manufacturing processes use substantial amounts of natural gas and electricity, which are major components of our cost of goods sold. Energy costs are affected by various market factors, including the availability of supplies of particular forms of energy, energy prices and local and national regulatory decisions. Prices for natural gas and electrical power have been volatile in recent years. There may be substantial increases in the price of energy in the future, which may be pronounced if there are dislocations in the energy markets due to political instability or other unforeseeable events. Our policy, which is designed to decrease volatility, is to hedge no more than 50% of our historical gas usage and to maintain hedges for no more than one year. We have entered into a contract to purchase most of our electricity requirements at our Buchanan, New York plant at fixed rates. We purchase our other electricity requirements at market rates and we currently do not hedge our electricity purchases. Consequently, our business, financial condition and results of operations may be adversely impacted by increases in price more than competitors utilizing a more comprehensive hedging strategy, particularly in respect of electricity purchases. There can be no assurances we will continue to utilize this hedging strategy in the future or whether it or any other strategy we implement, including not hedging at all, will be successful.
We also use substantial quantities of other raw materials including gypsum, paperboard liner, starch and other manufacturing additives. The cost of certain of these raw materials has been volatile, and because we do not hedge any of these costs, significant increases in the cost or changes in the availability of one or more of these raw materials could materially and adversely affect our business, financial condition and results of operations.
Significant changes in the cost and availability of transportation could adversely affect our business, financial condition and results of operations.
Because manufacturers are responsible for delivering wallboard to their customers in our industry, transportation costs associated with the delivery of our wallboard products are a significant portion of our variable costs. Increases in the cost of fuel or energy can result in increases in the cost of transportation, which could materially and adversely affect our operating profits. Also, reductions in the availability of certain modes of transportation, such as rail or trucking, could limit our ability to deliver our products and therefore materially and adversely affect our operating profits.
We and our suppliers are subject to environmental and safety laws and regulations and these laws and regulations may change. These laws and regulations could cause us or our suppliers to make modifications to how we or they manufacture and price our or their products. These laws could also require that we or our suppliers make significant capital investments or otherwise increase our or their costs or result in liabilities to us.
We and our suppliers are subject to federal, state, local and foreign laws and regulations governing the protection of the environment and occupational health and safety, including those governing air emissions, wastewater discharges, the management, disposal and cleanup of hazardous materials and wastes and the health and safety of our employees. We are also required to obtain permits from governmental authorities for certain operations, and if we expand or modify our facilities, or if environmental laws change, we could be required to obtain new or modified permits. If we were to fail to comply with these laws, regulations or permits, we could incur fines, penalties or other sanctions. In addition, we could be held responsible for costs and damages arising from claims or liabilities under these laws and regulations, such as with respect to any contamination at our facilities or at third-party waste disposal sites. We cannot completely eliminate the risk of contamination or injury resulting from hazardous materials. Environmental laws and regulations tend to become more stringent over time, and we could incur material additional expenses relating to compliance with future environmental laws.
10
For example, our manufacturing processes for wallboard use a significant amount of energy, especially natural gas. Increased regulation of energy use to address the possible emission of greenhouse gases and climate change could materially increase our manufacturing costs. The U.S. Congress and several states are considering or have adopted legislation to reduce emission of greenhouse gases, including carbon dioxide and methane. Enactment of new climate control legislation or other regulatory initiatives by the U.S. Congress or various states, or the adoption of additional regulations by the EPA and analogous state or Canadian governmental agencies that restrict emissions of greenhouse gases in areas in which we conduct business, could have a material adverse effect on our business, financial condition and results of operations. From time to time, legislation has been introduced proposing a "carbon tax" on energy use or establishing a so-called "cap and trade" system. Such legislation would likely increase the cost of energy and therefore could materially increase our manufacturing costs.
Environmental regulatory changes or changes in methods used to comply with environmental regulations could adversely affect our suppliers, and therefore the price and availability of synthetic gypsum. If regulatory changes or changes in methods used to comply with environmental regulations adversely affect our suppliers or the price and availability of synthetic gypsum, our business, financial condition and results of operations may be materially and adversely affected.
It is difficult to accurately predict whether or when currently proposed or additional laws and regulations regarding emissions and other environmental concerns will be enacted or what capital expenditures might be required as a result of them. Stricter regulation of emissions might require us or our suppliers to install emissions control or other equipment at some or all of our or their manufacturing facilities, requiring significant additional capital investments.
Our financial results may be affected by various legal and regulatory proceedings.
We are subject to litigation and regulatory proceedings in the normal course of business and could become subject to additional claims in the future, some of which could be material. The outcome of legal proceedings may differ from our expectations because the outcomes of litigation and similar disputes are often difficult to predict reliably. Various factors and developments could lead us to make changes in initial estimates of liabilities and related insurance receivables, where applicable, or make additional estimates, including new or modified estimates as a result of a judicial ruling or judgment, a settlement, regulatory developments or changes in applicable law. A future adverse ruling, settlement or unfavorable development could result in charges that could have a material adverse effect on our business, financial condition and results of operations.
We may be unable to attract and retain key management employees.
Our key management personnel are important to our success. Our ability to retain our key management personnel or to attract suitable replacements should any members of our management team leave is dependent on the competitive nature of the employment market. The loss of services from key management personnel or a limitation in their availability could materially and adversely impact our business, financial condition and results of operations.
We may experience disruptions in our information technology system and computer networks due to catastrophic events or data security breaches.
We use information technology systems to collect, store and transmit the data needed to operate our business. We may be subject to information technology system failures and network disruptions. These may be caused by delays or disruptions due to system updates, natural disasters, malicious cyber attacks, accidents, power disruptions, telecommunications failures, acts of terrorism or war, computer viruses, physical or electronic break-ins or similar events or disruptions. We may in the future add applications to operate more efficiently. Predictions regarding benefits resulting from the implementation of these projects are subject to uncertainties. We may not be able to successfully implement the projects without experiencing difficulties. In addition, any expected benefits of implementing projects might not be realized or the costs of implementation might outweigh the benefits realized.
A disruption in our information technology systems due to a catastrophic event or security breach could interrupt or damage our operations. In addition, we could be subject to reputational harm or liability if confidential customer information is misappropriated from our information technology systems. Despite our security measures and business continuity plans, these systems could be vulnerable to disruption, and any such disruption could negatively affect our business, financial condition and results of operations.
We are subject to cybersecurity risks that could adversely affect us, and we may incur increasing costs in an effort to minimize those risks.
Our business relies on systems, including those of third parties with whom we do business. Our systems and those of our third parties we work with may be subjected to computer viruses or other malicious codes, unauthorized access attempts and cyber-attacks that include phishing-attacks, ransomware, malware, and hacking. Breach of our systems or those of third parties with
11
whom we do business could compromise our confidential information and that of our customers or employees, impede or interrupt our business operations, and may result in other negative consequences, including remediation costs, loss of revenue, litigation, significant legal and financial exposure, loss of intellectual property and reputational damage.
To date, we have not experienced a material breach of cybersecurity. As cyber-attacks become more sophisticated generally, and as we implement changes giving customers and suppliers greater electronic access to our systems, we may be required to incur additional costs to strengthen our systems from outside intrusions and/or maintain insurance coverage related to the threat of such attacks. Further, the regulatory environment related to information security and privacy is increasingly rigorous, with new and constantly changing requirements applicable to our business and those of third parties with whom we do business, and compliance with those requirements could result in additional costs. Despite our efforts, we may not have the resources or technical sophistication to anticipate or prevent rapidly evolving types of cyber-attacks on our systems or those of the third parties with whom we do business. While we have implemented administrative and technical controls such as malware and ransomware defense software, regular patching of our software and training of our employees on cybersecurity risk awareness, and taken other preventive actions to reduce the risk of cyber incidents, these measures, and other measures we may take in the future, can be expensive, and may be insufficient, circumvented, or may become ineffective. Any of the foregoing risks and increased costs could have a material adverse effect on our business, financial condition and results of operations.
Labor disruptions or cost increases could adversely affect our business, financial condition and results of operations.
A work stoppage at one of our facilities could cause us to lose sales, incur increased costs and adversely affect our ability to meet customers' needs. A plant shutdown or a substantial modification to employment terms could negatively impact us. Approximately 13% of our 621 employees were unionized as of December 31, 2017. The current collective bargaining agreements with our unionized employees at our Buchanan plant expire on November 30, 2020. We cannot assure you that we will be able to negotiate new collective bargaining agreements on the same or similar terms as those in the current agreements, or at all, without production interruptions, including labor stoppages. In the past, we have experienced union organizing efforts directed at our non-union employees. We may also experience labor cost increases or disruptions in our non-union facilities in circumstances in which we must compete for employees with necessary skills and experience or in tight labor markets. Any such cost increases, work stoppages or disruptions could limit production, sales volumes and profitability and have a material adverse effect on our business, financial condition, and results of operations.
Our business can be seasonal in nature, and this may cause our quarterly results to vary.
Sales of our wallboard products are, similar to many building products, seasonal in that sales are generally slightly higher from spring through autumn when construction activity is greatest in our markets. As a result, our quarterly results have varied in the past and may vary from quarter to quarter in the future. Such variations could have a negative impact on the price of our common stock. Additionally, because our business is seasonal, unfavorable weather conditions during peak construction periods could have an adverse effect on our business, financial condition and results of operations.
Risks Relating to our Indebtedness
Our current indebtedness, and any future indebtedness we may incur, may limit our operational and financing flexibility and negatively impact our business, financial condition and results of operations.
Our subsidiary, Continental Building Products Operating Company, LLC, or OpCo, is a party to an Amended and Restated Credit Agreement that was entered into in August of 2016 that provided for a $275.0 million senior secured term loan facility, or the Term Loan, and a $75.0 million senior secured revolving credit facility, or the Revolver. As of December 31, 2017, $271.6 million was outstanding under the Term Loan and no loans were outstanding under the Revolver. We may incur substantial additional debt in the future. The Amended and Restated Credit Agreement, and other debt instruments we may enter into in the future, may have important consequences, including the following:
• | our ability to obtain additional financing for working capital, capital expenditures, acquisitions or general corporate purposes may be impaired; |
• | the requirement that we use a significant portion of our cash flows from operations to pay interest on any outstanding indebtedness, which would reduce the funds available to us for operations and other purposes; and |
• | our flexibility in planning for, or reacting to, changes in our business and the industry in which we operate may be limited. |
We expect that we will depend primarily on cash generated by our operations for funds to pay our expenses and any amounts due under our credit facility and any other indebtedness we may incur. Our ability to make these payments depends on our
12
future performance, which will be affected by financial, business, economic and other factors, many of which we cannot control. Our business may not generate sufficient cash flows from operations in the future and our currently anticipated growth in revenues and cash flows may not be realized, either or both of which could result in our being unable to repay indebtedness or to fund other liquidity needs. If we do not have enough money, we may be required to refinance all or part of our then existing debt, sell assets or borrow more money, in each case on terms that may not be acceptable to us. In addition, the terms of existing or future debt agreements, including our existing credit facility, may restrict us from adopting any of these alternatives. Our ability to recapitalize and incur additional debt in the future could also delay or prevent a change in control of our company, make some transactions more difficult and impose additional financial or other covenants on us. In addition, any significant levels of indebtedness in the future could place us at a competitive disadvantage compared to our competitors that may have proportionately less debt and could make us more vulnerable to economic downturns and adverse developments in our business, financial condition and results of operations. Our indebtedness and any inability to pay our debt obligations as they come due or inability to incur additional debt could adversely affect our business, financial condition and results of operations.
The terms of our credit facility imposes operating and financial restrictions on us.
The Amended and Restated Credit Agreement contains a number of significant restrictions and covenants that generally limit our ability to, among other things:
• | incur or guarantee additional debt; |
• | create or incur certain liens; |
• | make certain loan advances; |
• | engage in acquisitions, consolidations, mergers, changes of control and sales of certain assets; |
• | pay dividends and make other distributions; |
• | make optional payments and modifications of junior debt instruments; |
• | engage in certain affiliate transactions, sales and leasebacks and pledge transactions; |
• | make certain restricted subsidiary distributions; |
• | engage in certain lines of business or activities; and |
• | modify certain agreements. |
The Amended and Restated Credit Agreement limits our ability to engage in these types of transactions even if we believe that a specific transaction would contribute to our future growth or improve our operating results. The Amended and Restated Credit Agreement also requires OpCo and its restricted subsidiaries to maintain a specific total leverage ratio in certain circumstances. See Note 9 to the Consolidated Financial Statements for more information regarding the terms of the Amended and Restated Credit Agreement.
Our ability to comply with these provisions may be affected by events beyond our control. A breach of any of these provisions or the inability to comply with required financial ratios in the Amended and Restated Credit Agreement could result in a default, in which case the lenders will have the right to declare all borrowings to be immediately due and payable. If we are unable to repay all borrowings when due, whether at maturity or if declared due and payable following a default, the lenders would have the right to proceed against the collateral granted to secure the indebtedness. If we breach these covenants or fail to comply with the terms of the Amended and Restated Credit Agreement, and the lenders accelerate the amounts outstanding thereunder, our business, financial condition and results of operations would be adversely affected.
Risks Related to the Ownership of Our Common Stock
Our future operating results may fluctuate significantly and our current operating results may not be a good indication of our future performance. Fluctuations in our quarterly financial results could affect our stock price in the future.
Our revenues and operating results have historically varied from period to period and we expect that they will continue to do so as a result of a number of factors, many of which are outside of our control, including the cyclicality and seasonality of our industry. If our quarterly financial results fail to meet the expectations of securities analysts and investors, our stock price could be negatively affected. Any volatility in our quarterly financial results may make it more difficult for us to raise capital
13
in the future or pursue acquisitions that involve issuances of our stock. Our operating results for prior periods may not be effective predictors of future performance.
We have no present intention to pay dividends on our common stock.
We have no present intention to pay cash dividends on our common stock. Any determination to pay dividends to holders of our common stock will be at the discretion of our board of directors and will depend upon many factors, including our financial condition, results of operations, projections, liquidity, earnings, legal requirements, restrictions in our debt agreements and other factors that our board of directors deems relevant. Accordingly, you may need to sell your shares of our common stock to realize a return on your investment, and you may not be able to sell your shares at or above the price you paid for them.
If securities or industry analysts do not continue to publish research or reports about our business, publish inaccurate or unfavorable research about our business or change their recommendations regarding our stock adversely, our stock price and trading volume could decline.
The trading market for our common stock is influenced in part by the research and other reports that industry or securities analysts may publish about us or our business. We currently have research coverage by industry or financial analysts, but this coverage may not continue. If analysts do not continue coverage of us, the trading price of our stock would likely be negatively impacted. Even if analyst coverage continues, if one or more of the analysts who cover us downgrade our stock, or if analysts issue other unfavorable commentary or inaccurate research, our stock price would likely decline. If one or more of these analysts cease coverage of our company or fail to regularly publish reports on us, we could lose visibility in the financial markets, which in turn could cause our stock price or trading volume to decline.
Our ability to raise capital in the future may be limited.
Our business and operations may consume resources faster than we anticipate. In the future, we may need to raise additional funds through the issuance of new equity securities, debt or a combination of both. Additional financing may not be available on favorable terms, or at all. If adequate funds are not available on acceptable terms, we may be unable to fund our capital requirements. If we issue new debt securities, the debt holders would have rights senior to common stockholders to make claims on our assets, and the terms of any debt could restrict our operations, including our ability to pay dividends on our common stock. If we issue additional equity securities, existing stockholders will experience dilution, and the new equity securities could have rights senior to those of our common stock. Because our decision to issue securities in any future offering will depend on market conditions and other factors beyond our control, we cannot predict or estimate the amount, timing or nature of our future offerings. Thus, our stockholders bear the risk of any future securities offerings by us reducing the market price of our common stock and diluting their interest.
We are a holding company and depend on the cash flow of our subsidiaries.
We are a holding company with no material assets other than the equity interests of our subsidiaries. Our subsidiaries conduct substantially all of our operations and own substantially all of our assets and intellectual property. Consequently, our cash flow and our ability to meet our obligations and pay any future dividends to our stockholders depends upon the cash flow of our subsidiaries and the payment of funds by our subsidiaries directly or indirectly to us in the form of dividends, distributions and other payments. Any inability on the part of our subsidiaries to make payments to us could have a material adverse effect on our business, financial condition and results of operations.
Provisions of our charter documents, Delaware law and other documents could discourage, delay or prevent a merger or acquisition at a premium price.
Provisions in our certificate of incorporation and bylaws may have the effect of delaying or preventing a change of control or changes in our management. For example, our certificate of incorporation and bylaws include provisions that:
• | permit us to issue, without stockholder approval, preferred stock in one or more series and, with respect to each series, fix the number of shares constituting the series and the designation of the series, the voting powers, if any, of the shares of the series and the preferences and other special rights, if any, and any qualifications, limitations or restrictions, of the shares of the series; |
• | prevent stockholders from calling special meetings; |
• | restrict the ability of stockholders to act by written consent; |
• | limit the ability of stockholders to amend our certificate of incorporation and bylaws; |
14
• | require advance notice for nominations for election to the board of directors and for stockholder proposals; |
• | do not permit cumulative voting in the election of our directors, which means that the holders of a majority of our common stock may elect all of the directors standing for election; and |
• | establish a classified board of directors with staggered three-year terms. |
These provisions may discourage, delay or prevent a merger or acquisition of our company, including a transaction in which the acquiror may offer a premium price for our common stock.
We are also subject to Section 203 of the Delaware General Corporation Law, or the DGCL, which, subject to certain exceptions, prohibits us from engaging in any business combination with any interested stockholder, as defined in that section, for a period of three years following the date on which that stockholder became an interested stockholder. In addition, our equity incentive plan permits vesting of stock options and restricted stock, and payments to be made to the employees thereunder in certain circumstances, in connection with a change of control of our company, which could discourage, delay or prevent a merger or acquisition at a premium price. In addition, our credit facility, and other debt instruments we may enter into in the future, may include provisions entitling the lenders to demand immediate repayment of all borrowings upon the occurrence of certain change of control events relating to our company, which also could discourage, delay or prevent a business combination transaction.
Our certificate of incorporation includes a forum selection clause, which could limit our stockholders' ability to obtain a favorable judicial forum for disputes with us.
Our certificate of incorporation provides that, unless we consent in writing to the selection of an alternative forum, the sole and exclusive forum for any stockholder (including any beneficial owner) to bring (i) any derivative action or proceeding brought on our behalf, (ii) any action asserting a claim of breach of a fiduciary duty owed to us or to our stockholders by any of our directors, officers, or employees, (iii) any action asserting a claim arising pursuant to any provision of the DGCL or our certificate of incorporation or bylaws, or (iv) any action asserting a claim governed by the internal affairs doctrine, will be a state court located within the State of Delaware (or, if no state court located within the State of Delaware has jurisdiction, the federal district court for the District of Delaware); in all cases subject to the court's having personal jurisdiction over the indispensable parties named as defendants. Any person or entity purchasing or otherwise acquiring any interest in shares of our capital stock is deemed to have notice of and consented to the foregoing provisions. This forum selection provision in our certificate of incorporation may limit our stockholders' ability to obtain a favorable judicial forum for disputes with us. It is also possible that, notwithstanding the forum selection clause included in our certificate of incorporation, a court could rule that such a provision is inapplicable or unenforceable.
Item 1B. Unresolved Comments
None.
15
Item 2. Properties
We own the real property on which each of our wallboard manufacturing facilities and joint compound finishing products facilities are located. The address of our corporate headquarters is currently 12950 Worldgate Drive, Suite 700, Herndon, VA 20170, in approximately 19,500 square feet of leased office space.
Wallboard Manufacturing Facilities
We believe that our wallboard facilities are some of the largest and most modern in North America, resulting in productivity levels among the highest in the industry. Our facilities operate at production speeds that are significantly faster than the industry average. Each of our facilities is able to produce a full range of our wallboard products. In 2017, our utilization rate across all of our wallboard facilities was approximately 81%. Each of our wallboard manufacturing facilities is subject to a mortgage under the Amended and Restated Credit Agreement. Each of our wallboard manufacturing facilities is described in further detail below.
Silver Grove
Our Silver Grove facility is located on the Ohio River in the township of Silver Grove, Kentucky, just outside of Cincinnati, Ohio. The design capacity for Silver Grove is 1.7 bsf, which we believe makes it the largest wallboard facility in North America.
Palatka
Our Palatka facility is located approximately 50 miles southwest of Jacksonville, Florida, near the I-95 corridor. The design capacity of the Palatka facility is 900 million square feet, or mmsf, per year.
Buchanan
The Buchanan facility is located on the Hudson River, approximately 40 miles north of Manhattan and has a capacity of 650 mmsf per year.
Finishing Products
We operate two joint compound plants as part of our finishing products business. The Chambly plant is located approximately 20 miles outside of Montreal, and the Silver Grove joint compound plant is within our Silver Grove wallboard facility just outside of Cincinnati, Ohio.
We believe that our existing properties are adequate for our current requirements and our operations in the foreseeable future.
Item 3. Legal Proceedings
From time to time we have been, and may in the future become involved in, litigation or other legal proceedings relating to claims arising in the normal course of business. In the opinion of management, there are no pending or threatened legal proceedings which would reasonably be expected to have a material adverse effect on our business or results of operations. We may become involved in material legal proceedings in the future.
See Note 16 to the Consolidated Financial Statements for a description of certain legal proceedings.
Item 4. Mine Safety Disclosures
Not applicable.
16
PART II
Item 5. Market for Registrant's Common Equity, Related Shareholder Matters and Issuer Purchases of Equity Securities
Our common stock is traded on the New York Stock Exchange, or NYSE, under the symbol CBPX. As of February 21, 2018, there were 3 holders of record of our common stock.
We have not declared or paid cash dividends on our common stock since the Initial Public Offering and we have no present intention to pay cash dividends on our common stock. Any determination to pay dividends to holders of our common stock will be at the discretion of our board of directors and will depend upon many factors, including our financial condition, results of operations, projections, liquidity, earnings, legal requirements, restrictions in our debt agreements and other factors that our board of directors deems relevant. Our Amended and Restated Credit Agreement contains, and debt instruments that we enter into in the future may contain, covenants that place limitations on the amount of dividends we may pay. In addition, under Delaware law, our board of directors may declare dividends only to the extent of our surplus, which is defined as total assets at fair market value minus total liabilities, minus statutory capital, or, if there is no surplus, out of our net profits for the then current and immediately preceding year.
See Item 12. Security Ownership of Certain Beneficial Owners and Management and Related Stockholder Matters, for information regarding common stock authorized for issuance under equity compensation plans.
The information below represents the high and low sales prices per share of our common stock for the periods indicated below, as reported on the NYSE:
Sales Prices | |||
Common Stock Voting | |||
High | Low | ||
(per share) | |||
2017 | |||
Fourth Quarter | $28.55 | $25.00 | |
Third Quarter | 26.20 | 21.00 | |
Second Quarter | 25.75 | 22.88 | |
First Quarter | 26.53 | 21.80 | |
2016 | |||
Fourth Quarter | $24.25 | $18.35 | |
Third Quarter | 24.78 | 20.75 | |
Second Quarter | 23.77 | 18.26 | |
First Quarter | 18.87 | 13.25 | |
17
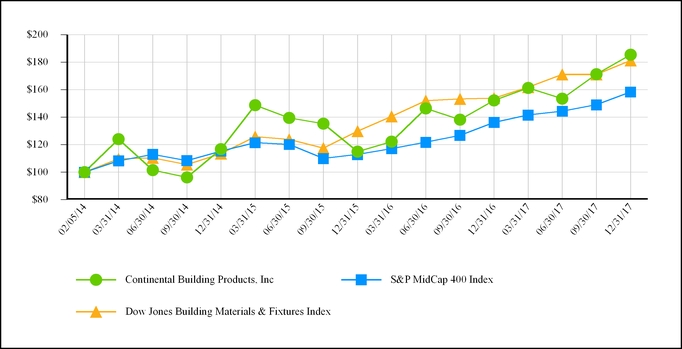
The graph below compares the cumulative total shareholder return since inception with S&P 500 Index ("S&P 500"), the Russell 2000 Index and the S&P 500 Industrials Index. The graph assumes that the value of the investment in our common stock was $100 on February 5, 2014 and that all dividends were reinvested.
On August 3, 2016, we announced that the board of directors approved an expansion of our stock repurchase program, which was originally announced on November 4, 2015. The expansion increased the total amount of our common stock we are authorized to repurchase from $50.0 million to $100.0 million, at such times and prices as determined by management as market conditions warrant. The expanded authorization also extended the expiration date from December 31, 2016 to December 31, 2017.
On February 21, 2017, the board of directors further expanded our share repurchase program up to a total of $200.0 million of our common stock and extended the expiration date to December 31, 2018. See Note 11 to the Consolidated Financial Statements for the information on the common stock repurchase activity during the years ended December 31, 2017, 2016 and 2015.
Common Stock Repurchase Activity During the Three Months Ended December 31, 2017 | ||||||||||||||
Period | Total Number of Shares Purchased | Average Price Paid Per Share | Total Number of Shares Purchased as Part of the Publicly Announced Plans or Programs | Maximum Dollar Value That May Yet Be Purchased Under the Plans or Programs | ||||||||||
October 1 - October 31, 2017 | — | $ | — | — | $ | 102,150,852 | ||||||||
November 1 - November 30, 2017 | 83,400 | 27.34 | 83,400 | 98,870,395 | ||||||||||
December 1 - December 31, 2017 | 115,600 | 27.62 | 115,600 | 96,677,737 | ||||||||||
Total | 199,000 | $ | 27.50 | 199,000 | ||||||||||
18
Item 6. Selected Financial Data
The selected consolidated financial data presented below should be reviewed in conjunction with the audited consolidated financial statements and related notes and with Item 7. Management's Discussion and Analysis of Financial Condition and Results of Operations.
As discussed in more detail under Item 1, Business—The Acquisition, we acquired the gypsum division of Lafarge North America Inc. on August 30, 2013. The accompanying financial statements are presented for the "Predecessor," which are the combined financial statements of the Lafarge gypsum division for the period preceding the Acquisition, and the "Successor," which are the consolidated financial statements of us and our subsidiaries for the period following the Acquisition. We were formed on July 26, 2013 and had no results of operations prior to the Acquisition on August 30, 2013. As such, our consolidated results of operations reflect activity of the acquired business for the four months from August 30, 2013 through December 31, 2013. The Predecessor's combined statements of operations data for the year ended December 31, 2012 and for the period from January 1, 2013 to August 30, 2013, and the Predecessor's combined balance sheet data as of December 31, 2012 have been derived from the audited combined financial statements of the Lafarge gypsum division. Our balance sheet data as of December 31, 2016 and 2017 and consolidated statements of operations for the years ended December 31, 2015, 2016 and 2017 and are derived from the Successor consolidated financial statements included in Item 8. Financial Statements and Supplementary Data. Our balance sheet data as of December 31, 2013, 2014 and 2015 and consolidated statements of operations for the period from July 26, 2013 to December 31, 2013 and the year ended December 31, 2014 is derived from Successor consolidated financial statements not included in this Annual Report on Form 10-K. The Predecessor's financial statements may not necessarily be indicative of the cost structure or results of operations that would have existed if the gypsum division of Lafarge operated as a stand-alone, independent business. The Acquisition was accounted for as a business combination, which resulted in a new basis of accounting. The Predecessor's and the Successor's financial statements are not comparable as a result of applying a new basis of accounting.
19
Selected Financial Data | ||||||||||||||||||||||||
Successor | Predecessor | |||||||||||||||||||||||
For the Year Ended December 31, | July 26 - December 31, 2013 | January 1 - August 30, 2013 | ||||||||||||||||||||||
2017 | 2016 | 2015 | 2014 | |||||||||||||||||||||
(in thousands) | ||||||||||||||||||||||||
Results of Operations: | ||||||||||||||||||||||||
Net sales | $ | 489,163 | $ | 461,375 | $ | 421,682 | $ | 424,502 | $ | 150,066 | 252,248 | |||||||||||||
Costs, expenses and other income: | ||||||||||||||||||||||||
Cost of goods sold | 361,825 | 336,317 | 312,840 | 330,173 | 121,335 | 195,338 | ||||||||||||||||||
Selling and administrative: | ||||||||||||||||||||||||
Direct | 37,753 | 37,918 | 34,891 | 33,568 | 14,953 | 19,338 | ||||||||||||||||||
Allocated from Lafarge | — | — | — | — | — | 4,945 | ||||||||||||||||||
Total selling and administrative | 37,753 | 37,918 | 34,891 | 33,568 | 14,953 | 24,283 | ||||||||||||||||||
Long Term Incentive Plan funded by Lone Star | — | — | 29,946 | — | — | — | ||||||||||||||||||
Total costs and operating expenses | 399,578 | 374,235 | 377,677 | 363,741 | 136,288 | 219,621 | ||||||||||||||||||
Operating income | 89,585 | 87,140 | 44,005 | 60,761 | 13,778 | 32,627 | ||||||||||||||||||
Other expense, net | (1,196 | ) | (5,963 | ) | (751 | ) | (5,644 | ) | (21 | ) | (191 | ) | ||||||||||||
Interest expense, net | (11,788 | ) | (13,590 | ) | (16,432 | ) | (29,069 | ) | (10,542 | ) | (91 | ) | ||||||||||||
Income before losses from equity method investment and provision for income tax | 76,601 | 67,587 | 26,822 | 26,048 | 3,215 | 32,345 | ||||||||||||||||||
Losses from equity method investment | (187 | ) | (736 | ) | (750 | ) | (113 | ) | — | (30 | ) | |||||||||||||
Income before provision for income taxes | 76,414 | 66,851 | 26,072 | 25,935 | 3,215 | 32,315 | ||||||||||||||||||
Provision for income taxes | (16,566 | ) | (22,827 | ) | (9,336 | ) | (10,044 | ) | (1,110 | ) | (130 | ) | ||||||||||||
Net income | 59,848 | 44,024 | 16,736 | 15,891 | 2,105 | 32,185 | ||||||||||||||||||
Foreign currency translation adjustment | 1,142 | 514 | (3,099 | ) | (1,939 | ) | (254 | ) | 2,707 | |||||||||||||||
Net unrealized (losses)/gains on derivatives, net of tax | (382 | ) | 1,418 | 811 | (867 | ) | — | — | ||||||||||||||||
Other | — | — | 7 | — | — | — | ||||||||||||||||||
Other comprehensive income | $ | 60,608 | $ | 45,956 | $ | 14,455 | $ | 13,085 | $ | 1,851 | $ | 34,892 | ||||||||||||
Other financial data: | ||||||||||||||||||||||||
Capital expenditures | 22,042 | 12,147 | 10,029 | 9,638 | 2,798 | 2,506 | ||||||||||||||||||
Period End Balances: | ||||||||||||||||||||||||
Cash and cash equivalents | $ | 72,521 | $ | 51,536 | $ | 14,729 | $ | 15,627 | $ | 11,822 | N/A | |||||||||||||
Property, plant and equipment, net | 294,003 | 307,838 | 326,407 | 353,652 | 383,625 | N/A | ||||||||||||||||||
Total assets | 641,934 | 634,749 | 634,968 | 700,981 | 740,376 | N/A | ||||||||||||||||||
Total liabilities | 323,908 | 325,737 | 334,202 | 397,608 | 603,525 | N/A | ||||||||||||||||||
Total equity / net Parent investment | 318,026 | 309,012 | 300,766 | 303,373 | 136,851 | N/A | ||||||||||||||||||
20
Item 7. Management's Discussion and Analysis of Financial Condition and Results of Operations
This Management's Discussion and Analysis of Financial Condition and Results of Operations should be read together with the Company's audited consolidated financial statements and the related notes thereto for the fiscal years ended December 31, 2017, 2016 and 2015 included in Item 8. Financial Statements and Supplementary Data.
The discussion below and the other sections to which the Company has referred you contain management's comments on the Company's business strategy and outlook, and such discussions contain forward-looking statements. These forward-looking statements reflect the expectations, beliefs, plans and objectives of management about future financial performance and assumptions underlying management's judgment concerning the matters discussed, and accordingly, involve estimates, assumptions, judgments and uncertainties. The Company's actual results could differ materially from those discussed in the forward-looking statements and the discussion below is not necessarily indicative of future results. Factors that could cause or contribute to any differences include, but are not limited to, those discussed below and elsewhere in this Annual Report on Form 10-K, particularly in Item 1A. Risk Factors and below in "Forward-Looking Statements."
Overview
We are a leading manufacturer of gypsum wallboard and complementary finishing products in the eastern United States and eastern Canada. We operate highly efficient and automated manufacturing facilities that produce a full range of gypsum wallboard products for our diversified customer base. We sell our products in the new residential, repair and remodel, or R&R, and commercial construction markets.
Our primary reportable segment is wallboard, which accounted for approximately 96.9%, 97.0% and 96.8% of our net sales for the years ended December 31, 2017, 2016 and 2015, respectively. We also operate other business activities, primarily the production of finishing products, which complement our full range of wallboard products. See Note 18 to the Consolidated Financial Statements for additional information on our reporting segments.
Factors Affecting Our Results
Market
For the new residential construction market, housing starts are a good indicator of demand for our gypsum products. Installation of our gypsum products into a single family home typically follows a housing start by 90 to 120 days. The R&R market includes renovation of both residential and nonresidential buildings. Many buyers begin to remodel an existing home within two years of purchase. The generally rising levels of existing home sales and home resale values in recent years have contributed to an increase in demand for our products from the R&R market. The commercial construction market encompasses areas such as office, retail, heath care, hospitality, and government projects. Demand for our products from commercial construction typically follows signing of construction contracts by 12 to 18 months.
The rate of growth in the new residential construction market, R&R market, and the new nonresidential construction market remains uncertain and will depend on broader economic circumstances, including employment, household formation, the home ownership rate, existing home price trends, availability of mortgage financing, interest rates, consumer confidence, job growth and discretionary business investment.
Wallboard pricing can be impacted by overall industry capacity in the United States. Currently, there is excess wallboard production capacity industry-wide in the United States which can lead to downward pressure on wallboard prices. We estimate that industry capacity utilization was approximately 76% year ended December 31, 2017, respectively, compared to 75% and 67% for the years ended December 31, 2016 and 2015, respectively.
Market Outlook
Most forecasts continue to project moderate growth in housing starts. Industry Analysts' forecasts for 2018 housing starts in the United States included in the most recent Blue Chip Economic Indicators are 1.22 million to 1.35 million units, based on the average of the bottom ten and top ten forecasts included in the report, respectively. This forecast range represents an increase in the range of 2% and 13% over 2017 housing starts of 1.20 million. We also expect that the R&R and new commercial construction markets will continue to experience moderate growth.
Industry shipments of gypsum wallboard in the United States as reported by the Gypsum Association were an estimated 25.3 billion square feet, 24.7 billion square feet and 22.1 billion square feet for the years ended December 31, 2017, 2016 and 2015. The 25.3 billion square feet is up 2.4% when compared to 2016, and the 24.7 billion was approximately up 11.8% from 2015. We estimate that industry shipments in the United States for all of 2018 will increase in percentage by low to mid-single digits from 25.3 billion square feet in 2017.
21
Manufacturing Costs
Paper and synthetic gypsum are our principal wallboard raw materials. Paper constitutes our most significant input cost and the most significant driver of our variable manufacturing costs. Energy costs, consisting of natural gas and electricity, are the other key input costs. In total, manufacturing cash costs represented 65% of our costs of goods sold for the year ended December 31, 2017, compared to 63% and 61% for the years ended December 31, 2016 and 2015, respectively. Depreciation and amortization represented 12% of our costs of goods sold for the year ended December 31, 2017, compared to 13% and 16% for the years ended December 31, 2016 and 2015, respectively. Distribution costs to deliver products to our customers represented the remaining portion of our costs of goods sold, or approximately 23% of our costs of goods sold for the year ended December 31, 2017, compared to 24% and 23% of our costs of goods sold for the years ended December 31, 2016 and 2015, respectively.
Variable manufacturing costs, including inputs such as paper, gypsum, natural gas, and other raw materials, represented 70% of our manufacturing cash costs for the year ended December 31, 2017, compared to 68% and 67% for the years ended December 31, 2016 and 2015, respectively. Fixed production costs excluding depreciation and amortization consisted of labor, maintenance, and other costs that represented 30% of our manufacturing cash costs for the year ended December 31, 2017, compared to 32% and 33% for the year ended December 31, 2016 and 2015, respectively.
We currently purchase most of our paperboard liner from Seven Hills, a joint venture between us and WestRock Company. Under the joint venture agreement with Seven Hills, the price of paper adjusts based on changes in the underlying costs of production of the paperboard liner, of which the two most significant are recovered waste paper and natural gas. The largest waste paper source used by the operation is old cardboard containers (known as OCC). With a recent increase in production capability, Seven Hills has the capacity to supply us with approximately 80% of our paper needs at our full capacity utilization and most of our needs at current capacity utilization on market-based pricing terms that we consider favorable. We also purchase additional paper on the spot market at competitive prices. See Note 7 to the Consolidated Financial Statements for additional information regarding our investment in Seven Hills.
Results of Operations
Table M1: Results of Operations | |||||||||||
For the Year Ended December 31, | |||||||||||
2017 | 2016 | 2015 | |||||||||
(dollars in thousands, except mill net) | |||||||||||
Net Sales | $ | 489,163 | $ | 461,375 | $ | 421,682 | |||||
Costs, expenses and other income: | |||||||||||
Cost of goods sold | 361,825 | 336,317 | 312,840 | ||||||||
Selling and administrative | 37,753 | 37,918 | 34,891 | ||||||||
Long Term Incentive Plan funded by Lone Star | — | — | 29,946 | ||||||||
Total costs and operating expenses | 399,578 | 374,235 | 377,677 | ||||||||
Operating income | 89,585 | 87,140 | 44,005 | ||||||||
Other expense, net | (1,196 | ) | (5,963 | ) | (751 | ) | |||||
Interest expense, net | (11,788 | ) | (13,590 | ) | (16,432 | ) | |||||
Income before losses from equity method investment and provision for income taxes | 76,601 | 67,587 | 26,822 | ||||||||
Losses from equity method investment | (187 | ) | (736 | ) | (750 | ) | |||||
Income before provision for income taxes | 76,414 | 66,851 | 26,072 | ||||||||
Provision for income taxes | (16,566 | ) | (22,827 | ) | (9,336 | ) | |||||
Net income | $ | 59,848 | $ | 44,024 | $ | 16,736 | |||||
Other operating data: | |||||||||||
Capital expenditures and software purchased or developed | $ | 22,042 | $ | 12,147 | $ | 10,029 | |||||
Wallboard sales volume (million square feet) | 2,666 | 2,560 | 2,199 | ||||||||
Mill net sales price (1) | $ | 146.92 | $ | 143.83 | $ | 153.70 | |||||
(1) | Mill net sales price represents average selling price per thousand square feet net of freight and delivery costs. |
22
Net Sales - 2017 vs. 2016. Net sales increased by $27.8 million, up 6.0% from $461.4 million for the year ended December 31, 2016, to $489.2 million for the year ended December 31, 2017. The increase was primarily attributable to an $18.4 million favorable impact of higher wallboard volumes driven by higher demand in the United States and a favorable impact of $7.7 million due to an increase in the average net selling price for gypsum wallboard at constant exchange rates. In addition, there were favorable impacts of $1.3 million related to non-wallboard products and $0.4 million related to foreign currency exchange rates.
Net Sales - 2016 vs. 2015. Net sales increased by $39.7 million, up 9.4% from $421.7 million for the year ended December 31, 2015, to $461.4 million for the year ended December 31, 2016. The increase was primarily attributable to a $67.0 million favorable impact of higher wallboard volumes driven by higher demand in the United States. This increase was partially offset by an unfavorable impact of $26.0 million due to a decrease in the average net selling price for gypsum wallboard at constant exchange rates and an unfavorable impact of $1.3 million related to foreign currency exchange rates. Our non-wallboard products had a nominal impact on net sales.
Cost of Goods Sold - 2017 vs. 2016. Cost of goods sold increased $25.5 million, up 7.6% from $336.3 million for the year ended December 31, 2016, to $361.8 million for the year ended December 31, 2017. The increase was primarily driven by higher per unit input costs, mainly related to paper, gypsum and natural gas which increased cost of goods sold by $13.7 million. Higher wallboard volumes increased input costs and freight costs by $5.6 million and $3.3 million, respectively. In addition, during the period both labor costs and non-wallboard manufacturing costs increased by $2.9 million and $1.3 million, respectively. The overall increase was partially offset by a $0.8 million decrease in maintenance expenses, $0.3 million decrease in depreciation costs and a $0.2 million decrease due to lower per unit freight costs.
Cost of Goods Sold - 2016 vs. 2015. Cost of goods sold increased $23.5 million, up 7.5% from $312.8 million for the year ended December 31, 2015, to $336.3 million for the year ended December 31, 2016. Higher wallboard volumes increased freight costs and input costs by $11.5 million and $19.8 million, respectively. In addition, labor costs increased by $5.4 million, primarily due to higher volumes, and non-wallboard manufacturing costs increased by $0.1 million. Lower per unit input costs, primarily related to energy prices, decreased cost of goods sold $5.5 million. Other cost decreases included a $4.7 million decrease of amortization and depreciation costs, a $2.0 million favorable impact due to freight rates, a $0.4 million favorable impact due to exchange rates, and a $0.7 million decrease in other manufacturing costs.
Selling and Administrative Expense - 2017 vs. 2016. Selling and administrative expense decreased $0.1 million, down 0.3% from $37.9 million for the year ended December 31, 2016, to $37.8 million for the year ended December 31, 2017. Associate costs decreased $0.3 million offset by an increase in professional services of $0.2 million.
Selling and Administrative Expense - 2016 vs. 2015. Selling and administrative expense increased $3.0 million, up 8.7% from $34.9 million for the year ended December 31, 2015, to $37.9 million for the year ended December 31, 2016. This increase was driven by a $1.5 million increase in stock compensation expense and a $1.8 million increase in payroll and bonus expenses and were partially offset by $0.3 million decrease in other selling and administrative expense.
Long Term Incentive Plan Funded by Lone Star - 2015. Under the LSF8 Gypsum Holdings, LP. Long Term Incentive Plan, or LTIP, certain of our officers and the estate of our former CEO were eligible to receive payments from LSF8 Gypsum Holdings, L.P., an affiliate of Lone Star Funds, or LSF8, in the event of a monetization event, as further described in Note 17 to the Consolidated Financial Statements. These monetization events occurred in 2015 and LSF8 was responsible for funding payments under the LTIP. As these payments arose out of employment with the Company, the $29.9 million expenses were recorded on our books for the year ended December 31, 2015, and were also deductible for tax purposes. The funding of the LTIP was recorded as capital contributions from LSF8 in the Consolidated Statement of Cash Flows under financing activities.
Operating Income - 2017 vs. 2016. Operating income of $89.6 million for the year ended December 31, 2017 increased by $2.5 million from operating income of $87.1 million for the year ended December 31, 2016. The increase was primarily attributable to higher volumes and an increase in net selling price, which was partially offset by higher input and labor costs.
Operating Income - 2016 vs. 2015. Operating income of $87.1 million for the year ended December 31, 2016 increased by $43.1 million from operating income of $44.0 million for the year ended December 31, 2015. The primary driver for this increase was the 16.4% increase in wallboard sales volumes in 2016 versus 2015 producing a $16.2 million increase in gross margin. In addition, the absence of any LTIP expense in 2016, as compared to $29.9 million in LTIP expense in 2015 led to higher operating income in 2016. The favorable impacts were partly offset by $3.0 million higher selling and administrative expense.
23
Other Expense, Net - 2017 vs. 2016. Other expense, net, was $1.2 million for the year ended December 31, 2017 compared to other expense, net, of $6.0 million for the year ended December 31, 2016. The change mainly reflects the non-recurring costs related to the debt refinancing. The impact of debt refinancing was $1.2 million for the year ended December 31, 2017 compared to $5.8 million in 2016. See Note 9 to the Consolidated Financial Statements for further details on the refinancing.
Other Expense, Net - 2016 vs. 2015. Other expense, net, was $6.0 million for the year ended December 31, 2016, an increase in expenses from the $0.8 million other expense, net in the year ended December 31, 2015. The increase was primarily due to $5.8 million in additional expenses associated with the debt refinancing in the third quarter 2016. See Note 9 to the Consolidated Financial Statements for further details on the refinancing.
Interest Expense, Net - 2017 vs. 2016. Interest expense was $11.8 million for the year ended December 31, 2017, a decrease of $1.8 million from $13.6 million for the year ended December 31, 2016, reflecting lower average outstanding borrowings during 2017 compared to 2016 and the lower interest rate spread over LIBOR following the debt refinancing in August 2016 and repricing in February and December of 2017. This decrease was partially offset by the rise in LIBOR. See Note 9 to the Consolidated Financial Statements for further details on the refinancing.
Interest Expense, Net - 2016 vs. 2015. Interest expense was $13.6 million for the year ended December 31, 2016, a decrease from $16.4 million for the year ended December 31, 2015, reflecting lower average outstanding borrowings during 2016 compared to 2015 and the lower interest rate following the debt refinancing in August 2016. See Note 9 to the Consolidated Financial Statements for further details on the refinancing.
Provision for Income Taxes - 2017 vs. 2016. Provision for income taxes decreased $6.2 million to $16.6 million for the year ended December 31, 2017, compared to $22.8 million in the prior period. The decrease was mainly driven by the $9.2 million adjustment to deferred taxes as a result of the new tax law enacted on December 22, 2017, which required us to remeasure certain deferred tax assets and liabilities based on the rates at which they are expected to reverse in the future. This tax benefit was partially offset by a higher provision for income taxes driven by higher pretax income.
Provision for Income Taxes - 2016 vs 2015. Provision for income taxes was $22.8 million for the year ended December 31, 2016, compared to $9.3 million in the prior year period. Higher provision for income taxes was primarily driven by higher pretax income as the effective income tax rates remained fairly steady at 34.1% and 35.8% for the years ended December 31, 2016 and 2015, respectively. See Note 14 to the Consolidated Financial Statements for full effective tax rate reconciliations.
Liquidity and Capital Resources
Our primary sources of liquidity are cash on hand, cash from operations, and borrowings under our debt financing arrangements. As of December 31, 2017, we had $72.5 million in cash and cash equivalents. We believe that our current cash position, access to the long-term debt capital markets and cash flow generated from operations should be sufficient not only for our operating requirements but also to enable us to complete our capital expenditure programs, fund share repurchases and any required long-term debt payments through the next several fiscal years. In addition, we have funds available from our revolving credit facilities and the ability to obtain alternative sources of financing. See Note 9 to the Consolidated Financial Statements for a more detailed discussion of our debt financing arrangements.
Table M2: Net Change in Cash and Cash Equivalents | |||||||||||
For the Year Ended December 31, | |||||||||||
2017 | 2016 | 2015 | |||||||||
(in thousands) | |||||||||||
Net cash provided by operating activities | $ | 101,667 | $ | 116,267 | $ | 82,578 | |||||
Net cash used in investing activities | (23,471 | ) | (11,641 | ) | (9,122 | ) | |||||
Net cash used in financing activities | (57,833 | ) | (68,044 | ) | (72,856 | ) | |||||
Effect of foreign exchange rates on cash and cash equivalents | 622 | 225 | (1,498 | ) | |||||||
Net change in cash and cash equivalents | $ | 20,985 | $ | 36,807 | $ | (898 | ) | ||||
Net Cash Provided By Operating Activities
Net cash provided by operating activities for the year ended December 31, 2017, 2016 and 2015 was $101.7 million, $116.3 million and $82.6 million, respectively. The decrease of $14.6 million in 2017 compared to 2016 was primarily driven by a decrease in cash from changes in working capital, primarily an increase in receivables. The increase in receivables was
24
consistent with the increase in revenues during the periods then ended. Other changes in working capital were due to timing of receipts and payments. The increase of $33.7 million in 2016 compared to 2015 was primarily driven by an increase in operating income and an improvement in working capital, partially offset by higher tax payments.
Net Cash Used In Investing Activities
Net cash used in investing activities for the year ended December 31, 2017 was $23.5 million, compared to $11.6 million and $9.1 million for the 2016 and 2015, respectively. The increase in investing activities for the year ended December 31, 2017 primarily reflect an aggregate of $22.0 million in capital expenditures and software purchased or developed, compared to $12.1 million and $10.0 million for 2016 and 2015, respectively. The remaining increase in 2017, 2016 and 2015 was driven by distributions and contributions related to our equity investment in Seven Hills.
Net Cash Used In Financing Activities
Net cash used in financing activities for the year ended December 31, 2017 was $57.8 million, compared to $68.0 million and $72.9 million for 2016 and 2015, respectively. During the year ended December 31, 2017, we repriced the Amended and Restated Credit Agreement, resulting in a net outflow of $1.2 million. During the year ended December 31, 2016, we refinanced the First Lien Credit Agreement, resulting in a net outflow of $1.4 million. See Note 9 to the Consolidated Financial Statements for a more detailed discussion of the repricing. We made principal payments on our outstanding debt of $2.1 million, $26.4 million and $55.0 million for the years ended December 31, 2017, 2016 and 2015, respectively. During 2015, we received $29.8 million of capital contributions from Lone Star in connection with payments under LTIP. See Note 17 to the Consolidated Financial Statements for additional information on the LTIP payments. We also deployed $54.6 million, $40.3 million and $48.5 million during 2017, 2016 and 2015, respectively, to repurchase common stock. See Note 11 to the Consolidated Financial Statements.
Credit Facilities
As of December 31, 2017, the Company had total outstanding borrowing under the term loan agreement of $271.6 million and $73.4 million available under the Revolver, based on draws and outstanding letters of credit and absence of violations of covenants. See Note 9 to the Consolidated Financial Statements for information regarding the terms of the Amended and Restated Credit Agreement.
Contractual Obligations and Other Long-Term Liabilities
Table M3: Future Contractual Obligations By Year As of December 31, 2017 | |||||||||||||||||||||||||||
2018 | 2019 | 2020 | 2021 | 2022 | Thereafter | Total | |||||||||||||||||||||
(in thousands) | |||||||||||||||||||||||||||
Operating leases (1) | $ | 790 | $ | 1,658 | $ | 48 | $ | — | $ | — | $ | — | $ | 2,496 | |||||||||||||
Purchase commitments: | |||||||||||||||||||||||||||
Purchase obligations (2) | 26,193 | 26,349 | 17,808 | 5,237 | 5,394 | 58,862 | $ | 139,843 | |||||||||||||||||||
IT and other professional services (3) | 960 | 58 | 45 | — | — | — | $ | 1,063 | |||||||||||||||||||
Other commitments: | |||||||||||||||||||||||||||
Long-term debt | 2,736 | 2,736 | 2,736 | 2,736 | 2,736 | 257,893 | 271,573 | ||||||||||||||||||||
Interest on indebtedness (4) | 10,557 | 10,451 | 10,374 | 10,240 | 10,134 | 6,336 | 58,092 | ||||||||||||||||||||
Total commitments | $ | 41,236 | $ | 41,252 | $ | 31,011 | $ | 18,213 | $ | 18,264 | $ | 323,091 | $ | 473,067 | |||||||||||||
(1) | Operating lease payments reflect the minimum payments over the non-cancelable lease terms of the associated lease. |
(2) | Purchase obligations consist of contracts to purchase natural gas, synthetic gypsum and paper. |
(3) | Represents commitments for data center, warehouse facilities and other. |
(4) | See Note 9 - Debt for further details. Interest on indebtedness is calculated based on interest rates in effect at December 31, 2017. |
A purchase commitment is an enforceable and legally binding agreement to purchase goods or services that specifies significant terms, including: fixed or minimum quantities to be purchased, minimum or variable price provisions and approximate timing of the transaction. Our primary purchase obligations are for our two principal raw materials, synthetic gypsum and paper. The purchase commitment amounts in the table above are based on the minimum quantities to be purchased at estimated prices to be paid based on current market conditions. Accordingly, the actual amounts due may vary significantly from the estimates included in the table.
25
Off-Balance Sheet Arrangements
With the exception of letters of credit of approximately $1.6 million as of December 31, 2017, we have no off-balance sheet arrangements.
Critical Accounting Policies and Estimates
Critical Accounting Policies
A summary of our significant and recent accounting policies is included in Note 2 to the consolidated financial statements included in Item 8. Financial Statements and Supplementary Data. The preparation of our financial statements requires management to make estimates and assumptions that affect the reported amounts of assets and liabilities and the disclosure of contingent assets and liabilities at the date of the financial statements and the reported amounts of revenues and expenses. Although management bases its estimates on historical experience and various other assumptions that are believed to be reasonable under the circumstances, actual results may differ to some extent from the estimates on which our financial statements have been prepared at any point in time. We believe that the critical accounting policies listed below involve our more significant judgments, assumptions and estimates and, therefore, could have the greatest potential impact on the financial statements.
Impairment or Disposal of Long-Lived Assets
We evaluate the recoverability of our long-lived assets in accordance with the provisions of Financial Accounting Standards Board Accounting Standards Codification 360 Property, Plant and Equipment, or ASC 360. ASC 360 requires that long-lived assets and certain identifiable intangibles be reviewed for impairment whenever events or changes in circumstances indicate that the carrying amount of an asset may not be recoverable. Recoverability of assets is measured by comparing the carrying amount of an asset to future undiscounted net cash flows expected to be generated by the asset. Such evaluations for impairment are significantly impacted by estimates of future prices for its products, capital needs, economic trends in the construction sector and other factors. If such assets are considered to be impaired, the impairment to be recognized is measured by the amount by which the carrying amount of the assets exceeds their fair value. Assets to be disposed of by sale are reflected at the lower of their carrying amount or fair value less cost to sell.
Determination as to whether and how much an asset is impaired involves significant management judgment involving highly uncertain matters, including estimating the future success of sales volumes, future selling prices and costs, alternative uses for the assets, and estimated proceeds from disposal of the assets. However, the impairment reviews and calculations are based on estimates and assumptions that take into account our business plans and long-term investment decisions.
We record impairment charges for assets that we permanently close if their fair value is less than their carrying value.
Goodwill and Intangible Assets
Goodwill represents the excess of costs over the fair value of identifiable assets of businesses acquired. We value goodwill and intangible assets in accordance with Financial Accounting Standards Board Accounting Standards Codification 350, Goodwill and Other Intangible Assets, or ASC 350. ASC 350 requires goodwill to be either qualitatively or quantitatively assessed for impairment annually (or more frequently if impairment indicators arise). Intangible assets that have indefinite useful lives are not amortized but are tested at least annually for impairment or whenever events or circumstances indicate an impairment may have occurred. Intangible assets that are deemed to have definite lives are amortized over their useful lives.
As of December 31, 2017 and 2016, we had $119.9 million of goodwill, which resulted from the Acquisition. All goodwill is associated with our wallboard reporting unit. On an annual basis, we measure the fair value of our wallboard reporting unit on a qualitative basis or by using a discounted cash flow approach that estimates the projected future cash flows to be generated by the reporting unit, using a discount rate reflecting the weighted average cost of capital for a potential market participant. We perform our annual goodwill impairment test on the first day of our fiscal fourth quarter. Differences in assumptions used in projecting future cash flows and cost of funds could have a significant impact on the determination of fair value. During our goodwill impairment review, we may assess qualitative factors to determine whether more likely than not the fair value of the reporting unit is less than its carrying amount, including goodwill. The qualitative factors include, but are not limited to, macroeconomic conditions, industry and market considerations and our overall financial performance. If, after assessing the totality of these qualitative factors, we determine that it is not more likely than not that the fair value of the reporting unit is less than its carrying amount, then no additional assessment is deemed necessary.
When we use a discounted cash flow approach, projections are based on forecasts developed internally by management for use in managing the business. These projections include significant assumptions such as estimates of future revenues, profits, working capital requirements, operating plans and capital expenditures. Our forecasts are driven by consensus industry
26
estimates of key economic indicators that affect our operating results, most notably new residential construction, light commercial construction, and repair and remodel activity. These economic indicators are then used to estimate future production volumes, selling prices and key input costs for our manufactured products. Our forecasts also take into consideration recent sales data and planned timing of capital projects. Differences in assumptions used in projecting future cash flows and cost of funds could have a significant impact on the determination of fair value.
A growth rate is used to calculate the terminal value in the discounted cash flow model and is the expected rate at which earnings or revenue is projected to grow beyond the forecasted period. The future cash flows are discounted at our weighted average cost of capital.
Based on the results of the qualitative assessment of the goodwill impairment test, it is not more likely than not that the fair value of our wallboard reporting unit is less than its carrying amount as of October 1, 2017 and 2016 and, therefore, no goodwill impairment existed. We relied on a qualitative assessment to reach this conclusion. As a result, the quantitative assessment of the goodwill impairment test was not required to be completed.
Income Taxes
Since the formation of the Company on July 26, 2013, our annual tax rate is based on our income, statutory tax regulations and rates, and tax planning opportunities available to us in the various jurisdictions in which we operate. Significant judgment is required in determining our annual tax expense and in evaluating our tax positions.
Tax law requires items to be included in our tax returns at different times than when the items are reflected in the financial statements. As a result, the annual tax expense reflected in the consolidated statement of operations is different than that which will be reported in the tax returns. Some of these differences are permanent, such as expenses recorded for accounting purposes that are not deductible in the returns, and some differences are temporary and reverse over time, such as depreciation expense. Temporary differences create deferred tax assets and liabilities. Deferred tax liabilities generally represent tax expense recognized in the financial statements for which payment has been deferred, or expense for which a deduction has been taken already in the tax return but the expense has not yet been recognized in the financial statements. Deferred tax assets generally represent items that can be used as a tax deduction or credit in tax returns in future years for which a benefit has already been recorded in the financial statements. Valuation allowances are established when necessary to reduce deferred income tax assets to the amounts we believe are more likely than not to be recovered. In evaluating the amount of any such valuation allowance, the company considers the reversal of existing temporary differences, the existence of taxable income in prior carry back years, available tax planning strategies and estimates of future taxable income for each of its taxable jurisdictions. The latter two factors involve the exercise of significant judgment.
We determine whether it is more likely than not that a tax position will be sustained upon examination by the appropriate taxing authorities before any part of the benefit is recorded in the financial statements. A tax position is measured as the portion of the tax benefit that is greater than 50% likely to be realized upon settlement with a taxing authority (that has full knowledge of all relevant information). We may be required to change our provision for income taxes when the ultimate deductibility of certain items is challenged or agreed to by taxing authorities, when estimates used in determining valuation allowances on deferred tax assets significantly change, or when receipt of new information indicates the need for adjustment in valuation allowances. Additionally, future events, such as changes in tax laws, tax regulations, or interpretations of such laws or regulations, could have an impact on the provision for income tax and the effective tax rate. Any such changes could significantly affect the amounts reported in the consolidated financial statements in the year these changes occur.
27
Forward-Looking Statements
This Annual Report on Form 10-K contains "forward-looking statements" within the meaning of the Private Securities Litigation Reform Act of 1995. These forward-looking statements are included throughout this Annual Report on Form 10-K, and relate to matters such as our industry, business strategy, goals and expectations concerning our market position, future operations, margins, profitability, capital expenditures, liquidity, capital resources and other financial and operating information. We have used the words "anticipate," "assume," "believe," "contemplate," "continue," "could," "estimate," "expect," "future," "intend," "may," "plan," "potential," "predict," "project," "seek," "should," "target," "will" and similar terms and phrases to identify forward-looking statements in this Annual Report on Form 10-K. All of our forward-looking statements are subject to risks and uncertainties that may cause actual results to differ materially from those that we are expecting, including:
• | cyclicality in our markets, especially the new residential construction market; |
• | the highly competitive nature of our industry and the substitutability of competitors' products; |
• | disruptions in our supply of synthetic gypsum due to regulatory changes or coal-fired power plants ceasing or reducing operations or switching to natural gas; |
• | significant buying power of certain customers; |
• | potential losses of customers; |
• | changes to environmental and safety laws and regulations requiring modifications to our manufacturing systems; |
• | material disruptions at our facilities or the facilities of our suppliers; |
• | disruptions to our supply of paperboard liner, including termination of the WestRock contract; |
• | changes in energy, transportation and other input costs; |
• | changes in, cost of compliance with or the failure or inability to comply with governmental laws and regulations, in particular environmental regulations; |
• | our involvement in legal and regulatory proceedings; |
• | our ability to attract and retain key management employees; |
• | disruptions in our information technology systems; |
• | cybersecurity risks; |
• | labor disruptions; |
• | seasonal nature of our business; and |
• | additional factors discussed under the sections captioned Item 1A. Risk Factors, Item 7. Management's Discussion and Analysis of Financial Condition and Results of Operations and Item 1. Business. |
The forward-looking statements contained in this Annual Report on Form 10-K are based on historical performance and management's current plans, estimates and expectations in light of information currently available to us and are subject to uncertainty and changes in circumstances. There can be no assurance that future developments affecting us will be those that we have anticipated. Actual results may differ materially from these expectations due to changes in global, regional or local political, economic, business, competitive, market, regulatory and other factors, many of which are beyond our control. We believe that these factors include those described in Item 1A. Risk Factors. Should one or more of these risks or uncertainties materialize, or should any of our assumptions prove to be incorrect, our actual results may vary in material respects from what we may have expressed or implied by these forward-looking statements. We caution that you should not place undue reliance on any of our forward-looking statements. Any forward-looking statement made by us in this Annual Report on Form 10-K speaks only as of the date on which we make it. Factors or events that could cause our actual results to differ may emerge from time to time, and it is not possible for us to predict all of them. We undertake no obligation to publicly update any forward-looking statement, whether as a result of new information, future developments or otherwise, except as may be required by applicable securities laws.
28
Item 7A. Quantitative and Qualitative Disclosures About Market Risk
In the normal course of business, we are exposed to financial risks such as changes in interest rates, foreign currency exchange rates, commodity price risk associated with our input costs and counterparty risk. We use derivative instruments to manage selected commodity price and interest rate exposures.
Interest Rate Risk
Our exposure to market risk for changes in interest rates relates primarily to our outstanding debt, and cash and cash equivalents. As of December 31, 2017, we had $72.5 million in cash and cash equivalents. The interest expense associated with the Term Loan and Revolver will vary with market rates.
Our exposure to market risk for changes in interest rates related to our outstanding debt is partially mitigated as the Term Loan has a LIBOR floor of 0.75% and we have interest rates swaps with a combined notional amount of $100.0 million. A rise of interest rate levels would increase our interest expense and a reduction in interest rates to the floor would decrease our interest expense. A hypothetical 100 basis point increase in interest rates would increase interest expense by approximately $1.7 million, while a hypothetical 100 basis point decrease in interest rates would decrease interest expense by $1.4 million. We based this sensitivity calculation on one month LIBOR rate of 1.57% in accordance with the most recent measurement date specified in the Amended and Restated Credit Agreement.
As of December 31, 2017, the Company had $72.5 million in cash and cash equivalents which includes highly liquid investments with maturities of three months or less at the time of purchase maintained at financial institutions in the United States and Canada. Based on the overall balance of $72.5 million and assuming the Company is able to invest an average of $50.0 million of that balance in interest-earning investments, a hypothetical 100 basis point increase or decrease in investment interest rates would have a positive or negative effect on earnings in the amount of $0.5 million.
Foreign Currency Risk
Approximately 6.0%, 7.8% and 8.0% of our net sales for the years ended December 31, 2017, 2016 and 2015, respectively, were in Canada. As a result, we are exposed to movements in foreign exchange rates between the U.S. dollar and Canadian dollar. We estimate that a 1% change in the exchange rate between the U.S. and Canadian currencies would have an immaterial impact to net sales.
Commodity Price Risk
Some of our key production inputs, such as paper and natural gas, are commodities whose prices are determined by the market's supply and demand for such products. Price fluctuations on our key input costs have a significant effect on our financial performance. The markets for most of these commodities are cyclical and are affected by factors such as global economic conditions, changes in or disruptions to industry production capacity, changes in inventory levels and other factors beyond our control. As of December 31, 2017, the Company had natural gas swap contracts for a portion of its natural gas usage. The contracts matured or mature between January 31, 2018 and December 31, 2018. Other than the natural gas swap contracts described above, we did not manage commodity price risk with derivative instruments. We may in the future enter into derivative financial instruments from time to time to manage our exposure related to these market risks.
Counterparty Risk
The Company is exposed to credit losses in the event of nonperformance by the counterparties to the Company's derivative instruments. All of the Company's counterparties have investment grade credit ratings; accordingly, the Company anticipates that the counterparties will be able to fully satisfy their obligations under the contracts. The Company's agreements outline the conditions upon which it or the counterparties are required to post collateral. As of December 31, 2017, the Company had no collateral posted with its counterparties related to the derivatives.
29
Item 8. Financial Statements and Supplementary Data
Management's Report on Internal Control Over Financial Reporting
The Company's management is responsible for establishing and maintaining adequate internal control over financial reporting, as defined in Exchange Act Rule 13a-15(f). Internal control over financial reporting is a process designed by or under the supervision of the Company's Chief Executive Officer and Chief Financial Officer, and effected by the Company's board of directors, management and other personnel, to provide reasonable assurance regarding the reliability of financial reporting and the preparation of the Company's financial statements for external purposes in accordance with accounting principles generally accepted in the United States ("U.S. GAAP").
The Company's internal control over financial reporting includes those policies and procedures that: (1) pertain to the maintenance of records that, in reasonable detail, accurately and fairly reflect the transactions and dispositions of the assets of the Company; (2) provide reasonable assurance that transactions are recorded as necessary to permit preparation of financial statements in accordance with U.S. GAAP, and that receipts and expenditures of the Company are being made only in accordance with authorizations of management and directors of the Company; and (3) provide reasonable assurance regarding prevention or timely detection of unauthorized acquisition, use or disposition of Continental's assets that could have a material effect on the consolidated financial statements.
Under the supervision and with the participation of the Company's Chief Executive Officer and Chief Financial Officer, management assessed the effectiveness of the Company's internal control over financial reporting as of December 31, 2017. In making this assessment, management used the criteria set forth by the Committee of Sponsoring Organizations of the Treadway Commission (COSO) in Internal Control - Integrated Framework (2013). Based on its evaluation, management concluded that the Company's internal control over financial reporting was effective as of December 31, 2017.
The Company's independent registered public accounting firm, Ernst & Young LLP, has issued an attestation report on the Company's internal control over financial reporting as of December 31, 2017, as stated in their report appearing below.
Report of Independent Registered Public Accounting Firm
To the Shareholders and the Board of Directors of Continental Building Products, Inc.
Opinion on Internal Control over Financial Reporting
We have audited Continental Building Products, Inc.'s internal control over financial reporting as of December 31, 2017, based on criteria established in Internal Control-Integrated Framework issued by the Committee of Sponsoring Organizations of the Treadway Commission (2013 framework) (the COSO criteria). In our opinion, Continental Building Products, Inc. (the Company) maintained, in all material respects, effective internal control over financial reporting as of December 31, 2017, based on the COSO criteria.
We also have audited, in accordance with the standards of the Public Company Accounting Oversight Board (United States) (PCAOB), the consolidated balance sheets of Continental Building Products, Inc. as of December 31, 2017 and 2016, and the related consolidated statements of operations, comprehensive income, changes in shareholders' equity and cash flows for each of the three years in the period ended December 31, 2017, and the related notes and our report dated February 23, 2018 expressed an unqualified opinion thereon.
Basis for Opinion
The Company's management is responsible for maintaining effective internal control over financial reporting and for its assessment of the effectiveness of internal control over financial reporting included in the accompanying Management's Report on Internal Control Over Financial Reporting. Our responsibility is to express an opinion on the Company's internal control over financial reporting based on our audit. We are a public accounting firm registered with the PCAOB and are required to be independent with respect to the Company in accordance with the U.S. federal securities laws and the applicable rules and regulations of the Securities and Exchange Commission and the PCAOB.
We conducted our audit in accordance with the standards of the PCAOB. Those standards require that we plan and perform the audit to obtain reasonable assurance about whether effective internal control over financial reporting was maintained in all material respects.
Our audit included obtaining an understanding of internal control over financial reporting, assessing the risk that a material weakness exists, testing and evaluating the design and operating effectiveness of internal control based on the assessed risk, and performing such other procedures as we considered necessary in the circumstances. We believe that our audit provides a reasonable basis for our opinion.
Definition and Limitations of Internal Control Over Financial Reporting
A company's internal control over financial reporting is a process designed to provide reasonable assurance regarding the reliability of financial reporting and the preparation of financial statements for external purposes in accordance with generally accepted accounting principles. A company's internal control over financial reporting includes those policies and procedures that (1) pertain to the maintenance of records that, in reasonable detail, accurately and fairly reflect the transactions and dispositions of the assets of the company; (2) provide reasonable assurance that transactions are recorded as necessary to permit preparation of financial statements in accordance with generally accepted accounting principles, and that receipts and expenditures of the company are being made only in accordance with authorizations of management and directors of the company; and (3) provide reasonable assurance regarding prevention or timely detection of unauthorized acquisition, use, or disposition of the company's assets that could have a material effect on the financial statements.
Because of its inherent limitations, internal control over financial reporting may not prevent or detect misstatements. Also, projections of any evaluation of effectiveness to future periods are subject to the risk that controls may become inadequate because of changes in conditions, or that the degree of compliance with the policies or procedures may deteriorate.
/s/ Ernst & Young LLP
Tysons, Virginia
February 23, 2018
31
Report of Independent Registered Public Accounting Firm
To the Shareholders and the Board of Directors of Continental Building Products, Inc.
Opinion on the Financial Statements
We have audited the accompanying consolidated balance sheets of Continental Building Products, Inc. (the Company) as of December 31, 2017 and 2016, and the related consolidated statements of operations, comprehensive income, changes in shareholders' equity and cash flows for each of the three years in the period ended December 31, 2017, and the related notes (collectively referred to as the "financial statements"). In our opinion, the financial statements present fairly, in all material respects, the consolidated financial position of the Company at December 31, 2017 and 2016, and the consolidated results of its operations and its cash flows for each of the three years in the period ended December 31, 2017, in conformity with U.S. generally accepted accounting principles.
We also have audited, in accordance with the standards of the Public Company Accounting Oversight Board (United States) (PCAOB), the Company's internal control over financial reporting as of December 31, 2017, based on criteria established in Internal Control-Integrated Framework issued by the Committee of Sponsoring Organizations of the Treadway Commission (2013 framework) and our report dated February 23, 2018 expressed an unqualified opinion thereon.
Basis for Opinion
These financial statements are the responsibility of the Company's management. Our responsibility is to express an opinion on the Company's financial statements based on our audits. We are a public accounting firm registered with the PCAOB and are required to be independent with respect to the Company in accordance with the U.S. federal securities laws and the applicable rules and regulations of the Securities and Exchange Commission and the PCAOB.
We conducted our audits in accordance with the standards of the PCAOB. Those standards require that we plan and perform the audit to obtain reasonable assurance about whether the financial statements are free of material misstatement, whether due to error or fraud. Our audits included performing procedures to assess the risks of material misstatement of the financial statements, whether due to error or fraud, and performing procedures that respond to those risks. Such procedures included examining, on a test basis, evidence regarding the amounts and disclosures in the financial statements. Our audits also included evaluating the accounting principles used and significant estimates made by management, as well as evaluating the overall presentation of the financial statements. We believe that our audits provide a reasonable basis for our opinion.
/s/ Ernst & Young LLP
We have served as the Company's auditor since 2013.
Tysons, Virginia
February 23, 2018
32
Continental Building Products, Inc.
Consolidated Statements of Operations
For the Year Ended December 31, | |||||||||||
2017 | 2016 | 2015 | |||||||||
(in thousands, except share data and per share amounts) | |||||||||||
Net sales | $ | 489,163 | $ | 461,375 | $ | 421,682 | |||||
Costs, expenses and other income: | |||||||||||
Cost of goods sold | 361,825 | 336,317 | 312,840 | ||||||||
Selling and administrative | 37,753 | 37,918 | 34,891 | ||||||||
Long Term Incentive Plan funded by Lone Star | — | — | 29,946 | ||||||||
Total costs and operating expenses | 399,578 | 374,235 | 377,677 | ||||||||
Operating income | 89,585 | 87,140 | 44,005 | ||||||||
Other expense, net | (1,196 | ) | (5,963 | ) | (751 | ) | |||||
Interest expense, net | (11,788 | ) | (13,590 | ) | (16,432 | ) | |||||
Income before losses from equity method investment and provision for income tax | 76,601 | 67,587 | 26,822 | ||||||||
Losses from equity method investment | (187 | ) | (736 | ) | (750 | ) | |||||
Income before provision for income taxes | 76,414 | 66,851 | 26,072 | ||||||||
Provision for income taxes | (16,566 | ) | (22,827 | ) | (9,336 | ) | |||||
Net income | $ | 59,848 | $ | 44,024 | $ | 16,736 | |||||
Net income per share: | |||||||||||
Basic | $ | 1.55 | $ | 1.08 | $ | 0.39 | |||||
Diluted | $ | 1.54 | $ | 1.08 | $ | 0.39 | |||||
Weighted average shares outstanding: | |||||||||||
Basic | 38,636,152 | 40,605,464 | 43,172,528 | ||||||||
Diluted | 38,774,963 | 40,662,304 | 43,218,324 | ||||||||
See accompanying notes to consolidated financial statements.
33
Continental Building Products, Inc.
Consolidated Statements of Comprehensive Income
For the Year Ended December 31, | |||||||||||
2017 | 2016 | 2015 | |||||||||
(in thousands) | |||||||||||
Net income | $ | 59,848 | $ | 44,024 | $ | 16,736 | |||||
Foreign currency translation adjustment | 1,142 | 514 | (3,099 | ) | |||||||
Net unrealized (losses)/gains on derivatives, net of taxes | (382 | ) | 1,418 | 811 | |||||||
Other | — | — | 7 | ||||||||
Other comprehensive income | 760 | 1,932 | (2,281 | ) | |||||||
Comprehensive income | $ | 60,608 | $ | 45,956 | $ | 14,455 | |||||
See accompanying notes to consolidated financial statements.
34
Continental Building Products, Inc.
Consolidated Balance Sheets
As of December 31, | |||||||
2017 | 2016 | ||||||
(in thousands) | |||||||
Assets: | |||||||
Cash and cash equivalents | $ | 72,521 | $ | 51,536 | |||
Receivables, net | 38,769 | 32,473 | |||||
Inventories, net | 24,882 | 25,239 | |||||
Prepaid and other current assets | 11,267 | 7,485 | |||||
Total current assets | 147,439 | 116,733 | |||||
Property, plant and equipment, net | 294,003 | 307,838 | |||||
Customer relationships and other intangibles, net | 70,807 | 81,555 | |||||
Goodwill | 119,945 | 119,945 | |||||
Equity method investment | 9,263 | 8,020 | |||||
Debt issuance costs | 477 | 658 | |||||
Total Assets | $ | 641,934 | $ | 634,749 | |||
Liabilities and Shareholders' Equity: | |||||||
Liabilities: | |||||||
Accounts payable | $ | 30,809 | $ | 27,411 | |||
Accrued and other liabilities | 11,940 | 12,321 | |||||
Notes payable, current portion | 1,702 | 1,742 | |||||
Total current liabilities | 44,451 | 41,474 | |||||
Deferred taxes and other long-term liabilities | 15,847 | 19,643 | |||||
Notes payable, non-current portion | 263,610 | 264,620 | |||||
Total Liabilities | 323,908 | 325,737 | |||||
Equity: | |||||||
Undesignated preferred stock, par value $0.001 per share; 10,000,000 shares authorized, no shares issued and outstanding | — | — | |||||
Common stock, $0.001 par value per share; 190,000,000 shares authorized; 44,321,776 and 44,191,370 shares issued and 37,532,959 and 39,691,715 shares outstanding as of December 31, 2017 and 2016, respectively | 44 | 44 | |||||
Additional paid-in capital | 325,391 | 322,384 | |||||
Less: Treasury stock | (143,357 | ) | (88,756 | ) | |||
Accumulated other comprehensive loss | (2,649 | ) | (3,409 | ) | |||
Accumulated earnings | 138,597 | 78,749 | |||||
Total Equity | 318,026 | 309,012 | |||||
Total Liabilities and Equity | $ | 641,934 | $ | 634,749 | |||
See accompanying notes to consolidated financial statements.
35
Continental Building Products, Inc.
Consolidated Statements of Cash Flows
For the Year Ended December 31, | |||||||||||
2017 | 2016 | 2015 | |||||||||
(in thousands) | |||||||||||
Cash flows from operating activities: | |||||||||||
Net income | $ | 59,848 | $ | 44,024 | $ | 16,736 | |||||
Adjustments to reconcile net income to net cash provided by operating activities: | |||||||||||
Depreciation and amortization | 46,460 | 46,646 | 51,308 | ||||||||
Amortization of debt issuance costs and debt discount | 1,177 | 1,947 | 2,315 | ||||||||
Losses from equity method investment | 187 | 736 | 750 | ||||||||
Debt related expenses | 1,170 | 5,802 | — | ||||||||
Stock-based compensation | 2,784 | 2,288 | 801 | ||||||||
Deferred taxes | (3,414 | ) | 6,504 | 3,407 | |||||||
Change in assets and liabilities: | |||||||||||
Receivables | (6,296 | ) | 3,342 | 4,133 | |||||||
Inventories | 488 | 1,921 | 2,116 | ||||||||
Prepaid expenses and other current assets | (3,735 | ) | 895 | 844 | |||||||
Accounts payable | 3,987 | 2,058 | (1,323 | ) | |||||||
Accrued and other current liabilities | (830 | ) | 360 | 1,682 | |||||||
Other long term liabilities | (159 | ) | (256 | ) | (191 | ) | |||||
Net cash provided by operating activities | 101,667 | 116,267 | 82,578 | ||||||||
Cash flows from investing activities: | |||||||||||
Capital expenditures | (21,459 | ) | (11,733 | ) | (8,812 | ) | |||||
Software purchased or developed | (583 | ) | (414 | ) | (1,217 | ) | |||||
Capital contributions to equity method investment | (2,219 | ) | (349 | ) | (103 | ) | |||||
Distributions from equity method investment | 790 | 855 | 1,010 | ||||||||
Net cash used in investing activities | (23,471 | ) | (11,641 | ) | (9,122 | ) | |||||
Cash flows from financing activities: | |||||||||||
Capital contribution from Lone Star Funds | — | — | 29,750 | ||||||||
Proceeds from exercise of stock options | 230 | 20 | 873 | ||||||||
Tax withholdings on share-based compensation | (240 | ) | — | — | |||||||
Proceeds from debt refinancing | 545,198 | 275,000 | — | ||||||||
Disbursements for debt refinancing | (545,198 | ) | (271,988 | ) | — | ||||||
Payments of financing costs | (1,170 | ) | (4,424 | ) | — | ||||||
Principal payments for debt | (2,052 | ) | (26,375 | ) | (55,000 | ) | |||||
Payments to repurchase common stock | (54,601 | ) | (40,277 | ) | (48,479 | ) | |||||
Net cash used in financing activities | (57,833 | ) | (68,044 | ) | (72,856 | ) | |||||
Effect of foreign exchange rates on cash and cash equivalents | 622 | 225 | (1,498 | ) | |||||||
Net change in cash and cash equivalents | 20,985 | 36,807 | (898 | ) | |||||||
Cash, beginning of period | 51,536 | 14,729 | 15,627 | ||||||||
Cash, end of period | $ | 72,521 | $ | 51,536 | $ | 14,729 | |||||
See accompanying notes to consolidated financial statements.
36
Continental Building Products, Inc.
Consolidated Statements of Changes in Shareholders' Equity
Accumulated Other Comprehensive Loss | ||||||||||||||||||||||||||
Common Stock | Additional Paid-In Capital | Treasury Stock | Accumulated Earnings | Total Equity | ||||||||||||||||||||||
Shares | Amount | |||||||||||||||||||||||||
(in thousands, except share data) | ||||||||||||||||||||||||||
Balance as of January 1, 2015 | 44,069,000 | $ | 44 | $ | 288,393 | $ | — | $ | (3,060 | ) | $ | 17,996 | $ | 303,373 | ||||||||||||
Net income | — | — | — | — | — | 16,736 | 16,736 | |||||||||||||||||||
Other comprehensive loss, net of tax | — | — | — | — | (2,281 | ) | — | (2,281 | ) | |||||||||||||||||
Capital contribution from Lone Star | — | — | 29,750 | — | — | — | 29,750 | |||||||||||||||||||
Purchase of treasury shares | (2,395,049 | ) | — | — | (48,479 | ) | — | — | (48,479 | ) | ||||||||||||||||
Stock option exercise | 62,331 | — | 873 | — | — | — | 873 | |||||||||||||||||||
Stock-based compensation | 13,749 | — | 801 | — | — | — | 801 | |||||||||||||||||||
Other | — | — | — | — | — | (7 | ) | (7 | ) | |||||||||||||||||
Balance as of December 31, 2015 | 41,750,031 | 44 | 319,817 | (48,479 | ) | (5,341 | ) | 34,725 | 300,766 | |||||||||||||||||
Net income | — | — | — | — | — | 44,024 | 44,024 | |||||||||||||||||||
Other comprehensive income, net of tax | — | — | — | — | 1,932 | — | 1,932 | |||||||||||||||||||
Purchase of treasury shares | (2,104,606 | ) | — | — | (40,277 | ) | — | — | (40,277 | ) | ||||||||||||||||
Stock option exercise | 1,463 | — | 20 | — | — | — | 20 | |||||||||||||||||||
Stock-based compensation | 33,954 | — | 2,288 | — | — | — | 2,288 | |||||||||||||||||||
Employee stock purchase program | 10,873 | — | 259 | — | — | — | 259 | |||||||||||||||||||
Balance as of December 31, 2016 | 39,691,715 | 44 | 322,384 | (88,756 | ) | (3,409 | ) | 78,749 | 309,012 | |||||||||||||||||
Net income | — | — | — | — | — | 59,848 | 59,848 | |||||||||||||||||||
Other comprehensive income, net of tax | — | — | — | — | 760 | — | 760 | |||||||||||||||||||
Purchase of treasury shares | (2,289,162 | ) | — | — | (54,601 | ) | — | — | (54,601 | ) | ||||||||||||||||
Stock option exercise | 16,594 | — | 230 | — | — | — | 230 | |||||||||||||||||||
Stock-based compensation | 93,470 | — | 2,544 | — | — | — | 2,544 | |||||||||||||||||||
Employee stock purchase program | 20,342 | — | 233 | — | — | — | 233 | |||||||||||||||||||
Balance as of December 31, 2017 | 37,532,959 | $ | 44 | $ | 325,391 | $ | (143,357 | ) | $ | (2,649 | ) | $ | 138,597 | $ | 318,026 | |||||||||||
See accompanying notes to consolidated financial statements.
37
Continental Building Products, Inc.
Notes to the Consolidated Financial Statements
1. BACKGROUND AND NATURE OF OPERATIONS
Description of Business
Continental Building Products, Inc. (the "Company") is a Delaware corporation. Prior to the acquisition of the gypsum division of Lafarge North America Inc. ("Lafarge N.A.") described below, the Company had no operating activity. The Company manufactures gypsum wallboard related products for commercial and residential buildings and houses. The Company operates a network of three highly efficient wallboard facilities, all located in the eastern United States, and produces joint compound at one plant in the United States and at another plant in Canada.
The Acquisition
On June 24, 2013, Lone Star Fund VIII (U.S.), L.P., (along with its affiliates and associates, but excluding the companies that it owns as a result of its investment activity, "Lone Star"), entered into a definitive agreement with Lafarge N.A. to purchase the assets of its North American gypsum division for an aggregate purchase price of approximately $703 million (the "Acquisition") in cash. The closing of the Acquisition occurred on August 30, 2013.
Secondary Public Offerings
On March 18, 2015, LSF8, an affiliate of Lone Star, sold 5,000,000 shares of the Company's common stock at a price per share of $19.40. As a result of the sale, the aggregate beneficial ownership of Lone Star fell below 50% of the Company's outstanding shares of common stock and the Company no longer qualified as a "Controlled Company" under the corporate governance standards of New York Stock Exchange. On May 15, 2015 and June 3, 2015, LSF8 sold an additional 4,600,000 and 361,747 shares of the Company's common stock, respectively, at a price per share of $21.90. On September 16, 2015, LSF8 sold an additional 4,600,000 shares of the Company's common stock at a price per share of $19.85. The decrease in ownership by Lone Star and its affiliates to below 50% and LSF8's subsequent sales of common stock triggered an aggregate of $29.9 million in payments to certain officers and the estate of the Company's former CEO under the LSF8 Gypsum Holdings, L.P. Long Term Incentive Plan, which was funded by LSF8 (See Note 17, Related Party Transactions).
On March 18, 2016, following a series of secondary offerings, LSF8 Gypsum Holdings, L.P. ("LSF8") sold its remaining 5,106,803 shares of the Company's common stock at a price per share of $16.10. Following the March 18, 2016 transaction and the concurrent repurchase by the Company of 900,000 shares of Company's common stock from LSF8, to the best of the Company's knowledge, neither LSF8 nor any other affiliate of Lone Star held any shares of Company common stock (See Note 11, Treasury Stock).
2. SIGNIFICANT ACCOUNTING POLICIES
(a) | Basis of Presentation |
The accompanying consolidated financial statements for the Company have been prepared in accordance with accounting principles generally accepted in the United States ("U.S. GAAP"). The consolidated financial statements include the accounts of the Company and its wholly-owned subsidiaries. All intercompany transactions have been eliminated.
(b) | Cash |
Cash and cash equivalents include highly liquid investments with maturities of three months or less at the time of purchase maintained at financial institutions in the United States and Canada. At times the amounts may exceed federally insured deposit limits. The Company has not experienced any losses and does not believe it is exposed to any significant credit risk related to demand deposits.
Table 2.1: Certain Cash and Non-Cash Transactions | |||||||||||
For the Year Ended December 31, | |||||||||||
2017 | 2016 | 2015 | |||||||||
(in thousands) | |||||||||||
Cash paid during the period for: | |||||||||||
Interest paid on term loan | $ | 10,000 | $ | 10,996 | $ | 13,525 | |||||
Income taxes paid, net | 19,836 | 19,105 | 1,870 | ||||||||
38
Non-cash amounts in accounts payable for capital expenditures for the years ended December 31, 2017 and 2016 totaled $0.6 million and $2.5 million, respectively.
(c) | Use of Estimates |
The preparation of financial statements in conformity with U.S. GAAP requires management to make estimates and assumptions that affect the reported amounts of assets and liabilities and the disclosure of contingent assets and liabilities at the date of the financial statements and the reported amounts of revenues and expenses. Actual results may differ from these estimates.
(d) | Earnings Per Share |
Basic earnings per share is computed by dividing net income applicable to common stock by the weighted average number of shares of common stock outstanding. Diluted earnings per share is computed by dividing net income applicable to shares of common stock by the weighted average number of shares of common stock outstanding inclusive of any dilutive potential shares of common stock and dilutive stock options. It is assumed that all dilutive stock options were exercised at the beginning of each period and that the proceeds were used to purchase shares of common stock at the average market price during the period.
(e) | Cost of Goods Sold and Selling and Administrative Expenses |
Cost of goods sold includes costs of production, depreciation, amortization of acquired intangibles, inbound freight charges for raw materials, outbound freight to customers, purchasing and receiving costs, inspection costs, warehousing at plant facilities, and internal transfer costs. Costs associated with third-party warehouses are included in selling and administrative expenses. Selling and administrative costs also include expenses for sales, marketing, legal, accounting and finance services, human resources, customer support, treasury, other general corporate services and amortization of software development cost.
(f) | Foreign Currency Translation |
The Company uses the U.S. dollar as its functional currency for operations in the United States and the Canadian dollar for the Company's operations in Canada. The assets and liabilities of the Company's Canadian operations are translated at the exchange rate prevailing at the balance sheet date. Related revenues and expense accounts for the Canadian operations are translated using the average exchange rate during the year.
(g) | Concentration of Credit Risk |
Financial instruments that potentially subject the Company to concentrations of credit risk are primarily receivables. The Company performs ongoing credit evaluations of its customers' financial condition and generally requires no collateral from its customers. The allowances for non-collection of receivables are based upon analysis of economic trends in the construction industry, detailed analysis of the expected collectability of accounts receivable that are past due and the expected collectability of overall receivables.
Table 2.2: Significant Customer Net Sales as a Percentage of Total Net Sales | ||||||||
For the Year Ended December 31, | ||||||||
2017 | 2016 | 2015 | ||||||
Lowe's | 14 | % | 15 | % | 16 | % | ||
Foundation Building Materials | 11 | % | * | * | ||||
* | Foundation Building Materials was not considered a significant customer in prior years. |
Table 2.3: Significant Customer Accounts Receivable as a Percentage of Total Accounts Receivable | |||||
As of December 31, | |||||
2017 | 2016 | ||||
Lowe's | 25 | % | 32 | % | |
Foundation Building Materials | 9 | % | * | ||
* | Foundation Building Materials was not considered a significant customer in prior years. |
39
(h) | Receivables |
Trade receivables are recorded at net realizable value, which includes allowances for cash discounts and doubtful accounts, and are reflected net of customer rebates. The Company reviews the collectability of trade receivables on an ongoing basis. The Company reserves for trade receivables determined to be uncollectible. This determination is based on the delinquency of the account, the financial condition of the customer and the Company's collection experience.
(i) | Inventories |
Inventories are valued at the lower of cost and net realizable value. Virtually all of the Company's inventories are valued under the average cost method. Inventories include materials, labor and applicable factory overhead costs. The value of inventory is adjusted for damaged, obsolete, excess and slow-moving inventory. Net realizable value of inventory is estimated based on the impact of market trends, an evaluation of economic conditions and the value of current orders relating to the future sales of this type of inventory.
(j) | Property, Plant and Equipment |
Property, plant and equipment is stated at cost less accumulated depreciation. Depreciation of property, plant and equipment is computed for financial reporting purposes using the straight-line method over the estimated useful lives of the assets. These lives range from 20 to 25 years for buildings, 5 to 25 years for plant machinery, and 5 to 8 years for mobile equipment. Repair and maintenance costs are expensed as incurred. Substantially all of the Company's depreciation expenses are recorded in "Cost of goods sold" in the Statements of Operations.
The Company capitalizes interest during the construction of major projects. Capitalized interest is added to the cost of the underlying assets and is depreciated over the useful lives of those assets.
(k) | Impairment or Disposal of Long-Lived Assets |
The Company evaluates the recoverability of its long-lived assets in accordance with the provisions of Financial Accounting Standards Board ("FASB") Accounting Standards Codification ("ASC") 360 Property, Plant and Equipment ("ASC 360"). ASC 360 requires that long-lived assets and certain identifiable intangibles be reviewed for impairment whenever events or changes in circumstances indicate that the carrying amount of an asset may not be recoverable. Recoverability of assets is measured by comparing the carrying amount of an asset to future undiscounted net cash flows expected to be generated by the asset.
Such evaluations for impairment are significantly impacted by estimates of future prices for its products, capital needs, economic trends in the construction sector and other factors. If such assets are considered to be impaired, the impairment to be recognized is measured by the amount by which the carrying amount of the assets exceeds their fair value. Assets to be disposed of by sale are reflected at the lower of their carrying amount or fair value less cost to sell.
The Company assesses impairment of the Company's long-lived assets at the lowest level for which identifiable cash flows are largely independent of the cash flows of other assets and liabilities. As of December 31, 2017, the Company grouped the wallboard plants as an asset group. The plants within each group were used together to generate cash flows. The Company's two joint compound plants were also grouped as an asset group.
(l) | Goodwill and Intangible Assets |
The goodwill and intangibles reflected in the financial statements relates solely to the Acquisition.
Goodwill represents the excess of costs over the fair value of identifiable assets of businesses acquired. The Company evaluates goodwill and intangible assets in accordance with ASC 350, Goodwill and Other Intangible Assets. ASC 350 requires goodwill to be either qualitatively or quantitatively assessed for impairment annually (or more frequently if impairment indicators arise) for each reporting unit. As of December 31, 2017 and 2016, the Company had one reporting unit, wallboard, which included goodwill. The Company performs its annual impairment testing of goodwill as of October 1st of each year. The Company completed qualitative assessments as of October 1, 2017 and 2016 and determined that it was not more likely than not that the fair value of its reporting unit was less than its carrying amount. To date, no goodwill impairment losses have been recognized.
Intangible assets that are deemed to have definite lives are amortized over their useful lives. The cost of internal-use software purchased or developed internally, is accounted for in accordance with ASC 350-40, Internal-Use Software. The weighted average useful life of capitalized software is 3 years. Amortization of customer relationships is done over a 15 year period using an accelerated method that reflects the expected future cash flows from the acquired customer-related intangible asset. Trademarks identified as having definite lives are amortized on a straight-line basis over the estimated useful life of 15 years.
40
(m) | Fair Value Measurements |
U.S. GAAP provides a framework for measuring fair value, establishes a fair value hierarchy of the valuation techniques used to measure the fair value and requires certain disclosures relating to fair value measurements. Fair value is defined as the price that would be received to sell an asset or paid to transfer a liability in an orderly transaction between market participants in a market with sufficient activity.
The three-tier fair value hierarchy which prioritizes the inputs used in measuring fair value is as follows:
• | Level 1—Observable inputs such as quoted prices (unadjusted) in active markets for identical assets or liabilities that a Company has the ability to access; |
• | Level 2—Inputs, other than the quoted market prices included in Level 1, which are observable for the asset or liability, either directly or indirectly; and |
• | Level 3—Unobservable inputs for the asset or liability which is typically based on an entity's own assumptions when there is little, if any, related market data available. |
The Company evaluates assets and liabilities subject to fair value measurements on a recurring and non-recurring basis to determine the appropriate level to classify them for each reporting period. This determination requires significant judgments to be made by the Company. The fair values of receivables, accounts payable, accrued costs and other current liabilities approximate the carrying values as a result of the short-term nature of these instruments.
(n) | Environmental Remediation Liabilities |
When the Company determines that it is probable that a liability for environmental matters has been incurred, an undiscounted estimate of the required remediation costs is recorded as a liability in the financial statements, without offset of potential insurance recoveries. Costs that extend the life, increase the capacity or improve the safety or efficiency of company-owned assets or are incurred to mitigate or prevent future environmental contamination are capitalized. Other environmental costs are expensed when incurred. The Company did not have any environmental liabilities recorded as of December 31, 2017 and 2016.
(o) | Income Taxes |
The provision for income taxes has been determined using the asset and liability approach of accounting for income taxes to reflect the expected future tax consequences of events recognized in the financial statements. Deferred income tax assets and liabilities are recognized by applying enacted tax rates to temporary differences that exist as of the balance sheet date which result from differences in the timing of reported taxable income between tax and financial reporting.
The Company reduces the carrying amounts of deferred tax assets by a valuation allowance if, based on the available evidence, it is more likely than not that such assets will not be realized. The need to establish valuation allowances for deferred tax assets is assessed annually. In assessing the requirement for, and amount of, a valuation allowance in accordance with the more likely than not standard, the Company gives appropriate consideration to all positive and negative evidence related to the realization of the deferred tax assets. This assessment considers, among other matters, the nature, frequency and severity of current and cumulative losses, forecasts of future profitability and foreign source income, the duration of statutory carryforward periods, and the Company's experience with operating loss and tax credit carryforward expirations. A history of cumulative losses is a significant piece of negative evidence used in the assessment. If a history of cumulative losses is incurred for a tax jurisdiction, forecasts of future profitability are not used as positive evidence related to the realization of the deferred tax assets in the assessment.
The Company recognizes the tax benefits of an uncertain tax position if those benefits are more likely than not to be sustained based on existing tax law. Additionally, the Company establishes a reserve for tax positions that are more likely than not to be sustained based on existing tax law, but uncertain in the ultimate benefit to be sustained upon examination by the relevant taxing authorities. Unrecognized tax benefits are subsequently recognized at the time the more likely than not recognition threshold is met, the tax matter is effectively settled or the statute of limitations for the relevant taxing authority to examine and challenge the tax position has expired, whichever is earlier.
(p) | Share-Based Compensation |
The Company accounts for stock-based compensation to employees and directors based on the estimated fair value of the award generally determined on the date of grant. The associated expense, net of estimated forfeitures, is generally recognized
41
ratably over the requisite service period, which is generally the vesting period of the award. For awards with graded vesting that only contain a service condition, the Company recognizes expense on a straight-line basis over the service period.
(q) | Defined Contribution Pension Plans and Other Post-Retirement Benefits |
Subsequent to the Acquisition, the Company's employees were able to participate in a 401K defined contribution pension plan. The Company contributes funds into this plan depending on each employee's years of service and subject to certain limits. For the years ended December 31, 2017, 2016 and 2015, the Company recorded an expense of $1.8 million, $1.9 million and $1.4 million, respectively, for these contributions.
(r) | Revenue Recognition |
Revenue from the sale of gypsum products is recorded when title and ownership are transferred upon shipment of the products. Amounts billed to a customer in a sales transaction related to shipping and handling are included in "Net sales," and costs incurred for shipping and handling are classified as "Cost of goods sold" in the Consolidated Statements of Operations. The Company records estimated reductions to revenue for customer programs and incentive offerings, including promotions and other volume-based incentives, in the period in which the sale occurs.
(s) | Derivative Instruments |
The Company uses derivative instruments to manage selected commodity price and interest rate exposures. The Company does not use derivative instruments for speculative trading purposes, and typically does not hedge beyond one year. All derivative instruments must be recorded on the balance sheet at fair value.
Currently, the Company is using natural gas swap contracts to manage commodity price increase exposure and interest rate swap contracts to lock a portion of the variability of the interest payments on long-term debt. The Company elected to designate these derivative instruments as cash flow hedges in accordance with ASC 815-20, Derivatives – Hedging. For derivative contracts designated as cash flow hedges, the effective portion of changes in the fair value of the derivative is recorded to accumulated other comprehensive income, and is reclassified to earnings when the underlying forecasted transaction affects earnings. The ineffective portion of the changes in the fair value of the derivative is recorded in cost of goods sold for gas hedges and in interest expense for interest rate swaps. Gains and losses on these contracts that are designated as cash flow hedges are reclassified into earnings when the underlying forecasted transaction affect earnings. Cash flows from derivative instruments are included in net cash provided by operating activities in the consolidated statements of cash flows. The Company reassesses the probability of the underlying forecasted transactions occurring on a quarterly basis.
(t) | Recent Accounting Pronouncements |
Accounting Standards Adopted During the Period
In July 2015, the FASB issued Accounting Standards Update ("ASU") 2015-11, "Inventory: Simplifying the Measurement of Inventory." This guidance applies to inventory valued at first-in, first-out (FIFO) or average cost and requires inventory to be measured at the lower of cost and net realizable value, rather than at the lower of cost or market. ASU 2015-11 was effective on a prospective basis for annual periods, including interim reporting periods within those periods, beginning after December 15, 2016. The Company values its inventory under the average cost method and thus was required to adopt the standard. The Company adopted the new standard in the first quarter of 2017. The adoption of this standard did not have a material impact on the Company's Consolidated Financial Statements.
In March 2016, the FASB issued ASU 2016-09, "Compensation-Stock Compensation (Topic 718): Improvements to Employee Share-Based Payment Accounting," which introduces targeted amendments intended to simplify the accounting for stock compensation. Specifically, the ASU requires all excess tax benefits and tax deficiencies (including tax benefits of dividends on share-based payment awards) to be recognized as income tax expense or benefit in the income statement. The tax effects of exercised or vested awards should be treated as discrete items in the reporting period in which they occur. An entity also should recognize excess tax benefits, and assess the need for a valuation allowance, regardless of whether the benefit reduces taxes payable in the current period. That is, off-balance sheet accounting for net operating losses stemming from excess tax benefits would no longer be required and instead such net operating losses would be recognized when they arise. Existing net operating losses that are currently tracked off-balance sheet would be recognized, net of a valuation allowance if required, through an adjustment to opening retained earnings in the period of adoption. Entities will no longer need to maintain and track an "APIC pool." The ASU also requires excess tax benefits to be classified along with other income tax cash flows as an operating activity in the statement of cash flows. The amendments were effective for annual periods beginning after December 15, 2016. The Company adopted the new standard in the first quarter of 2017, which resulted in a favorable adjustment to income tax provision of $0.3 million.
42
In January 2017, the FASB issued ASU 2017- 04, "Intangibles - Goodwill and Other." This ASU simplifies the goodwill impairment calculation by eliminating the requirement to calculate the implied fair value of goodwill (i.e., Step 2 of today's goodwill impairment test) to measure a goodwill impairment charge. Instead, entities will record an impairment charge based on the excess of a reporting unit's carrying amount over its fair value (i.e., Step 1 of today's goodwill impairment test). The standard will be applied prospectively and is effective for annual and interim impairment tests performed in periods beginning after December 15, 2019. Early adoption is permitted for annual and interim goodwill impairment testing dates after January 1, 2017. The Company adopted the new standard in the fourth quarter of 2017. The adoption of this standard did not have a material impact on the Company's Consolidated Financial Statements.
Accounting Standards Not Yet Adopted
In May 2014, the FASB issued ASU No. 2014-9, "Revenue from Contracts with Customers (Topic 606)," which provides accounting guidance for all revenue arising from contracts with customers and affects all entities that enter into contracts to provide goods or services to their customers. In August 2015, the FASB issued ASU No. 2015-14, "Revenue from Contracts with Customers (Topic 606): Deferral of the Effective Date," which defers the effective date of ASU No. 2014-9 for all entities by one year to annual reporting periods beginning after December 15, 2017. The ASU requires retroactive application on either a full or modified basis. The Company will adopt the standard on January 1, 2018. Based on evaluation, the Company has concluded it has one revenue stream and the adoption of this new guidance will not have a material impact on its Consolidated Financial Statements. The Company is still in the process of evaluating the potential impact of additional disclosure requirements.
In February 2016, the FASB issued ASU 2016-02, "Leases." ASU 2016-02 requires lessees to recognize a lease liability and a right-of-use asset on the balance sheet. ASU 2016-02 is effective for fiscal years beginning after December 15, 2018, including interim periods within those fiscal years. The Company is in the process of evaluating the impact of adoption, which is not expected to have a material impact on the Company's Consolidated Financial Statements.
In June 2016, the FASB issued ASU 2016-13, "Financial Instruments – Credit Losses: Measurement of Credit Losses on Financial Instruments." This ASU is intended to introduce a revised approach to the recognition and measurement of credit losses, emphasizing an updated model based on expected losses rather than incurred losses. The provisions of this standard are effective for reporting periods beginning after December 15, 2019 and early adoption is permitted. The Company is currently evaluating the impact that this guidance may have on its Consolidated Financial Statements.
In August 2016, the FASB issued ASU 2016-15, "Classification of Certain Cash Receipts and Cash Payments." This ASU reduces existing diversity in the classification of certain cash receipts and cash payments on the statements of cash flows. ASU 2016-15 is effective for fiscal years beginning after December 15, 2017, and for interim periods within those fiscal years. The Company does not expect the adoption of this standard to have a material impact on its Consolidated Financial Statements.
In October 2016, the FASB issued ASU 2016-16, "Intra-Entity Transfers of Assets Other Than Inventory." The new standard requires companies to recognize the income tax effects of intercompany sales or transfers of assets, other than inventory, in the income statement as income tax expense (or benefit) in the period the sales or transfer occurs. The standard requires companies to apply a modified retrospective approach with a cumulative catch-up adjustment to opening retained earnings in the period of adoption. The provisions of this standard are effective for fiscal years beginning after December 15, 2017, and early adoption is permitted. The Company does not expect the adoption of this standard to have a material impact on its Consolidated Financial Statements.
In August 2017, the FASB issued ASU 2017-12, "Derivatives and Hedging (Topic 815), Targeted Improvements to Accounting for Hedging Activities". This ASU expands an entity's ability to hedge non-financial and financial risk components and reduce complexity in fair value hedges of interest rate risk. The guidance eliminates the requirement to separately measure and report hedge ineffectiveness and generally requires the entire change in the fair value of a hedging instrument to be presented in the same income statement line as the hedged item. The provisions of this standard are effective in 2019 for calendar-year public business entities and in 2020 for all other calendar-year companies. Early adoption of the standard is permitted. The Company is currently evaluating when it will adopt the ASU and the expected impact to its Consolidated Financial Statements.
(u) | Reclassifications |
Certain reclassifications of prior year information were made to conform to the 2017 presentation. These reclassifications had no material impact on the Company's Consolidated Financial Statements.
43
3. RECEIVABLES, NET
Table 3: Details of Receivables, Net | |||||||
As of December 31, | |||||||
2017 | 2016 | ||||||
(in thousands) | |||||||
Trade receivables, gross | $ | 39,577 | $ | 33,199 | |||
Allowance for cash discounts and doubtful accounts | (808 | ) | (726 | ) | |||
Receivables, net | $ | 38,769 | $ | 32,473 | |||
Trade receivables are recorded net of credit memos issued during the normal course of business.
Table 3.2: Changes in Allowance for Cash Discounts and Doubtful Accounts | |||||||||||
For the Year Ended December 31, | |||||||||||
2017 | 2016 | 2015 | |||||||||
(in thousands) | |||||||||||
Balance at beginning of period | $ | 726 | $ | 1,988 | 2,308 | ||||||
Provision for/(release of) bad debt expense | 15 | (104 | ) | (166 | ) | ||||||
Write-offs, net of recoveries | 8 | (1,209 | ) | (71 | ) | ||||||
Cash discount additions | 4,783 | 4,334 | 3,719 | ||||||||
Cash discount deductions | (4,724 | ) | (4,283 | ) | (3,802 | ) | |||||
Balance at end of period | $ | 808 | $ | 726 | $ | 1,988 | |||||
4. INVENTORIES, NET
Table 4: Details of Inventories, Net | |||||||
As of December 31, | |||||||
2017 | 2016 | ||||||
(in thousands) | |||||||
Finished products | $ | 5,893 | $ | 7,246 | |||
Raw materials | 11,663 | 10,910 | |||||
Supplies and other | 7,326 | 7,083 | |||||
Inventories, net | $ | 24,882 | $ | 25,239 | |||
5. PROPERTY, PLANT AND EQUIPMENT, NET
Table 5: Details of Property, Plant and Equipment, Net | |||||||
As of December 31, | |||||||
2017 | 2016 | ||||||
(in thousands) | |||||||
Land | $ | 13,187 | $ | 12,925 | |||
Buildings | 114,051 | 112,583 | |||||
Plant machinery | 281,786 | 275,010 | |||||
Mobile equipment | 10,366 | 6,721 | |||||
Construction in progress | 20,291 | 15,016 | |||||
Property, plant and equipment, at cost | 439,681 | 422,255 | |||||
Accumulated depreciation | (145,678 | ) | (114,417 | ) | |||
Property, plant and equipment, net | $ | 294,003 | $ | 307,838 | |||
44
Depreciation expense was $34.5 million, $33.1 million and $35.4 million for the years ended December 31, 2017, 2016 and 2015 respectively.
6. CUSTOMER RELATIONSHIPS AND OTHER INTANGIBLES, NET
Table 6.1: Details of Customer Relationships and Other Intangibles, Net | |||||||||||||||||||||||
As of December 31, | |||||||||||||||||||||||
2017 | 2016 | ||||||||||||||||||||||
Gross | Accumulated Amortization | Net | Gross | Accumulated Amortization | Net | ||||||||||||||||||
(in thousands) | |||||||||||||||||||||||
Customer relationships | $ | 116,711 | $ | (57,811 | ) | $ | 58,900 | $ | 116,267 | $ | (48,243 | ) | $ | 68,024 | |||||||||
Purchased and internally developed software | 6,226 | (4,871 | ) | 1,355 | 5,322 | (3,289 | ) | 2,033 | |||||||||||||||
Trademarks | 14,839 | (4,287 | ) | 10,552 | 14,783 | (3,285 | ) | 11,498 | |||||||||||||||
Total | $ | 137,776 | $ | (66,969 | ) | $ | 70,807 | $ | 136,372 | $ | (54,817 | ) | $ | 81,555 | |||||||||
Amortization expense was $11.9 million, $13.5 million and $15.9 million for the years ended December 31, 2017, 2016 and 2015, respectively.
Table 6.2: Details of Future Amortization Expense of Customer Relationships and Other Intangibles | |||
As of December 31, 2017 | |||
(in thousands) | |||
2018 | $ | 9,763 | |
2019 | 8,745 | ||
2020 | 7,880 | ||
2021 | 7,154 | ||
2022 | 6,535 | ||
Thereafter | 30,730 | ||
Total | $ | 70,807 | |
7. INVESTMENT IN SEVEN HILLS
The Company is a party with an unaffiliated third party to a paperboard liner venture named Seven Hills Paperboard, LLC ("Seven Hills") that provides the Company with a continuous supply of high-quality recycled paperboard liner to meet its ongoing production requirements.
The Company has evaluated the characteristics of its investment and determined that Seven Hills would be deemed a variable interest entity, but that it does not have the power to direct the principal activities most impacting the economic performance of Seven Hills, and is thus not the primary beneficiary. As such, the Company accounts for this investment in Seven Hills under the equity method of accounting.
In 2017, the Company made capital contributions of $2.2 million for capital projects, which increased the capacity of Seven Hills to supply the Company with its paper needs.
The Company currently has the right to terminate the venture and put its interest to the other investor based on a formula-driven price effective on the anniversary of the commencement date by providing notice two years prior to any such anniversary. Proceeds from such termination would revert to the Company. As of December 31, 2017 and 2016, the estimated redemption value would be $8.9 million and $8.3 million, respectively.
Paperboard liner purchased from Seven Hills was $55.8 million, $47.0 million and $45.5 million for the years ended December 31, 2017, 2016 and 2015, respectively. As of December 31, 2017, the Company had certain purchase commitments for paper totaling $26.3 million through 2020.
45
8. ACCRUED AND OTHER LIABILITIES
Table 8: Details of Accrued and Other Liabilities | |||||||
As of December 31, | |||||||
2017 | 2016 | ||||||
(in thousands) | |||||||
Employee-related costs | $ | 9,258 | $ | 9,595 | |||
Other taxes | 938 | 2,088 | |||||
Other | 1,744 | 638 | |||||
Accrued and other liabilities | $ | 11,940 | $ | 12,321 | |||
9. DEBT
Table 9.1: Details of Debt | |||||||
As of December 31, | |||||||
2017 | 2016 | ||||||
(in thousands) | |||||||
First Lien Credit Agreement (a) | $ | 271,573 | $ | 273,625 | |||
Less: Original issue discount (net of amortization) | (1,681 | ) | (1,946 | ) | |||
Less: Debt issuance costs | (4,580 | ) | (5,317 | ) | |||
Total debt | 265,312 | 266,362 | |||||
Less: Current portion of long-term debt | (1,702 | ) | (1,742 | ) | |||
Long-term debt | $ | 263,610 | $ | 264,620 | |||
(a) | As of December 31, 2017, the Amended and Restated Credit Agreement, as amended, had a maturity date of August 18, 2023 and an interest rate of LIBOR (with a 0.75% floor) plus 2.25%, compared to as of December 31, 2016, at which time the Amended and Restated Credit Agreement had the same maturity date and an interest rate of LIBOR (with a 0.75% floor) plus 2.75%. |
On August 18, 2016, the Company, Continental Building Products Operating Company, LLC ("OpCo") and Continental Building Products Canada Inc. and the lenders party thereto and Credit Suisse, as Administrative Agent, entered into an Amended and Restated Credit Agreement amending and restating the Company's First Lien Credit Agreement (the "Amended and Restated Credit Agreement"). The Amended and Restated Credit Agreement provides for a $275 million senior secured first lien term loan facility and a $75 million senior secured revolving credit facility (the "Revolver"), which mature on August 18, 2023 and August 18, 2021, respectively. Related to this debt refinancing, the Company incurred $4.7 million of discount and debt issuance costs, of which $2.5 million was recorded in Other expense, net on the Consolidated Statements of Operations in 2016, and $2.2 million will be amortized over the term of the Amended and Restated Credit Agreement. Upon completion of this debt refinancing, the Company recognized an additional expense of $3.3 million related to losses resulting from debt extinguishment which is also reported in Other expense, net on the Consolidated Statements of Operations in 2016. The interest rate under the Amended and Restated Credit Agreement remained floating but was reduced to a spread over LIBOR of 2.75% and floor of 0.75%.
On February 21, 2017, the Company repriced its term loan under the Amended and Restated Credit Agreement lowering its interest rate by 25 basis points to LIBOR plus 2.50%. Subsequently, on December 6, 2017, the Company further repriced its term loan under the Amended and Restated Credit Agreement lowering its interest rate by an additional 25 basis points to LIBOR plus 2.25%. The Company may further reduce its interest rate to LIBOR plus 2.00% based on the attainment of a total leverage ratio of 1.1 or better. All other terms and conditions under the Amended and Restated Credit Agreement remained the same. In connection with the debt repricings, the Company incurred $1.2 million of debt issuance costs, which was recorded in Other expense, net on the Consolidated Statements of Operations in 2017.
The Amended and Restated Credit Agreement is secured by the underlying property and equipment of the Company. Under the terms of the Amended and Restated Credit Agreement, we are required to repay the Term Loan in consecutive quarterly installments equal to 0.25% of the original principal amount of the Term Loan, beginning on September 30, 2016, and a final installment on August 18, 2023 in an amount equal to the aggregate principal amount outstanding on such date. During 2017, we made approximately $2.1 million of mandatory principal payments compared to $1.4 million in 2016. During the year ended December 31, 2017 the Company made no voluntary prepayment of principal, compared to $25.0 million and
46
$55.0 million in the years ended December 31, 2016 and 2015, respectively. As of December 31, 2017, the annual effective interest rate, including original issue discount and amortization of debt issuance costs, was 4.3%.
There were no amounts outstanding under the Revolver as of December 31, 2017 or 2016. During the year ended December 31, 2017 the Company did not have any draws under the Revolver, compared to $22.0 million which the Company borrowed and repaid in full in 2016 under the applicable revolving credit facility. Interest under the Revolver is floating, based on LIBOR plus 2.25%. In addition, the Company pays a facility fee of 50 basis points per annum on the total capacity under the Revolver. Availability under the Revolver as of December 31, 2017, based on draws and outstanding letters of credit and absence of violations of covenants, was $73.4 million.
Table 9.2: Details of Future Minimum Principal Payments Due Under the Amended and Restated Credit Agreement | |||
Amount Due | |||
(in thousands) | |||
2018 | $ | 2,736 | |
2019 | 2,736 | ||
2020 | 2,736 | ||
2021 | 2,736 | ||
2022 | 2,736 | ||
Thereafter | 257,893 | ||
Total Payments | $ | 271,573 | |
Under the terms of the Amended and Restated Credit Agreement, the Company is required to comply with certain covenants, including among others, the limitation of indebtedness, limitation on liens, and limitations on certain cash distributions. One single financial covenant governs all of the Company's debt and only applies if the outstanding borrowings of the Revolver plus outstanding letters of credit are greater than $22.5 million as of the end of the quarter. The financial covenant is a total leverage ratio calculation, in which total debt less outstanding cash is divided by adjusted earnings before interest, taxes, depreciation and amortization. As the sum of outstanding borrowings under the Revolver and outstanding letters of credit were less than $22.5 million at December 31, 2017, the total leverage ratio of no greater than 5.0 under the financial covenant was not applicable at December 31, 2017. The Company was in compliance with all applicable covenants under the Amended and Restated Credit Agreement as of December 31, 2017.
10. DERIVATIVE INSTRUMENTS
Commodity Derivative Instruments
As of December 31, 2017, the Company had 3.5 million mmBTUs (millions of British Thermal Units) in aggregate notional amount outstanding natural gas swap contracts to manage commodity price exposures. All of these contracts mature by December 31, 2018. The Company elected to designate these derivative instruments as cash flow hedges in accordance with ASC 815-20, Derivatives – Hedging. No ineffectiveness was recorded on these contracts during the years ended December 31, 2017, 2016 and 2015.
Interest Rate Derivative Instrument
In September 2016, the Company entered into interest rate swap agreements for a combined notional amount of $100.0 million with a term of four years, which hedged the floating LIBOR on a portion of the term loan under the Amended and Restated Credit Agreement to an average fixed rate of 1.323% and LIBOR floor of 0.75%. The Company elected to designate these interest rate swaps as cash flow hedges for accounting purposes. No ineffectiveness was recorded on these contracts during the years ended December 31, 2017 and 2016.
47
Table 10.1: Details of Derivatives Fair Value | |||||||
As of December 31, | |||||||
2017 | 2016 | ||||||
(in thousands) | |||||||
Assets | |||||||
Interest rate swap | $ | 2,148 | $ | 1,800 | |||
Commodity hedges | 11 | 351 | |||||
Total assets | $ | 2,159 | $ | 2,151 | |||
Liabilities | |||||||
Interest rate swap | $ | — | $ | — | |||
Commodity hedges | 613 | — | |||||
Total liabilities | $ | 613 | $ | — | |||
Table 10.2: Gains/(losses) on Derivatives | |||||||||||||||||||||||
For the Year Ended December 31, | |||||||||||||||||||||||
2017 | 2016 | 2015 | 2017 | 2016 | 2015 | ||||||||||||||||||
Gain/(loss) recognized in AOCI on derivatives (effective portion), net of tax | Loss reclassified from AOCI into income (effective portion), net of tax | ||||||||||||||||||||||
(in thousands) | |||||||||||||||||||||||
Interest rate swap | $ | 328 | $ | 1,302 | — | $ | (87 | ) | $ | (110 | ) | — | |||||||||||
Commodity hedges | (455 | ) | 532 | 2,718 | (168 | ) | (306 | ) | (1,900 | ) | |||||||||||||
Total | $ | (127 | ) | $ | 1,834 | $ | 2,718 | $ | (255 | ) | $ | (416 | ) | $ | (1,900 | ) | |||||||
Counterparty Risk
The Company is exposed to credit losses in the event of nonperformance by the counterparties to the Company's derivative instruments. As of December 31, 2017, the Company's derivatives were in a $1.5 million net asset position and recorded in Other current assets. All of the Company's counterparties have investment grade credit ratings; accordingly, the Company anticipates that the counterparties will be able to fully satisfy their obligations under the contracts. The Company's agreements outline the conditions upon which it or the counterparties are required to post collateral. As of December 31, 2017, the Company had no collateral posted with its counterparties related to the derivatives.
11. TREASURY STOCK
On May 15, 2015, the Company repurchased 913,200 shares of its common stock from LSF8 in a private transaction at a price per share of $21.90, or an aggregate of approximately $20.0 million, pursuant to a stock purchase agreement dated May 11, 2015. On September 16, 2015, the Company repurchased an additional 1,007,500 shares of its common stock from LSF8 in a private transaction at a price per share of $19.85, or an aggregate of approximately $20.0 million, pursuant to a stock purchase agreement dated September 10, 2015. On March 18, 2016, the Company repurchased an additional 900,000 shares of its common stock from LSF8 in a private transaction at a price per share of $16.10, or an aggregate of approximately $14.5 million, pursuant to a stock purchase agreement dated March 14, 2016.
On November 4, 2015, the Company announced that the Board of Directors approved a new stock repurchase program authorizing the Company to repurchase up to $50 million of its common stock, at such times and prices as determined by management as market conditions warrant, through December 31, 2016. Pursuant to this authorization, the Company has repurchased shares of its common stock in the open market and in the March 2016 private transaction with LSF8 described above. On August 3, 2016, the Company announced the Board of Directors had approved an expansion of its stock repurchase program by $50 million, increasing the aggregate authorization from up to $50 million to up to $100 million. The program was also extended from the end of 2016 to the end of 2017.
On February 21, 2017, the Board of Directors further expanded the Company's share repurchase program by an additional $100 million up to a total of $200 million of its common stock and extended the expiration date to December 31, 2018.
All repurchased shares are held in treasury, reducing the number of shares of common stock outstanding and used in the Company's earnings per share calculation.
48
Table 11: Details of Treasury Stock Activity | |||||||||||||||||||||
December 31, 2017 | December 31, 2016 | ||||||||||||||||||||
Shares | Amount (a) | Average Share Price (a) | Shares | Amount (a) | Average Share Price (a) | ||||||||||||||||
(in thousands, except share data) | |||||||||||||||||||||
Beginning Balance | 4,499,655 | $ | 88,756 | $ | 19.73 | 2,395,049 | $ | 48,479 | $ | 20.24 | |||||||||||
Repurchases on open market | 2,289,162 | 54,601 | 23.85 | 1,204,606 | 25,787 | 21.41 | |||||||||||||||
Repurchase from LSF8 in private transaction | — | — | — | 900,000 | 14,490 | 16.10 | |||||||||||||||
Ending Balance | 6,788,817 | $ | 143,357 | $ | 21.12 | 4,499,655 | $ | 88,756 | $ | 19.73 | |||||||||||
(a) Includes commissions paid for repurchases on open market. | |||||||||||||||||||||
12. SHARE-BASED COMPENSATION
The Company grants stock options, restricted stock awards ("RSAs"), restricted stock units ("RSUs") and performance restricted stock units ("PRSUs") to eligible participants under its 2014 Stock Incentive Plan, which was approved by the Board of Directors and stock holders. The PRSUs vesting is subject to the achievement of certain performance conditions and the number of PRSUs earned could vary from 0% to 200% of the number of PRSUs awarded, depending on the Company's performance relative to a cumulative two year EBITDA target. The fair value of each RSU and PRSU is equal to the market price of the Company's common stock at the date of the grant. The RSUs granted to employees vest ratably over four years and one year for members of the board of directors from the grant date.
Table 12.1: Stock Options | ||||||||||||||||||||
For the Year Ended December 31, | ||||||||||||||||||||
2017 | 2016 | 2015 | ||||||||||||||||||
Stock Options | Weighted Average Exercise Price | Stock Options | Weighted Average Exercise Price | Stock Options | Weighted Average Exercise Price | |||||||||||||||
Outstanding, beginning of year | 75,456 | $ | 14.00 | 77,369 | $ | 14.00 | 142,000 | $ | 14.00 | |||||||||||
Granted | — | — | — | — | — | — | ||||||||||||||
Exercised | (16,594 | ) | 14.00 | (1,463 | ) | 14.00 | (62,331 | ) | 14.00 | |||||||||||
Cancelled/Forfeited | (3,750 | ) | 14.00 | (450 | ) | 14.00 | (2,300 | ) | 14.00 | |||||||||||
Outstanding, end of year | 55,112 | $ | 14.00 | 75,456 | $ | 14.00 | 77,369 | $ | 14.00 | |||||||||||
Exercisable at end of year | 39,688 | $ | 14.00 | 37,108 | $ | 14.00 | 19,131 | $ | 14.00 | |||||||||||
The weighted average exercise price of the 55,112 options vested or expected to vest as of December 31, 2017 was $14.00. During 2017 and 2016, the total intrinsic value of options exercised was $0.2 million compared to a nominal amount for the options exercised during 2016.
49
Table 12.2: Restricted Stock Awards, Restricted Stock Units and Performance Based Restricted Stock Units | |||||||||||||||
Restricted Stock Awards | Restricted Stock Units | Performance Restricted Stock Units | Total | Weighted Average Grant Date Fair Value | |||||||||||
Non-vested as of January 1, 2015 | 55,000 | — | — | 55,000 | $ | 14.00 | |||||||||
Granted | — | 71,275 | 46,330 | 117,605 | 21.19 | ||||||||||
Cancelled/Forfeited | (3,619 | ) | (1,103 | ) | — | (4,722 | ) | 14.00 | |||||||
Vested and issued | (13,749 | ) | — | — | (13,749 | ) | 14.00 | ||||||||
Non-vested as of December 31, 2015 | 37,632 | 70,172 | 46,330 | 154,134 | 19.44 | ||||||||||
Granted | — | 125,701 | 62,795 | 188,496 | 17.22 | ||||||||||
Cancelled/Forfeited | (1,068 | ) | (2,444 | ) | — | (3,512 | ) | 17.47 | |||||||
Vested and issued | (12,329 | ) | (23,849 | ) | — | (36,178 | ) | 18.72 | |||||||
Non-vested as of December 31, 2016 | 24,235 | 169,580 | 109,125 | 302,940 | 18.17 | ||||||||||
Granted | — | 100,224 | 49,207 | 149,431 | 23.75 | ||||||||||
Cancelled/Forfeited | (2,500 | ) | (27,976 | ) | (26,897 | ) | (57,373 | ) | 20.15 | ||||||
Vested and issued | (12,118 | ) | (60,259 | ) | (23,623 | ) | (96,000 | ) | 18.44 | ||||||
Non-vested as of December 31, 2017 | 9,617 | 181,569 | 107,812 | 298,998 | $ | 20.49 | |||||||||
As of December 31, 2017, 2016 and 2015, the intrinsic value of options, restricted stock awards, RSUs and PRSUs outstanding, exercisable, and vested or expected to vest was $9.2 million, $7.7 million and $3.0 million, respectively.
For the years ended December 31, 2017, 2016 and 2015, the Company recognized share-based compensation expenses of $2.8 million, $2.1 million and $0.7 million in expense, respectively. The expenses related to share-based compensation awards that were recorded in Selling and administrative expenses. As of December 31, 2017, there was $3.8 million of total unrecognized compensation cost related to non-vested stock options, restricted stock awards, RSUs and PRSUs. This cost is expected to be recognized over a weighted-average period of 2.2 years.
Employee Stock Purchase Plan
On February 18, 2015, subject to approval by the Company's stockholders, the Company adopted an Employee Stock Purchase Plan ("ESPP") enabling employees to purchase shares of the Company's common stock at a discount. On May 20, 2015, the Company's stockholders approved the ESPP at the Company's 2015 annual meeting. The ESPP authorizes the issuance of up to 600,000 shares of the Company’s common stock, but actual shares issued will depend on plan participation. Shares issued under the ESPP will reduce, on a share-for-share basis, the number of shares of the Company's common stock previously available for issuance pursuant to the Company's 2014 Stock Incentive Plan. Employees contribute to the ESPP through payroll deductions over a twelve month offering period and are limited to the lower of 10% of the employee's salary or $10,000 per employee. The purchase price of the shares is equal to the lower of 85 percent of the closing price of the Company's common stock on either the first or last trading day of a given offering period. The first offering period commenced on May 1, 2015 and a second commenced on May 1, 2016. There have been no additional offering periods after May 1, 2016. During the years ended December 31, 2017 and 2016, expenses recognized were nominal and $0.1 million, respectively, which was recorded in Selling and administrative expenses, related to the ESPP. Additionally, during 2017 the Company's employees purchased 20,342 shares of common stock under the ESPP.
50
13. ACCUMULATED OTHER COMPREHENSIVE LOSS
Table 13: Details of Changes in Accumulated Other Comprehensive Loss by Category | |||||||||||
Foreign currency translation adjustment | Net unrealized gain on derivatives, net of tax | Total | |||||||||
(in thousands) | |||||||||||
Balance as of January 1, 2015 | $ | (2,193 | ) | $ | (867 | ) | $ | (3,060 | ) | ||
Other comprehensive (loss)/income before reclassifications | (3,099 | ) | 2,718 | (381 | ) | ||||||
Amounts reclassified from AOCI | — | (1,900 | ) | (1,900 | ) | ||||||
Net current period other comprehensive (loss)/income | (3,099 | ) | 818 | (2,281 | ) | ||||||
Balance as of December 31, 2015 | (5,292 | ) | (49 | ) | (5,341 | ) | |||||
Other comprehensive income before reclassifications | 514 | 1,834 | 2,348 | ||||||||
Amounts reclassified from AOCI | — | (416 | ) | (416 | ) | ||||||
Net current period other comprehensive income | 514 | 1,418 | 1,932 | ||||||||
Balance as of December 31, 2016 | $ | (4,778 | ) | $ | 1,369 | $ | (3,409 | ) | |||
Other comprehensive income/(loss) before reclassifications | 1,142 | (127 | ) | 1,015 | |||||||
Amounts reclassified from AOCI | — | (255 | ) | (255 | ) | ||||||
Net current period other comprehensive income/(loss) | 1,142 | (382 | ) | 760 | |||||||
Balance as of December 31, 2017 | $ | (3,636 | ) | $ | 987 | $ | (2,649 | ) | |||
14. INCOME TAXES
Table 14.1: Components of Income Tax Expense | |||||||||||
For the Year Ended December 31, | |||||||||||
2017 | 2016 | 2015 | |||||||||
(in thousands) | |||||||||||
Current income tax expense | $ | 19,980 | $ | 16,323 | $ | 5,929 | |||||
Deferred tax (benefit)/expense | (3,414 | ) | 6,504 | 3,407 | |||||||
Income tax expense | $ | 16,566 | $ | 22,827 | $ | 9,336 | |||||
Table 14.2: Components of Income before Provision for Income Taxes by Country | |||||||||||
For the Year Ended December 31, | |||||||||||
2017 | 2016 | 2015 | |||||||||
(in thousands) | |||||||||||
United States | $ | 75,940 | $ | 67,128 | $ | 27,090 | |||||
Canada | 474 | (277 | ) | (1,018 | ) | ||||||
Income before provision for income taxes | $ | 76,414 | $ | 66,851 | $ | 26,072 | |||||
51
Table 14.3: Reconciliation of Tax Expense at Statutory Tax Rate to Actual Tax Expense | |||||||||||
For the Year Ended December 31, | |||||||||||
2017 | 2016 | 2015 | |||||||||
(in thousands) | |||||||||||
Tax expense at statutory rate | $ | 26,745 | $ | 23,398 | $ | 9,124 | |||||
Increase/(decrease) due to: | |||||||||||
U.S./Canadian tax rate differential | (94 | ) | 21 | (18 | ) | ||||||
U.S. state taxes net of federal benefit | 1,339 | 1,045 | 401 | ||||||||
Non-deductible (benefit)/expense | (104 | ) | 144 | 166 | |||||||
Domestic production activities deduction | (1,870 | ) | (1,719 | ) | (356 | ) | |||||
Tax credits | — | (12 | ) | (147 | ) | ||||||
Change in valuation allowance | (60 | ) | 27 | 272 | |||||||
Tax Cuts and Jobs Act of 2017 | (9,168 | ) | — | — | |||||||
Other | (222 | ) | (77 | ) | (106 | ) | |||||
Income tax expense | $ | 16,566 | $ | 22,827 | $ | 9,336 | |||||
Statutory tax rate | 35.00 | % | 35.00 | % | 35.00 | % | |||||
Effective tax rate | 21.68 | % | 34.15 | % | 35.81 | % | |||||
Table 14.4: Components of Deferred Tax Assets and Liabilities | |||||||
As of December 31, | |||||||
2017 | 2016 | ||||||
(in thousands) | |||||||
Deferred tax assets: | |||||||
Reserves and other liabilities | $ | 916 | $ | 3,220 | |||
Tax loss carryforwards | 313 | 661 | |||||
Acquisition costs and intangibles | 531 | 498 | |||||
Equity investment | 883 | 1,503 | |||||
Deferred compensation | 760 | 877 | |||||
Inventory | 536 | 1,432 | |||||
State depreciation | 201 | 95 | |||||
Other | 141 | 83 | |||||
Valuation allowance | (507 | ) | (693 | ) | |||
Total deferred tax assets | $ | 3,774 | $ | 7,676 | |||
Deferred tax liabilities: | |||||||
Prepaids | $ | 402 | $ | 543 | |||
Acquisition costs and intangibles | 2,214 | 1,074 | |||||
Depreciation, amortization and other | 15,909 | 24,012 | |||||
Unrealized gains on hedges | 355 | 788 | |||||
Total deferred tax liabilities | 18,880 | 26,417 | |||||
Net deferred tax liability | $ | 15,106 | $ | 18,741 | |||
On December 22, 2017, the Tax Cuts and Jobs Act of 2017 (the "Act") was signed into law making significant changes to the Internal Revenue Code. Changes include, but are not limited to, a corporate tax rate decrease from 35% to 21% effective for tax years beginning after December 31, 2017, the transition of U.S. international taxation from a worldwide tax system to a territorial system, and a one-time transition tax on earnings of certain foreign subsidiaries that were previously deferred and the creation of new taxes on certain foreign sourced earnings. Due to the timing of the enactment and the complexity involved in applying the provisions or the Act, the Company has calculated its best estimate of the impact of the Act in its year end income tax provision in accordance with its understanding of the Act and guidance available as of the date of this filing and as a result
52
has recorded $9.2 million reduction in income tax expense in the fourth quarter of 2017, the period in which the legislation was enacted. The provisional amount relates to the remeasurement of certain deferred tax assets and liabilities based on the rates at which they are expected to reverse in the future, which is approximately 22.7%. The provisional amount related to the one-time transition tax on the mandatory deemed repatriation of foreign earnings was zero, based on our estimate of foreign earnings. The ultimate impact may differ from these provisional amounts, possibly materially, due to, among other things, additional analysis, changes in interpretations and assumptions the Company has made, additionally regulatory guidance may be issued, and actions the Company may take as a result of the Act. The accounting is expected to be complete when the 2017 U.S. Federal and state corporate income tax returns are filed in late 2018.
The Company is subject to audit examinations at federal, state and local levels by tax authorities in those jurisdictions. In addition, the Canadian operations are subject to audit examinations at federal and provincial levels by tax authorities in those jurisdictions. The tax matters challenged by the tax authorities are typically complex; therefore, the ultimate outcome of any challenges would be subject to uncertainty. The Company has not identified any issues that did not meet the recognition threshold or would be impacted by the measurement provisions of the uncertain tax position guidance.
As of December 31, 2017 and 2016 the Company did not have any unrecognized tax benefits. The Company does not expect the amount of any unrecognized tax benefits to significantly increase in the next twelve months. The Company recognizes interest related to income tax matters as interest expense and penalties related to income tax matters as other non-interest expense. As of December 31, 2017 and 2016, the Company does not have any amounts accrued for interest or penalties.
15. EARNINGS PER SHARE
The following table shows the weighted average number of shares used in computing earnings per share and the effect on the weighted average number of shares of potentially dilutive securities. Potentially dilutive common stock has no effect on income available to common stockholders. For the years ended December 31, 2017, 2016 and 2015, awards that had an anti-dilutive impact on the Company's dilutive earnings per share computation excluded from the weighted average shares outstanding were nominal.
Table 15: Details of Basic and Dilutive Earnings Per Share | |||||||||||
For the Year Ended December 31, | |||||||||||
2017 | 2016 | 2015 | |||||||||
(dollars in thousands, except for per share amounts) | |||||||||||
Net income | $ | 59,848 | $ | 44,024 | $ | 16,736 | |||||
Weighted average number of shares outstanding - basic | 38,636,152 | 40,605,464 | 43,172,528 | ||||||||
Effect of dilutive securities: | |||||||||||
Restricted stock awards | 7,827 | 9,018 | 12,081 | ||||||||
Restricted stock units | 61,099 | 31,200 | 7,000 | ||||||||
Performance restricted stock units | 47,122 | 3,557 | 3,188 | ||||||||
Stock options | 22,763 | 13,065 | 23,527 | ||||||||
Total effect of dilutive securities | 138,811 | 56,840 | 45,796 | ||||||||
Weighted average number of shares outstanding - diluted | 38,774,963 | 40,662,304 | 43,218,324 | ||||||||
Basic earnings per share | $ | 1.55 | $ | 1.08 | $ | 0.39 | |||||
Diluted earnings per share | $ | 1.54 | $ | 1.08 | $ | 0.39 | |||||
16. COMMITMENTS AND CONTINGENCIES
Commitments
The Company leases certain buildings and equipment. The Company's facility and equipment leases may provide for escalations of rent or rent abatements and payment of pro rata portions of building operating expenses. Minimum lease payments are recognized on a straight-line basis over the minimum lease term. The total expenses under operating leases for the years ended December 31, 2017, 2016 and 2015 was $3.4 million, $4.1 million and $4.4 million, respectively. The Company also has non-capital purchase commitments that primarily relate to gas, gypsum, paper and other raw materials. The
53
total amounts purchased under such commitments were $82.4 million, $68.1 million and $66.7 million for the years ended December 31, 2017, 2016 and 2015 respectively.
Table 16: Details of Future Minimum Lease Payments Due Under Noncancellable Operating Leases and Purchase Commitments | |||||||
Future Minimum Lease Payments | Purchase Commitments | ||||||
(in thousands) | |||||||
2018 | $ | 790 | $ | 27,153 | |||
2019 | 1,658 | 26,407 | |||||
2020 | 48 | 17,853 | |||||
2021 | — | 5,237 | |||||
2022 | — | 5,394 | |||||
Thereafter | — | 58,862 | |||||
Total | $ | 2,496 | $ | 140,906 | |||
Contingent obligations
Under certain circumstances, the Company provides letters of credit related to its natural gas and other supply purchases. As of December 31, 2017 and December 31, 2016, the Company had outstanding letters of credit of approximately $1.6 million and $2.1 million, respectively.
Legal Matters
In the ordinary course of business, the Company executes contracts involving indemnifications standard in the industry. These indemnifications might include claims relating to any of the following: environmental and tax matters; intellectual property rights; governmental regulations and employment-related matters; customer, supplier, and other commercial contractual relationships; and financial matters. While the maximum amount to which the Company may be exposed under such agreements cannot be estimated, it is the opinion of management that these guarantees and indemnifications are not expected to have a material adverse effect on the Company's financial condition, results of operations or liquidity.
In the ordinary course of business, the Company is involved in certain legal actions and claims, including proceedings under laws and regulations relating to environmental and other matters. Because such matters are subject to many uncertainties and the outcomes are not predictable with assurance, the total liability for these legal actions and claims cannot be determined with certainty. When the Company determines that it is probable that a liability for environmental matters, legal actions or other contingencies has been incurred and the amount of the loss is reasonably estimable, an estimate of the costs to be incurred is recorded as a liability in the financial statements. As of December 31, 2017 and December 31, 2016, such liabilities were not expected to have a material adverse effect on the Company's financial condition, results of operations or liquidity. While management believes its accruals for such liabilities are adequate, the Company may incur costs in excess of the amounts provided. Although the ultimate amount of liability that may result from these matters or actions is not ascertainable, any amounts exceeding the recorded accruals are not expected to have a material adverse effect on the Company's financial condition, results of operations or liquidity.
17. RELATED PARTY TRANSACTIONS
LTIP Payments
In connection with the March, May and September 2015 secondary public offerings and concurrent May and September 2015 stock repurchases, certain officers of the Company and the estate of the Company's former CEO earned incentive payments in the aggregate amount of approximately $29.9 million under the LSF8 Gypsum Holdings, L.P. Long-Term Incentive Plan ("LTIP"). LSF8 was responsible for funding any payments under the LTIP, including those referenced above. As these payments arose out of employment with the Company, the Company recognized the payments made to the officers and the estate as an expense. The funding of the LTIP payments by LSF8 was recorded as additional paid-in capital. The $29.9 million in LTIP payments were recorded as an expense to the Company, that were tax deductible, and capital contributions by LSF8 in the first, second and third quarters of 2015. No further payments will be made under the LTIP.
54
18. SEGMENT REPORTING
Segment information is presented in accordance with ASC 280, Segment Reporting, which establishes standards for reporting information about operating segments. It also establishes standards for related disclosures about products and geographic areas. The Company's primary reportable segment is wallboard, which represented approximately 96.9%, 97.0% and 96.8% of the Company's revenues for the years ended December 31, 2017, 2016 and 2015, respectively. This segment produces wallboard for the commercial and residential construction sectors. The Company also manufactures finishing products, which complement the Company's full range of wallboard products.
Revenues from the major products sold to external customers include gypsum wallboard and finishing products.
The Company's two geographic areas consist of the United States and Canada for which it reports net sales, fixed assets and total assets.
The Company evaluates operating performance based on profit or loss from operations before certain adjustments as shown below. Revenues are attributed to geographic areas based on the location of the customer generating the revenue. The Company did not provide asset information by segment as its Chief Operating Decision Maker does not use such information for purposes of allocating resources and assessing segment performance.
Table 18.1: Segment Reporting | |||||||||||
For the Year Ended December 31, | |||||||||||
2017 | 2016 | 2015 | |||||||||
(in thousands) | |||||||||||
Net Sales: | |||||||||||
Wallboard | $ | 474,189 | $ | 447,679 | $ | 407,982 | |||||
Other | 14,974 | 13,696 | 13,700 | ||||||||
Total net sales | $ | 489,163 | $ | 461,375 | $ | 421,682 | |||||
Operating income: | |||||||||||
Wallboard | $ | 90,220 | $ | 87,094 | $ | 44,276 | |||||
Other | (635 | ) | 46 | (271 | ) | ||||||
Total operating income | $ | 89,585 | $ | 87,140 | $ | 44,005 | |||||
Adjustments: | |||||||||||
Interest expense | $ | (11,788 | ) | $ | (13,590 | ) | $ | (16,432 | ) | ||
Losses from equity investment | (187 | ) | (736 | ) | (750 | ) | |||||
Other expense, net | (1,196 | ) | (5,963 | ) | (751 | ) | |||||
Income before provision for income taxes | $ | 76,414 | $ | 66,851 | $ | 26,072 | |||||
Depreciation and Amortization: | |||||||||||
Wallboard | $ | 45,368 | $ | 45,561 | $ | 50,150 | |||||
Other | 1,092 | 1,085 | 1,158 | ||||||||
Total depreciation and amortization | $ | 46,460 | $ | 46,646 | $ | 51,308 | |||||
Table 18.2: Details of Net Sales By Geographic Region | |||||||||||
For the Year Ended December 31, | |||||||||||
2017 | 2016 | 2015 | |||||||||
(in thousands) | |||||||||||
United States | $ | 460,032 | $ | 425,611 | $ | 387,937 | |||||
Canada | 29,131 | 35,764 | 33,745 | ||||||||
Net sales | $ | 489,163 | $ | 461,375 | $ | 421,682 | |||||
55
Table 18.3: Details of Assets By Geographic Region | |||||||||||||||
Fixed Assets | Total Assets | ||||||||||||||
As of December 31, | As of December 31, | ||||||||||||||
2017 | 2016 | 2017 | 2016 | ||||||||||||
(in thousands) | |||||||||||||||
United States | $ | 290,324 | $ | 304,807 | $ | 622,836 | $ | 617,050 | |||||||
Canada | 3,679 | 3,031 | 19,098 | 17,699 | |||||||||||
Total | $ | 294,003 | $ | 307,838 | $ | 641,934 | $ | 634,749 | |||||||
19. FAIR VALUE DISCLOSURES
The Company estimates the fair value of its debt by discounting the future cash flows of each instrument using estimated market rates of debt instruments with similar maturities and credit profiles. These inputs are classified as Level 3 within the fair value hierarchy. As of December 31, 2017 and December 31, 2016, the carrying value reported in the consolidated balance sheet for the Company's notes payable approximated its fair value. The only assets or liabilities the Company had at December 31, 2017 that are recorded at fair value on a recurring basis are the natural gas hedges and interest rate swaps. Generally, the Company obtains its Level 2 pricing inputs from its counterparties. Substantially all of these assumptions are observable in the marketplace throughout the full term of the instrument, can be derived from observable data or are supported by observable levels at which transactions are executed in the marketplace.
Assets and liabilities that are measured at fair value on a non-recurring basis include intangible assets and goodwill. These items are recognized at fair value when they are considered to be impaired.
There were no fair value adjustments for assets and liabilities measured on a non-recurring basis. The Company discloses fair value information about financial instruments for which it is practicable to estimate that value.
Table 19.1: Fair Value Hierarchy - 2017 | |||||||||||||||
As of December 31, 2017 | |||||||||||||||
Level 1 | Level 2 | Level 3 | Balance | ||||||||||||
(in thousands) | |||||||||||||||
Asset | |||||||||||||||
Interest rate swap | $ | — | $ | 2,148 | $ | — | $ | 2,148 | |||||||
Commodity derivatives | — | 11 | — | 11 | |||||||||||
Total assets | $ | — | $ | 2,159 | $ | — | $ | 2,159 | |||||||
Liabilities | |||||||||||||||
Interest rate swap | $ | — | $ | — | $ | — | $ | — | |||||||
Commodity derivatives | — | 613 | — | 613 | |||||||||||
Total liabilities | $ | — | $ | 613 | $ | — | $ | 613 | |||||||
56
Table 19.2: Fair Value Hierarchy - 2016 | |||||||||||||||
As of December 31, 2016 | |||||||||||||||
Level 1 | Level 2 | Level 3 | Balance | ||||||||||||
(in thousands) | |||||||||||||||
Asset | |||||||||||||||
Interest rate swap | $ | — | $ | 1,800 | $ | — | $ | 1,800 | |||||||
Commodity derivatives | — | 351 | — | 351 | |||||||||||
Total assets | $ | — | $ | 2,151 | $ | — | $ | 2,151 | |||||||
Liabilities | |||||||||||||||
Interest rate swap | $ | — | $ | — | $ | — | $ | — | |||||||
Commodity derivatives | — | — | — | — | |||||||||||
Total liabilities | $ | — | $ | — | $ | — | $ | — | |||||||
20. QUARTERLY FINANCIAL INFORMATION (Unaudited)
Table 20.1: Quarterly Income Statement and Other Operating Data - 2017 | |||||||||||||||
2017 Quarter Ended | |||||||||||||||
December 31 | September 30 | June 30 | March 31 | ||||||||||||
(in thousands, except earnings per share and operating data) | |||||||||||||||
Net sales | $ | 131,392 | $ | 116,526 | $ | 120,630 | $ | 120,615 | |||||||
Costs, expenses and other income: | |||||||||||||||
Cost of goods sold | 94,432 | 87,952 | 89,817 | 89,624 | |||||||||||
Selling and administrative | 10,389 | 8,867 | 9,193 | 9,304 | |||||||||||
Total costs and operating expenses | $ | 104,821 | $ | 96,819 | $ | 99,010 | $ | 98,928 | |||||||
Operating income | 26,571 | 19,707 | 21,620 | 21,687 | |||||||||||
Other (expense)/income, net | (563 | ) | 146 | (135 | ) | (644 | ) | ||||||||
Interest expense, net | (2,822 | ) | (2,988 | ) | (3,062 | ) | (2,916 | ) | |||||||
Income before (losses)/income from equity method investment and benefit from/(provision for) income taxes | $ | 23,186 | $ | 16,865 | $ | 18,423 | $ | 18,127 | |||||||
(Losses)/income from equity method investment | (158 | ) | (204 | ) | 345 | (170 | ) | ||||||||
Income before benefit from/(provision for) for income taxes | 23,028 | 16,661 | 18,768 | 17,957 | |||||||||||
Benefit from/(provision for) income taxes | 1,208 | (5,674 | ) | (6,370 | ) | (5,730 | ) | ||||||||
Net income | $ | 24,236 | $ | 10,987 | $ | 12,398 | $ | 12,227 | |||||||
Net income per share (1): | |||||||||||||||
Basic | $ | 0.64 | $ | 0.29 | $ | 0.32 | $ | 0.31 | |||||||
Diluted | $ | 0.64 | $ | 0.29 | $ | 0.32 | $ | 0.31 | |||||||
Other operating data: | |||||||||||||||
Wallboard sales volume (mmsf) | 725 | 644 | 647 | 650 | |||||||||||
Mill net sales price | 144.78 | 144.90 | 150.32 | 147.92 | |||||||||||
Depreciation and amortization | 10,643 | 12,057 | 12,474 | 11,286 | |||||||||||
(1) | As a result of rounding and the required method of computing shares in interim periods, the total of the quarterly earnings per share amounts may not equal the earnings per share amount of the year. |
57
Table 20.2: Quarterly Income Statement and Other Operating Data - 2016 | |||||||||||||||
2016 Quarter Ended | |||||||||||||||
December 31 | September 30 | June 30 | March 31 | ||||||||||||
(in thousands, except earnings per share and operating data) | |||||||||||||||
Net sales | $ | 118,217 | $ | 114,558 | $ | 117,115 | $ | 111,485 | |||||||
Costs, expenses and other income: | |||||||||||||||
Cost of goods sold | 85,862 | 86,756 | 83,744 | 79,955 | |||||||||||
Selling and administrative | 9,554 | 9,241 | 10,163 | 8,960 | |||||||||||
Total costs and operating expenses | $ | 95,416 | $ | 95,997 | $ | 93,907 | $ | 88,915 | |||||||
Operating income | 22,801 | 18,561 | 23,208 | 22,570 | |||||||||||
Other (expense)/income, net | (223 | ) | (5,900 | ) | 6 | 154 | |||||||||
Interest expense, net | (3,098 | ) | (3,146 | ) | (3,648 | ) | (3,698 | ) | |||||||
Income before losses from equity method investment and provision for income tax | $ | 19,480 | $ | 9,515 | $ | 19,566 | $ | 19,026 | |||||||
Losses from equity method investment | (10 | ) | (291 | ) | (240 | ) | (195 | ) | |||||||
Income before provision for income taxes | $ | 19,470 | $ | 9,224 | $ | 19,326 | $ | 18,831 | |||||||
Provision for income taxes | (6,879 | ) | (3,014 | ) | (6,604 | ) | (6,330 | ) | |||||||
Net income | $ | 12,591 | $ | 6,210 | $ | 12,722 | $ | 12,501 | |||||||
Net income per share (1): | |||||||||||||||
Basic | $ | 0.32 | $ | 0.15 | $ | 0.31 | $ | 0.30 | |||||||
Diluted | $ | 0.31 | $ | 0.15 | $ | 0.31 | $ | 0.30 | |||||||
Other operating data: | |||||||||||||||
Wallboard sales volume (mmsf) | 666 | 634 | 643 | 617 | |||||||||||
Mill net sales price | 141.61 | 144.34 | 144.86 | 144.62 | |||||||||||
Depreciation and amortization | 10,990 | 11,868 | 11,842 | 11,946 | |||||||||||
(1) | As a result of rounding and the required method of computing shares in interim periods, the total of the quarterly earnings per share amounts may not equal the earnings per share amount of the year. |
21. SUBSEQUENT EVENTS
On February 22, 2018, the Company announced the Board of Directors had approved an expansion of its stock repurchase program by $100 million, increasing the aggregate authorization from up to $200 million to up to $300 million. The program was also extended from December 31, 2018 to December 31, 2019.
58
Item 9. Changes in and Disagreements with Accountants on Accounting and Financial Disclosure
None.
Item 9A. Controls and Procedures
Management's Evaluation of Disclosure Controls and Procedures. The Company maintains disclosure controls and procedures designed to ensure that information required to be disclosed by the Company in the reports that it files or submits under the Securities Exchange Act of 1934 (the "Exchange Act"), including this Annual Report on Form 10-K, is recorded, processed, summarized and reported, within the time periods specified in the SEC's rules and forms. These disclosure controls and procedures include, without limitation, controls and procedures designed to ensure that information required to be disclosed by the Company in the reports that it files or submits under the Exchange Act is accumulated and communicated to the Company's management, including its Chief Executive Officer and Chief Financial Officer, as appropriate to allow timely decisions regarding the required disclosure.
The Company carried out the evaluation of the effectiveness of its disclosure controls and procedures, required by paragraph (b) of Exchange Act Rules 13a-15 and 15d-15, under the supervision and with the participation of management, including the Chief Executive Officer and Chief Financial Officer. Based upon this evaluation, the Chief Executive Officer and Chief Financial Officer concluded that the Company's disclosure controls and procedures were effective as of December 31, 2017.
Management's Report on Internal Control Over Financial Reporting. See Item 8. "Financial Statements and Supplementary Data."
Attestation Report of Independent Registered Public Accounting Firm. See Item 8. "Financial Statements and Supplementary Data."
Changes in Internal Control Over Financial Reporting. There were no changes in the Company's internal control over financial reporting (as defined in Rule 13a-15(f) of the Exchange Act) that occurred during three months ended December 31, 2017 that have materially affected, or are reasonably likely to materially affect, the Company's internal control over financial reporting.
Limitations on Effectiveness of Controls. The Company's management, including the Chief Executive Officer and Chief Executive Officer, does not expect that the Company's disclosure controls and procedures or its system of internal control over financial reporting will prevent or detect all errors and all fraud. A control system, no matter how well designed or operated, can provide only reasonable, but not absolute, assurance that the objectives of the system of internal control are met. The design of the Company's control system reflects the fact that there are resource constraints, and that the benefits of such control system must be considered relative to their costs. Further, because of the inherent limitations in all control systems, no evaluation of controls can provide absolute assurance that all control failures and instances of fraud, if any, within the Company have been detected. These inherent limitations include the realities that judgments in decision-making can be faulty and that breakdowns can occur because of simple error or mistake. Additionally, controls can be circumvented by the intentional acts of individuals, by collusion of two or more people, or by management override of the controls. The design of any system of controls is also based in part on certain assumptions about the likelihood of future events, and there can be no assurance that the design of any particular control will always succeed in achieving its objective under all potential future conditions.
Item 9B. Other Information
None.
59
PART III
Item 10. Directors, Executive Officers and Corporate Governance
The information required by this Item is herein incorporated by reference to the Company's definitive proxy statement relating to the 2018 Annual Meeting of Stockholders, which will be filed with the Securities and Exchange Commission not later than 120 days after December 31, 2017.
Item 11. Executive Compensation
The information required by this Item is herein incorporated by reference to the Company's definitive proxy statement relating to the 2018 Annual Meeting of Stockholders, which will be filed with the Securities and Exchange Commission not later than 120 days after December 31, 2017.
Item 12. Security Ownership of Certain Beneficial Owners and Management and Related Stockholder Matters
Information with Respect to Securities Authorized for Issuance Under Equity Compensation Plans
The following table sets forth as of December 31, 2017, information with respect to (a) number of securities to be issued upon exercise of outstanding options, warrants and rights, (b) the weighted average exercise price of outstanding options, warrants and rights and (c) the number of securities remaining available for future issuance, in each case under the Company's 2014 Stock Incentive Plan and the Company's Employee Stock Purchase Plan, or the ESPP. The ESPP provides for the sale of up to a maximum of 600,000 shares of Company common stock to plan participants. Shares issued under the ESPP will reduce, on a share-for-share basis, the number of shares of Company common stock available for issuance pursuant to our 2014 Stock Incentive Plan.
(a) | (b) | (c) | |||||||
Number of Securities to be Issued Upon Exercise of Outstanding Options, Warrants and Rights | Weighted Average Exercise Price of Outstanding Options, Warrants and Rights | Number of Securities Remaining Available for Future Issuance under Equity Compensation Plans (Excluding Securities in Column (a)) | |||||||
Equity compensation plans approved by security holders | 55,112 | $ | 14.00 | 1,005,724 | |||||
Equity compensation plans not approved by security | — | — | — | ||||||
Total | 55,112 | $ | 14.00 | 1,005,724 | |||||
All other information required by this Item is herein incorporated by reference to the Company's definitive proxy statement relating to the 2018 Annual Meeting of Stockholders, which will be filed with the Securities and Exchange Commission not later than 120 days after December 31, 2017.
Item 13. Certain Relationships and Related Transactions, and Director Independence
The information required by this Item is herein incorporated by reference to the Company's definitive proxy statement relating to the 2018 Annual Meeting of Stockholders, which will be filed with the Securities and Exchange Commission not later than 120 days after December 31, 2017.
Item 14. Principal Accountant Fees and Services
The information required by this Item is herein incorporated by reference to the Company's definitive proxy statement relating to the 2018 Annual Meeting of Stockholders, which will be filed with the Securities and Exchange Commission not later than 120 days after December 31, 2017.
60
PART IV
Item 15. Exhibits and Financial Statements
The following documents are filed as part of this Annual Report on Form 10-K, or incorporated herein by reference:
1. | Financial Statements. The Company's financial statements are included Item 8. Financial Statements and Supplementary Data. |
2. | Financial Statement Schedules. All schedules are omitted since they are not applicable, not required, or the information required to be set forth herein is included in the Consolidated Financial Statements. |
3. | Exhibits. The exhibits listed in the Exhibit Index immediately below are filed as part of this Annual Report on Form 10‑K, or are incorporated by reference herein. |
Exhibit No. | Description of Exhibit | ||
(b) | |||
(b) | |||
(b) | |||
(c) | |||
(b) | |||
(b) | |||
(c) | |||
(b) | |||
(h) | |||
(h) | |||
(b) | |||
(b) | |||
(b) | |||
(i) | |||
(a) | |||
(a) | |||
# | Denotes management compensatory plan or arrangement. | |
* | Filed herewith. | |
^ | Certain portions of this exhibit have been redacted and separately filed with the Securities and Exchange Commission pursuant to a request for confidential treatment. | |
+ | Certain schedules to this agreement have been omitted in accordance with Item 601(b)(2) of Regulation S-K. A copy of any omitted schedules will be furnished supplementally to the SEC upon request. | |
61
Exhibit No. | Description of Exhibit | ||
(a) | |||
(b) | |||
(b) | |||
(b) | |||
(b) | |||
(b) | |||
(b) | |||
(b) | |||
(d) | |||
(d) | |||
(d) | |||
(d) | |||
(d) | |||
(e) | |||
(i) | |||
(f) | |||
(g) | |||
(h) | |||
# | Denotes management compensatory plan or arrangement. | |
* | Filed herewith. | |
^ | Certain portions of this exhibit have been redacted and separately filed with the Securities and Exchange Commission pursuant to a request for confidential treatment. | |
+ | Certain schedules to this agreement have been omitted in accordance with Item 601(b)(2) of Regulation S-K. A copy of any omitted schedules will be furnished supplementally to the SEC upon request. | |
62
Exhibit No. | Description of Exhibit | ||
(j) | |||
(i) | |||
(i) | |||
* | |||
* | |||
* | |||
* | |||
* | |||
101.INS | XBRL Instance Document. | * | |
101.SCH | XBRL Taxonomy Extension Schema Document. | * | |
101.CAL | XBRL Taxonomy Calculation Linkbase Document. | * | |
101.DEF | XBRL Taxonomy Definition Linkbase Document. | * | |
101.LAB | XBRL Taxonomy Label Linkbase Document. | * | |
101.PRE | XBRL Taxonomy Presentation Linkbase Document. | * | |
# | Denotes management compensatory plan or arrangement. | |
* | Filed herewith. | |
^ | Certain portions of this exhibit have been redacted and separately filed with the Securities and Exchange Commission pursuant to a request for confidential treatment. | |
+ | Certain schedules to this agreement have been omitted in accordance with Item 601(b)(2) of Regulation S-K. A copy of any omitted schedules will be furnished supplementally to the SEC upon request. | |
(a) | Previously filed on December 24, 2013 as an exhibit to the Company's Registration Statement on Form S-1 (File No. 333-193078) and incorporated herein by reference. |
(b) | Previously filed on January 10, 2014 as an exhibit to Amendment No. 1 to the Company's Registration Statement on Form S-1 (File No. 333-193078) and incorporated herein by reference. |
(c) | Previously filed on January 31, 2014 as an exhibit to Amendment No. 3 to the Company's Registration Statement on Form S-1 (File No. 333-193078) and incorporated herein by reference. |
(d) | Previously filed on May 6, 2015 as an exhibit to the Company's Quarterly Report on Form 10-Q and incorporated herein by reference. |
(e) | Previously filed on August 6, 2015 as an exhibit to the Company's Quarterly Report on Form 10-Q and incorporated herein by reference. |
(f) | Previously filed on May 10, 2016 as an exhibit to the Company's Quarterly Report on Form 10-Q and incorporated herein by reference. |
(g) | Previously filed on August 22, 2016 as an exhibit to the Company's Current Report on Form 8-K and incorporated herein by reference. |
(h) | Previously filed on May 5, 2017 as an exhibit to the Company's Quarterly Report on Form 10-Q and incorporated herein by reference. |
(i) | Previously filed on August 4, 2017 as an exhibit to the Company's Quarterly Report on Form 10-Q and incorporated herein by reference. |
63
Item 16. Form 10-K Summary
Not applicable.
64
SIGNATURES
Pursuant to the requirements of Section 13 or 15(d) of the Securities Exchange Act of 1934, the Registrant has duly caused this report to be signed on its behalf by the undersigned, thereunto duly authorized.
CONTINENTAL BUILDING PRODUCTS, INC. | |||
/s/ James Bachmann | February 23, 2018 | ||
By: | James Bachmann | ||
President and Chief Executive Officer | |||
(Principal Executive Officer) | |||
Pursuant to the requirements of the Securities Exchange Act of 1934, this report has been signed below by the following persons on behalf of the Registrant and in the capacities and on the dates indicated.
Name | Title | Date | ||
/s/ James Bachmann | President and Chief Executive Officer (Principal Executive Officer) and Director | February 23, 2018 | ||
James Bachmann | ||||
/s/ Dennis Schemm | Senior Vice President and Chief Financial Officer (Principal Financial Officer) | February 23, 2018 | ||
Dennis Schemm | ||||
/s/ Dennis Romps | Senior Vice President, Corporate Controller and Chief Accounting Officer (Principal Accounting Officer) | February 23, 2018 | ||
Dennis Romps | ||||
/s/ Edward Bosowski | Chairman of the Board, Director | February 23, 2018 | ||
Edward Bosowski | ||||
/s/ Michael O. Moore | Director | February 23, 2018 | ||
Michael O. Moore | ||||
/s/ Jack Sweeny | Director | February 23, 2018 | ||
Jack Sweeny | ||||
/s/ Chantal Veevaete | Director | February 23, 2018 | ||
Chantal Veevaete | ||||
/s/ Michael Keough | Director | February 23, 2018 | ||
Michael Keough | ||||
/s/ Ira Saul Strassberg | Director | February 23, 2018 | ||
Ira Saul Strassberg | ||||
65