Attached files
| file | filename |
|---|---|
| EX-32.2 - EX-32.2 - Sprouts Farmers Market, Inc. | sfm-ex322_10.htm |
| EX-32.1 - EX-32.1 - Sprouts Farmers Market, Inc. | sfm-ex321_8.htm |
| EX-31.2 - EX-31.2 - Sprouts Farmers Market, Inc. | sfm-ex312_7.htm |
| EX-31.1 - EX-31.1 - Sprouts Farmers Market, Inc. | sfm-ex311_6.htm |
| EX-23.1 - EX-23.1 - Sprouts Farmers Market, Inc. | sfm-ex231_9.htm |
| EX-21.1 - EX-21.1 - Sprouts Farmers Market, Inc. | sfm-ex211_11.htm |
UNITED STATES
SECURITIES AND EXCHANGE COMMISSION
Washington, D.C. 20549
FORM 10-K
|
☒ |
ANNUAL REPORT PURSUANT TO SECTION 13 OR 15(d) OF THE SECURITIES EXCHANGE ACT OF 1934 |
For the fiscal year ended December 31, 2017
Commission File Number: 001-36029

Sprouts Farmers Market, Inc.
(Exact name of registrant as specified in its charter)
|
Delaware |
32-0331600 |
|
(State or other jurisdiction of incorporation or organization) |
(I.R.S. Employer Identification No.) |
5455 East High Street, Suite 111
Phoenix, Arizona 85054
(Address of principal executive offices and zip code)
(480) 814-8016
(Registrant’s telephone number, including area code)
Securities registered pursuant to Section 12(b) of the Act:
|
Title of Each Class
|
Name of Each Exchange on Which Registered
|
|
Common Stock, $0.001 par value |
NASDAQ Global Select Market |
Securities registered pursuant to Section 12(g) of the Act:
None
Indicate by check mark if the registrant is a well-known seasoned issuer, as defined in Rule 405 of the Securities Act. Yes ☒ No ☐
Indicate by check mark if the registrant is not required to file reports pursuant to Section 13 or Section 15(d) of the Act. Yes ☐ No ☒
Indicate by check mark whether the registrant (1) has filed all reports required to be filed by Section 13 or 15(d) of the Securities Exchange Act of 1934 during the preceding 12 months (or for such shorter period that the registrant was required to file such reports), and (2) has been subject to such filing requirements for the past 90 days. Yes ☒ No ☐
Indicate by check mark whether the registrant has submitted electronically and posted on its corporate Web site, if any, every Interactive Data File required to be submitted and posted pursuant to Rule 405 of Regulation S-T (§ 232.405 of this chapter) during the preceding 12 months (or for such shorter period that the registrant was required to submit and post such files). Yes ☒ No ☐
Indicate by check mark if disclosure of delinquent filers pursuant to Item 405 of Regulation S-K (§229.405 of this chapter) is not contained herein, and will not be contained, to the best of registrant’s knowledge, in definitive proxy or information statements incorporated by reference in Part III of this Form 10-K or any amendment to this Form 10-K. ☒
Indicate by check mark whether the registrant is a large accelerated filer, an accelerated filer, a non-accelerated filer, or a smaller reporting company. See the definitions of “large accelerated filer,” “accelerated filer” and “smaller reporting company” in Rule 12b-2 of the Exchange Act.
|
Large accelerated filer |
☒ |
Accelerated filer |
☐ |
|
|
|
|
|
|
Non-accelerated filer |
☐ (Do not check if a smaller reporting company) |
Smaller reporting company |
☐ |
|
Emerging growth company |
☐ |
|
|
If an emerging growth company, indicate by check mark if the registrant has elected not to use the extended transition period for complying with any new or revised financial accounting standards provided pursuant to Section 13(a) of the Exchange Act. ☐
Indicate by check mark whether the registrant is a shell company (as defined in Rule 12b-2 of the Exchange Act). Yes ☐ No ☒
As of June 30, 2017, the last business day of the registrant’s most recently completed second fiscal quarter, the aggregate market value of the registrant’s voting common stock held by non-affiliates of the registrant was $3,088,626,747, based on the last reported sale price of such stock as reported on The NASDAQ Global Select Market on such date.
As of February 20, 2018, there were outstanding 133,311,311 shares of the registrant’s common stock, $0.001 par value per share.
DOCUMENTS INCORPORATED BY REFERENCE
Portions of the registrant’s definitive Proxy Statement for its 2018 Annual Meeting of Stockholders are incorporated by reference in Part III of this Annual Report on Form 10-K where indicated. Such Proxy Statement will be filed with the Securities and Exchange Commission within 120 days of the registrant’s fiscal year ended December 31, 2017.
|
|
|
Page |
|
Item 1. |
1 |
|
|
Item 1A. |
12 |
|
|
Item 1B. |
29 |
|
|
Item 2. |
29 |
|
|
Item 3. |
30 |
|
|
Item 4. |
31 |
|
|
|
||
|
Item 5. |
32 |
|
|
Item 6. |
36 |
|
|
Item 7. |
Management’s Discussion and Analysis of Financial Condition and Results of Operations |
38 |
|
Item 7A. |
57 |
|
|
Item 8. |
58 |
|
|
Item 9. |
Changes in and Disagreements with Accountants on Accounting and Financial Disclosure |
99 |
|
Item 9A. |
99 |
|
|
Item 9B. |
99 |
|
|
|
||
|
Item 10. |
100 |
|
|
Item 11. |
100 |
|
|
Item 12. |
Security Ownership of Certain Beneficial Owners and Management and Related Stockholder Matters |
100 |
|
Item 13. |
Certain Relationships and Related Transactions, and Director Independence |
100 |
|
Item 14. |
100 |
|
|
|
||
|
Item 15. |
100 |
|
|
Item 16. |
103 |
|
|
104 |
||
As used in this Annual Report on Form 10-K, unless the context otherwise requires, references to the “Company,” “Sprouts,” “we,” “us” and “our” refer to Sprouts Farmers Market, Inc. and, where appropriate, its subsidiaries.
SPECIAL NOTE REGARDING FORWARD-LOOKING STATEMENTS
This Annual Report on Form 10-K contains “forward-looking statements” that involve substantial risks and uncertainties. The statements contained in this Annual Report on Form 10-K that are not purely historical are forward-looking statements within the meaning of Section 27A of the Securities Act of 1933, as amended (referred to as the “Securities Act”), and Section 21E of the Securities Exchange Act of 1934, as amended (referred to as the “Exchange Act”), including, but not limited to, statements regarding our expectations, beliefs, intentions, strategies, future operations, future financial position, future revenue, projected expenses, and plans and objectives of management. In some cases, you can identify forward-looking statements by terms such as “anticipate,” “believe,” “estimate,” “expect,” “intend,” “may,” “might,” “plan,” “project,” “will,” “would,” “should,” “could,” “can,” “predict,” “potential,” “continue,” “objective,” or the negative of these terms, and similar expressions intended to identify forward-looking statements. However, not all forward-looking statements contain these identifying words. These forward-looking statements reflect our current views about future events and involve known risks, uncertainties, and other factors that may cause our actual results, levels of activity, performance, or achievement to be materially different from those expressed or implied by the forward-looking statements. Factors that could cause or contribute to such differences include, but are not limited to, those discussed in the section titled “Risk Factors” included in this Annual Report on Form 10-K. Furthermore, such forward-looking statements speak only as of the date of this report. Except as required by law, we undertake no obligation to update any forward-looking statements to reflect events or circumstances after the date of such statements.
Sprouts Farmers Market operates as a healthy grocery store that specializes in fresh, natural and organic products at prices that appeal to everyday grocery shoppers. Based on the belief that healthy food should be affordable, Sprouts’ welcoming environment and knowledgeable team members continue to drive its growth. Sprouts offers a complete shopping experience that includes an array of fresh produce in the heart of the store, a deli with prepared entrees and side dishes, The Butcher Shop, The Fish Market, an expansive vitamins and supplements department and more. Since our founding in 2002, we have grown rapidly, significantly increasing our sales, store count and profitability. With 285 stores in 15 states as of December 31, 2017, we are one of the largest healthy grocery stores selling fresh, natural and organic food in the United States. As of February 20, 2018, we have grown to 289 stores in 15 states.
At Sprouts, we believe healthy living is a journey and every meal is a choice. The cornerstones of our business are fresh, natural and organic products at compelling prices (which we refer to as “Healthy Living for Less”), an attractive, convenient and differentiated shopping experience featuring a broad selection of innovative healthy products, and knowledgeable team members who we believe provide best-in-class customer engagement and product education.
Our Heritage
In 2002, we opened the first Sprouts Farmers Market store in Chandler, Arizona. From our founding in 2002 through December 31, 2017, we continued to open new stores while successfully rebranding 43 Henry’s Farmers Market and 39 Sunflower Farmers Market stores added in 2011 and 2012, respectively, through acquisitions to the Sprouts banner. These three businesses all trace their lineage back to Henry’s Farmers Market and were built with similar store formats and operations including a strong emphasis on value, produce and service in smaller, convenient locations. The consistency of these formats and operations was an important factor that allowed us to rapidly and successfully rebrand and integrate each of these businesses under the Sprouts banner and on a common platform.
1
We believe our stores represent a blend of conventional supermarkets, farmers markets, natural foods stores, and smaller specialty markets, differentiating us from other food retailers, while also providing a complete offering for our customers.
|
|
• |
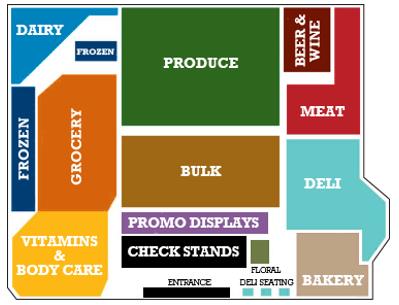
Store Design. Our stores are organized in a “flipped” conventional food retail store model, positioning our produce at the center of the store surrounded by a complete grocery offering. We typically dedicate approximately 15% of a store’s selling square footage to produce, which we believe is significantly higher than many of our peers. The stores are designed with open floor plans and low displays, intended to provide an easy-to-shop environment that allows our customers to view the entire store, and our small box format allows for quick in-and-out service. The below diagram shows a sample layout of our stores: |
|
|
• |
Customer Engagement. We are committed to providing, and believe we have, best-in-class customer engagement, which builds trust with our customers and differentiates the Sprouts shopping experience from that of many of our competitors. We design our stores to maximize customers’ interactions with our team members, as we believe this interaction provides an opportunity to educate customers and provides a valued, differentiated customer service model, which enhances customer loyalty and increases visits and purchases over time. In addition, we continue to explore mobile and digital opportunities to further engage with our customers. |
|
|
• |
Store Size. Our stores are generally between 28,000 and 30,000 square feet, which we believe is smaller than many of our peers’ average stores. Our stores are located in a variety of mid-sized and larger shopping centers, lifestyle centers and in certain cases, independent single-unit, stand-alone developments. The size of our stores and our real estate strategy provide us flexibility in site selection, including entering into new developments or existing sites formerly operated by other retailers, including other grocery banners, office supply stores, electronics retailers and other second generation space. Further, we believe our value positioning allows us to serve a diverse customer base and provides us significant flexibility to enter new markets across a variety of socio-economic areas, including markets with varying levels of fresh, natural and organic grocer penetration. |
2
Our Product Offering
We are a complete food retailer that offer a full shopping experience for our customers. We focus and tailor our assortment to fresh, natural and organic foods and healthier options throughout all of our departments.
Fresh, Natural and Organic Foods
Our product offerings focus on fresh, natural and organic foods. Foods are generally considered “fresh” if they are minimally processed or in its raw state not subject to any type of preservation or freezing. Natural foods can be broadly defined as foods that are minimally processed and are free of synthetic preservatives, artificial sweeteners, colors, flavors and other additives, growth hormones, antibiotics, hydrogenated oils, stabilizers and emulsifiers. Essentially, natural foods are largely or completely free of non-naturally occurring chemicals and are as near to their whole, natural state as possible.
Organic foods refer to the food itself as well as the method by which it is produced. In general, organic operations must demonstrate that they are protecting natural resources, conserving biodiversity, and using only approved substances and must be certified by a USDA-accredited certifying agency. Further, retailers that handle, store or sell organic products must implement measures to protect their organic character.
Products
We categorize the varieties of products we sell as perishable and non-perishable. Perishable product categories include produce, meat, seafood, deli and bakery. Non-perishable product categories include grocery, vitamins and supplements, bulk items, dairy and dairy alternatives, frozen foods, beer and wine, and natural health and body care. The following is a breakdown of our perishable and non-perishable sales mix:
|
|
|
2017 |
|
|
2016 |
|
|
2015 |
|
|||
|
Perishables |
|
|
50.0 |
% |
|
|
50.4 |
% |
|
|
50.8 |
% |
|
Non-Perishables |
|
|
50.0 |
% |
|
|
49.6 |
% |
|
|
49.2 |
% |
Departments
While we focus on providing an abundant and affordable offering of natural and organic produce, our stores also include the following departments that enable customers to have a full grocery shopping experience: packaged groceries, meat and seafood, deli, vitamins and supplements, dairy and dairy alternatives, bulk items, baked goods, frozen foods, natural health and body care, and beer and wine. We believe each of our departments provides high-quality, value-oriented offerings for our customers which we continuously refine with our customer preferences in mind, including our ongoing fresh food and deli expansion initiatives in select stores, comprised of freshly prepared proteins and sides, full service deli case, salad bar, fresh juices and soup station to provide more convenient prepared food options for our customers.
3
We have been expanding the breadth of our Sprouts branded products over the last several years and have a dedicated product development team focused on continuing this growth. These products feature competitively priced specialty and innovative products, with great taste profiles and quality and strict ingredient standards that we believe equal or exceed national brands. Our private label program now accounts approximately 12% of our revenue and features approximately 2,400 products. Our private label brands drive value by offering our customers lower prices while still delivering generally higher margin as compared to branded products. We believe our private label products build and enhance the Sprouts brand and allow us to distinguish ourselves from our competitors, promoting customer loyalty and creating a destination shopping experience.
Sourcing and Distribution
We manage the buying of, and set the standards for, the products we sell, and we source our products from over 850 vendors and suppliers, both domestically and internationally. We work closely with our supply chain partners to improve animal welfare standards, sustainable seafood sourcing, support for organic agriculture and the ethical treatment of people.
We believe, based on our industry experience, that our strong relationships in the produce business provide us a competitive advantage and enable us to offer high-quality produce at prices we believe are significantly below those of conventional food retailers and even further below high-end natural and organic food retailers. Given the importance of produce to our stores, we source, warehouse and distribute nearly all produce in-house. This ensures our produce meets our high quality standards. We are supported by dedicated regional procurement teams that provide us flexibility to procure produce on local, regional and national levels.
We have department and product specifications that ensure a consistently high level of quality across product ingredients, production standards and other key measures of freshness, natural and organic standards. These specifications are measured at both entry and exit points to our facilities. We distribute all produce to our stores from two leased distribution facilities and three third-party operated distribution facilities, and we manage every aspect of quality control in this department. We believe we currently have sufficient capacity at these facilities to support our near-term growth plans in our current markets, but we continue to explore expansion opportunities as our needs evolve.
We believe our scale, together with this decentralized purchasing structure and flexibility generates cost savings, which we then pass on to our customers. Distributors and farmers recognize the volume of goods we sell through our stores and our flexible purchasing and distribution model allows us to opportunistically acquire produce at great value which we will also pass along to our customers.
For all non-produce products, we use third-party distributors and vendors to distribute products directly to our stores following specifications and quality control standards that are set by us.
KeHE Distributors, LLC (referred to as “KeHE”), is our primary supplier of dry grocery and frozen food products, accounting for approximately 34%, 33% and 31% of our total purchases in fiscal 2017, 2016 and 2015, respectively. Another 4% of our total purchases in each of fiscal 2017, 2016 and 2015, respectively, were made through our secondary supplier, United Natural Foods, Inc. (referred to as “UNFI”). See “Risk Factors—Disruption of significant supplier relationships could negatively affect our business.”
4
Our Pricing, Marketing and Advertising
Pricing
We are committed to a pricing strategy consistent with our motto of “Healthy Living for Less.” As a farmers market style store, we emphasize low prices throughout the entire store, as we are able to pass along the benefits of our scale and purchasing power to our customers. We position our prices with everyday value for our customers with regular promotions on selected products that drive traffic and trial. We typically have about 30% of our approximately 19,700 products on sale at any given time.
Marketing and Advertising
We supplement and support our everyday competitive pricing strategy through weekly advertised specials, a weekly e-circular, online coupons and special promotions. We send over 17 million weekly advertisement circulars to encourage customers to shop at our stores. These circulars focus on product education and offerings and aim to engage the customer. We use sales flyers distributed through direct delivery or inserted into local newspapers as our primary medium for advertising. These sales flyers include representative products from our key departments. In addition, we have a customer database of over two million customers as of December 31, 2017, many of whom receive electronic versions of our weekly circulars or monthly newsletters.
We tailor our advertisements to specific markets, which provides us with greater flexibility to offer different promotions and respond to local competitive activity. In addition, we advertise our sales promotions and support our brand image through the use of local radio, television and billboards, as well as targeted direct mail in specific markets.
We also continue to promote and enhance our digital presence. We developed and maintain a smartphone app on which we include mobile coupons, customized offers based on the user’s preferences and in-store scan features, and our website, www.sprouts.com, on which we display our weekly sales flyers and offer special deals. Our website also features on-line ordering for gift cards, holiday meals and catering trays. The inclusion of our website address in this Annual Report on Form 10-K does not include or incorporate by reference the information on or accessible through our website herein. We continue to expand our social media platform. As of December 31, 2017, we had approximately 1.6 million social media followers, primarily on Facebook and Instagram. In addition, we offer home deliveries from our stores through partner services in many of our markets, and we intend to expand our home delivery to our major markets nationwide. We will continue to explore mobile and digital opportunities to further connect with our customers.
In addition to the weekly circulars, we offer numerous other saving opportunities for our customers, all of which are meant to reinforce our value offering and are designed to appeal to specific target customers. In 2017, we had more than 30 department-wide promotions at each store throughout the year, which included our Vitamin Extravaganza, Frozen Frenzy, Gluten-Free Favorites, and Incredible Bulk Sales, in addition to our 72-Hour Sales.
Our Customers
Our target customer seeks a wide assortment of high-quality fresh and nutritious food as well as vitamins and supplements at competitive prices. We believe our value proposition and complete grocery offering engages both conventional and health-focused shoppers.
We have a broad range of customers from those looking for value, to customers seeking specific attribute products, to those seeking to eat healthier. We believe the majority of our customers are initially attracted to our stores by our fresh produce, which we offer at prices we believe are significantly below those of conventional food retailers and even further below high-end natural and organic food retailers. We drive customer traffic by aggressively promoting produce and other items through weekly
5
advertisements designed primarily to reach the everyday supermarket shopper. Through department-specific promotions, in-store signage, and customer education, many customers begin to shop new departments and try new products. Over time, through customer service and engagement, targeted marketing, and increased knowledge of our product offering, we believe that customers will shop with greater frequency throughout the entire store.
Sustainability and Social Responsibility
Central to our identity is a genuine commitment to sustainability and social responsibility. We care deeply about the health and well-being of our customers, team members, communities and our world. We are committed to operating our business in a way that respects social and environmental welfare.
Hunger Relief and Waste Management
In the United States, approximately 40% of all food grown goes uneaten and ends up in landfills, while one in seven Americans is food insecure at some point throughout a given year. We are committed to eliminating food waste and fighting hunger in the communities we serve. We’ve taken great strides to ensure that each of our stores and distribution centers has a food recovery program in place. In 2017, Sprouts rescued and repurposed nearly 50 million pounds of food.
Every day, Sprouts team members gather product that may no longer be in retail condition, but remains wholesome to consume, through our Food Rescue Program. In 2017, Sprouts stores and distribution centers donated the equivalent of 19 million meals to hunger relief agencies. Our annual Grab’N’Give campaign funded by contributions from our customers generated over 325,000 personal care and emergency food bags for those in need. Sprouts was proud to once again be named a Leadership Partner by Feeding America in 2017 for our commitment to help those facing hunger in our communities.
Food that did not meet our Food Rescue Program donation guidelines was sent to local farms through our Food Waste to Farms Program. In 2017, our stores diverted more than 30 million pounds of food waste to these farms to provide a low-cost feed source for local farmers. As part of our further effort to combat waste, during 2017 we recycled more than 80 million pounds of cardboard. These waste reduction initiatives reduce our environmental footprint and waste management expenditures and take Sprouts closer to our commitment to “zero waste”.
Refrigeration and Energy Management
Sprouts has a robust refrigeration and energy management plan in place to reduce fugitive refrigeration emissions and reduce energy consumption in our stores. In 2017, we conducted our first annual greenhouse gas emissions inventory and identified areas of opportunity within our operations and supply chain. In 2017, the Environmental Protection Agency (referred to as the “EPA”) recognized 76 Sprouts stores with “GreenChill” certifications; the GreenChill program is a partnership between the EPA and food retailers to reduce refrigerant emissions and decrease their impact on the ozone layer and climate change.
To further reduce energy consumption in our stores, Sprouts implemented a program engaging our approximately 27,000 team members to “Save Green”. The Save Green program is a team member engagement tool aimed at reducing energy consumption and costs through best practices. Sprouts also embeds green building practices into our new stores and remodels that lead to long-term reduced energy consumption and cost. Some examples include daylight harvesting, LED lighting and energy management systems to control refrigeration and HVAC.
6
The Sprouts Healthy Communities Foundation
In 2015, we formed the Sprouts Healthy Communities Foundation (referred to as our “Foundation”), a registered 501(c)(3) organization focused on giving locally in the areas of health education and access to nutrition and healthy food. Our Foundation relies on donations from Sprouts, as well as our vendors and customers, to support non-profit organizations that are stewards of health and wellness in the communities where our team members and customers live, work and play.
Our Foundation has multi-year partnerships with six organizations that are committed to making a meaningful difference in the lives of children, individuals and families.
|
|
• |
REAL School Gardens builds learning gardens in low-income elementary schools that enhance student learning and provide health nutrition education. |
|
|
• |
Vitamin Angels provides access to life saving vitamins and minerals for at-risk populations in need, particularly pregnant women, new mothers and children. |
|
|
• |
Denver Urban Gardens funds community gardens and school-based nutrition education in neighborhoods with limited resources. |
|
|
• |
Soil Born Farms Urban Agriculture & Education provides school-based gardening, teacher training and nutrition education for low-income schools in Sacramento County. |
|
|
• |
Spaces of Opportunity South Phoenix Urban Farm is an 18-acre community garden that will broaden access to healthy, nutritious foods in the heart of South Phoenix. |
|
|
• |
Autism Speaks provides resources for adults and children affected by autism. |
Collectively, our Foundation donated over $1.7 million to these organizations in 2017.
In 2017, our Foundation began the Neighborhood Grants program to distribute donations received from Sprouts and our customers entirely in the communities in which the donations were collected. With grants ranging from $2,500 to $10,000, our Foundation contributed $430,000 to 58 local non-profit organizations aligned with its goal to create stronger and healthier communities. Our Foundation and stores also contributed financial and in-kind donations to those impacted by natural disasters during 2017 in Florida, Texas and California. Our stores and engaged team members also contribute to healthy environments through in-kind support and volunteerism at community events.
Growing Our Business
We believe we are well-positioned to capitalize on two powerful, long-term consumer trends—a growing interest in health and wellness and a focus on value and are pursuing a number of strategies designed to continue our growth and strong financial performance, including:
Expand our store base. We intend to continue expanding our store base by pursuing new store openings in existing markets, expanding into adjacent markets and penetrating new markets. We have opened 32, 36 and 27 new stores in fiscal 2017, 2016 and 2015, respectively. We expect to continue to expand our store base with 30 store openings planned in fiscal 2018, including our initial expansion into Maryland, Pennsylvania, South Carolina, and Washington, we have opened four stores in 2018 as of February 20. We intend to open approximately 30 new stores annually over the near term, with approximately 60-65% in existing markets.
7
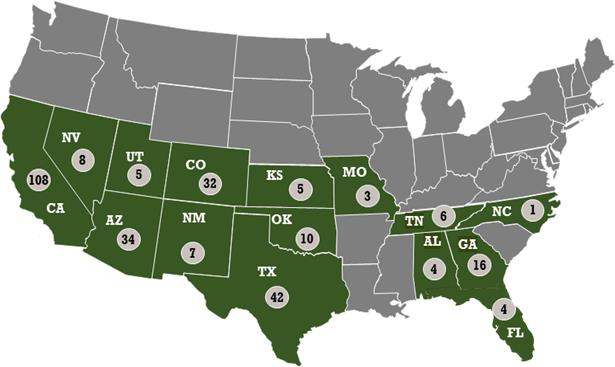
The below diagram shows our store footprint, by state, as of December 31, 2017.
Continue positive comparable store sales. For 43 consecutive quarters, including throughout the economic downturn from 2008 to 2010, stores under our management have achieved positive comparable store sales growth. We believe the consistency of our performance over time and across geographies and vintages is the result of a number of factors, including our distinctive value positioning and merchandising strategies, product innovation and a well-trained staff focused on customer education and engagement. We believe we can continue to grow the number and size of customer transactions by enhancing our core value proposition and distinctive customer-oriented shopping experience. We aim to grow our average ticket by continuing to expand and refine our fresh, natural and organic product offering, our private label program, our targeted and personalized marketing efforts and our in-store and digital education. We believe these factors, combined with the continued strong growth in fresh, natural and organic food consumption, will allow Sprouts to gain new customers, increase customer loyalty and, over time, convert single-department customers into core customers who shop Sprouts with greater frequency and across an increasing number of departments.
Grow the Sprouts Farmers Market brand. We are committed to supporting our stores, product offerings and brand through a variety of marketing programs, expanded private label offerings and corporate partnerships. In addition, we will continue our community outreach and charity programs to more broadly connect with our local communities with the aim of promoting our brand and educating consumers on healthy choices. We will also continue to expand our innovative marketing and promotional strategy through print, digital and social media platforms.
Train Future Leaders. We believe Sprouts is an attractive place to work with significant growth opportunities for our approximately 27,000 team members. In 2017, we promoted more than 5,600 team members. We regularly assess prevailing wages in the markets in which we operate and offer competitive wages and benefits as we believe active, educated and passionate team members contribute to consumer satisfaction. Customer engagement is critical to our culture and growth plans, and we place great importance on recruiting candidates that share our passion for Healthy Living for Less and training our team members on customer engagement and product knowledge to ensure there is friendly,
8
knowledgeable staff in every department in every store. Our team members are trained and empowered to proactively engage with customers throughout the entire store. This includes investing time to educate them on the benefits of different vitamins, sharing ways to prepare a meal or cutting a piece of produce or opening a package to offer customers product tastings throughout the store. We consider customer education and engagement to be particularly important as many conventional supermarket customers that have not shopped our stores believe that eating healthy is expensive and difficult.
New Store Development
We have an extensive and selective process for new store site selection, which includes in-depth analysis of area demographics, competition, growth potential, traffic patterns, grocery spend and other key criteria. We have a dedicated real estate team as well as a real estate committee that includes certain of our executive officers. Multiple members of this committee will conduct an on-site inspection prior to approving any new location.
We believe that our store model, combined with our rigorous store selection process and a growing interest in health and wellness, contribute to our attractive new store returns on investment and strong cash flows. We have been successful across varying geographies which we believe supports the portability of the Sprouts brand and store model into a wide range of markets. Based on our experience, we believe that our broad product offering and value proposition appeals to a wider demographic than other leading competitors, including higher-priced health food and gourmet food retailers. Sprouts has been successful across a variety of urban, suburban and rural locations in diverse geographies, from coast to coast, underscoring the heightened interest in eating healthy across markets.
We currently anticipate opening approximately 30 new Sprouts Farmers Market stores per year going forward based on our new store site selection analysis. We expect to open approximately 60-65% of our new stores in existing markets and approximately one-third in new markets, as we believe this provides for a good balance, given that our new stores in existing markets mature more quickly than those in new markets. This mix allows us to focus our resources on developing our new markets so they begin with a solid foundation.
See “Properties” for additional information with respect to our store locations.
Our Competition and Industry
We operate within the intensely competitive and highly fragmented grocery store industry which encompasses a wide array of food retailers, including large conventional independent and chain supermarkets, warehouse clubs, small grocery and convenience stores, and natural and organic, specialty, mass, discount and other food retail and online formats. According to the Progressive Grocer, U.S. supermarket sales totaled over $668 billion in 2016. Based on our industry experience, we believe we are capturing significant market share from conventional supermarkets and specialty concepts in this supermarket segment.
While the natural and organic food segment is one of the fastest growing segments in the industry, conventional supermarkets have experienced overall share decline from approximately 73% in 2005 to approximately 63% in 2016, according to the Progressive Grocer, as customers have migrated to other grocery retail formats. Conventional supermarket customers are attracted to unique product offerings, formats and differentiated shopping experiences. Based on our industry experience, we also believe consumers are increasingly focused on health and wellness and are actively seeking healthy foods in order to improve eating habits. This overall demand for healthy products is driven by many factors, including increased awareness about the benefits of eating healthy, a greater focus on preventative health measures, and the rising costs of health care. We believe customers are attracted to retailers with comprehensive health and wellness product offerings. As a result, food retailers are offering an increased assortment of fresh, natural and organic foods as well as vitamins and supplements to meet this demand.
9
Our competitors include conventional supermarkets such as Kroger, Albertsons and Safeway, and other food retailers such as Whole Foods, Natural Grocers by Vitamin Cottage and Trader Joe’s, as well as mass or discount retailers, warehouse membership clubs, online retailers, specialty stores, restaurants, and home delivery and meal solution companies. We believe Sprouts offers consumers a compelling value relative to our competitors and will continue to benefit from increasing consumer focus on health, wellness and value, as well as their emphasis on an enhanced shopping experience featuring a broad selection of products along with exceptional customer engagement.
Insurance and Risk Management
We use a combination of insurance and self-insurance to provide for potential liability for workers’ compensation, general liability, product liability, director and officers’ liability, team member healthcare benefits, and other casualty and property risks. Changes in legal trends and interpretations, variability in inflation rates, changes in the nature and method of claims settlement, benefit level changes due to changes in applicable laws, insolvency of insurance carriers, and changes in discount rates could all affect ultimate settlements of claims. We evaluate our insurance requirements on an ongoing basis to ensure we maintain adequate levels of coverage.
Trademarks and Other Intellectual Property
We believe that our intellectual property has substantial value and has contributed to the success of our business. In particular, our trademarks, including our registered SPROUTS FARMERS MARKET®, SPROUTS® and HEALTHY LIVING FOR LESS!® trademarks, are valuable assets that we believe reinforce our customers’ favorable perception of our stores. In addition to our trademarks, we believe that our trade dress, which includes the human-scale design, arrangement, color scheme and other physical characteristics of our stores and product displays, is a large part of the farmers market atmosphere we create in our stores and enables customers to distinguish our stores and products from those of our competitors.
From time to time, third parties have used names similar to ours, have applied to register trademarks similar to ours and, we believe, have infringed or misappropriated our intellectual property rights. Third parties have also, from time to time, opposed our trademarks and challenged our intellectual property rights. We respond to these actions on a case-by-case basis. The outcomes of these actions have included both negotiated out-of-court settlements as well as litigation.
Information Technology Systems
We have made significant investments in information technology infrastructure and business systems, including point-of-sale, data warehouse, labor management, purchasing, inventory control, demand forecasting, financial and reporting systems. Our recent investments have focused on solutions to enhance our operational productivity, optimize our labor, maintain our in-stock positions and forecast our customer demand, while maintaining our high quality and value proposition. All of our stores operate under one integrated information technology platform which allows for our current and future store growth. We will continue making investments in our current information technology infrastructure and invest in systems that scale to support our growth and add efficiencies to our growing operations.
Regulatory Compliance
Our stores are subject to various local, state and federal laws, regulations and administrative practices affecting our business. We must comply with provisions regulating health and sanitation standards, food labeling, equal employment, minimum wages, environmental protection, licensing for the
10
sale of food and, in many stores, licensing for beer and wine or other alcoholic beverages. Our operations, including the manufacturing, processing, formulating, packaging, labeling and advertising of products are subject to regulation by various federal agencies, including the Food and Drug Administration (referred to as the “FDA”), the Federal Trade Commission (referred to as the “FTC”), the U.S. Department of Agriculture (referred to as the “USDA”), the Consumer Product Safety Commission (“referred to as the CPSC”) and the EPA.
Food. The FDA has comprehensive authority to regulate the safety of food and food ingredients (other than meat, poultry, catfish and certain egg products), as well as dietary supplements under the Federal Food, Drug, and Cosmetic Act (referred to as “FDCA”). Similarly, the USDA’s Food Safety Inspection Service is the public health agency responsible for ensuring that the nation’s commercial supply of meat, poultry, catfish and certain egg products is safe, wholesome and correctly labeled and packaged under the Federal Meat Inspection Act and the Poultry Products Inspection Act.
Congress amended the FDCA in 2011 through passage of the Food Safety Modernization Act (referred to as “FSMA”), which greatly expanded FDA’s regulatory obligations over all actors in the supply chain. Industry actors continue to determine the best pathways to implement FSMA’s regulatory mandates and FDA’s promulgating regulations throughout supply chains, as most requirements are now in effect. Such regulations mandate that risk-based preventive controls be observed by the majority of food producers. This authority applies to all domestic food facilities and, by way of imported food supplier verification requirements, to all foreign facilities that supply food products.
The FDA also exercises broad jurisdiction over the labeling and promotion of food. Labeling is a broad concept that, under certain circumstances, extends even to product-related claims and representations made on a company’s website or similar printed or graphic medium. All foods, including dietary supplements, must bear labeling that provides consumers with essential information with respect to standards of identity, net quantity, nutrition facts labeling, ingredient statement, allergen disclosures. FDA also regulates the use of structure/function claims, health claims and nutrient content claims. Additional in-store labeling requirements, such as disclosure of calories and other nutrient information for frequently sold items are scheduled to go into effect in 2018. In addition, compliance dates on various nutrition initiatives that will impact many actors in our supply chain, such as in relation to partially hydrogenated oils and new nutritional labeling guidelines, are scheduled to go into effect beginning 2018 and scheduled into 2021.
Dietary Supplements. The FDA has comprehensive authority to regulate the safety of dietary supplements, dietary ingredients, labeling and current good manufacturing practices. Congress amended the FDCA in 1994 through passage of the Dietary Supplement Health and Education Act (referred to as “DSHEA”), which greatly expanded FDA’s regulatory authority over dietary supplements. Through DSHEA, dietary supplements became its own regulated commodity while also allowing structure/function claims on products. However, no statement on a dietary supplement may expressly or implicitly represent that it will diagnose, cure, mitigate, treat or prevent a disease.
Food and Dietary Supplement Advertising. The FTC exercises jurisdiction over the advertising of foods and dietary supplements. The FTC has the power to institute monetary sanctions and the imposition of consent decrees and penalties that can severely limit a company’s business practices. In recent years, the FTC has instituted numerous enforcement actions against dietary supplement companies for failure to have adequate substantiation for claims made in advertising or for the use of false or misleading advertising claims.
Compliance. As is common in our industry, we rely on our suppliers and contract manufacturers to ensure that the products they manufacture and sell to us comply with all applicable regulatory and legislative requirements. In general, we seek certifications of compliance, representations and warranties, indemnification and/or insurance from our suppliers and contract manufacturers. However, even with adequate insurance and indemnification, any claims of non-compliance could significantly damage our reputation and consumer confidence in products we sell. In addition, the failure of such products to comply with applicable regulatory and legislative requirements could prevent us from marketing the
11
products or require us to recall or remove such products from our stores. In order to comply with applicable statutes and regulations, our suppliers and contract manufacturers have from time to time reformulated, eliminated or relabeled certain of their products and we have revised certain provisions of our sales and marketing program.
Employees
As of December 31, 2017, we had approximately 27,000 team members. None of our team members are subject to collective bargaining agreements. We consider our relations with our team members to be good, and we have never experienced a strike or significant work stoppage.
Corporate Offices
Our principal executive offices are located at 5455 E. High Street, Suite 111, Phoenix, Arizona 85054. Our website address is www.sprouts.com. The information on or accessible through our website is not incorporated by reference into this Annual Report on Form 10-K or in any other report or document we file with the Securities and Exchange Commission (referred to as the “SEC”).
Certain factors may have a material adverse effect on our business, financial condition and results of operations. You should carefully consider the risks and uncertainties described below, together with all of the other information in this Annual Report on Form 10-K, including our consolidated financial statements and related notes. Any of the following risks could materially and adversely affect our business, results of operations, cash flows, financial condition, or prospects and cause the value of our common stock to decline, which could cause you to lose all or part of your investment.
Business and Operating Risks
Our continued growth depends on new store openings, and our failure to successfully open new stores could negatively impact our business.
Our continued growth depends, in large part, on our ability to open new stores and to operate those stores successfully. Successful implementation of this strategy depends upon a number of factors, including our ability to effectively achieve a level of cash flow or obtain necessary financing to support our expansion; find suitable sites for new store locations; negotiate and execute leases on acceptable terms; secure and manage the inventory necessary for the launch and operation of our new stores; hire, train and retain skilled team members; promote and market new stores; and address competitive merchandising, distribution and other challenges encountered in connection with expansion into new geographic areas and markets. Although we plan to expand our store base primarily through new store openings, we may grow through strategic acquisitions. Our ability to grow through strategic acquisitions will depend upon our ability to identify suitable targets and negotiate acceptable terms and conditions for their acquisition, as well as our ability to obtain financing for such acquisitions, integrate the acquired stores into our existing store base and retain the customers of such stores. If we are ineffective in performing these activities, then our efforts to open and operate new stores may be unsuccessful or unprofitable, and we may be unable to execute our growth strategy.
We opened 32 and 36 stores in fiscal 2017 and 2016, respectively, and we intend to open approximately 30 new stores annually over the near term. However, we cannot assure you that we will achieve this expected level of new store growth. We may not have the level of cash flow or financing necessary to support our growth strategy. Additionally, our proposed expansion will place increased demands on our operational, managerial and administrative resources. These increased demands could cause us to operate our existing business less effectively, which in turn could cause deterioration in the
12
financial performance of our existing stores. Further, new store openings in markets where we have existing stores may result in reduced sales volumes at our existing stores in those markets. If we experience a decline in performance, we may slow or discontinue store openings, or we may decide to close stores that we are unable to operate in a profitable manner. If we fail to successfully implement our growth strategy, including by opening new stores, our financial condition, results of operations and cash flows may be adversely affected.
We may be unable to maintain or increase comparable store sales, which could negatively impact our business and stock price.
We may not be able to maintain or improve the levels of comparable store sales that we have experienced in the past. Our comparable store sales growth could be lower than our historical average for many reasons, including:
|
|
• |
general economic conditions; |
|
|
• |
product price inflation or deflation; |
|
|
• |
increased competitive activity; |
|
|
• |
price changes in response to competitive factors; |
|
|
• |
the impact of new and acquired stores entering into the comparable store base; |
|
|
• |
the opening of new stores that cannibalize store sales in existing areas; |
|
|
• |
cycling against any year or quarter of above-average sales results; |
|
|
• |
consumer preferences, buying trends and spending levels; |
|
|
• |
slowing in the fresh, natural and organic retail sector; |
|
|
• |
possible supply shortages or other operational disruptions; |
|
|
• |
the number and dollar amount of customer transactions in our stores; |
|
|
• |
our ability to provide product or service offerings that generate new and repeat visits to our stores; and |
|
|
• |
the level of customer engagement that we provide in our stores. |
These factors may cause our comparable store sales results to be materially lower than in recent periods, which could harm our business and result in a decline in the price of our common stock.
Disruption of significant supplier relationships could negatively affect our business.
KeHE is our primary supplier of dry grocery and frozen food products, accounting for approximately 34% and 33% of our total purchases in each of fiscal 2017 and 2016, respectively. We also have commitments in place with KeHE to order certain amounts of our distribution-sourced organic and natural produce, and to maintain certain minimum average annual store purchase volumes, including for any new stores we open. Our current primary contractual relationship with KeHE continues through May 2018. Due to this concentration of purchases from a single third-party supplier, the cancellation of our distribution arrangement or the disruption, delay or inability of KeHE to deliver product to our stores in quantities that meet our requirements may materially and adversely affect our operating results while we establish alternative distribution channels. Another 4% of our total purchases in each of fiscal 2017 and 2016 were made through our secondary supplier, UNFI. Our current contractual relationship with UNFI continues through December 31, 2018. There is no assurance UNFI or other distributors will be able to fulfill our needs on favorable terms or at all. In addition, if KeHE, UNFI or any of our other suppliers fail to comply with food safety, labeling or other laws and regulations, or face allegations of non-compliance, their operations may be disrupted. Further, the food distribution and manufacturing industries are dynamic. Consolidation of distributors or the manufacturers that supply them could reduce our supply
13
options and detrimentally impact the terms under which we purchase products. We cannot assure you that we would be able to find replacement suppliers on commercially reasonable terms, which would have a material adverse effect on our financial condition, results of operations and cash flows.
Any significant interruption in the operations of our distribution centers or supply chain network could disrupt our ability to deliver our produce and other products in a timely manner.
We self-distribute our produce through our two distribution centers located in Arizona and Texas and three third-party distribution centers, with two located in California and one located in Georgia. Any significant interruption in the operation of our distribution center infrastructure, such as disruptions due to fire, severe weather or other catastrophic events, power outages, labor disagreements, shipping or infrastructure problems, or contractual disputes with third-party service providers could adversely impact our ability to distribute produce to our stores. Such interruptions could result in lost sales and a loss of customer loyalty to our brand. While we maintain business interruption and property insurance, if the operation of our distribution centers were interrupted for any reason, causing delays in shipment of produce to our stores, our insurance may not be sufficient to cover losses we experience, which could have a material adverse effect on our business, financial condition, results of operations and cash flows.
In addition, unexpected delays in deliveries from vendors that ship directly to our stores or increases in transportation costs (including through increased fuel costs) could have a material adverse effect on our financial condition, results of operations and cash flows. Labor shortages or work stoppages in the transportation industry, long-term disruptions to the national and international transportation infrastructure, reduction in capacity and industry-specific regulations such as hours-of-service rules that lead to delays or interruptions of deliveries or increased costs could negatively affect our business.
Disruptions to, or security breaches involving, our information technology systems could harm our ability to run our business.
We rely extensively on information technology systems for point of sale processing in our stores, supply chain, financial reporting, human resources and various other processes and transactions. Our information technology systems are subject to damage or interruption from power outages, computer and telecommunications failures, computer viruses, security breaches, including breaches of our transaction processing or other systems that could result in the compromise of confidential customer or team member data, catastrophic events, and usage errors by our team members. In March 2016, an email “phishing” scam was perpetrated against one of our team members, who inadvertently disclosed 2015 W-2 statements of our team members to an unauthorized third party purporting to be one of our executive officers. We worked with the FBI and the IRS to investigate this crime and to determine the best ways to protect team member tax information, and offered credit monitoring services to impacted team members. As described under “Legal Proceedings,” we are subject to four complaints related to this scam, each on behalf of a purported class of our current and former team members whose personally identifiable information was inadvertently disclosed; these matters are covered by our cyber insurance, subject to applicable deductibles. Additionally, in January 2013, we discovered sophisticated malware installed on certain credit card “pin pads” in a limited number of our stores designed to illegally access our customers’ credit card information. We have implemented numerous additional security protocols since these attacks in order to further tighten security and continue to maintain a customary cyber insurance policy, but there can be no assurance similar breaches will not occur in the future, be detected in a timely manner or be covered by our insurance policy.
Our information technology systems may also fail to perform as we anticipate, and we may encounter difficulties in adapting these systems to changing technologies or expanding them to meet the future needs and growth of our business. If our systems are breached, damaged or cease to function properly, we may have to make significant investments to fix or replace them; suffer interruptions in our operations; experience data loss; incur liability to our customers, team members and others; face costly litigation, enforcement actions and penalties; and our reputation with our customers may be harmed. Various third parties, such as our suppliers and payment processors, also rely heavily on information technology systems, and any failure of these systems could also cause loss of sales, transactional or
14
other data and significant interruptions to our business. Any security breach or other material interruption in the information technology systems we rely on may have a material adverse effect on our business, operating results and financial condition.
If we are unable to successfully identify market trends and react to changing consumer preferences in a timely manner, our sales may decrease.
We believe our success depends, in substantial part, on our ability to:
|
|
• |
anticipate, identify and react to fresh, natural and organic grocery and dietary supplement trends and changing consumer preferences and demographics in a timely manner; |
|
|
• |
translate market trends into appropriate, saleable product and service offerings in our stores before our competitors; and |
|
|
• |
develop and maintain vendor and service provider relationships that provide us access to the newest merchandise and customer engagement options on reasonable terms. |
Consumer preferences often change rapidly and without warning, moving from one trend to another among many product or retail concepts. Our performance is impacted by trends regarding healthy lifestyles, dietary preferences, natural and organic products, and vitamins and supplements, as well as new and evolving methods of engaging with and delivering our products to our customers. Consumer preferences towards vitamins, supplements or natural and organic food products might shift as a result of, among other things, economic conditions, food safety perceptions, scientific research or findings regarding the benefits or efficacy of such products, national media attention and the cost of these products. Our store offerings currently include natural and organic products and dietary supplements. A change in consumer preferences away from our offerings would have a material adverse effect on our business. Additionally, negative publicity over the safety, efficacy or benefits of any such items may adversely affect demand for our products, and could result in lower customer traffic, sales, results of operations and cash flows.
If we are unable to anticipate and satisfy consumer preferences in the regions where we operate with respect to product offerings and customer engagement options, our sales may decrease, which could have a material adverse effect on our business, financial condition, results of operations and cash flows.
Our newly opened stores may negatively impact our financial results in the short-term, and may not achieve sales and operating levels consistent with our more mature stores on a timely basis or at all.
We have actively pursued new store growth and plan to continue doing so in the future. We cannot assure you that our new store openings will be successful or reach the sales and profitability levels of our existing stores. New store openings may negatively impact our financial results in the short-term due to the effect of store opening costs and lower sales and contribution to overall profitability during the initial period following opening. New stores build their sales volume and their customer base over time and, as a result, generally have lower margins and higher operating expenses, as a percentage of net sales, than our more mature stores. New stores may not achieve sustained sales and operating levels consistent with our more mature store base on a timely basis or at all. This may have an adverse effect on our financial condition and operating results.
On many of our projects, we have received landlord contributions for leasehold improvements and other build-out costs. We cannot guarantee that we will be able to continue to receive landlord contributions at the same levels or at all. Any reductions of landlord contributions could have an adverse impact on our new store cash-on-cash returns and our operating results.
15
In addition, we may not be able to successfully integrate new stores into our existing store base and those new stores may not be as profitable as our existing stores. Further, we have experienced in the past, and expect to experience in the future, some sales volume transfer from our existing stores to our new stores as some of our existing customers switch to new, closer locations. If our new stores are less profitable than our existing stores, or if we experience sales volume transfer from our existing stores, our financial condition and operating results may be adversely affected.
We may be unable to maintain or improve our operating margins, which could adversely affect our financial condition and ability to grow.
If we are unable to successfully manage the potential difficulties associated with store growth, we may not be able to capture the efficiencies of scale that we expect from expansion. If we are not able to continue to capture efficiencies of scale, improve our systems, continue our cost discipline, and maintain appropriate store labor levels and disciplined product selection, our operating margins may stagnate or decline. In addition, competition and pricing pressures from competitors may also adversely impact our operating margins. Both our inability to capture the efficiencies from scale and competition could have a material adverse effect on our business, financial condition, results of operations and cash flows and adversely affect the price of our common stock.
Real or perceived concerns that products we sell could cause unexpected side effects, illness, injury or death could result in their discontinuance or expose us to lawsuits, either of which could result in unexpected costs and damage to our reputation.
There is increasing governmental scrutiny of and public awareness regarding food safety. Unexpected side effects, illness, injury, or death caused by products we prepare and/or sell or involving vendors that supply us with products could result in the discontinuance of sales of these products or our relationship with such vendors or prevent us from achieving market acceptance of the affected products. Such side effects, illnesses, injuries and death could also expose us to damage to our reputation and product liability or negligence lawsuits. Any claims brought against us may exceed our existing or future insurance policy coverage or limits. Any judgment against us that is in excess of our policy limits would have to be paid from our cash reserves, which would reduce our capital resources. Further, we may not have sufficient capital resources to pay a judgment, in which case our creditors could levy against our assets.
As a fresh, natural and organic retailer, we believe that many customers choose to shop our stores because of their interest in health, nutrition and food safety. As a result, we believe that our customers hold us to a high food safety standard. Therefore, real or perceived quality or food safety concerns, whether or not ultimately based on fact, and whether or not involving products prepared and/or sold at our stores or vendors that supply us with products, would cause negative publicity and lost confidence regarding our company, brand, or products, which could in turn harm our reputation and net sales, and could have a material adverse effect on our business, results of operations, cash flows or financial condition.
If we fail to maintain our reputation and the value of our brand, our sales may decline.
We believe our continued success depends on our ability to maintain and grow the value of the Sprouts brand. Maintaining, promoting and positioning our brand and reputation will depend largely on the success of our marketing and merchandising efforts and our ability to provide a consistent, high-quality customer experience. Brand value is based in large part on perceptions of subjective qualities, and even isolated incidents involving our company, our team members, suppliers, agents or third-party service providers, or the products we sell can erode trust and confidence, particularly if they involve our private label products, or result in adverse publicity, governmental investigations or litigation. Our brand could be adversely affected if we fail to achieve these objectives, or if our public image or reputation were to be tarnished by negative publicity.
16
The loss of key management could negatively affect our business.
We are dependent upon a number of key management and other team members. If we were to lose the services of a significant number of key team members within a short period of time, this could have a material adverse effect on our operations as we may not be able to find suitable individuals to replace them on a timely basis, if at all. In addition, any such departure could be viewed in a negative light by investors and analysts, which may cause our stock price to decline. We do not maintain key person insurance on any team member.
If we are unable to attract, train and retain team members, we may not be able to grow or successfully operate our business.
The food retail industry is labor intensive. Our continued success is dependent upon our ability to attract and retain qualified team members in our stores and at our regional and store support offices who understand and appreciate our culture and are able to represent our brand effectively and establish credibility with our business partners and consumers. We face intense competition for qualified team members, many of whom are subject to offers from competing employers. Our ability to meet our labor needs, while controlling wage and labor-related costs, is subject to numerous external factors, including the availability of a sufficient number of qualified persons in the work force in the markets in which we are located, unemployment levels within those markets, unionization of the available work force, prevailing wage rates, changing demographics, health and other insurance costs and changes in employment legislation. In the event of increasing wage rates, if we fail to increase our wages competitively, the quality of our workforce could decline, causing our customer engagement to suffer, while increasing our wages could cause our earnings to decrease. If we are unable to hire and retain team members capable of meeting our business needs and expectations, our business and brand image may be impaired. Any failure to meet our staffing needs or any material increase in turnover rates of our team members or team member wages may adversely affect our business, results of operations, cash flows or financial condition.
Union attempts to organize our team members could negatively affect our business.
None of our team members are currently subject to a collective bargaining agreement. As we continue to grow and enter different regions, unions may attempt to organize all or part of our team member base at certain stores or within certain regions. Responding to such organization attempts may distract management and team members and may have a negative financial impact on individual stores, or on our business as a whole.
Our lease obligations could adversely affect our financial performance and may require us to continue paying rent for store locations that we no longer operate.
We are subject to risks associated with our current and future store, distribution center and administrative office real estate leases. Our high level of fixed lease obligations will require us to use a portion of cash generated by our operations to satisfy these obligations, and could adversely impact our ability to obtain future financing, if required, to support our growth or other operational investments. We will require substantial cash flows from operations to make our payments under our operating leases, all of which provide for periodic increases in rent. If we are not able to make the required payments under the leases, the lenders or owners of the relevant stores, distribution centers or administrative offices may, among other things, repossess those assets, which could adversely affect our ability to conduct our operations. In addition, our failure to make payments under our operating leases could trigger defaults under other leases or under agreements governing our indebtedness, which could cause the counterparties under those agreements to accelerate the obligations due thereunder.
Further, we generally cannot cancel our leases, so if we decide to close or relocate a location, we may nonetheless be committed to perform our obligations under the applicable lease, including paying the base rent for the remaining lease term. In addition, as our leases expire, we may fail to negotiate renewals, either on commercially acceptable terms or any terms at all, which could materially adversely affect our business, results of operations, cash flows or financial condition.
17
Claims under our insurance plans may differ from our estimates, which could materially impact our results of operations.
We use a combination of insurance and self-insurance plans to provide for the potential liabilities for workers’ compensation, general liability (including, in connection with legal proceedings described under “—Legal proceedings could materially impact our business, financial condition, results of operations and cash flows” below), property insurance, director and officers’ liability insurance, vehicle liability and team member health-care benefits. Liabilities associated with the risks that are retained by us are estimated, in part, by considering historical claims experience, demographic factors, severity factors and other actuarial assumptions. Our results could be materially impacted by claims and other expenses related to such plans if future occurrences and claims differ from these assumptions and historical trends.
We may be unable to generate sufficient cash flow to satisfy our debt service obligations, which could adversely impact our business.
As of December 31, 2017, we had outstanding indebtedness of $348.0 million under our credit agreement (referred to as the “Credit Facility”). We may incur additional indebtedness in the future, including borrowings under our Credit Facility. Our indebtedness, any additional indebtedness we may incur or any hedging arrangements related to such indebtedness could require us to divert funds identified for other purposes for debt service and impair our liquidity position. If we cannot generate sufficient cash flow from operations to service our debt, we may need to refinance our debt, dispose of assets or issue equity to obtain necessary funds. We do not know whether we will be able to take any of such actions on a timely basis, on terms satisfactory to us or at all.
The fact that a substantial portion of our cash flow from operations could be needed to make payments on this indebtedness could have important consequences, including the following:
|
|
• |
reducing our ability to execute our growth strategy, including new store development; |
|
|
• |
impacting our ability to continue to execute our operational strategies in existing stores; |
|
|
• |
increasing our vulnerability to general adverse economic and industry conditions; |
|
|
• |
reducing the availability of our cash flow for other purposes; |
|
|
• |
limiting our flexibility in planning for, or reacting to, changes in our business and the market in which we operate, which would place us at a competitive disadvantage compared to our competitors that may have less debt; |
|
|
• |
limiting our ability to borrow additional funds; and |
|
|
• |
failing to comply with the covenants in our debt agreements could result in negative consequences, including all of our indebtedness becoming immediately due and payable. |
Our ability to obtain necessary funds through borrowing will depend on our ability to generate cash flow from operations. Our ability to generate cash is subject to general economic, financial, competitive, legislative, regulatory, and other factors that are beyond our control. If our business does not generate sufficient cash flow from operations or if future borrowings are not available to us under our Credit Facility or otherwise in amounts sufficient to enable us to fund our liquidity needs, our operating results and financial condition may be adversely affected. Our inability to make scheduled payments on our debt obligations in the future would require us to refinance all or a portion of our indebtedness on or before maturity, sell assets, delay capital expenditures, or seek additional equity investment.
18
Covenants in our debt agreements restrict our operational flexibility.
The agreement governing our Credit Facility contains usual and customary restrictive covenants relating to our management and the operation of our business, including the following:
|
|
• |
incurring additional indebtedness; |
|
|
• |
making certain investments; |
|
|
• |
merging, dissolving, liquidating, consolidating, or disposing of all or substantially all of our assets; |
|
|
• |
paying dividends, making distributions, or redeeming capital stock; |
|
|
• |
entering into transactions with our affiliates; and |
|
|
• |
granting liens on our assets. |
Our Credit Facility also requires us to maintain a specified total net leverage ratio and minimum interest coverage ratio at the end of any fiscal quarter at any time the facility is drawn. Our ability to meet these ratios, if applicable, could be affected by events beyond our control. Failure to comply with any of the covenants under our Credit Facility could result in a default under the facility, which could cause our lenders to accelerate the timing of payments and exercise their lien on substantially all of our assets, which would have a material adverse effect on our business, operating results, and financial condition.
Market and Other External Risks
General economic conditions that impact consumer spending or result in competitive responses could adversely affect our business.
The retail food business is sensitive to changes in general economic conditions. Recessionary economic cycles, increases in interest rates, higher prices for commodities, fuel and other energy, inflation, high levels of unemployment and consumer debt, depressed home values, high tax rates and other economic factors that affect consumer spending and confidence or buying habits may materially adversely affect the demand for products we sell in our stores. In recent years, the U.S. economy has experienced volatility due to uncertainties related to energy prices, credit availability, difficulties in the banking and financial services sectors, decreases in home values and retirement accounts, instability in foreign markets, high unemployment and falling consumer confidence. As a result, consumers are more cautious and could shift their spending to lower-priced competition, such as warehouse membership clubs, dollar stores or extreme value formats, which could have a material and adverse effect on our operating results and financial condition.
In addition, prolonged inflation or deflation can impact our business. Food deflation across multiple categories, particularly in produce, could reduce sales growth and earnings if our competitors react by lowering their retail pricing and expanding their promotional activities, which can lead to retail deflation higher than cost deflation that could reduce our sales, gross profit margins and comparable store sales. Food inflation, when combined with reduced consumer spending, could also reduce sales, gross profit margins and comparable store sales. As a result, our operating results and financial condition could be materially adversely affected.
Competition in our industry is intense, and our failure to compete successfully may adversely affect our revenues and profitability.
We operate in the highly competitive retail food industry. Our competitors include supermarkets, natural food stores, mass or discount retailers, warehouse membership clubs, online retailers and specialty stores, as well as restaurants and home delivery and home meal solution providers. These businesses compete with us for products, customers and locations. We compete on a combination of factors, primarily product selection and quality, customer engagement, store format, location, price and
19
delivery options. Our success depends on our ability to offer products and services that appeal to our customers’ preferences, and our failure to offer such products or services could lead to a decrease in our sales. To the extent that our competitors lower prices, our ability to maintain profit margins and sales levels may be negatively impacted. In addition, some competitors are aggressively expanding their number of stores or their product offerings, increasing the space allocated to perishable, prepared and specialty foods, including fresh, natural and organic foods, and enhancing options of engaging with and delivering their products to customers. Some of these competitors may have been in business longer or may have greater financial or marketing resources than we do and may be able to devote greater resources to sourcing, promoting and selling their products. As competition in certain areas or platforms intensifies or competitors open stores within close proximity to our stores, our results of operations and cash flows may be negatively impacted through a loss of sales, decrease in market share, reduction in margin from competitive price changes or greater operating costs.
We rely heavily on sales of fresh produce and quality natural and organic products, and product supply disruptions may have an adverse effect on our profitability and operating results.
We have a significant focus on perishable products, including fresh produce and natural and organic products. Sales of produce accounted for approximately 24% of our net sales in both fiscal 2017 and 2016, respectively. Although we have not experienced difficulty to date in maintaining the supply of our produce and fresh, natural and organic products that meet our quality standards, there is no assurance that these products will be available to meet our needs in the future. The availability of such products at competitive prices depends on many factors beyond our control, including the number and size of farms that grow natural or organic crops or raise livestock that meet our quality, welfare and production standards, tariffs and import regulations or restrictions on foreign-sourced products and the ability of our vendors to maintain organic, non-genetically modified or other applicable third-party certifications for such products. Produce is also vulnerable to adverse weather conditions and natural disasters, such as floods, droughts, storms, frosts, wildfires, earthquakes, hurricanes, pestilences and other extreme or abnormal environmental conditions. Adverse weather conditions and natural disasters can lower crop yields and reduce crop size and quality, which in turn could reduce the available supply of, or increase the price of, fresh produce, which may adversely impact sales of our fresh produce and our other products that rely on produce as a key ingredient.
In addition, we and our suppliers compete with other food retailers in the procurement of fresh, natural and organic products, which are often less available than conventional products. If our competitors significantly increase their fresh, natural and organic product offerings due to increases in consumer demand or otherwise, we and our suppliers may not be able to obtain a sufficient supply of such products on favorable terms, or at all, and our sales may decrease, which could have a material adverse effect on our business, financial condition, results of operations and cash flows. We could also suffer significant inventory losses in the event of disruption of our distribution network or extended power outages in our distribution centers. If we are unable to maintain inventory levels suitable for our business needs, it would materially adversely affect our financial condition, results of operations and cash flows.
Higher wage and benefit costs could adversely affect our business.
Changes in federal and state minimum wage laws and other laws relating to employee benefits, including the Patient Protection and Affordable Care Act (or its successor or replacement), could cause us to incur additional wage and benefit costs. Increased labor costs brought about by changes in minimum wage laws, other regulations or prevailing market conditions would increase our expenses and have an adverse impact on our profitability.
The current geographic concentration of our stores creates an exposure to local or regional downturns or catastrophic occurrences.
As of December 31, 2017, we operated 108 stores in California, making California our largest market representing 38% of our total stores in fiscal 2017. We also have store concentration in Texas, Arizona and Colorado, operating 42, 34 and 32 stores in those states, respectively, and representing 15%, 12% and 11% of our total stores in fiscal 2017, respectively. In addition, we source a large portion
20
of our produce from California, ranging from approximately 40% to approximately 70% depending on the time of year. As a result, our business is currently more susceptible to regional conditions than the operations of more geographically diversified competitors, and we are vulnerable to economic downturns in those regions. Any unforeseen events or circumstances that negatively affect these areas in which we have stores or from which we obtain products could materially adversely affect our revenues and profitability. These factors include, among other things, changes in demographics, population and employee bases; wage increases; changes in economic conditions; floods, prolonged droughts or other severe weather conditions; and other catastrophic occurrences, such as wildfires. Such conditions may result in reduced customer traffic and spending in our stores, physical damage to our stores, loss of inventory, closure of one or more of our stores, inadequate work force in our markets, temporary disruption in the supply of products, delays in the delivery of goods to our stores and a reduction in the availability of products in our stores. Any of these factors may disrupt our business and materially adversely affect our financial condition, results of operations and cash flows.
Fluctuations in commodity prices and availability may impact profitability.
Many products we sell include ingredients such as wheat, corn, oils, milk, sugar, cocoa, nuts and other key commodities. Many commodity prices are subject to significant price fluctuations. Any increase in prices of such key ingredients may cause our vendors to seek price increases from us, and price decreases may result in our competitors reducing retail prices on items containing such ingredients. We cannot assure you that we will be able to mitigate vendor efforts to increase our costs or competitive responses to decreasing prices, either in whole or in part. In the event we are unable to continue mitigating potential vendor price increases, we may in turn consider raising our prices, and our customers may be deterred by any such price increases. In addition, we may lower our retail prices in response to lower commodity costs or competitive conditions. Our profitability may be impacted either through increased costs to us or lower prices and loss of customers due to competitive conditions, which may impact gross margins, or through reduced revenue as a result of a decline in the number and average size of customer transactions.
Increases in certain costs affecting our marketing, advertising and promotions may adversely impact our ability to advertise effectively and reduce our profitability.
Postal rate increases, and increasing paper and printing costs affect the cost of our promotional mailings. In response to any future increase in mailing costs, we may consider reducing the number and size of certain promotional pieces. In addition, we rely on discounts from the basic postal rate structure, such as discounts for bulk mailings and sorting by zip code and carrier routes. We are not party to any long-term contracts for the supply of paper. Future increases in costs affecting our marketing, advertising and promotions could adversely impact our ability to advertise effectively and our profitability.
A widespread health epidemic could materially impact our business.
Our business could be severely impacted by a widespread regional, national or global health epidemic. A widespread health epidemic may cause customers to avoid public gathering places such as our stores or otherwise change their shopping behaviors. Additionally, a widespread health epidemic could also adversely impact our business by disrupting production and delivery of products to our stores and by impacting our ability to appropriately staff our stores.
We may require additional capital to fund the expansion of our business, and our inability to obtain such capital could harm our business.
To support our expanding business, we must have sufficient capital to continue to make significant investments in our new and existing stores and advertising. We cannot assure you that cash generated by our operations will be sufficient to allow us to fund such expansion. If cash flows from operations are not sufficient, we may need additional equity or debt financing to provide the funds required to expand our business. If such financing is not available on satisfactory terms or at all, we may be unable to expand our business or to develop new business at the rate desired and our operating results may suffer. Debt
21
financing increases expenses, may contain covenants that restrict the operation of our business, and must be repaid regardless of operating results. Equity financing, or debt financing that is convertible into equity, could result in additional dilution to our existing stockholders.
Our inability to obtain adequate capital resources, whether in the form of equity or debt, to fund our business and growth strategies may require us to delay, scale back or eliminate some or all of our operations or the expansion of our business, which may have a material adverse effect on our business, operating results, financial condition or prospects.
Increasing energy costs, unless offset by more efficient usage or other operational responses, may impact our profitability.
We utilize natural gas, water, sewer and electricity in our stores and use gasoline and diesel in trucks that deliver products to our stores. We may also be required to pay certain adjustments or other amounts pursuant to our supply and delivery contracts in connection with increases in fuel prices. Increases in energy costs, whether driven by increased demand, decreased or disrupted supply, increased environmental regulations or an anticipation of any such events will increase the costs of operating our stores. Although fuel prices declined during the second half of 2014 and persisted through 2017, our shipping costs also may increase if fuel and freight prices increase. We may not be able to recover these rising costs through increased prices charged to our customers, and any increased prices may exacerbate the risk of customers choosing lower-cost alternatives. In addition, if we are unsuccessful in attempts to protect against these increases in energy costs through long-term energy contracts, improved energy procurement, improved efficiency and other operational improvements, the overall costs of operating our stores will increase, which would impact our profitability, financial condition, results of operations and cash flows.
Financial Reporting, Legal and Other Regulatory Risks
We, as well as our vendors, are subject to numerous laws and regulations and our compliance with these laws and regulations may increase our costs, limit or eliminate our ability to sell certain products, raise regulatory enforcement risks not present in the past, or otherwise adversely affect our business, reputation, results of operations, cash flows and financial condition.
Enforcement. Both FDA and USDA have broad authority to enforce their applicable provisions relating to the safety, labeling, manufacturing and promotion of foods and dietary supplements, including powers to issue a public warning letter to a company, publicize information about illegal products, institute an administrative detention of food, request or order a recall of food from the market, and request the Department of Justice to initiate a seizure action, an injunction action or a criminal prosecution in the U.S. courts.
Dietary Supplement Risks. As a retailer of dietary supplements our sales of dietary supplements are regulated by FDA. However, other public and private actors are increasingly targeting dietary supplement retailers and manufacturers for selling products that fail to adhere to requirements under FDCA, as amended by DSHEA. While FDCA provides FDA with the authority to remove products from the market that are adulterated or misbranded, state actors, such as the New York Attorney General, and the Plaintiffs’ Bar have been targeting retailers and manufacturers of dietary supplements for failing to adhere to current good manufacturing practices and for false or misleading product statements.
Advertising and Product Claims Risks. In connection with the marketing and advertisement of products we sell, we could be the target of claims relating to false or deceptive advertising, including under the auspices of the FTC and the consumer protection statutes of some states. Furthermore, in recent years, the FDA has been aggressive in enforcing its regulations with respect to nutrient content claims (e.g., “low fat,” “good source of,” “calorie free,” etc.), unauthorized “health claims” (claims that characterize the relationship between a food or food ingredient and a disease or health condition), and other claims that impermissibly suggest therapeutic benefits for certain foods or food components. These
22
events could interrupt the marketing and sales of products in our stores, including our private label products, severely damage our brand reputation and public image, increase the cost of products in our stores, result in product recalls or litigation, and impede our ability to deliver merchandise in sufficient quantities or quality to our stores, which could result in a material adverse effect on our business, financial condition, results of operations and cash flows.
Our reputation could also suffer from real or perceived issues involving the labeling or marketing of products we sell as “natural.” Although the FDA and the USDA have each issued statements regarding the appropriate use of the word “natural,” and the FDA has requests for comment now pending on the issue, there is no single, U.S. government-regulated definition of the term “natural” for use in the food industry. The resulting uncertainty has led to consumer confusion, distrust and legal challenges. Plaintiffs have commenced legal actions against a number of food companies and retailers that market “natural” products, asserting false, misleading and deceptive advertising and labeling claims, including claims related to genetically modified ingredients. Should we become subject to similar claims, consumers may avoid purchasing products from us or seek alternatives, even if the basis for the claim is unfounded. Adverse publicity about these matters may discourage consumers from buying our products. The cost of defending against any such claims could be significant. Any loss of confidence on the part of consumers in the truthfulness of our labeling or ingredient claims would be difficult and costly to overcome and may significantly reduce our brand value. Any of these events could adversely affect our reputation and brand and decrease our sales, which would have a material adverse effect on our business, financial condition, results of operations and cash flows.
Organic and GMO Claims. We are also subject to the USDA’s Organic Rule, which facilitates interstate commerce and the marketing of organically produced food, and provides assurance to our customers that such products meet consistent, uniform standards. Compliance with the USDA’s Organic Rule also places a significant burden on some of our suppliers, which may cause a disruption in some of our product offerings. Additionally, the USDA has been directed, through legislation passed in July 2016, to promulgate regulations within two years requiring the disclosure of the presence of genetically modified ingredients in food. While it is uncertain whether USDA will meet the July 2018 statutory deadline, we along with our suppliers, will likely have one to three years to implement promulgating regulations.
FSMA Implementation Costs. FSMA directed an historic shift at FDA from the Agency reacting to and solving problems in the food supply chain to preventing contamination of food before it occurs. FSMA accomplished this goal by overhauling FDA’s current food safety program by requiring all actors in the food supply chain to expand their safety programs and record keeping processes. We predict that FSMA’s continued implementation and FDA’s own development in understanding effective ways to enforce FSMA provisions could delay the supply of certain products or result in certain products being unavailable to us for sale in our stores.
Third-Party Risks. As is common in our industry, we rely on our suppliers and contract manufacturers to ensure that the products they manufacture and sell to us comply with all applicable regulatory and legislative requirements. In general, we seek certifications of compliance, representations and warranties, indemnification and/or insurance from our suppliers and contract manufacturers. However, even with adequate insurance and indemnification, any claims of non-compliance could significantly damage our reputation and consumer confidence in products we sell. In addition, the failure of such products to comply with applicable regulatory and legislative requirements could prevent us from marketing the products or require us to recall or remove such products from our stores. In order to comply with applicable statutes and regulations, our suppliers and contract manufacturers have from time to time reformulated, eliminated or relabeled certain of their products and we have revised certain provisions of our sales and marketing program.
23
We are also subject to laws and regulations more generally applicable to retailers. Compliance with or changes to such laws and regulations may increase our costs, limit or eliminate our ability to sell certain products or otherwise adversely affect our business, reputation, results of operations, financial condition or cash flows.
We are subject to laws and regulations more generally applicable to retailers, including labor and employment, taxation, zoning and land use, environmental protection, workplace safety, public health, community right-to-know and alcoholic beverage sales. Our stores are subject to unscheduled inspections on a regular basis, which, if violations are found, could result in the assessment of fines, suspension of one or more needed licenses and, in the case of repeated “critical” violations, closure of the store until a re-inspection demonstrates that we have remediated the problem. Further, our new store openings could be delayed or prevented or our existing stores could be impacted by difficulties or failures in our ability to obtain or maintain required approvals or licenses. In addition, we are subject to environmental laws pursuant to which we could be held responsible for all of the costs or liabilities relating to any contamination at our or our predecessors’ past or present facilities and at third-party waste disposal sites, regardless of our knowledge of, or responsibility for, such contamination, and such costs may exceed our environmental liability insurance coverage.
As is common in our industry, we rely on our suppliers and contract manufacturers to ensure that the products they manufacture and sell to us comply with all applicable regulatory and legislative requirements. In general, we seek certifications of compliance, representations and warranties, indemnification and/or insurance from our suppliers and contract manufacturers. However, even with adequate insurance and indemnification, any claims of non-compliance could significantly damage our reputation and consumer confidence in our products. In order to comply with applicable statutes and regulations, our suppliers and contract manufacturers have from time to time reformulated, eliminated or relabeled certain of their products and we have revised certain provisions of our sales and marketing program.
We cannot predict the nature of future laws, regulations, interpretations or applications, or determine what effect either additional government regulations or executive or administrative orders, when and if promulgated, or disparate federal, state and local regulatory schemes would have on our business in the future. They could, however, increase our costs; result in our unintended misinterpretation or noncompliance; expose us to litigation; require the reformulation of certain products or alternative sourcing from domestic suppliers or otherwise to meet new standards, regulations or trade restrictions; require the recall or discontinuance of certain products not able to be reformulated or alternatively sourced in compliance with new regulations or restrictions; impose additional recordkeeping; expand documentation of the properties of certain products; necessitate expanded or different labeling and/or scientific substantiation. Any or all of such requirements could have a material adverse effect on our business, financial condition, results of operations and cash flows.
Legal proceedings could materially impact our business, financial condition, results of operations and cash flows.
Our operations, which are characterized by a high volume of customer traffic and by transactions involving a wide variety of product selections, carry a higher exposure to consumer litigation risk when compared to the operations of companies operating in some other industries. Consequently, we may be a party to individual personal injury, product liability, intellectual property, employment-related and other legal actions in the ordinary course of our business, including litigation arising from food-related illness or product labeling. The outcome of litigation, particularly class action lawsuits, is difficult to assess or quantify. Plaintiffs in these types of lawsuits may seek recovery of very large or indeterminate amounts, and the magnitude of the potential loss relating to such lawsuits may remain unknown for substantial periods of time. While we maintain insurance, insurance coverage may not be adequate, and the cost to defend against future litigation may be significant. There may also be adverse publicity associated with litigation that may decrease consumer confidence in our business, regardless of whether the allegations are valid or whether we are ultimately found liable. As a result, litigation may materially adversely affect our business, financial condition, results of operations and cash flows.
24
We may be unable to adequately protect our intellectual property rights, which could harm our business.
We rely on a combination of trademark, trade secret, copyright and domain name law and internal procedures and nondisclosure agreements to protect our intellectual property. In particular, we believe our trademarks, including SPROUTS FARMERS MARKET®, SPROUTS® and HEALTHY LIVING FOR LESS!®, and our domain names, including sprouts.com, are valuable assets. However, there can be no assurance that our intellectual property rights will be sufficient to distinguish our products and services from those of our competitors and to provide us with a competitive advantage. From time to time, third parties may use names and logos similar to ours, may apply to register trademarks or domain names similar to ours, and may infringe or otherwise violate our intellectual property rights. There can be no assurance that our intellectual property rights can be successfully asserted against such third parties or will not be invalidated, circumvented or challenged. Asserting or defending our intellectual property rights could be time consuming and costly and could distract management’s attention and resources. If we are unable to prevent our competitors from using names, logos and domain names similar to ours, consumer confusion could result, the perception of our brand and products could be negatively affected, and our sales and profitability could suffer as a result. We also license the SPROUTS FARMERS MARKETS trademark to a third party for use in operating two grocery stores. If the licensee fails to maintain the quality of the goods and services used in connection with this trademark, our rights to, and the value of, this and similar trademarks could potentially be harmed. Negative publicity relating to the licensee could also be incorrectly associated with us, which could harm the business. Failure to protect our proprietary information could also have a material adverse effect on our business.
We may also be subject to claims that our activities or the products we sell infringe, misappropriate or otherwise violate the intellectual property rights of others. Any such claims can be time consuming and costly to defend and may distract management’s attention and resources, even if the claims are without merit. Such claims may also require us to enter into costly settlement or license agreements (which could, for example, prevent us from using our trademarks in certain geographies or in connection with certain products and services), pay costly damage awards, and face a temporary or permanent injunction prohibiting us from marketing or providing the affected products and services, any of which could have a material adverse effect on our business.
Changes in accounting standards may materially impact reporting of our financial condition and results of operations.
Accounting principles generally accepted in the United States and related accounting pronouncements, implementation guidelines, and interpretations for many aspects of our business, such as accounting for inventories, goodwill and intangible assets, store closures, leases, insurance, income taxes, stock-based compensation and accounting for mergers and acquisitions, are complex and involve subjective judgments. Changes in these rules or their interpretation may necessitate changes to our financial statement presentation and significantly change or add significant volatility to our reported earnings without a comparable underlying change in cash flow from operations. As a result, changes in accounting standards may materially impact our reported financial condition and results of operations.
If we are unable to maintain effective internal control over financial reporting in the future, we may fail to prevent or detect material misstatements in our financial statements, in which case investors may lose confidence in the accuracy and completeness of our financial reports and the market price of our common stock may decline.
As a public company, we are required to maintain internal control over financial reporting. Pursuant to Section 404 of the Sarbanes-Oxley Act, we are required to file a report by management on the effectiveness of our internal control over financial reporting, and our independent registered public accounting firm is required to attest to the effectiveness of our internal control over financial reporting.
25
If we are unable to maintain effective internal control over financial reporting, if we identify any material weaknesses therein, if we are unsuccessful in our efforts to remediate any such material weakness, if our management is unable to report that our internal control over financial reporting is effective when required, or if our independent registered public accounting firm is unable to express an opinion as to the effectiveness of our internal control over financial reporting when required, investors may lose confidence in the accuracy and completeness of our financial reports and the market price of our common stock could be negatively affected. In addition, we could become subject to investigations by the NASDAQ Global Select Market, the SEC, or other regulatory authorities, which could require additional financial and management resources.
If our goodwill or other intangible assets become impaired, we may be required to record a significant charge to earnings.
We have a significant amount of goodwill and other intangible assets. As of December 31, 2017, we had goodwill and intangible assets of approximately $368.1 million and $196.2 million, respectively, which represented approximately 23% and 12% of our total assets as of such date, respectively. Goodwill is reviewed for impairment on an annual basis in the fourth fiscal quarter or whenever events occur or circumstances change that would more likely than not reduce the fair value of our reporting unit below its carrying amount. Fair value is determined based on the discounted cash flows and the market value of our single reporting unit. If the fair value of the reporting unit is less than its carrying value, the fair value of the implied goodwill is calculated as the difference between the fair value of our reporting unit and the fair value of the underlying assets and liabilities, excluding goodwill. In the event an impairment to goodwill is identified, an immediate charge to earnings in an amount equal to the excess of the carrying value over the implied fair value would be recorded, which would adversely affect our operating results. See “Management’s Discussion and Analysis of Financial Condition and Results of Operations—Critical Accounting Estimates—Goodwill and Intangible Assets.”
Determining market values using a discounted cash flow method requires that we make significant estimates and assumptions, including long-term projections of cash flows, market conditions and appropriate market rates. Our judgments are based on historical experience, current market trends and other information. In estimating future cash flows, we rely on internally generated forecasts for operating profits and cash flows, including capital expenditures. Based on our annual impairment test during fiscal 2015, 2016 and 2017, no goodwill impairment charge was required to be recorded. Changes in estimates of future cash flows caused by items such as unforeseen events or changes in market conditions could negatively affect our reporting unit’s fair value and result in an impairment charge. Factors that could cause us to change our estimates of future cash flows include a prolonged economic crisis, successful efforts by our competitors to gain market share in our core markets, our inability to compete effectively with other retailers or our inability to maintain price competitiveness. An impairment of a significant portion of our goodwill could materially adversely affect our financial condition and results of operations.
Our nutrition-oriented educational activities may be impacted by government regulation or our inability to secure adequate liability insurance.
We provide nutrition-oriented education to our customers, and these activities may be subject to state and federal regulation, and oversight by professional organizations. In the past, the FDA has expressed concerns regarding summarized health and nutrition-related information that (i) does not, in the FDA’s view, accurately present such information, (ii) diverts a consumer’s attention and focus from FDA-required nutrition labeling and information or (iii) impermissibly promotes drug-type disease-related benefits. If our team members or third parties we engage to provide this information do not act in accordance with regulatory requirements, we may become subject to penalties that could have a material adverse effect on our business. We believe we are currently in compliance with relevant regulatory requirements. However, we cannot predict the nature of future government regulation and oversight, including the potential impact of any such regulation on this activity. Furthermore, the availability of professional liability insurance or the scope of such coverage may change, or our insurance coverage may prove inadequate, which may adversely impact the ability of our customer educators to provide some information to our customers. The occurrence of any such developments could negatively impact the perception of our brand, our sales and our ability to attract new customers.
26
Our stock price may be volatile, and you may not be able to resell your shares at or above the price you paid for them or at all.
There is no guarantee that our common stock will appreciate in value or even maintain the price at which our stockholders have purchased their shares. The trading price of our common stock may be volatile and subject to wide price fluctuations in response to various factors, many of which are beyond our control, including the following:
|
|
• |
actual or anticipated fluctuations in our quarterly or annual financial results; |
|
|
• |
the financial guidance we may provide to the public, any changes in such guidance, or our failure to meet such guidance; |
|
|
• |
failure of industry or securities analysts to maintain coverage of our company, changes in financial estimates by any industry or securities analysts that follow our company, or our failure to meet such estimates; |
|
|
• |
various market factors or perceived market factors, including rumors, whether or not correct, involving us or our competitors; |
|
|
• |
fluctuations in stock market prices and trading volumes of securities of similar companies; |
|
|
• |
sales, or anticipated sales, of large blocks of our stock; |
|
|
• |
short selling of our common stock by investors; |
|
|
• |
additions or departures of key personnel; |
|
|
• |
new store openings or entry into new markets by us or by our competitors; |
|
|
• |
regulatory or political developments; |
|
|
• |
changes in accounting principles or methodologies; |
|
|
• |
litigation and governmental investigations; |
|
|
• |
acquisitions by us or by our competitors; |
|
|
• |
actions taken by activist shareholders; and |
|
|
• |
general financial market conditions or events. |
Furthermore, the stock markets have experienced extreme price and volume fluctuations that have affected and continue to affect the market prices of equity securities of many companies. These fluctuations often have been unrelated or disproportionate to the operating performance of those companies. These and other factors may cause the market price and demand for our common stock to fluctuate substantially, which may limit or prevent investors from readily selling their shares of common stock and may otherwise negatively affect the price or liquidity of our common stock. In addition, in the past, when the market price of a stock has been volatile, holders of that stock have sometimes instituted securities class action litigation against the company that issued the stock. If any of our stockholders were to bring a lawsuit against us, we could incur substantial costs defending the lawsuit or paying for settlements or damages. Such a lawsuit could also divert the time and attention of our management from our business.
27
Anti-takeover provisions could impair a takeover attempt and adversely affect existing stockholders.
Certain provisions of our certificate of incorporation and bylaws and applicable provisions of Delaware law may have the effect of rendering more difficult, delaying, or preventing an acquisition of our company, even when this would be in the best interest of our stockholders. Our corporate governance documents include the following provisions:
|
|
• |
creating a classified board of directors (referred to as the “Board”) whose members serve staggered three-year terms; |
|
|
• |
authorizing “blank check” preferred stock, which could be issued by our board of directors without stockholder approval and may contain voting, liquidation, dividend, and other rights superior to our common stock; |
|
|
• |
limiting the liability of, and providing indemnification to, our directors and officers; |
|
|
• |
prohibiting our stockholders from acting by written consent, thereby requiring stockholder action to be taken at an annual or special meeting of stockholders; |
|
|
• |
prohibiting our stockholders from calling special meetings of stockholders, which may delay the ability of our stockholders to force consideration of a proposal or the ability of holders controlling a majority of our capital stock to take any action, including the removal of directors; |
|
|
• |
requiring advance notice of stockholder proposals for business to be conducted at meetings of our stockholders and for nominations of candidates for election to our board of directors; |
|
|
• |
controlling the procedures for the conduct and scheduling of board and stockholder meetings; |
|
|
• |
providing the board of directors with the express power to postpone previously scheduled annual meetings and to cancel previously scheduled special meetings; |
|
|
• |
permitting newly created directorships resulting from an increase in the authorized number of directors or vacancies on our board of directors to be filled only by a majority of our remaining directors, even if less than a quorum is then in office, or by a sole remaining director; and |
|
|
• |
providing that our board of directors is expressly authorized to make, repeal, alter, or amend our bylaws. |
In addition, Delaware law imposes conditions on the voting of “control shares” and on certain business combination transactions with “interested stockholders.”
These provisions, alone or together, could delay or prevent hostile takeovers and changes in control or changes in our management. Any provision of our certificate of incorporation or bylaws or Delaware law that has the effect of delaying or deterring a change in control could limit the opportunity for our stockholders to receive a premium for their shares of our common stock, and could also affect the price that some investors are willing to pay for our common stock.
If securities or industry analysts cease publishing research or reports about us, our business, or our market, or if they adversely change their recommendations regarding our stock, our stock price and trading volume could decline.
The trading market for our common stock is influenced by the research and reports that industry or securities analysts may publish about us, our business, our market or our competitors. If we do not maintain adequate research coverage, or if any of the analysts who may cover us downgrade our stock or publish inaccurate or unfavorable research about our business or provide relatively more favorable recommendations about our competitors, our stock price could decline. If any analyst who may cover us were to cease coverage of our company or fail to regularly publish reports on us, we could lose visibility in the financial markets, which in turn could cause our stock price or trading volume to decline.
28
Since we do not expect to pay any cash dividends for the foreseeable future, investors may be forced to sell their stock in order to obtain a return on their investment.
We do not anticipate declaring or paying in the foreseeable future any cash dividends on our capital stock. Instead, we plan to retain any earnings to finance our operations and growth plans. In addition, our Credit Facility contains covenants that would restrict our ability to pay cash dividends. Accordingly, investors must rely on sales of their common stock after price appreciation, which may never occur, as the only way to realize any return on their investment. As a result, investors seeking cash dividends should not purchase our common stock.
Our business could be impacted as a result of actions by activist shareholders or others.
We may be subject, from time to time, to legal and business challenges in the operation of our company due to actions instituted by activist shareholders or others. Responding to such actions, which may include private engagement, publicity campaigns, proxy contests, efforts to force transactions not supported by our board of directors, and litigation, could be costly and time-consuming, may not align with our strategic plan and could divert the time and attention of our board of directors and management from our business. Perceived uncertainties as to our future direction as a result of shareholder activism may lead to the perception of a change in the direction of the business or other instability and may affect our stock price, relationships with vendors, customers, prospective and current team members and others.
None.
As of December 31, 2017, we had 285 stores located in fifteen states, as shown in the chart below:
|
State |
|
Number of Stores |
|
|
State |
|
Number of Stores |
|
||
|
Alabama |
|
|
4 |
|
|
Nevada |
|
|
8 |
|
|
Arizona |
|
|
34 |
|
|
New Mexico |
|
|
7 |
|
|
California |
|
|
108 |
|
|
North Carolina |
|
|
1 |
|
|
Colorado |
|
|
32 |
|
|
Oklahoma |
|
|
10 |
|
|
Florida |
|
|
4 |
|
|
Tennessee |
|
|
6 |
|
|
Georgia |
|
|
16 |
|
|
Texas |
|
|
42 |
|
|
Kansas |
|
|
5 |
|
|
Utah |
|
|
5 |
|
|
Missouri |
|
|
3 |
|
|
|
|
|
|
|
In fiscal 2017, we opened 32 new stores, and in fiscal 2016 we opened 36 new stores. As of February 20, 2018, we have opened four stores in fiscal 2018, bringing our total store count to 289.
We lease all of our stores from unaffiliated third parties. A typical store lease is for an initial 10 to 15 year term with four renewal options of five years each. We expect that we will be able to renegotiate these leases or relocate these stores as necessary. In addition to new store openings, we remodel or relocate stores periodically in order to improve performance. In fiscal 2017, we remodeled nine stores and in fiscal 2018, we plan to remodel approximately 13 stores.
29
As of December 31, 2017, we leased our two distribution warehouses, as well as our current corporate office in Phoenix, Arizona, from unaffiliated third parties. Information about such facilities is set forth in the table below:
|
Facility |
|
State |
|
Square Footage* |
|
|
|
Corporate Office |
|
Arizona |
|
|
71,000 |
|
|
Distribution Warehouse |
|
Arizona |
|
|
106,000 |
|
|
Distribution Warehouse |
|
Texas |
|
|
117,000 |
|
|
* |
Rounded to the nearest 1,000 square feet |
We believe our portfolio of long-term leases is a valuable asset supporting our retail operations, but we do not believe that any individual store property is material to our financial condition or results of operations.
From time to time we are a party to legal proceedings, including matters involving personnel and employment issues, product liability, personal injury, intellectual property and other proceedings arising in the ordinary course of business, which have not resulted in any material losses to date. Although management does not expect that the outcome in these proceedings will have a material adverse effect on our financial condition or results of operations, litigation is inherently unpredictable. Therefore, we could incur judgments or enter into settlements of claims that could materially impact our results.
Securities Action
On March 4, 2016, a complaint was filed in the Superior Court for the State of Arizona against our company and certain of our directors and officers on behalf of a purported class of purchasers of shares of our common stock in our underwritten secondary public offering which closed on March 10, 2015 (the “March 2015 Offering”). The complaint purports to state claims under Sections 11, 12 and 15 of the Securities Act of 1933, as amended, based on an alleged failure by our company to disclose adequate information about produce price deflation in the March 2015 Offering documents. The complaint seeks damages on behalf of the purported class in an unspecified amount, rescission, and an award of reasonable costs and attorneys’ fees. After removal to federal court, the plaintiff sought remand, which the court granted in March 2017. Our company has appealed the order granting remand to the Ninth Circuit Court of Appeals. On May 25, 2017, our company filed a Motion to Dismiss in the Superior Court for the State of Arizona, which the court granted in part and denied in part by order entered August 30, 2017. Our company answered the complaint on September 28, 2017. Our company will continue to defend this case vigorously, but it is not possible at this time to reasonably estimate the outcome of, or any potential liability from, the case.
“Phishing” Scam Actions
In April 2016, four complaints were filed, two in the federal courts of California, one in the Superior Court of California and one in the federal court in the District of Colorado, each on behalf of a purported class of our current and former team members whose personally identifiable information (referred to as “PII”) was inadvertently disclosed to an unauthorized third party that perpetrated an email “phishing” scam against one of our team members. The complaints allege we failed to properly safeguard the PII in accordance with applicable law. The complaints seek damages on behalf of the purported class in unspecified amounts, attorneys’ fees and litigation expenses. In June 2016, a motion was filed before the Judicial Panel on Multidistrict Litigation (referred to as “JPML”) to transfer and consolidate all four of the cases to the federal court in the District of Arizona. The JPML granted the motion on October 6, 2016. On May 24, 2017, the JPML granted our motion to stay proceedings in the case pending a U.S. Supreme Court ruling which is likely to be dispositive on the question of whether the arbitration agreements signed by each of the named plaintiffs are enforceable; oral argument in this case was heard by the U.S.
30
Supreme Court on October 2, 2017, and we do not expect a decision from the U.S. Supreme Court until Spring 2018. We will continue to defend these cases vigorously, but it is not possible at this time to reasonably estimate the outcome of, or any potential liability from, the cases.
Not applicable.
31
|
Item 5. |
Market for Registrant’s Common Equity, Related Stockholder Matters and Issuer Purchases of Equity Securities |
Market Information
Our common stock began trading on the NASDAQ Global Select Market under the symbol “SFM” on August 1, 2013. The price range per share of common stock presented below represents the highest and lowest closing prices for our common stock on the NASDAQ Global Select Market for each full quarterly period for fiscal years 2016 and 2017.
|
|
|
High |
|
|
Low |
|
||
|
2016 |
|
|
|
|
|
|
|
|
|
First quarter |
|
$ |
30.00 |
|
|
$ |
21.18 |
|
|
Second quarter |
|
$ |
29.37 |
|
|
$ |
21.10 |
|
|
Third quarter |
|
$ |
24.52 |
|
|
$ |
18.70 |
|
|
Fourth quarter |
|
$ |
22.63 |
|
|
$ |
18.88 |
|
|
|
|
High |
|
|
Low |
|
||
|
2017 |
|
|
|
|
|
|
|
|
|
First quarter |
|
$ |
23.67 |
|
|
$ |
17.38 |
|
|
Second quarter |
|
$ |
25.98 |
|
|
$ |
19.30 |
|
|
Third quarter |
|
$ |
24.92 |
|
|
$ |
18.48 |
|
|
Fourth quarter |
|
$ |
25.00 |
|
|
$ |
17.55 |
|
The closing price of our common stock as of February 20, 2018 was $26.00 per share, and the number of stockholders of record of our common stock as of February 20, 2018 was 40. This number excludes stockholders whose stock is held in nominee or street name by brokers.
Dividend Policy
Since we became a publicly traded company on August 1, 2013, we have not declared or paid, and do not anticipate declaring or paying in the foreseeable future, any cash dividends on our capital stock. Any future determination as to the declaration and payment of dividends, if any, will be at the discretion of our board of directors and will depend on then existing conditions, including our operating results, financial condition, contractual restrictions, capital requirements, business prospects, and other factors our board of directors may deem relevant. Our Credit Facility contains covenants that would restrict our ability to pay cash dividends.
32
Issuer Purchases of Equity Securities
The following tables provide information about our share repurchase activity for each share repurchase program.
2016 Common Stock Share Repurchase Program
|
Period (1) |
|
Total number of shares purchased |
|
|
Average price paid per share |
|
|
Total number of shares purchased as part of publicly announced plans or programs (2) |
|
|
Approximate dollar value of shares that may yet be purchased under the plans or programs (2) |
|
||||
|
2016 |
|
|
|
|
|
|
|
|
|
|
|
|
|
|
|
|
|
Third quarter |
|
|
3,189,818 |
|
|
$ |
19.93 |
|
|
|
3,189,818 |
|
|
$ |
186,428,090 |
|
|
Fourth quarter |
|
|
5,072,973 |
|
|
$ |
20.98 |
|
|
|
5,072,973 |
|
|
$ |
80,000,000 |
|
|
2017 |
|
|
|
|
|
|
|
|
|
|
|
|
|
|
|
|
|
First quarter |
|
|
4,099,936 |
|
|
$ |
19.51 |
|
|
|
4,099,936 |
|
|
$ |
- |
|
|
Total |
|
|
12,362,727 |
|
|
$ |
20.22 |
|
|
|
12,362,727 |
|
|
$ |
- |
|
2017 Common Stock Share Repurchase Program
|
Period (3) |
|
Total number of shares purchased |
|
|
Average price paid per share |
|
|
Total number of shares purchased as part of publicly announced plans or programs (4) |
|
|
Approximate dollar value of shares that may yet be purchased under the plans or programs (4) |
|
||||
|
2017 |
|
|
|
|
|
|
|
|
|
|
|
|
|
|
|
|
|
Second quarter |
|
|
1,787,328 |
|
|
$ |
22.38 |
|
|
|
1,787,328 |
|
|
$ |
210,000,000 |
|
|
Third quarter |
|
|
3,249,204 |
|
|
$ |
22.16 |
|
|
|
3,249,204 |
|
|
$ |
138,000,000 |
|
|
Fourth quarter |
|
|
560,351 |
|
|
$ |
20.33 |
|
|
|
560,351 |
|
|
$ |
126,600,000 |
|
|
Total |
|
|
5,596,883 |
|
|
$ |
22.05 |
|
|
|
5,596,883 |
|
|
|
|
|
Share repurchase activity during the fourth fiscal quarter of 2017 was as follows:
|
Period (5) |
|
Total number of shares purchased |
|
|
Average price paid per share |
|
|
Total number of shares purchased as part of publicly announced plans or programs (4) |
|
|
Approximate dollar value of shares that may yet be purchased under the plans or programs (4) |
|
||||
|
Oct. 2, 2017 - Oct. 29, 2017 |
|
|
— |
|
|
|
— |
|
|
|
— |
|
|
$ |
138,000,000 |
|
|
Oct. 30, 2017 - Nov. 26, 2017 |
|
|
560,351 |
|
|
$ |
20.33 |
|
|
|
560,351 |
|
|
$ |
126,600,000 |
|
|
Nov. 27, 2017 - Dec. 31, 2017 |
|
|
— |
|
|
|
— |
|
|
|
— |
|
|
$ |
126,600,000 |
|
|
Total |
|
|
560,351 |
|
|
$ |
20.33 |
|
|
|
560,351 |
|
|
|
|
|
|
(1) |
Periodic information is presented by reference to our quarterly periods during fiscal years 2016 and 2017. |
|
(2) |
On September 6, 2016, our board of directors authorized a $250 million share repurchase program of our common stock. The shares may be purchased on a discretionary basis from time to time through December 31, 2017, subject to general business and market conditions and other investment opportunities, through open market purchases, privately negotiated transactions, or other means, including through Rule 10b5-1 trading plans. |
|
(3) |
Periodic information is presented by reference to our quarterly periods during fiscal year 2017. |
33
|
(5) |
Periodic information is presented by reference to our fiscal periods during the fourth quarter of 2017. |
Subsequent to the end of the year and through February 20, 2018, the Company has repurchased 1.2 million shares of common stock for a total investment of $30 million. On February 20, 2018, the Company’s board of directors authorized a new $350 million share repurchase program for its common stock, for an aggregate authorization of $447 million. The shares may be purchased on a discretionary basis from time to time through December 31, 2019, subject to general business and market conditions and other investment opportunities, through open market purchases, privately negotiated transactions, or other means, including through Rule 10b5-1 trading plans.
34
The graph set forth below compares the cumulative total stockholder return on our common stock between August 1, 2013 (the date our stock began trading on the Nasdaq Global Select Market) and December 31, 2017, with the cumulative total return of (i) the Nasdaq Composite Index and (ii) the S&P Food Retail Index, over the same period.
The comparison assumes that $100.00 was invested in our common stock, the Nasdaq Composite Index and the S&P Food Retail Index, and assumes reinvestment of dividends, if any. The graph assumes the initial value of our common stock on August 1, 2013 was the closing sale price on that day of $40.11 per share and not the initial offering price to the public of $18.00 per share. The performance shown on the graph below is based on historical results and is not intended to suggest future performance.
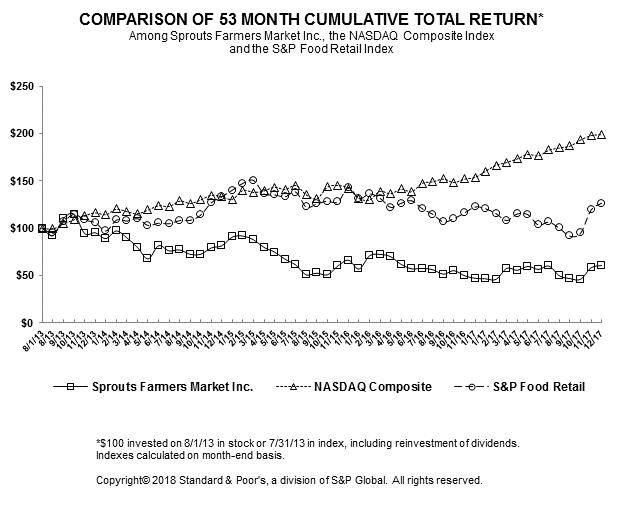
This performance graph shall not be deemed “soliciting material” or to be “filed” with the SEC for purposes of Section 18 of the Exchange Act or otherwise subject to the liabilities under that section, and shall not be deemed to be incorporated by reference into any filing of Sprouts Farmers Market, Inc. under the Securities Act or the Exchange Act.
35
|
|
|
Fiscal 2017(5) |
|
|
Fiscal 2016(4) |
|
|
Fiscal 2015(3) |
|
|
Fiscal 2014(2) |
|
|
Fiscal 2013(1) |
|
|||||
|
|
|
(dollars in thousands, except per share data) |
|
|||||||||||||||||
|
Statements of Income Data: |
|
|
|
|
|
|
|
|
|
|
|
|
|
|
|
|
|
|
|
|
|
Net sales |
|
$ |
4,664,612 |
|
|
$ |
4,046,385 |
|
|
$ |
3,593,031 |
|
|
$ |
2,967,424 |
|
|
$ |
2,437,911 |
|
|
Cost of sales, buying and occupancy |
|
|
3,314,487 |
|
|
|
2,864,379 |
|
|
|
2,541,403 |
|
|
|
2,082,221 |
|
|
|
1,712,644 |
|
|
Gross profit |
|
|
1,350,125 |
|
|
|
1,182,006 |
|
|
|
1,051,628 |
|
|
|
885,203 |
|
|
|
725,267 |
|
|
Direct store expenses |
|
|
962,894 |
|
|
|
828,943 |
|
|
|
706,044 |
|
|
|
581,621 |
|
|
|
496,183 |
|
|
Selling, general and administrative expenses |
|
|
148,408 |
|
|
|
126,929 |
|
|
|
106,412 |
|
|
|
95,397 |
|
|
|
81,795 |
|
|
Store pre-opening costs |
|
|
11,627 |
|
|
|
12,974 |
|
|
|
8,616 |
|
|
|
7,749 |
|
|
|
5,734 |
|
|
Store closure and other costs |
|
|
1,126 |
|
|
|
228 |
|
|
|
1,802 |
|
|
|
725 |
|
|
|
2,051 |
|
|
Income from operations |
|
|
226,070 |
|
|
|
212,932 |
|
|
|
228,754 |
|
|
|
199,711 |
|
|
|
139,504 |
|
|
Interest expense |
|
|
(21,177 |
) |
|
|
(14,794 |
) |
|
|
(17,723 |
) |
|
|
(25,063 |
) |
|
|
(37,203 |
) |
|
Other income |
|
|
625 |
|
|
|
454 |
|
|
|
443 |
|
|
|
596 |
|
|
|
487 |
|
|
Loss on extinguishment of debt |
|
|
— |
|
|
|
— |
|
|
|
(5,481 |
) |
|
|
(1,138 |
) |
|
|
(18,721 |
) |
|
Income before income taxes |
|
|
205,518 |
|
|
|
198,592 |
|
|
|
205,993 |
|
|
|
174,106 |
|
|
|
84,067 |
|
|
Income tax provision(7) |
|
|
(47,078 |
) |
|
|
(74,286 |
) |
|
|
(77,002 |
) |
|
|
(66,414 |
) |
|
|
(32,741 |
) |
|
Net income |
|
$ |
158,440 |
|
|
$ |
124,306 |
|
|
$ |
128,991 |
|
|
$ |
107,692 |
|
|
$ |
51,326 |
|
|
Per Share Data: |
|
|
|
|
|
|
|
|
|
|
|
|
|
|
|
|
|
|
|
|
|
Net income per share—basic |
|
$ |
1.17 |
|
|
$ |
0.84 |
|
|
$ |
0.84 |
|
|
$ |
0.72 |
|
|
$ |
0.38 |
|
|
Net income per share—diluted |
|
$ |
1.15 |
|
|
$ |
0.83 |
|
|
$ |
0.83 |
|
|
$ |
0.70 |
|
|
$ |
0.37 |
|
|
Weighted average shares outstanding— basic |
|
|
135,169 |
|
|
|
147,311 |
|
|
|
153,099 |
|
|
|
149,751 |
|
|
|
134,622 |
|
|
Weighted average shares outstanding— diluted |
|
|
137,884 |
|
|
|
149,653 |
|
|
|
155,877 |
|
|
|
154,328 |
|
|
|
139,765 |
|
|
|
|
Fiscal 2017 |
|
|
Fiscal 2016 |
|
|
Fiscal 2015 |
|
|
Fiscal 2014 (2) |
|
|
Fiscal 2013(1) |
|
|||||
|
Comparable store sales growth |
|
|
2.9 |
% |
|
|
2.7 |
% |
|
|
5.8 |
% |
|
|
9.9 |
% |
|
|
10.7 |
% |
|
Stores at end of period |
|
|
285 |
|
|
|
253 |
|
|
|
217 |
|
|
|
191 |
|
|
|
167 |
|
|
Other Operating Data: |
|
|
|
|
|
|
|
|
|
|
|
|
|
|
|
|
|
|
|
|
|
Stores at beginning of period |
|
|
253 |
|
|
|
217 |
|
|
|
191 |
|
|
|
167 |
|
|
|
148 |
|
|
Opened |
|
|
32 |
|
|
|
36 |
|
|
|
27 |
|
|
|
24 |
|
|
|
19 |
|
|
Closed |
|
|
— |
|
|
|
— |
|
|
|
(1 |
) |
|
|
— |
|
|
|
— |
|
|
Stores at end of period(6) |
|
|
285 |
|
|
|
253 |
|
|
|
217 |
|
|
|
191 |
|
|
|
167 |
|
|
Gross square feet at end of period |
|
|
8,054,720 |
|
|
|
7,070,248 |
|
|
|
5,976,780 |
|
|
|
5,252,851 |
|
|
|
4,582,743 |
|
|
Average store size at end of period (gross square feet) |
|
|
28,262 |
|
|
|
27,946 |
|
|
|
27,572 |
|
|
|
27,502 |
|
|
|
27,442 |
|
36
|
|
|
As of |
|
|||||||||||||||||
|
|
|
December 31, 2017 |
|
|
January 1, 2017 |
|
|
January 3, 2016 |
|
|
December 28, 2014 |
|
|
December 29, 2013(1) |
|
|||||
|
Balance Sheet Data |
|
|
|
|
|
|
|
|
|
|
|
|
|
|
|
|
|
|
|
|
|
Cash and cash equivalents |
|
$ |
19,479 |
|
|
$ |
12,465 |
|
|
$ |
136,069 |
|
|
$ |
130,513 |
|
|
$ |
77,652 |
|
|
Total assets |
|
|
1,581,603 |
|
|
|
1,439,893 |
|
|
|
1,426,364 |
|
|
|
1,368,407 |
|
|
|
1,171,450 |
|
|
Total capital and finance lease obligations, including current portion |
|
|
134,727 |
|
|
|
129,736 |
|
|
|
130,472 |
|
|
|
150,698 |
|
|
|
119,572 |
|
|
Total long-term debt, including current portion |
|
|
348,000 |
|
|
|
255,000 |
|
|
|
160,000 |
|
|
|
255,691 |
|
|
|
310,286 |
|
|
Total stockholders’ equity |
|
|
650,694 |
|
|
|
672,909 |
|
|
|
822,992 |
|
|
|
685,389 |
|
|
|
513,771 |
|
|
(1) |
Fiscal 2013 selling, general and administrative expense included $3.2 million for IPO related bonuses and $2.0 million for expenses related to our November 2013 secondary offering. Fiscal 2013 includes 52 weeks. |
|
(2) |
Fiscal 2014 selling, general and administrative expense included $2.6 million for expenses related to our April 2014 secondary offering and our August 2014 secondary offering. Fiscal 2014 includes 52 weeks. |
|
(3) |
Fiscal 2015 includes 53 weeks. |
|
(4) |
Fiscal 2016 includes 52 weeks. |
|
(5) |
Fiscal 2017 includes 52 weeks. |
|
(6) |
During each of fiscal 2014 and 2016, we also relocated one store. |
|
(7) |
Fiscal 2017 income tax provision included an $18.7 million benefit related to the implementation of the Tax Cuts and Jobs Act in the fourth quarter and a $9.9 million benefit related to the implementation of ASU 2016-09 “Compensation – Stock Compensation, effective January 2, 2017.” |
37
You should read the following discussion and analysis of our financial condition and results of operations together with the consolidated financial statements and related notes that are included elsewhere in this Annual Report on Form 10-K. This discussion contains forward-looking statements based upon current expectations that involve risks and uncertainties. Our actual results may differ materially from those anticipated in these forward-looking statements as a result of various factors, including those set forth under “Risk Factors” or in other parts of this Annual Report on Form 10-K. Please also see the section entitled “Special Note Regarding Forward-Looking Statements.”
Business Overview
Sprouts Farmers Market operates as a healthy grocery store that specializes in fresh, natural and organic products at prices that appeal to everyday grocery shoppers. Based on the belief that healthy food should be affordable, Sprouts’ welcoming environment and knowledgeable team members continue to drive its growth. Sprouts offers a complete shopping experience that includes an array of fresh produce in the heart of the store, a deli with prepared entrees and side dishes, The Butcher Shop, The Fish Market, an expansive vitamins and supplements department and more. Since our founding in 2002, we have grown rapidly, significantly increasing our sales, store count and profitability. With 285 stores in 15 states as of December 31, 2017, we are one of the largest specialty retailers of fresh, natural and organic food in the United States. As of February 20, 2018, we have grown to 289 stores in 15 states.
At Sprouts, we believe healthy living is a journey and every meal is a choice. The cornerstones of our business are fresh, natural and organic products at compelling prices (which we refer to as “Healthy Living for Less”), an attractive and differentiated shopping experience featuring a broad selection of innovative healthy products, and knowledgeable team members who we believe provide best-in-class customer engagement and product education.
Our Heritage
In 2002, we opened the first Sprouts Farmers Market store in Chandler, Arizona. From our founding in 2002 through December 31, 2017, we continued to open new stores while successfully rebranding 43 Henry’s Farmers Market and 39 Sunflower Farmers Market stores added in 2011 and 2012, respectively, through acquisitions to the Sprouts banner. These three businesses all trace their lineage back to Henry’s Farmers Market and were built with similar store formats and operations including a strong emphasis on value, produce and service in smaller, convenient locations. The consistency of these formats and operations was an important factor that allowed us to rapidly and successfully rebrand and integrate each of these businesses under the Sprouts banner and on a common platform.
Outlook
We are pursuing a number of strategies designed to continue our growth, including expansion of our store base, continuing positive comparable store sales and growing the Sprouts brand. We intend to continue expanding our store base by pursuing new store openings in our existing markets, expanding into adjacent markets and penetrating new markets. Although we plan to expand our store base primarily through new store openings, we may grow through strategic acquisitions if we identify suitable targets and are able to negotiate acceptable terms and conditions for acquisition. We intend to open 30 new stores in 2018, of which four have opened through February 20, 2018, and approximately 30 new stores per year for the near term.
38
We also believe we can continue to deliver positive comparable store sales growth by enhancing our core value proposition and distinctive customer-oriented shopping experience, as well as through expanding and refining our fresh, natural and organic product offerings, our targeted and personalized marketing efforts and our in-store and digital customer engagement. We are committed to growing the Sprouts brand by supporting our stores, product offerings and corporate partnerships, including the expansion of innovative marketing and promotional strategies through print, digital and social media platforms.
Components of Operating Results
We report our results of operations on a 52- or 53-week fiscal year ending on the Sunday closest to December 31, with each fiscal quarter generally divided into three periods consisting of two four-week periods and one five-week period. Fiscal 2017 was a 52-week year ending on December 31, 2017. Fiscal 2016 was a 52-week year ending on January 1, 2017 and fiscal 2015 was a 53-week year ending on January 3, 2016. In the discussion below, we discuss the impact of the 53rd week of fiscal 2015 on our financial results.
Net Sales
We recognize sales revenue at the point of sale, with discounts provided to customers reflected as a reduction in sales revenue. Proceeds from sales of gift cards are recorded as a liability at the time of sale, and recognized as sales when they are redeemed by the customer. In 2015, we determined that we had sufficient data to estimate gift card breakage. We do not include sales taxes in net sales.
We monitor our comparable store sales growth to evaluate and identify trends in our sales performance. Our practice is to include sales from a store in comparable store sales beginning on the first day of the 61st week following the store’s opening and to exclude sales from a closed store from comparable store sales on the day of closure. This practice may differ from the methods that other retailers use to calculate similar measures. We use comparable store sales to calculate pro forma comparable store sales growth, when applicable.
Our net sales have increased as a result of new store openings and comparable store sales growth. Factors that influence comparable store sales growth and other sales trends include:
|
|
• |
general economic conditions and trends, including levels of disposable income and consumer confidence; |
|
|
• |
product price inflation or deflation; |
|
|
• |
our competition, including competitive store openings in the vicinity of our stores and competitor pricing and merchandising strategies; |
|
|
• |
consumer preferences and buying trends; |
|
|
• |
our ability to identify market trends, and to source and provide product offerings that promote customer traffic and growth in average ticket; |
|
|
• |
the number of customer transactions and average ticket; |
|
|
• |
the prices of our products, including the effects of inflation and deflation; |
|
|
• |
opening new stores in the vicinity of our existing stores; and |
|
|
• |
advertising, in-store merchandising and other marketing activities. |
39
Cost of sales, buying and occupancy and gross profit
Cost of sales includes the cost of inventory sold during the period, including direct costs of purchased merchandise (net of discounts and allowances), distribution and supply chain costs, buying costs and supplies. Merchandise incentives received from vendors are reflected in the carrying value of inventory when earned or as progress is made toward earning the rebate or allowance, and are reflected as a component of cost of sales as the inventory is sold. Inflation and deflation in the prices of food and other products we sell may periodically affect our gross profit and gross margin. The short-term impact of inflation and deflation is largely dependent on whether or not we pass the effects through to our customers, which will depend upon competitive market conditions.
Occupancy costs include store rental, property taxes, utilities, common area maintenance, amortization of favorable and unfavorable leasehold interests and property insurance. Occupancy costs do not include building depreciation, which is classified as a direct store expense.
Our cost of sales, buying and occupancy and gross profit are correlated to sales volumes. As sales increase, gross margin is affected by the relative mix of products sold, pricing strategies, inventory shrinkage and improved leverage of fixed costs of sales, buying and occupancy.
Direct store expenses
Direct store expenses consist of store-level expenses such as salaries and benefits, related equity-based compensation, supplies, depreciation and amortization for buildings, store leasehold improvements, equipment and other store specific costs. As sales increase, direct store expenses generally decline as a percentage of sales.
Selling, general and administrative expenses
Selling, general and administrative expenses primarily consist of salaries and benefits costs, equity-based compensation, advertising, acquisition-related costs and corporate overhead.
We charge third-parties to place advertisements in our in-store guide and circulars. We record consideration received from vendors in connection with cooperative advertising programs as a reduction to advertising costs when the allowance represents reimbursement of a specific and identifiable cost. Advertising costs are expensed as incurred.
Store pre-opening costs
Store pre-opening costs include rent expense during construction of new stores and costs related to new store openings, including costs associated with hiring and training personnel and other miscellaneous costs. Store pre-opening costs are expensed as incurred.
Store closure and other costs
We recognize a reserve for future operating lease payments associated with facilities that are no longer being utilized in our current operations. The reserve is recorded based on the present value of the remaining non-cancelable lease payments after the cease use date less an estimate of subtenant income. If subtenant income is expected to be higher than the lease payments, no accrual is recorded. Lease payments included in the closed store reserve are expected to be paid over the remaining terms of the respective leases. Our assumptions about subtenant income are based on our experience and knowledge of the area in which the closed property is located, guidance received from local brokers and agents and existing economic conditions. Adjustments to the closed store reserve relate primarily to changes in actual or estimated subtenant income and changes in actual lease payments from original estimates. Adjustments are made for changes in estimates in the period in which the change becomes known, considering timing of new information regarding market, subleases or other lease updates. Changes in closed store reserve estimates are classified as store closure and other costs in the consolidated statements of operations. See Note 16, “Closed Store Reserves” for additional information.
40
Factors Affecting Comparability of Results of Operations
Additional Week in 2015
Fiscal 2015 consisted of 53 weeks. The 53rd week resulted in additional sales and expenses as further discussed in “—Comparison of Fiscal 2016 to Fiscal 2015” below.
April 2015 Refinancing
In April 2015, we completed a transaction in which we refinanced our debt (referred to as the “April 2015 Refinancing”), as further discussed in “—Liquidity and Capital Resources” below. The April 2015 Refinancing resulted in decrease in borrowings, a reduction in interest rate and the recording of a loss on extinguishment of debt.
Adoption of ASU No. 2016-09, “Compensation – Stock Compensation (Topic 718)”
As a result of the adoption, we recognized excess tax benefits related to the exercise of stock options in our income tax provision during fiscal 2017 (see Note 17, “Income Taxes”). Prior to the adoption, these items were recorded in Additional Paid-in Capital. During 2017, excess tax benefits were classified as an operating activity in the consolidated statement of cash flows, along with other income tax cash flows. Prior to adoption, excess tax benefits were classified as a financing activity. We have made a policy election to account for forfeitures as they occur. This election was adopted using a modified retrospective approach resulting in no cumulative effect on retained earnings at the beginning of the period. Prior to the adoption, forfeitures were accounted for using an estimated forfeiture rate (see Note 3, “Significant Accounting Policies”).
2017 Tax Cuts and Jobs Act
On December 22, 2017, the legislation commonly referred to as the Tax Cuts and Jobs Act (the “Tax Act”) was enacted into law, which changes various corporate income tax provisions within the existing Internal Revenue Code. Substantially all the provisions of the Tax Act are effective for taxable years beginning after December 31, 2017. The most significant changes that impact the Company are the reduction in the corporate federal income tax rate from 35% to 21% and 100% bonus depreciation for qualified property acquired and placed in service after September 27, 2017 and before January 1, 2023. In a manner consistent with ASC 740-10-25-47, the effect of a change in tax law or rates shall be recognized at the date of enactment, accordingly, the Company accounted for the corporate federal income tax rate reduction in the fourth quarter of 2017 (see Note 17, “Income Taxes”).
41
Results of Operations for Fiscal 2017, 2016 and 2015
The following tables set forth our results of operations and other operating data for the periods presented. The period-to-period comparison of financial results is not necessarily indicative of financial results to be achieved in future periods. Fiscal 2015 consisted of 53 weeks, while each of fiscal 2017 and fiscal 2016 consisted of 52 weeks.
|
|
|
Fiscal 2017 |
|
|
Fiscal 2016 |
|
|
Fiscal 2015 |
|
|||
|
|
|
(in thousands, except per share data) |
|
|||||||||
|
Consolidated Statement of Income Data: |
|
|
|
|
|
|
|
|
|
|
|
|
|
Net sales |
|
$ |
4,664,612 |
|
|
$ |
4,046,385 |
|
|
$ |
3,593,031 |
|
|
Cost of sales, buying and occupancy |
|
|
3,314,487 |
|
|
|
2,864,379 |
|
|
|
2,541,403 |
|
|
Gross profit |
|
|
1,350,125 |
|
|
|
1,182,006 |
|
|
|
1,051,628 |
|
|
Direct store expenses |
|
|
962,894 |
|
|
|
828,943 |
|
|
|
706,044 |
|
|
Selling, general and administrative expenses |
|
|
148,408 |
|
|
|
126,929 |
|
|
|
106,412 |
|
|
Store pre-opening costs |
|
|
11,627 |
|
|
|
12,974 |
|
|
|
8,616 |
|
|
Store closure and other costs |
|
|
1,126 |
|
|
|
228 |
|
|
|
1,802 |
|
|
Income from operations |
|
|
226,070 |
|
|
|
212,932 |
|
|
|
228,754 |
|
|
Interest expense |
|
|
(21,177 |
) |
|
|
(14,794 |
) |
|
|
(17,723 |
) |
|
Other income |
|
|
625 |
|
|
|
454 |
|
|
|
443 |
|
|
Loss on extinguishment of debt |
|
|
— |
|
|
|
— |
|
|
|
(5,481 |
) |
|
Income before income taxes |
|
|
205,518 |
|
|
|
198,592 |
|
|
|
205,993 |
|
|
Income tax provision |
|
|
(47,078 |
) |
|
|
(74,286 |
) |
|
|
(77,002 |
) |
|
Net income |
|
$ |
158,440 |
|
|
$ |
124,306 |
|
|
$ |
128,991 |
|
|
|
|
|
|
|
|
|
|
|
|
|
|
|
|
Weighted average shares outstanding |
|
|
135,169 |
|
|
|
147,311 |
|
|
|
153,099 |
|
|
Dilutive effect of equity-based awards |
|
|
2,715 |
|
|
|
2,342 |
|
|
|
2,778 |
|
|
Weighted average shares and equivalent shares outstanding |
|
|
137,884 |
|
|
|
149,653 |
|
|
|
155,877 |
|
|
Diluted net income per share |
|
$ |
1.15 |
|
|
$ |
0.83 |
|
|
$ |
0.83 |
|
|
|
|
Fiscal 2017 |
|
|
Fiscal 2016 |
|
|
Fiscal 2015 |
|
|||
|
Other Operating Data: |
|
|
|
|
|
|
|
|
|
|
|
|
|
Comparable store sales growth |
|
|
2.9 |
% |
|
|
2.7 |
% |
|
|
5.8 |
% |
|
Stores at beginning of period |
|
|
253 |
|
|
|
217 |
|
|
|
191 |
|
|
Opened |
|
|
32 |
|
|
|
36 |
|
|
|
27 |
|
|
Closed |
|
|
— |
|
|
|
— |
|
|
|
(1 |
) |
|
Stores at end of period |
|
|
285 |
|
|
|
253 |
|
|
|
217 |
|
42
Comparison of Fiscal 2017 to Fiscal 2016
Net sales
|
|
|
Fiscal 2017 |
|
|
Fiscal 2016 |
|
|
Change |
|
|
% Change |
|
||||
|
|
|
(dollars in thousands) |
|
|||||||||||||
|
Net sales |
|
$ |
4,664,612 |
|
|
$ |
4,046,385 |
|
|
$ |
618,227 |
|
|
|
15 |
% |
|
Comparable store sales growth |
|
|
2.9 |
% |
|
|
2.7 |
% |
|
|
|
|
|
|
|
|
Net sales during 2017 totaled $4.7 billion, increasing 15% over the prior fiscal year. Sales growth was primarily driven by solid performance in new stores opened in the last twelve months. Comparable stores contributed approximately 87% of total sales for 2017 and approximately 88% for the prior fiscal year.
Cost of sales, buying and occupancy and gross profit
|
|
|
Fiscal 2017 |
|
|
Fiscal 2016 |
|
|
Change |
|
|
% Change |
|
||||
|
|
|
(dollars in thousands) |
|
|||||||||||||
|
Net sales |
|
$ |
4,664,612 |
|
|
$ |
4,046,385 |
|
|
$ |
618,227 |
|
|
|
15 |
% |
|
Cost of sales, buying and occupancy |
|
|
3,314,487 |
|
|
|
2,864,379 |
|
|
|
450,108 |
|
|
|
16 |
% |
|
Gross profit |
|
|
1,350,125 |
|
|
|
1,182,006 |
|
|
|
168,119 |
|
|
|
14 |
% |
|
Gross margin |
|
|
28.9 |
% |
|
|
29.2 |
% |
|
|
(0.3 |
)% |
|
|
|
|
Gross profit increased during 2017 compared to 2016 by $168.1 million, $180.0 million was as a result of increased sales volume, offset by $11.9 million due to a slight decrease in gross margin. Gross margin decreased due to the competitive environment in the first half of 2017, as well as higher occupancy costs.
Direct store expenses
|
|
|
Fiscal 2017 |
|
|
Fiscal 2016 |
|
|
Change |
|
|
% Change |
|
||||
|
|
|
(dollars in thousands) |
|
|||||||||||||
|
Direct store expenses |
|
$ |
962,894 |
|
|
$ |
828,943 |
|
|
$ |
133,951 |
|
|
|
16 |
% |
|
Percentage of net sales |
|
|
20.6 |
% |
|
|
20.5 |
% |
|
|
0.1 |
% |
|
|
|
|
Direct store expenses increased $134.0 million, including $69.9 million related to stores opened since 2016, and $64.1 million related to stores operated prior to 2016. Direct store expenses, as a percentage of net sales, increased 10 basis points. This primarily reflects higher benefit costs and depreciation associated with new stores and strategic initiatives, partially offset by labor productivity improvement and other operating efficiencies.
Selling, general and administrative expenses
|
|
|
Fiscal 2017 |
|
|
Fiscal 2016 |
|
|
Change |
|
|
% Change |
|
||||
|
|
|
(dollars in thousands) |
|
|||||||||||||
|
Selling, general and administrative expenses |
|
$ |
148,408 |
|
|
$ |
126,929 |
|
|
$ |
21,479 |
|
|
|
17 |
% |
|
Percentage of net sales |
|
|
3.2 |
% |
|
|
3.1 |
% |
|
|
0.1 |
% |
|
|
|
|
The increase in selling, general and administrative expenses primarily reflects a $12.8 million increase in compensation expense (including bonus expense), a $5.3 million increase in advertising, and $6.4 million of increases in other corporate expenses, commensurate with store growth and improved company performance. These increases were partially offset by $3.0 million in one-time costs associated with the Executive Chairman of the Board’s retirement in the prior year.
43
|
|
|
Fiscal 2017 |
|
|
Fiscal 2016 |
|
|
Change |
|
|
% Change (1) |
|
||||
|
|
|
(dollars in thousands) |
|
|||||||||||||
|
Attributable to 2016 store openings |
|
$ |
— |
|
|
|
11,859 |
|
|
$ |
(11,859 |
) |
|
|
(100 |
)% |
|
Attributable to 2017 store openings |
|
|
9,859 |
|
|
|
1,115 |
|
|
|
8,744 |
|
|
|
784 |
% |
|
Attributable to planned 2018 store openings |
|
|
1,768 |
|
|
|
— |
|
|
|
1,768 |
|
|
n/m |
|
|
|
Total store pre-opening costs |
|
$ |
11,627 |
|
|
$ |
12,974 |
|
|
$ |
(1,347 |
) |
|
|
(10 |
)% |
|
Percentage of net sales |
|
|
0.2 |
% |
|
|
0.3 |
% |
|
|
(0.1 |
)% |
|
|
|
|
|
(1) Change calculation is not meaningful ("n/m"). |
|
|
|
|
|
|
|
|
|
|
|
|
|
|
|
|
Store pre-opening costs in 2017 included $9.9 million related to opening 32 stores during 2017 and $1.7 million associated with stores expected to open subsequent to year end. Store pre-opening costs in 2016 included $11.9 million related to opening 36 stores during that period, including costs for stores acquired during the year, and $1.1 million associated with stores opened after 2016.
Store closure and other costs
Store closure and other costs were $1.1 million for 2017 and $0.2 million for 2016.
During the third quarter of 2017, 14 of our stores were affected by hurricanes in three states. Although physical damage was minimal, the stores experienced loss of business due to temporary closures, inventory loss and additional expenses to clean up and power the stores. These costs, net of insurance recovery, totaled $0.7 million.
Interest expense
|
|
|
Fiscal 2017 |
|
|
Fiscal 2016 |
|
|
Change |
|
|
% Change |
|
||||
|
|
|
(dollars in thousands) |
|
|||||||||||||
|
Capital and financing leases |
|
$ |
11,660 |
|
|
$ |
10,423 |
|
|
$ |
1,237 |
|
|
|
12 |
% |
|
Long-term debt |
|
|
8,438 |
|
|
|
3,468 |
|
|
|
4,970 |
|
|
|
143 |
% |
|
Deferred financing costs / Original issuance discount |
|
|
463 |
|
|
|
463 |
|
|
|
- |
|
|
|
0 |
% |
|
Interest rate swap |
|
|
9 |
|
|
|
- |
|
|
|
9 |
|
|
n/m |
|
|
|
Other |
|
|
607 |
|
|
|
440 |
|
|
|
167 |
|
|
|
38 |
% |
|
Total Interest Expense |
|
$ |
21,177 |
|
|
$ |
14,794 |
|
|
$ |
6,383 |
|
|
|
43 |
% |
The increase in interest expense is due to higher principal balances on Credit Facility and additional capital and financing leases recorded during 2017.
Income tax provision
|
|
|
Fiscal 2017 |
|
|
|
|
|
Fiscal 2016 |
|
|
|
|
|
Change |
|
|
% Change |
|
||||
|
|
|
(dollars in thousands) |
|
|||||||||||||||||||
|
Income tax provision |
|
$ |
47,078 |
|
|
22.9 |
% |
|
$ |
74,286 |
|
|
37.4 |
% |
|
$ |
(27,208 |
) |
|
|
(37 |
)% |
|
Impact of Tax Act |
|
|
18,693 |
|
|
9.1 |
% |
|
|
— |
|
|
0.0 |
% |
|
|
18,693 |
|
|
n/m |
|
|
|
Income tax provision excluding impact of Tax Act |
|
$ |
65,771 |
|
|
32.0 |
% |
|
$ |
74,286 |
|
|
37.4 |
% |
|
$ |
(8,515 |
) |
|
|
(11 |
)% |
|
Income tax rate |
|
|
22.9 |
% |
|
|
|
|
|
37.4 |
% |
|
|
|
|
|
-14.5 |
% |
|
|
|
|
44
Income tax provision decreased to $47.1 million for 2017 from $74.3 million for 2016 and our effective income tax rate decreased to 22.9% in 2017 from 37.4% in 2016. The decrease in the income tax provision and effective income tax rate are primarily related to a one-time tax benefit of $18.7 million associated with the reduction in the corporate federal income tax rate from 35% to 21% as a result of the enactment of the Tax Act, combined with the recognition of $9.9 million excess tax benefits related to the exercise or vesting of equity based awards in the income tax provision resulting from the adoption of ASU 2016-09. See Note 3, “Significant Accounting Policies” and Note 17, “Income Taxes.”
Net income
|
|
|
Fiscal 2017 |
|
|
Fiscal 2016 |
|
|
Change |
|
|
% Change |
|
||||
|
|
|
(dollars in thousands) |
|
|||||||||||||
|
Net income |
|
$ |
158,440 |
|
|
$ |
124,306 |
|
|
$ |
34,134 |
|
|
|
27 |
% |
|
Percentage of net sales |
|
|
3.4 |
% |
|
|
3.1 |
% |
|
|
0.3 |
% |
|
|
|
|
Net income increased $34.4 million as a result of higher sales and gross profit, combined with a lower income tax provision discussed above. Net income as a percentage of net sales increased due to the lower effective tax rate, partially offset by lower gross margin and higher compensation and benefits costs.
Diluted earnings per share
|
|
|
Fiscal 2017 |
|
|
Fiscal 2016 |
|
|
Change |
|
|
% Change |
|
||||
|
|
(shares in thousands) |
|
||||||||||||||
|
Diluted earnings per share |
|
$ |
1.15 |
|
|
$ |
0.83 |
|
|
$ |
0.32 |
|
|
|
38 |
% |
|
Diluted weighted average shares outstanding |
|
|
137,884 |
|
|
|
149,653 |
|
|
|
(11,769 |
) |
|
|
|
|
Earnings per share for 2017 included a benefit of $0.14 per share for the 2017 effect of the Tax Act.
Earnings per share included a benefit of $0.04 per share for 2017 and $0.03 per share for 2016 related to the share repurchase program.
45
Comparison of Fiscal 2016 to Fiscal 2015
Net sales
|
|
|
Fiscal 2016 |
|
|
Fiscal 2015 |
|
|
Change |
|
|
% Change |
|
||||
|
|
|
(dollars in thousands) |
|
|||||||||||||
|
Net sales |
|
$ |
4,046,385 |
|
|
$ |
3,593,031 |
|
|
$ |
453,354 |
|
|
|
13 |
% |
|
Comparable store sales growth |
|
|
2.7 |
% |
|
|
5.8 |
% |
|
|
|
|
|
|
|
|
Net sales during 2016 totaled $4.0 billion, increasing 13% over the prior fiscal year. Sales growth was primarily driven by solid performance in new stores opened. Comparable stores contributed approximately 88% of total sales for 2016 and approximately 85% for the prior fiscal year. Sales growth was negatively impacted by the benefit of the 53rd week in the prior year.
Cost of sales, buying and occupancy and gross profit
|
|
|
Fiscal 2016 |
|
|
Fiscal 2015 |
|
|
Change |
|
|
% Change |
|
||||
|
|
|
(dollars in thousands) |
|
|||||||||||||
|
Net sales |
|
$ |
4,046,385 |
|
|
$ |
3,593,031 |
|
|
$ |
453,354 |
|
|
|
13 |
% |
|
Cost of sales, buying and occupancy |
|
|
2,864,379 |
|
|
|
2,541,403 |
|
|
|
322,976 |
|
|
|
13 |
% |
|
Gross profit |
|
|
1,182,006 |
|
|
|
1,051,628 |
|
|
|
130,378 |
|
|
|
12 |
% |
|
Gross margin |
|
|
29.2 |
% |
|
|
29.3 |
% |
|
|
(0.1 |
)% |
|
|
|
|
Gross profit increased during 2016 compared to 2015 by $130.4 million, of which $132.7 million was as a result of increased sales volume, partially offset by $2.3 million related to decreased margin. The gross margin decrease primarily reflects cycling both the positive impact in 2015 from the 53rd week of approximately 20 basis points and higher margins due to deflation in the prior year without the corresponding promotional environment, as well as higher occupancy costs.
Direct store expenses
|
|
|
Fiscal 2016 |
|
|
Fiscal 2015 |
|
|
Change |
|
|
% Change |
|
||||
|
|
|
(dollars in thousands) |
|
|||||||||||||
|
Direct store expenses |
|
$ |
828,943 |
|
|
$ |
706,044 |
|
|
$ |
122,899 |
|
|
|
17 |
% |
|
Percentage of net sales |
|
|
20.5 |
% |
|
|
19.7 |
% |
|
|
0.8 |
% |
|
|
|
|
Direct store expenses increased $122.9 million, including $80.3 million related to stores opened since 2015, and $42.6 million related to stores operated prior to 2016. Direct store expenses, as a percentage of net sales, increased 80 basis points, reflecting deleverage of fixed costs associated with lower comparable store sales growth, higher payroll expense from planned increases in wages and training costs implemented at the beginning of the year and cycling the positive impact in 2015 from the 53rd week.
Selling, general and administrative expenses
|
|
|
Fiscal 2016 |
|
|
Fiscal 2015 |
|
|
Change |
|
|
% Change |
|
||||
|
|
|
(dollars in thousands) |
|
|||||||||||||
|
Selling, general and administrative expenses |
|
$ |
126,929 |
|
|
$ |
106,412 |
|
|
$ |
20,517 |
|
|
|
19 |
% |
|
Percentage of net sales |
|
|
3.1 |
% |
|
|
3.0 |
% |
|
|
0.1 |
% |
|
|
|
|
46
The increase in selling, general and administrative expenses included $3.0 million for costs associated with the Executive Chairman of the Board’s retirement and $4.9 million for increases in stock compensation costs, primarily related to executive changes. Excluding these items, the increase in selling, general and administrative expense was $12.6 million or 11.8%.
Store pre-opening costs
|
|
|
Fiscal 2016 |
|
|
Fiscal 2015 |
|
|
Change |
|
|
% Change |
|
||||
|
|
|
(dollars in thousands) |
|
|||||||||||||
|
Attributable to 2015 store openings |
|
$ |
— |
|
|
$ |
7,166 |
|
|
$ |
(7,166 |
) |
|
|
(100 |
)% |
|
Attributable to 2016 store openings |
|
|
11,859 |
|
|
|
1,450 |
|
|
|
10,409 |
|
|
|
718 |
% |
|
Attributable to planned 2017 store openings |
|
|
1,115 |
|
|
|
— |
|
|
|
1,115 |
|
|
n/m |
|
|
|
Total store pre-opening costs |
|
$ |
12,974 |
|
|
$ |
8,616 |
|
|
$ |
4,358 |
|
|
|
51 |
% |
|
Percentage of net sales |
|
|
0.3 |
% |
|
|
0.2 |
% |
|
|
0.1 |
% |
|
|
|
|
Store pre-opening costs in 2016 included $11.9 million related to opening 36 stores during 2016 and $1.1 million associated with stores expected to open subsequent to year end. Store pre-opening costs in 2015 included $7.2 million related to opening 27 stores during that period and $1.4 million associated with stores opened after 2015.
Store closure and other costs
Store closure and other costs were $0.2 million for 2016 and $1.8 million for 2015. Store closure and other costs for 2015 included $1.1 million for the relocation of our support office and adjustments for prior reserves.
Loss on extinguishment of debt
In 2015, we recorded a loss on extinguishment of debt totaling $5.5 million related to the write-off of deferred financing costs and issue discount in the April 2015 Refinancing.
Interest expense
|
|
|
Fiscal 2016 |
|
|
Fiscal 2015 |
|
|
Change |
|
|
% Change |
|
||||
|
|
|
(dollars in thousands) |
|
|||||||||||||
|
Capital and financing leases |
|
$ |
10,423 |
|
|
$ |
10,912 |
|
|
$ |
(489 |
) |
|
|
(4 |
)% |
|
Long-term debt |
|
|
3,468 |
|
|
|
5,542 |
|
|
|
(2,074 |
) |
|
|
(37 |
)% |
|
Deferred financing costs / Original issuance discount |
|
|
463 |
|
|
|
742 |
|
|
|
(279 |
) |
|
|
(38 |
)% |
|
Other |
|
|
440 |
|
|
|
527 |
|
|
|
(87 |
) |
|
|
(17 |
)% |
|
Total Interest Expense |
|
$ |
14,794 |
|
|
$ |
17,723 |
|
|
$ |
(2,929 |
) |
|
|
(17 |
)% |
The decrease in interest expense is due to the lower principal balances on both the current Credit Facility and former revolving credit facility combined with the lower interest rate on our Credit Facility after the April 2015 Refinancing.
47
Income tax provision decreased to $74.3 million for 2016 from $77.0 million for 2015, primarily related to a decrease in income before income taxes. Our effective income tax rate increased to 37.41% in 2016 from 37.38% in 2015 primarily due to a slight decrease in tax credits and enhanced charitable food contribution deduction.
Net income
|
|
|
Fiscal 2016 |
|
|
Fiscal 2015 |
|
|
Change |
|
|
% Change |
|
||||
|
|
|
(dollars in thousands) |
|
|||||||||||||
|
Net income |
|
$ |
124,306 |
|
|
$ |
128,991 |
|
|
$ |
(4,685 |
) |
|
|
(4 |
)% |
|
Percentage of net sales |
|
|
3.1 |
% |
|
|
3.6 |
% |
|
|
(0.5 |
)% |
|
|
|
|
Net income growth was attributable to growth in net sales driven by comparable store sales, performance of new stores opened, loss on extinguishment of debt in the prior year and reduced interest expense. Net income growth was negatively impacted by the $4.1 million benefit of the 53rd week in 2015. Excluding the 53rd week, net income remained flat from prior year.
Diluted earnings per share
|
|
|
Fiscal 2016 |
|
|
Fiscal 2015 |
|
|
Change |
|
|||
|
|
|
(shares in thousands) |
|
|||||||||
|
Diluted earnings per share |
|
$ |
0.83 |
|
|
$ |
0.83 |
|
|
$ |
— |
|
|
Diluted weighted average shares outstanding |
|
|
149,653 |
|
|
|
155,877 |
|
|
|
(6,224 |
) |
|
|
|
|
|
|
|
|
|
|
|
|
|
|
Earnings per share for 2016 included a benefit of $0.03 per share related to the share repurchase program.
Quarterly Financial Data
The following table sets forth certain of our unaudited consolidated statements of operations data for each of the fiscal quarters in 2017 and 2016.
|
|
|
Fiscal Quarter Ended |
|
|||||||||||||||||||||||||||||
|
|
|
December 31, 2017 |
|
|
October 1, 2017 |
|
|
July 2, 2017 |
|
|
April 2, 2017 |
|
|
January 1, 2017 |
|
|
October 2, 2016 |
|
|
July 3, 2016 |
|
|
April 3, 2016 |
|
||||||||
|
|
|
(dollars in thousands, except per share amounts) |
|
|||||||||||||||||||||||||||||
|
Net sales |
|
$ |
1,143,933 |
|
|
$ |
1,206,059 |
|
|
$ |
1,183,975 |
|
|
$ |
1,130,645 |
|
|
$ |
985,700 |
|
|
$ |
1,035,801 |
|
|
$ |
1,031,643 |
|
|
$ |
993,241 |
|
|
Gross profit |
|
$ |
324,444 |
|
|
$ |
346,409 |
|
|
$ |
341,986 |
|
|
$ |
337,286 |
|
|
$ |
278,178 |
|
|
$ |
291,513 |
|
|
$ |
305,802 |
|
|
$ |
306,513 |
|
|
Income from operations |
|
$ |
37,084 |
|
|
$ |
53,004 |
|
|
$ |
63,471 |
|
|
$ |
72,511 |
|
|
$ |
30,187 |
|
|
$ |
41,447 |
|
|
$ |
63,462 |
|
|
$ |
77,836 |
|
|
Net income |
|
$ |
39,699 |
|
|
$ |
31,486 |
|
|
$ |
40,968 |
|
|
$ |
46,287 |
|
|
$ |
17,005 |
|
|
$ |
23,885 |
|
|
$ |
37,209 |
|
|
$ |
46,207 |
|
|
Net income per share: |
|
|
|
|
|
|
|
|
|
|
|
|
|
|
|
|
|
|
|
|
|
|
|
|
|
|
|
|
|
|
|
|
|
Basic |
|
$ |
0.30 |
|
|
$ |
0.23 |
|
|
$ |
0.30 |
|
|
$ |
0.34 |
|
|
$ |
0.12 |
|
|
$ |
0.16 |
|
|
$ |
0.25 |
|
|
$ |
0.31 |
|
|
Diluted |
|
$ |
0.29 |
|
|
$ |
0.23 |
|
|
$ |
0.29 |
|
|
$ |
0.33 |
|
|
$ |
0.12 |
|
|
$ |
0.16 |
|
|
$ |
0.25 |
|
|
$ |
0.30 |
|
48
In addition to reporting financial results in accordance with generally accepted accounting principles, or GAAP, we provide information regarding Return on Invested Capital (referred to as “ROIC”) as additional information about our operating results. ROIC is a non-GAAP financial measure and should not be reviewed in isolation or considered as a substitute for our financial results as reported in accordance with GAAP. ROIC is an important measure used by management to evaluate our investment returns on capital and provides a meaningful measure of the effectiveness of our capital allocation over time.
We define ROIC as net operating profit after tax (referred to as “NOPAT”), including the effect of capitalized operating leases, divided by average invested capital. Operating leases are capitalized as part of the ROIC calculation to control for differences in capital structure between us and our competitors. Capitalized operating lease interest represents this adjustment to NOPAT and is calculated by the hypothetical capitalization of our operating leases, using eight times our trailing twelve months rent expense and an interest rate factor of seven percent. Operating leases are determined as the trailing twelve months’ rent expense times a factor of eight. Invested capital reflects a trailing twelve-month average.
As numerous methods exist for calculating ROIC, our method may differ from methods used by other companies to calculate their ROIC. It is important to understand the methods and the differences in those methods used by other companies to calculate their ROIC before comparing our ROIC to that of other companies.
Our calculation of ROIC for the fiscal years indicated was as follows:
|
|
|
2017 |
|
|
2016 |
|
|
2015 (1) |
|
|||
|
|
|
(dollars in thousands) |
|
|||||||||
|
Net income |
|
$ |
158,440 |
|
|
$ |
124,306 |
|
|
$ |
128,991 |
|
|
Income Tax Adjustment from Tax Act (2) |
|
|
(18,693 |
) |
|
|
— |
|
|
|
— |
|
|
Interest expense, net of tax (3) |
|
|
14,373 |
|
|
|
9,876 |
|
|
|
11,296 |
|
|
Net operating profit after tax (NOPAT) |
|
$ |
154,120 |
|
|
$ |
134,182 |
|
|
$ |
140,287 |
|
|
|
|
|
|
|
|
|
|
|
|
|
|
|
|
Total rent expense, net of tax (3) |
|
|
82,285 |
|
|
|
65,886 |
|
|
|
55,250 |
|
|
Estimated depreciation on capitalized operating leases, net of tax (3) |
|
|
(36,205 |
) |
|
|
(28,990 |
) |
|
|
(24,310 |
) |
|
Estimated interest on capitalized operating leases, net of tax (3) (4) |
|
|
46,080 |
|
|
|
36,896 |
|
|
|
30,940 |
|
|
NOPAT, including effect of capitalized operating leases |
|
$ |
200,200 |
|
|
$ |
171,078 |
|
|
$ |
171,227 |
|
|
|
|
|
|
|
|
|
|
|
|
|
|
|
|
Average working capital |
|
|
5,652 |
|
|
|
77,273 |
|
|
|
148,368 |
|
|
Average property and equipment |
|
|
668,576 |
|
|
|
546,652 |
|
|
|
472,189 |
|
|
Average other assets |
|
|
570,859 |
|
|
|
584,945 |
|
|
|
583,943 |
|
|
Average other liabilities |
|
|
(158,193 |
) |
|
|
(121,724 |
) |
|
|
(103,714 |
) |
|
Average invested capital |
|
$ |
1,086,894 |
|
|
$ |
1,087,146 |
|
|
$ |
1,100,786 |
|
|
|
|
|
|
|
|
|
|
|
|
|
|
|
|
Average estimated asset base of capitalized operating leases |
|
|
968,201 |
|
|
|
838,200 |
|
|
|
704,802 |
|
|
Average invested capital, including the effect of capitalized operating leases |
|
$ |
2,055,095 |
|
|
$ |
1,925,346 |
|
|
$ |
1,805,588 |
|
|
|
|
|
|
|
|
|
|
|
|
|
|
|
|
ROIC |
|
|
14.2 |
% |
|
|
12.3 |
% |
|
|
12.7 |
% |
|
ROIC, including the effect of capitalized operating leases |
|
|
9.7 |
% |
|
|
8.9 |
% |
|
|
9.5 |
% |
|
(1) |
Fiscal 2015 includes 53 weeks. |
|
(2) |
$18.7 million income tax credit related to the Tax Act, see Note 17, “Income Taxes.” |
49
|
(4) |
Interest on capitalized leases is calculated as the trailing four quarters’ rent expense multiplied by eight and by a seven percent interest rate factor. |
Liquidity and Capital Resources
The following table sets forth the major sources and uses of cash for each of the periods set forth below, as well as our cash and cash equivalents at the end of each period (in thousands):
|
|
|
Fiscal 2017 |
|
|
Fiscal 2016 |
|
|
Fiscal 2015 |
|
|||
|
Cash and cash equivalents at end of period |
|
$ |
19,479 |
|
|
$ |
12,465 |
|
|
$ |
136,069 |
|
|
Cash provided by operating activities |
|
$ |
309,567 |
|
|
$ |
254,351 |
|
|
$ |
239,898 |
|
|
Cash used in investing activities |
|
$ |
(198,594 |
) |
|
$ |
(180,803 |
) |
|
$ |
(128,312 |
) |
|
Cash used in financing activities |
|
$ |
(103,959 |
) |
|
$ |
(197,152 |
) |
|
$ |
(106,030 |
) |
We have generally financed our operations principally through cash generated from operations and borrowings under our credit facilities. Our primary uses of cash are for purchases of inventory, operating expenses, capital expenditures primarily for opening new stores, remodels and maintenance, repurchases of our common stock and debt service. We believe that our existing cash and cash equivalents, and cash anticipated to be generated from operations will be sufficient to meet our anticipated cash needs for at least the next 12 months, and we may continue to use borrowings under our Credit Facility to fund our share repurchase programs. Our future capital requirements will depend on many factors, including new store openings, remodel and maintenance capital expenditures at existing stores, store initiatives and other corporate capital expenditures and activities. Our cash and cash equivalents position benefits from the fact that we generally collect cash from sales to customers the same day or, in the case of credit or debit card transactions, within days from the related sale.
Operating Activities
Cash flows from operating activities increased $55.2 million to $309.6 million for 2017 compared to $254.4 million for 2016. The increase in cash flows from operating activities is the result of higher net sales and pretax income reflecting higher gross profit due to store and sales growth, working capital improvements, higher noncash depreciation and amortization expense, partially offset by lower noncash deferred income taxes as the result of the Tax Act.
Cash flows from operating activities increased $14.5 million to $254.4 million for 2016 compared to $239.9 million for 2015. The increase in cash flows from operating primarily relates to working capital improvements and higher non-cash expense depreciation and amortization expenses, partially offset by lower net income in 2016.
Cash flows provided by/ (used in) operating activities from changes in working capital was $19.3 million in 2017, compared to ($18.2) million in 2016 and ($12.5) million in 2015. The increase in cash flows from operating activities for changes in working capital in 2017, compared to 2016 was primarily due to working capital improvements as a result of operating efficiencies achieved through our strategic initiatives, as well as a net increase in accounts payable and accrued liabilities and compensation related accruals in line with improved performance and company growth.
50
Cash flows used in investing activities consist primarily of capital expenditures in new stores, including leasehold improvements and store equipment, capital expenditures to maintain the appearance of our stores, sales enhancing initiatives and other corporate investments. Cash flows used in investing activities were $198.6 million, $180.8 million, and $128.3 million for 2017, 2016, and 2015, respectively. The increase in cash flows used in investing activities in each of these periods is primarily due to capital investments in new stores combined with store remodels and other store-level capital projects.
We expect capital expenditures to be in the range of $165 - $170 million in 2018, including expenditures incurred to date, net of estimated landlord tenant improvement allowances, primarily to fund investments in new stores, remodels, maintenance capital expenditures and corporate capital expenditures. We expect to fund our capital expenditures with cash on hand, cash generated from operating activities and, if required, borrowings under our Credit Facility.
Financing Activities
Cash flows used in financing activities were $104.0 million for 2017 compared to $197.2 million for 2016. During 2017, cash flows used in financing activities consisted of $203.4 million for stock repurchases, $4.2 million cash paid for capital and financing lease obligations, partially offset by $93 million of net borrowings on the Credit Facility, $9.3 million in proceeds from the exercise of stock options and $1.3 million from cash received from landlords related to finance lease obligations.
During 2016, cash flows used in financing activities consisted of $294.3 million for stock repurchases, $4.4 million cash paid for capital and financing lease obligations, partially offset by $95 million of net borrowings on the Credit Facility, $3.7 million of excess tax benefits from the exercise of stock options and $2.7 million in proceeds from the exercise of stock options.
Cash flows used in financing activities were $106.0 million for 2015. During 2015, cash flows used in financing activities consisted of $261.3 million cash paid on our term loan, $25.7 million for stock repurchases, $4.1 million cash paid for capital and financing lease obligations and $1.9 million payments of deferred financing costs, partially offset by $160 million of net borrowings on our Credit Facility, $20.0 million of excess tax benefits from the exercise of stock options, $6.6 million in proceeds from the exercise of stock options and $0.4 million from cash received from landlords related to finance lease obligations.
Long-term Debt and Credit Facilities
Long-term debt increased $93.0 million to $348.0 million as of December 31, 2017, compared to January 1, 2017. The increase in 2017, compared to 2016, resulted primarily from $93.0 million of net borrowings under our Credit Facility used in our share repurchase programs.
Long-term debt increased $95.0 million to $255.0 million as of January 1, 2017, compared to January 3, 2016. The increase in 2016, compared to 2015, resulted primarily from $95.0 million of net borrowings under our Credit Facility used in our share repurchase programs.
See Note 12, “Long-Term Debt” of our audited consolidated financial statements for a description of our Credit Facility and our Former Credit Facility (as defined therein).
Share Repurchase Program
On November 4, 2015, the Company’s board of directors authorized a $150 million common stock share repurchase program, which was completed during the second quarter of 2016. On September 6, 2016, the Company’s board of directors authorized a $250 million common stock share repurchase program, which was completed during the first quarter of 2017. On February 20, 2017, the Company’s board of directors authorized a new $250 million common stock share repurchase program, of which
51
$126.6 million remained available as of December 31, 2017. The following table outlines the share repurchase programs authorized by the Board, and the related repurchase activity and available authorization as of December 31, 2017 (in thousands):
|
Effective date |
|
Expiration date |
|
Amount authorized |
|
|
Cost of repurchases |
|
|
Authorization available |
|
|||
|
November 4, 2015 |
|
November 4, 2017 |
|
$ |
150,000 |
|
|
$ |
150,000 |
|
|
$ |
— |
|
|
September 6, 2016 |
|
December 31, 2017 |
|
|
250,000 |
|
|
|
250,000 |
|
|
|
— |
|
|
February 20, 2017 |
|
December 31, 2018 |
|
$ |
250,000 |
|
|
$ |
123,400 |
|
|
$ |
126,600 |
|
The shares under the repurchase programs may be purchased on a discretionary basis from time to time prior to the applicable expiration date, subject to general business and market conditions and other investment opportunities, through open market purchases, privately negotiated transactions, or other means, including through Rule 10b5-1 trading plans. The board’s authorization of the share repurchase programs does not obligate us to acquire any particular amount of common stock, and the repurchase programs may be commenced, suspended, or discontinued at any time. We have used borrowings under our Credit Facility to assist with the repurchase program authorized on September 6, 2016. See Note 12, “Long-Term Debt” of our audited consolidated financial statements, contained elsewhere in this Annual Report on Form 10-K, for more details.
Share repurchase activity under our repurchase programs for the periods indicated was as follows (total cost in thousands):
|
|
|
Year Ended |
|
|||||
|
|
|
December 31, 2017 |
|
|
January 1, 2017 |
|
||
|
Number of common shares acquired |
|
|
9,696,819 |
|
|
|
13,242,483 |
|
|
Average price per common share acquired |
|
$ |
20.98 |
|
|
$ |
22.22 |
|
|
Total cost of common shares acquired |
|
$ |
203,392 |
|
|
$ |
294,265 |
|
Shares purchased under our repurchase programs were subsequently retired.
Subsequent to December 31, 2017 and through February 20, 2018, we repurchased an additional 1.2 million shares of common stock for a total investment of $30.4 million year-to-date.
Factors Affecting Liquidity
We can currently borrow under our Credit Facility, up to an initial aggregate commitment of $450.0 million, which may be increased from time to time pursuant to an expansion set forth in the Credit Agreement. We are currently utilizing borrowings under our Credit Facility to fund our share repurchase program described above. The interest rate we pay on our borrowings increases as our leverage ratio increases.
The Credit Agreement contains financial, affirmative and negative covenants. The negative covenants include, among other things, limitations on our ability to:
|
|
• |
incur additional indebtedness; |
|
|
• |
grant additional liens; |
|
|
• |
enter into sale-leaseback transactions; |
|
|
• |
make loans or investments; |
|
|
• |
merge, consolidate or enter into acquisitions; |
|
|
• |
pay dividends or distributions; |
52
|
|
• |
enter into new lines of business; |
|
|
• |
modify the terms of debt or other material agreements; and |
|
|
• |
change our fiscal year. |
Each of these covenants is subject to customary and other agreed-upon exceptions.
In addition, the Credit Agreement requires that we and our subsidiaries maintain a maximum total net leverage ratio not to exceed 3.00 to 1.00 and minimum interest coverage ratio not to be less than 1.75 to 1.00. Each of these covenants is tested on the last day of each fiscal quarter, starting with the fiscal quarter ended June 28, 2015.
We were in compliance with all applicable covenants under the Credit Agreement as of December 31, 2017.
Our Credit Agreement is defined and more fully described in Note 12, “Long-Term Debt” of our audited consolidated financial statements contained elsewhere in this Annual Report on Form 10-K.
Contractual Obligations
The following table summarizes our contractual obligations as of December 31, 2017, and the effect such obligations are expected to have on our liquidity and cash flow in future periods:
|
|
|
Payments Due by Period |
|
|||||||||||||||||
|
|
|
Total |
|
|
Less Than 1 Year |
|
|
1-3 Years |
|
|
4-5 Years |
|
|
More Than 5 Years |
|
|||||
|
|
|
(in thousands) |
|
|||||||||||||||||
|
$450.0 million Credit Facility (1) |
|
$ |
348,000 |
|
|
$ |
— |
|
|
$ |
348,000 |
|
|
$ |
— |
|
|
$ |
— |
|
|
Interest payments on $450 million Credit Facility (2) |
|
|
33,102 |
|
|
|
11,427 |
|
|
|
17,327 |
|
|
|
4,348 |
|
|
|
— |
|
|
Capital and financing lease obligations(3) |
|
|
136,289 |
|
|
|
16,833 |
|
|
|
32,418 |
|
|
|
29,342 |
|
|
|
57,696 |
|
|
Operating lease obligations(3) |
|
|
1,596,197 |
|
|
|
142,620 |
|
|
|
306,824 |
|
|
|
289,927 |
|
|
|
856,826 |
|
|
Purchase commitments(4) |
|
|
63,544 |
|
|
|
10,814 |
|
|
|
35,952 |
|
|
|
16,778 |
|
|
|
— |
|
|
Totals(5) |
|
$ |
2,177,132 |
|
|
$ |
181,694 |
|
|
$ |
740,521 |
|
|
$ |
340,395 |
|
|
$ |
914,522 |
|
|
(1) |
The Credit Facility is scheduled to mature and the commitments thereunder will terminate on April 17, 2020, subject to extensions as set forth in the Credit Agreement. These borrowings are reflected in the “4-5 Years” column and discussed in the financing activities section above. See Note 12, “Long-Term Debt” to our audited consolidated financial statements contained elsewhere in this Annual Report on Form 10-K. |
|
(2) |
Represents estimated interest payments through maturity date of April 17, 2020 on our Credit Facility based on the outstanding amounts as of December 31, 2017 and based on LIBOR rates in effect at the time of this report, net of interest rate swaps. |
|
(3) |
Represents estimated payments for capital and financing and operating leases. Capital and financing lease obligations and operating lease obligations are presented gross without offset for subtenant rentals. We have subtenant agreements under which we will receive $1.5 million for the period of less than one year, $2.3 million for years one to three, $1.7 million for years four to five, and $1.5 million for the period beyond five years. |
|
(4) |
Consists primarily of purchase commitments under noncancelable service and supply contracts. |
|
(5) |
As of December 31, 2017, we had recorded $42.5 million of liabilities related to our self-insurance programs. Self-insurance liabilities are not included in the table above because the payments are not contractual in nature and the timing of the payments is uncertain. |
53
The contractual commitment amounts in the table above are associated with agreements that are enforceable and legally binding. Obligations under contracts that we can cancel without a significant penalty are not included in the table above.
We periodically make other commitments and become subject to other contractual obligations that we believe to be routine in nature and incidental to the operation of the business. Management believes that such routine commitments and contractual obligations do not have a material impact on our business, financial condition or results of operations.
Off-Balance Sheet Arrangements
We do not engage in any off-balance sheet financing activities, nor do we have any interest in entities referred to as variable interest entities.
Impact of Inflation and Deflation
Inflation and deflation in the prices of food and other products we sell may periodically affect our sales, gross profit and gross margin. The short-term impact of inflation and deflation is largely dependent on whether or not the effects are passed through to our customers, which is subject to competitive market conditions.
Food inflation and deflation is affected by a variety of factors and our determination of whether to pass on the effects of inflation or deflation to our customers is made in conjunction with our overall pricing and marketing strategies, as well as our competitors’ responses. Although we may experience periodic effects on sales, gross profit, gross margins and cash flows as a result of changing prices, we do not expect the effect of inflation or deflation to have a material impact on our ability to execute our long-term business strategy.
Critical Accounting Estimates
Our discussion and analysis of our financial condition and results of operations are based upon our financial statements, which have been prepared in accordance with GAAP. These principles require us to make estimates and judgments that affect the reported amounts of assets, liabilities, sales and expenses, cash flow and related disclosure of contingent assets and liabilities. Our estimates include, but are not limited to, those related to inventory, lease assumptions, self-insurance reserves, sublease assumptions for closed stores, goodwill and intangible assets, impairment of long-lived assets, fair values of equity-based awards and derivatives, and income taxes. We base our estimates on historical experience and on various other assumptions that we believe to be reasonable under the circumstances. Actual results may differ from these estimates. To the extent that there are material differences between these estimates and our actual results, our future financial statements will be affected.
We believe that of our significant accounting policies, which are described in Note 3, “Significant Accounting Policies” to the audited consolidated financial statements included in this Annual Report on Form 10-K, the following accounting policies involve a greater degree of judgment and complexity. Accordingly, we believe these are the most critical to fully understand and evaluate our financial condition and results of operations.
Inventories
Inventories consist of merchandise purchased for resale, which are stated at the lower of cost or net realizable value. The cost method is used for warehouse perishable and store perishable department inventories by assigning costs to each of these items based on a first-in, first-out (referred to as “FIFO”) basis (net of vendor discounts).
54
The Company’s non-perishable inventory is valued at the lower of cost or net realizable value using weighted averaging, the use of which approximates the FIFO method.
The Company believes that all inventories are saleable and no allowances or reserves for obsolescence were recorded as of December 31, 2017 and January 1, 2017.
Equity-Based Compensation
Under the provisions of ASC 718, equity-based compensation expense is measured at the grant date, based on the fair value of the award. Changes in these inputs and assumptions can materially affect the measurement of the estimated fair value of our equity-based compensation expense.
We will continue to use judgment in evaluating the assumptions related to our equity-based compensation on a prospective basis. If any of the assumptions used in the Black-Scholes model for options valuation change significantly, equity-based compensation for future awards may differ materially compared with the awards granted previously. Refer to Note 25, “Equity-Based Compensation” to our audited consolidated financial statements included elsewhere in this Annual Report on Form 10-K for further discussion of these assumptions.
Lease Assumptions
The most significant estimates used by management in accounting for leases and the impact of those estimates are as follows:
Expected lease term—Our expected lease term includes both contractual lease periods and cancelable option periods where failure to exercise such options would result in an economic penalty. The expected lease term is used in determining whether the lease is accounted for as an operating lease or a capital lease. An increase in the expected lease term will increase the probability that a lease will be considered a capital lease and will generally result in higher interest and depreciation expense for a leased property recorded on our balance sheets.
Incremental borrowing rate—The incremental borrowing rate is primarily used in determining whether the lease is accounted for as an operating lease or a capital lease. An increase in the incremental borrowing rate decreases the net present value of the minimum lease payments and reduces the probability that a lease will be considered a capital lease. For leases which are recorded on our balance sheets with a related capital lease, the incremental borrowing rate is also used in allocating our rental payments between interest expense and a reduction of the outstanding obligation.
Fair market value of the leased asset—The fair market value of leased retail property is generally estimated based on comparable market data provided by third-party sources and evaluated using the experience of our development staff. Fair market value is used in determining whether the lease is accounted for as an operating lease or a capital lease.
Accounting owner—With certain leases, we are involved in the construction of the building (or certain significant changes to an existing building) and we are considered owner of the building for accounting purposes. We capitalize the amount of the total project costs incurred during the construction period. At the completion of the construction project, we evaluate whether the transfer to the landlord meets the requirements for sale-leaseback accounting treatment. A sale and leaseback of the asset is deemed to occur when construction of the asset is complete and the lease term begins and the relevant sale-leaseback accounting criteria are met. If we do not pass the criteria for sale-leaseback accounting, we record a financing lease asset, which is included with “Property and equipment, net of accumulated depreciation” and a corresponding financing obligation in “Capital and financing lease obligations” in our consolidated balance sheets. We allocate each lease payment between a reduction of the lease obligation and interest expense using the effective interest method.
55
Goodwill and Intangible Assets
Goodwill represents the cost of acquired businesses in excess of the fair value of assets and liabilities acquired. Our indefinite-lived intangible assets consist of trade names related to “Sprouts Farmers Market” and liquor licenses. We also hold intangible assets with finite useful lives, consisting of favorable and unfavorable leasehold interests and the “Sunflower Farmers Market” trade name.
Goodwill and indefinite-lived intangible assets are evaluated for impairment on an annual basis during the fourth fiscal quarter, or more frequently if events or changes in circumstances indicate that the asset might be impaired. Our impairment evaluation of goodwill consists of a qualitative assessment to determine if it is more likely than not that the fair value of a reporting unit is less than its carrying amount. If this qualitative assessment indicates it is more likely than not the estimated fair value of a reporting unit exceeds its carrying value, no further analysis is required and goodwill is not impaired. Our qualitative assessment considered factors including changes in the competitive market, budget-to-actual performance, trends in market capitalization for us and our peers, lack of turnover in key management personnel and overall changes in macroeconomic environment.
Our impairment evaluation for our indefinite-lived intangible assets consists of a qualitative assessment similar to that for goodwill. If our qualitative assessment indicates it is more likely than not that the estimated fair value of an indefinite-lived intangible asset exceeds its carrying value, no further analysis is required and the asset is not impaired. Otherwise, we compare the estimated fair value of the asset to its carrying amount with an impairment loss recognized for the amount, if any, by which carrying value exceeds estimated fair value.
Significant estimates and assumptions are made in connection with the estimated reporting unit and intangible asset fair values, including projected cash flows, the timing of projected cash flows and applicable discount rates. In the event actual results vary from our estimates and assumptions, or if we change our estimates and assumptions, we may be required to record a goodwill or intangible assets impairment charge.
No impairment of goodwill or indefinite-lived intangible assets was recorded during fiscal 2017, 2016 or 2015 because the fair value of those assets was substantially above carrying value.
Impairment of Long-Lived Assets
Long-lived assets are reviewed for impairment annually or whenever events or changes in circumstances indicate that the carrying amounts may not be recoverable. This evaluation is performed at the lowest level of identifiable cash flows independent of other assets. An impairment loss would be recognized when estimated undiscounted future cash flows from the operation and/or disposition of the assets are less than their carrying amount. Measurement of an impairment loss would be based on the excess of the carrying amount of the asset group over its fair value. Fair value is measured using discounted cash flows or independent opinions of value, as appropriate.
Income Taxes
Income taxes are accounted for under the asset and liability method. Deferred tax assets and liabilities are recognized for the future tax consequences attributable to differences between the financial statement carrying amounts of existing assets and liabilities and their respective tax bases and operating loss and tax credit carryforwards. Deferred tax assets and liabilities are measured using enacted tax rates expected to apply to taxable income in the years in which those temporary differences are expected to be recovered or settled. The effect on deferred tax assets and liabilities of a change in tax rates is recognized in income in the period that includes the enactment date. We recognize the effect of income tax positions only if those positions are more likely than not of being sustained. Recognized income tax positions are measured at the largest amount that is greater than 50% likely of being realized. Changes in recognition or measurement are reflected in the period in which the change in judgment occurs. We record interest and penalties related to unrecognized tax benefits as part of income tax expense.
56
During the ordinary course of business, there are many transactions and calculations for which the ultimate tax settlement is uncertain. Under applicable accounting guidance, we are required to evaluate the realizability of our deferred tax assets. The realization of our deferred tax assets is dependent on future earnings. Applicable accounting guidance requires that a valuation allowance be recognized when, based on available evidence, it is more likely than not that all or a portion of deferred tax assets will not be realized due to the inability to generate sufficient taxable income in future periods. In circumstances where there is significant negative evidence, establishment of a valuation allowance must be considered. A pattern of sustained profitability is considered significant positive evidence when evaluating a decision to reverse a valuation allowance. Further, in those cases where a pattern of sustained profitability exists, projected future taxable income may also represent positive evidence, to the extent that such projections are determined to be reliable given the current economic environment. Accordingly, our assessment of our valuation allowances requires considerable judgment and could have a significant negative or positive impact on our current and future earnings.
Interest Rate Sensitivity
We have a Credit Facility that bears interest at a rate based in part on LIBOR. Accordingly, we are exposed to fluctuations in interest rates. Based on the $255.0 million principal outstanding under our Credit Facility as of January 1, 2017, each hundred basis point change in LIBOR would result in a change in interest expense by $2.6 million annually. We have entered into an interest rate swap agreement in December 2017 to manage our cash flow associated with variable interest rates. The notional dollar amount of the five outstanding swaps at December 31, 2017 was $250.0 million under which we pay a fixed rate and received a variable rate of interest (cash flow swap). Taking into account the interest rate swaps, based on the $348.0 million principal outstanding under our Credit Facility as of December 31, 2017, each hundred basis point change in LIBOR would result in a change in interest expense by $1.0 million annually. See Note 12, “Long-Term Debt” to our accompanying audited consolidated financial statements contained elsewhere in this Annual Report on Form 10-K for details on our Credit Facility.
This sensitivity analysis assumes our mix of financial instruments and all other variables will remain constant in future periods. These assumptions are made in order to facilitate the analysis and are not necessarily indicative of our future intentions.
We do not enter into derivative financial instruments for trading purposes (see Note 22, “Derivative Financial Instruments”).
57
INDEX TO FINANCIAL STATEMENTS
|
Consolidated Financial Statements for |
|
|
Sprouts Farmers Market, Inc. and Subsidiaries: |
|
|
59 |
|
|
Consolidated Balance Sheets as of December 31, 2017 and January 1, 2017 |
61 |
|
62 |
|
|
63 |
|
|
64 |
|
|
65 |
|
|
66 |
58
REPORT OF INDEPENDENT REGISTERED PUBLIC ACCOUNTING FIRM
To the Board of Directors and Stockholders of Sprouts Farmers Market, Inc.
Opinions on the Financial Statements and Internal Control over Financial Reporting
We have audited the accompanying consolidated balance sheets of Sprouts Farmers Market, Inc. and its subsidiaries as of December 31, 2017 and January 1, 2017, and the related consolidated statements of income, comprehensive income, stockholders’ equity, and cash flows for each of the three years in the period ended December 31, 2017, including the related notes (collectively referred to as the “consolidated financial statements”). We also have audited the Company's internal control over financial reporting as of December 31, 2017, based on criteria established in Internal Control - Integrated Framework (2013) issued by the Committee of Sponsoring Organizations of the Treadway Commission (COSO).
In our opinion, the consolidated financial statements referred to above present fairly, in all material respects, the financial position of the Company as of December 31, 2017 and January 1, 2017, and the results of their operations and their cash flows for each of the three years in the period ended December 31, 2017 in conformity with accounting principles generally accepted in the United States of America. Also in our opinion, the Company maintained, in all material respects, effective internal control over financial reporting as of December 31, 2017, based on criteria established in Internal Control - Integrated Framework (2013) issued by the COSO.
Basis for Opinions
The Company's management is responsible for these consolidated financial statements, for maintaining effective internal control over financial reporting, and for its assessment of the effectiveness of internal control over financial reporting, included in Management's Annual Report on Internal Control over Financial Reporting, appearing under Item 9A of this Form 10-K. Our responsibility is to express opinions on the Company’s consolidated financial statements and on the Company's internal control over financial reporting based on our audits. We are a public accounting firm registered with the Public Company Accounting Oversight Board (United States) ("PCAOB") and are required to be independent with respect to the Company in accordance with the U.S. federal securities laws and the applicable rules and regulations of the Securities and Exchange Commission and the PCAOB.
We conducted our audits in accordance with the standards of the PCAOB. Those standards require that we plan and perform the audits to obtain reasonable assurance about whether the consolidated financial statements are free of material misstatement, whether due to error or fraud, and whether effective internal control over financial reporting was maintained in all material respects.
Our audits of the consolidated financial statements included performing procedures to assess the risks of material misstatement of the consolidated financial statements, whether due to error or fraud, and performing procedures that respond to those risks. Such procedures included examining, on a test basis, evidence regarding the amounts and disclosures in the consolidated financial statements. Our audits also included evaluating the accounting principles used and significant estimates made by management, as well as evaluating the overall presentation of the consolidated financial statements. Our audit of internal control over financial reporting included obtaining an understanding of internal control over financial reporting, assessing the risk that a material weakness exists, and testing and evaluating the design and operating effectiveness of internal control based on the assessed risk. Our audits also included performing such other procedures as we considered necessary in the circumstances. We believe that our audits provide a reasonable basis for our opinions.
59
Definition and Limitations of Internal Control over Financial Reporting
A company’s internal control over financial reporting is a process designed to provide reasonable assurance regarding the reliability of financial reporting and the preparation of financial statements for external purposes in accordance with generally accepted accounting principles. A company’s internal control over financial reporting includes those policies and procedures that (i) pertain to the maintenance of records that, in reasonable detail, accurately and fairly reflect the transactions and dispositions of the assets of the company; (ii) provide reasonable assurance that transactions are recorded as necessary to permit preparation of financial statements in accordance with generally accepted accounting principles, and that receipts and expenditures of the company are being made only in accordance with authorizations of management and directors of the company; and (iii) provide reasonable assurance regarding prevention or timely detection of unauthorized acquisition, use, or disposition of the company’s assets that could have a material effect on the financial statements.
Because of its inherent limitations, internal control over financial reporting may not prevent or detect misstatements. Also, projections of any evaluation of effectiveness to future periods are subject to the risk that controls may become inadequate because of changes in conditions, or that the degree of compliance with the policies or procedures may deteriorate.
PricewaterhouseCoopers LLP (signed)
Phoenix, Arizona
February 22, 2018
We have served as the Company’s auditor since 2011.
60
SPROUTS FARMERS MARKET, INC. AND SUBSIDIARIES
(IN THOUSANDS, EXCEPT SHARE AND PER SHARE AMOUNTS)
|
|
|
December 31, 2017 |
|
|
January 1, 2017 |
|
||
|
ASSETS |
|
|
|
|
|
|
|
|
|
Current assets: |
|
|
|
|
|
|
|
|
|
Cash and cash equivalents |
|
$ |
19,479 |
|
|
$ |
12,465 |
|
|
Accounts receivable, net |
|
|
25,893 |
|
|
|
25,228 |
|
|
Inventories |
|
|
229,542 |
|
|
|
204,464 |
|
|
Prepaid expenses and other current assets |
|
|
24,593 |
|
|
|
21,869 |
|
|
Total current assets |
|
|
299,507 |
|
|
|
264,026 |
|
|
Property and equipment, net of accumulated depreciation |
|
|
713,031 |
|
|
|
604,660 |
|
|
Intangible assets, net of accumulated amortization |
|
|
196,205 |
|
|
|
197,608 |
|
|
Goodwill |
|
|
368,078 |
|
|
|
368,078 |
|
|
Other assets |
|
|
4,782 |
|
|
|
5,521 |
|
|
Total assets |
|
$ |
1,581,603 |
|
|
$ |
1,439,893 |
|
|
LIABILITIES AND STOCKHOLDERS’ EQUITY |
|
|
|
|
|
|
|
|
|
Current liabilities: |
|
|
|
|
|
|
|
|
|
Accounts payable and other accrued liabilities |
|
$ |
244,853 |
|
|
$ |
213,926 |
|
|
Accrued salaries and benefits |
|
|
45,623 |
|
|
|
32,859 |
|
|
Current portion of capital and financing lease obligations |
|
|
9,238 |
|
|
|
12,370 |
|
|
Total current liabilities |
|
|
299,714 |
|
|
|
259,155 |
|
|
Long-term capital and financing lease obligations |
|
|
125,489 |
|
|
|
117,366 |
|
|
Long-term debt |
|
|
348,000 |
|
|
|
255,000 |
|
|
Other long-term liabilities |
|
|
130,640 |
|
|
|
116,200 |
|
|
Deferred income tax liability |
|
|
27,066 |
|
|
|
19,263 |
|
|
Total liabilities |
|
|
930,909 |
|
|
|
766,984 |
|
|
Commitments and contingencies (Note 19) |
|
|
|
|
|
|
|
|
|
Stockholders’ equity: |
|
|
|
|
|
|
|
|
|
Undesignated preferred stock; $0.001 par value; 10,000,000 shares authorized, no shares issued and outstanding |
|
|
— |
|
|
|
— |
|
|
Common stock, $0.001 par value; 200,000,000 shares authorized, 132,823,981 shares issued and outstanding, December 31, 2017; 140,256,313 shares issued and outstanding, January 1, 2017 |
|
|
132 |
|
|
|
140 |
|
|
Additional paid-in capital |
|
|
620,788 |
|
|
|
597,269 |
|
|
Accumulated other comprehensive loss |
|
|
(784 |
) |
|
|
— |
|
|
Retained earnings |
|
|
30,558 |
|
|
|
75,500 |
|
|
Total stockholders’ equity |
|
|
650,694 |
|
|
|
672,909 |
|
|
Total liabilities and stockholders’ equity |
|
$ |
1,581,603 |
|
|
$ |
1,439,893 |
|
The accompanying notes are an integral part of these consolidated financial statements.
61
SPROUTS FARMERS MARKET, INC. AND SUBSIDIARIES
CONSOLIDATED STATEMENTS OF INCOME
(IN THOUSANDS, EXCEPT PER SHARE AMOUNTS)
|
|
|
Year Ended |
|
|||||||||
|
|
|
December 31, 2017 |
|
|
January 1, 2017 |
|
|
January 3, 2016 |
|
|||
|
Net sales |
|
$ |
4,664,612 |
|
|
$ |
4,046,385 |
|
|
$ |
3,593,031 |
|
|
Cost of sales, buying and occupancy |
|
|
3,314,487 |
|
|
|
2,864,379 |
|
|
|
2,541,403 |
|
|
Gross profit |
|
|
1,350,125 |
|
|
|
1,182,006 |
|
|
|
1,051,628 |
|
|
Direct store expenses |
|
|
962,894 |
|
|
|
828,943 |
|
|
|
706,044 |
|
|
Selling, general and administrative expenses |
|
|
148,408 |
|
|
|
126,929 |
|
|
|
106,412 |
|
|
Store pre-opening costs |
|
|
11,627 |
|
|
|
12,974 |
|
|
|
8,616 |
|
|
Store closure and other costs |
|
|
1,126 |
|
|
|
228 |
|
|
|
1,802 |
|
|
Income from operations |
|
|
226,070 |
|
|
|
212,932 |
|
|
|
228,754 |
|
|
Interest expense |
|
|
(21,177 |
) |
|
|
(14,794 |
) |
|
|
(17,723 |
) |
|
Other income |
|
|
625 |
|
|
|
454 |
|
|
|
443 |
|
|
Loss on extinguishment of debt |
|
|
— |
|
|
|
— |
|
|
|
(5,481 |
) |
|
Income before income taxes |
|
|
205,518 |
|
|
|
198,592 |
|
|
|
205,993 |
|
|
Income tax provision |
|
|
(47,078 |
) |
|
|
(74,286 |
) |
|
|
(77,002 |
) |
|
Net income |
|
$ |
158,440 |
|
|
$ |
124,306 |
|
|
$ |
128,991 |
|
|
Net income per share: |
|
|
|
|
|
|
|
|
|
|
|
|
|
Basic |
|
$ |
1.17 |
|
|
$ |
0.84 |
|
|
$ |
0.84 |
|
|
Diluted |
|
$ |
1.15 |
|
|
$ |
0.83 |
|
|
$ |
0.83 |
|
|
Weighted average shares outstanding: |
|
|
|
|
|
|
|
|
|
|
|
|
|
Basic |
|
|
135,169 |
|
|
|
147,311 |
|
|
|
153,099 |
|
|
Diluted |
|
|
137,884 |
|
|
|
149,653 |
|
|
|
155,877 |
|
The accompanying notes are an integral part of these consolidated financial statements.
62
SPROUTS FARMERS MARKET, INC. AND SUBSIDIARIES
CONSOLIDATED STATEMENTS OF COMPREHENSIVE INCOME
(IN THOUSANDS)
|
|
|
Year Ended |
|
|||||||||
|
|
|
December 31, 2017 |
|
|
January 1, 2017 |
|
|
January 3, 2016 |
|
|||
|
Net income |
|
$ |
158,440 |
|
|
$ |
124,306 |
|
|
$ |
128,991 |
|
|
|
|
|
|
|
|
|
|
|
|
|
|
|
|
Other comprehensive loss, net of tax |
|
|
|
|
|
|
|
|
|
|
|
|
|
Unrealized losses on cash flow hedging activities, net of income tax of $(271), $0, and $0 |
|
|
(784 |
) |
|
|
— |
|
|
|
— |
|
|
Total other comprehensive loss |
|
$ |
(784 |
) |
|
$ |
— |
|
|
$ |
— |
|
|
|
|
|
|
|
|
|
|
|
|
|
|
|
|
Comprehensive income |
|
$ |
157,656 |
|
|
$ |
124,306 |
|
|
$ |
128,991 |
|
The accompanying notes are an integral part of these consolidated financial statements.
63
SPROUTS FARMERS MARKET, INC. AND SUBSIDIARIES
CONSOLIDATED STATEMENTS OF STOCKHOLDERS’ EQUITY
(IN THOUSANDS, EXCEPT SHARE AMOUNTS)
|
|
|
Shares |
|
|
Common Stock |
|
|
Additional Paid-in Capital |
|
|
Retained Earnings |
|
|
Accumulated Other Comprehensive Loss |
|
|
Total Stockholders’ Equity |
|
||||||
|
Balances at December 28, 2014 |
|
|
151,833,334 |
|
|
$ |
152 |
|
|
$ |
543,048 |
|
|
$ |
142,189 |
|
|
$ |
— |
|
|
$ |
685,389 |
|
|
Net income |
|
|
— |
|
|
|
— |
|
|
|
— |
|
|
|
128,991 |
|
|
|
— |
|
|
|
128,991 |
|
|
Issuance of shares under stock plans |
|
|
1,812,829 |
|
|
|
2 |
|
|
|
6,318 |
|
|
|
— |
|
|
|
— |
|
|
|
6,320 |
|
|
Repurchase and retirement of common stock |
|
|
(1,068,279 |
) |
|
|
(1 |
) |
|
|
— |
|
|
|
(25,734 |
) |
|
|
— |
|
|
|
(25,735 |
) |
|
Excess tax benefit for exercise of options |
|
|
— |
|
|
|
— |
|
|
|
20,009 |
|
|
|
— |
|
|
|
— |
|
|
|
20,009 |
|
|
Equity-based compensation |
|
|
— |
|
|
|
— |
|
|
|
8,018 |
|
|
|
— |
|
|
|
— |
|
|
|
8,018 |
|
|
Balances at January 3, 2016 |
|
|
152,577,884 |
|
|
$ |
153 |
|
|
$ |
577,393 |
|
|
$ |
245,446 |
|
|
$ |
— |
|
|
$ |
822,992 |
|
|
Net income |
|
|
— |
|
|
|
— |
|
|
|
— |
|
|
|
124,306 |
|
|
|
— |
|
|
|
124,306 |
|
|
Issuance of shares under stock plans |
|
|
666,841 |
|
|
|
— |
|
|
|
2,740 |
|
|
|
— |
|
|
|
— |
|
|
|
2,740 |
|
|
Repurchase and retirement of common stock |
|
|
(13,242,483 |
) |
|
|
(13 |
) |
|
|
— |
|
|
|
(294,252 |
) |
|
|
— |
|
|
|
(294,265 |
) |
|
Excess tax benefit for exercise of options |
|
|
— |
|
|
|
— |
|
|
|
3,737 |
|
|
|
— |
|
|
|
— |
|
|
|
3,737 |
|
|
Equity-based compensation |
|
|
— |
|
|
|
— |
|
|
|
13,399 |
|
|
|
— |
|
|
|
— |
|
|
|
13,399 |
|
|
Balances at January 1, 2017 |
|
|
140,002,242 |
|
|
$ |
140 |
|
|
$ |
597,269 |
|
|
$ |
75,500 |
|
|
$ |
— |
|
|
$ |
672,909 |
|
|
Net income |
|
|
— |
|
|
|
— |
|
|
|
— |
|
|
|
158,440 |
|
|
|
— |
|
|
|
158,440 |
|
|
Other comprehensive loss |
|
|
— |
|
|
|
— |
|
|
|
— |
|
|
|
— |
|
|
|
(784 |
) |
|
|
(784 |
) |
|
Issuance of shares under stock plans |
|
|
2,144,669 |
|
|
|
2 |
|
|
|
9,298 |
|
|
|
— |
|
|
|
— |
|
|
|
9,300 |
|
|
Repurchase and retirement of common stock |
|
|
(9,696,819 |
) |
|
|
(10 |
) |
|
|
— |
|
|
|
(203,382 |
) |
|
|
— |
|
|
|
(203,392 |
) |
|
Equity-based compensation |
|
|
— |
|
|
|
— |
|
|
|
14,221 |
|
|
|
— |
|
|
|
— |
|
|
|
14,221 |
|
|
Balances at December 31, 2017 |
|
|
132,450,092 |
|
|
$ |
132 |
|
|
$ |
620,788 |
|
|
$ |
30,558 |
|
|
$ |
(784 |
) |
|
$ |
650,694 |
|
The accompanying notes are an integral part of these consolidated financial statements.
64
SPROUTS FARMERS MARKET, INC. AND SUBSIDIARIES
CONSOLIDATED STATEMENTS OF CASH FLOWS
(IN THOUSANDS)
|
|
|
Year Ended |
|
|||||||||
|
|
|
December 31, 2017 |
|
|
January 1, 2017 |
|
|
January 3, 2016 |
|
|||
|
Cash flows from operating activities |
|
|
|
|
|
|
|
|
|
|
|
|
|
Net income |
|
$ |
158,440 |
|
|
$ |
124,306 |
|
|
$ |
128,991 |
|
|
Adjustments to reconcile net income to net cash provided by operating activities: |
|
|
|
|
|
|
|
|
|
|
|
|
|
Depreciation and amortization expense |
|
|
96,744 |
|
|
|
80,414 |
|
|
|
69,169 |
|
|
Accretion of asset retirement obligation and closed store reserve |
|
|
243 |
|
|
|
309 |
|
|
|
344 |
|
|
Amortization of financing fees and debt issuance costs |
|
|
463 |
|
|
|
463 |
|
|
|
742 |
|
|
Loss on disposal of property and equipment |
|
|
1,623 |
|
|
|
439 |
|
|
|
1,512 |
|
|
Equity-based compensation |
|
|
14,221 |
|
|
|
13,399 |
|
|
|
8,018 |
|
|
Loss on extinguishment of debt |
|
|
— |
|
|
|
— |
|
|
|
5,481 |
|
|
Deferred income taxes |
|
|
7,803 |
|
|
|
20,663 |
|
|
|
15,581 |
|
|
Changes in operating assets and liabilities: |
|
|
|
|
|
|
|
|
|
|
|
|
|
Accounts receivable |
|
|
(4,920 |
) |
|
|
(4,803 |
) |
|
|
(5,622 |
) |
|
Inventories |
|
|
(25,079 |
) |
|
|
(39,030 |
) |
|
|
(22,641 |
) |
|
Prepaid expenses and other current assets |
|
|
(2,733 |
) |
|
|
1,419 |
|
|
|
(12,042 |
) |
|
Other assets |
|
|
(114 |
) |
|
|
13,018 |
|
|
|
(481 |
) |
|
Accounts payable and other accrued liabilities |
|
|
39,244 |
|
|
|
22,118 |
|
|
|
26,782 |
|
|
Accrued salaries and benefits |
|
|
12,764 |
|
|
|
2,142 |
|
|
|
1,030 |
|
|
Other long-term liabilities |
|
|
10,868 |
|
|
|
19,494 |
|
|
|
23,034 |
|
|
Cash flows from operating activities |
|
|
309,567 |
|
|
|
254,351 |
|
|
|
239,898 |
|
|
Cash flows from investing activities |
|
|
|
|
|
|
|
|
|
|
|
|
|
Purchases of property and equipment |
|
|
(198,624 |
) |
|
|
(181,018 |
) |
|
|
(125,313 |
) |
|
Proceeds from sale of property and equipment |
|
|
30 |
|
|
|
706 |
|
|
|
2,708 |
|
|
Purchase of leasehold interests |
|
|
— |
|
|
|
(491 |
) |
|
|
(5,707 |
) |
|
Cash flows used in investing activities |
|
|
(198,594 |
) |
|
|
(180,803 |
) |
|
|
(128,312 |
) |
|
Cash flows from financing activities |
|
|
|
|
|
|
|
|
|
|
|
|
|
Proceeds from revolving credit facility |
|
|
153,000 |
|
|
|
105,000 |
|
|
|
260,000 |
|
|
Payments on revolving credit facility |
|
|
(60,000 |
) |
|
|
(10,000 |
) |
|
|
(100,000 |
) |
|
Payments on term loan |
|
|
— |
|
|
|
— |
|
|
|
(261,250 |
) |
|
Payments on capital and financing lease obligations |
|
|
(4,192 |
) |
|
|
(4,364 |
) |
|
|
(4,142 |
) |
|
Payments of deferred financing costs |
|
|
— |
|
|
|
— |
|
|
|
(1,896 |
) |
|
Cash from landlord related to financing lease obligations |
|
|
1,325 |
|
|
|
— |
|
|
|
419 |
|
|
Repurchase of common stock |
|
|
(203,392 |
) |
|
|
(294,265 |
) |
|
|
(25,735 |
) |
|
Proceeds from exercise of stock options |
|
|
9,300 |
|
|
|
2,740 |
|
|
|
6,565 |
|
|
Excess tax benefit for exercise of stock options |
|
|
— |
|
|
|
3,737 |
|
|
|
20,009 |
|
|
Cash flows used in financing activities |
|
|
(103,959 |
) |
|
|
(197,152 |
) |
|
|
(106,030 |
) |
|
Increase / (Decrease) in cash and cash equivalents |
|
|
7,014 |
|
|
|
(123,604 |
) |
|
|
5,556 |
|
|
Cash and cash equivalents at beginning of the period |
|
|
12,465 |
|
|
|
136,069 |
|
|
|
130,513 |
|
|
Cash and cash equivalents at the end of the period |
|
$ |
19,479 |
|
|
$ |
12,465 |
|
|
$ |
136,069 |
|
|
Supplemental disclosure of cash flow information |
|
|
|
|
|
|
|
|
|
|
|
|
|
Cash paid for interest |
|
$ |
20,759 |
|
|
$ |
14,537 |
|
|
$ |
17,455 |
|
|
Cash paid for income taxes |
|
|
33,475 |
|
|
|
46,083 |
|
|
|
40,656 |
|
|
Supplemental disclosure of non-cash investing and financing activities |
|
|
|
|
|
|
|
|
|
|
|
|
|
Property and equipment in accounts payable |
|
$ |
17,869 |
|
|
$ |
23,228 |
|
|
$ |
16,196 |
|
|
Property acquired through capital and financing lease obligations |
|
|
23,882 |
|
|
|
4,332 |
|
|
|
10,125 |
|
The accompanying notes are an integral part of these consolidated financial statements.
65
SPROUTS FARMERS MARKET, INC. AND SUBSIDIARIES
NOTES TO CONSOLIDATED FINANCIAL STATEMENTS
1. Organization and Description of Business
Sprouts Farmers Market, Inc., a Delaware corporation, through its subsidiaries, operates as a healthy grocery store that offers fresh, natural and organic food through a complete shopping experience that includes fresh produce, bulk foods, vitamins and supplements, packaged groceries, meat and seafood, baked goods, dairy products, frozen foods, beer and wine, natural body care and household items catering to consumers’ growing interest in health and wellness. As of December 31, 2017, the Company operated 285 stores in 15 states. For convenience, the “Company” is used to refer collectively to Sprouts Farmers Market, Inc. and, unless the context requires otherwise, its subsidiaries. The Company’s store operations are conducted by its subsidiaries.
2. Basis of Presentation
The consolidated financial statements include the accounts of the Company and its wholly owned subsidiaries in accordance with accounting principles generally accepted in the United States of America (“GAAP”). All material intercompany accounts and transactions have been eliminated in consolidation.
The Company has one reportable and one operating segment, healthy grocery stores.
The Company categorizes its products as perishable and non-perishable. Perishable product categories include produce, meat and seafood, deli and baked goods. Non-perishable product categories include packaged groceries, vitamins and supplements, bulk foods, dairy products, frozen foods, beer and wine, and natural body care and household items.
The following is a breakdown of the Company’s perishable and non-perishable sales mix:
|
|
|
2017 |
|
|
2016 |
|
|
2015 |
|
|||
|
Perishables |
|
|
50.0 |
% |
|
|
50.4 |
% |
|
|
50.8 |
% |
|
Non-Perishables |
|
|
50.0 |
% |
|
|
49.6 |
% |
|
|
49.2 |
% |
All dollar amounts are in thousands, unless otherwise indicated.
3. Significant Accounting Policies
Fiscal Years
The Company reports its results of operations on a 52- or 53-week fiscal calendar ending on the Sunday closest to December 31. Fiscal year 2017 ended on December 31, 2017 and included 52-weeks. Fiscal year 2016 ended on January 1, 2017 and included 52-weeks, while fiscal year 2015 ended on January 3, 2016 and included 53-weeks. Fiscal years 2017, 2016, and 2015 are referred to as 2017, 2016, and 2015.
Significant Accounting Estimates
The preparation of financial statements in conformity with GAAP requires management to make estimates and assumptions. Such estimates and assumptions affect the reported amounts of assets and liabilities and the disclosure of contingent assets and liabilities at the date of the financial statements and the reported amounts of revenues and expenses during the reporting period. The Company’s critical accounting estimates include, but are not limited to: inventory valuations, lease assumptions, sublease assumptions for closed stores, self-insurance reserves, goodwill and intangible assets, impairment of long-lived assets, fair values of equity-based awards and derivatives, and income taxes. Actual results could differ from those estimates.
66
The Company considers all highly liquid instruments with an original maturity of three months or less to be cash equivalents. The Company’s cash and cash equivalents are maintained at financial institutions in the United States of America. Deposits in transit includes sales through the end of the period, the majority of which were paid with credit and debit cards and settle within a few days of the sales transactions. The amounts due from banks for these transactions at each reporting date were as follows:
|
|
|
As Of |
|
|||||
|
|
|
December 31, 2017 |
|
|
January 1, 2017 |
|
||
|
Due from banks for debit and credit card transactions |
|
$ |
51,825 |
|
|
$ |
43,015 |
|
Accounts Receivable
Accounts receivable generally represent billings to vendors for earned rebates, advertising and other items and landlords for tenant allowances. Accounts receivable also represent receivables from the Company’s insurance carrier for payments expected to be made in excess of self-insured retentions. When a specific account is determined uncollectible, the net recognized receivable is written off.
Inventories
Inventories consist of merchandise purchased for resale, which are stated at the lower of cost or net realizable value. The cost method is used for warehouse and store perishable department inventories by assigning costs to each of these items based on a first-in, first-out (FIFO) basis (net of vendor discounts).
The Company’s non-perishable inventory is valued at the lower of cost or market using weighted averaging, the use of which approximates the FIFO method.
The Company believes that all inventories are saleable and no allowances or reserves for obsolescence were recorded as of December 31, 2017 and January 1, 2017.
Property and Equipment
Property and equipment are stated at cost, net of accumulated depreciation and amortization. Expenditures for major additions and improvements to facilities are capitalized, while maintenance and repairs are charged to expense as incurred. When property is retired or otherwise disposed of, the related cost and accumulated depreciation are removed from the accounts and any resulting gain or loss is reflected in the consolidated statements of operations. Depreciation expense, which includes the amortization of assets recorded under capital and financing leases, is computed using the straight-line method over the estimated useful lives of the individual assets. Leasehold improvements and assets under capital and financing leases are amortized over the shorter of the lease term to which they relate, or the estimated useful life of the asset. Terms of leases used in the determination of estimated useful lives may include renewal options if the exercise of the renewal option is determined to be reasonably assured.
The following table includes the estimated useful lives of certain of our asset classes:
|
Computer hardware and software |
|
3 to 5 years |
|
Furniture, fixtures and equipment |
|
7 to 20 years |
|
Leasehold improvements |
|
up to 15 years |
|
Buildings |
|
40 years |
67
Store development costs, which include costs associated with the selection and procurement of real estate sites, are also included in property and equipment. These costs are included in leasehold improvements and are amortized over the remaining lease term of the successful sites with which they are associated.
Closed Store Reserve
The Company recognizes a reserve for future operating lease payments and other occupancy costs associated with facilities that are no longer being utilized in its current operations. The reserve is recorded based on the present value of the remaining noncancelable lease payments and estimates of other occupancy costs after the cease use date, less an estimate of subtenant income. If subtenant income is expected to be higher than the lease payments, no accrual is recorded. Lease payments and other occupancy costs included in the closed store reserve are expected to be paid over the remaining terms of the respective leases. Adjustments to the closed store reserve relate primarily to changes in actual or estimated subtenant income and actual lease payments and other occupancy costs from original estimates. Adjustments are made for changes in estimates in the period in which the change becomes known considering timing of new information regarding the market, subleases or other lease updates. Adjustments in the closed store reserves are recorded in “store closure and other costs” in the accompanying consolidated statements of operations. See Note 16, “Closed Store Reserves.”
Self-Insurance Reserves
The Company uses a combination of insurance and self-insurance programs to provide for costs associated with general liability, workers’ compensation and team member health benefits. Liabilities for self-insurance reserves are estimated through consideration of various factors, which include historical claims experience, demographic factors, severity factors and other actuarial assumptions. Amounts expected to be recovered from insurance companies are included in the liability, with a corresponding amount recorded in accounts receivable.
Goodwill and Intangible Assets
Goodwill represents the cost of acquired businesses in excess of the fair value of assets and liabilities acquired. The Company’s indefinite-lived intangible assets consist of trade names related to “Sprouts Farmers Market” and liquor licenses. The Company also holds intangible assets with finite useful lives, consisting of favorable and unfavorable leasehold interests and the “Sunflower Farmers Market” trade name.
Goodwill is evaluated for impairment on an annual basis or more frequently if events or changes in circumstances indicate that the asset might be impaired. The Company’s impairment evaluation of goodwill consists of a qualitative assessment to determine if it is more likely than not that the fair value of a reporting unit is less than its carrying amount. If the Company’s qualitative assessment indicates it is more likely than not that the estimated fair value of a reporting unit exceeds its carrying value, no further analysis is required and goodwill is not impaired. Otherwise, the Company follows a two-step quantitative goodwill impairment test to determine if goodwill is impaired. The first step of the quantitative goodwill impairment test compares the fair value of a reporting unit with its carrying amount, including goodwill. If the fair value of the Company’s reporting unit exceeds its carrying value, no further analysis or impairment of goodwill is required. If the carrying value of the Company’s reporting unit exceeds its fair value, the fair value of the reporting unit would be allocated to the reporting unit’s assets and liabilities based on the relative fair value, with goodwill written down to its implied fair value, if necessary.
Indefinite-lived assets are evaluated for impairment on an annual basis or more frequently if events or changes in circumstances indicate that the asset might be impaired. The Company’s impairment evaluation for its indefinite-lived intangible assets consists of a qualitative assessment similar to that for goodwill. If the Company’s qualitative assessment indicates it is more likely than not that the estimated fair value of an indefinite-lived intangible asset exceeds its carrying value, no further analysis is required
68
and the asset is not impaired. Otherwise, the Company compares the estimated fair value of the asset to its carrying amount with an impairment loss recognized for the amount, if any, by which carrying value exceeds estimated fair value.
The Company can elect to bypass the qualitative assessments approach for goodwill and indefinite-lived intangible assets and proceed directly to the quantitative assessments for goodwill or any indefinite-lived intangible assets in any period.
The Company has determined its business consists of a single reporting unit, healthy grocery stores. When applying the quantitative test, the Company determines the fair value of its reporting unit using the income approach methodology of valuation that includes the discounted cash flow method as well as other generally accepted valuation methodologies.
We have had no goodwill impairment charges for the past three fiscal years. See Note 7, “Intangible Assets” and Note 8, “Goodwill” for further discussion.
The trade name related to “Sunflower Farmers Market” meets the definition of a defensive intangible asset and is amortized on a straight-line basis over an estimated useful life of 10 years from the date of its acquisition by the Company. Favorable and unfavorable leasehold interests are amortized on a straight-line basis over the lease term.
Impairment of Long-Lived Assets
The Company assesses its long-lived assets, including property and equipment and finite-lived intangible assets, for potential impairment each quarter based on whether certain triggering events have occurred or changes in circumstances indicate that the carrying amount of an asset group may not be recoverable. These events include current period losses combined with a history of losses or a projection of continuing losses, a significant decrease in the market value of an asset or a significant negative industry or economic trend. The Company groups and evaluates long-lived assets for impairment at the individual store level, which is the lowest level at which independent identifiable cash flows are available. Recoverability of assets to be held and used is measured by a comparison of the carrying amount of an asset to the future undiscounted cash flows expected to be generated by that asset. If impairment is indicated, a loss is recognized for any excess of the carrying value over the estimated fair value of the asset group. The fair value is estimated based on the discounted future cash flows or comparable market values, if available. The Company did not record any impairment loss during 2017, 2016 or 2015.
Deferred Financing Costs
The Company capitalizes certain fees and costs incurred in connection with the issuance of debt. Deferred financing costs are amortized to interest expense over the term of the debt using the effective interest method. For the Credit Facility and Former Credit Facility (as defined in Note 12, “Long-Term Debt”), deferred financing costs are amortized on a straight-line basis over the term of the facility. Upon prepayment, redemption or conversion of debt, the Company accelerates the recognition of an appropriate amount of financing costs as loss on extinguishment of debt. The current and noncurrent portions of deferred financing costs are included in prepaid expenses and other current assets and other assets, respectively, in the accompanying consolidated balance sheets.
Operating Leases
The Company leases certain stores, warehouse facilities and administrative offices under operating leases.
69
Incentives received from lessors are deferred and recorded as a reduction of rental expense over the lease term using the straight-line method. The current portion of unamortized lease incentives is included in other accrued liabilities and the noncurrent portion is included in other long-term liabilities in the accompanying consolidated balance sheets.
Store lease agreements generally include rent abatements and rent escalation provisions and may include contingent rent provisions based on a percentage of sales in excess of specified levels. The Company recognizes escalations of minimum rents and/or abatements as deferred rent and amortizes these balances on a straight-line basis over the term of the lease.
For lease agreements that require the payment of contingent rents based on a percentage of sales above stipulated minimums, the Company begins accruing an estimate for contingent rent when it is determined that it is probable the specified levels of sales in excess of the stipulated minimums will be reached during the year. The Company expensed $1.9 million, $1.8 million and $1.8 million for the years ended December 31, 2017, January 1, 2017 and January 3, 2016, respectively, for contingent rent.
Financing Lease Obligations
Financing lease obligations are recorded for store building leases in which the Company was deemed to be the owner during the construction period under lease accounting guidance. Further, each lease contains provisions indicating continuing involvement with the property at the end of the construction period, which include either an affiliate guaranty or contingent collateral. As a result, in accordance with applicable accounting guidance, buildings and related assets subject to the leases are reflected on the Company’s balance sheets and depreciated over their remaining useful lives. The present value of the lease payments associated with these buildings is recorded as financing lease obligations.
Monthly lease payments are allocated between the land element of the lease (which is accounted for as an operating lease) and the financing obligation. The financing obligation is amortized using the effective interest method and the interest rate is determined in accordance with the requirements of sale-leaseback accounting. Lease payments less the portion allocated to the land element of the lease and that portion considered to be interest expense decrease the financing liability. At the end of the initial lease term, should the Company decide not to renew the lease, the net book value of the asset and the corresponding financing obligation would be reversed.
The outflows from the construction of the buildings are classified as investing activities, and the outflows associated with the financing obligations principal payments and inflows from the associated financing proceeds are classified as financing activities in the accompanying consolidated statements of cash flows.
The Company records its financial assets and liabilities in accordance with the framework for measuring fair value in accordance with GAAP. This framework establishes a fair value hierarchy that prioritizes the inputs used to measure fair value:
Level 1: Quoted prices for identical instruments in active markets.
Level 2: Quoted prices for similar instruments in active markets; quoted prices for identical or similar instruments in markets that are not active; and model-derived valuations in which all significant inputs and significant value drivers are observable in active markets.
Level 3: Valuations derived from valuation techniques in which one or more significant inputs or significant value drivers are unobservable.
70
Fair value measurements of nonfinancial assets and nonfinancial liabilities are primarily used in the valuation of derivative instruments, impairment analysis of goodwill, intangible assets, and long-lived assets and in the valuation of store closure and exit costs.
Cash and cash equivalents, accounts receivable, prepaid expenses and other current assets, accounts payable, accrued salaries and benefits and other accrued liabilities approximate fair value because of the short maturity of those instruments.
Derivative Financial Instruments
We record derivatives at fair value. The designation of a derivative instrument as a hedge and its ability to meet the hedge accounting criteria determine how we reflect the change in fair value of the derivative instrument in our financial statements. A derivative qualifies for hedge accounting if, at inception, the derivative is expected to be highly effective in offsetting the underlying hedged cash flows and we fulfill the hedge documentation standards at the time we enter into the derivative contract. We designate our hedge based on the exposure we are hedging. For qualifying cash flow hedges, we record changes in fair value in other comprehensive income (OCI). We release the derivative’s gain or loss from OCI to match the timing of the underlying hedged item’s effect on earnings.
We review the effectiveness of our hedging instruments quarterly. We recognize changes in the fair value for derivatives not designated as hedges or those not qualifying for hedge accounting in current period earnings. We discontinue hedge accounting for any hedge that is no longer evaluated to be highly effective.
We do not enter into derivative financial instruments for trading or speculative purposes, and we monitor the financial stability and credit standing of our counterparties in these transactions.
Equity-Based Compensation
The Company measures equity-based compensation cost at the grant date based on the fair value of the award and recognizes equity-based compensation cost as expense over the vesting period. As equity-based compensation expense recognized in the consolidated statements of operations is based on awards ultimately expected to vest, the amount of expense has been reduced for actual forfeitures as they occur. The Company uses the Black-Scholes option-pricing model to determine the grant date fair value for each option grant. The Black-Scholes option-pricing model requires extensive use of subjective assumptions. See Note 25, “Equity-Based Compensation” for a discussion of assumptions used in the calculation of fair values. Application of alternative assumptions could produce different estimates of the fair value of equity-based compensation and, consequently, the related amounts recognized in the accompanying consolidated statements of operations. The grant date fair value of restricted stock units (“RSUs”), performance share awards (“PSAs”), and restricted stock awards (“RSAs”) is based on the closing price per share of the Company’s stock on the grant date. The Company recognizes compensation expense for time-based awards on a straight-line basis and for performance-based awards on the graded-vesting method over the vesting period of the awards.
Revenue Recognition
Revenue is recognized at the point of sale. Discounts provided to customers at the time of sale are recognized as a reduction in sales as the discounted products are sold. Sales taxes are not included in revenue. Proceeds from the sale of gift cards are recorded as a liability at the time of sale, and recognized as sales when they are redeemed by the customer. Beginning in 2015, the Company obtained sufficient historical redemption data for its gift card program to make a reasonable estimate of the ultimate redemption patterns and breakage rate.
71
Cost of Sales, Buying and Occupancy
Cost of sales, buying and occupancy includes the cost of inventory sold during the period, including the direct costs of purchased merchandise (net of discounts and allowances), distribution and supply chain costs, buying costs and supplies. Occupancy costs include store rental, property taxes, utilities, common area maintenance, amortization of favorable or unfavorable leasehold interests and property insurance. The Company recognizes vendor allowances and merchandise volume related rebate allowances as a reduction of inventories during the period when earned and reflects the allowances as a component of cost of sales, buying and occupancy as the inventory is sold.
Our largest supplier accounted for approximately 34%, 33% and 31% of total purchases during 2017, 2016, and 2015, respectively.
Direct Store Expenses
Direct store expenses consist of store-level expenses such as salaries and benefits, related equity-based compensation, supplies, depreciation and amortization for buildings and store leasehold improvements, equipment and other store specific costs.
Selling, General and Administrative Expenses
Selling, general and administrative expenses primarily consist of salaries and benefits costs, related equity-based compensation, advertising, acquisition-related costs and corporate overhead.
The Company charges third-parties to place advertisements in the Company’s in-store guide and circulars. The Company records rebates received from vendors in connection with cooperative advertising programs as a reduction to advertising costs when the allowance represents a reimbursement of a specific incremental and identifiable cost. Advertising costs are expensed as incurred. Advertising expense, net of rebates, was $42.3 million, $37.0 million and $32.0 million for 2017, 2016 and 2015, respectively.
Store Pre-Opening Costs
Store pre-opening costs include rent expense during construction of new stores and costs related to new store openings, including costs associated with hiring and training personnel and other miscellaneous costs. Store pre-opening costs are expensed as incurred.
Income Taxes
Income taxes are accounted for under the asset and liability method. Deferred tax assets and liabilities are recognized for the future tax consequences attributable to differences between the financial statement carrying amounts of existing assets and liabilities and their respective tax basis and operating loss and tax credit carryforwards. Deferred tax assets and liabilities are measured using enacted tax rates expected to apply to taxable income in the years in which those temporary differences are expected to be recovered or settled. The effect on deferred tax assets and liabilities of a change in tax rates is recognized in income in the period that includes the enactment date. The Company’s deferred tax assets are subject to periodic recoverability assessments. Valuation allowances are established, when necessary, to reduce deferred tax assets to the amount that more likely than not will be realized. Realization of the deferred tax assets is principally dependent upon achievement of projected future taxable income offset by deferred tax liabilities. Changes in recognition or measurement are reflected in the period in which the judgment occurs.
72
The Company recognizes the effect of uncertain income tax positions only if those positions are more likely than not of being sustained. Recognized income tax positions are measured at the largest amount that is greater than 50% likely of being realized. Changes in recognition or measurement are reflected in the period in which the change in judgment occurs. The Company records interest and penalties related to unrecognized tax benefits as part of income tax expense.
Share Repurchases
The Company has elected to retire shares repurchased to date. Shares retired become part of the pool of authorized but unissued shares. The Company has elected to record purchase price of the retired shares in excess of par value directly as a reduction of retained earnings.
Net Income per Share
Basic net income per share is calculated by dividing net income by the weighted average number of shares outstanding during the fiscal period.
Diluted net income per share is based on the weighted average number of shares outstanding, plus, where applicable, shares that would have been outstanding related to dilutive options, PSAs and RSUs.
Comprehensive Income
Comprehensive income consists of net income and the unrealized gains or losses on derivative instruments that qualify for and have been designated as cash flow hedges, for all periods presented.
Recently Adopted Accounting Pronouncements
In July 2015, the FASB issued ASU No. 2015-11, “Simplifying the Measurement of Inventory.” ASU No. 2015-11 changes the measurement principle for inventory from the lower of cost or market to lower of cost and net realizable value. Net realizable value is defined as the estimated selling prices in the ordinary course of business; less reasonably predictable costs of completion, disposal and transportation. This guidance is effective for the Company for its fiscal year 2017. Adoption of the guidance took place prospectively during 2017, and the adoption did not have a material effect on the Company’s consolidated financial statements or disclosures.
In March 2016, the FASB issued ASU No. 2016-09, “Compensation – Stock Compensation (Topic 718).” This update involves several aspects of the accounting for share-based transactions, including the income tax consequences, classification of awards as either equity or liabilities, how to account for forfeitures, and classification on the statement of cash flows. The amendments in this update are effective for the Company for its fiscal year 2017. As a result of the adoption, the Company recognized excess tax benefits related to the exercise of options in its income tax provision during fiscal 2017 (see Note 17, “Income Taxes”). Prior to the adoption, these items were recorded in Additional Paid-in Capital. The Company has elected to prospectively apply the amendments related to classifying cash flows related to excess tax benefits as an operating activity. During 2017, excess tax benefits were classified as an operating activity on the consolidated statement of cash flows, along with other income tax cash flows. The Company has made a policy election to account for forfeitures as they occur. This election was adopted using a modified retrospective approach resulting in no cumulative effect on retained earnings at the beginning of the period. Prior to the adoption, forfeitures were accounted for using an estimated forfeiture rate.
In August 2017, the FASB issued ASU No. 2017-12, “Derivatives and hedging (Topic 815): Targeted improvements to accounting for hedging activities.” The amendments in this update expand and refine hedge accounting for both nonfinancial and financial risk components and align the recognition and presentation of effects of the hedging instrument and the hedged item in the financial statements. The amendments also make certain targeted improvements to simplify the application of hedge accounting guidance and ease the administrative burden of hedge documentation requirements and assessing hedge effectiveness. The
73
amendments in this update are effective for the Company for its fiscal year 2019, however, the Company has elected to early-adopt. Adoption of the guidance took place prospectively during 2017, and the adoption did not have a material effect on the Company’s consolidated financial statements or disclosures.
Recently Issued Accounting Pronouncements Not Yet Adopted
In May 2014, the FASB issued ASU No. 2014-09, “Revenue from Contracts with Customers.” ASU No. 2014-09 provides guidance for revenue recognition. The standard’s core principle is that a company will recognize revenue when it transfers promised goods or services to customers in an amount that reflects the consideration to which the company expects to be entitled in exchange for those goods or services. In doing so, companies will need to use more judgment and make more estimates than under current guidance. These may include identifying performance obligations in the contract, and estimating the amount of variable consideration to include in the transaction price attributable to each separate performance obligation. Subsequent to the initial standards, the FASB has also issued several ASUs to clarify specific revenue recognition topics. This guidance will be effective for the Company for its fiscal year 2018, with early adoption permitted. The Company will adopt using the modified retrospective approach and does not expect this ASU to materially impact the Company’s consolidated financial statements. The most significant impact will be related to additional disclosures and the addition of a disaggregated revenue footnote. The disaggregated revenue footnote, as well as additional disclosures, will first be disclosed in the 2018 Form 10-Q for the first quarter.
In February 2016, the FASB issued ASU No. 2016-02, “Leases (ASC 842).” ASU No. 2016-02 requires lessees to recognize a right-of-use asset and corresponding lease liability for all leases with terms greater than twelve months. Recognition, measurement and presentation of expenses will depend on classification as a finance or operating lease. The new guidance also requires certain additional quantitative and qualitative disclosures. This guidance will be effective for the Company for its fiscal year 2019, with early adoption permitted, and the Company is currently evaluating the potential impact of this guidance. The adoption of this ASU is expected to result in a material increase to the Company’s consolidated balance sheets for right-of-use assets and lease liabilities.
In March 2016, the FASB issued ASU No. 2016-04, “Liabilities-Extinguishments of Liabilities (Subtopic 405-20): Recognition of breakage for certain prepaid stored-value products.” ASU No. 2016-04 provides a narrow scope exception to the guidance in Subtopic 405-20 to require that stored-value breakage be accounted for consistently with the breakage guidance in Topic 606. The amendments in this update contain specific guidance for derecognition of prepaid stored-value product liabilities, thereby eliminating the current and potential future diversity. This guidance will be effective for the Company for its fiscal year 2018, with early adoption permitted. The Company does not expect this ASU to materially impact the Company’s consolidated financial statements.
In August 2016, the FASB issued ASU No. 2016-15, “Statement of Cash Flows (Topic 230): Classification of Certain Cash Receipts and Cash Payments.” This update provides clarifications on the cash flow classification for eight specific cash flow issues: debt prepayment or debt extinguishment costs; settlement of zero-coupon debt instruments or other debt instruments with coupon interest rates that are insignificant in relation to the effective interest rate of the borrowing; contingent consideration payments made after a business combination; proceeds from the settlement of insurance claims; proceeds from the settlement of corporate-owned life insurance policies (COLIs) (including bank-owned life insurance policies (BOLIs)); distributions received from equity method investees; beneficial interests in securitization transactions; and separately identifiable cash flows and application of the predominance principle. The guidance will be effective for the Company for its fiscal year 2018, with early adoption permitted. The Company does not expect this ASU to materially impact the Company’s consolidated financial statements.
In January 2017, the FASB issued ASU No. 2017-04, “Intangibles – Goodwill and Other (Topic 350): Simplifying the Test for Goodwill Impairment.” The amendments in this update eliminate the second step of the goodwill impairment test and provide that an entity will apply a one-step quantitative test and record the amount of goodwill impairment as the excess of a reporting unit's carrying amount over its fair value,
74
not to exceed the total amount of goodwill allocated to the reporting unit. The new guidance does not amend the optional qualitative assessment of goodwill impairment. The guidance will be effective for the Company for its fiscal year 2020, with early adoption permitted. The Company does not expect this ASU to materially impact the Company’s consolidated financial statements.
In May 2017, the FASB issued ASU No. 2017-09, “Compensation – Stock Compensation (Topic 718): Scope of Modification Accounting.” The amendments in this update provide guidance about which changes to the terms or conditions of a share-based award require an entity to apply modification accounting in Topic 718. The guidance will be effective for the Company for its fiscal year 2018, with early adoption permitted. The Company does not expect this ASU to materially impact the Company’s consolidated financial statements.
No other new accounting pronouncements issued or effective during fiscal 2017 had, or are expected to have, a material impact on the Company’s consolidated financial statements.
4. Accounts Receivable
A summary of accounts receivable is as follows:
|
|
|
As Of |
|
|||||
|
|
|
December 31, 2017 |
|
|
January 1, 2017 |
|
||
|
Vendors |
|
$ |
15,355 |
|
|
$ |
13,686 |
|
|
Landlords |
|
|
4,290 |
|
|
|
2,583 |
|
|
Insurance |
|
|
1,137 |
|
|
|
3,803 |
|
|
Other |
|
|
5,111 |
|
|
|
5,156 |
|
|
Total |
|
$ |
25,893 |
|
|
$ |
25,228 |
|
The Company had recorded allowances for certain vendor receivables of $0.1 million at both December 31, 2017 and January 1, 2017.
5. Prepaid Expenses and Other Current Assets
A summary of prepaid expenses and other current assets is as follows:
|
|
|
As Of |
|
|||||
|
|
|
December 31, 2017 |
|
|
January 1, 2017 |
|
||
|
Prepaid rent |
|
$ |
14,785 |
|
|
$ |
12,971 |
|
|
Prepaid expenses |
|
$ |
9,354 |
|
|
$ |
6,288 |
|
|
Income tax receivable |
|
|
— |
|
|
|
2,148 |
|
|
Other current assets |
|
|
454 |
|
|
|
462 |
|
|
Total |
|
$ |
24,593 |
|
|
$ |
21,869 |
|
75
A summary of property and equipment, net is as follows:
|
|
|
As Of |
|
|||||
|
|
|
December 31, 2017 |
|
|
January 1, 2017 |
|
||
|
Land and Buildings |
|
$ |
151,309 |
|
|
$ |
130,821 |
|
|
Furniture, fixtures and equipment |
|
|
491,990 |
|
|
|
400,724 |
|
|
Leasehold improvements |
|
|
401,237 |
|
|
|
321,730 |
|
|
Construction in progress |
|
|
52,100 |
|
|
|
49,263 |
|
|
Total property and equipment |
|
|
1,096,636 |
|
|
|
902,538 |
|
|
Accumulated depreciation and amortization |
|
|
(383,605 |
) |
|
|
(297,878 |
) |
|
Property and equipment, net |
|
$ |
713,031 |
|
|
$ |
604,660 |
|
A summary of leased property and equipment under capital and financing lease obligations is as follows:
|
|
|
As Of |
|
|||||
|
|
|
December 31, 2017 |
|
|
January 1, 2017 |
|
||
|
Capital Leases—Buildings |
|
|
|
|
|
|
|
|
|
Gross asset balance |
|
$ |
16,745 |
|
|
$ |
11,338 |
|
|
Accumulated depreciation |
|
|
(4,257 |
) |
|
|
(3,133 |
) |
|
Net |
|
$ |
12,488 |
|
|
$ |
8,205 |
|
|
Financing Leases |
|
|
|
|
|
|
|
|
|
Gross asset balance |
|
|
151,599 |
|
|
|
135,946 |
|
|
Accumulated depreciation |
|
|
(17,941 |
) |
|
|
(14,681 |
) |
|
Net |
|
$ |
133,658 |
|
|
$ |
121,265 |
|
Depreciation expense was $96.6 million, $80.2 million and $69.1 million for 2017, 2016 and 2015, respectively. Depreciation expense is primarily reflected in direct store expenses on the consolidated statements of operations.
7. Intangible Assets
A summary of the activity and balances in intangible assets is as follows:
|
|
|
Balance at January 3, 2016 |
|
|
Additions (1) |
|
|
Balance at January 1, 2017 |
|
|||
|
Gross Intangible Assets |
|
|
|
|
|
|
|
|
|
|
|
|
|
Indefinite-lived trade names |
|
$ |
182,937 |
|
|
$ |
— |
|
|
$ |
182,937 |
|
|
Indefinite-lived liquor licenses |
|
|
2,023 |
|
|
|
— |
|
|
|
2,023 |
|
|
Finite-lived trade names |
|
|
1,800 |
|
|
|
— |
|
|
|
1,800 |
|
|
Leasehold interests |
|
|
18,300 |
|
|
|
473 |
|
|
|
18,773 |
|
|
Total intangible assets |
|
$ |
205,060 |
|
|
$ |
473 |
|
|
$ |
205,533 |
|
|
Accumulated Amortization |
|
|
|
|
|
|
|
|
|
|
|
|
|
Finite-lived trade names |
|
$ |
(645 |
) |
|
$ |
(180 |
) |
|
$ |
(825 |
) |
|
Leasehold interests |
|
|
(5,814 |
) |
|
|
(1,286 |
) |
|
|
(7,100 |
) |
|
Total accumulated amortization |
|
$ |
(6,459 |
) |
|
$ |
(1,466 |
) |
|
$ |
(7,925 |
) |
76
|
|
|
Balance at January 1, 2017 |
|
|
Additions |
|
|
Balance at December 31, 2017 |
|
|||
|
Gross Intangible Assets |
|
|
|
|
|
|
|
|
|
|
|
|
|
Indefinite-lived trade names |
|
$ |
182,937 |
|
|
$ |
— |
|
|
$ |
182,937 |
|
|
Indefinite-lived liquor licenses |
|
|
2,023 |
|
|
|
— |
|
|
|
2,023 |
|
|
Finite-lived trade names |
|
|
1,800 |
|
|
|
— |
|
|
|
1,800 |
|
|
Leasehold interests |
|
|
18,773 |
|
|
|
— |
|
|
|
18,773 |
|
|
Total intangible assets |
|
$ |
205,533 |
|
|
$ |
— |
|
|
$ |
205,533 |
|
|
Accumulated Amortization |
|
|
|
|
|
|
|
|
|
|
|
|
|
Finite-lived trade names |
|
$ |
(825 |
) |
|
$ |
(180 |
) |
|
$ |
(1,005 |
) |
|
Leasehold interests |
|
|
(7,100 |
) |
|
|
(1,223 |
) |
|
|
(8,323 |
) |
|
Total accumulated amortization |
|
$ |
(7,925 |
) |
|
$ |
(1,403 |
) |
|
$ |
(9,328 |
) |
|
|
(1) |
Additions during 2016 represent leasehold interests as a result of adjustments to the leases acquired in 2015 and a lease acquired in 2016. |
Amortization expense was $1.4 million, $1.5 million and $1.3 million for 2017, 2016 and 2015, respectively. Future amortization associated with the net carrying amount of finite-lived intangible assets is as follows:
|
2018 |
|
|
1,402 |
|
|
2019 |
|
|
1,386 |
|
|
2020 |
|
|
1,375 |
|
|
2021 |
|
|
1,339 |
|
|
2022 |
|
|
1,189 |
|
|
Thereafter |
|
|
4,554 |
|
|
Total amortization |
|
$ |
11,245 |
|
The remaining weighted-average amortization period of leasehold interests acquired total 10.0 years. The remaining amortization period of the finite-lived trade name is 4.4 years.
8. Goodwill
The balance of our goodwill was $368.1 million as of December 31, 2017, January 1, 2017 and January 3, 2016. As of December 31, 2017, January 1, 2017 and January 3, 2016, the Company had no accumulated goodwill impairment losses. The goodwill was related to the acquisition of Sunflower Farmers Market stores and Henry’s Farmers Market stores.
9. Other Assets
A summary of other assets is as follows:
|
|
|
As Of |
|
|||||
|
|
|
December 31, 2017 |
|
|
January 1, 2017 |
|
||
|
Other assets |
|
|
4,782 |
|
|
|
5,521 |
|
77
As of December 31, 2017, the other assets balance primarily consists of claim amounts in excess of self-insurance retentions to be paid by the Company’s insurance provider (see Note 14, “Self-Insurance Programs”), sublease deferred rent, and miscellaneous other assets.
10. Accounts Payable and Other Accrued Liabilities
A summary of other accrued liabilities is as follows:
|
|
|
As Of |
|
|||||
|
|
|
December 31, 2017 |
|
|
January 1, 2017 |
|
||
|
Trade accounts payable |
|
$ |
119,034 |
|
|
$ |
115,326 |
|
|
Accrued occupancy related (CAM, property taxes, etc.) |
|
|
21,766 |
|
|
|
14,650 |
|
|
Self-insurance reserves |
|
|
19,714 |
|
|
|
19,161 |
|
|
Capital expenditures |
|
|
16,409 |
|
|
|
18,884 |
|
|
Distribution centers |
|
|
15,980 |
|
|
|
8,349 |
|
|
Gift cards |
|
|
13,099 |
|
|
|
12,264 |
|
|
Income taxes payable |
|
|
3,391 |
|
|
|
— |
|
|
Other |
|
|
35,460 |
|
|
|
25,292 |
|
|
Total |
|
$ |
244,853 |
|
|
$ |
213,926 |
|
11. Accrued Salaries and Benefits
A summary of accrued salaries and benefits is as follows:
|
|
|
As Of |
|
|||||
|
|
|
December 31, 2017 |
|
|
January 1, 2017 |
|
||
|
Bonuses |
|
|
16,957 |
|
|
|
8,168 |
|
|
Payroll |
|
|
14,906 |
|
|
$ |
12,972 |
|
|
Vacation |
|
|
12,281 |
|
|
|
10,633 |
|
|
Other |
|
|
1,479 |
|
|
|
1,086 |
|
|
Total |
|
$ |
45,623 |
|
|
$ |
32,859 |
|
12. Long-Term Debt
A summary of long-term debt is as follows:
|
|
|
|
|
|
|
As Of |
|
|||||
|
Facility |
|
Maturity |
|
Interest Rate |
|
December 31, 2017 |
|
|
January 1, 2017 |
|
||
|
Senior secured debt |
|
|
|
|
|
|
|
|
|
|
|
|
|
$450.0 million Credit Facility |
|
April 17, 2020 |
|
Variable |
|
$ |
348,000 |
|
|
$ |
255,000 |
|
|
Total debt |
|
|
|
|
|
|
348,000 |
|
|
|
255,000 |
|
|
Long-term debt |
|
|
|
|
|
$ |
348,000 |
|
|
$ |
255,000 |
|
78
Senior Secured Revolving Credit Facility
April 2015 Refinancing
On April 17, 2015, the Company’s subsidiary, Sprouts Farmers Markets Holdings, LLC (“Intermediate Holdings”), as borrower, entered into a credit agreement (the “Credit Agreement”) to replace the Former Credit Facility (as defined below). The Credit Agreement provides for a revolving credit facility with an initial aggregate commitment of $450.0 million (the “Credit Facility”), which may be increased from time to time pursuant to an expansion feature set forth in the Credit Agreement.
Concurrently with the closing of the Credit Agreement, the Company borrowed $260.0 million to pay off its existing $257.8 million former term loan (the “April 2015 Refinancing”), to terminate all commitments under its existing senior secured credit facility, dated April 23, 2013 (the “Former Credit Facility”) and to pay transaction costs related to the April 2015 Refinancing. Such repayment resulted in a $5.5 million loss on extinguishment of debt due to the write-off of deferred financing costs and original issue discount. No amounts were outstanding under the $60.0 million secured revolving credit facility component of the Former Credit Facility on April 17, 2015. The remaining proceeds of loans made under the Credit Facility were used for general corporate purposes.
The Company capitalized debt issuance costs of $2.3 million related to the Credit Facility, which are being amortized on a straight-line basis to interest expense over the five-year term of the Credit Facility.
The Credit Agreement also provides for a letter of credit subfacility and a $15.0 million swingline facility. Letters of credit issued under the Credit Agreement reduce the borrowing capacity of the Credit Facility. Letters of credit totaling $27.5 million have been issued as of December 31, 2017, primarily to support the Company’s insurance programs.
Guarantees
Obligations under the Credit Facility are guaranteed by the Company and all of its current and future wholly-owned material domestic subsidiaries, and are secured by first-priority security interests in substantially all of the assets of the Company and its subsidiary guarantors, including, without limitation, a pledge by the Company of its equity interest in Intermediate Holdings.
Interest and Fees
Loans under the Credit Facility bear interest, at the Company’s option, either at adjusted LIBOR plus 1.50% per annum, or a base rate plus 0.50% per annum. The interest rate margins are subject to adjustment pursuant to a pricing grid based on the Company’s total gross leverage ratio, as defined in the Credit Agreement. Under the terms of the Credit Agreement, the Company is obligated to pay a commitment fee on the available unused amount of the Credit Facility commitments equal to 0.20% per annum.
Outstanding letters of credit under the Credit Facility are subject to a participation fee of 1.50% per annum and an issuance fee of 0.125% per annum.
Payments and Borrowings
The Credit Facility is scheduled to mature, and the commitments thereunder will terminate on April 17, 2020, subject to extensions as set forth in the Credit Agreement.
The Company may repay loans and reduce commitments under the Credit Agreement at any time in agreed-upon minimum principal amounts, without premium or penalty (except LIBOR breakage costs, if applicable).
79
During 2016, the Company borrowed $105.0 million to be used in connection with the Company’s -$250.0 million share repurchase program and made a total of $10.0 million of principal payments; resulting in total outstanding debt under the Credit Facility of $255.0 million at January 1, 2017. During 2017, the Company borrowed an additional $153.0 million to be used in connection with the Company’s $250.0 million share repurchase program (see Note 20, “Capital Stock”) and made a total of $60.0 million of principal payments; resulting in total outstanding debt under the Credit Facility of $348.0 million at December 31, 2017.
Covenants
The Credit Agreement contains financial, affirmative and negative covenants. The negative covenants include, among other things, limitations on the Company’s ability to:
|
|
• |
incur additional indebtedness; |
|
|
• |
grant additional liens; |
|
|
• |
enter into sale-leaseback transactions; |
|
|
• |
make loans or investments; |
|
|
• |
merge, consolidate or enter into acquisitions; |
|
|
• |
pay dividends or distributions; |
|
|
• |
enter into transactions with affiliates; |
|
|
• |
enter into new lines of business; |
|
|
• |
modify the terms of debt or other material agreements; and |
|
|
• |
change its fiscal year |
Each of these covenants is subject to customary and other agreed-upon exceptions.
In addition, the Credit Agreement requires that the Company and its subsidiaries maintain a maximum total net leverage ratio not to exceed 3.00 to 1.00 and minimum interest coverage ratio not to be less than 1.75 to 1.00. Each of these covenants is tested on the last day of each fiscal quarter, starting with the fiscal quarter ended June 28, 2015.
The Company was in compliance with all applicable covenants under the Credit Agreement as of December 31, 2017 and January 1, 2017.
13. Other Long-Term Liabilities
A summary of other long-term liabilities is as follows:
|
|
|
As Of |
|
|||||
|
|
|
December 31, 2017 |
|
|
January 1, 2017 |
|
||
|
Unamortized lease incentives |
|
$ |
60,942 |
|
|
$ |
54,176 |
|
|
Deferred rent |
|
|
28,791 |
|
|
|
24,581 |
|
|
Self-insurance reserves |
|
|
22,756 |
|
|
|
22,399 |
|
|
Unfavorable leasehold interests |
|
|
7,727 |
|
|
|
8,954 |
|
|
Other |
|
|
10,424 |
|
|
|
6,090 |
|
|
Total |
|
$ |
130,640 |
|
|
$ |
116,200 |
|
80
Unfavorable leasehold interests of $16.7 million were recognized in connection with previous business combinations in 2011 and 2012 and are being amortized on a straight-line basis over the term of the underlying leases.
14. Self-Insurance Programs
The Company is self-insured for costs related to workers’ compensation, general liability and employee health benefits up to certain stop-loss limits. The Company establishes reserves for the ultimate obligation of reported and incurred but not reported (“IBNR”) claims. IBNR claims are estimated using historical claim information, demographic factors, severity factors and other actuarial assumptions.
The Company purchases coverage from third-party insurers for exposures in excess of certain stop-loss limits and recorded receivables of $2.6 million and a $6.1 million from its insurance carriers for payments expected to be made in excess of self-insured retentions at December 31, 2017 and January 1, 2017, respectively. The Company expects $1.1 million of the 2017 receivable to be paid during 2018. See Note 10, “Accounts Payable and Other Accrued Liabilities,” and Note 13, “Other Long-Term Liabilities” for amounts recorded for general liability and workers’ compensation liabilities.
15. Defined Contribution Plan
The Company maintains the Sprouts Farmers Market, Inc. Employee 401(k) Savings Plan (the “Plan”), which is a defined contribution plan covering all eligible team members. Under the provisions of the Plan, participants may direct the Company to defer a portion of their compensation to the Plan, subject to the Internal Revenue Code limitations. The Company provides for an employer matching contribution equal to 50% of each dollar contributed by the participants up to 6% of their eligible compensation.
Total expense recorded for the matching under the Plan:
|
Year Ended |
|
|||||||||
|
December 31, 2017 |
|
|
January 1, 2017 |
|
|
January 3, 2016 |
|
|||
|
$ |
4,067 |
|
|
$ |
3,354 |
|
|
$ |
2,656 |
|
16. Closed Store Reserves
A summary of closed store reserve activity is as follows:
|
|
|
As Of |
|
|||||
|
|
|
December 31, 2017 |
|
|
January 1, 2017 |
|
||
|
Beginning balance |
|
$ |
1,083 |
|
|
$ |
2,017 |
|
|
Additions |
|
|
— |
|
|
|
— |
|
|
Usage |
|
|
(492 |
) |
|
|
(998 |
) |
|
Adjustments |
|
|
220 |
|
|
|
64 |
|
|
Ending balance |
|
$ |
811 |
|
|
$ |
1,083 |
|
Usage during 2017 primarily related to lease payments made during the period for closed stores.
17. Income Taxes
On December 22, 2017, the legislation commonly referred to as the Tax Cuts and Jobs Act (the “Tax Act”) was enacted into law, which changes various corporate income tax provisions within the existing Internal Revenue Code. Substantially all the provisions of the Tax Act are effective for taxable
81
years beginning after December 31, 2017.The most significant changes that impact the Company are the reduction in the corporate federal income tax rate from 35% to 21% and 100% bonus depreciation for qualified property acquired and placed in service after September 27, 2017 and before January 1, 2023. In a manner consistent with ASC 740-10-25-47, the effect of a change in tax law or rates shall be recognized at the date of enactment, accordingly, the Company accounted for the corporate federal income tax rate reduction in the fourth quarter of 2017.
The staff of the US Securities and Exchange Commission (SEC) has recognized the complexity of reflecting the impacts of the Tax Act, and on December 22, 2017 issued guidance in Staff Accounting Bulletin 118 (SAB 118) which clarifies accounting for income taxes under ASC 740 if information is not yet available or complete and provides for up to a one year period in which to complete the required analyses and accounting (the measurement period). SAB 118 describes three scenarios (or “buckets”) associated with a company’s status of accounting for the Tax Act: (1) a company is complete with its accounting for certain effects of the Tax Act, (2) a company is able to determine a reasonable estimate for certain effects of the Tax Act and records that estimate as a provisional amount, or (3) a company is not able to determine a reasonable estimate and therefore continues to apply ASC 740, based on the provisions of the tax laws that were in effect immediately prior to the Tax Act being enacted.
The Company has substantially completed the measurement and accounting of certain effects of the enactment of the Tax Act which have been reflected in the 2017 financial statements. The Company reduced its net deferred tax liability, resulting in a non-cash income tax benefit of approximately $18.7 million in the fourth quarter of 2017. The Company anticipates the issuance of guidance and regulations for various provisions in the Tax Act which may have an impact on the amounts reflected in the 2017 financial statements. The Company will evaluate future guidance and regulations and reflect changes in the financial statements in the period the accounting is completed.
Income Tax Provision
The income tax provision consists of the following:
|
|
|
Year Ended |
|
|||||||||
|
|
|
December 31, 2017 |
|
|
January 1, 2017 |
|
|
January 3, 2016 |
|
|||
|
U.S. Federal—current |
|
$ |
(31,667 |
) |
|
$ |
(44,588 |
) |
|
$ |
(51,322 |
) |
|
U.S. Federal—deferred |
|
|
(6,551 |
) |
|
|
(19,293 |
) |
|
|
(15,155 |
) |
|
U.S. Federal—total |
|
|
(38,218 |
) |
|
|
(63,881 |
) |
|
|
(66,477 |
) |
|
State—current |
|
|
(7,337 |
) |
|
|
(9,036 |
) |
|
|
(9,619 |
) |
|
State—deferred |
|
|
(1,523 |
) |
|
|
(1,369 |
) |
|
|
(906 |
) |
|
State—total |
|
|
(8,860 |
) |
|
|
(10,405 |
) |
|
|
(10,525 |
) |
|
Total provision |
|
$ |
(47,078 |
) |
|
$ |
(74,286 |
) |
|
$ |
(77,002 |
) |
82
Income tax provision differed from the amounts computed by applying the U.S. federal income tax rate to pretax income as a result of the following:
|
|
|
Year Ended |
|
|||||||||
|
|
|
December 31, 2017 |
|
|
January 1, 2017 |
|
|
January 3, 2016 |
|
|||
|
Federal statutory rate |
|
|
35.00 |
% |
|
|
35.00 |
% |
|
|
35.00 |
% |
|
Decrease in income taxes resulting from: |
|
|
|
|
|
|
|
|
|
|
|
|
|
State income taxes, net of federal benefit |
|
|
3.20 |
|
|
|
3.73 |
|
|
|
3.82 |
|
|
Tax Act benefit |
|
|
(9.10 |
) |
|
|
— |
|
|
|
— |
|
|
Excess tax benefits from share based payments |
|
|
(4.33 |
) |
|
|
— |
|
|
|
— |
|
|
Other, net |
|
|
(1.86 |
) |
|
|
(1.32 |
) |
|
|
(1.44 |
) |
|
Effective tax rate |
|
|
22.91 |
% |
|
|
37.41 |
% |
|
|
37.38 |
% |
The effective income tax rate decreased to 22.91% in 2017 from 37.41% in 2016 primarily due to the enactment of the Tax Act as disclosed above and the recognition of excess tax benefits related to the exercise or vesting of equity based awards in the income tax provision resulting from the adoption of ASU 2016-09. See Note 3 “Significant Accounting Policies.” The effective income tax rate increased to 37.41% in 2016 from 37.38% in 2015 as a result of a slight decrease in tax credits and enhanced charitable food contribution deductions for 2016.
Excess tax benefits associated with share-based payment awards are recognized as income tax expense or benefit in the income statement. The tax effects of exercised or vested awards are treated as discrete items in the reporting period in which they occur. The income tax benefits resulting from equity-based awards were $9.9 million for 2017 and are reflected as a reduction to the 2017 income tax provision. The income tax benefits resulting from equity-based awards were $3.7 million and $20.0 million for 2016 and 2015 and recorded in Additional Paid-in Capital under prior accounting guidance.
Deferred Taxes
Significant components of the Company’s deferred tax assets and deferred tax liabilities are as follows:
|
|
|
As Of |
|
|||||
|
|
December 31, 2017 |
|
|
January 1, 2017 |
|
|||
|
Deferred tax assets |
|
|
|
|
|
|
|
|
|
Employee benefits |
|
$ |
20,332 |
|
|
$ |
26,650 |
|
|
Tax credits |
|
|
410 |
|
|
|
408 |
|
|
Lease related |
|
|
61,489 |
|
|
|
84,744 |
|
|
Other accrued liabilities |
|
|
5,605 |
|
|
|
9,986 |
|
|
Charitable contribution carryforward |
|
|
12,800 |
|
|
|
15,928 |
|
|
Inventories and other |
|
|
1,844 |
|
|
|
2,087 |
|
|
Total gross deferred tax assets |
|
|
102,480 |
|
|
|
139,803 |
|
|
Deferred tax liabilities |
|
|
|
|
|
|
|
|
|
Depreciation and amortization |
|
|
(109,245 |
) |
|
|
(137,230 |
) |
|
Intangible assets |
|
|
(20,301 |
) |
|
|
(21,021 |
) |
|
Other |
|
|
— |
|
|
|
(815 |
) |
|
Total gross deferred tax liabilities |
|
|
(129,546 |
) |
|
|
(159,066 |
) |
|
Net deferred tax (liability) / asset |
|
$ |
(27,066 |
) |
|
$ |
(19,263 |
) |
83
A valuation allowance is established for deferred tax assets if it is more likely than not that these items will either expire before the Company is able to realize their benefits, or that the realization of future deductions is uncertain.
Management performs an assessment over future taxable income to analyze whether it is more likely than not that some portion or all of the deferred tax assets will not be realized. The ultimate realization of deferred tax assets is dependent upon the generation of future taxable income during the periods in which those temporary differences become deductible. The Company has evaluated all available positive and negative evidence and believes it is probable that the deferred tax assets will be realized and has not recorded a valuation allowance against the Company’s deferred tax assets as of December 31, 2017 and January 1, 2017.
The Company has state income tax credits of $0.4 million which are available to offset future state income taxes. These credits have no expiration date.
The Company applies the authoritative accounting guidance under ASC 740 for the recognition, measurement, classification and disclosure of uncertain tax positions taken or expected to be taken in a tax return.
A reconciliation of the beginning and ending amounts of unrecognized tax benefits is as follows:
|
|
|
As Of |
|
|||||||||
|
|
|
December 31, 2017 |
|
|
January 1, 2017 |
|
|
January 3, 2016 |
|
|||
|
Beginning balance |
|
$ |
819 |
|
|
$ |
737 |
|
|
$ |
626 |
|
|
Additions based on tax positions related to the current year |
|
|
95 |
|
|
|
104 |
|
|
|
114 |
|
|
Reductions for tax positions for prior years |
|
|
(120 |
) |
|
|
(22 |
) |
|
|
(3 |
) |
|
Ending balance |
|
$ |
794 |
|
|
$ |
819 |
|
|
$ |
737 |
|
At both December 31, 2017 and January 1, 2017, the Company had unrecognized tax benefits of $0.8 million (tax effected) that would impact the effective tax rate if recognized.
The Company’s policy is to recognize accrued interest and penalties as a component of income tax expense.
The Company anticipates an increase in the total amount of unrecognized tax benefits during the next twelve months related to depreciation for transaction cost allocation in the amount of $0.1 million.
The Company files income tax returns with federal and state tax authorities within the United States. The statute of limitations for income tax examinations remains open for federal tax returns for tax years 2014 through 2016 and state tax returns for the tax years 2013 through 2016.
18. Related-Party Transactions
A member of the Company’s board of directors is an investor in a company that is a supplier of coffee to the Company for resale. During 2017, 2016 and 2015, purchases from this company were $10.9 million, $9.8 million and $9.7 million, respectively. As of December 31, 2017, January 1, 2017 and January 3, 2016, the Company had no receivable recorded from this vendor. As of December 31, 2017, January 1, 2017 and January 3, 2016, the Company had recorded accounts payable due to this vendor of $0.7 million, $0.7 million and $0.7 million, respectively.
On November 3, 2015, the Company entered into an agreement to purchase an airplane from this board member for $7.5 million. The transaction closed on December 17, 2015.
84
The Company’s former Executive Chairman of the Board has been the chief executive officer, an equity investor, and lender to a technology supplier to the Company. During 2017, 2016 and 2015, purchases from this supplier and its predecessors were $6.3 million, $7.9 million and $6.5 million, respectively. As of December 31, 2017, January 1, 2017, January 3, 2016, the Company had no receivable recorded from this vendor. As of December 31, 2017, January 1, 2017, January 3, 2016, the Company had recorded accounts payable due to the supplier of $0.1 million, $0.3 million and $0.4 million, respectively. This Executive Chairman of the Board retired from our Board effective February 20, 2017.
19. Commitments and Contingencies
Operating Lease Commitments
The Company’s leases include stores, office and warehouse buildings. These leases had an average remaining lease term of approximately nine years as of December 31, 2017.
Rent expense charged to operations in 2017, 2016 and 2015 totaled $120.5 million, $104.8 million and $88.1 million, respectively.
Future minimum lease obligations for operating leases with initial terms in excess of one year at December 31, 2017 are as follows:
|
2018 |
|
$ |
142,620 |
|
|
|
|
153,583 |
|
|
|
2020 |
|
|
153,241 |
|
|
2021 |
|
|
148,970 |
|
|
2022 |
|
|
140,957 |
|
|
Thereafter |
|
|
856,826 |
|
|
Total payments |
|
$ |
1,596,197 |
|
The Company has subtenant agreements under which it will receive rent as follows:
Capital and Financing Lease Commitments
The Company is committed under certain capital and financing leases for rental of buildings and equipment. These leases expire or become subject to renewal clauses at various dates from 2019 to 2034.
85
As of December 31, 2017, future minimum lease payments required by all capital and financing leases during the initial lease term are as follows:
|
Fiscal Year |
|
Capital Leases |
|
|
Financing Leases |
|
||
|
2018 |
|
$ |
2,069 |
|
|
$ |
14,764 |
|
|
2019 |
|
|
1,912 |
|
|
|
14,344 |
|
|
2020 |
|
|
1,811 |
|
|
|
14,351 |
|
|
2021 |
|
|
1,811 |
|
|
|
13,656 |
|
|
2022 |
|
|
1,831 |
|
|
|
12,044 |
|
|
Thereafter |
|
|
13,905 |
|
|
|
43,791 |
|
|
Total |
|
|
23,339 |
|
|
|
112,950 |
|
|
Plus balloon payment (financing leases) |
|
|
— |
|
|
|
94,041 |
|
|
Less amount representing interest |
|
|
(8,946 |
) |
|
|
(92,258 |
) |
|
Net present value of capital and financing lease obligations |
|
|
14,393 |
|
|
|
114,733 |
|
|
Less current portion |
|
|
(925 |
) |
|
|
(4,751 |
) |
|
Total long-term |
|
$ |
13,468 |
|
|
$ |
109,982 |
|
The table above does not include $3.6 million of current financing lease obligations expected to pass sale-leaseback accounting during 2018. The final payment under the financing lease obligations is a noncash payment which represents the conveyance of the property to the buyer-lessor at the end of the lease term, described as balloon payment in the table above.
Other Commitments and Contingencies
The Company is exposed to claims and litigation matters arising in the ordinary course of business and uses various methods to resolve these matters that are believed to best serve the interests of the Company’s stakeholders. The Company’s primary contingencies are associated with insurance and self-insurance obligations. Estimation of insurance and self-insurance liabilities require significant judgments, and actual claim settlements and associated expenses may differ from the Company’s current provisions for loss. See Note 14, “Self-Insurance Programs” for more information.
In addition to our lease obligations, the Company maintains certain purchase commitments with various vendors to ensure its operational needs are fulfilled. As of December 31, 2017, such future purchase commitments consisted of $63.5 million.
Commitments related to the Company’s business operations cover varying periods of time and are not individually significant. These commitments are expected to be fulfilled with no adverse consequences to the Company’s operations or financial conditions.
Securities Action
On March 4, 2016, a complaint was filed in the Superior Court for the State of Arizona against the Company and certain of its directors and officers on behalf of a purported class of purchasers of shares of the Company’s common stock in the Company’s underwritten secondary public offering which closed on March 10, 2015 (the “March 2015 Offering”). The complaint purports to state claims under Sections 11, 12 and 15 of the Securities Act of 1933, as amended, based on an alleged failure by the Company to disclose adequate information about produce price deflation in the March 2015 Offering documents. The complaint seeks damages on behalf of the purported class in an unspecified amount, rescission, and an award of reasonable costs and attorneys’ fees. After removal to federal court, the plaintiff sought remand, which the court granted in March 2017. The Company has appealed the order granting remand to the Ninth Circuit Court of Appeals. On May 25, 2017, the Company filed a Motion to Dismiss in the Superior Court for the State of Arizona, which the court granted in part and denied in part by order entered August
86
30, 2017. The Company answered the complaint on September 28, 2017. The Company will continue to defend this case vigorously, but it is not possible at this time to reasonably estimate the outcome of, or any potential liability from, the case.
20. Capital Stock
Common stock
As of December 31, 2017, 132,823,981 shares of the Company’s common stock were issued and outstanding, including 373,889 restricted shares, after the repurchase and retirement of 9,696,819 shares during 2017 and the repurchase and retirement of 13,242,483 shares during 2016, as described below. As of December 31, 2017, 5,809,319 shares of common stock are reserved for issuance under the 2013 Incentive Plan (see Note 25, “Equity-Based Compensation”). The following table outlines the options exercised in exchange for the issuance of shares of common stock during 2017, 2016, and 2015.
|
|
|
Year Ended |
|
|||||||||
|
|
|
December 31, 2017 |
|
|
January 1, 2017 |
|
|
January 3, 2016 |
|
|||
|
Options exercised |
|
|
1,863,059 |
|
|
|
565,568 |
|
|
|
1,773,518 |
|
Share Repurchases
On November 4, 2015, the Company’s board of directors authorized a $150 million common stock share repurchase program, which was completed during the second quarter of 2016. On September 6, 2016, the Company’s board of directors authorized a $250 million common stock share repurchase program, which was completed during the first quarter of 2017. On February 20, 2017, the Company’s board of directors authorized a new $250 million common stock share repurchase program. The following table outlines the share repurchase programs authorized by the Board, and the related repurchase activity and available authorization as of December 31, 2017 (in thousands).
|
Effective date |
|
Expiration date |
|
Amount authorized |
|
|
Cost of repurchases |
|
|
Authorization available |
|
|||
|
|
|
|
|
|
|
|||||||||
|
November 4, 2015 |
|
November 4, 2017 |
|
$ |
150,000 |
|
|
$ |
150,000 |
|
|
$ |
— |
|
|
September 6, 2016 |
|
December 31, 2017 |
|
|
250,000 |
|
|
|
250,000 |
|
|
|
— |
|
|
February 20, 2017 |
|
December 31, 2018 |
|
$ |
250,000 |
|
|
$ |
123,400 |
|
|
$ |
126,600 |
|
The shares under the Company’s repurchase programs may be purchased on a discretionary basis from time to time prior to the applicable expiration date, subject to general business and market conditions and other investment opportunities, through open market purchases, privately negotiated transactions, or other means, including through Rule 10b5-1 trading plans. The Board’s authorization of the share repurchase programs does not obligate the Company to acquire any particular amount of common stock, and the repurchase programs may be commenced, suspended, or discontinued at any time. The Company has used borrowings under its Credit Facility to assist with the repurchase programs (see Note 12, “Long-Term Debt”).
Share repurchase activity under the Company’s repurchase programs for the periods indicated was as follows (total cost in thousands):
|
|
|
Year Ended |
|
|||||
|
|
|
December 31, 2017 |
|
|
January 1, 2017 |
|
||
|
Number of common shares acquired |
|
|
9,696,819 |
|
|
|
13,242,483 |
|
|
Average price per common share acquired |
|
$ |
20.98 |
|
|
$ |
22.22 |
|
|
Total cost of common shares acquired |
|
$ |
203,392 |
|
|
$ |
294,265 |
|
87
Shares purchased under the Company’s repurchase programs were subsequently retired.
Preferred Stock
The Company’s board of directors is authorized, subject to limitations prescribed by Delaware law, to issue up to 10,000,000 shares of the Company’s preferred stock in one or more series, to establish from time to time the number of shares to be included in each series, to fix the designation, powers, preferences, and rights of the shares of each series and any of its qualifications, limitations, or restrictions, in each case without further action by the Company’s stockholders. The Company’s board of directors can also increase or decrease the number of shares of any series of preferred stock, but not below the number of shares of that series then outstanding. The Company’s board of directors may authorize the issuance of preferred stock with voting or conversion rights that could adversely affect the voting power or other rights of the holders of the common stock. The issuance of preferred stock, while providing flexibility in connection with possible acquisitions and other corporate purposes, could, among other things, have the effect of delaying, deferring, or preventing a change in control of the Company and might adversely affect the market price of the Company’s common stock and the voting and other rights of the holders of the Company’s common stock. The Company has no current plan to issue any shares of preferred stock.
21. Net Income per Share
The computation of net income per share is based on the number of weighted average shares outstanding during the period. The computation of diluted net income per share includes the dilutive effect of share equivalents consisting of incremental shares deemed outstanding from the assumed exercise of options.
A reconciliation of the numerators and denominators of the basic and diluted net income per share calculations is as follows (in thousands, except per share amounts):
|
|
|
Year Ended |
|
|||||||||
|
|
|
December 31, 2017 |
|
|
January 1, 2017 |
|
|
January 3, 2016 |
|
|||
|
Basic net income per share: |
|
|
|
|
|
|
|
|
|
|
|
|
|
Net income |
|
$ |
158,440 |
|
|
$ |
124,306 |
|
|
$ |
128,991 |
|
|
Weighted average shares outstanding |
|
|
135,169 |
|
|
|
147,311 |
|
|
|
153,099 |
|
|
Basic net income per share |
|
$ |
1.17 |
|
|
$ |
0.84 |
|
|
$ |
0.84 |
|
|
Diluted net income per share: |
|
|
|
|
|
|
|
|
|
|
|
|
|
Net income |
|
$ |
158,440 |
|
|
$ |
124,306 |
|
|
$ |
128,991 |
|
|
Weighted average shares outstanding |
|
|
135,169 |
|
|
|
147,311 |
|
|
|
153,099 |
|
|
Dilutive effect of equity-based awards: |
|
|
|
|
|
|
|
|
|
|
|
|
|
Assumed exercise of options to purchase shares |
|
|
2,378 |
|
|
|
2,232 |
|
|
|
2,737 |
|
|
Restricted Stock Units |
|
|
142 |
|
|
|
58 |
|
|
|
37 |
|
|
Restricted Stock Awards |
|
|
119 |
|
|
|
17 |
|
|
|
— |
|
|
Performance Share Awards |
|
|
76 |
|
|
|
35 |
|
|
|
4 |
|
|
Weighted average shares and equivalent shares outstanding |
|
|
137,884 |
|
|
|
149,653 |
|
|
|
155,877 |
|
|
Diluted net income per share |
|
$ |
1.15 |
|
|
$ |
0.83 |
|
|
$ |
0.83 |
|
88
The computation of diluted earnings per share for 2017 does not include 1,908,262 options, 10,364 RSUs, and 148,944 PSAs as those awards were antidilutive. The computation of diluted earnings per share for 2016 does not include 1,762,903 options, 14,404 RSUs, and 92,942 PSAs as those awards were antidilutive. The computation of diluted earnings per share for 2015 does not include 514,377 options as those options were antidilutive.
22. Derivative Financial Instruments
We have entered into an interest rate swap agreement in 2017 to manage our cash flow associated with variable interest rates. This forward contract has been designated and qualifies as a cash flow hedge, and its change in fair value is recorded as a component of other comprehensive income and reclassified into earnings in the same period or periods in which the forecasted transaction occurs. The forward contract consists of five cash flow hedges. To qualify as a hedge, we need to formally document, designate and assess the effectiveness of the transactions that receive hedge accounting.
The notional dollar amount of the five outstanding swaps at December 31, 2017 was $250.0 million under which we pay a fixed rate and received a variable rate of interest (cash flow swap). The cash flow swaps hedge the change in interest rates on debt related to fluctuations in interest rates and each have a length of one year and mature annually from 2018 to 2022. These interest rate swaps have been designated and qualify as cash flow hedges and have met the requirements to assume zero ineffectiveness. We review the effectiveness of our hedging instruments on a quarterly basis.
The counterparties to our derivative financial instruments are major financial institutions. We evaluate the credit ratings of the financial institutions and believe that credit risk is at an acceptable level.
The following table summarizes the fair value of our derivative instruments (in thousands):
|
|
|
Year Ended December 31, 2017 |
|
|
Year Ended January 1, 2017 |
|
||||||
|
|
|
Balance Sheet Location |
|
Fair Value |
|
|
Balance Sheet Location |
|
Fair Value |
|
||
|
Derivatives designated as hedging instruments |
|
|
|
|
|
|
|
|
|
|
|
|
|
Interest rate swaps |
|
Other Accrued and Long-term Liabilities |
|
$ |
1,064 |
|
|
- N/A - |
|
$ |
— |
|
The gain or loss on these derivative instruments is recognized in OCI, with the portion related to current period interest payments reclassified to “Interest expense” in the Statements of Income. The following table summarizes these gains and losses for 2017 and 2016 (in thousands):
|
|
|
Year Ended December 31, 2017 |
|
|
Year Ended January 1, 2017 |
|
||
|
Consolidated Statements of Income Classification |
|
|
|
|
|
|
|
|
|
Interest Expense |
|
$ |
9 |
|
|
$ |
— |
|
89
The following table presents the changes in accumulated other comprehensive income for the year ended December 31, 2017 (in thousands):
|
|
|
Cash Flow Hedges |
|
|
|
Balance at January 1, 2017 |
|
|
— |
|
|
Other comprehensive loss before reclassifications |
|
|
(1,064 |
) |
|
Amounts reclassified from accumulated other comprehensive loss |
|
|
9 |
|
|
Total before tax |
|
|
(1,055 |
) |
|
Tax benefit |
|
|
271 |
|
|
Net current year other comprehensive loss |
|
|
(784 |
) |
|
Balance at December 31, 2017 |
|
|
(784 |
) |
Amounts reclassified from accumulated other comprehensive income (loss) are included within interest expense on the Consolidated Statement of Operations.
24. Fair Value Measurements
The Company records its financial assets and liabilities in accordance with the framework for measuring fair value in accordance with GAAP. This framework establishes a fair value hierarchy that prioritizes the inputs used to measure fair value:
Level 1: Quoted prices for identical instruments in active markets.
Level 2: Quoted prices for similar instruments in active markets; quoted prices for identical or similar instruments in markets that are not active; and model-derived valuations in which all significant inputs and significant value drivers are observable in active markets.
Level 3: Valuations derived from valuation techniques in which one or more significant inputs or significant value drivers are unobservable.
Fair value measurements of nonfinancial assets and nonfinancial liabilities are primarily used in the valuation of derivative instruments, impairment analysis of goodwill, intangible assets, and long-lived assets and in the valuation of store closure and exit costs.
The following tables present our fair value hierarchy for our financial assets and liabilities measured at fair value on a recurring basis as of December 31, 2017 and January 1, 2017 (in thousands):
|
Year Ended December 31, 2017 |
|
Level 1 |
|
|
Level 2 |
|
|
Level 3 |
|
|
Total |
|
||||
|
Long-term debt |
|
$ |
— |
|
|
$ |
348,000 |
|
|
$ |
— |
|
|
$ |
348,000 |
|
|
Interest rate swap liability |
|
$ |
— |
|
|
$ |
1,064 |
|
|
$ |
— |
|
|
$ |
1,064 |
|
|
Closed store reserves |
|
$ |
— |
|
|
$ |
— |
|
|
$ |
811 |
|
|
$ |
811 |
|
|
Total |
|
$ |
— |
|
|
$ |
349,064 |
|
|
$ |
811 |
|
|
$ |
349,875 |
|
|
Year Ended January 1, 2017 |
|
Level 1 |
|
|
Level 2 |
|
|
Level 3 |
|
|
Total |
|
||||
|
Long-term debt |
|
$ |
— |
|
|
$ |
255,000 |
|
|
$ |
— |
|
|
$ |
255,000 |
|
|
Interest rate swap liability |
|
$ |
— |
|
|
$ |
— |
|
|
$ |
— |
|
|
$ |
— |
|
|
Closed store reserves |
|
$ |
— |
|
|
$ |
— |
|
|
$ |
1,083 |
|
|
$ |
1,083 |
|
|
Total |
|
$ |
— |
|
|
$ |
255,000 |
|
|
$ |
1,083 |
|
|
$ |
256,083 |
|
90
The Company’s interest rate swaps are considered Level 2 in the hierarchy and are valued using an income approach. Expected future cash flows are converted to a present value amount based on market expectations of the yield curve on floating interest rates, which is readily available on public markets.
The determination of fair values of certain tangible and intangible assets for purposes of the Company’s goodwill impairment evaluation as described above is based upon Level 3 inputs. Closed store reserves are recorded at net present value to approximate fair value which is classified as Level 3 in the hierarchy. The estimated fair value of the closed store reserve is calculated based on the present value of the remaining lease payments and other charges using a weighted average cost of capital, reduced by estimated sublease rentals. The weighted average cost of capital is estimated using information from comparable companies and management’s judgment related to the risk associated with the operations of the stores.
Cash and cash equivalents, accounts receivable, prepaid expenses and other current assets, accounts payable, accrued salaries and benefits and other accrued liabilities approximate fair value because of the short maturity of those instruments. Based on comparable open market transactions, the fair value of the long-term debt approximated carrying value as of December 31, 2017 and January 1, 2017. The Company’s estimates of the fair value of long-term debt (including current maturities) were classified as Level 2 in the fair value hierarchy.
25. Equity-Based Compensation
2013 Incentive Plan
The Company’s board of directors adopted, and its equity holders approved, the Sprouts Farmers Market, Inc. 2013 Incentive Plan (the “2013 Incentive Plan”). The 2013 Incentive Plan became effective July 31, 2013 in connection with the Company’s initial public offering and replaced the 2011 Option Plan (as defined below) (except with respect to outstanding options under the 2011 Option Plan). The 2013 Incentive Plan serves as the umbrella plan for the Company’s stock-based and cash-based incentive compensation programs for its directors, officers and other team members.
The Company granted to certain officers and team members the following awards during 2015, under the 2013 Incentive Plan:
|
Grant Date |
|
Award Type |
|
Shares of common stock |
|
|
Exercise Price |
|
|
Grant date fair value |
|
|||
|
March 11, 2015 |
|
Options |
|
|
277,833 |
|
|
$ |
34.33 |
|
|
$ |
9.42 |
|
|
|
|
RSUs |
|
|
87,394 |
|
|
|
— |
|
|
$ |
34.33 |
|
|
|
|
PSAs |
|
|
71,753 |
|
|
|
— |
|
|
$ |
34.33 |
|
|
May 21, 2015 |
|
Options |
|
|
14,492 |
|
|
$ |
30.30 |
|
|
$ |
8.28 |
|
|
|
|
RSUs |
|
|
3,896 |
|
|
|
— |
|
|
$ |
30.30 |
|
|
August 11, 2015 |
|
Options |
|
|
2,138,899 |
|
|
$ |
20.98 |
|
|
$ |
5.79 |
|
|
|
|
RSUs |
|
|
5,660 |
|
|
|
— |
|
|
$ |
20.98 |
|
|
November 10, 2015 |
|
Options |
|
|
4,431 |
|
|
$ |
23.26 |
|
|
$ |
6.77 |
|
|
. |
|
RSUs |
|
|
1,370 |
|
|
|
— |
|
|
$ |
23.26 |
|
The options vest ratably over a period of 12 quarters (three years) and the RSUs vest either one-third each year for three years or one-half each year for two years. The options expire seven years from grant date. The PSAs are described below.
91
The Company granted to certain officers and team members the following awards during 2016, under the 2013 Incentive Plan:
|
Grant Date |
|
Award Type |
|
Shares of common stock |
|
|
Exercise Price |
|
|
Grant date fair value |
|
|||
|
March 4, 2016 |
|
Options |
|
|
318,156 |
|
|
$ |
28.21 |
|
|
$ |
8.59 |
|
|
|
|
RSUs |
|
|
213,767 |
|
|
|
— |
|
|
$ |
28.21 |
|
|
|
|
PSAs |
|
|
92,942 |
|
|
|
— |
|
|
$ |
28.21 |
|
|
April 11, 2016 |
|
Options |
|
|
4,627 |
|
|
$ |
27.69 |
|
|
$ |
8.32 |
|
|
|
|
RSUs |
|
|
1,335 |
|
|
|
— |
|
|
$ |
27.69 |
|
|
May 9, 2016 |
|
RSUs |
|
|
14,404 |
|
|
|
— |
|
|
$ |
26.65 |
|
|
May 23, 2016 |
|
Options |
|
|
419,935 |
|
|
$ |
24.48 |
|
|
$ |
6.54 |
|
|
|
|
RSAs |
|
|
217,852 |
|
|
|
— |
|
|
$ |
24.48 |
|
|
August 18, 2016 |
|
RSUs |
|
|
7,499 |
|
|
|
— |
|
|
$ |
22.44 |
|
The options vest ratably one-third each year for three years and the RSUs vest either one-third each year for three years or one-half each year for two years for team members. RSUs granted to independent members of its board of directors cliff vest in one year. The options expire seven years from grant date. The PSAs and RSAs are described below.
The Company granted to certain officers and team members the following awards during 2017, under the 2013 Incentive Plan:
|
Grant Date |
|
Award Type |
|
Shares of common stock |
|
|
Exercise Price |
|
|
Grant date fair value |
|
|||
|
March 3, 2017 |
|
RSUs |
|
|
323,687 |
|
|
|
— |
|
|
$ |
18.11 |
|
|
|
|
RSAs |
|
|
288,746 |
|
|
|
— |
|
|
$ |
18.11 |
|
|
|
|
PSAs |
|
|
148,944 |
|
|
|
— |
|
|
$ |
18.11 |
|
|
March 27, 2017 |
|
RSUs |
|
|
1,719 |
|
|
|
— |
|
|
$ |
22.54 |
|
|
May 12, 2017 |
|
RSUs |
|
|
21,820 |
|
|
|
— |
|
|
$ |
23.89 |
|
|
August 11, 2017 |
|
RSUs |
|
|
10,630 |
|
|
|
— |
|
|
$ |
24.14 |
|
|
November 10, 2017 |
|
RSUs |
|
|
2,586 |
|
|
|
— |
|
|
$ |
20.80 |
|
The RSUs vest either one-third each year for three years or one-half each year for two years for team members. RSUs granted to independent members of its board of directors cliff vest in one year. The PSAs and RSAs are described below.
The aggregate number of shares of common stock that may be issued to team members and directors under the 2013 Incentive Plan may not exceed 10,089,072. Shares subject to awards granted under the 2013 Incentive Plan which are subsequently forfeited, expire unexercised or are otherwise not issued will not be treated as having been issued for purposes of the share limitation. As of December 31, 2017, 5,809,319 shares of common stock are reserved for issuance under the 2013 Incentive Plan.
2011 Option Plan
In May 2011, the Company adopted the Sprouts Farmers Markets, LLC Option Plan (the “2011 Option Plan”) to provide team members or directors of the Company with options to acquire shares of the Company. The Company had authorized 12,100,000 shares for issuance under the 2011 Option Plan. Options may no longer be issued under the 2011 Option Plan.
92
In the event of a change in control as defined in the award agreements issued under the 2013 Incentive Plan and in the 2011 Option Plan, all options and awards issued prior to 2015 become immediately vested and exercisable. For grants issued in and subsequent to 2015, the options and awards only become immediately vested in the event of a change in control (as defined in the applicable team member award agreement) if the grants are not continued or assumed by the acquirer on a substantially equivalent basis. If the options and awards continue or are assumed on a substantially equivalent basis, but employment is terminated by the Company or an acquirer without cause or by the team member for good reason (as such terms are defined in the applicable team member award agreement) within 24 months following the change in control, such options or awards will become immediately vested upon such termination. Under all other scenarios, the awards continue to vest per the schedule outlined in the applicable team member award agreement.
Shares issued for option exercises are newly issued shares.
There were no options granted during 2017. The estimated fair values of options granted during 2016 and 2015 range from $5.79 to $9.42, and were calculated using the following assumptions:
|
|
|
2017 |
|
2016 |
|
|
2015 |
|
||
|
Dividend yield |
|
- |
|
|
0.00 |
% |
|
|
0.00 |
% |
|
Expected volatility |
|
- |
|
33.92% to 34.18% |
|
|
30.61% to 32.51% |
|
||
|
Risk free interest rate |
|
- |
|
1.18% to 1.32% |
|
|
1.44% to 1.67% |
|
||
|
Expected term, in years |
|
- |
|
3.53 to 4.50 |
|
|
|
4.31 |
|
|
The grant date weighted average fair value of the 0.5 million options issued but not vested as of December 31, 2017 was $7.25. The grant date weighted average fair value of the 1.2 million options issued but not vested as of January 1, 2017 was $7.02. The grant date weighted average fair value of the 2.1 million options issued but not vested as of January 3, 2016 was $6.32.
The following table summarizes grant date weighted average fair value of options granted and options forfeited:
|
|
|
Year Ended |
|
|||||||||
|
|
|
December 31, 2017 |
|
|
January 1, 2017 |
|
|
January 3, 2016 |
|
|||
|
Grant date weighted average fair value of options granted |
|
$ |
— |
|
|
$ |
7.43 |
|
|
$ |
6.22 |
|
|
Grant date weighted average fair value of options forfeited |
|
$ |
9.66 |
|
|
$ |
8.60 |
|
|
$ |
5.36 |
|
Expected volatility is calculated based upon historical volatility data from a group of comparable companies and the Company over a timeframe consistent with the expected life of the awards. The expected term is estimated based on the expected period that the options are anticipated to be outstanding after initial grant until exercise or expiration based upon various factors including the contractual terms of the awards and vesting schedules. The expected risk-free rate is based on the U.S. Treasury yield curve rates in effect at the time of the grant using the term most consistent with the expected life of the award. Dividend yield was estimated at zero as the Company does not anticipate making regular future distributions to stockholders. The total intrinsic value of options exercised was $31.6 million, $12.3 million, and $53.4 million for 2017, 2016, and 2015, respectively.
93
The following table summarizes option activity during 2017:
|
|
|
Number of Options |
|
|
Weighted Average Exercise Price |
|
|
Weighted Average Remaining Contractual Life (In Years) |
|
|
Aggregate Intrinsic Value |
|
||||
|
Outstanding at January 1, 2017 |
|
|
6,757,358 |
|
|
$ |
12.57 |
|
|
|
|
|
|
|
|
|
|
Granted |
|
|
— |
|
|
|
— |
|
|
|
|
|
|
|
|
|
|
Forfeited |
|
|
(204,357 |
) |
|
|
35.08 |
|
|
|
|
|
|
|
|
|
|
Exercised |
|
|
(1,863,059 |
) |
|
|
4.99 |
|
|
|
|
|
|
$ |
31,627 |
|
|
Outstanding at December 31, 2017 |
|
|
4,689,942 |
|
|
|
14.60 |
|
|
|
2.61 |
|
|
$ |
51,363 |
|
|
Exercisable—December 31, 2017 |
|
|
4,225,908 |
|
|
|
13.43 |
|
|
|
2.37 |
|
|
$ |
50,970 |
|
|
Vested/Expected to vest—December 31, 2017 |
|
|
4,689,942 |
|
|
$ |
14.60 |
|
|
|
2.61 |
|
|
$ |
51,363 |
|
RSUs
In the event of a change in control as defined in the award agreements issued under the 2013 Incentive Plan, all RSUs granted prior to 2015 become immediately vested. RSUs granted in and subsequent to 2015 only become immediately vested in the event of a change in control (as defined in the applicable team member award agreement) if the awards are not continued or assumed by the acquirer on a substantially equivalent basis. If the awards continue or are assumed on a substantially equivalent basis, but employment is terminated by the Company or an acquirer without cause or by the team member for good reason (as such terms are defined in the applicable team member award agreement) within 24 months following the change in control, such awards will become immediately vested upon such termination. Under all other scenarios, the awards continue to vest per the schedule outlined in the applicable team member award agreement.
Shares issued for RSU vesting are newly issued shares.
The estimated fair value of RSUs granted during 2017 and 2016 range from $18.11 to $28.21, and were calculated based on the closing price on the grant date.
The following table summarizes the weighted average grant date fair value of RSUs awarded during 2017, 2016, and 2015:
|
|
|
Year Ended |
|
|||||||||
|
|
|
December 31, 2017 |
|
|
January 1, 2017 |
|
|
January 3, 2016 |
|
|||
|
RSUs awarded |
|
$ |
18.68 |
|
|
$ |
27.93 |
|
|
$ |
33.25 |
|
The following table summarizes RSU activity during 2017:
|
|
|
Number of RSUs |
|
|
Weighted Average Grant Date Fair Value |
|
||
|
Outstanding at January 1, 2017 |
|
|
274,457 |
|
|
$ |
29.47 |
|
|
Awarded |
|
|
360,442 |
|
|
|
18.68 |
|
|
Released |
|
|
(137,560 |
) |
|
|
30.01 |
|
|
Forfeited |
|
|
(48,692 |
) |
|
|
23.21 |
|
|
Outstanding at December 31, 2017 |
|
|
448,647 |
|
|
$ |
21.31 |
|
94
PSAs granted in March 2015 were earned based on the Company’s achievement of certain earnings per share performance targets during 2015. Such PSAs vest 50% on the second anniversary of the grant date (2017), and 50% on the third anniversary of the grant date (2018).
PSAs granted in March 2016 are subject to the Company achieving certain earnings before interest and taxes (“EBIT”) performance targets on an annual and cumulative basis over a three-year performance period, as well as additional time-vesting conditions. The EBIT target for each of the three years during the performance period is based on a percentage increase over the previous year’s actual EBIT, with each annual performance tranche measured independently of the previous and next tranche. Cumulative performance is based on the aggregate annual performance and is measured against a cumulative performance target. Payout of the performance shares will either be 0% or range from 50% to 150% of the target number of shares granted, depending upon goal achievement. If the performance conditions are met, the applicable number of performance shares is subject to cliff vesting on the third anniversary of the grant date (March 2019).
PSAs granted in March 2017 are subject to the Company achieving certain earnings per share performance targets during 2017. The criteria is based on a range of performance targets in which grantees may earn between 10% and 150% of the base number of awards granted. If the performance conditions are met, the applicable number of performance shares will vest 50% on the second anniversary of the grant date (2019) and 50% on the third anniversary of the grant date (2020).
The PSAs only become immediately vested in the event of a change in control (as defined in the applicable team member award agreement) if the awards are not continued or assumed by the acquirer on a substantially equivalent basis. If the awards continue or are assumed on a substantially equivalent basis, but employment is terminated by the Company or an acquirer without cause or by the team member for good reason (as such terms are defined in the applicable team member award agreement) within 24 months following the change in control, such awards will become immediately vested upon such termination. Under all other scenarios, the awards continue to vest per the schedule outlined in the applicable team member award agreement.
Shares issued for PSA vesting are newly issued shares.
The estimated fair value of each performance share granted pursuant to PSAs during 2017 is $18.11, and was calculated based on the closing price on the grant date.
The total grant date fair value of PSAs granted during 2017 was $2.7 million. The total grant date fair value of PSAs vested during 2017 was $0.7 million. The total grant date fair value of performance shares forfeited during 2017 was $0.8 million. The total grant date fair value of the 0.2 million PSAs issued but not released as of December 31, 2017 was $5.2 million. Subsequent to December 31, 2017, the Company’s board of directors determined that the maximum level of the 2017 performance target was met, and accordingly, 150% of the performance shares will be granted.
The total grant date fair value of PSAs granted during 2016 was $2.6 million. There were no PSAs released during 2016. The total grant date fair value of performance shares forfeited during 2016 was $0.1 million. The total grant date fair value of the 0.1 million PSAs issued but not released as of January 1, 2017 was $2.6 million. During February 2017, the Company’s board of directors determined that the performance targets for the 2016 tranche were not met and 30,984 performance shares were not earned. During February 2018, the Company’s board of directors determined that the performance targets for the 2017 tranche were not met and an additional 30,980 performance shares were not earned.
The total grant date fair value of PSAs granted during 2015 was $2.5 million. There were no PSAs released during 2015. The total grant date fair value of PSAs forfeited during 2015 was $0.1 million. The total grant date fair value of the 0.1 million PSAs issued but not released as of January 3, 2016 was $2.4 million. Subsequent to January 3, 2016, the Company’s board of directors determined that the performance targets were met and 0.1 million performance shares were earned and remained subject to time-vesting restrictions.
95
The following table summarizes PSA activity during 2017:
|
|
|
Number of PSAs |
|
|
Weighted Average Grant Date Fair Value |
|
||
|
Outstanding at January 1, 2017 |
|
|
158,936 |
|
|
|
30.75 |
|
|
Awarded |
|
|
148,944 |
|
|
|
18.11 |
|
|
Released |
|
|
(21,050 |
) |
|
|
34.33 |
|
|
Forfeited |
|
|
(24,349 |
) |
|
|
34.33 |
|
|
PSAs not earned |
|
|
(30,984 |
) |
|
|
28.21 |
|
|
Outstanding at December 31, 2017 |
|
|
231,497 |
|
|
|
22.26 |
|
RSAs
The fair value of RSAs is based on the closing price of the Company’s common stock on the grant date. RSAs either vest ratably over a seven quarter period, beginning on December 31, 2016 or cliff vest on June 30, 2018 or vest annually over three years.
The RSAs only become immediately vested in the event of a change in control (as defined in the applicable team member award agreement) if the awards are not continued. If the awards continue, but employment is terminated by the Company or an acquirer without cause or by the team member for good reason (as such terms are defined in the applicable team member award agreement) within 24 months following the change in control, such awards will become immediately vested upon such termination. Under all other scenarios, the awards continue to vest per the schedule outlined in the applicable team member award agreement.
Shares issued for RSA vesting are newly issued shares.
The estimated fair values of RSAs granted during 2017 is $18.11 per share of restricted stock, and was calculated based on the closing price on the grant date.
The total grant date fair value of RSAs granted during 2017 was $5.2 million. The total grant date fair value of shares of restricted stock released upon vesting during 2017 was $3.0 million. There were no RSAs forfeited during 2017. The total grant date fair value of the 352,847 shares of restricted stock issued but not released as of December 31, 2017 was $6.8 million.
The following table summarizes RSA activity during 2017:
|
|
|
Number of RSAs |
|
|
Weighted Average Grant Date Fair Value |
|
||
|
Outstanding at January 1, 2017 |
|
|
187,101 |
|
|
$ |
24.48 |
|
|
Awarded |
|
|
288,746 |
|
|
|
18.11 |
|
|
Released |
|
|
(123,000 |
) |
|
|
24.48 |
|
|
Forfeited |
|
|
— |
|
|
|
— |
|
|
Outstanding at December 31, 2017 |
|
|
352,847 |
|
|
$ |
19.27 |
|
96
Equity-Based Compensation Expense
Equity-based compensation expense was as follows:
|
|
|
Year Ended |
|
|||||||||
|
|
|
December 31, 2017 |
|
|
January 1, 2017 |
|
|
January 3, 2016 |
|
|||
|
Cost of sales, buying and occupancy |
|
$ |
1,039 |
|
|
$ |
965 |
|
|
$ |
681 |
|
|
Direct store expenses |
|
|
1,444 |
|
|
|
1,345 |
|
|
|
1,103 |
|
|
Selling, general and administrative expenses |
|
|
11,738 |
|
|
|
11,089 |
|
|
|
6,234 |
|
|
Total equity-based compensation expense |
|
$ |
14,221 |
|
|
$ |
13,399 |
|
|
$ |
8,018 |
|
The Company recognized income tax benefits of $5.6 million, $5.2 million and $3.1 million for 2017, 2016, and 2015, respectively.
As of December 31, 2017, total unrecognized compensation expense and remaining weighted average recognition period related to outstanding equity-based awards were as follows:
|
|
|
Unrecognized compensation expense |
|
|
Remaining weighted average recognition period |
|
||
|
Options |
|
$ |
2,529 |
|
|
|
0.8 |
|
|
RSUs |
|
|
5,485 |
|
|
|
1.4 |
|
|
PSAs |
|
|
2,692 |
|
|
|
1.4 |
|
|
RSAs |
|
|
5,040 |
|
|
|
1.9 |
|
|
Total unrecognized compensation expense at December 31, 2017 |
|
$ |
15,746 |
|
|
|
|
|
During 2017, 2016 and 2015, the Company received $9.3 million, $2.7 million and $6.6 million in cash proceeds from the exercise of options, respectively.
During 2017, 2016 and 2015, the Company recorded $9.9 million, $3.7 million and $20.0 million of excess tax benefits from the exercise of options, respectively.
Equity Award Restructuring
In connection with the appointments of the Company’s Chief Executive Officer and President & Chief Operating Officer in August 2015, the Compensation Committee of the Company’s Board of Directors approved a grant of stock options to purchase 1,200,000 and 500,000 shares of the Company’s common stock at an exercise price of $20.98 per share to these officers, respectively (the “August 2015 Options”) pursuant to the 2013 Incentive Plan. The August 2015 Options, taken together with other options granted under the 2013 Incentive Plan to such officers during 2015, exceeded the limit of 500,000 shares which may be granted pursuant to stock options and stock appreciation rights per calendar year to each participant under the 2013 Incentive Plan by 733,439 shares in the case of the Company’s Chief Executive Officer and 33,439 shares in the case of the Company’s President & Chief Operating Officer (the “Excess Options”). Accordingly, the Company has determined, and these officers have acknowledged, that the grants of the Excess Options were null and void.
97
In order to satisfy the original intent with respect to these individuals’ compensation, on May 23, 2016, the Compensation Committee granted to the Company’s Chief Executive Officer and President & Chief Operating Officer under the 2013 Incentive Plan options to purchase 386,496 and 33,439 shares of the Company’s common stock at an exercise price of $24.48 per share, respectively, and 215,251 and 2,601 RSAs, respectively. The Company recognized compensation expense of $3.8 million during the year ended December 31, 2017 related to the options and RSAs granted.
26. Subsequent Events
Subsequent to December 31, 2017, and through February 20, 2018, the Company repurchased an additional 1.2 million shares of common stock for $30.4 million. The Company borrowed an additional $3.0 million under its Credit Facility that was utilized in these repurchases, and made a $10.0 million principal payment, resulting in total outstanding debt under the Credit Facility of $341 million as of February 20, 2018.
On February 20, 2018, the Company’s board of directors authorized a new $350 million share repurchase program for its common stock. The shares may be purchased on a discretionary basis from time to time through December 31, 2019, subject to general business and market conditions and other investment opportunities, through open market purchases, privately negotiated transactions, or other means, including through Rule 10b5-1 trading plans.
98
None.
Evaluation of Disclosure Controls and Procedures
We maintain a system of disclosure controls and procedures (as defined in Rules 13a-15(e) and 15d-15(e) under the Exchange Act) designed to ensure that the information required to be disclosed by us in the reports that we file or submit under the Exchange Act, is recorded, processed, summarized and reported within the time periods specified in the rules and forms of the Securities and Exchange Commission, and is accumulated and communicated to our management, including our Chief Executive Officer (our principal executive officer) and our Chief Financial Officer (our principal financial officer), as appropriate, to allow timely decisions regarding required disclosure.
Our management, with the participation of our Chief Executive Officer and Chief Financial Officer, has evaluated the effectiveness of our disclosure controls and procedures under the Exchange Act as of December 31, 2017, the end of the period covered by this Annual Report on Form 10-K. Based upon that evaluation, our Chief Executive Officer and Chief Financial Officer concluded that, as of December 31, 2017, our disclosure controls and procedures are effective.
Management’s Annual Report on Internal Control Over Financial Reporting
Our management is responsible for establishing and maintaining adequate internal control over financial reporting as defined in Rules 13a-15(f) and 15d-15(f) under the Exchange Act. Our internal control over financial reporting is designed to provide reasonable assurance regarding the reliability of financial reporting and the preparation of financial statements for external purposes in accordance with generally accepted accounting principles.
Because of its inherent limitations, internal control over financial reporting may not prevent or detect misstatements. Also, projections of any evaluation of effectiveness to future periods are subject to the risk that controls may become inadequate because of changes in conditions, or that the degree of compliance with the policies or procedures may deteriorate.
Under the supervision and with the participation of our management, including our Chief Executive Officer and Chief Financial Officer, we assessed the effectiveness of our internal control over financial reporting as of December 31, 2017, using the criteria set forth by the Committee of Sponsoring Organizations of the Treadway Commission (COSO) in Internal Control—Integrated Framework (2013 Framework). Based on this assessment, our management has concluded that our internal control over financial reporting was effective as of December 31, 2017.
PricewaterhouseCoopers LLP, our independent registered public accounting firm, assessed the effectiveness of our internal control over financial reporting, as stated in the firm’s report which is included with the consolidated financial statements in Item 8 of this Annual Report on Form 10-K.
Changes in Internal Control Over Financial Reporting
There were no changes in our internal control over financial reporting that occurred during the quarterly period ended December 31, 2017 that have materially affected, or are reasonably likely to materially affect, our internal control over financial reporting.
None.
99
The information required by this item will be contained in our definitive Proxy Statement to be filed with the SEC in connection with our 2018 Annual Meeting of Stockholders (referred to as the “Proxy Statement”), which is expected to be filed not later than 120 days after the end of our fiscal year ended December 31, 2017, and is incorporated herein by reference.
We have adopted a Code of Ethics – Principal Executive Officer and Senior Financial Officers (referred to as the “Code”) that applies to our principal executive officer, principal financial officer and principal accounting officer and controller. The Code is publicly available on our website at http://investors.sprouts.com/governance-information.
We will provide disclosure of future updates, amendments or waivers from the Code by posting them to our investor relations website located at investors.sprouts.com. The information contained on or accessible through our website is not incorporated by reference into this Annual Report on Form 10-K. Except for such Code, the information contained on or accessible through our website is not incorporated by reference into this Annual Report on Form 10-K.
The information required by this Item will be set forth in the Proxy Statement and is incorporated herein by reference.
|
Item 12. |
Security Ownership of Certain Beneficial Owners and Management and Related Stockholder Matters |
The information required by this Item will be set forth in the Proxy Statement and is incorporated herein by reference.
The information required by this Item will be set forth in the Proxy Statement and is incorporated herein by reference.
The information required by this Item will be set forth in the Proxy Statement and is incorporated herein by reference.
|
|
(a) |
Documents filed as part of this report: |
|
|
1. |
Financial Statements: The information concerning our financial statements and Report of Independent Registered Public Accounting Firm required by this Item is incorporated by reference herein to the section of this Annual Report on Form 10-K in Item 8, titled “Financial Statements and Supplementary Data.” |
|
|
2. |
Financial Statement Schedules: No schedules are required. |
|
|
3. |
Exhibits: See Item 15(b) below. |
100
|
Exhibit Number |
Description |
|
|
|
|
2.1 |
|
|
|
|
|
3.1 |
Certificate of Incorporation of Sprouts Farmers Market, Inc. (1) |
|
|
|
|
3.2 |
Amended and Restated Bylaws of Sprouts Farmers Market, Inc. (2) |
|
|
|
|
10.1 |
|
|
|
|
|
10.2 |
Form of Stock Option Agreement under Sprouts Farmers Markets, LLC 2011 Option Plan (3) |
|
|
|
|
10.3 |
Sprouts Farmers Market, Inc. 2013 Incentive Plan, amended as of May 1, 2015 (4) |
|
|
|
|
10.3.1(a) |
Form of Stock Option Agreement under Sprouts Farmers Market, Inc. 2013 Incentive Plan (5) |
|
|
|
|
10.3.1(b) |
2015 Form of Stock Option Agreement under Sprouts Farmers Market, Inc. 2013 Incentive Plan (6) |
|
|
|
|
10.3.1(c) |
|
|
|
|
|
10.3.2(a) |
Form of Restricted Stock Unit Agreement under Sprouts Farmers Market, Inc. 2013 Incentive Plan (5) |
|
|
|
|
10.3.2(b) |
|
|
|
|
|
10.3.3(a) |
|
|
|
|
|
10.3.3(b) |
|
|
|
|
|
10.3.4 |
|
|
|
|
|
10.4 |
|
|
|
|
|
10.4.1 |
|
|
|
|
|
10.4.2 |
|
|
|
|
|
10.4.3 |
|
|
|
|
|
10.5 |
|
|
|
|
|
10.5.1 |
|
|
|
|
|
10.5.2 |
|
|
|
|
|
10.5.3 |
|
|
|
|
101
|
|
|
|
10.6.1 |
|
|
|
|
|
10.6.2 |
|
|
|
|
|
10.7 |
|
|
|
|
|
10.7.1 |
|
|
|
|
|
10.7.2 |
|
|
|
|
|
10.8† |
Amended and Restated Nature’s Best Distribution Agreement, dated as of August 13, 2014 (12) |
|
|
|
|
10.9 |
|
|
|
|
|
10.10 |
|
|
|
|
|
10.11 |
Form of Confidentiality, Non-Competition, and Non-Solicitation Agreement (14) |
|
|
|
|
10.12 |
|
|
|
|
|
10.13 |
|
|
|
|
|
10.14 |
Offer Letter from Sprouts Farmers Market, Inc. to Brad Lukow, dated February 25, 2016 (16) |
|
|
|
|
10.15† |
|
|
|
|
|
21.1 |
|
|
|
|
|
23.1 |
Consent of PricewaterhouseCoopers LLP, independent registered accounting firm |
|
|
|
|
31.1 |
Certification of Chief Executive Officer Pursuant to Section 302 of the Sarbanes-Oxley Act of 2002 |
|
|
|
|
31.2 |
Certification of Chief Financial Officer Pursuant to Section 302 of the Sarbanes-Oxley Act of 2002 |
|
|
|
|
32.1 |
|
|
|
|
|
32.2 |
|
|
|
|
|
101.INS |
XBRL Instance Document |
|
|
|
|
101.SCH |
XBRL Taxonomy Extension Schema Document |
|
|
|
102
|
XBRL Taxonomy Extension Calculation Linkbase Document |
|
|
|
|
|
101.DEF |
XBRL Taxonomy Extension Definition Linkbase Document |
|
|
|
|
101.LAB |
XBRL Taxonomy Extension Label Linkbase Document |
|
|
|
|
101.PRE |
XBRL Taxonomy Extension Presentation Linkbase Document |
|
† |
Portions of this exhibit (indicated by asterisks) have been omitted pursuant to a confidential treatment order granted pursuant to a request submitted separately to the SEC. |
|
(1) |
Filed as an exhibit to Amendment No. 4 to the Registrant’s Registration Statement on Form S-1 (File No. 333-188493) filed with the SEC on July 29, 2013, and incorporated herein by reference. |
|
(2) |
Filed as an exhibit to the Registrant’s Current Report on Form 8-K filed with the SEC on January 30, 2017, and incorporated herein by reference. |
|
(3) |
Filed as an exhibit to the Registrant’s Registration Statement on Form S-1 (File No. 333-188493) filed with the SEC on May 9, 2013, and incorporated herein by reference. |
|
(4) |
Filed as an exhibit to the Registrant’s Current Report on Form 8-K filed with the SEC on May 5, 2015, and incorporated herein by reference. |
|
(5) |
Filed as an exhibit to the Registrant’s Quarterly Report on Form 10-Q filed with the SEC on August 7, 2014, and incorporated herein by reference. |
|
(6) |
Filed as an exhibit to the Registrant’s Quarterly Report on Form 10-Q filed with the SEC on May 7, 2015, and incorporated herein by reference. |
|
(7) |
Filed as an exhibit to the Registrant’s Current Report on Form 8-K filed with the SEC on May 25, 2016, and incorporated herein by reference. |
|
(8) |
Filed as an exhibit to the Registrant’s Quarterly Report on Form 10-Q filed with the SEC on May 5, 2016, and incorporated herein by reference. |
|
(9) |
Filed as an exhibit to the Registrant’s Current Report on Form 8-K filed with the SEC on August 10, 2015, and incorporated herein by reference. |
|
(10) |
Filed as an exhibit to Amendment No. 3 to the Registrant’s Registration Statement on Form S-1 (File No. 333-188493) filed with the SEC on July 22, 2013, and incorporated herein by reference. |
|
(11) |
Filed as an exhibit to the Registrant’s Current Report on Form 8-K filed with the SEC on March 12, 2014, and incorporated herein by reference. |
|
(12) |
Filed as an exhibit to the Registrant’s Quarterly Report on Form 10-Q filed with the SEC on November 6, 2014, and incorporated herein by reference. |
|
(13) |
Filed as an exhibit to the Registrant’s Current Report on Form 8-K filed with the SEC on April 17, 2015, and incorporated herein by reference. |
|
(14) |
Filed as an exhibit to the Registrant’s Quarterly Report on Form 10-Q filed with the SEC on August 6, 2015, and incorporated herein by reference. |
|
(15) |
Filed as an exhibit to the Registrant’s Quarterly Report on Form 10-Q filed with the SEC on November 5, 2015, and incorporated herein by reference. |
|
(16) |
Filed as an exhibit to the Registrant’s Current Report on Form 8-K filed with the SEC on February 25, 2016, and incorporated herein by reference. |
|
(17) |
Filed as an exhibit to the Registrant’s Quarterly Report on Form 10-Q filed with the SEC on August 4, 2016, and incorporated herein by reference. |
Not applicable.
103
Pursuant to the requirements of Section 13 or 15(d) of the Securities Exchange Act of 1934, the registrant has duly caused this report to be signed on its behalf by the undersigned, thereunto duly authorized.
|
|
SPROUTS FARMERS MARKET, INC. |
|
|
|
|
|
|
Date: February 22, 2018 |
By: |
/s/ Bradley S. Lukow |
|
|
Name: |
Bradley S. Lukow |
|
|
Title: |
Chief Financial Officer |
Pursuant to the requirements of the Securities Exchange Act of 1934, this report has been signed below by the following persons on behalf of the registrant and in the capacities and on the dates indicated.
|
Signature |
|
Title |
|
Date |
|
|
|
|
|
|
|
/s/ Amin N. Maredia
Amin N. Maredia |
|
Director and Chief Executive Officer |
|
February 22, 2018 |
|
|
|
|
|
|
|
/s/ Bradley S. Lukow
Bradley S. Lukow |
|
Chief Financial Officer |
|
February 22, 2018 |
|
|
|
|
|
|
|
/s/ Joseph Fortunato
Joseph Fortunato |
|
Chairman of the Board |
|
February 22, 2018 |
|
|
|
|
|
|
|
/s/ Kristen E. Blum
Kristen E. Blum |
|
Director |
|
February 22, 2018 |
|
|
|
|
|
|
|
/s/ Shon A. Boney
Shon A. Boney |
|
Director |
|
February 22, 2018 |
|
|
|
|
|
|
|
/s/ Terri Funk Graham
Terri Funk Graham |
|
Director |
|
February 22, 2018 |
|
|
|
|
|
|
|
/s/ Lawrence P. Molloy
Lawrence P. Molloy |
|
Director |
|
February 22, 2018 |
|
|
|
|
|
|
|
/s/ Joseph O’Leary
Joseph O’Leary |
|
Director |
|
February 22, 2018 |
|
|
|
|
|
|
|
/s/ Steven H. Townsend
Steven H. Townsend |
|
Director |
|
February 22, 2018 |
104