Attached files
| file | filename |
|---|---|
| EX-99.1 - EX-99.1 - INDEPENDENCE REALTY TRUST, INC. | irt-ex991_6.htm |
| 8-K - 12/31/2017-8K-ER - INDEPENDENCE REALTY TRUST, INC. | irt-8k_20180220.htm |
Exhibit 99.2

NYSE: IRT
WWW.IRTLIVING.COM
Q4 2017 Earnings Release &
Supplemental Information

|
Company Information |
|
3 |
|
|
|
|
|
Forward-Looking Statements |
|
4 |
|
|
|
|
|
Earnings Release Text |
|
5 |
|
|
|
|
|
Financial & Operating Highlights |
|
9 |
|
|
|
|
|
Balance Sheets |
|
10 |
|
|
|
|
|
Statements of Operations, FFO & CORE FFO |
|
|
|
Trailing 5 Quarters |
|
11 |
|
Three and Twelve Months Ended December 31, 2017 and 2016 |
|
12 |
|
|
|
|
|
Adjusted EBITDA Reconciliations and Coverage Ratio |
|
|
|
Trailing 5 Quarters |
|
13 |
|
Three and Twelve Months Ended December 31, 2017 and 2016 |
|
13 |
|
|
|
|
|
Same-Store Portfolio Net Operating Income |
|
|
|
Trailing 5 Quarters |
|
14 |
|
Three and Twelve Months Ended December 31, 2017 and 2016 |
|
15 |
|
|
|
|
|
Net Operating Income Bridge |
|
16 |
|
|
|
|
|
Capital Recycling Activity |
|
17 |
|
|
|
|
|
Property Summary |
|
18 |
|
|
|
|
|
NOI Exposure by Market |
|
19 |
|
|
|
|
|
Debt Summary |
|
20 |
|
|
|
|
|
Definitions |
|
21 |
2
December 31, 2017
Company Information:
Independence Realty Trust (NYSE: IRT) is a real estate investment trust that owns and operates 55 multifamily apartment properties, totaling 15,045 units, across non-gateway U.S. markets, including Atlanta, Louisville, Memphis, and Raleigh. IRT’s investment strategy is focused on gaining scale within key amenity rich submarkets that offer good school districts, high-quality retail and major employment centers. IRT aims to provide stockholders attractive risk-adjusted returns through diligent portfolio management, strong operational performance, and a consistent return of capital through distributions and capital appreciation.
|
Corporate Headquarters |
|
Two Liberty Place |
|
|
|
50 S. 16th Street, Suite 3575 |
|
|
|
Philadelphia, PA 19102 |
|
|
|
267.270.4800 |
|
|
|
|
|
Trading Symbol |
|
NYSE: “IRT” |
|
|
|
|
|
Investor Relations Contact |
|
Edelman Financial Communications & Capital Markets |
|
|
|
Ted McHugh and Lauren Tarola |
|
|
|
212.277.4322 |
|
|
|
IRT@edelman.com
|
|
|
|
|
3
This supplemental information may contain certain forward-looking statements within the meaning of Section 27A of the Securities Act of 1933, as amended, and Section 21E of the Securities Exchange Act of 1934, as amended. Such forward-looking statements can generally be identified by our use of forward-looking terminology such as “may,” “will,” “expect,” “intend,” “anticipate,” “estimate,” “believe,” “seek,” “outlook,” “assumption,” “projected,” “strategy”, “guidance” or other similar words. Because such statements include risks, uncertainties and contingencies, actual results may differ materially from the expectations, intentions, beliefs, plans or predictions of the future expressed or implied by such forward-looking statements. These forward-looking statements are based upon the current beliefs and expectations of IRT’s management and are inherently subject to significant business, economic and competitive uncertainties and contingencies, many of which are difficult to predict and generally not within IRT’s control. In addition, these forward-looking statements are subject to assumptions with respect to future business strategies and decisions that are subject to change. Such forward-looking statements include, but are not limited to, IRT’s 2018 EPS and CFFO guidance; the assumptions underlying such guidance; changes in financial markets and interest rates, or to the business or financial condition of IRT; changes in market demand for rental apartment homes and competitive pricing from projected apartment industry dynamics, demographic and employment information; IRT’s maintenance of real estate investment trust (“REIT”) status; availability of financing and capital; dividends are subject to the discretion of IRT’s Board of Directors, and will depend on IRT’s financial condition, results of operations, capital requirements, compliance with applicable laws and agreements and any other factors deemed relevant by IRT’s Board; risks associated with pursuing additional strategic acquisitions, including risks associated with the need to raise additional capital to fund the acquisitions; and those additional risks and factors discussed in reports filed with the Securities and Exchange Commission (“SEC”) by IRT from time to time, including those discussed under the heading “Risk Factors” in IRT’s most recently filed reports on Forms 10-K and 10-Q. IRT undertakes no obligation to update these forward-looking statements to reflect events or circumstances after the date hereof or to reflect the occurrence of unanticipated events, except as may be required by law.
4
Independence Realty Trust Announces Fourth Quarter and Fiscal Year 2017 Financial Results
PHILADELPHIA – (BUSINESS WIRE) – February 20, 2018 — Independence Realty Trust, Inc. (“IRT”) (NYSE: IRT), a multifamily apartment REIT, today announced its fourth quarter and fiscal 2017 financial results.
Results for the Fourth Quarter
|
|
• |
Net income (loss) allocable to common shares of $6.3 million for the quarter ended December 31, 2017 as compared to ($41.0) million for the quarter ended December 31, 2016. |
|
|
• |
Core Funds from Operations (“CFFO”) per share of $0.18 for the quarter ended December 31, 2017 as compared to $0.17 for the quarter ended December 31, 2016. |
|
|
• |
Adjusted EBITDA of $21.7 million for the quarter ended December 31, 2017 as compared to $18.5 million for the quarter ended December 31, 2016. |
Results for the Full Year
|
|
• |
Net income (loss) allocable to common shareholders of $30.2 million for the twelve months ended December 31, 2017 as compared to ($9.8) million for the twelve months ended December 31, 2016. |
|
|
• |
Core Funds from Operations (“CFFO”) per share of $0.73 for the twelve months ended December 31, 2017 as compared to $0.79 for the twelve months ended December 31, 2016. |
|
|
• |
Adjusted EBITDA of $81.0 million for the twelve months ended December 31, 2017 as compared to $74.5 million for the twelve months ended December 31, 2016. |
Same-Store Property Operating Results
|
|
Fourth Quarter 2017 Compared to Fourth Quarter 2016(1) |
Twelve Months Ended 12/31/17 Compared to Twelve Months Ended 12/31/16(1) |
|
Rental income |
3.1% increase |
3.4% increase |
|
Total revenues |
3.5% increase |
3.9% increase |
|
Property level operating expenses |
2.1% increase |
2.5% increase |
|
Net operating income (“NOI”) |
4.3% increase |
4.8% increase |
|
Portfolio average occupancy |
100 bps increase to 94.7% |
80 bps increase to 94.6% |
|
Portfolio average rental rate |
2.3% increase to $1,021 |
2.8% increase to $1,015 |
|
NOI Margin |
60 bps increase to 60.7% |
50 bps increase to 60.1% |
|
|
(1) |
Same store portfolio for the three and twelve months ended December 31, 2017 and 2016 includes 42 properties, which represent 11,677 units. |
“IRT’s 2017 performance highlights our ability to consistently deliver strong operating returns, while simultaneously transforming the portfolio and solidifying our balance sheet,” said Scott Schaeffer, IRT’s Chairman and CEO. “We continue to be rewarded for our commitment to owning and operating high-quality, middle-market communities across core non-gateway markets, underlined by 4.8% year-over-year same-store NOI growth in 2017. We are dedicated to operating a portfolio of apartment communities that will deliver outstanding long-term returns. Our recently completed nine-community portfolio acquisition and disposition of legacy Class C assets during 2017 has upgraded our portfolio composition and enhanced our economies of scale. Our execution has generated significant momentum to continue to drive outsized NOI growth and remain on track to achieve our long-term objectives.”
5
During the fourth quarter and subsequent to year end, IRT completed the acquisition of the remaining five properties related to the nine-community portfolio transaction, initially announced on September 5, 2017. The nine-community portfolio totaled 2,352 units and was acquired for a gross purchase price of $228.1 million. IRT assumed $58.5 million of property level debt in association with three of the acquired assets.
On January 4, 2018, IRT completed the acquisition of a 312-unit community located in Columbus, OH for approximately $36.8 million. IRT used available cash and borrowings from its line of credit to complete the acquisition. As of January 2, 2018, the community was 94.6% occupied with average rent of $1,066.
Property Dispositions
On November 28, 2017, IRT completed the disposition of a 432-unit community located in Jackson, MS for a gross sale price of $27.2 million. IRT recognized a gain on sale of this community of approximately $3.1 million during the fourth quarter of 2017. The community was held for sale and represented the final of four legacy Class C communities that were sold during 2017 for a gross sale price of $86.8 million.
Term Loan Agreement
On November 11, 2017, IRT announced that it entered into a seven-year, $100 million unsecured term loan that will reach maturity in November 2024. The proceeds will reduce borrowings currently outstanding under the revolving portion of IRT’s $300 million unsecured credit facility. The term loan bears interest at a spread over LIBOR, based on IRT’s overall leverage. At closing, the spread to LIBOR was 165 basis points. To continue IRT’s practice of reducing exposure to floating interest rates, IRT purchased a collar that caps LIBOR at 2.00%, subject to a floor on LIBOR of 1.25%, during the entire seven-year term.
At-the-Market Offering
During the fourth quarter, IRT issued 1,164,900 shares of our common stock under the At-the-Market Issuance Sales Agreement dated August 4, 2017. The shares were issued at an average price of $10.38 and net proceeds from the issuances were approximately $11.9 million.
Capital Expenditures
For the three months ended December 31, 2017, recurring capital expenditures for the total portfolio were $1.6 million, or $118 per unit. For the twelve months ended December 31, 2017, recurring capital expenditures for the total portfolio were $7.1 million, or $532 per unit.
2018 EPS and CFFO Guidance
IRT is announcing 2018 full year guidance. EPS per diluted share is projected to be in a range of $0.26 to $0.31. CFFO per diluted share is projected to be in the range of $0.74 to $0.79. A reconciliation of IRT's projected net income allocable to common shares to its projected CFFO per share, a non-GAAP financial measure, is included below. Also included below are the primary assumptions underlying this estimate. See Schedule II to this release for further information regarding how IRT calculates CFFO and Schedule V to this release for management’s definition and rationale for the usefulness of CFFO.
|
2018 Full Year EPS and CFFO Guidance (1) |
Low |
High |
|
Net income allocable to common shares |
$0.26 |
$0.31 |
|
Earnings per share |
$0.26 |
$0.31 |
|
|
|
|
|
2018 EPS and CFFO Guidance |
|
|
|
Net income allocable to common shares |
$0.26 |
$0.31 |
|
Adjustments: |
|
|
|
Depreciation and amortization |
0.43 |
0.43 |
|
Share base compensation |
0.03 |
0.03 |
|
Amortization of deferred financing fees |
0.02 |
0.02 |
|
CORE FFO per diluted share allocated to common shareholders |
$0.74 |
$0.79 |
6
|
Same Store Communities |
2018 Outlook |
|
Number of properties/units |
42 properties /11,676 units |
|
Property revenue growth |
3.0% to 4.0% |
|
Controllable property operating expense growth |
1.6% to 2.0% |
|
Real estate tax and insurance expense increase |
4.6% to 5.6% |
|
Total real estate operating expense growth |
2.5% to 3.5% |
|
Property NOI growth |
3.0% to 4.0% |
|
|
|
|
Corporate Expenses |
|
|
General and administrative expenses (excluding stock based compensation) |
$8.0 to $9.0 million |
|
|
|
|
Capital Expenditures |
|
|
Recurring |
$7.8 to $8.8 million |
|
Value add & non-recurring |
$32 to $40 million |
Selected Financial Information
See Schedule I to this Release for selected financial information for IRT.
Non-GAAP Financial Measures and Definitions
IRT discloses the following non-GAAP financial measures in this release: FFO, CFFO, Adjusted EBITDA and NOI. A reconciliation of IRT’s reported net income (loss) to its FFO and CFFO is included as Schedule II to this release. A reconciliation of IRT’s same store NOI to its reported net income (loss) is included as Schedule III to this release. A reconciliation of IRT’s Adjusted EBITDA to net income (loss) is included as Schedule IV to this release. See Schedule V to this release for management’s respective definitions and rationales for the usefulness of each of these non-GAAP financial measures and other definitions used in this release.
Distributions
As previously announced, IRT will transition to a quarterly distribution of cash dividends during the first quarter of 2018, with the Board of Directors expected to declare the first quarter dividend before the end of the first quarter.
Conference Call
All interested parties can listen to the live conference call webcast at 9:30 AM ET on Tuesday, February 20, 2018 from the investor relations section of the IRT website at www.irtliving.com or by dialing 1.844.775.2542, access code 5985018. For those who are not available to listen to the live call, the replay will be available shortly following the live call from the investor relations section of IRT’s website and telephonically until Tuesday, February 27, 2018 by dialing 1.855.859.2056, access code 5985018.
Supplemental Information
IRT produces supplemental information that includes details regarding the performance of the portfolio, financial information, non-GAAP financial measures, same-store information and other useful information for investors. The supplemental information is available via the Company's website, www.irtliving.com, through the "Investor Relations" section.
7
About Independence Realty Trust, Inc.
Independence Realty Trust (NYSE: IRT) is a real estate investment trust that owns and operates 55 multifamily apartment properties, totaling 15,045 units, across non-gateway U.S. markets, including Atlanta, Louisville, Memphis, and Raleigh. IRT’s investment strategy is focused on gaining scale within key amenity rich submarkets that offer good school districts, high-quality retail and major employment centers. IRT aims to provide stockholders attractive risk-adjusted returns through diligent portfolio management, strong operational performance, and a consistent return of capital through distributions and capital appreciation.
Forward-Looking Statements
This press release may contain certain forward-looking statements within the meaning of Section 27A of the Securities Act of 1933, as amended, and Section 21E of the Securities Exchange Act of 1934, as amended. Such forward-looking statements can generally be identified by our use of forward-looking terminology such as “may,” “will,” “expect,” “intend,” “anticipate,” “estimate,” “believe,” “seek,” “outlook,” “assumption,” “projected,” “strategy”, “guidance” or other similar words. Because such statements include risks, uncertainties and contingencies, actual results may differ materially from the expectations, intentions, beliefs, plans or predictions of the future expressed or implied by such forward-looking statements. These forward-looking statements are based upon the current beliefs and expectations of IRT’s management and are inherently subject to significant business, economic and competitive uncertainties and contingencies, many of which are difficult to predict and generally not within IRT’s control. In addition, these forward-looking statements are subject to assumptions with respect to future business strategies and decisions that are subject to change. Such forward-looking statements include, but are not limited to, IRT’s 2018 EPS and CFFO guidance; the assumptions underlying such guidance; changes in financial markets and interest rates, or to the business or financial condition of IRT; changes in market demand for rental apartment homes and competitive pricing from projected apartment industry dynamics, demographic and employment information; IRT’s maintenance of real estate investment trust (“REIT”) status; availability of financing and capital; dividends are subject to the discretion of IRT’s Board of Directors, and will depend on IRT’s financial condition, results of operations, capital requirements, compliance with applicable laws and agreements and any other factors deemed relevant by IRT’s Board; risks associated with pursuing additional strategic acquisitions, including risks associated with the need to raise additional capital to fund the acquisitions; and those additional risks and factors discussed in reports filed with the Securities and Exchange Commission (“SEC”) by IRT from time to time, including those discussed under the heading “Risk Factors” in IRT’s most recently filed reports on Forms 10-K and 10-Q. IRT undertakes no obligation to update these forward-looking statements to reflect events or circumstances after the date hereof or to reflect the occurrence of unanticipated events, except as may be required by law.
Independence Realty Trust, Inc. Contact
Edelman Financial Communications & Capital Markets
Ted McHugh and Lauren Tarola
212.277.4322
IRT@edelman.com
8
FINANCIAL & OPERATING HIGHLIGHTS
Dollars in thousands, except share and per share data
|
|
|
As of or For the Three Months Ended |
|
|||||||||||||||||
|
|
|
December 31, 2017 |
|
|
September 30, 2017 |
|
|
June 30, 2017 |
|
|
March 31, 2017 |
|
|
December 31, 2016 |
|
|||||
|
Selected Financial Information: |
|
|
|
|
|
|
|
|
|
|
|
|
|
|
|
|
|
|
|
|
|
Operating Statistics: |
|
|
|
|
|
|
|
|
|
|
|
|
|
|
|
|
|
|
|
|
|
Net income allocable to common shares |
|
$ |
6,293 |
|
|
$ |
1,097 |
|
|
$ |
18,739 |
|
|
$ |
4,077 |
|
|
$ |
(40,980 |
) |
|
Earnings (loss) per share -- diluted |
|
$ |
0.08 |
|
|
$ |
0.02 |
|
|
$ |
0.27 |
|
|
$ |
0.06 |
|
|
$ |
(0.61 |
) |
|
Total property revenue |
|
$ |
42,307 |
|
|
$ |
39,864 |
|
|
$ |
39,431 |
|
|
$ |
38,895 |
|
|
$ |
38,002 |
|
|
Total property operating expenses |
|
$ |
16,610 |
|
|
$ |
16,196 |
|
|
$ |
15,918 |
|
|
$ |
15,992 |
|
|
$ |
15,560 |
|
|
Net operating income |
|
$ |
25,697 |
|
|
$ |
23,668 |
|
|
$ |
23,513 |
|
|
$ |
22,903 |
|
|
$ |
22,442 |
|
|
NOI margin |
|
|
60.7 |
% |
|
|
59.4 |
% |
|
|
59.6 |
% |
|
|
58.9 |
% |
|
|
59.1 |
% |
|
Adjusted EBITDA |
|
$ |
21,743 |
|
|
$ |
20,220 |
|
|
$ |
19,493 |
|
|
$ |
19,512 |
|
|
$ |
18,544 |
|
|
FFO per share -- diluted |
|
$ |
0.14 |
|
|
$ |
0.13 |
|
|
$ |
0.12 |
|
|
$ |
0.17 |
|
|
$ |
(0.50 |
) |
|
CORE FFO per share -- diluted |
|
$ |
0.18 |
|
|
$ |
0.19 |
|
|
$ |
0.19 |
|
|
$ |
0.18 |
|
|
$ |
0.17 |
|
|
Dividends per share |
|
$ |
0.18 |
|
|
$ |
0.18 |
|
|
$ |
0.18 |
|
|
$ |
0.18 |
|
|
$ |
0.18 |
|
|
CORE FFO payout ratio |
|
|
100.0 |
% |
|
|
94.7 |
% |
|
|
94.7 |
% |
|
|
100.0 |
% |
|
|
105.9 |
% |
|
Portfolio Data: |
|
|
|
|
|
|
|
|
|
|
|
|
|
|
|
|
|
|
|
|
|
Total gross assets |
|
$ |
1,551,238 |
|
|
$ |
1,497,546 |
|
|
$ |
1,400,864 |
|
|
$ |
1,390,589 |
|
|
$ |
1,370,243 |
|
|
Total number of properties |
|
|
52 |
|
|
|
50 |
|
|
|
46 |
|
|
|
47 |
|
|
|
46 |
|
|
Total units |
|
|
14,017 |
|
|
|
13,729 |
|
|
|
12,812 |
|
|
|
13,198 |
|
|
|
12,982 |
|
|
Period end occupancy |
|
|
94.0 |
% |
|
|
94.8 |
% |
|
|
94.5 |
% |
|
|
94.7 |
% |
|
|
94.5 |
% |
|
Total portfolio average occupancy |
|
|
94.1 |
% |
|
|
94.7 |
% |
|
|
94.9 |
% |
|
|
93.8 |
% |
|
|
93.8 |
% |
|
Total portfolio average effective monthly rent, per unit |
|
$ |
1,006 |
|
|
$ |
1,004 |
|
|
$ |
1,010 |
|
|
$ |
978 |
|
|
$ |
977 |
|
|
Same store period end occupancy (a) |
|
|
94.9 |
% |
|
|
94.9 |
% |
|
|
94.6 |
% |
|
|
94.8 |
% |
|
|
93.9 |
% |
|
Same store portfolio average occupancy (a) |
|
|
94.7 |
% |
|
|
94.7 |
% |
|
|
95.0 |
% |
|
|
93.9 |
% |
|
|
93.7 |
% |
|
Same store portfolio average effective monthly rent, per unit (a) |
|
$ |
1,021 |
|
|
$ |
1,020 |
|
|
$ |
1,013 |
|
|
$ |
1,007 |
|
|
$ |
998 |
|
|
Capitalization: |
|
|
|
|
|
|
|
|
|
|
|
|
|
|
|
|
|
|
|
|
|
Total debt |
|
$ |
778,442 |
|
|
$ |
731,625 |
|
|
$ |
764,521 |
|
|
$ |
765,695 |
|
|
$ |
743,817 |
|
|
Common share price, period end |
|
$ |
10.09 |
|
|
$ |
10.17 |
|
|
$ |
9.87 |
|
|
$ |
9.37 |
|
|
$ |
8.92 |
|
|
Market equity capitalization |
|
$ |
885,094 |
|
|
$ |
880,257 |
|
|
$ |
712,413 |
|
|
$ |
674,591 |
|
|
$ |
641,393 |
|
|
Total market capitalization |
|
$ |
1,663,536 |
|
|
$ |
1,611,882 |
|
|
$ |
1,476,934 |
|
|
$ |
1,440,286 |
|
|
$ |
1,385,210 |
|
|
Total debt/total gross assets |
|
|
50.2 |
% |
(c) |
|
48.9 |
% |
|
|
54.6 |
% |
|
|
55.1 |
% |
|
|
54.3 |
% |
|
Net debt to adjusted EBITDA |
|
|
8.8 |
x |
(b) |
|
8.9 |
x |
|
|
9.7 |
x |
|
|
9.7 |
x |
|
|
9.7 |
x |
|
Interest coverage |
|
|
3.0 |
x |
|
|
2.9 |
x |
|
|
2.7 |
x |
|
|
2.6 |
x |
|
|
2.4 |
x |
|
Common shares and OP Units: |
|
|
|
|
|
|
|
|
|
|
|
|
|
|
|
|
|
|
|
|
|
Shares outstanding |
|
|
84,708,551 |
|
|
|
83,518,603 |
|
|
|
69,143,955 |
|
|
|
69,125,681 |
|
|
|
68,996,070 |
|
|
OP units outstanding |
|
|
3,011,351 |
|
|
|
3,035,654 |
|
|
|
3,035,654 |
|
|
|
2,869,050 |
|
|
|
2,908,949 |
|
|
Common shares and OP units outstanding |
|
|
87,719,902 |
|
|
|
86,554,257 |
|
|
|
72,179,609 |
|
|
|
71,994,731 |
|
|
|
71,905,019 |
|
|
Weighted average common shares and units |
|
|
86,646,371 |
|
|
|
75,009,859 |
|
|
|
71,703,735 |
|
|
|
71,656,205 |
|
|
|
70,036,948 |
|
|
|
|
|
|
|
|
|
|
|
|
|
|
|
|
|
|
|
|
|
|
|
|
(a) |
Same store portfolio consists of 42 properties, which represent 11,677 units. |
|
(b) |
Net debt to adjusted EBITDA would be 9.2x if adjusted for acquisitions subsequent to year-end. |
|
(c) |
Total debt to total gross assets would be 52.4% if adjusted for acquisitions subsequent to year-end. |
9
Dollars in thousands, except per share data
|
|
|
As of |
|
|||||||||||||||||
|
|
|
December 31, 2017 |
|
|
September 30, 2017 |
|
|
June 30, 2017 |
|
|
March 31, 2017 |
|
|
December 31, 2016 |
|
|||||
|
Assets |
|
|
|
|
|
|
|
|
|
|
|
|
|
|
|
|
|
|
|
|
|
Investments in real estate at cost |
|
$ |
1,504,156 |
|
|
$ |
1,427,057 |
|
|
$ |
1,340,573 |
|
|
$ |
1,280,840 |
|
|
$ |
1,249,356 |
|
|
Less: accumulated depreciation |
|
|
(84,097 |
) |
|
|
(75,084 |
) |
|
|
(66,853 |
) |
|
|
(59,055 |
) |
|
|
(51,511 |
) |
|
Investments in real estate, net |
|
|
1,420,059 |
|
|
|
1,351,973 |
|
|
|
1,273,720 |
|
|
|
1,221,785 |
|
|
|
1,197,845 |
|
|
Real estate held for sale |
|
|
- |
|
|
|
22,031 |
|
|
|
21,964 |
|
|
|
61,102 |
|
|
|
60,786 |
|
|
Cash and cash equivalents |
|
|
9,985 |
|
|
|
10,128 |
|
|
|
6,271 |
|
|
|
10,065 |
|
|
|
20,892 |
|
|
Restricted cash |
|
|
4,634 |
|
|
|
6,665 |
|
|
|
5,690 |
|
|
|
5,575 |
|
|
|
5,518 |
|
|
Accounts receivable and other assets |
|
|
7,556 |
|
|
|
9,416 |
|
|
|
5,114 |
|
|
|
3,794 |
|
|
|
5,211 |
|
|
Derivative assets |
|
|
7,291 |
|
|
|
3,581 |
|
|
|
3,619 |
|
|
|
4,292 |
|
|
|
3,867 |
|
|
Intangible assets, net |
|
|
1,099 |
|
|
|
1,418 |
|
|
|
799 |
|
|
|
373 |
|
|
|
118 |
|
|
Total assets |
|
$ |
1,450,624 |
|
|
$ |
1,405,212 |
|
|
$ |
1,317,177 |
|
|
$ |
1,306,986 |
|
|
$ |
1,294,237 |
|
|
Liabilities and Equity |
|
|
|
|
|
|
|
|
|
|
|
|
|
|
|
|
|
|
|
|
|
Total indebtedness |
|
$ |
778,442 |
|
|
$ |
731,625 |
|
|
$ |
764,521 |
|
|
$ |
765,695 |
|
|
$ |
743,817 |
|
|
Accounts payable and accrued expenses |
|
|
17,216 |
|
|
|
23,236 |
|
|
|
16,940 |
|
|
|
13,154 |
|
|
|
14,028 |
|
|
Accrued interest payable |
|
|
249 |
|
|
|
134 |
|
|
|
176 |
|
|
|
540 |
|
|
|
491 |
|
|
Dividends payable |
|
|
5,245 |
|
|
|
5,176 |
|
|
|
4,313 |
|
|
|
4,301 |
|
|
|
4,297 |
|
|
Other liabilities |
|
|
3,353 |
|
|
|
3,063 |
|
|
|
2,906 |
|
|
|
2,952 |
|
|
|
2,913 |
|
|
Total liabilities |
|
|
804,505 |
|
|
|
763,234 |
|
|
|
788,856 |
|
|
|
786,642 |
|
|
|
765,546 |
|
|
Equity |
|
|
|
|
|
|
|
|
|
|
|
|
|
|
|
|
|
|
|
|
|
Shareholders' Equity: |
|
|
|
|
|
|
|
|
|
|
|
|
|
|
|
|
|
|
|
|
|
Preferred shares, $0.01 par value per share |
|
|
— |
|
|
|
— |
|
|
|
— |
|
|
|
— |
|
|
|
— |
|
|
Common shares, $0.01 par value per share |
|
|
846 |
|
|
|
835 |
|
|
|
691 |
|
|
|
691 |
|
|
|
690 |
|
|
Additional paid in capital |
|
|
703,849 |
|
|
|
691,550 |
|
|
|
565,372 |
|
|
|
565,006 |
|
|
|
564,633 |
|
|
Accumulated other comprehensive income (loss) |
|
|
4,626 |
|
|
|
3,466 |
|
|
|
3,468 |
|
|
|
4,097 |
|
|
|
3,683 |
|
|
Retained earnings (deficit) |
|
|
(85,221 |
) |
|
|
(76,419 |
) |
|
|
(64,260 |
) |
|
|
(70,608 |
) |
|
|
(62,181 |
) |
|
Total shareholders' equity |
|
|
624,100 |
|
|
|
619,432 |
|
|
|
505,271 |
|
|
|
499,186 |
|
|
|
506,825 |
|
|
Noncontrolling Interests |
|
|
22,019 |
|
|
|
22,546 |
|
|
|
23,050 |
|
|
|
21,158 |
|
|
|
21,866 |
|
|
Total equity |
|
|
646,119 |
|
|
|
641,978 |
|
|
|
528,321 |
|
|
|
520,344 |
|
|
|
528,691 |
|
|
Total liabilities and equity |
|
$ |
1,450,624 |
|
|
$ |
1,405,212 |
|
|
$ |
1,317,177 |
|
|
$ |
1,306,986 |
|
|
$ |
1,294,237 |
|
10
STATEMENTS OF OPERATIONS, FFO & CORE FFO
TRAILING 5 QUARTERS
Dollars in thousands, except per share data
|
|
|
For the Three Months Ended |
|
|||||||||||||||||
|
|
|
December 31, 2017 |
|
|
September 30, 2017 |
|
|
June 30, 2017 |
|
|
March 31, 2017 |
|
|
December 31, 2016 |
|
|||||
|
Revenue: |
|
|
|
|
|
|
|
|
|
|
|
|
|
|
|
|
|
|
|
|
|
Rental income |
|
$ |
38,029 |
|
|
$ |
35,531 |
|
|
$ |
35,176 |
|
|
$ |
34,737 |
|
|
$ |
34,145 |
|
|
Reimbursement and other property income |
|
|
4,278 |
|
|
|
4,333 |
|
|
|
4,255 |
|
|
|
4,158 |
|
|
|
3,857 |
|
|
Total property revenue |
|
|
42,307 |
|
|
|
39,864 |
|
|
|
39,431 |
|
|
|
38,895 |
|
|
|
38,002 |
|
|
Property management and other income |
|
|
140 |
|
|
|
202 |
|
|
|
130 |
|
|
|
247 |
|
|
|
29 |
|
|
Total revenue |
|
|
42,447 |
|
|
|
40,066 |
|
|
|
39,561 |
|
|
|
39,142 |
|
|
|
38,031 |
|
|
Expenses: |
|
|
|
|
|
|
|
|
|
|
|
|
|
|
|
|
|
|
|
|
|
Real estate operating expenses |
|
|
16,610 |
|
|
|
16,196 |
|
|
|
15,918 |
|
|
|
15,992 |
|
|
|
15,560 |
|
|
Property management expenses |
|
|
1,696 |
|
|
|
1,328 |
|
|
|
1,444 |
|
|
|
1,538 |
|
|
|
1,137 |
|
|
General and administrative expenses |
|
|
2,398 |
|
|
|
2,322 |
|
|
|
2,706 |
|
|
|
2,100 |
|
|
|
2,790 |
|
|
Acquisition and integration expenses |
|
|
386 |
|
|
|
569 |
|
|
|
265 |
|
|
|
122 |
|
|
|
6 |
|
|
Depreciation and amortization expense |
|
|
9,912 |
|
|
|
8,671 |
|
|
|
8,011 |
|
|
|
7,607 |
|
|
|
7,897 |
|
|
Total expenses |
|
|
31,002 |
|
|
|
29,086 |
|
|
|
28,344 |
|
|
|
27,359 |
|
|
|
27,390 |
|
|
Operating Income (loss) |
|
|
11,445 |
|
|
|
10,980 |
|
|
|
11,217 |
|
|
|
11,783 |
|
|
|
10,641 |
|
|
Interest expense |
|
|
(7,129 |
) |
|
|
(6,963 |
) |
|
|
(7,162 |
) |
|
|
(7,448 |
) |
|
|
(7,720 |
) |
|
Other income (expense) |
|
|
94 |
|
|
|
12 |
|
|
|
(12 |
) |
|
|
(5 |
) |
|
|
(2 |
) |
|
Net gains (losses) on sale of assets |
|
|
2,952 |
|
|
|
(92 |
) |
|
|
16,050 |
|
|
|
(85 |
) |
|
|
3 |
|
|
Gains (losses) on extinguishment of debt |
|
|
— |
|
|
|
— |
|
|
|
(572 |
) |
|
|
— |
|
|
|
(652 |
) |
|
Acquisition related debt extinguishment expenses |
|
|
(843 |
) |
|
|
(2,781 |
) |
|
|
— |
|
|
|
— |
|
|
|
— |
|
|
Management internalization expense |
|
|
— |
|
|
|
— |
|
|
|
— |
|
|
|
— |
|
|
|
(44,976 |
) |
|
Net income (loss) |
|
|
6,519 |
|
|
|
1,156 |
|
|
|
19,521 |
|
|
|
4,245 |
|
|
|
(42,706 |
) |
|
(Income) loss allocated to noncontrolling interests |
|
|
(226 |
) |
|
|
(59 |
) |
|
|
(782 |
) |
|
|
(168 |
) |
|
|
1,726 |
|
|
Net income (loss) allocable to common shares |
|
$ |
6,293 |
|
|
$ |
1,097 |
|
|
$ |
18,739 |
|
|
$ |
4,077 |
|
|
$ |
(40,980 |
) |
|
EPS - basic |
|
$ |
0.08 |
|
|
$ |
0.02 |
|
|
$ |
0.27 |
|
|
$ |
0.06 |
|
|
$ |
(6.10 |
) |
|
Weighted-average shares outstanding - Basic |
|
|
83,612,566 |
|
|
|
71,972,394 |
|
|
|
68,832,855 |
|
|
|
68,787,155 |
|
|
|
6,712,693 |
|
|
EPS - diluted |
|
$ |
0.08 |
|
|
$ |
0.02 |
|
|
$ |
0.27 |
|
|
$ |
0.06 |
|
|
$ |
(0.61 |
) |
|
Weighted-average shares outstanding - Diluted |
|
|
83,849,367 |
|
|
|
72,144,544 |
|
|
|
68,943,869 |
|
|
|
68,958,786 |
|
|
|
67,126,993 |
|
|
Funds From Operations (FFO): |
|
|
|
|
|
|
|
|
|
|
|
|
|
|
|
|
|
|
|
|
|
Net Income (loss) |
|
$ |
6,519 |
|
|
$ |
1,156 |
|
|
$ |
19,521 |
|
|
$ |
4,245 |
|
|
$ |
(42,706 |
) |
|
Add-Back (Deduct): |
|
|
|
|
|
|
|
|
|
|
|
|
|
|
|
|
|
|
|
|
|
Depreciation |
|
|
9,868 |
|
|
|
8,645 |
|
|
|
7,987 |
|
|
|
7,595 |
|
|
|
7,897 |
|
|
Net (gains) losses on sale of assets |
|
|
(4,455 |
) |
|
|
92 |
|
|
|
(18,798 |
) |
|
|
85 |
|
|
|
(3 |
) |
|
FFO |
|
$ |
11,932 |
|
|
$ |
9,893 |
|
|
$ |
8,710 |
|
|
$ |
11,925 |
|
|
$ |
(34,812 |
) |
|
FFO per share--diluted |
|
$ |
0.14 |
|
|
|
0.13 |
|
|
$ |
0.12 |
|
|
$ |
0.17 |
|
|
$ |
(0.50 |
) |
|
CORE Funds From Operations (CFFO): |
|
|
|
|
|
|
|
|
|
|
|
|
|
|
|
|
|
|
|
|
|
FFO |
|
$ |
11,932 |
|
|
$ |
9,893 |
|
|
$ |
8,710 |
|
|
$ |
11,925 |
|
|
$ |
(34,812 |
) |
|
Add-Back (Deduct): |
|
|
|
|
|
|
|
|
|
|
|
|
|
|
|
|
|
|
|
|
|
Stock compensation expense |
|
|
420 |
|
|
|
422 |
|
|
|
738 |
|
|
|
388 |
|
|
|
390 |
|
|
Amortization of deferred financing costs |
|
|
309 |
|
|
|
282 |
|
|
|
359 |
|
|
|
519 |
|
|
|
521 |
|
|
Acquisition and integration expenses |
|
|
386 |
|
|
|
569 |
|
|
|
265 |
|
|
|
122 |
|
|
|
6 |
|
|
Other depreciation and amortization |
|
|
44 |
|
|
|
26 |
|
|
|
24 |
|
|
|
12 |
|
|
|
— |
|
|
Other expense (income) |
|
|
(94 |
) |
|
|
(12 |
) |
|
|
12 |
|
|
|
— |
|
|
|
— |
|
|
(Gains) losses on extinguishment of debt |
|
|
— |
|
|
|
— |
|
|
|
572 |
|
|
|
— |
|
|
|
652 |
|
|
Defeasance costs included in net gains (losses) on sale of assets |
|
|
1,503 |
|
|
|
— |
|
|
|
2,748 |
|
|
|
— |
|
|
|
— |
|
|
Management internalization expense |
|
|
— |
|
|
|
— |
|
|
|
— |
|
|
|
— |
|
|
|
44,976 |
|
|
Acquisition related debt extinguishment expenses |
|
|
843 |
|
|
|
2,781 |
|
|
|
— |
|
|
|
— |
|
|
|
— |
|
|
|
|
|
|
|
|
|
|
|
|
|
|
|
|
|
|
|
|
|
|
|
|
CFFO |
|
$ |
15,343 |
|
|
$ |
13,961 |
|
|
$ |
13,428 |
|
|
$ |
12,966 |
|
|
$ |
11,733 |
|
|
CFFO per share--diluted |
|
$ |
0.18 |
|
|
$ |
0.19 |
|
|
$ |
0.19 |
|
|
$ |
0.18 |
|
|
$ |
0.17 |
|
|
Weighted-average shares and units outstanding |
|
|
86,646,371 |
|
|
|
75,009,859 |
|
|
|
71,703,735 |
|
|
|
71,656,205 |
|
|
|
70,036,948 |
|
11
STATEMENTS OF OPERATIONS, FFO & CORE FFO
THREE AND TWELVE MONTHS ENDED DECEMBER 31, 2017 and 2016
Dollars in thousands, except per share data
|
|
|
Three Months Ended December 31, |
|
|
Twelve Months Ended December 31, |
|
||||||||||
|
|
|
2017 |
|
|
2016 |
|
|
2017 |
|
|
2016 |
|
||||
|
Revenue: |
|
|
|
|
|
|
|
|
|
|
|
|
|
|
|
|
|
Rental income |
|
$ |
38,029 |
|
|
|
34,145 |
|
|
$ |
143,473 |
|
|
|
137,416 |
|
|
Reimbursement and other property income |
|
|
4,278 |
|
|
|
3,857 |
|
|
|
17,024 |
|
|
|
15,943 |
|
|
Total property revenue |
|
|
42,307 |
|
|
|
38,002 |
|
|
|
160,497 |
|
|
|
153,359 |
|
|
Property management and other income |
|
|
140 |
|
|
|
29 |
|
|
|
719 |
|
|
|
29 |
|
|
Total revenue |
|
|
42,447 |
|
|
|
38,031 |
|
|
|
161,216 |
|
|
|
153,388 |
|
|
Expenses: |
|
|
|
|
|
|
|
|
|
|
|
|
|
|
|
|
|
Real estate operating expenses |
|
|
16,610 |
|
|
|
15,560 |
|
|
|
64,716 |
|
|
|
63,148 |
|
|
Property management expenses |
|
|
1,696 |
|
|
|
1,137 |
|
|
|
6,006 |
|
|
|
4,847 |
|
|
General and administrative expenses |
|
|
2,398 |
|
|
|
2,790 |
|
|
|
9,526 |
|
|
|
10,864 |
|
|
Acquisition and integration expenses |
|
|
386 |
|
|
|
6 |
|
|
|
1,342 |
|
|
|
43 |
|
|
Depreciation and amortization expense |
|
|
9,912 |
|
|
|
7,897 |
|
|
|
34,201 |
|
|
|
34,824 |
|
|
Total expenses |
|
|
31,002 |
|
|
|
27,390 |
|
|
|
115,791 |
|
|
|
113,726 |
|
|
Operating Income (loss) |
|
|
11,445 |
|
|
|
10,641 |
|
|
|
45,425 |
|
|
|
39,662 |
|
|
Interest expense |
|
|
(7,129 |
) |
|
|
(7,720 |
) |
|
|
(28,702 |
) |
|
|
(35,535 |
) |
|
Other income (expense) |
|
|
94 |
|
|
|
(2 |
) |
|
|
89 |
|
|
|
(4 |
) |
|
Net gains (losses) on sale of assets |
|
|
2,952 |
|
|
|
3 |
|
|
|
18,825 |
|
|
|
31,776 |
|
|
Gains(losses) on extinguishment of debt |
|
|
— |
|
|
|
(652 |
) |
|
|
(572 |
) |
|
|
(1,210 |
) |
|
Acquisition related debt extinguishment expenses |
|
|
(843 |
) |
|
|
— |
|
|
|
(3,624 |
) |
|
|
— |
|
|
Gains (losses) on TSRE merger and property acquisitions |
|
|
— |
|
|
|
— |
|
|
|
— |
|
|
|
732 |
|
|
Management internalization expense |
|
|
— |
|
|
|
(44,976 |
) |
|
|
— |
|
|
|
(44,976 |
) |
|
Net income (loss) |
|
|
6,519 |
|
|
|
(42,706 |
) |
|
|
31,441 |
|
|
|
(9,555 |
) |
|
(Income) loss allocated to noncontrolling interests |
|
|
(226 |
) |
|
|
1,726 |
|
|
|
(1,235 |
) |
|
|
(246 |
) |
|
Net income (loss) available to common shares |
|
$ |
6,293 |
|
|
$ |
(40,980 |
) |
|
$ |
30,206 |
|
|
$ |
(9,801 |
) |
|
EPS - basic |
|
$ |
0.08 |
|
|
$ |
(0.61 |
) |
|
$ |
0.41 |
|
|
$ |
(0.19 |
) |
|
Weighted-average shares outstanding - Basic |
|
|
83,612,566 |
|
|
|
67,126,993 |
|
|
|
73,338,219 |
|
|
|
52,182,427 |
|
|
EPS - diluted |
|
$ |
0.08 |
|
|
$ |
(0.61 |
) |
|
$ |
0.41 |
|
|
$ |
(0.19 |
) |
|
Weighted-average shares outstanding - Diluted |
|
|
83,849,367 |
|
|
|
67,126,993 |
|
|
|
73,599,869 |
|
|
|
52,182,427 |
|
|
Funds From Operations (FFO): |
|
|
|
|
|
|
|
|
|
|
|
|
|
|
|
|
|
Net Income (loss) |
|
$ |
6,519 |
|
|
$ |
(42,706 |
) |
|
$ |
31,441 |
|
|
$ |
(9,555 |
) |
|
Adjustments: |
|
|
|
|
|
|
|
|
|
|
|
|
|
|
|
|
|
Real estate depreciation and amortization |
|
|
9,868 |
|
|
|
7,897 |
|
|
|
34,097 |
|
|
|
34,824 |
|
|
Net (gains) losses on sale of assets |
|
|
(4,455 |
) |
|
|
(3 |
) |
|
|
(23,076 |
) |
|
|
(31,776 |
) |
|
Funds From Operations |
|
$ |
11,932 |
|
|
$ |
(34,812 |
) |
|
$ |
42,462 |
|
|
$ |
(6,507 |
) |
|
FFO per share--diluted |
|
$ |
0.14 |
|
|
$ |
(0.50 |
) |
|
$ |
0.56 |
|
|
$ |
(0.12 |
) |
|
Core Funds From Operations (CFFO): |
|
|
|
|
|
|
|
|
|
|
|
|
|
|
|
|
|
Funds From Operations |
|
$ |
11,932 |
|
|
$ |
(34,812 |
) |
|
$ |
42,462 |
|
|
$ |
(6,507 |
) |
|
Adjustments: |
|
|
|
|
|
|
|
|
|
|
|
|
|
|
|
|
|
Stock compensation expense |
|
|
420 |
|
|
|
390 |
|
|
|
1,967 |
|
|
|
1,222 |
|
|
Amortization of deferred financing costs |
|
|
309 |
|
|
|
521 |
|
|
|
1,469 |
|
|
|
3,064 |
|
|
Acquisition and integration expenses |
|
|
386 |
|
|
|
6 |
|
|
|
1,342 |
|
|
|
43 |
|
|
Other depreciation and amortization |
|
|
44 |
|
|
|
- |
|
|
|
104 |
|
|
|
- |
|
|
Other expense (income) |
|
|
(94 |
) |
|
|
- |
|
|
|
(94 |
) |
|
|
- |
|
|
(Gains) losses on extinguishment of debt |
|
|
- |
|
|
|
652 |
|
|
|
572 |
|
|
|
1,210 |
|
|
Defeasance costs included in net gains (losses) on sale of assets |
|
|
1,503 |
|
|
|
- |
|
|
|
4,251 |
|
|
|
- |
|
|
Management internalization expense |
|
|
- |
|
|
|
44,976 |
|
|
|
- |
|
|
|
44,976 |
|
|
Acquisition related debt extinguishment expenses |
|
|
843 |
|
|
|
- |
|
|
|
3,624 |
|
|
|
- |
|
|
Gains (losses) on TSRE merger |
|
|
- |
|
|
|
- |
|
|
|
- |
|
|
|
(732 |
) |
|
|
|
|
|
|
|
|
|
|
|
|
|
|
|
|
|
|
|
Core Funds From Operations |
|
$ |
15,343 |
|
|
$ |
11,733 |
|
|
$ |
55,697 |
|
|
$ |
43,276 |
|
|
CFFO per share--diluted |
|
$ |
0.18 |
|
|
$ |
0.17 |
|
|
$ |
0.73 |
|
|
$ |
0.79 |
|
|
Weighted-average shares and units outstanding |
|
|
86,646,371 |
|
|
|
70,036,948 |
|
|
|
76,291,465 |
|
|
|
55,092,382 |
|
12
ADJUSTED EBITDA RECONCILIATION AND COVERAGE RATIO
Dollars in thousands
|
|
|
Three Months Ended |
|
|
|
Twelve Months Ended |
|
||||||||||||||||||||||
|
ADJUSTED EBITDA: |
|
December 31, 2017 |
|
|
September 30, 2017 |
|
|
June 30, 2017 |
|
|
March 31, 2017 |
|
|
December 31, 2016 |
|
|
|
December 31, 2017 |
|
|
December 31, 2016 |
|
|||||||
|
Net income (loss) |
|
$ |
6,519 |
|
|
|
1,156 |
|
|
|
19,521 |
|
|
$ |
4,245 |
|
|
$ |
(42,706 |
) |
|
|
|
31,441 |
|
|
|
(9,555 |
) |
|
Add-Back (Deduct): |
|
|
|
|
|
|
|
|
|
|
|
|
|
|
|
|
|
|
|
|
|
|
|
|
|
|
|
|
|
|
Depreciation and amortization |
|
|
9,912 |
|
|
|
8,671 |
|
|
|
8,011 |
|
|
|
7,607 |
|
|
|
7,897 |
|
|
|
|
34,201 |
|
|
|
34,824 |
|
|
Interest expense |
|
|
7,129 |
|
|
|
6,963 |
|
|
|
7,162 |
|
|
|
7,448 |
|
|
|
7,720 |
|
|
|
|
28,702 |
|
|
|
35,535 |
|
|
Other (income) expense |
|
|
(94 |
) |
|
|
(12 |
) |
|
|
12 |
|
|
|
5 |
|
|
|
2 |
|
|
|
|
(89 |
) |
|
|
4 |
|
|
Acquisition and integration expenses |
|
|
386 |
|
|
|
569 |
|
|
|
265 |
|
|
|
122 |
|
|
|
6 |
|
|
|
|
1,342 |
|
|
|
43 |
|
|
Net (gains) losses on sale of assets |
|
|
(2,952 |
) |
|
|
92 |
|
|
|
(16,050 |
) |
|
|
85 |
|
|
|
(3 |
) |
|
|
|
(18,825 |
) |
|
|
(31,776 |
) |
|
(Gains) losses on extinguishment of debt |
|
|
- |
|
|
|
- |
|
|
|
572 |
|
|
|
- |
|
|
|
652 |
|
|
|
|
572 |
|
|
|
1,210 |
|
|
Management internalization expense |
|
|
- |
|
|
|
- |
|
|
|
- |
|
|
|
- |
|
|
|
44,976 |
|
|
|
|
- |
|
|
|
44,976 |
|
|
Acquisition related debt extinguishment expenses |
|
|
843 |
|
|
|
2,781 |
|
|
|
- |
|
|
|
- |
|
|
|
- |
|
|
|
|
3,624 |
|
|
|
- |
|
|
(Gains) losses on TSRE merger and property acquisitions |
|
|
- |
|
|
|
- |
|
|
|
- |
|
|
|
- |
|
|
|
- |
|
|
|
|
- |
|
|
|
(732 |
) |
|
Adjusted EBITDA |
|
$ |
21,743 |
|
|
$ |
20,220 |
|
|
$ |
19,493 |
|
|
$ |
19,512 |
|
|
$ |
18,544 |
|
|
|
|
80,968 |
|
|
|
74,529 |
|
|
|
|
|
|
|
|
|
|
|
|
|
|
|
|
|
|
|
|
|
|
|
|
|
|
|
|
|
|
|
|
|
INTEREST COST: |
|
|
|
|
|
|
|
|
|
|
|
|
|
|
|
|
|
|
|
|
|
|
|
|
|
|
|
|
|
|
Interest expense |
|
$ |
7,129 |
|
|
$ |
6,963 |
|
|
$ |
7,162 |
|
|
$ |
7,448 |
|
|
$ |
7,720 |
|
|
|
|
28,702 |
|
|
|
35,535 |
|
|
|
|
|
|
|
|
|
|
|
|
|
|
|
|
|
|
|
|
|
|
|
|
|
|
|
|
|
|
|
|
|
INTEREST COVERAGE: |
|
|
3.0 |
x |
|
|
2.9 |
x |
|
|
2.7 |
x |
|
|
2.6 |
x |
|
|
2.4 |
x |
|
|
|
2.8 |
x |
|
|
2.1 |
x |
13
SAME STORE PORTFOLIO NET OPERATING INCOME
TRAILING 5 QUARTERS
Dollars in thousands, except per unit data
|
|
|
For the Three-Months Ended (a) |
|
|||||||||||||||||
|
|
|
December 31, 2017 |
|
|
September 30, 2017 |
|
|
June 30, 2017 |
|
|
March 31, 2017 |
|
|
December 31, 2016 |
|
|||||
|
Revenue: |
|
|
|
|
|
|
|
|
|
|
|
|
|
|
|
|
|
|
|
|
|
Rental income |
|
$ |
32,428 |
|
|
$ |
32,483 |
|
|
$ |
32,342 |
|
|
$ |
31,762 |
|
|
$ |
31,456 |
|
|
Reimbursement and other property income |
|
|
3,714 |
|
|
|
3,913 |
|
|
|
3,881 |
|
|
|
3,719 |
|
|
|
3,476 |
|
|
Total revenue |
|
|
36,142 |
|
|
|
36,396 |
|
|
|
36,223 |
|
|
|
35,481 |
|
|
|
34,932 |
|
|
Operating Expenses: |
|
|
|
|
|
|
|
|
|
|
|
|
|
|
|
|
|
|
|
|
|
Real estate taxes |
|
|
4,447 |
|
|
|
4,388 |
|
|
|
4,384 |
|
|
|
4,381 |
|
|
|
4,193 |
|
|
Property insurance |
|
|
768 |
|
|
|
747 |
|
|
|
781 |
|
|
|
820 |
|
|
|
796 |
|
|
Personnel expenses |
|
|
3,389 |
|
|
|
3,573 |
|
|
|
3,483 |
|
|
|
3,400 |
|
|
|
3,376 |
|
|
Utilities |
|
|
2,205 |
|
|
|
2,353 |
|
|
|
2,123 |
|
|
|
2,223 |
|
|
|
2,235 |
|
|
Repairs and maintenance |
|
|
1,035 |
|
|
|
1,550 |
|
|
|
1,334 |
|
|
|
1,233 |
|
|
|
1,194 |
|
|
Contract services |
|
|
1,040 |
|
|
|
1,074 |
|
|
|
1,090 |
|
|
|
1,043 |
|
|
|
1,029 |
|
|
Advertising expenses |
|
|
458 |
|
|
|
397 |
|
|
|
382 |
|
|
|
382 |
|
|
|
395 |
|
|
Other expenses |
|
|
876 |
|
|
|
662 |
|
|
|
703 |
|
|
|
791 |
|
|
|
703 |
|
|
Total operating expenses |
|
|
14,218 |
|
|
|
14,744 |
|
|
|
14,280 |
|
|
|
14,273 |
|
|
|
13,921 |
|
|
Same-store net operating income (a) |
|
$ |
21,924 |
|
|
$ |
21,652 |
|
|
$ |
21,943 |
|
|
$ |
21,208 |
|
|
$ |
21,011 |
|
|
Same-store NOI margin |
|
|
60.7 |
% |
|
|
59.5 |
% |
|
|
60.6 |
% |
|
|
59.8 |
% |
|
|
60.1 |
% |
|
Average occupancy |
|
|
94.7 |
% |
|
|
94.7 |
% |
|
|
95.0 |
% |
|
|
93.9 |
% |
|
|
93.7 |
% |
|
Average effective monthly rent, per unit |
|
$ |
1,021 |
|
|
$ |
1,020 |
|
|
$ |
1,013 |
|
|
$ |
1,007 |
|
|
$ |
998 |
|
|
Reconciliation of same-store net operating income to net income (loss) |
|
|
|
|
|
|
|
|
|
|
|
|
|
|
|
|
|
|
|
|
|
Same-store net operating income |
|
$ |
21,924 |
|
|
$ |
21,652 |
|
|
$ |
21,943 |
|
|
$ |
21,208 |
|
|
$ |
21,011 |
|
|
Non same-store net operating income |
|
|
3,773 |
|
|
|
2,016 |
|
|
|
1,570 |
|
|
|
1,695 |
|
|
|
1,431 |
|
|
Property management and other income |
|
|
140 |
|
|
|
202 |
|
|
|
130 |
|
|
|
247 |
|
|
|
29 |
|
|
Property management expenses |
|
|
(1,696 |
) |
|
|
(1,328 |
) |
|
|
(1,444 |
) |
|
|
(1,538 |
) |
|
|
(1,137 |
) |
|
General and administrative expenses |
|
|
(2,398 |
) |
|
|
(2,322 |
) |
|
|
(2,706 |
) |
|
|
(2,100 |
) |
|
|
(2,790 |
) |
|
Acquisition and integration expenses |
|
|
(386 |
) |
|
|
(569 |
) |
|
|
(265 |
) |
|
|
(122 |
) |
|
|
(6 |
) |
|
Depreciation and amortization |
|
|
(9,912 |
) |
|
|
(8,671 |
) |
|
|
(8,011 |
) |
|
|
(7,607 |
) |
|
|
(7,897 |
) |
|
Interest expense |
|
|
(7,129 |
) |
|
|
(6,963 |
) |
|
|
(7,162 |
) |
|
|
(7,448 |
) |
|
|
(7,720 |
) |
|
Other income (expense) |
|
|
94 |
|
|
|
12 |
|
|
|
(12 |
) |
|
|
(5 |
) |
|
|
(2 |
) |
|
Net gains (losses) on sale of assets |
|
|
2,952 |
|
|
|
(92 |
) |
|
|
16,050 |
|
|
|
(85 |
) |
|
|
3 |
|
|
Gains (losses) on extinguishment of debt |
|
|
— |
|
|
|
— |
|
|
|
(572 |
) |
|
|
— |
|
|
|
(652 |
) |
|
Acquisition related debt extinguishment expenses |
|
|
(843 |
) |
|
|
(2,781 |
) |
|
|
— |
|
|
|
— |
|
|
|
— |
|
|
Management internalization expense |
|
|
— |
|
|
|
— |
|
|
|
— |
|
|
|
— |
|
|
|
(44,976 |
) |
|
Net income (loss) |
|
$ |
6,519 |
|
|
$ |
1,156 |
|
|
$ |
19,521 |
|
|
$ |
4,245 |
|
|
$ |
(42,706 |
) |
|
(a) |
Same store portfolio consists of 42 properties, which represent 11,677 units. |
14
SAME STORE PORTFOLIO NET OPERATING INCOME
THREE AND TWELVE MONTHS ENDED DECEMBER 31, 2017 and 2016
Dollars in thousands, except per unit data
|
|
|
Three-Months Ended December 31 |
|
|
Twelve-Months Ended December 31 |
|
||||||||||||||||||
|
|
|
2017 |
|
|
2016 |
|
|
% change |
|
|
2017 |
|
|
2016 |
|
|
% change |
|
||||||
|
Revenue: |
|
|
|
|
|
|
|
|
|
|
|
|
|
|
|
|
|
|
|
|
|
|
|
|
|
Rental income |
|
$ |
32,428 |
|
|
$ |
31,456 |
|
|
|
3.1 |
% |
|
$ |
129,015 |
|
|
$ |
124,769 |
|
|
|
3.4 |
% |
|
Reimbursement and other property income |
|
|
3,714 |
|
|
|
3,476 |
|
|
|
6.8 |
% |
|
|
15,227 |
|
|
|
14,116 |
|
|
|
7.9 |
% |
|
Total revenue |
|
|
36,142 |
|
|
|
34,932 |
|
|
|
3.5 |
% |
|
|
144,242 |
|
|
|
138,885 |
|
|
|
3.9 |
% |
|
Operating Expenses: |
|
|
|
|
|
|
|
|
|
|
|
|
|
|
|
|
|
|
|
|
|
|
|
|
|
Real estate taxes |
|
|
4,447 |
|
|
|
4,193 |
|
|
|
6.1 |
% |
|
|
17,600 |
|
|
|
17,038 |
|
|
|
3.3 |
% |
|
Property insurance |
|
|
768 |
|
|
|
796 |
|
|
|
-3.5 |
% |
|
|
3,116 |
|
|
|
3,050 |
|
|
|
2.2 |
% |
|
Personnel expenses |
|
|
3,389 |
|
|
|
3,376 |
|
|
|
0.4 |
% |
|
|
13,845 |
|
|
|
13,414 |
|
|
|
3.2 |
% |
|
Utilities |
|
|
2,205 |
|
|
|
2,235 |
|
|
|
-1.3 |
% |
|
|
8,904 |
|
|
|
8,775 |
|
|
|
1.5 |
% |
|
Repairs and maintenance |
|
|
1,035 |
|
|
|
1,194 |
|
|
|
-13.3 |
% |
|
|
5,152 |
|
|
|
5,010 |
|
|
|
2.8 |
% |
|
Contract services |
|
|
1,040 |
|
|
|
1,029 |
|
|
|
1.1 |
% |
|
|
4,247 |
|
|
|
4,283 |
|
|
|
-0.8 |
% |
|
Advertising expenses |
|
|
458 |
|
|
|
395 |
|
|
|
15.9 |
% |
|
|
1,619 |
|
|
|
1,593 |
|
|
|
1.6 |
% |
|
Other expenses |
|
|
876 |
|
|
|
703 |
|
|
|
24.6 |
% |
|
|
3,032 |
|
|
|
2,957 |
|
|
|
2.5 |
% |
|
Total operating expenses |
|
|
14,218 |
|
|
|
13,921 |
|
|
|
2.1 |
% |
|
|
57,515 |
|
|
|
56,120 |
|
|
|
2.5 |
% |
|
Same-store net operating income (a) |
|
$ |
21,924 |
|
|
$ |
21,011 |
|
|
|
4.3 |
% |
|
$ |
86,727 |
|
|
$ |
82,765 |
|
|
|
4.8 |
% |
|
Same-store NOI margin |
|
|
60.7 |
% |
|
|
60.1 |
% |
|
|
0.6 |
% |
|
|
60.1 |
% |
|
|
59.6 |
% |
|
|
0.5 |
% |
|
Average occupancy |
|
|
94.7 |
% |
|
|
93.7 |
% |
|
|
1.0 |
% |
|
|
94.6 |
% |
|
|
93.8 |
% |
|
|
0.8 |
% |
|
Average effective monthly rent, per unit |
|
$ |
1,021 |
|
|
$ |
998 |
|
|
|
2.3 |
% |
|
$ |
1,015 |
|
|
$ |
987 |
|
|
|
2.8 |
% |
|
Reconciliation of same-store net operating income to net income (loss) |
|
|
|
|
|
|
|
|
|
|
|
|
|
|
|
|
|
|
|
|
|
|
|
|
|
Same-store portfolio net operating income |
|
$ |
21,924 |
|
|
$ |
21,011 |
|
|
|
|
|
|
$ |
86,727 |
|
|
$ |
82,765 |
|
|
|
|
|
|
Non same-store net operating income |
|
|
3,773 |
|
|
|
1,431 |
|
|
|
|
|
|
|
9,054 |
|
|
|
7,446 |
|
|
|
|
|
|
Property management and other income |
|
|
140 |
|
|
|
29 |
|
|
|
|
|
|
|
719 |
|
|
|
29 |
|
|
|
|
|
|
Property management expenses |
|
|
(1,696 |
) |
|
|
(1,137 |
) |
|
|
|
|
|
|
(6,006 |
) |
|
|
(4,847 |
) |
|
|
|
|
|
General and administrative expenses |
|
|
(2,398 |
) |
|
|
(2,790 |
) |
|
|
|
|
|
|
(9,526 |
) |
|
|
(10,864 |
) |
|
|
|
|
|
Acquisition and integration expenses |
|
|
(386 |
) |
|
|
(6 |
) |
|
|
|
|
|
|
(1,342 |
) |
|
|
(43 |
) |
|
|
|
|
|
Depreciation and amortization |
|
|
(9,912 |
) |
|
|
(7,897 |
) |
|
|
|
|
|
|
(34,201 |
) |
|
|
(34,824 |
) |
|
|
|
|
|
Interest expense |
|
|
(7,129 |
) |
|
|
(7,720 |
) |
|
|
|
|
|
|
(28,702 |
) |
|
|
(35,535 |
) |
|
|
|
|
|
Other income (expense) |
|
|
94 |
|
|
|
(2 |
) |
|
|
|
|
|
|
89 |
|
|
|
(4 |
) |
|
|
|
|
|
Net gains (losses) on sale of assets |
|
|
2,952 |
|
|
|
3 |
|
|
|
|
|
|
|
18,825 |
|
|
|
31,776 |
|
|
|
|
|
|
Gains (losses) on extinguishment of debt |
|
|
— |
|
|
|
(652 |
) |
|
|
|
|
|
|
(572 |
) |
|
|
(1,210 |
) |
|
|
|
|
|
Acquisition related debt extinguishment expenses |
|
|
(843 |
) |
|
|
— |
|
|
|
|
|
|
|
(3,624 |
) |
|
|
- |
|
|
|
|
|
|
Management internalization expense |
|
|
— |
|
|
|
(44,976 |
) |
|
|
|
|
|
|
- |
|
|
|
(44,976 |
) |
|
|
|
|
|
Gains (losses) on TSRE merger |
|
|
— |
|
|
|
— |
|
|
|
|
|
|
|
- |
|
|
|
732 |
|
|
|
|
|
|
Net income (loss) |
|
$ |
6,519 |
|
|
$ |
(42,706 |
) |
|
|
|
|
|
$ |
31,441 |
|
|
$ |
(9,555 |
) |
|
|
|
|
|
(a) |
Same store portfolio consists of 42 properties, which represent 11,677 units. |
15
NET OPERATING INCOME (NOI) BRIDGE
TRAILING 5 QUARTERS
Dollars in thousands
|
|
|
For the Three-Months Ended |
|
|||||||||||||||||
|
|
|
December 31, 2017 |
|
|
September 30, 2017 |
|
|
June 30, 2017 |
|
|
March 31, 2017 |
|
|
December 31, 2016 |
|
|||||
|
Property revenue |
|
|
|
|
|
|
|
|
|
|
|
|
|
|
|
|
|
|
|
|
|
Same store (a) |
|
$ |
36,142 |
|
|
$ |
36,396 |
|
|
$ |
36,223 |
|
|
$ |
35,481 |
|
|
$ |
34,932 |
|
|
Non same store |
|
|
6,165 |
|
|
|
3,468 |
|
|
|
3,208 |
|
|
|
3,414 |
|
|
|
3,070 |
|
|
Total property revenue |
|
|
42,307 |
|
|
|
39,864 |
|
|
|
39,431 |
|
|
|
38,895 |
|
|
|
38,002 |
|
|
Property expenses |
|
|
|
|
|
|
|
|
|
|
|
|
|
|
|
|
|
|
|
|
|
Same store (a) |
|
|
14,218 |
|
|
|
14,744 |
|
|
|
14,280 |
|
|
|
14,273 |
|
|
|
13,921 |
|
|
Non same store |
|
|
2,392 |
|
|
|
1,452 |
|
|
|
1,638 |
|
|
|
1,719 |
|
|
|
1,639 |
|
|
Total property expenses |
|
|
16,610 |
|
|
|
16,196 |
|
|
|
15,918 |
|
|
|
15,992 |
|
|
|
15,560 |
|
|
Net operating income |
|
|
|
|
|
|
|
|
|
|
|
|
|
|
|
|
|
|
|
|
|
Same store (a) |
|
|
21,924 |
|
|
|
21,652 |
|
|
|
21,943 |
|
|
|
21,208 |
|
|
|
21,011 |
|
|
Non same store |
|
|
3,773 |
|
|
|
2,016 |
|
|
|
1,570 |
|
|
|
1,695 |
|
|
|
1,431 |
|
|
Total property net operating income |
|
$ |
25,697 |
|
|
$ |
23,668 |
|
|
$ |
23,513 |
|
|
$ |
22,903 |
|
|
$ |
22,442 |
|
|
Reconciliation of NOI to net income (loss) |
|
|
|
|
|
|
|
|
|
|
|
|
|
|
|
|
|
|
|
|
|
Total property net operating income |
|
$ |
25,697 |
|
|
$ |
23,668 |
|
|
$ |
23,513 |
|
|
$ |
22,903 |
|
|
$ |
22,442 |
|
|
Property management income |
|
|
140 |
|
|
|
202 |
|
|
|
130 |
|
|
|
247 |
|
|
|
29 |
|
|
General and administrative expense |
|
|
(2,398 |
) |
|
|
(2,322 |
) |
|
|
(2,706 |
) |
|
|
(2,100 |
) |
|
|
(2,790 |
) |
|
Property management expenses |
|
|
(1,696 |
) |
|
|
(1,328 |
) |
|
|
(1,444 |
) |
|
|
(1,538 |
) |
|
|
(1,137 |
) |
|
Acquisition and integration expenses |
|
|
(386 |
) |
|
|
(569 |
) |
|
|
(265 |
) |
|
|
(122 |
) |
|
|
(6 |
) |
|
Depreciation and amortization expense |
|
|
(9,912 |
) |
|
|
(8,671 |
) |
|
|
(8,011 |
) |
|
|
(7,607 |
) |
|
|
(7,897 |
) |
|
Interest expense |
|
|
(7,129 |
) |
|
|
(6,963 |
) |
|
|
(7,162 |
) |
|
|
(7,448 |
) |
|
|
(7,720 |
) |
|
Other income (expense) |
|
|
94 |
|
|
|
12 |
|
|
|
(12 |
) |
|
|
(5 |
) |
|
|
(2 |
) |
|
Net gains (losses) on sale of assets |
|
|
2,952 |
|
|
|
(92 |
) |
|
|
16,050 |
|
|
|
(85 |
) |
|
|
3 |
|
|
Gains (losses) on extinguishment of debt |
|
|
— |
|
|
|
— |
|
|
|
(572 |
) |
|
|
— |
|
|
|
(652 |
) |
|
Acquisition related debt extinguishment expenses |
|
|
(843 |
) |
|
|
(2,781 |
) |
|
|
— |
|
|
|
— |
|
|
|
— |
|
|
Management internalization expense |
|
|
— |
|
|
|
— |
|
|
|
— |
|
|
|
— |
|
|
|
(44,976 |
) |
|
Net income (loss) |
|
$ |
6,519 |
|
|
$ |
1,156 |
|
|
$ |
19,521 |
|
|
$ |
4,245 |
|
|
$ |
(42,706 |
) |
|
(a) |
Same store portfolio consists of 42 properties, which represent 11,677 units. |
16
|
SUMMARY OF APARTMENT COMMUNITY ACQUISITION AND DISPOSITION ACTIVITY |
|
Dollars in thousands with respect to Contract Price and Price per Unit
|
|
|
|
|
|
|
|
|
|
|
|
|
|
|
|
|
|
|
|
|
|
|
Acquisitions |
|
|
|
|
|
|
|
|
|
|
|
|
|
|
|
|
|
|
|
|
|
|
|
|
|
|
|
|
|
|
|
|
|
|
|
|
|
|
|
|
|
|
|
2017 Acquisitions |
|
Location |
|
Units |
|
|
Acquisition Date |
|
Contract Price |
|
|
Price per Unit |
|
|
Average Rent Per Unit |
|
||||
|
Lakes at Northdale |
|
Tampa, FL |
|
216 |
|
|
February 27, 2017 |
|
$ |
29,750 |
|
|
$ |
138 |
|
|
$ |
1,192 |
|
|
|
Haverford Place |
|
Lexington, KY |
|
160 |
|
|
May 24, 2017 |
|
$ |
14,240 |
|
|
$ |
89 |
|
|
$ |
874 |
|
|
|
South Terrace |
|
Durham, NC |
|
328 |
|
|
June 30, 2017 |
|
$ |
42,950 |
|
|
$ |
131 |
|
|
$ |
1,039 |
|
|
|
Cherry Grove Commons |
|
North Myrtle Beach, SC |
|
172 |
|
|
September 26, 2017 |
|
$ |
16,157 |
|
|
$ |
94 |
|
|
$ |
949 |
|
|
|
Riverchase Apts |
|
Indianapolis, IN |
|
216 |
|
|
September 26, 2017 |
|
$ |
18,899 |
|
|
$ |
87 |
|
|
$ |
800 |
|
|
|
Kensington Commons |
|
Canal Winchester, OH |
|
264 |
|
|
September 26, 2017 |
|
$ |
24,409 |
|
|
$ |
92 |
|
|
$ |
852 |
|
|
|
Schirm Farms |
|
Canal Winchester, OH |
|
264 |
|
|
September 26, 2017 |
|
$ |
23,749 |
|
|
$ |
90 |
|
|
$ |
831 |
|
|
|
Live Oak Trace |
|
Baton Rouge, LA |
|
264 |
|
|
October 25, 2017 |
|
$ |
28,501 |
|
|
$ |
108 |
|
|
$ |
983 |
|
|
|
Tides at Calabash |
|
Wilmington, NC |
|
168 |
|
|
November 14, 2017 |
|
$ |
14,269 |
|
|
$ |
85 |
|
|
$ |
838 |
|
|
|
Brunswick Point |
|
Wilmington, NC |
|
288 |
|
|
December 12, 2017 |
|
$ |
30,661 |
|
|
$ |
106 |
|
|
$ |
817 |
|
|
|
Total - 2017 Acquisitions |
|
|
|
|
2,340 |
|
|
|
|
$ |
243,585 |
|
|
$ |
104 |
|
|
$ |
921 |
|
|
|
|
|
|
|
|
|
|
|
|
|
|
|
|
|
|
|
|
|
|
|
|
2018 Acquisitions |
|
Location |
|
Units |
|
|
Acquisition Date |
|
Contract Price |
|
|
Price per Unit |
|
|
Average Rent Per Unit |
|
||||
|
Hartshire Lakes |
|
Indianapolis, IN |
|
272 |
|
|
January 3, 2018 |
|
$ |
27,597 |
|
|
$ |
101 |
|
|
$ |
917 |
|
|
|
Creekside Corners Apts |
|
Atlanta, GA |
|
444 |
|
|
January 3, 2018 |
|
$ |
43,901 |
|
|
$ |
99 |
|
|
$ |
931 |
|
|
|
The Chelsea |
|
Columbus, OH |
|
312 |
|
|
January 4, 2018 |
|
$ |
36,750 |
|
|
$ |
118 |
|
|
$ |
1,066 |
|
|
|
Total - 2018 Acquisitions |
|
|
|
|
1,028 |
|
|
|
|
$ |
108,248 |
|
|
$ |
105 |
|
|
$ |
968 |
|
|
|
|
|
|
|
|
|
|
|
|
|
|
|
|
|
|
|
|
|
|
|
|
Total - Acquisitions |
|
|
|
|
3,368 |
|
|
|
|
$ |
351,833 |
|
|
$ |
104 |
|
|
$ |
935 |
|
|
|
|
|
|
|
|
|
|
|
|
|
|
|
|
|
|
|
|
|
|
|
|
|
|
|
|
|
|
|
|
|
|
|
|
|
|
|
|
|
|
|
|
|
|
|
|
|
|
|
|
|
|
|
|
|
|
|
|
|
|
|
|
|
|
|
|
|
|
|
|
|
|
|
|
|
|
|
|
|
|
|
|
|
|
|
|
|
|
Dispositions |
|
|
|
|
|
|
|
|
|
|
|
|
|
|
|
|
|
|
|
|
|
|
|
|
|
|
|
|
|
|
|
|
|
|
|
|
|
|
|
|
|
|
|
2017 Dispositions |
|
Location |
|
Units |
|
|
Disposition Date |
|
Contract Price |
|
|
Price per Unit |
|
|
Average Rent Per Unit |
|
||||
|
Copper Mill |
|
Austin, TX |
|
320 |
|
|
May 5, 2017 |
|
$ |
32,000 |
|
|
$ |
100 |
|
|
$ |
1,016 |
|
|
|
Heritage Trace |
|
Newport News, VA |
|
200 |
|
|
June 1, 2017 |
|
$ |
11,600 |
|
|
$ |
58 |
|
|
$ |
750 |
|
|
|
Berkshire Square |
|
Indianapolis, IN |
|
354 |
|
|
June 9, 2017 |
|
$ |
16,000 |
|
|
$ |
45 |
|
|
$ |
651 |
|
|
|
The Crossings |
|
Jackson, MS |
|
432 |
|
|
November 28, 2017 |
|
$ |
27,200 |
|
|
$ |
63 |
|
|
$ |
790 |
|
|
|
Total - 2017 Dispositions |
|
|
|
|
1,306 |
|
|
|
|
$ |
86,800 |
|
|
$ |
66 |
|
|
$ |
802 |
|
17
Dollars in thousands, except per unit data
|
|
|
|
|
|
|
Investments in Real Estate |
|
|
|
|
|
|
|
|
|
|
|
|
|
|
|
|||||||
|
Property Name |
Location |
Acquisition Date |
Year Built / Renovated (a) |
|
Gross Cost |
|
Accumulated Depreciation |
|
Net Book Value |
|
Units (b) |
|
Period End Occupancy (c) |
|
|
Average Occupancy (d) |
|
|
Effective Rent (e) |
|
||||||||
|
Same Store Properties: |
|
|
|
|
|
|
|
|
|
|
|
|
|
|
|
|
|
|
|
|
|
|
|
|
|
|
|
|
|
Crestmont |
Marietta, GA |
4/29/2011 |
2010 (f) |
|
|
17,556 |
|
|
(3,800 |
) |
|
13,756 |
|
|
228 |
|
95.2% |
|
|
95.7% |
|
|
|
945 |
|
|||
|
Runaway Bay |
Indianapolis, IN |
10/11/2012 |
|
2002 |
|
|
16,266 |
|
|
(1,998 |
) |
|
14,268 |
|
|
192 |
|
94.8% |
|
|
94.7% |
|
|
|
1,008 |
|
||
|
Reserve at Eagle Ridge |
Waukegan, IL |
1/31/2014 |
|
2008 |
|
|
29,451 |
|
|
(2,484 |
) |
|
26,967 |
|
|
370 |
|
92.7% |
|
|
94.2% |
|
|
|
1,014 |
|
||
|
Windrush |
Edmond, OK |
2/28/2014 |
|
2011 |
|
|
9,593 |
|
|
(843 |
) |
|
8,750 |
|
|
160 |
|
91.3% |
|
|
89.0% |
|
|
|
759 |
|
||
|
Heritage Park |
Oklahoma City, OK |
2/28/2014 |
|
2011 |
|
|
17,794 |
|
|
(1,584 |
) |
|
16,210 |
|
|
453 |
|
93.4% |
|
|
92.4% |
|
|
|
645 |
|
||
|
Raindance |
Oklahoma City, OK |
2/28/2014 |
|
2011 |
|
|
14,741 |
|
|
(1,311 |
) |
|
13,430 |
|
|
504 |
|
96.8% |
|
|
94.7% |
|
|
|
545 |
|
||
|
Augusta |
Oklahoma City, OK |
2/28/2014 |
|
2011 |
|
|
11,845 |
|
|
(1,143 |
) |
|
10,702 |
|
|
197 |
|
91.9% |
|
|
93.5% |
|
|
|
726 |
|
||
|
Invitational |
Oklahoma City, OK |
2/28/2014 |
|
2011 |
|
|
19,644 |
|
|
(1,901 |
) |
|
17,743 |
|
|
344 |
|
92.4% |
|
|
93.0% |
|
|
|
665 |
|
||
|
King's Landing |
Creve Coeur, MO |
3/31/2014 |
|
2005 |
|
|
32,987 |
|
|
(2,914 |
) |
|
30,073 |
|
|
152 |
|
90.8% |
|
|
90.8% |
|
|
|
1,623 |
|
||
|
Carrington Park |
Little Rock, AR |
5/7/2014 |
|
1999 |
|
|
22,449 |
|
|
(2,090 |
) |
|
20,359 |
|
|
202 |
|
95.0% |
|
|
93.9% |
|
|
|
1,046 |
|
||
|
Arbors at the Reservoir |
Ridgeland, MS |
6/4/2014 |
|
2000 |
|
|
21,130 |
|
|
(1,780 |
) |
|
19,350 |
|
|
170 |
|
92.9% |
|
|
95.0% |
|
|
|
1,138 |
|
||
|
Walnut Hill |
Cordova, TN |
8/28/2014 |
|
2001 |
|
|
28,393 |
|
|
(2,400 |
) |
|
25,993 |
|
|
362 |
|
96.7% |
|
|
96.3% |
|
|
|
968 |
|
||
|
Lenoxplace |
Raleigh, NC |
9/5/2014 |
|
2012 |
|
|
24,644 |
|
|
(1,880 |
) |
|
22,764 |
|
|
268 |
|
95.9% |
|
|
96.7% |
|
|
|
937 |
|
||
|
Stonebridge Crossing |
Cordova, TN |
9/15/2014 |
|
1994 |
|
|
30,679 |
|
|
(2,479 |
) |
|
28,200 |
|
|
500 |
|
95.4% |
|
|
95.2% |
|
|
|
829 |
|
||
|
Bennington Pond |
Groveport, OH |
11/24/2014 |
|
2000 |
|
|
18,047 |
|
|
(1,375 |
) |
|
16,672 |
|
|
240 |
|
95.8% |
|
|
96.3% |
|
|
|
897 |
|
||
|
Prospect Park |
Louisville, KY |
12/8/2014 |
|
1990 |
|
|
14,316 |
|
|
(911 |
) |
|
13,405 |
|
|
138 |
|
93.5% |
|
|
92.5% |
|
|
|
940 |
|
||
|
Brookside |
Louisville, KY |
12/8/2014 |
|
1987 |
|
|
21,041 |
|
|
(1,380 |
) |
|
19,661 |
|
|
224 |
|
95.5% |
|
|
95.7% |
|
|
|
871 |
|
||
|
Jamestown |
Louisville, KY |
12/8/2014 |
1970 (f) |
|
|
37,137 |
|
|
(2,463 |
) |
|
34,674 |
|
|
356 |
|
92.1% |
|
|
94.7% |
|
|
|
1,040 |
|
|||
|
Oxmoor |
Louisville, KY |
12/8/2014 |
1999-2000 |
|
|
55,736 |
|
|
(3,854 |
) |
|
51,882 |
|
|
432 |
|
93.1% |
|
|
93.1% |
|
|
|
1,011 |
|
|||
|
Meadows |
Louisville, KY |
12/8/2014 |
|
1988 |
|
|
38,224 |
|
|
(2,528 |
) |
|
35,696 |
|
|
400 |
|
93.8% |
|
|
93.1% |
|
|
|
838 |
|
||
|
Stonebridge at the Ranch |
Little Rock, AR |
12/16/2014 |
|
2005 |
|
|
31,990 |
|
|
(2,213 |
) |
|
29,777 |
|
|
260 |
|
94.6% |
|
|
94.0% |
|
|
|
942 |
|
||
|
Iron Rock Ranch |
Austin, TX |
12/30/2014 |
2001-2002 |
|
|
35,590 |
|
|
(2,384 |
) |
|
33,206 |
|
|
300 |
|
94.3% |
|
|
93.8% |
|
|
|
1,275 |
|
|||
|
Bayview Club |
Indianapolis, IN |
5/1/2015 |
|
2004 |
|
|
26,020 |
|
|
(1,638 |
) |
|
24,382 |
|
|
236 |
|
92.4% |
|
|
95.7% |
|
|
|
994 |
|
||
|
Arbors River Oaks |
Memphis, TN |
9/17/2015 |
2010 (f) |
|
|
21,934 |
|
|
(1,228 |
) |
|
20,706 |
|
|
191 |
|
96.9% |
|
|
97.6% |
|
|
|
1,243 |
|
|||
|
Aston |
Wake Forest, NC |
9/17/2015 |
|
2013 |
|
|
38,005 |
|
|
(1,970 |
) |
|
36,035 |
|
|
288 |
|
95.1% |
|
|
95.7% |
|
|
|
1,084 |
|
||
|
Avenues at Craig Ranch |
McKinneuy, TX |
9/17/2015 |
|
2013 |
|
|
47,813 |
|
|
(2,413 |
) |
|
45,400 |
|
|
334 |
|
96.7% |
|
|
94.4% |
|
|
|
1,273 |
|
||
|
Bridge Pointe |
Huntsville, AL |
9/17/2015 |
|
2002 |
|
|
16,125 |
|
|
(860 |
) |
|
15,265 |
|
|
178 |
|
95.5% |
|
|
96.5% |
|
|
|
860 |
|
||
|
Creekstone at RTP |
Durham, NC |
9/17/2015 |
|
2013 |
|
|
38,350 |
|
|
(1,887 |
) |
|
36,463 |
|
|
256 |
|
96.5% |
|
|
94.5% |
|
|
|
1,200 |
|
||
|
Fountains Southend |
Charlotte, NC |
9/17/2015 |
|
2013 |
|
|
41,764 |
|
|
(2,118 |
) |
|
39,646 |
|
|
208 |
|
91.3% |
|
|
93.3% |
|
|
|
1,442 |
|
||
|
Fox Trails |
Plano, TX |
9/17/2015 |
|
1981 |
|
|
28,313 |
|
|
(1,356 |
) |
|
26,957 |
|
|
286 |
|
96.9% |
|
|
95.6% |
|
|
|
1,067 |
|
||
|
Lakeshore on the Hill |
Chattanooga, TN |
9/17/2015 |
|
2015 |
|
|
11,509 |
|
|
(634 |
) |
|
10,875 |
|
|
123 |
|
97.6% |
|
|
96.6% |
|
|
|
971 |
|
||
|
Millenia 700 |
Orlando, FL |
9/17/2015 |
|
2012 |
|
|
47,653 |
|
|
(2,403 |
) |
|
45,250 |
|
|
297 |
|
97.0% |
|
|
96.1% |
|
|
|
1,386 |
|
||
|
Miller Creek at German Town |
Memphis, TN |
9/17/2015 |
|
2013 |
|
|
57,048 |
|
|
(3,048 |
) |
|
54,000 |
|
|
330 |
|
95.5% |
|
|
96.5% |
|
|
|
1,238 |
|
||
|
Pointe at Canyon Ridge |
Atlanta, GA |
9/17/2015 |
2007 (f) |
|
|
49,950 |
|
|
(2,341 |
) |
|
47,609 |
|
|
494 |
|
96.8% |
|
|
96.0% |
|
|
|
993 |
|
|||
|
St James at Goose Creek |
Goose Creek, SC |
9/17/2015 |
|
2009 |
|
|
31,865 |
|
|
(1,661 |
) |
|
30,204 |
|
|
244 |
|
93.9% |
|
|
94.6% |
|
|
|
1,125 |
|
||
|
Talison Row at Daniel Island |
Daniel Island, SC |
9/17/2015 |
|
2013 |
|
|
47,225 |
|
|
(2,392 |
) |
|
44,833 |
|
|
274 |
|
96.4% |
|
|
95.3% |
|
|
|
1,463 |
|
||
|
The Aventine Greenville |
Greenville, SC |
9/17/2015 |
|
2013 |
|
|
48,233 |
|
|
(2,488 |
) |
|
45,745 |
|
|
346 |
|
92.5% |
|
|
93.5% |
|
|
|
1,094 |
|
||
|
Trails at Signal Mountain |
Chattanooga, TN |
9/17/2015 |
|
2015 |
|
|
14,498 |
|
|
(806 |
) |
|
13,692 |
|
|
172 |
|
98.3% |
|
|
95.9% |
|
|
|
951 |
|
||
|
Vue at Knoll Trail |
Dallas, TX |
9/17/2015 |
|
2015 |
|
|
9,355 |
|
|
(377 |
) |
|
8,978 |
|
|
114 |
|
96.5% |
|
|
96.2% |
|
|
|
927 |
|
||
|
Waterstone at Brier Creek |
Raleigh, NC |
9/17/2015 |
|
2014 |
|
|
39,035 |
|
|
(1,985 |
) |
|
37,050 |
|
|
232 |
|
94.0% |
|
|
95.0% |
|
|
|
1,260 |
|
||
|
Waterstone Big Creek |
Alpharetta, GA |
9/17/2015 |
|
2014 |
|
|
69,758 |
|
|
(3,518 |
) |
|
66,240 |
|
|
370 |
|
97.3% |
|
|
95.9% |
|
|
|
1,386 |
|
||
|
Westmont Commons |
Asheville, NC |
9/17/2015 |
2003, 2008 |
|
|
28,319 |
|
|
(1,493 |
) |
|
26,826 |
|
|
252 |
|
97.2% |
|
|
96.0% |
|
|
|
1,065 |
|
|||
|
TOTAL Same Store |
|
|
|
|
|
$ |
1,262,025 |
|
$ |
(82,331 |
) |
$ |
1,179,694 |
|
|
11,677 |
|
94.9% |
|
|
94.7% |
|
|
$ |
1,021 |
|
||
|
Non-Same Store Properties: |
|
|
|
|
|
|
|
|
|
|
|
|
|
|
|
|
|
|
|
|
|
|
|
|
|
|
|
|
|
Lakes of Northdale |
Tampa, FL |
2/27/2017 |
|
2016 |
|
|
29,867 |
|
|
(546 |
) |
|
29,321 |
|
|
216 |
|
91.2% |
|
|
92.5% |
|
|
|
1,208 |
|
||
|
Haverford Place |
Lexington, KY |
5/24/2017 |
2001 (f) |
|
|
14,382 |
|
|
(158 |
) |
|
14,224 |
|
|
160 |
|
91.9% |
|
|
92.9% |
|
|
|
913 |
|
|||
|
South Terrace |
Durham, NC |
6/30/2017 |
2002 (f) |
|
|
42,710 |
|
|
(467 |
) |
|
42,243 |
|
|
328 |
|
89.9% |
|
|
95.0% |
|
|
|
1,090 |
|
|||
|
Cherry Grove |
North Myrtle Beach, SC |
9/26/2017 |
|
2001 |
|
|
15,943 |
|
|
(96 |
) |
|
15,847 |
|
|
172 |
|
98.3% |
|
|
99.1% |
|
|
|
946 |
|
||
|
Kensington Commons |
Canal Winchester, OH |
9/26/2017 |
|
2004 |
|
|
24,124 |
|
|
(130 |
) |
|
23,994 |
|
|
264 |
|
97.7% |
|
|
97.4% |
|
|
|
882 |
|
||
|
Schirm Farms |
Canal Winchester, OH |
9/26/2017 |
|
2002 |
|
|
23,486 |
|
|
(122 |
) |
|
23,364 |
|
|
264 |
|
95.8% |
|
|
96.9% |
|
|
|
846 |
|
||
|
Riverchase |
Indianapolis, IN |
9/26/2017 |
|
2000 |
|
|
18,727 |
|
|
(108 |
) |
|
18,619 |
|
|
216 |
|
89.8% |
|
|
90.5% |
|
|
|
814 |
|
||
|
Live Oak Trace |
Baton Rouge, LA |
10/25/2017 |
|
2002 |
|
|
28,431 |
|
|
(114 |
) |
|
28,317 |
|
|
264 |
|
60.6% |
|
(g) |
61.5% |
|
(g) |
|
916 |
|
||
|
Tides at Calabash |
Wilmington, NC |
11/14/2017 |
|
2010 |
|
|
14,097 |
|
|
(25 |
) |
|
14,072 |
|
|
168 |
|
91.7% |
|
|
92.0% |
|
|
|
846 |
|
||
|
Brunswick Point |
Wilmington, NC |
12/12/2017 |
|
2005 |
|
|
30,364 |
|
|
- |
|
|
30,364 |
|
|
288 |
|
93.1% |
|
|
93.1% |
|
|
|
795 |
|
||
|
TOTAL Non-Same Store |
|
|
|
|
|
$ |
242,131 |
|
$ |
(1,766 |
) |
$ |
240,365 |
|
|
2,340 |
|
89.5% |
|
|
90.7% |
|
|
$ |
928 |
|
||
|
|
|
|
|
|
|
|
|
|
|
|
|
|
|
|
|
|
|
|
|
|
|
|
|
|
|
|
|
|
|
TOTAL |
|
|
|
|
|
$ |
1,504,156 |
|
$ |
(84,097 |
) |
$ |
1,420,059 |
|
|
14,017 |
|
94.0% |
|
|
94.1% |
|
|
$ |
1,006 |
|
||
|
(a) |
All dates are for the later of (i) the year in which construction was completed or (ii) the year in which a significant renovation program was completed. |
|
(b) |
Units represent the total number of apartment units available for rent at December 31, 2017. |
|
(c) |
Physical occupancy for each of our properties is calculated as (i) total units rented as of December 31, 2017 divided by (ii) total units available as of December 31, 2017, expressed as a percentage. |
|
(d) |
Average occupancy represents the daily average occupied units for the three-month period ended December 31, 2017. |
|
(e) |
Average monthly effective rent, per unit, represents the average monthly rent for all occupied units for the three-month period ended December 31, 2017. |
|
(f) |
Properties are undergoing renovation. |
|
(g) |
Property was recently renovated and impacted units are in the process of being leased up. |
18
Dollars in thousands, except rent per unit
|
|
|
|
|
|
|
|
|
|
|
|
|
|
|
For the Three Months Ended December 31, 2017 |
|
|||||||||
|
Market |
|
Units |
|
|
Gross Real Estate Assets |
|
|
Period End Occupancy |
|
|
Average Effective Monthly Rent per Unit |
|
|
Net Operating Income (a) |
|
|
% of NOI |
|
||||||
|
Louisville, KY |
|
|
1,710 |
|
|
$ |
180,836 |
|
|
|
93.3 |
% |
|
$ |
944 |
|
|
$ |
2,912 |
|
|
|
11.5 |
% |
|
Raleigh-Durham, NC |
|
|
1,372 |
|
|
|
182,744 |
|
|
|
94.1 |
% |
|
|
1,108 |
|
|
|
2,910 |
|
|
|
11.5 |
% |
|
Atlanta, GA |
|
|
1,092 |
|
|
|
137,264 |
|
|
|
96.6 |
% |
|
|
1,116 |
|
|
|
2,496 |
|
|
|
9.9 |
% |
|
Memphis, TN |
|
|
1,383 |
|
|
|
138,054 |
|
|
|
96.0 |
% |
|
|
1,020 |
|
|
|
2,474 |
|
|
|
9.8 |
% |
|
Oklahoma City, OK |
|
|
1,658 |
|
|
|
73,617 |
|
|
|
93.8 |
% |
|
|
640 |
|
|
|
1,714 |
|
|
|
6.8 |
% |
|
Dallas, TX |
|
|
734 |
|
|
|
85,481 |
|
|
|
96.7 |
% |
|
|
1,139 |
|
|
|
1,553 |
|
|
|
6.1 |
% |
|
Columbus, OH |
|
|
768 |
|
|
|
65,657 |
|
|
|
96.5 |
% |
|
|
874 |
|
|
|
1,254 |
|
|
|
5.0 |
% |
|
Charleston, SC |
|
|
518 |
|
|
|
79,090 |
|
|
|
95.2 |
% |
|
|
1,304 |
|
|
|
1,185 |
|
|
|
4.7 |
% |
|
Indianapolis, IN |
|
|
644 |
|
|
|
61,013 |
|
|
|
92.2 |
% |
|
|
938 |
|
|
|
1,067 |
|
|
|
4.2 |
% |
|
Little Rock, AR |
|
|
462 |
|
|
|
54,439 |
|
|
|
94.8 |
% |
|
|
988 |
|
|
|
860 |
|
|
|
3.4 |
% |
|
Orlando, FL |
|
|
297 |
|
|
|
47,653 |
|
|
|
97.0 |
% |
|
|
1,386 |
|
|
|
775 |
|
|
|
3.1 |
% |
|
Greenville, SC |
|
|
346 |
|
|
|
48,233 |
|
|
|
92.5 |
% |
|
|
1,094 |
|
|
|
729 |
|
|
|
2.9 |
% |
|
Charlotte, NC |
|
|
208 |
|
|
|
41,764 |
|
|
|
91.3 |
% |
|
|
1,442 |
|
|
|
644 |
|
|
|
2.5 |
% |
|
Chicago, IL |
|
|
370 |
|
|
|
29,451 |
|
|
|
92.7 |
% |
|
|
1,014 |
|
|
|
638 |
|
|
|
2.5 |
% |
|
Austin, TX |
|
|
300 |
|
|
|
35,590 |
|
|
|
94.3 |
% |
|
|
1,275 |
|
|
|
636 |
|
|
|
2.5 |
% |
|
Myrtle Beach, SC |
|
|
340 |
|
|
|
30,040 |
|
|
|
95.0 |
% |
|
|
1,102 |
|
|
|
569 |
|
|
|
2.3 |
% |
|
Asheville, NC |
|
|
252 |
|
|
|
28,319 |
|
|
|
97.2 |
% |
|
|
1,065 |
|
|
|
552 |
|
|
|
2.2 |
% |
|
Chattanooga, TN |
|
|
295 |
|
|
|
26,007 |
|
|
|
98.0 |
% |
|
|
959 |
|
|
|
446 |
|
|
|
1.8 |
% |
|
Tampa-St. Petersburg, FL |
|
|
216 |
|
|
|
29,867 |
|
|
|
91.2 |
% |
|
|
1,208 |
|
|
|
432 |
|
|
|
1.7 |
% |
|
St. Louis, MO |
|
|
152 |
|
|
|
32,987 |
|
|
|
90.8 |
% |
|
|
1,623 |
|
|
|
405 |
|
|
|
1.6 |
% |
|
Jackson, MS |
|
|
170 |
|
|
|
21,130 |
|
|
|
92.9 |
% |
|
|
1,138 |
|
|
|
401 |
|
|
|
1.6 |
% |
|
Huntsville, AL |
|
|
178 |
|
|
|
16,125 |
|
|
|
95.5 |
% |
|
|
860 |
|
|
|
277 |
|
|
|
1.1 |
% |
|
Baton Rouge, LA |
|
|
264 |
|
|
|
28,431 |
|
|
|
60.6 |
% |
|
|
1,126 |
|
|
|
248 |
|
|
|
1.0 |
% |
|
Wilmington, NC |
|
|
288 |
|
|
|
30,364 |
|
|
|
93.1 |
% |
|
|
795 |
|
|
|
96 |
|
|
|
0.4 |
% |
|
Total/Weighted Average |
|
|
14,017 |
|
|
$ |
1,504,156 |
|
|
|
94.0 |
% |
|
$ |
1,015 |
|
|
$ |
25,273 |
|
|
|
100.0 |
% |
|
|
|
|
|
|
|
|
|
|
|
|
|
|
|
|
|
|
|
|
|
|
|
|
|
|
|
(a) |
Net operating income for the three months ended December 31, 2017 excludes $424 primarily related to sold properties. |
19
DEBT SUMMARY AS OF DECEMBER 31, 2017
Dollars in thousands
|
|
|
Amount |
|
|
Rate |
|
|
Type |
|
Weighted Average Maturity (in years) |
|
|
|||
|
Debt: |
|
|
|
|
|
|
|
|
|
|
|
|
|
|
|
|
Credit facility (a) |
|
$ |
104,005 |
|
|
|
3.0 |
% |
|
Floating |
|
|
3.8 |
|
|
|
Term loan (b) |
|
|
100,000 |
|
|
|
3.2 |
% |
|
Floating |
|
|
6.9 |
|
|
|
Mortgages-Fixed rate |
|
|
580,635 |
|
|
|
3.7 |
% |
|
Fixed |
|
|
5.8 |
|
|
|
Unamortized debt premiums |
|
|
(6,198 |
) |
|
|
|
|
|
|
|
|
|
|
|
|
Total Debt |
|
|
778,442 |
|
|
|
3.6 |
% |
|
|
|
|
5.7 |
|
|
|
Market Equity Capitalization, at period end |
|
|
885,094 |
|
|
|
|
|
|
|
|
|
|
|
|
|
Total Capitalization |
|
$ |
1,663,536 |
|
|
|
|
|
|
|
|
|
|
|
|
|
|
(a) |
Credit facility total capacity is $300,000, of which $104,005 was drawn as of December 31, 2017, comprised of a $50,000 term loan and a revolving commitment of up to $250,000. The maturity date on the term loan is May 1, 2022, and the maturity date on borrowings outstanding under the revolving commitment is May 1, 2021. |
|
|
(b) |
The maturity date on the term loan is November 20, 2024. |
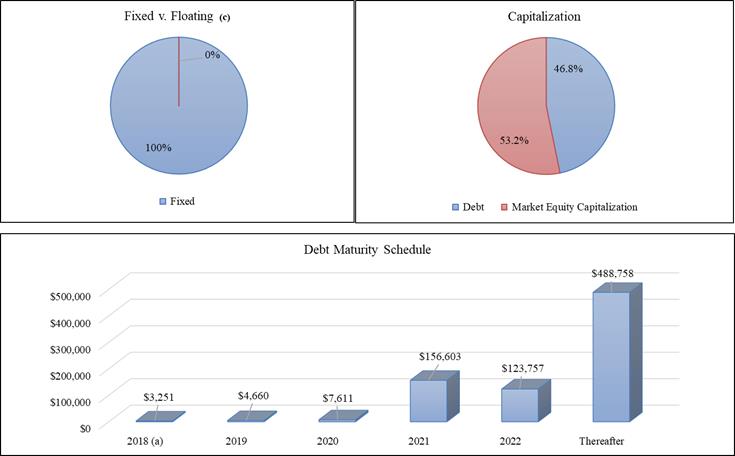
|
|
(c) |
As of December 31, 2017, IRT maintained a float-to-fixed interest rate swap with a $150,000 notional amount. The swap, which expires on June 17, 2021 and has a fixed rate of 1.1325%, has converted $150,000 of our floating rate debt to fixed rate debt. We also maintain an interest rate collar with a $100,000 notional amount. The collar, which expires on November 20, 2024, has a floor of 1.25% and a cap of 2.00%. It has converted $100,000 of our floating rate debt to fixed rate debt when LIBOR is above the cap rate or below the floor rate. |
20
Average Effective Monthly Rent per Unit
Average effective rent per unit represents the average of gross rent amounts, divided by the average occupancy (in units) for the period presented. We believe average effective rent is a helpful measurement in evaluating average pricing. This metric, when presented, reflects the average effective rent per month.
Average Occupancy
Average occupancy represents the average of the daily physical occupancy for the period presented.
Adjusted EBITDA
EBITDA is defined as net income before interest expense including amortization of deferred financing costs, income tax expense, and depreciation and amortization expenses. Adjusted EBITDA is EBITDA before acquisition and integration expenses and certain other non-operating gains or losses related to items such as asset sales, debt extinguishments, acquisition related debt extinguishment expenses, gains on the TSRE merger, and management internalization expenses. EBITDA and Adjusted EBITDA are each non-GAAP measures. We consider each of EBITDA and Adjusted EBITDA to be an appropriate supplemental measure of our performance because it eliminates interest, income taxes, depreciation and amortization, acquisition and integration expenses and other non-operating gains and losses, which permits investors to view income from operations without these non-cash or non-operating items. IRT’s calculation of Adjusted EBITDA differs from the methodology used for calculating Adjusted EBITDA by certain other REITs and, accordingly, IRT’s Adjusted EBITDA may not be comparable to Adjusted EBITDA reported by other REITs.
Funds From Operations (“FFO”) and Core Funds From Operations (“CFFO”)
IRT believes that FFO and CFFO, each of which is a non-GAAP measure, are additional appropriate measures of the operating performance of a REIT and IRT in particular. IRT computes FFO in accordance with the standards established by the National Association of Real Estate Investment Trusts, or NAREIT, as net income or loss (computed in accordance with GAAP), excluding real estate-related depreciation and amortization expense, gains or losses on sales of real estate and the cumulative effect of changes in accounting principles.
CFFO is a computation made by analysts and investors to measure a real estate company’s operating performance by removing the effect of items that do not reflect ongoing property operations, including stock compensation expense, depreciation and amortization of other items not included in FFO, amortization of deferred financing costs, acquisition and integration expenses, and other non-operating gains or losses related to items such as defeasance costs we incur when we sell a property subject to secured debt, asset sales, debt extinguishments, acquisition related debt extinguishment expenses, gains on the TSRE merger, and management internalization expenses, from the determination of FFO. IRT incurs acquisition expenses in connection with acquisitions of real estate properties and expenses those costs when incurred in accordance with GAAP. As these expenses are one-time and reflective of investing activities rather than operating performance, IRT adds back these costs to FFO in determining CFFO.
IRT’s calculation of CFFO differs from the methodology used for calculating CFFO by certain other REITs and, accordingly, IRT’s CFFO may not be comparable to CFFO reported by other REITs. IRT’s management utilizes FFO and CFFO as measures of IRT’s operating performance, and believes they are also useful to investors, because they facilitate an understanding of IRT’s operating performance after adjustment for certain non-cash or non-operating items that are required by GAAP to be expensed but may not necessarily be indicative of current operating performance and that may not accurately compare IRT’s operating performance between periods. Furthermore, although FFO, CFFO and other supplemental performance measures are defined in various ways throughout the REIT industry, IRT believes that FFO and CFFO may provide IRT and our investors with an additional useful measure to compare IRT’s financial performance to certain other REITs. Neither FFO nor CFFO is equivalent to net income or cash generated from operating activities determined in accordance with GAAP. Furthermore, FFO and CFFO do not represent amounts available for management’s discretionary use because of needed capital replacement or expansion, debt service obligations or other commitments or uncertainties. Neither FFO nor CFFO should be considered as an alternative to net income as an indicator of IRT’s operating performance or as an alternative to cash flow from operating activities as a measure of IRT’s liquidity.
21
Interest coverage is a ratio computed by dividing our Adjusted EBITDA by our interest expense.
Net Debt
Net debt, a non-GAAP measure, equals total debt less cash and cash equivalents. The following table provides a reconciliation of total debt to net debt (Dollars in thousands).
|
|
|
|
|
|
|
|
|
|
As of |
|
|
|
|
|
|
|
|
|
|
|
|
December 31, 2017 |
|
|
September 30, 2017 |
|
|
June 30, 2017 |
|
|
March 31, 2017 |
|
|
December 31, 2016 |
|
|||||
|
Total debt |
$ |
778,442 |
|
|
$ |
731,625 |
|
|
$ |
764,521 |
|
|
$ |
765,695 |
|
|
$ |
743,817 |
|
|
Less: cash and cash equivalents |
|
(9,985 |
) |
|
|
(10,128 |
) |
|
|
(6,271 |
) |
|
|
(10,065 |
) |
|
|
(20,892 |
) |
|
Total net debt |
$ |
768,457 |
|
|
$ |
721,497 |
|
|
$ |
758,250 |
|
|
$ |
755,630 |
|
|
$ |
722,925 |
|
IRT presents net debt because management believes it is a useful measure of IRT’s credit position and progress toward reducing leverage. The calculation is limited in that IRT may not always be able to use cash to repay debt on a dollar for dollar basis.
Net Operating Income
IRT believes that Net Operating Income (“NOI”), a non-GAAP measure, is a useful measure of its operating performance. IRT defines NOI as total property revenues less total property operating expenses, excluding depreciation and amortization, asset management fees, property management fees, acquisition expenses and general administrative expenses. In connection with our management internalization which was completed in the fourth quarter of 2016, we modified our calculation of NOI to exclude property management expenses. We retrospectively adjusted previously reported NOI to conform to this change. Other REITs may use different methodologies for calculating NOI, and accordingly, our NOI may not be comparable to other REITs. We believe that this measure provides an operating perspective not immediately apparent from GAAP operating income or net income. We use NOI to evaluate our performance on a same store and non-same store basis because NOI measures the core operations of property performance by excluding corporate level expenses and other items not related to property operating performance and captures trends in rental housing and property operating expenses. However, NOI should only be used as an alternative measure of our financial performance.
Same Store Properties and Same Store Portfolio
IRT reviews its same store portfolio at the beginning of each calendar year. Properties are added into the same store portfolio if they were owned at the beginning of the previous year. Properties that are held-for-sale or have been sold are excluded from the same store portfolio.
Total Gross Assets
Total Gross Assets equals total assets plus accumulated depreciation and accumulated amortization, including fully depreciated or amortized real estate and real estate related assets. The following table provides a reconciliation of total assets to total gross assets (Dollars in thousands).
|
|
|
|
|
|
|
|
|
|
As of |
|
|
|
|
|
|
|
|
|
|
|
|
December 31, 2017 |
|
|
September 30, 2017 |
|
|
June 30, 2017 |
|
|
March 31, 2017 |
|
|
December 31, 2016 |
|
|||||
|
Total assets |
$ |
1,450,624 |
|
|
$ |
1,405,212 |
|
|
$ |
1,317,177 |
|
|
$ |
1,306,986 |
|
|
$ |
1,294,237 |
|
|
Plus: Accumulated Depreciation (a) |
|
84,097 |
|
|
|
76,664 |
|
|
|
68,433 |
|
|
|
68,262 |
|
|
|
60,719 |
|
|
Plus: Accumulated Amortization |
|
16,517 |
|
|
|
15,670 |
|
|
|
15,254 |
|
|
|
15,341 |
|
|
|
15,287 |
|
|
Total gross assets |
$ |
1,551,238 |
|
|
$ |
1,497,546 |
|
|
$ |
1,400,864 |
|
|
$ |
1,390,589 |
|
|
$ |
1,370,243 |
|
|
|
(a) |
Includes previously recognized depreciation on properties that are classified as held-for-sale. |
22