Attached files
| file | filename |
|---|---|
| EX-99.1 - EX-99.1 - INDEPENDENCE REALTY TRUST, INC. | irt-ex991_13.htm |
| EX-32.2 - EX-32.2 - INDEPENDENCE REALTY TRUST, INC. | irt-ex322_10.htm |
| EX-32.1 - EX-32.1 - INDEPENDENCE REALTY TRUST, INC. | irt-ex321_8.htm |
| EX-31.2 - EX-31.2 - INDEPENDENCE REALTY TRUST, INC. | irt-ex312_16.htm |
| EX-31.1 - EX-31.1 - INDEPENDENCE REALTY TRUST, INC. | irt-ex311_7.htm |
| EX-23.1 - EX-23.1 - INDEPENDENCE REALTY TRUST, INC. | irt-ex231_6.htm |
| EX-21.1 - EX-21.1 - INDEPENDENCE REALTY TRUST, INC. | irt-ex211_15.htm |
| EX-12.1 - EX-12.1 - INDEPENDENCE REALTY TRUST, INC. | irt-ex121_11.htm |
| EX-4.1.13 - EX-4.1.13 - INDEPENDENCE REALTY TRUST, INC. | irt-ex4113_338.htm |
UNITED STATES
SECURITIES AND EXCHANGE COMMISSION
WASHINGTON, D.C. 20549
FORM 10-K
(Mark One)
|
☒ |
ANNUAL REPORT PURSUANT TO SECTION 13 OR 15(d) OF THE SECURITIES EXCHANGE ACT OF 1934 |
For the fiscal year ended December 31, 2017
or
|
☐ |
TRANSITION REPORT PURSUANT TO SECTION 13 OR 15(d) OF THE SECURITIES EXCHANGE ACT OF 1934 |
For the Transition Period from to .
Commission file number 001-36041
INDEPENDENCE REALTY TRUST, INC.
(Exact name of registrant as specified in its charter)
|
Maryland |
|
26-4567130 |
|
(State or other jurisdiction of incorporation or organization) |
|
(I.R.S. Employer Identification No.) |
|
|
|
|
|
Two Liberty Place, 50 S. 16th Street, Suite 3575, Philadelphia, PA |
|
19102 |
|
(Address of principal executive offices) |
|
(Zip Code) |
(267) 270-4800
(Registrant’s telephone number, including area code)
Securities registered pursuant to Section 12(b) of the Securities Exchange Act of 1934:
|
Title of each class |
|
Name of each exchange on which registered |
|
Common Stock |
|
NYSE |
Securities registered pursuant to Section 12(g) of the Securities Exchange Act of 1934:
None
Indicate by check mark if the registrant is a well-known seasoned issuer, as defined in Rule 405 of the Securities Act. Yes ☐ No ☒
Indicate by check mark if the registrant is not required to file reports pursuant to Section 13 or 15(d) of the Act. Yes ☐ No ☒
Indicate by check mark whether the registrant: (1) has filed all reports required to be filed by Section 13 or 15(d) of the Securities Exchange Act of 1934 during the preceding 12 months (or for such shorter period that the registrant was required to file such reports), and (2) has been subject to such filing requirements for the past 90 days. Yes ☒ No ☐
Indicate by check mark whether the registrant has submitted electronically and posted on its corporate Web site, if any, every Interactive Data File required to be submitted and posted pursuant to Rule 405 of Regulation S-T (§ 232.405 of this chapter) during the preceding 12 months (or for such shorter period that the registrant was required to submit and post such files). Yes ☒ No ☐
Indicate by check mark if disclosure of delinquent filers pursuant to Item 405 of Regulation S-K is not contained herein, and will not be contained, to the best of the registrant’s knowledge, in definitive proxy or information statements incorporated by reference in Part III of this Form 10-K or any amendment to this Form 10-K. ☒
Indicate by check mark whether the registrant is a large accelerated filer, an accelerated filer, a non-accelerated filer, a smaller reporting company or an emerging growth company. See definitions of “large accelerated filer,” “accelerated filer,” “smaller reporting company” and “emerging growth company” in Rule 12b-2 of the Exchange Act (check one):
|
Large accelerated filer |
☐ |
Accelerated filer |
☒ |
|
|
|
|
|
|
Non-accelerated filer |
☐ (Do not check if a smaller reporting company) |
Smaller reporting company |
☐ |
|
Emerging Growth company |
☐ |
|
|
If an emerging growth company, indicate by checkmark if the registrant has elected not to use the extended transition period for complying with any new or revised financial accounting standards provided pursuant to Section 13(a) of the Exchange Act. ☐
Indicate by check mark whether the registrant is a shell company (as defined in Rule 12b-2 of the Act). Yes ☐ No ☒
The aggregate market value of the shares of common stock of the registrant held by non-affiliates of the registrant, based upon the closing price of such shares on June 30, 2017 of $9.87, was approximately $678,966,666.63.
As of February 20, 2018 there were 84,962,474 outstanding shares of the registrant’s common stock issued and outstanding.
DOCUMENTS INCORPORATED BY REFERENCE
Portions of the proxy statement for registrant’s 2018 Annual Meeting of Stockholders are incorporated by reference in Part III of this Form 10-K.
INDEPENDENCE REALTY TRUST, INC.
TABLE OF CONTENTS
|
1 |
|||
|
|
|||
|
PART I |
|||
|
|
|
|
|
|
Item 1. |
2 |
||
|
Item 1A. |
8 |
||
|
Item 1B. |
29 |
||
|
Item 2. |
30 |
||
|
Item 3. |
31 |
||
|
Item 4. |
31 |
||
|
|
|||
|
PART II |
|||
|
|
|
|
|
|
Item 5. |
31 |
||
|
Item 6. |
36 |
||
|
Item 7. |
Management’s Discussion and Analysis of Financial Condition and Results of Operations |
36 |
|
|
Item 7A. |
48 |
||
|
Item 8. |
50 |
||
|
Item 9. |
Changes in and Disagreements with Accountants on Accounting and Financial Disclosure |
81 |
|
|
Item 9A. |
81 |
||
|
Item 9B. |
81 |
||
|
|
|||
|
PART III |
|||
|
|
|
|
|
|
Item 10. |
82 |
||
|
Item 11. |
82 |
||
|
Item 12. |
Security Ownership of Certain Beneficial Owners and Management and Related Stockholder Matters |
82 |
|
|
Item 13. |
Certain Relationships and Related Transactions, and Director Independence |
82 |
|
|
Item 14. |
82 |
||
|
|
|||
|
PART IV |
|||
|
|
|
|
|
|
Item 15. |
82 |
||
|
Item 16 |
88 |
||
The Securities and Exchange Commission, or SEC, encourages companies to disclose forward-looking information so that investors can better understand a company’s future prospects and make informed investment decisions. This report contains or incorporates by reference such “forward-looking statements” within the meaning of Section 27A of the Securities Act of 1933, as amended, or Securities Act, and Section 21E of the Securities Exchange Act of 1934, as amended, or Exchange Act.
Words such as “anticipates,” “estimates,” “expects,” “projects,” “intends,” “plans,” “believes” and words and terms of similar substance used in connection with any discussion of future operating or financial performance identify forward-looking statements. As used herein, the terms “we,” “our” “us” and “IRT” refer to Independence Realty Trust, Inc. and, as required by context, Independence Realty Operating Partnership, LP, which we refer to as IROP, and their subsidiaries.
We claim the protection of the safe harbor for forward-looking statements provided in the Private Securities Litigation Reform Act of 1995. These statements may be made directly in this report and they may also be incorporated by reference in this report to other documents filed with the SEC, and include, but are not limited to, statements about future financial and operating results and performance, statements about our plans, objectives, expectations and intentions with respect to future operations, products and services, and other statements that are not historical facts. These forward-looking statements are based upon the current beliefs and expectations of our management and are inherently subject to significant business, economic and competitive uncertainties and contingencies, many of which are difficult to predict and generally beyond our control. In addition, these forward-looking statements are subject to assumptions with respect to future business strategies and decisions that are subject to change. Actual results may differ materially from the anticipated results discussed in these forward-looking statements.
The risk factors discussed and identified in item 1A of this report and in other of our public filings with the SEC, among others, could cause actual results to differ materially from the anticipated results or other expectations expressed in the forward-looking statements. We caution you not to place undue reliance on these forward-looking statements, which speak only as of the date of this report. All subsequent written and oral forward-looking statements attributable to us or any person acting on our behalf are expressly qualified in their entirety by the cautionary statements contained or referred to in this section. Except to the extent required by applicable law or regulation, we undertake no obligation to update these forward-looking statements to reflect events or circumstances after the date of this filing or to reflect the occurrence of unanticipated events.
1
Our Company
We are a Maryland corporation that owns and operates multifamily apartment communities across non-gateway U.S. markets, including Louisville, Memphis, Atlanta and Raleigh. Our investment strategy is focused on gaining scale within key amenity rich submarkets that offer good school districts, high-quality retail and major employment centers. We aim to provide stockholders attractive risk-adjusted returns through diligent portfolio management, strong operational performance, and a consistent return of capital through distributions and capital appreciation. We elected to be taxed as a REIT under the Internal Revenue Code of 1986, as amended, or the Code, commencing with our taxable year ended December 31, 2011. We own all of our assets and conduct our operations through Independence Realty Operating Partnership, LP, which we refer to as IROP, of which we are the sole general partner. As of December 31, 2017, we owned a 96.6% interest in IROP. The remaining 3.4% consists of common units of limited partnership interest issued to third parties in exchange for contributions of properties to IROP. As sole general partner of IROP, we have full and complete control over IROP’s day-to-day operations. See “Development and Structure of our Company” for more information.
We seek to acquire and operate apartment properties that:
|
|
• |
have stable occupancy; |
|
|
• |
are located in submarkets that we do not expect will experience substantial new apartment construction in the foreseeable future; |
|
|
• |
in appropriate circumstances, present opportunities for repositioning or updating through capital expenditures and in turn for increased rents; and |
|
|
• |
present opportunities to apply tailored marketing and management strategies to attract and retain residents and enable rent increases. |
Our Business Objective and Investment Strategies
Our primary business objective is to maximize stockholder value by increasing cash flows at our existing apartment properties and acquiring additional properties that have strong and stable occupancies with the ability to raise rental rates or that have the potential for repositioning through capital expenditures or tailored management strategies. We intend to achieve this objective by executing the following strategies:
|
|
• |
Focus on properties in markets that have strong apartment demand, reduced competition from national apartment buyers and no substantial new apartment construction. In evaluating potential acquisitions, we analyze apartment occupancy and trends in rental rates, employment and new construction, among many other factors, and seek to identify properties located primarily in non-gateway markets where there is strong demand for apartment units, less apartment development relative to demand, stable resident bases and occupancy rates, positive net migration trends and strong employment drivers. We generally seek to avoid markets where we believe potential yields have decreased as a result of the acquisition and development efforts of large institutional buyers. |
|
|
• |
Acquire properties that have operating upside through targeted management strategies. We have expertise in acquiring and managing properties to maximize the net operating income, or NOI, of such properties through more effective marketing and leasing, better management of rental rates and more efficient expense management. We will seek to acquire properties that we believe possess significant prospects for increased occupancy and rental revenue growth. Our target profile for acquisitions currently is midrise/garden-style apartments containing 150-500 units with high quality amenities that we can acquire at less than replacement cost in the $15 million to $50 million price range with a five to fifteen year operating track record. We do not intend to limit ourselves to properties in this target profile, however, and may make acquisitions outside of this profile or change our target profile whenever market conditions warrant. |
2
|
|
enhancing capital projects that we believe will improve the physical plant or market positioning of particular apartment properties and generate increased income over time. |
|
|
• |
Use our extensive experience owning and managing apartment properties, and our networks of contacts in the apartment industry, to acquire additional apartment properties. We own approximately 15,000 apartment units in 16 states. We believe these factors and our management’s real estate relationships and access to off-market transactions, including relationships with the brokerage community, will continue to provide us with a strong pipeline of acquisition opportunities. |
2017 Developments
HPI Portfolio Acquisition
On September 3, 2017, IRT reached an agreement to acquire a portfolio of nine communities (the “HPI Portfolio”), totaling 2,353 units, for a gross purchase price of $228.1 million. The acquisition accelerates IRT’s penetration into a number of core existing markets, including Columbus, OH, Indianapolis, IN and Atlanta, GA. The acquisition also includes properties in Myrtle Beach, SC, Baton Rouge, LA and Wilmington, NC. The portfolio contains nine communities that were built or renovated between 2000 and 2011, had period end occupancy of 95% as of July 31, 2017, and had an average effective rent per unit of $884 for the three months ended July 31, 2017. On September 26, 2017, IRT closed on the acquisition of four of these multifamily apartment communities, aggregating 917 units, representing the consummation of the first phase of the portfolio acquisition. In the fourth quarter of 2017, we acquired three of the remaining five communities, aggregating 720 units. The acquisition of the remaining two communities closed on January 3, 2018.
2017 Common Stock Offering
On September 11, 2017, IRT closed a public offering of 12,500,000 shares of its common stock at a public offering price of $9.25 per share. IRT also closed on the underwriters’ option to purchase an additional 1,875,000 shares of common stock at the public offering price. As a result of the offering and the exercise of the underwriters’ option, IRT received approximately $126.1 million in net proceeds, after deducting the underwriting discount and estimated offering expenses. IRT used the net proceeds from the offering to pay a portion of the purchase price for the HPI portfolio. Any remaining proceeds will be used for general corporate purposes.
2017 At-the-Market Offering
During the fourth quarter of 2017, IRT issued 1,164,900 shares of its common stock under the At-the-Market Issuance Sales Agreement dated August 4, 2017. The shares were issued at an average price per share of $10.38, and gross proceeds from the issuances were approximately $12.1 million. We paid commissions of approximately $0.2 million and net proceeds from the issuances were approximately $11.9 million.
New Line of Credit Refinancing/Term Loan Agreement
On May 1, 2017, IRT closed on a new $300.0 million unsecured credit facility refinancing its previous secured credit facility. The new facility is comprised of a $50.0 million term loan and a revolving commitment of up to $250.0 million. The maturity date on the new term loan is May 1, 2022, and the maturity date on borrowings outstanding under the revolving commitment is May 1, 2021, extending the September 17, 2018 maturity of the previous secured credit facility. Borrowings under the revolving commitment can be extended through two, six-month extension options. The new unsecured credit facility also provides for an accordion feature allowing for an additional $200.0 million of capacity resulting in a maximum borrowing capacity of $500.0 million, a portion of which may be drawn as an incremental term loan with a maturity date of five years from the date of such draw. The exercise of the accordion is subject to customary terms and conditions. Based on our leverage levels as of closing, IRT’s annual interest cost would be LIBOR plus 145 basis points under the term loan and LIBOR plus 150 basis points for borrowings outstanding under the revolving commitments, an annual savings of approximately 35 to 40 basis points from IRT’s previous secured credit facility. The new facility is unsecured and improves IRT’s flexibility to effectively manage its assets by creating a pool of unencumbered assets.
On November 20, 2017, IRT entered into a seven-year, $100.0 million unsecured term loan agreement with KeyBank, that will reach maturity in November 2024. The proceeds were used to reduce borrowings outstanding under the revolving portion of IRT’s $300.0 million unsecured credit facility. The term loan bears interest at a spread over LIBOR, based on IRT’s overall leverage. At closing, the spread to LIBOR was 165 basis points. To continue IRT’s practice of reducing exposure to floating interest rates, IRT purchased an interest rate collar that caps LIBOR at 2.00%, subject to a floor on LIBOR of 1.25%, during the entire seven-year term.
3
Financing Strategy
We intend to use prudent amounts of leverage in making our investments. Our long term goal is to reduce leverage as we continue to increase the communities we own and as we grow the net operating income at our communities through increasing rents and managing expenses. We continue to review and reposition our financing structures seeking to enhance our flexibility and liquidity while continuing to reduce our leverage.
For further description of our indebtedness at December 31, 2017, see “Part II-Item 8. Financial Statements and Supplementary Data-Note 5: Indebtedness” below, or the financial statements indebtedness note.
In general, however, by operating on a leveraged basis, we expect to have more funds available for property acquisitions and other purposes, which we believe will allow us to acquire more properties than would otherwise be possible, resulting in a larger and more diversified portfolio. See “Part I-Item 1A. Risk Factors—Risks Associated with Debt Financing” below for more information about the risks related to operating on a leveraged basis.
If our board of directors changes our policies regarding our use of leverage, we expect that it will consider many factors, including, our long term strategic plan, the leverage ratios of publicly traded REITs with similar investment strategies, the cost of leverage as compared to expected operating net revenues and general market conditions.
Development and Structure of Our Company
We were formed as a Maryland corporation on March 26, 2009. RAIT Financial Trust, or RAIT, a publicly traded Maryland REIT whose common shares are listed on the New York Stock Exchange under the symbol “RAS”, through various subsidiaries, acquired beneficial ownership of 100% of our outstanding common stock on January 20, 2011 for approximately $2.5 million and we commenced operations on April 29, 2011 upon our acquisition of six properties from various RAIT subsidiaries. Since our formation through December 31, 2016, we have sold 55,198,300 shares of our common stock in six underwritten public offerings raising $497.2 million of gross proceeds. While RAIT had bought shares in several of these offerings, RAIT’s ownership percentage was reduced after each offering. On October 5, 2016, we repurchased and retired all 7,269,719 shares of our common stock owned by RAIT.
We became internally managed as of December 20, 2016. Prior to that, we were externally advised by our advisor, a RAIT subsidiary, pursuant to an advisory agreement and subject to the oversight of our board of directors. We acquired our advisor from RAIT as a result of the management internalization and terminated the advisory agreement. Our advisor was formed on March 26, 2009 and, prior to the management internalization, was responsible for managing our day-to-day business operations and identifying properties for us to acquire. We did not have any employees until the management internalization closed.
In connection with the management internalization, we acquired the multifamily property management business of RAIT on December 20, 2016. We now operate that business in our wholly owned subsidiary, IRT Management, LLC, formed October 26, 2016. Prior to that, RAIT Residential, a RAIT subsidiary, was our property manager. In the management internalization, RAIT Residential transferred substantially all of its assets and certain of its liabilities to us and we hired substantially all of its employees. IRT Management LLC is a full-service apartment property management company that, as of December 31, 2017, employed 407 staff and professionals and managed 14,834 apartment units, including 14,017 units owned by us. IRT Management LLC provides services to us in connection with the rental, leasing, operation and management of our properties.
We conduct our business through a traditional umbrella partnership REIT, or UPREIT, structure in which our properties are owned by our operating partnership, IROP, directly or through subsidiaries. We are the sole general partner of IROP. IROP was formed as a Delaware limited partnership on March 27, 2009. Substantially all of our assets are held by, and substantially all of our operations are conducted through, our operating partnership. As the sole general partner of our operating partnership, we have the exclusive power under the partnership agreement to manage and conduct its business. Since IROP’s formation, IROP has issued 3,374,472 IROP units to unaffiliated third parties as part of the consideration to acquire 24 properties in six transactions, including 1,925,419 IROP units issued in connection with the TSRE merger. These IROP units are exchangeable for the equivalent number of shares of common stock or the equivalent value in cash, at our option, in defined circumstances. From IROP’s formation through December 31, 2017, 363,121 IROP units held by unaffiliated third parties have been exchanged for 363,115 shares of our common stock with fractional units being settled in cash. From January 1, 2018 through February 20, 2018, 186,717 of IROP units held by unaffiliated third parties were exchanged for 186,717 shares of our common stock. As of December 31, 2017, 3,011,351 IROP units held by unaffiliated third parties were outstanding. As of February 20, 2018, 2,824,634 IROP units held by unaffiliated third parties were outstanding. We refer to these transactions as UPREIT transactions. Limited partners have certain limited approval and voting rights.
4
Competition
In attracting and retaining residents to occupy our properties, we compete with numerous other housing alternatives. Our properties compete directly with other rental apartments as well as condominiums and single-family homes that are available for rent or purchase in the sub-markets in which our properties are located. Principal factors of competition include rent or price charged, attractiveness of the location and property, and quality and breadth of services and amenities. If our competitors offer leases at rental rates below current market rates, or below the rental rates we currently charge our tenants, we may lose potential tenants.
The number of competitive properties relative to demand in a particular area has a material effect on our ability to lease apartment units at our properties and on the rents we charge. In certain sub-markets there exists an oversupply of single family homes and condominiums and a reduction of households, both of which affect the pricing and occupancy of our rental apartments. Additionally, we compete with other real estate investors, including other apartment REITs, pension and investment funds, partnerships and investment companies in acquiring, redeveloping and managing apartment properties. This competition affects our ability to acquire properties and the price that we pay for such acquisitions.
Employees
As of February 20, 2018, we had 421 employees and believe our relationships with our employees to be good. None of our employees are covered by a collective bargaining agreement.
Regulation
Our investments are subject to various federal, state, and local laws, ordinances, and regulations, including, among other things, zoning regulations, land use controls, environmental controls relating to air and water quality, noise pollution, and indirect environmental impacts such as increased motor vehicle activity, and fair housing laws. We believe that we have all permits and approvals necessary under current law to operate our investments.
Income Taxes
We have elected to be taxed as a REIT beginning with the taxable year ended December 31, 2011. Accordingly, we recorded no income tax expense for the years ended December 31, 2017, 2016, and 2015.
To qualify as a REIT, we must meet certain organizational and operational requirements, including a requirement to distribute at least 90% of our ordinary taxable income to stockholders. As a REIT, we generally are not subject to federal income tax on taxable income that we distribute to our stockholders. If we fail to qualify as a REIT in any taxable year, we will be subject to federal income taxes on our taxable income at regular corporate rates and will not be permitted to qualify for treatment as a REIT for federal income tax purposes for four years following the year during which qualification is lost unless the Internal Revenue Service grants us relief under certain statutory provisions. Such an event could materially adversely affect our net income and core funds from operations, or core FFO; however, we believe that we are organized and operate in such a manner as to qualify and maintain treatment as a REIT and intend to operate in such a manner so that we will remain qualified as a REIT for federal income tax purposes. For a discussion of the
5
tax implications of our REIT status to us and our stockholders, see “Material U.S. Federal Income Tax Considerations” contained in Exhibit 99.1 to this Annual Report on Form 10-K.
The table below reconciles the differences between reported net income (loss), total taxable income and estimated REIT taxable income for the three years ended December 31, 2017 (dollars in thousands):
|
|
|
For the Years Ended December 31 |
|
|||||||||
|
|
|
2017 |
|
|
2016 |
|
|
2015 |
|
|||
|
Net Income (loss) |
|
$ |
31,441 |
|
|
$ |
(9,555 |
) |
|
$ |
30,156 |
|
|
Add (deduct): |
|
|
|
|
|
|
|
|
|
|
|
|
|
Depreciation and amortization differences |
|
|
(8,646 |
) |
|
|
(3,063 |
) |
|
|
334 |
|
|
Gain/loss differences |
|
|
2,816 |
|
|
|
4,680 |
|
|
|
(3,175 |
) |
|
Gain recognized on TSRE Merger |
|
|
- |
|
|
|
(621 |
) |
|
|
(64,604 |
) |
|
IRT Internalization Expense |
|
|
- |
|
|
|
44,976 |
|
|
|
- |
|
|
Other book to tax differences: |
|
|
|
|
|
|
|
|
|
|
|
|
|
Capitalized acquisition costs |
|
|
4,966 |
|
|
|
- |
|
|
|
20,973 |
|
|
Share-based compensation expense |
|
|
647 |
|
|
|
1,001 |
|
|
|
495 |
|
|
Other |
|
|
476 |
|
|
|
(1,382 |
) |
|
|
6 |
|
|
Total taxable income (loss) |
|
$ |
31,700 |
|
|
$ |
36,036 |
|
|
$ |
(15,815 |
) |
|
Deductible capital gain distribution |
|
|
(25,904 |
) |
|
|
(34,783 |
) |
|
|
(4,376 |
) |
|
Taxable (income)/loss allocable to noncontrolling interest |
|
|
(889 |
) |
|
|
(1,253 |
) |
|
|
1,010 |
|
|
Estimated REIT taxable income (loss) before dividends paid deduction |
|
$ |
4,907 |
|
|
$ |
- |
|
|
$ |
(19,181 |
) |
For the year ended December 31, 2017, the tax classification of our dividends on common shares was as follows:
|
Record Date |
|
Payment Date |
|
Dividend Paid |
|
|
Ordinary Income |
|
|
Qualified Dividend |
|
|
Total Capital Gain Distribution |
|
|
Unrecaptured Section 1250 Gain |
|
|
Return of Capital |
|
||||||
|
1/31/2017 |
|
2/15/2017 |
|
$ |
0.0600 |
|
|
$ |
0.0284 |
|
|
$ |
- |
|
|
$ |
0.0316 |
|
|
$ |
0.0104 |
|
|
$ |
- |
|
|
2/28/2017 |
|
3/15/2017 |
|
|
0.0600 |
|
|
|
0.0284 |
|
|
|
- |
|
|
|
0.0316 |
|
|
|
0.0104 |
|
|
|
- |
|
|
3/31/2017 |
|
4/17/2017 |
|
|
0.0600 |
|
|
|
0.0284 |
|
|
|
- |
|
|
|
0.0316 |
|
|
|
0.0104 |
|
|
|
- |
|
|
4/28/2017 |
|
5/15/2017 |
|
|
0.0600 |
|
|
|
0.0284 |
|
|
|
- |
|
|
|
0.0316 |
|
|
|
0.0104 |
|
|
|
- |
|
|
5/31/2017 |
|
6/15/2017 |
|
|
0.0600 |
|
|
|
0.0240 |
|
|
|
- |
|
|
|
0.0316 |
|
|
|
0.0104 |
|
|
|
0.0044 |
|
|
6/30/2017 |
|
7/17/2017 |
|
|
0.0600 |
|
|
|
0.0172 |
|
|
|
- |
|
|
|
0.0316 |
|
|
|
0.0104 |
|
|
|
0.0112 |
|
|
7/31/2017 |
|
8/15/2017 |
|
|
0.0600 |
|
|
|
0.0172 |
|
|
|
- |
|
|
|
0.0316 |
|
|
|
0.0104 |
|
|
|
0.0112 |
|
|
8/31/2017 |
|
9/15/2017 |
|
|
0.0600 |
|
|
|
0.0172 |
|
|
|
- |
|
|
|
0.0316 |
|
|
|
0.0104 |
|
|
|
0.0112 |
|
|
9/29/2017 |
|
10/13/2017 |
|
|
0.0600 |
|
|
|
0.0172 |
|
|
|
- |
|
|
|
0.0316 |
|
|
|
0.0104 |
|
|
|
0.0112 |
|
|
10/31/2017 |
|
11/15/2017 |
|
|
0.0600 |
|
|
|
0.0172 |
|
|
|
- |
|
|
|
0.0316 |
|
|
|
0.0104 |
|
|
|
0.0112 |
|
|
11/30/2017 |
|
12/15/2017 |
|
|
0.0600 |
|
|
|
0.0172 |
|
|
|
- |
|
|
|
0.0316 |
|
|
|
0.0104 |
|
|
|
0.0112 |
|
|
|
|
|
|
$ |
0.6600 |
|
|
$ |
0.2408 |
|
|
$ |
- |
|
|
$ |
0.3476 |
|
|
$ |
0.1144 |
|
|
$ |
0.0716 |
|
The Company’s dividend paid on January 15, 2018 to holders of record on December 29, 2017 will be treated as a 2018 distribution for tax purposes.
6
For the year ended December 31, 2016, the tax classification of our dividends on common shares was as follows:
|
Record Date |
|
Payment Date |
|
Dividend Paid |
|
|
Ordinary Income |
|
|
Qualified Dividend |
|
|
Total Capital Gain Distribution |
|
|
Unrecaptured Section 1250 Gain |
|
|
Return of Capital |
|
|
||||||
|
1/29/2016 |
|
2/16/2016 |
|
$ |
0.0600 |
|
|
$ |
0.0042 |
|
|
$ |
- |
|
|
$ |
0.0558 |
|
|
$ |
0.0198 |
|
|
$ |
- |
|
|
|
2/29/2016 |
|
3/15/2016 |
|
|
0.0600 |
|
|
|
0.0042 |
|
|
|
- |
|
|
|
0.0558 |
|
|
|
0.0198 |
|
|
|
- |
|
|
|
3/31/2016 |
|
4/15/2016 |
|
|
0.0600 |
|
|
|
0.0042 |
|
|
|
- |
|
|
|
0.0558 |
|
|
|
0.0198 |
|
|
|
- |
|
|
|
4/29/2016 |
|
5/16/2016 |
|
|
0.0600 |
|
|
|
0.0042 |
|
|
|
- |
|
|
|
0.0558 |
|
|
|
0.0198 |
|
|
|
- |
|
|
|
5/31/2016 |
|
6/15/2016 |
|
|
0.0600 |
|
|
|
0.0042 |
|
|
|
- |
|
|
|
0.0558 |
|
|
|
0.0198 |
|
|
|
- |
|
|
|
6/30/2016 |
|
7/15/2016 |
|
|
0.0600 |
|
|
|
0.0042 |
|
|
|
- |
|
|
|
0.0558 |
|
|
|
0.0198 |
|
|
|
- |
|
|
|
7/29/2016 |
|
8/15/2016 |
|
|
0.0600 |
|
|
|
0.0042 |
|
|
|
- |
|
|
|
0.0558 |
|
|
|
0.0198 |
|
|
|
- |
|
|
|
8/31/2016 |
|
9/15/2016 |
|
|
0.0600 |
|
|
|
0.0042 |
|
|
|
- |
|
|
|
0.0558 |
|
|
|
0.0198 |
|
|
|
- |
|
|
|
9/30/2016 |
|
10/17/2016 |
|
|
0.0600 |
|
|
|
0.0042 |
|
|
|
- |
|
|
|
0.0558 |
|
|
|
0.0198 |
|
|
|
- |
|
|
|
10/31/2016 |
|
11/15/2016 |
|
|
0.0600 |
|
|
|
0.0042 |
|
|
|
- |
|
|
|
0.0558 |
|
|
|
0.0198 |
|
|
|
- |
|
|
|
11/30/2016 |
|
12/15/2016 |
|
|
0.0600 |
|
|
|
0.0042 |
|
|
|
- |
|
|
|
0.0558 |
|
|
|
0.0198 |
|
|
|
- |
|
|
|
12/30/2016 |
|
01/17/2017 |
|
|
0.0600 |
|
|
|
0.0042 |
|
|
|
- |
|
|
|
0.0558 |
|
|
|
0.0198 |
|
|
|
- |
|
|
|
|
|
|
|
$ |
0.7200 |
|
|
$ |
0.0504 |
|
|
$ |
- |
|
|
$ |
0.6696 |
|
|
$ |
0.2376 |
|
|
$ |
- |
|
|
For the year ended December 31, 2015, the estimated REIT taxable loss before dividends paid deduction was primarily attributable to prepayment penalties incurred on the mortgage debt that was assumed as part of, and paid off upon closing of, the TSRE acquisition.
Financial Information About Industry Segments
Our current business consists of owning, managing, operating, leasing, acquiring, developing, investing in, and disposing of real estate assets. We internally evaluate all of our real estate assets as one industry segment, and, accordingly, we do not report segment information.
Available Information
We file annual, quarterly and current reports, proxy statements and other information with the SEC. The public may read and copy any materials we file with the SEC at the SEC’s Public Reference Room at 100 F Street, NE, Washington, DC 20549. The public may obtain information on the operation of the Public Reference Room by calling the SEC at 1-800-SEC-0330. The SEC maintains an internet site that contains reports, proxy and information statements, and other information regarding issuers that file electronically with the SEC. The internet address of the SEC site is http://www.sec.gov. Our internet address is http://www.irtliving.com. We make our SEC filings available free of charge on or through our internet website as soon as reasonably practicable after we electronically file such material with, or furnish it to, the SEC. In addition, the charters of our Board’s Compensation Committee, Audit Committee, and Nominating and Governance Committee, as well as our Corporate Governance Guidelines, Insider Trading Policy, Whistle Blower Policy, and Code of Ethics, are also available on our website free of charge.
Code of Conduct
We maintain a Code of Business Conduct and Ethics applicable to our Board of Directors and all of our officers and employees, including our principal executive officer, principal financial officer, principal accounting officer, controller and persons performing similar functions. A copy of our Code of Business Conduct and Ethics is available on our website, www.irtliving.com. In addition to being accessible through our website, copies of our Code of Business Conduct and Ethics can be obtained, free of charge, upon written request to Investor Relations, Two Liberty Place, 50 S. 16th Street, Philadelphia, PA 19102. Any amendments to or waivers of our Code of Business Conduct and Ethics that apply to our principal executive officer, principal financial officer, principal accounting officer, controller and persons performing similar functions and that relate to any matter enumerated in Item 406(b) of Regulation S-K promulgated by the SEC will be disclosed on our website.
7
Stockholders should carefully consider the following risk factors in conjunction with the other information contained in this report. The risks discussed in this report could adversely affect our business, operating results, prospects and financial condition. This could cause the value of our common stock to decline and/or you to lose part or all of any investment in our securities. The risks and uncertainties described below are not the only ones we face, but do represent those risks and uncertainties that we believe are material to us. Additional risks and uncertainties not presently known to us or that, as of the date of this report, we deem immaterial may also harm our business. Some statements in this report, including statements in the following risk factors, constitute forward-looking statements. Please refer to the “Forward-Looking Statements” above contained in this report.
Risks Related to Our Business and Operations
Our portfolio of properties consists primarily of apartment communities concentrated in certain markets, and any adverse developments in local economic conditions or in the demand for apartment units in these markets may cause our operating results to decline.
Our portfolio of properties consists primarily of apartment communities geographically concentrated in the Southeastern United States, including Louisville, Kentucky, Raleigh-Durham, North Carolina, Atlanta, Georgia, Memphis, Tennessee, Oklahoma City, Oklahoma, Dallas, Texas and Columbus, Ohio. As such, we are susceptible to local economic conditions and the supply of and demand for apartment units in these markets. If there is a downturn in the local economy or an oversupply of or decrease in demand for apartment units in these markets, our business could be harmed to a greater extent than if we owned a real estate portfolio that was more diversified in terms of both geography and industry focus.
Adverse economic conditions may reduce or eliminate our returns and profitability and, as a result, our ability to make distributions to our stockholders.
Our operating results may be affected by market and economic challenges, which may reduce or eliminate our returns and profitability and, as a result, our ability to make distributions to our stockholders. These market and economic challenges include, principally, the following:
|
|
• |
adverse conditions in the real estate industry could harm our business and financial condition by reducing the value of our existing assets, limiting our access to debt and equity capital and otherwise negatively impacting our operations; |
|
|
• |
any future downturn in the U.S. economy and the related reduction in spending, reduced home prices and high unemployment may result in tenant defaults under leases, vacancies at our apartment communities and concessions or reduced rental rates under new leases due to reduced demand; |
|
|
• |
the rate of household formation or population growth in our markets or a continued or exacerbated economic slow-down experienced by the local economies where our properties are located or by the real estate industry generally may result in changes in supply of or demand for apartment units in our markets; and |
|
|
• |
the failure of the real estate market to attract the same level of capital investment in the future that it attracts at the time of our purchases or a reduction in the number of companies seeking to acquire properties may result in the value of our investments not appreciating or decreasing significantly below the amount we pay for these investments. |
The length and severity of any economic slow-down or downturn cannot be predicted. Our operations and, as a result, our ability to make distributions to our stockholders could be negatively affected to the extent that an economic slow-down or downturn is prolonged or becomes severe.
We depend on residents for revenue, and vacancies, resident defaults or lease terminations may cause a material decline in our operating results.
The success of our investments depends upon the occupancy levels, rental revenue and operating expenses of our apartment communities. Our revenues may be adversely affected by the general or local economic climate, local real estate considerations (such as oversupply of or reduced demand for apartment units), the perception by prospective residents of the safety, convenience and attractiveness of the areas in which our apartment communities are located (including the quality of local schools and other amenities) and increased operating costs (including real estate taxes and utilities).
Occupancy rates and rents at a community, including apartment communities that are newly constructed or in the lease-up phase, may fail to meet our original expectations for a number of reasons, including changes in market and economic conditions beyond our control and the development by competitors of competing communities and we may be unable to complete lease-up of a community on schedule, resulting in increased construction and financing costs and a decrease in expected rental revenues.
8
Vacancy rates may increase in the future and we may be unable to lease vacant units or renew expiring leases on attractive terms, or at all, and we may be required to offer reduced rental rates or other concessions to residents. Our revenues may be lower as a result of lower occupancy rates, increased turnover, reduced rental rates, increased economic concessions and potential increases in uncollectible rent. In addition, we will continue to incur expenses, including maintenance costs, insurance costs and property taxes, even though a property maintains a high vacancy rate. Our financial performance will suffer if our revenues decrease or our costs increase as a result of this trend.
The underlying value of our properties and our ability to make distributions to our stockholders will depend upon our ability to lease our available apartment units and the ability of our residents to generate enough income to pay their rents in a timely manner. Our residents’ inability to pay rents may be impacted by employment and other constraints on their personal finances, including debts, purchases and other factors. Upon a resident default, we will attempt to remove the resident from the premises and re-lease the unit as promptly as possible. Our ability and the time required to evict a resident, however, will depend on applicable law. Substantially all of the leases for our properties are short-term leases (generally, one year or less in duration). As a result, our rental income and our cash flow are impacted by declines in market conditions more quickly than if our leases were for longer terms.
We may be limited in our ability to diversify our investments.
Our ability to diversify our portfolio may be limited both as to the number of investments owned and the geographic regions in which our investments are located. While we will seek to diversify our portfolio by geographic location, we expect to focus on markets with high potential for attractive returns located in the United States and, accordingly, our actual investments may result in concentrations in a limited number of geographic regions. As a result, there is an increased likelihood that the performance of any single property, or the economic performance of a particular region in which our properties are located, could materially affect our operating results.
We may fail to consummate some or all potential property dispositions we disclose individually or in the aggregate, whether as part of our capital recycling strategy or otherwise, which could have a material adverse impact on our liquidity and leverage.
We have continued a capital recycling strategy that contemplates selling properties and may disclose other potential property dispositions, whether individually or in the aggregate, at any time and from time to time. We may disclose our plans to sell one or more properties prior to offering such properties for sale, identifying or negotiating with potential buyers, entering into letters of intent or if entering into a purchase and sale agreement at any time and from time to time. These letters of intent are generally non-binding. If we enter into a legally binding purchase and sale agreement to dispose of a property, the disposition may be subject to the satisfaction of various closing conditions, and there can be no assurance that these conditions will be satisfied or that the disposition will close on the terms described, or at all. If we fail to consummate a disposition, we will not have the use of the proceeds of the disposition and may not be able to carry out our intended plans for such proceeds or may have to obtain liquidity from alternative sources on less favorable terms. To the extent we intend to use proceeds of property sales to purchase new properties or to reduce our leverage by repaying our indebtedness, any such failure may cause us not to have the liquidity necessary to purchase such new properties or repay our indebtedness in accordance with its terms or we may be required to obtain such liquidity from such alternative sources. As a result, failure to consummate one or more of pending property dispositions we may disclose could have a material adverse impact on our liquidity and affect our ability to purchase new properties or may result in our obtaining alternative financing which may increase our leverage which could adversely affect our financial condition, results of operations and the market price of our common stock.
We may fail to consummate some or all potential property acquisitions we disclose individually or in the aggregate, which could have a material adverse impact on our results of operations, earnings and cash flow.
We may disclose potential property acquisitions, whether individually or in the aggregate, at any time and from time to time. We refer to the aggregate number of potential acquisitions we are considering at any particular time as our pipeline. We generally include a property in our pipeline when our underwriting and due diligence efforts have proceeded to the point where we have issued a letter of intent to acquire a particular property or if we have entered into a purchase and sale agreement. These letters of intent are generally non-binding. If we enter into a legally binding purchase and sale agreement to acquire a property, the acquisition may be subject to the satisfaction of various closing conditions, and there can be no assurance that these conditions will be satisfied or that the acquisition will close on the terms described therein, or at all. If we fail to consummate an acquisition, to the extent we issued additional securities in order to use the proceeds of the offering to fund an acquisition, we may have issued a significant number of our securities without realizing a corresponding increase in earnings and cash flow from acquiring the properties involved in such acquisition. In addition, we may have broad authority to use the net proceeds of any offering for other purposes, including the repayment of indebtedness, the acquisition of other properties that we may identify in the future or for other investments, which may not be initially accretive to our results of operations. As a result, failure to consummate one or more of the pending property acquisitions could have a material adverse impact on our financial condition, results of operations and the market price of our common stock.
9
We may suffer from delays in locating suitable investments or, because of our public company status, may be unable to acquire otherwise suitable investments, which could adversely affect our growth prospects and results of operations.
Our ability to achieve our investment objectives and to make distributions to our stockholders depends upon our ability to locate, obtain financing for and consummate the acquisition of apartment properties that meet our investment criteria. The current market for apartment properties that meet our investment criteria is highly competitive. We cannot be sure that we will be successful in obtaining suitable investments on financially attractive terms or at all.
Additionally, as a public company, we are subject to the ongoing reporting requirements under the Securities Exchange Act of 1934, as amended, or the Exchange Act. Pursuant to the Exchange Act, we may be required to file with the SEC financial statements of properties we acquire. To the extent any required financial statements are not available or cannot be obtained, we may not be able to acquire the property. As a result, we may be unable to acquire certain properties that otherwise would be suitable investments.
If we are unable to invest the proceeds of any offering of our securities in real properties in a timely manner, we may invest the proceeds in short-term, investment-grade investments which typically will yield significantly less than what we expect our investments will yield. As a result, delays we encounter in identifying and consummating potential acquisitions may adversely affect our growth prospects, results of operations and our ability to make distributions to our stockholders.
If we lose or are unable to retain or obtain key personnel, our ability to implement our investment strategies could be hindered, which could reduce our ability to make distributions and adversely affect the trading price of our common stock.
Our success depends to a significant degree upon the contributions of certain of our officers and other key personnel. If any of our key personnel were to terminate their employment with us, our operating results could suffer. Further, we do not have and do not intend to maintain key person life insurance that would provide us with proceeds in the event of death or disability of any of our key personnel. We believe our future success depends upon our ability to hire and retain highly skilled managerial, operational and marketing personnel. Competition for such personnel is intense, and we cannot assure you that we will be successful in attracting and retaining such skilled personnel. If we lose or are unable to obtain the services of key personnel, our ability to implement our investment strategies could be delayed or hindered, and the trading price of our common stock may be adversely affected.
The representations, warranties, covenants and indemnities in the IRT internalization agreement and related agreements are subject to limitations and qualifiers, which may limit our ability to enforce any remedy under these agreements.
The representations, warranties, covenants and indemnities in the IRT internalization agreement and other agreements related to the IRT management internalization completed on December 20, 2016 are subject to limitations and qualifiers, which may limit our ability to enforce any remedy under these agreements. These include, without limitation, limitations on liability and materiality qualifiers on certain representations and covenants.
If we fail to maintain an effective system of integrated internal controls, we may not be able to accurately report our financial results and may be required to incur additional costs and divert management resources.
We depend on our ability to produce accurate and timely financial statements in order to run our business. If we fail to do so, our business could be negatively affected and our independent registered public accounting firm may be unable to attest to the accuracy of our financial statements. A deficiency in internal control exists when the design or operation of a control does not allow management or employees, in the normal course of performing their assigned functions, to prevent, or detect and correct, misstatements on a timely basis. A significant deficiency is defined as a deficiency, or a combination of deficiencies, in internal control over financial reporting that is less severe than a material weakness, yet important enough to merit attention by those responsible for oversight of a registrant’s financial reporting. A material weakness is a deficiency, or a combination of deficiencies, in internal control, such that there is a reasonable possibility that a material misstatement of the entity’s financial statements will not be prevented or detected and corrected, on a timely basis by the Company’s internal controls.
Although we continuously monitor the design, implementation and operating effectiveness of our internal controls over financial reporting and disclosure controls and procedures, there can be no assurance that significant deficiencies or material weaknesses will not occur in the future. If we fail to maintain effective internal controls and disclosure controls in the future, it could result in a material misstatement of our financial statements that may not be prevented or detected on a timely basis, which could cause investors, analysts and others to lose confidence in our reported financial information. Our inability to remedy any additional deficiencies or material weaknesses that may be identified in the future could, among other things, cause us to fail to file timely our periodic reports with the SEC (which may have a material adverse effect on our ability to access the capital markets); prevent us from providing reliable and accurate financial information and forecasts or from avoiding or detecting fraud; or require us to incur additional costs or divert management resources to achieve compliance.
A change in the United States government policy with regard to Fannie Mae and Freddie Mac could impact our financial condition.
10
Fannie Mae and Freddie Mac are a major source of financing for the multifamily residential real estate sector. Many multifamily companies depend heavily on Fannie Mae and Freddie Mac to finance growth by purchasing or guarantying apartment loans and to refinance outstanding indebtedness as it matures.
If new U.S. government regulations (i) heighten Fannie Mae’s and Freddie Mac’s underwriting standards, (ii) adversely affect interest rates and (iii) continue to reduce the amount of capital they can make available to the multifamily sector, it could reduce or remove entirely a vital resource for multifamily financing. Any potential reduction in loans, guarantees and credit-enhancement arrangements from Fannie Mae and Freddie Mac could jeopardize the effectiveness of the multifamily sector’s available financing and decrease the amount of available liquidity and credit that could be used to acquire and diversify our portfolio of multifamily assets, as well as dispose of our multifamily assets upon our liquidation, and our ability to refinance our existing mortgage obligations as they come due and obtain additional long-term financing for the acquisition of additional multifamily apartment communities on favorable terms or at all. In addition, the members of the current Presidential administration have announced restructuring and privatizing Fannie Mae and Freddie Mac is a priority of the current administration, and there is uncertainty regarding the impact of this action on us and buyers of our properties.
If we are not able to cost-effectively maximize the life of our properties, we may incur greater than anticipated capital expenditure costs, which may adversely affect our ability to make distributions to our stockholders.
As of December 31, 2017, the average age of our apartment communities was approximately 16 years, after adjusting for significant renovations. While the majority of our properties are newly-constructed or have undergone substantial renovations since they were constructed, older properties may carry certain risks including unanticipated repair costs associated with older properties, increased maintenance costs as older properties continue to age, and cost overruns due to the need for special materials and/or fixtures specific to older properties. Although we take a proactive approach to property preservation, utilizing a preventative maintenance plan, and selective improvements that mitigate the cost impact of maintaining exterior building features and aging building components, if we are not able to cost-effectively maximize the life of our properties, we may incur greater than anticipated capital expenditure costs which may adversely affect our ability to make distributions to our stockholders.
Our growth will depend upon future acquisitions of multifamily apartment communities, and we may be unable to complete acquisitions on advantageous terms or acquisitions may not perform as we expect.
Our growth will depend upon future acquisitions of multifamily apartment communities, which entails various risks, including risks that our investments may not perform as we expect. Further, we will face competition for attractive investment opportunities from other real estate investors, including local real estate investors and developers, as well as other multifamily REITs, income-oriented non-traded REITs, and private real estate fund managers, and these competitors may have greater financial resources than us and a greater ability to borrow funds to acquire properties. This competition may increase as investments in real estate become increasingly attractive relative to other forms of investment. As a result of competition, we may be unable to acquire additional properties as we desire or the purchase price may be significantly elevated. In addition, our acquisition activities pose the following risks to our ongoing operations:
|
|
• |
we may not achieve the increased occupancy, cost savings and operational efficiencies projected at the time of acquiring a property; |
|
|
• |
management may incur significant costs and expend significant resources evaluating and negotiating potential acquisitions, including those that we subsequently are unable to complete; |
|
|
• |
we may acquire properties that are not initially accretive to our results upon acquisition, and we may not successfully manage and operate those properties to meet our expectations; |
|
|
• |
we may acquire properties outside of our existing markets where we are less familiar with local economic and market conditions; |
|
|
• |
some properties may be worth less or may generate less revenue than, or simply not perform as well as, we believed at the time of the acquisition; |
|
|
• |
we may be unable to assume mortgage indebtedness with respect to properties we seek to acquire or obtain financing for acquisitions on favorable terms or at all; |
|
|
• |
we may forfeit earnest money deposits with respect to acquisitions we are unable to complete due to lack of financing, failure to satisfy closing conditions or certain other reasons; |
|
|
• |
we may spend more than budgeted to make necessary improvements or renovations to acquired properties; and |
|
|
• |
we may acquire properties without any recourse, or with only limited recourse, for liabilities, whether known or unknown, such as clean-up of environmental contamination, claims by tenants, vendors or other persons against the former owners of the properties, and claims for indemnification by general partners, trustees, officers, and others indemnified by the former owners of the properties. |
11
Our growth depends on securing external sources of capital that are outside of our control, which may affect our ability to take advantage of strategic opportunities, satisfy debt obligations and make distributions to our stockholders.
In order to maintain our qualification as a REIT, we are generally required under the Code to distribute annually at least 90% of our REIT taxable income, determined without regard to the dividends paid deduction and excluding any net capital gain. In addition, we will be subject to income tax at regular corporate rates to the extent that we distribute less than 100% of our net taxable income, including any net capital gains. Because of these distribution requirements, we may not be able to fund future capital needs, including any necessary acquisition financing, from operating cash flow. Consequently, we may rely on third-party sources to fund our capital needs. We may not be able to obtain financing on favorable terms or at all. Any additional debt we incur may increase our leverage. If we issue additional equity securities to finance developments and acquisitions instead of incurring debt, the interests of our existing stockholders could be diluted. Our access to third-party sources of capital depends, in part, on:
|
|
• |
general market conditions; |
|
|
• |
the market’s perception of our growth potential; |
|
|
• |
our current debt levels; |
|
|
• |
our current and expected future earnings; |
|
|
• |
our cash flow and cash distributions; and |
|
|
• |
the market price per share of our common stock. |
If we cannot obtain capital from third-party sources, we may not be able to acquire properties when strategic opportunities exist, meet the capital and operating needs of our existing properties or satisfy our debt service obligations. Further, in order to meet the REIT distribution requirements and maintain our REIT status and to avoid the payment of income and excise taxes, we may need to borrow funds on a short-term basis even if the then-prevailing market conditions are not favorable for these borrowings. These short-term borrowing needs could result from differences in timing between the actual receipt of cash and inclusion of income for U.S. federal income tax purposes or the effect of non-deductible capital expenditures, the creation of reserves, certain restrictions on distributions under loan documents or required debt or amortization payments.
To the extent that capital is not available to acquire properties, profits may not be realized or their realization may be delayed, which could result in an earnings stream that is less predictable than some of our competitors and result in us not meeting our projected earnings and distributable cash flow levels in a particular reporting period. Failure to meet our projected earnings and distributable cash flow levels in a particular reporting period could have an adverse effect on our financial condition and on the market price of our common stock.
We may increase our debt or raise additional capital in the future, which could adversely affect our financial condition and growth prospects.
To execute our business strategy, we will require additional capital. Debt or equity financing, however, may not be available to us on terms acceptable to us, if at all. If we incur additional debt or raise equity through the issuance of preferred stock, the terms of the debt or preferred stock issued may give the holders rights, preferences and privileges senior to those of holders of our common stock, particularly in the event of liquidation. The terms of any new debt may also impose additional and more stringent restrictions on our operations than we currently have. If we raise funds through the issuance of additional common equity, either through public or private offerings or rights offerings, the percentage ownership of our stockholders would decline. If we are unable to raise additional capital when needed, it could affect our financial condition and growth prospects.
We may be subject to contingent or unknown liabilities related to properties or business that we have acquired or may acquire for which we may have limited or no recourse against the sellers.
The properties or businesses that we have acquired or may acquire may be subject to unknown or contingent liabilities for which we have limited or no recourse against the sellers. Unknown liabilities might include liabilities for, among other things, cleanup or remediation of undisclosed environmental conditions, liabilities under the Employee Retirement Income Security Act of 1974, as amended, or ERISA, claims of residents, vendors or other persons dealing with the entities prior to the acquisition of such property, tax liabilities, and accrued but unpaid liabilities whether incurred in the ordinary course of business or otherwise. Because many liabilities, including tax liabilities, may not be identified within the applicable contractual indemnification period, we may have no recourse against any of the owners from whom we acquired such properties for these liabilities. The existence of such liabilities could significantly adversely affect the value of the property subject to such liability. As a result, if a liability was asserted against us based on ownership of any of such properties, then we might have to pay substantial sums to settle it, which could adversely affect our cash flows.
12
Representations and warranties made by us in connection with sales of our properties may subject us to liability that could result in losses and could harm our operating results and, therefore distributions we make to our stockholders.
When we sell a property, we may be required to make representations and warranties regarding the property and other customary items. In the event of a breach of such representations or warranties, the purchaser of the property may have claims for damages against us, rights to indemnification from us or otherwise have remedies against us. In any such case, we may incur liabilities that could result in losses and could harm our operating results and, therefore distributions we make to our stockholders.
A material failure, inadequacy, interruption or security failure of our technology networks and related systems could harm our business.
Our information technology networks and related systems are essential to our ability to conduct our day to day operations. As a result, we face risks associated with security breaches, whether through cyber attacks or cyber intrusions over the internet, malware, computer viruses, attachments to emails, persons who access our systems from inside or outside our organization and other significant disruptions of our information technology networks and related systems. A security breach or other significant disruption involving our information technology networks and related systems or those of our vendors could: disrupt our operations; result in the unauthorized access to, and the destruction, loss, theft, misappropriation or release of, proprietary, personally identifiable, confidential, sensitive or otherwise valuable information including tenant information and lease data, which others could use to compete against us or which could expose us to damage claims by third parties for disruptive, destructive or otherwise harmful outcomes; require significant management attention and resources to remedy any damages that result; subject us to claims for breach of contract, damages, credits, penalties or termination of leases or other agreements; or damage our business relationships or reputation generally. Any or all of the foregoing could materially and adversely affect our business and the value of our stock.
Our third-party service providers are primarily responsible for the security of their own information technology environments and in certain instances, we rely significantly on third-party service providers to supply and store our sensitive data in a secure manner. All of these third parties face risks relating to cybersecurity similar to ours which could disrupt their businesses and therefore adversely impact us. While we provide guidance and specific requirements in some cases, we do not directly control any of such parties’ information technology security operations, or the amount of investment they place in guarding against cybersecurity threats. Accordingly, we are subject to any flaws in or breaches to their information technology systems or those which they operate for us, which could have a material adverse effect on our financial condition or results of operations.
Although no material incidents have occurred to date and we have taken various actions to maintain the security and integrity of our information technology networks and related systems and have implemented various measures to manage the risk of a security breach or disruption, we cannot be sure that our security efforts and measures will be effective or that our financial results will not be negatively impacted by such an incident.
Damage from catastrophic weather and other natural events and climate change could result in losses and could harm our operating results.
To the extent that significant changes in the climate occur in areas where our properties are located, we may experience extreme weather and changes in precipitation and temperature, all of which may result in physical damage to or a decrease in demand for properties located in these areas or affected by these conditions. Should the impact of climate change be material in nature, including destruction of our properties, or occur for lengthy periods of time, our financial condition or results of operations may be adversely affected.
General Risks Related to Investments in Real Estate
We face numerous risks associated with the real estate industry that could adversely affect our results of operations through decreased revenues or increased costs.
As a real estate company, we are subject to various changes in real estate conditions and any negative trends in such real estate conditions may adversely affect our results of operations through decreased revenues or increased costs. These conditions include:
|
|
• |
changes in national, regional and local economic conditions, which may be negatively impacted by concerns about inflation, deflation, government deficits, high unemployment rates, decreased consumer confidence and liquidity concerns, particularly in markets in which we have a high concentration of properties; |
|
|
• |
fluctuations in interest rates, which could adversely affect our ability to obtain financing on favorable terms or at all, or could reduce our ability to deploy capital in investments that are accretive to our stockholders; |
|
|
• |
the inability of residents to pay rent; |
|
|
• |
the existence and quality of the competition, such as the attractiveness of our properties as compared to our competitors’ properties based on considerations such as convenience of location, rental rates, amenities and safety record; |
13
|
|
• |
increased operating costs, including increased real property taxes, maintenance, insurance and utilities costs; |
|
|
• |
weather conditions that may increase or decrease energy costs and other weather-related expenses; |
|
|
• |
civil unrest, acts of God, including earthquakes, floods, hurricanes and other natural disasters, which may result in uninsured losses, and acts of war or terrorism; |
|
|
• |
oversupply of multifamily housing or a reduction in demand for real estate in the markets in which our properties are located; |
|
|
• |
a favorable interest rate environment that may result in a significant number of potential residents of our multifamily apartment communities deciding to purchase homes instead of renting; |
|
|
• |
changes in, or increased costs of compliance with, laws and/or governmental regulations, including those governing usage, zoning, the environment and taxes; and |
|
|
• |
rent control or stabilization laws, or other laws regulating rental housing, which could prevent us from raising rents to offset increases in operating costs. |
Economic conditions may adversely affect the residential real estate market and our income.
A residential property’s income and value may be adversely affected by international, national and regional economic conditions. During the past five years, the U.S. and international markets have experienced increased levels of volatility due to a combination of many factors, including decreased values of homes and commercial real estate, limited access to credit markets, increased energy costs, increased unemployment rates, and a national and global recession. Although recently some economic conditions appear to have improved, if such improvement does not continue or if new economic or capital markets problems arise, the value of our portfolio may decline significantly. A deterioration in economic conditions may also have an adverse effect on our operations if they result in our tenants or prospective tenants being unable to afford the rents we need to charge to be profitable.
In addition, local real estate conditions such as an oversupply of properties or a reduction in demand for properties, availability of “for sale” properties and competition from other similar properties, our ability to provide adequate maintenance, insurance and management services, increased operating costs (including real estate taxes), the attractiveness and location of the property and changes in market rental rates, may adversely affect a property’s income and value. A rise in energy costs could result in higher operating costs, which may affect our results from operations. In addition, local conditions in the markets in which we own or intend to own properties may significantly affect occupancy or rental rates at such properties. Layoffs, plant closings, relocations of significant local employers and other events reducing local employment rates and the local economy; an oversupply of, or a lack of demand for, apartments; a decline in household formation; the inability or unwillingness of residents to pay rent increases; and rent control, rent stabilization and other housing laws, all could prevent us from raising or maintaining rents, and could cause us to reduce rents.
We will face competition from third parties, including other apartment properties, which may limit our profitability and the return on any investment in our securities.
The apartment industry is highly competitive. This competition may limit our ability to increase revenue and could reduce occupancy levels and revenues at our apartment properties. We compete with many other entities engaged in real estate investment activities, including individuals, corporations, bank and insurance company investment accounts, other REITs, real estate limited partnerships, and other entities engaged in real estate investment activities. Many of these entities have significant financial and other resources, including operating experience, allowing them to compete effectively with us. Competitors with substantially greater financial resources than us may be able to accept more risk than we can effectively manage. In addition, those competitors that are not REITs may be at an advantage to the extent they can use working capital to finance projects, while we (and our competitors that are REITs) will be required by the annual distribution provisions under the Code to distribute significant amounts of cash from operations to our stockholders. Competition may also result in overbuilding of apartment properties, causing an increase in the number of apartment units available which could potentially decrease our occupancy and apartment rental rates. We may also be required to expend substantial sums to attract new residents. The resale value of the property could be diminished because the market value of a particular property will depend principally upon the net revenues generated by the property. In addition, increases in operating costs due to inflation may not be offset by increased apartment rental rates. Further, costs associated with real estate investment, such as real estate taxes and maintenance costs, generally are not reduced when circumstances cause a reduction in income from the investment. These events would cause a significant decrease in revenues and the trading price of our common stock, and could cause us to reduce the amount of distributions to our stockholders.
The illiquidity of real estate investments could make it difficult for us to respond to changing economic, financial, and investment conditions or changes in the operating performance of our properties, which could reduce our cash flows and adversely affect results of operations.
Real estate investments are relatively illiquid and may become even more illiquid during periods of economic downturn. As a result, we will have a limited ability to vary our portfolio in response to changes in economic, financial and investment conditions or
14
changes in the operating performance of our properties. We may not be able to sell a property or properties quickly or on favorable terms in response to changes in the economy or other conditions when it otherwise may be prudent to do so. This inability to respond quickly to changes in the performance of our properties as a result of an economic or market downturn could adversely affect our results of operations if we cannot sell an unprofitable property.
We will also have a limited ability to sell assets in order to fund working capital, repay debt and similar capital needs. Our financial condition could be adversely affected if we were, for example, unable to sell one or more of our properties in order to meet our debt obligations upon maturity. We cannot predict whether we will be able to sell any property for the price or on the terms set by us, or whether any price or other terms offered by a prospective purchaser would be acceptable to us. We also cannot predict the length of time needed to find a willing purchaser and to close the sale of a property. We also may be required to expend funds to correct defects or to make improvements before a property can be sold, and we cannot assure you that we will have funds available to correct those defects or to make those improvements. Our inability to dispose of assets at opportune times or on favorable terms could adversely affect our cash flows and results of operations.
Moreover, the Code imposes restrictions on a REIT’s ability to dispose of properties that are not applicable to other types of real estate companies. In particular, the tax laws applicable to REITs require that we hold our properties for investment, rather than primarily for sale in the ordinary course of business, which may cause us to forego or defer sales of properties that otherwise would be in our best interests.
Therefore, we may not be able to vary our portfolio promptly in response to economic or other conditions or on favorable terms, which may adversely affect our cash flows, our ability to make distributions to our stockholders and the market price of our common stock.
Properties we purchase may not appreciate or may decrease in value.
The residential real estate market may experience substantial influxes of capital from investors. A substantial flow of capital, combined with significant competition for real estate, may result in inflated purchase prices for such assets. To the extent we purchase real estate in such an environment, we are subject to the risk that, if the real estate market subsequently ceases to attract the same level of capital investment, or if the number of investors seeking to acquire such assets decreases, our returns will be lower and the value of our assets may not appreciate or may decrease significantly below the amount we paid for such assets. In addition, if interest rates applicable to financing apartment properties rise, that may negatively affect the values of our properties in any period when capitalization rates for our properties, an important valuation metric, do not make corresponding adjustments.
We may incur liabilities in connection with properties we acquire.
We may acquire properties that are subject to liabilities or that have problems relating to environmental condition, state of title, physical condition or compliance with zoning laws, building codes, or other legal requirements, many of which may not be known to us at the time of acquisition. In each case, our acquisition may be without any, or with only limited, recourse with respect to unknown liabilities or conditions. If any liability were asserted against us relating to those properties or entities, or if any adverse condition existed with respect to the properties or entities, we might have to pay substantial sums to settle or cure it, which could adversely affect our cash flow and operating results. While we will attempt to obtain appropriate representations and undertakings from the sellers of the properties or entities we acquire, the sellers may not have the resources to satisfy their indemnification obligations if a liability arises.
Increasing real estate taxes, utilities and insurance costs may negatively impact operating results.
Our properties may be subject to increases in tax rates, utility costs, operating expenses, insurance costs, repairs and maintenance, administrative and other expenses. Real estate taxes, utilities costs and insurance premiums, in particular, are subject to significant increases and fluctuations, which can be widely outside of our control. A number of our markets have multi-year real estate tax reassessments coming up in 2018 and tax increases may result from such reassessments. If our costs should rise, without being offset by a corresponding increase in rental rates, our results of operations could be negatively impacted, and our ability to pay our dividends and distributions and senior debt could be affected.
We may suffer losses that are not covered by insurance.
If we suffer losses that are not covered by insurance or that are in excess of insurance coverage, we could lose invested capital and anticipated profits. We maintain comprehensive insurance for our properties, including casualty, liability, fire, extended coverage, terrorism, earthquakes, hurricanes and rental loss customarily obtained for similar properties in amounts which our advisor determines are sufficient to cover reasonably foreseeable losses, and with policy specifications and insured limits that we believe are adequate and appropriate under the circumstances. Material losses may occur in excess of insurance proceeds with respect to any property, and there are types of losses, generally of a catastrophic nature, such as losses due to wars, pollution, environmental matters (such as snow or ice storms, windstorms or hurricanes, earthquakes, flooding or other severe weather) and mold, which are either uninsurable or not economically insurable, or may be insured subject to limitations, such as large deductibles or co-payments. Moreover, we cannot predict whether all of the coverage that we currently maintain will be available to us in the future, or what the future costs or limitations on any coverage that is available to us will be. The Company relies on third party insurance providers for its property,
15
general liability and worker’s compensation insurance. While there has yet to be any non-performance by these major insurance providers, should any of them experience liquidity issues or other financial distress, it could negatively impact the Company. In addition, the Company annually assesses its insurance needs based on the cost of coverage and other factors. We may choose to self-insure a greater portion of this risks in the future or may choose to have higher deductibles or lesser policy terms.
Lawsuits or other legal proceedings could result in substantial costs.
We are subject to various lawsuits and other legal proceedings and claims that arise in the ordinary course of our business operations. The defense or settlement of any lawsuit or claim may adversely affect our business, financial condition, or results of operations or result in increased insurance premiums.
We may be unable to secure funds for property improvements, which could reduce cash distributions to our stockholders.
When tenants do not renew their leases or otherwise vacate, we may be required to expend funds for capital improvements to the vacated apartment units in order to attract replacement tenants. In addition, we may require substantial funds to renovate an apartment property in order to sell, upgrade or reposition it in the market. If our reserves are insufficient to fund these improvements, we may have to obtain financing. We cannot assure you that sufficient financing will be available or, if available, will be available on economically feasible terms or on terms acceptable to us. Moreover, some reserves required by lenders may be designated for specific uses and may not be available for capital improvements to other properties. Additional borrowing will increase our interest expense, and could result in decreased net revenues and a decreased ability to make cash distributions to our stockholders.
Short-term tenant leases expose us to the effects of declining market rent, which could adversely impact our ability to make cash distributions to our stockholders.
We expect that most of our tenant leases will be for a term of one year or less. Because these leases generally permit the tenants to leave at the end of the lease term without any penalty, our rental revenues may be impacted by declines in market rents more quickly than if our leases were for longer terms.
The profitability of our acquisitions is uncertain.
We intend to acquire properties selectively. Acquisition of properties entails risks that investments will fail to perform in accordance with expectations. In undertaking these acquisitions, we will incur certain risks, including the expenditure of funds on, and the devotion of management’s time to, transactions that may not come to fruition. Additional risks inherent in acquisitions include risks that the properties will not achieve anticipated occupancy levels and that estimates of the costs of improvements to bring an acquired property up to standards established for the market position intended for that property may prove inaccurate.
Acquiring or attempting to acquire multiple properties in a single transaction may adversely affect our operations.
We have and may in the future acquire multiple properties in a single transaction. Such portfolio acquisitions are more complex and expensive than single-property acquisitions, and the risk that a multiple-property acquisition does not close may be greater than in a single-property acquisition. Portfolio acquisitions may also result in us owning investments in geographically dispersed markets, placing additional demands on our ability to manage the properties in the portfolio. In addition, a seller may require that a group of properties be purchased as a package even though we may not want to purchase one or more properties in the portfolio. In these situations, if we are unable to identify another person or entity to acquire the unwanted properties, we may be required to operate, or attempt to dispose of, these properties. To acquire multiple properties in a single transaction, we may be required to accumulate a large amount of cash. We expect the returns that we can earn on such cash to be less than the ultimate returns on real property, and therefore, accumulating such cash could reduce the funds available for distributions. Any of the foregoing events may have an adverse effect on our operations.
If we sell properties by providing financing to purchasers, we will bear the risk of default by the purchaser.
If we decide to sell any of our properties, we intend to use commercially reasonable efforts to sell them for cash. However, in some instances, we may sell our properties by providing financing to purchasers. If we provide financing to purchasers, we will bear the risk of default by the purchaser which would reduce the value of our assets, impair our ability to make distributions to our stockholders and reduce the price of our common stock.
Our revenue and net income may vary significantly from one period to another due to investments in value-add properties and portfolio acquisitions, which could increase the variability of our cash distributions.
We may make investments in properties that have existing cash flow which are in various phases of development, redevelopment or repositioning and where we believe that, through limited capital expenditures, we can achieve enhanced returns (which we refer to as value-add properties), which may cause our revenues and net income to fluctuate significantly from one period to another. Projects do not produce revenue while in development or redevelopment. We have identified a number of properties in our portfolio as value-add properties and intend to make capital expenditures on such properties. During any period when the number of our projects in development or redevelopment or those with significant capital requirements increases without a corresponding increase in stable revenue-producing properties, our revenues and net income will likely decrease, and we could have losses.
16
Moreover, value-add properties subject us to the risks of higher than expected construction costs, failure to complete projects on a timely basis, failure of the properties to perform at expected levels upon completion of development or redevelopment, and increased borrowings necessary to fund higher than expected construction or other costs related to the project. The occurrence of one or more of these risks could decrease our core FFO.
We may acquire properties through joint ventures, which could subject us to liabilities in excess of those contemplated or prevent us from taking actions which are in the best interests of our stockholders, which could adversely affect our trading price.
We may enter into joint ventures with affiliates and/or other third parties to acquire or improve properties. We may also purchase properties in partnerships, co-tenancies or other co-ownership arrangements. Such investments may involve risks not otherwise present when acquiring real estate directly, including the following:
|
|
• |
a co-venturer, co-owner or partner may have certain approval rights over major decisions, which may prevent us from taking actions that are in the best interest of our stockholders but opposed by our partners or co-venturers; |
|
|
• |
a co-venturer, co-owner or partner may at any time have economic or business interests or goals which are or become inconsistent with our business interests or goals, including inconsistent goals relating to the sale of properties held in the joint venture or the timing of termination or liquidation of the joint venture; |
|
|
• |
a co-venturer, co-owner or partner in an investment might become insolvent or bankrupt (in which event we and any other remaining partners or members would generally remain liable for the liabilities of the partnership or joint venture); |
|
|
• |
we may incur liabilities as a result of an action taken by our co-venturer, co-owner or partner; |
|
|
• |
a co-venturer, co-owner or partner may be in a position to take actions contrary to our instructions, requests, objectives or policies, including our policy with respect to qualifying and maintaining our qualification as a REIT; |
|
|
• |
agreements governing joint ventures, limited liability companies and partnerships often contain restrictions on the transfer of a member’s or partner’s interest or “buy-sell” or other provisions that may result in a purchase or sale of the interest at a disadvantageous time or on disadvantageous terms; |
|
|
• |
disputes between us and our joint venturers may result in litigation or arbitration that would increase our expenses and prevent our officers and directors from focusing their time and effort on our business and result in subjecting the properties owned by the applicable joint venture to additional risk; and |
|
|
• |
under certain joint venture arrangements, neither venture partner may have the power to control the venture, and an impasse could be reached which might have a negative influence on the joint venture. |
If any of the foregoing were to occur we may be subject to liabilities in excess of those contemplated, which could adversely affect our trading price.
Risks Associated with Debt Financing
We plan to incur mortgage indebtedness and other borrowings and are not limited in the amount or percentage of indebtedness that we may incur, which may increase our business risks.
We intend to acquire properties subject to existing financing or by borrowing new funds. In addition, we intend to incur additional mortgage debt by obtaining loans secured by some, or all, of our real properties to obtain funds to acquire additional real properties and/or make capital improvements to properties. We may also borrow funds, if necessary, to satisfy the requirement that we generally distribute to stockholders as dividends at least 90% of our annual REIT taxable income (computed without regard to dividends paid and excluding net capital gain), or otherwise as is necessary or advisable to assure that we maintain our qualification as a REIT for U.S. federal income tax purposes.
Our charter and bylaws do not limit the amount or percentage of indebtedness that we may incur. We are subject to risks normally associated with debt financing, including the risk that our cash flows will be insufficient to meet required payments of principal and interest. There can be no assurance that we will be able to refinance any maturing indebtedness, that such refinancing would be on terms as favorable as the terms of the maturing indebtedness or that we will be able to otherwise obtain funds by selling assets or raising equity to make required payments on maturing indebtedness.
In particular, loans obtained to fund property acquisitions will generally be secured by mortgages or deeds in trust on such properties. If we are unable to make our debt service payments as required, a lender could foreclose on the property or properties securing its debt.
In addition, for U.S. federal income tax purposes, a foreclosure of any of our properties would be treated as a sale of the property for a purchase price equal to the outstanding balance of the debt secured by the mortgage. If the outstanding balance of the debt secured by the mortgage exceeds our tax basis in the property, we would recognize taxable income on foreclosure, but would not receive any cash proceeds. We may, in some circumstances, give a guaranty on behalf of an entity that owns one or more of our
17
properties. In these cases, we will be responsible to the lender for satisfaction of the debt if it is not paid by such entity. If any mortgages contain cross-collateralization or cross-default provisions, there is a risk that we could lose part or all of our investment in multiple properties. Each of these events could in turn cause the value of our common stock and distributions payable to stockholders to be reduced.
Any mortgage debt which we place on properties may prohibit prepayment and/or impose a prepayment penalty upon the sale of a mortgaged property. If a lender invokes these prohibitions or penalties upon the sale of a property or prepayment of a mortgage on a property, the cost to us to sell the property could increase substantially. This could decrease the proceeds from a sale or refinancing or make the sale or refinancing impractical, which may lead to a reduction in our income, which would reduce core FFO and, accordingly, our distributions to stockholders.
We may also finance our property acquisitions using interest-only mortgage indebtedness. During the interest-only period, the amount of each scheduled payment will be less than that of a traditional amortizing mortgage loan. The principal balance of the mortgage loan will not be reduced (except in the case of prepayments) because there are no scheduled monthly payments of principal during this period. After the interest-only period, we will be required either to make scheduled payments of amortized principal and interest or to make a lump-sum or “balloon” payment at maturity. These required principal or balloon payments will increase the amount of our scheduled payments and may increase our risk of default under the related mortgage loan. If the mortgage loan has an adjustable interest rate, the amount of our scheduled payments also may increase at a time of rising interest rates. Increased payments and substantial principal or balloon maturity payments will reduce the funds available for distribution to our stockholders because cash otherwise available for distribution will be required to pay principal and interest associated with these mortgage loans.
Lenders may require us to enter into restrictive covenants relating to our operations, which could limit our ability to make distributions to our stockholders.
In providing financing to us, a lender may impose restrictions on us that would affect our ability to incur additional debt, make certain investments, reduce liquidity below certain levels, make distributions to our stockholders and otherwise affect our distribution and operating policies. Our KeyBank credit facility and term loan include restrictions and requirements relating to the incurrence of debt, permitted investments, maximum level of distributions, maintenance of insurance, mergers and sales of assets and transactions with affiliates. We expect that any other loan agreements we enter into will contain similar covenants and may also impose other restrictions and limitations. Any such covenants, restrictions or limitations may limit our ability to make distributions to you and could make it difficult for us to satisfy the requirements necessary to maintain our qualification as a REIT for U.S. federal income tax purposes.
Lenders may be able to recover against our other properties under our mortgage loans.
In financing our property acquisitions, we may seek to obtain secured nonrecourse loans. However, only recourse financing may be available, in which event, in addition to the property securing the loan, the lender would have the ability to look to our other assets for satisfaction of the debt if the proceeds from the sale or other disposition of the property securing the loan are insufficient to fully repay it. Also, in order to facilitate the sale of a property, we may allow the buyer to purchase the property subject to an existing loan whereby we remain responsible for certain liabilities associated with the debt.
If we are required to make payments under any “bad boy” carve-out guaranties that we may provide in connection with certain mortgages and related loans, our business and financial results could be materially adversely affected.
In obtaining certain nonrecourse loans, we may provide standard carve-out guaranties. These guaranties are only applicable if and when the borrower directly, or indirectly through agreement with an affiliate, joint venture partner or other third party, voluntarily files a bankruptcy or similar liquidation or reorganization action or takes other actions that are fraudulent or improper (commonly referred to as “bad boy” guaranties). Although we believe that “bad boy” carve-out guaranties are not guaranties of payment in the event of foreclosure or other actions of the foreclosing lender that are beyond the borrower’s control, some lenders in the real estate industry have recently sought to make claims for payment under such guaranties. In the event such a claim were made against us under a “bad boy” carve-out guaranty following foreclosure on mortgages or related loan, and such claim were successful, our business and financial results could be materially adversely affected.
We may be subject to risks related to interest rate fluctuations, and the derivative financial instruments that we may use may be costly and ineffective, may reduce the overall returns on any investment in our securities and have other related risks.
We may be subject to risks related to interest rate fluctuations if any of our debt is subject to a floating interest rate. At December 31, 2017, we had $784.6 million of outstanding indebtedness, $204.0 million of which was floating-rate indebtedness. On June 24, 2016, we entered into an interest rate swap contract with a notional value of $150.0 million, a strike rate of 1.145% based on 1-month LIBOR and a maturity date of June 17, 2021 to hedge our interest rate exposure on floating rate indebtedness. On November 17, 2017, we purchased an interest rate collar with a notional value of $100.0 million, a 2.00% cap and 1.25% floor, and a maturity date of November 17, 2024. To the extent that we use derivative financial instruments to hedge our exposure to floating interest rate debt, we may be exposed to credit, basis and legal enforceability risks. Derivative financial instruments may include interest rate swap contracts, interest rate cap or floor contracts, futures or forward contracts, options or repurchase agreements. In this context, credit risk
18
is the failure of the counterparty to perform under the terms of the derivative contract. If the fair value of a derivative contract is positive, the counterparty owes us, which creates credit risk for us. Basis risk occurs when the index upon which the contract is based is more or less variable than the index upon which the hedged asset or liability is based, thereby making the hedge less effective. Finally, legal enforceability risks encompass general contractual risks, including the risk that the counterparty will breach the terms of, or fail to perform its obligations under, the derivative contract. Moreover, hedging strategies involve transaction and other costs. If we are unable to manage these risks and costs effectively, our results of operations, financial condition and ability to make distributions to you will be adversely affected.
Some of our outstanding mortgage indebtedness contains, and we may in the future acquire or finance properties with, lock-out provisions, which may prohibit us from selling a property, or may require us to maintain specified debt levels for a period of years on some properties.
A lock-out provision is a provision that prohibits the prepayment of a loan during a specified period of time. Lock-out provisions may include terms that provide strong financial disincentives for borrowers to prepay their outstanding loan balance and exist in order to protect the yield expectations of lenders. Some of our outstanding mortgage indebtedness is, and we expect that many of our properties will be, subject to lock-out provisions. Lock-out provisions could materially restrict us from selling or otherwise disposing of or refinancing properties when we may desire to do so. Lock-out provisions may prohibit us from reducing the outstanding indebtedness with respect to any properties, refinancing such indebtedness on a non-recourse basis at maturity, or increasing the amount of indebtedness with respect to such properties. Lock-out provisions could impair our ability to take other actions during the lock-out period that could be in the best interests of our stockholders and, therefore, may have an adverse impact on the value of our shares relative to the value that would result if the lock-out provisions did not exist. In particular, lock-out provisions could preclude us from participating in major transactions that could result in a disposition of our assets or a change in control even though that disposition or change in control might be in the best interests of our stockholders.
Complying with REIT requirements may limit our ability to hedge risk effectively.
The REIT provisions of the Code may limit our ability to hedge the risks inherent to our operations. Any income or gain derived by us from transactions that hedge certain risks, such as the risk of changes in interest rates, will not be treated as gross income for purposes of either the 75% or the 95% Gross Income Test, as defined in Exhibit 99.1 “Material U.S. Federal Income Tax Considerations” of this report, provided specific requirements are met. Such requirements include that the hedging transaction be properly identified within prescribed time periods and that the transaction either (i) hedges risks associated with indebtedness issued by us that is incurred to acquire or carry real estate assets or (ii) manages the risks of currency fluctuations with respect to income or gain that qualifies under the 75% or 95% Gross Income Test (or assets that generate such income). To the extent that we do not properly identify such transactions as hedges, hedge with other types of financial instruments, or hedge other types of indebtedness, the income from those transactions will not be treated as qualifying income for purposes of the 75% and 95% Gross Income Tests. As a result of these rules, we may have to limit the use of hedging techniques that might otherwise be advantageous, which could result in greater risks associated with interest rate or other changes than we would otherwise incur.
Higher levels of debt or increases in interest rates could increase the amount of our debt payments and adversely affect our ability to make distributions to our stockholders.
We expect that we will incur additional indebtedness in the future. Interest we pay reduces our core FFO. In addition, if we incur variable rate debt in the future, increases in interest rates could raise our interest costs, which would reduce our cash flows and our ability to make distributions to our stockholders. If we are unable to refinance our indebtedness at maturity or meet our payment obligations, the amount of our distributable cash flows and our financial condition would be adversely affected, and we may lose the property securing such indebtedness. In addition, if we need to repay existing debt during periods of rising interest rates, we could be required to liquidate one or more of our investments in properties at times which may not permit realization of the maximum return on such investments.
There is refinancing risk associated with our debt.
Certain of our outstanding debt contains, and we may in the future acquire or finance properties with debt containing, limited or no principal amortization, which would require that the principal be repaid at the maturity of the loan in a so-called “balloon payment.” As of December 31, 2017, the financing arrangements of our outstanding indebtedness could require us to make lump-sum or “balloon” payments of approximately $746.6 million at maturity dates that range from 2021 to 2026. At the maturity of these loans, assuming we do not have sufficient funds to repay the debt, we will need to refinance the debt. If the credit environment is constrained at the time of our debt maturities, we would have a very difficult time refinancing debt. In addition, for certain loans, we locked in our fixed-rate debt at a point in time when we were able to obtain favorable interest rate, principal payments and other terms. When we refinance our debt, prevailing interest rates and other factors may result in us paying a greater amount of debt service, which will adversely affect our cash flow, and, consequently, our core FFO and distributions to our stockholders. If we are unable to refinance our debt on acceptable terms, we may be forced to choose from a number of unfavorable options, including agreeing to otherwise unfavorable financing terms on one or more of our unencumbered assets, selling one or more properties at disadvantageous terms, including unattractive prices, or defaulting on the mortgage and permitting the lender to foreclose. Any one of these options could
19
have a material adverse effect on our business, financial condition, results of operations and our ability to make distributions to our stockholders.
If mortgage debt is unavailable at reasonable rates, we may not be able to finance or refinance our properties, which could reduce the amount of cash distributions we can make.
If mortgage debt is unavailable at reasonable rates, we may not be able to finance the purchase of properties. In addition, we run the risk of being unable to refinance mortgage debt when the loans come due or of being unable to refinance such debt on favorable terms. If interest rates are higher when we refinance such debt, our income could be reduced. We may be unable to refinance such debt at appropriate times, which may require us to sell properties on terms that are not advantageous to us or could result in the foreclosure of such properties. If any of these events occur, our cash flows would be reduced. This, in turn, would reduce core FFO to our stockholders and may hinder our ability to raise more capital by issuing more stock or by borrowing more money.
Some of our mortgage loans may have “due on sale” provisions, which may impact the manner in which we acquire, sell and/or finance our properties.
In purchasing properties subject to financing, we may obtain financing with “due-on-sale” and/or “due-on-encumbrance” clauses. Due-on-sale clauses in mortgages allow a mortgage lender to demand full repayment of the mortgage loan if the borrower sells the mortgaged property. Similarly, due-on-encumbrance clauses allow a mortgage lender to demand full repayment if the borrower uses the real estate securing the mortgage loan as security for another loan. In such event, we may be required to sell our properties on an all-cash basis, to acquire new financing in connection with the sale, or to provide seller financing which may make it more difficult to sell the property or reduce the selling price.
Changes in the method pursuant to which the LIBOR rates are determined and potential phasing out of LIBOR after 2021 may affect our financial results.
The chief executive of the United Kingdom Financial Conduct Authority ("FCA"), which regulates LIBOR, has recently announced that the FCA intends to stop compelling banks to submit rates for the calculation of LIBOR after 2021. It is not possible to predict the effect of these changes, other reforms or the establishment of alternative reference rates in the United Kingdom or elsewhere. Furthermore, in the United States, efforts to identify a set of alternative U.S. dollar reference interest rates include proposals by the Alternative Reference Rates Committee of the Federal Reserve Board and the Federal Reserve Bank of New York. On August 24, 2017, the Federal Reserve Board requested public comment on a proposal by the Federal Reserve Bank of New York, in cooperation with the Office of Financial Research, to produce three new reference rates intended to serve as alternatives to LIBOR. These alternative rates are based on overnight repurchase agreement transactions secured by U.S. Treasury Securities. The Federal Reserve Bank said that the publication of these alternative rates is targeted to commence by mid-2018.
Any changes announced by the FCA, other regulators or any other successor governance or oversight body, or future changes adopted by such body, in the method pursuant to which the LIBOR rates are determined may result in a sudden or prolonged increase or decrease in the reported LIBOR rates. If that were to occur, the level of interest payments we incur may change. In addition, although certain of our LIBOR based obligations provide for alternative methods of calculating the interest rate payable on certain of our obligations if LIBOR is not reported, which include requesting certain rates from major reference banks in London or New York, or alternatively using LIBOR for the immediately preceding interest period or using the initial interest rate, as applicable, uncertainty as to the extent and manner of future changes may result in interest rates and/or payments that are higher than, lower than or that do not otherwise correlate over time with the interest rates and/or payments that would have been made on our obligations if LIBOR rate was available in its current form.
Compliance with Laws
We are subject to significant regulations, which could adversely affect our results of operations through increased costs and/or an inability to pursue business opportunities.
Local zoning and use laws, environmental statutes and other governmental requirements may restrict or increase the costs of our development, expansion, renovation and reconstruction activities and thus may prevent or delay us from taking advantage of business opportunities. Failure to comply with these requirements could result in the imposition of fines, awards to private litigants of damages against us, substantial litigation costs and substantial costs of remediation or compliance. In addition, we cannot predict what requirements may be enacted in the future or that such requirements will not increase our costs of regulatory compliance or prohibit us from pursuing business opportunities that could be profitable to us, which could adversely affect our results of operations.
The costs of compliance with environmental laws and regulations may adversely affect our income and the cash available for any distributions.
All real property and the operations conducted on real property are subject to federal, state and local laws and regulations relating to environmental protection and human health and safety. Examples of federal laws include: the National Environmental Policy Act, the Comprehensive Environmental Response, Compensation, and Liability Act, the Solid Waste Disposal Act, as amended by the Resource Conservation and Recovery Act, the Federal Water Pollution Control Act, the Federal Clean Air Act, the Toxic
20
Substances Control Act, the Emergency Planning and Community Right to Know Act and the Hazard Communication Act. These laws and regulations generally govern wastewater discharges, air emissions, the operation and removal of underground and aboveground storage tanks, the use, storage, treatment, transportation and disposal of solid and hazardous materials, and the remediation of contamination associated with disposals. Some of these laws and regulations may impose joint and several liability on tenants, owners or operators for the costs of investigation or remediation of contaminated properties, regardless of fault or the legality of the original disposal.
Under various federal, state and local environmental laws, ordinances and regulations, a current or previous owner or operator of real property may be liable for the cost of removal or remediation of hazardous or toxic substances on, under or in such property. The costs of removal or remediation could be substantial. These laws often impose liability whether or not the owner or operator knew of, or was responsible for, the presence of the hazardous or toxic substances. In addition, the presence of these substances, or the failure to properly remediate these substances, may adversely affect our ability to sell or rent the property or to use the property as collateral for future borrowing.
Environmental laws also may impose restrictions on the manner in which property may be used or businesses may be operated, and these restrictions may require substantial expenditures. Environmental laws provide for sanctions in the event of noncompliance and may be enforced by governmental agencies or, in certain circumstances, by private parties. Certain environmental laws and common law principles govern the presence, maintenance, removal and disposal of certain building materials, including asbestos and lead-based paint. Such hazardous substances could be released into the air and third parties may seek recovery from owners or operators of real properties for personal injury or property damage associated with exposure to released hazardous substances.
In addition, if any property in our portfolio is not properly connected to a water or sewer system, or if the integrity of such systems is breached, microbial matter or other contamination can develop. If this were to occur, we could incur significant remedial costs and we may also be subject to private damage claims and awards, which could be material. If we become subject to claims in this regard, it could materially and adversely affect us.
Property values may also be affected by the proximity of such properties to electric transmission lines. Electric transmission lines are one of many sources of electro-magnetic fields, or EMFs, to which people may be exposed. Research completed regarding potential health concerns associated with exposure to EMFs has produced inconclusive results. Notwithstanding the lack of conclusive scientific evidence, some states now regulate the strength of electric and magnetic fields emanating from electric transmission lines and other states have required transmission facilities to measure for levels of EMFs. On occasion, lawsuits have been filed (primarily against electric utilities) that allege personal injuries from exposure to transmission lines and EMFs, as well as from fear of adverse health effects due to such exposure. This fear of adverse health effects from transmission lines may be considered both when property values are determined to obtain financing and in condemnation proceedings. We may not, in certain circumstances, search for electric transmission lines near our properties, but are aware of the potential exposure to damage claims by persons exposed to EMFs.
There may also be potential liability associated with lead-based paint arising from lawsuits alleging personal injury and related claims. The existence of lead paint is especially a concern in residential units. A structure built prior to 1978 may contain lead-based paint and may present a potential for exposure to lead; however, structures built after 1978 are not likely to contain lead-based paint.
The cost of defending against such claims of liability, of compliance with environmental regulatory requirements, of remediating any contaminated property, or of paying personal injury claims could materially adversely affect our business, assets or results of operations and, consequently, amounts available for distribution to our stockholders.
Compliance with new or more stringent laws or regulations or stricter interpretation of existing laws may require material expenditures by us. We cannot assure you that future laws, ordinances or regulations will not impose any material environmental liability, or that the current environmental condition of our properties will not be affected by the operations of residents, existing conditions of the land, operations in the vicinity of the properties, or the activities of unrelated third parties. In addition, there are various local, state and federal fire, health, life-safety and similar regulations that we may be required to comply with. Failure to comply with applicable laws and regulations could result in fines and/or damages, suspension of our personnel and/or other sanctions.
We cannot provide any assurance properties which we acquire will not have any material environmental conditions, liabilities or compliance concerns. Accordingly, we have no way of determining at this time the magnitude of any potential liability to which we may be subject arising out of environmental conditions or violations with respect to the properties we own.
As the owner or operator of real property, we could become subject to liability for asbestos-containing building materials in the buildings on our properties.
Some of our properties may contain asbestos-containing materials. Environmental laws typically require that owners or operators of buildings with asbestos-containing building materials properly manage and maintain these materials, adequately inform or train those who may come in contact with asbestos and undertake special precautions, including removal or other abatement, in the event that asbestos is disturbed during building renovation or demolition. These laws may impose fines and penalties on building owners or operators for failure to comply with these requirements. In addition, third parties may be entitled to seek recovery from owners or operators for personal injury associated with exposure to asbestos-containing building materials.
21
In addition, many insurance carriers are excluding asbestos-related claims from standard policies, pricing asbestos endorsements at prohibitively high rates or adding significant restrictions to this coverage. Because of our inability to obtain specialized coverage at rates that correspond to the perceived level of risk, we may not obtain insurance for asbestos-related claims. We will continue to evaluate the availability and cost of additional insurance coverage from the insurance market. If we decide in the future to purchase insurance for asbestos, the cost could have a negative impact on our results of operations.
Costs associated with addressing indoor air quality issues, moisture infiltration and resulting mold remediation may be costly.
As a general matter, concern about indoor exposure to mold or other air contaminants has been increasing as such exposure has been alleged to have a variety of adverse effects on health. As a result, there have been a number of lawsuits in our industry against owners and managers of apartment communities relating to indoor air quality, moisture infiltration and resulting mold. Some of our properties may contain microbial matter such as mold and mildew. The terms of our property and general liability policies generally exclude certain mold-related claims. Should an uninsured loss arise against us, we would be required to use our funds to resolve the issue, including litigation costs. We can offer no assurance that liabilities resulting from indoor air quality, moisture infiltration and the presence of or exposure to mold will not have a future impact on our business, results of operations and financial condition.
Our costs associated with and the risk of failing to comply with the Americans with Disabilities Act may affect core FFO.
We generally expect that our properties will be subject to the Americans with Disabilities Act of 1990, as amended, or the Disabilities Act. Under the Disabilities Act, all places of public accommodation are required to comply with federal requirements related to access and use by disabled persons. The Disabilities Act has separate compliance requirements for “public accommodations” and “commercial facilities” that generally require that buildings and services be made accessible and available to people with disabilities. The Disabilities Act does not, however, consider residential properties, such as apartment properties, to be public accommodations or commercial facilities, except to the extent portions of such facilities, such as a leasing office, are open to the public. The Disabilities Act’s requirements could require removal of access barriers and could result in the imposition of injunctive relief, monetary penalties or, in some cases, an award of damages. We will attempt to acquire properties that comply with the Disabilities Act or place the burden on the seller or a third party to ensure compliance with such laws. However, we cannot assure you that we will be able to acquire properties or allocate responsibilities in this manner. If we cannot, costs in complying with these laws may affect core FFO and the amount of distributions to you.
We must comply with the Fair Housing Amendments Act of 1988, or the FHAA, and failure to comply may affect core FFO.
We must comply with the FHAA, which requires that apartment properties first occupied after March 13, 1991 be accessible to handicapped residents and visitors. As with the Disabilities Act, compliance with the FHAA could require removal of structural barriers to handicapped access in a community, including the interiors of apartment units covered under the FHAA. Recently there has been heightened scrutiny of apartment housing properties for compliance with the requirements of the FHAA and the Disabilities Act and an increasing number of substantial enforcement actions and private lawsuits have been brought against apartment communities to ensure compliance with these requirements. Noncompliance with the FHAA could result in the imposition of fines, awards of damages to private litigants, payment of attorneys’ fees and other costs to plaintiffs, substantial litigation costs and substantial costs of remediation.
United States Federal Income Tax Risks
Legislative or regulatory action could adversely affect the returns to our investors.
Legislative, regulatory or administrative changes could be enacted or promulgated at any time, either prospectively or with retroactive effect, and may adversely affect us and/or our stockholders.
On December 22, 2017, a bill informally known as the Tax Cuts and Jobs Act (the “TCJA”) was signed into law. The TCJA makes significant changes to the U.S. federal income tax rules for taxation of individuals and corporations, generally effective for taxable years beginning after December 31, 2017. In addition to reducing corporate and individual tax rates, the TCJA eliminates or restricts various deductions. Most of the changes applicable to individuals are temporary and apply only to taxable years beginning after December 31, 2017 and before January 1, 2026. The TCJA makes numerous large and small changes to the tax rules that do not affect the REIT qualification rules directly but may otherwise affect us or our stockholders.
While the changes in the TCJA generally appear to be favorable with respect to REITs and their stockholders, the extensive changes to non-REIT provisions in the Code may have unanticipated effects on us or our stockholders. Moreover, Congressional leaders have recognized that the process of adopting extensive tax legislation in a short amount of time without hearings and substantial time for review is likely to have led to drafting errors, issues needing clarification and unintended consequences that will have to be revisited in subsequent tax legislation. At this point, it is not clear if or when Congress will address these issues or when the IRS will issue administrative guidance on the changes made in the TCJA.
22
We urge you to consult with your own tax advisor with respect to the status of the TCJA and other legislative, regulatory or administrative developments and proposals and their potential effect on an investment in shares of our common stock.
Dividends paid by REITs do not qualify for the reduced tax rates provided under current law.
Dividends paid by REITs are generally not eligible for the reduced 15% maximum tax rate for dividends paid to individuals (20% for those with taxable income above certain thresholds that are adjusted annually under current law). The more favorable rates applicable to regular corporate dividends could cause stockholders who are individuals to perceive investments in REITs to be relatively less attractive than investments in the stock of non-REIT corporations that pay dividends to which more favorable rates apply, which could reduce the value of the stocks of REITs. However, under the TCJA regular dividends from REITS are treated as income from a pass-through entity and are eligible for a 20% deduction. As a result, our regular dividends will be taxed at 80% of an individual marginal tax rate. The current maximum rate is 37% resulting in a maximum tax rate of 29.6% on our dividends. Dividends from REITs as well as regular corporate dividends will also be subject to a 3.8% Medicare surtax for taxpayers with modified adjusted gross income above $200,000 (if single) or $250,000 (if married and filing jointly).
We may decide to borrow funds to satisfy our REIT minimum distribution requirements, which could adversely affect our overall financial performance.
We may decide to borrow funds in order to meet the REIT minimum distribution requirements even if our management believes that the then prevailing market conditions generally are not favorable for such borrowings or that such borrowings would not be advisable in the absence of such tax considerations. If we borrow money to meet the REIT minimum distribution requirements or for other working capital needs, our expenses will increase, our net income will be reduced by the amount of interest we pay on the money we borrow and we will be obligated to repay the money we borrow from future earnings or by selling assets, any or all of which may decrease future distributions to stockholders.
To maintain our qualification as a REIT, we may be forced to forego otherwise attractive opportunities, which may delay or hinder our ability to meet our investment objectives and adversely affect the trading price of our common stock.
To maintain our qualification as a REIT, we must satisfy certain tests on an ongoing basis concerning, among other things, the sources of our income, nature of our assets and the amounts we distribute to our stockholders. We may be required to make distributions to stockholders at times when it would be more advantageous to reinvest cash in our business or when we do not have funds readily available for distribution. Compliance with the REIT qualification requirements may hinder our ability to operate solely on the basis of maximizing profits and adversely affect the trading price of our common stock.
If we fail to maintain our qualification as a REIT, we will be subject to tax on our income, and the amount of distributions we make to our stockholders will be less.
We intend to maintain our qualification as a REIT under the Code. A REIT generally is not taxed at the corporate level on income and gains that it distributes to its stockholders on a timely basis. We do not intend to request a ruling from the Internal Revenue Service, or the IRS, as to our REIT status. Qualification as a REIT involves the application of highly technical and complex rules for which there are only limited judicial or administrative interpretations. The determination of various factual matters and circumstances not entirely within our control may affect our ability to continue to qualify as a REIT. In addition, new legislation, regulations, administrative interpretations or court decisions could significantly change the tax laws with respect to qualification as a REIT or the U.S. federal income tax consequences of such qualification, including changes with retroactive effect.
If we fail to qualify as a REIT in any taxable year:
|
|
• |
we would not be allowed to deduct our distributions to our stockholders when computing our taxable income; |
|
|
• |
we would be subject to U.S. federal income tax (including any applicable alternative minimum tax) on our taxable income at regular corporate rates; |
|
|
• |
we generally would be disqualified from being taxed as a REIT for the four taxable years following the year during which qualification was lost, unless entitled to relief under certain statutory provisions; |
|
|
• |
we would have less cash to make distributions to our stockholders; and |
|
|
• |
we might be required to borrow additional funds or sell some of our assets in order to pay corporate tax obligations we may incur as a result of our disqualification. |
Although our organization and current and proposed method of operation is intended to enable us to maintain our qualification to be taxed as a REIT, it is possible that future economic, market, legal, tax or other considerations may cause our board of directors to revoke our REIT election. Even if we maintain our qualification to be taxed as a REIT, we expect to incur some taxes, such as state and local taxes, taxes imposed on certain subsidiaries and potential U.S. federal excise taxes.
We encourage you to read Exhibit 99.1—“Material U.S. Federal Income Tax Considerations” to this report for further discussion of the tax issues related to an investment in us.
23
The ability of our Board of Directors to revoke our REIT election without stockholder approval may cause adverse consequences to our stockholders.
Our Charter provides that our Board of Directors may revoke or otherwise terminate our REIT election, without the approval of our stockholders, if it determines that it is no longer in our best interest to continue to maintain our qualification as a REIT. If we cease to maintain our qualification as a REIT, we would become subject to U.S. federal income tax on our taxable income without the benefit of the dividends paid deduction and would no longer be required to distribute most of our taxable income to our stockholders, which may have adverse consequences on the total return to our stockholders.
To maintain our qualification as a REIT, we must meet annual distribution requirements, which may result in our distributing amounts that may otherwise be used for our operations.
To obtain the favorable tax treatment accorded to REITs, we generally are required each year to distribute to our stockholders at least 90% of our REIT taxable income (excluding net capital gain), determined without regard to the deduction for distributions paid. We are subject to U.S. federal income tax on our undistributed taxable income and net capital gain and to a 4% nondeductible excise tax on any amount by which distributions we pay with respect to any calendar year are less than the sum of (i) 85% of our ordinary income, (ii) 95% of our capital gain net income and (iii) 100% of our undistributed income from prior years. These requirements could cause us to distribute amounts that otherwise would be spent on investments in real estate assets, and it is possible that we might be required to borrow funds, possibly at unfavorable rates, or sell assets to fund these distributions. Although we intend to make distributions sufficient to meet the annual distribution requirements and to avoid U.S. federal income and excise taxes on our earnings, it is possible that we might not always be able to do so.
Complying with REIT requirements may cause us to forgo otherwise attractive opportunities.
To maintain our qualification as a REIT, we must continually satisfy various tests regarding sources of income, nature and diversification of assets, amounts distributed to stockholders and the ownership of shares of our capital stock. In order to satisfy these tests, we may be required to forgo investments that might otherwise be made. Accordingly, compliance with the REIT requirements may hinder our investment performance.
In particular, at least 75% of our total assets at the end of each calendar quarter must consist of real estate assets, government securities, and cash or cash items. For this purpose, “real estate assets” generally include interests in real property, such as land, buildings, leasehold interests in real property, stock of other entities that qualify as REITs, interests in mortgage loans secured by real property, investments in stock or debt instruments during the one-year period following the receipt of new capital and regular or residual interests in a real estate mortgage investment conduit. In addition, the amount of securities of a single issuer that we hold, other than securities qualifying under the 75% asset test and certain other securities, must generally not exceed either 5% of the value of our gross assets or 10% of the vote or value of such issuer’s outstanding securities.
A REIT’s net income from prohibited transactions is subject to a 100% penalty tax. In general, prohibited transactions are sales or other dispositions of property, other than foreclosure property, held in inventory or primarily for sale to customers in the ordinary course of business. It may be possible to reduce the impact of the prohibited transaction tax and the holding of assets not qualifying as real estate assets for purposes of the REIT asset tests by conducting certain activities, or holding non-qualifying REIT assets through a TRS, subject to certain limitations as described below. To the extent that we engage in such activities through a taxable REIT subsidiary, or TRS, the income associated with such activities will be subject to full U.S. federal corporate income tax.
Certain of our business activities are potentially subject to the prohibited transaction tax, which could reduce the return on any investment in our securities.
Our ability to dispose of property is restricted to a substantial extent as a result of our REIT status. Under applicable provisions of the Code regarding prohibited transactions by REITs, we will be subject to a 100% tax on any gain recognized on the sale or other disposition of any property (other than foreclosure property) that we own, directly or through any subsidiary entity, including IROP, but excluding a TRS, that is deemed to be inventory or property held primarily for sale to customers in the ordinary course of trade or business. Whether property is inventory or otherwise held primarily for sale to customers in the ordinary course of a trade or business depends on the particular facts and circumstances surrounding each property. No assurance can be given that any particular property we own, directly or through any subsidiary entity, including IROP, but excluding a TRS, will not be treated as inventory or property held primarily for sale to customers in the ordinary course of a trade or business.
The use of TRSs would increase our overall tax liability.
Some of our assets may need to be owned or sold, or some of our operations may need to be conducted, by TRSs. We do not currently have significant operations through a TRS but may in the future. A TRS will be subject to U.S. federal and state income tax on its taxable income. The after-tax net income of a TRS would be available for distribution to us. Further, we will incur a 100% excise tax on transactions with a TRS that are not conducted on an arm’s length basis. For example, to the extent that the rent paid by a TRS exceeds an arm’s length rental amount, such amount is potentially subject to the excise tax. We intend that all transactions
24
between us and any TRS we form will be conducted on an arm’s length basis, and, therefore, any amounts paid by any TRS we form to us will not be subject to the excise tax. However, no assurance can be given that no excise tax would arise from such transactions.
If our operating partnership, IROP, is not treated as a partnership or disregarded entity for U.S. federal income tax purposes, its income may be subject to taxation.
We intend to maintain the status of IROP as a partnership or disregarded entity for U.S. federal income tax purposes. However, if the IRS were to successfully challenge the status of IROP as a partnership or disregarded entity for such purposes, it would be taxable as a corporation. In such event, this would reduce the amount of distributions that IROP could make to us. This would also result in our losing REIT status, and becoming subject to a corporate level tax on our own income. This would substantially reduce our cash available to pay distributions and the yield on any investment in our securities. In addition, if any of the partnerships or limited liability companies through which IROP owns its properties, in whole or in part, loses its characterization as a partnership for U.S. federal income tax purposes, it would be subject to taxation as a corporation, thereby reducing distributions to IROP. Such a recharacterization of an underlying property owner could also threaten our ability to maintain REIT status.
Distributions to tax-exempt investors may be classified as unrelated business taxable income, or UBTI, and tax-exempt investors would be required to pay tax on such income and to file income tax returns.
Neither ordinary nor capital gain distributions with respect to our common stock nor gain from the sale of stock should generally constitute UBTI to a tax-exempt investor. However, there are certain exceptions to this rule, including:
|
|
• |
under certain circumstances, part of the income and gain recognized by certain qualified employee pension trusts with respect to our stock may be treated as UBTI if our stock is predominately held by qualified employee pension trusts, such that we are a “pension-held” REIT (which we do not expect to be the case); |
|
|
• |
part of the income and gain recognized by a tax-exempt investor with respect to our stock would constitute UBTI if such investor incurs debt in order to acquire our common stock; and |
|
|
• |
part or all of the income or gain recognized with respect to our stock held by social clubs, voluntary employee benefit associations, supplemental unemployment benefit trusts and qualified group legal services plans which are exempt from U.S. federal income taxation under Sections 501(c)(7), (9), (17) or (20) of the Code may be treated as UBTI. |
We encourage you to consult your own tax advisor to determine the tax consequences applicable to you if you are a tax-exempt investor.
Distributions to foreign investors may be treated as an ordinary income distribution to the extent that it is made out of current or accumulated earnings and profits.
In general, foreign investors will be subject to regular U.S. federal income tax with respect to their investment in our stock if the income derived therefrom is “effectively connected” with the foreign investor’s conduct of a trade or business in the United States. A distribution to a foreign investor that is not attributable to gain realized by us from the sale or exchange of a “U.S. real property interest” within the meaning of the Foreign Investment in Real Property Tax Act of 1980, as amended, or FIRPTA, will be treated as an ordinary income distribution to the extent that it is made out of current or accumulated earnings and profits (as determined for U.S. federal income tax purposes). Generally, any ordinary income distribution will be subject to a U.S. withholding tax equal to 30% of the gross amount of the distribution, unless this tax is reduced by the provisions of an applicable treaty.
Foreign investors may be subject to FIRPTA tax upon the sale of their shares of our stock.
A foreign investor disposing of a U.S. real property interest, including shares of stock of a U.S. corporation whose assets consist principally of U.S. real property interests, is generally subject to FIRPTA tax on the gain recognized on the disposition. Such FIRPTA tax does not apply, however, to the disposition of stock in a REIT if the REIT is “domestically controlled.” A REIT is “domestically controlled” if less than 50% of the REIT’s stock, by value, has been owned directly or indirectly by persons who are not U.S. persons during a continuous five-year period ending on the date of disposition or, if shorter, during the entire period of the REIT’s existence. While we intend to qualify as “domestically controlled,” we cannot assure you that we will. If we were to fail to so qualify, gain realized by foreign investors on a sale of shares of our stock would be subject to FIRPTA tax, unless the shares of our stock were traded on an established securities market and the foreign investor did not at any time during a specified testing period directly or indirectly own more than 10% of the value of our outstanding common stock.
Foreign investors may be subject to FIRPTA tax upon a capital gain dividend.
A foreign investor may be subject to FIRPTA tax upon the payment of any capital gain dividend by us if such dividend is attributable to gain from sales or exchanges of U.S. real property interests.
We encourage you to consult your own tax advisor to determine the tax consequences applicable to you if you are a foreign investor.
25
We may make distributions consisting of both stock and cash, in which case stockholders may be required to pay income taxes in excess of the cash distributions they receive.
We may make distributions that are paid in cash and stock at the election of each stockholder and may distribute other forms of taxable stock dividends. Taxable stockholders receiving such distributions will be required to include the full amount of the distributions as ordinary income to the extent of our current and accumulated earnings and profits for U.S. federal income tax purposes. As a result, stockholders may be required to pay income taxes with respect to such distributions in excess of the cash received. If a stockholder sells the stock that it receives in order to pay this tax, the sales proceeds may be less than the amount included in income with respect to the distribution, depending on the market price of our stock at the time of the sale. Furthermore, in the case of certain non-U.S. stockholders, we may be required to withhold federal income tax with respect to taxable dividends, including taxable dividends that are paid in stock. In addition, if a significant number of our stockholders decide to sell their shares in order to pay taxes owed with respect to taxable stock dividends, it may put downward pressure on the trading price of our stock.
If our operating partnership, IROP, were classified as a “publicly traded partnership” taxable as a corporation for U.S. federal income tax purposes under the Code, we would cease to maintain our qualification as a REIT and would suffer other adverse tax consequences.
We intend for IROP to be treated as a partnership for U.S. federal income tax purposes. If the IRS were to successfully challenge the status of IROP as a partnership, however, IROP generally would be taxable as a corporation. In such event, we likely would fail to maintain our status as a REIT for U.S. federal income tax purposes, and the resulting corporate income tax burden would reduce the amount of distributions that IROP could make to us. This would substantially reduce the cash available to pay distributions to our stockholders. In addition, if any of the partnerships or limited liability companies through which the operating partnership owns its properties, in whole or in part, loses its characterization as a partnership and is not otherwise disregarded for U.S. federal income tax purposes, it would be subject to taxation as a corporation, thereby reducing distributions to the operating partnership. Such a recharacterization of an underlying property owner could also threaten our ability to maintain our REIT qualification.
Our stockholders may be restricted from acquiring or transferring certain amounts of our common stock.
Certain provisions of the Code and the stock ownership limits in our Charter may inhibit market activity in our capital stock and restrict our business combination opportunities. In order to maintain our qualification as a REIT, five or fewer individuals, as defined in the Code, may not own, beneficially or constructively, more than 50% in value of our issued and outstanding stock at any time during the last half of a taxable year. Attribution rules in the Code determine if any individual or entity beneficially or constructively owns our capital stock under this requirement. Additionally, at least 100 persons must beneficially own our capital stock during at least 335 days of a taxable year. To help insure that we meet these tests, our Charter restricts the acquisition and ownership of shares of our stock.
Our Charter, with certain exceptions, authorizes our Board of Directors to take such actions as are necessary and desirable to preserve our qualification as a REIT. Unless exempted by our Board of Directors, our Charter prohibits any person from beneficially or constructively owning more than 9.8% in value or number of shares, whichever is more restrictive, of the outstanding shares of our common stock or capital stock. Our Board of Directors may not grant an exemption from these restrictions to any proposed transferee whose ownership in excess of ownership limits would result in our failing to maintain our qualification as a REIT. These restrictions on transferability and ownership will not apply, however, if our Board of Directors determines that it is no longer in our best interest to continue to maintain our qualification as a REIT.
Risks Related to Our Organization and Structure
The Maryland General Corporation Law prohibits certain business combinations, which may make it more difficult for us to be acquired.
Under the Maryland General Corporation Law, “business combinations” between a Maryland corporation and an “interested stockholder” or an affiliate of an interested stockholder are prohibited for five years after the most recent date on which the interested stockholder became an interested stockholder. These business combinations include a merger, consolidation, share exchange, or in circumstances specified in the statute, an asset transfer or issuance or reclassification of equity securities. An interested stockholder is defined as (i) any person who beneficially owns 10% or more of the voting power of the then outstanding voting stock of the corporation; or (ii) an affiliate or associate of the corporation who, at any time within the two-year period prior to the date in question, was the beneficial owner of 10% or more of the voting power of the then outstanding stock of the corporation.
A person is not an interested stockholder under the statute if the board of directors approved in advance the transaction by which the person otherwise would have become an interested stockholder. However, in approving a transaction, the board of directors may provide that its approval is subject to compliance, at or after the time of approval, with any terms and conditions determined by the board.
26
After the expiration of the five-year period described above, any business combination between the Maryland corporation and an interested stockholder must generally be recommended by the board of directors of the corporation and approved by the affirmative vote of at least:
|
|
• |
80% of the votes entitled to be cast by holders of the then outstanding shares of voting stock of the corporation; and |
|
|
• |
two-thirds of the votes entitled to be cast by holders of voting stock of the corporation, other than shares held by the interested stockholder with whom or with whose affiliate the business combination is to be effected, or held by an affiliate or associate of the interested stockholder. |
These super-majority vote requirements do not apply if the corporation’s common stockholders receive a minimum price, as defined under the Maryland General Corporation Law, for their shares in the form of cash or other consideration in the same form as previously paid by the interested stockholder for its shares. The Maryland General Corporation Law also permits various exemptions from these provisions, including business combinations that are exempted by the board of directors before the time that the interested stockholder becomes an interested stockholder. Pursuant to the statute, our board of directors has by resolution exempted business combinations between us and any other person from these provisions of the Maryland General Corporation Law, provided that the business combination is first approved by our board of directors and, consequently, the five year prohibition and the supermajority vote requirements will not apply to such business combinations. As a result, any person approved by our board of directors will be able to enter into business combinations with us that may not be in the best interests of our stockholders without compliance by us with the supermajority vote requirements and other provisions of the statute. This resolution, however, may be altered or repealed in whole or in part at any time. If this resolution is repealed, or our board of directors does not otherwise approve a business combination, the statute may discourage others from trying to acquire control of us and increase the difficulty of consummating any offer.
Stockholders have limited control over changes in our policies and operations.
Our board of directors determines our major policies, including those regarding our investment objectives and strategies, financing, growth, debt capitalization, REIT qualification and distributions. Our board of directors may amend or revise these and other policies without a vote of the stockholders. Under our charter and the Maryland General Corporation Law, our stockholders generally have a right to vote only on the following matters:
|
|
• |
the election or removal of directors; |
|
|
• |
the amendment of our charter, except that our board of directors may amend our charter without stockholder approval to: |
|
|
• |
change our name; |
|
|
• |
change the name or other designation or the par value of any class or series of stock and the aggregate par value of our stock; |
|
|
• |
increase or decrease the aggregate number of our authorized shares; |
|
|
• |
increase or decrease the number of our shares of any class or series of stock that we have the authority to issue; and |
|
|
• |
effect certain reverse stock splits; |
|
|
• |
our dissolution; and |
|
|
• |
our being a party to any acquisition, consolidation, sale or other disposition of substantially all of our assets or statutory share exchange. |
All other matters are subject to the discretion of our board of directors.
Our authorized but unissued shares of common and preferred stock may prevent a change in our control.
Our charter authorizes us to issue additional authorized but unissued shares of common or preferred stock. In addition, our board of directors may, without stockholder approval, amend our charter from time to time to increase or decrease the aggregate number of shares of our stock or the number of shares of stock of any class or series that we have authority to issue and classify or reclassify any unissued shares of common or preferred stock into other classes or series of stock and set the preferences, rights and other terms of the classified or reclassified shares. As a result, our board of directors may establish a series of common or preferred stock that could delay or prevent a transaction or a change in control that might involve a premium price for our common stock or otherwise be in the best interest of our stockholders.
Because of our holding company structure, we depend on our operating partnership, IROP, and its subsidiaries for cash flow; however, we will be structurally subordinated in right of payment to the obligations of IROP and its subsidiaries.
We are a holding company with no business operations of our own. Our only significant asset is and will be the partnership interests in IROP. We conduct, and intend to continue to conduct, all of our business operations through IROP. Accordingly, our only
27
source of cash to pay our obligations is distributions from IROP and its subsidiaries of their net earnings and cash flows. We cannot assure you that IROP or its subsidiaries will be able to, or be permitted to, make distributions to us that will enable us to make distributions to our stockholders from cash flows from operations. Each of IROP’s subsidiaries is a distinct legal entity and, under certain circumstances, legal and contractual restrictions may limit our ability to obtain cash from such entities. In addition, because we are a holding company, your claims as stockholders will be structurally subordinated to all existing and future liabilities and obligations of IROP and its subsidiaries. Therefore, in the event of our bankruptcy, liquidation or reorganization, our assets and those of IROP and its subsidiaries will be able to satisfy your claims as stockholders only after all of our and IROP’s and its subsidiaries’ liabilities and obligations have been paid in full.
Our rights and the rights of our stockholders to recover on claims against our directors are limited, which could reduce your and our recovery against them if they negligently cause us to incur losses.
The Maryland General Corporation Law provides that a director has no liability in such capacity if he performs his duties in good faith, in a manner he reasonably believes to be in our best interests and with the care that an ordinarily prudent person in a like position would use under similar circumstances. In addition, our directors and officers will not be liable to us or our stockholders for monetary damages unless the director or officer actually received an improper benefit or profit in money, property or services, or is adjudged to be liable to us or our stockholders based on a finding that his or her action, or failure to act, was the result of active and deliberate dishonesty and was material to the cause of action adjudicated in the proceeding. We will indemnify and advance expenses to our directors and officers to the maximum extent permitted by the Maryland General Corporation Law and we are permitted to purchase and maintain insurance or provide similar protection on behalf of any directors, officers, employees and agents, against any liability asserted which was incurred in any such capacity with us or arising out of such status.
Risks Relating to the Market for our Common Stock
The percentage of ownership of any of our common stockholders may be diluted if we issue new shares of common stock.
Stockholders have no rights to buy additional shares of stock if we issue new shares of stock. We may issue common stock, convertible debt or preferred stock pursuant to a public offering or a private placement, to sellers of properties we directly or indirectly acquire instead of, or in addition to, cash consideration. Because our decision to issue securities in any future offering will depend on market conditions and other factors beyond our control, we cannot predict or estimate the amount, timing or nature of our future offerings. Any of our common stockholders who do not participate in any future stock issuances will experience dilution in the percentage of the issued and outstanding stock they own.
Sales of our common stock, or the perception that such sales will occur, may have adverse effects on our share price.
We cannot predict the effect, if any, of future sales of common stock, or the availability of shares for future sales, on the market price of our common stock. Sales of substantial amounts of common stock, including shares of common stock issuable upon the exchange of units of our operating partnership, IROP, that we may issue from time to time, the sale of shares of common stock held by our current stockholders and the sale of any shares we may issue under our long-term incentive plan, or the perception that these sales could occur, may adversely affect prevailing market prices for our common stock.
An increase in market interest rates may have an adverse effect on the market price of our common stock.
One of the factors that investors may consider in deciding whether to buy or sell our common stock is our distribution yield, which is our distribution rate as a percentage of our share price, relative to market interest rates. If market interest rates increase, prospective investors may desire a higher distribution yield on our common stock or may seek securities paying higher dividends or interest. The market price of our common stock likely will be based primarily on the earnings that we derive from rental income with respect to our properties and our related distributions to stockholders, and not from the underlying appraised value of the properties themselves. As a result, interest rate fluctuations and capital market conditions are likely to affect the market price of our common stock, and such effects could be significant. For example, if interest rates rise without an increase in our distribution rate, the market price of our common stock could decrease because potential investors may require a higher distribution yield on our common stock as market rates on interest-bearing securities, such as bonds, rise.
Some of our distributions may include a return of capital for U.S. federal income tax purposes.
Some of our distributions may include a return of capital. To the extent that we decide to make distributions in excess of our current and accumulated earnings and profits, such distributions would generally be considered a return of capital for U.S. federal income tax purposes to the extent of the holder’s adjusted tax basis in its shares, and thereafter as gain on a sale or exchange of such shares.
Future issuances of debt securities, which would rank senior to our common stock upon liquidation, or future issuances of preferred equity securities, may adversely affect the trading price of our common stock.
In the future, we may issue debt or equity securities or incur other borrowings. Upon our liquidation, holders of our debt securities, other loans and preferred stock will receive a distribution of our available assets before common stockholders. Any
28
preferred stock, if issued, likely will also have a preference on periodic distribution payments, which could eliminate or otherwise limit our ability to make distributions to common stockholders. Common stockholders bear the risk that our future issuances of debt or equity securities or our incurrence of other borrowings may negatively affect the trading price of our common stock.
The market prices for our common stock may be volatile.
The prices at which our common stock may sell in the public market may be volatile. Fluctuations in the market prices of our common stock may not be correlated in a predictable way to our performance or operating results. The prices at which our common stock trade may fluctuate as a result of factors that are beyond our control or unrelated to our performance or operating results.
We have not established a minimum dividend payment level and we cannot assure you of our ability to pay dividends in the future or the amount of any dividends.
Our board of directors will determine the amount and timing of distributions. In making this determination, our directors will consider all relevant factors, including REIT minimum distribution requirements, the amount of core FFO, restrictions under Maryland law, capital expenditures and reserve requirements and general operational requirements. We cannot assure you that we will be able to make distributions in the future or in amounts similar to our past distributions. We may need to fund distributions through borrowings, returning capital or selling assets, which may be available only at commercially unattractive terms, if at all. Any of the foregoing could adversely affect the market price of our common stock.
None.
29
We hold fee title to all of the apartment properties in our portfolio. The following table presents an overview of our portfolio as of December 31, 2017.
|
|
|
|
|
|
|
|
|
|
|
|
|
|
|
|
|
|
|
|
|
|
|
|
|
|
||||||||||||
|
Property Name |
|
Location |
|
Acquisition Date |
|
Year Built / Renovated (a) |
|
|
Gross Cost |
|
|
Accumulated Depreciation |
|
|
Net Book Value |
|
|
Units (b) |
|
|
Period End Occupancy (c) |
|
|
Average Occupancy (d) |
|
|
Average Effective Rent per Occupied Unit (e) |
|
||||||||
|
Crestmont |
|
Marietta, GA |
|
4/29/2011 |
|
2010 (f) |
|
|
|
17,556 |
|
|
|
(3,800 |
) |
|
|
13,756 |
|
|
|
228 |
|
|
95.2% |
|
|
95.7% |
|
|
|
945 |
|
|||
|
Runaway Bay |
|
Indianapolis, IN |
|
10/11/2012 |
|
|
2002 |
|
|
|
16,266 |
|
|
|
(1,998 |
) |
|
|
14,268 |
|
|
|
192 |
|
|
94.8% |
|
|
94.7% |
|
|
|
1,008 |
|
||
|
Reserve at Eagle Ridge |
|
Waukegan, IL |
|
1/31/2014 |
|
|
2008 |
|
|
|
29,451 |
|
|
|
(2,484 |
) |
|
|
26,967 |
|
|
|
370 |
|
|
92.7% |
|
|
94.2% |
|
|
|
1,014 |
|
||
|
Windrush |
|
Edmond, OK |
|
2/28/2014 |
|
|
2011 |
|
|
|
9,593 |
|
|
|
(843 |
) |
|
|
8,750 |
|
|
|
160 |
|
|
91.3% |
|
|
89.0% |
|
|
|
759 |
|
||
|
Heritage Park |
|
Oklahoma City, OK |
|
2/28/2014 |
|
|
2011 |
|
|
|
17,794 |
|
|
|
(1,584 |
) |
|
|
16,210 |
|
|
|
453 |
|
|
93.4% |
|
|
92.4% |
|
|
|
645 |
|
||
|
Raindance |
|
Oklahoma City, OK |
|
2/28/2014 |
|
|
2011 |
|
|
|
14,741 |
|
|
|
(1,311 |
) |
|
|
13,430 |
|
|
|
504 |
|
|
96.8% |
|
|
94.7% |
|
|
|
545 |
|
||
|
Augusta |
|
Oklahoma City, OK |
|
2/28/2014 |
|
|
2011 |
|
|
|
11,845 |
|
|
|
(1,143 |
) |
|
|
10,702 |
|
|
|
197 |
|
|
91.9% |
|
|
93.5% |
|
|
|
726 |
|
||
|
Invitational |
|
Oklahoma City, OK |
|
2/28/2014 |
|
|
2011 |
|
|
|
19,644 |
|
|
|
(1,901 |
) |
|
|
17,743 |
|
|
|
344 |
|
|
92.4% |
|
|
93.0% |
|
|
|
665 |
|
||
|
King's Landing |
|
Creve Coeur, MO |
|
3/31/2014 |
|
|
2005 |
|
|
|
32,987 |
|
|
|
(2,914 |
) |
|
|
30,073 |
|
|
|
152 |
|
|
90.8% |
|
|
90.8% |
|
|
|
1,623 |
|
||
|
Carrington Park |
|
Little Rock, AR |
|
5/7/2014 |
|
|
1999 |
|
|
|
22,449 |
|
|
|
(2,090 |
) |
|
|
20,359 |
|
|
|
202 |
|
|
95.0% |
|
|
93.9% |
|
|
|
1,046 |
|
||
|
Arbors at the Reservoir |
|
Ridgeland, MS |
|
6/4/2014 |
|
|
2000 |
|
|
|
21,130 |
|
|
|
(1,780 |
) |
|
|
19,350 |
|
|
|
170 |
|
|
92.9% |
|
|
95.0% |
|
|
|
1,138 |
|
||
|
Walnut Hill |
|
Cordova, TN |
|
8/28/2014 |
|
|
2001 |
|
|
|
28,393 |
|
|
|
(2,400 |
) |
|
|
25,993 |
|
|
|
362 |
|
|
96.7% |
|
|
96.3% |
|
|
|
968 |
|
||
|
Lenoxplace |
|
Raleigh, NC |
|
9/5/2014 |
|
|
2012 |
|
|
|
24,644 |
|
|
|
(1,880 |
) |
|
|
22,764 |
|
|
|
268 |
|
|
95.9% |
|
|
96.7% |
|
|
|
937 |
|
||
|
Stonebridge Crossing |
|
Cordova, TN |
|
9/15/2014 |
|
|
1994 |
|
|
|
30,679 |
|
|
|
(2,479 |
) |
|
|
28,200 |
|
|
|
500 |
|
|
95.4% |
|
|
95.2% |
|
|
|
829 |
|
||
|
Bennington Pond |
|
Groveport, OH |
|
11/24/2014 |
|
|
2000 |
|
|
|
18,047 |
|
|
|
(1,375 |
) |
|
|
16,672 |
|
|
|
240 |
|
|
95.8% |
|
|
96.3% |
|
|
|
897 |
|
||
|
Prospect Park |
|
Louisville, KY |
|
12/8/2014 |
|
|
1990 |
|
|
|
14,316 |
|
|
|
(911 |
) |
|
|
13,405 |
|
|
|
138 |
|
|
93.5% |
|
|
92.5% |
|
|
|
940 |
|
||
|
Brookside |
|
Louisville, KY |
|
12/8/2014 |
|
|
1987 |
|
|
|
21,041 |
|
|
|
(1,380 |
) |
|
|
19,661 |
|
|
|
224 |
|
|
95.5% |
|
|
95.7% |
|
|
|
871 |
|
||
|
Jamestown |
|
Louisville, KY |
|
12/8/2014 |
|
1970 (f) |
|
|
|
37,137 |
|
|
|
(2,463 |
) |
|
|
34,674 |
|
|
|
356 |
|
|
92.1% |
|
|
94.7% |
|
|
|
1,040 |
|
|||
|
Oxmoor |
|
Louisville, KY |
|
12/8/2014 |
|
1999-2000 |
|
|
|
55,736 |
|
|
|
(3,854 |
) |
|
|
51,882 |
|
|
|
432 |
|
|
93.1% |
|
|
93.1% |
|
|
|
1,011 |
|
|||
|
Meadows |
|
Louisville, KY |
|
12/8/2014 |
|
|
1988 |
|
|
|
38,224 |
|
|
|
(2,528 |
) |
|
|
35,696 |
|
|
|
400 |
|
|
93.8% |
|
|
93.1% |
|
|
|
838 |
|
||
|
Stonebridge at the Ranch |
|
Little Rock, AR |
|
12/16/2014 |
|
|
2005 |
|
|
|
31,990 |
|
|
|
(2,213 |
) |
|
|
29,777 |
|
|
|
260 |
|
|
94.6% |
|
|
94.0% |
|
|
|
942 |
|
||
|
Iron Rock Ranch |
|
Austin, TX |
|
12/30/2014 |
|
2001-2002 |
|
|
|
35,590 |
|
|
|
(2,384 |
) |
|
|
33,206 |
|
|
|
300 |
|
|
94.3% |
|
|
93.8% |
|
|
|
1,275 |
|
|||
|
Bayview Club |
|
Indianapolis, IN |
|
5/1/2015 |
|
|
2004 |
|
|
|
26,020 |
|
|
|
(1,638 |
) |
|
|
24,382 |
|
|
|
236 |
|
|
92.4% |
|
|
95.7% |
|
|
|
994 |
|
||
|
Arbors River Oaks |
|
Memphis, TN |
|
9/17/2015 |
|
2010 (f) |
|
|
|
21,934 |
|
|
|
(1,228 |
) |
|
|
20,706 |
|
|
|
191 |
|
|
96.9% |
|
|
97.6% |
|
|
|
1,243 |
|
|||
|
Aston |
|
Wake Forest, NC |
|
9/17/2015 |
|
|
2013 |
|
|
|
38,005 |
|
|
|
(1,970 |
) |
|
|
36,035 |
|
|
|
288 |
|
|
95.1% |
|
|
95.7% |
|
|
|
1,084 |
|
||
|
Avenues at Craig Ranch |
|
McKinneuy, TX |
|
9/17/2015 |
|
|
2013 |
|
|
|
47,813 |
|
|
|
(2,413 |
) |
|
|
45,400 |
|
|
|
334 |
|
|
96.7% |
|
|
94.4% |
|
|
|
1,273 |
|
||
|
Bridge Pointe |
|
Huntsville, AL |
|
9/17/2015 |
|
|
2002 |
|
|
|
16,125 |
|
|
|
(860 |
) |
|
|
15,265 |
|
|
|
178 |
|
|
95.5% |
|
|
96.5% |
|
|
|
860 |
|
||
|
Creekstone at RTP |
|
Durham, NC |
|
9/17/2015 |
|
|
2013 |
|
|
|
38,350 |
|
|
|
(1,887 |
) |
|
|
36,463 |
|
|
|
256 |
|
|
96.5% |
|
|
94.5% |
|
|
|
1,200 |
|
||
|
Fountains Southend |
|
Charlotte, NC |
|
9/17/2015 |
|
|
2013 |
|
|
|
41,764 |
|
|
|
(2,118 |
) |
|
|
39,646 |
|
|
|
208 |
|
|
91.3% |
|
|
93.3% |
|
|
|
1,442 |
|
||
|
Fox Trails |
|
Plano, TX |
|
9/17/2015 |
|
|
1981 |
|
|
|
28,313 |
|
|
|
(1,356 |
) |
|
|
26,957 |
|
|
|
286 |
|
|
96.9% |
|
|
95.6% |
|
|
|
1,067 |
|
||
|
Lakeshore on the Hill |
|
Chattanooga, TN |
|
9/17/2015 |
|
|
2015 |
|
|
|
11,509 |
|
|
|
(634 |
) |
|
|
10,875 |
|
|
|
123 |
|
|
97.6% |
|
|
96.6% |
|
|
|
971 |
|
||
|
Millenia 700 |
|
Orlando, FL |
|
9/17/2015 |
|
|
2012 |
|
|
|
47,653 |
|
|
|
(2,403 |
) |
|
|
45,250 |
|
|
|
297 |
|
|
97.0% |
|
|
96.1% |
|
|
|
1,386 |
|
||
|
Miller Creek at German Town |
|
Memphis, TN |
|
9/17/2015 |
|
|
2013 |
|
|
|
57,048 |
|
|
|
(3,048 |
) |
|
|
54,000 |
|
|
|
330 |
|
|
95.5% |
|
|
96.5% |
|
|
|
1,238 |
|
||
|
Pointe at Canyon Ridge |
|
Atlanta, GA |
|
9/17/2015 |
|
2007 (f) |
|
|
|
49,950 |
|
|
|
(2,341 |
) |
|
|
47,609 |
|
|
|
494 |
|
|
96.8% |
|
|
96.0% |
|
|
|
993 |
|
|||
|
St James at Goose Creek |
|
Goose Creek, SC |
|
9/17/2015 |
|
|
2009 |
|
|
|
31,865 |
|
|
|
(1,661 |
) |
|
|
30,204 |
|
|
|
244 |
|
|
93.9% |
|
|
94.6% |
|
|
|
1,125 |
|
||
|
Talison Row at Daniel Island |
|
Daniel Island, SC |
|
9/17/2015 |
|
|
2013 |
|
|
|
47,225 |
|
|
|
(2,392 |
) |
|
|
44,833 |
|
|
|
274 |
|
|
96.4% |
|
|
95.3% |
|
|
|
1,463 |
|
||
|
The Aventine Greenville |
|
Greenville, SC |
|
9/17/2015 |
|
|
2013 |
|
|
|
48,233 |
|
|
|
(2,488 |
) |
|
|
45,745 |
|
|
|
346 |
|
|
92.5% |
|
|
93.5% |
|
|
|
1,094 |
|
||
|
Trails at Signal Mountain |
|
Chattanooga, TN |
|
9/17/2015 |
|
|
2015 |
|
|
|
14,498 |
|
|
|
(806 |
) |
|
|
13,692 |
|
|
|
172 |
|
|
98.3% |
|
|
95.9% |
|
|
|
951 |
|
||
|
Vue at Knoll Trail |
|
Dallas, TX |
|
9/17/2015 |
|
|
2015 |
|
|
|
9,355 |
|
|
|
(377 |
) |
|
|
8,978 |
|
|
|
114 |
|
|
96.5% |
|
|
96.2% |
|
|
|
927 |
|
||
|
Waterstone at Brier Creek |
|
Raleigh, NC |
|
9/17/2015 |
|
|
2014 |
|
|
|
39,035 |
|
|
|
(1,985 |
) |
|
|
37,050 |
|
|
|
232 |
|
|
94.0% |
|
|
95.0% |
|
|
|
1,260 |
|
||
|
Waterstone Big Creek |
|
Alpharetta, GA |
|
9/17/2015 |
|
|
2014 |
|
|
|
69,758 |
|
|
|
(3,518 |
) |
|
|
66,240 |
|
|
|
370 |
|
|
97.3% |
|
|
95.9% |
|
|
|
1,386 |
|
||
|
Westmont Commons |
|
Asheville, NC |
|
9/17/2015 |
|
2003, 2008 |
|
|
|
28,319 |
|
|
|
(1,493 |
) |
|
|
26,826 |
|
|
|
252 |
|
|
97.2% |
|
|
96.0% |
|
|
|
1,065 |
|
|||
|
Lakes of Northdale |
|
Tampa, FL |
|
2/27/2017 |
|
|
2016 |
|
|
|
29,867 |
|
|
|
(546 |
) |
|
|
29,321 |
|
|
|
216 |
|
|
91.2% |
|
|
92.5% |
|
|
|
1,208 |
|
||
|
Haverford Place |
|
Lexington, KY |
|
5/24/2017 |
|
2001 (f) |
|
|
|
14,382 |
|
|
|
(158 |
) |
|
|
14,224 |
|
|
|
160 |
|
|
91.9% |
|
|
92.9% |
|
|
|
913 |
|
|||
|
South Terrace |
|
Durham, NC |
|
6/30/2017 |
|
2002 (f) |
|
|
|
42,710 |
|
|
|
(467 |
) |
|
|
42,243 |
|
|
|
328 |
|
|
89.9% |
|
|
95.0% |
|
|
|
1,090 |
|
|||
|
Cherry Grove |
|
North Myrtle Beach, SC |
|
9/26/2017 |
|
|
2001 |
|
|
|
15,943 |
|
|
|
(96 |
) |
|
|
15,847 |
|
|
|
172 |
|
|
98.3% |
|
|
99.1% |
|
|
|
946 |
|
||
|
Kensington Commons |
|
Canal Winchester, OH |
|
9/26/2017 |
|
|
2004 |
|
|
|
24,124 |
|
|
|
(130 |
) |
|
|
23,994 |
|
|
|
264 |
|
|
97.7% |
|
|
97.4% |
|
|
|
882 |
|
||
|
Schirm Farms |
|
Canal Winchester, OH |
|
9/26/2017 |
|
|
2002 |
|
|
|
23,486 |
|
|
|
(122 |
) |
|
|
23,364 |
|
|
|
264 |
|
|
95.8% |
|
|
96.9% |
|
|
|
846 |
|
||
|
Riverchase |
|
Indianapolis, IN |
|
9/26/2017 |
|
|
2000 |
|
|
|
18,727 |
|
|
|
(108 |
) |
|
|
18,619 |
|
|
|
216 |
|
|
89.8% |
|
|
90.5% |
|
|
|
814 |
|
||
|
Live Oak Trace |
|
Baton Rouge, LA |
|
10/25/2017 |
|
|
2002 |
|
|
|
28,431 |
|
|
|
(114 |
) |
|
|
28,317 |
|
|
|
264 |
|
|
60.6% |
|
|
61.5% |
|
|
|
916 |
|
||
|
Tides at Calabash |
|
Wilmington, NC |
|
11/14/2017 |
|
|
2010 |
|
|
|
14,097 |
|
|
|
(25 |
) |
|
|
14,072 |
|
|
|
168 |
|
|
91.7% |
|
|
92.0% |
|
|
|
846 |
|
||
|
Brunswick Point |
|
Wilmington, NC |
|
12/12/2017 |
|
|
2005 |
|
|
|
30,364 |
|
|
|
- |
|
|
|
30,364 |
|
|
|
288 |
|
|
93.1% |
|
|
93.1% |
|
|
|
795 |
|
||
|
TOTAL |
|
|
|
|
|
|
|
|
|
$ |
1,504,156 |
|
|
$ |
(84,097 |
) |
|
$ |
1,420,059 |
|
|
|
14,017 |
|
|
94.0% |
|
|
94.1% |
|
|
$ |
1,006 |
|
||
|
|
(a) |
All dates are for the later of the year in which construction was completed or the year in which a significant renovation program was completed. |
|
|
(b) |
Units represent the total number of apartment units available for rent at December 31, 2017. |
|
|
(c) |
Physical occupancy for each of our properties is calculated as (i) total units rented as of December 31, 2017 divided by (ii) total units available as of December 31, 2017, expressed as a percentage. |
|
|
(d) |
Average occupancy represents the daily average occupied units for the three-month period ended December 31, 2017. |
|
|
(e) |
Average effective monthly rent, per unit, represents the average monthly rent for all occupied units for the three-month period ended December 31, 2017. |
|
|
(f) |
Properties are undergoing renovation. |
Additional information on our consolidated properties is contained in “Schedule III - Real Estate and Accumulated Depreciation” in this Annual Report on Form 10-K, which is incorporated herein by reference.
30
We are subject to various legal proceedings and claims that arise in the ordinary course of our business operations. Matters which arise out of allegations of bodily injury, property damage, and employment practices are generally covered by insurance. While the resolution of these matters cannot be predicted with certainty, we currently believe the final outcome of such matters will not have a material adverse effect on our financial position, results of operations or cash flows.
Not applicable.
|
ITEM 5. |
Market for Registrant’s Common Equity, Related Stockholder Matters and Issuer Purchases of Equity Securities |
Market Price Information
Our common stock is listed and traded on the NYSE under the symbol “IRT”. At the close of business on February 20, 2018, the closing price for our common stock was $8.60 per share and there were 39 holders of record, one of which is the holder for all beneficial owners who hold in street name.
Since our formation, we have sold our common stock in seven public offerings. See Item 1-“Business.” The following table sets forth the range of high and low sales prices of our common stock by quarter in the periods indicated.
|
2016 |
|
|
|
|
|
|
|
|
|
First Quarter (January 1, 2016 through March 31, 2016) |
|
$ |
7.78 |
|
|
$ |
5.97 |
|
|
Second Quarter (April 1, 2016 through June 30, 2016) |
|
$ |
8.21 |
|
|
$ |
6.75 |
|
|
Third Quarter (July 1, 2016 through September 30, 2016) |
|
$ |
10.70 |
|
|
$ |
8.05 |
|
|
Fourth Quarter (October 1, 2016 through December 31, 2016) |
|
$ |
9.15 |
|
|
$ |
7.74 |
|
|
2017 |
|
|
|
|
|
|
|
|
|
First Quarter (January 1, 2017 through March 31, 2017) |
|
$ |
9.45 |
|
|
$ |
8.57 |
|
|
Second Quarter (April 1, 2017 through June 30, 2017) |
|
$ |
10.13 |
|
|
$ |
8.92 |
|
|
Third Quarter (July 1, 2017 through September 30, 2017) |
|
$ |
10.43 |
|
|
$ |
9.35 |
|
|
Fourth Quarter (October 1, 2017 through December 31, 2017) |
|
$ |
10.63 |
|
|
$ |
9.91 |
|
31
On August 13, 2013, our common stock commenced trading on the NYSE MKT. On July 31, 2017 we transferred the listing of our common stock to the New York Stock Exchange (“NYSE”) from the NYSE MKT. The following graph compares the index of the cumulative total shareholder return on our common shares for the measurement period commencing August 12, 2013 and ending December 31, 2017 with the cumulative total returns of the National Association of Real Estate Investment Trusts (NAREIT) Equity REIT index and the Russell 3000 Index. The following graph assumes that each index was 100 on the initial day of the relevant measurement period and that all dividends were reinvested.
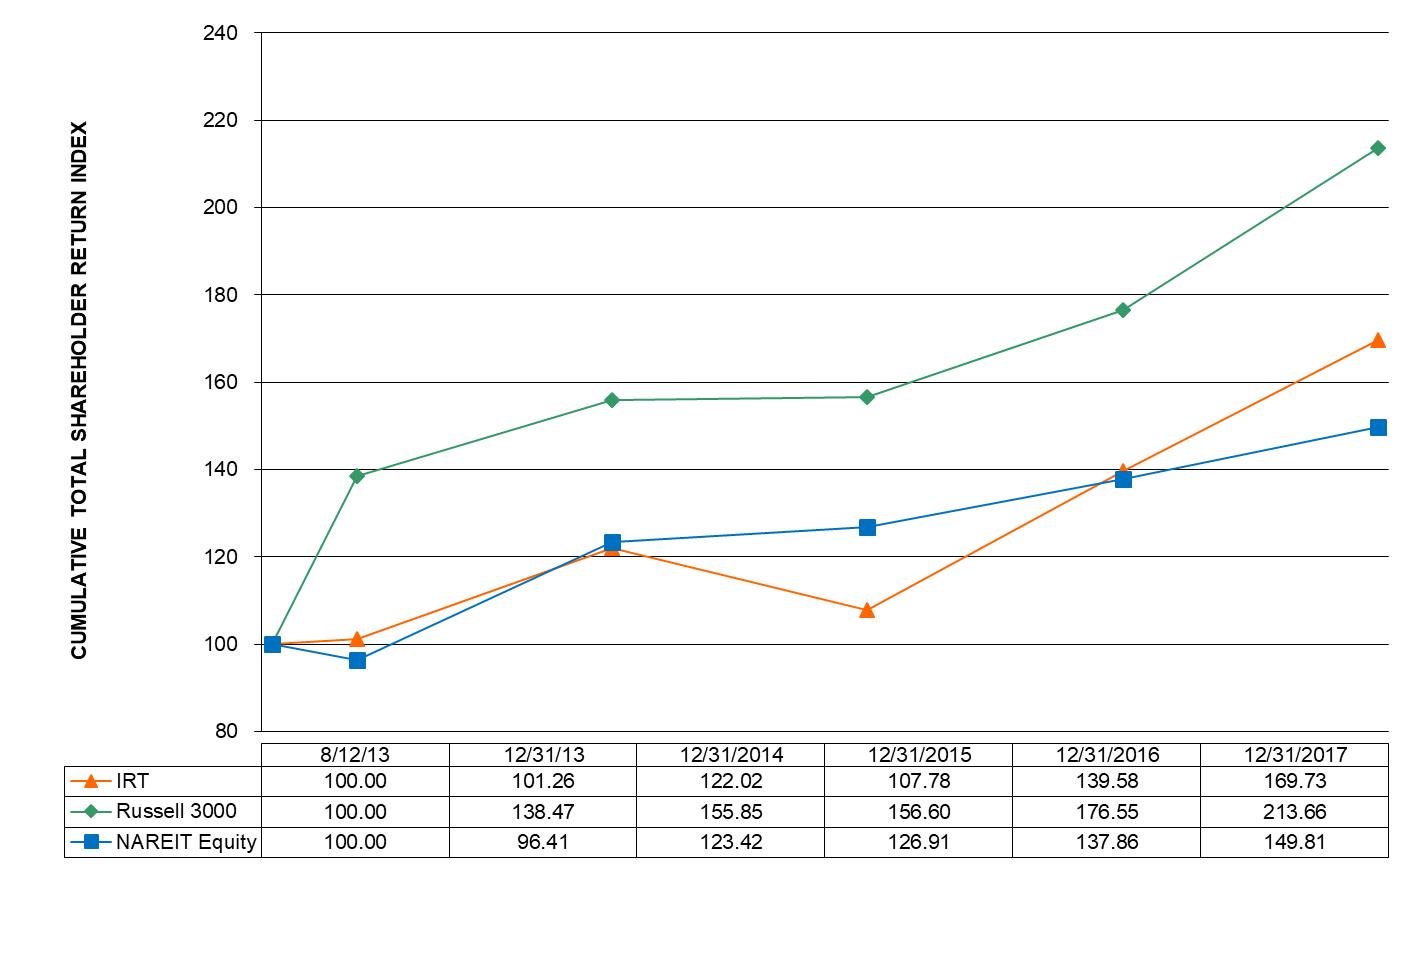
Unregistered Sales of Equity Securities
We have previously disclosed four “UPREIT” transactions completed in May 2014, August 2014, November 2014 and December 2014 wherein IROP, issued, in the aggregate, 1,282,449 common units, or units, to unaffiliated entities or persons in order to acquire properties. In addition, we have previously disclosed that in September 2015, IROP issued 1,925,419 units, plus cash in lieu of fractional TSRE operating partnership units, in a transaction related to the TSRE merger. In June 2017, we issued 166,604 IROP units in connection with our acquisition of South Terrace. All of such issuances were exempt from registration pursuant to Section 4(a)(2) of the Securities Act. As previously disclosed, these units are subject to exchange agreements containing the terms and conditions under which the units could be exchanged for cash in an amount equal to the value of an equivalent number of shares of our common stock as of the date IROP receives contributor’s notice of its desire to exchange the units for cash or, at IROP’s option, for the equivalent number of shares of our common stock. Exchanges have occurred periodically. From May 2015 through December 31, 2017 IROP exchanged 338,818 units for 338,812 shares of our common stock (with fractional units being settled in cash). As a result of these exchanges, at December 31, 2017 and at February 20, 2018, there remained outstanding 3,011,351 units and 2,824,634 units, respectively, held by unaffiliated third parties. The issuance of the shares of our common stock in these exchanges was exempt from registration pursuant to Section 4(a)(2) of the Securities Act and Rule 506 of Regulation D; all of the persons receiving such shares were accredited investors.
Unregistered Purchase of Equity Securities
None.
32
We intend to continue to qualify as a REIT for U.S. federal income tax purposes. The Code generally requires that a REIT annually distribute at least 90% of its REIT taxable income, determined without regard to the deduction for dividends paid and excluding any net capital gain, and imposes a tax on any taxable income retained by a REIT, including capital gains.
To satisfy the requirements for qualification as a REIT and generally not be subject to U.S. federal income and excise tax, we intend to make regular quarterly distributions of all or substantially all of our REIT taxable income, determined without regard to dividends paid, to our stockholders out of assets legally available for such purposes. Our board of directors has not yet determined the rate for our future distributions, and all future distributions will be at the sole discretion of our board of directors. When determining the amount of future distributions, our board of directors considers, among other factors, (i) the amount of cash generated from our operating activities, (ii) our expectations of future cash flows, (iii) our determination of near-term cash needs for acquisitions of new properties, general property capital improvements and debt repayments, (iv) our ability to continue to access additional sources of capital, (v) the requirements of Maryland law, (vi) the amount required to be distributed to maintain our status as a REIT and to reduce any income and excise taxes that we otherwise would be required to pay and (vii) any limitations on our distributions contained in our credit or other agreements.
We cannot assure you that we will generate sufficient cash flows to make distributions to our stockholders or that we will be able to sustain those distributions. If our operations do not generate sufficient cash flow to allow us to satisfy the REIT distribution requirements, we may be required to fund distributions from working capital, borrow funds, sell assets, make taxable distributions of our securities or reduce such distributions. Our distribution policy enables us to review the alternative funding sources available to us from time to time. Our actual results of operations will be affected by a number of factors, including the revenues we receive from our properties, our operating expenses, interest expense, the ability of our tenants to meet their obligations and unanticipated expenditures. For more information regarding risk factors that could materially adversely affect our actual results of operations, please see “Risk Factors.”
For 2016 and 2017 and for the first quarter of 2018, our board established, on a quarterly basis, in advance, the distribution amount for our common stock and for the units for each month in the quarter. The distributions for each month in the three-month period are paid in arrears on or about the fifteenth day following the completion of each respective month. For 2016, and 2017, we declared and paid the following distributions (expressed on a quarterly basis) on our common stock (dollars in thousands except per share and per unit data):
|
|
|
Common Shares |
|
|||||
|
|
|
Dividends Declared and Payable per Share |
|
|
Total Dividends Payable |
|
||
|
2016 |
|
|
|
|
|
|
|
|
|
First Quarter |
|
$ |
0.18 |
|
|
$ |
8,519 |
|
|
Second Quarter |
|
|
0.18 |
|
|
|
8,494 |
|
|
Third Quarter |
|
|
0.18 |
|
|
|
8,499 |
|
|
Fourth Quarter |
|
|
0.18 |
|
|
|
12,368 |
|
|
2017 |
|
|
|
|
|
|
|
|
|
First Quarter |
|
$ |
0.18 |
|
|
$ |
12,377 |
|
|
Second Quarter |
|
|
0.18 |
|
|
|
12,391 |
|
|
Third Quarter |
|
|
0.18 |
|
|
|
13,255 |
|
|
Fourth Quarter |
|
|
0.18 |
|
|
|
15,097 |
|
33
|
|
Operating Partnership Units |
|
||||||
|
|
|
Dividends Declared and Payable per Unit |
|
|
Total Dividends Payable |
|
||
|
2016 |
|
|
|
|
|
|
|
|
|
First Quarter |
|
$ |
0.18 |
|
|
$ |
543 |
|
|
Second Quarter |
|
|
0.18 |
|
|
|
531 |
|
|
Third Quarter |
|
|
0.18 |
|
|
|
527 |
|
|
Fourth Quarter |
|
|
0.18 |
|
|
|
523 |
|
|
2017 |
|
|
|
|
|
|
|
|
|
First Quarter |
|
$ |
0.18 |
|
|
$ |
519 |
|
|
Second Quarter |
|
|
0.18 |
|
|
|
526 |
|
|
Third Quarter |
|
|
0.18 |
|
|
|
536 |
|
|
Fourth Quarter |
|
|
0.18 |
|
|
|
545 |
|
We will transition to a quarterly distribution of cash dividends, effective for the first quarter of 2018.
On August 4, 2017, we entered into an At-the-Market Issuance Sales Agreement (the “ATM Sales Agreement”) with various sales agents. Pursuant to the ATM Sales Agreement, we may offer and sell shares of our common stock, $0.01 par value per share, having an aggregate offering price of up to $150 million, from time to time through the sales agents. The sales agents are entitled to compensation in an agreed amount not to exceed 2.0% of the gross sales price per share for any shares sold from time to time under the ATM Sales Agreement. We have no obligation to sell any of the shares under the ATM Sales Agreement and may at any time suspend solicitations and offers under the ATM Sales Agreement. During the year ended December 31, 2017, 1,164,900 shares were issued at an average price of $10.38 per share resulting in gross proceeds of $12.1 million. We paid commissions of approximately $0.2 million and net proceeds from the issuances were approximately $11.9 million.
Issuer Purchases of Equity Securities
During the quarter ended December 31, 2017 we repurchased 384 shares of our common stock. The table below summarizes this repurchase activity.
|
Period |
|
Total Number of Shares Purchased |
|
|
Average Price Paid per Share |
|
|
Total Number of Shares Purchased as Part of Publicly Announced Plans or Programs |
|
|
Maximum Number (or Approximate Dollar Value) of Shares that May Yet Be Purchased Under the Plans or Programs |
|
||||
|
10/01/2017 to 10/31/2017 |
|
|
384 |
|
(1) |
$ |
10.54 |
|
|
|
- |
|
|
|
0 |
|
|
11/01/2017 to 11/30/2017 |
|
|
- |
|
|
|
- |
|
|
|
- |
|
|
|
- |
|
|
12/01/2017 to 12/31/2017 |
|
|
- |
|
|
|
- |
|
|
|
- |
|
|
|
- |
|
|
Total |
|
|
- |
|
|
$ |
- |
|
|
|
- |
|
|
|
0 |
|
|
(1) |
Represents shares of common stock withheld to cover taxes in connection with the exercise of outstanding SARS. |
34
Equity Compensation Plan Information
The following table sets forth certain information regarding IRT’s equity compensation plans as of December 31, 2017.
|
Plan Category |
(a) Number of Securities to be Issued Upon Exercise of Outstanding Options, Warrants, and Rights |
|
|
(b) Weighted Average Exercise Price of Outstanding Options Warrants, and Rights |
|
|
(c) Number of Securities Remaining Available for Future Issuance Under Equity Compensation Plans (Excluding Securities Reflected in Column(a)) |
|
|
|||
|
Equity compensation plans approved by security holders |
|
250,000 |
|
(1) |
$ |
9.28 |
|
|
|
3,439,073 |
|
(2) |
|
Equity compensation plans not approved by security holders |
|
- |
|
|
n/a |
|
|
|
- |
|
|
|
|
Total |
|
250,000 |
|
(1) |
|
|
|
|
|
3,439,073 |
|
(2) |
|
(1) |
Includes 250,000 shares of our common stock underlying SARs outstanding under the incentive award plan at December 31, 2017, or the outstanding SARs. This is the gross number of shares of our common stock with respect to which the SARs are exercisable, not the net number of such shares which would actually be issued upon any exercise. Excludes 295,847 restricted common stock awards that remained subject to forfeiture at December 31, 2017 because they are neither to be issued upon exercise of outstanding options, warrants and rights nor available for future issuance. |
|
(2) |
Assumes the reduction of the number of shares of our common stock remaining issuable under the LTIP at December 31, 2017 by the number of shares of our common stock reported in column (a). |
35
The following table summarizes selected financial data about our company (dollars in thousands, except share and per share data). The following selected financial data information should be read in conjunction with Item 7, “Management’s Discussion and Analysis of Financial Condition and Results of Operations,” and our consolidated financial statements, including the notes thereto, included elsewhere herein.
|
|
|
As of and for the Years Ended December 31 |
|
|||||||||||||||||
|
|
|
2017 |
|
|
2016 |
|
|
2015 |
|
|
2014 |
|
|
2013 |
|
|||||
|
Operating Data: |
|
|
|
|
|
|
|
|
|
|
|
|
|
|
|
|
|
|
|
|
|
Total revenue |
|
$ |
161,216 |
|
|
$ |
153,388 |
|
|
$ |
109,576 |
|
|
$ |
49,171 |
|
|
$ |
19,943 |
|
|
Property operating expenses |
|
|
(64,716 |
) |
|
|
(63,148 |
) |
|
|
(46,281 |
) |
|
|
(21,636 |
) |
|
|
(8,643 |
) |
|
Total expenses |
|
|
(115,791 |
) |
|
|
(113,726 |
) |
|
|
(99,394 |
) |
|
|
(40,630 |
) |
|
|
(15,010 |
) |
|
Interest expense |
|
|
(28,702 |
) |
|
|
(35,535 |
) |
|
|
(23,553 |
) |
|
|
(8,496 |
) |
|
|
(3,659 |
) |
|
Net income (loss) |
|
|
31,441 |
|
|
|
(9,555 |
) |
|
|
30,156 |
|
|
|
2,944 |
|
|
|
1,274 |
|
|
Net income (loss) allocable to common shares |
|
|
30,206 |
|
|
|
(9,801 |
) |
|
|
28,242 |
|
|
|
2,940 |
|
|
|
615 |
|
|
Earnings (loss) per share: |
|
|
|
|
|
|
|
|
|
|
|
|
|
|
|
|
|
|
|
|
|
Basic |
|
$ |
0.41 |
|
|
$ |
(0.19 |
) |
|
$ |
0.78 |
|
|
$ |
0.14 |
|
|
$ |
0.12 |
|
|
Diluted |
|
$ |
0.41 |
|
|
$ |
(0.19 |
) |
|
$ |
0.78 |
|
|
$ |
0.14 |
|
|
$ |
0.12 |
|
|
Balance Sheet Data: |
|
|
|
|
|
|
|
|
|
|
|
|
|
|
|
|
|
|
|
|
|
Investments in real estate, net |
|
$ |
1,420,059 |
|
|
$ |
1,197,845 |
|
|
$ |
1,332,377 |
|
|
$ |
665,736 |
|
|
$ |
174,321 |
|
|
Total assets |
|
|
1,450,624 |
|
|
|
1,294,237 |
|
|
|
1,383,188 |
|
|
|
694,150 |
|
|
|
181,871 |
|
|
Total indebtedness, net |
|
|
778,442 |
|
|
|
743,817 |
|
|
|
966,611 |
|
|
|
418,901 |
|
|
|
103,303 |
|
|
Total liabilities |
|
|
804,505 |
|
|
|
765,546 |
|
|
|
993,158 |
|
|
|
431,116 |
|
|
|
106,963 |
|
|
Total equity |
|
|
646,119 |
|
|
|
528,691 |
|
|
|
390,030 |
|
|
|
263,034 |
|
|
|
74,908 |
|
|
|
|
As of and for the years ended December 31 |
|
|||||||||||||||||
|
|
|
2017 |
|
|
2016 |
|
|
2015 |
|
|
2014 |
|
|
2013 |
|
|||||
|
Other Data: |
|
|
|
|
|
|
|
|
|
|
|
|
|
|
|
|
|
|
|
|
|
Property portfolio occupancy |
|
|
94.0 |
% |
|
|
94.5 |
% |
|
|
93.0 |
% |
|
|
92.7 |
% |
|
|
94.5 |
% |
|
Common shares outstanding |
|
|
84,708,551 |
|
|
|
68,996,070 |
|
|
|
47,070,678 |
|
|
|
31,800,076 |
|
|
|
9,652,540 |
|
|
Limited partnership units outstanding (1) |
|
|
3,011,351 |
|
|
|
2,908,949 |
|
|
|
3,154,931 |
|
|
|
1,282,449 |
|
|
|
— |
|
|
Cash distributions declared per common share/unit |
|
$ |
0.7200 |
|
|
$ |
0.7200 |
|
|
$ |
0.7200 |
|
|
$ |
0.7200 |
|
|
$ |
0.6263 |
|
|
|
(1) |
Held by persons other than IRT and its subsidiaries. |
Forward-Looking Statements
The Securities and Exchange Commission, or SEC, encourages companies to disclose forward-looking information so that investors can better understand a company’s future prospects and make informed investment decisions. This report contains or incorporates by reference such “forward-looking statements” within the meaning of Section 27A of the Securities Act of 1933, as amended, or Securities Act, and Section 21E of the Securities Exchange Act of 1934, as amended, or Exchange Act.
Words such as “anticipates,” “estimates,” “expects,” “projects,” “intends,” “plans,” “believes” and words and terms of similar substance used in connection with any discussion of future operating or financial performance identify forward-looking statements. As used herein, the terms “we,” “our” and “us” refer to Independence Realty Trust, Inc., which we refer to as IRT, and, as required by context, Independence Realty Operating Partnership, LP, which we refer to as IROP, and their subsidiaries.
We claim the protection of the safe harbor for forward-looking statements provided in the Private Securities Litigation Reform Act of 1995. These statements may be made directly in this report and they may also be incorporated by reference in this report to other documents filed with the SEC, and include, but are not limited to, statements about future financial and operating results and performance, statements about our plans, objectives, expectations and intentions with respect to future operations, products and
36
services, and other statements that are not historical facts. These forward-looking statements are based upon the current beliefs and expectations of our management and are inherently subject to significant business, economic and competitive uncertainties and contingencies, many of which are difficult to predict and generally beyond our control. In addition, these forward-looking statements are subject to assumptions with respect to future business strategies and decisions that are subject to change. Actual results may differ materially from the anticipated results discussed in these forward-looking statements.
The risk factors discussed and identified in Item 1A of this report and in our other public filings with the SEC, among others, could cause actual results to differ materially from the anticipated results or other expectations expressed in the forward-looking statements. We caution you not to place undue reliance on these forward-looking statements, which speak only as of the date of this report. All subsequent written and oral forward-looking statements attributable to us or any person acting on our behalf are expressly qualified in their entirety by the cautionary statements contained or referred to in this section. Except to the extent required by applicable law or regulation, we undertake no obligation to update these forward-looking statements to reflect events or circumstances after the date of this report or to reflect the occurrence of unanticipated events.
Overview
General
We are a Maryland corporation that owns and operates multifamily apartment properties across non-gateway U.S. markets, including Louisville, Memphis, Atlanta and Raleigh. Our investment strategy is focused on gaining scale within key amenity rich submarkets that offer good school districts, high-quality retail and major employment centers. We aim to provide stockholders attractive risk-adjusted returns through diligent portfolio management, strong operational performance, and a consistent return of capital through distributions and capital appreciation. We elected to be taxed as a REIT under the Internal Revenue Code of 1986, as amended, or the Code, commencing with our taxable year ended December 31, 2011.
We seek to acquire and operate apartment properties that:
|
|
• |
have stable occupancy; |
|
|
• |
are located in submarkets that we do not expect will experience substantial new apartment construction in the foreseeable future; |
|
|
• |
in appropriate circumstances, present opportunities for repositioning or updating through capital expenditures and in turn for increased rents; and |
|
|
• |
present opportunities to apply tailored marketing and management strategies to attract and retain residents and enable rent increases. |
We continue our focus on maximizing internal growth opportunities, including value add projects, capital recycling opportunities and the ability to raise rental rates and manage expenses to increase net operating income at our communities. We have one reportable segment in that we own, operate, manage and acquire apartment communities.
2017 was a transformative year for IRT as we continued to execute on our long-term strategic plan, acquiring 10 properties, totaling 2,340 units, for $243.6 million; refinancing our line of credit into a longer term and more flexible financing arrangement; reducing our overall leverage; recycling capital out of our class C assets and into class B assets; and reducing the effect of debt maturities and interest rates through long term loans and interest rate derivatives.
37
Trends That May Affect Our Business
The following trends may affect our business:
Positive Economic and Demographic Characteristics. We expect economic conditions and demographic characteristics to remain favorable for our investment strategy focused on owning apartment properties for the foreseeable future across our markets for the following reasons:
|
|
• |
Positive Demographic Factors. We believe demand for rental housing will remain strong as a result of a strengthening job market and positive household formation growth. Over the past few years, population growth in our markets has grown at a higher rate than the U.S overall. |
|
|
• |
Low Homeownership. While both owner and rental sectors benefit from the growth in households, the rental sector is benefiting more from this trend due to the declining homeownership rate. A contributing factor is that homeownership affordability remains challenging for many households, especially for many first-time buyers. |
|
|
• |
Limited New Supply. Notwithstanding an increase in apartment completions across the broader apartment market, national vacancy rates remain close to historic lows. The majority of new supply remains focused on primary markets. IRT’s markets have outperformed both the regional and national markets in terms of their ability to absorb new deliveries. |
Strong Employment Outlook. We believe the broader economic trends across the United States, including the Tax Cuts and Jobs Act signed in 2017, will benefit job growth for the foreseeable future.
Market Trends. We continue to believe that the Class B apartment market offers the most opportunity to consistently increase rents and is much less likely to be impacted from construction of new apartment supply. We also believe that the Class B apartment sector has much less exposure to home ownership as we see far fewer move outs due to home purchases in our Class B portfolio as compared to our Class A portfolio. We are experiencing some challenges in a few of our markets where new apartment properties are being delivered, impacting our occupancy and ability to drive rents, as some tenants seek out the low rental pricing typically charged by new apartment properties in lease-up. Typically, once this supply pressure abates, occupancies and the ability to push rental rates return.
Interest rate environment. We expect interest rates to rise in 2018 as the United States Federal Reserve targets to achieve its unemployment and inflationary goals. As a result, we expect benchmark rates for lending to rise and eventually, capitalization rates. As of December 31, 2017, all of our debt is effectively fixed rate, using fixed rate mortgages and interest rate derivatives. As a result, we do not expect an increase in our interest expense in 2018 from a rising interest rate environment. However, an increase in capitalization rates may affect the pricing of properties we wish to buy or sell.
38
Year Ended December 31, 2017 Compared to the Year Ended December 31, 2016
|
|
SAME STORE PROPERTIES (a) |
|
NON SAME STORE PROPERTIES |
|
CONSOLIDATED |
|
||||||||||||||||||||||||||||||
|
(Dollars in thousands) |
2017 |
|
2016 |
|
Increase (Decrease) |
|
% Change |
|
2017 |
|
2016 |
|
Increase (Decrease) |
|
% Change |
|
2017 |
|
2016 |
|
Increase (Decrease) |
|
% Change |
|
||||||||||||
|
Revenue: |
|
|
|
|
|
|
|
|
|
|
|
|
|
|
|
|
|
|
|
|
|
|
|
|
|
|
|
|
|
|
|
|
|
|
|
|
|
Rental income |
$ |
129,015 |
|
$ |
124,769 |
|
$ |
4,246 |
|
|
3.4 |
% |
$ |
14,458 |
|
$ |
12,647 |
|
$ |
1,811 |
|
|
14.3 |
% |
$ |
143,473 |
|
$ |
137,416 |
|
$ |
6,057 |
|
|
4.4 |
% |
|
Reimbursement and other income |
|
15,227 |
|
|
14,116 |
|
|
1,111 |
|
|
7.9 |
% |
|
1,797 |
|
|
1,827 |
|
|
(30 |
) |
|
-1.6 |
% |
|
17,024 |
|
|
15,943 |
|
|
1,081 |
|
|
6.8 |
% |
|
Total revenue |
|
144,242 |
|
|
138,885 |
|
|
5,357 |
|
|
3.9 |
% |
|
16,255 |
|
|
14,474 |
|
|
1,781 |
|
|
12.3 |
% |
|
160,497 |
|
|
153,359 |
|
|
7,138 |
|
|
4.7 |
% |
|
Expenses: |
|
|
|
|
|
|
|
|
|
|
|
|
|
|
|
|
|
|
|
|
|
|
|
|
|
|
|
|
|
|
|
|
|
|
|
|
|
Real estate operating expenses |
|
57,515 |
|
|
56,120 |
|
|
1,395 |
|
|
2.5 |
% |
|
7,201 |
|
|
7,028 |
|
|
173 |
|
|
2.5 |
% |
|
64,716 |
|
|
63,148 |
|
|
1,568 |
|
|
2.5 |
% |
|
Net Operating Income |
$ |
86,727 |
|
$ |
82,765 |
|
$ |
3,962 |
|
|
4.8 |
% |
$ |
9,054 |
|
$ |
7,446 |
|
$ |
1,608 |
|
|
21.6 |
% |
$ |
95,781 |
|
$ |
90,211 |
|
$ |
5,570 |
|
|
6.2 |
% |
|
|
|
|
|
|
|
|
|
|
|
|
|
|
|
|
|
|
|
|
|
|
|
|
|
|
|
|
|
|
|
|
|
|
|
|
|
|
|
Other Income: |
|
|
|
|
|
|
|
|
|
|
|
|
|
|||||||||||||||||||||||
|
Property management |
|
|
719 |
|
|
29 |
|
|
690 |
|
- |
|
||||||||||||||||||||||||
|
Total other income |
|
|
719 |
|
|
29 |
|
|
690 |
|
- |
|
||||||||||||||||||||||||
|
Corporate and other expenses: |
|
|
|
|
|
|
|
|
|
|
|
|
|
|||||||||||||||||||||||
|
Property management expenses |
|
|
6,006 |
|
|
4,847 |
|
|
1,159 |
|
|
23.9 |
% |
|||||||||||||||||||||||
|
General and administrative expenses |
|
|
9,526 |
|
|
10,864 |
|
|
(1,338 |
) |
|
-12.3 |
% |
|||||||||||||||||||||||
|
Acquisition and integration expenses |
|
|
1,342 |
|
|
43 |
|
|
1,299 |
|
- |
|
||||||||||||||||||||||||
|
Depreciation and amortization expense |
|
|
34,201 |
|
|
34,824 |
|
|
(623 |
) |
|
-1.8 |
% |
|||||||||||||||||||||||
|
Total corporate and other expenses |
|
|
51,075 |
|
|
50,578 |
|
|
497 |
|
|
1.0 |
% |
|||||||||||||||||||||||
|
Operating Income (loss) |
|
|
45,425 |
|
|
39,662 |
|
|
5,763 |
|
|
14.5 |
% |
|||||||||||||||||||||||
|
Interest expense |
|
|
(28,702 |
) |
|
(35,535 |
) |
|
6,833 |
|
|
-19.2 |
% |
|||||||||||||||||||||||
|
Interest income |
|
|
89 |
|
|
(4 |
) |
|
93 |
|
- |
|
||||||||||||||||||||||||
|
Net gains (losses) on sale of assets |
|
|
18,825 |
|
|
31,776 |
|
|
(12,951 |
) |
|
-40.8 |
% |
|||||||||||||||||||||||
|
Gains (losses) on extinguishment of debt |
|
|
(572 |
) |
|
(1,210 |
) |
|
638 |
|
|
-52.7 |
% |
|||||||||||||||||||||||
|
Acquisition related debt extinguishment expenses |
|
|
(3,624 |
) |
|
- |
|
|
(3,624 |
) |
- |
|
||||||||||||||||||||||||
|
Management internalization expense |
|
|
- |
|
|
(44,976 |
) |
|
44,976 |
|
|
-100.0 |
% |
|||||||||||||||||||||||
|
Gains (losses) on TSRE merger and property acquisitions |
|
|
- |
|
|
732 |
|
|
(732 |
) |
|
-100.0 |
% |
|||||||||||||||||||||||
|
Net income (loss) |
|
|
31,441 |
|
|
(9,555 |
) |
|
40,996 |
|
|
-429.1 |
% |
|||||||||||||||||||||||
|
(Income) loss allocated to noncontrolling interests |
|
|
(1,235 |
) |
|
(246 |
) |
|
(989 |
) |
|
402.0 |
% |
|||||||||||||||||||||||
|
Net income (loss) available to common shares |
|
$ |
30,206 |
|
$ |
(9,801 |
) |
$ |
40,007 |
|
|
-408.2 |
% |
|||||||||||||||||||||||
|
|
|
|
|
|
|
|
|
|
|
|
|
|
|
|
|
|
|
|
|
|
|
|
|
|
|
|
|
|
|
|
|
|
|
|
|
|
|
(a) |
Same store portfolio consists of 42 properties, which represent 11,677 units. |
Revenue
Rental Income. Rental revenue increased $6.1 million to $143.5 million for the year ended December 31, 2017 from $137.4 million for the year ended December 31, 2016. The increase was primarily attributable to a $4.2 million increase due to improved occupancy and rental rates at our same store properties and a $1.8 million increase in our non-same store portfolio.
Tenant reimbursement and other income. Tenant reimbursement and other income increased $1.1 million to $17.0 million for the year ended December 31, 2017 from $15.9 million for the year ended December 31, 2016. The increase was due to a $1.1 million increase in same store reimbursement and other income attributable to our continued focus on driving non-rental revenue and fee income.
Property management income. Property management income was $0.7 million for the year ended December 31, 2017 compared to $0.0 million for the year ended December 31, 2016. This was due to third party property management income that we received for managing properties on behalf of third parties during the current period. This service did not exist prior to our management internalization in December 2016.
Expenses
Property operating expenses. Property operating expenses increased $1.6 million to $64.7 million for the year ended December 31, 2017 from $63.1 million for the year ended December 31, 2016. The increase was primarily attributable to a $1.4 million increase in real estate operating expense in our same store portfolio.
Property management expenses. Property management expenses increased $1.2 million to $6.0 million for the year ended December 31, 2017 from $4.8 million for the year ended December 31, 2016. This increase coincides with the abovementioned increase in property management income driven by our management internalization. After our management internalization, property management expenses include costs incurred to directly support on-site management. Prior to this, property management expenses included property and construction management fees paid to our former property manager.
39
General and administrative expenses. General and administrative expenses decreased $1.4 million to $9.5 million for the year ended December 31, 2017 from $10.9 million for the year ended December 31, 2016. After our management internalization, general and administrative expenses included office and compensation expenses, including stock-based compensation, for our asset management and corporate employees. Prior to this, general and administrative expenses were mostly comprised of fees paid to our former advisor.
Acquisition and integration expenses. Acquisition and integration expenses were $1.3 million for the year ended December 31, 2017. These expenses primarily related to the acquisition of the HPI Portfolio.
Depreciation and amortization expense. Depreciation and amortization expense decreased $0.6 million to $34.2 million for the year ended December 31, 2017 from $34.8 million for the year ended December 31, 2016. The decrease was primarily attributable to a $3.7 million decrease of amortization expense related to intangible assets in our same store portfolio. This decrease was offset by a $3.2 million increase in depreciation and amortization expense related to our 10 acquisitions in 2017.
Interest expense. Interest expense decreased $6.8 million to $28.7 million for the year ended December 31, 2017 from $35.5 million for the year ended December 31, 2016. The decrease was primarily due to debt reductions in 2016 when our term loan was fully repaid and our credit facility balance decreased by $121.5 million.
Net gains (losses) on sale of assets. During the year ended December 31, 2017, four multi-family properties were sold resulting in gains of $18.8 million.
Gains (losses) on extinguishment of debt. During the year ended December 31, 2017, we recognized a $0.6 million loss on the extinguishment of debt related to the partial extinguishment of our prior secured credit facility. During the year ended December 31, 2016, we recognized a $1.2 million loss on the extinguishment of the debt related to the write-off of the unamortized deferred financing costs associated with debt that was extinguished.
Acquisition related debt extinguishment expenses. Acquisition related debt extinguishment expenses were $3.6 million for the year ended December 31, 2017 due to defeasance related costs incurred in connection with the HPI Portfolio acquisitions.
Management internalization expense. During the year ended December 31, 2016, we recognized a $45.0 million loss due to our management internalization.
40
Year Ended December 31, 2016 Compared to the Year Ended December 31, 2015
|
|
SAME STORE PROPERTIES |
|
NON SAME STORE PROPERTIES |
|
CONSOLIDATED |
|
||||||||||||||||||||||||||||||
|
2016 |
|
2015 |
|
Increase (Decrease) |
|
% Change |
|
2016 |
|
2015 |
|
Increase (Decrease) |
|
% Change |
|
2016 |
|
2015 |
|
Increase (Decrease) |
|
% Change |
|
|||||||||||||
|
Revenue: |
|
|
|
|
|
|
|
|
|
|
|
|
|
|
|
|
|
|
|
|
|
|
|
|
|
|
|
|
|
|
|
|
|
|
|
|
|
Rental income |
$ |
60,485 |
|
$ |
58,765 |
|
$ |
1,720 |
|
|
2.9 |
% |
$ |
76,931 |
|
$ |
39,451 |
|
$ |
37,480 |
|
|
95.0 |
% |
$ |
137,416 |
|
$ |
98,216 |
|
$ |
39,200 |
|
|
39.9 |
% |
|
Reimbursement and other income |
|
7,126 |
|
|
6,744 |
|
|
382 |
|
|
5.7 |
% |
|
8,817 |
|
|
4,616 |
|
|
4,201 |
|
|
91.0 |
% |
|
15,943 |
|
|
11,360 |
|
|
4,583 |
|
|
40.3 |
% |
|
Total revenue |
|
67,611 |
|
|
65,509 |
|
|
2,102 |
|
|
3.2 |
% |
|
85,748 |
|
|
44,067 |
|
|
41,681 |
|
|
94.6 |
% |
|
153,359 |
|
|
109,576 |
|
|
43,783 |
|
|
40.0 |
% |
|
Expenses: |
|
|
|
|
|
|
|
|
|
|
|
|
|
|
|
|
|
|
|
|
|
|
|
|
|
|
|
|
|
|
|
|
|
|
|
|
|
Real estate operating expenses |
|
28,914 |
|
|
28,492 |
|
|
422 |
|
|
1.5 |
% |
|
34,234 |
|
|
17,789 |
|
|
16,445 |
|
|
92.4 |
% |
|
63,148 |
|
|
46,281 |
|
|
16,867 |
|
|
36.4 |
% |
|
Net Operating Income (a) |
$ |
38,697 |
|
$ |
37,017 |
|
$ |
1,680 |
|
|
4.5 |
% |
$ |
51,514 |
|
$ |
26,278 |
|
$ |
25,236 |
|
|
96.0 |
% |
$ |
90,211 |
|
$ |
63,295 |
|
$ |
26,916 |
|
|
42.5 |
% |
|
|
|
|
|
|
|
|
|
|
|
|
|
|
|
|
|
|
|
|
|
|
|
|
|
|
|
|
|
|
|
|
|
|
|
|
|
|
|
Other Income: |
|
|
|
|
|
|
|
|
|
|
|
|
|
|||||||||||||||||||||||
|
Property management |
|
|
29 |
|
|
- |
|
|
29 |
|
- |
|
||||||||||||||||||||||||
|
Total other income |
|
|
29 |
|
|
- |
|
|
29 |
|
- |
|
||||||||||||||||||||||||
|
Corporate and other expenses: |
|
|
|
|
|
|
|
|
|
|
|
|
|
|||||||||||||||||||||||
|
Property management expenses |
|
|
4,847 |
|
|
3,674 |
|
|
1,173 |
|
|
31.9 |
% |
|||||||||||||||||||||||
|
General and administrative expenses |
|
|
3,422 |
|
|
2,177 |
|
|
1,245 |
|
|
57.2 |
% |
|||||||||||||||||||||||
|
Asset management fees |
|
|
7,442 |
|
|
5,613 |
|
|
1,829 |
|
|
32.6 |
% |
|||||||||||||||||||||||
|
Acquisition and integration expenses |
|
|
43 |
|
|
13,555 |
|
|
(13,512 |
) |
|
-99.7 |
% |
|||||||||||||||||||||||
|
Depreciation and amortization expense |
|
|
34,824 |
|
|
28,094 |
|
|
6,730 |
|
|
24.0 |
% |
|||||||||||||||||||||||
|
Total corporate and other expenses |
|
|
50,578 |
|
|
53,113 |
|
|
(2,535 |
) |
|
-4.8 |
% |
|||||||||||||||||||||||
|
Operating Income (loss) |
|
|
39,662 |
|
|
10,182 |
|
|
29,480 |
|
|
289.5 |
% |
|||||||||||||||||||||||
|
Interest expense |
|
|
(35,535 |
) |
|
(23,553 |
) |
|
(11,982 |
) |
|
50.9 |
% |
|||||||||||||||||||||||
|
Interest income |
|
|
(4 |
) |
|
19 |
|
|
(23 |
) |
|
-121.1 |
% |
|||||||||||||||||||||||
|
Net gains (losses) on sale of assets |
|
|
31,776 |
|
|
6,412 |
|
|
25,364 |
|
- |
|
||||||||||||||||||||||||
|
Gains (losses) on extinguishment of debt |
|
|
(1,210 |
) |
|
- |
|
|
(1,210 |
) |
- |
|
||||||||||||||||||||||||
|
TSRE financing extinguishment and employees and separation expenses |
|
|
- |
|
|
(27,508 |
) |
|
27,508 |
|
- |
|
||||||||||||||||||||||||
|
Management internalization expense |
|
|
(44,976 |
) |
|
- |
|
|
(44,976 |
) |
- |
|
||||||||||||||||||||||||
|
Gains (losses) on TSRE merger and property acquisitions |
|
|
732 |
|
|
64,604 |
|
|
(63,872 |
) |
|
-98.9 |
% |
|||||||||||||||||||||||
|
Net income (loss) |
|
|
(9,555 |
) |
|
30,156 |
|
|
(39,711 |
) |
|
-131.7 |
% |
|||||||||||||||||||||||
|
(Income) loss allocated to noncontrolling interests |
|
|
(246 |
) |
|
(1,914 |
) |
|
1,668 |
|
|
-87.1 |
% |
|||||||||||||||||||||||
|
Net income (loss) available to common shares |
|
$ |
(9,801 |
) |
$ |
28,242 |
|
$ |
(38,043 |
) |
|
-134.7 |
% |
|||||||||||||||||||||||
|
(a) |
Same store portfolio consists of 22 properties, which represent 6,451 units. |
Revenue
Rental Income. Rental revenue increased $39.2 million to $137.4 million for the year ended December 31, 2016 from $98.2 million for the year ended December 31, 2015. The increase was primarily attributable to $45.0 million of rental income from the acquisition of 20 properties during the year ended December 31, 2015 present for a full year of operations in 2016, and an increase of $1.7 million due to improved occupancy and rental rates at our same store properties. The increase was partially offset by a decrease of $8.0 million of rental income related to four properties that were disposed of and not present for a full year of operations in 2016.
Tenant reimbursement and other income. Tenant reimbursement and other income increased $4.5 million to $15.9 million for the year ended December 31, 2016 from $11.4 million for the year ended December 31, 2015. The increase was primarily attributable to $4.9 million of tenant reimbursement and other income from the acquisition of 20 properties during the year ended December 31, 2015 present for a full year of operations in 2016, and an increase of $0.4 million of tenant reimbursement and other income in our same store portfolio. The increase was partially offset by a decrease of $0.9 million of tenant reimbursement and other income related to four properties that were disposed of and not present for a full year of operations in 2016.
Expenses
Property operating expenses. Property operating expenses increased $16.8 million to $63.1 million for the year ended December 31, 2016 from $46.3 million for the year ended December 31, 2015. The increase was primarily attributable to $19.6 million of real estate operating expense from the acquisition of 20 properties during the year ended December 31, 2015 present for a full year of operations in 2016, and an increase of $0.4 million of real estate operating expense in our same store portfolio. This increase was partially offset by a decrease of $3.4 million of real estate operating expenses related to four properties that were disposed of and not present for a full year of operations in 2016.
Property management expenses. Property management expenses increased $1.1 million to $4.8 million for the year ended December 31, 2016 from $3.7 million for the year ended December 31, 2015. The increase was primarily attributable to $1.5 million of property management expense from the acquisition of 20 properties during the year ended December 31, 2015 present for a full
41
year of operations in 2016. The increase was partially offset by a decrease of $0.3 million of property management expense related to four properties that were disposed of and not present for a full year of operations in 2016.
General and administrative expenses. General and administrative expenses increased $1.2 million to $3.4 million for the year ended December 31, 2016 from $2.2 million for the year ended December 31, 2015. This was primarily due to an increase of $0.7 million of stock based compensation and $0.5 million of professional fees for the year ended December 31, 2016 compared to the year ended December 31, 2015.
Asset management fees. Asset management fees increased $1.8 million to $7.4 million for the year ended December 31, 2016 from $5.6 million for the year ended December 31, 2015. The increase was primarily due to the growth of our portfolio of real estate properties which occurred in 2015 and the related capital used to complete the acquisitions as well as the offering that was completed in October 2016. Additionally, as part of the TSRE merger in September 2015, we changed the structure of our advisory contract with RAIT. Through September 30, 2015, the asset management fees payable to RAIT were calculated as 75 basis points of our average gross real estate assets, with an incentive fee due equal to 20% of any excess core FFO over a 7% core FFO return. As of October 1, 2015, the fee structure became a base fee of 1.5% of cumulative equity with an incentive fee equal to 20% of CORE FFO in excess of $0.20 per share. We terminated the advisory agreement requiring us to pay these asset management fees on December 20, 2016 in connection with the management internalization.
Acquisition and integration expenses. Acquisition and integration expenses were $13.6 million for the year ended December 31, 2015. These expenses primarily related to the TSRE merger in which we acquired 19 properties in 2015.
Depreciation and amortization expense. Depreciation and amortization expense increased $6.7 million to $34.8 million for the year ended December 31, 2016 from $28.1 million for the year ended December 31, 2015. The increase was primarily attributable to $11.5 million of depreciation and amortization expense from the acquisition of 20 properties during the year ended December 31, 2015 present for a full year of operations in 2016. The increase was partially offset by a decrease of $1.9 million of depreciation and amortization expense related to four properties that were disposed of and not present for a full year of operations in 2016 and by a decrease of $3.3 million of amortization expense in our same store portfolio.
Interest expense. Interest expense increased $11.9 million to $35.5 million for the year ended December 31, 2016 from $23.6 million for the year ended December 31, 2015. The increase was primarily attributable to $7.8 million of additional interest expense on debt obtained in connection with the TSRE merger that was present for a full year of operation in 2016, and $6.7 million attributable to additional debt obtained on properties acquired during the year ended December 31, 2015 and present for a full year of operations in 2016. The increase was partially offset by a decrease of $1.6 million of interest expense related to four properties that were disposed of and not present for a full year of operation in 2016 and by a decrease of $1.1 million of interest expense related to the loan payoff of our Oklahoma City portfolio of properties.
Net gains (losses) on sale of assets. During the year ended December 31, 2016, three multi-family properties were sold resulting in gains of $31.8 million.
Gains (losses) on extinguishment of debt. During the year ended December 31, 2016, we recognized a $1.2 million loss on the extinguishment of the debt related to the write-off of the unamortized deferred financing costs associated with debt that was extinguished.
Management internalization expense. During the year ended December 31, 2016, we recognized a $45.0 million loss due to our management internalization.
Non-GAAP Financial Measures
Funds from Operations and Core Funds from Operations
We believe that FFO and Core FFO, or CFFO, each of which is a non-GAAP financial measure, are additional appropriate measures of the operating performance of a REIT and us in particular. We compute FFO in accordance with the standards established by the National Association of Real Estate Investment Trusts, or NAREIT, as net income or loss allocated to common shares (computed in accordance with GAAP), excluding real estate-related depreciation and amortization expense, gains or losses on sales of real estate and the cumulative effect of changes in accounting principles.
CFFO is a computation made by analysts and investors to measure a real estate company’s operating performance by removing the effect of items that do not reflect ongoing property operations, including stock compensation expense, depreciation and amortization of other items not included in FFO, amortization of deferred financing costs, acquisition and integration expenses, other non-operating gains or losses related to items such as defeasance costs we incur when we sell a property subject to secured debt, asset sales, debt extinguishments,
42
acquisition related debt extinguishment expenses, gains on the TSRE merger, and management internalization expenses, from the determination of FFO. IRT incurs acquisition expenses in connection with acquisitions of real estate properties and expenses those costs when incurred in accordance with GAAP. As these expenses are one-time and reflective of investing activities rather than operating performance, IRT adds back these costs to FFO in determining CFFO.
Our calculation of CFFO differs from the methodology used for calculating CFFO by certain other REITs and, accordingly, our CFFO may not be comparable to CFFO reported by other REITs. Our management utilizes FFO and CFFO as measures of our operating performance, and believe they are also useful to investors, because they facilitate an understanding of IRT’s operating performance after adjustment for certain non-cash or non-recurring items that are required by GAAP to be expensed but may not necessarily be indicative of current operating performance and that may not accurately compare our operating performance between periods. Furthermore, although FFO, CFFO and other supplemental performance measures are defined in various ways throughout the REIT industry, we believe that FFO and CFFO may provide us and our investors with an additional useful measure to compare our financial performance to certain other REITs. Neither FFO nor CFFO is equivalent to net income or cash generated from operating activities determined in accordance with GAAP. Furthermore, FFO and CFFO do not represent amounts available for management’s discretionary use because of needed capital replacement or expansion, debt service obligations or other commitments or uncertainties. Neither FFO nor CFFO should be considered as an alternative to net income as an indicator of our operating performance or as an alternative to cash flow from operating activities as a measure of our liquidity.
Set forth below is a reconciliation of net income (loss) to FFO and Core FFO for the years ended December 31, 2017, 2016 and 2015 (in thousands, except share and per share information):
|
|
|
For the Year Ended December 31, 2017 |
|
|
For the Year Ended December 31, 2016 |
|
|
For the Year Ended December 31, 2015 |
|
|||||||||||||||
|
|
|
Amount |
|
|
Per Share (1) |
|
|
Amount |
|
|
Per Share (1) |
|
|
Amount |
|
|
Per Share (1) |
|
||||||
|
Funds From Operations: |
|
|
|
|
|
|
|
|
|
|
|
|
|
|
|
|
|
|
|
|
|
|
|
|
|
Net income (loss) |
|
$ |
31,441 |
|
|
$ |
0.41 |
|
|
$ |
(9,555 |
) |
|
$ |
(0.17 |
) |
|
$ |
30,156 |
|
|
$ |
0.79 |
|
|
Adjustments: |
|
|
|
|
|
|
|
|
|
|
|
|
|
|
|
|
|
|
|
|
|
|
|
|
|
Real estate depreciation and amortization |
|
|
34,097 |
|
|
|
0.45 |
|
|
|
34,824 |
|
|
|
0.63 |
|
|
|
28,094 |
|
|
|
0.75 |
|
|
Net (gains) losses on sale of assets |
|
|
(23,076 |
) |
|
|
(0.30 |
) |
|
|
(31,776 |
) |
|
|
(0.58 |
) |
|
|
(6,412 |
) |
|
|
(0.17 |
) |
|
Funds From Operations |
|
$ |
42,462 |
|
|
$ |
0.56 |
|
|
$ |
(6,507 |
) |
|
$ |
(0.12 |
) |
|
$ |
51,838 |
|
|
$ |
1.37 |
|
|
Core Funds From Operations: |
|
|
|
|
|
|
|
|
|
|
|
|
|
|
|
|
|
|
|
|
|
|
|
|
|
Funds From Operations |
|
$ |
42,462 |
|
|
$ |
0.56 |
|
|
$ |
(6,507 |
) |
|
$ |
(0.12 |
) |
|
$ |
51,838 |
|
|
$ |
1.37 |
|
|
Adjustments: |
|
|
|
|
|
|
|
|
|
|
|
|
|
|
|
|
|
|
|
|
|
|
|
|
|
Stock-based compensation |
|
|
1,967 |
|
|
|
0.02 |
|
|
|
1,222 |
|
|
|
0.02 |
|
|
|
495 |
|
|
|
0.01 |
|
|
Amortization of deferred financing costs |
|
|
1,469 |
|
|
|
0.02 |
|
|
|
3,064 |
|
|
|
0.06 |
|
|
|
1,483 |
|
|
|
0.04 |
|
|
Acquisition and integration expenses |
|
|
1,342 |
|
|
|
0.02 |
|
|
|
43 |
|
|
|
- |
|
|
|
13,555 |
|
|
|
0.36 |
|
|
Other depreciation and amortization |
|
|
104 |
|
|
|
- |
|
|
|
|
|
|
|
|
|
|
|
|
|
|
|
|
|
|
Other expense (income) |
|
|
(94 |
) |
|
|
- |
|
|
|
|
|
|
|
|
|
|
|
|
|
|
|
|
|
|
(Gains) losses on extinguishment of debt |
|
|
572 |
|
|
|
0.01 |
|
|
|
1,210 |
|
|
|
0.02 |
|
|
|
- |
|
|
|
- |
|
|
Defeasance costs included in net gains (losses) on sale of assets |
|
|
4,251 |
|
|
|
0.06 |
|
|
|
|
|
|
|
|
|
|
|
|
|
|
|
|
|
|
Management internalization expense |
|
|
- |
|
|
|
- |
|
|
|
44,976 |
|
|
|
0.82 |
|
|
|
- |
|
|
|
- |
|
|
Acquisition related debt extinguishment expenses |
|
|
3,624 |
|
|
|
0.04 |
|
|
|
|
|
|
|
|
|
|
|
|
|
|
|
|
|
|
TSRE financing extinguishment and employee separation expenses |
|
|
- |
|
|
|
- |
|
|
|
- |
|
|
|
- |
|
|
|
27,508 |
|
|
|
0.72 |
|
|
(Gains) losses on TSRE merger and property acquisitions |
|
|
- |
|
|
|
- |
|
|
|
(732 |
) |
|
|
(0.01 |
) |
|
|
(64,604 |
) |
|
|
(1.70 |
) |
|
Core Funds From Operations |
|
$ |
55,697 |
|
|
$ |
0.73 |
|
|
$ |
43,276 |
|
|
$ |
0.79 |
|
|
$ |
30,275 |
|
|
$ |
0.80 |
|
|
(1) |
Based on 76,291,465, 55,092,382 and 37,968,183 weighted average shares and units outstanding for the years ended December 31, 2017, 2016, and 2015, respectively. |
Same Store Portfolio Net Operating Income
We believe that Net Operating Income, or NOI, a non-GAAP measure, is a useful measure of our operating performance. We define NOI as total property revenues less total property operating expenses, excluding depreciation and amortization, asset
43
management fees, acquisition and integration expenses and general administrative expenses. In connection with our management internalization which was completed in the fourth quarter of 2016, we modified our calculation of NOI to exclude property management expenses. We retrospectively adjusted previously reported NOI to conform to this change in the table below.
Other REITs may use different methodologies for calculating NOI, and accordingly, our NOI may not be comparable to other REITs. We believe that this measure provides an operating perspective not immediately apparent from GAAP operating income or net income. We use NOI to evaluate our performance on a same store and non-same store basis because NOI measures the core operations of property performance by excluding corporate level expenses and other items not related to property operating performance and captures trends in rental housing and property operating expenses. However, NOI should only be used as an alternative measure of our financial performance.
We review our same store properties or portfolio at the beginning of each calendar year. Properties are added into the same store portfolio if they were owned at the beginning of the previous year. Properties that have been sold or classified as held for sale are excluded from the same store portfolio. The current same store portfolio is comprised of properties owned as of January 1, 2016. As such, the table below does not include results for the year ended December 31, 2015 (in thousands).
|
|
|
Three-Months Ended December 31 (a) |
|
|
Twelve-Months Ended December 31 (a) |
|
||||||||||||||||||
|
|
|
2017 |
|
|
2016 |
|
|
% change |
|
|
2017 |
|
|
2016 |
|
|
% change |
|
||||||
|
Revenue: |
|
|
|
|
|
|
|
|
|
|
|
|
|
|
|
|
|
|
|
|
|
|
|
|
|
Rental income |
|
$ |
32,428 |
|
|
$ |
31,456 |
|
|
|
3.1 |
% |
|
$ |
129,015 |
|
|
$ |
124,769 |
|
|
|
3.4 |
% |
|
Reimbursement and other income |
|
|
3,714 |
|
|
|
3,476 |
|
|
|
6.8 |
% |
|
|
15,227 |
|
|
|
14,116 |
|
|
|
7.9 |
% |
|
Total revenue |
|
|
36,142 |
|
|
|
34,932 |
|
|
|
3.5 |
% |
|
|
144,242 |
|
|
|
138,885 |
|
|
|
3.9 |
% |
|
Operating Expenses: |
|
|
|
|
|
|
|
|
|
|
|
|
|
|
|
|
|
|
|
|
|
|
|
|
|
Real estate taxes |
|
|
4,447 |
|
|
|
4,193 |
|
|
|
6.1 |
% |
|
|
17,600 |
|
|
|
17,038 |
|
|
|
3.3 |
% |
|
Property insurance |
|
|
768 |
|
|
|
796 |
|
|
|
-3.5 |
% |
|
|
3,116 |
|
|
|
3,050 |
|
|
|
2.2 |
% |
|
Personnel expenses |
|
|
3,389 |
|
|
|
3,376 |
|
|
|
0.4 |
% |
|
|
13,845 |
|
|
|
13,414 |
|
|
|
3.2 |
% |
|
Utilities |
|
|
2,205 |
|
|
|
2,235 |
|
|
|
-1.3 |
% |
|
|
8,904 |
|
|
|
8,775 |
|
|
|
1.5 |
% |
|
Repairs and maintenance |
|
|
1,035 |
|
|
|
1,194 |
|
|
|
-13.3 |
% |
|
|
5,152 |
|
|
|
5,010 |
|
|
|
2.8 |
% |
|
Contract services |
|
|
1,040 |
|
|
|
1,029 |
|
|
|
1.1 |
% |
|
|
4,247 |
|
|
|
4,283 |
|
|
|
-0.8 |
% |
|
Advertising expenses |
|
|
458 |
|
|
|
395 |
|
|
|
15.9 |
% |
|
|
1,619 |
|
|
|
1,593 |
|
|
|
1.6 |
% |
|
Other expenses |
|
|
876 |
|
|
|
703 |
|
|
|
24.6 |
% |
|
|
3,032 |
|
|
|
2,957 |
|
|
|
2.5 |
% |
|
Total operating expenses |
|
|
14,218 |
|
|
|
13,921 |
|
|
|
2.1 |
% |
|
|
57,515 |
|
|
|
56,120 |
|
|
|
2.5 |
% |
|
Net operating income |
|
$ |
21,924 |
|
|
$ |
21,011 |
|
|
|
4.3 |
% |
|
$ |
86,727 |
|
|
$ |
82,765 |
|
|
|
4.8 |
% |
|
NOI Margin |
|
|
60.7 |
% |
|
|
60.1 |
% |
|
|
0.6 |
% |
|
|
60.1 |
% |
|
|
59.6 |
% |
|
|
0.5 |
% |
|
Average Occupancy |
|
|
94.7 |
% |
|
|
93.7 |
% |
|
|
1.0 |
% |
|
|
94.6 |
% |
|
|
93.8 |
% |
|
|
0.8 |
% |
|
Average effective monthly rent, per unit |
|
$ |
1,021 |
|
|
$ |
998 |
|
|
|
2.3 |
% |
|
$ |
1,015 |
|
|
$ |
987 |
|
|
|
2.8 |
% |
|
Reconciliation of Same-Store Net Operating Income to Net Income (loss) |
|
|
|
|
|
|
|
|
|
|
|
|
|
|
|
|
|
|
|
|
|
|
|
|
|
Same-store portfolio net operating income (a) |
|
$ |
21,924 |
|
|
$ |
21,011 |
|
|
|
|
|
|
$ |
86,727 |
|
|
$ |
82,765 |
|
|
|
|
|
|
Non same-store net operating income |
|
|
3,773 |
|
|
|
1,431 |
|
|
|
|
|
|
|
9,054 |
|
|
|
7,446 |
|
|
|
|
|
|
Property management income |
|
|
140 |
|
|
|
29 |
|
|
|
|
|
|
|
719 |
|
|
|
29 |
|
|
|
|
|
|
Property management expenses |
|
|
(1,696 |
) |
|
|
(1,137 |
) |
|
|
|
|
|
|
(6,006 |
) |
|
|
(4,847 |
) |
|
|
|
|
|
General and administrative expenses |
|
|
(2,398 |
) |
|
|
(2,790 |
) |
|
|
|
|
|
|
(9,526 |
) |
|
|
(10,864 |
) |
|
|
|
|
|
Acquisition and integration expenses |
|
|
(386 |
) |
|
|
(6 |
) |
|
|
|
|
|
|
(1,342 |
) |
|
|
(43 |
) |
|
|
|
|
|
Depreciation and amortization |
|
|
(9,912 |
) |
|
|
(7,897 |
) |
|
|
|
|
|
|
(34,201 |
) |
|
|
(34,824 |
) |
|
|
|
|
|
Interest expense |
|
|
(7,129 |
) |
|
|
(7,720 |
) |
|
|
|
|
|
|
(28,702 |
) |
|
|
(35,535 |
) |
|
|
|
|
|
Other income (expense) |
|
|
94 |
|
|
|
(2 |
) |
|
|
|
|
|
|
89 |
|
|
|
(4 |
) |
|
|
|
|
|
Net gains (losses) on sale of assets |
|
|
2,952 |
|
|
|
3 |
|
|
|
|
|
|
|
18,825 |
|
|
|
31,776 |
|
|
|
|
|
|
Gains (losses) on extinguishment of debt |
|
|
— |
|
|
|
(652 |
) |
|
|
|
|
|
|
(572 |
) |
|
|
(1,210 |
) |
|
|
|
|
|
Acquisition related debt extinguishment expenses |
|
|
(843 |
) |
|
|
— |
|
|
|
|
|
|
|
(3,624 |
) |
|
|
- |
|
|
|
|
|
|
Management internalization expense |
|
|
— |
|
|
|
(44,976 |
) |
|
|
|
|
|
|
- |
|
|
|
(44,976 |
) |
|
|
|
|
|
Gains (losses) on TSRE merger |
|
|
— |
|
|
|
— |
|
|
|
|
|
|
|
- |
|
|
|
732 |
|
|
|
|
|
|
Net income (loss) |
|
$ |
6,519 |
|
|
$ |
(42,706 |
) |
|
|
|
|
|
$ |
31,441 |
|
|
$ |
(9,555 |
) |
|
|
|
|
44
|
(a) |
Same store portfolio for the three and twelve months ended December 31, 2017 and 2016 includes 42 properties which represent 11,677 units. |
Liquidity and Capital Resources
Overview
Liquidity is a measure of our ability to meet potential cash requirements, including ongoing commitments to repay borrowings, fund and maintain investments, pay distributions and other general business needs. We believe our available cash balances, financing arrangements and cash flows from operations will be sufficient to fund our liquidity requirements with respect to our existing portfolio for the next 12 months and the foreseeable future.
Our primary cash requirements are to:
|
|
• |
make investments and fund the associated costs; |
|
|
• |
repay our indebtedness; |
|
|
• |
pay our operating expenses; and |
|
|
• |
distribute a minimum of 90% of our REIT taxable income (determined without regard to the deduction for dividends paid and excluding net capital gain) and to make investments in a manner that enables us to maintain our qualification as a REIT. |
We intend to meet these liquidity requirements primarily through:
|
|
• |
the use of our cash and cash equivalent balance of $10.0 million as of December 31, 2017; |
|
|
• |
existing and future financing secured directly or indirectly by the apartment properties in our portfolio; |
|
|
• |
cash generated from operating activities; |
|
|
• |
net cash proceeds from property sales implementing our capital recycling strategy and other sales; |
|
|
• |
proceeds from the sale of our common stock; and |
|
|
• |
if required, proceeds from future borrowings and offerings. |
As previously disclosed in prior reports, we determined that the strategic long term benefits of the TSRE merger justified exceeding our historical leverage limits, defined as having total indebtedness of no more than approximately 65% of the combined initial purchase price of all of the properties in our portfolio. Also, as previously disclosed, following the completion of the TSRE merger, we have instituted a strategy, which we refer to as our capital recycling strategy, seeking to reduce IRT’s leverage ratio over time by using the proceeds from sales of properties which are outside our core geographic footprint in the Southeastern United States or which we believe have limited potential for further improvements to their operating results to repay a portion of our indebtedness. We have successfully continued to implement our capital recycling strategy, which began in 2015, to reduce our leverage and reduce our exposure to short term indebtedness. By December 31, 2017, our leverage had decreased with debt to gross assets declining from 64% historically to 50.2%.
|
|
• |
We have sold four targeted properties for $86.8 million, in the aggregate, generating net cash proceeds of $44.1 million, in the aggregate, after costs and repayment of property specific financing. |
|
|
• |
On September 11, 2017, we issued 12,500,000 shares of our common stock at a public offering price of $9.25 per share. We also closed on the underwriters’ option to purchase an additional 1,875,000 shares of common stock at the public offering price. As a result of the offering and exercise or the underwriters’ option, we received approximately $126.1 million in net proceeds, after deducting the underwriting discount and offering expenses. |
45
|
|
our unsecured credit facility. In connection with this agreement, we purchased a collar that caps LIBOR at 2.00% and is subject to a floor on LIBOR at 1.25% during the entire term of this loan. |
|
|
• |
On August 4, 2017, we entered into an At-the-Market Issuance Sales Agreement (the “ATM Sales Agreement”) with various sales agents. Pursuant to the ATM Sales Agreement, we may offer and sell shares of our common stock, $0.01 par value per share, having an aggregate offering price of up to $150 million, from time to time through the sales agents. The sales agents are entitled to compensation in an agreed amount not to exceed 2.0% of the gross sales price per share for any shares sold from time to time under the ATM Sales Agreement. We have no obligation to sell any of the shares under the ATM Sales Agreement and may at any time suspend solicitations and offers under the ATM Sales Agreement. During the year ended December 31, 2017, 1,164,900 shares were issued at an average price of $10.38 per share resulting in net proceeds of $12.1 million. We paid commissions of approximately $0.2 million and net proceeds from the issuances were approximately $11.9 million |
Cash Flows
As of December 31, 2017 and 2016, we maintained cash and cash equivalents of approximately $10.0 million and $20.9 million, respectively. Our cash and cash equivalents were generated from the following activities (dollars in thousands):
|
|
|
For the Years Ended December 31 |
|
|||||||||
|
|
|
2017 |
|
|
2016 |
|
|
2015 |
|
|||
|
Cash flow from operating activities |
|
$ |
54,324 |
|
|
$ |
(7,533 |
) |
|
$ |
18,725 |
|
|
Cash flow from investing activities |
|
|
(190,825 |
) |
|
|
27,779 |
|
|
|
(153,466 |
) |
|
Cash flow from financing activities |
|
|
125,594 |
|
|
|
(37,655 |
) |
|
|
158,279 |
|
|
Net change in cash and cash equivalents |
|
|
(10,907 |
) |
|
|
(17,409 |
) |
|
|
23,538 |
|
|
Cash and cash equivalents at beginning of period |
|
|
20,892 |
|
|
|
38,301 |
|
|
|
14,763 |
|
|
Cash and cash equivalents at end of period |
|
$ |
9,985 |
|
|
$ |
20,892 |
|
|
$ |
38,301 |
|
Our cash inflow from operating activities during the year ended December 31, 2017 was primarily driven by ongoing operations of our properties. Our cash outflow from operating activities during the year ended December 31, 2016 was related to the cost of our management internalization partially offset by ongoing operations of our properties.
Our cash outflow from investing activities during the year ended December 31, 2017 was primarily driven by $220.3 million of outflows related to ten property acquisitions. This was partially offset by $44.5 million of inflows related to four property sales. Our cash inflow from investing activities during the year ended December 31, 2016 was primarily due to the disposition of three properties.
Our cash inflow from financing activities during the year ended December 31, 2017 was primarily driven by $137.4 million of inflows related to the issuance of common stock. Our cash outflow from financing activities during the year ended December 31, 2016 was primarily due to repayments of mortgage indebtedness and the interim facility with proceeds from the three property dispositions.
As a REIT, we evaluate our dividend coverage based on our cash flow from operating activities, excluding acquisition and integration expenses and changes in other assets and liabilities. During the year ended December 31, 2017, we paid distributions to our common stockholders and non-controlling interests of $54.4 million and generated cash flows from operating activities, before acquisition and integration expenses, management internalization expense and changes in working capital of $55.8 million.
46
Refer to Item 8, Financial Statements and Supplementary Data, Note 4: Indebtedness and Note 6: Stockholder Equity and Non-Controlling Interest, for information regarding our capitalization.
Contractual Commitments
The table below summarizes our contractual obligations as of December 31, 2017 (dollars in thousands):
|
|
|
Payment due by Period |
|
|||||||||||||||||
|
|
|
Total |
|
|
Less Than 1 Year |
|
|
1-3 Years |
|
|
3-5 Years |
|
|
More Than 5 Years |
|
|||||
|
Principal payments on outstanding debt obligations |
|
$ |
784,640 |
|
|
$ |
3,251 |
|
|
$ |
12,271 |
|
|
$ |
280,360 |
|
|
$ |
488,758 |
|
|
Interest payments on outstanding debt obligations (1) |
|
|
156,619 |
|
|
|
27,869 |
|
|
|
55,205 |
|
|
|
42,989 |
|
|
|
30,556 |
|
|
Operating lease obligations |
|
|
607 |
|
|
|
285 |
|
|
|
322 |
|
|
|
— |
|
|
|
— |
|
|
Total |
|
$ |
941,866 |
|
|
$ |
31,405 |
|
|
$ |
67,798 |
|
|
$ |
323,349 |
|
|
$ |
519,314 |
|
|
|
(1) |
Our senior credit facility and $50 million term loan assumes a 30-day LIBOR rate of 1.495% as of December 18, 2017. Our $100 million term loan assumes a 30-day LIBOR rate of 1.51113% as of December 20, 2017. |
Off-Balance Sheet Arrangements
There were no off-balance sheet arrangements during the year ended December 31, 2017 that have or are likely to have a current or future effect on our financial condition, changes in financial condition, revenues or expenses, results of operations, liquidity, capital expenditures, or capital resource that is material to our interests.
Terms of Leases and Tenant Characteristics
The leases for our portfolio typically follow standard forms customarily used between landlords and tenants in the geographic area in which the relevant property is located. Under such leases, the tenant typically agrees to pay an initial deposit (generally one month’s rent) and pays rent on a monthly basis. As landlord, we are directly responsible for all real estate taxes, sales and use taxes, special assessments, property-level utilities, insurance and building repairs, and other building operation and management costs. Individual tenants are generally responsible for the utility costs of their unit. Our lease terms generally range from six months to two years and average twelve months.
Our apartment tenant composition varies across the regions in which we operate, includes single and family renters and is generally reflective of the principal employers in the relevant region. Our apartment properties predominantly consist of one-bedroom and two-bedroom units, although some of our apartment properties also have three-bedroom units.
Critical Accounting Estimates and Policies
We consider the accounting policies discussed below to be critical to an understanding of how we report our financial condition and results of operations because their application places the most significant demands on the judgment of our management.
Our financial statements are prepared on the accrual basis of accounting in accordance with GAAP. The preparation of financial statements in conformity with GAAP requires management to make use of estimates and assumptions that affect the reported amounts of assets and liabilities, the disclosure of contingent assets and liabilities at the date of the financial statements and the reported amounts of revenue and expenses during the reporting periods. Actual results could differ from those estimates.
Revenue Recognition
Rental revenues are recognized on an accrual basis when due from residents. We primarily lease apartments units under operating leases generally with terms of one year or less. Rental payments are generally due monthly and recognized when earned. Rental income represents gross market rent less adjustments for concessions and vacancy loss. Tenant reimbursement income represents reimbursement from tenants for utility charges while other property income includes parking, trash, late fees, and other miscellaneous property related income.
47
Allocation of Purchase Price of Acquired Assets
We account for acquisitions of properties that meet the definition of a business pursuant to Financial Accounting Standards Board, or FASB, Accounting Standards Codification, or ASC, Topic 805, “Business Combinations”. The fair value of the real estate acquired is allocated to the acquired tangible assets, generally consisting of land and building, and identified intangible assets, generally consisting of acquired in-place leases, based in each case on their fair values. Purchase accounting is applied to assets and liabilities associated with the real estate acquired. Transaction costs and fees incurred related to acquisitions are expensed as incurred. Transaction costs and fees incurred related to the financing of an acquisition are capitalized and amortized over the life of the related financing.
As final information regarding fair value of the assets acquired and liabilities assumed is received and estimates are refined, appropriate adjustments will be made to the purchase price allocation, in no case later than twelve months after the acquisition date.
The aggregate value of in-place leases is determined by evaluating various factors, including the terms of the leases that are in place and assumed lease-up periods.
Impairment of Long-Lived Assets
Management evaluates the recoverability of its investment in real estate assets, including related identifiable intangible assets, in accordance with FASB ASC Topic 360, “Property, Plant and Equipment.” This statement requires that long-lived assets be reviewed for impairment whenever events or changes in circumstances indicate that recoverability of the assets is not assured.
Management reviews its long-lived assets on an ongoing basis and evaluates the recoverability of the carrying value when there is an indicator of impairment. An impairment charge is recorded when it is determined that the carrying value of the assets exceeds the fair value. The estimated cash flows used for the impairment analysis and the determination of estimated fair value are based on our plans for the respective assets and our views of market and economic conditions. The estimates consider matters such as current and historical rental rates, occupancies for the respective and/or comparable properties, and recent sales data for comparable properties. Changes in estimated future cash flows due to changes in our plans or views of market and economic conditions could result in recognition of impairment losses, which, under the applicable accounting guidance, could be substantial.
Share-Based Compensation
We account for stock-based compensation in accordance with FASB ASC Subtopic 505-50, “Equity - Equity Payments to Non-Employees” and FASB ASC Topic 718, “Compensation - Stock Compensation”. We did not have any employees prior to December 20, 2016 and therefore accounted for share-based compensation as nonemployee awards. Stock-based compensation cost is measured at the grant date based on the fair value of the award and revalued at the end of each accounting period. The expense is recognized over the requisite service period, which is the vesting period. Any share-based compensation awards granted to employees are measured based on the grant-date fair value of the award and we record compensation expense for the entire award on a straight line basis, over the related vesting period, for the entire award.
Market risk is the adverse effect on the value of a financial instrument that results from a change in interest rates. We may be exposed to interest rate changes primarily as a result of long-term debt used to maintain liquidity, fund capital expenditures and expand our real estate investment portfolio and operations. Market fluctuations in real estate financing may affect the availability and cost of funds needed to expand our investment portfolio. In addition, restrictions upon the availability of real estate financing or high interest rates for real estate loans could adversely affect our ability to dispose of real estate in the future. We seek to limit the impact of interest rate changes on earnings and cash flows and to lower our overall borrowing costs. We are and may in the future use derivative financial instruments to hedge exposures to changes in interest rates on loans secured by our assets. The market risk associated with interest-rate contracts is managed by establishing and monitoring parameters that limit the types and degree of market risk that may be undertaken. With regard to variable rate financing, we assess our interest rate cash flow risk by continually identifying and monitoring changes in interest rate exposures that may adversely impact expected future cash flows and by evaluating hedging opportunities. We maintain risk management control systems to monitor interest rate cash flow risk attributable to both our outstanding and forecasted debt obligations as well as our potential offsetting hedge positions. While this hedging strategy is designed to minimize the impact on our net income and funds from operations of changes in interest rates, the overall returns on any investment in our securities may be reduced. We currently have limited exposure to financial market risks.
48
We may also be exposed to credit risk in derivative contracts we may use. Credit risk is the failure of the counterparty to perform under the terms of the derivative contract. If the fair value of a derivative contract is positive, the counterparty will owe us, which creates credit risk for us. If the fair value of a derivative contract is negative, we will owe the counterparty and, therefore, do not have credit risk. We seek to minimize the credit risk in derivative instruments by entering into transactions with high-quality counterparties.
Interest Rate Risk and Sensitivity
Interest rates may be affected by economic, geo-political, monetary and fiscal policy, market supply and demand and other factors generally outside our control, and such factors may be highly volatile. A change in market interest rates applicable to the fixed-rate portion of our indebtedness affects the fair value, but it has no effect on interest incurred or cash flows. A change in market interest rates applicable to the variable portion of our indebtedness affects the interest incurred and cash flows, but does not affect the fair value.
As of December 31, 2017, our only interest rate sensitive assets or liabilities related to our principal amount of $784.6 million of outstanding indebtedness, of which $580.6 million was fixed rate and $204.0 million was floating rate, a float-to-fixed interest rate swap with a notional amount of $150.0 million and a float-to-fixed interest rate swap with a notional amount of $100.0 million. As of December 31, 2016, our only interest rate sensitive assets or liabilities related to our principal amount of $750.2 million of outstanding indebtedness, of which $600.2 million was fixed rate and $150.0 million was floating rate, an individual interest rate cap with a notional amount of $200.0 million and a float-to-fixed interest rate swap with a notional amount of $150.0 million. We monitor interest rate risk routinely and seek to minimize the possibility that a change in interest rates would impact the interest incurred and our cash flows. To mitigate such risk, we may use interest rate derivative contracts. As of December 31, 2017 and 2016, the fair value of our fixed-rate indebtedness was $564.3 million and $588.5 million, respectively. The fair value of our fixed rate indebtedness was estimated using a discounted cash flow analysis utilizing rates that we believe a market participant would expect to pay for debt of a similar type and remaining maturity as if the debt was originated at December 31, 2017 and 2016, respectively. As we expect to remain obligated on our fixed rate instruments to maturity and the amounts due under such instruments would be limited to the outstanding principal balance and any accrued and unpaid interest, we do not expect that fluctuations in interest rates, and the resulting change in fair value of our fixed rate instruments, would have a significant impact on our operations.
As of December 31, 2017 and 2016, our interest rate cap had an insignificant asset fair value. The fair value of our interest rate cap was estimated using a discounted cash flow analysis based on forward interest rate curves and implied volatilities applicable to the individual caplets. The interest rate cap has been excluded from the table below as its impact to our interest rate risk under the scenarios presented in the table is insignificant.
As of December 31, 2017, our interest rate swap and interest rate collars had a combined asset fair value of $7.3 million. The fair values of our interest rate swap and interest rate collar were estimated using a discounted cash flow analysis based on forward interest rate curves. The impact of the interest rate swap and interest rate collar have been included in the table below.
The following table summarizes our indebtedness, and the impact to interest expense for a 12-month period, and the change in the net fair value of our indebtedness assuming an instantaneous increase or, subject to note (b) below, decrease of 100 basis points in the LIBOR interest rate curve (dollars in thousands):
|
|
|
|
|
|
|
|
|
|
|||||
|
|
|
Liabilities Subject to Interest Rate Sensitivity (a) |
|
|
100 Basis Point Increase |
|
|
100 Basis Point Decrease |
|
|
|||
|
Interest expense from variable-rate indebtedness |
|
$ |
159,690 |
|
|
$ |
781 |
|
(b) |
$ |
(417 |
) |
(b) |
|
Fair value of fixed-rate indebtedness |
|
|
564,333 |
|
|
|
(28,253 |
) |
|
|
29,998 |
|
|
(a) Unpaid balance of variable-rate indebtedness as of December 31, 2017 is shown. Fair value of fixed-rate indebtedness as of December 31, 2017 is shown.
(b) Libor is capped at 2.00% with a 1.25% floor due to our interest rate collar we purchased in 2017.
49
INDEX TO FINANCIAL STATEMENTS
OF INDEPENDENCE REALTY TRUST, INC.
(A Maryland Corporation)
50
Report of Independent Registered Public Accounting Firm
To the stockholders and board of directors
Independence Realty Trust, Inc.:
Opinion on the Consolidated Financial Statements
We have audited the accompanying consolidated balance sheets of Independence Realty Trust, Inc. and subsidiaries (the “Company”) as of December 31, 2017 and 2016, the related consolidated statements of operations, comprehensive income (loss), equity, and cash flows for each of the years in the three year period ended December 31, 2017, and the related notes and financial statement schedule III (collectively, the “consolidated financial statements”). In our opinion, the consolidated financial statements present fairly, in all material respects, the financial position of the Company as of December 31, 2017 and 2016, and the results of its operations and its cash flows for each of the years in the three year period ended December 31, 2017, in conformity with U.S. generally accepted accounting principles.
We also have audited, in accordance with the standards of the Public Company Accounting Oversight Board (United States) (“PCAOB”), the Company’s internal control over financial reporting as of December 31, 2017, based on criteria established in Internal Control – Integrated Framework (2013) issued by the Committee of Sponsoring Organizations of the Treadway Commission, and our report dated February 23, 2018 expressed an unqualified opinion on the effectiveness of the Company’s internal control over financial reporting.
Basis for Opinion
These consolidated financial statements are the responsibility of the Company’s management. Our responsibility is to express an opinion on these consolidated financial statements based on our audits. We are a public accounting firm registered with the PCAOB and are required to be independent with respect to the Company in accordance with the U.S. federal securities laws and the applicable rules and regulations of the Securities and Exchange Commission and the PCAOB.
We conducted our audits in accordance with the standards of the PCAOB. Those standards require that we plan and perform the audit to obtain reasonable assurance about whether the consolidated financial statements are free of material misstatement, whether due to error or fraud. Our audits included performing procedures to assess the risks of material misstatement of the consolidated financial statements, whether due to error or fraud, and performing procedures that respond to those risks. Such procedures included examining, on a test basis, evidence regarding the amounts and disclosures in the consolidated financial statements. Our audits also included evaluating the accounting principles used and significant estimates made by management, as well as evaluating the overall presentation of the consolidated financial statements. We believe that our audits provide a reasonable basis for our opinion.
/s/ KPMG LLP
We have served as the Company’s auditor since 2014.
Philadelphia, Pennsylvania
February 23, 2018
51
Report of Independent Registered Public Accounting Firm
To the stockholders and board of directors
Independence Realty Trust, Inc.:
Opinion on Internal Control Over Financial Reporting
We have audited Independence Realty Trust, Inc. and subsidiaries’ (the “Company”) internal control over financial reporting as of December 31, 2017, based on criteria established in Internal Control – Integrated Framework (2013) issued by the Committee of Sponsoring Organizations of the Treadway Commission. In our opinion, the Company maintained, in all material respects, effective internal control over financial reporting as of December 31, 2017, based on criteria established in Internal Control – Integrated Framework (2013) issued by the Committee of Sponsoring Organizations of the Treadway Commission.
We also have audited, in accordance with the standards of the Public Company Accounting Oversight Board (United States) (“PCAOB”), the consolidated balance sheets of the Company as of December 31, 2017 and 2016, the related consolidated statements of operations, comprehensive income (loss), equity, and cash flows for each of the years in the three-year period ended December 31, 2017, and the related notes and financial statement schedule III (collectively, the “consolidated financial statements”), and our report dated February 23, 2018 expressed an unqualified opinion on those consolidated financial statements.
Basis for Opinion
The Company’s management is responsible for maintaining effective internal control over financial reporting and for its assessment of the effectiveness of internal control over financial reporting, included in the accompanying Management’s Report on Internal Control over Financial Reporting. Our responsibility is to express an opinion on the Company’s internal control over financial reporting based on our audit. We are a public accounting firm registered with the PCAOB and are required to be independent with respect to the Company in accordance with the U.S. federal securities laws and the applicable rules and regulations of the Securities and Exchange Commission and the PCAOB.
We conducted our audit in accordance with the standards of the PCAOB. Those standards require that we plan and perform the audit to obtain reasonable assurance about whether effective internal control over financial reporting was maintained in all material respects. Our audit of internal control over financial reporting included obtaining an understanding of internal control over financial reporting, assessing the risk that a material weakness exists, and testing and evaluating the design and operating effectiveness of internal control based on the assessed risk. Our audit also included performing such other procedures as we considered necessary in the circumstances. We believe that our audit provides a reasonable basis for our opinion.
Definition and Limitations of Internal Control Over Financial Reporting
A company’s internal control over financial reporting is a process designed to provide reasonable assurance regarding the reliability of financial reporting and the preparation of financial statements for external purposes in accordance with generally accepted accounting principles. A company’s internal control over financial reporting includes those policies and procedures that (1) pertain to the maintenance of records that, in reasonable detail, accurately and fairly reflect the transactions and dispositions of the assets of the company; (2) provide reasonable assurance that transactions are recorded as necessary to permit preparation of financial statements in accordance with generally accepted accounting principles, and that receipts and expenditures of the company are being made only in accordance with authorizations of management and directors of the company; and (3) provide reasonable assurance regarding prevention or timely detection of unauthorized acquisition, use, or disposition of the company’s assets that could have a material effect on the financial statements.
Because of its inherent limitations, internal control over financial reporting may not prevent or detect misstatements. Also, projections of any evaluation of effectiveness to future periods are subject to the risk that controls may become inadequate because of changes in conditions, or that the degree of compliance with the policies or procedures may deteriorate.
/s/ KPMG LLP
Philadelphia, Pennsylvania
February 23, 2018
52
Independence Realty Trust, Inc. and Subsidiaries
(Dollars in thousands, except share and per share data)
|
|
|
As of December 31, 2017 |
|
|
As of December 31, 2016 |
|
||
|
ASSETS: |
|
|
|
|
|
|
|
|
|
Investments in real estate: |
|
|
|
|
|
|
|
|
|
Investments in real estate, at cost |
|
$ |
1,504,156 |
|
|
$ |
1,249,356 |
|
|
Accumulated depreciation |
|
|
(84,097 |
) |
|
|
(51,511 |
) |
|
Investments in real estate, net |
|
|
1,420,059 |
|
|
|
1,197,845 |
|
|
Real estate held for sale (see Note 4) |
|
|
- |
|
|
|
60,786 |
|
|
Cash and cash equivalents |
|
|
9,985 |
|
|
|
20,892 |
|
|
Restricted cash |
|
|
4,634 |
|
|
|
5,518 |
|
|
Accounts receivable and other assets |
|
|
7,556 |
|
|
|
5,211 |
|
|
Derivative assets |
|
|
7,291 |
|
|
|
3,867 |
|
|
Intangible assets, net of accumulated amortization of $1,511 and $0, respectively |
|
|
1,099 |
|
|
|
118 |
|
|
Total Assets |
|
$ |
1,450,624 |
|
|
$ |
1,294,237 |
|
|
LIABILITIES AND EQUITY: |
|
|
|
|
|
|
|
|
|
Indebtedness, net of unamortized discount and deferred financing costs of $6,198 and $6,371, respectively |
|
$ |
778,442 |
|
|
$ |
743,817 |
|
|
Accounts payable and accrued expenses |
|
|
17,216 |
|
|
|
14,028 |
|
|
Accrued interest payable |
|
|
249 |
|
|
|
491 |
|
|
Dividends payable |
|
|
5,245 |
|
|
|
4,297 |
|
|
Other liabilities |
|
|
3,353 |
|
|
|
2,913 |
|
|
Total Liabilities |
|
|
804,505 |
|
|
|
765,546 |
|
|
Equity: |
|
|
|
|
|
|
|
|
|
Stockholders’ equity: |
|
|
|
|
|
|
|
|
|
Preferred stock, $0.01 par value; 50,000,000 shares authorized, 0 and 0 shares issued and outstanding, respectively |
|
|
- |
|
|
|
- |
|
|
Common stock, $0.01 par value; 300,000,000 shares authorized, 84,708,551 and 68,996,070 shares issued and outstanding, including 295,847 and 281,005 unvested restricted common share awards, respectively |
|
|
846 |
|
|
|
690 |
|
|
Additional paid in capital |
|
|
703,849 |
|
|
|
564,633 |
|
|
Accumulated other comprehensive income (loss) |
|
|
4,626 |
|
|
|
3,683 |
|
|
Retained earnings (accumulated deficit) |
|
|
(85,221 |
) |
|
|
(62,181 |
) |
|
Total stockholders’ equity |
|
|
624,100 |
|
|
|
506,825 |
|
|
Noncontrolling interests |
|
|
22,019 |
|
|
|
21,866 |
|
|
Total Equity |
|
|
646,119 |
|
|
|
528,691 |
|
|
Total Liabilities and Equity |
|
$ |
1,450,624 |
|
|
$ |
1,294,237 |
|
The accompanying notes are an integral part of these consolidated financial statements
53
Independence Realty Trust, Inc. and Subsidiaries
Consolidated Statements of Operations
(Dollars in thousands, except share and per share information)
|
|
|
For the Years Ended December 31, |
|
|||||||||
|
|
|
2017 |
|
|
2016 |
|
|
2015 |
|
|||
|
REVENUE: |
|
|
|
|
|
|
|
|
|
|
|
|
|
Rental income |
|
$ |
143,473 |
|
|
$ |
137,416 |
|
|
$ |
98,216 |
|
|
Tenant reimbursement income |
|
|
5,719 |
|
|
|
5,587 |
|
|
|
4,401 |
|
|
Other property income |
|
|
11,305 |
|
|
|
10,356 |
|
|
|
6,959 |
|
|
Property management and other income |
|
|
719 |
|
|
|
29 |
|
|
|
- |
|
|
Total revenue |
|
|
161,216 |
|
|
|
153,388 |
|
|
|
109,576 |
|
|
EXPENSES: |
|
|
|
|
|
|
|
|
|
|
|
|
|
Property operating expenses |
|
|
64,716 |
|
|
|
63,148 |
|
|
|
46,281 |
|
|
Property management expenses |
|
|
6,006 |
|
|
|
4,847 |
|
|
|
3,674 |
|
|
General and administrative expenses |
|
|
9,526 |
|
|
|
10,864 |
|
|
|
7,790 |
|
|
Acquisition and integration expenses |
|
|
1,342 |
|
|
|
43 |
|
|
|
13,555 |
|
|
Depreciation and amortization expense |
|
|
34,201 |
|
|
|
34,824 |
|
|
|
28,094 |
|
|
Total expenses |
|
|
115,791 |
|
|
|
113,726 |
|
|
|
99,394 |
|
|
Operating income |
|
|
45,425 |
|
|
|
39,662 |
|
|
|
10,182 |
|
|
Interest expense |
|
|
(28,702 |
) |
|
|
(35,535 |
) |
|
|
(23,553 |
) |
|
Other income (expense) |
|
|
89 |
|
|
|
(4 |
) |
|
|
19 |
|
|
Net gains (losses) on sale of assets |
|
|
18,825 |
|
|
|
31,776 |
|
|
|
6,412 |
|
|
TSRE financing extinguishment and employee separation expenses |
|
|
- |
|
|
|
- |
|
|
|
(27,508 |
) |
|
Gain (loss) on extinguishment of debt |
|
|
(572 |
) |
|
|
(1,210 |
) |
|
|
- |
|
|
Acquisition related debt extinguishment expenses |
|
|
(3,624 |
) |
|
|
- |
|
|
|
- |
|
|
Management internalization expense |
|
|
- |
|
|
|
(44,976 |
) |
|
|
- |
|
|
Gains (losses) on TSRE merger and property acquisitions |
|
|
- |
|
|
|
732 |
|
|
|
64,604 |
|
|
Net income (loss): |
|
|
31,441 |
|
|
|
(9,555 |
) |
|
|
30,156 |
|
|
(Income) loss allocated to noncontrolling interest |
|
|
(1,235 |
) |
|
|
(246 |
) |
|
|
(1,914 |
) |
|
Net income (loss) allocable to common shares |
|
$ |
30,206 |
|
|
$ |
(9,801 |
) |
|
$ |
28,242 |
|
|
Earnings (loss) per share: |
|
|
|
|
|
|
|
|
|
|
|
|
|
Basic |
|
$ |
0.41 |
|
|
$ |
(0.19 |
) |
|
$ |
0.78 |
|
|
Diluted |
|
$ |
0.41 |
|
|
$ |
(0.19 |
) |
|
$ |
0.78 |
|
|
Weighted-average shares: |
|
|
|
|
|
|
|
|
|
|
|
|
|
Basic |
|
|
73,338,219 |
|
|
|
52,182,427 |
|
|
|
36,153,673 |
|
|
Diluted |
|
|
73,599,869 |
|
|
|
52,182,427 |
|
|
|
36,160,274 |
|
The accompanying notes are an integral part of these consolidated financial statements.
54
Independence Realty Trust, Inc. and Subsidiaries
Consolidated Statements of Comprehensive Income (Loss)
(Dollars in thousands)
|
|
|
For the Years Ended December 31, |
|
|||||||||
|
|
|
2017 |
|
|
2016 |
|
|
2015 |
|
|||
|
Net income (loss) |
|
$ |
31,441 |
|
|
$ |
(9,555 |
) |
|
$ |
30,156 |
|
|
Other comprehensive income (loss): |
|
|
|
|
|
|
|
|
|
|
|
|
|
Change in fair value of interest rate hedges |
|
|
845 |
|
|
|
3,354 |
|
|
|
(8 |
) |
|
Realized (gains) losses on interest rate hedges reclassified to earnings |
|
|
107 |
|
|
|
492 |
|
|
|
— |
|
|
Total other comprehensive income |
|
|
952 |
|
|
|
3,846 |
|
|
|
(8 |
) |
|
Comprehensive income (loss) before allocation to noncontrolling interests |
|
|
32,393 |
|
|
|
(5,709 |
) |
|
|
30,148 |
|
|
Allocation to noncontrolling interests |
|
|
(1,244 |
) |
|
|
(401 |
) |
|
|
(1,914 |
) |
|
Comprehensive income (loss) allocable to common shares |
|
$ |
31,149 |
|
|
$ |
(6,110 |
) |
|
$ |
28,234 |
|
|
|
|
|
|
|
|
|
|
|
|
|
|
|
The accompanying notes are an integral part of these consolidated financial statements.
55
Independence Realty Trust, Inc. and Subsidiaries
Consolidated Statements of Equity (Dollars in thousands, except share and per share data)
|
|
Preferred Shares |
|
Par Value Preferred Shares |
|
Common Shares |
|
Par Value Common Shares |
|
Additional Paid In Capital |
|
Accumulated Other Comprehensive Income (Loss) |
|
Retained Earnings (Accumulated Deficit) |
|
Total Stockholders’ Equity |
|
Noncontrolling Interests |
|
Total Equity |
|
||||||||||
|
Balance, January 1, 2015 |
|
- |
|
$ |
- |
|
|
31,800,076 |
|
$ |
318 |
|
$ |
267,683 |
|
$ |
- |
|
$ |
(16,728 |
) |
$ |
251,273 |
|
$ |
11,761 |
|
$ |
263,034 |
|
|
Net income (loss) |
|
- |
|
|
- |
|
|
- |
|
|
- |
|
|
- |
|
|
- |
|
|
28,242 |
|
|
28,242 |
|
|
1,914 |
|
|
30,156 |
|
|
Distribution to noncontrolling interest declared |
|
- |
|
|
- |
|
|
- |
|
|
- |
|
|
- |
|
|
- |
|
|
- |
|
|
- |
|
|
(1,300 |
) |
|
(1,300 |
) |
|
Common dividends declared |
|
- |
|
|
- |
|
|
- |
|
|
- |
|
|
- |
|
|
- |
|
|
(26,014 |
) |
|
(26,014 |
) |
|
- |
|
|
(26,014 |
) |
|
Other comprehensive income |
|
- |
|
|
- |
|
|
- |
|
|
- |
|
|
- |
|
|
(8 |
) |
|
- |
|
|
(8 |
) |
|
- |
|
|
(8 |
) |
|
Issuance of noncontrolling interests |
|
- |
|
|
- |
|
|
- |
|
|
- |
|
|
- |
|
|
- |
|
|
- |
|
|
- |
|
|
13,998 |
|
|
13,998 |
|
|
Conversion of noncontrolling interest to common shares |
|
- |
|
|
- |
|
|
52,933 |
|
|
- |
|
|
493 |
|
|
- |
|
|
- |
|
|
493 |
|
|
(493 |
) |
|
- |
|
|
Issuance of common shares, net |
|
- |
|
|
- |
|
|
15,105,669 |
|
|
152 |
|
|
109,516 |
|
|
- |
|
|
- |
|
|
109,668 |
|
|
- |
|
|
109,668 |
|
|
Stock compensation expense |
|
- |
|
|
- |
|
|
112,000 |
|
|
1 |
|
|
495 |
|
|
- |
|
|
- |
|
|
496 |
|
|
- |
|
|
496 |
|
|
Balance, December 31, 2015 |
|
- |
|
$ |
- |
|
|
47,070,678 |
|
$ |
471 |
|
$ |
378,187 |
|
$ |
(8 |
) |
$ |
(14,500 |
) |
$ |
364,150 |
|
$ |
25,880 |
|
$ |
390,030 |
|
|
Net income (loss) |
|
- |
|
|
- |
|
|
- |
|
|
- |
|
|
- |
|
|
- |
|
|
(9,801 |
) |
|
(9,801 |
) |
246 |
|
|
(9,555 |
) |
|
|
Common dividends declared |
|
- |
|
|
- |
|
|
- |
|
|
- |
|
|
- |
|
|
- |
|
|
(37,880 |
) |
|
(37,880 |
) |
|
- |
|
|
(37,880 |
) |
|
Other comprehensive income |
|
- |
|
|
- |
|
|
- |
|
|
- |
|
|
- |
|
|
3,691 |
|
|
|
|
|
3,691 |
|
155 |
|
|
3,846 |
|
|
|
Stock compensation expense |
|
- |
|
|
- |
|
|
228,000 |
|
|
2 |
|
|
1,220 |
|
|
- |
|
|
- |
|
|
1,222 |
|
|
- |
|
|
1,222 |
|
|
Common share activity related to equity compensation |
|
- |
|
|
- |
|
|
(28,869 |
) |
|
- |
|
|
(143 |
) |
|
- |
|
|
- |
|
|
(143 |
) |
|
- |
|
|
(143 |
) |
|
Conversion of noncontrolling interest to common shares |
|
- |
|
|
- |
|
|
245,980 |
|
|
2 |
|
|
2,288 |
|
|
- |
|
|
- |
|
|
2,290 |
|
|
(2,290 |
) |
|
0 |
|
|
Issuance of common shares, net |
|
- |
|
|
- |
|
|
28,750,000 |
|
|
288 |
|
|
245,164 |
|
|
- |
|
|
- |
|
|
245,452 |
|
|
- |
|
|
245,452 |
|
|
Repurchase of common shares |
|
- |
|
|
- |
|
|
(7,269,719 |
) |
|
(73 |
) |
|
(62,083 |
) |
|
- |
|
|
- |
|
|
(62,156 |
) |
|
- |
|
|
(62,156 |
) |
|
Distribution to noncontrolling interest declared |
|
- |
|
|
- |
|
|
- |
|
|
- |
|
|
- |
|
|
- |
|
|
- |
|
|
- |
|
|
(2,125 |
) |
|
(2,125 |
) |
|
Balance, December 31, 2016 |
|
- |
|
$ |
- |
|
|
68,996,070 |
|
$ |
690 |
|
$ |
564,633 |
|
$ |
3,683 |
|
$ |
(62,181 |
) |
$ |
506,825 |
|
$ |
21,866 |
|
$ |
528,691 |
|
|
Net income (loss) |
|
- |
|
|
- |
|
|
- |
|
|
- |
|
|
- |
|
|
- |
|
|
30,206 |
|
|
30,206 |
|
|
1,235 |
|
|
31,441 |
|
|
Common dividends declared |
|
- |
|
|
- |
|
|
- |
|
|
- |
|
|
- |
|
|
- |
|
|
(53,246 |
) |
|
(53,246 |
) |
|
- |
|
|
(53,246 |
) |
|
Other comprehensive income |
|
- |
|
|
- |
|
|
- |
|
|
- |
|
|
- |
|
|
943 |
|
|
- |
|
|
943 |
|
|
9 |
|
|
952 |
|
|
Stock compensation expense |
|
- |
|
|
- |
|
|
168,010 |
|
|
1 |
|
|
1,967 |
|
|
- |
|
|
- |
|
|
1,968 |
|
|
- |
|
|
1,968 |
|
|
Repurchase of shares related to equity award tax withholding |
|
- |
|
|
- |
|
|
(59,631 |
) |
|
(1 |
) |
|
(568 |
) |
|
- |
|
|
- |
|
|
(569 |
) |
|
- |
|
|
(569 |
) |
|
Conversion of noncontrolling interest to common shares |
|
- |
|
|
- |
|
|
64,202 |
|
|
1 |
|
|
619 |
|
|
- |
|
|
- |
|
|
620 |
|
|
(620 |
) |
|
- |
|
|
Issuance of common shares, net |
|
- |
|
|
- |
|
|
15,539,900 |
|
|
155 |
|
|
137,198 |
|
|
- |
|
|
- |
|
|
137,353 |
|
|
- |
|
|
137,353 |
|
|
Issuance of noncontrolling interests |
|
- |
|
|
- |
|
|
- |
|
|
- |
|
|
- |
|
|
- |
|
|
- |
|
|
- |
|
|
1,654 |
|
|
1,654 |
|
|
Distribution to noncontrolling interest declared |
|
- |
|
|
- |
|
|
- |
|
|
- |
|
|
- |
|
|
- |
|
|
- |
|
|
- |
|
|
(2,125 |
) |
|
(2,125 |
) |
|
Balance, December 31, 2017 |
|
- |
|
$ |
- |
|
|
84,708,551 |
|
$ |
846 |
|
$ |
703,849 |
|
$ |
4,626 |
|
$ |
(85,221 |
) |
$ |
624,100 |
|
$ |
22,019 |
|
$ |
646,119 |
|
56
Independence Realty Trust, Inc. and Subsidiaries
Consolidated Statements of Cash Flows (Dollars in thousands)
|
|
|
For the Years Ended December 31, |
|
|||||||||
|
|
|
2017 |
|
|
2016 |
|
|
2015 |
|
|||
|
Cash flows from operating activities: |
|
|
|
|
|
|
|
|
|
|
|
|
|
Net income (loss) |
|
$ |
31,441 |
|
|
$ |
(9,555 |
) |
|
$ |
30,156 |
|
|
Adjustments to reconcile net income to cash flow from operating activities: |
|
|
|
|
|
|
|
|
|
|
|
|
|
Depreciation and amortization |
|
|
34,201 |
|
|
|
34,824 |
|
|
|
28,094 |
|
|
Amortization of deferred financing costs, net |
|
|
1,464 |
|
|
|
2,757 |
|
|
|
389 |
|
|
Stock compensation expense |
|
|
1,968 |
|
|
|
1,222 |
|
|
|
495 |
|
|
Net (gains) losses on sale of assets |
|
|
(18,825 |
) |
|
|
(31,776 |
) |
|
|
(6,412 |
) |
|
Net (gains) losses on extinguishment of debt |
|
|
572 |
|
|
|
1,210 |
|
|
|
- |
|
|
Acquisition related debt extinguishment expenses |
|
|
3,624 |
|
|
|
- |
|
|
|
- |
|
|
TSRE financing extinguishment expenses |
|
|
- |
|
|
|
- |
|
|
|
23,219 |
|
|
(Gains) losses on TSRE merger and property acquisitions |
|
|
- |
|
|
|
(732 |
) |
|
|
(64,604 |
) |
|
Changes in assets and liabilities: |
|
|
|
|
|
|
|
|
|
|
|
|
|
Accounts receivable and other assets |
|
|
(1,267 |
) |
|
|
(477 |
) |
|
|
5,570 |
|
|
Accounts payable and accrued expenses |
|
|
1,578 |
|
|
|
(4,328 |
) |
|
|
3,362 |
|
|
Accrued interest payable |
|
|
(242 |
) |
|
|
(715 |
) |
|
|
1,060 |
|
|
Other liabilities |
|
|
(190 |
) |
|
|
37 |
|
|
|
(2,604 |
) |
|
Net cash provided by (used in) operating activities |
|
|
54,324 |
|
|
|
(7,533 |
) |
|
|
18,725 |
|
|
Cash flows from investing activities: |
|
|
|
|
|
|
|
|
|
|
|
|
|
Acquisition of real estate properties |
|
|
(220,254 |
) |
|
|
- |
|
|
|
(24,746 |
) |
|
Disposition of real estate properties |
|
|
44,474 |
|
|
|
39,690 |
|
|
|
17,524 |
|
|
Acquisition of advisory and management contracts |
|
|
- |
|
|
|
(143 |
) |
|
|
- |
|
|
TSRE merger, net of cash acquired |
|
|
- |
|
|
|
- |
|
|
|
(137,096 |
) |
|
Capital expenditures |
|
|
(14,370 |
) |
|
|
(10,663 |
) |
|
|
(8,941 |
) |
|
Deposits paid for future acquisitions |
|
|
(1,617 |
) |
|
|
(1,000 |
) |
|
|
- |
|
|
(Increase) decrease in restricted cash |
|
|
942 |
|
|
|
(105 |
) |
|
|
(207 |
) |
|
Cash flow provided by (used in) investing activities |
|
|
(190,825 |
) |
|
|
27,779 |
|
|
|
(153,466 |
) |
|
Cash flows from financing activities: |
|
|
|
|
|
|
|
|
|
|
|
|
|
Proceeds from issuance of common stock |
|
|
137,353 |
|
|
|
245,309 |
|
|
|
(188 |
) |
|
Payments related to repurchase of common stock |
|
|
- |
|
|
|
(62,156 |
) |
|
|
- |
|
|
TSRE financing extinguishment expenses |
|
|
- |
|
|
|
- |
|
|
|
(23,219 |
) |
|
Proceeds from unsecured credit facility and term loan |
|
|
199,690 |
|
|
|
103,501 |
|
|
|
391,500 |
|
|
Credit facility repayments |
|
|
(145,685 |
) |
|
|
(345,001 |
) |
|
|
(239,511 |
) |
|
Proceeds from mortgage |
|
|
- |
|
|
|
105,980 |
|
|
|
97,225 |
|
|
Mortgage principal repayments |
|
|
(2,654 |
) |
|
|
(45,088 |
) |
|
|
(33,240 |
) |
|
Payments for deferred financing costs |
|
|
(2,089 |
) |
|
|
(1,485 |
) |
|
|
(7,998 |
) |
|
Distributions on common stock |
|
|
(52,304 |
) |
|
|
(36,575 |
) |
|
|
(25,103 |
) |
|
Distributions to noncontrolling interests |
|
|
(2,119 |
) |
|
|
(2,140 |
) |
|
|
(1,187 |
) |
|
Payment for interest rate collar |
|
|
(2,405 |
) |
|
|
- |
|
|
|
- |
|
|
Payments related to extinguishment of debt on acquisitions |
|
|
(3,624 |
) |
|
|
- |
|
|
|
- |
|
|
Repurchase of shares related to equity award tax withholding |
|
|
(569 |
) |
|
|
- |
|
|
|
- |
|
|
Net cash provided by (used in) financing activities |
|
|
125,594 |
|
|
|
(37,655 |
) |
|
|
158,279 |
|
|
Net change in cash and cash equivalents |
|
|
(10,907 |
) |
|
|
(17,409 |
) |
|
|
23,538 |
|
|
Cash and cash equivalents, beginning of period |
|
|
20,892 |
|
|
|
38,301 |
|
|
|
14,763 |
|
|
Cash and cash equivalents, end of the period |
|
$ |
9,985 |
|
|
$ |
20,892 |
|
|
$ |
38,301 |
|
|
Supplemental cash flow information: |
|
|
|
|
|
|
|
|
|
|
|
|
|
Cash paid for interest |
|
$ |
27,368 |
|
|
$ |
33,034 |
|
|
$ |
22,105 |
|
|
Supplemental disclosure of noncash investing and financing activities: |
|
|
|
|
|
|
|
|
|
|
|
|
|
Decrease in noncontrolling interest from conversion of common limited partnership units to shares of common stock |
|
$ |
620 |
|
|
$ |
2,290 |
|
|
$ |
493 |
|
|
Distributions declared but not paid |
|
$ |
5,245 |
|
|
$ |
4,297 |
|
|
$ |
3,006 |
|
|
Value of common stock issued |
|
$ |
- |
|
|
$ |
- |
|
|
$ |
109,857 |
|
|
Value of limited partnership units issued in acquisitions |
|
$ |
1,654 |
|
|
$ |
- |
|
|
$ |
13,998 |
|
|
Mortgage debt assumed |
|
$ |
18,977 |
|
|
$ |
- |
|
|
$ |
121,885 |
|
57
Independence Realty Trust, Inc. and Subsidiaries
Notes to Consolidated Financial Statements
As of December 31, 2017
(Dollars in thousands, except share and per share data)
NOTE 1: Organization
Independence Realty Trust, Inc. was formed on March 26, 2009 as a Maryland corporation that has elected to be taxed as a real estate investment trust, or REIT, commencing with the taxable year ended December 31, 2011. We became an internally managed REIT in December 2016. Prior to that date, we were externally managed by a subsidiary of RAIT Financial Trust, or RAIT, a publicly traded Maryland REIT whose common shares are listed on the New York Stock Exchange under the symbol “RAS” (referred to as our Advisor). On December 20, 2016, we completed our management internalization, which consisted of two parts: (i) our acquisition of our external advisor, which was a subsidiary of RAIT, and (ii) our acquisition of substantially all of the assets and the assumption of certain liabilities relating to the multifamily property management business of RAIT, including property management contracts relating to apartment properties owned by us, RAIT and third parties. Also, pursuant to the internalization agreement, on October 5, 2016, we repurchased all of the 7,269,719 shares of our common stock owned by certain of RAIT’s subsidiaries and retired these shares.
As used herein, the terms “we,” “our” and “us” refer to Independence Realty Trust, Inc. and, as required by context, Independence Realty Operating Partnership, LP, which we refer to as IROP, and their subsidiaries. We own apartment properties in geographic non-gateway markets that we believe support strong occupancy and have the potential for growth in rental rates. We seek to provide stockholders with attractive risk-adjusted returns, with an emphasis on distributions and capital appreciation. We own substantially all of our assets and conduct our operations through IROP, of which we are the sole general partner.
NOTE 2: Summary of Significant Accounting Policies
a. Basis of Presentation
The consolidated financial statements have been prepared by management in accordance with generally accepted accounting principles in the United States, or GAAP. In the opinion of management, all adjustments, consisting only of normal recurring adjustments, necessary to present fairly our consolidated financial position and consolidated results of operations and cash flows are included.
b. Principles of Consolidation
The consolidated financial statements reflect our accounts and the accounts of IROP and its subsidiaries. All intercompany accounts and transactions have been eliminated in consolidation. Pursuant to FASB Accounting Standards Codification Topic 810, “Consolidation”, IROP is considered a variable interest entity. As our significant asset is our investment in IROP, substantially all of our assets and liabilities represent the assets and liabilities of IROP.
c. Use of Estimates
The preparation of financial statements in conformity with GAAP requires management to make estimates and assumptions that affect the reported amounts of assets and liabilities, the disclosure of contingent assets and liabilities at the date of the financial statements and the reported amounts of revenue and expenses during the reporting periods. Actual results could differ from those estimates.
d. Cash and Cash Equivalents
Cash and cash equivalents include cash held in banks and highly liquid investments with maturities of three months or less when purchased. Cash, including amounts restricted, may at times exceed the Federal Deposit Insurance Corporation deposit insurance limit of $250 per institution. We mitigate credit risk by placing cash and cash equivalents with major financial institutions. To date, we have not experienced any losses on cash and cash equivalents.
e. Restricted Cash
Restricted cash includes tenant escrows and our funds held by lenders to fund certain expenditures or to be released at our discretion upon the occurrence of certain pre-specified events. As of December 31, 2017 and 2016, we had $4,634 and $5,518, respectively, of restricted cash.
58
Independence Realty Trust, Inc. and Subsidiaries
Notes to Consolidated Financial Statements
As of December 31, 2017
(Dollars in thousands, except share and per share data)
f. Accounts Receivable and Allowance for Bad Debts
We make estimates of the collectability of our accounts receivable related to base rents, expense reimbursements and other revenue. We analyze accounts receivable and historical bad debt levels, tenant credit worthiness and current economic trends when evaluating the adequacy of the allowance for doubtful accounts. In addition, tenants experiencing financial difficulties are analyzed and estimates are made in connection with expected uncollectible receivables. Our reported operating results are affected by management’s estimate of the collectability of accounts receivable. For the years ended December 31, 2017, 2016, and 2015, we recorded bad debt expense of $870, $975, and $746, respectively.
g. Investments in Real Estate
Investments in real estate are recorded at cost less accumulated depreciation. Costs that both add value and appreciably extend the useful life of an asset are capitalized. Expenditures for repairs and maintenance are expensed as incurred.
Investments in real estate are classified as held for sale in the period in which certain criteria are met including when the sale of the asset is probable and actions required to complete the plan of sale indicate that it is unlikely that significant changes to the plan of sale will be made or the plan of sale will be withdrawn.
Allocation of Purchase Price of Acquired Assets
We account for acquisitions of properties that meet the definition of a business pursuant to Financial Accounting Standards Board, or FASB, Accounting Standards Codification, or ASC, Topic 805, “Business Combinations”. The fair value of the real estate acquired is allocated to the acquired tangible assets, generally consisting of land, building, and identified intangible assets and liabilities based in each case on their fair values. Purchase accounting is applied to assets and liabilities associated with the real estate acquired. Transaction costs and fees incurred related to acquisition are expensed as incurred. Transaction costs and fees incurred related to the financing of an acquisition are capitalized and amortized over the life of the related financing.
As final information regarding fair value of the assets acquired and liabilities assumed is received and estimates are refined, appropriate adjustments will be made to the purchase price allocation, in no case later than twelve months after the acquisition date.
The aggregate value of in-place leases is determined by evaluating various factors, including the terms of the leases that are in place and assumed lease-up periods. During the year ended December 31, 2017, we acquired in-place leases with a value of $2,515 related to our acquisitions that are discussed further in NOTE 3: Investments in Real Estate. During the year ended December 31, 2016, we did not acquire any properties and, therefore, did not acquire any in-place leases. The value assigned to this intangible asset is amortized over the assumed lease up period, typically six months. For the years ended December 31, 2017, 2016 and 2015 we recorded $1,536, $3,735 and $7,206 of amortization expense for intangible assets, respectively. Based on the intangible assets identified above, we expect to record amortization expense of intangible assets of $1,024 for 2018, $10 for 2019, $10 for 2020, $10 for 2021, $10 for 2022 and $35 thereafter.
Impairment of Long-Lived Assets
Management evaluates the recoverability of its investment in real estate assets, including related identifiable intangible assets, in accordance with FASB ASC Topic 360, “Property, Plant and Equipment”. This statement requires that long-lived assets be reviewed for impairment whenever events or changes in circumstances indicate that recoverability of the assets is not assured.
Management reviews its long-lived assets on an ongoing basis and evaluates the recoverability of the carrying value when there is an indicator of impairment. An impairment charge is recorded when it is determined that the carrying value of the asset exceeds the fair value. The estimated cash flows used for the impairment analysis and the determination of estimated fair value are based on our plans for the respective assets and our views of market and economic conditions. The estimates consider matters such as current and historical rental rates, occupancies for the respective and/or comparable properties, and recent sales data for comparable properties. Changes in estimated future cash flows due to changes in our plans or views of market and economic conditions could result in recognition of impairment losses, which, under the applicable accounting guidance, could be substantial.
59
Independence Realty Trust, Inc. and Subsidiaries
Notes to Consolidated Financial Statements
As of December 31, 2017
(Dollars in thousands, except share and per share data)
Depreciation expense for real estate assets is computed using a straight-line method based on a life of 40 years for buildings and improvements and five to ten years for equipment and fixtures. For the years ended December 31, 2017, 2016 and 2015 we recorded $32,665, $31,089 and $20,888 of depreciation expense, respectively.
h. Revenue and Expenses
Rental revenues are recognized on an accrual basis when due from residents. We primarily lease apartment units under operating leases generally with terms of one year or less. Rental payments are generally due monthly and recognized when earned. Rental income represents gross market rent less adjustments for concessions and vacancy loss. Tenant reimbursement income represents reimbursement from tenants for utility charges while other property income includes parking, trash, late fees, and other miscellaneous property related income.
Our portfolio of properties consists primarily of apartment communities geographically concentrated in the Southeastern United States. North Carolina, Tennessee, Kentucky, Texas, Georgia, South Carolina, and Oklahoma comprised 14.70%, 13.09%, 11.51%, 9.95%, 9.09%, 8.61%, and 7.86%, respectively, of our rental revenue for the year ended December 31, 2017. We have no single customer that accounts for 10% or more of revenue.
For the year ended December 31, 2017 and 2016, we recognized revenues of $110 and $189, respectively, related to recoveries of lost rental revenue due to natural disasters and other insurable events from our insurance providers.
For the years ended December 31, 2017, 2016 and 2015, we incurred $1,806, $1,749, and $1,399 of advertising expenses, respectively.
i. Fair Value of Financial Instruments
In accordance with FASB ASC Topic 820, “Fair Value Measurements and Disclosures”, fair value is the price that would be received to sell an asset or paid to transfer a liability in an orderly transaction between market participants at the measurement date. Where available, fair value is based on observable market prices or parameters or derived from such prices or parameters. Where observable prices or inputs are not available, valuation models are applied. These valuation techniques involve management estimation and judgment, the degree of which is dependent on the price transparency for the instruments or market and the instruments’ complexity for disclosure purposes. Assets and liabilities recorded at fair value in our consolidated balance sheets are categorized based upon the level of judgment associated with the inputs used to measure their value. Hierarchical levels, as defined in FASB ASC Topic 820, “Fair Value Measurements and Disclosures” and directly related to the amount of subjectivity associated with the inputs to fair valuations of these assets and liabilities, are as follows:
|
|
• |
Level 1: Valuations are based on unadjusted, quoted prices in active markets for identical assets or liabilities at the measurement date. The types of assets carried at Level 1 fair value generally are equity securities listed in active markets. As such, valuations of these investments do not entail a significant degree of judgment. |
|
|
• |
Level 2: Valuations are based on quoted prices for similar instruments in active markets or quoted prices for identical or similar instruments in markets that are not active or for which all significant inputs are observable, either directly or indirectly. |
|
|
• |
Level 3: Inputs are unobservable for the asset or liability, and include situations where there is little, if any, market activity for the asset or liability. In certain cases, the inputs used to measure fair value may fall into different levels of the fair value hierarchy. In such cases, the level in the fair value hierarchy within which the fair value measurement in its entirety falls has been determined based on the lowest level input that is significant to the fair value measurement in its entirety. Our assessment of the significance of a particular input to the fair value measurement in its entirety requires judgment, and considers factors specific to the asset or liability. |
The availability of observable inputs can vary depending on the financial asset or liability and is affected by a wide variety of factors, including, for example, the type of investment, whether the investment is new, whether the investment is traded on an active exchange or in the secondary market, and the current market condition. To the extent that valuation is based on models or inputs that are less observable or unobservable in the market, the determination of fair value requires more judgment. Accordingly, the degree of judgment exercised by us in determining fair value is greatest for instruments categorized in Level 3.
60
Independence Realty Trust, Inc. and Subsidiaries
Notes to Consolidated Financial Statements
As of December 31, 2017
(Dollars in thousands, except share and per share data)
Fair value is a market-based measure considered from the perspective of a market participant who holds the asset or owes the liability rather than an entity-specific measure. Therefore, even when market assumptions are not readily available, our own assumptions are set to reflect those that management believes market participants would use in pricing the asset or liability at the measurement date. We use prices and inputs that management believes are current as of the measurement date, including during periods of market dislocation. In periods of market dislocation, the observability of prices and inputs may be reduced for many instruments. This condition could cause an instrument to be transferred from Level 1 to Level 2 or Level 2 to Level 3.
Fair value for certain of our Level 3 financial instruments is derived using internal valuation models. These internal valuation models include discounted cash flow analyses developed by management using current interest rates, estimates of the term of the particular instrument, specific issuer information and other market data for securities without an active market. In accordance with FASB ASC Topic 820, “Fair Value Measurements and Disclosures”, the impact of our own credit spreads is also considered when measuring the fair value of financial assets or liabilities. Where appropriate, valuation adjustments are made to account for various factors, including bid-ask spreads, credit quality and market liquidity. These adjustments are applied on a consistent basis and are based on observable inputs where available. Management’s estimate of fair value requires significant management judgment and is subject to a high degree of variability based upon market conditions, the availability of specific issuer information and management’s assumptions.
FASB ASC Topic 825, “Financial Instruments” requires disclosure of the fair value of financial instruments for which it is practicable to estimate that value. Given that cash and cash equivalents and restricted cash are short term in nature with limited fair value volatility, the carrying amount is deemed to be a reasonable approximation of fair value and the fair value input is classified as a Level 1 fair value measurement. The fair value input for the derivatives is classified as a Level 2 fair value measurement within the fair value hierarchy. The fair value inputs for our unsecured credit facility and our former secured credit facility are classified as Level 2 fair value measurements within the fair value hierarchy. The fair value of mortgage indebtedness is based on a discounted cash flows valuation technique. As this technique utilizes current credit spreads, which are generally unobservable, this is classified as a Level 3 fair value measurement within the fair value hierarchy. We determine appropriate credit spreads based on the type of debt and its maturity. The following table summarizes the carrying amount and the fair value of our financial instruments as of the periods indicated:
|
|
|
December 31, 2017 |
|
|
As of December 31, 2016 |
|
||||||||||
|
Financial Instrument |
|
Carrying Amount |
|
|
Estimated Fair Value |
|
|
Carrying Amount |
|
|
Estimated Fair Value |
|
||||
|
Assets |
|
|
|
|
|
|
|
|
|
|
|
|
|
|
|
|
|
Cash and cash equivalents |
|
$ |
9,985 |
|
|
$ |
9,985 |
|
|
$ |
20,892 |
|
|
$ |
20,892 |
|
|
Restricted cash |
|
|
4,634 |
|
|
|
4,634 |
|
|
|
5,518 |
|
|
|
5,518 |
|
|
Derivative assets |
|
|
7,291 |
|
|
|
7,291 |
|
|
|
3,867 |
|
|
|
3,867 |
|
|
|
|
|
|
|
|
|
|
|
|
|
|
|
|
|
|
|
|
Liabilities |
|
|
|
|
|
|
|
|
|
|
|
|
|
|
|
|
|
Debt: |
|
|
|
|
|
|
|
|
|
|
|
|
|
|
|
|
|
Unsecured credit facility |
|
|
101,629 |
|
|
|
104,005 |
|
|
|
147,280 |
|
|
|
150,000 |
|
|
Term loan |
|
|
99,105 |
|
|
|
100,000 |
|
|
|
- |
|
|
|
- |
|
|
Mortgages |
|
|
577,708 |
|
|
|
564,333 |
|
|
|
596,537 |
|
|
|
588,523 |
|
j. Deferred Financing Costs
Costs incurred in connection with debt financing are deferred and classified within indebtedness and charged to interest expense over the terms of the related debt agreements, under the effective interest method.
k. Income Taxes
We have elected to be taxed as a REIT beginning with the taxable year ended December 31, 2011. Accordingly, we recorded no income tax expense for the years ended December 31, 2017, 2016 and 2015.
To qualify as a REIT, we must meet certain organizational and operational requirements, including a requirement to distribute at least 90% of our ordinary taxable income to stockholders. As a REIT, we generally are not subject to federal income tax on taxable
61
Independence Realty Trust, Inc. and Subsidiaries
Notes to Consolidated Financial Statements
As of December 31, 2017
(Dollars in thousands, except share and per share data)
income that we distribute to our stockholders. If we fail to qualify as a REIT in any taxable year, we will be subject to federal income taxes on our taxable income at regular corporate rates and will not be permitted to qualify for treatment as a REIT for federal income tax purposes for four years following the year during which qualification is lost unless the Internal Revenue Service grants us relief under certain statutory provisions. Such an event could materially adversely affect our net income and net cash available for distribution to stockholders; however, we believe that we are organized and operate in such a manner as to qualify and maintain treatment as a REIT and intend to operate in such a manner so that we will remain qualified as a REIT for federal income tax purposes. For the year ended December 31, 2017, 53% of dividends were characterized as total capital gain distribution, 36% were characterized as ordinary income and 11% were characterized as return of capital. For the year ended December 31, 2016, 93% of dividends were characterized as total capital gain distribution and 7% were characterized as ordinary income. For the year ended December 31, 2015, 17% of dividends were characterized as ordinary income and 83% were characterized as return of capital.
l. Share-Based Compensation
We account for stock-based compensation in accordance with FASB ASC Subtopic 505-50, “Equity – Equity Payments to Non-Employees” and FASB ASC Topic 718, “Compensation—Stock Compensation”. We did not have any employees prior to the management internalization on December 20, 2016 and therefore accounted for stock-based compensation as non-employee awards. Stock-based compensation cost for non-employee awards is measured at the grant date based on the fair value of the award and is revalued at the end of each accounting period. The expense is recognized over the requisite service period, which is the vesting period. Any share-based compensation awards granted to employees are measured based on the grant-date fair value of the award and we record compensation expense for the entire award on a straight-line basis, over the related vesting period. For awards granted to nonemployees who subsequently became employees, the fair values of the awards were revalued on the date the employment status change occurred and the resulting compensation expense is recognized on a straight-line basis over the remaining vesting period, for the entire award.
m. Noncontrolling Interest
Our noncontrolling interest represents limited partnership units of our operating partnership that were issued in connection with certain property acquisitions. We record limited partnership units issued in an acquisition at their fair value on the closing date of the acquisition. The holders of the limited partnership units have the right to redeem their limited partnership units for either shares of our common stock or for cash at our discretion. As the settlement of a redemption is in our sole discretion, we present noncontrolling interest in our consolidated balance sheet within equity but separate from stockholders’ equity. Any noncontrolling interests that fail to qualify as permanent equity will be presented as temporary equity and be carried at the greater of historical cost or their redemption value.
n. Derivative Instruments
We may use derivative financial instruments to hedge all or a portion of the interest rate risk associated with our borrowings. The principal objective of such arrangements is to minimize the risks and/or costs associated with our operating and financial structure as well as to hedge specific anticipated transactions. While these instruments may impact our periodic cash flows, they benefit us by minimizing the risks and/or costs previously described. The counterparties to these contractual arrangements are major financial institutions with which we and our affiliates may also have other financial relationships. In the event of nonperformance by the counterparties, we are potentially exposed to credit loss. However, because of the high credit ratings of the counterparties, we do not anticipate that any of the counterparties will fail to meet their obligations.
In accordance with FASB ASC Topic 815, “Derivatives and Hedging”, we measure each derivative instrument (including certain derivative instruments embedded in other contracts) at fair value and record such amounts in our consolidated balance sheet as either an asset or liability. For derivatives designated as cash flow hedges, the changes in the fair value of the effective portions of the derivative are reported in other comprehensive income and changes in the ineffective portions of cash flow hedges, if any, are recognized in earnings. For derivatives not designated as hedges (or designated as fair value hedges), the changes in fair value of the derivative instrument are recognized in earnings. Any derivatives that we designate in hedge relationships are done so at inception. At inception, we determine whether or not the derivative is highly effective in offsetting changes in the designated interest rate risk associated with the identified indebtedness using regression analysis. At each reporting period, we update our regression analysis and use the hypothetical derivative method to measure any ineffectiveness.
62
Independence Realty Trust, Inc. and Subsidiaries
Notes to Consolidated Financial Statements
As of December 31, 2017
(Dollars in thousands, except share and per share data)
o. Recent Accounting Pronouncements
Adopted Within these Financial Statements
In March 2016, the FASB issued an accounting standard classified under FASB ASC Topic 718, “Compensation – Stock Compensation”. This accounting standard simplifies several aspects of the accounting for share-based payment award transactions, including: (i) income tax consequences; (ii) classification of awards as either equity or liabilities; and (iii) classification on the statement of cash flows. This standard is effective for annual periods beginning after December 15, 2016, and interim periods within those annual periods. The adoption of this accounting standard did not have a material impact on our consolidated financial statements.
In August 2017, the FASB issued an accounting standard update under FASB ASC Topic 815, “Derivatives and Hedging.” The amendments in this update provide guidance about the application of the hedge accounting guidance in current GAAP based on the feedback received from preparers, auditors, and other stakeholders. As a result, the accounting for derivatives and hedging transactions could be impacted. The updated standard is effective for us on January 1, 2019 with early adoption permitted. We early adopted this update on October 1, 2017. The adoption of this update did not have a material impact on our consolidated financial statements. In accordance with this accounting standard update, upon adoption, we revised our approach to recognizing interest expense for our interest rate swap that was designated an off-market cash flow hedge. Rather than record interest expense based on the hypothetical derivative method with differences from actual net settlements reflected as ineffectiveness, we will record actual net settlements to interest expense adjusted for the straight-line amortization of the inception clean value of the hedging instrument over the hedge term. The result will be that no ineffectiveness will be recorded in future periods related to our off-market interest rate swap. Since we entered into the off-market hedging relationship in 2017, no transition entry was necessary upon adoption.
Not Yet Adopted Within these Financial Statements
In May 2014, the FASB issued an accounting standard classified under FASB ASC Topic 606, “Revenue from Contracts with Customers”. This accounting standard generally replaces existing guidance by requiring an entity to recognize the amount of revenue to which it expects to be entitled for the transfer of promised goods or services to customers. This accounting standard applies to all contracts with customers, except those that are within the scope of other Topics in the FASB ASC. Subsequently, the FASB issued amendments to this accounting standard that provided further clarification. These standards amending FASB ASC Topic 606 are currently effective for annual reporting periods beginning after December 15, 2017. We adopted these accounting standard updates on January 1, 2018 using the modified retrospective approach. A majority of our revenue is derived from real estate lease contracts, which are specifically excluded from the scope of these standards. The portion of our revenue that is impacted by these standards, including revenue recorded within the tenant reimbursement income, other property income, and property management and other income captions of our Consolidated Statements of Operations, will be accounted for under the standards amending FASB ASC Topic 606 in a manner consistent with existing GAAP. Therefore, the adoption of these standards will not have a material impact on our consolidated financial statements and no cumulative effect adjustment will be recorded upon adoption.
In February 2016, the FASB issued an accounting standard classified under FASB ASC Topic 842, “Leases”. This accounting standard amends lease accounting by requiring the recognition of lease assets and lease liabilities by lessees for those leases classified as operating leases on the balance sheet and disclosing key information about leasing arrangements. This standard is effective for annual periods beginning after December 15, 2018, including interim periods within those fiscal years. Early application of the amendments in this standard is permitted. Management is currently evaluating the impact that this standard may have on our consolidated financial statements.
In August 2016, the FASB issued an accounting standard classified under FASB ASC Topic 230, “Statement of Cash Flows”. This accounting standard provides guidance on eight specific cash flow issues: (i) debt prepayment or debt extinguishment costs; (ii) settlement of zero-coupon debt instruments or other debt instruments with coupon interest rates that are insignificant in relation to the effective interest rate of the borrowing; (iii) contingent consideration payments made after a business combination; (iv) proceeds from the settlement of insurance claims; (v) proceeds from the settlement of corporate-owned life insurance policies, including bank-owned life insurance policies; (vi) distributions received from equity method investees; (vii) beneficial interests in securitization transactions; and (viii) separately identifiable cash flows and application of the predominance principle. The amendments are effective for fiscal years beginning after December 15, 2017, and interim periods within those fiscal years. We adopted these standards as of January 1, 2018. Management does not expect this standard to have a material impact to our consolidated statement of cash flows.
63
Independence Realty Trust, Inc. and Subsidiaries
Notes to Consolidated Financial Statements
As of December 31, 2017
(Dollars in thousands, except share and per share data)
In January 2017, the FASB issued an accounting standard update under FASB ASC Topic 805, “Business Combinations” that changes the definition of a business to assist entities with evaluating whether a set of transferred assets is a business. As a result, the accounting for acquisitions of real estate could be impacted. The updated standard will be effective for us on January 1, 2018. The new definition will be applied prospectively to any transactions occurring within the period of adoption. This standard was adopted on January 1, 2018. Management expects that the updated standard will result in fewer acquisitions of real estate meeting the definition of a business and fewer acquisition-related costs being expensed in the period incurred.
In February 2017, the FASB issued an accounting standard update under FASB ASC Topic 610 “Other Income.” The amendments in this update provide guidance for partial sales of nonfinancial assets, including partial sales of real estate. Historically, GAAP contained several different accounting models to evaluate whether the transfer of certain assets qualified for sale treatment. This new standard reduces the number of potential accounting models that might apply and clarifies which model does apply in various circumstances. Partial sales of nonfinancial assets are common in the real estate industry and include transactions in which the seller retains an equity interest in the entity that owns the assets or has an equity interest in the buyer. This update is effective for interim and annual periods beginning after December 15, 2017. We adopted this standard as of January 1, 2018. While this is common in the real estate industry, we have never participated in a transaction of this nature. Taking this into consideration, management does not believe this standard will have any impact on our consolidated financial statements at the time of adoption.
In May 2017, the FASB issued an accounting standard update under FASB ASC Topic 718, “Compensation – Stock Compensation.” The amendments in this update provide guidance about which changes to the terms or conditions of a share-based payment award require an entity to apply modification accounting in Topic 718. As a result, the accounting for share-based payment award transactions could be impacted. The updated standard will be effective for us on January 1, 2018. The new definition will be applied prospectively to an award modified on or after the adoption date. This standard was adopted on January 1, 2018. Management does not expect this standard to have a material impact on our consolidated financial statements at the time of adoption.
NOTE 3: Investments in Real Estate
As of December 31, 2017, our investments in real estate consisted of 52 apartment properties (unaudited). The table below summarizes our investments in real estate:
|
|
|
2017 |
|
|
2016 |
|
|
Depreciable Lives (In years) |
||
|
Land |
|
$ |
193,026 |
|
|
$ |
165,120 |
|
|
- |
|
Building |
|
|
1,279,777 |
|
|
|
1,066,611 |
|
|
40 |
|
Furniture, fixtures and equipment |
|
|
31,353 |
|
|
|
17,625 |
|
|
5-10 |
|
Total investment in real estate |
|
$ |
1,504,156 |
|
|
$ |
1,249,356 |
|
|
|
|
Accumulated depreciation |
|
|
(84,097 |
) |
|
|
(51,511 |
) |
|
|
|
Investments in real estate, net |
|
$ |
1,420,059 |
|
|
$ |
1,197,845 |
|
|
|
As of December 31, 2017 and 2016, we had investments in real estate valued at $0 and $60,786, respectively, classified as held for sale.
Acquisitions
The below table summarizes the acquisitions for the year ended December 31, 2017:
|
Property Name |
|
Date of Purchase |
|
Location |
|
Units (unaudited) |
|
|
Purchase Price |
|
||
|
Lakes of Northdale |
|
2/27/2017 |
|
Tampa, FL |
|
216 |
|
|
$ |
29,750 |
|
|
|
Haverford Place |
|
5/24/2017 |
|
Lexington, KY |
|
160 |
|
|
$ |
14,240 |
|
|
|
South Terrace (1) |
|
6/30/2017 |
|
Durham, NC |
|
328 |
|
|
$ |
42,950 |
|
|
|
Cherry Grove (2) |
|
9/26/2017 |
|
North Myrtle Beach, SC |
|
172 |
|
|
$ |
16,157 |
|
|
|
Riverchase (2) |
|
9/26/2017 |
|
Indianapolis, IN |
|
216 |
|
|
$ |
18,899 |
|
|
|
Kensington (2) |
|
9/26/2017 |
|
Canal Winchester, OH |
|
264 |
|
|
$ |
24,409 |
|
|
|
Schirm Farms (2) |
|
9/26/2017 |
|
Canal Winchester, OH |
|
264 |
|
|
$ |
23,749 |
|
|
|
Live Oak Trace (2) |
|
10/25/2017 |
|
Baton Rouge, LA |
|
264 |
|
|
$ |
28,501 |
|
|
|
Tides at Calabash (2) |
|
11/14/2017 |
|
Wilmington, NC |
|
168 |
|
|
$ |
14,269 |
|
|
|
Brunswick Point (2) |
|
12/12/2017 |
|
Wilmington, NC |
|
288 |
|
|
$ |
30,661 |
|
|
|
Total |
|
|
|
|
|
|
2,340 |
|
|
$ |
243,585 |
|
64
Independence Realty Trust, Inc. and Subsidiaries
Notes to Consolidated Financial Statements
As of December 31, 2017
(Dollars in thousands, except share and per share data)
|
|
(2) |
These properties were acquired as a part of our acquisition of a nine-community portfolio (the HPI Portfolio), totaling 2,353 units (unaudited), which we agreed to acquire on September 3, 2017 for a total purchase price of $228,144. In connection with the acquisition of these properties, we incurred defeasance costs totaling $3,624, which are included in Acquisition related debt extinguishment expenses within the Consolidated Statements of Operations. |
The following table summarizes the aggregate fair value of the assets and liabilities associated with the properties acquired, outside of the HPI Portfolio, during the year ended December 31, 2017, on the date of acquisition, accounted for under FASB ASC Topic 805.
|
Description |
|
Fair Value of Asset Acquired During the Year Ended December 31, 2017 |
|
|
|
Assets acquired: |
|
|
|
|
|
Investments in real estate |
|
$ |
86,012 |
|
|
Accounts receivable and other assets |
|
|
331 |
|
|
Intangible assets |
|
|
928 |
|
|
Total assets acquired |
|
$ |
87,271 |
|
|
Liabilities assumed: |
|
|
|
|
|
Indebtedness |
|
$ |
- |
|
|
Accounts payable and accrued expenses |
|
|
398 |
|
|
Accrued interest payable |
|
|
- |
|
|
Other liabilities |
|
|
150 |
|
|
Total liabilities assumed |
|
$ |
548 |
|
|
Estimated fair value of net assets acquired |
|
$ |
86,723 |
|
The following table summarizes the aggregate fair value of the assets and liabilities associated with the HPI Portfolio properties acquired during the year ended December 31, 2017, on the date of acquisition, accounted for under FASB ASC Topic 805.
|
Description |
|
Fair Value of Asset Acquired During the Year Ended December 31, 2017 |
|
|
|
Assets acquired: |
|
|
|
|
|
Investments in real estate |
|
$ |
155,059 |
|
|
Accounts receivable and other assets |
|
|
290 |
|
|
Intangible assets |
|
|
1,587 |
|
|
Total assets acquired |
|
$ |
156,936 |
|
|
Liabilities assumed: |
|
|
|
|
|
Indebtedness |
|
$ |
18,977 |
|
|
Accounts payable and accrued expenses |
|
|
1,479 |
|
|
Accrued interest payable |
|
|
- |
|
|
Other liabilities |
|
|
607 |
|
|
Total liabilities assumed |
|
$ |
21,063 |
|
|
Estimated fair value of net assets acquired |
|
$ |
135,873 |
|
The table below presents the revenue and net income, excluding any acquisition and defeasance costs, for the properties acquired during the year ended December 31, 2017 as reported in our consolidated financial statements.
65
Independence Realty Trust, Inc. and Subsidiaries
Notes to Consolidated Financial Statements
As of December 31, 2017
(Dollars in thousands, except share and per share data)
|
|
For the Year Ended December 31, 2017 |
|
||||||
|
Property |
|
Total revenue |
|
|
Net Income allocable to common shares |
|
||
|
Lakes of Northdale |
|
$ |
2,603 |
|
|
$ |
709 |
|
|
Haverford Place |
|
|
1,078 |
|
|
|
302 |
|
|
South Terrace |
|
|
2,071 |
|
|
|
379 |
|
|
Cherry Grove |
|
|
526 |
|
|
|
140 |
|
|
Riverchase |
|
|
533 |
|
|
|
70 |
|
|
Kensington |
|
|
736 |
|
|
|
187 |
|
|
Schirm Farms |
|
|
711 |
|
|
|
170 |
|
|
Live Oak Trace |
|
|
424 |
|
|
|
108 |
|
|
Tides at Calabash |
|
|
315 |
|
|
|
177 |
|
|
Brunswick Point |
|
|
137 |
|
|
|
24 |
|
|
Total |
|
$ |
9,134 |
|
|
$ |
2,266 |
|
The table below represents the revenue, net income and earnings per share effect of the properties acquired during the year ended December 31, 2017, as reported in our consolidated financial statements and on a pro forma basis as if the acquisition occurred on January 1, 2016. These pro forma results are not necessarily indicative of the results that actually would have occurred if the acquisition had occurred on the first day of the periods presented, nor does the pro forma financial information purport to represent the results of operations for future periods.
|
Description |
|
For the Year Ended December 31, 2017 |
|
|
For the Year Ended December 31, 2016 |
|
||
|
Pro forma total revenue (unaudited) |
|
$ |
177,642 |
|
|
$ |
177,412 |
|
|
Pro forma net income (loss) allocable to common shares (unaudited) |
|
|
36,219 |
|
|
|
(3,398 |
) |
|
Earnings (loss) per share attributable to common shareholders: |
|
|
|
|
|
|
|
|
|
Basic-pro forma (unaudited) |
|
$ |
0.49 |
|
|
$ |
(0.07 |
) |
|
Diluted-pro forma (unaudited) |
|
$ |
0.49 |
|
|
$ |
(0.07 |
) |
On May 1, 2015 we acquired a 236 unit (unaudited) residential community located in Indianapolis, Indiana known as Bayview Club. We acquired the property for an aggregate purchase price of $25,250 exclusive of closing costs.
On September 17, 2015 the merger with Trade Street Residential, or TSRE, closed. As part of this merger we acquired 19 properties containing 4,989 units (unaudited). Net assets acquired was $328,240 and fair value of the consideration transferred totaled $263,636, consisting of $109,857 of common shares and $13,998 of IRT OP units, and cash consideration of $139,781. As the fair value of the net assets acquired exceeded the fair value of the consideration, we recognized a gain from a bargain purchase of $64,604.
During 2016, we received additional information regarding estimates we had made for certain accrued expenses related to our acquisition of TSRE. This information led to an increase in the fair value of the net assets we acquired of $732, which was recognized during the year ended December 31, 2016.
In January 2018, we acquired two properties, Creekside and Hartshire, that had a total of 716 units (unaudited) for a combined purchase price of $71,498. These properties were the final two remaining properties that were a part of the HPI Portfolio
66
Independence Realty Trust, Inc. and Subsidiaries
Notes to Consolidated Financial Statements
As of December 31, 2017
(Dollars in thousands, except share and per share data)
acquisition. These properties were in Indianapolis, IN and Atlanta, GA. In January 2018, we also acquired The Chelsea, a 312-unit (unaudited) property in Columbus, OH, for $36,750.
Dispositions
The below table summarizes the dispositions for the year ended December 31, 2017 and also presents each property’s contribution to net income allocable to common shares, excluding the impact of the gain on sale:
|
|
|
|
|
|
|
|
|
|
|
|
|
Net income allocable to common shares |
|
|||||
|
Property Name |
|
Date of Sale |
|
Sale Price |
|
|
Gain (loss) on sale (1) |
|
|
For the Year Ended December 31, 2017 |
|
|
For the Year Ended December 31, 2016 |
|
||||
|
Copper Mill |
|
5/5/2017 |
|
$ |
32,000 |
|
|
$ |
15,595 |
|
|
$ |
548 |
|
|
$ |
1,105 |
|
|
Heritage Trace |
|
6/1/2017 |
|
|
11,600 |
|
|
|
(1,256 |
) |
|
|
240 |
|
|
|
(47 |
) |
|
Berkshire Square |
|
6/9/2017 |
|
|
16,000 |
|
|
|
1,510 |
|
|
|
201 |
|
|
|
306 |
|
|
Crossings |
|
11/28/2017 |
|
|
27,200 |
|
|
|
3,061 |
|
|
|
1,374 |
|
|
|
941 |
|
|
Total |
|
|
|
$ |
86,800 |
|
|
$ |
18,910 |
|
|
$ |
2,363 |
|
|
$ |
2,305 |
|
|
|
(1) |
The gain (loss) on sale for these properties is net of $4,251 of defeasance and debt prepayment premium costs. All properties were previously classified as held for sale. |
The below table summarizes the dispositions for the year ended December 31, 2016 and also presents each property’s contribution to net income (loss) allocable to common shares, excluding the impact of the gain (loss) on sale:
|
|
|
|
|
|
|
|
|
|
|
|
|
Property Name |
|
Date of Sale |
|
Sale Price |
|
|
Gain (loss) on sale |
|
||
|
Cumberland Glen (1) |
|
02/18/2016 |
|
$ |
18,000 |
|
|
$ |
2,452 |
|
|
Belle Creek |
|
04/07/2016 |
|
|
23,000 |
|
|
|
14,191 |
|
|
Tresa |
|
05/05/2016 |
|
|
47,000 |
|
|
|
15,142 |
|
|
Total |
|
|
|
$ |
88,000 |
|
|
$ |
31,785 |
|
|
|
(1) |
Gain (loss) on sale related to this property includes a defeasance premium of $1,343. |
On December 22, 2015, we disposed of one multi-family real estate property for a total sale price of $33,600. We recorded a gain on the sale of this asset of $6,420.
On October 15, 2015, we sold a parcel of land acquired in the TSRE merger for $3,350. After considering actual closing costs, we recognized a loss on the sale of this asset of $8.
NOTE 4: Indebtedness
The following tables contains summary information concerning our indebtedness as of December 31, 2017:
|
Debt: |
|
Outstanding Principal |
|
|
Unamortized Discount and Debt Issuance Costs |
|
|
Carrying Amount |
|
|
Type |
|
Weighted Average Rate |
|
|
Weighted Average Maturity (in years) |
|
|||||
|
Unsecured credit facility (1) |
|
$ |
104,005 |
|
|
$ |
(2,376 |
) |
|
$ |
101,629 |
|
|
Floating |
|
3.0% |
|
|
|
3.8 |
|
|
|
Term loan |
|
$ |
100,000 |
|
|
$ |
(895 |
) |
|
$ |
99,105 |
|
|
Floating |
|
3.2% |
|
|
|
6.9 |
|
|
|
Mortgages-Fixed rate |
|
|
580,635 |
|
|
|
(2,927 |
) |
|
|
577,708 |
|
|
Fixed |
|
3.7% |
|
|
|
5.8 |
|
|
|
Total Debt |
|
$ |
784,640 |
|
|
$ |
(6,198 |
) |
|
$ |
778,442 |
|
|
|
|
3.6% |
|
|
|
5.7 |
|
|
|
|
|
|
|
|
|
|
|
|
|
|
|
|
|
|
|
|
|
|
|
|
|
|
|
|
(1) |
The unsecured credit facility total capacity is $300,000, of which $104,005 was outstanding as of December 31, 2017. |
67
Independence Realty Trust, Inc. and Subsidiaries
Notes to Consolidated Financial Statements
As of December 31, 2017
(Dollars in thousands, except share and per share data)
|
|
Original maturities on or before December 31, |
|
||||||||||||||||||||||
|
Debt: |
|
2018 |
|
|
2019 |
|
|
2020 |
|
|
2021 |
|
|
2022 |
|
|
Thereafter |
|
||||||
|
Unsecured credit facility |
|
$ |
- |
|
|
$ |
- |
|
|
$ |
- |
|
|
$ |
54,005 |
|
|
$ |
50,000 |
|
|
$ |
- |
|
|
Term loan |
|
$ |
- |
|
|
$ |
- |
|
|
$ |
- |
|
|
$ |
- |
|
|
$ |
- |
|
|
$ |
100,000 |
|
|
Mortgages-Fixed rate |
|
|
3,251 |
|
|
|
4,660 |
|
|
|
7,611 |
|
|
|
102,598 |
|
|
|
73,757 |
|
|
|
388,758 |
|
|
Total |
|
$ |
3,251 |
|
|
$ |
4,660 |
|
|
$ |
7,611 |
|
|
$ |
156,603 |
|
|
$ |
123,757 |
|
|
$ |
488,758 |
|
|
|
|
|
|
|
|
|
|
|
|
|
|
|
|
|
|
|
|
|
|
|
|
|
|
|
As of December 31, 2017 we were in compliance with all financial covenants contained in our indebtedness.
The following tables contains summary information concerning our indebtedness as of December 31, 2016:
|
Debt: |
|
Outstanding Principal |
|
|
Unamortized Discount and Debt Issuance Costs |
|
|
Carrying Amount |
|
|
Type |
|
Weighted Average Rate |
|
|
Weighted Average Maturity (in years) |
|
|||||
|
Secured credit facility (1) |
|
$ |
150,000 |
|
|
$ |
(2,720 |
) |
|
$ |
147,280 |
|
|
Floating |
|
|
3.0% |
|
|
|
1.7 |
|
|
Mortgages-Fixed rate |
|
|
600,188 |
|
|
|
(3,651 |
) |
|
|
596,537 |
|
|
Fixed |
|
|
3.8% |
|
|
|
6.7 |
|
|
Total Debt |
|
$ |
750,188 |
|
|
$ |
(6,371 |
) |
|
$ |
743,817 |
|
|
|
|
|
3.6% |
|
|
|
5.7 |
|
|
|
(1) |
The secured credit facility total capacity was $312,500, of which $150,000 was outstanding as of December 31, 2016. |
Credit Facility
On September 17, 2015, we entered into a credit agreement with KeyBank with respect to a $325,000 senior secured credit facility, or the secured credit facility. We incurred upfront costs of $4,722 associated with this facility that were capitalized as deferred financing costs. The secured credit facility consisted of a revolving line of credit in an amount of up to $125,000 and a term loan in an amount of no less than $200,000.
On December 21, 2016, we entered into an Increase Agreement with KeyBank which amended the terms of the previous secured credit facility. The amended agreement increased the revolving line of credit to $172,500, which reflected the conversion of a portion of the term loan line of credit which had previously been repaid and was therefore unavailable for re-borrowing into availability under the revolving line of credit. The amended revised amount of the secured facility total capacity was $312,500. The other features of the facility remained the same.
On May 1, 2017, we closed on a new $300,000 unsecured credit facility, refinancing and terminating the previous secured credit facility. The new unsecured facility is comprised of a $50,000 term loan and a revolving commitment of up to $250,000. Additionally, we have the right to increase the aggregate amount of the unsecured credit facility to up to $500,000. The maturity date on the new term loan is May 1, 2022. The maturity date on borrowings outstanding under the revolving commitment is May 1, 2021, subject to our option to extend the revolving commitment for two additional 6-month periods under certain circumstances. We may prepay the unsecured credit facility, in whole or in part, at any time without prepayment fee or penalty. At our option, borrowings under the unsecured credit facility will bear interest at a rate equal to either (i) the 1-month LIBOR rate plus a margin of 130 to 220 basis points, or (ii) a base rate plus a margin of 30 to 120 basis points. The applicable margin is determined based upon our total consolidated leverage ratio. In addition, we pay a fee of either 15 basis points (if greater than or equal to 50% of the revolver is used) or 25 basis points (if less than 50% of the revolver is used) on the unused portion of the revolver. The unsecured credit facility requires regular interest only payments. We recognized the refinance as a partial extinguishment of our prior secured credit facility and recognized a loss on extinguishment of debt of $572.
In addition to certain negative covenants, our unsecured credit facility with Key Bank has financial covenants that require us to (i) maintain a consolidated leverage ratio below thresholds described in the debt agreement, (ii) maintain a minimum consolidated fixed charge coverage ratio, (iii) maintain a minimum consolidated tangible net worth, and (iv) maintain a minimum liquidity amount. Additionally, the covenants (i) limit (a) the amount of distributions that IRT can make to a percentage of Funds from Operations (as such term is described in the debt agreement), (b) the amount of recourse indebtedness that may be incurred by us, and (c) the amount of unhedged variable rate indebtedness that may be incurred by us, and (ii) require us to maintain a pool of unencumbered properties with an occupancy level of not less than 85%.
68
Independence Realty Trust, Inc. and Subsidiaries
Notes to Consolidated Financial Statements
As of December 31, 2017
(Dollars in thousands, except share and per share data)
In January 2018, we drew down $68,000 on the unsecured credit facility in connection with the acquisition of the final two properties in the HPI Portfolio and The Chelsea.
Term Loan
On September 17, 2015, we entered into a credit agreement with KeyBank with respect to a $120,000 senior interim term loan facility, or the interim facility. We incurred upfront deferred costs of $2,092 associated with this interim facility. On June 24, 2016, the interim facility was amended to replace the interim term loan facility with a $40,000 senior secured term loan. Upon entering into the senior secured term loan, we borrowed $40,000, using $416 to pay closing costs and $33,512 to repay the remaining balance under the interim facility. The maturity date of the senior secured term loan was September 17, 2018, subject to acceleration in the event of customary events of default. The term loan required monthly interest only payments. The senior secured term loan was repaid in October 2016.
On November 20, 2017, we entered into a loan agreement for a $100,000 unsecured term loan that will mature in November 2024. We incurred upfront deferred costs of $917 associated with this facility. The unsecured term loan requires monthly interest only payments. The interest rate on the unsecured term loan is LIBOR plus a spread of 1.60% - 2.50% based on our consolidated leverage ratio. The proceeds from this loan reduced borrowings then outstanding under the revolving portion of our unsecured credit facility.
Mortgages-Fixed Rate
On December 12, 2017, in connection with our acquisition of our Brunswick Point property, we assumed a $19,000 loan secured by a first mortgage on the property. The loan bears interest at a rate of 4.4% per annum, provides for monthly payments of interest only through May 2019, when principal and interest payments will be due monthly based on a 30-year amortization schedule, and matures May 2025. This loan was recorded at its fair value of $18,977 based on a discounted cash flows valuation technique. As this technique utilizes current credit spreads, which are generally unobservable, this is classified as a Level 3 fair value measurement within the fair value hierarchy.
On January 3, 2018, in connection with our acquisition of our Hartshire property, we assumed a $16,000 loan secured by a first mortgage on the property. The loan bears interest at a rate of 4.68% per annum, provides for monthly payments of interest only through January 2019, when principal and interest payments will be due monthly based on a 30-year amortization schedule, and matures January 2025.
On January 3, 2018, in connection with our acquisition of our Creekside property, we assumed a $23,500 loan secured by a first mortgage on the property. The loan bears interest at a rate of 4.56% per annum, provides for monthly payments of interest only through January 2019, when principal and interest payments will be due monthly based on a 30-year amortization schedule, and matures January 2025.
During the year ended December 31, 2017, in connection with four property dispositions, we extinguished property mortgages totaling $35,901.
In February of 2016, we repaid $6,659 of mortgage indebtedness as part of the disposition of our Cumberland property.
In March of 2016, we repaid $43,694 of mortgage indebtedness related to the Oklahoma City portfolio of properties we acquired in 2014 through a refinancing whereby IROP drew down on the secured credit facility.
On May 26, 2016, we entered into a loan agreement for a $25,050 loan secured by a first mortgage on our Aston property. The loan bears interest at a rate of 3.4% per annum, provides for monthly payments of interest only through December 2019, when principal and interest payments will be due monthly based on a 30-year amortization schedule, and matures June 2023.
On May 17, 2016, we entered into a loan agreement for a $31,250 loan secured by a first mortgage on our Avenues at Craig Ranch property. The loan bears interest at a rate of 3.3% per annum, provides for monthly payments of interest only through May 2019, when principal and interest payments will be due monthly based on a 30-year amortization schedule, and matures June 2023.
On May 20, 2016, we entered into a loan agreement for a $49,680 loan secured by a first mortgage on our Waterstone at Big Creek property. The loan bears interest at a rate of 3.7% per annum, provides for monthly payments of interest only through June 2019, when principal and interest payments will be due monthly based on a 30-year amortization schedule, and matures June 2026.
On January 27, 2015, we entered into a loan agreement for a $22,900 loan secured by a first mortgage on our Iron Rock Ranch property. The loan bears interest at a rate of 3.4% per annum, provides for monthly payments of interest only until the maturity date of February 1, 2025.
69
Independence Realty Trust, Inc. and Subsidiaries
Notes to Consolidated Financial Statements
As of December 31, 2017
(Dollars in thousands, except share and per share data)
On April 13, 2015, we entered into a loan agreement for a $20,527 loan secured by a first mortgage on our Stonebridge at the Ranch property. The loan bears interest at a rate of 3.2% per annum, provides for monthly payments of interest only until the maturity date of May 1, 2025.
On September 17, 2015, in connection with the TSRE Merger, we acquired Creekstone at RTP and assumed an existing loan secured by the property with a fair value of $23,250. The loan bears interest at a fixed rate of 3.9% per annum, provides for monthly payments of interest only through June 10, 2016 when principal and interest payments will be due monthly based on a 30-year amortization schedule, and matures on June 10, 2023.
On September 17, 2015, in connection with the TSRE Merger, we acquired Fountains Southend and assumed an existing loan secured by the property with a fair value of $23,750. The loan bears interest at a fixed rate of 4.3% per annum, provides for monthly payments of interest only through February 5, 2017 when principal and interest payments will be due monthly based on a 30-year amortization schedule, and matures on February 5, 2024.
On September 17, 2015, in connection with the TSRE Merger, we acquired IRT Millenia and assumed an existing loan secured by the property with a fair value of $25,000. The loan bears interest at a fixed rate of 3.8% per annum, provides for monthly payments of interest only through April 5, 2018 when principal and interest payments will be due monthly based on a 30-year amortization schedule, and matures on March 5, 2021. In connection with our acquisition of IRT Millenia, we also entered into a supplemental loan agreement for a $4,175 loan secured by the property. The supplemental loan bears interest at a fixed rate of 4.3% per annum, provides for monthly payments of interest only through May 5, 2018 when principal and interest payments will be due monthly based on a 30-year amortization schedule, and matures on March 5, 2021.
On September 17, 2015, in connection with the TSRE Merger, we acquired Talison Row and assumed an existing loan secured by the property with a fair value of $33,635. The loan bears interest at a fixed rate of 4.1% per annum, provides for monthly payments of interest only through September 10, 2016. Beginning September 11, 2016 principal and interest payments are required monthly based on a 30 year amortization schedule until the maturity date of September 10, 2023.
On September 17, 2015, in connection with the TSRE Merger, we acquired Aventine Greenville and entered into a loan agreement for $30,600 secured by the property. The loan bears interest at a fixed rate of 3.2% per annum, provides for monthly payments of interest only through November 4, 2016. Beginning November 5, 2016 principal and interest payments are required monthly based on a 30 year amortization schedule until the maturity date of March 5, 2021.
On September 17, 2015, in connection with the TSRE Merger, we acquired Waterstone at Brier Creek and assumed an existing loan secured by the property with a fair value of $16,250. The loan bears interest at a fixed rate of 3.7% per annum, provides for monthly payments of interest only through the maturity date of April 5, 2022. In connection with our acquisition of Waterstone at Brier Creek, we also entered into a supplemental loan agreement for a $4,175 loan secured by the property. The supplemental loan bears interest at a fixed rate of 4.2% per annum, provides for monthly payments of interest only until the maturity date of April 5, 2022.
NOTE 5: Derivative Financial Instruments
We have and may in the future use derivative financial instruments to hedge all or a portion of the interest rate risk associated with our borrowings. The principal objective of such arrangements is to minimize the risks and/or costs associated with our operating and financial structure as well as to hedge specific anticipated transactions. While these instruments may impact our periodic cash flows, they benefit us by minimizing the risks and/or costs previously described. The counterparties to these contractual arrangements are major financial institutions with which we and our affiliates may also have other financial relationships. In the event of nonperformance by the counterparties, we are potentially exposed to credit loss. However, because of the high credit ratings of the counterparties, we do not anticipate that any of the counterparties will fail to meet their obligations.
The following table summarizes the aggregate notional amount and estimated net fair value of our derivative instruments as of December 31, 2017 and December 31, 2016:
70
Independence Realty Trust, Inc. and Subsidiaries
Notes to Consolidated Financial Statements
As of December 31, 2017
(Dollars in thousands, except share and per share data)
|
|
December 31, 2017 |
|
|
As of December 31, 2016 |
|
|||||||||||||||||||
|
|
|
Notional |
|
|
Fair Value of Assets |
|
|
Fair Value of Liabilities |
|
|
Notional |
|
|
Fair Value of Assets |
|
|
Fair Value of Liabilities |
|
||||||
|
Cash flow hedges: |
|
|
|
|
|
|
|
|
|
|
|
|
|
|
|
|
|
|
|
|
|
|
|
|
|
Interest rate swap |
|
$ |
150,000 |
|
|
$ |
4,700 |
|
|
$ |
— |
|
|
$ |
150,000 |
|
|
$ |
3,867 |
|
|
$ |
— |
|
|
Interest rate collar |
|
|
50,000 |
|
|
|
1,297 |
|
|
|
— |
|
|
|
— |
|
|
|
— |
|
|
|
— |
|
|
|
|
|
200,000 |
|
|
|
5,997 |
|
|
|
— |
|
|
|
150,000 |
|
|
|
3,867 |
|
|
|
— |
|
|
Freestanding derivatives: |
|
|
|
|
|
|
|
|
|
|
|
|
|
|
|
|
|
|
|
|
|
|
|
|
|
Interest rate cap |
|
|
— |
|
|
|
— |
|
|
|
— |
|
|
|
200,000 |
|
|
|
— |
|
|
|
— |
|
|
Interest rate collar |
|
|
50,000 |
|
|
|
1,294 |
|
|
|
— |
|
|
|
— |
|
|
|
— |
|
|
|
— |
|
|
Net fair value |
|
$ |
250,000 |
|
|
$ |
7,291 |
|
|
$ |
— |
|
|
$ |
350,000 |
|
|
$ |
3,867 |
|
|
$ |
— |
|
Interest rate swap
On June 24, 2016, we entered into an interest rate swap contract with a notional value of $150,000, a strike rate of 1.145% and a maturity date of June 17, 2021. We designated this interest rate swap as a cash flow hedge at inception and determined that the hedge is highly effective in offsetting interest rate fluctuations associated with the identified indebtedness. We did not recognize any ineffectiveness associated with this cash flow hedge through April 2017. On April 17, 2017, in conjunction with the refinance of our credit facility, we restructured our existing interest rate swap to remove the LIBOR floor. This resulted in a decrease in the strike rate to 1.1325%. The notional value and maturity date remained the same. We designated the restructured interest rate swap as a cash flow hedge at inception and determined that the hedge is highly effective in offsetting interest rate fluctuations associated with the identified indebtedness. Upon our early adoption of accounting standard updates to ASC Topic 815, “Derivatives and Hedging”, ineffectiveness is no longer measured or reported.
Interest rate collar
On November 17, 2017, in connection with our new $100,000 unsecured term loan, we purchased an interest rate collar with a notional value of $100,000, a 2.00% cap and 1.25% floor, and a maturity date of November 17, 2024. We designated $50,000 of the interest rate collar as a cash flow hedge at inception and determined that the hedge is highly effective in offsetting interest rate fluctuations associated with the identified indebtedness. We concluded that this hedging relationship was and will continue to be highly effective using the hypothetical derivative method.
The other $50,000 notional value interest rate collar was accounted for as a freestanding derivative from inception. During the year ended December 31, 2017, we recognized a $94 gain within other income (expense) in our consolidated statements of operations reflecting the change in fair value of the instrument from its inception date through December 31, 2017. On January 4, 2018, we designated this other $50,000 notional value interest rate collar as a cash flow hedge and determined that the hedge is highly effective in offsetting interest rate fluctuations associated with the identified indebtedness.
Interest rate cap
On September 30, 2015, we entered into an interest rate cap contract with a notional value of $200,000, a strike rate of 3.0% based on 1-month LIBOR, which had a maturity date of October 17, 2017 and therefore was not outstanding as of December 31, 2017. Through June 23, 2016, this interest rate cap was designated as a cash flow hedge. Through that date, we concluded that this hedging relationship was highly effective in offsetting interest rate fluctuations associated with the identified indebtedness and, using the hypothetical derivative method, did not recognize any ineffectiveness. On June 24, 2016, this interest rate cap was de-designated and, as of June 30, 2016, this interest rate cap was accounted for as a freestanding derivative.
Effective interest rate swaps, caps and collars are reported in accumulated other comprehensive income and the fair value of these hedge agreements is included in other assets or other liabilities.
For interest rate swaps, caps, and collars that are considered effective hedges, we reclassified realized losses of $107, $492 and $0 to earnings within interest expense for the twelve months ended December 31, 2017, 2016 and 2015, respectively. For interest rate swaps and caps that are considered effective hedges, we expect $954 to be reclassified out of accumulated other comprehensive income to earnings over the next 12 months.
71
Independence Realty Trust, Inc. and Subsidiaries
Notes to Consolidated Financial Statements
As of December 31, 2017
(Dollars in thousands, except share and per share data)
NOTE 6: Stockholder Equity and Noncontrolling Interest
Stockholder Equity
On August 4, 2017, we entered into an At-the-Market Issuance Sales Agreement (the “ATM Sales Agreement”) with various sales agents. Pursuant to the ATM Sales Agreement, we may offer and sell shares of our common stock, $0.01 par value per share, having an aggregate offering price of up to $150,000, from time to time through the sales agents. The sales agents are entitled to compensation in an agreed amount not to exceed 2.0% of the gross sales price per share for any shares sold from time to time under the ATM Sales Agreement. We have no obligation to sell any of the shares under the ATM Sales Agreement and may at any time suspend solicitations and offers under the ATM Sales Agreement. During the year ended December 31, 2017, 1,164,900 shares were issued at an average price of $10.38 per share, resulting in $11,851 of net proceeds, after deducting $242 of commissions.
On September 11, 2017, we issued 12,500,000 shares of our common stock at a public offering price of $9.25 per share. We also closed on the underwriters’ option to purchase an additional 1,875,000 shares of common stock at the public offering price. As a result of the offering and exercise or the underwriters’ option, we received approximately $126,100 in net proceeds, after deducting the underwriting discount and offering expenses.
Effective the first quarter of 2018, we will be transitioning to a quarterly distribution of cash dividends on our common stock.
Our board of directors declared the following dividends in 2017:
|
Month |
|
Declaration Date |
|
Record Date |
|
Payment Date |
|
Dividend Declared Per Share |
|
|
|
January 2017 |
|
January 12, 2017 |
|
January 31, 2017 |
|
February 15, 2017 |
|
$ |
0.06 |
|
|
February 2017 |
|
January 12, 2017 |
|
February 28, 2017 |
|
March 15, 2017 |
|
$ |
0.06 |
|
|
March 2017 |
|
January 12, 2017 |
|
March 31, 2017 |
|
April 17, 2017 |
|
$ |
0.06 |
|
|
April 2017 |
|
April 12, 2017 |
|
April 28, 2017 |
|
May 15, 2017 |
|
$ |
0.06 |
|
|
May 2017 |
|
April 12, 2017 |
|
May 31, 2017 |
|
June 15, 2017 |
|
$ |
0.06 |
|
|
June 2017 |
|
April 12, 2017 |
|
June 30, 2017 |
|
July 17, 2017 |
|
$ |
0.06 |
|
|
July 2017 |
|
July 14, 2017 |
|
July 31, 2017 |
|
August 15, 2017 |
|
$ |
0.06 |
|
|
August 2017 |
|
July 14, 2017 |
|
August 31, 2017 |
|
September 15, 2017 |
|
$ |
0.06 |
|
|
September 2017 |
|
July 14, 2017 |
|
September 29, 2017 |
|
October 13, 2017 |
|
$ |
0.06 |
|
|
October 2017 |
|
October 12, 2017 |
|
October 31, 2017 |
|
November 15, 2017 |
|
$ |
0.06 |
|
|
November 2017 |
|
October 12, 2017 |
|
November 30, 2017 |
|
December 15, 2017 |
|
$ |
0.06 |
|
|
December 2017 |
|
October 12, 2017 |
|
December 29, 2017 |
|
January 15, 2018 |
|
$ |
0.06 |
|
72
Independence Realty Trust, Inc. and Subsidiaries
Notes to Consolidated Financial Statements
As of December 31, 2017
(Dollars in thousands, except share and per share data)
Our board of directors declared the following dividends in 2016:
|
Month |
|
Declaration Date |
|
Record Date |
|
Payment Date |
|
Dividend Declared Per Share |
|
|
|
January 2016 |
|
January 14, 2016 |
|
January 29, 2016 |
|
February 16, 2016 |
|
$ |
0.06 |
|
|
February 2016 |
|
January 14, 2016 |
|
February 29, 2016 |
|
March 15, 2016 |
|
$ |
0.06 |
|
|
March 2016 |
|
January 14, 2016 |
|
March 31, 2016 |
|
April 15, 2016 |
|
$ |
0.06 |
|
|
April 2016 |
|
April 14, 2016 |
|
April 29, 2016 |
|
May 16, 2016 |
|
$ |
0.06 |
|
|
May 2016 |
|
April 14, 2016 |
|
May 31, 2016 |
|
June 15, 2016 |
|
$ |
0.06 |
|
|
June 2016 |
|
April 14, 2016 |
|
June 30, 2016 |
|
July 15, 2016 |
|
$ |
0.06 |
|
|
July 2016 |
|
July 14, 2016 |
|
July 29, 2016 |
|
August 15, 2016 |
|
$ |
0.06 |
|
|
August 2016 |
|
July 14, 2016 |
|
August 31, 2016 |
|
September 15, 2016 |
|
$ |
0.06 |
|
|
September 2016 |
|
July 14, 2016 |
|
September 30, 2016 |
|
October 17, 2016 |
|
$ |
0.06 |
|
|
October 2016 |
|
October 12, 2016 |
|
October 31, 2016 |
|
November 15, 2016 |
|
$ |
0.06 |
|
|
November 2016 |
|
October 12, 2016 |
|
November 30, 2016 |
|
December 15, 2016 |
|
$ |
0.06 |
|
|
December 2016 |
|
October 12, 2016 |
|
December 30, 2016 |
|
January 17, 2017 |
|
$ |
0.06 |
|
Noncontrolling Interest
In June 2017, we issued 166,604 IROP units in connection with our acquisition of South Terrace. The IROP units were valued at $1,654 based on the price of our common stock. See Note 3: Investments in Real Estate for details on the property acquisition.
During 2017, holders of IROP units exchanged 64,202 units for 64,202 shares of our common stock.
During 2016, holders of IROP units exchanged 245,982 units for 245,980 shares of our common stock.
As of December 31, 2017, 3,011,351 IROP units held by unaffiliated third parties remain outstanding with a redemption value of $30,385, based on IRT’s stock price of $10.09 as of December 29, 2017. In January 2018, holders of IROP units exchanged 186,717 units for 186,717 shares of our common stock.
Effective the first quarter of 2018, we will be transitioning to a quarterly distribution of cash dividends on our operating partnership’s LP units.
Our board of directors declared the following distributions on our operating partnership’s LP units during 2017:
|
Month |
|
Declaration Date |
|
Record Date |
|
Payment Date |
|
Dividend Declared Per Share |
|
|
|
January 2017 |
|
January 12, 2017 |
|
January 31, 2017 |
|
February 15, 2017 |
|
$ |
0.06 |
|
|
February 2017 |
|
January 12, 2017 |
|
February 28, 2017 |
|
March 15, 2017 |
|
$ |
0.06 |
|
|
March 2017 |
|
January 12, 2017 |
|
March 31, 2017 |
|
April 17, 2017 |
|
$ |
0.06 |
|
|
April 2017 |
|
April 12, 2017 |
|
April 28, 2017 |
|
May 15, 2017 |
|
$ |
0.06 |
|
|
May 2017 |
|
April 12, 2017 |
|
May 31, 2017 |
|
June 15, 2017 |
|
$ |
0.06 |
|
|
June 2017 |
|
April 12, 2017 |
|
June 30, 2017 |
|
July 17, 2017 |
|
$ |
0.06 |
|
|
July 2017 |
|
July 14, 2017 |
|
July 31, 2017 |
|
August 15, 2017 |
|
$ |
0.06 |
|
|
August 2017 |
|
July 14, 2017 |
|
August 31, 2017 |
|
September 15, 2017 |
|
$ |
0.06 |
|
|
September 2017 |
|
July 14, 2017 |
|
September 29, 2017 |
|
October 13, 2017 |
|
$ |
0.06 |
|
|
October 2017 |
|
October 12, 2017 |
|
October 31, 2017 |
|
November 15, 2017 |
|
$ |
0.06 |
|
|
November 2017 |
|
October 12, 2017 |
|
November 30, 2017 |
|
December 15, 2017 |
|
$ |
0.06 |
|
|
December 2017 |
|
October 12, 2017 |
|
December 29, 2017 |
|
January 15, 2018 |
|
$ |
0.06 |
|
73
Independence Realty Trust, Inc. and Subsidiaries
Notes to Consolidated Financial Statements
As of December 31, 2017
(Dollars in thousands, except share and per share data)
Our board of directors declared the following distributions on our operating partnership’s LP units during 2016:
|
Month |
|
Declaration Date |
|
Record Date |
|
Payment Date |
|
Dividend Declared Per Share |
|
|
|
January 2016 |
|
January 14, 2016 |
|
January 29, 2016 |
|
February 16, 2016 |
|
$ |
0.06 |
|
|
February 2016 |
|
January 14, 2016 |
|
February 29, 2016 |
|
March 15, 2016 |
|
$ |
0.06 |
|
|
March 2016 |
|
January 14, 2016 |
|
March 31, 2016 |
|
April 15, 2016 |
|
$ |
0.06 |
|
|
April 2016 |
|
April 14, 2016 |
|
April 29, 2016 |
|
May 16, 2016 |
|
$ |
0.06 |
|
|
May 2016 |
|
April 14, 2016 |
|
May 31, 2016 |
|
June 15, 2016 |
|
$ |
0.06 |
|
|
June 2016 |
|
April 14, 2016 |
|
June 30, 2016 |
|
July 15, 2016 |
|
$ |
0.06 |
|
|
July 2016 |
|
July 14, 2016 |
|
July 29, 2016 |
|
August 15, 2016 |
|
$ |
0.06 |
|
|
August 2016 |
|
July 14, 2016 |
|
August 31, 2016 |
|
September 15, 2016 |
|
$ |
0.06 |
|
|
September 2016 |
|
July 14, 2016 |
|
September 30, 2016 |
|
October 17, 2016 |
|
$ |
0.06 |
|
|
October 2016 |
|
October 12, 2016 |
|
October 31, 2016 |
|
November 15, 2016 |
|
$ |
0.06 |
|
|
November 2016 |
|
October 12, 2016 |
|
November 30, 2016 |
|
December 15, 2016 |
|
$ |
0.06 |
|
|
December 2016 |
|
October 12, 2016 |
|
December 30, 2016 |
|
January 17, 2017 |
|
$ |
0.06 |
|
NOTE 7: Equity Compensation Plans
Long Term Incentive Plan
In May 2016, our shareholders approved and our board of directors adopted an amended and restated Long Term Incentive Plan, or the incentive plan, which provides for the grants of awards to our directors, officers and full-time employees, full-time employees of our former advisor and its affiliates, full-time employees of entities that provide services to our former advisor, directors of our former advisor or of entities that provide services to it, certain of our consultants and certain consultants to our former advisor and its affiliates or to entities that provide services to our former advisor. The incentive plan authorizes the grant of restricted or unrestricted shares of our common stock, non-qualified and incentive stock options, restricted stock units, stock appreciation rights, dividend equivalents and other stock- or cash-based awards. In conjunction with the amendment, the number of shares of common stock issuable under the incentive plan was increased to 4,300,000 shares and the term of the incentive plan was extended to May 12, 2026.
Under the incentive plan or predecessor incentive plans, we have granted restricted shares and stock appreciation rights, or SARs, to employees and employees of our former advisor. These awards generally vested over a three or four year period. In addition, we have granted unrestricted shares to our directors. These awards generally vested immediately.
For the years ended December 31, 2017, 2016 and 2015 we recognized $1,968, $1,222 and $495 of stock compensation expense, respectively.
A summary of the restricted common share awards activity of the incentive plan is presented below.
|
|
2017 |
|
|
2016 |
|
|
2015 |
|
|||||||||||||||
|
|
Number of Shares |
|
|
Weighted Average Grant Date Fair Value Per Share |
|
|
Number of Shares |
|
|
Weighted Average Grant Date Fair Value Per Share |
|
|
Number of Shares |
|
|
Weighted Average Grant Date Fair Value Per Share |
|
||||||
|
Balance, January 1, |
|
281,005 |
|
|
$ |
6.99 |
|
|
|
117,000 |
|
|
$ |
9.13 |
|
|
|
36,000 |
|
|
$ |
8.20 |
|
|
Granted |
|
168,010 |
|
|
|
9.17 |
|
|
|
228,000 |
|
|
|
6.33 |
|
|
|
112,000 |
|
|
|
9.30 |
|
|
Vested |
|
(142,748 |
) |
|
|
7.68 |
|
|
|
(60,661 |
) |
|
|
8.62 |
|
|
|
(24,000 |
) |
|
|
8.55 |
|
|
Forfeited |
|
(10,420 |
) |
|
|
8.56 |
|
|
|
(3,334 |
) |
|
|
7.47 |
|
|
|
(7,000 |
) |
|
|
9.02 |
|
|
Balance, December 31, |
|
295,847 |
|
|
$ |
7.84 |
|
|
|
281,005 |
|
|
$ |
6.99 |
|
|
|
117,000 |
|
|
$ |
9.13 |
|
|
|
|
|
|
|
|
|
|
|
|
|
|
|
|
|
|
|
|
|
|
|
|
|
|
74
Independence Realty Trust, Inc. and Subsidiaries
Notes to Consolidated Financial Statements
As of December 31, 2017
(Dollars in thousands, except share and per share data)
As of December 31, 2017, the unearned compensation cost relating to unvested restricted common share awards was $1,463. The estimated fair value of restricted common share awards vested during 2017 and 2016 was $1,319 and $427, respectively.
A summary of the SARs activity of the incentive plan is presented below.
|
|
2017 |
|
|
2016 |
|
|
2015 |
|
|
|
|
|||||||||||
|
|
SARs |
|
|
Weighted Average Exercise Price |
|
|
SARs |
|
|
Weighted Average Exercise Price |
|
|
SARs |
|
Weighted Average Exercise Price |
|
||||||
|
Outstanding, January 1, |
|
337,000 |
|
|
$ |
9.15 |
|
|
|
351,000 |
|
|
$ |
9.13 |
|
|
|
72,000 |
|
$ |
8.20 |
|
|
Granted |
|
— |
|
|
|
— |
|
|
|
— |
|
|
|
— |
|
|
|
300,000 |
|
|
9.35 |
|
|
Expired |
|
— |
|
|
|
— |
|
|
|
(2,000 |
) |
|
|
9 |
|
|
|
— |
|
|
— |
|
|
Exercised |
|
(84,000 |
) |
|
|
8.78 |
|
|
|
(8,000 |
) |
|
|
8.20 |
|
|
|
(2,000 |
) |
|
8.20 |
|
|
Forfeited |
|
(3,000 |
) |
|
|
9.35 |
|
|
|
(4,000 |
) |
|
|
9.35 |
|
|
|
(19,000 |
) |
|
9.11 |
|
|
Outstanding, December 31, |
|
250,000 |
|
|
$ |
9.28 |
|
|
|
337,000 |
|
|
$ |
9.15 |
|
|
|
351,000 |
|
$ |
9.13 |
|
|
SARs exercisable at December 31, |
|
160,000 |
|
|
|
|
|
|
|
128,998 |
|
|
|
|
|
|
|
22,000 |
|
|
|
|
|
|
|
|
|
|
|
|
|
|
|
|
|
|
|
|
|
|
|
|
|
|
|
|
As of December 29, 2017, our closing common stock price was $10.09, which exceeds the exercise prices of all outstanding SARs. The exercise prices of outstanding SARs ranges from $8.20-$9.35. The weighted average contractual life of outstanding SARs is 2.07 years. The weighted average contractual life of exercisable SARs is 2.03 years. The total intrinsic value of SARs outstanding and exercisable at December 31, 2017 was $203. As of December 31, 2017, there was no unearned compensation cost relating to unvested SAR awards.
Our assumptions used in computing the fair value of the SARs issued during the year ended December 31, 2015 using the Black-Scholes Option Pricing Model, are summarized below. There were no SARs issued during the years ended December 31, 2017 and 2016.
|
|
As of December 31, |
|
|
|
|
2015 |
|
|
|
Stock Price |
$ |
7.51 |
|
|
Strike Price |
$ 8.20-9.35 |
|
|
|
Risk-free interest rate |
1.1 - 1.2% |
|
|
|
Dividend yield |
|
9.6 |
% |
|
Volatility |
|
34 |
% |
|
Expected term |
1.7 - 2.5 years |
|
|
The following table summarizes the PSUs granted for the year ended December 31, 2017:
|
|
|
|
|
|
|
|
|
|
|
|
|
|
|
|
|
|
|
Grant Date |
|
Type of PSUs Granted |
|
Number of PSUs Granted |
|
|
Performance Period Commencement Date |
|
Performance Period End Date |
|
Grant Date Fair Value |
|
Number of PSUs Outstanding as of December 31, 2017 |
|
||
|
February 28, 2017 |
|
Relative 3-year TSR vs NAREIT Apartment Index |
|
|
135,881 |
|
|
January 1, 2018 |
|
December 31, 2020 |
|
4.83 |
|
|
135,881 |
|
|
February 28, 2017 |
|
Absolute 3-Year TSR |
|
|
45,294 |
|
|
January 1, 2018 |
|
December 31, 2020 |
|
3.13 |
|
|
45,294 |
|
|
July 26, 2017 |
|
Strategic Objectives |
|
|
45,294 |
|
|
January 1, 2018 |
|
December 31, 2020 |
|
9.87 |
|
|
45,294 |
|
Our assumptions used in computing the fair value of the PSUs at the dates of their respective awards, using the Monte Carlo method, were as follows:
75
Independence Realty Trust, Inc. and Subsidiaries
Notes to Consolidated Financial Statements
As of December 31, 2017
(Dollars in thousands, except share and per share data)
|
|
|
|
|
|
|
|
For the year ended December 31, 2017 |
|
|
|
|
Dividend yield |
|
8.1 |
% |
|
|
Volatility |
|
27.0 |
% |
(a) |
|
Expected term |
2.8 years |
|
|
|
|
|
(a) |
This represents the volatility assumption used for IRT. The volatility assumptions used for our peer group and the NAREIT Mortgage Index ranged from 19% to 28%. |
The Company estimates future expenses associated with PSUs outstanding at December 31, 2017 to be $751, which will be recognized over a weighted-average period of 2.2 years.
On February 8, 2018, our compensation committee awarded 93,700 restricted stock awards, valued at $8.37 per share, or $784 in the aggregate to non-executive employees. These restricted stock awards vest over a three-year period.
NOTE 8: 2016 Management Internalization
On December 20, 2016, we completed our management internalization, which consisted of two parts: (i) our acquisition of our external advisor, which was a subsidiary of RAIT, and (ii) our acquisition of substantially all of its assets and the assumption of certain liabilities relating to the multifamily property management business of RAIT, including property management contracts relating to apartment properties owned by us, RAIT and third parties.
In accounting for the management internalization transaction, we first evaluated the net assets that were acquired. We also considered pre-existing relationships that were settled as part of the transaction, which included the advisory agreement and our properties’ property management agreements. In evaluating the amount by which these contracts were favorable or unfavorable to us, we compared the actual amounts historically paid and that would be owed under these agreements to a range of potential market arrangements and then applying a discount rate to the two sets of cash flows. The most significant difference between our agreements and the potential markets arrangements observed was our inability to terminate the advisory agreement until October 1, 2020 as well as the advisory agreement’s termination fee. The impact of this difference led to the conclusion that these agreements were unfavorable to us, on a present value basis, by more than $43,000, which was the purchase price for the management internalization.
Accordingly, the difference between estimated fair value of the net assets acquired of $143 and the consideration transferred of $43,000 represents the settlement of pre-existing relationships between us and RAIT. Accordingly, the difference of $42,857 was recognized as a loss in our income statement as management internalization expense.
As part of our management internalization, we incurred $2,119 of acquisition-related expenses. These acquisition-related expenses were recognized in earnings immediately and are included within management internalization expense.
NOTE 9: Related Party Transactions and Arrangements
Fees and Expenses Paid to Our Former Advisor
On December 20, 2016, in connection with our management internalization, we acquired our former advisor and, therefore, fees and expenses to our former advisor are no longer incurred.
For the years ended December 31, 2017, 2016 and 2015, our former advisor earned $0, $7,092, and $4,984 of asset management fees, respectively. These fees are included within general and administrative expenses in our consolidated statements of operations.
For the years ended December 31, 2017, 2016 and 2015, our former advisor earned $0, $350 and $629 of incentive fees, respectively. These fees are included within general and administrative expenses in our consolidated statements of operations.
For the years ended December 31, 2017, 2016 and 2015, we incurred costs of $727, $0 and $0, respectively, with respect to our shared services agreement with our former advisor, under which our former advisor provided us with certain back office support services. The term of the share services agreement was from December 21, 2016 to June 20, 2017, and the associated fees are included within general and administrative expenses in our consolidated statements of operations.
76
Independence Realty Trust, Inc. and Subsidiaries
Notes to Consolidated Financial Statements
As of December 31, 2017
(Dollars in thousands, except share and per share data)
Property Management Fees Paid to Our Former Property Manager and Earned from RAIT
On December 20, 2016, in connection with our management internalization, we acquired property management agreements with respect to each of our properties from RAIT Residential, our former property manager, which is wholly owned by RAIT. Subsequent to this transaction, we earned $257 of property management fees from RAIT for the year ended December 31, 2017.
For the years ended December 31, 2017, 2016 and 2015, our former property manager earned $0, $4,769, and $3,675, respectively, of property management and leasing fees.
Dividends Paid to Affiliates of Our Former Advisor
On October 5, 2016, we repurchased and retired all 7,269,719 shares of our common stock owned by subsidiaries of RAIT.
Since October 5, 2016, RAIT has not owned any shares of our common stock. For the years ended December 31, 2017, 2016 and 2015, we declared and subsequently paid dividends of $0, $3,926 and $5,234, respectively, related to shares of common stock owned by subsidiaries of RAIT.
RAIT Indebtedness
In the second quarter of 2016, we repaid $38,075 of mortgage indebtedness with proceeds from two property dispositions. This indebtedness was held by RAIT. Total interest expense paid to RAIT for the years ended December 31, 2017, 2016 and 2015 was $0, $361 and $965, respectively.
South Terrace Acquisition
In June 2017, we acquired South Terrace, a 328-unit property in Durham, NC for $42,950 from a joint venture, of which a subsidiary of RAIT was a controlling member. For further information, see Note 3: Investment in Real Estate.
NOTE 10: Earnings (Loss) Per Share
The following table presents a reconciliation of basic and diluted earnings (loss) per share for the years ended December 31, 2017, 2016 and 2015:
|
|
|
For the Years Ended December 31, |
|
|||||||||
|
|
|
2017 |
|
|
2016 |
|
|
2015 |
|
|||
|
Net Income (loss) |
|
$ |
31,441 |
|
|
$ |
(9,555 |
) |
|
$ |
30,156 |
|
|
(Income) loss allocated to non-controlling interests |
|
|
(1,235 |
) |
|
|
(246 |
) |
|
|
(1,914 |
) |
|
Net Income (loss) allocable to common shares |
|
|
30,206 |
|
|
|
(9,801 |
) |
|
|
28,242 |
|
|
Weighted-average shares outstanding—Basic |
|
|
73,338,219 |
|
|
|
52,182,427 |
|
|
|
36,153,673 |
|
|
Dilutive securities |
|
|
261,650 |
|
|
|
- |
|
|
|
6,601 |
|
|
Weighted-average shares outstanding—Diluted |
|
|
73,599,869 |
|
|
|
52,182,427 |
|
|
|
36,160,274 |
|
|
Earnings (loss) per share—Basic |
|
$ |
0.41 |
|
|
$ |
(0.19 |
) |
|
$ |
0.78 |
|
|
Earnings (loss) per share—Diluted |
|
$ |
0.41 |
|
|
$ |
(0.19 |
) |
|
$ |
0.78 |
|
Certain IROP units and unvested shares totaling 3,011,351, 3,175,720, and 3,156,184 for the years ended December 31, 2017, 2016 and 2015, respectively, were excluded from the earnings (loss) per share computation because their effect would have been anti-dilutive.
77
Independence Realty Trust, Inc. and Subsidiaries
Notes to Consolidated Financial Statements
As of December 31, 2017
(Dollars in thousands, except share and per share data)
NOTE 11: Quarterly Financial Data (Unaudited)
The following table summarizes our quarterly financial data which, in the opinion of management, reflects all adjustments, consisting only of normal recurring adjustments, necessary for a fair presentation of our results of operations:
|
|
|
For the Three-Month Periods Ended |
|
|||||||||||||
|
|
|
March 31 |
|
|
June 30 |
|
|
September 30 |
|
|
December 31 |
|
||||
|
2017: |
|
|
|
|
|
|
|
|
|
|
|
|
|
|
|
|
|
Total revenue |
|
$ |
39,142 |
|
|
$ |
39,561 |
|
|
$ |
40,066 |
|
|
$ |
42,447 |
|
|
Net income (loss) |
|
|
4,245 |
|
|
|
19,521 |
|
|
|
1,156 |
|
|
|
6,519 |
|
|
Net income (loss) allocable to common shares |
|
|
4,077 |
|
|
|
18,739 |
|
|
|
1,097 |
|
|
|
6,293 |
|
|
Total earnings (loss) per share—Basic (1) |
|
$ |
0.06 |
|
|
$ |
0.27 |
|
|
$ |
0.02 |
|
|
$ |
0.08 |
|
|
Total earnings (loss) per share—Diluted (1) |
|
$ |
0.06 |
|
|
$ |
0.27 |
|
|
$ |
0.02 |
|
|
$ |
0.08 |
|
|
2016: |
|
|
|
|
|
|
|
|
|
|
|
|
|
|
|
|
|
Total revenue |
|
$ |
38,666 |
|
|
$ |
38,327 |
|
|
$ |
38,364 |
|
|
$ |
38,031 |
|
|
Net income (loss) |
|
|
(46 |
) |
|
|
30,790 |
|
|
|
2,407 |
|
|
|
(42,706 |
) |
|
Net income (loss) allocable to common shares |
|
|
(75 |
) |
|
|
28,987 |
|
|
|
2,267 |
|
|
|
(40,980 |
) |
|
Total earnings (loss) per share—Basic (1) |
|
$ |
— |
|
|
$ |
0.61 |
|
|
$ |
0.05 |
|
|
$ |
(0.61 |
) |
|
Total earnings (loss) per share—Diluted (1) |
|
$ |
— |
|
|
$ |
0.61 |
|
|
$ |
0.05 |
|
|
$ |
(0.61 |
) |
|
|
|
|
|
|
|
|
|
|
|
|
|
|
|
|
|
|
|
|
(1) |
The summation of quarterly per share amounts do not equal the full year amounts. |
NOTE 12: SEGMENT REPORTING
Segments
We have identified one operating segment and have determined that we have one reportable segment. As a group, our executive officers act as the Chief Operating Decision Maker or CODM. The CODM reviews operating results to make decisions about all investments and resources and to assess performance for the entire company. Our portfolio consists of one reportable segment, investments in real estate through the mechanism of ownership. The CODM manages and reviews our operations as one unit. Resources are allocated without regard to the underlying structure of any investment, but rather after evaluating such economic characteristics as returns on investment, leverage ratios, current portfolio mix, degrees of risk, income tax consequences and opportunities for growth.
NOTE 13: COMMITMENTS AND CONTINGENCIES
Litigation
We are subject to various legal proceedings and claims that arise in the ordinary course of our business operations. Matters which arise out of allegations of bodily injury, property damage, and employment practices are generally covered by insurance. While the resolution of these matters cannot be predicted with certainty, we currently believe the final outcome of such matters will not have a material adverse effect on our financial position, results of operations or cash flows.
Other Matters
To the extent that a natural disaster or similar event occurs with more than a remote risk of having a material impact on the consolidated financial statements, we will disclose the estimated range of possible outcomes, and, if an outcome is probable, accrue an appropriate liability.
Lease Obligations
We lease office space in Philadelphia, PA and Chicago, IL. As of December 31, 2017, the annual minimum rent due pursuant to these leases for each of the next five years and thereafter is estimated to be $285, $189, $133, $0, $0, and $0, respectively.
78
Schedule III - Real Estate and Accumulated Depreciation
As of December 31, 2017
(Dollars in thousands)
|
|
|
|
|
|
|
|
|
|
|
|
|
Cost of |
|
|
Gross Carrying |
|
|
Accumulated |
|
|
Encumbrances |
|
|
|
|
|
|
|
||||||||||||
|
Property |
|
|
|
Initial Cost |
|
|
Improvements, |
|
|
Amount |
|
|
Depreciation- |
|
|
(Unpaid |
|
|
Year of |
|
Life of |
|
||||||||||||||||||
|
Name |
|
Location |
|
Land |
|
|
Building |
|
|
Land |
|
|
Building |
|
|
Land |
|
|
Building |
|
|
Building |
|
|
Principal) |
|
|
Acquisition |
|
Depreciation |
|
|||||||||
|
Crestmont |
|
Marietta, GA |
|
$ |
3,254 |
|
|
$ |
13,017 |
|
|
$ |
- |
|
|
$ |
1,285 |
|
|
$ |
3,254 |
|
|
$ |
14,302 |
|
|
$ |
(3,800 |
) |
|
$ |
(6,326 |
) |
|
2011 |
|
|
40 |
|
|
Runaway Bay |
|
Indianapolis, IN |
|
|
3,079 |
|
|
|
12,318 |
|
|
|
- |
|
|
|
869 |
|
|
|
3,079 |
|
|
|
13,187 |
|
|
|
(1,998 |
) |
|
|
(9,423 |
) |
|
2012 |
|
|
40 |
|
|
Reserve at Eagle Ridge |
|
Waukegan, IL |
|
|
5,800 |
|
|
|
22,743 |
|
|
|
- |
|
|
|
908 |
|
|
|
5,800 |
|
|
|
23,651 |
|
|
|
(2,484 |
) |
|
|
(18,850 |
) |
|
2014 |
|
|
40 |
|
|
Windrush |
|
Edmond, OK |
|
|
1,677 |
|
|
|
7,464 |
|
|
|
- |
|
|
|
452 |
|
|
|
1,677 |
|
|
|
7,916 |
|
|
|
(843 |
) |
|
|
- |
|
|
2014 |
|
|
40 |
|
|
Heritage Park |
|
Oklahoma, OK |
|
|
4,234 |
|
|
|
12,232 |
|
|
|
- |
|
|
|
1,328 |
|
|
|
4,234 |
|
|
|
13,560 |
|
|
|
(1,584 |
) |
|
|
- |
|
|
2014 |
|
|
40 |
|
|
Raindance |
|
Oklahoma, OK |
|
|
3,503 |
|
|
|
10,051 |
|
|
|
- |
|
|
|
1,187 |
|
|
|
3,503 |
|
|
|
11,238 |
|
|
|
(1,311 |
) |
|
|
- |
|
|
2014 |
|
|
40 |
|
|
Augusta |
|
Oklahoma, OK |
|
|
1,296 |
|
|
|
9,930 |
|
|
|
- |
|
|
|
619 |
|
|
|
1,296 |
|
|
|
10,549 |
|
|
|
(1,143 |
) |
|
|
- |
|
|
2014 |
|
|
40 |
|
|
Invitational |
|
Oklahoma, OK |
|
|
1,924 |
|
|
|
16,852 |
|
|
|
- |
|
|
|
868 |
|
|
|
1,924 |
|
|
|
17,720 |
|
|
|
(1,901 |
) |
|
|
- |
|
|
2014 |
|
|
40 |
|
|
Kings Landing |
|
Creve Coeur, MO |
|
|
2,513 |
|
|
|
29,873 |
|
|
|
- |
|
|
|
601 |
|
|
|
2,513 |
|
|
|
30,474 |
|
|
|
(2,914 |
) |
|
|
(20,992 |
) |
|
2014 |
|
|
40 |
|
|
Carrington |
|
Little Rock, AR |
|
|
1,715 |
|
|
|
19,526 |
|
|
|
- |
|
|
|
1,208 |
|
|
|
1,715 |
|
|
|
20,734 |
|
|
|
(2,090 |
) |
|
|
(14,235 |
) |
|
2014 |
|
|
40 |
|
|
Arbors |
|
Ridgeland, MS |
|
|
4,050 |
|
|
|
15,946 |
|
|
|
- |
|
|
|
1,134 |
|
|
|
4,050 |
|
|
|
17,080 |
|
|
|
(1,780 |
) |
|
|
(13,150 |
) |
|
2014 |
|
|
40 |
|
|
Walnut Hill |
|
Cordova, TN |
|
|
2,230 |
|
|
|
25,251 |
|
|
|
- |
|
|
|
912 |
|
|
|
2,230 |
|
|
|
26,163 |
|
|
|
(2,400 |
) |
|
|
(18,650 |
) |
|
2014 |
|
|
40 |
|
|
Lenox Place |
|
Raleigh, NC |
|
|
3,480 |
|
|
|
20,482 |
|
|
|
- |
|
|
|
682 |
|
|
|
3,480 |
|
|
|
21,164 |
|
|
|
(1,880 |
) |
|
|
(15,991 |
) |
|
2014 |
|
|
40 |
|
|
Stonebridge Crossing |
|
Memphis, TN |
|
|
3,100 |
|
|
|
26,223 |
|
|
|
- |
|
|
|
1,356 |
|
|
|
3,100 |
|
|
|
27,579 |
|
|
|
(2,479 |
) |
|
|
(19,370 |
) |
|
2014 |
|
|
40 |
|
|
Bennington Pond |
|
Groveport, OH |
|
|
2,400 |
|
|
|
14,828 |
|
|
|
- |
|
|
|
819 |
|
|
|
2,400 |
|
|
|
15,647 |
|
|
|
(1,375 |
) |
|
|
(11,375 |
) |
|
2014 |
|
|
40 |
|
|
Prospect Park |
|
Louisville, KY |
|
|
2,837 |
|
|
|
11,193 |
|
|
|
- |
|
|
|
286 |
|
|
|
2,837 |
|
|
|
11,479 |
|
|
|
(911 |
) |
|
|
(9,230 |
) |
|
2014 |
|
|
40 |
|
|
Brookside |
|
Louisville, KY |
|
|
3,947 |
|
|
|
16,502 |
|
|
|
- |
|
|
|
592 |
|
|
|
3,947 |
|
|
|
17,094 |
|
|
|
(1,380 |
) |
|
|
(13,455 |
) |
|
2014 |
|
|
40 |
|
|
Jamestown |
|
Louisville, KY |
|
|
7,034 |
|
|
|
27,730 |
|
|
|
- |
|
|
|
2,373 |
|
|
|
7,034 |
|
|
|
30,103 |
|
|
|
(2,463 |
) |
|
|
(22,880 |
) |
|
2014 |
|
|
40 |
|
|
Oxmoor |
|
Louisville, KY |
|
|
7,411 |
|
|
|
47,095 |
|
|
|
- |
|
|
|
1,230 |
|
|
|
7,411 |
|
|
|
48,325 |
|
|
|
(3,854 |
) |
|
|
(35,815 |
) |
|
2014 |
|
|
40 |
|
|
Meadows |
|
Louisville, KY |
|
|
6,857 |
|
|
|
30,030 |
|
|
|
- |
|
|
|
1,337 |
|
|
|
6,857 |
|
|
|
31,367 |
|
|
|
(2,528 |
) |
|
|
(24,245 |
) |
|
2014 |
|
|
40 |
|
|
Stonebridge at the Ranch |
|
Little Rock, AR |
|
|
3,315 |
|
|
|
27,954 |
|
|
|
- |
|
|
|
721 |
|
|
|
3,315 |
|
|
|
28,675 |
|
|
|
(2,213 |
) |
|
|
(20,527 |
) |
|
2014 |
|
|
40 |
|
|
Iron Rock Ranch |
|
Austin, TX |
|
|
5,860 |
|
|
|
28,911 |
|
|
|
- |
|
|
|
819 |
|
|
|
5,860 |
|
|
|
29,730 |
|
|
|
(2,384 |
) |
|
|
(22,900 |
) |
|
2014 |
|
|
40 |
|
|
Bayview Club |
|
Indianapolis, IN |
|
|
2,525 |
|
|
|
22,506 |
|
|
|
- |
|
|
|
989 |
|
|
|
2,525 |
|
|
|
23,495 |
|
|
|
(1,638 |
) |
|
|
- |
|
|
2015 |
|
|
40 |
|
|
Arbors River Oaks |
|
Memphis, TN |
|
|
2,100 |
|
|
|
19,045 |
|
|
|
- |
|
|
|
789 |
|
|
|
2,100 |
|
|
|
19,834 |
|
|
|
(1,228 |
) |
|
|
- |
|
|
2015 |
|
|
40 |
|
|
Aston |
|
Wake Forest, NC |
|
|
3,450 |
|
|
|
34,333 |
|
|
|
- |
|
|
|
222 |
|
|
|
3,450 |
|
|
|
34,555 |
|
|
|
(1,970 |
) |
|
|
(25,050 |
) |
|
2015 |
|
|
40 |
|
|
Avenues at Craig Ranch |
|
McKinney, TX |
|
|
5,500 |
|
|
|
42,054 |
|
|
|
- |
|
|
|
259 |
|
|
|
5,500 |
|
|
|
42,313 |
|
|
|
(2,413 |
) |
|
|
(31,250 |
) |
|
2015 |
|
|
40 |
|
|
Bridge Pointe |
|
Huntsville, AL |
|
|
1,500 |
|
|
|
14,306 |
|
|
|
- |
|
|
|
319 |
|
|
|
1,500 |
|
|
|
14,625 |
|
|
|
(860 |
) |
|
|
- |
|
|
2015 |
|
|
40 |
|
|
Creekstone at RTP |
|
Durham, NC |
|
|
5,376 |
|
|
|
32,727 |
|
|
|
- |
|
|
|
247 |
|
|
|
5,376 |
|
|
|
32,974 |
|
|
|
(1,887 |
) |
|
|
(22,581 |
) |
|
2015 |
|
|
40 |
|
|
Fountains Southend |
|
Charlotte, NC |
|
|
4,368 |
|
|
|
37,254 |
|
|
|
- |
|
|
|
142 |
|
|
|
4,368 |
|
|
|
37,396 |
|
|
|
(2,118 |
) |
|
|
(23,388 |
) |
|
2015 |
|
|
40 |
|
|
Fox Trails |
|
Plano, TX |
|
|
5,700 |
|
|
|
21,944 |
|
|
|
- |
|
|
|
669 |
|
|
|
5,700 |
|
|
|
22,613 |
|
|
|
(1,356 |
) |
|
|
- |
|
|
2015 |
|
|
40 |
|
|
Lakeshore on the Hill |
|
Chattanooga, TN |
|
|
925 |
|
|
|
10,212 |
|
|
|
- |
|
|
|
372 |
|
|
|
925 |
|
|
|
10,584 |
|
|
|
(634 |
) |
|
|
- |
|
|
2015 |
|
|
40 |
|
|
Millenia 700 |
|
Orlando, FL |
|
|
5,500 |
|
|
|
41,752 |
|
|
|
- |
|
|
|
401 |
|
|
|
5,500 |
|
|
|
42,153 |
|
|
|
(2,403 |
) |
|
|
(29,175 |
) |
|
2015 |
|
|
40 |
|
|
Miller Creek at German Town |
|
Memphis, TN |
|
|
3,300 |
|
|
|
53,504 |
|
|
|
- |
|
|
|
244 |
|
|
|
3,300 |
|
|
|
53,748 |
|
|
|
(3,048 |
) |
|
|
- |
|
|
2015 |
|
|
40 |
|
|
Pointe at Canyon Ridge |
|
Atlanta, GA |
|
|
11,100 |
|
|
|
36,995 |
|
|
|
- |
|
|
|
1,855 |
|
|
|
11,100 |
|
|
|
38,850 |
|
|
|
(2,341 |
) |
|
|
- |
|
|
2015 |
|
|
40 |
|
|
St James at Goose Creek |
|
Goose Creek, SC |
|
|
3,780 |
|
|
|
27,695 |
|
|
|
- |
|
|
|
390 |
|
|
|
3,780 |
|
|
|
28,085 |
|
|
|
(1,661 |
) |
|
|
- |
|
|
2015 |
|
|
40 |
|
|
Talison Row at Daniel Island |
|
Daniel Island, SC |
|
|
5,480 |
|
|
|
41,409 |
|
|
|
- |
|
|
|
336 |
|
|
|
5,480 |
|
|
|
41,745 |
|
|
|
(2,392 |
) |
|
|
(32,848 |
) |
|
2015 |
|
|
40 |
|
|
The Aventine Greenville |
|
Greenville, SC |
|
|
4,150 |
|
|
|
43,905 |
|
|
|
- |
|
|
|
178 |
|
|
|
4,150 |
|
|
|
44,083 |
|
|
|
(2,488 |
) |
|
|
(29,825 |
) |
|
2015 |
|
|
40 |
|
|
Trails at Signal Mountain |
|
Chattanooga, TN |
|
|
1,200 |
|
|
|
12,895 |
|
|
|
- |
|
|
|
403 |
|
|
|
1,200 |
|
|
|
13,298 |
|
|
|
(806 |
) |
|
|
- |
|
|
2015 |
|
|
40 |
|
|
Vue at Knoll Trail |
|
Dallas, TX |
|
|
3,100 |
|
|
|
6,077 |
|
|
|
- |
|
|
|
178 |
|
|
|
3,100 |
|
|
|
6,255 |
|
|
|
(377 |
) |
|
|
- |
|
|
2015 |
|
|
40 |
|
|
Waterstone at Brier Creek |
|
Raleigh, NC |
|
|
4,200 |
|
|
|
34,651 |
|
|
|
- |
|
|
|
184 |
|
|
|
4,200 |
|
|
|
34,835 |
|
|
|
(1,985 |
) |
|
|
(20,425 |
) |
|
2015 |
|
|
40 |
|
|
Waterstone Big Creek |
|
Alpharetta, GA |
|
|
7,600 |
|
|
|
61,971 |
|
|
|
- |
|
|
|
187 |
|
|
|
7,600 |
|
|
|
62,158 |
|
|
|
(3,518 |
) |
|
|
(49,680 |
) |
|
2015 |
|
|
40 |
|
|
Westmont Commons |
|
Asheville, NC |
|
|
2,750 |
|
|
|
25,225 |
|
|
|
- |
|
|
|
344 |
|
|
|
2,750 |
|
|
|
25,569 |
|
|
|
(1,493 |
) |
|
|
- |
|
|
2015 |
|
|
40 |
|
|
Lakes at Northdale |
|
Tampa, FL |
|
|
3,898 |
|
|
|
25,543 |
|
|
|
- |
|
|
|
426 |
|
|
|
3,898 |
|
|
|
25,969 |
|
|
|
(546 |
) |
|
|
- |
|
|
2017 |
|
|
40 |
|
|
Haverford Place |
|
Lexington, KY |
|
|
3,927 |
|
|
|
10,100 |
|
|
|
- |
|
|
|
355 |
|
|
|
3,927 |
|
|
|
10,455 |
|
|
|
(158 |
) |
|
|
- |
|
|
2017 |
|
|
40 |
|
|
South Terrace |
|
Durham, NC |
|
|
5,621 |
|
|
|
36,923 |
|
|
|
- |
|
|
|
166 |
|
|
|
5,621 |
|
|
|
37,089 |
|
|
|
(467 |
) |
|
|
- |
|
|
2017 |
|
|
40 |
|
|
Cherry Grove |
|
North Myrtle Beach, SC |
|
|
550 |
|
|
|
15,369 |
|
|
|
- |
|
|
|
24 |
|
|
|
550 |
|
|
|
15,393 |
|
|
|
(96 |
) |
|
|
- |
|
|
2017 |
|
|
40 |
|
|
Kensington Commons |
|
Canal Winchester, OH |
|
|
3,400 |
|
|
|
20,703 |
|
|
|
- |
|
|
|
21 |
|
|
|
3,400 |
|
|
|
20,724 |
|
|
|
(130 |
) |
|
|
- |
|
|
2017 |
|
|
40 |
|
|
Schirm Farms |
|
Canal Winchester, OH |
|
|
3,960 |
|
|
|
19,488 |
|
|
|
- |
|
|
|
38 |
|
|
|
3,960 |
|
|
|
19,526 |
|
|
|
(122 |
) |
|
|
- |
|
|
2017 |
|
|
40 |
|
|
Riverchase |
|
Indianapolis, IN |
|
|
1,460 |
|
|
|
17,250 |
|
|
|
- |
|
|
|
17 |
|
|
|
1,460 |
|
|
|
17,267 |
|
|
|
(108 |
) |
|
|
- |
|
|
2017 |
|
|
40 |
|
|
Live Oak Trace |
|
Baton Rouge, LA |
|
|
1,060 |
|
|
|
27,362 |
|
|
|
- |
|
|
|
9 |
|
|
|
1,060 |
|
|
|
27,371 |
|
|
|
(114 |
) |
|
|
- |
|
|
2017 |
|
|
40 |
|
|
Tides at Calabash |
|
Wilmington, NC |
|
|
1,880 |
|
|
|
12,214 |
|
|
|
- |
|
|
|
3 |
|
|
|
1,880 |
|
|
|
12,217 |
|
|
|
(25 |
) |
|
|
- |
|
|
2017 |
|
|
40 |
|
|
Brunswick Point |
|
Wilmington, NC |
|
|
2,150 |
|
|
|
28,214 |
|
|
|
- |
|
|
|
- |
|
|
|
2,150 |
|
|
|
28,214 |
|
|
|
- |
|
|
|
(19,000 |
) |
|
2017 |
|
|
40 |
|
|
Total Investment in Real Estate |
|
|
|
$ |
193,026 |
|
|
$ |
1,279,777 |
|
|
$ |
- |
|
|
$ |
31,353 |
|
|
$ |
193,026 |
|
|
$ |
1,311,130 |
|
|
$ |
(84,097 |
) |
|
$ |
(580,635 |
) |
|
|
|
|
|
|
79
|
Investments in Real Estate |
|
For the Year Ended December 31, 2017 |
|
|
For the Year Ended December 31, 2016 |
|
|
For the Year Ended December 31, 2015 |
|
|||
|
Balance, beginning of period |
|
$ |
1,319,350 |
|
|
$ |
1,372,015 |
|
|
$ |
689,112 |
|
|
Additions during period: |
|
|
|
|
|
|
|
|
|
|
|
|
|
Acquisitions |
|
|
241,071 |
|
|
|
— |
|
|
|
707,268 |
|
|
Improvements to land and building |
|
|
14,368 |
|
|
|
10,664 |
|
|
|
8,941 |
|
|
Deductions during period: |
|
|
|
|
|
|
|
|
|
|
|
|
|
Dispositions of real estate |
|
|
(70,633 |
) |
|
|
(63,329 |
) |
|
|
(33,306 |
) |
|
Reclassification to held for sale |
|
|
— |
|
|
|
(69,994 |
) |
|
|
— |
|
|
Balance, end of period: |
|
$ |
1,504,156 |
|
|
$ |
1,249,356 |
|
|
$ |
1,372,015 |
|
|
Balance, end of period - held for sale: |
|
$ |
— |
|
|
$ |
69,994 |
|
|
$ |
— |
|
|
Accumulated Depreciation |
|
For the Year Ended December 31, 2017 |
|
|
For the Year Ended December 31, 2016 |
|
|
For the Year Ended December 31, 2015 |
|
|||
|
Balance, beginning of period |
|
$ |
60,719 |
|
|
$ |
39,638 |
|
|
$ |
23,376 |
|
|
Depreciation expense |
|
|
32,586 |
|
|
|
31,085 |
|
|
|
20,888 |
|
|
Dispositions of real estate |
|
|
(9,208 |
) |
|
|
(10,004 |
) |
|
|
(4,626 |
) |
|
Reclassification to held for sale |
|
|
— |
|
|
|
(9,208 |
) |
|
|
— |
|
|
Balance, end of period: |
|
$ |
84,097 |
|
|
$ |
51,511 |
|
|
$ |
39,638 |
|
|
Balance, end of period - held for sale: |
|
$ |
— |
|
|
$ |
9,208 |
|
|
$ |
— |
|
80
None.
Disclosure Controls and Procedures
We maintain disclosure controls and procedures that are designed to ensure that information required to be disclosed in our reports under the Securities Exchange Act of 1934, as amended, or the Exchange Act, is recorded, processed, summarized, and reported within the time periods specified in the SEC’s rules and forms, and that such information is accumulated and communicated to our management, including our chief executive officer and our chief financial officer, as appropriate, to allow timely decisions regarding required disclosure. In designing and evaluating the disclosure controls and procedures, our management recognized that any controls and procedures, no matter how well designed and operated, can provide only reasonable assurance of achieving the desired control objectives, and our management necessarily was required to apply its judgment in evaluating the cost-benefit relationship of possible controls and procedures.
Under the supervision of our chief executive officer and chief financial officer and with the participation of our disclosure committee, we have carried out an evaluation of the effectiveness of our disclosure controls and procedures as of the end of the period covered by this report. Based upon that evaluation, our chief executive officer and chief financial officer determined that our disclosure controls and procedures are effective at the reasonable assurance level.
Management’s Annual Report on Internal Control over Financial Reporting
Our management is responsible for establishing and maintaining adequate internal control over financial reporting as defined in Rules 13a-15(f) and 15d-15(f) under the Exchange Act. Because of its inherent limitations, internal control over financial reporting may not prevent or detect misstatements. Projections of any evaluation of effectiveness to future periods are subject to the risks that controls may become inadequate because of changes in conditions, or that the degree of compliance with the policies or procedures may deteriorate.
Management assessed the effectiveness of our internal control over financial reporting as of December 31, 2017. In making this assessment, management used the criteria set forth by the Committee of Sponsoring Organizations of the Treadway Commission (COSO) in Internal Control – Integrated Framework (2013 Framework). Based on this assessment, management believes that, as of December 31, 2017, our internal control over financial reporting is effective.
Our independent registered public accounting firm has issued an attestation report on our internal control over financial reporting. This report is included as part of Item 8 in this annual report on Form 10-K.
Changes in Internal Control Over Financial Reporting
There were no changes in our internal control over financial reporting or in other factors during our last fiscal quarter that have materially affected, or were reasonably likely to materially affect, our internal control over financial reporting.
The disclosure below is intended to satisfy any obligation of ours to provide disclosures pursuant to Form 8-K, Item 5.02 “Departure of Directors or Certain Officers; Election of Directors; Appointment of Certain Officers; Compensatory Arrangements of Certain Officers.”
Item 5.02. Departure of Directors or Certain Officers; Election of Directors; Appointment of Certain Officers; Compensatory Arrangements of Certain Officers.
Effective February 22, 2018, our board of directors approved the promotion of Jason R. Delozier to serve as IRT’s chief accounting officer. Upon Mr. Delozier’s promotion, he became IRT’s principal accounting officer and James J. Sebra ceased to be IRT’s principal accounting officer. Mr. Sebra continues to serve as IRT’s chief financial officer and treasurer and in those capacities, continues to serve as IRT’s principal financial officer. There have been no transactions regarding Mr. Delozier that are required to be disclosed by IRT pursuant to Item 404(a) of Regulation S-K. There was no material plan, contract or arrangement to which Mr. Delozier is a party or in which he participated that was entered into, or material amendment thereto, in connection with his promotion, or any grant or award to Mr. Delozier or modification thereto, under any such plan, contract or arrangement in connection with such promotion.
81
Jason R. Delozier, age 34, has served as our Chief Accounting Officer since February 2018 and as our Controller from June 2017 to February 2018. Prior to joining IRT, Mr. Delozier was the Controller at RAIT Financial Trust, a publicly traded REIT and IRT’s former advisor, from September 2015 to June 2017. Previously, Mr. Delozier was Director of Financial Reporting at Ascensus, Inc., a private-equity owned financial services provider, from May 2013 to September 2015. From 2005 to 2013, Mr. Delozier worked for KPMG LLP, a national public accounting firm, serving a variety of financial institutions. Mr. Delozier is a Certified Public Accountant in Pennsylvania.
The information required by this item will be set forth in our definitive proxy statement with respect to our 2018 annual meeting of stockholders, and is incorporated herein by reference.
The information required by this item will be set forth in our definitive proxy statement with respect to our 2018 annual meeting of stockholders, and is incorporated herein by reference.
|
ITEM 12. |
Security Ownership of Certain Beneficial Owners and Management and Related Stockholder Matters |
The information required by this item will be set forth in our definitive proxy statement with respect to our 2018 annual meeting of stockholders, and is incorporated herein by reference.
The information required by this item will be set forth in our definitive proxy statement with respect to our 2018 annual meeting of stockholders, and is incorporated herein by reference.
The information required by this item will be set forth in our definitive proxy statement with respect to our 2018 annual meeting of stockholders, and is incorporated herein by reference.
The following documents are filed as part of this report:
|
1. |
Consolidated Financial Statements |
Index to Consolidated Financial Statements
Independence Realty Trust, Inc.
Report of Independent Registered Public Accounting Firm.
Consolidated Balance Sheets as of December 31, 2017 and 2016.
Consolidated Statements of Operations for the years ended December 31, 2017, 2016 and 2015.
Consolidated Statements of Changes in Equity for the years ended December 31, 2017, 2016 and 2015.
Consolidated Statements of Cash Flows for the years ended December 31, 2017, 2016 and 2015.
Notes to Consolidated Financial Statements.
|
2. |
Financial Statement Schedules |
Schedule III: Real Estate and Accumulated Depreciation
82
All other schedules are not applicable.
|
3. |
Exhibits |
The following exhibits are filed as part of, or incorporated by reference into, this Annual Report on Form 10-K.
|
|
|
EXHIBIT INDEX
|
|
Exhibit |
|
Description |
|
1.1 |
|
|
|
2.1 |
|
|
|
|
|
|
|
2.2 |
|
|
|
|
|
|
|
3.1 |
|
|
|
|
|
|
|
3.2 |
|
|
|
|
|
|
|
3.3 |
|
|
|
|
|
|
|
4.1.1 |
|
|
|
|
|
|
|
4.1.2 |
|
|
|
|
|
|
|
4.1.3 |
|
|
|
|
|
|
|
4.1.4 |
|
|
|
|
|
|
|
4.1.5 |
|
|
|
|
|
|
|
4.1.6 |
|
|
|
|
|
|
|
4.1.7 |
|
|
|
|
|
|
|
4.1.8 |
|
|
|
|
|
|
83
|
|
|
EXHIBIT INDEX
|
|
|
||
|
|
|
|
|
4.1.10 |
|
|
|
|
|
|
|
4.1.11 |
|
|
|
|
|
|
|
4.1. 4.1.12 |
|
|
|
|
|
|
|
4.1. 4.1.13 |
|
Exchange Rights Agreement dated June 30, 2017, filed herewith. |
|
|
|
|
|
10.1.1 |
|
|
|
|
|
|
|
10.1.2 |
|
|
|
|
|
|
|
10.1.3 |
|
|
|
|
|
|
|
10.1.4 |
|
|
|
|
|
|
|
|
|
|
|
10.2.1 |
|
|
|
|
|
|
|
10.2.2 |
|
|
|
|
|
|
|
10.2.3 |
|
|
|
|
|
|
|
10.2.4 |
|
|
|
10.2.5 |
|
|
|
10.2.6 |
|
|
|
|
|
|
|
10.4.1 |
|
|
|
|
|
|
|
10.4.2 |
|
|
|
|
|
|
|
10.6.1 |
|
|
|
|
|
|
84
|
|
|
EXHIBIT INDEX
|
|
|
||
|
|
|
|
|
10.7 |
|
|
|
|
|
|
|
10.9.1 |
|
|
|
|
|
|
|
10.9.2 |
|
|
|
|
|
|
|
10.9.3 |
|
|
|
|
|
|
|
10.11.1 |
|
|
|
|
|
|
|
10.11.2 |
|
|
|
|
|
|
|
10.11.3 |
|
|
|
|
|
|
|
10.11.4 |
|
|
|
|
|
|
|
10.11.5 |
|
|
|
|
|
|
|
10.12 |
|
|
|
|
|
|
|
10.13.1 |
|
|
|
|
|
|
|
10.13.2 |
|
|
|
|
|
|
|
10.13.3 |
|
|
|
|
|
|
|
10.13.4 |
|
|
|
|
|
|
|
10.13.5 |
|
|
|
|
|
|
|
10.13.6 |
|
|
|
|
|
|
|
10.13.7 |
|
85
|
|
|
EXHIBIT INDEX
|
|
|
|
|
|
10.13.8 |
|
|
|
|
|
|
|
10.13.9 |
|
|
|
|
|
|
|
10.13.10 |
|
|
|
|
|
|
|
10.13.11 |
|
|
|
|
|
|
|
10.13.12 |
|
|
|
|
|
|
|
10.13.13 |
|
|
|
|
|
|
|
10.13.14 |
|
|
|
|
|
|
|
10.13.15 |
|
|
|
|
|
|
|
10.16.1 |
|
|
|
|
|
|
|
10.16.2 |
|
|
|
|
|
|
|
10.16.3 |
|
|
|
|
|
|
|
10.16.4 |
|
|
86
|
|
|
EXHIBIT INDEX
|
|
|
||
|
|
|
|
|
10.17.2 |
|
|
|
|
|
|
|
10.17.3 |
|
|
|
|
|
|
|
10.17.4 |
|
|
|
|
|
|
|
10.18.1 |
|
|
|
|
|
|
|
10.18.2 |
|
|
|
|
|
|
|
10.19 |
|
|
|
|
|
|
|
10.20 |
|
|
|
|
|
|
|
10.21 |
|
|
|
|
|
|
|
10.22 |
|
|
|
10.23 |
|
|
|
10.24 |
|
|
|
10.25 |
|
|
87
|
|
|
EXHIBIT INDEX
|
|
10.26 |
|
|
|
|
|
|
|
10.27.2 |
|
|
|
10.27.3 |
|
|
|
12.1 |
|
Statements regarding computation of ratios as of December 31, 2017, filed herewith. |
|
|
|
|
|
21.1 |
|
|
|
|
|
|
|
23.1 |
|
|
|
|
|
|
|
31.1 |
|
|
|
|
|
|
|
31.2 |
|
|
|
|
|
|
|
32.1 |
|
|
|
|
|
|
|
32.2 |
|
|
|
|
|
|
|
99.1 |
|
Material U.S. Federal Income Tax Considerations filed herewith. |
|
|
|
|
|
99.2 |
|
|
|
|
|
|
|
99.3 |
|
|
|
|
|
|
|
99.4 |
|
|
|
|
|
|
|
99.5 |
|
|
|
|
|
|
|
101 |
|
XBRL (eXtensible Business Reporting Language). The following materials, formatted in XBRL: (i) Consolidated Balance Sheets as of December 31, 2017 and December 31, 2016, (ii) Consolidated Statements of Operations for the years ended December 31, 2017, 2016 and 2015. (iii) Consolidated Statements of Equity for the years ended December 31, 2017, 2016 and 2015, (iv) Consolidated Statements of Cash Flows for the years ended December 31, 2017, 2016, and 2015, and (v) notes to the consolidated financial statements as of December 31, 2017, filed herewith. |
* Management contract or compensatory plan or arrangement required to be filed as an exhibit pursuant to Item 15(b) of Form 10-K.
|
None. |
88
Pursuant to the requirements of Section 13 or 15(d) of the Securities Exchange Act of 1934, the registrant has duly caused this report to be signed on its behalf by the undersigned, thereunto duly authorized.
|
|
|
INDEPENDENCE REALTY TRUST, INC. |
|
|
Date: |
February 23, 2018 |
By: |
/S/ SCOTT F. SCHAEFFER |
|
|
|
|
Scott F. Schaeffer |
|
|
|
|
Chairman of the Board and Chief Executive Officer |
Pursuant to the requirements of the Securities Exchange Act of 1934, this report has been signed below by the following persons on behalf of the registrant and in the capacities and on the dates indicated.
|
Name |
|
Title |
|
Date |
|
|
|
|
|
|
|
/S/ SCOTT F. SCHAEFFER |
|
Chairman of the Board and Chief Executive Officer (Principal Executive Officer) |
|
February 23, 2018 |
|
Scott F. Schaeffer |
|
|
||
|
|
|
|
|
|
|
/S/ JAMES J. SEBRA |
|
Chief Financial Officer and Treasurer (Principal Financial Officer) |
|
February 23, 2018 |
|
James J. Sebra |
|
|
||
|
|
|
|
|
|
|
/S/ JASON R. DELOZIER |
|
Chief Accounting Officer |
|
February 23, 2018 |
|
Jason R. Delozier |
|
(Principal Accounting Officer) |
|
|
|
|
|
|
|
|
|
/S/ WILLIAM C. DUNKELBERG |
|
Director |
|
February 23, 2018 |
|
William C. Dunkelberg |
|
|
|
|
|
|
|
Director |
|
February 23, 2018 |
|
/s/ Richard Gebert |
|
|
||
|
Richard D. Gebert |
|
|
|
|
|
|
|
Director |
|
February 23, 2018 |
|
/S/ Mack D. Pridgen III |
|
|
||
|
Mack D. Pridgen III |
|
|
|
|
|
|
|
Director |
|
February 23, 2018 |
|
/S/ Richard H. Ross |
|
|
||
|
Richard H. Ross |
|
|
|
|
|
|
|
Director |
|
February 23, 2018 |
|
/S/ DEFOREST B. SOARIES, JR. |
|
|
||
|
DeForest B. Soaries, Jr. |
|
|
|
|
|
|
|
|
|
|
|
/S/ MELINDA McCLURE |
|
Director |
|
February 23, 2018 |
|
Melinda H. McClure |
|
|
|
|
|
|
|
|
|
|
89