Attached files
| file | filename |
|---|---|
| 8-K - 8-K - FRANKLIN FINANCIAL SERVICES CORP /PA/ | fraf-20180209x8k.htm |
OTCQX Banks Virtual Conference February 8, 2018 Franklin Financial Services Corporation F&M TRUST
Forward Looking Statements In order for you to better understand the business of the Company – where we have been and where we want to go – our remarks today (those of the Company officers who will speak or respond to questions) will include forward looking statements related to anticipated financial performance, future operating results, business prospects, new products, and similar matters. These statements represent our best judgment, based upon present circumstances and the information now available to us, of what we think may occur in the future – and, of course, it is possible that actual results may differ materially from those we envision today. For a more complete discussion on the subject of forward looking statements, including a list of some of the risk factors that might adversely affect future operating results, we refer you to the section entitled “Forward Looking Statements” which appears in our annual report on Form 10-K as filed with the Securities and Exchange Commission. 2
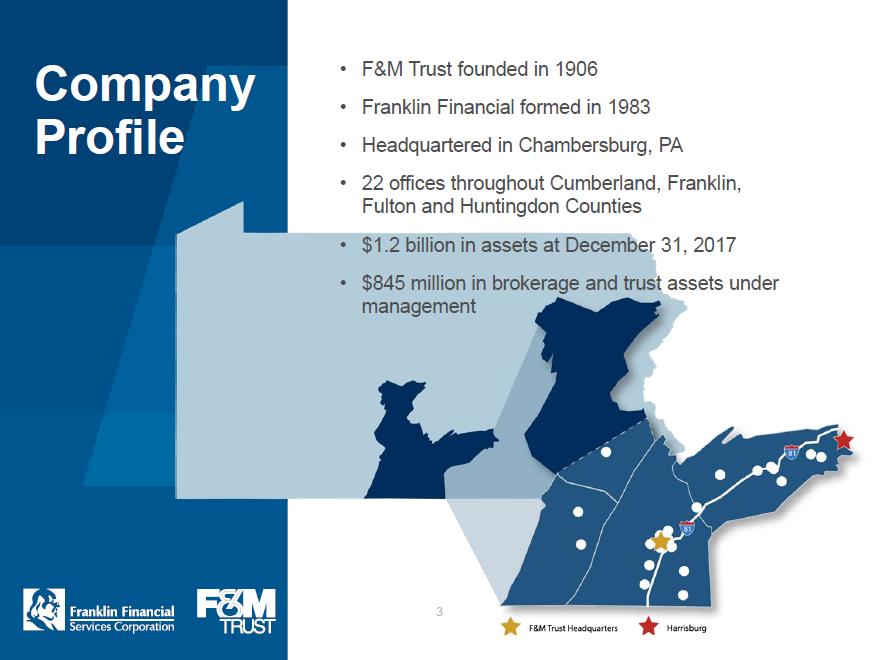
Company Profile •F&M Trust founded in 1906 •Franklin Financial formed in 1983 •Headquartered in Chambersburg, PA •22 offices throughout Cumberland, Franklin, Fulton and Huntingdon Counties •$1.2 billion in assets at December 31, 2017 •$845 million in brokerage and trust assets under management F&M Trust Headquarters Harrisburg 3
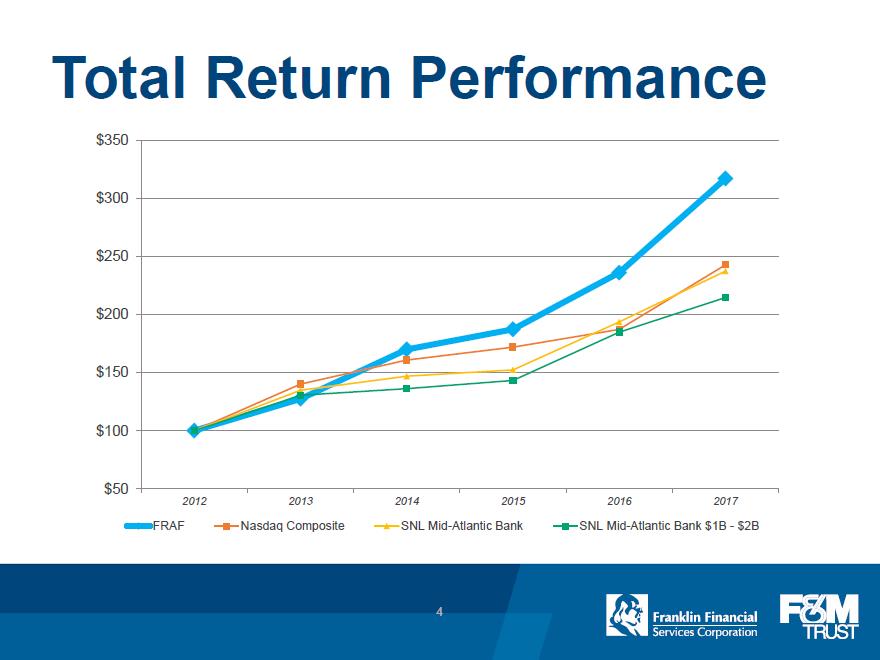
Total Return Performance $50 $100 $150 $200 $250 $300 $350 2012 2013 2014 2015 2016 2017 FRAF Nasdaq Composite SNL Mid-Atlantic Bank SNL Mid-Atlantic Bank $1B-$2B 4
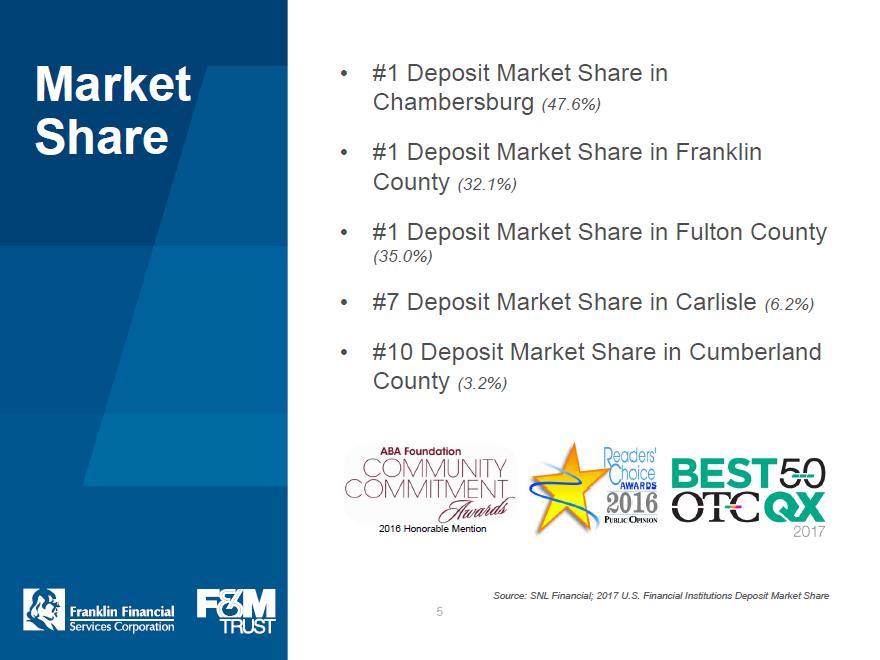
Market Share •#1 Deposit Market Share in Chambersburg (47.6%) •#1 Deposit Market Share in Franklin County (32.1%) •#1 Deposit Market Share in Fulton County (35.0%) •#7 Deposit Market Share in Carlisle (6.2%) •#10 Deposit Market Share in Cumberland County (3.2%) ABA Foundation COMMUNITY COMMITMENT Awards 2016 Honorable Mention Readers’ Choice AWARDS 2016 Public Opinion Best 50 OTCQX 2017 Source: SNL Financial; 2017 U.S. Financial Institutions 5
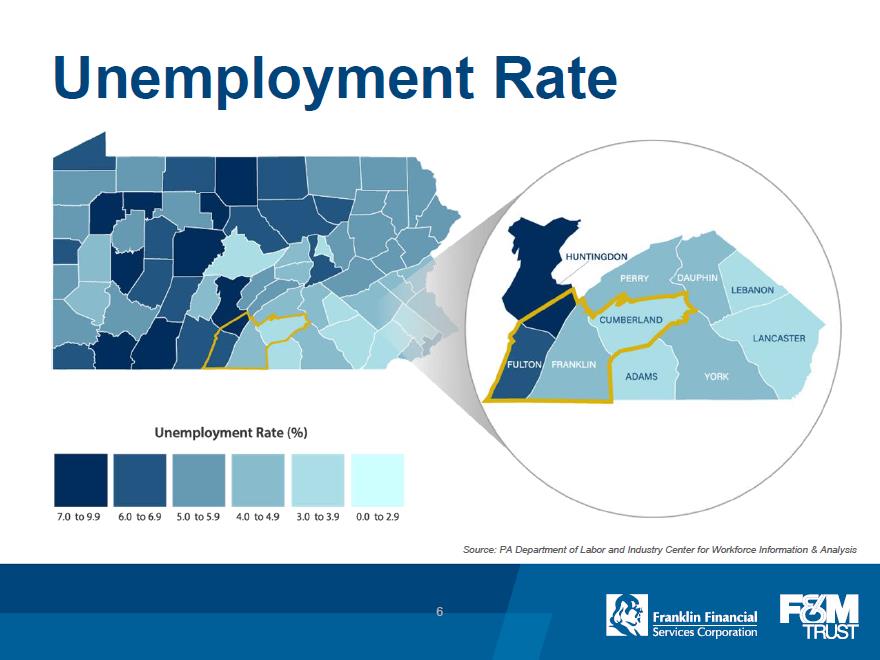
Unemployment Rate Unemployment Rate (%) 7.0 to 9.9 6.0 to 6.9 5.0 to 5.9 4.0 to 4.9 3.0 to 3.9 0.0 to 2.9 Source: PA Department of Labor and Industry Center for Workforce Information & Analysis 6
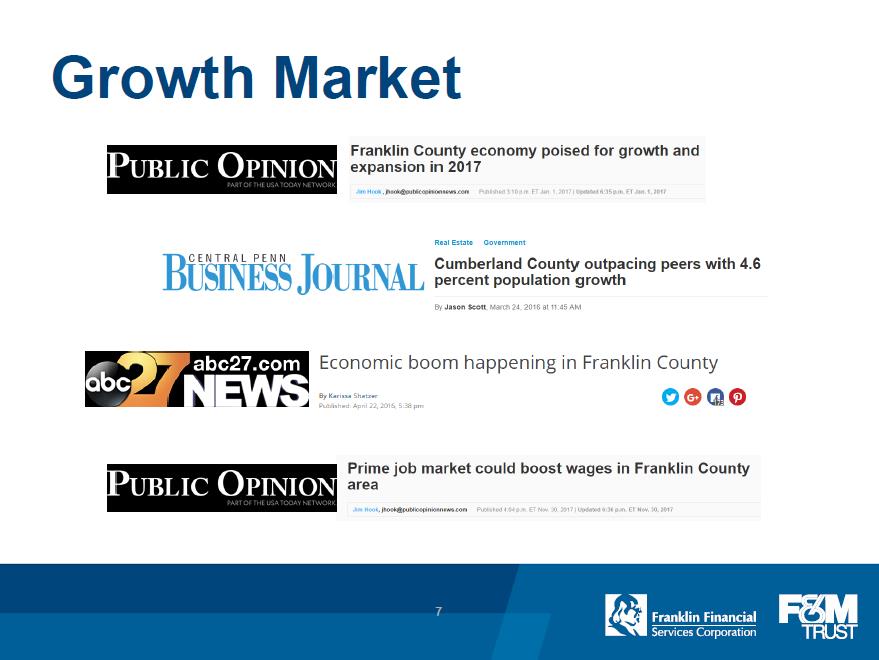
Growth Market Public Opinion Franklin County economy poised for growth and expansion in 2017 Central Penn Business Journal Cumberland County outpacing peers with 4.6 percent population growth abc 27 NEWS Economic boom happening in Franklin County Public Opinion Prime job market could boost wages in Franklin County area 7
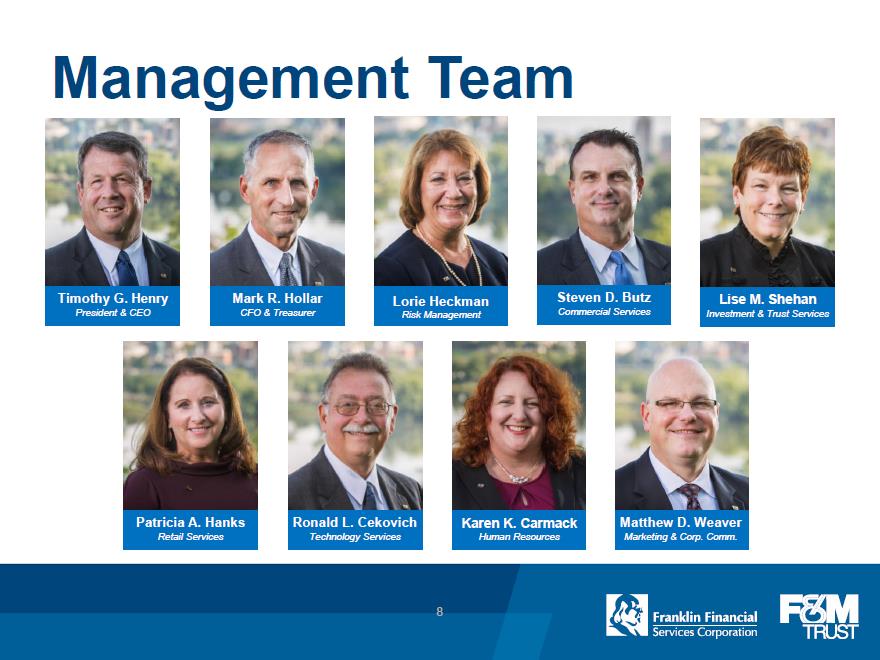
Management Team Timothy G. Henry President & CEO Mark R. Hollar CFO & Treasurer Lorie Heckman Risk Management Steven D. Butz Commercial Services Lise M. Shehan Investment & Trust Services Patricia A. Hanks Retail Services Ronald L. Cekovich Technology Services Karen K. Carmack Human Resources Matthew D. Weaver Marketing & Corp. Comm. 8
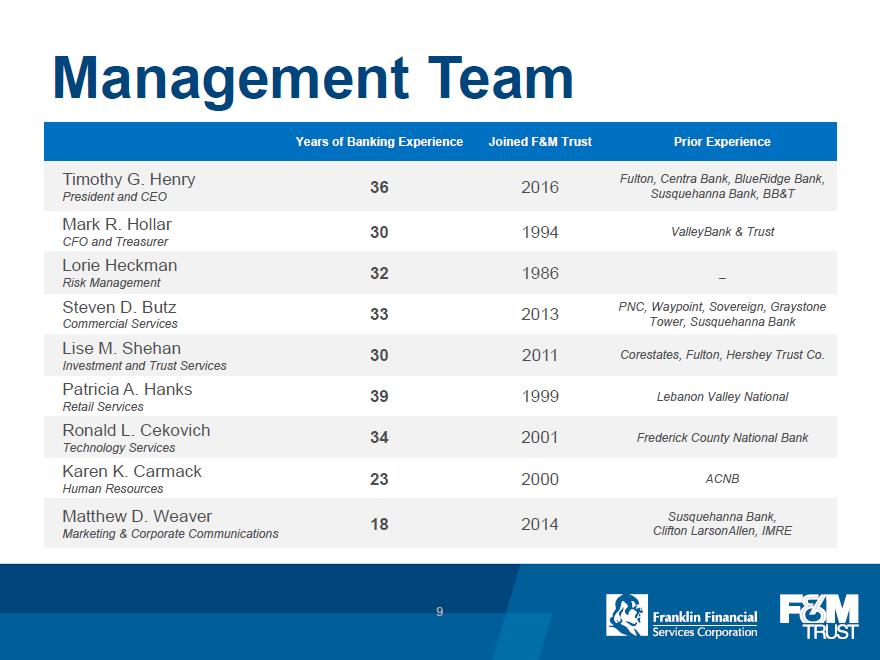
Management Team Years of Banking Experience Joined F&M Trust Prior Experience Timothy G. Henry President and CEO 36 2016 Fulton, Centra Bank, BlueRidge Bank, Susquehanna Bank, BB&T Mark R. Hollar CFO and Treasurer 30 1994 ValleyBank & Trust Lorie Heckman Risk Management 32 1986 _ Steven D. Butz Commercial Services 33 2013 PNC, Waypoint, Sovereign, Graystone Tower, Susquehanna Bank Lise M. Shehan Investment and Trust Services 30 2011 Corestates, Fulton, Hershey Trust Co. Patricia A. Hanks Retail Services 39 1999 Lebanon Valley National Ronald L. Cekovich Technology Services 34 2001 Frederick County National Bank Karen K. Carmack Human Resources 23 2000 ACNB Matthew D. Weaver Marketing & Corporate Communications 18 2014 Susquehanna Bank, Clifton LarsonAllen, IMRE 9
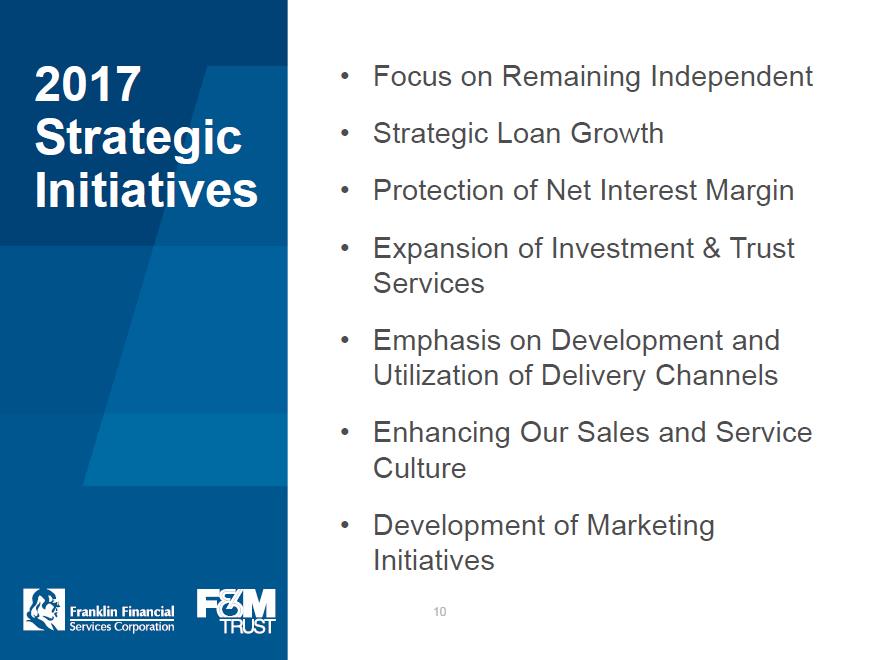
2017 Strategic Initiatives •Focus on Remaining Independent •Strategic Loan Growth •Protection of Net Interest Margin •Expansion of Investment & Trust Services •Emphasis on Development and Utilization of Delivery Channels •Enhancing Our Sales and Service Culture •Development of Marketing Initiatives 10
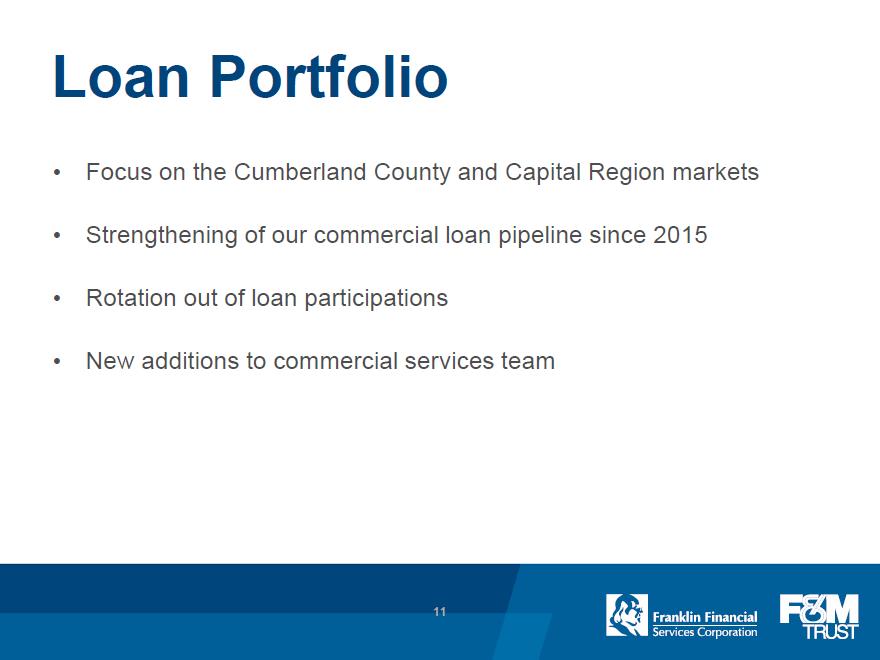
Loan Portfolio •Focus on the Cumberland County and Capital Region markets •Strengthening of our commercial loan pipeline since 2015 •Rotation out of loan participations •New additions to commercial services team 11
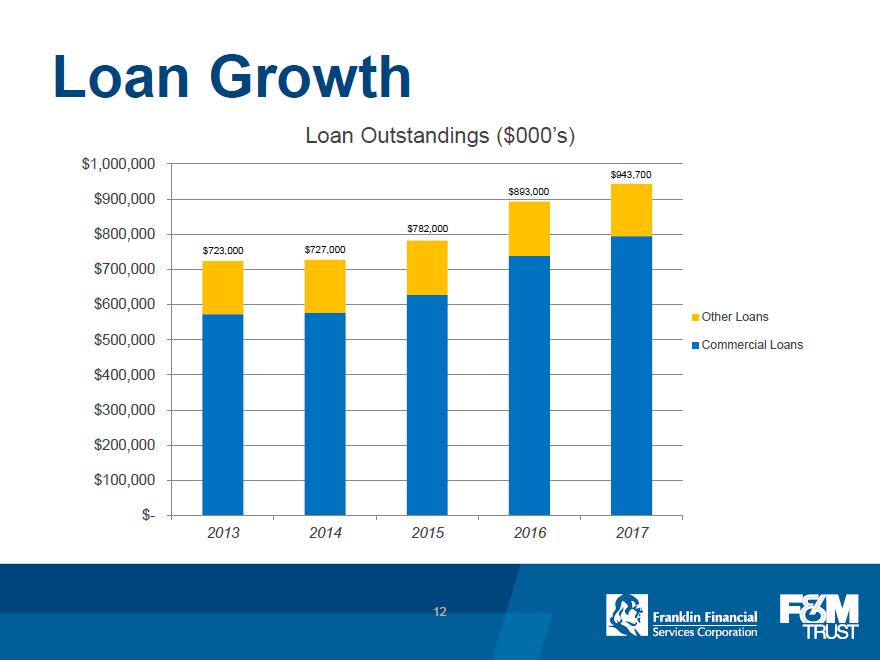
Loan Growth Loan Outstandings ($000’s) $- $100,000 $200,000 $300,000 $400,000 $500,000 $600,000 $700,000 $800,000 $900,000 $1,000,000 2013 2014 2015 2016 2017 Other Loans Commercial Loans $723,000 $727,000 $782,000 $893,000 $943,700 12
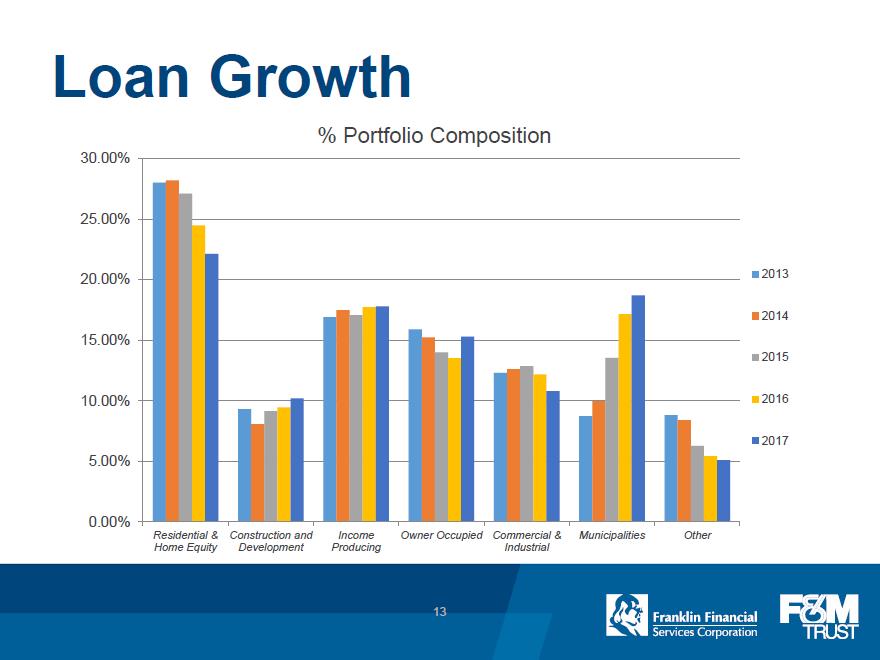
Loan Growth % Portfolio Composition 0.00% 5.00% 10.00% 15.00% 20.00% 25.00% 30.00% Residential & Home Equity Construction and Development Income Producing Owner Occupied Commercial & Industrial Municipalities Other 2013 2014 2015 2016 2017 13
Net Interest Margin •Implementing strategies to improve deposit growth •Creation of Business Banking team with focus on core deposits •Restructured Treasury Management function to include additional resources in Cumberland County / Capital Region •Loan pricing discipline in a rising rate environment 14
Investment & Trust Services •Trust powers since our incorporation in 1906 •Fully integrated trust, investment, insurance and brokerage services, focused exclusively on client needs •Over 300 years of combined financial services experience among our professional staff members •Additional resources in Cumberland, Franklin and Fulton Counties to focus on portfolio expansion and new relationships •44.1% of total non-interest income in 2017 15
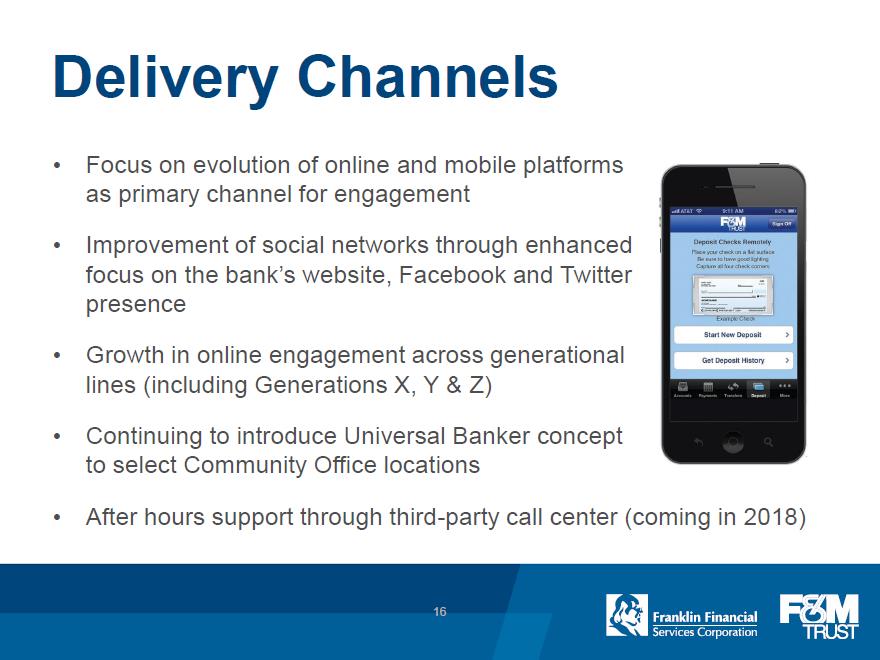
Delivery Channels •Focus on evolution of online and mobile platforms as primary channel for engagement •Improvement of social networks through enhanced focus on the bank’s website, Facebook and Twitter presence •Growth in online engagement across generational lines (including Generations X, Y & Z) •Continuing to introduce Universal Banker concept to select Community Office locations •After hours support through third-party call center (coming in 2018) 16
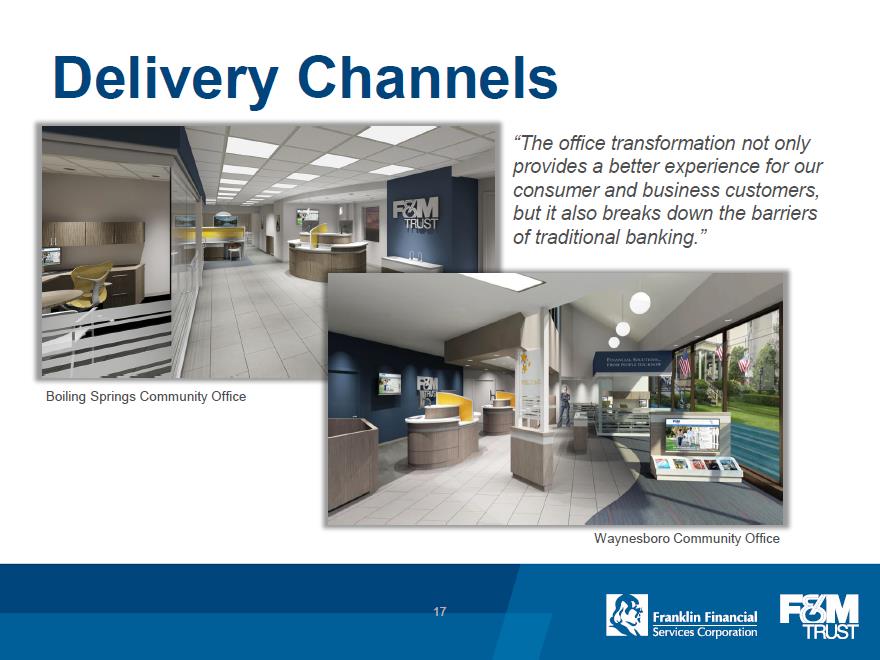
Delivery Channels “The office transformation not only provides a better experience for our consumer and business customers, but it also breaks down the barriers of traditional banking.” Boiling Springs Community Office Waynesboro Community Office 17
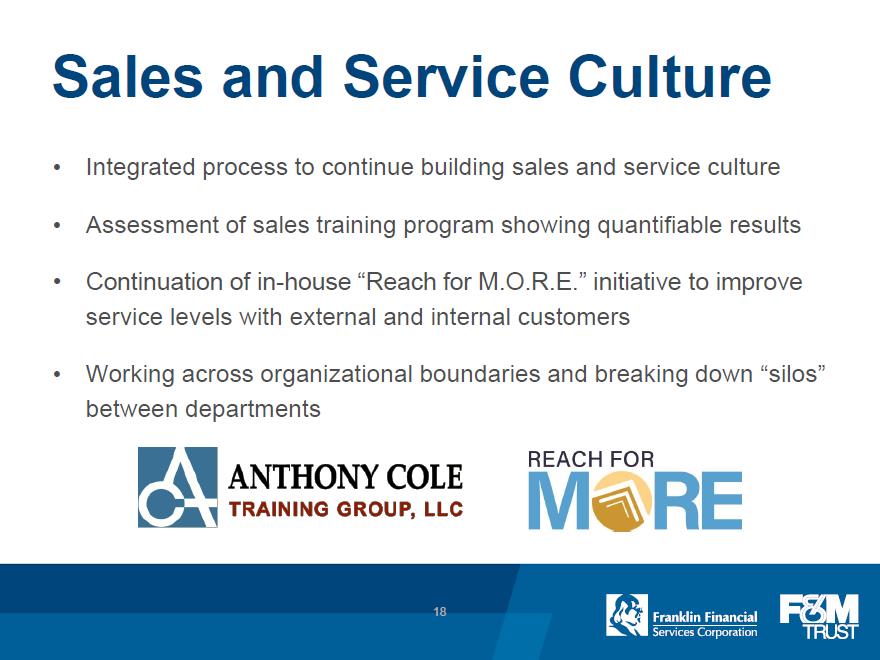
Sales and Service Culture •Integrated process to continue building sales and service culture •Assessment of sales training program showing quantifiable results •Continuation of in-house “Reach for M.O.R.E.” initiative to improve service levels with external and internal customers •Working across organizational boundaries and breaking down “silos” between departments ANTHONY COLE TRAINING GROUP, LLC REACH FOR MORE 18
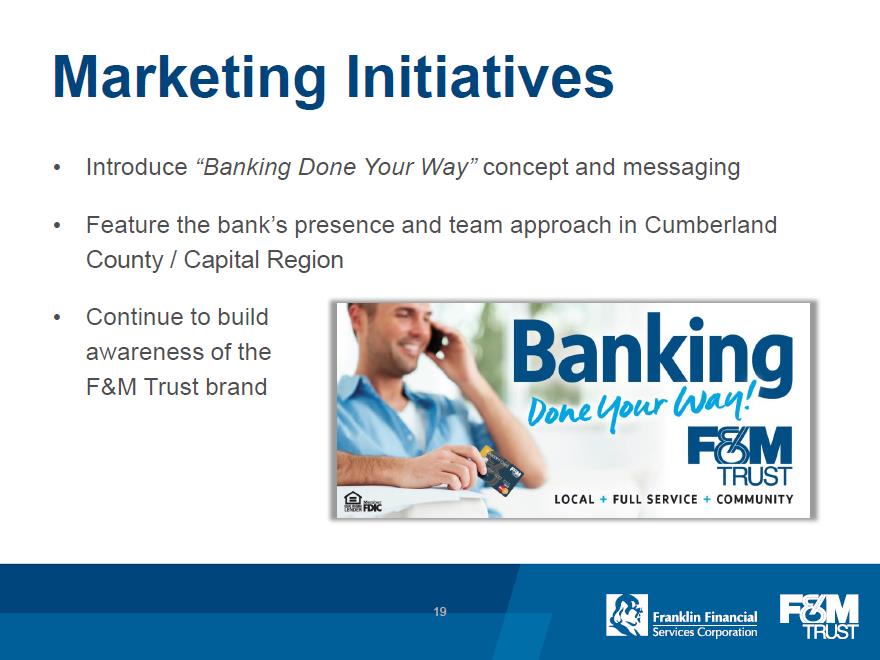
Marketing Initiatives •Introduce “Banking Done Your Way” concept and messaging •Feature the bank’s presence and team approach in Cumberland County / Capital Region •Continue to build awareness of the F&M Trust brand Banking Done Your Way! F&M Trust LOCAL FULL SERVICE COMMUNITY 19
Appendix 20
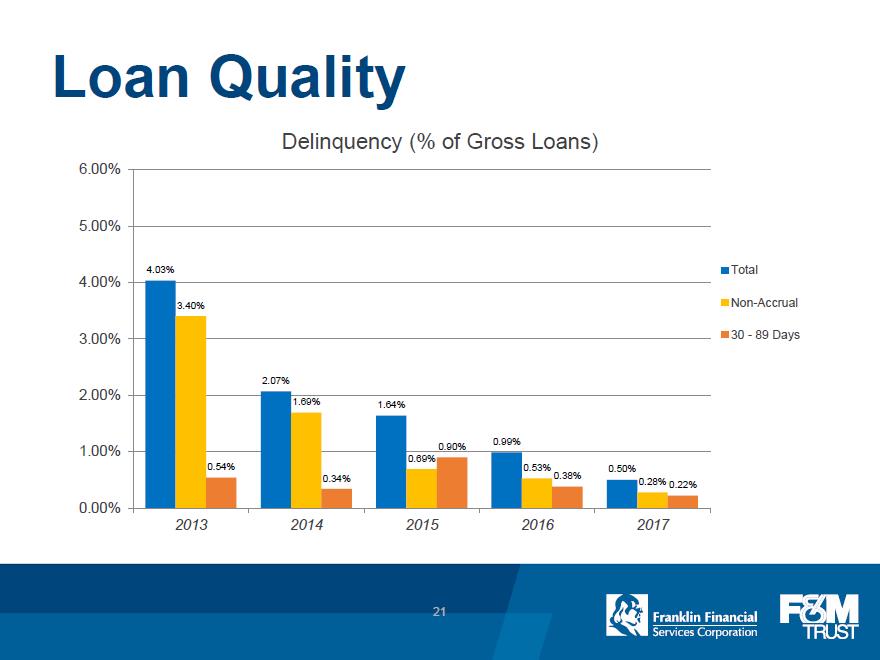
Loan Quality Delinquency (% of Gross Loans) 0.00% 1.00% 2.00% 3.00% 4.00% 5.00% 6.00% 2013 2014 2015 2016 2017 Total Non-Accrual 30-89 Days 4.03% 3.40% 0.54% 2.07% 1.69% 0.34% 1.64% 0.69% 0.90% 0.99% 0.53% 0.38% 0.50% 0.28% 0.22% 21
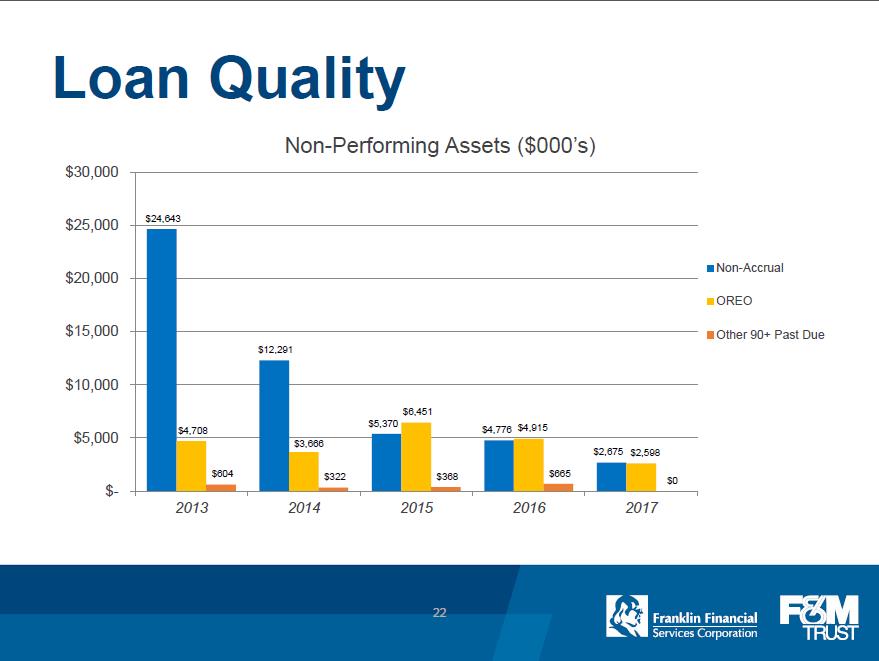
Loan Quality $24,643 $12,291 $5,370 $4,776 $2,675 $4,708 $3,666 $6,451 $4,915 $2,598 $604 $322 $368 $665 $0 $- $5,000 $10,000 $15,000 $20,000 $25,000 $30,000 2013 2014 2015 2016 2017 Non-Performing Assets ($000’s) Non-Accrual OREO Other 90+ Past Due 22
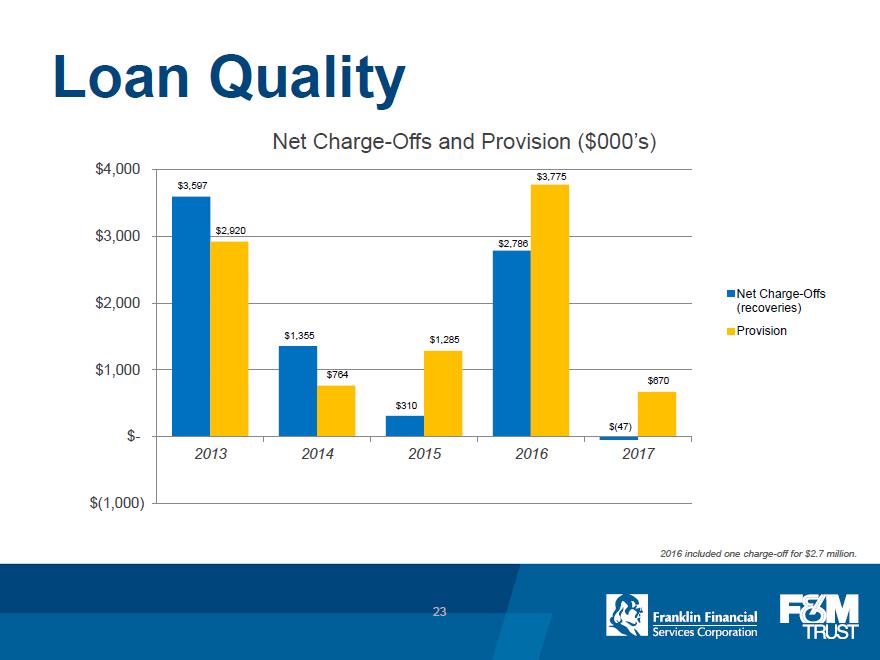
Loan Quality Net Charge-Offs and Provision ($000’s) $(1,000) $- $1,000 $2,000 $3,000 $4,000 2013 2014 2015 2016 2017 Net Charge-Offs (recoveries) Provision $3,597$2,920 $1,355 $764 $310 $1,285 $2,786 $3,775 $(47) $670 2016 included one charge-off for $2.7 million. 23
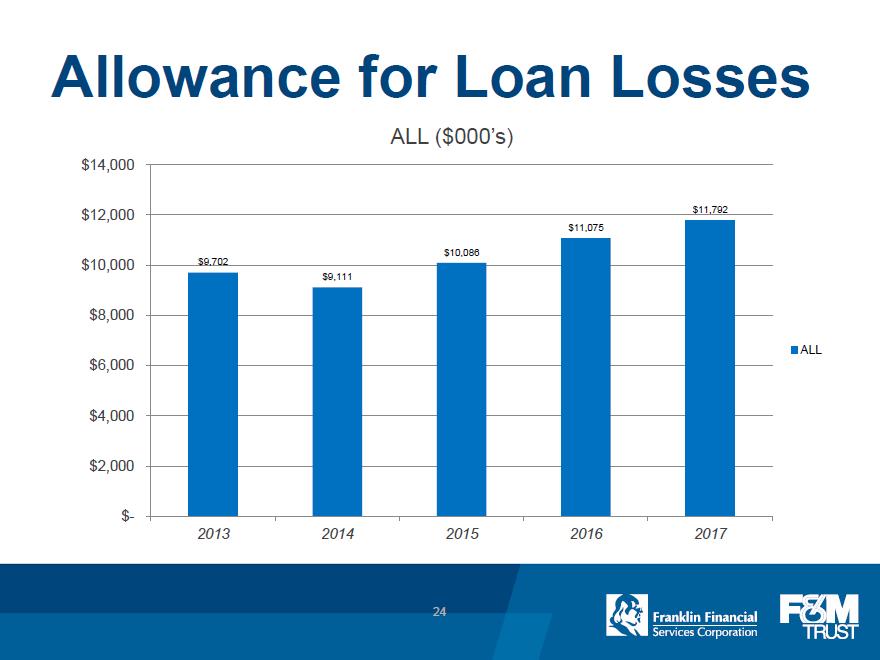
Allowance for Loan Losses ALL ($000’s) $- $2,000 $4,000 $6,000 $8,000 $10,000 $12,000 $14,000 2013 2014 2015 2016 2017 ALL $9,702 $9,111 $10,086 $11,075 $11,792 24
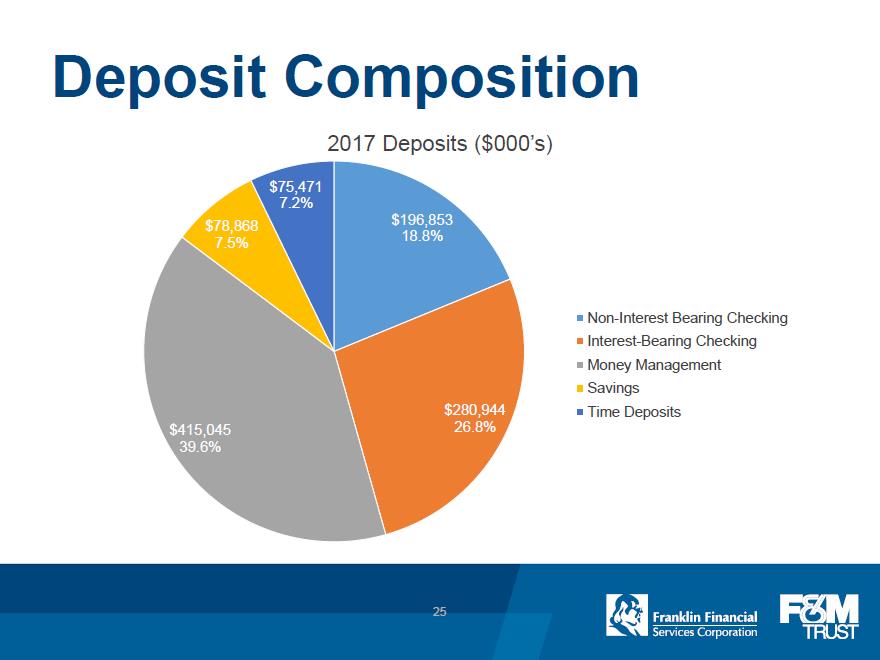
Deposit Composition 2017 Deposits ($000’s) $196,853 18.8% $280,944 26.8% $415,045 39.6% $78,868 7.5% $75,471 7.2% Non-Interest Bearing Checking Interest-Bearing Checking Money Management Savings Time Deposits 25
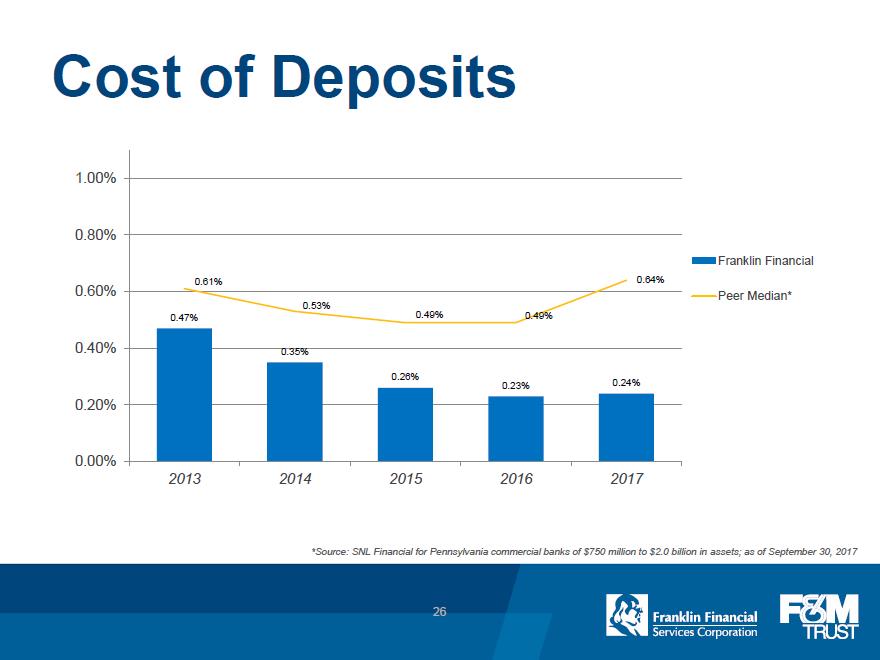
Cost of Deposits 0.00% 0.20% 0.40% 0.60% 0.80% 1.00% 2013 2014 2015 2016 2017 Franklin Financial Peer Median* 0.47% 0.35% 0.26% 0.23% 0.24% 0.61% 0.53% 0.49% 0.49% 0.64% *Source: SNL Financial for Pennsylvania commercial banks of $750 million to $2.0 billion in assets; as of September 30, 2017 26
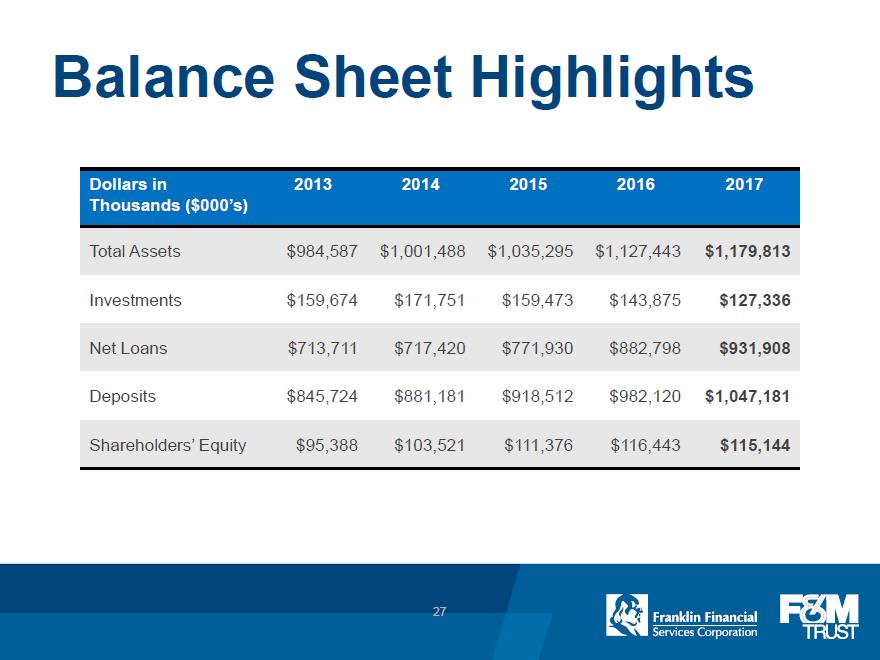
Balance Sheet Highlights Dollars in Thousands ($000’s) 2013 2014 2015 2016 2017 Total Assets $984,587 $1,001,488 $1,035,295 $1,127,443 $1,179,813 Investments $159,674 $171,751 $159,473 $143,875 $127,336 Net Loans $713,711 $717,420 $771,930 $882,798 $931,908 Deposits $845,724 $881,181 $918,512 $982,120 $1,047,181 Shareholders’ Equity $95,388 $103,521 $111,376 $116,443 $115,144 27
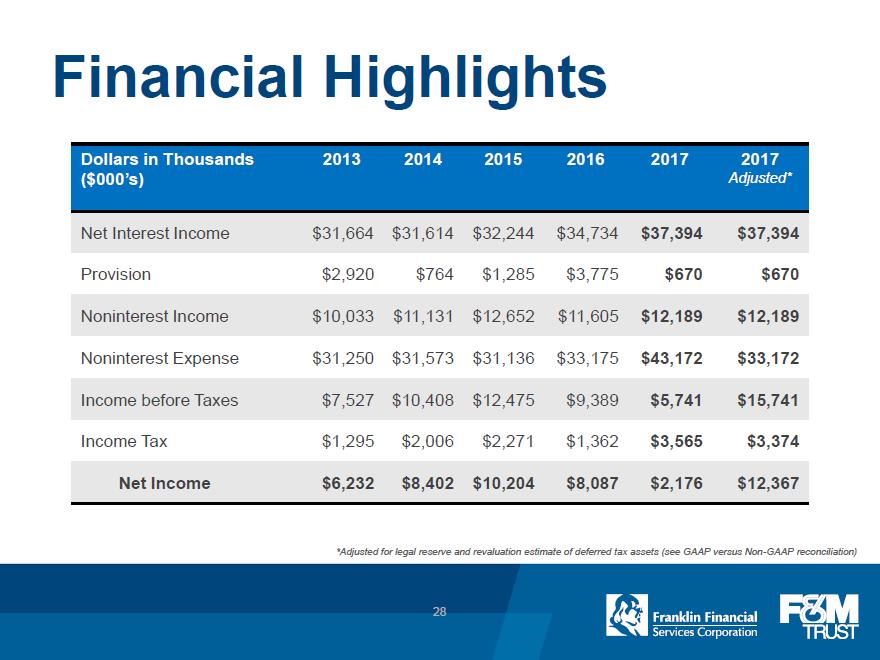
Financial Highlights Dollars in Thousands ($000’s) 2013 2014 2015 2016 2017 2017 Adjusted* Net Interest Income $31,664 $31,614 $32,244 $34,734 $37,394 $37,394 Provision $2,920 $764 $1,285 $3,775 $670 $670 Noninterest Income $10,033 $11,131 $12,652 $11,605 $12,189 $12,189 Noninterest Expense $31,250 $31,573 $31,136 $33,175 $43,172 $33,172 Income before Taxes $7,527 $10,408 $12,475 $9,389 $5,741 $15,741 Income Tax $1,295 $2,006 $2,271 $1,362 $3,565 $3,374 Net Income $6,232 $8,402 $10,204 $8,087 $2,176 $12,367 *Adjusted for legal reserve and revaluation estimate of deferred tax assets (see GAAP versus Non-GAAP reconciliation) 28
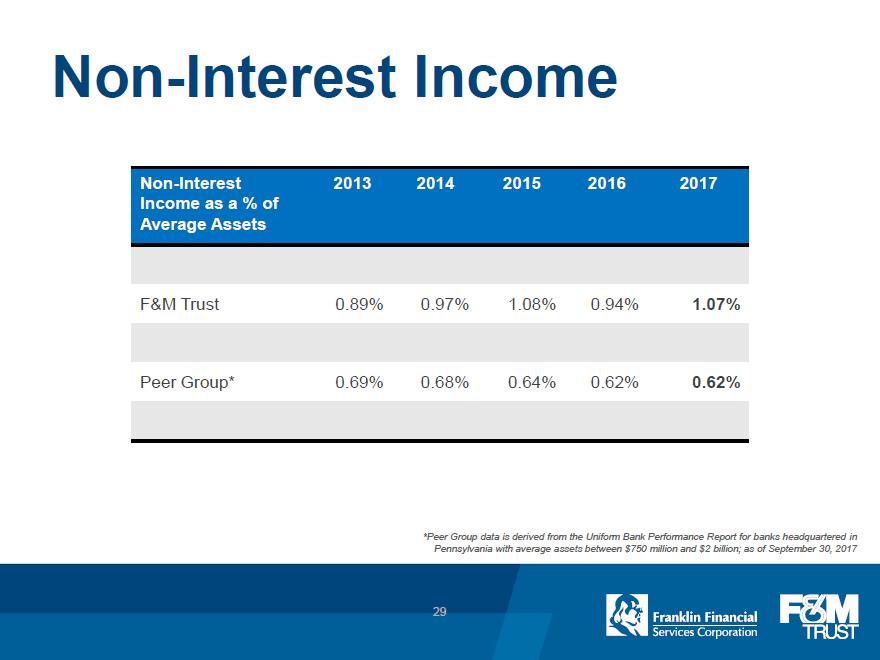
Non-Interest Income Non-Interest Income as a % of Average Assets 2013 2014 2015 2016 2017 F&M Trust 0.89% 0.97% 1.08% 0.94% 1.07% Peer Group* 0.69% 0.68% 0.64% 0.62% 0.62% *Peer Group data is derived from the Uniform Bank Performance Report for banks headquartered in Pennsylvania with average assets between $750 million and $2 billion; as of September 30, 2017 29
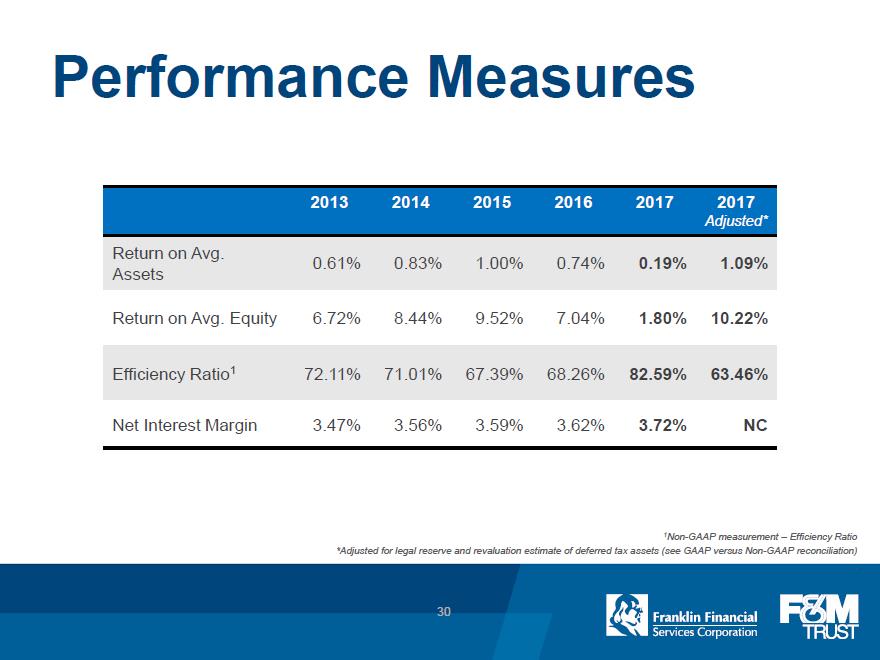
Performance Measures 2013 2014 2015 2016 2017 2017 Adjusted* Return on Avg. Assets 0.61% 0.83% 1.00% 0.74% 0.19% 1.09% Return on Avg. Equity 6.72% 8.44% 9.52% 7.04% 1.80% 10.22% Efficiency Ratio1 72.11% 71.01% 67.39% 68.26% 82.59% 63.46% Net Interest Margin 3.47% 3.56% 3.59% 3.62% 3.72% NC 1 Non-GAAP measurement – Efficiency Ratio *Adjusted for legal reserve and revaluation estimate of deferred tax assets (see GAAP versus Non-GAAP reconciliation) . 30
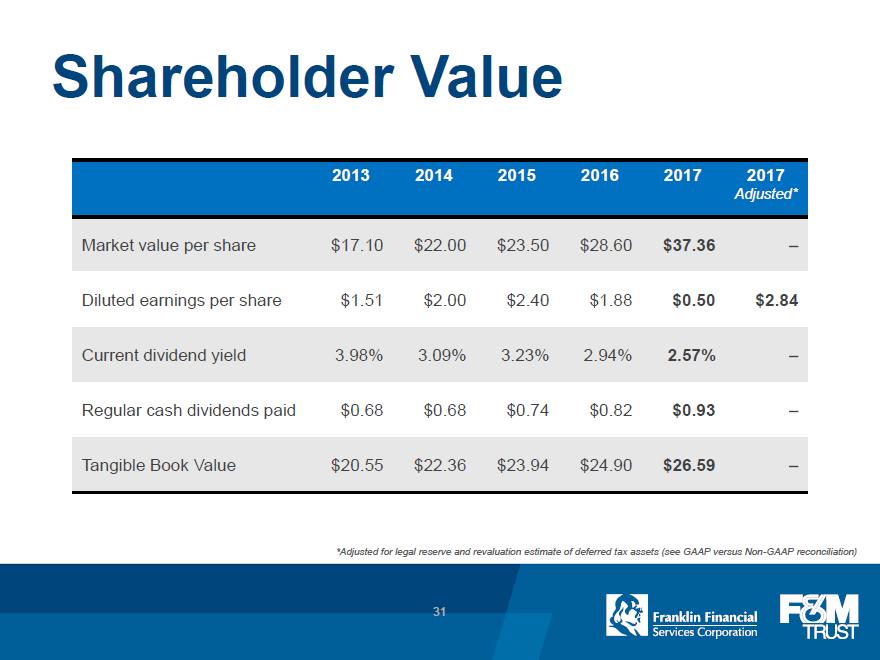
Shareholder Value 2013 2014 2015 2016 2017 2017 Adjusted* Market value per share $17.10 $22.00 $23.50 $28.60 $37.36 . Diluted earnings per share $1.51 $2.00 $2.40 $1.88 $0.50 $2.84 Current dividend yield 3.98% 3.09% 3.23% 2.94% 2.57% . Regular cash dividends paid $0.68 $0.68 $0.74 $0.82 $0.93 . Tangible Book Value $20.55 $22.36 $23.94 $24.90 $26.59 . 31 *Adjusted for legal reserve and revaluation estimate of deferred tax assets (see GAAP versus Non-GAAP reconciliation)
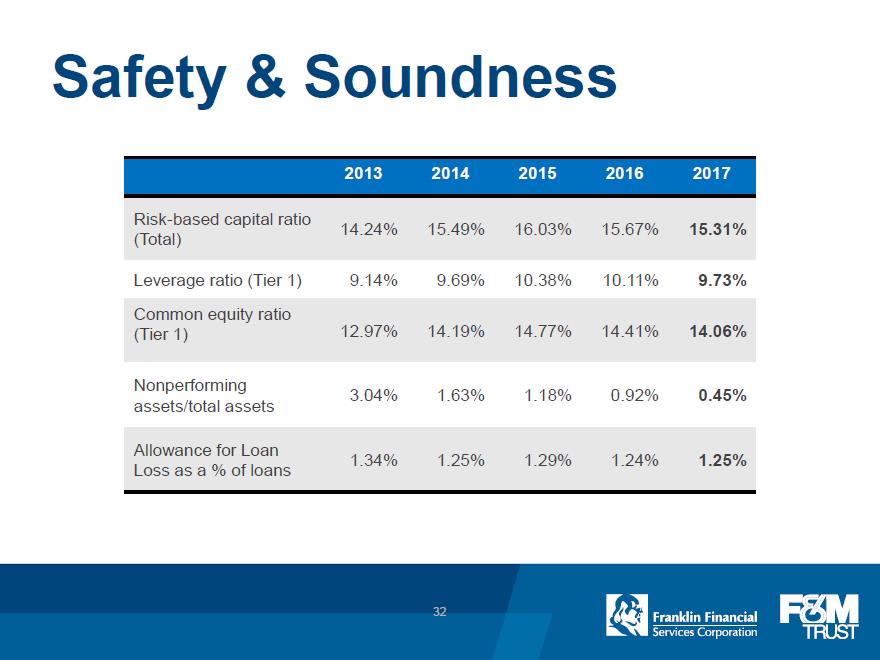
Safety & Soundness 2013 2014 2015 2016 2017 Risk-based capital ratio (Total) 14.24% 15.49% 16.03% 15.67% 15.31% Leverage ratio (Tier 1) 9.14% 9.69% 10.38% 10.11% 9.73% Common equity ratio (Tier 1) 12.97% 14.19% 14.77% 14.41% 14.06% Nonperforming assets/total assets 3.04% 1.63% 1.18% 0.92% 0.45% Allowance for Loan Loss as a % of loans 1.34% 1.25% 1.29% 1.24% 1.25% 32
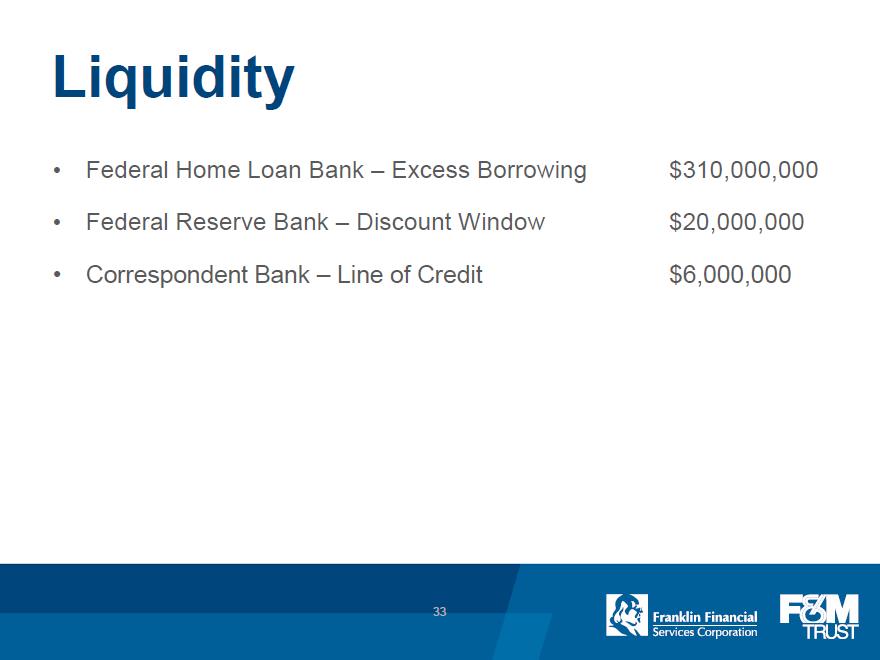
Liquidity •Federal Home Loan Bank – Excess Borrowing $310,000,000 •Federal Reserve Bank – Discount Window $20,000,000 •Correspondent Bank – Line of Credit $6,000,000 33
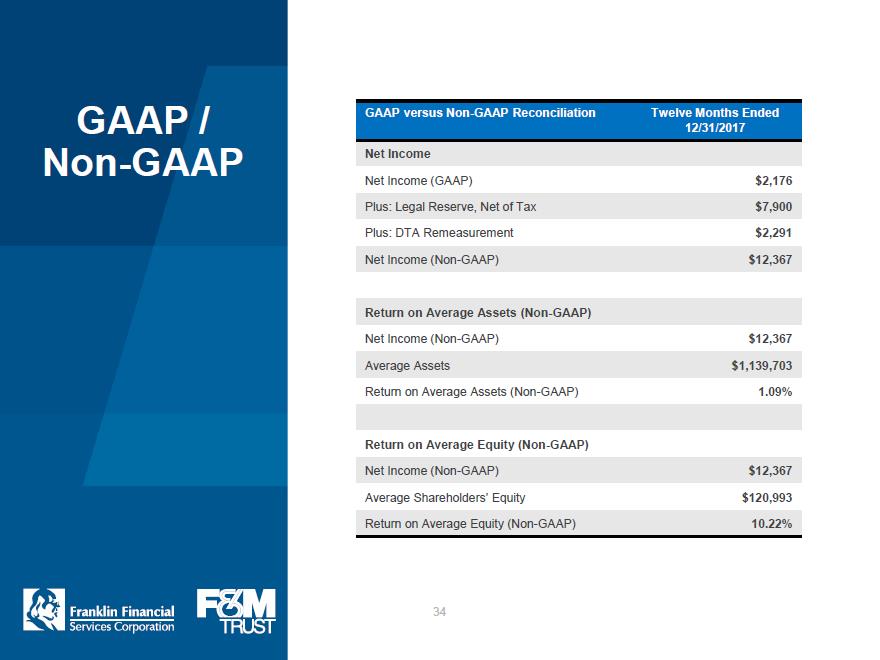
GAAP / Non-GAAP GAAP versus Non-GAAP Reconciliation Twelve Months Ended 12/31/2017 Net Income Net Income (GAAP) $2,176 Plus: Legal Reserve, Net of Tax $7,900 Plus: DTA Remeasurement $2,291 Net Income (Non-GAAP) $12,367 Return on Average Assets (Non-GAAP) Net Income (Non-GAAP) $12,367 Average Assets $1,139,703 Return on Average Assets (Non-GAAP) 1.09% Return on Average Equity (Non-GAAP) Net Income (Non-GAAP) $12,367 Average Shareholders’ Equity $120,993 Return on Average Equity (Non-GAAP) 10.22% 34
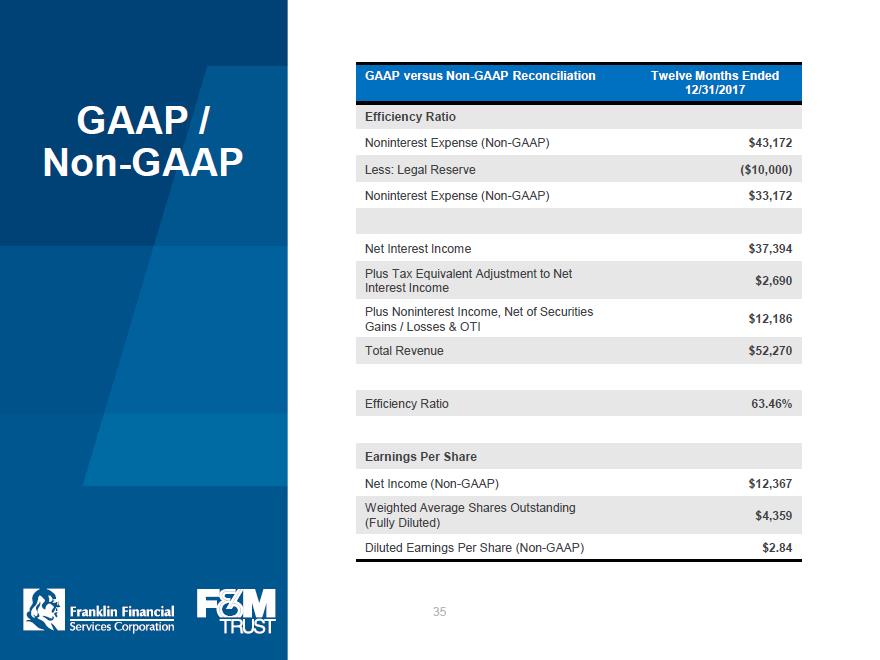
GAAP / Non-GAAP GAAP versus Non-GAAP Reconciliation Twelve Months Ended 12/31/2017 Efficiency Ratio Noninterest Expense (Non-GAAP) $43,172 Less: Legal Reserve ($10,000) Noninterest Expense (Non-GAAP) $33,172 Net Interest Income $37,394 Plus Tax Equivalent Adjustment to Net Interest Income $2,690 Plus Noninterest Income, Net of Securities Gains / Losses & OTI $12,186 Total Revenue $52,270 Efficiency Ratio 63.46% Earnings Per Share Net Income (Non-GAAP) $12,367 Weighted Average Shares Outstanding (Fully Diluted) $4,359 Diluted Earnings Per Share (Non-GAAP) $2.84 35
Franklin Financial Services Corporation Stock Symbol: FRAF (OTCQX) www.franklinfin.com www.fmtrustonline.com 36