Attached files
| file | filename |
|---|---|
| 8-K - 8-K - LINDSAY CORP | lnn-20180125x8k.htm |
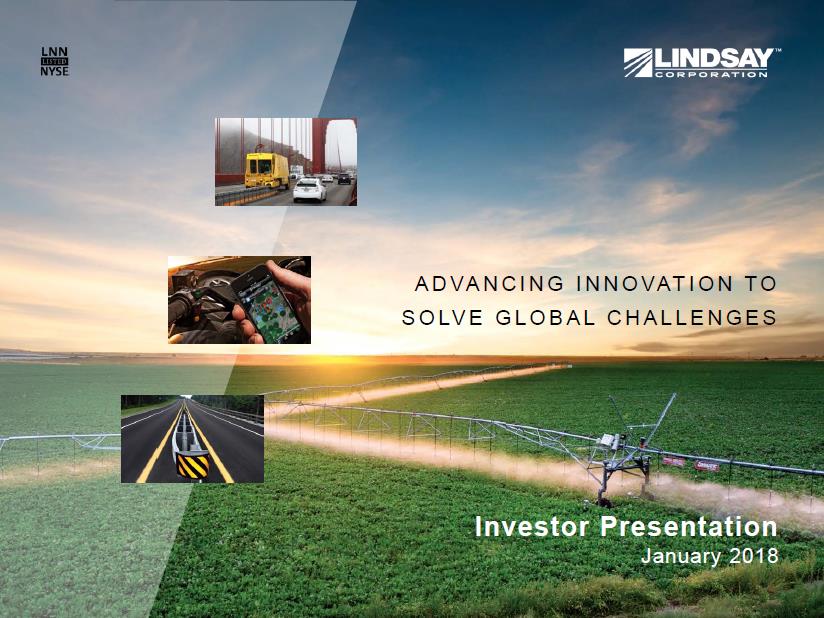
ADVANCING INNOVATION TO SOLVE GLOBAL CHALLENGES Investor Presentation January 2018
Safe-Harbor Statement This presentation contains forward-looking statements that are subject to risks and uncertainties and which reflect management’s current beliefs and estimates of future economic circumstances, industry conditions, Company performance, financial results and planned financing. You can find a discussion of many of these risks and uncertainties in the annual, quarterly and current reports that the Company files with the Securities and Exchange Commission. Investors should understand that a number of factors could cause future economic and industry conditions, and the Company’s actual financial condition and results of operations, to differ materially from management’s beliefs expressed in the forward-looking statements contained in this presentation. These factors include those outlined in the “Risk Factors” section of the Company’s most recent annual report on Form 10-K filed with the Securities and Exchange Commission, and investors are urged to review these factors when considering the forward-looking statements contained in this presentation. For these statements, the Company claims the protection of the safe harbor for forward-looking statements contained in the Private Securities Litigation Reform Act of 1995.
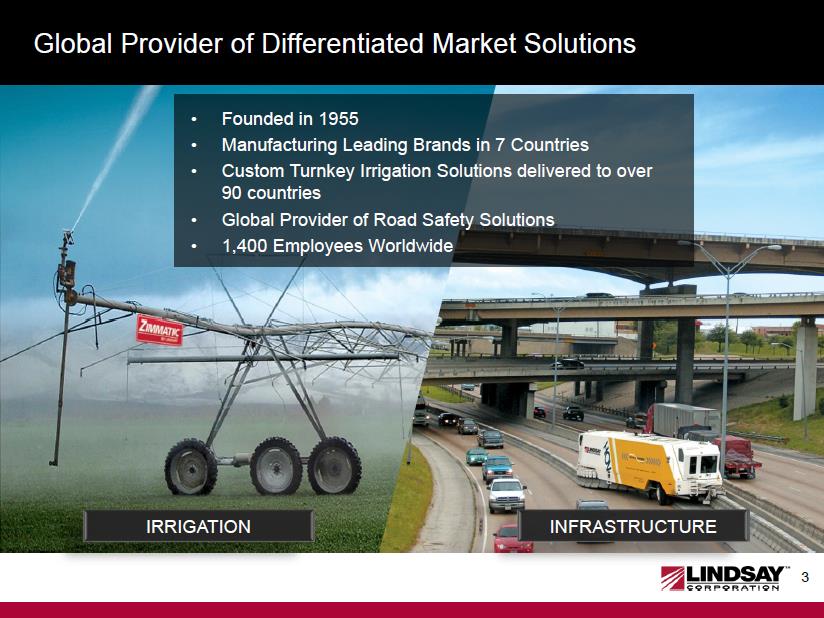
Global Provider of Differentiated Market Solutions INFRASTRUCTURE IRRIGATION •Founded in 1955 •Manufacturing Leading Brands in 7 Countries •Custom Turnkey Irrigation Solutions delivered to over 90 countries •Global Provider of Road Safety Solutions •1,400 Employees Worldwide
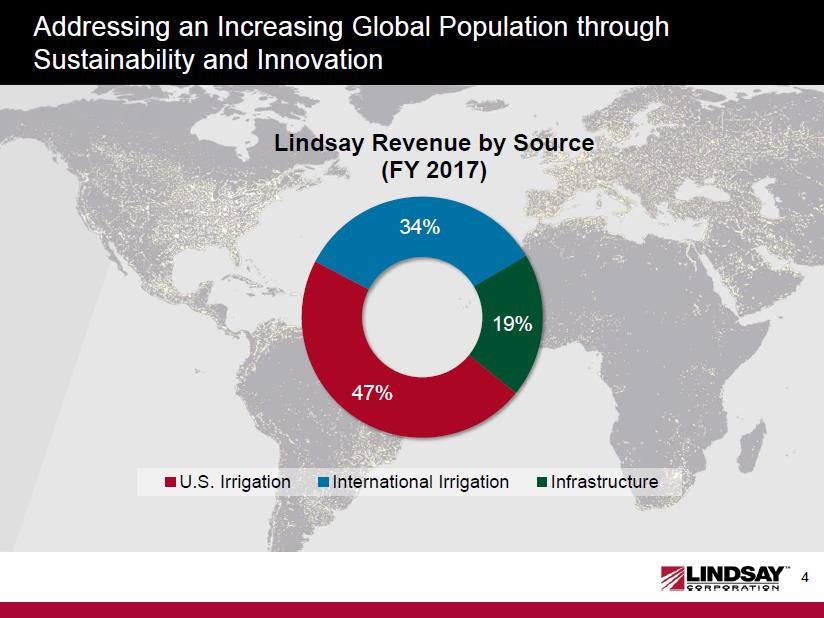
Addressing an Increasing Global Population through Sustainability and Innovation 47% 34% 19% Lindsay Revenue by Source (FY 2017) U.S. Irrigation International Irrigation Infrastructure
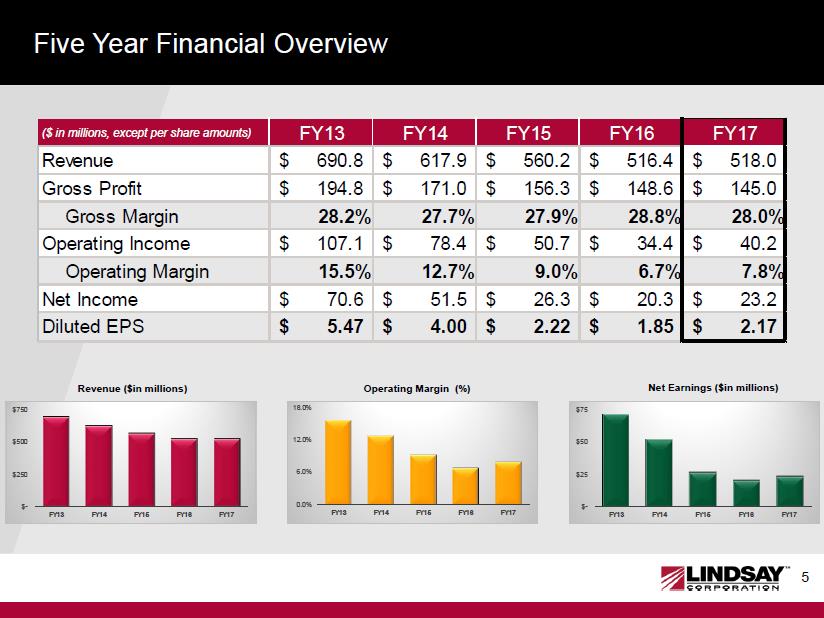
Five Year Financial Overview ($ in millions, except per share amounts) FY13 FY14 FY15 FY16 FY17 Revenue 690.8$ 617.9$ 560.2$ 516.4$ 518.0$ Gross Profit 194.8$ 171.0$ 156.3$ 148.6$ 145.0$ Gross Margin 28.2%27.7%27.9%28.8%28.0% Operating Income 107.1$ 78.4$ 50.7$ 34.4$ 40.2$ Operating Margin 15.5%12.7%9.0%6.7%7.8% Net Income 70.6$ 51.5$ 26.3$ 20.3$ 23.2$ Diluted EPS 5.47$ 4.00$ 2.22$ 1.85$ 2.17$ 0.0% 6.0% 12.0% 18.0% FY13 FY14 FY15 FY16 FY17 $- $250 $500 $750 FY13 FY14 FY15 FY16 FY17 Operating Margin (%) $- $25 $50 $75FY13FY14FY15FY16FY17 Net Earnings ($in millions)
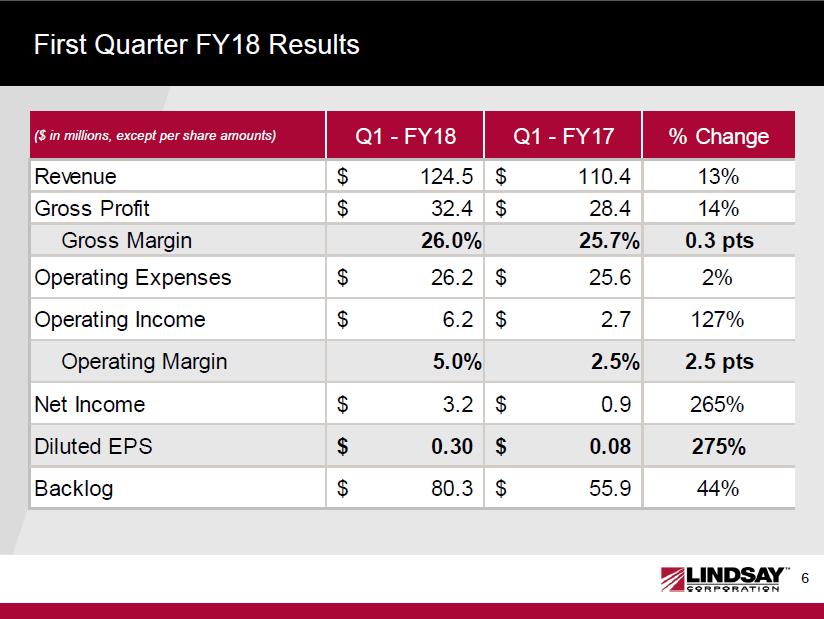
First Quarter FY18 Results ($ in millions, except per share amounts) Q1 - FY18 Q1 - FY17 % Change Revenue 124.5$ 110.4$ 13% Gross Profit 32.4$ 28.4$ 14% Gross Margin 26.0%25.7%0.3 pts Operating Expenses 26.2$ 25.6$ 2% Operating Income 6.2$ 2.7$ 127% Operating Margin 5.0%2.5%2.5 pts Net Income 3.2$ 0.9$ 265% Diluted EPS 0.30$ 0.08$ 275% Backlog 80.3$ 55.9$ 44%
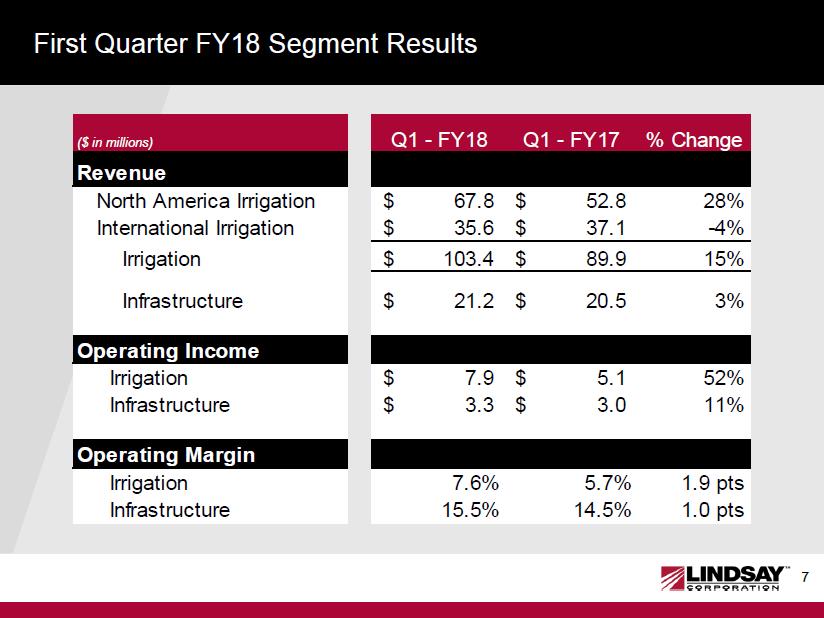
First Quarter FY18 Segment Results ($ in millions) Q1 - FY18 Q1 - FY17 % Change Revenue North America Irrigation 67.8$ 52.8$ 28% International Irrigation 35.6$ 37.1$ -4% Irrigation 103.4$ 89.9$ 15% Infrastructure 21.2$ 20.5$ 3% Operating Income Irrigation 7.9$ 5.1$ 52% Infrastructure 3.3$ 3.0$ 11% Operating Margin Irrigation 7.6%5.7%1.9 pts Infrastructure 15.5%14.5%1.0 pts
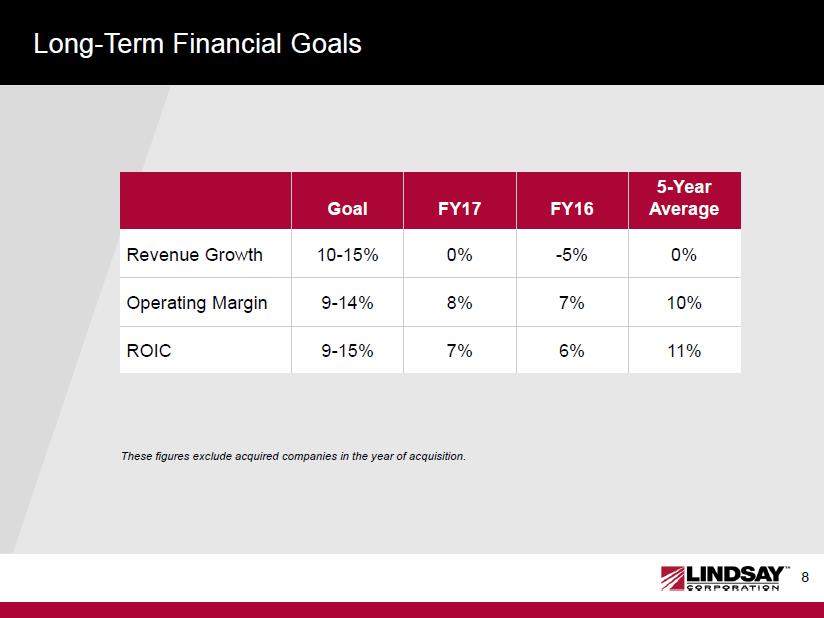
Long-Term Financial Goals These figures exclude acquired companies in the year of acquisition. Goal FY17 FY16 5-Year Average Revenue Growth 10-15% 0% -5% 0% Operating Margin 9-14% 8% 7% 10% ROIC 9-15% 7% 6% 11%
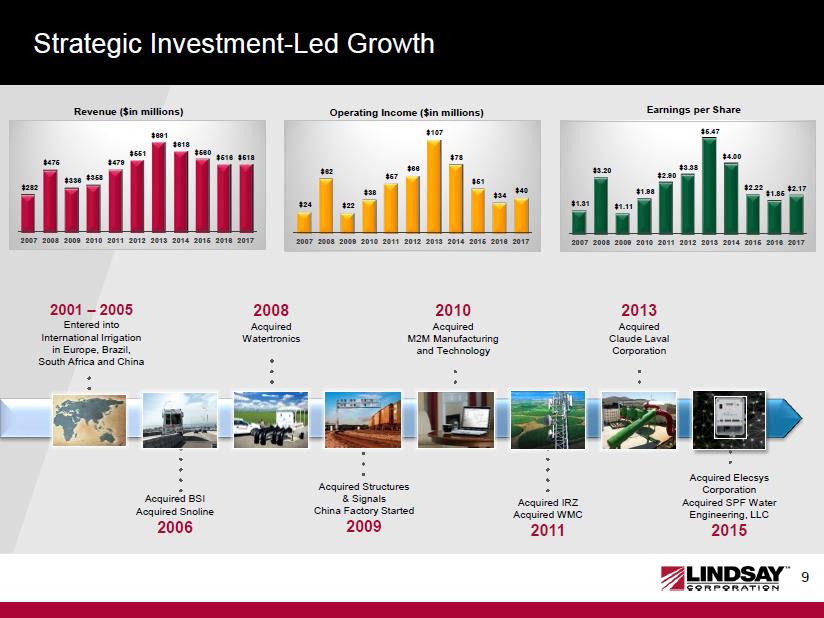
Strategic Investment-Led Growth 2001 – 2005 Entered into International irrigation in Europe, Brazil, South Africa and China Acquired BSI Acquired Snoline 2006
2008 Acquired Watertronics Acquired Structures & Signals China Factory Started 2009 2010 Acquired M2M Manufacturing and Technology Acquired IRZ Acquired WMC 2011 2013 Acquired Claude Laval Corporation Acquired Elecsys Corporation Acquired SPF Water Engineering, LLC 2015 Revenue ($in millions) $282 $475 $336 $358 $479 $551 $691 $618 $560 $516 $518 2007 2008 2009 2010 2011 2012 2013 2014 2015 2016 2017 Operating Income ($in millions) $24 $62 $22 $38 $57 $66 $107 $78 $51 $34 $40 2007 2008 2009 2010 2011 2012 2013 2014 2015 2016 2017 Earnings per Share $1.31 $3.20 $1.11 $1.98 $2.90 $3.38 $5.47 $4.00 $2.22 $1.85 $2.17 2007 2008 2009 2010 2011 2012 2013 2014 2015 2016 2017
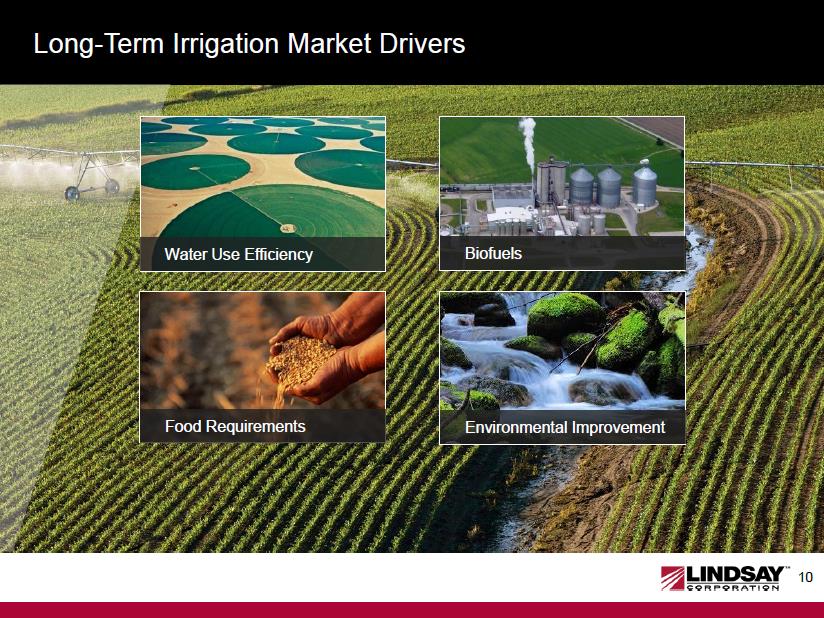
Long-Term Irrigation Market Drivers Water Use Efficiency Food Requirements Environmental Improvement Biofuels
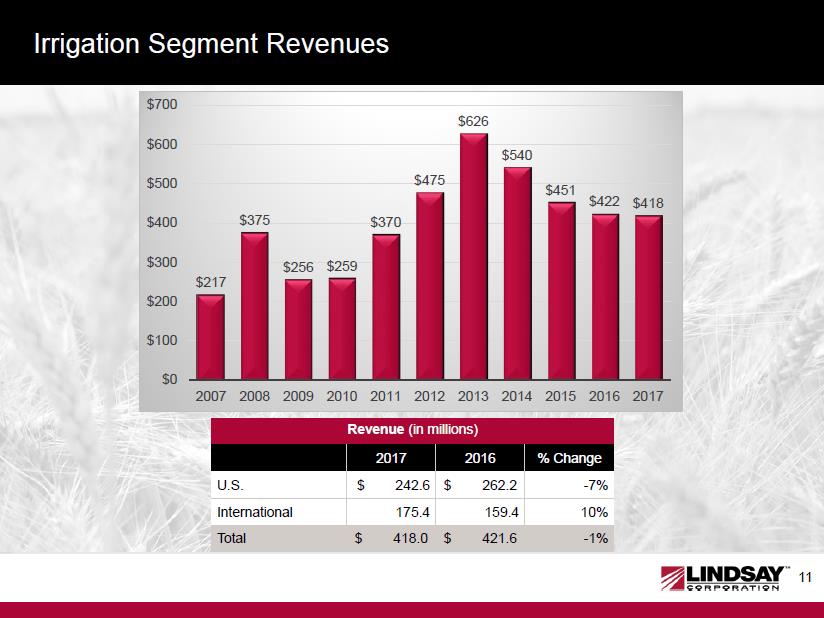
Irrigation Segment Revenues Revenue (in millions) 2017 2016 % Change U.S. $ 242.6 $262.2 -7% International 175.4 159.4 10% Total $418.0 $421.6 -1% $217 $375 $256 $259 $370 $475 $626 $540 $451 $422 $418 $0 $100 $200 $300 $400 $500 $600 $700 2007 2008 2009 2010 2011 2012 2013 2014 2015 2016 2017
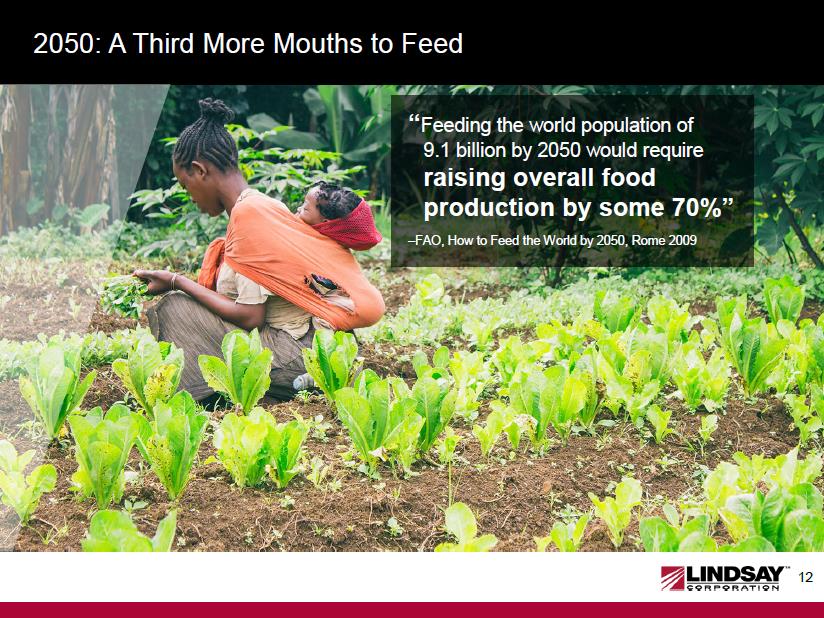
2050: A Third More Mouths to Feed “Feeding the world population of 9.1 billion by 2050 would require raising overall food production by some 70%” –FAO, How to Feed the World by 2050, Rome 2009
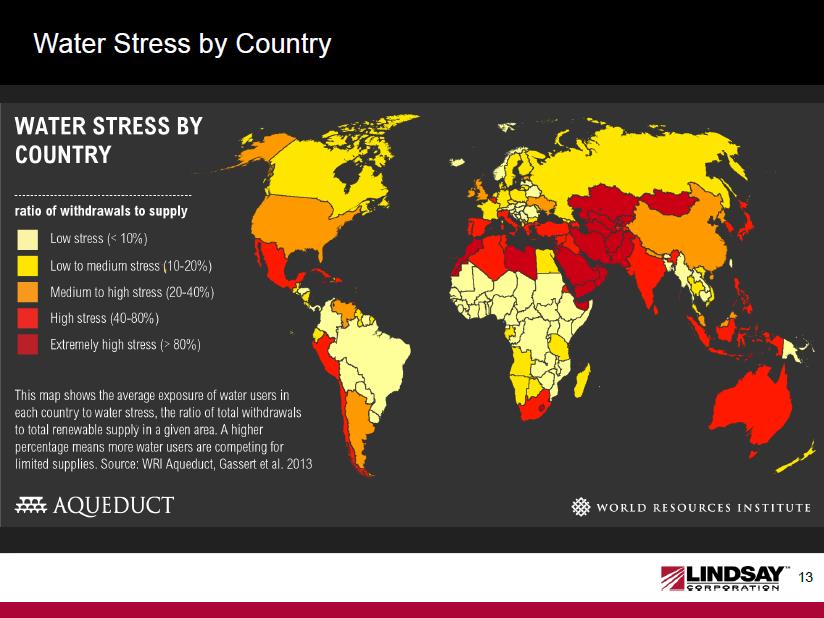
Water Stress by Country ratio of withdrawals to supply Low stress (<10%) Low to medium stress (10-20%) Medium to high stress (20-40%) Hight stress (40-80%) Extremely high stress (>80%) This map shows the average exposure of water users in each country to water stress, the ratio of total withdrawals to total renewable supply in a given area. A higher percentage means more water users are competing for limited suppliers. AQUEDUCT WORLD RESOURCES INSTITUTE
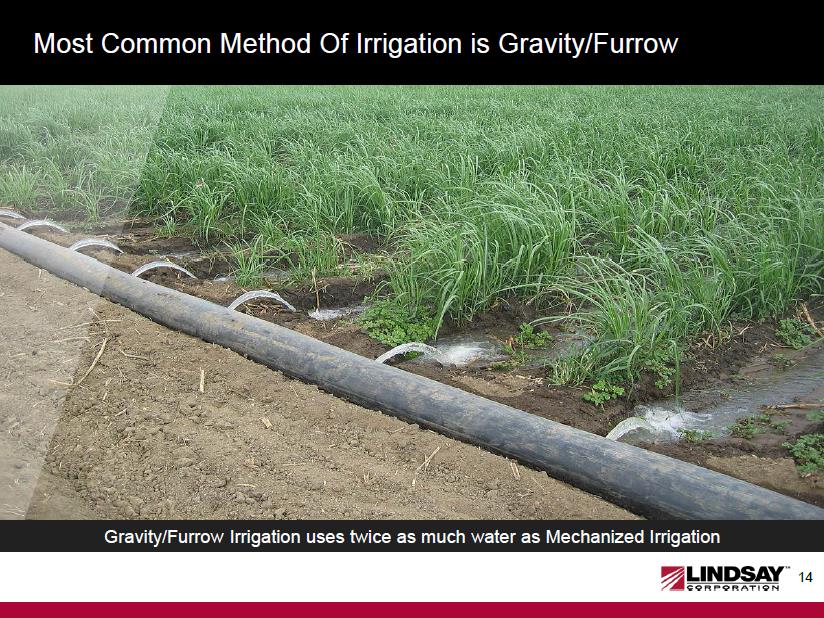
Most Common Method Of Irrigation is Gravity/Furrow I Gravity/Furrow Irrigation uses twice as much water as Mechanized Irrigation
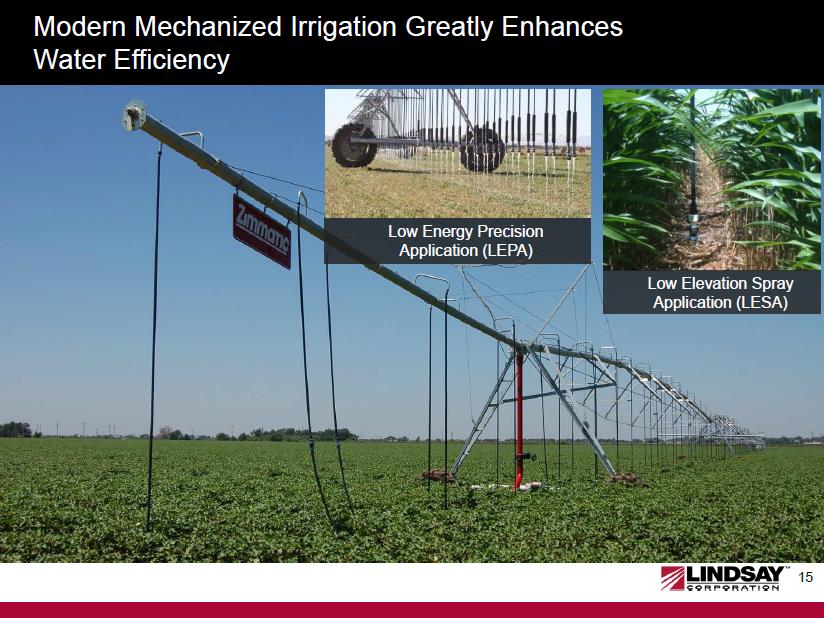
Modern Mechanized Irrigation Greatly Enhances Water Efficiency Low Elevation Spray Application (LESA) Low Energy Precision Application (LEPA)
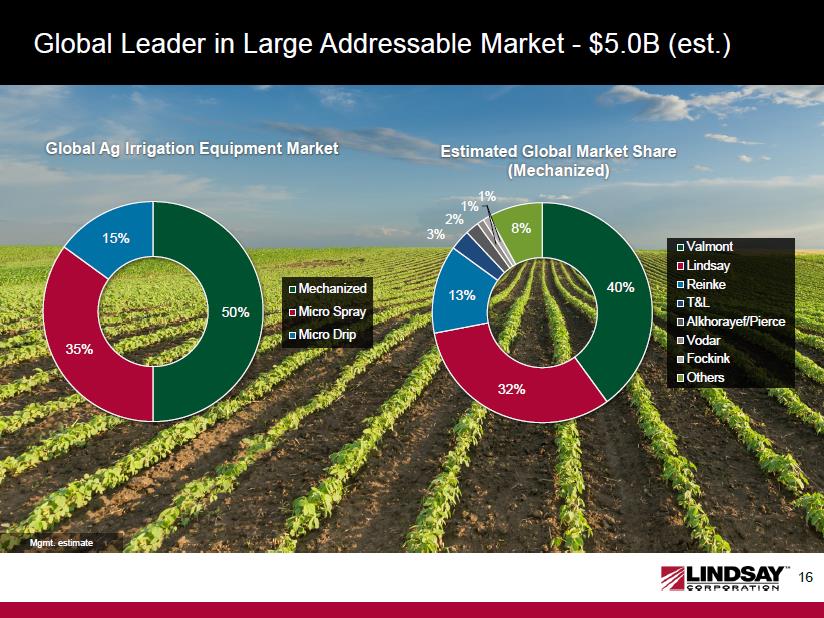
Global Leader in Large Addressable Market -$5.0B (est.) 50% 35% 15% Global Ag Irrigation Equipment Market Mechanized Micro Spray Micro Drip 40% 32% 13% 3% 2% 1% 1% 8% Estimated Global Market Share (Mechanized) Valmont Lindsay Reinke T&L Alkhorayef/Pierce Vodar Fockink Others Mgmt. estimate
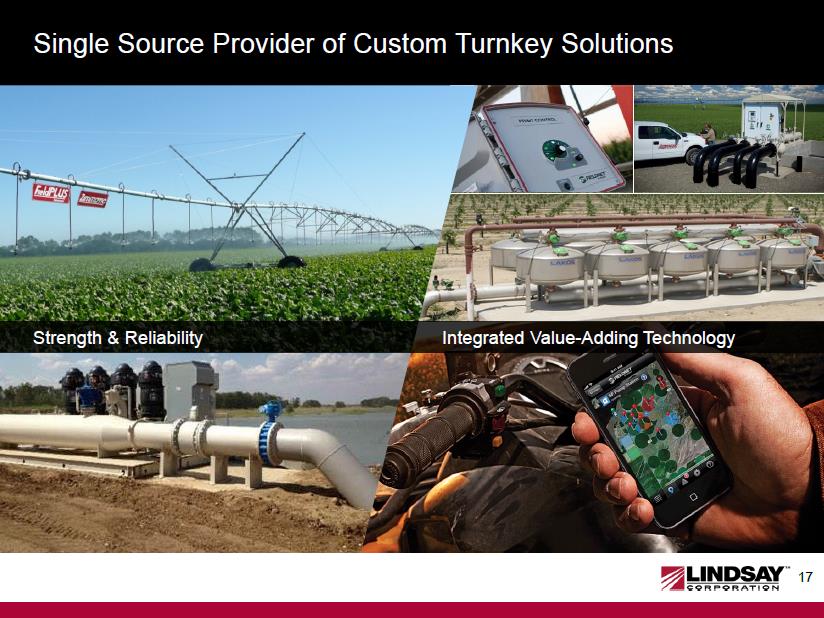
Single Source Provider of Custom Turnkey Integrated Value-Adding Technology Strength & Reliability
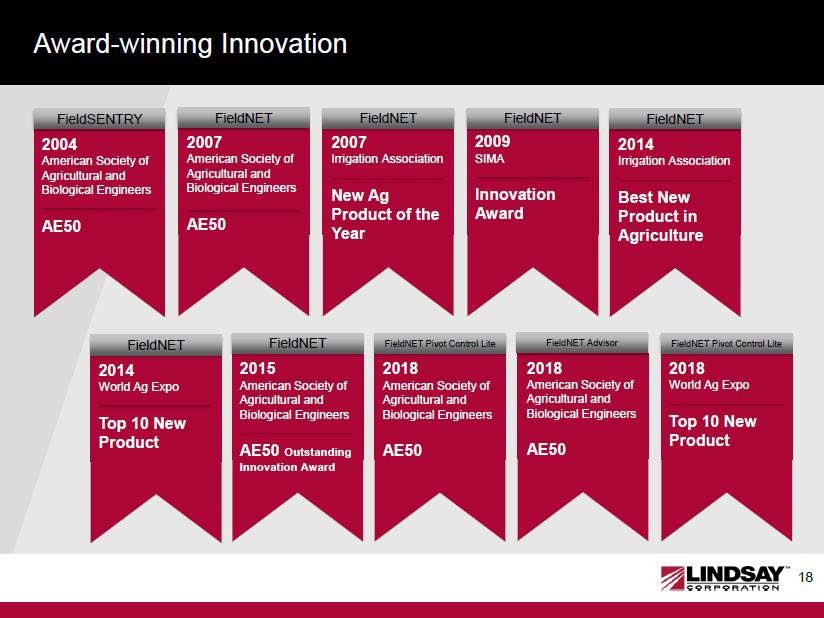
Award-winning Innovation FieldSENTRY 2004 American Society of Agricultural and Biological Engineers AE50 FieldNET 2007 American Society of Agricultural and Biological Engineers AE50 FieldNET 2007 Irrigation Association New Ag Product of the Year FieldNET 2009 SIMA Innovation Award FieldNET 2014 Irrigation Association Best New Product in Agriculture FieldNET 2014 World Ag Expo Top 10 New Product FieldNET 2015 American Society of Agricultural and Biological Engineers AE50 Outstanding Innovation Award FieldNET Pivot Control Lite 2018 American Society of Agricultural and Biological Engineers AE50 FieldNET Advisor 2018 American Society of Agricultural and Biological Engineers AE50 FieldNET Pivot Control Lite 2018 World Ag Expo Top 10 New Product
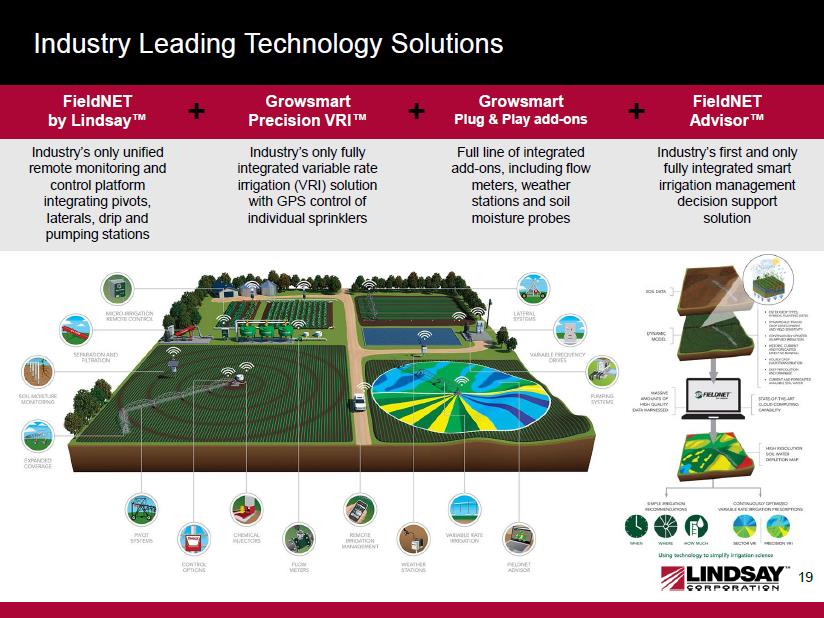
Industry Leading Technology Solutions FieldNETby Lindsay™ Industry’s only unified remote monitoring and control platform integrating pivots, laterals, drip and pumping stations GrowsmartPrecision VRI™ Industry’s only fully integrated variable rate irrigation (VRI) solution with GPS control of individual sprinklers GrowsmartPlug & Play add-ons Full line of integrated add-ons, including flow meters, weather stations and soil moisture probes FieldNETAdvisor™ Industry’s first and only fully integrated smart irrigation management decision support solution
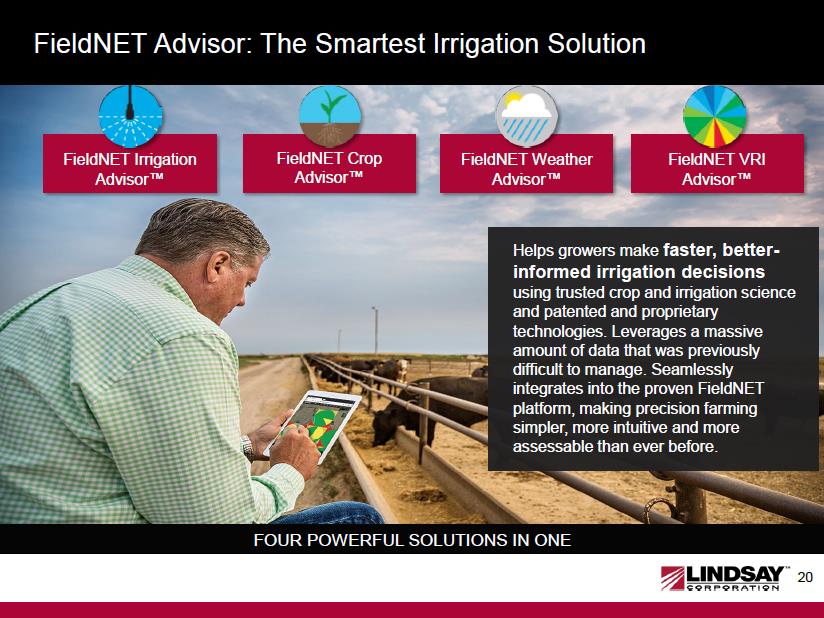
FieldNETAdvisor: The Smartest Irrigation Solution Helps growers make faster, better- informed irrigation decisionsusing trusted crop and irrigation science and patented and proprietary technologies. Leverages a massive amount of data that was previously difficult to manage. Seamlessly integrates into the proven FieldNETplatform, making precision farming simpler, more intuitive and more assessable than ever before. FOUR POWERFUL SOLUTIONS IN ONE FieldNET Irrigation Advisor™ FieldNET Crop Advisor™ FieldNET Weather Advisor™ FieldNET VRI Advisor™
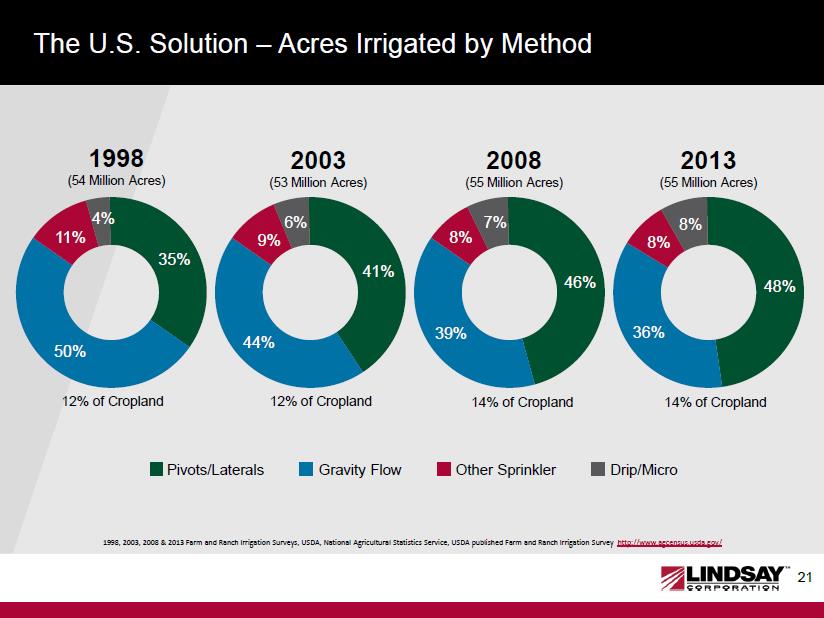
21 The U.S. Solution – Acres Irrigated by Method 21 1998, 2003, 2008 & 2013 Farm and Ranch Irrigation Surveys, USDA, National Agricultural Statistics Service, USDA published Farm and Ranch Irrigation Survey http://www.agcensus.usda.gov/ 35% 50% 11% 4% 41% 44% 9% 6% 2013 (55 Million Acres) 14% of Cropland Pivots/Laterals Gravity Flow Other Sprinkler Drip/Micro 2008 (55 Million Acres) 14% of Cropland 1998 (54 Million Acres) 12% of Cropland 2003 (53 Million Acres) 12% of Cropland 46% 39% 8% 7% 48% 36% 8% 8%
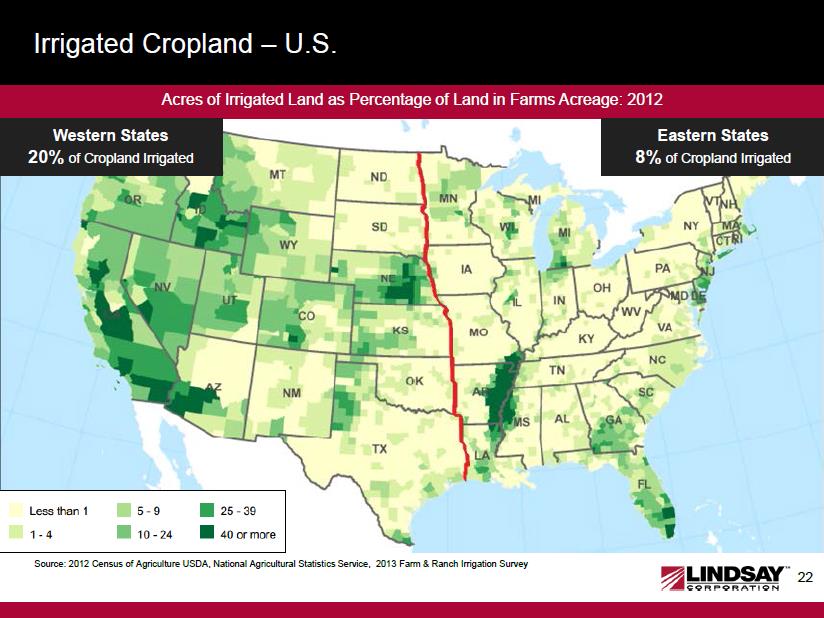
Irrigated Cropland –U.S. Source: 2012 Census of Agriculture USDA, National Agricultural Statistics Service, 2013 Farm & Ranch Irrigation Survey Acres of Irrigated Land as Percentage of Land in Farms Acreage: 2012 Western States 20%of Cropland Irrigated Eastern States 8%of Cropland Irrigated
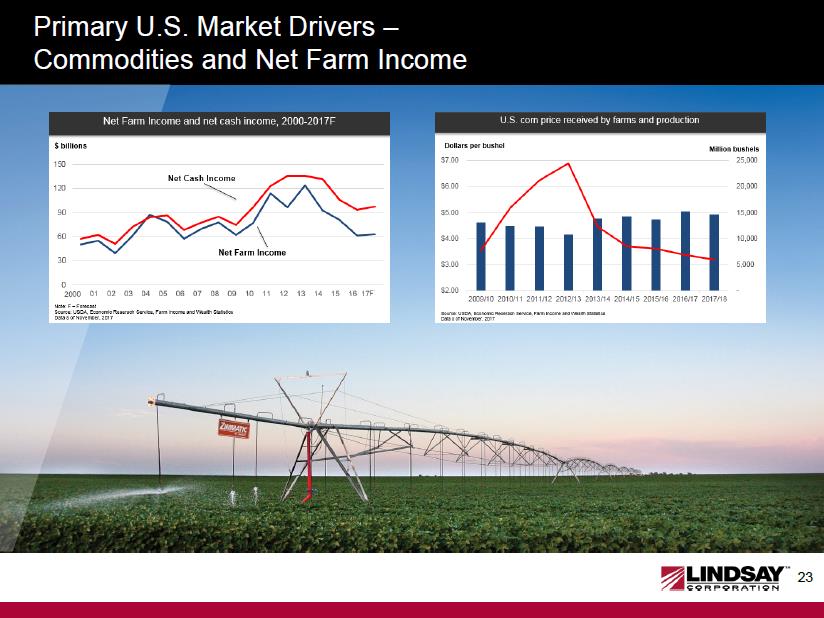
Primary U.S. Market Drivers – Commodities and Net Farm Income Net Farm Income and net cash income, 2000 – 2017F U.S. corn price received by farms and production
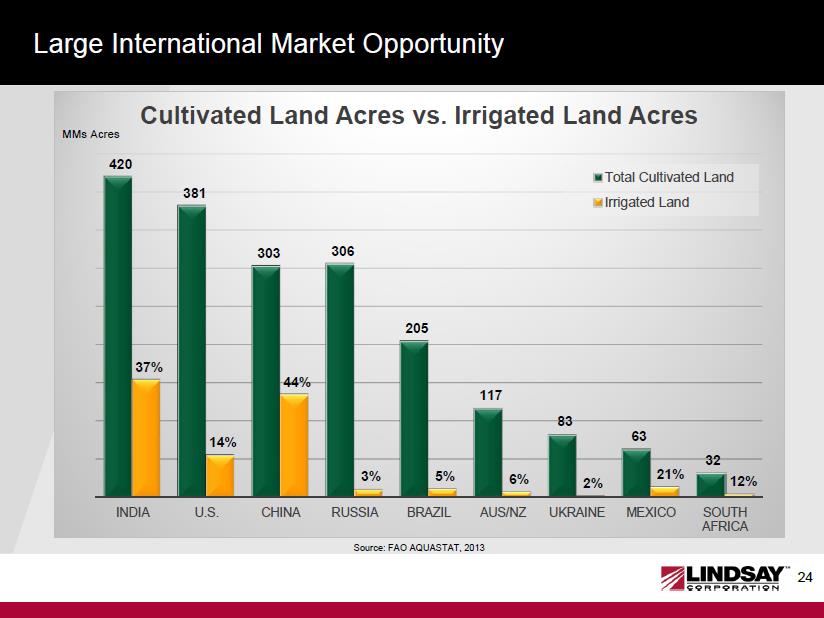
Large International Market Opportunity 420 381 303 306 205 117 83 63 32 37% 14% 44% 3% 5% 6% 2% 21% 12% INDIA U.S. CHINA RUSSIA BRAZIL AUS/NZ UKRAINE MEXICO SOUTH AFRICA Cultivated Land Acres vs. Irrigated Land Acres Total Cultivated Land Irrigated Land MMs Acres
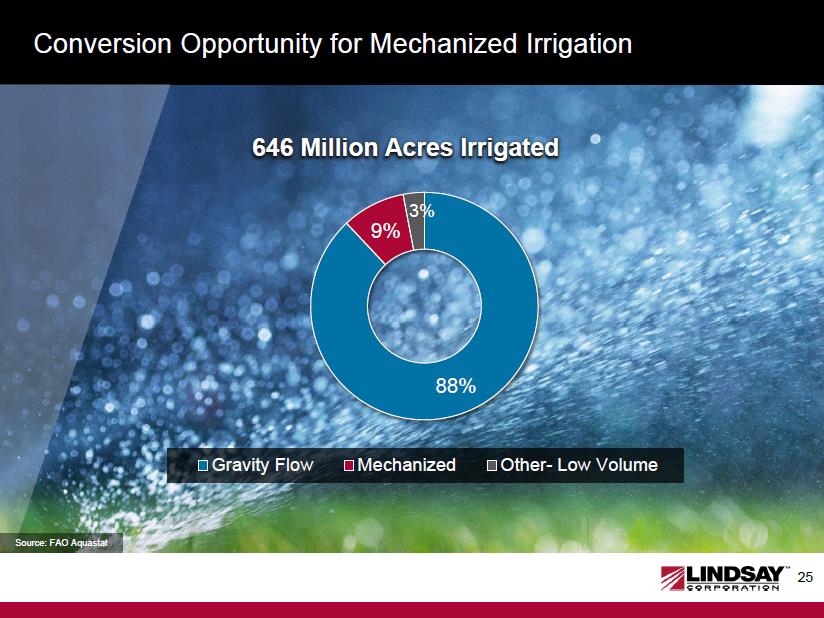
Conversion Opportunity for Mechanized Irrigation 88% 9% 3% 646 Million Acres Irrigated Gravity Flow Mechanized Other- Low Volume Source: FAO Aquastat
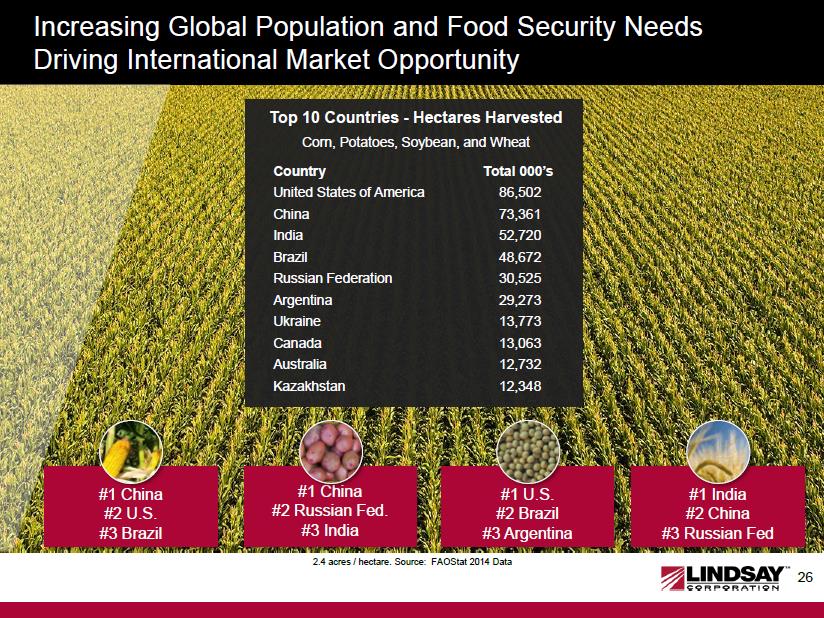
Increasing Global Population and Food Security Needs Driving International Market Opportunity #1 China #2 U.S. #3 Brazil #1 China #2 Russian Fed. #3 India #1 U.S. #2 Brazil #3 Argentina #1 India #2 China #3 Russian Fed 2.4 acres / hectare. Source: FAOStat2014 Data Country Total 000’s United States of America 86,502 China 73,361 India 52,720 Brazil 48,672 Russian Federation 30,525 Argentina 29,273 Ukraine 13,773 Canada 13,063 Australia 12,732 Kazakhstan 12,348
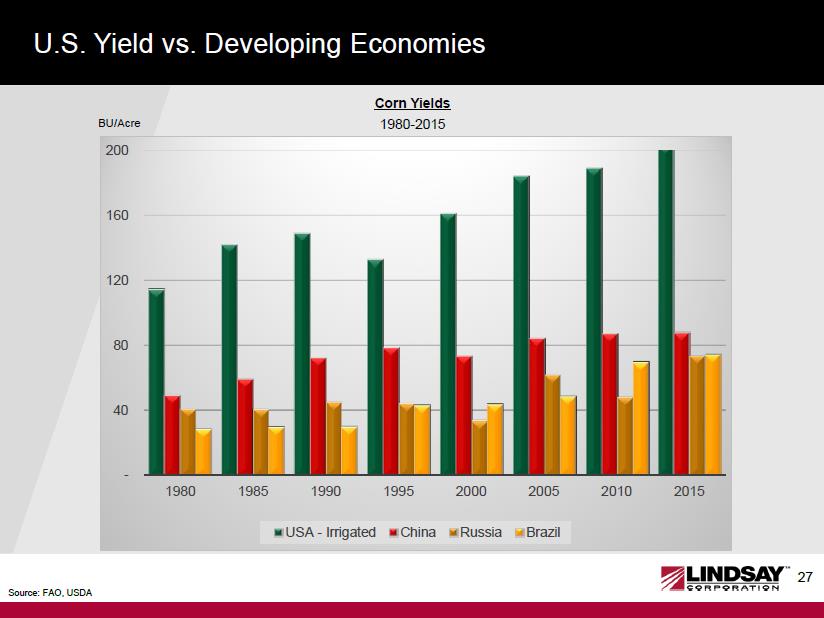
U.S. Yield vs. Developing Economies - 40 80 120 160 200 1980 1985 1990 1995 2000 2005 2010 2015 USA - Irrigated China Russia Brazil Corn Yields 1980-2015 BU/Acre
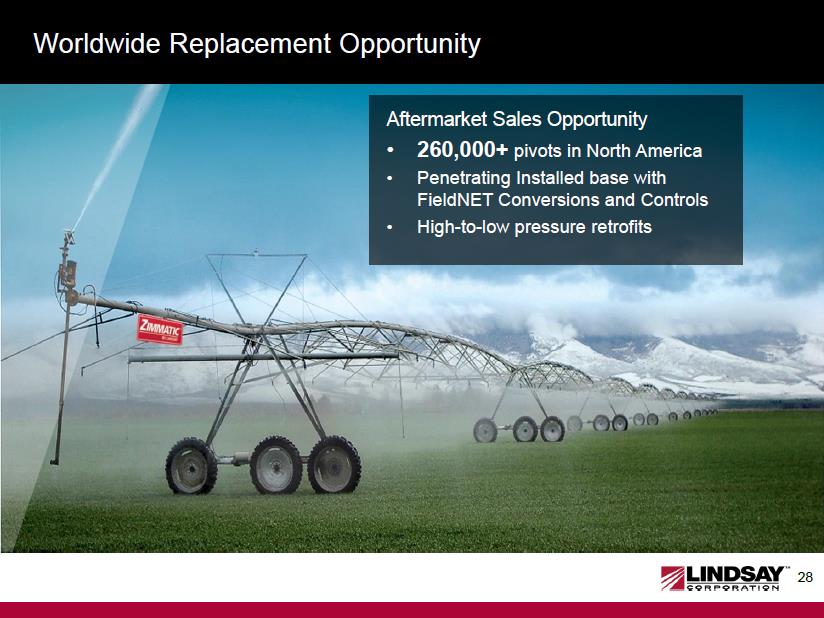
Worldwide Replacement Opportunity Aftermarket Sales Opportunity •260,000+pivots in North America •Penetrating Installed base with FieldNETConversions and Controls •High-to-low pressure retrofits
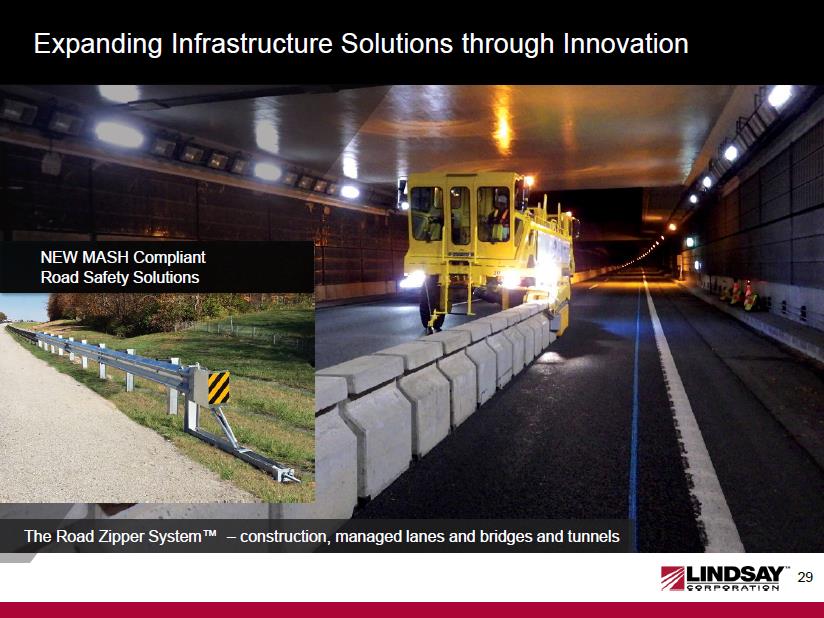
Expanding Infrastructure Solutions through Innovation The Road Zipper System™ –construction, managed lanes and bridges and tunnels NEW MASH Compliant Road Safety Solutions
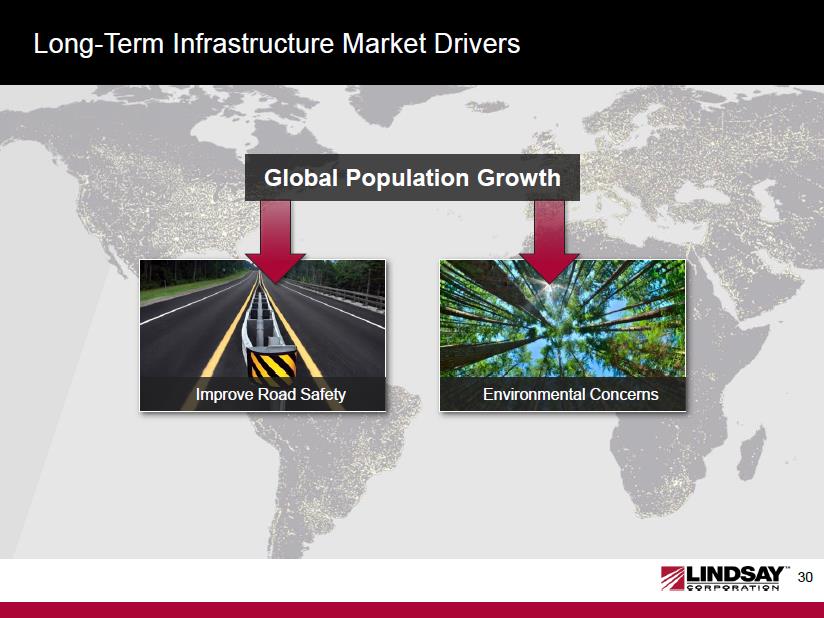
Long-Term Infrastructure Market Drivers Improve Road Safety Environmental Concerns Global Population Growth
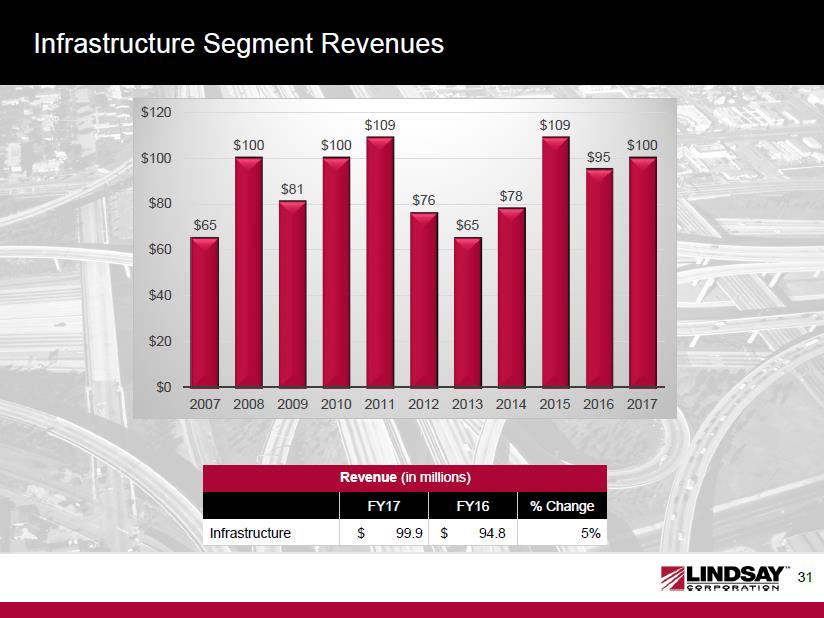
Infrastructure Segment Revenues Revenue (in millions) FY17 FY16 % Change Infrastructure $ 99.9 $94.8 5% $65 $100 $81 $100 $109 $76 $65 $78 $109 $95 $100 $0 $20 $40 $60 $80 $100 $120 2007 2008 2009 2010 2011 2012 2013 2014 2015 2016 2017
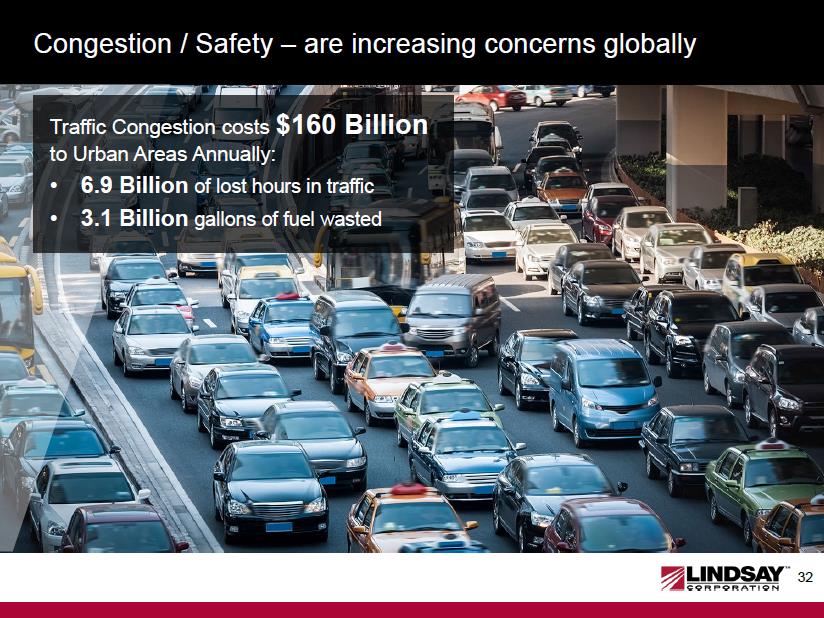
Congestion / Safety –are increasing concerns globally Traffic Congestion costs $160 Billion to Urban Areas Annually: •6.9 Billionof lost hours in traffic •3.1 Billiongallons of fuel wasted
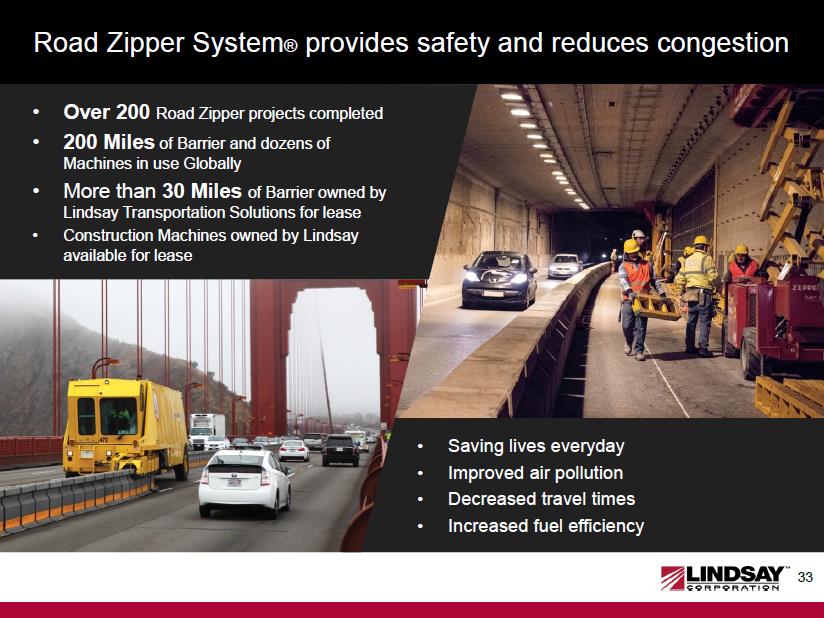
Road Zipper System®provides safety and reduces congestion •Saving lives everyday •Improved air pollution •Decreased travel times •Increased fuel efficiency •Over 200Road Zipper projects completed •200 Milesof Barrier and dozens of Machines in use Globally •More than 30 Milesof Barrier owned by Lindsay Transportation Solutions for lease •Construction Machines owned by Lindsay available for lease
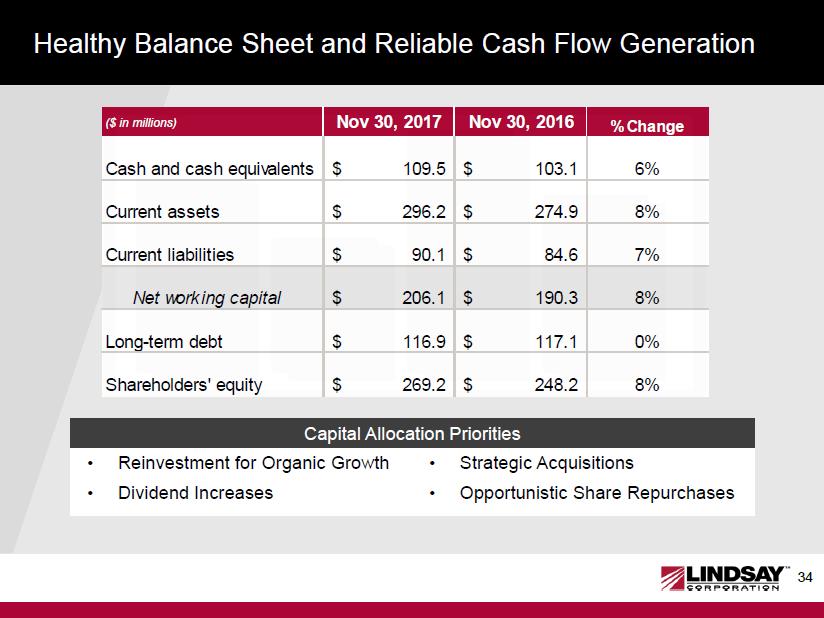
Healthy Balance Sheet and Reliable Cash Flow Generation •Reinvestment for Organic Growth •Dividend Increases ($ in millions)Nov 30, 2017Nov 30, 2016% ChangeCash and cash equivalents109.5$ 103.1$ 6% Current assets296.2$ 274.9$ 8% Current liabilities90.1$ 84.6$ 7% Net working capital206.1$ 190.3$ 8% Long-term debt116.9$ 117.1$ 0% Shareholders' equity269.2$ 248.2$ 8% •Strategic Acquisitions •Opportunistic Share Repurchases Capital Allocation Priorities
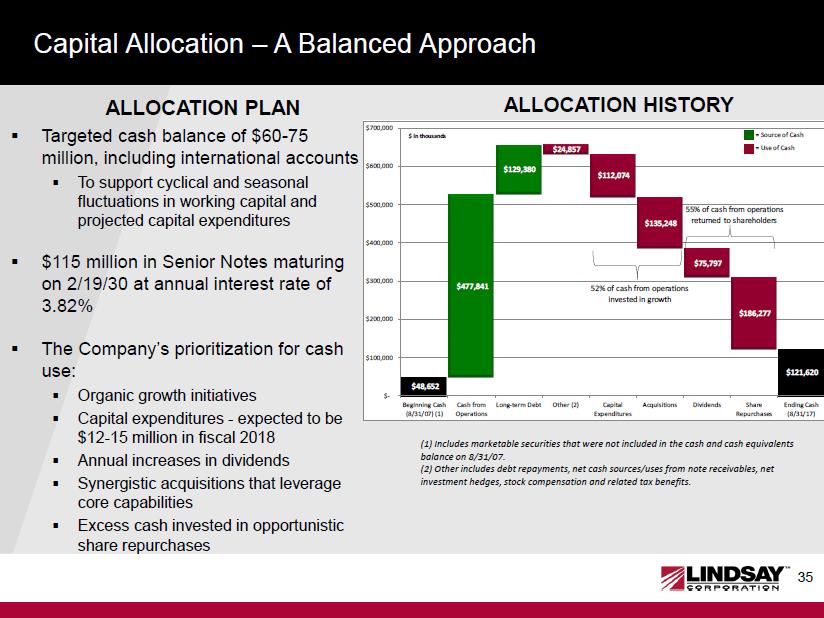
Capital Allocation –A Balanced Approach .Targeted cash balance of $60-75 million, including international accounts .To support cyclical and seasonal fluctuations in working capital and projected capital expenditures .$115 million in Senior Notes maturing on 2/19/30 at annual interest rate of 3.82% .The Company’s prioritization for cash use: .Organic growth initiatives .Capital expenditures -expected to be $12-15 million in fiscal 2018 .Annual increases in dividends .Synergistic acquisitions that leverage core capabilities .Excess cash invested in opportunistic share repurchases ALLOCATION PLAN ALLOCATION HISTORY $48,652 $477,841 $129,380 $24,857 $112,074 $135,248 $75,797 $186,277 $121,620 $- $100,000 $200,000 $300,000 $400,000 $500,000 $600,000 $700,000Beginning Cash(8/31/07) (1) Cash from Operations Long-term Debt Other (2) Capital Expenditures Acquisitions Dividends Share Repurchases Ending Cash (8/31/17) 52% of cash from operations invested in growth 55% of cash from operations returned to shareholders= Source of Cash= Use of Cash$ in thousands
Summary •Favorable Long-term market drivers •Unique market position leveraging a diversified business model with solid risk management •Reliable cash generation •Leveraging expanded global scale to enhance long-term margin opportunities
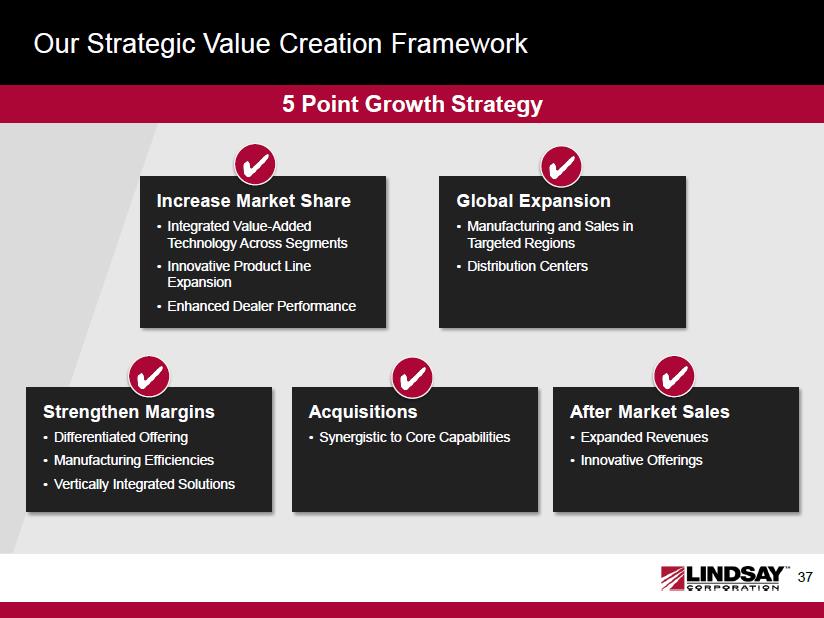
Our Strategic Value Creation Framework Global Expansion •Manufacturing and Sales in Targeted Regions •Distribution Centers CheckMark.png Increase Market Share •Integrated Value-Added Technology Across Segments •Innovative Product Line Expansion •Enhanced Dealer Performance Acquisitions •Synergistic to Core Capabilities CheckMark.png After Market Sales •Expanded Revenues •Innovative Offerings 5 Point Growth Strategy CheckMark.png Strengthen Margins •Differentiated Offering •Manufacturing Efficiencies •Vertically Integrated Solutions