Attached files
| file | filename |
|---|---|
| EX-99.1 - EX-99.1 - GRAFTECH INTERNATIONAL LTD | a17-28513_7ex99d1.htm |
| 8-K - 8-K - GRAFTECH INTERNATIONAL LTD | a17-28513_78k.htm |
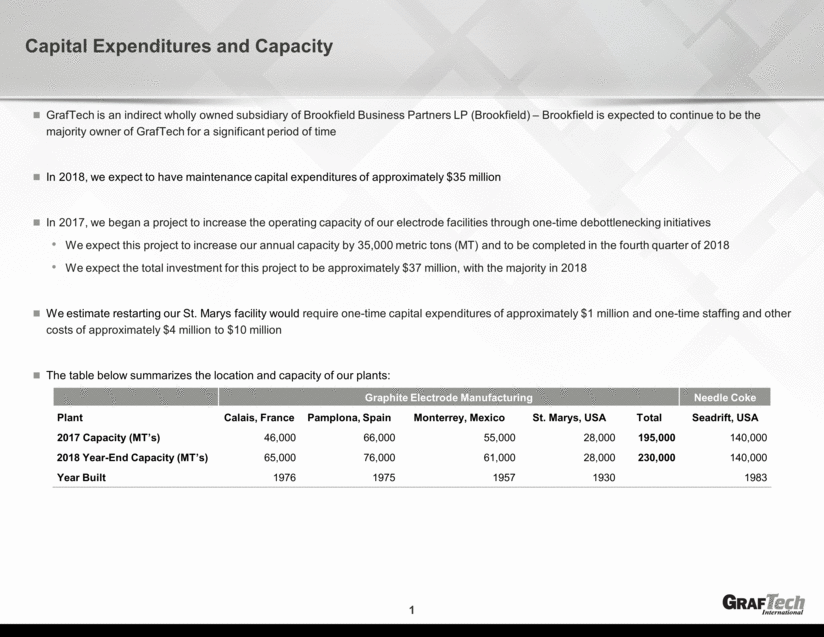
Capital Expenditures and Capacity Graphite Electrode Manufacturing Needle Coke Plant Calais, France Pamplona, Spain Monterrey, Mexico St. Marys, USA Total Seadrift, USA 2017 Capacity (MT’s) 46,000 66,000 55,000 28,000 195,000 140,000 2018 Year-End Capacity (MT’s) 65,000 76,000 61,000 28,000 230,000 140,000 Year Built 1976 1975 1957 1930 1983 1 GrafTech is an indirect wholly owned subsidiary of Brookfield Business Partners LP (Brookfield) – Brookfield is expected to continue to be the majority owner of GrafTech for a significant period of time In 2018, we expect to have maintenance capital expenditures of approximately $35 million In 2017, we began a project to increase the operating capacity of our electrode facilities through one-time debottlenecking initiatives We expect this project to increase our annual capacity by 35,000 metric tons (MT) and to be completed in the fourth quarter of 2018 We expect the total investment for this project to be approximately $37 million, with the majority in 2018 We estimate restarting our St. Marys facility would require one-time capital expenditures of approximately $1 million and one-time staffing and other costs of approximately $4 million to $10 million The table below summarizes the location and capacity of our plants:

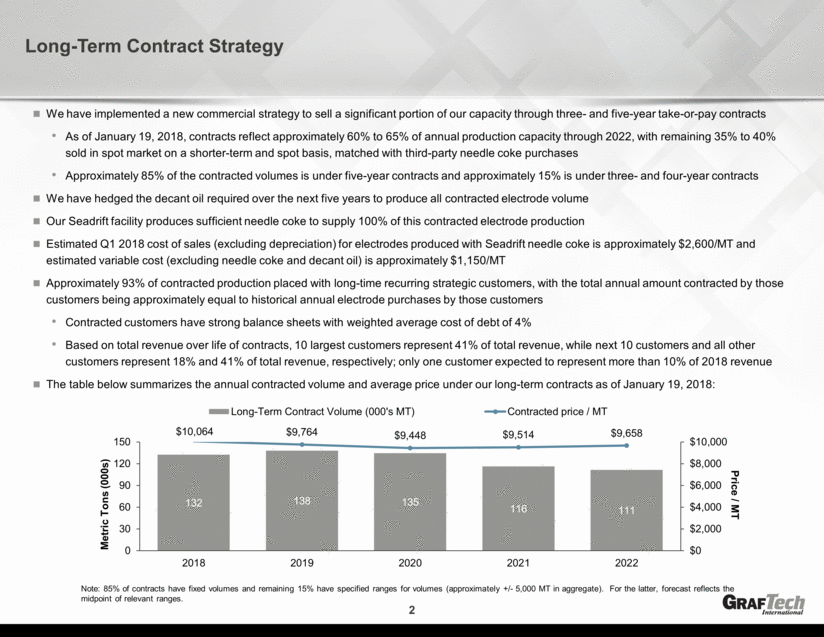
Long-Term Contract Strategy 2 We have implemented a new commercial strategy to sell a significant portion of our capacity through three- and five-year take-or-pay contracts As of January 19, 2018, contracts reflect approximately 60% to 65% of annual production capacity through 2022, with remaining 35% to 40% sold in spot market on a shorter-term and spot basis, matched with third-party needle coke purchases Approximately 85% of the contracted volumes is under five-year contracts and approximately 15% is under three- and four-year contracts We have hedged the decant oil required over the next five years to produce all contracted electrode volume Our Seadrift facility produces sufficient needle coke to supply 100% of this contracted electrode production Estimated Q1 2018 cost of sales (excluding depreciation) for electrodes produced with Seadrift needle coke is approximately $2,600/MT and estimated variable cost (excluding needle coke and decant oil) is approximately $1,150/MT Approximately 93% of contracted production placed with long-time recurring strategic customers, with the total annual amount contracted by those customers being approximately equal to historical annual electrode purchases by those customers Contracted customers have strong balance sheets with weighted average cost of debt of 4% Based on total revenue over life of contracts, 10 largest customers represent 41% of total revenue, while next 10 customers and all other customers represent 18% and 41% of total revenue, respectively; only one customer expected to represent more than 10% of 2018 revenue The table below summarizes the annual contracted volume and average price under our long-term contracts as of January 19, 2018: Note: 85% of contracts have fixed volumes and remaining 15% have specified ranges for volumes (approximately +/- 5,000 MT in aggregate). For the latter, forecast reflects the midpoint of relevant ranges. 132 138 135 116 111 $9,764 $9,448 $9,514 $9,658 $0 $2,000 $4,000 $6,000 $8,000 $10,000 0 30 60 90 120 150 2018 2019 2020 2021 2022 Price / MT Metric Tons (000s) Long-Term Contract Volume (000's MT) Contracted price / MT $10,064

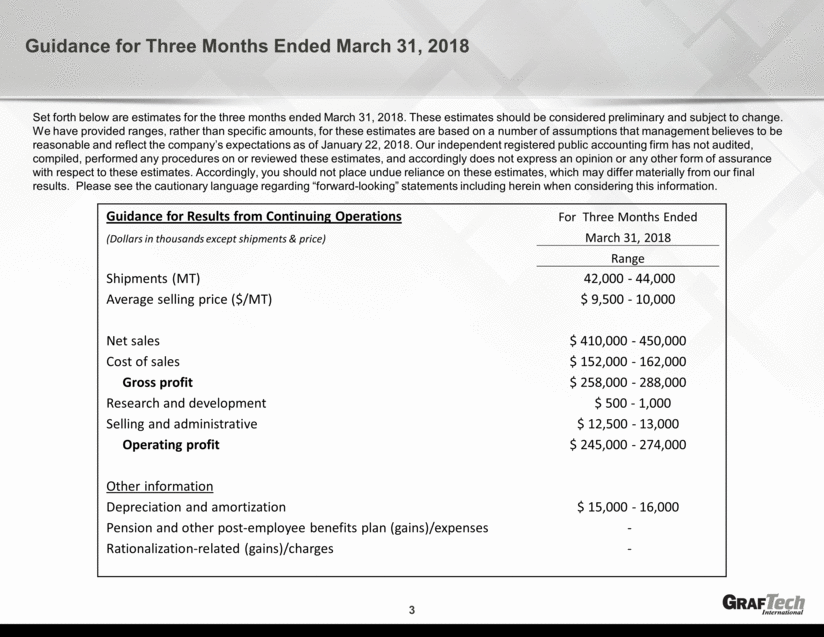
Guidance for Three Months Ended March 31, 2018 3 Set forth below are estimates for the three months ended March 31, 2018. These estimates should be considered preliminary and subject to change. We have provided ranges, rather than specific amounts, for these estimates are based on a number of assumptions that management believes to be reasonable and reflect the company’s expectations as of January 22, 2018. Our independent registered public accounting firm has not audited, compiled, performed any procedures on or reviewed these estimates, and accordingly does not express an opinion or any other form of assurance with respect to these estimates. Accordingly, you should not place undue reliance on these estimates, which may differ materially from our final results. Please see the cautionary language regarding “forward-looking” statements including herein when considering this information. Guidance for Results from Continuing Operations For Three Months Ended (Dollars in thousands except shipments & price) March 31, 2018 Range Shipments (MT) 42,000 - 44,000 Average selling price ($/MT) $ 9,500 - 10,000 Net sales $ 410,000 - 450,000 Cost of sales $ 152,000 - 162,000 Gross profit $ 258,000 - 288,000 Research and development $ 500 - 1,000 Selling and administrative $ 12,500 - 13,000 Operating profit $ 245,000 - 274,000 Other information Depreciation and amortization $ 15,000 - 16,000 Pension and other post-employee benefits plan (gains)/expenses - Rationalization-related (gains)/charges -

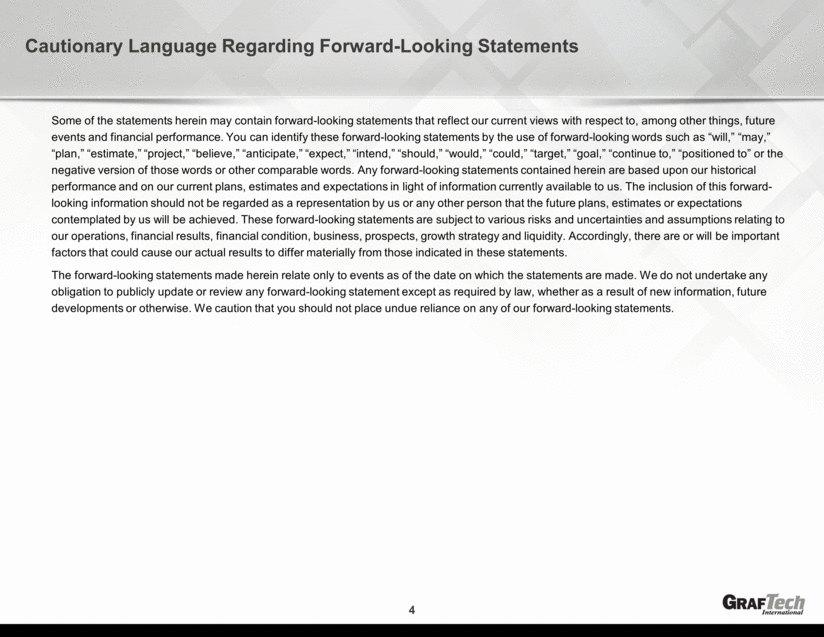
Cautionary Language Regarding Forward-Looking Statements Some of the statements herein may contain forward-looking statements that reflect our current views with respect to, among other things, future events and financial performance. You can identify these forward-looking statements by the use of forward-looking words such as “will,” “may,” “plan,” “estimate,” “project,” “believe,” “anticipate,” “expect,” “intend,” “should,” “would,” “could,” “target,” “goal,” “continue to,” “positioned to” or the negative version of those words or other comparable words. Any forward-looking statements contained herein are based upon our historical performance and on our current plans, estimates and expectations in light of information currently available to us. The inclusion of this forward-looking information should not be regarded as a representation by us or any other person that the future plans, estimates or expectations contemplated by us will be achieved. These forward-looking statements are subject to various risks and uncertainties and assumptions relating to our operations, financial results, financial condition, business, prospects, growth strategy and liquidity. Accordingly, there are or will be important factors that could cause our actual results to differ materially from those indicated in these statements. The forward-looking statements made herein relate only to events as of the date on which the statements are made. We do not undertake any obligation to publicly update or review any forward-looking statement except as required by law, whether as a result of new information, future developments or otherwise. We caution that you should not place undue reliance on any of our forward-looking statements. 4

