Attached files
| file | filename |
|---|---|
| EX-99.2 - EX-99.2 - GRAFTECH INTERNATIONAL LTD | a17-28513_7ex99d2.htm |
| 8-K - 8-K - GRAFTECH INTERNATIONAL LTD | a17-28513_78k.htm |
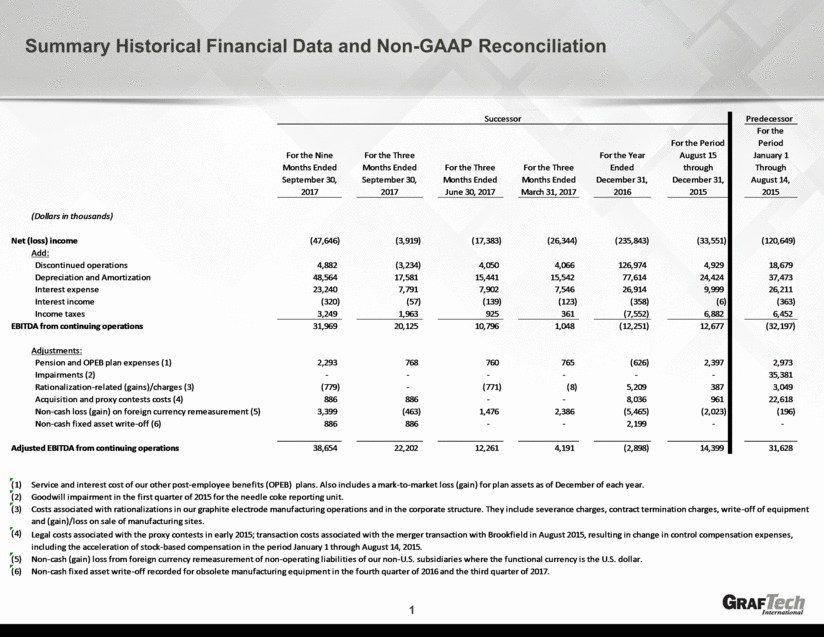
Summary Historical Financial Data and Non-GAAP Reconciliation 1 Successor Predecessor For the Nine Months Ended September 30, 2017 For the Three Months Ended September 30, 2017 For the Three Months Ended June 30, 2017 For the Three Months Ended March 31, 2017 For the Year Ended December 31, 2016 For the Period August 15 through December 31, 2015 For the Period January 1 Through August 14, 2015 (Dollars in thousands) Net (loss) income (47,646) (3,919) (17,383) (26,344) (235,843) (33,551) (120,649) Add: Discontinued operations 4,882 (3,234) 4,050 4,066 126,974 4,929 18,679 Depreciation and Amortization 48,564 17,581 15,441 15,542 77,614 24,424 37,473 Interest expense 23,240 7,791 7,902 7,546 26,914 9,999 26,211 Interest income (320) (57) (139) (123) (358) (6) (363) Income taxes 3,249 1,963 925 361 (7,552) 6,882 6,452 EBITDA from continuing operations 31,969 20,125 10,796 1,048 (12,251) 12,677 (32,197) Adjustments: Pension and OPEB plan expenses (1) 2,293 768 760 765 (626) 2,397 2,973 Impairments (2) - - - - - - 35,381 Rationalization-related (gains)/charges (3) (779) - (771) (8) 5,209 387 3,049 Acquisition and proxy contests costs (4) 886 886 - - 8,036 961 22,618 Non-cash loss (gain) on foreign currency remeasurement (5) 3,399 (463) 1,476 2,386 (5,465) (2,023) (196) Non-cash fixed asset write-off (6) 886 886 - - 2,199 - - Adjusted EBITDA from continuing operations 38,654 22,202 12,261 4,191 (2,898) 14,399 31,628 (1) Service and interest cost of our other post-employee benefits (OPEB) plans. Also includes a mark-to-market loss (gain) for plan assets as of December of each year. (2) Goodwill impairment in the first quarter of 2015 for the needle coke reporting unit. (3) Costs associated with rationalizations in our graphite electrode manufacturing operations and in the corporate structure. They include severance charges, contract termination charges, write-off of equipment and (gain)/loss on sale of manufacturing sites. (4) Legal costs associated with the proxy contests in early 2015; transaction costs associated with the merger transaction with Brookfield in August 2015, resulting in change in control compensation expenses, including the acceleration of stock-based compensation in the period January 1 through August 14, 2015. (5) Non-cash (gain) loss from foreign currency remeasurement of non-operating liabilities of our non-U.S. subsidiaries where the functional currency is the U.S. dollar. (6) Non-cash fixed asset write-off recorded for obsolete manufacturing equipment in the fourth quarter of 2016 and the third quarter of 2017.

Transformation Plan and 2017 Production Since 2012, we have executed a transformation plan to improve our competitive position and allow us to better serve our customers By the end of 2016, we had reduced annual fixed manufacturing costs by approximately $80 million, annual overhead expenses by approximately $65 million and annual maintenance capital expenditure requirements by approximately $45 million since 2012 In 2017, our Calais and Pamplona plants exceeded previous annual record production levels by approximately 15% and 12%, respectively, and our Monterrey plant’s production was approximately 12% higher than its highest level achieved during the past 10 years 2

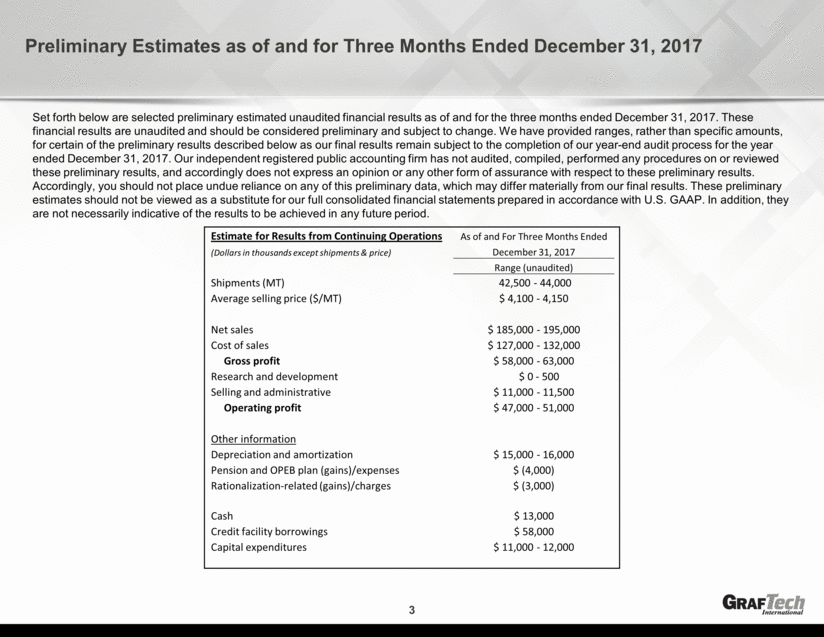
Preliminary Estimates as of and for Three Months Ended December 31, 2017 3 Set forth below are selected preliminary estimated unaudited financial results as of and for the three months ended December 31, 2017. These financial results are unaudited and should be considered preliminary and subject to change. We have provided ranges, rather than specific amounts, for certain of the preliminary results described below as our final results remain subject to the completion of our year-end audit process for the year ended December 31, 2017. Our independent registered public accounting firm has not audited, compiled, performed any procedures on or reviewed these preliminary results, and accordingly does not express an opinion or any other form of assurance with respect to these preliminary results. Accordingly, you should not place undue reliance on any of this preliminary data, which may differ materially from our final results. These preliminary estimates should not be viewed as a substitute for our full consolidated financial statements prepared in accordance with U.S. GAAP. In addition, they are not necessarily indicative of the results to be achieved in any future period. Estimate for Results from Continuing Operations As of and For Three Months Ended (Dollars in thousands except shipments & price) December 31, 2017 Range (unaudited) Shipments (MT) 42,500 - 44,000 Average selling price ($/MT) $ 4,100 - 4,150 Net sales $ 185,000 - 195,000 Cost of sales $ 127,000 - 132,000 Gross profit $ 58,000 - 63,000 Research and development $ 0 - 500 Selling and administrative $ 11,000 - 11,500 Operating profit $ 47,000 - 51,000 Other information Depreciation and amortization $ 15,000 - 16,000 Pension and OPEB plan (gains)/expenses $ (4,000) Rationalization-related (gains)/charges $ (3,000) Cash $ 13,000 Credit facility borrowings $ 58,000 Capital expenditures $ 11,000 - 12,000

