Attached files
| file | filename |
|---|---|
| 8-K - FORM 8-K - DELTA AIR LINES, INC. | delta_8k.htm |
Exhibit 99.1

Delta Finance 101

Value Drivers Unique to Delta Jill Greer Vice President - Investor Relations

Safe Harbor Statements in this presentation that are not historical facts, including statements regarding our estimates, expectations, be lie fs, intentions, projections or strategies for the future, may be "forward - looking statements" as defined in the Private Securities Litigation Re form Act of 1995. All forward - looking statements involve a number of risks and uncertainties that could cause actual results to differ mater ially from the estimates, expectations, beliefs, intentions, projections and strategies reflected in or suggested by the forward - looking statem ents. These risks and uncertainties include, but are not limited to, the effects of terrorist attacks or geopolitical conflict; the cost of aircraft fuel; the impact of fuel hedging activity including rebalancing our hedge portfolio, recording mark - to - market adjustments or posting colla teral in connection with our fuel hedge contracts; the availability of aircraft fuel; the performance of our significant investments i n a irlines in other parts of the world; the possible effects of accidents involving our aircraft; the restrictions that financial covenants in ou r f inancing agreements could have on our financial and business operations; labor issues; interruptions or disruptions in service at one of our hub, gateway or key airports; breaches or security lapses in our information technology systems; disruptions in our information te chn ology infrastructure; our dependence on technology in our operations; the effects of weather, natural disasters and seasonality on our business; the effects of an extended disruption in services provided by third party regional carriers; failure or inability of insuranc e t o cover a significant liability at Monroe’s Trainer refinery; the impact of environmental regulation on the Trainer refinery, including co sts related to renewable fuel standard regulations; our ability to retain management and key employees; competitive conditions in the airlin e i ndustry; the effects of extensive government regulation on our business; the sensitivity of the airline industry to prolonged periods of s tag nant or weak economic conditions; uncertainty in economic conditions and regulatory environment in the United Kingdom related to the likel y e xit of the United Kingdom from the European Union; and the effects of the rapid spread of contagious illnesses. Additional information concerning risks and uncertainties that could cause differences between actual results and forward - lookin g statements is contained in our Securities and Exchange Commission filings, including our Annual Report on Form 10 - K for the fisc al year ended December 31, 2016. Caution should be taken not to place undue reliance on our forward - looking statements, which represent our views only as of December 13, 2017, and which we have no current intention to update. 3

Value Drivers Unique to Delta 4 Key value drivers often present challenges when modeling Delta’s financial performance • Core to Delta’s International strategy Joint Ventures & Equity Investments 1 • Aligns employees’ incentives with owners’ interests Profit Sharing 2 • Complementary businesses that benefit earnings and cash flows Ancillary Businesses 3 • Differences between cash and book tax rates Tax Structure 4

Joint Ventures & Equity Investments 5

International Joint Ventures and Equity Investments Delta employs a unique strategy of joint ventures and equity investments Joint Ventures Equity Investments • Commercial arrangements based on contracts, not equity • Allow close cooperation and provide more choice for customers • Equal sharing of economic benefits drives customer - focused partner alignment • Reinforces commitment to relationship with board level participation • In addition to joint venture contribution in operating results, Delta recognizes its portion of the benefit from partners’ results in non - operating income Approach Mimics the Benefits of Cross - Border Consolidation 6
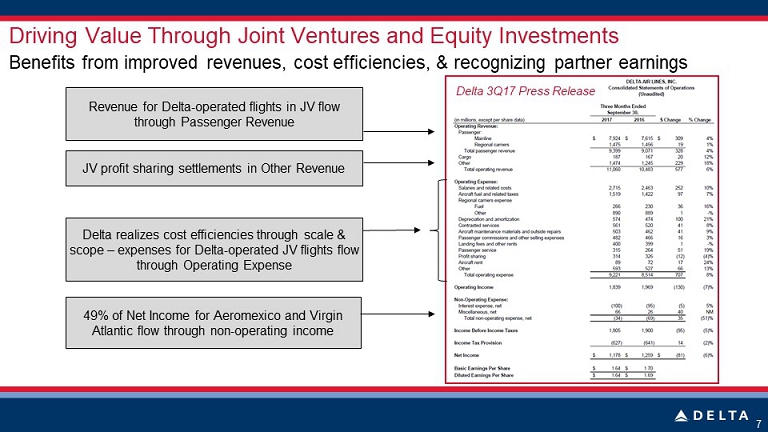
Driving Value Through Joint Ventures and Equity Investments Benefits from improved revenues, cost efficiencies, & recognizing partner earnings 7 Delta 3Q17 Press Release Revenue for Delta - operated flights in JV flow through Passenger Revenue JV profit sharing settlements in Other Revenue Delta realizes cost efficiencies through scale & scope – expenses for Delta - operated JV flights flow through Operating Expense 49% of Net Income for Aeromexico and Virgin Atlantic flow through non - operating income

8 Settlements balance split of profits above a baseline How Joint Venture Settlements are Determined • Baseline profitability was set for each carrier at the start of the joint venture contract • Current year profits are measured against the established baseline and split proportionately • Joint venture settlements are accrued quarterly as part of Other Revenue based on full year expected profitability 3Q17 Earnings Press Release: Delta Partner Total Baseline (2017) Profit (A) 100 60 160 Total 2018 Profit (B) 250 220 470 Incremental Value (C = B-A) 150 160 310 50/50 Split of Value (D) 155 155 310 Settlement (E = D - C) 5 (5) 0 JV Settlement - Sample Calculation

Equity Method Used to Account for Ownership Stakes >20% Delta currently owns 49% of Virgin Atlantic & Aeromexico 9 Seasonality Example – If Delta Owned 49% of Aeromexico in 2016 $5M $1M $17M $6M 1Q16 2Q16 3Q16 4Q16 AM Earnings (USD) 49% in DL Non-Op $9M $2M $34M $13M • Delta recognizes its 49% share of both Virgin Atlantic’s and Aeromexico’s results in non - operating income • Fluctuations in their profitability driven by economic factors, seasonality and currency need to be considered when modeling Delta’s non - operating expense ─ Virgin Atlantic and Aeromexico often earn the majority of their annual profits in the September quarter 3Q17 Earnings Press Release:
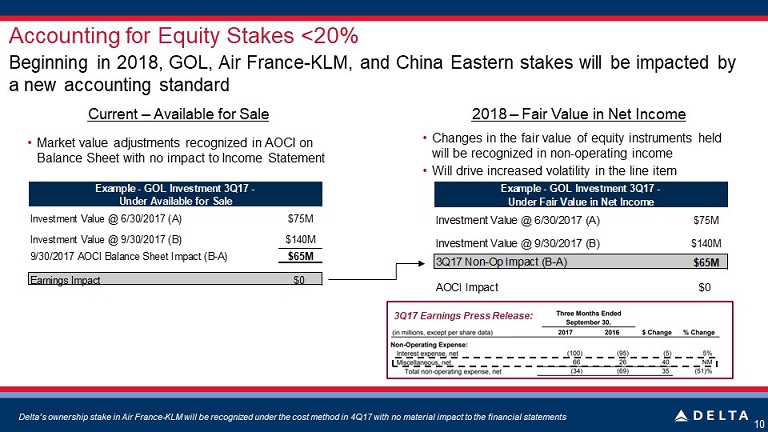
Accounting for Equity Stakes <20% 10 Beginning in 2018, GOL, Air France - KLM, and China Eastern stakes will be impacted by a new accounting standard Current – Available for Sale 2018 – Fair Value in Net Income • Market value adjustments recognized in AOCI on Balance Sheet with no impact to Income Statement Delta’s ownership stake in Air France - KLM will be recognized under the cost method in 4Q17 with no material impact to the financ ial statements • Changes in the fair value of equity instruments held will be recognized in non - operating income • Will drive increased volatility in the line item 3Q17 Earnings Press Release: Investment Value @ 6/30/2017 (A) $75M Investment Value @ 9/30/2017 (B) $140M 9/30/2017 AOCI Balance Sheet Impact (B-A) $65M Earnings Impact $0 Example - GOL Investment 3Q17 - Under Available for Sale Investment Value @ 6/30/2017 (A) $75M Investment Value @ 9/30/2017 (B) $140M 3Q17 Non-Op Impact (B-A) $65M AOCI Impact $0 Example - GOL Investment 3Q17 - Under Fair Value in Net Income

Profit Sharing 11

Profit Sharing Program • Eligible profit sharing pool is Delta’s pre - tax profits before profit sharing ─ Employees share 10% of first $2.5 billion of eligible profits and 20% above that amount ─ Delta also accrues for employer taxes and other benefits which adds 2 - 2.5% at 10% sharing level and 3 - 4% at 20% sharing level • Delta accrues profit sharing monthly based on updated full year forecasts and recognizes changes to profit sharing amounts quarterly 12 Profit Sharing is a unifying force for the Delta people and aligns the interests of employees, customers and owners $0.4B $0.5B $1.1B $1.5B $1.1B 2012 2013 2014 2015 2016 Annual Profit Sharing
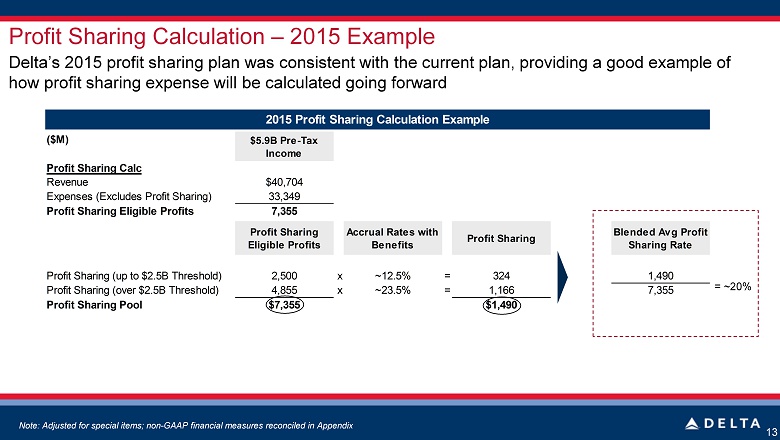
($M) $5.9B Pre-Tax Income Profit Sharing Calc Revenue $40,704 Expenses (Excludes Profit Sharing) 33,349 Profit Sharing Eligible Profits $7,355 Profit Sharing Eligible Profits Accrual Rates with Benefits Profit Sharing Blended Avg Annual Profit Sharing Rate Profit Sharing (up to $2.5B Threshold) 2,500 x ~12% = 290 1,490 Profit Sharing (over $2.5B Threshold) 4,855 x ~24% = 1,200 7,355 Profit Sharing Pool $7,355 $1,490 2015 Profit Sharing Calculation Example Profit Sharing Calculation – 2015 Example Delta’s 2015 profit sharing plan was consistent with the current plan, providing a good example of how profit sharing expense will be calculated going forward 13 = ~20% Note: Adjusted for special items; non - GAAP financial measures reconciled in Appendix

Third Party Refinery Sales and Ancillary Businesses 14

Third Party Refinery Sales • Delta has created a virtual “jet - only” refinery by exchanging most non - jet fuel products produced by its Monroe refinery for jet fuel with third parties • Roughly $250 - 400 million per year in products are not exchanged and are sold to third parties ─ Margins earned on these sales are de minimis ─ Sales are recorded in Other Revenue • Delta’s TRASM and adjusted margins exclude the impact of third party refinery sales from revenue as they are volatile, profit neutral, and are not indicative of trends in our airline business 15 Delta excludes third party refinery sales from TRASM and adjusted margins 80 49 10 95 61 67 129 1Q16 2Q16 3Q16 4Q16 1Q17 2Q17 3Q17 Third Party Refinery Sales ($M) 3Q17 Conference Call Non - GAAPs: Third Party Refinery Sales Disclosures Third Party Refinery Sales: $129M 3Q17 10 - Q Filing: Note: Adjusted for special items; non - GAAP financial measures reconciled in Appendix

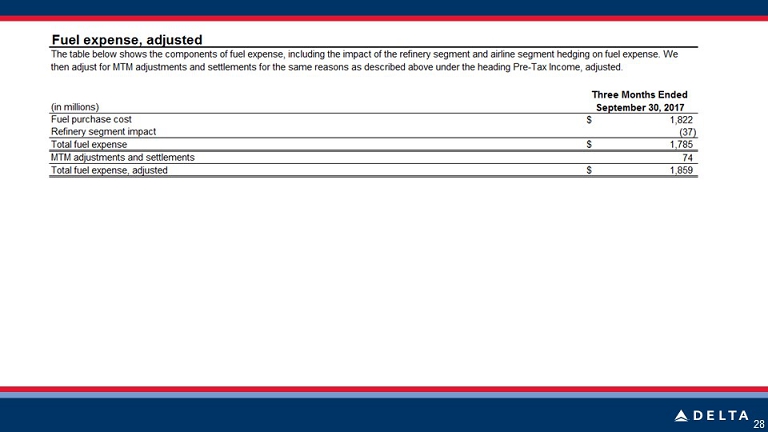
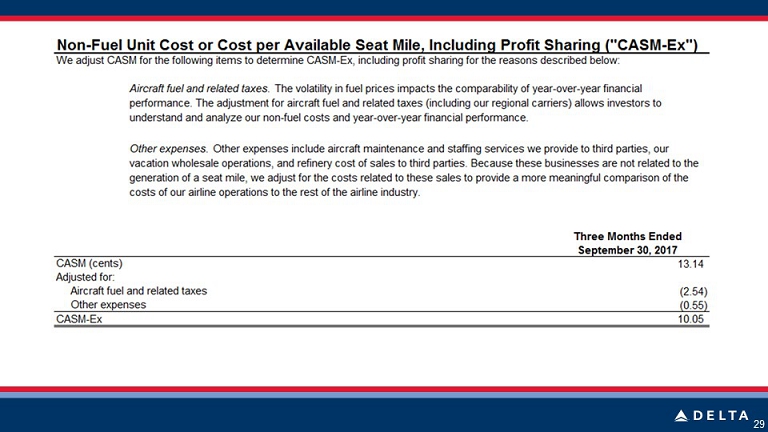
The Impact of Delta’s Ancillary Businesses • Delta’s ancillary businesses include Maintenance Repair and Overhaul (MRO), Delta Global Services (DGS), Delta Vacations, and Delta Private Jets (DPJ) • Ancillary businesses are complementary to the airline operation, but may have different seasonality and timing trends • Delta excludes expenses related to its ancillary businesses from CASM - ex fuel as these costs are not directly impacted by capacity ─ Allows for a clean comparison of the cost performance of the airline operation 16 Ancillary businesses are complementary to the airline operation and are earnings and cash flow positive ($M) Adjusted Total Operating Expenses 9,295 Less: Aircraft Fuel 1,859 Less: Ancillary Business Expenses (Ex. ….Third Party Refinery) 258 Less: Refinery Third Party Expense 129 NF CASM Expense Base 7,049 Capacity - (ASMs) 70,167 NF CASM Including Profit Sharing 10.05₵ 3Q17 Delta's CASM-Ex Calculation 3Q17 Earnings Press Release – End Notes; Note: Adjusted for special items; non - GAAP financial measures reconciled in Appendix

Tax Overview – Current Tax Law 17

18 Delta’s cash tax rate will be below its book rate for several years Delta’s Cash Taxes Are Below Book Expense • Delta’s cash tax rate is significantly below its ~35% book tax rate due to: ─ Accelerated depreciation ─ Pension funding ─ Permanently reinvested foreign earnings • Under current tax law, Delta does not expect to pay cash taxes until 2019 ─ Cash tax rate is expected to remain roughly 10 points below the book tax rate driven by the factors listed above 2017 Book vs. Cash Tax Rate (Ex. NOLs) ~35% Book Tax Rate Cash Tax Rate 20 - 25% $9.5B $5.9B ~$5B 2015 2016 2017E Net Operating Loss Carry Forwards

Upcoming Accounting Standard Changes Bryan Treadway Senior Vice President – Finance & Controller

Upcoming Accounting Standard Changes 20 New accounting standards will change income statement geography • Revenue reclassification improves comparability of reporting across the industry Revenue Recognition 1 • Benefits from Delta’s recent pension funding will be seen in pre - tax margin Pension Costs 2 • Contribution from partner investments will be evident in Delta’s P&L, but may drive some volatility in non - operating expense Financial Instruments 3 • No earnings impact expected when off - balance sheet leasing moves on - balance sheet in 2019 Lease Obligations 4

Revenue Recognition – P&L Impact Immaterial 21 Drives increase in frequent flyer liability on balance sheet, with P&L impact primarily to geography • Effective January 1, 2018 – Delta will provide a recast of the prior two years, including estimated 2017 impacts shown below • Reclassification of ~$2 billion of other revenue to passenger revenue including baggage fees, administrative and other fees, and portion of loyalty revenues • Shift to equivalent - ticket value (ETV) method will result in an estimated ~$100 million non - cash reduction to net income recast for 2017 • No material impact to year - over - year PRASM/TRASM growth Income Statement Balance Sheet • Higher deferral rate used for outstanding mileage credits under equivalent - ticket value (ETV) method will increase the frequent flyer liability by ~$2 billion

Pension and Other Post - Employment Costs – Change in P&L Geography Future pension funding benefits will fall below - the - line 22 Old Standard New Standard Impact • Net benefit or cost for pension and related plans is reported within operating expense • Delta will report under current standard in 2017 • Service costs reported in salaries and related costs (~$110M in 2017E vs. $90M in 2016) • Other components will be reported in non - operating expense , and have been declining with 2017E expense ~$50M vs. $325M in 2016 and $465M in 2012 • Effective January 2018, Delta will recast previous two years • Geography change within P&L with no impact on pre - tax income • Pension funding benefit realized in non - operating expense and pre - tax margins

Financial Instruments – Ownership Stakes Visible in P&L Likely to result in incremental volatility in non - operating income 23 Old Standard New Standard Impact • Market value adjustments for investments accounted for as available - for - sale currently recognized in equity • Market value adjustments recognized in non - operating income • Unrealized gain/loss in equity at end of 2017 reclassified to retained earnings • Effective January 2018 – applied on a go forward basis • Impacts ~50% of $2 billion equity portfolio – stakes in GOL, Air France - KLM, China Eastern • Likely to result in incremental volatility in non - operating income

Leases – Balance Sheet Impact, but Likely P&L Neutral Delta continues to evaluate the impact to the Balance Sheet 24 Old Standard New Standard Impact • Generally allowed off - balance sheet treatment as a future commitment, this included primarily airport and aircraft leases • Requires leases to be recorded on the balance sheet if certain criteria are met • Effective January 2019 • Delta has commenced the process of adopting the new lease standard, and is currently evaluating its leases to determine future treatment and impacts • While there will be a gross up of the balance sheet to recognize certain of these leases, we are not expecting any impacts to pre - tax earnings

Non - GAAP Reconciliations 25 Delta sometimes uses information ("non - GAAP financial measures") that is derived from the Consolidated Financial Statements, but that is not presented in accordance with accounting principles generally accepted in the U.S. (“GAAP”). Under the U.S. Securities and Exchange Commission rules, non - GAAP financial measures may be considered in additio n to results prepared in accordance with GAAP, but should not be considered a substitute for or superior to GAAP results. The tables below show reconciliations of non - GAAP financial measures used in this pr esentation to the most directly comparable GAAP financial measures. Forward Looking Projections. Delta is unable to reconcile certain forward - looking projections to GAAP as the nature or amount of special items cannot be esti mated at this time. Non - GAAP Financial Measures

26
27
27
28
29