Attached files
| file | filename |
|---|---|
| EX-32.2 - EXHIBIT 32.2 - NorthStar Real Estate Income II, Inc. | nreiii-09302017exhibit322.htm |
| EX-32.1 - EXHIBIT 32.1 - NorthStar Real Estate Income II, Inc. | nreiii-09302017exhibit321.htm |
| EX-31.2 - EXHIBIT 31.2 - NorthStar Real Estate Income II, Inc. | nreiii-09302017exhibit312.htm |
| EX-31.1 - EXHIBIT 31.1 - NorthStar Real Estate Income II, Inc. | nreiii-09302017exhibit311.htm |
UNITED STATES
SECURITIES AND EXCHANGE COMMISSION
Washington, D.C. 20549
FORM 10-Q
QUARTERLY REPORT PURSUANT TO SECTION 13 OR 15(d)
OF THE SECURITIES EXCHANGE ACT OF 1934
For the quarterly period ended September 30, 2017
Commission File Number: 000-55189
NORTHSTAR REAL ESTATE INCOME II, INC.
(Exact Name of Registrant as Specified in its Charter)
Maryland | 90-0916682 |
(State or Other Jurisdiction of | (IRS Employer |
Incorporation or Organization) | Identification No.) |
399 Park Avenue, 18th Floor, New York, NY 10022
(Address of Principal Executive Offices, Including Zip Code)
(212) 547-2600
(Registrant’s Telephone Number, Including Area Code)
Indicate by check mark whether the registrant (1) has filed all reports required to be filed by Section 13 or 15(d) of the Securities Exchange Act of 1934 during the preceding 12 months (or for such shorter period that the registrant was required to file such reports), and (2) has been subject to such filing requirements for the past 90 days. Yes ý No o
Indicate by check mark whether the registrant has submitted electronically and posted on its corporate Web site, if any, every Interactive Data File required to be submitted and posted pursuant to Rule 405 of Regulation S-T (§232.405 of this chapter) during the preceding 12 months (or for such shorter period that the registrant was required to submit and post such files).
Yes ý No o
Indicate by check mark whether the registrant is a large accelerated filer, an accelerated filer, a non-accelerated filer, smaller reporting company, or an emerging growth company. See the definitions of “large accelerated filer,” “accelerated filer,” “smaller reporting company,” and “emerging growth company” in Rule 12b-2 of the Exchange Act. (Check one):
Large accelerated filer o | Accelerated filer o | Non-accelerated filer ý (Do not check if a smaller reporting company) | Smaller reporting company o Emerging growth company ý | |||
If an emerging growth company, indicate by check mark if the registrant has elected not to use the extended transition period for complying with any new or revised financial accounting standards provided pursuant to Section 13(a) of the Exchange Act.ý
Indicate by check mark whether the registrant is a shell company (as defined in Rule 12b-2 of the Exchange Act). Yes o No ý
Indicate the number of shares outstanding of each of the registrant’s classes of common stock, as of the latest practicable date:
The Company has 97,740,433 shares of Class A common stock, $0.01 par value per share, and 17,202,405 shares of Class T common stock, $0.01 par value per share, outstanding as of November 8, 2017.
NORTHSTAR REAL ESTATE INCOME II, INC.
FORM 10-Q
TABLE OF CONTENTS
Index | Page | |
2
FORWARD-LOOKING STATEMENTS
This Quarterly Report on Form 10-Q contains certain “forward-looking statements” within the meaning of the Private Securities Litigation Reform Act of 1995, Section 27A of the Securities Act of 1933, as amended, or Securities Act, and Section 21E of the Securities Exchange Act of 1934, as amended, or Exchange Act. Forward-looking statements are generally identifiable by use of forward-looking terminology such as “may,” “will,” “should,” “potential,” “intend,” “expect,” “seek,” “anticipate,” “estimate,” “believe,” “could,” “project,” “predict,” “continue,” “future” or other similar words or expressions. Forward-looking statements are not guarantees of performance and are based on certain assumptions, discuss future expectations, describe plans and strategies, contain projections of results of operations or of financial condition or state other forward-looking information. Such statements include, but are not limited to, those relating to our ability to make distributions to our stockholders, our reliance on our advisor and our sponsor, the operating performance of our investments, our financing needs, the effects of our current strategies, the impact of the transactions pursuant to the master combination agreement, or the combination agreement, with, among others, Colony Capital Operating Company, LLC, or CLNS OP, the operating company of our sponsor, Colony NorthStar, Inc., and NorthStar Real Estate Income Trust, Inc., or NorthStar Income, on our business and operations, and investment activities and our ability to effectively deploy capital. Our ability to predict results or the actual effect of plans or strategies is inherently uncertain, particularly given the economic environment. Although we believe that the expectations reflected in such forward-looking statements are based on reasonable assumptions, our actual results and performance could differ materially from those set forth in the forward-looking statements and you should not unduly rely on these statements. These forward-looking statements involve risks, uncertainties and other factors that may cause our actual results in future periods to differ materially from those forward-looking statements. These factors include, but are not limited to:
• | our ability to consummate the transactions pursuant to the combination agreement on the contemplated terms or at all, including whether such transactions will have the full or any strategic and financial benefits and efficiencies we expect and whether such benefits will be delayed or materialize at all; |
• | the occurrence of any event, change or other circumstances that could give rise to the termination of the combination agreement and the risk that the conditions to the closing of the transactions will not be satisfied; |
• | adverse economic conditions and the impact on the commercial real estate industry; |
• | our ability to deploy capital quickly and successfully and achieve a diversified portfolio consistent with our target asset classes; |
• | our dependence on the resources and personnel of our advisor, our sponsor and their affiliates, including our advisor’s ability to source and close on attractive investment opportunities on our behalf; |
• | the performance of our advisor, our sponsor and their affiliates; |
• | our liquidity and access to capital; |
• | our use of leverage; |
• | our ability to make distributions to our stockholders; |
• | the lack of a public trading market for our shares; |
• | the effect of economic conditions on the valuation of our investments; |
• | the effect of paying distributions to our stockholders from sources other than cash flow provided by operations; |
• | the impact of our sponsor’s recently completed merger with NorthStar Realty Finance Corp. and Colony Capital, Inc. and whether any of the anticipated benefits to our advisor’s and its affiliates’ platform will be realized in full or at all; |
• | our advisor’s and its affiliates’ ability to attract and retain qualified personnel to support our operations and potential changes to key personnel providing management services to us; |
• | our reliance on our advisor and its affiliates and sub-advisors/co-venturers in providing management services to us, the payment of substantial fees to our advisor, the allocation of investments by our advisor and its affiliates among us and the other sponsored or managed companies and strategic vehicles of our sponsor and its affiliates, and various potential conflicts of interest in our relationship with our sponsor; |
• | the impact of market and other conditions influencing the availability of equity versus debt investments and performance of our investments relative to our expectations and the impact on our actual return on invested equity, as well as the cash provided by these investments; |
3
• | changes in our business or investment strategy; |
• | the impact of economic conditions on borrowers of the debt we originate and acquire and the mortgage loans underlying the commercial mortgage backed securities in which we invest, as well as on the tenants of the real property that we own; |
• | changes in the value of our portfolio; |
• | the impact of fluctuations in interest rates; |
• | our ability to realize current and expected returns over the life of our investments; |
• | any failure in our advisor’s and its affiliates’ due diligence to identify relevant facts during our underwriting process or otherwise; |
• | illiquidity of debt investments, equity investments or properties in our portfolio; |
• | our ability to finance our assets on terms that are acceptable to us, if at all, including our ability to complete securitization financing transactions; |
• | environmental compliance costs and liabilities; |
• | risks associated with our joint ventures and unconsolidated entities, including our lack of sole decision making authority and the financial condition of our joint venture partners; |
• | increased rates of loss or default and decreased recovery on our investments; |
• | the degree and nature of our competition; |
• | the effectiveness of our risk and portfolio management systems; |
• | the potential failure to maintain effective internal controls, disclosure and procedures; |
• | regulatory requirements with respect to our business generally, as well as the related cost of compliance; |
• | legislative and regulatory changes, including changes to laws governing the taxation of real estate investment trusts, or REITs, and changes to laws affecting non-traded REITs and alternative investments generally; |
• | our ability to maintain our qualification as a REIT for federal income tax purposes and limitations imposed on our business by our status as a REIT; |
• | the loss of our exemption from registration under the Investment Company Act of 1940, as amended; |
• | general volatility in capital markets; |
• | the adequacy of our cash reserves and working capital; and |
• | other risks associated with investing in our targeted investments, including changes in our industry, interest rates, the securities markets, the general economy or the capital markets and real estate markets specifically. |
The foregoing list of factors is not exhaustive. All forward-looking statements included in this Quarterly Report on Form 10-Q are based on information available to us on the date hereof and we are under no duty to update any of the forward-looking statements after the date of this report to conform these statements to actual results.
Factors that could have a material adverse effect on our operations and future prospects are set forth in our filings with the U.S. Securities and Exchange Commission, or the SEC, included in Part I, Item 1A of our Annual Report on Form 10-K for the fiscal year ended December 31, 2016 and in Part II, Item 1A of this Quarterly Report on Form 10-Q under the heading “Risk Factors.” The risk factors set forth in our filings with the SEC could cause our actual results to differ significantly from those contained in any forward-looking statement contained in this report.
4
PART I. Financial Information
Item 1. Financial Statements
NORTHSTAR REAL ESTATE INCOME II, INC. AND SUBSIDIARIES
CONSOLIDATED BALANCE SHEETS
(Dollars in Thousands, Except Per Share Data)
September 30, 2017 (Unaudited) | December 31, 2016 | ||||||
Assets | |||||||
Cash and cash equivalents | $ | 85,724 | $ | 78,081 | |||
Restricted cash | 70,763 | 69,699 | |||||
Real estate debt investments, net | 809,409 | 806,485 | |||||
Operating real estate, net | 394,174 | 399,237 | |||||
Investments in unconsolidated ventures (refer to Note 5) | 291,597 | 299,681 | |||||
Real estate securities, available for sale | 95,039 | 86,937 | |||||
Receivables, net | 12,166 | 12,001 | |||||
Deferred costs and other assets, net | 31,706 | 31,151 | |||||
Loan collateral receivable, related party | 23,728 | 23,728 | |||||
Total assets(1) | $ | 1,814,306 | $ | 1,807,000 | |||
Liabilities | |||||||
Mortgage and other notes payable, net | $ | 383,894 | $ | 376,181 | |||
Credit facilities | 342,870 | 241,407 | |||||
Securitization bonds payable, net | 115,592 | 191,315 | |||||
Due to related party (refer to Note 8) | 9,044 | 5,347 | |||||
Accounts payable and accrued expenses | 15,017 | 3,727 | |||||
Escrow deposits payable | 43,601 | 40,720 | |||||
Distribution payable | 6,488 | 6,618 | |||||
Deferred purchase price, net | 3,940 | 19,523 | |||||
Other liabilities | 4,230 | 10,771 | |||||
Total liabilities(1) | 924,676 | 895,609 | |||||
Commitments and contingencies | |||||||
Equity | |||||||
NorthStar Real Estate Income II, Inc. Stockholders’ Equity | |||||||
Preferred stock, $0.01 par value, 50,000,000 shares authorized, no shares issued and outstanding as of September 30, 2017 and December 31, 2016 | — | — | |||||
Class A common stock, $0.01 par value, 320,000,000 shares authorized, 97,740,433 and 96,892,562 shares issued and outstanding as of September 30, 2017 and December 31, 2016, respectively | 977 | 969 | |||||
Class T common stock, $0.01 par value, 80,000,000 shares authorized, 17,202,405 and 16,881,086 shares issued and outstanding as of September 30, 2017 and December 31, 2016, respectively | 172 | 169 | |||||
Additional paid-in capital | 1,021,859 | 1,011,599 | |||||
Retained earnings (accumulated deficit) | (139,771 | ) | (104,649 | ) | |||
Accumulated other comprehensive income (loss) | 4,401 | 1,164 | |||||
Total NorthStar Real Estate Income II, Inc. stockholders’ equity | 887,638 | 909,252 | |||||
Non-controlling interests | 1,992 | 2,139 | |||||
Total equity | 889,630 | 911,391 | |||||
Total liabilities and equity | $ | 1,814,306 | $ | 1,807,000 | |||
_______________________________________
(1) | Represents the consolidated assets and liabilities of NorthStar Real Estate Income Operating Partnership II, LP (the “Operating Partnership”). The Operating Partnership is a consolidated variable interest entity (“VIE”), of which the Company is the sole general partner and owns approximately 99.98%. As of September 30, 2017, the Operating Partnership includes $137.8 million and $98.0 million of assets and liabilities, respectively, of certain VIEs that are consolidated by the Operating Partnership. Refer to Note 2, “Summary of Significant Accounting Policies.” |
Refer to accompanying notes to consolidated financial statements.
5
NORTHSTAR REAL ESTATE INCOME II, INC. AND SUBSIDIARIES
CONSOLIDATED STATEMENTS OF OPERATIONS
(Dollars and Shares in Thousands, Except Per Share Data)
(Unaudited)
Three Months Ended September 30, | Nine Months Ended September 30, | ||||||||||||||
2017 | 2016 | 2017 | 2016 | ||||||||||||
Net interest income | |||||||||||||||
Interest income | $ | 18,127 | $ | 15,126 | $ | 52,873 | $ | 46,033 | |||||||
Interest expense | (5,653 | ) | (3,820 | ) | (15,904 | ) | (11,249 | ) | |||||||
Net interest income | 12,474 | 11,306 | 36,969 | 34,784 | |||||||||||
Property and other revenues | |||||||||||||||
Rental and other income | 11,093 | 10,973 | 32,624 | 32,229 | |||||||||||
Total property and other revenues | 11,093 | 10,973 | 32,624 | 32,229 | |||||||||||
Expenses | |||||||||||||||
Asset management and other fees - related party | 5,427 | 4,248 | 16,164 | 14,966 | |||||||||||
Mortgage notes interest expense | 3,644 | 3,490 | 10,648 | 10,257 | |||||||||||
Transaction costs | 3,636 | 313 | 4,496 | 1,659 | |||||||||||
Property operating expenses | 3,243 | 3,261 | 9,534 | 10,247 | |||||||||||
General and administrative expenses (refer to Note 8) | 3,456 | 3,485 | 10,618 | 6,728 | |||||||||||
Depreciation and amortization | 4,713 | 4,695 | 14,174 | 15,465 | |||||||||||
Total expenses | 24,119 | 19,492 | 65,634 | 59,322 | |||||||||||
Other income (loss) | |||||||||||||||
Unrealized gain (loss) on investments | (158 | ) | (39 | ) | (604 | ) | (39 | ) | |||||||
Realized gain (loss) on investments | (650 | ) | (34 | ) | (650 | ) | (34 | ) | |||||||
Income (loss) before equity in earnings (losses) of unconsolidated ventures and income tax benefit (expense) | (1,360 | ) | 2,714 | 2,705 | 7,618 | ||||||||||
Equity in earnings (losses) of unconsolidated ventures | 7,326 | 2,438 | 25,272 | 4,993 | |||||||||||
Income tax benefit (expense) | (646 | ) | (224 | ) | (4,200 | ) | (446 | ) | |||||||
Net income (loss) | 5,320 | 4,928 | 23,777 | 12,165 | |||||||||||
Net (income) loss attributable to non-controlling interests | (32 | ) | (33 | ) | (101 | ) | (77 | ) | |||||||
Net income (loss) attributable to NorthStar Real Estate Income II, Inc. common stockholders | $ | 5,288 | $ | 4,895 | $ | 23,676 | $ | 12,088 | |||||||
Net income (loss) per share of common stock, basic/diluted | $ | 0.05 | $ | 0.05 | $ | 0.21 | $ | 0.12 | |||||||
Weighted average number of shares of common stock outstanding, basic/diluted | 114,874 | 106,777 | 114,526 | 99,343 | |||||||||||
Distributions declared per share of common stock | $ | 0.18 | $ | 0.18 | $ | 0.53 | $ | 0.53 | |||||||
Refer to accompanying notes to consolidated financial statements.
6
NORTHSTAR REAL ESTATE INCOME II, INC. AND SUBSIDIARIES
CONSOLIDATED STATEMENTS OF COMPREHENSIVE INCOME (LOSS)
(Dollars in Thousands)
(Unaudited)
Three Months Ended September 30, | Nine Months Ended September 30, | ||||||||||||||
2017 | 2016 | 2017 | 2016 | ||||||||||||
Net income (loss) | $ | 5,320 | $ | 4,928 | $ | 23,777 | $ | 12,165 | |||||||
Other comprehensive income (loss) | |||||||||||||||
Unrealized gain (loss) on real estate securities, available for sale | (451 | ) | 3,609 | 3,237 | 3,491 | ||||||||||
Total other comprehensive income (loss) | (451 | ) | 3,609 | 3,237 | 3,491 | ||||||||||
Comprehensive income (loss) | 4,869 | 8,537 | 27,014 | 15,656 | |||||||||||
Comprehensive (income) loss attributable to non-controlling interests | (32 | ) | (33 | ) | (101 | ) | (77 | ) | |||||||
Comprehensive income (loss) attributable to NorthStar Real Estate Income II, Inc. common stockholders | $ | 4,837 | $ | 8,504 | $ | 26,913 | $ | 15,579 | |||||||
Refer to accompanying notes to consolidated financial statements.
7
NORTHSTAR REAL ESTATE INCOME II, INC. AND SUBSIDIARIES
CONSOLIDATED STATEMENTS OF EQUITY
(Dollars and Shares in Thousands)
Common Stock | Additional Paid-in Capital | Retained Earnings (Accumulated Deficit) | Accumulated Other Comprehensive Income (Loss) | Total Company’s Stockholders’ Equity | Non-controlling Interests | Total Equity | |||||||||||||||||||||||||||||||
Class A | Class T | ||||||||||||||||||||||||||||||||||||
Shares | Amount | Shares | Amount | ||||||||||||||||||||||||||||||||||
Balance as of December 31, 2015 | 84,517 | $ | 845 | 1,793 | $ | 18 | $ | 768,494 | $ | (56,159 | ) | $ | (443 | ) | $ | 712,755 | $ | 2,327 | $ | 715,082 | |||||||||||||||||
Net proceeds from issuance of common stock | 10,346 | 104 | 14,781 | 148 | 220,316 | — | — | 220,568 | — | 220,568 | |||||||||||||||||||||||||||
Issuance and amortization of equity-based compensation | 19 | — | — | — | 164 | — | — | 164 | — | 164 | |||||||||||||||||||||||||||
Non-controlling interests - distributions | — | — | — | — | — | — | — | — | (272 | ) | (272 | ) | |||||||||||||||||||||||||
Other comprehensive income (loss) | — | — | — | — | — | — | 1,607 | 1,607 | — | 1,607 | |||||||||||||||||||||||||||
Distributions declared | — | — | — | — | — | (70,855 | ) | — | (70,855 | ) | — | (70,855 | ) | ||||||||||||||||||||||||
Proceeds from distribution reinvestment plan | 3,007 | 30 | 315 | 3 | 32,110 | — | — | 32,143 | — | 32,143 | |||||||||||||||||||||||||||
Shares redeemed for cash | (996 | ) | (10 | ) | (8 | ) | — | (9,485 | ) | — | — | (9,495 | ) | — | (9,495 | ) | |||||||||||||||||||||
Net income (loss) | — | — | — | — | — | 22,365 | — | 22,365 | 84 | 22,449 | |||||||||||||||||||||||||||
Balance as of December 31, 2016 | 96,893 | $ | 969 | 16,881 | $ | 169 | $ | 1,011,599 | $ | (104,649 | ) | $ | 1,164 | $ | 909,252 | $ | 2,139 | $ | 911,391 | ||||||||||||||||||
Accretion of distribution fees on Class T shares | — | — | — | — | (228 | ) | — | — | (228 | ) | — | (228 | ) | ||||||||||||||||||||||||
Issuance and amortization of equity-based compensation | 30 | — | — | — | 202 | — | — | 202 | — | 202 | |||||||||||||||||||||||||||
Non-controlling interests - distributions | — | — | — | — | — | — | — | — | (248 | ) | (248 | ) | |||||||||||||||||||||||||
Other comprehensive income (loss) | — | — | — | — | — | — | 3,237 | 3,237 | — | 3,237 | |||||||||||||||||||||||||||
Distributions declared | — | — | — | — | — | (58,798 | ) | — | (58,798 | ) | — | (58,798 | ) | ||||||||||||||||||||||||
Proceeds from distribution reinvestment plan | 2,416 | 24 | 431 | 4 | 26,350 | — | — | 26,378 | — | 26,378 | |||||||||||||||||||||||||||
Shares redeemed for cash | (1,599 | ) | (16 | ) | (110 | ) | (1 | ) | (16,064 | ) | — | — | (16,081 | ) | — | (16,081 | ) | ||||||||||||||||||||
Net income (loss) | — | — | — | — | — | 23,676 | — | 23,676 | 101 | 23,777 | |||||||||||||||||||||||||||
Balance as of September 30, 2017 (unaudited) | 97,740 | $ | 977 | 17,202 | $ | 172 | $ | 1,021,859 | $ | (139,771 | ) | $ | 4,401 | $ | 887,638 | $ | 1,992 | $ | 889,630 | ||||||||||||||||||
Refer to accompanying notes to consolidated financial statements.
8
NORTHSTAR REAL ESTATE INCOME II, INC. AND SUBSIDIARIES
CONSOLIDATED STATEMENTS OF CASH FLOWS
(Dollars in Thousands)
(Unaudited)
Nine Months Ended September 30, | |||||||
2017 | 2016 | ||||||
Cash flows from operating activities: | |||||||
Net income (loss) | $ | 23,777 | $ | 12,165 | |||
Adjustments to reconcile net income (loss) to net cash provided by (used in) operating activities: | |||||||
Equity in (earnings) losses of unconsolidated ventures | (25,272 | ) | (4,993 | ) | |||
Amortization of equity-based compensation | 202 | 113 | |||||
Amortization of deferred financing costs | 2,492 | 1,096 | |||||
Amortization of fees / accretion of discount on investments | (2,888 | ) | (1,234 | ) | |||
Amortization of above/below market leases | 214 | 358 | |||||
Depreciation and amortization | 14,174 | 15,465 | |||||
Unrealized (gain) loss on investments | 604 | 39 | |||||
Realized (gain) loss on investments | 650 | 34 | |||||
Distributions of cumulative earnings from unconsolidated ventures (refer to Note 5) | 24,033 | 4,993 | |||||
Straight line rental income | (825 | ) | (1,109 | ) | |||
Deferred income tax (benefit) expense | (9,718 | ) | (471 | ) | |||
Other non-cash adjustments | — | (128 | ) | ||||
Changes in assets and liabilities: | |||||||
Restricted cash | (655 | ) | (387 | ) | |||
Receivables, net | 660 | 123 | |||||
Deferred costs and other assets, net | (2,538 | ) | (3,303 | ) | |||
Due to related party | 3,469 | (553 | ) | ||||
Accounts payable and accrued expenses | 11,290 | 561 | |||||
Other liabilities | (735 | ) | 289 | ||||
Net cash provided by (used in) operating activities | 38,934 | 23,058 | |||||
Cash flows from investing activities: | |||||||
Acquisition of real estate debt investments, net | — | (37,912 | ) | ||||
Origination and funding of real estate debt investments, net | (173,436 | ) | (188,253 | ) | |||
Proceeds from sale of real estate debt investments | — | 212,329 | |||||
Repayment on real estate debt investments | 170,091 | 84,450 | |||||
Improvements to operating real estate | (2,900 | ) | (5,751 | ) | |||
Investment in unconsolidated ventures (refer to Note 5) | (61,511 | ) | (97,334 | ) | |||
Acquisition of real estate securities, available for sale | (1,556 | ) | (53,955 | ) | |||
Distributions in excess of cumulative earnings from unconsolidated ventures (refer to Note 5) | 53,998 | 53,572 | |||||
Change in restricted cash | 1,219 | 278 | |||||
Net cash provided by (used in) investing activities | (14,095 | ) | (32,576 | ) | |||
Cash flows from financing activities: | |||||||
Borrowings from credit facilities | 129,133 | 116,042 | |||||
Repayment on credit facilities | (27,670 | ) | (185,537 | ) | |||
Borrowings from mortgage and other notes | 7,168 | 5,670 | |||||
Repayment on securitization bonds | (76,905 | ) | — | ||||
Net proceeds from issuance of common stock | — | 193,242 | |||||
Net proceeds from issuance of common stock, related party | — | 1,890 | |||||
Shares redeemed for cash | (16,081 | ) | (5,227 | ) | |||
Distributions paid on common stock | (58,928 | ) | (50,275 | ) | |||
Proceeds from distribution reinvestment plan | 26,378 | 23,461 | |||||
Payment of deferred financing costs | (1,296 | ) | (256 | ) | |||
Change in restricted cash | 1,253 | — | |||||
Distributions to non-controlling interests | (248 | ) | (213 | ) | |||
Net cash provided by (used in) financing activities | (17,196 | ) | 98,797 | ||||
Net increase (decrease) in cash and cash equivalents | 7,643 | 89,279 | |||||
Cash and cash equivalents - beginning of period | 78,081 | 179,870 | |||||
Cash and cash equivalents - end of period | $ | 85,724 | $ | 269,149 | |||
Refer to accompanying notes to consolidated financial statements.
9
NORTHSTAR REAL ESTATE INCOME II, INC. AND SUBSIDIARIES
CONSOLIDATED STATEMENTS OF CASH FLOWS (Continued)
(Dollars in Thousands)
(Unaudited)
Nine Months Ended September 30, | |||||||
2017 | 2016 | ||||||
Supplemental disclosure of non-cash investing and financing activities: | |||||||
Accrued cost of capital | $ | 228 | $ | 2,281 | |||
Subscriptions receivable, gross | — | 1,118 | |||||
Accrual of distribution payable | 6,488 | 6,134 | |||||
Escrow deposits payable | 2,881 | 15,176 | |||||
Non-cash related to PE Investments (refer to Note 5) | 664 | 232,469 | |||||
Refer to accompanying notes to consolidated financial statements.
10
NORTHSTAR REAL ESTATE INCOME II, INC. AND SUBSIDIARIES
NOTES TO CONSOLIDATED FINANCIAL STATEMENTS
(Unaudited)
1. | Business and Organization |
NorthStar Real Estate Income II, Inc. (the “Company”) was formed to originate, acquire and asset manage a diversified portfolio of commercial real estate (“CRE”) debt, equity and securities investments predominantly in the United States. CRE debt investments include first mortgage loans, subordinate mortgage and mezzanine loans and participations in such loans and preferred equity interests. Real estate equity investments include the Company’s direct ownership in properties, which may be structurally senior to a third-party partner’s equity, as well as indirect interests in real estate through real estate private equity funds (“PE Investments”). CRE securities primarily consist of commercial mortgage-backed securities (“CMBS”) and may include unsecured real estate investment trust (“REIT”) debt, collateralized debt obligation (“CDO”) notes and other securities. The Company may also invest internationally. In addition, the Company owns investments through joint ventures. The Company was formed in December 2012 as a Maryland corporation and commenced operations in September 2013. The Company elected to be taxed as a REIT under the Internal Revenue Code of 1986, as amended (the “Internal Revenue Code”), commencing with the taxable year ended December 31, 2013. The Company conducts its operations so as to continue to qualify as a REIT for U.S. federal income tax purposes.
The Company is externally managed and has no employees. Prior to January 11, 2017, the Company was managed by an affiliate of NorthStar Asset Management Group Inc. (NYSE: NSAM) (“NSAM”). Effective January 10, 2017, NSAM completed its previously announced merger with Colony Capital, Inc. (“Colony”), NorthStar Realty Finance Corp. (“NorthStar Realty”), and Colony NorthStar, Inc. (“Colony NorthStar”), a wholly-owned subsidiary of NSAM, which the Company refers to as the mergers, with Colony NorthStar surviving the mergers and succeeding NSAM as the Company’s sponsor (the “Sponsor”). As a result of the mergers, the Sponsor became an internally-managed equity REIT, with a diversified real estate and investment management platform and publicly-traded on the NYSE under the ticker symbol “CLNS.” In addition, following the mergers, CNI NSII Advisors, LLC (formerly known as NSAM J-NSII Ltd, an affiliate of NSAM), (the “Advisor”), became a subsidiary of Colony NorthStar. The Advisor manages the Company’s day-to-day operations pursuant to an advisory agreement. The mergers had no material impact on the Company’s operations.
Colony NorthStar manages capital on behalf of its stockholders, as well as institutional and retail investors in private funds, non-traded and traded REITs and registered investment companies.
Substantially all of the Company’s business is conducted through NorthStar Real Estate Income Operating Partnership II, LP (the “Operating Partnership”). The Company is the sole general partner and a limited partner of the Operating Partnership. The other limited partners of the Operating Partnership are NS Real Estate Income Advisor II, LLC (the “Prior Advisor”) and NorthStar OP Holdings II, LLC (the “Special Unit Holder”), each an affiliate of the Sponsor. The Prior Advisor invested $1,000 in the Operating Partnership in exchange for common units and the Special Unit Holder invested $1,000 in the Operating Partnership and was issued a separate class of limited partnership units (the “Special Units”), which are collectively recorded as non-controlling interests on the consolidated balance sheets as of September 30, 2017 and December 31, 2016. As the Company accepted subscriptions for shares in its continuous public offering, which closed in November 2016, it contributed substantially all of the net proceeds to the Operating Partnership as a capital contribution. As of September 30, 2017, the Company’s limited partnership interest in the Operating Partnership was 99.98%.
The Company’s charter authorizes the issuance of up to 400.0 million shares of common stock with a par value of $0.01 per share, of which 320.0 million are designated as Class A shares and 80.0 million are designated as Class T shares, and up to 50.0 million shares of preferred stock with a par value of $0.01 per share. The board of directors of the Company is authorized to amend its charter, without the approval of the stockholders, to increase the aggregate number of authorized shares of capital stock or the number of shares of any class or series that the Company has authority to issue.
On August 25, 2017, the Company entered into a master combination agreement (the “Combination Agreement”) with, among others, Colony Capital Operating Company, LLC (“CLNS OP”), the operating company of the Sponsor, and NorthStar Real Estate Income Trust, Inc. (“NorthStar Income”), a company managed by an affiliate of the Sponsor, pursuant to which a select portfolio of the assets and liabilities of the Sponsor will be combined with all of the assets and liabilities of the Company and substantially all of the assets and liabilities of NorthStar Income in an all-stock combination transaction to create an externally managed commercial real estate credit REIT (the transactions associated with the Combination Agreement, collectively the “Combination”). The Combination has been unanimously approved by the special committees and the boards of directors of both the Company and NorthStar Income and approved by the board of directors of the Sponsor. The combined company will be named “Colony NorthStar Credit Real Estate, Inc.” (“CLNC”) and its Class A common stock is expected to be listed on a national securities exchange.
11
NORTHSTAR REAL ESTATE INCOME II, INC. AND SUBSIDIARIES
NOTES TO CONSOLIDATED FINANCIAL STATEMENTS (Continued)
(Unaudited)
Upon completion of the Combination, the Company’s stockholders, the Sponsor, and NorthStar Income’s stockholders will own approximately 31%, 37%, and 32%, respectively, of CLNC on a fully diluted basis, subject to certain adjustments as set forth in the Combination Agreement.
The Combination is expected to close in the first quarter of 2018, subject to customary closing conditions, including approval by the stockholders of each of the Company and NorthStar Income, and the listing of CLNC’s Class A common stock on a national securities exchange. There can be no assurance that the closing conditions will be satisfied, that the Combination will be consummated, or the timing thereof.
On December 18, 2012, as part of its formation, the Company issued 22,223 shares of Class A common stock to NorthStar Realty for $0.2 million. On May 6, 2013, the Company’s registration statement on Form S-11 with the U.S. Securities and Exchange Commission (the “SEC”) was declared effective. Pursuant to such registration statement, the Company offered a maximum of $1.65 billion in any combination of Class A and Class T shares of common stock, excluding the initial shares, in a continuous, public offering, of which up to $1.5 billion in shares were offered pursuant to its primary offering (the “Primary Offering”) to the public and up to $150.0 million in shares were offered pursuant to its distribution reinvestment plan (the “DRP”), which are herein collectively referred to as the Offering.
The Company retained NorthStar Securities, LLC (the “Dealer Manager”), formerly a subsidiary of NSAM that became a subsidiary of the Sponsor upon completion of the mergers, to serve as the dealer manager responsible for marketing the shares offered pursuant to the Primary Offering. On September 18, 2013, the Company commenced operations by satisfying the minimum offering requirement in its Primary Offering as a result of NorthStar Realty purchasing 222,223 Class A shares of common stock for $2.0 million.
The Primary Offering closed effective November 9, 2016. Following the Primary Offering and until its suspension as described below, the Company continued to offer and sell shares pursuant to the DRP at the most recently disclosed estimated value per share of each share class. Prior to the closing of the Primary Offering, $150.0 million of the unsold shares remaining from the Primary Offering were allocated to the DRP, for a total of $300.0 million in shares offered pursuant to the DRP. The Company may amend, suspend or terminate the DRP for any reason, except to eliminate a participant’s ability to withdraw from the DRP, upon ten days written notice. On August 25, 2017, in connection with the entry into the Combination Agreement, the Company’s board of directors, including all of its independent directors, voted to suspend the DRP until further notice. Pursuant to the terms of the DRP, the suspension went into effect prior to the monthly distributions paid on or about October 1, 2017 and as a result, all stockholders will receive only cash distributions through the completion of the Combination unless and until the DRP is reinstated.
From inception through November 8, 2017, the Company raised total gross proceeds of $1.2 billion pursuant to the Offering, including gross proceeds of $81.7 million pursuant to the DRP.
2. | Summary of Significant Accounting Policies |
Basis of Quarterly Presentation
The accompanying unaudited consolidated financial statements and related notes of the Company have been prepared in accordance with accounting principles generally accepted in the United States (“U.S. GAAP”) for interim financial reporting and the instructions to Form 10-Q and Rule 10-01 of Regulation S-X. Accordingly, certain information and note disclosures normally included in the consolidated financial statements prepared under U.S. GAAP have been condensed or omitted. In the opinion of management, all adjustments considered necessary for a fair presentation of the Company’s financial position, results of operations and cash flows have been included and are of a normal and recurring nature. The operating results presented for interim periods are not necessarily indicative of the results that may be expected for any other interim period or for the entire year. These consolidated financial statements should be read in conjunction with the Company’s consolidated financial statements and notes thereto included in the Company’s Annual Report on Form 10-K for the fiscal year ended December 31, 2016, which was filed with the SEC.
Principles of Consolidation
The consolidated financial statements include the accounts of the Company, the Operating Partnership and their consolidated subsidiaries. The Company consolidates variable interest entities (“VIEs”), if any, where the Company is the primary beneficiary and voting interest entities which are generally majority owned or otherwise controlled by the Company. All significant intercompany balances are eliminated in consolidation.
12
NORTHSTAR REAL ESTATE INCOME II, INC. AND SUBSIDIARIES
NOTES TO CONSOLIDATED FINANCIAL STATEMENTS (Continued)
(Unaudited)
Variable Interest Entities
A VIE is an entity that lacks one or more of the characteristics of a voting interest entity. A VIE is defined as an entity in which equity investors do not have the characteristics of a controlling financial interest or do not have sufficient equity at risk for the entity to finance its activities without additional subordinated financial support from other parties. The determination of whether an entity is a VIE includes both a qualitative and quantitative analysis. The Company bases its qualitative analysis on its review of the design of the entity, its organizational structure including decision-making ability and relevant financial agreements and the quantitative analysis on the forecasted cash flow of the entity. The Company reassesses its initial evaluation of an entity as a VIE upon the occurrence of certain reconsideration events.
A VIE must be consolidated only by its primary beneficiary, which is defined as the party who, along with its affiliates and agents has both the: (i) power to direct the activities that most significantly impact the VIE’s economic performance; and (ii) obligation to absorb the losses of the VIE or the right to receive the benefits from the VIE, which could be significant to the VIE. The Company determines whether it is the primary beneficiary of a VIE by considering qualitative and quantitative factors, including, but not limited to: which activities most significantly impact the VIE’s economic performance and which party controls such activities; the amount and characteristics of its investment; the obligation or likelihood for the Company or other interests to provide financial support; consideration of the VIE’s purpose and design, including the risks the VIE was designed to create and pass through to its variable interest holders and the similarity with and significance to the business activities of the Company and the other interests. The Company reassesses its determination of whether it is the primary beneficiary of a VIE each reporting period. Significant judgments related to these determinations include estimates about the current and future fair value and performance of investments held by these VIEs and general market conditions.
The Company evaluates its investments and financings, including investments in unconsolidated ventures and securitization financing transactions, if any, to determine whether each investment or financing is a VIE. The Company analyzes new investments and financings, as well as reconsideration events for existing investments and financings, which vary depending on type of investment or financing.
The most significant consolidated VIEs are the Operating Partnership and certain properties that have non-controlling interests. These entities are VIEs because the non-controlling interests do not have substantive kick-out or participating rights. The Company consolidates these entities because it controls all significant business activities.
The Operating Partnership consolidates certain properties that have non-controlling interests. Included in operating real estate, net on the Company’s consolidated balance sheet as of September 30, 2017 is $118.9 million related to such consolidated VIEs. Included in mortgage and other notes payable, net on the Company’s consolidated balance sheet as of September 30, 2017 is $94.8 million, collateralized by the real estate assets of the related consolidated VIEs.
As of September 30, 2017, the Company identified unconsolidated VIEs related to its CRE debt investments, an investment in a mezzanine loan through a joint venture, PE Investments and CRE securities. Assets of each of the VIEs may only be used to settle obligations of the respective VIE. Creditors of each of the VIEs have no recourse to the general credit of the Company.
The following table presents the Company’s classification, carrying value and maximum exposure of unconsolidated VIEs as of September 30, 2017 (dollars in thousands):
Carrying Value | Maximum Exposure to Loss(1) | |||||||
Real estate debt investments, net | $ | 158,827 | $ | 165,748 | ||||
Investments in unconsolidated ventures | 291,597 | 312,219 | ||||||
Real estate securities, available for sale | 95,039 | 95,039 | ||||||
Total assets of unconsolidated VIEs | $ | 545,463 | $ | 573,006 | ||||
_______________________________________
(1) | As of September 30, 2017, maximum exposure to loss includes future funding commitments of $6.9 million for real estate debt investments, net, $17.4 million for an investment in a mezzanine loan through a joint venture, and $3.2 million related to the Company’s proportionate share of an obligation owed through a joint investment for a PE Investment. |
Based on management’s analysis, the Company determined that it is not the primary beneficiary of the above VIEs. Accordingly, the VIEs are not consolidated in the Company’s financial statements as of September 30, 2017. The Company did not provide financial support to the unconsolidated VIEs during the nine months ended September 30, 2017. As of September 30, 2017, there
13
NORTHSTAR REAL ESTATE INCOME II, INC. AND SUBSIDIARIES
NOTES TO CONSOLIDATED FINANCIAL STATEMENTS (Continued)
(Unaudited)
were no explicit arrangements or implicit variable interests that could require the Company to provide financial support to the unconsolidated VIEs outside of the future funding commitments disclosed above.
Voting Interest Entities
A voting interest entity is an entity in which the total equity investment at risk is sufficient to enable it to finance its activities independently and the equity holders have the power to direct the activities of the entity that most significantly impact its economic performance, the obligation to absorb the losses of the entity and the right to receive the residual returns of the entity. The usual condition for a controlling financial interest in a voting interest entity is ownership of a majority voting interest. If the Company has a majority voting interest in a voting interest entity, the entity will generally be consolidated. The Company does not consolidate a voting interest entity if there are substantive participating rights by other parties and/or kick-out rights by a single party or a simple majority vote.
The Company performs on-going reassessments of whether entities previously evaluated under the voting interest framework have become VIEs, based on certain events, and therefore subject to the VIE consolidation framework.
Investments in Unconsolidated Ventures
A non-controlling, unconsolidated ownership interest in an entity may be accounted for using the equity method or the cost method, and for either method, the Company may elect the fair value option. The Company will account for an investment in an unconsolidated entity that does not qualify for equity method accounting or for which the fair value option was not elected using the cost method if the Company determines that it does not have significant influence. Under the cost method, equity in earnings is recorded as dividends are received to the extent they are not considered a return of capital, which is recorded as a reduction of cost of the investment.
Under the equity method, the investment is adjusted each period for capital contributions and distributions and its share of the entity’s net income (loss). Capital contributions, distributions and net income (loss) of such entities are recorded in accordance with the terms of the governing documents. An allocation of net income (loss) may differ from the stated ownership percentage interest in such entity as a result of preferred returns and allocation formulas, if any, as described in such governing documents. Equity method investments are recognized using a cost accumulation model in which the investment is recognized based on the cost to the investor, which includes acquisition fees. The Company records as an expense certain acquisition costs and fees associated with consolidated investments deemed to be business combinations and capitalizes these costs for investments deemed to be acquisitions of an asset, including an equity method investment.
The Company may account for an investment in an unconsolidated entity at fair value by electing the fair value option. The Company elected the fair value option for PE Investments. The Company records the change in fair value for its share of the projected future cash flow of such investments from one period to another in equity in earnings (losses) of unconsolidated ventures in the consolidated statements of operations. Any change in fair value attributed to market related assumptions is considered unrealized gain (loss).
Non-controlling Interests
A non-controlling interest in a consolidated subsidiary is defined as the portion of the equity (net assets) in a subsidiary not attributable, directly or indirectly, to the Company. A non-controlling interest is required to be presented as a separate component of equity on the consolidated balance sheets and presented separately as net income (loss) and comprehensive income (loss) attributable to non-controlling interests. An allocation to a non-controlling interest may differ from the stated ownership percentage interest in such entity as a result of a preferred return and allocation formula, if any, as described in such governing documents.
Estimates
The preparation of consolidated financial statements in conformity with U.S. GAAP requires management to make estimates and assumptions that could affect the amounts reported in the consolidated financial statements and accompanying notes. Actual results could materially differ from those estimates and assumptions.
Comprehensive Income (Loss)
The Company reports consolidated comprehensive income (loss) in separate statements following the consolidated statements of operations. Comprehensive income (loss) is defined as the change in equity resulting from net income (loss) and other comprehensive income (loss) (“OCI”). The only component of OCI is unrealized gain (loss) on CRE securities available for sale for which the fair value option was not elected.
14
NORTHSTAR REAL ESTATE INCOME II, INC. AND SUBSIDIARIES
NOTES TO CONSOLIDATED FINANCIAL STATEMENTS (Continued)
(Unaudited)
Fair Value Option
The fair value option provides an election that allows a company to irrevocably elect to record certain financial assets and liabilities at fair value on an instrument-by-instrument basis at initial recognition. The Company has elected the fair value option for PE Investments. Any change in fair value for assets and liabilities for which the election is made is recognized in earnings.
Cash and Cash Equivalents
The Company considers all highly-liquid investments with an original maturity date of three months or less to be cash equivalents. Cash, including amounts restricted, may at times exceed the Federal Deposit Insurance Corporation deposit insurance limit of $250,000 per institution. The Company mitigates credit risk by placing cash and cash equivalents with major financial institutions. To date, the Company has not experienced any losses on cash and cash equivalents.
Restricted Cash
Restricted cash consists of amounts related to loan origination (escrow deposits) and operating real estate (escrows for taxes, insurance, capital expenditures and payments required under certain lease agreements).
Real Estate Debt Investments
CRE debt investments are generally intended to be held to maturity and, accordingly, are carried at cost, net of unamortized loan fees, premium and discount. CRE debt investments that are deemed to be impaired are carried at amortized cost less a loan loss reserve, if deemed appropriate, which approximates fair value. CRE debt investments where the Company does not have the intent to hold the loan for the foreseeable future or until its expected payoff are classified as held for sale and recorded at the lower of cost or estimated fair value.
The Company may syndicate a portion of the CRE debt investments that it originates or sell the CRE debt investments individually. When a transaction meets the criteria for sale accounting, the Company will no longer recognize the CRE debt investment sold as an asset and will recognize gain or loss based on the difference between the sales price and the carrying value of the CRE debt investment sold. Any related unamortized deferred origination fees, original issue discounts, loan origination costs, discounts or premiums at the time of sale are recognized as an adjustment to the gain or loss on sale, which is included in interest income on the consolidated statement of operations. Any fees received at the time of sale or syndication are recognized as part of interest income.
Operating Real Estate
Operating real estate is carried at historical cost less accumulated depreciation. Ordinary repairs and maintenance are expensed as incurred. Major replacements and betterments which improve or extend the life of the asset are capitalized and depreciated over their useful life. The Company accounts for purchases of operating real estate that qualify as business combinations using the acquisition method, where the purchase price is allocated to tangible assets such as land, building, improvements and other identified intangibles. Costs directly related to an acquisition deemed to be a business combination are expensed and included in transaction costs in the consolidated statements of operations.
Operating real estate is depreciated using the straight-line method over the estimated useful lives of the assets, summarized as follows:
Category: | Term: | |
Building | 40 years | |
Building improvements | Lesser of the useful life or remaining life of the building | |
Land improvements | 10 to 30 years | |
Tenant improvements | Lesser of the useful life or remaining term of the lease | |
Furniture, fixtures and equipment | 3 to 10 years | |
Real Estate Securities
The Company classifies its CRE securities investments as available for sale on the acquisition date, which are carried at fair value. Unrealized gains (losses) are recorded as a component of accumulated OCI in the consolidated statements of equity.
15
NORTHSTAR REAL ESTATE INCOME II, INC. AND SUBSIDIARIES
NOTES TO CONSOLIDATED FINANCIAL STATEMENTS (Continued)
(Unaudited)
Deferred Costs
Deferred costs primarily include deferred financing costs and deferred lease costs. Deferred financing costs represent commitment fees, legal and other third-party costs associated with obtaining financing. Costs related to revolving credit facilities are recorded in deferred costs and other assets, net and are amortized to interest expense using the straight-line basis over the term of the facility. Costs related to other borrowings are recorded net against the carrying value of such borrowings and are amortized to interest expense using the effective interest method. Unamortized deferred financing costs are expensed to realized gain (loss) when the associated facility is repaid before maturity. Costs incurred in seeking financing transactions, which do not close, are expensed in the period in which it is determined that the financing will not occur. Deferred lease costs consist of fees incurred to initiate and renew operating leases, which are amortized on a straight-line basis over the remaining lease term and are recorded to depreciation and amortization in the consolidated statements of operations.
Identified Intangibles
The Company records acquired identified intangibles, which includes intangible assets (such as the value of the above-market leases, in-place leases, and other intangibles) and intangible liabilities (such as the value of below market leases), based on estimated fair value. The value allocated to the identified intangibles are amortized over the remaining lease term. Above/below-market leases are amortized into rental income, below-market ground leases are amortized into real estate properties-operating expense and in-place leases are amortized into depreciation and amortization expense. Identified intangible assets are recorded in deferred costs and other assets, net, and identified intangible liabilities are recorded in other liabilities on the accompanying consolidated balance sheets.
Deferred Costs and Other Assets, Net and Other Liabilities
The following table presents a summary of deferred costs and other assets, net and other liabilities as of September 30, 2017 and December 31, 2016 (dollars in thousands):
September 30, 2017 (Unaudited) | December 31, 2016 | |||||||
Deferred costs and other assets, net | ||||||||
Intangible assets, net(1) | $ | 16,712 | $ | 23,117 | ||||
Deferred financing costs, net - credit facilities | 2,442 | 1,911 | ||||||
Deferred commissions and leasing costs | 5,393 | 3,446 | ||||||
Deposits and pending deal costs | 61 | 64 | ||||||
Prepaid expenses | 1,270 | 1,527 | ||||||
Deferred tax asset | 5,440 | 1,077 | ||||||
Other | 388 | 9 | ||||||
Total | $ | 31,706 | $ | 31,151 | ||||
Other liabilities: | ||||||||
Intangible liabilities, net(2) | 1,344 | 1,799 | ||||||
Tenant security deposits | 1,443 | 1,439 | ||||||
Tenant prepaid rent | 1,305 | 1,797 | ||||||
Deferred tax liability(3) | — | 5,355 | ||||||
Other | 138 | 381 | ||||||
Total | $ | 4,230 | $ | 10,771 | ||||
_______________________________________
(1) | Represents in-place leases and above-market leases, net. |
(2) | Represents below-market leases, net. |
(3) | Includes $4.3 million of tax related liabilities assumed upon the purchase of PE Investment III. Refer to Note 5, “Investments in Unconsolidated Ventures,” for additional information on PE Investment III. |
16
NORTHSTAR REAL ESTATE INCOME II, INC. AND SUBSIDIARIES
NOTES TO CONSOLIDATED FINANCIAL STATEMENTS (Continued)
(Unaudited)
Acquisition Fees and Expenses
The total of all acquisition fees and expenses for an investment, including acquisition fees to the Advisor, cannot exceed, in the aggregate, 6.0% of the contract purchase price of such investment unless such excess is approved by a majority of the Company’s directors, including a majority of its independent directors. For the nine months ended September 30, 2017, total acquisition fees and expenses did not exceed the allowed limit for any investment. An acquisition fee incurred related to an equity investment will generally be expensed as incurred. An acquisition fee paid to the Advisor related to the acquisition of an equity or debt investment in an unconsolidated joint venture is included in investments in unconsolidated ventures on the consolidated balance sheets. An acquisition fee paid to the Advisor related to the origination or acquisition of debt investments is included in debt investments, net on the consolidated balance sheets and is amortized to interest income over the life of the investment using the effective interest method. The Company records as an expense certain acquisition costs and fees associated with transactions deemed to be business combinations in which it consolidates the asset and capitalizes these costs for transactions deemed to be acquisitions of an asset, including an equity investment.
Revenue Recognition
Real Estate Debt Investments
Interest income is recognized on an accrual basis and any related premium, discount, origination costs and fees are amortized over the life of the investment using the effective interest method. The amortization is reflected as an adjustment to interest income in the consolidated statements of operations. The amortization of a premium or accretion of a discount is discontinued if such loan is reclassified to held for sale.
Operating Real Estate
Rental and other income from operating real estate is derived from the leasing of space to various types of tenants. Rental revenue recognition commences when the tenant takes legal possession of the leased space and the leased space is substantially ready for its intended use. The leases are for fixed terms of varying length and generally provide for annual rentals and expense reimbursements to be paid in monthly installments. Rental income from leases is recognized on a straight-line basis over the term of the respective leases. The excess of rent recognized over the amount contractually due pursuant to the underlying leases is included in receivables on the consolidated balance sheets. The Company amortizes any tenant inducements as a reduction of revenue utilizing the straight-line method over the term of the lease. Other income represents revenue from tenant/operator leases which provide for the recovery of all or a portion of the operating expenses and real estate taxes paid by the Company on behalf of the respective property. This revenue is recognized in the same period as the expenses are incurred.
In a situation in which a lease(s) associated with a significant tenant have been, or are expected to be, terminated early, the Company evaluates the remaining useful life of depreciable or amortizable assets in the asset group related to the lease that will be terminated (i.e., tenant improvements, above- and below-market lease intangibles, in-place lease value and deferred leasing costs). Based upon consideration of the facts and circumstances surrounding the termination, the Company may write-off or accelerate the depreciation and amortization associated with the asset group. Such amounts are included within rental and other income for above- and below-market lease intangibles and depreciation and amortization for the remaining lease related asset groups in the consolidated statements of operations.
Real Estate Securities
Interest income is recognized using the effective interest method with any premium or discount amortized or accreted through earnings based on expected cash flow through the expected maturity date of the security. Changes to expected cash flow may result in a change to the yield which is then applied retrospectively for high-credit quality securities that cannot be prepaid or otherwise settled in such a way that the holder would not recover substantially all of the investment or prospectively for all other securities to recognize interest income.
Credit Losses and Impairment on Investments
Real Estate Debt Investments
Loans are considered impaired when, based on current information and events, it is probable that the Company will not be able to collect all principal and interest amounts due according to the contractual terms. The Company assesses the credit quality of the portfolio and adequacy of loan loss reserves on a quarterly basis or more frequently as necessary. Significant judgment of the Company is required in this analysis. The Company considers the estimated net recoverable value of the loan as well as other
17
NORTHSTAR REAL ESTATE INCOME II, INC. AND SUBSIDIARIES
NOTES TO CONSOLIDATED FINANCIAL STATEMENTS (Continued)
(Unaudited)
factors, including but not limited to the fair value of any collateral, the amount and the status of any senior debt, the quality and financial condition of the borrower and the competitive situation of the area where the underlying collateral is located. Because this determination is based on projections of future economic events, which are inherently subjective, the amount ultimately realized may differ materially from the carrying value as of the balance sheet date. If upon completion of the assessment, the estimated fair value of the underlying collateral is less than the net carrying value of the loan, a loan loss reserve is recorded with a corresponding charge to provision for loan losses. The loan loss reserve for each loan is maintained at a level that is determined to be adequate by management to absorb probable losses.
Income recognition is suspended for a loan at the earlier of the date at which payments become 90-days past due or when, in the opinion of the Company, a full recovery of income and principal becomes doubtful. When the ultimate collectability of the principal of an impaired loan is in doubt, all payments are applied to principal under the cost recovery method. When the ultimate collectability of the principal of an impaired loan is not in doubt, contractual interest is recorded as interest income when received, under the cash basis method until an accrual is resumed when the loan becomes contractually current and performance is demonstrated to be resumed. Interest accrued and not collected will be reversed against interest income. A loan is written off when it is no longer realizable and/or legally discharged. As of September 30, 2017, the Company did not have any impaired CRE debt investments.
Operating Real Estate
The Company’s real estate portfolio is reviewed on a quarterly basis, or more frequently as necessary, to assess whether there are any indicators that the value of its operating real estate may be impaired or that its carrying value may not be recoverable. A property’s value is considered impaired if the Company’s estimate of the aggregate expected future undiscounted cash flow generated by the property is less than the carrying value. In conducting this review, the Company considers U.S. macroeconomic factors, real estate sector conditions and asset specific and other factors. To the extent an impairment has occurred, the loss is measured as the excess of the carrying value of the property over the estimated fair value and recorded in impairment on operating real estate in the consolidated statements of operations. As of September 30, 2017, the Company did not have any impaired operating real estate.
An allowance for a doubtful account for a tenant receivable is established based on a periodic review of aged receivables resulting from estimated losses due to the inability of tenants to make required rent and other payments contractually due. Additionally, the Company establishes, on a current basis, an allowance for future tenant credit losses on unbilled rent receivable based on an evaluation of the collectability of such amounts.
Real Estate Securities
CRE securities for which the fair value option is elected are not evaluated for other-than-temporary impairment (“OTTI”) as any change in fair value is recorded in the consolidated statements of operations. Realized losses on such securities are reclassified to realized gain (loss) on investments as losses occur.
CRE securities for which the fair value option is not elected are evaluated for OTTI quarterly. Impairment of a security is considered to be other-than-temporary when: (i) the holder has the intent to sell the impaired security; (ii) it is more likely than not the holder will be required to sell the security; or (iii) the holder does not expect to recover the entire amortized cost of the security. When a CRE security has been deemed to be other-than-temporarily impaired due to (i) or (ii), the security is written down to its fair value and an OTTI is recognized in the consolidated statements of operations. In the case of (iii), the security is written down to its fair value and the amount of OTTI is then bifurcated into: (a) the amount related to expected credit losses; and (b) the amount related to fair value adjustments in excess of expected credit losses. The portion of OTTI related to expected credit losses is recognized in the consolidated statements of operations. The remaining OTTI related to the valuation adjustment is recognized as a component of accumulated OCI in the consolidated statements of equity. CRE securities which are not high-credit quality are considered to have an OTTI if the security has an unrealized loss and there has been an adverse change in expected cash flow. The amount of OTTI is then bifurcated as discussed above. As of September 30, 2017, the Company did not have any OTTI recorded on its CRE securities.
Foreign Currency
Assets and liabilities denominated in a foreign currency for which the functional currency is a foreign currency are translated using the currency exchange rate in effect at the end of the period presented and the results of operations for such entities are translated into U.S. dollars using the average currency exchange rate in effect during the period. The resulting foreign currency translation adjustment is recorded as a component of accumulated OCI in the consolidated statements of equity.
18
NORTHSTAR REAL ESTATE INCOME II, INC. AND SUBSIDIARIES
NOTES TO CONSOLIDATED FINANCIAL STATEMENTS (Continued)
(Unaudited)
Assets and liabilities denominated in a foreign currency for which the functional currency is the U.S. dollar are remeasured using the currency exchange rate in effect at the end of the period presented and the results of operations for such entities are remeasured into U.S. dollars using the average currency exchange rate in effect during the period. The resulting foreign currency remeasurement adjustment is recorded in unrealized gain (loss) on investments and other in the consolidated statements of operations.
As of September 30, 2017, the Company had no deferred purchase price obligations denominated in foreign currency related to its PE Investments. As of December 31, 2016, the Company had $5.2 million of deferred purchase price obligations denominated in foreign currency related to its PE Investments.
Equity-Based Compensation
The Company accounts for equity-based compensation awards using the fair value method, which requires an estimate of fair value of the award at the time of grant. All fixed equity-based awards to directors, which have no vesting conditions other than time of service, are amortized to compensation expense over the awards’ vesting period on a straight-line basis. Equity-based compensation is classified within general and administrative expense in the consolidated statements of operations.
Income Taxes
The Company elected to be taxed as a REIT and to comply with the related provisions of the Internal Revenue Code beginning in its taxable year ended December 31, 2013. Accordingly, the Company will generally not be subject to U.S. federal income tax to the extent of its distributions to stockholders as long as certain asset, income and share ownership tests are met. To maintain its qualification as a REIT, the Company must annually distribute at least 90.0% of its REIT taxable income to its stockholders and meet certain other requirements. The Company believes that all of the criteria to maintain the Company’s REIT qualification have been met for the applicable periods, but there can be no assurance that these criteria will continue to be met in subsequent periods. If the Company were to fail to meet these requirements, it would be subject to U.S. federal income tax and potential interest and penalties, which could have a material adverse impact on its results of operations and amounts available for distributions to its stockholders. The Company’s accounting policy with respect to interest and penalties is to classify these amounts as a component of income tax expense, where applicable.
The Company may also be subject to certain state, local and franchise taxes. Under certain circumstances, U.S. federal income and excise taxes may be due on its undistributed taxable income.
The Company made joint elections to treat certain subsidiaries as taxable REIT subsidiaries (“TRS”) which may be subject to U.S. federal, state and local income taxes. In general, a TRS of the Company may perform non-customary services for tenants, hold assets that the REIT cannot hold directly and may engage in most real estate or non-real estate-related business.
Certain subsidiaries of the Company are subject to taxation by federal, state and local authorities for the periods presented. Income taxes are accounted for by the asset/liability approach in accordance with U.S. GAAP. Deferred taxes, if any, represent the expected future tax consequences when the reported amounts of assets and liabilities are recovered or paid. Such amounts arise from differences between the financial reporting and tax bases of assets and liabilities and are adjusted for changes in tax laws and tax rates in the period which such changes are enacted. A provision for income tax represents the total of income taxes paid or payable for the current period, plus the change in deferred taxes. Current and deferred taxes are recorded on the portion of earnings (losses) recognized by the Company with respect to its interest in TRSs. Deferred income tax assets and liabilities are calculated based on temporary differences between the Company’s U.S. GAAP consolidated financial statements and the federal, state and local tax basis of assets and liabilities as of the consolidated balance sheet date. The Company evaluates the realizability of its deferred tax assets (e.g., net operating loss and capital loss carryforwards) and recognizes a valuation allowance if, based on the available evidence, it is more likely than not that some portion or all of its deferred tax assets will not be realized. When evaluating the realizability of its deferred tax assets, the Company considers estimates of expected future taxable income, existing and projected book/tax differences, tax planning strategies available and the general and industry specific economic outlook. This realizability analysis is inherently subjective, as it requires the Company to forecast its business and general economic environment in future periods. Changes in estimate of deferred tax asset realizability, if any, are included in income tax benefit (expense) in the consolidated statements of operations.
For the three and nine months ended September 30, 2017, the Company recorded income tax expense of $0.6 million and $4.2 million, respectively. For the three and nine months ended September 30, 2016, the Company recorded income tax expense of $0.2 million and $0.4 million, respectively.
19
NORTHSTAR REAL ESTATE INCOME II, INC. AND SUBSIDIARIES
NOTES TO CONSOLIDATED FINANCIAL STATEMENTS (Continued)
(Unaudited)
Transfers of Financial Assets
Sale accounting for transfers of financial assets requires the transfer of an entire financial asset, a group of financial assets in its entirety or if a component of the financial asset is transferred, that component meets the definition of a participating interest by having characteristics that mirror the original financial asset.
Transfers of financial assets are accounted for as sales when control over the assets has been surrendered. If the Company has any continuing involvement, rights or obligations with the transferred financial asset (outside of standard representations and warranties), sale accounting would require that the transfer meets the following sale conditions: (1) the transferred asset has been legally isolated; (2) the transferee has the right (free of conditions that constrain it from taking advantage of that right) to pledge or exchange the transferred asset; and (3) the Company does not maintain effective control over the transferred asset through an agreement that provides for (a) both an entitlement and an obligation by the Company to repurchase or redeem the asset before its maturity, or (b) the unilateral ability by the Company to reclaim the asset and a more than trivial benefit attributable to that ability, or (c) the transferee requiring the Company to repurchase the asset at a price so favorable to the transferee that it is probable the repurchase will occur.
If sale accounting is met, the transferred financial asset is removed from the balance sheet and a net gain or loss is recognized upon sale, taking into account any retained interests. Transfers of financial assets that do not meet the criteria for sale are accounted for as financing transactions, or secured borrowings.
As a result of the requirements of sale accounting, senior participations in first mortgage loans purchased in connection with a securitization financing transaction are recorded as Loan collateral receivable, related party, on the Company’s consolidated balance sheets. Refer to Note 7, “Borrowings,” for additional information.
Recent Accounting Pronouncements
Revenue Recognition - In May 2014, the Financial Accounting Standards Board (“FASB”) issued Accounting Standards Update (“ASU”) No. 2014-09, Revenue from Contracts with Customers, requiring a company to recognize as revenue the amount of consideration it expects to be entitled to in connection with the transfer of promised goods or services to customers. The accounting standard update will replace most of the existing revenue recognition guidance currently promulgated by U.S. GAAP. In July 2015, the FASB decided to delay the effective date of the new revenue standard by one year. The effective date of the new revenue standard for the Company will be January 1, 2018. The Company has commenced the process of adopting the new revenue standard; including forming a project team and compiling an inventory of the sources of revenue the Company expects will be impacted by the adoption of this standard. The Company plans to adopt the standard on its required effective date of January 1, 2018 using the modified retrospective approach. The new revenue standard specifically excludes revenue streams for which specific guidance is stipulated in other sections of the codification, therefore it will not impact rental income or interest income generated on financial instruments such as preferred equity investments. The Company’s escalation income includes certain lease-related executory cost payments (i.e., utilities, common area maintenance), which are considered non-lease components and subject to the new standard on revenue recognition. The Company expects to apply the revenue recognition guidance related to its non-lease components within leases on January 1, 2019, upon its adoption of the lease accounting update. While this revenue stream is subject to the application of the new revenue standard, the Company believes that the pattern and timing of recognition of income will be consistent with the current accounting model.
Financial Instruments - In January 2016, the FASB issued ASU No. 2016-01, Recognition and Measurement of Financial Assets and Financial Liabilities. ASU 2016-01 addresses certain aspects of accounting and disclosure requirements of financial instruments, including the requirement that equity investments with readily determinable fair value be measured at fair value with changes in fair value recognized in results of operations. The new guidance is effective for fiscal years, and interim periods within those years, beginning after December 15, 2017. The Company does not have any equity investments with readily determinable fair value recorded as available-for-sale. The Company does not believe that this guidance will have a material impact on its consolidated financial statements and related disclosures.
Leases - In February 2016, the FASB issued ASU No. 2016-02, Leases, which sets out the principles for the recognition, measurement, presentation, and disclosure of leases for both parties to a contract (i.e., lessees and lessors). The update requires lessees to apply a dual approach, classifying leases as either finance or operating leases based on the principle of whether or not the lease is effectively a financed purchase of the leased asset by the lessee. This classification will determine whether the lease expense is recognized based on an effective interest method or on a straight-line basis over the term of the lease. A lessee is also required to record a right-of-use asset and a lease liability for all leases with a term of greater than 12 months regardless of their classification. Leases with a term of 12 months or less will be accounted for similar to existing guidance for operating leases
20
NORTHSTAR REAL ESTATE INCOME II, INC. AND SUBSIDIARIES
NOTES TO CONSOLIDATED FINANCIAL STATEMENTS (Continued)
(Unaudited)
today. Additionally, the new update will require that lessees and lessors capitalize, as initial direct costs, only those costs that are incurred due to the execution of a lease. Under this guidance, allocated payroll costs and other costs that are incurred regardless of whether the lease is obtained will no longer be capitalized as initial direct costs and instead will be expensed as incurred. The new guidance is to be applied using a modified retrospective approach at the beginning of the earliest comparative period in the financial statements and is effective for fiscal years beginning after December 15, 2018, including interim periods within those fiscal years. The Company is currently assessing the potential effect the adoption of this guidance will have on its consolidated financial statements and related disclosures.
Equity Method of Accounting - In March 2016, the FASB issued ASU No. 2016-07, Investments- Equity Method and Joint Ventures (Topic 323), Simplifying the Transition to the Equity Method of Accounting, which eliminates the requirement for an investor to retroactively apply the equity method when its increase in ownership interest (or degree of influence) in an investee triggers equity method accounting. The update requires that the equity method investor add the cost of acquiring the additional interest in the investee to the current basis of the investor’s previously held interest and adopt the equity method of accounting as of the date the investment becomes qualified for equity method accounting. The update should be applied prospectively upon its effective date to increases in the level of ownership interests or degree of influence that results in the adoption of the equity method. The guidance is effective for fiscal years beginning after December 15, 2016 and interim periods within those fiscal years. The Company adopted the new guidance prospectively on January 1, 2017 and the adoption of this standard did not have a material impact on its consolidated financial statements and related disclosures.
Equity-Based Compensation - In March 2016, the FASB issued ASU No. 2016-09, Improvements to Share-Based Payment Accounting, which amends several aspects of the accounting for equity-based payment transactions, including the income tax consequences, classification of awards as either equity or liabilities and classification on the statements of cash flows. The guidance is effective for interim and annual reporting periods in fiscal years beginning after December 15, 2016. The Company adopted the new guidance prospectively on January 1, 2017 and the adoption of this standard did not have a material impact on its consolidated financial statements and related disclosures.
Credit Losses - In June 2016, the FASB issued ASU No. 2016-13, Financial Instruments- Credit Losses, which changes the impairment model for certain financial instruments by requiring companies to recognize an allowance for expected losses, rather than incurred losses as required currently by the incurred loss approach. The guidance will apply to most financial assets measured at amortized cost and certain other instruments, including trade and other receivables, loans, held-to-maturity debt securities, net investments in leases and off-balance-sheet credit exposures (e.g., loan commitments). The new guidance is effective for reporting periods beginning after December 15, 2019 and will be applied as a cumulative adjustment to retained earnings as of the effective date. The Company is currently assessing the potential effect the adoption of this guidance will have on its consolidated financial statements and related disclosures.
Cash Flow Classifications - In August 2016, the FASB issued ASU No. 2016-15, Statement of Cash Flows: Classification of Certain Cash Receipts and Cash Payments, which makes eight targeted changes to how cash receipts and cash payments are presented and classified in the statement of cash flows. The guidance is effective for fiscal years beginning after December 15, 2017 and interim periods within those fiscal years. If an entity early adopts the amendments in an interim period, any adjustments should be reflected as of the beginning of the fiscal year that includes that interim period. The new guidance requires adoption on a retrospective basis unless it is impracticable to apply, in which case the company would be required to apply the amendments prospectively as of the earliest date practicable. The Company does not believe that this guidance will have a material impact on its consolidated financial statements and related disclosures.
Restricted Cash - In November 2016, the FASB issued ASU No. 2016-18, Statement of Cash Flows: Restricted Cash, which requires entities to show the changes in the total of cash and cash equivalents and restricted cash and restricted cash equivalents in the statement of cash flows. Entities will no longer present transfers between cash and cash equivalents and restricted cash and restricted cash equivalents in the statement of cash flows. The guidance is effective for reporting periods beginning after December 15, 2017 and will be applied retrospectively to all periods presented. The Company does not believe that this guidance will have a material impact on its consolidated financial statements and related disclosures.
Business Combinations - In January 2017, the FASB issued ASU No. 2017-01, Clarifying the Definition of a Business, which amends the guidance for determining whether a transaction involves the purchase or disposal of a business or an asset. The amendments clarify that when substantially all of the fair value of the gross assets acquired or disposed of is concentrated in a single identifiable asset or a group of similar identifiable assets, the set of transferred assets and activities is not a business. The guidance is effective for fiscal years, and interim periods within those years, beginning after December 15, 2017. The amendments in this update will be applied on a prospective basis. The Company expects that most acquisitions of real estate or in-substance
21
NORTHSTAR REAL ESTATE INCOME II, INC. AND SUBSIDIARIES
NOTES TO CONSOLIDATED FINANCIAL STATEMENTS (Continued)
(Unaudited)
real estate will not meet the revised definition of a business because substantially all of the fair value is concentrated in a single identifiable asset or group of similar identifiable assets (i.e. land, buildings, and related intangible assets). A significant difference between the accounting for an asset acquisition and a business combination is that transaction costs are capitalized for an asset acquisition, rather than expensed for a business combination. The Company plans to adopt the standard on its required effective date of January 1, 2018. The Company does not believe that this guidance will have a material impact on its consolidated financial statements and related disclosures.
Derecognition and Partial Sales of Nonfinancial Assets- In February 2017, the FASB issued ASU No. 2017-05, Clarifying the Scope of Asset Derecognition and Accounting for Partial Sales of Nonfinancial Assets, which clarifies the scope and application of recently established guidance on recognition of gains and losses from derecognition of non-financial assets, and defines in-substance non-financial assets. In addition, the guidance clarifies the accounting for partial sales of non-financial assets to be more consistent with the accounting for sale of a business. Specifically, in a partial sale to a non-customer, when a non-controlling interest is received or retained, the latter is considered a non-cash consideration and measured at fair value, which would result in full gain or loss recognized upon sale. This guidance has the same effective date as the new revenue guidance, which is January 1, 2018, with early adoption permitted beginning January 1, 2017. Both the revenue guidance and this update must be adopted concurrently. While the transition method is similar to the new revenue guidance, either full retrospective or modified retrospective, the transition approach need not be aligned between both updates. The Company plans to adopt the standard on its required effective date of January 1, 2018 using the modified retrospective approach. The Company does not believe that this guidance will have a material impact on its consolidated financial statements and related disclosures.
3. | Real Estate Debt Investments |
The following table presents CRE debt investments as of September 30, 2017 (dollars in thousands):
Weighted Average | Floating Rate as % of Principal Amount | ||||||||||||||||||||||||
Asset type: | Count | Principal Amount(1)(2) | Carrying Value(3) | Allocation by Investment Type(4) | Fixed Rate | Spread over LIBOR(5) | Total Unleveraged Current Yield | ||||||||||||||||||
First mortgage loans(5) (6) | 20 | $ | 674,263 | $ | 650,582 | 80.4 | % | — | 5.16 | % | 6.15 | % | 100.0 | % | |||||||||||
Subordinate interests(5) | 3 | 164,877 | 158,827 | 19.6 | % | 12.81 | % | 12.75 | % | 13.02 | % | 17.4 | % | ||||||||||||
Total/ Weighted average | 23 | $ | 839,140 | $ | 809,409 | 100.0 | % | 12.81 | % | 5.44 | % | 7.50 | % | 83.8 | % | ||||||||||
_______________________________________
(1) | Includes future funding commitments of $24.2 million for first mortgage loans and $6.9 million for subordinate interests. |
(2) | During the nine months ended September 30, 2017, the Company originated five first mortgage loans with an aggregate committed principal balance of $178.6 million, including future funding commitments. During the nine months ended September 30, 2017, the Company received repayments on four first mortgage loans, one mezzanine loan, and one subordinate interest with aggregate committed principal balances of $124.7 million, $20.5 million, and $24.9 million, respectively. |
(3) | Certain CRE debt investments serve as collateral for financing transactions, including carrying value of $479.8 million for Term Loan Facilities, as defined in Note 7, “Borrowings,” and other notes payable as well as $170.8 million for a securitization financing transaction executed in November 2016, Securitization 2016-1, as defined in Note 7. The remainder is unleveraged. |
(4) | Based on principal amount. |
(5) | Includes a fixed minimum LIBOR rate (“LIBOR floor”), as applicable. As of September 30, 2017, the Company had $497.7 million principal amount of floating-rate loans subject to a LIBOR floor with the weighted average LIBOR floor of 0.40%. |
(6) | Excludes three senior participation interests in first mortgage loans, which are recorded as “Loan collateral receivable, related party” on the Company’s consolidated balance sheets, totaling $28.3 million, including future funding commitments of $4.6 million. Refer to Note 7, “Borrowings,” for additional information. |
The following table presents CRE debt investments as of December 31, 2016 (dollars in thousands):
Weighted Average | Floating Rate as % of Principal Amount | ||||||||||||||||||||||||
Asset type: | Count | Principal Amount(1) | Carrying Value(2) | Allocation by Investment Type(3) | Fixed Rate | Spread over LIBOR(4) | Total Unleveraged Current Yield | ||||||||||||||||||
First mortgage loans | 19 | $ | 620,389 | $ | 604,510 | 74.7 | % | — | 5.26 | % | 5.74 | % | 100.0 | % | |||||||||||
Mezzanine loan | 1 | 20,528 | 20,631 | 2.5 | % | 14.00 | % | — | 14.00 | % | — | ||||||||||||||
Subordinate interests | 4 | 189,740 | 181,344 | 22.8 | % | 12.69 | % | 12.75 | % | 12.81 | % | 15.1 | % | ||||||||||||
Total/Weighted average | 24 | $ | 830,657 | $ | 806,485 | 100.0 | % | 12.84 | % | 5.53 | % | 7.54 | % | 78.1 | % | ||||||||||
_______________________________________
22
NORTHSTAR REAL ESTATE INCOME II, INC. AND SUBSIDIARIES
NOTES TO CONSOLIDATED FINANCIAL STATEMENTS (Continued)
(Unaudited)
(1) | Includes future funding commitments of $15.9 million for first mortgage loans and $9.3 million for subordinate interests. |
(2) | Certain CRE debt investments serve as collateral for financing transactions, including carrying value of $359.3 million for Term Loan Facilities, as defined in Note 7, “Borrowings,” and other notes payable and $245.2 million for a securitization financing transaction executed in November 2016, Securitization 2016-1, as defined in Note 7. The remainder is unleveraged. |
(3) | Based on principal amount. |
(4) | Includes a fixed minimum LIBOR floor, as applicable. As of December 31, 2016, the Company had $493.9 million principal amount of floating-rate loans subject to a LIBOR floor with the weighted average LIBOR floor of 0.29%. |
The following table presents maturities of CRE debt investments based on principal amount, which includes future funding commitments, as of September 30, 2017 (dollars in thousands):
Current Maturity | Maturity Including Extensions(1) | ||||||
October 1 to December 31, 2017 | $ | — | $ | — | |||
Years Ending December 31: | |||||||
2018 | 377,267 | — | |||||
2019 | 291,637 | 160,917 | |||||
2020 | 71,850 | 272,200 | |||||
2021 | — | 179,063 | |||||
Thereafter | 98,386 | 226,960 | |||||
Total | $ | 839,140 | $ | 839,140 | |||
_______________________________________
(1) | Assumes that all debt with extension options will qualify for extension at such maturity according to the conditions set forth in the governing documents. |
As of September 30, 2017, the weighted average maturity, including extensions, of CRE debt investments was 3.9 years.
Credit Quality Monitoring
CRE debt investments are typically loans secured by direct senior priority liens on real estate properties or by interests in entities that directly own real estate properties, which serve as the primary source of cash for the payment of principal and interest. The Company evaluates its debt investments at least quarterly and differentiates the relative credit quality principally based on: (i) whether the borrower is currently paying contractual debt service in accordance with its contractual terms; and (ii) whether the Company believes the borrower will be able to perform under its contractual terms in the future, as well as the Company’s expectations as to the ultimate recovery of principal at maturity. The Company categorizes a debt investment for which it expects to receive full payment of contractual principal and interest payments as “performing.” The Company will categorize a weaker credit quality debt investment that is currently performing, but for which it believes future collection of all or some portion of principal and interest is in doubt, into a category called “performing with a loan loss reserve.” The Company will categorize a weaker credit quality debt investment that is not performing, which the Company defines as a loan in maturity default and/or past due at least 90 days on its contractual debt service payments, as a non-performing loan (“NPL”). The Company’s definition of an NPL may differ from that of other companies that track NPLs.
As of September 30, 2017, all CRE debt investments were performing in accordance with the contractual terms of their governing documents and were categorized as performing loans. There were no real estate debt investments with contractual payments past due as of September 30, 2017 and December 31, 2016. For the nine months ended September 30, 2017, one debt investment contributed more than 10.0% of interest income.
4. | Operating Real Estate |
The following table presents operating real estate, net as of September 30, 2017 and December 31, 2016 (dollars in thousands):
September 30, 2017 (Unaudited) | December 31, 2016 | |||||||
Land and improvements | $ | 93,947 | $ | 93,707 | ||||
Buildings and improvements(1) | 324,080 | 321,420 | ||||||
Subtotal | 418,027 | 415,127 | ||||||
Less: Accumulated depreciation | (23,853 | ) | (15,890 | ) | ||||
Operating real estate, net | $ | 394,174 | $ | 399,237 | ||||
_______________________________________
23
NORTHSTAR REAL ESTATE INCOME II, INC. AND SUBSIDIARIES
NOTES TO CONSOLIDATED FINANCIAL STATEMENTS (Continued)
(Unaudited)
(1) | Includes tenant improvements as well as furniture, fixtures, and equipment. |
For the nine months ended September 30, 2017, the Company had one single property with rental and other income equal to or greater than 10.0% of total revenue.
5. | Investments in Unconsolidated Ventures |
Investments in Private Equity Funds
The following is a description of investments in private equity funds that own PE Investments either through unconsolidated ventures or direct investments which are recorded as investments in unconsolidated ventures on the consolidated balance sheets. The Company elected the fair value option for PE Investments, which include both cost method and equity method investments. As a result, the Company records equity in earnings (losses) based on the change in fair value for its share of the projected future cash flow from one period to another. All PE Investments are considered VIEs. Refer to Note 2, “Summary of Significant Accounting Policies,” for additional information.
The following table summarizes the Company’s PE Investment acquisitions (dollars in thousands):
PE Investment | Initial Closing Date | NAV Reference Date(1) | Number of Funds(2) | Purchase Price | ||||||
PE Investment I | March 20, 2015 | September 30, 2014 | 6 | $ | 45,045 | |||||
PE Investment II | August 4, 2015 | December 31, 2014 | 3 | 27,788 | ||||||
PE Investment III(3) | September 20, 2016 | March 31, 2016 | 41 | 317,587 | ||||||
Total | 50 | $ | 390,420 | |||||||
(1) | Represents the net asset value (“NAV”) date that served as the basis for the purchase price on which the Company agreed to acquire the PE Investment. |
(2) | Represents number of underlying fund investments at initial closing date. |
(3) | At the time of closing in September 2016, the Company paid $33.9 million to acquire PE Investment III and paid an additional $204.7 million in December 2016. In addition, the Company assumed $44.7 million of deferred purchase price obligations to third parties from the seller, which includes the proportionate share of an obligation owed through a joint investment within PE Investment III, totaling $5.6 million. As of September 30, 2017, $37.5 million in deferred purchase price obligations have been paid and $3.2 million remain outstanding, which includes the Company’s proportionate share of an obligation owed through an unconsolidated joint investment. Refer to Note 8, “Related Party Arrangements,” for additional information. |
The following tables present PE Investments as of September 30, 2017 and December 31, 2016 and activity for the three and nine months ended September 30, 2017 and 2016 (dollars in thousands):
Carrying Value(1) | Three Months Ended September 30, 2017 | Three Months Ended September 30, 2016 | ||||||||||||||||||||||||||||||
PE Investment | September 30, 2017 (Unaudited) | December 31, 2016 | Equity in Earnings | Distributions | Contributions(2) | Equity in Earnings | Distributions | Contributions(2) | ||||||||||||||||||||||||
PE Investment I | $ | 25,633 | $ | 26,949 | $ | 565 | $ | 1,301 | $ | 40 | $ | 823 | $ | 2,332 | $ | 127 | ||||||||||||||||
PE Investment II | 7,593 | 11,964 | 694 | 4,650 | — | 1,024 | 3,380 | 13,894 | ||||||||||||||||||||||||
PE Investment III | 214,700 | 260,768 | 4,828 | 21,196 | 17,251 | 591 | 37,787 | 83,275 | ||||||||||||||||||||||||
Total | $ | 247,926 | $ | 299,681 | $ | 6,087 | $ | 27,147 | $ | 17,291 | $ | 2,438 | $ | 43,499 | $ | 97,296 | ||||||||||||||||
_______________________________________
(1) | Includes a cumulative unrealized loss of $3.4 million and an unrealized gain of $3.1 million for PE Investment I and II, respectively, as of September 30, 2017. Includes a cumulative unrealized loss of $2.2 million and an unrealized gain of $2.5 million for PE Investment I and II, respectively, as of December 31, 2016. |
(2) | Includes initial investments, before closing statement adjustments for distributions and contributions, and subsequent contributions, including deferred purchase price fundings. |
Nine Months Ended September 30, 2017 | Nine Months Ended September 30, 2016 | |||||||||||||||||||||||
PE Investment | Equity in Earnings | Distributions | Contributions(1) | Equity in Earnings | Distributions | Contributions(1) | ||||||||||||||||||
PE Investment I | $ | 2,110 | $ | 2,233 | $ | 40 | $ | 2,835 | $ | 13,380 | $ | 165 | ||||||||||||
PE Investment II | 1,248 | 6,249 | — | 1,567 | 7,398 | 13,894 | ||||||||||||||||||
PE Investment III | 20,675 | 69,549 | 19,039 | 591 | 37,787 | 83,275 | ||||||||||||||||||
Total | $ | 24,033 | $ | 78,031 | $ | 19,079 | $ | 4,993 | $ | 58,565 | $ | 97,334 | ||||||||||||
_______________________________________
(1) | Includes initial investments, before closing statement adjustments for distributions and contributions, and subsequent contributions, including deferred purchase price fundings. |
24
NORTHSTAR REAL ESTATE INCOME II, INC. AND SUBSIDIARIES
NOTES TO CONSOLIDATED FINANCIAL STATEMENTS (Continued)
(Unaudited)
Other
In July 2017, the Company entered into a joint venture with an affiliate of the Sponsor to invest $60.0 million, on a pari passu basis, in a $180.0 million mezzanine loan which was originated by such affiliate of the Sponsor. Pursuant to the joint venture, the Company and the affiliate of the Sponsor have equal decision making rights with respect to the venture. The transaction was approved by the Company’s board of directors, including all of its independent directors.
As of September 30, 2017, the Company has $17.4 million in unfunded commitments remaining out of its total $60.0 million commitment. For the three months ended September 30, 2017, the Company recognized equity in earnings of $1.2 million. As of September 30, 2017, the carrying value of the investment was $43.7 million. Refer to Note 8, “Related Party Arrangements,” for additional information.
6. | Real Estate Securities, Available for Sale |
CRE securities are comprised of CMBS backed by a pool of CRE loans which are typically well-diversified by type and geography. The following table presents CMBS investments as of September 30, 2017 and December 31, 2016 (dollars in thousands):
Cumulative Unrealized on Investments | Weighted Average | ||||||||||||||||||||||||||
Principal Amount(1) | Amortized Cost | Fair Value | Unleveraged Current Yield | ||||||||||||||||||||||||
As of Date: | Count | Gain | (Loss) | Coupon | |||||||||||||||||||||||
September 30, 2017 (Unaudited)(1)(2) | 14 | $ | 130,191 | $ | 90,639 | $ | 4,427 | $ | (26 | ) | $ | 95,039 | 3.42 | % | 9.73 | % | |||||||||||
December 31, 2016(2) | 11 | 128,181 | 85,773 | 2,042 | (878 | ) | 86,937 | 3.42 | % | 9.73 | % | ||||||||||||||||
_______________________________________
(1) | As of September 30, 2017, certain CRE securities serve as collateral for financing transactions including carrying value of $62.0 million for the CMBS Credit Facilities, as defined in Note 7, “Borrowings.” The remainder is unleveraged. |
(2) | Includes a CRE security with an underlying loan that was non-performing at acquisition. The CRE security was purchased for $26.9 million, net of a $21.3 million discount. As of September 30, 2017, the non-accretable amount of total cash flows was $5.7 million. |
The Company recorded a net unrealized loss in OCI of $0.5 million and a net unrealized gain of $3.2 million for the three and nine months ended September 30, 2017, respectively. For the three and nine months ended September 30, 2016, the Company recorded a net unrealized loss in OCI of $3.6 million and $3.5 million, respectively.
As of September 30, 2017, the Company held two securities with an aggregate carrying value of $6.0 million with a cumulative unrealized loss of $26,000, one of which was in an unrealized loss position for a period of greater than 12 months. Based on management’s quarterly evaluation, no OTTI was identified related to these securities. The Company does not intend to sell these securities and it is more likely than not that the Company will not be required to sell these securities prior to recovery of its amortized cost basis, which may be at maturity.
As of September 30, 2017, the weighted average contractual maturity of CRE securities was 30.0 years with an expected maturity of 6.6 years.
25
NORTHSTAR REAL ESTATE INCOME II, INC. AND SUBSIDIARIES
NOTES TO CONSOLIDATED FINANCIAL STATEMENTS (Continued)
(Unaudited)
7. | Borrowings |
The following table presents borrowings as of September 30, 2017 and December 31, 2016 (dollars in thousands):
September 30, 2017 (Unaudited) | December 31, 2016 | ||||||||||||||||||||||||
Capacity | Recourse vs. Non-Recourse | Final Maturity | Contractual Interest Rate | Principal Amount(1) | Carrying Value(1) | Principal Amount(1) | Carrying Value(1) | ||||||||||||||||||
Securitization bonds payable, net | |||||||||||||||||||||||||
Securitization 2016-1 | Non-recourse | (2) | Sep-31 | LIBOR + 2.38% | $ | 117,075 | $ | 115,592 | $ | 193,980 | $ | 191,315 | |||||||||||||
Mortgage and other notes payable, net | |||||||||||||||||||||||||
Industrial | Non-recourse | (2) | Jul-25 | 4.31% | 250,000 | 249,284 | 250,000 | 249,215 | |||||||||||||||||
Multi-tenant office | Non-recourse | (2) | Aug-20 | (3) | LIBOR + 1.90% | 95,177 | 94,785 | 88,170 | 87,426 | ||||||||||||||||
Other notes payable(4) | Limited Recourse | (4) | Dec-20 | (5) | LIBOR + 2.65% | 40,029 | 39,825 | 39,868 | 39,540 | ||||||||||||||||
Subtotal mortgage and other notes payable, net | 385,206 | 383,894 | 378,038 | 376,181 | |||||||||||||||||||||
Term loan facilities | |||||||||||||||||||||||||
Citibank facility | $ | 150,000 | Limited Recourse | (6) | Oct-19 | (7) | LIBOR + 2.50% | (8) | 48,750 | 48,750 | 54,750 | 54,750 | |||||||||||||
Deutsche Bank facility | 200,000 | Limited Recourse | (9) | Jul-19 | (10) | LIBOR + 2.42% | (8) | 26,742 | 26,742 | 47,242 | 47,242 | ||||||||||||||
Morgan Stanley facility | 300,000 | Limited Recourse | (4) | (11) | LIBOR + 2.49% | (8) | 222,332 | 222,332 | 101,000 | 101,000 | |||||||||||||||
Subtotal term loan facilities | $ | 650,000 | 297,824 | 297,824 | 202,992 | 202,992 | |||||||||||||||||||
CMBS credit facilities | |||||||||||||||||||||||||
Citibank facility | Recourse | Various | (12) | LIBOR + 1.47% | (8) | 10,630 | 10,630 | 9,887 | 9,887 | ||||||||||||||||
JP Morgan facility | Recourse | Various | (12) | LIBOR + 1.50% | (8) | 34,416 | 34,416 | 28,528 | 28,528 | ||||||||||||||||
Subtotal CMBS credit facilities | 45,046 | 45,046 | 38,415 | 38,415 | |||||||||||||||||||||
Subtotal | 342,870 | 342,870 | 241,407 | 241,407 | |||||||||||||||||||||
Total(13) | $ | 845,151 | $ | 842,356 | $ | 813,425 | $ | 808,903 | |||||||||||||||||
_______________________________________
(1) | Difference between principal amount and carrying value of securitization bonds payable and mortgage and other notes payable is attributable to deferred financing costs, net. |
(2) | Subject to customary non-recourse carveouts. |
(3) | The initial maturity of the mortgage payable is August 2018, with a two-year extension available at the Company’s option, which may be subject to the satisfaction of certain customary conditions set forth in the governing documents. |
(4) | Recourse solely with respect to 25.0% of the financed amount. Relates to financing obtained for a CRE debt investment. |
(5) | The initial maturity of the note payable is December 2018, with two one-year extensions available at the Company’s option, which may be subject to the satisfaction of certain customary conditions set forth in the governing documents. |
(6) | Recourse solely with respect to 25.0% of the financed amount for assets with a lender debt yield equal to or greater than 10.0% at the time of financing plus 100.0% of the financed amount for assets with a lender debt yield less than 10.0% at the time of financing. |
(7) | The initial maturity of the Citibank Facility is October 2018, with a one-year extension available, which may be subject to the satisfaction of certain customary conditions set forth in the governing documents. |
(8) | Represents the weighted average spread as of September 30, 2017. The contractual interest rate depends upon asset type and characteristics and ranges from one-month to three-month LIBOR plus 1.45% to 2.75%. |
(9) | Recourse solely with respect to the greater of: (i) 25.0% of the financed amount of stabilized loans plus the financed amount of transitional loans, as further defined in the governing documents; or (ii) the lesser of $25.0 million or the aggregate financed amount of all loans. |
(10) | The Company has exercised the third of four, one-year extensions available at the Company’s option, respectively. These extensions may be subject to the satisfaction of certain customary conditions set forth in the governing documents. |
(11) | The initial maturity of the Morgan Stanley Facility is June 2019. The Company may, at its option, extend the facility for one-year periods indefinitely, subject to the approval of Morgan Stanley. |
(12) | The maturity dates on the CMBS Credit Facilities are typically three months. |
(13) | Secured by collateral comprised of certain CRE debt, securities, equity investments and loan collateral receivable with a carrying value of $1.1 billion as of September 30, 2017. |
26
NORTHSTAR REAL ESTATE INCOME II, INC. AND SUBSIDIARIES
NOTES TO CONSOLIDATED FINANCIAL STATEMENTS (Continued)
(Unaudited)
The following table presents scheduled principal on borrowings, based on final maturity as of September 30, 2017 (dollars in thousands):
Total | Securitization Bonds Payable | Mortgage and Other Notes Payable | Credit Facilities | |||||||||||||
October 1 to December 31, 2017 | $ | 45,046 | $ | — | $ | — | $ | 45,046 | (1) | |||||||
Years Ending December 31: | ||||||||||||||||
2018 | — | — | — | — | ||||||||||||
2019 | 75,492 | — | — | 75,492 | ||||||||||||
2020 | 357,538 | — | 135,206 | 222,332 | ||||||||||||
2021 | — | — | — | — | ||||||||||||
Thereafter | 367,075 | 117,075 | 250,000 | — | ||||||||||||
Total | $ | 845,151 | $ | 117,075 | $ | 385,206 | $ | 342,870 | ||||||||
_______________________________________
(1) | Represents CMBS Credit Facilities borrowings, which have maturities typically ranging and renewing on a continuous three month basis. |
Securitization Financing Transactions
In November 2016, the Company entered into a $284.2 million securitization financing transaction (“Securitization 2016-1”). Securitization 2016-1 was collateralized by a pool of 10 CRE debt investments with a committed aggregate principal balance of $254.7 million primarily originated by the Company and three senior participations with a committed aggregate principal balance of $29.5 million originated by NorthStar Income, a company managed by an affiliate of the Sponsor. A total of $194.0 million of permanent, non-recourse, non-mark-to-market investment-grade securitization bonds were issued, representing an advance rate of 68.3%.
An affiliate of NorthStar Income retained $14.9 million of junior participations in the collateral it contributed. As a result of U.S. GAAP requirements for transfers of financial assets, the senior participations are recorded as loan collateral receivable, related party, on the Company’s consolidated balance sheets. Refer to Note 2, “Summary of Significant Accounting Policies” for additional information.
Securitization 2016-1 is considered a voting interest entity as the Company has all of the controlling financial interest in the entity and as such, is consolidated by the Company. An affiliate of the Sponsor was appointed special servicer of Securitization 2016-1.
In the event of breaches of certain representations and warranties or a defect in the document of any of the contributed assets to Securitization 2016-1 provided at the time the Company entered into Securitization 2016-1 and contributed the loans that serve as collateral for Securitization 2016-1, the Company may be required to repurchase certain of those loans or replace the affected contributed asset or make a loss of value payment. These obligations do not relate to the credit performance of the loans contributed to Securitization 2016-1, but only to breaches of specific representations and warranties or a defect in the document of any of the contributed assets to Securitization 2016-1. Since inception, the Company has not been required to make any repurchases or replace the affected contributed asset or make a loss of value payment nor has the Company received any notice of assertion of a potential breach of representation and warranty or a defect in the document of any of the contributed assets to Securitization 2016-1. Any payment to repurchase a loan or replace the affected contributed asset or make a loss of value payment would impact the Company’s liquidity. Dependent upon the size of any such payment, the impact to liquidity could be material.
During the three months ended September 30, 2017, the proceeds from two CRE debt investment repayments totaling $75.7 million were used to paydown the principal balance of Securitization 2016-1.
In October 2017, following the repayment of a CRE debt investment, the principal amount of securitization bonds payable, net was $80.8 million.
27
NORTHSTAR REAL ESTATE INCOME II, INC. AND SUBSIDIARIES
NOTES TO CONSOLIDATED FINANCIAL STATEMENTS (Continued)
(Unaudited)
Term Loan Facilities
The Company, through subsidiaries, has entered into credit facility agreements with multiple global financial institutions to provide an aggregate principal amount of up to $650.0 million to finance the origination of first mortgage loans and senior loan participations secured by CRE (“Term Loan Facilities”). The Company agreed to guarantee certain obligations under the Term Loan Facilities, which contain representations, warranties, covenants, conditions precedent to funding, events of default and indemnities that are customary for agreements of this type. The Term Loan Facilities act as revolving loan facilities that can be paid down as assets are repaid or sold and re-drawn upon for new investments. As of September 30, 2017, the Company was in compliance with all of its financial covenants under the Term Loan Facilities.
As of September 30, 2017, the Company had $479.8 million carrying value of CRE debt investments financed with $297.8 million under the Term Loan Facilities.
CMBS Credit Facilities
In October 2015, January 2016, and April 2016, the Company entered into master repurchase agreements (“Merrill Lynch Facility,” “Citibank Facility,” and “JP Morgan Facility,” respectively, and collectively the “CMBS Credit Facilities”) to finance CMBS investments. The CMBS Credit Facilities are on a recourse basis and contain representations, warranties, covenants, conditions precedent to funding, events of default and indemnities that are customary for agreements of this type.
As of September 30, 2017, the Company had $62.0 million carrying value of CRE securities financed with $45.0 million under its CMBS Credit Facilities. As of September 30, 2017, the Company has not utilized the Merrill Lynch Facility.
8. | Related Party Arrangements |
Advisor
Subject to certain restrictions and limitations, the Advisor is responsible for managing the Company’s affairs on a day-to-day basis and for identifying, originating, acquiring and asset managing investments on behalf of the Company. The Advisor may delegate certain of its obligations to affiliated entities, which may be organized under the laws of the United States or foreign jurisdictions. References to the Advisor include the Advisor and any such affiliated entities. For such services, to the extent permitted by law and regulations, the Advisor receives fees and reimbursement from the Company. Pursuant to the advisory agreement, the Advisor may defer or waive fees in its discretion. Below is a description and table of the fees and reimbursements incurred to the Advisor.
In June 2017, the advisory agreement was renewed for an additional one-year term commencing on June 30, 2017, with terms identical to those in effect through June 30, 2017.
Fees to Advisor
Asset Management Fee
The Advisor receives a monthly asset management fee equal to one-twelfth of 1.25% of the sum of the amount funded or allocated for CRE investments, including expenses and any financing attributable to such investments, less any principal received on debt and securities investments (or the proportionate share thereof in the case of an investment made through a joint venture).
Incentive Fee
The Advisor is entitled to receive distributions equal to 15.0% of net cash flows of the Company, whether from continuing operations, repayment of loans, disposition of assets or otherwise, but only after stockholders have received, in the aggregate, cumulative distributions equal to their invested capital plus a 7.0% cumulative, non-compounded annual pre-tax return on such invested capital.
Acquisition Fee
The Advisor also receives fees for providing structuring, diligence, underwriting advice and related services in connection with real estate acquisitions equal to 1.0% of the amount funded or allocated by the Company to originate or acquire investments, including acquisition costs and any financing attributable to such investments (or the proportionate share thereof in the case of an investment made through a joint venture). A fee paid to the Advisor in connection with or related to the origination or acquisition of CRE debt investments is included in CRE debt investments, net on the consolidated balance sheets and is amortized to interest income over the life of the investment using the effective interest method. An acquisition fee incurred related to an equity investment will generally be expensed as incurred. A fee paid to the Advisor in connection with an acquisition of an equity or debt investment in an unconsolidated joint venture is included in investments in unconsolidated ventures on the consolidated balance sheets.
28
NORTHSTAR REAL ESTATE INCOME II, INC. AND SUBSIDIARIES
NOTES TO CONSOLIDATED FINANCIAL STATEMENTS (Continued)
(Unaudited)
Disposition Fee
For substantial assistance in connection with the sale of investments and based on the services provided, as determined by the Company’s independent directors, the Advisor receives a disposition fee up to 1.0% of the contract sales price of each CRE investment sold. The Company does not pay a disposition fee upon the maturity, prepayment, workout, modification or extension of a CRE debt investment unless there is a corresponding fee paid by the borrower, in which case the disposition fee is the lesser of: (i) 1.0% of the principal amount of the CRE debt investment prior to such transaction; or (ii) the amount of the fee paid by the borrower in connection with such transaction. If the Company takes ownership of a property as a result of a workout or foreclosure of a CRE debt investment, the Company will pay a disposition fee upon the sale of such property. A disposition fee from the sale of a CRE investment is generally expensed and included in asset management and other fees - related party in the Company’s consolidated statements of operations. A disposition fee for a CRE debt investment incurred in a transaction other than a sale is included in CRE debt investments, net on the consolidated balance sheets and is amortized to interest income over the life of the investment using the effective interest method.
Reimbursements to Advisor
Operating Costs
The Advisor is entitled to receive reimbursement for direct and indirect operating costs incurred by the Advisor in connection with administrative services provided to the Company. The Advisor allocates, in good faith, indirect costs to the Company related to the Advisor’s and its affiliates’ employees, occupancy and other general and administrative costs and expenses in accordance with the terms of, and subject to the limitations contained in, the advisory agreement with the Advisor. The indirect costs include the Company’s allocable share of the Advisor’s compensation and benefit costs associated with dedicated or partially dedicated personnel who spend all or a portion of their time managing the Company’s affairs, based upon the percentage of time devoted by such personnel to the Company’s affairs. The indirect costs also include rental and occupancy, technology, office supplies, travel and entertainment and other general and administrative costs and expenses. However, there is no reimbursement for personnel costs related to executive officers (although there may be reimbursement for certain executive officers of the Advisor) and other personnel involved in activities for which the Advisor receives an acquisition fee or a disposition fee. The Advisor allocates these costs to the Company relative to its and its affiliates’ other managed companies in good faith and has reviewed the allocation with the Company’s board of directors, including its independent directors. The Advisor will update the board of directors on a quarterly basis of any material changes to the expense allocation and will provide a detailed review to the board of directors, at least annually, and as otherwise requested by the board of directors. The Company reimburses the Advisor quarterly for operating costs (including the asset management fee) based on a calculation for the four preceding fiscal quarters not to exceed the greater of: (i) 2.0% of its average invested assets; or (ii) 25.0% of its net income determined without reduction for any additions to reserves for depreciation, loan losses or other similar non-cash reserves and excluding any gain from the sale of assets for that period. Notwithstanding the above, the Company may reimburse the Advisor for expenses in excess of this limitation if a majority of the Company’s independent directors determines that such excess expenses are justified based on unusual and non-recurring factors. The Company calculates the expense reimbursement quarterly based upon the trailing twelve-month period.
Organization and Offering Costs
The Advisor was entitled to receive reimbursement for organization and offering costs paid on behalf of the Company in connection with the Offering. The Company was obligated to reimburse the Advisor for organization and offering costs to the extent the aggregate of selling commissions, dealer manager fees, distribution fees and other organization and offering costs did not exceed 15.0% of gross proceeds from the Offering. The Advisor initially expected cumulative organization and offering costs, excluding selling commissions and dealer manager fees, would not exceed $15.0 million, or 1.0% of the total proceeds available to be raised from the Primary Offering. The Company incurred reimbursable organization and offering costs, excluding selling commissions and dealer manager fees, of $13.0 million, or 1.2% of the gross proceeds of $1.1 billion from the Primary Offering. The Company’s independent directors did not determine that any of the organization and offering costs were unfair or commercially unreasonable.
Dealer Manager
Selling Commissions, Dealer Manager Fees, and Distribution Fees
As a result of the Primary Offering closing, effective November 9, 2016, the Company no longer pays the Dealer Manager selling commissions and dealer manager fees under a dealer manager agreement.
Pursuant to a dealer manager agreement, the Company pays the Dealer Manager an ongoing distribution fee of up to 1.0% annually of gross proceeds from the sale of Class T shares sold in the Primary Offering, all of which is available to be reallowed to participating
29
NORTHSTAR REAL ESTATE INCOME II, INC. AND SUBSIDIARIES
NOTES TO CONSOLIDATED FINANCIAL STATEMENTS (Continued)
(Unaudited)
broker-dealers. The Dealer Manager will cease receiving distribution fees with respect to each Class T share upon the earliest to occur of the following: (i) a listing of the Company’s shares of common stock on a national securities exchange; (ii) such Class T share is no longer outstanding; (iii) the Dealer Manager’s determination that total underwriting compensation, with respect to all Class A shares and Class T shares would be in excess of 10.0% of the gross proceeds of the Primary Offering; or (iv) the end of the month in which total underwriting compensation, with respect to the Class T shares held by a stockholder within his or her particular account, would be in excess of 10.0% of the stockholder’s total gross investment amount at the time of purchase of the primary Class T shares held in such account.
During the nine months ended September 30, 2017, the Company recorded a present value adjustment to the estimated liability of distribution fees totaling $0.2 million. As of September 30, 2017, the estimated liability for the present value of the expected future distribution fees payable to the Dealer Manager, which is included in due to related party on the Company’s consolidated balance sheets, with an offset to additional paid-in capital, was $4.1 million. The Company began issuing Class T shares in October 2015 and during the second quarter of 2016, commenced recording the estimated liability for future distribution fees payable related to all outstanding Class T shares. As of December 31, 2016, the estimated liability was $5.0 million.
No selling commissions, dealer manager fees, or distribution fees are paid for sales pursuant to the DRP or for shares that were sold pursuant to the Company’s distribution support agreement (“Distribution Support Agreement”).
Summary of Fees and Reimbursements
The following table presents the fees and reimbursements incurred and paid to the Advisor and the Dealer Manager for the nine months ended September 30, 2017 and the amounts due to related party as of September 30, 2017 and December 31, 2016 (dollars in thousands):
Due to Related Party as of December 31, 2016 | Nine Months Ended September 30, 2017 | Due to Related Party as of September 30, 2017 (Unaudited) | ||||||||||||||||
Type of Fee or Reimbursement | Financial Statement Location | Incurred | Paid | |||||||||||||||
Fees to Advisor Entities | ||||||||||||||||||
Asset management | Asset management and other fees-related party | $ | 17 | $ | 16,164 | $ | (14,381 | ) | $ | 1,800 | ||||||||
Acquisition(1) | Real estate debt investments, net / Investments in unconsolidated ventures / Asset management and other fees-related party | — | 2,386 | (2,386 | ) | — | ||||||||||||
Disposition(1) | Real estate debt investments, net / Asset management and other fees-related party | 85 | 1,674 | (1,759 | ) | — | ||||||||||||
Reimbursements to Advisor Entities | ||||||||||||||||||
Operating costs(2) | General and administrative expenses | 11 | 9,326 | (6,152 | ) | 3,185 | ||||||||||||
Offering | Cost of capital(3) | 272 | — | (272 | ) | — | ||||||||||||
Distribution Fees | Cost of capital(3) | 4,962 | 228 | (1,131 | ) | 4,059 | ||||||||||||
Total | $ | 5,347 | $ | 29,778 | $ | (26,081 | ) | $ | 9,044 | |||||||||
_______________________________________
(1) | Acquisition/disposition fees incurred to the Advisor related to CRE debt investments are generally offset by origination/exit fees paid to the Company by borrowers if such fees are required from the borrower. Acquisition fees related to equity investments are included in asset management and other fees - related party in the consolidated statements of operations. From inception through September 30, 2017, the Advisor waived $3.7 million of acquisition fees related to CRE securities and PE Investments. |
(2) | As of September 30, 2017, the Advisor has incurred unreimbursed operating costs on behalf of the Company of $13.8 million, that remain eligible to allocate to the Company. Pursuant to the Combination Agreement, immediately prior to the closing of the Combination, CLNC will, if necessary, declare a special distribution to an affiliate of the Sponsor in an amount that is intended to true up such affiliate for, among other things, the expected present value of the unreimbursed operating costs incurred by the Advisor on the Company’s behalf. |
(3) | Cost of capital is included in net proceeds from issuance of common stock in the Company’s consolidated statements of equity. |
Investment Activity
In September 2016, the Company completed the acquisition of a diversified portfolio of limited partnership or similar equity interests in real estate private equity funds, from NorthStar Realty (“PE Investment III”). At acquisition, PE Investment III was comprised of interests in 41 funds managed by 20 institutional-quality sponsors and had an aggregate reported NAV of approximately $344.3 million as of March 31, 2016 (the “Record Date”). The funds hold interests in assets that are diversified geographically across 24 states and internationally and diversified by investment type, including mixed-use, multifamily, office and hotel properties.
30
NORTHSTAR REAL ESTATE INCOME II, INC. AND SUBSIDIARIES
NOTES TO CONSOLIDATED FINANCIAL STATEMENTS (Continued)
(Unaudited)
The Company acquired PE Investment III at a price equal to 92.25% of the NAV as of the Record Date with $33.9 million paid at the closing (reflecting $34.3 million of net distributions due to the Company as of the closing date) and $204.7 million paid in December 2016. In addition, the Company assumed approximately $44.7 million of deferred purchase price obligations to third parties from whom NorthStar Realty had originally acquired certain of the fund interests within PE Investment III, which includes the proportionate share of an obligation owed through a joint investment within PE Investment III, totaling $5.6 million. As of September 30, 2017, $37.5 million in deferred purchase price obligations have been paid. The Company also agreed to indemnify NorthStar Realty in connection with NorthStar Realty’s continuing guarantee of the payment of such deferred obligations. The transaction was approved by the Company’s board of directors, including all of its independent directors, and supported by an independent third-party valuation of PE Investment III.
In September 2016, the Company originated a $98.4 million subordinate interest in an industrial portfolio (the “Industrial Portfolio”), sponsored and owned by an unaffiliated third party. In connection with the transaction, the third-party sponsor redeemed an interest in an industrial portfolio historically held by NorthStar Realty.
In November 2016, the Company entered into a $284.2 million securitization financing transaction. Securitization 2016-1 was collateralized by a pool of 10 CRE debt investments with a committed aggregate principal balance of $254.7 million primarily originated by the Company and three senior participations with a committed aggregate principal balance of $29.5 million originated by NorthStar Income, a company managed by an affiliate of the Sponsor. An affiliate of the Sponsor was appointed special servicer of Securitization 2016-1. The transaction was approved by the Company’s board of directors, including all of its independent directors.
In July 2017, the Company entered into a joint venture with an affiliate of the Sponsor to make a $60.0 million investment in a $180.0 million mezzanine loan which was originated by such affiliate of the Sponsor. The Company’s interest in the joint venture is 50.0% and its interest in the underlying mezzanine loan is 33.3%. The Company’s total commitment is $60.0 million. The transaction was approved by the Company’s board of directors, including all of its independent directors. Refer to Note 5, “Investments in Unconsolidated Ventures,” for additional information.
9. | Equity-Based Compensation |
The Company adopted a long-term incentive plan, as amended (the “Plan”), which it may use to attract and retain qualified officers, directors, employees and consultants, as well as an independent directors compensation plan, which is a component of the Plan. Pursuant to the Plan, as of September 30, 2017, the Company’s independent and non-management directors were granted a total of 81,385 Class A shares of restricted common stock for an aggregate $0.8 million, based on the share price on the date of each grant. Unvested shares totaled 31,014 and 21,651 as of September 30, 2017 and December 31, 2016, respectively. The restricted stock granted prior to 2015 generally vests quarterly over four years and the restricted stock granted in and subsequent to 2015 generally vests quarterly over two years. However, the stock will become fully vested on the earlier occurrence of: (i) the termination of the independent or non-management director’s service as a director due to his or her death or disability; or (ii) a change in control of the Company. If the Combination is consummated, all unvested shares of restricted common stock will automatically vest. A maximum of 2,000,000 shares of restricted common stock may be granted, of which 1,918,615 remain available for future grants as of September 30, 2017.
The Company recognized equity-based compensation expense of $62,234 and $50,935 for the three months ended September 30, 2017 and 2016, respectively, and $202,221 and $112,956 for the nine months ended September 30, 2017 and 2016, respectively, related to the issuance of restricted stock to the independent and non-management directors, which was recorded in general and administrative expenses in the consolidated statements of operations.
10. | Stockholders’ Equity |
Common Stock from Primary Offering
The Company’s Primary Offering closed effective November 9, 2016. From inception through the close of the Primary Offering, the Company issued 109.2 million shares of common stock, generating gross proceeds of $1.1 billion.
Distribution Reinvestment Plan
The Company adopted a DRP through which common stockholders may elect to reinvest an amount equal to the distributions declared on their shares in additional shares of the Company’s common stock in lieu of receiving cash distributions. As a result of a reallocation of $150.0 million in unsold shares from the Primary Offering to the DRP, the Company may offer up to $300.0 million in shares pursuant to the DRP.
31
NORTHSTAR REAL ESTATE INCOME II, INC. AND SUBSIDIARIES
NOTES TO CONSOLIDATED FINANCIAL STATEMENTS (Continued)
(Unaudited)
Effective on December 28, 2016, the purchase price for shares in the DRP was $9.26, which is equal to the estimated value per share of the Company’s common stock as of September 30, 2016 (the “Valuation Date”) until such time as the Company establishes a new estimated per share value, at which time the purchase price will adjust to 100.0% of such estimated value per share.
Previously, following the close of the Primary Offering effective November 9, 2016, the purchase price for shares in the DRP was equal to $9.05, which was equal to the estimated value per share of the Company’s common stock as of September 30, 2015. During the Primary Offering from November 16, 2015 to November 9, 2016, the purchase price for shares for shares in the DRP was $9.79 for Class A shares and $9.25 for Class T shares. Until November 16, 2015, the initial purchase price per share in the DRP was $9.50.
No selling commissions or dealer manager fees are paid on shares issued pursuant to the DRP. The board of directors of the Company may amend, suspend or terminate the DRP for any reason upon ten-days’ notice to participants, except that the Company may not amend the DRP to eliminate a participant’s ability to withdraw from the DRP. On August 25, 2017, in connection with the entry into the Combination Agreement, the Company’s board of directors voted to suspend the DRP until further notice. Pursuant to the terms of the DRP, the suspension went into effect prior to the monthly distributions paid on or about October 1, 2017 and as a result, all stockholders will receive only cash distributions through the completion of the Combination unless and until the DRP is reinstated.
For the nine months ended September 30, 2017, the Company issued 2.8 million shares of common stock totaling $26.4 million of gross offering proceeds pursuant to the DRP. For the year ended December 31, 2016, the Company issued 3.3 million shares of common stock totaling $32.1 million of gross offering proceeds pursuant to the DRP. From inception through September 30, 2017, the Company issued 8.6 million shares of common stock totaling $81.7 million of gross offering proceeds pursuant to the DRP.
Distributions
Distributions to stockholders are declared quarterly by the board of directors of the Company and are paid monthly based on a daily amount of $0.001917808 per share of Class A common stock and $0.001917808 per share of Class T common stock less the distribution fees that are payable with respect to such Class T shares, which is equivalent to an annualized distribution amount of $0.70 per share of the Company’s common stock, less the distribution fee on Class T shares. Distributions are generally paid to stockholders on the first business day of the month following the month for which the distribution has accrued.
The following table presents distributions declared for the nine months ended September 30, 2017 (dollars in thousands):
Distributions(1)(2) | |||||||||||
Period | Cash | DRP | Total | ||||||||
January | $ | 3,652 | $ | 2,999 | $ | 6,651 | |||||
February | 3,287 | 2,715 | 6,002 | ||||||||
March | 3,711 | 3,007 | 6,718 | ||||||||
April | 3,546 | 2,858 | 6,404 | ||||||||
May | 3,696 | 2,976 | 6,672 | ||||||||
June | 3,589 | 2,885 | 6,474 | ||||||||
July | 3,739 | 2,965 | 6,704 | ||||||||
August | 3,713 | 2,972 | 6,685 | ||||||||
September | 6,488 | — | 6,488 | ||||||||
Total | $ | 35,421 | $ | 23,377 | $ | 58,798 | |||||
_______________________________________
(1) | Represents distributions declared for the period, even though such distributions are actually paid to stockholders the month following such period. |
(2) | On August 9, 2017, the board of directors of the Company approved a daily cash distribution of $0.001917808 per share of Class A common stock and $0.001917808 per share of Class T common stock less the distribution fees that are payable with respect to such Class T common stock, for each of the three months ended December 31, 2017. |
Share Repurchase Program
The Company adopted a share repurchase program that may enable stockholders to sell their shares to the Company in limited circumstances (the “Share Repurchase Program”). The Company may not repurchase shares unless a stockholder has held shares for one year. However, the Company may repurchase shares held less than one year in connection with a stockholder’s death or
32
NORTHSTAR REAL ESTATE INCOME II, INC. AND SUBSIDIARIES
NOTES TO CONSOLIDATED FINANCIAL STATEMENTS (Continued)
(Unaudited)
qualifying disability. The Company is not obligated to repurchase shares under the Share Repurchase Program. The Company may amend, suspend or terminate the Share Repurchase Program at its discretion at any time, subject to certain notice requirements.
On August 25, 2017, in connection with the entry into the Combination Agreement, the Company’s board of directors voted to suspend the Share Repurchase Program until further notice. The suspension of the Share Repurchase Program was effective as of September 7, 2017 and as a result, pursuant to the terms of the Share Repurchase Program, no further share repurchases will be processed unless and until the Share Repurchase Program is reinstated.
Prior to the suspension of the Share Repurchase Program in connection with the Combination, for the nine months ended September 30, 2017, the Company repurchased 1.7 million shares totaling $16.1 million pursuant to the Share Repurchase Program. For the year ended December 31, 2016, the Company repurchased 1.0 million shares totaling $9.5 million pursuant to the Share Repurchase Program. Prior to its suspension, the Company generally funded repurchase requests received during a quarter with proceeds set aside for that purpose which were not expected to exceed proceeds received from its DRP.
11. | Non-controlling Interests |
Operating Partnership
Non-controlling interests include the aggregate limited partnership interests in the Operating Partnership held by limited partners, other than the Company. Income (loss) attributable to the non-controlling interests is based on the limited partners’ ownership percentage of the Operating Partnership and was de minimis for the three and nine months ended September 30, 2017 and 2016.
Other
Other non-controlling interests represent third-party equity interests in ventures that are consolidated with the Company’s financial statements. Net income (loss) attributable to other non-controlling interests for the three and nine months ended September 30, 2017 was $32,000 and $101,000, respectively. Net income (loss) attributable to other non-controlling interests for the three and nine months ended September 30, 2016 was $33,000 and $77,000, respectively.
12. | Fair Value |
Fair Value Measurement
The fair value of financial instruments is categorized based on the priority of the inputs to the valuation technique and categorized into a three-level fair value hierarchy. The fair value hierarchy gives the highest priority to quoted prices in active markets for identical assets or liabilities (Level 1) and the lowest priority to unobservable inputs (Level 3). If the inputs used to measure the financial instruments fall within different levels of the hierarchy, the categorization is based on the lowest level input that is significant to the fair value measurement of the instrument.
Financial assets and liabilities recorded at fair value on the consolidated balance sheets are categorized based on the inputs to the valuation techniques as follows:
Level 1. | Quoted prices for identical assets or liabilities in an active market. |
Level 2. | Financial assets and liabilities whose values are based on the following: |
a) | Quoted prices for similar assets or liabilities in active markets. |
b) | Quoted prices for identical or similar assets or liabilities in non-active markets. |
c) | Pricing models whose inputs are observable for substantially the full term of the asset or liability. |
d) | Pricing models whose inputs are derived principally from or corroborated by observable market data for substantially the full term of the asset or liability. |
Level 3. | Prices or valuation techniques based on inputs that are both unobservable and significant to the overall fair value measurement. |
Determination of Fair Value
The following is a description of the valuation techniques used to measure fair value of assets accounted for at fair value on a recurring basis and the general classification of these instruments pursuant to the fair value hierarchy.
33
NORTHSTAR REAL ESTATE INCOME II, INC. AND SUBSIDIARIES
NOTES TO CONSOLIDATED FINANCIAL STATEMENTS (Continued)
(Unaudited)
PE Investments
The Company accounts for PE Investments at fair value which is determined based on a valuation model using assumptions for the timing and amount of expected future cash flow for income and realization events for the underlying assets in the funds and discount rate. This fair value measurement is generally based on unobservable inputs and, as such, is classified as Level 3 of the fair value hierarchy. The Company is not using the NAV (practical expedient) of the underlying funds for purposes of determining fair value.
Real Estate Securities
CRE securities are generally valued using a third-party pricing service or broker quotations. These quotations are not adjusted and are based on observable inputs that can be validated, and as such, are classified as Level 2 of the fair value hierarchy. Certain CRE securities may be valued based on a single broker quote or an internal price which may have less observable pricing, and as such, would be classified as Level 3 of the fair value hierarchy. Management determines the prices are representative of fair value through a review of available data, including observable inputs, recent transactions as well as its knowledge of and experience in the market.
Derivative Instruments
Derivative instruments include listed derivatives with quoted prices in active markets for identical financial instruments as of the reporting date. The Company does not adjust the quoted price for these instruments, and as such, classifies derivative instruments as Level 1 of the fair value hierarchy. The derivative assets are recorded within deferred costs and other assets, net on the Company’s consolidated balance sheets. The derivative liabilities are recorded within other liabilities on the Company’s consolidated balance sheets.
Fair Value Hierarchy
Financial assets recorded at fair value on a recurring basis are classified in their entirety based on the lowest level of input that is significant to the fair value measurement. The following table presents financial assets that were accounted for at fair value on a recurring basis as of September 30, 2017 and December 31, 2016 by level within the fair value hierarchy (dollars in thousands):
September 30, 2017 (Unaudited) | December 31, 2016 | ||||||||||||||||||||||||||||||
Level 1 | Level 2 | Level 3 | Total | Level 1 | Level 2 | Level 3 | Total | ||||||||||||||||||||||||
Assets: | |||||||||||||||||||||||||||||||
PE Investments, at fair value(1) | $ | — | $ | — | $ | 247,926 | $ | 247,926 | $ | — | $ | — | $ | 299,681 | $ | 299,681 | |||||||||||||||
Real estate securities, available for sale | — | 95,039 | — | 95,039 | — | 86,937 | — | 86,937 | |||||||||||||||||||||||
Derivative assets(2) | 388 | — | — | 388 | — | — | — | — | |||||||||||||||||||||||
Liabilities: | |||||||||||||||||||||||||||||||
Derivative liabilities(3) | $ | — | $ | — | $ | — | $ | — | $ | — | $ | 381 | $ | — | $ | 381 | |||||||||||||||
_______________________________________
(1) | Presented in investments in unconsolidated ventures on the accompanying consolidated balance sheets. |
(2) | Presented in deferred costs and other assets, net on the accompanying consolidated balance sheets. |
(3) | Presented in other liabilities on the accompanying consolidated balance sheets. |
34
NORTHSTAR REAL ESTATE INCOME II, INC. AND SUBSIDIARIES
NOTES TO CONSOLIDATED FINANCIAL STATEMENTS (Continued)
(Unaudited)
The following table presents additional information about PE Investments which are measured at fair value on a recurring basis for the nine months ended September 30, 2017 and year ended December 31, 2016 for which the Company has used Level 3 inputs to determine fair value (dollars in thousands):
Nine Months Ended September 30, 2017 (Unaudited) | Year Ended December 31, 2016 | ||||||
Beginning balance | $ | 299,681 | $ | 54,865 | |||
Purchases/contributions, net(1) | 2,846 | 315,033 | |||||
Distributions | (78,031 | ) | (82,069 | ) | |||
Equity in earnings | 24,033 | 11,611 | |||||
Unrealized gains included in earnings | 630 | 2,455 | |||||
Unrealized losses included in earnings | (1,233 | ) | (2,214 | ) | |||
Ending balance | $ | 247,926 | $ | 299,681 | |||
_______________________________________
(1) | Includes contributions subsequent to closing and accretion of discount on deferred purchase price obligations. In the period of acquisition, includes initial investment, gross of adjustments and deferred purchase price obligations, net of discount. For the year ended December 31, 2016, includes $19.5 million of outstanding deferred purchase price obligations, net. |
For the nine months ended September 30, 2017 and the year ended December 31, 2016, the Company used a discounted cash flow model to quantify Level 3 fair value measurements on a recurring basis. For the nine months ended September 30, 2017 and year ended December 31, 2016, the key unobservable inputs used in this analysis included discount rates with a weighted average of 9.0% and 13.1%, respectively, and timing and amount of expected future cash flow.
Significant increases (decreases) in any one of the inputs described above in isolation may result in a significantly different fair value for the financial assets using such Level 3 inputs.
Fair Value Option
The Company elected the fair value option for PE Investments because management believes it is a more useful presentation for such investments. The Company determined recording the PE Investments based on the change in fair value of projected future cash flow from one period to another better represents the underlying economics of the respective investment. As of September 30, 2017, the Company has elected not to apply the fair value option for any other eligible financial assets or liabilities.
Fair Value of Financial Instruments
In addition to the above disclosures regarding financial assets or liabilities which are recorded at fair value, U.S. GAAP requires disclosure of fair value about all financial instruments. The following disclosure of estimated fair value of financial instruments was determined by the Company using available market information and appropriate valuation methodologies. Considerable judgment is necessary to interpret market data and develop estimated fair value. Accordingly, the estimates presented herein are not necessarily indicative of the amounts the Company could realize on disposition of the financial instruments. The use of different market assumptions and/or estimation methodologies may have a material effect on estimated fair value.
35
NORTHSTAR REAL ESTATE INCOME II, INC. AND SUBSIDIARIES
NOTES TO CONSOLIDATED FINANCIAL STATEMENTS (Continued)
(Unaudited)
The following table presents the principal amount, carrying value and fair value of certain financial assets and liabilities as of September 30, 2017 and December 31, 2016 (dollars in thousands):
September 30, 2017 (Unaudited) | December 31, 2016 | ||||||||||||||||||||||
Principal Amount | Carrying Value | Fair Value | Principal Amount | Carrying Value | Fair Value | ||||||||||||||||||
Financial assets:(1) | |||||||||||||||||||||||
Real estate debt investments, net | $ | 808,019 | (2) | $ | 809,409 | $ | 808,019 | $ | 805,489 | (2) | $ | 806,485 | $ | 835,589 | |||||||||
Real estate securities, available for sale | 130,191 | 95,039 | 95,039 | 128,181 | 86,937 | 86,937 | |||||||||||||||||
Loan collateral receivable, related party | 23,728 | (3) | 23,728 | 23,728 | 23,728 | (3) | 23,728 | 23,051 | |||||||||||||||
Financial liabilities:(1) | |||||||||||||||||||||||
Securitization bonds payable, net | $ | 117,075 | $ | 115,592 | $ | 117,075 | $ | 193,980 | $ | 191,315 | $ | 193,980 | |||||||||||
Credit facilities | 342,870 | 342,870 | 342,870 | 241,407 | 241,407 | 241,407 | |||||||||||||||||
Mortgage and other notes payable, net | 385,206 | 383,894 | 385,206 | 378,038 | 376,181 | 357,397 | |||||||||||||||||
_______________________________________
(1) | The fair value of other financial instruments not included in this table is estimated to approximate their carrying value. |
(2) | Excludes future funding commitments of $31.1 million and $25.2 million as of September 30, 2017 and December 31, 2016, respectively. |
(3) | Represents three senior loan participation interests in first mortgage loans. Excludes future funding commitments of $4.6 million as of September 30, 2017 and December 31, 2016, respectively. |
Disclosure about fair value of financial instruments is based on pertinent information available to management as of the reporting date. Although management is not aware of any factors that would significantly affect fair value, such amounts have not been comprehensively revalued for purposes of these consolidated financial statements since that date and current estimates of fair value may differ significantly from the amounts presented herein.
Real Estate Debt Investments, net / Loan Collateral Receivable, Related Party
For CRE debt investments, including loan collateral receivable, related party, fair values were determined: (i) by comparing the current yield to the estimated yield for newly originated loans with similar credit risk or the market yield at which a third party might expect to purchase such investment; or (ii) based on discounted cash flow projections of principal and interest expected to be collected, which includes consideration of the financial standing of the borrower or sponsor as well as operating results of the underlying collateral. As of the reporting date, the Company believes the principal amount approximates fair value. These fair value measurements of CRE debt, including loan collateral receivable, related party, are generally based on unobservable inputs, and as such, are classified as Level 3 of the fair value hierarchy.
Securitization Bonds Payable, net
Securitization bonds payable, net are valued using quotations from nationally recognized financial institutions that generally acted as underwriter for the transactions. These quotations are not adjusted and are generally based on observable inputs that can be validated, and as such, are classified as Level 2 of the fair value hierarchy.
Credit Facilities
The Company has amounts outstanding under Term Loan Facilities. The Term Loan Facilities bear floating rates of interest. As of the reporting date, the Company believes the carrying value approximates fair value. This fair value measurement is based on observable inputs, and as such, is classified as Level 2 of the fair value hierarchy.
Mortgage and Other Notes Payable, net
For mortgage and other notes payable, the Company primarily uses rates currently available with similar terms and remaining maturities to estimate fair value. These measurements are determined using comparable U.S. Treasury rates as of the end of the reporting period. As of the reporting date, the Company believes the principal amount approximates fair value. These fair value measurements are based on observable inputs, and as such, are classified as Level 2 of the fair value hierarchy.
36
NORTHSTAR REAL ESTATE INCOME II, INC. AND SUBSIDIARIES
NOTES TO CONSOLIDATED FINANCIAL STATEMENTS (Continued)
(Unaudited)
13. | Segment Reporting |
The Company currently conducts its business through the following four segments, which are based on how management reviews and manages its business:
• | Commercial Real Estate Debt - Focused on originating, acquiring and asset managing CRE debt investments including first mortgage loans, subordinate interests and mezzanine loans and participations in such loans, as well as preferred equity interests. |
• | Commercial Real Estate Equity - Focused on direct and indirect ownership in real estate and real estate assets that may be structurally senior to a third-party partner’s equity and indirect interests in real estate through PE Investments since the underlying collateral in the funds is primarily real estate. |
• | Commercial Real Estate Securities - Focused on investing in CMBS, unsecured REIT debt, CDO notes and other securities. |
• | Corporate - The corporate segment includes corporate level asset management and other fees - related party and general and administrative expenses. |
The Company may also invest in CRE debt investments and equity investments indirectly through joint ventures.
The Company primarily generates revenue from net interest income on its CRE debt and securities investments and rental and other income from its real estate properties. Additionally, the Company records equity in earnings of unconsolidated ventures, including PE Investments and an investment in a joint venture. The Company’s income is primarily derived through the difference between revenue and the cost at which the Company is able to finance its investments. The Company may also acquire investments which generate attractive returns without any leverage.
The following tables present segment reporting for the three and nine months ended September 30, 2017 and 2016 (dollars in thousands):
Three Months Ended September 30, 2017 | Real Estate Debt | Real Estate Equity | Real Estate Securities | Corporate | Total | |||||||||||||||
Net interest income | $ | 10,526 | $ | 1 | $ | 1,808 | $ | 139 | $ | 12,474 | ||||||||||
Rental and other income | — | 11,093 | — | — | 11,093 | |||||||||||||||
Asset management and other fees - related party | — | — | — | (5,427 | ) | (5,427 | ) | |||||||||||||
Mortgage notes interest expense | — | (3,644 | ) | — | — | (3,644 | ) | |||||||||||||
Transaction costs | — | — | — | (3,636 | ) | (3,636 | ) | |||||||||||||
Property operating expenses | — | (3,243 | ) | — | — | (3,243 | ) | |||||||||||||
General and administrative expenses | (151 | ) | — | (9 | ) | (3,296 | ) | (3,456 | ) | |||||||||||
Depreciation and amortization | — | (4,713 | ) | — | — | (4,713 | ) | |||||||||||||
Unrealized gain (loss) on investments | — | (158 | ) | (158 | ) | |||||||||||||||
Realized gain (loss) on investments | — | (650 | ) | — | — | (650 | ) | |||||||||||||
Income (loss) before equity in earnings (losses) of unconsolidated ventures and income tax benefit (expense) | 10,375 | (1,314 | ) | 1,799 | (12,220 | ) | (1,360 | ) | ||||||||||||
Equity in earnings (losses) of unconsolidated ventures | 1,239 | 6,087 | — | — | 7,326 | |||||||||||||||
Income tax benefit (expense) | — | (646 | ) | — | — | (646 | ) | |||||||||||||
Net income (loss) | $ | 11,614 | $ | 4,127 | $ | 1,799 | $ | (12,220 | ) | $ | 5,320 | |||||||||
37
NORTHSTAR REAL ESTATE INCOME II, INC. AND SUBSIDIARIES
NOTES TO CONSOLIDATED FINANCIAL STATEMENTS (Continued)
(Unaudited)
Three Months Ended September 30, 2016 | Real Estate Debt | Real Estate Equity | Real Estate Securities | Corporate | Total | |||||||||||||||
Net interest income | $ | 9,407 | $ | 1 | $ | 1,797 | $ | 101 | $ | 11,306 | ||||||||||
Rental and other income | — | 10,973 | — | — | 10,973 | |||||||||||||||
Asset management and other fees - related party | — | — | — | (4,248 | ) | (4,248 | ) | |||||||||||||
Mortgage notes interest expense | — | (3,490 | ) | — | — | (3,490 | ) | |||||||||||||
Transaction costs | (28 | ) | (285 | ) | — | — | (313 | ) | ||||||||||||
Property operating expenses | — | (3,261 | ) | — | — | (3,261 | ) | |||||||||||||
General and administrative expenses | (88 | ) | (2 | ) | (7 | ) | (3,388 | ) | (3,485 | ) | ||||||||||
Depreciation and amortization | — | (4,695 | ) | — | — | (4,695 | ) | |||||||||||||
Unrealized gain (loss) on investments | — | (39 | ) | — | (39 | ) | ||||||||||||||
Realized gain (loss) on investments | — | (34 | ) | — | (34 | ) | ||||||||||||||
Income (loss) before equity in earnings (losses) of unconsolidated ventures and income tax benefit (expense) | 9,291 | (832 | ) | 1,790 | (7,535 | ) | 2,714 | |||||||||||||
Equity in earnings (losses) of unconsolidated ventures | — | 2,438 | — | — | 2,438 | |||||||||||||||
Income tax benefit (expense) | — | (224 | ) | — | — | (224 | ) | |||||||||||||
Net income (loss) | $ | 9,291 | $ | 1,382 | $ | 1,790 | $ | (7,535 | ) | $ | 4,928 | |||||||||
Nine Months Ended September 30, 2017 | Real Estate Debt | Real Estate Equity | Real Estate Securities | Corporate | Total | |||||||||||||||
Net interest income | $ | 31,498 | $ | 4 | $ | 5,063 | $ | 404 | $ | 36,969 | ||||||||||
Rental and other income | — | 32,624 | — | — | 32,624 | |||||||||||||||
Asset management and other fees - related party | — | — | — | (16,164 | ) | (16,164 | ) | |||||||||||||
Mortgage notes interest expense | — | (10,648 | ) | — | — | (10,648 | ) | |||||||||||||
Transaction costs | — | — | — | (4,496 | ) | (4,496 | ) | |||||||||||||
Property operating expenses | — | (9,534 | ) | — | — | (9,534 | ) | |||||||||||||
General and administrative expenses | (440 | ) | (14 | ) | (30 | ) | (10,134 | ) | (10,618 | ) | ||||||||||
Depreciation and amortization | — | (14,174 | ) | — | — | (14,174 | ) | |||||||||||||
Unrealized gain (loss) on investments | — | (604 | ) | — | — | (604 | ) | |||||||||||||
Realized gain (loss) on investments | — | (650 | ) | — | — | (650 | ) | |||||||||||||
Income (loss) before equity in earnings (losses) of unconsolidated ventures and income tax benefit (expense) | 31,058 | (2,996 | ) | 5,033 | (30,390 | ) | 2,705 | |||||||||||||
Equity in earnings (losses) of unconsolidated ventures | 1,239 | 24,033 | — | — | 25,272 | |||||||||||||||
Income tax benefit (expense) | — | (4,200 | ) | — | — | (4,200 | ) | |||||||||||||
Net income (loss) | $ | 32,297 | $ | 16,837 | $ | 5,033 | $ | (30,390 | ) | $ | 23,777 | |||||||||
38
NORTHSTAR REAL ESTATE INCOME II, INC. AND SUBSIDIARIES
NOTES TO CONSOLIDATED FINANCIAL STATEMENTS (Continued)
(Unaudited)
Nine Months Ended September 30, 2016 | Real Estate Debt | Real Estate Equity | Real Estate Securities | Corporate | Total | |||||||||||||||
Net interest income | $ | 31,407 | $ | 5 | $ | 3,271 | $ | 101 | $ | 34,784 | ||||||||||
Rental and other income | — | 32,229 | — | — | 32,229 | |||||||||||||||
Asset management and other fees - related party | — | — | — | (14,966 | ) | (14,966 | ) | |||||||||||||
Mortgage notes interest expense | — | (10,257 | ) | — | — | (10,257 | ) | |||||||||||||
Transaction costs | (1,362 | ) | (297 | ) | — | — | (1,659 | ) | ||||||||||||
Property operating expenses | — | (10,247 | ) | — | — | (10,247 | ) | |||||||||||||
General and administrative expenses | (278 | ) | (2 | ) | (20 | ) | (6,428 | ) | (6,728 | ) | ||||||||||
Depreciation and amortization | — | (15,465 | ) | — | — | (15,465 | ) | |||||||||||||
Unrealized gain (loss) on investments | — | (39 | ) | — | — | (39 | ) | |||||||||||||
Realized gain (loss) on investments | — | (34 | ) | — | — | (34 | ) | |||||||||||||
Income (loss) before equity in earnings (losses) of unconsolidated ventures and income tax benefit (expense) | 29,767 | (4,107 | ) | 3,251 | (21,293 | ) | 7,618 | |||||||||||||
Equity in earnings (losses) of unconsolidated ventures | — | 4,993 | — | — | 4,993 | |||||||||||||||
Income tax benefit (expense) | — | (446 | ) | — | — | (446 | ) | |||||||||||||
Net income (loss) | $ | 29,767 | $ | 440 | $ | 3,251 | $ | (21,293 | ) | $ | 12,165 | |||||||||
The following table presents total assets by segment as of September 30, 2017 and December 31, 2016 (dollars in thousands):
Total Assets | Real Estate Debt | Real Estate Equity(1) | Real Estate Securities | Corporate(2) | Total | |||||||||||||||
September 30, 2017 (Unaudited) | $ | 955,374 | $ | 709,758 | $ | 103,707 | $ | 45,467 | $ | 1,814,306 | ||||||||||
December 31, 2016 | 909,240 | 753,690 | 92,451 | 51,619 | 1,807,000 | |||||||||||||||
_______________________________________
(1) | Includes investments in private equity funds totaling $247.9 million and $299.7 million as of September 30, 2017 and December 31, 2016, respectively. |
(2) | Includes cash and cash equivalents, unallocated receivables and deferred costs and other assets, net. |
14. | Subsequent Events |
Distributions
On November 8, 2017, the board of directors of the Company approved a daily cash distribution of $0.001917808 per share of Class A common stock and $0.001917808 per share of Class T common stock less the distribution fees that are payable with respect to such Class T common stock, for each of the three months ended March 31, 2018. Distributions are generally paid to stockholders on the first business day of the month following the month for which the distribution was accrued.
39
Item 2. Management’s Discussion and Analysis of Financial Condition and Results of Operations
The following discussion should be read in conjunction with our consolidated financial statements and notes thereto included in Item 1. “Financial Statements” of this report. References to “we,’’ “us,’’ or “our’’ refer to NorthStar Real Estate Income II, Inc. and its subsidiaries unless the context specifically requires otherwise.
Introduction
We were formed to originate, acquire and asset manage a diversified portfolio of commercial real estate, or CRE, debt, equity and securities investments predominantly in the United States. CRE debt investments include first mortgage loans, subordinate mortgage and mezzanine loans and participations in such loans and preferred equity interests. Real estate equity investments include direct ownership in properties, which may be structurally senior to a third-party partner’s equity, as well as indirect interests in real estate through real estate private equity funds, or PE Investments. CRE securities primarily consist of commercial mortgage-backed securities, or CMBS, and may include unsecured real estate investment trust, or REIT, debt, collateralized debt obligation, or CDO, notes and other securities. We may also invest internationally. In addition, we own investments through joint ventures. We were formed in December 2012 as a Maryland corporation and commenced operations in September 2013. We elected to be taxed as a REIT under the Internal Revenue Code of 1986, as amended, or the Internal Revenue Code, commencing with the taxable year ended December 31, 2013. We conduct our operations so as to continue to qualify as a REIT for U.S. federal income tax purposes.
We are externally managed and have no employees. Prior to January 11, 2017, we were managed by an affiliate of NorthStar Asset Management Group Inc. (NYSE: NSAM), or NSAM. Effective January 10, 2017, NSAM completed its previously announced merger with Colony Capital, Inc., or Colony, NorthStar Realty Finance Corp., or NorthStar Realty, and Colony NorthStar, Inc., or Colony NorthStar, a wholly-owned subsidiary of NSAM, which we refer to as the mergers, with Colony NorthStar surviving the mergers and succeeding NSAM as our Sponsor. As a result of the mergers, our Sponsor became an internally-managed equity REIT, with a diversified real estate and investment management platform and publicly-traded on the NYSE under the ticker symbol “CLNS.” In addition, following the mergers, CNI NSII Advisors, LLC (formerly known as NSAM J-NSII Ltd, an affiliate of NSAM), or our Advisor, became a subsidiary of Colony NorthStar. Our Advisor manages our day-to-day operations pursuant to an advisory agreement. The mergers had no material impact on our operations.
Colony NorthStar manages capital on behalf of its stockholders, as well as institutional and retail investors in private funds, non-traded and traded REITs and registered investment companies. As of September 30, 2017, our Sponsor had $57.1 billion of assets under management, including Colony NorthStar’s balance sheet investments and third-party managed investments.
Combination Agreement
On August 25, 2017, we entered into a master combination agreement, or the Combination Agreement, with, among others, Colony Capital Operating Company, LLC, or CLNS OP, the operating company of our Sponsor, and NorthStar Real Estate Income Trust, Inc., or NorthStar Income, a company managed by an affiliate of our Sponsor, pursuant to which a select portfolio of our Sponsor’s assets and liabilities will be combined with all of our assets and liabilities and substantially all of the assets and liabilities of NorthStar Income in an all-stock combination transaction to create an externally managed commercial real estate credit REIT (the transactions associated with the Combination Agreement, collectively, the “Combination”). The Combination has been unanimously approved by our special committee and our board of directors as well as the special committee and the board of directors of NorthStar Income and approved by the board of directors of our Sponsor. The combined company will be named “Colony NorthStar Credit Real Estate, Inc.,” or CLNC, and its Class A common stock is expected to be listed on a national securities exchange.
Upon completion of the Combination, our stockholders, our Sponsor, and the stockholders of NorthStar Income will own approximately 31%, 37% and 32%, respectively, of CLNC on a fully diluted basis, subject to certain adjustments as set forth in the Combination Agreement.
The Combination is expected to close in the first quarter of 2018, subject to customary closing conditions, including approval by our stockholders as well as stockholders of NorthStar Income, and the listing of CLNC’s Class A common stock on a national securities exchange. There can be no assurance that the closing conditions will be satisfied, that the Combination will be consummated, or the timing thereof.
Our Business
Our primary investment types are as follows:
• | Commercial Real Estate Debt - Our CRE debt investments include first mortgage loans, subordinate interests and mezzanine loans and participations in such loans, as well as preferred equity interests. |
40
• | Commercial Real Estate Equity - Our CRE equity investments include direct and indirect ownership in real estate and real estate assets that may be structurally senior to a third-party partner’s equity and indirect interests in real estate through PE Investments since the underlying collateral in the funds is primarily real estate. |
• | Commercial Real Estate Securities - Our CRE securities investments include CMBS and may include unsecured REIT debt, CDO notes and other securities. |
We believe that our targeted investment types are complementary to each other due to their overlapping sources of investment opportunities, common reliance on real estate fundamentals and application of similar portfolio management and servicing skills to maximize value and to protect shareholder capital. We believe our Advisor’s platform and experience provide us the flexibility to invest across the real estate capital structure.
The Offering
In May 2013, our public offering of up to $1.65 billion in shares of our common stock, which included up to $1.5 billion of shares pursuant to our primary offering, or our Primary Offering, and up to $150.0 million of shares pursuant to our distribution reinvestment plan, or our DRP, was declared effective by the U.S. Securities and Exchange Commission, or SEC. Our Primary Offering and our DRP are herein collectively referred to as our Offering. In our Offering, our shares of common stock were offered in any combination of the two classes of shares of our common stock: Class A shares and Class T shares. NorthStar Securities, LLC, or our Dealer Manager, formerly a subsidiary of NSAM and a subsidiary of our Sponsor upon completion of the mergers, was responsible for marketing the shares that were offered pursuant to our Primary Offering.
Our Primary Offering closed effective November 9, 2016. Following the termination of the Primary Offering and until its suspension described below, we continued to offer and sell shares pursuant to our DRP at the most recently disclosed estimated value per share of each share class. Prior to the closing of the Primary Offering, $150.0 million of the unsold shares remaining from our Primary Offering were allocated to our DRP, for a total of $300.0 million in shares offered pursuant to our DRP. We may amend, suspend or terminate our DRP for any reason except to eliminate a participant’s ability to withdraw from our DRP, upon ten days written notice. On August 25, 2017, in connection with the entry into the Combination Agreement, our board of directors voted to suspend the DRP until further notice. Pursuant to the terms of the DRP, the suspension went into effect prior to the monthly distributions to be paid on or about October 1, 2017 and as a result, our stockholders will receive only cash distributions through the completion of the Combination unless and until the DRP is reinstated.
From inception through November 8, 2017, we raised total gross proceeds of $1.2 billion pursuant to our Offering, including gross proceeds of $81.7 million pursuant to our DRP.
41
Our Investments
The following table presents our investments as of September 30, 2017, adjusted for acquisitions, dispositions and commitments to purchase and sell through November 8, 2017 (dollars in thousands):
Investment Type: | Count | Principal Amount / Cost(1) | % of Total | ||||||
Real estate debt investments | Loans | ||||||||
First mortgage loans(2) (3) | 22 | $ | 666,302 | 38.1 | % | ||||
Mezzanine loan(2)(4) | 1 | 60,000 | 3.4 | % | |||||
Subordinate interests(2) | 3 | 164,877 | 9.4 | % | |||||
Total real estate debt | 26 | 891,179 | 50.9 | % | |||||
Operating real estate | Properties | ||||||||
Industrial | 22 | 335,111 | 19.1 | % | |||||
Multi-tenant office | 2 | 144,582 | 8.3 | % | |||||
Total operating real estate | 24 | 479,693 | 27.4 | % | |||||
Investments in private equity funds | |||||||||
PE Investment I | 1 | 25,633 | 1.5 | % | |||||
PE Investment II | 1 | 7,593 | 0.4 | % | |||||
PE Investment III(5) | 1 | 217,892 | 12.4 | % | |||||
Total investments in private equity funds | 3 | 251,118 | 14.3 | % | |||||
Real estate securities | |||||||||
CMBS | 14 | 130,191 | 7.4 | % | |||||
Total real estate securities | 14 | 130,191 | 7.4 | % | |||||
Total | 67 | $ | 1,752,181 | 100.0 | % | ||||
______________________________________
(1) | Based on principal amount for real estate debt investments and securities, fair value for our PE Investments and cost for real estate equity, which includes purchase price allocations related to net intangibles, deferred costs and other assets. |
(2) | Includes future funding commitments of $28.7 million for first mortgage loans, $14.1 million for mezzanine loan, and $5.9 million for subordinate interests, as of November 8, 2017. |
(3) | Includes three senior participation interests in first mortgage loans, which are recorded as “Loan collateral receivable, related party” on our consolidated balance sheets, totaling $28.3 million of principal, including future funding commitments of $4.6 million. |
(4) | Includes an investment in a mezzanine loan through a joint venture with an affiliate of our Sponsor, which is recorded as “Investments in unconsolidated ventures” on our consolidated balance sheets, totaling $60.0 million of principal, including future funding commitments of $14.1 million. |
(5) | Includes deferred payments, net of discount, assumed from the seller and owed to third parties. As of September 30, 2017, $3.2 million in deferred purchase price obligations remain outstanding, which includes our proportionate share of an obligation owed through an unconsolidated joint investment. |
For financial information regarding our reportable segments, refer to Note 13, “Segment Reporting” in our accompanying consolidated financial statements included in Part I Item 1. “Financial Statements.”
Underwriting Process
We use a rigorous investment and underwriting process that has been developed and utilized by our Advisor’s and its affiliates’ senior management team leveraging their extensive commercial real estate expertise over many years and real estate cycles which focuses on some or all of the following factors designed to ensure each investment is evaluated appropriately: (i) macroeconomic conditions that may influence operating performance; (ii) fundamental analysis of underlying real estate, including tenant rosters, lease terms, zoning, necessary licensing, operating costs and the asset’s overall competitive position in its market; (iii) real estate market factors that may influence the economic performance of the investment, including leasing conditions and overall competition; (iv) the operating expertise and financial strength and reputation of a tenant, operator, partner or borrower; (v) the cash flow in place and projected to be in place over the term of the investment and potential return; (vi) the appropriateness of the business plan and estimated costs associated with tenant buildout, repositioning or capital improvements; (vii) an internal and third-party valuation of a property, investment basis relative to the competitive set and the ability to liquidate an investment through a sale or refinancing; (viii) review of third-party reports including appraisals, engineering and environmental reports; (ix) physical inspections of properties and markets; (x) the overall legal structure of the investment, contractual implications and the lenders’ rights; and (xi) the tax and accounting impact.
The following section describes the major CRE asset classes in which we invest and actively manage to maximize value and to protect capital.
42
Real Estate Debt Investments
Overview
Our CRE debt investment strategy focuses on originating, acquiring and asset managing CRE debt investments, including first mortgage loans, subordinate mortgage and mezzanine loans and participations in such loans and preferred equity interests.
We emphasize direct origination of our debt investments as this allows us a greater degree of control over underwriting and structure and provides us the opportunity to syndicate some or all of the loans (including senior or subordinate interests), if desired. Further, direct origination of debt investments provides for a closer relationship with our borrowers.
Our Portfolio
As of September 30, 2017, adjusted for repayments through November 8, 2017, 50.9% of our assets were invested in CRE debt, consisting of 26 loans with an average investment size of $34.3 million. These loans are collateralized by a total of 80 properties. The weighted average extended maturity of our CRE debt portfolio is 3.9 years. Although our current portfolio is predominantly comprised of first mortgage loans, we continue to evaluate lending opportunities throughout the capital structure including mezzanine loans and subordinate interests.
The following table presents a summary of our CRE debt investments as of September 30, 2017, adjusted for repayments through November 8, 2017 (dollars in thousands):
Weighted Average | Floating Rate as % of Principal Amount | ||||||||||||||||||||||||
Investment Type: | Count | Principal Amount(1) | Carrying Value(2) | Allocation by Investment Type(3) | Fixed Rate | Spread over LIBOR(4) | Total Unleveraged Current Yield | ||||||||||||||||||
First mortgage loans(5) | 22 | $ | 666,302 | $ | 638,097 | 74.8 | % | — | % | 5.08 | % | 6.07 | % | 100.0 | % | ||||||||||
Mezzanine loan(6) | 1 | 60,000 | 45,918 | 6.7 | % | 12.08 | % | — | % | 12.14 | % | — | % | ||||||||||||
Subordinate interests | 3 | 164,877 | 159,821 | 18.5 | % | 12.81 | % | 12.75 | % | 13.02 | % | 17.4 | % | ||||||||||||
Total/Weighted average | 26 | $ | 891,179 | $ | 843,836 | 100.0 | % | 12.63 | % | 5.36 | % | 7.72 | % | 78.0 | % | ||||||||||
______________________________________
(1) | Includes future funding commitments of $28.7 million for first mortgage loans, $14.1 million for a mezzanine loan, and $5.9 million for subordinate interests, as of November 8, 2017. |
(2) | Certain CRE debt investments serve as collateral for financing transactions, including carrying value of $479.8 million for Term Loan Facilities, as defined in Item 2, “Financing Strategy,” and other notes payable and $158.3 million for a securitization financing transaction executed in November 2016. Refer to Item 2, “Liquidity and Capital Resources,” for further detail. The remainder is unleveraged. |
(3) | Based on principal amount. |
(4) | Includes a fixed minimum LIBOR rate, or LIBOR floor, as applicable. As of November 8, 2017, we had $468.2 million principal amount of floating-rate loans subject to a LIBOR floor with the weighted average LIBOR floor of 0.43%. |
(5) | Includes three senior participation interests in first mortgage loans, which are recorded as “Loan collateral receivable, related party” on our consolidated balance sheets, totaling $28.3 million of principal, including future funding commitments of $4.6 million. Refer to Item 2, “Liquidity and Capital Resources,” for further detail. |
(6) | Includes an investment in a mezzanine loan through a joint venture with an affiliate of our Sponsor, which is recorded as “Investments in unconsolidated ventures” on our consolidated balance sheets, totaling $60.0 million of principal, including future funding commitments of $14.1 million. |
43
The following charts present our CRE debt portfolio’s diversity across investment type, property type and geographic location based on principal amount as of September 30, 2017, adjusted for repayments through November 8, 2017:
Real Estate Debt by Investment Type |
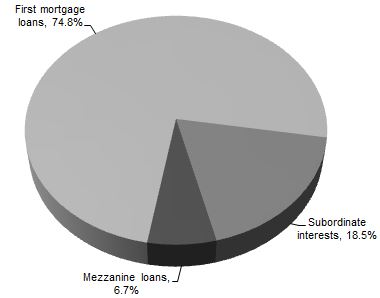 |
Real Estate Debt by Property Type | Real Estate Debt by Geographic Location | |
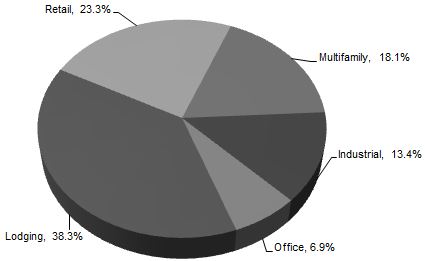 | 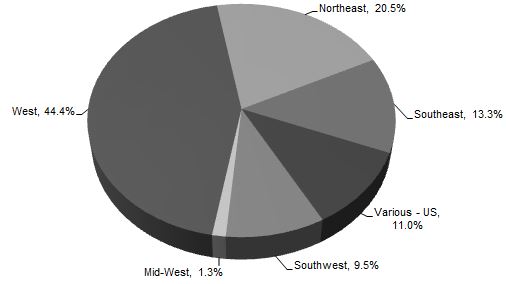 | |
Operating Real Estate
Our operating real estate investment strategy focuses on direct ownership in commercial real estate with an emphasis on properties with stable cash flow, which may be structurally senior to a third-party partner’s equity. In addition, we may own operating real estate investments through joint ventures with one or more partners. Our operating real estate investments may have the potential to appreciate in value and therefore help offset upfront fees and expenses. Our operating real estate investments are comprised of an industrial and a multi-tenant office portfolio, respectively.
Our industrial portfolio includes net lease properties, which are typically leased to a single tenant. We may also invest in properties that are leased to tenants with us retaining responsibility for certain operating and capital costs. At the end of the lease term, the tenant typically has a right to renew the lease at market rates or to vacate the property with no further ongoing obligation.
Our multi-tenant office portfolio consists of commercial office properties that are well located with strong operating partners which we believe offer both attractive cash flow and returns.
As of September 30, 2017, $479.7 million, or 27.4% of our assets were invested in real estate properties and our portfolio was 93.0% occupied with a weighted average lease term of 3.4 years.
The following table presents our real estate property investments as of September 30, 2017 (dollars in thousands):
Property Type | Number of Portfolios | Number of Properties | Amount(1) | % of Total | Capacity | Primary Locations | |||||||||||
Industrial | 1 | 22 | $ | 335,111 | 69.9 | % | 6,697,324 | square feet | IN, KY, TN | ||||||||
Multi-tenant Office | 1 | 2 | 144,582 | 30.1 | % | 717,702 | square feet | WA | |||||||||
Total | 2 | 24 | $ | 479,693 | 100.0 | % | |||||||||||
(1) | Based on cost which includes purchase price allocations related to deferred costs and other assets. |
44
The following charts present our real estate portfolio’s diversity across property type and geographic location based on cost as of September 30, 2017:
Real Estate by Property Type | Real Estate by Geographic Location | |
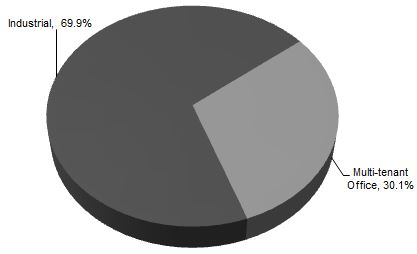 | 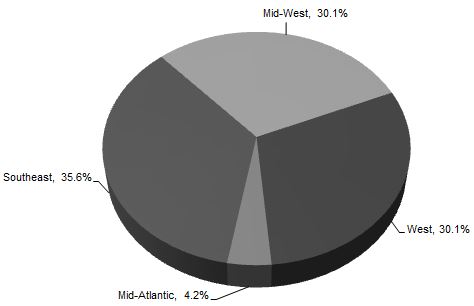 | |
Investments in Private Equity Funds
Our PE Investments own limited partnership interests in real estate private equity funds acquired in the secondary market and are managed by institutional-quality sponsors, which we refer to as fund interests. In addition, we may own PE Investments through joint ventures with one or more partners.
As of September 30, 2017, 14.3% of our assets were invested in PE Investments, totaling $251.1 million.
The following tables present a summary of our PE Investments (dollars in thousands):
Underlying Fund Interests(3) | |||||||||||||||||||||||
PE Investment | Number of Funds(1) | Number of General Partners(1) | Initial NAV | Amount(2) | Assets, at Cost | Implied Underlying Leverage(4) | Expected Future Contributions(5) | ||||||||||||||||
PE Investment I | 5 | 4 | $ | 50,233 | $ | 25,633 | $ | 2,307,000 | 48.3% | $ | — | ||||||||||||
PE Investments II | 3 | 2 | 29,250 | 7,593 | 338,000 | — | % | — | |||||||||||||||
PE Investments III(6) | 39 | 20 | 344,267 | 217,892 | 20,972,000 | 42.5% | — | ||||||||||||||||
Total | 47 | 26 | $ | 423,750 | $ | 251,118 | $ | 23,617,000 | $ | — | |||||||||||||
________________________________________
(1) | Based on number of remaining underlying fund interests as of September 30, 2017. |
(2) | Includes deferred payments, net of discount, assumed from the seller and owed to third parties. |
(3) | Based on financial data reported by the underlying funds as of June 30, 2017, which is the most recent financial information available from the underlying funds, except as otherwise noted. |
(4) | Represents implied leverage for funds with investment-level financing, calculated as the underlying borrowing divided by assets at fair value. |
(5) | Represents the estimated amount of expected future contributions to funds as of September 30, 2017. |
(6) | At the time of closing in September 2016, we paid $33.9 million to acquire PE Investment III and paid an additional $204.7 million in December 2016. In addition, we assumed $44.7 million of deferred purchase price obligations to third parties from the seller, which includes the proportionate share of an obligation owed through a joint investment within PE Investment III, totaling $5.6 million. As of September 30, 2017, $37.5 million in deferred purchase price obligations have been paid and $3.2 million remains outstanding, which is our proportionate share of an obligation owed through an unconsolidated joint investment. Refer to Item 2, “Related Party Arrangements” for additional information. |
PE Investment I | Income | Return of Capital | Distributions | Contributions(2) | ||||||||||||
Three Months Ended September 30, 2017 | $ | 565 | $ | 736 | $ | 1,301 | $ | 40 | ||||||||
March 20, 2015 to September 30, 2017(1) | 9,771 | 16,944 | 26,715 | 46,024 | ||||||||||||
PE Investment II | ||||||||||||||||
Three Months Ended September 30, 2017 | $ | 694 | $ | 3,956 | $ | 4,650 | $ | — | ||||||||
August 4, 2015 to September 30, 2017(1) | 5,889 | 23,279 | 29,168 | 27,788 | ||||||||||||
PE Investment III | ||||||||||||||||
Three Months Ended September 30, 2017 | $ | 4,828 | $ | 16,368 | $ | 21,196 | $ | 17,251 | ||||||||
September 20, 2016 to September 30, 2017(1) | 26,006 | 102,685 | 128,691 | 313,817 | ||||||||||||
45
(1) | Represents activity from the initial closing date through September 30, 2017. |
(2) | Includes initial investments, before closing statement adjustments for distributions and contributions, and subsequent contributions, including deferred purchase price fundings. |
The following charts present the underlying fund interests in our PE Investments by investment type and geographic location based on net asset value, or NAV, as of June 30, 2017 (the most recently available information):
PE Investments by Underlying Investment Type(1) | PE Investments by Underlying Geographic Location(1) | |
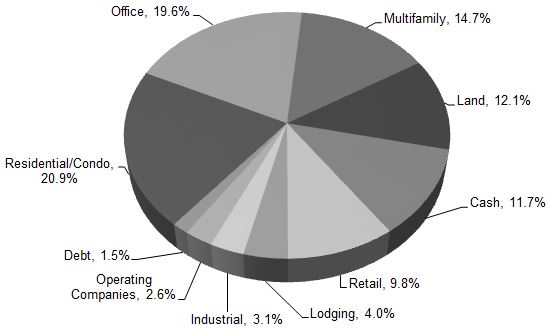 | 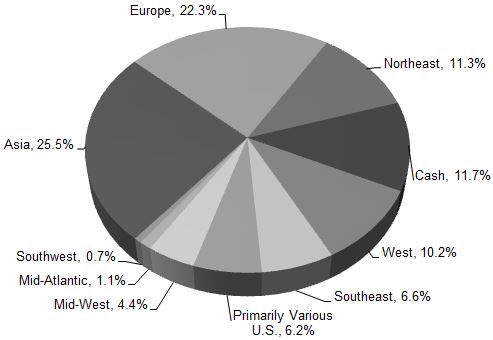 | |
_______________________________________
(1) | Based on individual fund financial statements as of June 30, 2017. |
Real Estate Securities
Our CRE securities investment strategy may focus on investing in and asset managing a wide range of CRE securities, primarily CMBS, unsecured REIT debt or CDO notes backed primarily by CRE securities and debt. We expect our CRE securities to have explicit credit ratings assigned by at least one of the major rating agencies (Moody’s Investors Services, Standard & Poor’s, Fitch Ratings, Morningstar, DBRS and/or Kroll Bond Rating Agency).
As of September 30, 2017, 7.4% of our assets were invested in CRE securities and consisted of 14 CMBS securities totaling $130.2 million purchased at an aggregate $46.1 million discount to par. Of the bonds that are rated, all have a rating of BBB- from Fitch Ratings and Kroll Bond Rating Agency with a weighted average credit support of 8.2%. The bonds are secured by diverse portfolios of mortgage loans with a weighted average loan-to-value of 58.1%. The portfolios are geographically diverse with concentrations in the Northeast, Mid-Atlantic, Southeast, and West regions of the United States and comprise office, retail, multifamily, mixed use, lodging and industrial properties. The bonds were purchased at a weighted average unlevered yield of 9.7%. We may lever the bonds with an existing or new credit facility to enhance the yield.
As of September 30, 2017, the weighted average expected maturity of our CMBS was 6.6 years.
Sources of Operating Revenues and Cash Flows
We primarily generate revenue from net interest income on our CRE debt and securities investments and rental and other income from our real estate properties. Additionally, we record equity in earnings of unconsolidated ventures, including from PE Investments. Our income is primarily derived through the difference between revenue and the cost at which we are able to finance our investments. We may also acquire investments which generate attractive returns without any leverage.
Profitability and Performance Metrics
We calculate Funds from Operations, or FFO, and Modified Funds from Operations, or MFFO (see “Non-GAAP Financial Measures-Funds from Operations and Modified Funds from Operations” for a description of these metrics), to evaluate the profitability and performance of our business.
Outlook and Recent Trends
The U.S. economy continues to demonstrate positive underlying fundamentals, with moderate gross domestic product, or GDP, growth and improving employment conditions. With the national unemployment rate lowered to 4.2% as of September and third quarter GDP growth of 3.0%, overall macroeconomic conditions remain strong. The Federal Reserve’s June 2017 decision to raise the federal funds rate for the fourth time in almost a decade reflects a consensus that the economic foundation driving the current expansion remains sound, as well as a belief the labor market is close to or already at full employment resulting in wage growth and consumer confidence. Market participants expect another rate increase in December, and while some believe that higher interest rates may potentially reduce investor demand in the broader commercial real estate market, significant increases
46
across long-term rates have yet to materialize and we expect real estate prices and returns to remain attractive while inflation is targeted to remain at 2.0% in the near term.
With major stock indexes at all-time highs and corporate earnings generally exceeding estimates, investor sentiment across both U.S. and European capital markets reflects increased confidence in the global economy. Following a year of political uncertainty given the unexpected results of the Brexit referendum and the U.S. presidential election, strong corporate earnings have overshadowed these political headwinds, providing fundamental support for record stock valuations in the U.S. and Europe. Despite the initial volatility following both outcomes, since the U.S. election the S&P 500 has increased nearly 20% and the Dow Jones Industrial Average has surpassed 23,000 for the first time and is up more than 5,000 points. In addition, benchmark 10-year interest rates in several other key global economies, including England, Germany and Japan, have recently trended to positive territory, signaling normalized market conditions while many global central banks continue to ease monetary policy to combat low inflation and economic stagnation. The pace of these changes may create volatility in global debt and equity markets and at the same time, the Federal Reserve experiences increased pressure to raise interest rates and reduce its large balance sheet holdings of financial instruments acquired during the financial crisis. In addition, the impact of potentially significant fiscal and regulatory policy changes, including potential U.S. corporate and personal tax reform, infrastructure spending, healthcare reform and new trade policies, may also have a considerable impact on the trajectory of the U.S. and global economies over the next few years.
CRE fundamentals remain relatively healthy across U.S. property types. Given certain dynamics in the current market including (i) the continuing strength of the economy; (ii) a historically low interest rate environment; (iii) low relative new CRE supply; and (iv) robust international demand for U.S. commercial real estate, we expect real estate values to trend positively due to increased property-level net operating income, strong transaction volume or a combination of both. Although CRE transaction volume has slowed slightly during 2017, property valuations remain at all-time highs across property sectors. Extreme weather events and natural disasters have had a devastating effect on real estate in impacted markets, both commercial and residential, in 2017. Hurricanes Harvey, Irma, Jose, and Maria have preliminary total cost estimates of up to $200 billion. More recently, wildfires in northern California have left significant damage to hotels, retirement communities and trailer parks. Projected costs and the impact on loans secured by properties in these regions and other regions subject to natural disasters remain uncertain. In addition, approximately $400 billion of ten-year debt originated during 2007 is set to mature during the course of 2017, and these maturities may contribute to periodic volatility in the commercial real estate market. Despite the highest quarterly issuance in three years during the third quarter 2017, overall CMBS issuance remains below pre-crisis levels due in part to uncertainty around the Dodd-Frank risk retention rules and capital requirements for banks. Given these trends, traditional capital sources may lack sufficient lending capacity to absorb the high refinancing demand, which may provide attractive lending opportunities for new market participants such as alternative investment platforms, REITs and insurance companies. Overall, economic and industry trends should support robust CRE investment activity, providing attractive investment opportunities for CRE capital providers with strong balance sheets and high underwriting standards.
Our Strategy
Our primary business objectives are to originate and acquire real estate-related investments, with a focus on CRE debt, that we expect will generate attractive risk-adjusted returns, stable cash flow for distributions and provide downside protection to our stockholders. Some of our CRE debt investments may be considered transitional in nature because the borrower or owner may have a business plan to improve the collateral and, as a result, we generally require the borrower to fund interest or other reserves, whether through loan proceeds or otherwise, to support debt service payments and capital expenditures. We, our borrower or owner, and possibly a guarantor, may be required to refill these reserves should they become deficient during the applicable period for any reason. We will seek to realize growth in the value of our real estate equity investments through appreciation and/or by opportunistic sales to maximize value. We believe that our Advisor and its affiliates have a platform that derives a potential competitive advantage from the combination of experience, proven track record of successfully managing public companies, deep industry relationships and market-leading CRE credit underwriting and capital markets expertise which enables us to manage credit risk across our investments as well as to structure and finance our assets efficiently. In addition, we believe that such platform, and our Advisor’s and its affiliates’ capabilities, will be strengthened and enhanced as a result of the mergers of Colony, NSAM and NorthStar Realty, with Colony NorthStar succeeding NSAM as our Sponsor. We believe that our targeted investment types are complementary to each other due to their overlapping sources of investment opportunities, common reliance on CRE fundamentals and ability to apply similar portfolio management and servicing skills to maximize value and to protect capital. We use the net proceeds from our Offering and other financing sources to carry out our primary business objectives of originating and acquiring real estate-related investments.
47
The following table presents our investment activity for the nine months ended September 30, 2017 and from inception through September 30, 2017, adjusted for acquisitions and commitments to purchase and sell through November 8, 2017 (dollars in thousands):
Nine Months Ended | From Inception Through | ||||||||||||
September 30, 2017 | November 8, 2017 | ||||||||||||
Count | Principal Amount / Cost(1)(2) | Count | Principal Amount / Cost(2)(3) | ||||||||||
Real estate debt investments(4) | 6 | $ | 238,574 | 40 | $ | 1,485,047 | |||||||
Investments in private equity funds | — | — | 3 | 390,419 | (5) | ||||||||
Operating real estate | — | 7,007 | (6) | 24 | 479,693 | ||||||||
Real estate securities | 3 | 2,010 | 14 | 130,191 | |||||||||
Total | 9 | $ | 247,591 | 81 | $ | 2,485,350 | |||||||
_______________________________________
(1) | Includes future funding commitments of $31.7 million for real estate debt investments. |
(2) | Based on principal amount for real estate debt investments and securities, fair value at acquisition for our PE Investments and cost for real estate equity, which includes purchase price allocations related to deferred costs and other assets. |
(3) | Includes future funding commitments of $48.7 million for real estate debt investments. |
(4) | Includes three loan participation interests in first mortgage loans, which are recorded as “Loan collateral receivable, related party” on our consolidated balance sheets, totaling $28.3 million of principal, including future funding commitments of $4.6 million. Also includes an investment in a mezzanine loan through a joint venture with an affiliate of our Sponsor, which is recorded as “Investments in unconsolidated ventures” on our consolidated balance sheets, totaling $60.0 million of principal, including future funding commitments of $14.1 million. |
(5) | Includes initial investment, before distribution and contribution closing statement adjustments, and deferred obligations. |
(6) | Represents capital improvements to our operating real estate. |
Financing Strategy
We use asset-level financing as part of our investment strategy and we seek to match-fund our assets and liabilities by having similar maturities and like-kind interest rate benchmarks (fixed or floating) to manage refinancing and interest rate risk and utilize non-recourse liabilities whenever possible. Our Advisor is responsible for managing such financing and interest rate risk on our behalf. We intend to pursue a variety of financing arrangements such as credit facilities, securitization financing transactions, mortgage notes and other term borrowings. We continue to seek and prefer long-term, non-recourse financing, including non mark-to-market financing that may be available through securitization.
Our credit facilities currently include three secured credit facility agreements, or Term Loan Facilities, that provide for an aggregate principal amount of up to $650.0 million to finance the first mortgage loans and senior loan participations secured by commercial real estate and three master repurchase agreements, or CMBS Credit Facilities, to finance the acquisition of CMBS. In November 2016, we closed a securitization financing transaction, Securitization 2016-1, as defined in Item 2, “Liquidity and Capital Resources,” which provides permanent, non-recourse, non-mark-to-market financing for our debt investments that were mainly previously financed on our Term Loan Facilities. As of November 8, 2017, we had $297.8 million borrowings outstanding under our Term Loan Facilities, with up to $352.2 million of available borrowings, $45.5 million borrowings outstanding under our CMBS Credit Facilities, and $80.8 million bonds issued and outstanding as part of the securitization transaction.
Our financing strategy for our debt and securities investments is dependent on our ability to obtain match-funded borrowings at rates that provide a positive net spread, generally using credit facilities and securitization financing transactions.
Although we have a limitation on the maximum leverage for our portfolio, which approximates 75.0% of the aggregate cost of our investments, including cash and cash equivalents and excluding indirect leverage held through our unconsolidated venture investments, before deducting loan loss reserves, other non-cash reserves and depreciation, we do not have a targeted debt-to-equity ratio on an asset-by-asset basis, as we believe the appropriate leverage for the particular assets we finance depends on the specific credit characteristics of each asset. We use leverage for the sole purpose of financing our investments and diversifying our equity and we do not employ leverage to speculate on changes in interest rates. As of September 30, 2017, our leverage as a percentage of our cost of investments was 47.1%.
Portfolio Management
Our Advisor and its affiliates maintain a comprehensive portfolio management process that generally includes day-to-day oversight by the portfolio management and servicing team, regular management meetings and an exhaustive quarterly credit review process. These processes are designed to enable management to evaluate and proactively identify asset-specific credit issues and trends on a portfolio-wide basis. For joint venture investments, we may rely on joint venture partners to provide certain asset management, property management and/or other services in managing our joint investments. Nevertheless, we cannot be certain that our Advisor’s review will identify all issues within our portfolio due to, among other things, adverse economic conditions or events
48
adversely affecting specific assets; therefore, potential future losses may also stem from investments that are not identified during these credit reviews. The portfolio management team, under the direction of the investment committee, uses many methods to actively manage our asset base to preserve our income and capital. Credit risk management is the ability to manage our assets in a manner that preserves principal/cost and income and minimizes credit losses that could decrease income and portfolio value. For CRE investments, frequent re-underwriting and dialogue with borrowers/partners and regular inspections of our collateral and owned properties have proven to be an effective process for identifying issues early. During the quarterly credit review, or more frequently as necessary, investments are put on highly-monitored status and identified for possible loan loss reserves/asset impairment, as appropriate, based upon several factors, including missed or late contractual payments, significant declines in collateral performance and other data which may indicate a potential issue in our ability to recover our invested capital from an investment. Our Advisor uses an experienced portfolio management and servicing team that monitors these factors on our behalf.
Our investments are reviewed on a quarterly basis, or more frequently as necessary, to assess whether there are any indicators that the value of our investments may be impaired or that carrying value may not be recoverable. In conducting these reviews, we consider macroeconomic factors, including real estate sector conditions, together with investment and market specific circumstances among other factors. To the extent an impairment has occurred, the loss will be measured as compared to the carrying amount of the investment. An allowance for a doubtful account for a tenant receivable is established based on a periodic review of aged receivables resulting from estimated losses due to the inability of tenants to make required rent and other payments contractually due. Additionally, we establish, on a current basis, allowance for future tenant credit losses on unbilled rents receivable based upon an evaluation of the collectability of such amounts.
Each of our debt investments is secured by CRE collateral and requires customized portfolio management and servicing strategies for dealing with potential credit situations. The complexity of each situation depends on many factors, including the number of properties, the type of property, macro and local market conditions impacting supply/demand, cash flow and the financial condition of our collateral and our borrowers’/tenants’ ability to further support the collateral. Further, many of our investments may be considered transitional in nature because the business plan is to re-position, re-develop or otherwise lease-up the property in order to improve the collateral. At the time of origination or acquisition, the underlying property revenues may not be sufficient to support debt service, lease payments or generate positive net operating income. The business plan may necessitate an interest or lease reserve or other reserves, whether through proceeds from our loans, borrowings, offering proceeds or otherwise, to support debt service or lease payments and capital expenditures during the implementation of the business plan. There may also be a requirement for the borrower, tenant, guarantor or us, to refill these reserves should they become deficient during the applicable period for any reason.
As of September 30, 2017, all of our debt investments were performing in accordance with the contractual terms of their governing documents in all material respects. However, there can be no assurance that our investments will continue to perform in accordance with the contractual terms of the governing documents or underwriting and we may, in the future, record loan loss reserves/asset impairment, as appropriate, if required.
Critical Accounting Policies
Our consolidated financial statements are prepared in accordance with accounting principles generally accepted in the United States, or U.S. GAAP, which requires the use of estimates and assumptions that involve the exercise of judgment and that affect the reported amounts of assets and liabilities at the date of the consolidated financial statements and the reported amounts of revenues and expenses during the reporting period. There have been no material changes to our critical accounting policies since the filing of our Annual Report on Form 10-K for the fiscal year ended December 31, 2016.
Recent Accounting Pronouncements
For recent accounting pronouncements, refer to Note 2, “Significant Accounting Policies” in our accompanying consolidated financial statements included in Part I Item 1. “Financial Statements.”
49
Results of Operations
Comparison of the Three Months Ended September 30, 2017 to 2016 (dollars in thousands):
Three Months Ended September 30, | Increase (Decrease) | |||||||||||||
2017 | 2016 | Amount | % | |||||||||||
Net interest income | ||||||||||||||
Interest income | $ | 18,127 | $ | 15,126 | $ | 3,001 | 19.8 | % | ||||||
Interest expense | (5,653 | ) | (3,820 | ) | 1,833 | (48.0 | )% | |||||||
Net interest income | 12,474 | 11,306 | 1,168 | 10.3 | % | |||||||||
Property and other revenues | ||||||||||||||
Rental and other income | 11,093 | 10,973 | 120 | 1.1 | % | |||||||||
Total property and other revenues | 11,093 | 10,973 | 120 | 1.1 | % | |||||||||
Expenses | ||||||||||||||
Asset management and other fees - related party | 5,427 | 4,248 | 1,179 | 27.8 | % | |||||||||
Mortgage notes interest expense | 3,644 | 3,490 | 154 | 4.4 | % | |||||||||
Transaction costs | 3,636 | 313 | 3,323 | 1,061.7 | % | |||||||||
Property operating expenses | 3,243 | 3,261 | (18 | ) | (0.6 | )% | ||||||||
General and administrative expenses | 3,456 | 3,485 | (29 | ) | (0.8 | )% | ||||||||
Depreciation and amortization | 4,713 | 4,695 | 18 | 0.4 | % | |||||||||
Total expenses | 24,119 | 19,492 | 4,627 | 23.7 | % | |||||||||
Other income (loss) | ||||||||||||||
Unrealized gain (loss) on investments | (158 | ) | (39 | ) | (119 | ) | 305.1 | % | ||||||
Realized gain (loss) on investments | (650 | ) | (34 | ) | (616 | ) | 1,811.8 | % | ||||||
Income (loss) before equity in earnings (losses) of unconsolidated ventures and income tax benefit (expense) | (1,360 | ) | 2,714 | (4,074 | ) | 150.1 | % | |||||||
Equity in earnings (losses) of unconsolidated ventures | 7,326 | 2,438 | 4,888 | 200.5 | % | |||||||||
Income tax benefit (expense) | (646 | ) | (224 | ) | (422 | ) | 188.4 | % | ||||||
Net income (loss) | $ | 5,320 | $ | 4,928 | $ | 392 | 8.0 | % | ||||||
Net Interest Income
Net interest income is interest income generated on our interest-earning assets less interest expense on our related interest-bearing liabilities.
The following table presents the average balance of interest-earning assets less related interest-bearing liabilities, associated interest income and expense and corresponding yield earned and incurred for the three months ended September 30, 2017 and 2016. Amounts presented have been impacted by the timing of new investments and repayments during the period (dollars in thousands):
50
Three Months Ended September 30, | |||||||||||||||||||||
2017 | 2016 | ||||||||||||||||||||
Average Carrying Value(1) | Interest Income/ Expense(2) | WA Yield/ Financing Cost(3) | Average Carrying Value(1) | Interest Income/ Expense(2) | WA Yield/ Financing Cost(3) | ||||||||||||||||
Interest-earning assets: | |||||||||||||||||||||
CRE debt investments | $ | 873,891 | $ | 15,848 | 7.25 | % | $ | 775,610 | $ | 13,051 | 6.73 | % | |||||||||
CRE securities investments | 94,689 | 2,129 | 8.99 | % | 66,013 | 1,973 | 11.96 | % | |||||||||||||
968,580 | 17,977 | 7.42 | % | 841,623 | 15,024 | 7.14 | % | ||||||||||||||
Interest-bearing liabilities: | |||||||||||||||||||||
Credit facilities | 345,931 | 3,533 | 4.09 | % | 408,936 | 3,458 | 3.38 | % | |||||||||||||
Securitization bonds payable | 153,257 | 1,681 | 4.39 | % | — | — | — | ||||||||||||||
Other notes payable | 39,949 | 439 | 4.40 | % | 39,868 | 362 | 3.63 | % | |||||||||||||
539,137 | 5,653 | 4.19 | % | 448,804 | 3,820 | 3.40 | % | ||||||||||||||
Other interest income(4) | 150 | 102 | |||||||||||||||||||
Net interest income | $ | 12,474 | $ | 11,306 | |||||||||||||||||
_______________________________________
(1) | Based on amortized cost for CRE debt and securities investments and principal amount for credit facilities, other notes payable, and securitization bonds payable. All amounts are calculated based on quarterly averages. |
(2) | Includes the effect of amortization of premium or accretion of discount and deferred fees. |
(3) | Calculated as annualized interest income or expense divided by average carrying value. |
(4) | Primarily interest income earned on money market funds. |
Interest income increased by $3.0 million to $18.1 million during the three months ended September 30, 2017 as compared to the three months ended September 30, 2016 as a result of a $127.0 million increase in average carrying value of interest-earning assets as well as rising LIBOR rates.
Interest expense increased by $1.8 million to $5.7 million primarily as a result of an overall higher average carrying value of interest-bearing liabilities as well as rising LIBOR rates.
Property and Other Revenues
Rental and Other Income
Rental and other income remained consistent for the three months ended September 30, 2017 as compared to the three months ended September 30, 2016.
Expenses
Asset Management and Other Fees - Related Party
Asset management and other fees increased by $1.2 million to $5.4 million as a result of a higher level of invested assets during the three months ended September 30, 2017 as compared to three months ended September 30, 2016.
Mortgage Notes Interest Expense
Mortgage notes interest expense increased by $0.2 million to $3.6 million as a result of rising LIBOR rates and additional draws on the mortgage note for our multi-tenant office portfolio.
Transaction Costs
Transaction costs represent costs such as professional fees associated with new investments and transactions. Transaction costs increased by $3.3 million for the three months ended September 30, 2017 as compared to the three months ended September 30, 2016 primarily as a result of costs associated with the Combination.
Property Operating Expenses
Property operating expenses remained consistent for the three months ended September 30, 2017 as compared to the three months ended September 30, 2016.
General and Administrative Expenses
General and administrative expenses are incurred at the corporate level and include auditing and professional fees, director fees and other costs associated with operating our business which are primarily paid by our Advisor on our behalf in accordance with our advisory agreement. Reimbursements to our Advisor are limited in any given period based on a calculation further detailed
51
in “Related Party Arrangements.” General and administrative expenses remained consistent for the three months ended September 30, 2017 as compared to the three months ended September 30, 2016.
Depreciation and Amortization
Depreciation and amortization remained consistent for the three months ended September 30, 2017 as compared to the three months ended September 30, 2016.
Unrealized Gain (Loss) on Investments
During the three months ended September 30, 2017 and 2016, we recorded unrealized losses of $0.2 million and less than $0.1 million, respectively, related to our PE Investments.
Realized Gain (Loss) on Investments
During the three months ended September 30, 2017 and 2016, we recorded realized losses of $0.7 million and less than $0.1 million, respectively, related to our PE Investments.
Equity in Earnings (Losses) of Unconsolidated Ventures
Equity in earnings (losses) of unconsolidated ventures increased by $4.9 million to $7.3 million attributable to earnings from PE Investment III acquired in September 2016 and an investment in a mezzanine loan held through a joint venture with an affiliate of our Sponsor purchased in July 2017.
Income Tax Benefit (Expense)
For the three months ended September 30, 2017 and 2016, income tax expense of $0.6 million and $0.2 million, respectively, was recorded related to earnings from PE Investments I and III acquired in March 2015 and September 2016, respectively.
52
Comparison of the Nine Months Ended September 30, 2017 to 2016 (dollars in thousands):
Nine Months Ended September 30, | Increase (Decrease) | |||||||||||||
2017 | 2016 | Amount | % | |||||||||||
Net interest income | ||||||||||||||
Interest income | $ | 52,873 | $ | 46,033 | $ | 6,840 | 14.9 | % | ||||||
Interest expense | (15,904 | ) | (11,249 | ) | 4,655 | (41.4 | )% | |||||||
Net interest income | 36,969 | 34,784 | 2,185 | 6.3 | % | |||||||||
Property and other revenues | ||||||||||||||
Rental and other income | 32,624 | 32,229 | 395 | 1.2 | % | |||||||||
Total property and other revenues | 32,624 | 32,229 | 395 | 1.2 | % | |||||||||
Expenses | ||||||||||||||
Asset management and other fees - related party | 16,164 | 14,966 | 1,198 | 8.0 | % | |||||||||
Mortgage notes interest expense | 10,648 | 10,257 | 391 | 3.8 | % | |||||||||
Transaction costs | 4,496 | 1,659 | 2,837 | 171.0 | % | |||||||||
Property operating expenses | 9,534 | 10,247 | (713 | ) | (7.0 | )% | ||||||||
General and administrative expenses | 10,618 | 6,728 | 3,890 | 57.8 | % | |||||||||
Depreciation and amortization | 14,174 | 15,465 | (1,291 | ) | (8.3 | )% | ||||||||
Total expenses | 65,634 | 59,322 | 6,312 | 10.6 | % | |||||||||
Other income (loss) | ||||||||||||||
Unrealized gain (loss) on investments | (604 | ) | (39 | ) | (565 | ) | 1,448.7 | % | ||||||
Realized gain (loss) on investments | (650 | ) | (34 | ) | (616 | ) | 1,811.8 | % | ||||||
Income (loss) before equity in earnings (losses) of unconsolidated ventures and income tax benefit (expense) | 2,705 | 7,618 | (4,913 | ) | (64.5 | )% | ||||||||
Equity in earnings (losses) of unconsolidated ventures | 25,272 | 4,993 | 20,279 | 406.1 | % | |||||||||
Income tax benefit (expense) | (4,200 | ) | (446 | ) | (3,754 | ) | 841.7 | % | ||||||
Net income (loss) | $ | 23,777 | $ | 12,165 | $ | 11,612 | 95.5 | % | ||||||
Net Interest Income
Net interest income is interest income generated on our interest-earning assets less interest expense on our related interest-bearing liabilities.
The following table presents the average balance of interest-earning assets less related interest-bearing liabilities, associated interest income and expense and corresponding yield earned and incurred for the nine months ended September 30, 2017 and 2016. Amounts presented have been impacted by the timing of new investments and repayments during the period (dollars in thousands):
53
Nine Months Ended September 30, | |||||||||||||||||||||
2017 | 2016 | ||||||||||||||||||||
Average Carrying Value(1) | Interest Income/ Expense(2) | WA Yield/ Financing Cost(3) | Average Carrying Value(1) | Interest Income/ Expense(2) | WA Yield/ Financing Cost(3) | ||||||||||||||||
Interest-earning assets: | |||||||||||||||||||||
CRE debt investments | $ | 869,720 | $ | 46,547 | 7.14 | % | $ | 797,917 | $ | 42,339 | 7.07 | % | |||||||||
CRE securities investments | 92,070 | 5,895 | 8.54 | % | 53,995 | 3,588 | 8.86 | % | |||||||||||||
961,790 | 52,442 | 7.27 | % | 851,912 | 45,927 | 7.19 | % | ||||||||||||||
Interest-bearing liabilities: | |||||||||||||||||||||
Credit facilities | 314,495 | 9,287 | 3.94 | % | 422,144 | 10,182 | 3.22 | % | |||||||||||||
Securitization bonds payable | 172,084 | 5,383 | 4.17 | % | — | — | — | ||||||||||||||
Other notes payable | 39,825 | 1,234 | 4.13 | % | 39,868 | 1,067 | 3.57 | % | |||||||||||||
526,404 | 15,904 | 4.03 | % | 462,012 | 11,249 | 3.25 | % | ||||||||||||||
Other interest income(4) | 431 | 106 | |||||||||||||||||||
Net interest income | $ | 36,969 | $ | 34,784 | |||||||||||||||||
______________________________________
(1) | Based on amortized cost for CRE debt and securities investments and principal amount for credit facilities, other notes payable, and securitization bonds payable. All amounts are calculated based on quarterly averages. |
(2) | Includes the effect of amortization of premium or accretion of discount and deferred fees. |
(3) | Calculated as annualized interest income or expense divided by average carrying value. |
(4) | Primarily interest income earned on money market funds. |
Interest income increased by $6.8 million to $52.9 million during the nine months ended September 30, 2017 as compared to the nine months ended September 30, 2016 as a result of a $109.9 million increase in average carrying value of interest-earning assets as well as rising LIBOR rates.
Interest expense increased by $4.7 million to $15.9 million primarily as a result of an overall higher average carrying value of interest-bearing liabilities as well as rising LIBOR rates.
Property and Other Revenues
Rental and Other Income
Rental and other income increased by $0.4 million to $32.6 million as a result of tenant activity at our real estate investment portfolio.
Expenses
Asset Management and Other Fees - Related Party
Asset management and other fees increased by $1.2 million to $16.2 million for the nine months ended September 30, 2017 as a result of a higher level of invested assets during the nine months ended September 30, 2017 as compared to the nine months ended September 30, 2016. This increase was offset by disposition fees paid to our Advisor during the nine months ended September 30, 2016 related to the sale of CRE debt investments. Similar disposition fees were not incurred during the nine months ended September 30, 2017.
Mortgage Notes Interest Expense
Mortgage notes interest expense increased by $0.4 million to $10.6 million as a result of rising LIBOR rates and additional draws on the mortgage note for our multi-tenant office portfolio.
Transaction Costs
Transaction costs represent costs such as professional fees associated with new investments and transactions. Transaction costs increased by $2.8 million for the nine months ended September 30, 2017 as compared to the nine months ended September 30, 2016 primarily as a result of costs associated with the Combination.
Property Operating Expenses
Property operating expenses decreased by $0.7 million to $9.5 million as a result of lower operating expenses incurred at our industrial portfolio for the nine months ended September 30, 2017 as compared to the nine months ended September 30, 2016.
54
General and Administrative Expenses
General and administrative expenses are incurred at the corporate level and include auditing and professional fees, director fees and other costs associated with operating our business which are primarily paid by our Advisor on our behalf in accordance with our advisory agreement. Reimbursements to our Advisor are limited in any given period based on a calculation further detailed in Related Party Arrangements. General and administrative expenses increased by $3.9 million to $10.6 million primarily as a result of a higher level of average invested assets during the nine months ended September 30, 2017 as compared to the nine months ended September 30, 2016. The increase was partially offset by disposition fees paid to our Advisor for the nine months ended September 30, 2016 related to the sale of CRE debt investments, which are included in the calculation for determining the limit of operating expense available for reimbursement. Similar disposition fees were not incurred during the nine months ended September 30, 2017.
Depreciation and Amortization
Depreciation and amortization decreased by $1.3 million to $14.2 million as a result of in-place lease intangible assets fully amortizing in June 2016.
Unrealized Gain (Loss) on Investments
During the nine months ended September 30, 2017 and 2016, we recorded unrealized losses of $0.6 million and less than $0.1 million, respectively, related to our PE Investments.
Realized Gain (Loss) on Investments
During the nine months ended September 30, 2017 and 2016, we recorded realized losses of $0.7 million and less than $0.1 million, respectively, related to our PE Investments.
Equity in Earnings (Losses) of Unconsolidated Ventures
Equity in earnings (losses) of unconsolidated ventures increased by $20.3 million to $25.3 million attributable to earnings from PE Investment III acquired in September 2016 and an investment in a mezzanine loan held through a joint venture with an affiliate of our Sponsor purchased in July 2017.
Income Tax Benefit (Expense)
For the nine months ended September 30, 2017 and 2016, income tax expense of $4.2 million and $0.4 million, respectively, was recorded related to earnings from PE Investments I and III acquired in March 2015 and September 2016, respectively.
Liquidity and Capital Resources
We require capital to fund our investment activities, operating expenses and to make distributions. Subsequent to the close of our Primary Offering, our capital sources may include net proceeds from asset repayments and sales, securitization financing transactions, borrowings under our Credit Facilities, mortgage notes and other term borrowings. As of November 8, 2017, current available cash has been committed to existing investments.
Our charter limits us from incurring borrowings that would exceed 300.0% of our net assets. We cannot exceed this limit unless any excess in borrowing over such level is approved by a majority of our independent directors. We would need to disclose any such approval to our stockholders in our next quarterly report along with the justification for such excess. An approximation of this leverage calculation, excluding indirect leverage held through our unconsolidated joint venture investments, is 75.0% of our assets, other than intangibles, before deducting loan loss reserves, other non-cash reserves and depreciation and as of September 30, 2017, our leverage was 47.1%.
From inception through November 8, 2017, we have raised total gross proceeds of $1.2 billion. We are no longer raising capital from our Primary Offering or, unless otherwise reinstated, our DRP and we have invested or committed to invest a substantial majority of the net proceeds from our Offering. As such, we do not expect significant new investment activity. However, as investments are repaid or sold, we expect that those proceeds will be reinvested. Our inability to invest these proceeds could reduce our net income and limit our ability to make distributions. Further, we have certain fixed direct and indirect operating expenses, including certain expenses as a publicly registered REIT. We expect our net income from operations will be sufficient to cover such expenses.
In addition to making investments in accordance with our investment objectives, we use or have used our capital resources to make certain payments to NS Real Estate Income Advisor II, LLC, or our Prior Advisor, our Advisor and our Dealer Manager. During our organization and offering stage, these payments included payments to our Dealer Manager for selling commissions, dealer manager fees, and distribution fees and payments to our Advisor, Prior Advisor or their affiliates, as applicable, for
55
reimbursement of certain organization and offering costs. However, we will not be obligated to reimburse our Advisor, or its affiliates, as applicable, to the extent that the aggregate of selling commissions, dealer manager fees, distribution fees and other organization and offering costs incurred by us exceed 15.0% of gross proceeds from our Offering. During our acquisition and development stage, we expect to make payments to our Advisor, or its affiliates, as applicable, in connection with the selection and origination or acquisition of investments, the management of our assets and costs incurred by our Advisor in providing services to us. On June 30, 2014, we entered into a new advisory agreement with our Advisor, on terms substantially similar to those set forth in our prior advisory agreement with our Prior Advisor, which has a one-year term but may be renewed for an unlimited number of successive one-year periods upon the mutual consent of our Advisor and our board of directors, including a majority of our independent directors. We renewed our advisory agreement with our Advisor on June 30, 2017 for an additional one-year term, with terms identical to those in effect through June 30, 2017.
Securitization Financing Transactions
In November 2016, we entered into a $284.2 million securitization financing transaction, or Securitization 2016-1. Securitization 2016-1 was collateralized by a pool of 10 CRE debt investments with an aggregate principal balance of $254.7 million primarily originated by us and three senior participations with an aggregate principal balance of $29.5 million originated by NorthStar Income, a company managed by an affiliate of our Sponsor. A total of $194.0 million of permanent, non-recourse, non-mark-to-market investment-grade securitization bonds were issued, representing an advance rate of 68.3%.
An affiliate of NorthStar Income retained $14.9 million of junior participations in the collateral it contributed. As a result of U.S. GAAP requirements for transfers of financial assets, the senior participations are recorded as Loan collateral receivable, related party, on our consolidated balance sheets. Refer to Note 2, “Summary of Significant Accounting Policies” in our accompanying consolidated financial statements for additional information. An affiliate of our Sponsor was appointed special servicer of Securitization 2016-1.
Securitization 2016-1 provides permanent, non-recourse, non-mark-to market financing for a portion of our CRE debt investments that were generally initially financed on our Term Loan Facilities. In the future, we expect to execute similar transactions to finance our newly-originated debt investments that might initially be financed on our Term Loan Facilities, although there is no assurance that will be the case. As of November 8, 2017, we had $80.8 million of securitization bonds issued and outstanding.
Credit Facilities
Our credit facilities include three secured Term Loan Facilities and three secured CMBS Credit Facilities.
Our Term Loan Facilities provide an aggregate principal amount of up to $650.0 million to finance the origination of first mortgage loans and senior loan participations secured by CRE. The interest rates and advance rates depend on asset type and characteristics. Maturity dates of our Term Loan Facilities range from July 2018 to June 2019 and have extensions available at our option with maturity dates ranging from July 2019 to June 2020, subject to the satisfaction of certain customary conditions.
In July 2017, we exercised the third of four one-year extensions for the Deutsche Bank Term Loan Facility.
In July 2016, we amended the terms of the Morgan Stanley Term Loan Facility, increasing the total potential borrowing capacity under the Morgan Stanley Term Loan Facility from $200.0 million to $300.0 million and, subject to certain conditions precedent, extending the initial maturity of the Morgan Stanley Term Loan Facility by twelve months to June 2019. All other terms governing the Morgan Stanley Term Loan Facility remain substantially the same.
In October 2016, we amended the terms of the Citibank Term Loan Facility, increasing the total potential borrowing capacity under the Citibank Term Loan Facility from $100.0 million to $150.0 million and, subject to certain conditions precedent, extending the initial maturity of the Citibank Term Loan Facility by two years to October 2018. All other terms governing the Citibank Term Loan Facility remain substantially the same.
Our Term Loan Facilities contain representations, warranties, covenants, conditions precedent to funding, events of default and indemnities that are customary for agreements of this type. We are currently in compliance with all of our financial covenants under our Term Loan Facilities. As of November 8, 2017, we had up to $352.2 million of available borrowings under our Term Loan Facilities.
In October 2015, January 2016, and April 2016, we entered into master repurchase agreements, or the Merrill Lynch Facility, Citibank Facility, and JP Morgan Facility, respectively, and collectively the CMBS Credit Facilities, to finance CMBS investments. The CMBS Credit Facilities are on a recourse basis and contain representations, warranties, covenants, conditions precedent to funding, events of default and indemnities that are customary for agreements of this type. The advance rates and maturity dates of our CMBS Credit Facilities depend on asset type.
56
Cash Flows
The following table presents a summary of our consolidated statements of cash flows for the nine months ended September 30, 2017 and 2016 (dollars in thousands):
Nine Months Ended September 30, | ||||||||||||
Cash flow provided by (used in): | 2017 | 2016 | Change | |||||||||
Operating activities | $ | 38,934 | $ | 23,058 | $ | 15,876 | ||||||
Investing activities | (14,095 | ) | (32,576 | ) | 18,481 | |||||||
Financing activities | (17,196 | ) | 98,797 | (115,993 | ) | |||||||
Net change in cash and cash equivalents | $ | 7,643 | $ | 89,279 | $ | (81,636 | ) | |||||
Nine Months Ended September 30, 2017 Compared to September 30, 2016
Operating Activities
Our cash flows from operating activities depends on numerous factors including the changes to net interest income and net operating income generated from our investments, distributions from unconsolidated ventures, fees paid to our Advisor for the management of our investments, transaction costs on new investments, and general and administrative expenses. Our net cash provided by operating activities increased by $15.9 million for the nine months ended September 30, 2017 compared to the nine months ended September 30, 2016, primarily as a result of increased invested assets generating higher net interest income and equity in earnings from unconsolidated ventures.
Investing Activities
Our cash flows from investing activities is generally used to fund debt investment originations and investment acquisitions, net of proceeds received from dispositions or repayments of real estate assets. Our net cash used in investing activities for the nine months ended September 30, 2017 was primarily a result of originating new CRE debt investments and purchasing an interest in an unconsolidated venture, partially offset by CRE debt repayments as well as distributions received from unconsolidated ventures. Cash flows provided by investing activities for the nine months ended September 30, 2016 was primarily a result of CRE debt sales and repayments, partially offset by originating new CRE debt investments and the purchase of real estate securities.
Financing Activities
Our cash flows from financing activities is principally impacted by our capital raising activities, net of distributions paid on common stock and borrowings credit facilities and mortgage notes payable. Our net cash used in financing activities for the nine months ended September 30, 2017 was primarily a result of the repayment of securitization bonds, distributions paid on common stock and redemption of stock, partially offset by additional borrowings from credit facilities. Our net cash provided by financing activities for the nine months ended September 30, 2016 was primarily a result of additional capital raised from our Primary Offering, which closed in November 2016, partially offset by net repayments of borrowings on investments.
Off-Balance Sheet Arrangements
As of September 30, 2017, we are not dependent on the use of any off-balance sheet financing arrangements for liquidity. We have made investments in unconsolidated ventures. Refer to Note 5, “Investments in Unconsolidated Ventures” in Item 1. “Financial Statements” for a discussion of such unconsolidated ventures in our consolidated financial statements. In each case, our exposure to loss is limited to the carrying value of our investment plus any unfunded commitments and our proportionate share of any obligations owed through joint investments.
Related Party Arrangements
Advisor
Subject to certain restrictions and limitations, our Advisor is responsible for managing our affairs on a day-to-day basis and for identifying, originating, acquiring and asset managing investments on our behalf. Our Advisor may delegate certain of its obligations to affiliated entities, which may be organized under the laws of the United States or foreign jurisdictions. References to our Advisor include our Advisor and any such affiliated entities. For such services, to the extent permitted by law and regulations, our Advisor receives fees and reimbursement from us. Pursuant to the advisory agreement, our Advisor may defer or waive fees in its discretion. Below is a description and table of the fees and reimbursements incurred to our Advisor.
In June 2017, our advisory agreement was renewed for an additional one-year term commencing on June 30, 2017, with terms identical to those in effect through June 30, 2017.
57
Fees to Advisor
Asset Management Fee
Our Advisor receives a monthly asset management fee equal to one-twelfth of 1.25% of the sum of the amount funded or allocated for CRE investments, including expenses and any financing attributable to such investments, less any principal received on debt and securities investments (or our proportionate share thereof in the case of an investment made through a joint venture).
Incentive Fee
Our Advisor is entitled to receive distributions equal to 15.0% of our net cash flows, whether from continuing operations, repayment of loans, disposition of assets or otherwise, but only after stockholders have received, in the aggregate, cumulative distributions equal to their invested capital plus a 7.0% cumulative, non-compounded annual pre-tax return on such invested capital.
Acquisition Fee
Our Advisor also receives fees for providing structuring, diligence, underwriting advice and related services in connection with real estate acquisitions equal to 1.0% of the amount funded or allocated by us to originate or acquire investments, including acquisition costs and any financing attributable to such investments (or our proportionate share thereof in the case of an investment made through a joint venture). A fee paid to our Advisor in connection with or related to the origination or acquisition of CRE debt investments is included in CRE debt investments, net on our consolidated balance sheets and is amortized to interest income over the life of the investment using the effective interest method. An acquisition fee incurred related to an equity investment will generally be expensed as incurred. A fee paid to our Advisor in connection with an acquisition of an equity or debt investment in an unconsolidated joint venture is included in investments in unconsolidated ventures on our consolidated balance sheets.
Disposition Fee
For substantial assistance in connection with the sale of investments and based on the services provided, as determined by our independent directors, our Advisor receives a disposition fee up to 1.0% of the contract sales price of each CRE investment sold. We do not pay a disposition fee upon the maturity, prepayment, workout, modification or extension of a CRE debt investment unless there is a corresponding fee paid by our borrower, in which case the disposition fee is the lesser of: (i) 1.0% of the principal amount of the CRE debt investment prior to such transaction; or (ii) the amount of the fee paid by our borrower in connection with such transaction. If we take ownership of a property as a result of a workout or foreclosure of a CRE debt investment, we will pay a disposition fee upon the sale of such property. A disposition fee from the sale of a CRE investment is generally expensed and included in asset management and other fees - related party in our consolidated statements of operations. A disposition fee for a CRE debt investment incurred in a transaction other than a sale is included in CRE debt investments, net on our consolidated balance sheets and is amortized to interest income over the life of the investment using the effective interest method.
Reimbursements to Advisor
Operating Costs
Our Advisor is entitled to receive reimbursement for direct and indirect operating costs incurred by our Advisor in connection with administrative services provided to us. Our Advisor allocates, in good faith, indirect costs to us related to our Advisor’s and its affiliates’ employees, occupancy and other general and administrative costs and expenses in accordance with the terms of, and subject to the limitations contained in, the advisory agreement with our Advisor. The indirect costs include our allocable share of our Advisor’s compensation and benefit costs associated with dedicated or partially dedicated personnel who spend all or a portion of their time managing our affairs, based upon the percentage of time devoted by such personnel to our affairs. The indirect costs also include rental and occupancy, technology, office supplies, travel and entertainment and other general and administrative costs and expenses. However, there is no reimbursement for personnel costs related to executive officers (although there may be reimbursement for certain executive officers of our Advisor) and other personnel involved in activities for which our Advisor receives an acquisition fee or a disposition fee. Our Advisor allocates these costs to us relative to its and its affiliates’ other managed companies in good faith and has reviewed the allocation with our board of directors, including its independent directors. Our Advisor will update the board of directors on a quarterly basis of any material changes to the expense allocation and will provide a detailed review to the board of directors, at least annually, and as otherwise requested by the board of directors. We reimburse our Advisor quarterly for operating costs (including the asset management fee) based on a calculation for the four preceding fiscal quarters not to exceed the greater of: (i) 2.0% of our average invested assets; or (ii) 25.0% of our net income determined without reduction for any additions to reserves for depreciation, loan losses or other similar non-cash reserves and excluding any gain from the sale of assets for that period. Notwithstanding the above, we may reimburse our Advisor for expenses in excess of this limitation if a majority of our independent directors determines that such excess expenses are justified based on unusual and non-recurring factors. We calculate the expense reimbursement quarterly based upon the trailing twelve-month period.
58
Organization and Offering Costs
Our Advisor was entitled to receive reimbursement for organization and offering costs paid on behalf of us in connection with our Offering. We were obligated to reimburse our Advisor for organization and offering costs to the extent the aggregate of selling commissions, dealer manager fees, distribution fees and other organization and offering costs do not exceed 15.0% of gross proceeds from our Offering. Our Advisor initially expected cumulative organization and offering costs, excluding selling commissions and dealer manager fees, would not exceed $15.0 million, or 1.0% of the total proceeds available to be raised from our Primary Offering. We incurred reimbursable organization and offering costs, excluding selling commissions and dealer manager fees, of $13.0 million, or 1.2% of the gross proceeds of $1.1 billion from the Primary Offering. Our independent directors did not determine that any of the organization and offering costs were unfair or commercially unreasonable to us.
Dealer Manager
Selling Commissions, Dealer Manager Fees, and Distribution Fees
As a result of the Primary Offering closing, effective November 9, 2016, we no longer pay the Dealer Manager selling commissions and dealer manager fees under a dealer manager agreement.
Pursuant to a dealer manager agreement, we pay our Dealer Manager an ongoing distribution fee of up to 1.0% annually of gross proceeds from the sale of Class T shares sold in our Primary Offering, all of which is available to be reallowed to participating broker-dealers. Our Dealer Manager will cease receiving distribution fees with respect to each Class T share upon the earliest to occur of the following: (i) a listing of our shares of common stock on a national securities exchange; (ii) such Class T share is no longer outstanding; (iii) our Dealer Manager’s determination that total underwriting compensation, with respect to all Class A shares and Class T shares would be in excess of 10.0% of the gross proceeds of our Primary Offering; or (iv) the end of the month in which total underwriting compensation, with respect to the Class T shares held by a stockholder within his or her particular account, would be in excess of 10.0% of the stockholder’s total gross investment amount at the time of purchase of the primary Class T shares held in such account.
During the nine months ended September 30, 2017, we recorded a present value adjustment to the estimated liability of distribution fees totaling $0.2 million. As of September 30, 2017, the estimated liability for the present value of the expected future distribution fees payable to the Dealer Manager, which is included in due to related party on our consolidated balance sheets, with an offset to additional paid-in capital, was $4.1 million. We began issuing Class T shares in October 2015 and during the second quarter of 2016, commenced recording the estimated liability for future distribution fees payable related to all outstanding Class T shares. As of December 31, 2016, the estimated liability was $5.0 million. No selling commissions, dealer manager fees, or distribution fees are paid for sales pursuant to our DRP or for shares that were sold pursuant to our distribution support agreement with our Sponsor, or our Distribution Support Agreement. Our Distribution Support Agreement expired in November 2016.
Summary of Fees and Reimbursements
The following table presents the fees and reimbursements incurred and paid to our Advisor and our Dealer Manager for the nine months ended September 30, 2017 and the amounts due to related party as of September 30, 2017 and December 31, 2016 (dollars in thousands):
Due to Related Party as of December 31, 2016 | Nine Months Ended September 30, 2017 | Due to Related Party as of September 30, 2017 | ||||||||||||||||
Type of Fee or Reimbursement | Financial Statement Location | Incurred | Paid | |||||||||||||||
Fees to Advisor Entities | ||||||||||||||||||
Asset management | Asset management and other fees - related party | $ | 17 | $ | 16,164 | $ | (14,381 | ) | $ | 1,800 | ||||||||
Acquisition(1) | Real estate debt investments, net / Investments in unconsolidated ventures / Asset management and other fees-related party | — | 2,386 | (2,386 | ) | — | ||||||||||||
Disposition(1) | Real estate debt investments, net / Asset management and other fees-related party | 85 | 1,674 | (1,759 | ) | — | ||||||||||||
Reimbursements to Advisor Entities | ||||||||||||||||||
Operating costs(2) | General and administrative expenses | 11 | 9,326 | (6,152 | ) | 3,185 | ||||||||||||
Offering | Cost of capital(3) | 272 | — | (272 | ) | — | ||||||||||||
Distribution Fees | Cost of capital(3) | 4,962 | 228 | (1,131 | ) | 4,059 | ||||||||||||
Total | $ | 5,347 | $ | 29,778 | $ | (26,081 | ) | $ | 9,044 | |||||||||
59
_______________________________
(1) | Acquisition/disposition fees incurred to our Advisor related to CRE debt investments are generally offset by origination/exit fees paid to us by borrowers if such fees are required from the borrower. Acquisition fees related to equity investments are included in asset management and other fees - related party in our consolidated statements of operations. From inception through September 30, 2017, our Advisor waived $3.7 million of acquisition fees related to CRE securities and PE Investments. |
(2) | As of September 30, 2017, our Advisor has incurred unreimbursed operating costs on our behalf of $13.8 million, that remain eligible to allocate to us. Pursuant to the Combination Agreement, immediately prior to the closing of the Combination, CLNC will, if necessary, declare a special distribution to an affiliate of our Sponsor in an amount that is intended to true up such affiliate for, among other things, the expected present value of the unreimbursed operating costs incurred by our Advisor on our behalf. |
(3) | Cost of capital is included in net proceeds from issuance of common stock in our consolidated statements of equity. |
Investment Activity
In September 2016, we completed the acquisition of a diversified portfolio of limited partnership or similar equity interests in real estate private equity funds, from NorthStar Realty, or PE Investment III. At acquisition, PE Investment III was comprised of interests in 41 funds managed by 20 institutional-quality sponsors and had an aggregate reported NAV of approximately $344.3 million as of March 31, 2016, or the Record Date. The funds hold interests in assets that are diversified geographically across 24 states and internationally and diversified by investment type, including mixed-use, multifamily, office and hotel properties.
We acquired PE Investment III at a price equal to 92.25% of the NAV as of the Record Date with $33.9 million paid at the closing (reflecting $34.3 million of net distributions due to us as of the closing date) and $204.7 million paid in December 2016. In addition, we assumed approximately $44.7 million of deferred purchase price obligations to third parties from whom NorthStar Realty had originally acquired certain of the fund interests within PE Investment III, which includes the proportionate share of an obligation owed through a joint investment within PE Investment III, totaling $5.6 million. As of September 30, 2017, $37.5 million in deferred purchase price obligations have been paid. We also agreed to indemnify NorthStar Realty in connection with NorthStar Realty’s continuing guarantee of the payment of such deferred obligations. The transaction was approved by our board of directors, including all of its independent directors, and supported by an independent third-party valuation of PE Investment III.
In September 2016, we originated a $98.4 million subordinate interest in an industrial portfolio sponsored and owned by an unaffiliated third party. In connection with the transaction, the third-party sponsor redeemed an interest in an industrial portfolio historically held by NorthStar Realty.
In November 2016, we entered into a $284.2 million securitization financing transaction. Securitization 2016-1 was collateralized by a pool of 10 CRE debt investments with a committed aggregate principal balance of $254.7 million primarily originated by us and three senior participations with a committed aggregate principal balance of $29.5 million originated by NorthStar Income, a company managed by an affiliate of our Sponsor. An affiliate of our Sponsor was appointed special servicer of Securitization 2016-1. The transaction was approved by our board of directors, including all of its independent directors.
In July 2017, we entered into a joint venture with an affiliate of our Sponsor to make a $60.0 million investment in a $180.0 million mezzanine loan which was originated by such affiliate of our Sponsor. Our interest in the joint venture is 50.0% and our interest in the underlying mezzanine loan is 33.3%. Our total commitment is $60.0 million. The transaction was approved by our board of directors, including all of its independent directors.
Recent Developments
Distributions
On November 8, 2017, our board of directors approved a daily cash distribution of $0.001917808 per share of Class A common stock and $0.001917808 per share of Class T common stock less the distribution fees that are payable with respect to such Class T common stock, for each of the three months ended March 31, 2018. Distributions are generally paid to stockholders on the first business day of the month following the month for which the distribution was accrued.
Inflation
Virtually all of our assets and liabilities are interest rate sensitive in nature. As a result, interest rates and other factors influence our performance significantly more than inflation does. A change in interest rates may correlate with the inflation rate.
Refer to Item 3. “Quantitative and Qualitative Disclosures About Market Risk” for additional details.
60
Non-GAAP Financial Measures
Funds from Operations and Modified Funds from Operations
We believe that FFO and MFFO, both of which are non-GAAP measures, are additional appropriate measures of the operating performance of a REIT and of us in particular. We compute FFO in accordance with the standards established by the National Association of Real Estate Investment Trusts, or NAREIT, as net income (loss) (computed in accordance with U.S. GAAP), excluding gains (losses) from sales of depreciable property, the cumulative effect of changes in accounting principles, real estate-related depreciation and amortization, impairment on depreciable property owned directly or indirectly and after adjustments for unconsolidated ventures.
Changes in the accounting and reporting rules under U.S. GAAP that have been put into effect since the establishment of NAREIT’s definition of FFO have prompted an increase in the non-cash and non-operating items included in FFO. For instance, the accounting treatment for acquisition fees related to business combinations has changed from being capitalized to being expensed. Additionally, publicly registered, non-traded REITs are typically different from traded REITs because they generally have a limited life followed by a liquidity event or other targeted exit strategy. Non-traded REITs typically have a significant amount of acquisition activity and are substantially more dynamic during their initial years of investment and operation as compared to later years when the proceeds from their initial public offering have been fully invested and when they may seek to implement a liquidity event or other exit strategy. However, it is likely that we will make investments past the acquisition and development stage, albeit at a substantially lower pace.
Acquisition fees paid to our Advisor in connection with the origination and acquisition of debt investments are amortized over the life of the investment as an adjustment to interest income under U.S. GAAP and are therefore included in the computation of net income (loss) and income (loss) before equity in earnings (losses) of unconsolidated ventures and income tax benefit (expense), both of which are performance measures under U.S. GAAP. We adjust MFFO for the amortization of acquisition fees in the period when such amortization is recognized under U.S. GAAP. Acquisition fees are paid in cash that would otherwise be available to distribute to our stockholders. In the event that proceeds from our Offering are not sufficient to fund the payment or reimbursement of acquisition fees and expenses to our Advisor, such fees would be paid from other sources, including new financing, operating cash flow, net proceeds from the sale of investments or from other cash flow. We believe that acquisition fees incurred by us negatively impact our operating performance during the period in which such investments are originated or acquired by reducing cash flow and therefore the potential distributions to our stockholders. However, in general, we earn origination fees for debt investments from our borrowers in an amount equal to the acquisition fees paid to our Advisor, and as a result, the impact of acquisition fees to our operating performance and cash flow would be minimal.
Acquisition fees and expenses paid to our Advisor and third parties in connection with the acquisition of equity investments are generally considered expenses and are included in the determination of net income (loss) and income (loss) before equity in earnings (losses) of unconsolidated ventures and income tax benefit (expense), both of which are performance measures under U.S. GAAP. Such fees and expenses will not be reimbursed by our Advisor or its affiliates and third parties, and therefore, if there are no further proceeds from the sale of shares of our common stock to fund future acquisition fees and expenses, such fees and expenses will need to be paid from either additional debt, operating earnings, cash flow or net proceeds from the sale of investments or properties. All paid and accrued acquisition fees and expenses will have negative effects on future distributions to stockholders and cash flow generated by us, unless earnings from operations or net sales proceeds from the disposition of other properties are generated to cover the purchase price of the property, these fees and expenses and other costs related to such property.
The origination and acquisition of debt investments and the corresponding acquisition fees paid to our Advisor (and any offsetting origination fees received from our borrowers) associated with such activity is a key operating feature of our business plan that results in generating income and cash flow in order to make distributions to our stockholders. Therefore, the exclusion for acquisition fees may be of limited value in calculating operating performance because acquisition fees affect our overall long-term operating performance and may be recurring in nature as part of net income (loss) and income (loss) before equity in earnings (losses) of unconsolidated ventures and income tax benefit (expense) over our life.
Due to certain of the unique features of publicly-registered, non-traded REITs, the Investment Program Association, or the IPA, an industry trade group, standardized a performance measure known as MFFO and recommends the use of MFFO for such REITs. Management believes MFFO is a useful performance measure to evaluate our business and further believes it is important to disclose MFFO in order to be consistent with the IPA recommendation and other non-traded REITs. MFFO that adjusts for items such as acquisition fees would only be comparable to non-traded REITs that have completed the majority of their acquisition activity and have other similar operating characteristics as us. Neither the SEC, nor any other regulatory body has approved the acceptability of the adjustments that we use to calculate MFFO. In the future, the SEC or another regulatory body may decide to standardize permitted adjustments across the non-listed REIT industry and we may need to adjust our calculation and characterization of MFFO.
61
MFFO is a metric used by management to evaluate our future operating performance once our organization and offering and acquisition and development stages are complete and is not intended to be used as a liquidity measure. Although management uses the MFFO metric to evaluate future operating performance, this metric excludes certain key operating items and other adjustments that may affect our overall operating performance. MFFO is not equivalent to net income (loss) as determined under U.S. GAAP. In addition, MFFO is not a useful measure in evaluating NAV since an impairment is taken into account in determining NAV but not in determining MFFO.
We define MFFO in accordance with the concepts established by the IPA and adjust for certain items, such as accretion of a discount and amortization of a premium on borrowings and related deferred financing costs, as such adjustments are comparable to adjustments for debt investments and will be helpful in assessing our operating performance. We also adjust MFFO for the non-recurring impact of the non-cash effect of deferred income tax benefits or expenses, as applicable, as such items are not indicative of our operating performance. Similarly, we adjust for the non-cash effect of unrealized gains or losses on unconsolidated ventures. Our computation of MFFO may not be comparable to other REITs that do not calculate MFFO using the same method. MFFO is calculated using FFO. FFO, as defined by NAREIT, is a computation made by analysts and investors to measure a real estate company’s operating performance. The IPA’s definition of MFFO excludes from FFO the following items:
• | acquisition fees and expenses; |
• | non-cash amounts related to straight-line rent and the amortization of above or below market and in-place intangible lease assets and liabilities (which are adjusted in order to reflect such payments from an accrual basis of accounting under U.S. GAAP to a cash basis of accounting); |
• | amortization of a premium and accretion of a discount on debt investments; |
• | non-recurring impairment of real estate-related investments that meet the specified criteria identified in the rules and regulations of the SEC; |
• | realized gains (losses) from the early extinguishment of debt; |
• | realized gains (losses) on the extinguishment or sales of hedges, foreign exchange, securities and other derivative holdings except where the trading of such instruments is a fundamental attribute of our business; |
• | unrealized gains (losses) from fair value adjustments on real estate securities, including CMBS and other securities, interest rate swaps and other derivatives not deemed hedges and foreign exchange holdings; |
• | unrealized gains (losses) from the consolidation from, or deconsolidation to, equity accounting; |
• | adjustments related to contingent purchase price obligations; and |
• | adjustments for consolidated and unconsolidated partnerships and joint ventures calculated to reflect MFFO on the same basis as above. |
Certain of the above adjustments are also made to reconcile net income (loss) to net cash provided by (used in) operating activities, such as for the amortization of a premium and accretion of a discount on debt and securities investments, amortization of fees, any unrealized gains (losses) on derivatives, securities or other investments, as well as other adjustments.
MFFO excludes non-recurring impairment of real estate-related investments. We assess the credit quality of our investments and adequacy of reserves/impairment on a quarterly basis, or more frequently as necessary. Significant judgment is required in this analysis. With respect to debt investments, we consider the estimated net recoverable value of the loan as well as other factors, including but not limited to the fair value of any collateral, the amount and the status of any senior debt, the prospects for the borrower and the competitive situation of the region where the borrower does business. Fair value is typically estimated based on discounting expected future cash flow of the underlying collateral taking into consideration the discount rate, capitalization rate, occupancy, creditworthiness of major tenants and many other factors. This requires significant judgment and because it is based on projections of future economic events, which are inherently subjective, the amount ultimately realized may differ materially from the carrying value as of the balance sheet date. If the estimated fair value of the underlying collateral for the debt investment is less than its net carrying value, a loan loss reserve is recorded with a corresponding charge to provision for loan losses. With respect to a real estate investment, a property’s value is considered impaired if a triggering event is identified and our estimate of the aggregate future undiscounted cash flow to be generated by the property is less than the carrying value of the property. The value of our investments may be impaired and their carrying values may not be recoverable due to our limited life. Investors should note that while impairment charges are excluded from the calculation of MFFO, investors are cautioned that due to the fact that impairments are based on estimated future undiscounted cash flow and the relatively limited term of a non-traded REIT’s anticipated operations, it could be difficult to recover any impairment charges through operational net revenues or cash flow prior to any liquidity event.
62
We believe that MFFO is a useful non-GAAP measure for non-traded REITs. It is helpful to management and stockholders in assessing our future operating performance once our organization and offering and acquisition and development stages are complete, because it eliminates from net income non-cash fair value adjustments on our real estate securities and acquisition fees and expenses that are incurred as part of our investment activities. However, MFFO may not be a useful measure of our operating performance or as a comparable measure to other typical non-traded REITs if we do not continue to operate in a similar manner to other non-traded REITs, including if we were to extend our acquisition and development stage or if we determined not to pursue an exit strategy.
However, MFFO does have certain limitations. For instance, the effect of any amortization or accretion on debt investments originated or acquired at a premium or discount, respectively, is not reported in MFFO. In addition, realized gains (losses) from acquisitions and dispositions and other adjustments listed above are not reported in MFFO, even though such realized gains (losses) and other adjustments could affect our operating performance and cash available for distribution. Stockholders should note that any cash gains generated from the sale of investments would generally be used to fund new investments. Any mark-to-market or fair value adjustments may be based on many factors, including current operational or individual property issues or general market or overall industry conditions.
We typically purchase CMBS at a premium or discount to par value, and in accordance with U.S. GAAP, record the amortization of premium/accretion of the discount to interest income, or the CMBS effective yield. We believe that reporting the CMBS effective yield in MFFO provides better insight to the expected contractual cash flows and is more consistent with our review of operating performance.
Neither FFO nor MFFO is equivalent to net income (loss) or cash flow provided by operating activities determined in accordance with U.S. GAAP and should not be construed to be more relevant or accurate than the U.S. GAAP methodology in evaluating our operating performance. Neither FFO nor MFFO is necessarily indicative of cash flow available to fund our cash needs including our ability to make distributions to our stockholders. FFO and MFFO do not represent amounts available for management’s discretionary use because of needed capital replacement or expansion, debt service obligations or other commitments or uncertainties. Furthermore, neither FFO nor MFFO should be considered as an alternative to net income (loss) as an indicator of our operating performance.
The following table presents a reconciliation of net income (loss) attributable to common stockholders to FFO and MFFO attributable to common stockholders (dollars in thousands):
Three Months Ended September 30, | Nine Months Ended September 30, | ||||||||||||||
2017 | 2016 | 2017 | 2016 | ||||||||||||
Funds from operations: | |||||||||||||||
Net income (loss) attributable to NorthStar Real Estate Income II, Inc. common stockholders | $ | 5,288 | $ | 4,895 | $ | 23,676 | $ | 12,088 | |||||||
Adjustments: | |||||||||||||||
Depreciation and amortization | 4,713 | 4,695 | 14,174 | 15,465 | |||||||||||
Depreciation and amortization related to non-controlling interests | (59 | ) | (52 | ) | (178 | ) | (161 | ) | |||||||
FFO attributable to NorthStar Real Estate Income II, Inc. common stockholders | $ | 9,942 | $ | 9,538 | $ | 37,672 | $ | 27,392 | |||||||
Modified funds from operations: | |||||||||||||||
FFO attributable to NorthStar Real Estate Income II, Inc. common stockholders | $ | 9,942 | $ | 9,538 | $ | 37,672 | $ | 27,392 | |||||||
Adjustments: | |||||||||||||||
Amortization of premiums, discounts and fees on investments and borrowings, net | 988 | 1,157 | 3,484 | 2,769 | |||||||||||
Acquisition fees and transaction costs on investments | 3,636 | 313 | 4,496 | 1,659 | |||||||||||
Straight line rental income | (284 | ) | (620 | ) | (825 | ) | (1,109 | ) | |||||||
Amortization of capitalized above/below market leases | 64 | 112 | 214 | 358 | |||||||||||
Other non-cash adjustments | — | — | — | (128 | ) | ||||||||||
Unrealized (gain) loss on investments | 158 | 39 | 604 | 39 | |||||||||||
Realized (gain) loss on investments | 650 | 34 | 650 | 34 | |||||||||||
Adjustments related to non-controlling interests | (11 | ) | (9 | ) | (16 | ) | (28 | ) | |||||||
MFFO attributable to NorthStar Real Estate Income II, Inc. common stockholders | $ | 15,143 | $ | 10,564 | $ | 46,279 | $ | 30,986 | |||||||
63
Distributions Declared and Paid
We generally pay distributions on a monthly basis based on daily record dates. From the commencement of our operations on September 18, 2013 through September 30, 2017, we paid distributions at an annualized distribution amount of $0.70, less distribution fees on our Class T shares. Distributions are generally paid to stockholders on the first business day of the month following the month for which the distribution has accrued.
The following table presents distributions declared for the nine months ended September 30, 2017 and year ended December 31, 2016 (dollars in thousands):
Nine Months Ended September 30, 2017 | Year Ended December 31, 2016 | |||||||||||||
Distributions(1)(2) | ||||||||||||||
Cash | $ | 35,421 | $ | 38,081 | ||||||||||
DRP | 23,377 | 32,774 | ||||||||||||
Total | $ | 58,798 | $ | 70,855 | ||||||||||
Sources of Distributions(1) | ||||||||||||||
Funds from Operations(3) | $ | 37,672 | 64.0 | % | $ | 42,866 | 60.5 | % | ||||||
Offering Proceeds - Distribution support | — | — | % | 1,774 | 2.5 | % | ||||||||
Offering proceeds | 21,126 | 36.0 | % | 26,215 | 37.0 | % | ||||||||
Total | $ | 58,798 | 100.0 | % | $ | 70,855 | 100.0 | % | ||||||
Cash Flow Provided by (Used in) Operations | $ | 38,934 | $ | 34,591 | ||||||||||
_______________________________________
(1) | Represents distributions declared for such period, even though such distributions are actually paid to stockholders the month following such period. |
(2) | On August 9, 2017, our board of directors approved a daily cash distribution of $0.001917808 per share of Class A common stock and $0.001917808 per share of Class T common stock less the distribution fees that are payable with respect to such Class T common stock, for each of the three months ended December 31, 2017. |
(3) | For the period from the date of our first investment on September 18, 2013 through September 30, 2017, we declared $183.7 million in distributions, of which 49.0% was paid from FFO, 49.0% was paid from offering proceeds and 2.0% was paid from distribution support proceeds. Cumulative FFO for the period from September 18, 2013 through September 30, 2017 was $90.1 million. |
Distributions in excess of our cash flow provided by operations were paid using Offering proceeds, including from the purchase of additional shares under the Distribution Support Agreement, which terminated upon completion of the Primary Offering. Over the long-term, we expect that our distributions will be paid entirely from cash flow provided by operations. However, our operating performance cannot be accurately predicted and may deteriorate in the future due to numerous factors, including our ability to raise and invest capital at favorable yields, the financial performance of our investments in the current real estate and financial environment, the type and mix of our investments and accounting of our investments in accordance with U.S. GAAP. Future distributions declared and paid may exceed cash flow provided by operations.
As of November 8, 2017, our portfolio generated a 11.6% current yield on invested equity before expenses and excluding uninvested cash. There is no assurance we will realize the expected returns on invested equity over the term of these investments. Our actual return on invested equity could vary significantly from our expectations.
64
Item 3. Quantitative and Qualitative Disclosures About Market Risk
We are primarily subject to interest rate risk, credit spread risk and credit risk. These risks are dependent on various factors beyond our control, including monetary and fiscal policies, domestic and international economic conditions and political considerations. Our market risk sensitive assets, liabilities and related derivative positions are held for investment and not for trading purposes.
Interest Rate Risk
We may be subject to interest rate changes as a result of long-term borrowings used to acquire real estate equity investments and may also be exposed to changes in net interest income of our real estate debt investments, which is the difference between the income earned and the interest expense incurred in connection with our borrowings and derivatives.
Our interest rate risk management objectives are to limit the impact of interest rate changes on earnings, prepayment penalties and cash flows and to lower overall borrowing costs by borrowing primarily at fixed rates or variable rates with the lowest margins available and by evaluating hedging opportunities.
Our CRE debt and securities investments bear interest at either a floating or fixed-rate. The interest rate on our floating-rate assets is a fixed spread over an index such as LIBOR and typically reprices every 30 days based on LIBOR in effect at the time. Currently, most of our floating-rate CRE debt investments have a fixed minimum LIBOR floor. We will not benefit from an increase in LIBOR until it is in excess of the LIBOR floors. Given the frequent and periodic repricing of our floating-rate assets, changes in benchmark interest rates are unlikely to materially affect the value of our floating-rate portfolio. Changes in short-term rates will, however, affect income from our investments.
A change in interest rates could affect the value of our fixed-rate CRE debt and securities investments. For instance, an increase in interest rates would result in a higher required yield on investments, which would decrease the value on existing fixed-rate investments in order to adjust their yields to current market levels.
Our general financing strategy has focused on the use of “match-funded” structures. This means that we seek to align the maturities of our liabilities with the maturities on our assets as closely as possible in order to manage the risks of being forced to refinance our liabilities prior to the maturities of our assets. In addition, we seek to match interest rates on our assets with like-kind borrowings, so fixed-rate investments are financed with fixed-rate borrowings and floating-rate assets are financed with floating-rate borrowings, directly or indirectly, through the use of interest rate swaps, caps and other financial instruments or through a combination of these strategies. We are subject to interest rate risk because, on certain investments, we maintain a net floating-rate asset position, and therefore our income will increase with increases in interest rates and decrease with declines in interest rates. As of September 30, 2017, 83.8% of the outstanding principal of our debt investments were floating rate investments and 70.4% of our total borrowings were floating rate liabilities. Of the floating rate liabilities, 76.4% related to CRE debt investments financing, 16.0% related to a CRE equity investment mortgage note payable, and 7.6% related to CRE securities financing. As of September 30, 2017, a hypothetical 100 basis point increase in interest rates (including the effect of the interest rate floor) would increase income by $1.4 million annually, net of interest expense.
Credit Spread Risk
The value of our fixed and floating-rate investments also changes with market credit spreads. This means that when market-demanded risk premium, or credit spread, increases, the value of our fixed and floating-rate assets decrease and vice versa. Fixed-rate assets are valued based on a market credit spread over the rate payable on fixed-rate U.S. Treasury of like maturity. This means that their value is dependent on the yield demanded on such assets by the market, based on their credit relative to U.S. Treasuries. The floating-rate CRE debt and securities investments are valued based on a market credit spread over the applicable LIBOR. Demand for a higher yield on investments results in higher or “wider” spread over the benchmark rate (usually the applicable U.S. Treasury yield) to value these assets. Under these conditions, the value of our portfolio should decrease. Conversely, if the spread used to value these assets were to decrease or “tighten,” the value of these assets should increase.
Credit Risk
Credit risk in our CRE debt and securities investments relates to each individual borrower’s ability to make required interest and principal payments on scheduled due dates. We seek to manage credit risk through our Advisor’s comprehensive credit analysis prior to making an investment, actively monitoring our portfolio and the underlying credit quality, including subordination and diversification of our portfolio. Our analysis is based on a broad range of real estate, financial, economic and borrower-related factors which we believe are critical to the evaluation of credit risk inherent in a transaction. For the nine months ended September 30, 2017, one debt investment contributed more than 10% of interest income.
We are subject to the credit risk of the borrower when we make CRE debt and securities investments. We undertake a rigorous credit evaluation of each borrower prior to making an investment. This analysis includes an extensive due diligence investigation of the borrower’s creditworthiness and business as well as an assessment of the strategic importance of the underlying real estate to the borrower’s core business operations.
65
Item 4. Controls and Procedures
Disclosure Controls and Procedures
As of the end of the period covered by this report, the Company’s management conducted an evaluation, as required under Rules 13a-15(b) and 15d-15(b) under the Securities Exchange Act of 1934, as amended, or Exchange Act, under the supervision and with the participation of the Company’s Chief Executive Officer and Chief Financial Officer, of the effectiveness of the Company’s disclosure controls and procedures (as defined in Rules 13a-15(e) and 15d-15(e) under the Exchange Act).
Based on this evaluation, the Company’s Chief Executive Officer and Chief Financial Officer concluded that, as of the end of the period covered by this report, the Company’s disclosure controls and procedures are effective. Notwithstanding the foregoing, a control system, no matter how well designed and operated, can provide only reasonable, not absolute, assurance that it will detect or uncover failures to disclose material information otherwise required to be set forth in the Company’s periodic reports.
Internal Control over Financial Reporting
Changes in Internal Control over Financial Reporting.
There have not been any changes in the Company’s internal control over financial reporting (as defined in Rules 13a-15(f) and 15d-15(f) under the Exchange Act) during the most recent fiscal quarter that materially affected, or are reasonably likely to materially affect, the Company’s internal control over financial reporting.
66
PART II. Other Information
Item 1. Legal Proceedings
We may be involved in various litigation matters arising in the ordinary course of our business. Although we are unable to predict with certainty the eventual outcome of any litigation, in the opinion of management, any current legal proceedings are not expected to have a material adverse effect on our financial position or results of operations.
Item 1A. Risk Factors
There are no material changes from the risk factors previously disclosed in our Annual Report on Form 10-K for the fiscal year ended December 31, 2016 as filed with the SEC on March 17, 2017, except as noted below.
We have paid and may continue to pay distributions from sources other than our cash flow provided by operations, and as a result we will have less cash available for investments and stockholders’ overall return may be reduced.
Our organizational documents permit us to pay distributions from any source, including Offering proceeds, borrowings, our Advisor’s agreement to defer, reduce or waive fees (or accept, in lieu of cash, shares of our common stock) or sales of assets or we may make distributions in the form of taxable stock dividends. We have not established a limit on the amount of proceeds we may use to fund distributions. We have funded our cash distributions paid to date using net proceeds from our Offering and we may do so in the future. Until the proceeds from our Offering are fully invested, and otherwise during the course of our existence, we may not generate sufficient cash flow from operations to fund distributions.
During our initial public offering, pursuant to a distribution support agreement, in certain circumstances where our cash distributions exceeded our MFFO, an affiliate of our Sponsor, (previously a subsidiary of NorthStar Realty) purchased 0.6 million shares of our Class A common stock (which included the $2.0 million of shares purchased to satisfy the minimum offering amount) at a weighted average price of $9.05 per share to provide additional cash to support distributions to stockholders. The sale of these shares resulted in the dilution of the ownership interests of our public stockholders. Our Distribution Support Agreement expired in November 2016. For the nine months ended September 30, 2017, we declared distributions of $58.8 million compared to cash provided by operating activities of $38.9 million with $21.1 million, or 36% of the distributions declared during this period being paid using proceeds from our Offering. For the year ended December 31, 2016, we declared distributions of $70.9 million compared to cash provided by operating activities of $34.6 million with $28.0 million, or 40% of the distributions declared during this period being paid using proceeds from our Offering, including the purchase of additional shares by an affiliate of our Sponsor (previously a subsidiary of NorthStar Realty).
On August 25, 2017, in connection with our entry into the Combination Agreement, our board of directors voted to suspend the DRP until further notice. Pursuant to the terms of the DRP, the suspension went into effect prior to the monthly distributions to be paid on or about October 1, 2017 and as a result, all stockholders will receive only cash distributions unless and until the DRP is reinstated.
Stockholders cannot be sure of the market price of the CLNC common stock they will receive as consideration.
Upon completion of mergers of each of us and NorthStar Income I with and into CLNC as contemplated by the Combination Agreement, which we refer to as the Mergers, our stockholders will receive shares of CLNC class B common stock, which will subsequently convert to shares of CLNC’s class A common stock at various times as further described in the Combination Agreement. We anticipate that CLNC’s class A common stock will be traded on a national securities exchange; however, prior to the Combination, there has not been and will not be an established public trading market for CLNC common stock. The market price of the CLNC class A common stock following the Combination will be unknown until the commencement of trading of CLNC class A common stock upon the consummation of the Combination. The value of the CLNC class B common stock will be based on the market price of the CLNC class A common stock at the time that the applicable class of CLNC class B common stock converts to CLNC class A common stock. Therefore, stockholders will not know the value of the consideration they will receive for the Mergers until the completion of the Combination.
The NorthStar II exchange ratio in the Combination is fixed and generally will not be adjusted for changes affecting us.
If the Mergers are completed, and assuming the exchange ratio is not adjusted pursuant to the terms of the Combination Agreement, each outstanding share of our common stock will be converted into the right to receive 0.3511 (which we refer to as the NorthStar II exchange ratio) shares of CLNC class B common stock, classified as follows: (i) 10% as shares of CLNC class B-1 common stock, (ii) 45% as shares of CLNC class B-2 common stock and (iii) 45% as shares of CLNC class B-3 common stock.
The NorthStar II exchange ratio is fixed and may be adjusted only under certain limited circumstances as set forth in the Combination Agreement and will not be adjusted to reflect any changes in the value of our common stock between the signing of the Combination
67
Agreement and the closing of the Mergers. However, immediately prior to the closing of the Combination, if we have generated the least amount of cash leakage as compared to NorthStar Income I during the period from July 1, 2017 through the day immediately preceding the closing date, excluding the dividend payment made on July 1, 2017), we will declare a special dividend in order to true up the agreed contribution values of us and NorthStar Income I in relation to each other. In addition, immediately prior to the closing of the Combination, CLNC will, if necessary, declare a special distribution to CLNS OP in an amount that is intended to true up CLNS OP for the difference between (i) the sum of (a) the loss in value of us and NorthStar Income I as a result of the distributions made by us and NorthStar Income I in excess of funds from operations from July 1, 2017 through the day immediately preceding the closing date (excluding the dividend payment made on July 1, 2017), (b) funds from operations for the Contributed Entities (as defined in the Combination Agreement) from July 1, 2017 through the day immediately preceding the closing date of the Combination, (c) cash contributions or contributions of certain intercompany receivables made to the Contributed Entities from July 1, 2017 through the day immediately preceding the closing date and (d) the expected present value of certain unreimbursed operating expenses of us and NorthStar Income I paid on each company’s behalf by their respective advisors, and (ii) cash distributions made by the Contributed Entities from July 1, 2017 through the day immediately preceding the closing date, excluding the Goodwill Distribution (as defined in the Combination Agreement).
Completion of the Combination is subject to many conditions and if these conditions are not satisfied or waived, the Combination will not be completed.
Completion of the Combination is subject to many conditions that must be satisfied or waived under the Combination Agreement in order for the Combination to be completed including, among others, receipt of approval of our stockholders and the stockholders of NorthStar Income I.
In addition, each of the parties may terminate the Combination Agreement under certain circumstances, including, among other reasons, if the Combination is not completed by the outside date (as set forth in the Combination Agreement).
There can be no assurance that the conditions to the closing of the Combination will be satisfied or waived. For example, CLNC’s ability to qualify as a REIT depends, in part, on its acquisition of our and NorthStar Income I’s qualifying REIT assets in the Mergers. Accordingly, for CLNC’s counsel to deliver the REIT qualification opinion that is a condition to the closing of the Combination, CLNC must be able to project, and its counsel to reasonably assume, that CLNC will satisfy the REIT income and asset tests for the entire taxable year of the Mergers. Accordingly, there can be no assurance that the Combination, including the Mergers, will be completed.
If the Combination does not occur, we may incur payment obligations to the others.
If the Combination Agreement is terminated under certain circumstances, we may be required to pay NorthStar Income I and/or CLNS OP certain termination fees of approximately $41.6 million or transaction expenses of up to $10.0 million each (depending on the specific circumstances).
Our stockholders, as a group, will hold a significantly smaller share of CLNC following the closing of the Combination than they currently do as stockholders of us.
Following the Combination, our former stockholders are expected to hold approximately 31% of CLNC immediately after the completion of the Combination, on a fully diluted basis. Consequently, our stockholders, as a group, will exercise less influence over the management and policies of CLNC after the completion of the Combination than they currently exercise over the management and policies of us. In addition, our charter includes certain provisions required by the Statement of Policy Regarding Real Estate Investment Trusts published by the North American Securities Administrators Association, or the NASAA REIT Guidelines, which apply to REITs with shares that are publicly registered with the SEC but are not listed on a national securities exchange, including certain director removal rights. The CLNC charter does not include provisions based on the NASAA REIT Guidelines and such guidelines would not apply to CLNC.
If the Mergers are approved, the date on which our stockholders will receive CLNC common stock is uncertain.
Even if the Mergers are approved by our stockholders and NorthStar Income I’s stockholders, the date on which the Mergers are consummated and our stockholders will receive CLNC common stock will remain uncertain, and may not occur at all. Although it is expected that the Mergers will be consummated in the first quarter of 2018, the completion date of the Mergers might be later than expected due to delays in satisfying the conditions to the closing of the Combination (including the listing by CLNC of its class A common stock on a national securities exchange) or other unforeseen events. In addition, there can be no assurance that the Mergers will be completed even if the required stockholder approvals are obtained.
68
The Combination Agreement includes restrictions on our ability to make distributions to our stockholders, even if we would otherwise have net income and net cash available to make such distributions.
Pursuant to the Combination Agreement, we are permitted to make our regular daily dividend distributions to our stockholders of up to $0.001917808 per share of our common stock prior to the closing of the Mergers. Our board of directors may also declare a special dividend in cash in respect of our common stock to the extent the cash leakage of NorthStar Income I exceeds any cash leakage of us prior to the closing of the Mergers.
We are permitted under the Combination Agreement to make certain minimum distributions in excess of the above limits as needed in order to maintain our respective statuses as REITs. In the event the amounts of permitted dividends described above are exceeded, pursuant to a distribution necessary for us to qualify as a REIT or to avoid the incurrence of any income or excise tax, the NorthStar II exchange ratio will be adjusted.
Therefore, even if we have available net income or net cash to make distributions to our stockholders and satisfy any other conditions to make such distributions, the terms of the Combination Agreement could prohibit such action.
We will be subject to business uncertainties and certain operation restrictions until consummation of the Combination.
Uncertainty about the effect of the Mergers may have an adverse effect on us. These uncertainties could disrupt our business and cause investors and others that deal with us to seek to change existing business relationships, cease doing business with us or cause potential new business partners or investment counterparties to delay doing business with us until the Combination has been completed successfully. In addition, the Combination Agreement restricts us from making certain acquisitions and investments and taking other specified actions without the consent of the other parties until the Combination occurs. These restrictions may prevent us from pursuing attractive business opportunities that may arise prior to the completion of the Combination, even if such actions would otherwise prove beneficial to our stockholders. Those operating covenants will continue to apply until the Mergers occur.
Failure to complete the Combination could negatively affect our value and our future business and financial results.
If the Combination Agreement is terminated and the Combination is not completed for any reason, including as a result of our stockholders’ or NorthStar Income I stockholders’ failing to approve the necessary proposals, our ongoing business could be adversely affected and, without realizing any of the benefits of having completed the Combination, may be subject to several risks, including that:
• | we may experience negative reactions from our investors; |
• | we will be required to pay certain costs relating to the Combination, whether or not the Combination is completed, and, depending on the circumstances relating to a termination, may be required to pay certain termination fees or transaction expenses; and |
• | our management’s focus and resources may be diverted from operational matters and other strategic opportunities while working to implement the Combination. |
If either of the Mergers does not qualify as a “reorganization” within the meaning of Section 368(a) of the Code, stockholders participating in such Merger may be required to pay substantial U.S. federal income taxes.
Although the parties intend that each of the Mergers will qualify as a “reorganization” within the meaning of Section 368(a) of the Code, it is possible that the Internal Revenue Service, which we refer to as the IRS, could assert that one or both of the Mergers fails to so qualify. If the IRS were to be successful in any such contention, or if for any other reason any such Merger were to fail to qualify as a “reorganization,” each U.S. holder participating in any such Merger would recognize gain or loss with respect to all such U.S. holder’s shares of stock based on the difference between: (i) that U.S. holder’s tax basis in the relevant shares; and (ii) the aggregate cash and the fair market value of the shares of stock received in the applicable Merger.
Item 2. Unregistered Sales of Equity Securities and Use of Proceeds
Use of Proceeds from Registered Securities
On May 6, 2013, our registration statement on Form S-11 (File No. 333-185640) for our Offering of up to $1.65 billion in shares of common stock in any combination of our Class A and Class T shares, consisting of $1.5 billion issuable pursuant to our Primary Offering and $150.0 million issuable pursuant to our DRP, was declared effective under Securities Act of 1933, as amended, or the Securities Act. We commenced our Offering on the same date and retained our Dealer Manager to serve as our dealer manager of our Offering.
69
In March 2015, our board of directors determined to extend our Offering for one year to May 2016. In April 2016, the board of directors further extended our Offering for an additional six months, or such longer period as permitted by law.
Our Primary Offering closed effective November 9, 2016. Following the termination of the Primary Offering and until its suspension as described below, we continued to offer and sell shares pursuant to our DRP at the most recently disclosed estimated value per share of each share class. Prior to the closing of the Primary Offering, $150.0 million of the unsold shares remaining from our Primary Offering were allocated to our DRP, for a total of $300.0 million in shares offered pursuant to our DRP. On August 25, 2017, in connection with the entry into the Combination Agreement, our board of directors voted to suspend the DRP until further notice. Pursuant to the terms of the DRP, the suspension went into effect prior to the monthly distributions to be paid on or about October 1, 2017 and as a result, our stockholders will receive only cash distributions through the completion of the Combination unless and until the DRP is reinstated.
As of September 30, 2017, we sold the following shares of common stock and raised the following gross proceeds in connection with our Offering (dollars and shares in thousands):
Shares(1) | Proceeds(1) | ||||||
Primary Offering | 109,173 | $ | 1,084,098 | ||||
DRP | 8,608 | 81,743 | |||||
Total | 117,781 | $ | 1,165,841 | ||||
_______________________________________
(1) | Excludes shares repurchased. |
From the commencement of our Offering through September 30, 2017, we incurred $65.3 million in selling commissions, $31.9 million in dealer manager fees, $12.5 million in other offering costs and $2.1 million in distribution fees in connection with the issuance and distribution of our registered securities and $80.6 million of these costs have been reallowed to third party participating broker dealers.
From the commencement of our Offering through September 30, 2017, the net proceeds to us from our Offering, after deducting the total expenses incurred described above, were $1.1 billion. From the commencement of our Offering through September 30, 2017, including recycled capital, we used $647.0 million to acquire and originate real estate debt investments, $518.3 million to purchase real estate equity investments, $39.0 million to purchase real estate securities investments and $19.7 million to pay our Advisor and Prior Advisor acquisition fees.
Purchases of Equity Securities by the Issuer and Affiliated Purchasers
We adopted our Share Repurchase Program effective May 6, 2013, which enables stockholders to sell their shares to us in limited circumstances. We may not repurchase shares unless a stockholder has held shares for at least one year. However, we may repurchase shares held for less than one year in connection with a stockholder’s death or qualifying disability. We are not obligated to repurchase shares under our Share Repurchase Program. We fund repurchase requests received during a quarter with proceeds set aside for that purpose which are not expected to exceed proceeds received from our DRP. However, to the extent that the aggregate DRP proceeds are not sufficient to fund repurchase requests, our board of directors may, in its sole discretion, choose to use other sources of funds. Subject to funds being available, we will limit the number of shares redeemed pursuant to our Share Repurchase Program to: (i) 5.0% of the weighted average number of shares of our common stock outstanding during the prior calendar year; and (ii) those that could be funded from the net DRP proceeds in the prior calendar year plus such additional funds as may be reserved for that purpose by our board of directors; provided, however, that the above volume limitations shall not apply to repurchases requested within two years after the death or qualifying disability of a stockholder. Our board of directors may, in its sole discretion, amend, suspend or terminate our Share Repurchase Program at any time provided that any amendment that adversely affects the rights or obligations of a participant (as determined in the sole discretion of our board of directors) will take effect only upon ten days’ prior written notice except that changes in the number of shares that can be repurchased during any calendar year will take effect only upon ten business days’ prior written notice. We may provide written notice by filing a Current Report on Form 8-K with the SEC. In addition, our Share Repurchase Program will terminate in the event a secondary market develops for our shares or a listing of our shares occurs on a national exchange or are included for quotation in a national securities market. On August 25, 2017, in connection with the entry into the Combination Agreement, our board of directors voted to suspend our Share Repurchase Program until further notice. The suspension of our Share Repurchase Program went effective as of September 7, 2017 and as a result, pursuant to the terms of the Share Repurchase Program, no further share repurchases will be processed.
70
During the nine months ended September 30, 2017, we repurchased shares of our common stock as follows:
Period | Total Number of Shares Purchased | Average Price Paid Per Share | Total Number of Shares Purchased as Part of Publicly Announced Plan or Program | Maximum Approximate Dollar Value of Shares that May Yet Be Purchased Under the Plan or Program | ||||||||
January 1 to January 31 | — | $ | — | — | (1) | |||||||
February 1 to February 28 | 474,893 | 9.48 | 474,893 | |||||||||
March 1 to March 31 | — | — | — | |||||||||
April 1 to April 30 | — | — | — | |||||||||
May 1 to May 31 | 478,003 | 9.39 | 478,003 | |||||||||
June 1 to June 30 | — | — | — | |||||||||
July 1 to July 31 | — | — | — | |||||||||
August 1 to August 31 | 756,307 | 9.38 | 756,307 | |||||||||
September 1 to September 30 | — | — | — | |||||||||
Total | 1,709,203 | $ | 9.41 | 1,709,203 | ||||||||
_____________________________
(1) | Subject to funds being available, and if our Share Repurchase Program resumes, we will limit the number of shares of our common stock repurchased during any calendar year to 5.0% of the weighted average number of shares of our common stock outstanding during the prior calendar year; provided however, shares of our common stock subject to a repurchase requested upon the death of a stockholder will not be subject to this cap. |
Unregistered Sales of Equity Securities
During the three months ended September 30, 2017, we did not issue any equity securities that were not registered under the Securities Act. All prior sales of unregistered securities have been previously reported on quarterly reports on Form 10-Q and annual reports on Form 10-K.
71
Item 6. Exhibits
Exhibit Number | Description of Exhibit | |
2.1 | ||
3.1 | ||
3.2 | ||
3.3 | ||
3.4 | ||
4.1 | ||
31.1* | ||
31.2* | ||
32.1* | ||
32.2* | ||
101* | The following materials from the NorthStar Real Estate Income II, Inc. Quarterly Report on Form 10-Q for the quarterly period ended September 30, 2017, formatted in XBRL (eXtensible Business Reporting Language): (i) Consolidated Balance Sheets as of September 30, 2017 (unaudited) and December 31, 2016; (ii) Consolidated Statements of Operations (unaudited) for the three and nine months ended September 30, 2017 and 2016; (iii) Consolidated Statements of Comprehensive Income (Loss) (unaudited) for the three and nine months ended September 30, 2017 and 2016; (iv) Consolidated Statements of Equity for the nine months ended September 30, 2017 (unaudited) and the year ended December 31, 2016; (v) Consolidated Statements of Cash Flows (unaudited) for the nine months ended September 30, 2017 and 2016; and (vi) Notes to Consolidated Financial Statements (unaudited) | |
_______________________________________
* | Filed herewith |
72
SIGNATURES
Pursuant to the requirements of the Securities Exchange Act of 1934, the Registrant has duly caused this report to be signed on its behalf by the undersigned, thereunto duly authorized.
NorthStar Real Estate Income II, Inc. | ||||
Date: | November 13, 2017 | By: | /s/ DANIEL R. GILBERT | |
Name: | Daniel R. Gilbert | |||
Title: | Chairman, Chief Executive Officer and President | |||
By: | /s/ FRANK V. SARACINO | |||
Name: | Frank V. Saracino | |||
Title: | Chief Financial Officer and Treasurer | |||
73