Attached files
| file | filename |
|---|---|
| EX-31.1 - CERTIFICATION - Carbon Energy Corp | f10q0917ex31-1_carbonnatural.htm |
| EX-32.2 - CERTIFICATION - Carbon Energy Corp | f10q0917ex32-2_carbonnatural.htm |
| EX-32.1 - CERTIFICATION - Carbon Energy Corp | f10q0917ex32-1_carbonnatural.htm |
| EX-31.2 - CERTIFICATION - Carbon Energy Corp | f10q0917ex31-2_carbonnatural.htm |
| EX-10.1 - AMENDED AND RESTATED LIMITED LIABILITY COMPANY AGREEMENT OF CARBON APPALACHIAN C - Carbon Energy Corp | f10q0917ex10-1_carbonnatural.htm |
| EX-2.2 - PURCHASE AND SALE AGREEMENT BY AND AMONG CARBON WEST VIRGINIA COMPANY, LLC - Carbon Energy Corp | f10q0917ex2-2_carbonnatural.htm |
| EX-2.1 - PURCHASE AND SALE AGREEMENT BY AND BETWEEN CARBON WEST VIRGINIA COMPANY, LLC - Carbon Energy Corp | f10q0917ex2-1_carbonnatural.htm |
UNITED STATES
SECURITIES AND EXCHANGE COMMISSION
Washington, D.C. 20549
FORM 10-Q
☒ Quarterly report pursuant to section 13 or 15(d) of the Securities Exchange Act of 1934
For the quarter ended September 30, 2017
or
☐ Transition report pursuant to section 13 or 15(d) of the Securities Exchange Act of 1934
For the transition period from ___________ to ____________
Commission File Number: 000-02040
| CARBON NATURAL GAS COMPANY |
| (Exact name of registrant as specified in its charter) |
| Delaware | 26-0818050 | |
| (State or other jurisdiction of | (I.R.S. Employer | |
| incorporation or organization) | Identification No.) | |
| 1700 Broadway, Suite 1170, Denver, CO | 80290 | |
| (Address of principal executive offices) | (Zip Code) |
Registrant's telephone number, including area code: (720) 407-7043
| (Former name, address and fiscal year, if changed since last report) |
Indicate by check mark whether the registrant (1) has filed all reports required to be filed by Section 13 or 15(d) of the Securities Exchange Act of 1934 during the preceding 12 months (or for such shorter period that the Company was required to file such reports), and (2) has been subject to such filing requirements for the past 90 days.
YES ☒ NO ☐
Indicate by check mark whether the registrant has submitted electronically and posted on its corporate Web site, if any, every Interactive Data File required to be submitted and posted pursuant to rule 405 of Regulations S-T (§232.405 of this chapter) during the preceding 12 months (or for such shorter period that the registrant was required to submit and post such files).
YES ☒ NO ☐
Indicate by check mark whether the registrant is a large accelerated filer, an accelerated filer, a non-accelerated filer, or a smaller reporting company. See definitions of “large accelerated filer,” “accelerated filer”, “smaller reporting company” and “emerging growth company” in Rule 12b-2 of the Exchange Act.
| Large accelerated filer | ☐ | Smaller reporting company | ☒ | ||
| Accelerated filer | ☐ | Emerging growth company | ☐ | ||
| Non-accelerated filer | ☐ | (Do not check if a smaller reporting company) |
If an emerging growth company, indicate by check mark if the registrant has elected not to use the extended transition period for complying with any new or revised financial accounting standards pursuant to Section 13(a) of the Exchange Act. ☐
Indicate by check mark whether the registrant is a shell company (as defined in Rule 12b-2 of the Exchange Act).
YES ☐ NO ☒
Indicate the number of shares outstanding of each of the issuer's classes of common stock, as of the latest practicable date.
At November 10, 2017, there were 6,059,640 issued and outstanding shares of the Company’s common stock, $0.01 par value.
Carbon Natural Gas Company
TABLE OF CONTENTS
| Part I – FINANCIAL INFORMATION | |
| Item 1. Consolidated Financial Statements | 1 |
| Consolidated Balance Sheets (unaudited) | 1 |
| Consolidated Statements of Operations (unaudited) | 2 |
| Consolidated Statements of Stockholders’ Equity (unaudited) | 3 |
| Consolidated Statements of Cash Flows (unaudited) | 4 |
| Notes to the Consolidated Financial Statements (unaudited) | 5 |
| Item 2. Management’s Discussion and Analysis of Financial Condition and Results of Operations | 24 |
| Item 4. Controls and Procedures | 40 |
| Part II – OTHER INFORMATION | |
| Item 2. Unregistered Sales of Equity Securities and Use of Proceeds | 41 |
| Item 6. Exhibits | 41 |
PART I. FINANCIAL INFORMATION
ITEM 1. Financial Statements
CARBON NATURAL GAS COMPANY
Consolidated Balance Sheets
| September 30, | December 31, | |||||||
| (in thousands, except share and per share data) | 2017 | 2016 | ||||||
| (Unaudited) | ||||||||
| ASSETS | ||||||||
| Current assets: | ||||||||
| Cash and cash equivalents | $ | 1,119 | $ | 858 | ||||
| Accounts receivable: | ||||||||
| Revenue | 2,349 | 2,369 | ||||||
| Trade receivables | 1,023 | 330 | ||||||
| Receivable – related party | 346 | - | ||||||
| Other | 39 | 1,921 | ||||||
| Commodity derivative asset | 190 | - | ||||||
| Prepaid expense, deposits and other current assets | 585 | 305 | ||||||
| Total current assets | 5,651 | 5,783 | ||||||
| Property and equipment (note 4): | ||||||||
| Oil and gas properties, full cost method of accounting; | ||||||||
| Proved, net | 32,059 | 33,212 | ||||||
| Unproved | 1,926 | 1,999 | ||||||
| Other property and equipment, net | 773 | 325 | ||||||
| 34,758 | 35,536 | |||||||
| Investments in affiliates (note 5) | 14,245 | 668 | ||||||
| Other long-term assets | 847 | 725 | ||||||
| Total assets | $ | 55,501 | $ | 42,712 | ||||
| LIABILITIES AND STOCKHOLDERS’ EQUITY | ||||||||
| Current liabilities: | ||||||||
| Accounts payable and accrued liabilities (note 9) | $ | 8,093 | $ | 9,121 | ||||
| Firm transportation contract obligations (note 12) | 234 | 561 | ||||||
| Commodity derivative liability | - | 1,341 | ||||||
| Total current liabilities | 8,327 | 11,023 | ||||||
| Non-current liabilities: | ||||||||
| Firm transportation contract obligations (note 12) | 166 | 261 | ||||||
| Commodity derivative liability | - | 591 | ||||||
| Ad valorem taxes payable | 561 | 628 | ||||||
| Warrant derivative liability | 4,600 | - | ||||||
| Asset retirement obligations (note 2) | 5,120 | 5,006 | ||||||
| Notes payable (note 6) | 22,140 | 16,230 | ||||||
| Total non-current liabilities | 32,587 | 22,716 | ||||||
| Commitments (note 12) | ||||||||
| Stockholders’ equity: | ||||||||
| Preferred stock, $0.01 par value; authorized 1,000,000 shares, no shares issued and outstanding at September 30, 2017 and December 31, 2016 | - | - | ||||||
| Common stock, $0.01 par value; authorized 200,000,000 shares, 5,627,589 and 5,482,673 shares issued and outstanding at September 30, 2017 and December 31, 2016, respectively | 56 | 55 | ||||||
| Additional paid-in capital | 58,339 | 57,588 | ||||||
| Accumulated deficit | (45,701 | ) | (50,535 | ) | ||||
| Total Carbon stockholders’ equity | 12,694 | 7,108 | ||||||
| Non-controlling interests | 1,893 | 1,865 | ||||||
| Total stockholders’ equity | 14,587 | 8,973 | ||||||
| Total liabilities and stockholders’ equity | $ | 55,501 | $ | 42,712 | ||||
See accompanying notes to Consolidated Financial Statements.
| 1 |
CARBON NATURAL GAS COMPANY
Consolidated Statements of Operations
(Unaudited)
| Three Months Ended September 30, | Nine Months Ended September 30, | |||||||||||||||
| (in thousands except per share amounts) | 2017 | 2016 | 2017 | 2016 | ||||||||||||
| Revenue: | ||||||||||||||||
| Natural gas sales | $ | 3,689 | $ | 1,431 | $ | 11,706 | $ | 3,484 | ||||||||
| Oil sales | 997 | 765 | 3,189 | 2,201 | ||||||||||||
| Commodity derivative (loss) gain | (499 | ) | 160 | 2,642 | (474 | ) | ||||||||||
| Other income | 8 | 9 | 28 | 10 | ||||||||||||
| Total revenue | 4,195 | 2,365 | 17,565 | 5,221 | ||||||||||||
| Expenses: | ||||||||||||||||
| Lease operating expenses | 1,605 | 622 | 4,311 | 1,864 | ||||||||||||
| Transportation costs | 556 | 364 | 1,571 | 1,121 | ||||||||||||
| Production and property taxes | 331 | 184 | 1,186 | 443 | ||||||||||||
| General and administrative | 2,129 | 2,327 | 5,623 | 5,402 | ||||||||||||
| General and administrative - related party reimbursement | (423 | ) | - | (723 | ) | - | ||||||||||
| Depreciation, depletion and amortization | 613 | 393 | 1,847 | 1,332 | ||||||||||||
| Accretion of asset retirement obligations | 77 | 35 | 232 | 105 | ||||||||||||
| Impairment of oil and gas properties | - | - | - | 4,299 | ||||||||||||
| Total expenses | 4,888 | 3,925 | 14,047 | 14,566 | ||||||||||||
| Operating (loss) income | (693 | ) | (1,560 | ) | 3,518 | (9,345 | ) | |||||||||
| Other income and (expense): | ||||||||||||||||
| Interest expense | (299 | ) | (38 | ) | (821 | ) | (141 | ) | ||||||||
| Warrant derivative gain | 811 | - | 2,494 | - | ||||||||||||
| Equity investment loss | (285 | ) | (4 | ) | (285 | ) | (10 | ) | ||||||||
| Other | 20 | - | 20 | 17 | ||||||||||||
| Total other income (expense) | 247 | (42 | ) | 1,408 | (134 | ) | ||||||||||
| Income (loss) before income taxes | (446 | ) | (1,602 | ) | 4,926 | (9,479 | ) | |||||||||
| Provision for income taxes | - | - | - | - | ||||||||||||
| Net income (loss) before non-controlling interests | (446 | ) | (1,602 | ) | 4,926 | (9,479 | ) | |||||||||
| Net income (loss) attributable to non-controlling interests | 16 | (3 | ) | 92 | (435 | ) | ||||||||||
| Net income (loss) attributable to controlling interest | $ | (462 | ) | $ | (1,599 | ) | $ | 4,834 | $ | (9,044 | ) | |||||
| Net income (loss) per common share: | ||||||||||||||||
| Basic | $ | (0.08 | ) | $ | (0.29 | ) | $ | 0.87 | $ | (1.66 | ) | |||||
| Diluted | $ | (0.08 | ) | $ | (0.29 | ) | $ | 0.36 | $ | (1.66 | ) | |||||
| Weighted average common shares outstanding: | ||||||||||||||||
| Basic | 5,628 | 5,507 | 5,579 | 5,455 | ||||||||||||
| Diluted | 5,628 | 5,507 | 6,486 | 5,455 | ||||||||||||
See accompanying notes to Consolidated Financial Statements.
| 2 |
CARBON NATURAL GAS COMPANY
Consolidated Statements of Stockholders’ Equity
(Unaudited)
(in thousands)
| Additional | Non- | Total | ||||||||||||||||||||||
| Common Stock | Paid-in | Controlling | Accumulated | Stockholders’ | ||||||||||||||||||||
| Shares | Amount | Capital | Interests | Deficit | Equity | |||||||||||||||||||
| Balances, December 31, 2016 | 5,483 | $ | 55 | $ | 57,588 | $ | 1,865 | $ | (50,535 | ) | $ | 8,973 | ||||||||||||
| Stock-based compensation | - | - | 752 | - | - | 752 | ||||||||||||||||||
| Restricted stock vested | 65 | - | - | - | - | - | ||||||||||||||||||
| Performance units vested | 80 | 1 | (1 | ) | - | - | - | |||||||||||||||||
| Non-controlling interest distributions, net | - | - | - | (64 | ) | - | (64 | ) | ||||||||||||||||
| Net income | - | - | - | 92 | 4,834 | 4,926 | ||||||||||||||||||
| Balances, September 30, 2017 | 5,628 | $ | 56 | $ | 58,339 | $ | 1,893 | $ | (45,701 | ) | $ | 14,587 | ||||||||||||
See accompanying notes to Consolidated Financial Statements.
| 3 |
CARBON NATURAL GAS COMPANY
Consolidated Statements of Cash Flows
(Unaudited)
| Nine Months Ended | ||||||||
| September 30, | ||||||||
| (in thousands) | 2017 | 2016 | ||||||
| Cash flows from operating activities: | ||||||||
| Net income (loss) | $ | 4,926 | $ | (9,479 | ) | |||
| Items not involving cash: | ||||||||
| Depreciation, depletion and amortization | 1,847 | 1,332 | ||||||
| Accretion of asset retirement obligations | 232 | 105 | ||||||
| Impairment of oil and gas properties | - | 4,299 | ||||||
| Unrealized commodity derivative (gain) loss | (2,179 | ) | 823 | |||||
| Warrant derivative unrealized gain | (2,494 | ) | - | |||||
| Stock-based compensation expense | 752 | 2,037 | ||||||
| Investment in affiliates (gain) loss | 315 | 10 | ||||||
| Amortization of debt issuance costs | 131 | - | ||||||
| Other | (108 | ) | (8 | ) | ||||
| Net change in: | ||||||||
| Accounts receivable | 863 | 43 | ||||||
| Prepaid expenses, deposits and other current assets | (280 | ) | 27 | |||||
| Accounts payable, accrued liabilities and firm transportation contract obligations | (1,425 | ) | 118 | |||||
| Net cash provided by (used in) operating activities | 2,580 | (693 | ) | |||||
| Cash flows from investing activities: | ||||||||
| Development and acquisition of properties and equipment | (1,268 | ) | (328 | ) | ||||
| Proceeds from sale of oil and gas properties and other assets | 16 | 8 | ||||||
| Other long-term assets | (56 | ) | 57 | |||||
| Investment in affiliates | (6,798 | ) | 275 | |||||
| Net cash (used in) provided by investing activities | (8,106 | ) | 12 | |||||
| Cash flows from financing activities: | ||||||||
| Proceeds from notes payable | 7,210 | 707 | ||||||
| Payments on notes payable | (1,300 | ) | (200 | ) | ||||
| Debt issuance costs | (59 | ) | - | |||||
| Distributions to non-controlling interests | (64 | ) | (3 | ) | ||||
| Net cash provided by financing activities | 5,787 | 504 | ||||||
| Net increase (decrease) in cash and cash equivalents | 261 | (177 | ) | |||||
| Cash and cash equivalents, beginning of period | 858 | 305 | ||||||
| Cash and cash equivalents, end of period | $ | 1,119 | $ | 128 | ||||
See accompanying notes to Consolidated Financial Statements.
| 4 |
CARBON NATURAL GAS COMPANY
Notes to Consolidated Financial Statements
(Unaudited)
Note 1 – Organization
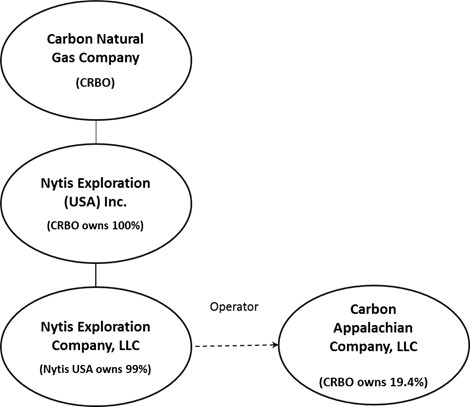
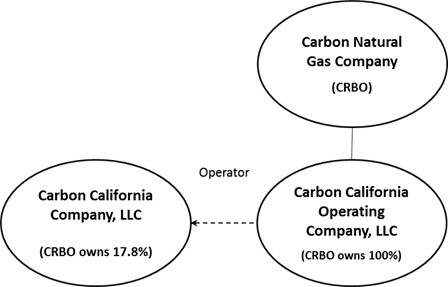
The Company’s business is comprised of the assets and properties of Carbon Natural Gas Company and its subsidiaries as well as its equity investments in Carbon Appalachian Company, LLC (“Carbon Appalachia”) and Carbon California Company, LLC (“Carbon California”).
Appalachian and Illinois Basin Operations
In the Appalachian and Illinois Basins, Nytis Exploration Company, LLC (“Nytis LLC”) conducts operations for the Company and Carbon Appalachia.
California Operations
In California, Carbon California Operating Company, LLC (“CCOC”), conducts Carbon California’s operations.
Collectively, Carbon Natural Gas Company, CCOC, Nytis Exploration (USA) Inc. (“Nytis USA”) and Nytis LLC are referred to as the Company.
| 5 |
Note 2 – Summary of Significant Accounting Policies
Basis of Presentation
The accompanying unaudited Consolidated Financial Statements of the Company have been prepared in accordance with accounting principles generally accepted in the United States (“GAAP”) for interim financial information. Accordingly, they do not include all of the information and footnotes required by GAAP for complete financial statements. In the opinion of management, the accompanying unaudited Consolidated Financial Statements include all adjustments (consisting of normal and recurring accruals) considered necessary to present fairly the Company’s financial position as of September 30, 2017 and the Company’s results of operations and cash flows for the three and nine months ended September 30, 2017 and 2016. Operating results for the three and nine months ended September 30, 2017 are not necessarily indicative of the results that may be expected for the full year because of the impact of fluctuations in prices received for oil and natural gas, natural production declines, the uncertainty of exploration and development drilling results and other factors. For a more complete understanding of the Company’s operations, financial position and accounting policies, the unaudited Consolidated Financial Statements and the notes thereto should be read in conjunction with the Company’s audited Consolidated Financial Statements for the year ended December 31, 2016 filed on Form 10-K with the Securities and Exchange Commission (“SEC”).
In the course of preparing the unaudited Consolidated Financial Statements, management makes various assumptions, judgments and estimates to determine the reported amount of assets, liabilities, revenue and expenses and in the disclosures of commitments and contingencies. Changes in these assumptions, judgments and estimates will occur as a result of the passage of time and the occurrence of future events and accordingly, actual results could differ from amounts initially established.
Principles of Consolidation
The Consolidated Financial Statements include the accounts of Carbon, CCOC, Nytis USA and its consolidated subsidiary, Nytis LLC. Carbon owns 100% of Nytis USA and CCOC. Nytis USA owns approximately 99% of Nytis LLC.
Nytis LLC also holds an interest in 64 oil and gas partnerships. For partnerships where the Company has a controlling interest, the partnerships are consolidated. The Company is currently consolidating on a pro-rata basis 46 partnerships. In these instances, the Company reflects the non-controlling ownership interest in partnerships and subsidiaries as non-controlling interests on its Consolidated Statements of Operations and reflects the non-controlling ownership interests in the net assets of the partnerships as non-controlling interests within stockholders’ equity on its Consolidated Balance Sheets. All significant intercompany accounts and transactions have been eliminated.
In accordance with established practice in the oil and gas industry, the Company’s unaudited Consolidated Financial Statements also include its pro-rata share of assets, liabilities, income, lease operating costs and general and administrative expenses of the oil and gas partnerships in which the Company has a non-controlling interest.
Non-majority owned investments that do not meet the criteria for pro-rata consolidation are accounted for using the equity method when the Company has the ability to significantly influence the operating decisions of the investee. When the Company does not have the ability to significantly influence the operating decisions of an investee, the cost method is used. All transactions, if any, with investees have been eliminated in the accompanying unaudited Consolidated Financial Statements.
Accounting for Oil and Gas Operations
The Company uses the full cost method of accounting for oil and gas properties. Accordingly, all costs incidental to the acquisition, exploration and development of oil and gas properties, including costs of undeveloped leasehold, dry holes and leasehold equipment, are capitalized. Overhead costs incurred that are directly identified with acquisition, exploration and development activities undertaken by the Company for its own account, and which are not related to production, general corporate overhead or similar activities, are also capitalized.
| 6 |
Unproved properties are excluded from amortized capitalized costs until it is determined if proved reserves can be assigned to such properties. The Company assesses its unproved properties for impairment at least annually. Significant unproved properties are assessed individually.
Capitalized costs are depleted by an equivalent unit-of-production method, converting oil to gas at the ratio of one barrel of oil to six thousand cubic feet of natural gas. Depletion is calculated using capitalized costs, including estimated asset retirement costs, plus the estimated future expenditures (based on current costs) to be incurred in developing proved reserves, net of estimated salvage values.
No gain or loss is recognized upon disposal of oil and gas properties unless such disposal significantly alters the relationship between capitalized costs and proved reserves. All costs related to production activities, including work-over costs incurred solely to maintain or increase levels of production from an existing completion interval, are charged to expense as incurred.
The Company performs a ceiling test quarterly. The full cost ceiling test is a limitation on capitalized costs prescribed by SEC Regulation S-X Rule 4-10. The ceiling test is not a fair value based measurement, rather it is a standardized mathematical calculation. The ceiling test provides that capitalized costs less related accumulated depletion and deferred income taxes may not exceed the sum of (1) the present value of future net revenue from estimated production of proved oil and gas reserves using the un-weighted arithmetic average of the first-day-of-the month price for the previous twelve month period, excluding the future cash outflows associated with settling asset retirement obligations that have been accrued on the balance sheet, at a discount factor of 10%; plus (2) the cost of properties not being amortized, if any; plus (3) the lower of cost or estimated fair value of unproved properties included in the costs being amortized, if any; less (4) income tax effects related to differences in the book and tax basis of oil and gas properties. Should the net capitalized costs exceed the sum of the components noted above, a ceiling test write-down would be recognized to the extent of the excess capitalized costs. Such impairments are permanent and cannot be recovered in future periods even if the sum of the components noted above exceeds the capitalized costs in future periods.
For the three and nine months ended September 30, 2017, the Company did not recognize a ceiling test impairment as the Company’s full cost pool did not exceed the ceiling limitations. For the three months ended September 30, 2016, the Company did not recognize a ceiling test impairment as the Company’s full cost pool did not exceed the ceiling limitations. For the nine months ended September 30, 2016, the Company recognized a ceiling test impairment of approximately $4.3 million as the Company’s full cost pool exceeded its ceiling limitations. Future declines in oil and natural gas prices, and increases in future operating expenses and future development costs could result in additional impairments of our oil and gas properties in future periods. Impairment charges are a non-cash charge and accordingly, do not affect cash flow, but adversely affect our net income and stockholders’ equity.
Investments in Affiliates
Investments in non-consolidated affiliates are accounted for under either the cost or equity method of accounting, as appropriate. The cost method of accounting is generally used for investments in affiliates in which the Company has less than 20% of the voting interests of a corporate affiliate or less than a 3% to 5% interest of a partnership or limited liability company and does not have significant influence. Investments in non-consolidated affiliates, accounted for using the cost method of accounting, are recorded at cost and impairment assessments for each investment are made annually to determine if a decline in the fair value of the investment, other than temporary, has occurred. A permanent impairment is recognized if a decline in the fair value occurs.
If the Company holds between 20% and 50% of the voting interest in non-consolidated corporate affiliates or generally greater than a 3% to 5% interest of a partnership or limited liability company and exerts significant influence or control (e.g., through its influence with a seat on the board of directors or management of operations), the equity method of accounting is generally used to account for the investment. Equity method investments will increase or decrease by the Company’s share of the affiliate’s profits or losses and such profits or losses are recognized in the Company’s Consolidated Statements of Operations. For its equity method investments in Carbon Appalachia and Carbon California, the Company uses the hypothetical liquidation at book value method to recognize its share of the affiliate’s profits or losses. The Company reviews equity method investments for impairment whenever events or changes in circumstances indicate that an other than temporary decline in value has occurred.
| 7 |
Related Party Transactions
On February 15, 2017, the Company entered into a limited liability company agreement of Carbon California to make investments in California oil and gas projects. Pursuant to the limited liability agreement, Carbon California reimbursed the Company for (i) due diligence costs incurred on behalf of Carbon California, (ii) transaction-related costs and (iii) management-related costs in connection with its role as manager of Carbon California. Management-related reimbursements were $150,000 and $375,000 for the three months ended September 30, 2017 and period February 15, 2017 (inception) through September 30, 2017, respectively.
On April 3, 2017, the Company entered into the limited liability company agreement of Carbon Appalachia to make investments in Appalachia oil and gas projects. Pursuant to the limited liability agreement, Carbon Appalachia reimbursed the Company for (i) due diligence costs incurred on behalf of Carbon Appalachia, (ii) transaction-related costs and (iii) management-related costs in connection with its role as manager of Carbon Appalachia. Management-related reimbursements were approximately $273,000 and $348,000 for the three months ended September 30, 2017 and period April 3, 2017 (inception) through September 30, 2017, respectively. As of September 30, 2017, Carbon Appalachia owes the Company approximately $273,000 in connection with its role as manager.
Warrant Derivative Liability
The Company issued warrants related to investments in Carbon California and Carbon Appalachia. The Company accounts for these warrants in accordance with guidance contained in Accounting Standards Codification (“ASC”) 815, Derivatives and Hedging, which requires these warrants to be recorded on the balance sheet as either an asset or a liability measured at fair value, with changes in fair value recognized in earnings. Based on this guidance, the Company determined that the Company’s warrants do not meet the criteria for classification as equity. Accordingly, the Company classified the warrants as liabilities. The warrants are subject to remeasurement at each balance sheet date, with any change in the fair value recognized as a component of other income or expense, net in the statement of operations. For the three and nine months ended September 30, 2017, changes in the fair value of warrants accounted for gains of approximately $811,000 and $2.5 million, respectively.
Asset Retirement Obligations
The Company’s asset retirement obligations (“ARO”) relate to future costs associated with the plugging and abandonment of oil and gas wells, removal of equipment and facilities from leased acreage and returning such land to its original condition. The fair value of a liability for an ARO is recorded in the period in which it is incurred and the cost of such liability is recorded as an increase in the carrying amount of the related long-lived asset by the same amount. The liability is accreted each period and the capitalized cost is depleted on a units-of-production basis as part of the full cost pool. Revisions to estimated AROs result in adjustments to the related capitalized asset and corresponding liability.
The estimated ARO liability is based on estimated economic lives, estimates as to the cost to abandon the wells in the future, and federal and state regulatory requirements. The liability is discounted using a credit-adjusted risk-free rate estimated at the time the liability is incurred or increased as a result of a reassessment of expected cash flows and assumptions inherent in the estimation of the liability. Upward revisions to the liability could occur due to changes in estimated abandonment costs or well economic lives, or if federal or state regulators enact new requirements regarding the abandonment of wells. AROs are valued utilizing Level 3 fair value measurement inputs.
| 8 |
The following table is a reconciliation of the ARO for the nine months ended September 30, 2017 and 2016:
| (in thousands) | Nine Months Ended September 30, | |||||||
| 2017 | 2016 | |||||||
| Balance at beginning of period | $ | 5,120 | $ | 3,095 | ||||
| Accretion expense | 232 | 105 | ||||||
| Additions during period | 5 | 5 | ||||||
Obligations on sale of oil & gas properties | (93 | ) | - | |||||
| 5,264 | 3,205 | |||||||
| Less: ARO recognized as a current liability | (144 | ) | - | |||||
| Balance at end of period | $ | 5,120 | $ | 3,205 | ||||
Earnings (Loss) Per Common Share
Basic earnings or loss per common share is computed by dividing the net income or loss attributable to common shareholders for the period by the weighted average number of common shares outstanding during the period. The shares of restricted common stock granted to certain officers, directors and employees of the Company are included in the computation of basic net income or loss per share only after the shares become fully vested. Diluted earnings per common share includes both the vested and unvested shares of restricted stock and the potential dilution that could occur upon exercise of warrants to acquire common stock, computed using the treasury stock method, which assumes that the increase in the number of shares is reduced by the number of shares which could have been repurchased by the Company with the proceeds from the exercise of warrants (which were assumed to have been made at the average market price of the common shares during the reporting period).
The following table sets forth the calculation of basic and diluted income (loss) per share:
| in thousands except per share amounts | Three Months Ended September 30, | Nine Months Ended September 30, | ||||||||||||||
| 2017 | 2016 | 2017 | 2016 | |||||||||||||
| Basic Earnings (Loss) per Share | ||||||||||||||||
| Net income (loss) available to common shareholders, basic | $ | (462 | ) | $ | (1,599 | ) | $ | 4,834 | $ | (9,044 | ) | |||||
| Weighted average shares outstanding, basic | 5,628 | 5,507 | 5,579 | 5,455 | ||||||||||||
| Net income (loss) per common share, basic | $ | (0.08 | ) | $ | (0.29 | ) | $ | 0.87 | (1.66 | ) | ||||||
| Diluted Earnings (Loss) per Share | ||||||||||||||||
| Net income (loss) available to common shareholders, basic | $ | (462 | ) | $ | (1,599 | ) | $ | 4,834 | $ | (9,044 | ) | |||||
| Less: decrease in fair value of warrant | - | - | (2,494 | ) | - | |||||||||||
| Adjusted net income (loss) available to common shareholders, diluted | $ | (462 | ) | $ | (1,599 | ) | $ | 2,340 | $ | (9,044 | ) | |||||
| Weighted average shares outstanding, basic | 5,628 | 5,507 | 5,579 | 5,455 | ||||||||||||
| Add: dilutive effects of warrant and nonvested shares of restricted stock | - | - | 907 | - | ||||||||||||
| Weighted-average shares outstanding, diluted | 5,628 | 5,507 | 6,486 | 5,455 | ||||||||||||
| Net income (loss) per common share, diluted | $ | (0.08 | ) | $ | (0.29 | ) | $ | 0.36 | $ | (1.66 | ) | |||||
For the three months ended September 30, 2017, the Company had a net loss, and therefore, the diluted net loss per share calculation excluded the anti-dilutive effect of approximately 284,000 non-vested shares of restricted stock and approximately 617,000 in-the-money warrants. In addition, approximately 276,000 restricted performance units, subject to future contingencies, are excluded from the basic and diluted loss per share calculations.
For the nine months ended September 30, 2017, the Company had net income and the diluted net income per share calculation for that period includes the dilutive effect of approximately 284,000 non-vested shares of restricted stock and approximately 623,000 in-the-money warrants. In addition, approximately 276,000 restricted performance units, subject to future contingencies, are excluded from the basic and diluted loss per share calculations.
| 9 |
For the three and nine months ended September 30, 2016, the Company had a net loss and therefore, the diluted net loss per share calculation excluded the anti-dilutive effect of approximately 13,000 warrants and approximately 291,000 non-vested shares of restricted stock in each period. In addition, approximately 298,000 restricted performance units, in each period, subject to future contingencies were excluded from the basic and diluted loss per share calculations.
Use of Estimates in the Preparation of Financial Statements
The preparation of financial statements in conformity with accounting principles generally accepted in the United States requires management to make estimates and assumptions that affect the reported amounts of assets, liabilities and expenses and disclosure of contingent assets and liabilities. Significant items subject to such estimates and assumptions include the carrying value of oil and gas properties, the estimate of proved oil and gas reserve volumes and the related depletion and present value of estimated future net cash flows and the ceiling test applied to capitalized oil and gas properties, determining the amounts recorded for deferred income taxes, stock-based compensation, fair value of commodity derivative instruments, fair value of warrants, equity method investments, fair value of assets acquired qualifying as business contributions and asset retirement obligations. Actual results could differ from those estimates and assumptions used, and the use of such estimates may result in volatility within the Company’s financial statements.
Adopted and Recently Issued Accounting Pronouncements
In February 2016, the FASB issued Accounting Standard Update (“ASU”) No. 2016-02, Leases (“ASU 2016-02”). The objective of this ASU is to increase transparency and comparability among organizations by recognizing lease assets and liabilities on the balance sheet and disclosing key information about leasing arrangements. ASU 2016-02 is effective for fiscal years, and interim periods within those fiscal years, beginning after December 15, 2018 and should be applied using a modified retrospective approach. Early adoption is permitted. The Company is currently evaluating the impact on its consolidated financial statements of adopting ASU 2016-02.
In May 2014, the FASB issued ASU No. 2014-09, Revenue from Contracts with Customers (“ASU 2014-09”). The objective of ASU 2014-09 is to clarify the principles for recognizing revenue and to develop a common revenue standard for U.S. GAAP and International Financial Reporting Standards. The FASB subsequently issued ASU 2015-14, ASU 2016-08, ASU 2016-10, ASU 2016-12 and ASU 2016-20, which deferred the effective date of ASU 2014-09 and provided additional implementation guidance. These ASUs are effective for fiscal years, and interim periods within those years, beginning after December 15, 2017. The standards permit retrospective application using either of the following methodologies: (i) restatement of each prior reporting period presented or (ii) recognition of a cumulative-effect adjustment as of the date of initial application. The Company plans to adopt these ASUs effective January 1, 2018 using the modified retrospective method. The Company is in the process of assessing its contracts with customers and evaluating the effect of adopting these standards on its financial statements, accounting policies, internal controls and disclosures. The adoption is not expected to have a significant impact on the Company’s net income or cash flows, however, the Company is currently evaluating the proper classification of certain pipeline gathering, transportation and gas processing agreements to determine whether changes to total revenues and expenses will be necessary under the new standards.
In June 2016, the FASB issued ASU 2016-13, Financial Instruments-Credit Losses (Topic 326): Measurement of Credit Losses on Financial Instruments. These amendments change the measurement of credit losses for most financial assets and certain other instruments that are not measured at fair value through net income. The amendments in this update affect investments in loans, investments in debt securities, trade receivables, net investments in leases, off balance sheet credit exposures, reinsurance receivables, and any other financial assets not excluded from the scope that have the contractual right to receive cash. The amendments replace the incurred loss impairment methodology in current GAAP with a methodology that reflects expected credit losses and requires consideration of a broader range of reasonable and supportable information to inform credit loss estimates. ASU 2016-13 is effective for fiscal years, and interim periods within those fiscal years, beginning after December 15, 2019. The Company is currently evaluating the impact on its consolidated financial statements of adopting ASU 2016-13.
In January 2017, the FASB issued ASU 2017-01, Clarifying the Definition of a Business, which clarifies the definition of “a business” to assist entities with evaluating whether transactions should be accounted for as acquisitions or disposals of assets or businesses. The standard introduces a screen for determining when assets acquired are not a business and clarifies that a business must include, at a minimum, an input and a substantive process that contribute to an output to be considered a business. This standard is effective for fiscal years beginning after December 15, 2017, including interim periods within that reporting period. The Company elected to early adopt this pronouncement effective January 1, 2017.
Note 3 – Acquisitions and Divestitures
In October 2016, Nytis LLC completed an acquisition (the “EXCO Acquisition”) consisting of producing natural gas wells and natural gas gathering facilities located in the Company’s Appalachian Basin operating area. The natural gas gathering facilities are primarily used to gather the Company’s natural gas production. The acquisition was pursuant to a purchase and sale agreement, effective October 1, 2016 (the “EXCO Purchase Agreement”) by and among EXCO Production Company (WV), LLC, BG Production Company (WV), LLC and EXCO Resources (PA) LLC (collectively, the “Sellers”) and Nytis LLC, as the buyer. The purchase price of the acquired assets was $9.0 million subject to customary closing adjustments plus certain assumed obligations.
| 10 |
The EXCO Acquisition included proved developed reserves, production and operating cash flow in a location where the Company has similar assets.
EXCO Acquisition Unaudited Pro Forma Results of Operations
Below are consolidated results of operations for the nine months ended September 30, 2017 and 2016 as though the EXCO Acquisition had been completed as of January 1, 2016. The EXCO Acquisition closed October 3, 2016, and accordingly, the Company’s unaudited consolidated statement of operations for the nine months ended September 30, 2017 includes the results of operations for the nine months ended September 30, 2017 of the EXCO properties acquired.
| Unaudited Pro Forma Consolidated Results | ||||||||
| For Nine Months Ended September 30, | ||||||||
| (in thousands, except per share amounts) | 2017 | 2016 | ||||||
| Revenue | $ | 17,565 | $ | 10,990 | ||||
| Net income (loss) before non-controlling interests | 4,926 | (4,447 | ) | |||||
| Net income (loss) attributable to non-controlling interests | 92 | (435 | ) | |||||
| Net income (loss) attributable to controlling interests | 4,834 | (4,012 | ) | |||||
| Net income (loss) income per share (basic) | 0.87 | (0.74 | ) | |||||
| Net income (loss) income per share (diluted) | 0.36 | (0.74 | ) | |||||
Note 4 – Property and Equipment
Net property and equipment as of September 30, 2017 and December 31, 2016 consists of the following:
| (in thousands) | September 30, 2017 | December 31, 2016 | ||||||
| Oil and gas properties: | ||||||||
| Proved oil and gas properties | $ | 112,211 | $ | 111,771 | ||||
| Unproved properties not subject to depletion | 1,926 | 1,999 | ||||||
| Accumulated depreciation, depletion, amortization and impairment | (80,152 | ) | (78,559 | ) | ||||
| Net oil and gas properties | 33,985 | 35,211 | ||||||
| Furniture and fixtures, computer hardware and software, and other equipment | 1,661 | 990 | ||||||
| Accumulated depreciation and amortization | (888 | ) | (665 | ) | ||||
| Net other property and equipment | 773 | 325 | ||||||
| Total net property and equipment | $ | 34,758 | $ | 35,536 | ||||
As of September 30, 2017, and December 31, 2016, the Company had approximately $1.9 million and $2.0 million, respectively, of unproved oil and gas properties not subject to depletion. The costs not subject to depletion relate to unproved properties that are excluded from amortized capital costs until it is determined if proved reserves can be assigned to such properties. The excluded properties are assessed for impairment at least annually. Subject to industry conditions, evaluation of most of these properties and the inclusion of their costs in amortized capital costs is expected to be completed within five years.
| 11 |
During the nine months ended September 30, 2017 and 2016, the Company capitalized general and administrative expenses applicable to development and exploration activities of approximately $178,000 and $431,000, respectively.
Depletion expense related to oil and gas properties for the three and nine months ended September 30, 2017 was approximately $521,000, or $0.38 per Mcfe, and $1.6 million, or $0.40 per Mcfe, respectively. For the three and nine months ended September 30, 2016, depletion expense was approximately $368,000, or $0.60 per Mcfe, and $1.2 million, or $0.68 per Mcfe, respectively.
Depreciation and amortization expense related to furniture and fixtures, computer hardware and software and other equipment for the three months ended September 30, 2017 and 2016 was approximately $91,000 and $25,000, respectively and for the nine months ended September 30, 2017 and 2016 was approximately $254,000 and $85,000, respectively.
Note 5– Investments in Affiliates
Carbon California
On February 15, 2017, the Company entered into a limited liability company agreement (the “Carbon California LLC Agreement”) of Carbon California, a Delaware limited liability company established by the Company. Pursuant to the Carbon California LLC Agreement, Carbon acquired a 17.8% interest in Carbon California represented by Class B Units. The Class B Units were acquired for no cash consideration. No further equity commitments have been made or are required by the Company under the Carbon California LLC Agreement.
On February 15, 2017, Carbon California (i) issued and sold Class A Units to two institutional investors for an aggregate cash consideration of $22.0 million, (ii) entered into a Note Purchase Agreement (the “Note Purchase Agreement”) with two institutional investors for the issuance and sale of up to $25.0 million of Senior Secured Revolving Notes (the “Senior Revolving Notes”) due February 15, 2022 and (iii) entered into a Securities Purchase Agreement (the “Securities Purchase Agreement”) with one institutional investor for the issuance and sale of $10.0 million of Senior Subordinated Notes (the “Subordinated Notes”) due February 15, 2024. The Company is not a guarantor of the Senior Revolving Notes or the Subordinate Notes. The closing of the Note Purchase Agreement and the Securities Purchase Agreement on February 15, 2017, resulted in the sale and issuance by Carbon California of (i) Senior Revolving Notes in the principal amount of $10.0 million and (ii) Subordinated Notes in the original principal amount of $10.0 million. The maximum principal amount available under the Senior Revolving Notes is based upon the borrowing base attributable to Carbon California’s proved oil and gas reserves which is to be determined at least semi-annually. The current borrowing base is $15.0 million, of which $10.0 million is outstanding as of September 30, 2017.
Net proceeds from the offering transaction were used by Carbon California to complete the acquisitions of oil and gas assets in the Ventura Basin of California, which acquisitions also closed on February 15, 2017. The remainder of the net proceeds may be used to fund field development projects and to fund future complementary acquisitions and for general working capital purposes of Carbon California.
| 12 |
In connection with the Company entering into the Carbon California LLC Agreement described above and Carbon California engaging in the transactions also described above, the Company issued to an affiliate of one of the institutional investors which purchased Class A Units of Carbon California (which is also an affiliate of the Company’s largest stockholders), a warrant to purchase approximately 1.5 million shares of the Company’s common stock at an exercise price of $7.20 per share (the “California Warrant”). The exercise price for the California Warrant is payable exclusively with Class A Units of Carbon California held by this investor and the number of shares of the Company’s common stock for which the California Warrant is exercisable is determined, as of the time of exercise, by dividing (a) the aggregate unreturned capital of the warrantholder’s Class A Units of Carbon California by (b) the exercise price. The California Warrant has a term of seven years and includes certain standard registration rights with respect to the shares of the Company’s common stock issuable upon exercise of the California Warrant. If exercised, the California Warrant provides Carbon an opportunity to increase its ownership stake in Carbon California without requiring the payment of cash.
Based on its 17.8% interest in Carbon California, its ability to appoint a member to the board of directors and its role of manager of Carbon California, the Company is accounting for its investment in Carbon California under the equity method of accounting as it believes it can exert significant influence. The Company uses the hypothetical liquidation at book value method (“HLBV”) to determine its share of profits or losses in Carbon California and adjusts the carrying value of its investment accordingly. The HLBV is a balance-sheet approach that calculates the amount each member of Carbon California would receive if Carbon California were liquidated at book value at the end of each measurement period. The change in the allocated amount to each member during the period represents the income or loss allocated to that member. In the event of liquidation of Carbon California, to the extent that Carbon California has net income, available proceeds are first distributed to members holding Class A and Class B units and any remaining proceeds are then distributed to members holding Class A units, of which the Company holds none. For the three months ended September 30, 2017, and for the period of February 15, 2017 through September 30, 2017, Carbon California incurred a net loss. Should Carbon California report income, the Company will not record income (or losses) until the Company’s share of such income equals the amount of its share of losses not previously reported. While income may be recorded in future periods, the ability of Carbon California to make distributions to its owners, including us, is dependent upon the terms of its credit facilities, which currently prohibit distributions unless agreed to by the lender.
The Company accounted for the California Warrant, at issuance, as the initial investment in Carbon California and a liability based on the fair value of the California Warrant as of the date of grant (February 15, 2017). Future changes to the fair value of the California Warrant are recognized in earnings.
As of grant date of the California Warrant, the Company estimated that the fair market value of the California Warrant was approximately $5.8 million and recorded that amount to its investment in Carbon California and a long-term liability. As of September 30, 2017, the Company estimated that the fair value of the California Warrant was approximately $3.0 million. The difference in the fair value of the California Warrant from the grant date though September 30, 2017 was approximately $2.8 million and approximately $1.3 million and $2.8 million was recognized in warrant derivative gain in the Company’s unaudited Consolidated Statements of Operations for the three and nine months ended September 30, 2017, respectively. See Note 10 for additional information.
The following table sets forth, for the periods presented, selected historical financial data for Carbon California.
| (in thousands, except per share amounts) | Three Months Ended September 30, 2017 | February 15, 2017 (Inception) through September 30, 2017 | ||||||
| Revenues | $ | 1,994 | $ | 6,511 | ||||
| Operating expenses | 2,625 | 6,578 | ||||||
| Loss from continuing operations | (1,135 | ) | (1,313 | ) | ||||
| Net loss | (1,135 | ) | (1,313 | ) | ||||
Carbon Appalachia
Outlined below is a summary of i) the Company’s contributions, ii) its resulting percent of Class A unit ownership and iii) the Company’s overall resulting sharing percentage of Carbon Appalachia after giving effect of all classes of ownership. Each contribution and its use is described in detail following the table.
| Timing | Capital Contribution | Resulting Class A Units (%) | Resulting Sharing % | |||
| April 2017 | $0.24 million | 2.00% | 2.98% | |||
| August 2017 | $3.71 million | 15.20% | 16.04% | |||
| September 2017 | $2.92 million | 18.55% | 19.37% | |||
| November 2017* | Warrant exercise* | 26.50% | 27.24% |
| * | See Note 14 for further details regarding the November 1, 2017 exercise of the Appalachia Warrant |
| 13 |
On April 3, 2017, the Company finalized a limited liability company agreement (the “Carbon Appalachia LLC Agreement”) and the initial funding of Carbon Appalachia. Carbon Appalachia was formed by Carbon and two institutional investors to acquire producing assets in the Southern Appalachian Basin and has an initial equity commitment of $100.0 million, of which $37.0 million has been contributed as of September 30, 2017.
Pursuant to the Carbon Appalachia LLC Agreement, Carbon acquired a 2.0% interest in Carbon Appalachia for $240,000 of Class A Units associated with its initial equity commitment of $2.0 million. Carbon also has the ability to earn up to an additional 19.6% of Carbon Appalachia distributions (represented by Class B Units) after certain return thresholds to the holders of Class A Units are met. The Class B Units were acquired for no cash consideration.
In addition, Carbon acquired a 1.0% interest represented by Class C Units which were obtained in connection with the contribution to Carbon Appalachia of a portion of its working interest in undeveloped properties in Tennessee. If Carbon Appalachia agrees to drill horizontal Chattanooga Shale wells on these properties, it will pay 100% of the cost of drilling and completion of the first 20 wells to earn a 75% working interest in such properties. Carbon, through its subsidiary, Nytis LLC, will retain a 25% working interest in the properties.
In connection with and concurrently with the closing of the acquisition described below, Carbon Appalachia Enterprises, LLC, formerly known as Carbon Tennessee Company, LLC (“Carbon Appalachia Enterprises”), an indirect subsidiary of Carbon Appalachia, entered into a 4-year $100.0 million senior secured asset-based revolving credit facility with LegacyTexas Bank with an initial borrowing base of $10.0 million. The Company is not a guarantor of this credit facility.
Borrowings under the credit facility, along with the initial equity contributions made to Carbon Appalachia, were used to complete the acquisition of natural gas producing properties and related facilities located predominantly in Tennessee (the “April 2017 Acquisition”). The purchase price was $20.0 million, subject to normal and customary pre and post-closing adjustments, and Carbon Appalachia Enterprises used $8.5 million drawn from the credit facility toward the purchase price.
During the quarter ended September 30, 2017, CAC completed two acquisitions, one on August 15, 2015 and the other on September 29, 2017. Each acquisition is described in more detail below.
On August 15, 2017, Carbon Appalachia completed the acquisition of natural gas producing properties and related facilities located predominantly in the state of West Virginia (the “August 2017 Acquisition”). The purchase price was $21.5 million, subject to normal and customary pre- and post-closing adjustments.
On August 15, 2017, the Carbon Appalachia LLC Agreement was amended and restated. Pursuant to the amended and restated Carbon Appalachia LLC Agreement, Carbon increased its capital commitment in Carbon Appalachia from $2.0 million to $23.6 million and its portion of any subsequent capital call from 2.0% to 26.5%. Aggregate capital commitments of all Members remained at $100.0 million. As each subsequent capital call is made, Carbon will contribute 26.5%. The Company is the sole manager of Carbon Appalachia and maintains the ability to earn additional ownership interests of Carbon Appalachia (represented by Class B Units) after certain thresholds to the holders of Class A Units are met. The Company also maintains its 1.0% carried interest represented by Class C Units.
In connection with and concurrently with the closing of the August 2017 Acquisition, the borrowing base of its existing credit facility with LegacyTexas Bank increased to $22.0 million and Carbon Appalachia Enterprises borrowed $8.0 million from its existing credit facility with LegacyTexas Bank. Carbon Appalachia received equity funding in the amount of $14.0 million from its members, including $3.7 million from Carbon. The contributed funds and funds drawn from the credit facility were used to pay the purchase price.
On September 29, Carbon Appalachia Enterprises amended its 4-year $100.0 million senior secured asset-based revolving credit facility with LegacyTexas Bank, resulting in a borrowing base of $50.0 million with redeterminations as of April 1 and October 1 each year and the addition of East West Bank as a participating lender. As of September 30, 2017, there was approximately $38.0 million outstanding under the credit facility.
| 14 |
On September 29, 2017, Carbon Appalachia completed the acquisition of natural gas producing properties, natural gas gathering pipelines and related facilities located predominantly in the state of West Virginia (the “September 2017 Acquisition”). The purchase price was $41.3 million, subject to normal and customary pre- and post-closing adjustments.
In connection with and concurrently with the closing of the September 2017 Acquisition described above, Carbon Appalachia Enterprises borrowed $20.4 million from its credit facility. Carbon Appalachia received equity funding in the amount of $11.0 million from its members, including $2.9 million from Carbon. The contributed funds and funds drawn from the credit facility were used to pay the purchase price.
In connection with the Company entering into the Carbon Appalachia LLC Agreement described above and Carbon Appalachia Enterprises engaging in the April 2017 Acquisition, the Company issued to an affiliate of one of the institutional investors which purchased Class A Units of Carbon Appalachia (which is also an affiliate of the Company’s largest stockholders), a warrant to purchase approximately 408,000 shares of the Company’s common stock at an exercise price of $7.20 per share (the “Appalachia Warrant”). The exercise price for the Appalachia Warrant is payable exclusively with Class A Units of Carbon Appalachia held by this investor and the number of shares of the Company common stock for which the Appalachia Warrant is exercisable is determined, as of the time of exercise, by dividing (a) the aggregate unreturned capital of the warrantholder’s Class A Units of Carbon Appalachia plus a 10% internal rate of return by (b) the exercise price. The Appalachia Warrant has a term of seven years and includes certain standard registration rights with respect to the shares of Carbon’s common stock issuable upon exercise of the Appalachia Warrant. If exercised, the Appalachia Warrant provides Carbon an opportunity to increase its ownership stake in Carbon Appalachia without requiring the payment of cash.
Based on its 19.4% combined Class A and Class C interest (and its ability as of September 30, 2017 to earn up to an additional 16.3%) in Carbon Appalachia, its ability to appoint a member to the board of directors and its role of manager of Carbon Appalachia, the Company is accounting for its investment in Carbon Appalachia under the equity method of accounting as it believes it can exert significant influence. The Company uses the HLBV to determine its share of profits or losses in Carbon Appalachia and adjusts the carrying value of its investment accordingly. The Company’s investment in Carbon Appalachia is represented by its Class A and C interests, which it acquired by contributing approximately $6.9 million in cash and unevaluated property. In the event of liquidation of Carbon Appalachia, available proceeds are first distributed to members holding Class A and Class C Units until their contributed capital is recovered with an internal rate of return of 10%. Any additional distributions would then be shared between holders of Class A, Class B and Class C Units. For the period of April 3, 2017 through September 30, 2017, Carbon Appalachia incurred a net loss, of which the Company’s share is approximately $348,000. While income may be recorded in future periods, the ability of Carbon Appalachia to make distributions to its owners, including us, is dependent upon the terms of its credit facilities, which currently prohibit distributions unless agreed to by the lender.
The Company accounted for the Appalachia Warrant, at issuance, as an investment in Carbon Appalachia and a liability based on the fair value of the Appalachia Warrant as of the date of grant (April 3, 2017). Future changes to the fair value of the Appalachia Warrant are recognized in earnings.
As of the grant date of the Appalachia Warrant, the Company estimated that the fair value of the Appalachia Warrant was approximately $1.3 million and recorded that amount to its investment in Carbon Appalachia and a long-term liability. As of September 30, 2017, the Company estimated that the fair value of the Appalachia Warrant was approximately $1.6 million. The difference in the fair value of the Appalachia Warrant from the grant date through September 30, 2017 was approximately $323,000 and approximately $497,000 and $323,000 was recognized in derivative warrant gain in the Company’s unaudited Consolidated Statements of Operations for the three and nine months ended September 30, 2017. See Note 10 for additional information. On November 1, 2017, the holder of the Appalachia Warrant exercised the warrant. See Note 14 for additional information.
The following table sets forth, for the periods presented, selected historical financial data for Carbon Appalachia.
| (in thousands, except per share amounts) | Three Months Ended September 30, 2017 | April 3, 2017 (Inception) through September 30, 2017 | ||||||
| Revenues | $ | 1,348 | $ | 2,905 | ||||
| Operating expenses | 2,691 | 4,449 | ||||||
| Loss from continuing operations | (1,545 | ) | (1,874 | ) | ||||
| Net loss | (1,545 | ) | (1,874 | ) | ||||
Crawford County Gas Gathering Company
The Company has a 50% interest in Crawford County Gas Gathering Company, LLC (“CCGGC”) which owns and operates pipelines and related gathering and treatment facilities which services the Company’s natural gas production in the Illinois Basin. The Company accounts for its investment in CCGGC under the equity method of accounting, and its share of income or loss is recognized in the Company’s statement of operations. During the nine months ended September 30, 2017 and 2016, the Company recorded equity method income of approximately $32,000 and equity method loss of approximately $10,000, respectively, related to this investment. In addition, during the third quarter of 2017 and first quarter of 2016, the Company received cash distributions from CCGGC of approximately $68,000 and $275,000, respectively.
| 15 |
Note 6 – Bank Credit Facility
In 2016, Carbon entered into a 4-year $100.0 million senior secured asset-based revolving credit facility with LegacyTexas Bank. LegacyTexas Bank is the initial lender and acts as administrative agent.
The credit facility has a maximum availability of $100.0 million (with a $500,000 sublimit for letters of credit), which availability is subject to the amount of the borrowing base. The initial borrowing base established under the credit facility was $17.0 million. The borrowing base is subject to semi-annual redeterminations in March and September. On March 30, 2017, the borrowing base was increased to $23.0 million. As of September 30, 2017, the borrowing base remained at $23.0 million.
The credit facility is guaranteed by each existing and future direct or indirect subsidiary of Carbon (subject to certain exceptions). The obligations of Carbon and the subsidiary guarantors under the credit facility are secured by essentially all tangible and intangible personal and real property of the Company (subject to certain exclusions).
Interest is payable quarterly and accrues on borrowings under the credit facility at a rate per annum equal to either (i) the base rate plus an applicable margin between 0.50% and 1.50% or (ii) the Adjusted LIBOR rate plus an applicable margin between 3.50% and 4.50% at Carbon’s option. The actual margin percentage is dependent on the credit facility utilization percentage. Carbon is obligated to pay certain fees and expenses in connection with the credit facility, including a commitment fee for any unused amounts of 0.50%.
The credit facility contains certain affirmative and negative covenants that, among other things, limit the Company’s ability to (1) incur additional debt; (ii) incur additional liens; (iii) sell, transfer or dispose of assets; (iv) merge or consolidate, wind-up, dissolve or liquidate; (v) make dividends and distributions on, or repurchases of, equity; (vi) make certain investments; (vii) enter into certain transactions with its affiliates; (viii) enter into sales-leaseback transaction; (ix) make optional or voluntary payment of debt; (x) change the nature of its business; (xi) change its fiscal year to make changes to the accounting treatment or reporting practices; (xii) amend constituent documents; and (xiii) enter into certain hedging transactions.
The affirmative and negative covenants are subject to various exceptions, including certain basket amounts and acceptable transaction levels. In addition, the credit facility requires Carbon’s compliance, on a consolidated basis, with (i) maximum funded Debt/EBITDA ratio of 3.5 to 1.0 and (ii) a minimum current ratio of 1.0 to 1.0, commencing with the quarter ended March 31, 2017.
In the third quarter of 2017, the Company contributed approximately $6.6 to Carbon Appalachia to fund its share of producing oil and gas properties acquired during the third quarter. This funding was provided primarily with borrowings under the credit facility. The funded Debt/EBITDA and current ratio covenants negotiated at the time the credit facility was established did not contemplate the Company’s contributions for its investment in Carbon Appalachia and, as a result, the Company was not in compliance with the financial covenants associated with the credit facility as of September 30, 2017. However, the Company has obtained a waiver of the funded debt/EBITDA ratio and the current ratio covenants as of September 30, 2017. The Company has requested that LegacyTexas Bank amend such financial covenants to take into account the Company’s investment in Carbon Appalachia. While the Company believes its relationship with LegacyTexas Bank is such that the requested amendment is likely, there can be no assurance that the bank will agree to an amendment.
Carbon may at any time repay the loans under the credit facility, in whole or in part, without penalty. Carbon must pay down borrowings under the credit facility or provide mortgages of additional oil and natural gas properties to the extent that outstanding loan and letters of credit exceed the borrowing base.
As required under the terms of the credit facility, the Company entered into derivative contracts at fixed pricing for a certain percentage of its production. The Company is party to an ISDA Master Agreement with BP Energy Company that establishes standard terms for the derivative contracts and an inter-creditor agreement with LegacyTexas Bank and BP Energy Company whereby any credit exposure related to the derivative contracts entered into by the Company and BP Energy Company is secured by the collateral and backed by the guarantees supporting the credit facility.
As of September 30, 2017, there were approximately $22.1 million in outstanding borrowings and approximately $860,000 of additional borrowing capacity available under the credit facility. The Company’s effective borrowing rate at September 30, 2017 was approximately 5.82%.
| 16 |
Note 7 – Income Taxes
The Company recognizes deferred income tax assets and liabilities for the estimated future tax consequences attributable to temporary differences between the financial statement carrying amounts of existing assets and liabilities and their respective tax bases. The Company has net operating loss carryforwards available in certain jurisdictions to reduce future taxable income. Future tax benefits for net operating loss carryforwards are recognized to the extent that realization of these benefits is considered more likely than not. To the extent that available evidence raises doubt about the realization of a deferred income tax asset, a valuation allowance is established.
At September 30, 2017, the Company has established a full valuation allowance against the balance of net deferred tax assets.
Note 8 – Stockholders’ Equity
Authorized and Issued Capital Stock
Effective March 15, 2017 and pursuant to a reverse stock split approved by the shareholders and Board of Directors, each 20 shares of issued and outstanding common stock became one share of common stock and no fractional shares were issued. References to the number of shares and price per share give retroactive effect to the reverse stock split for all periods presented.
As of September 30, 2017, the Company had 200,000,000 shares of common stock authorized with a par value of $0.01 per share, of which approximately 5.6 million were issued and outstanding and 1,000,000 shares of preferred stock authorized with a par value of $0.01 per share, none of which were issued and outstanding. During the first nine months of 2017, the increase in the Company’s issued and outstanding common stock was a result of restricted stock and performance units that vested during the period.
Equity Plans Prior to Merger
Pursuant to the merger of Nytis USA with and into the Company in 2011, all options, warrants and restricted stock were adjusted to reflect the conversion ratio used in the merger.
| 17 |
Nytis USA Restricted Stock Plan
As of September 30, 2017, all restricted stock issued under the Nytis USA Restricted Stock Plan (“Nytis USA Plan”) have vested. The Company accounted for these grants at their intrinsic value. From the date of grant through March 31, 2013, the Company estimated that none of these shares would vest and accordingly, no compensation cost had been recorded through March 31, 2013.
In June 2013, the vesting terms of these restricted stock grants were modified so that 25% of the shares would vest on the first of January from 2014 through 2017. As such, the Company recognized compensation expense for those restricted stock grants based on the fair value of the shares on the date the vesting terms were modified. Compensation expense recognized for those restricted stock grants was approximately $84,000 and approximately $252,000 for the three and nine months ended September 30, 2016, respectively. No compensation expense was recognized for those restricted stock grants for the three and nine months ended September 30, 2017. As of December 31, 2016, compensation costs relative to those restricted stock grants were fully recognized.
Carbon Stock Incentive Plans
The Company has two stock plans, the Carbon 2011 and 2015 Stock Incentive Plans (collectively the “Carbon Plans”). The Carbon Plans were approved by the shareholders of the Company and in the aggregate provide for the issuance of approximately 1.1 million shares of common stock to Carbon officers, directors, employees or consultants eligible to receive these awards under the Carbon Plans.
The Carbon Plans provide for granting Director Stock Awards to non-employee directors and for granting Incentive Stock Options, Non-qualified Stock Options, Restricted Stock Awards, Performance Awards and Phantom Stock Awards, or a combination of the foregoing, as is best suited to the circumstances of the particular employee, officer, director or consultant.
Restricted Stock
During the nine months ended September 30, 2017, approximately 81,000 shares of restricted stock were granted under the terms of the Carbon Plan in addition to 462,000 shares granted during previous years. For employees, these restricted stock awards either vest ratably over a three-year service period or cliff vest after a three-year service period. For non-employee directors, the awards vest upon the earlier of a change in control of the Company or the date their membership on the Board of Directors is terminated other than for cause. The Company recognizes compensation expense for these restricted stock grants based on the estimated grant date fair value of the shares, amortized ratably over three years for employee awards (based on the required service period for vesting) and seven years for non-employee director awards (based on a market survey of the average tenure of directors among U.S. public companies). As of September 30, 2017, approximately 258,000 of these restricted stock grants have vested.
Compensation costs recognized for these restricted stock grants were approximately $160,000 and $186,000 for the three months ended September 30, 2017 and 2016, respectively, and $513,000 and $554,000 for the nine months ended September 30, 2017 and 2016, respectively. As of September 30, 2017, there was approximately $1.3 million of unrecognized compensation costs related to these restricted stock grants. This cost is expected to be recognized over the next 6.5 years.
Performance Units
During the nine months ended September 30, 2017, approximately 60,000 shares of performance units were granted under the terms of the Carbon plans in addition to approximately 401,000 shares granted during previous years. The performance units represent a contractual right to receive one share of the Company’s common stock subject to the terms and conditions of the agreements including the achievement of certain performance measures relative to a defined peer group or the achievement of certain performance measures over a defined period of time for the Company as well as the lapse of forfeiture restrictions pursuant to the terms and conditions of the agreements, including for certain of the grants, the requirement of continuous employment by the grantee prior to a change in control of the Company. Based on the relative achievement of performance, approximately 272,000 restricted performance units are outstanding as of September 30, 2017.
| 18 |
The Company accounts for the performance units granted during 2012 and 2014 through 2017 at their fair value determined at the date of grant. The final measurement of compensation cost will be based on the number of performance units that ultimately vest. At September 30, 2017, the Company estimated that none of the performance units granted in 2012 and 2016 through 2017 would vest due to change in control or other performance provisions and accordingly, no compensation cost has been recorded for these performance units. At September 30, 2016, the Company estimated that it was probable that certain of the performance units granted in 2014 and 2015 would vest. Compensation costs of approximately $53,000 and $239,000 related to these performance units were recognized for the three and nine months ended September 30, 2017, respectively. Compensation expense of approximately $1.1 million was recognized for these performance units for the three and nine months ended September 30, 2016. As of September 30, 2017, if change in control and other performance provisions pursuant to the terms and conditions of these agreements are met in full, the estimated unrecognized compensation cost related to the performance units granted in 2012 and 2014 through 2017 would be approximately $2.4 million.
The performance units granted in 2013 contain specific vesting provisions, no change in control provisions nor any performance conditions other than stock price performance. Due to different earning requirements compared to the performance units granted in 2012 and 2014 through 2017, the Company recognized compensation expense for the performance units granted in 2013 based on the grant date fair value of the performance units, amortized ratably over three years (the performance period). The fair value of the performance units granted in 2013 was estimated using a Monte Carlo simulation (“MCS”) valuation model using the following key assumptions: no expected dividends, volatility of our stock and those of defined peer companies used to determine our performance relative to the defined peer group, a risk-free interest rate and an expected life of three years. Compensation costs recognized for these performance unit grants were nil and approximately $127,000 for the three and nine months ended September 30, 2016, respectively. As of September 30, 2016, compensation costs relative to these performance units had been fully recognized.
Note 9 – Accounts Payable and Accrued Liabilities
Accounts payable and accrued liabilities at September 30, 2017 and December 31, 2016 consist of the following:
| (in thousands) | September 30, 2017 | December 31, 2016 | ||||||
| Accounts payable | $ | 1,801 | $ | 2,315 | ||||
| Oil and gas revenue payable to oil and gas property owners | 1,583 | 1,415 | ||||||
| Gathering and transportation payables | 498 | 468 | ||||||
| Production taxes payable | 212 | 113 | ||||||
| Drilling advances received from joint venture partner | 422 | 955 | ||||||
| Accrued drilling costs | - | 4 | ||||||
| Accrued lease operating costs | 535 | 282 | ||||||
| Accrued ad valorem taxes | 1,461 | 1,552 | ||||||
| Accrued general and administrative expenses | 1,085 | 1,572 | ||||||
| Accrued interest | 232 | 184 | ||||||
| Other liabilities | 264 | 261 | ||||||
| Total accounts payable and accrued liabilities | $ | 8,093 | $ | 9,121 | ||||
| 19 |
Note 10 – Fair Value Measurements
Authoritative guidance defines fair value as the price that would be received to sell an asset or paid to transfer a liability (an exit price) in an orderly transaction between market participants at the measurement date. The guidance establishes a hierarchy for inputs used in measuring fair value that maximizes the use of observable inputs and minimizes the use of unobservable inputs by requiring that the most observable inputs be used when available. Observable inputs are inputs that market participants would use in pricing the asset or liability developed based on market data obtained from sources independent of the Company. Unobservable inputs are inputs that reflect the Company’s assumptions of what market participants would use in pricing the asset or liability developed based on the best information available under the circumstances. The hierarchy is broken down into three levels based on the reliability of the inputs as follows:
| Level 1: | Quoted prices are available in active markets for identical assets or liabilities; | |
| Level 2: | Quoted prices in active markets for similar assets or liabilities that are observable for the asset or liability; or | |
| Level 3: | Unobservable pricing inputs that are generally less observable from objective sources, such as discounted cash flow models or valuations. |
Financial assets and liabilities are classified based on the lowest level of input that is significant to the fair value measurement. The Company’s policy is to recognize transfers in and/or out of the fair value hierarchy as of the end of the reporting period for which the event or change in circumstances caused the transfer. The Company has consistently applied the valuation techniques discussed below for all periods presented.
Assets Measured and Recorded at Fair Value on a Recurring Basis
The following table presents the Company’s financial assets and liabilities that were accounted for at fair value on a recurring basis as of September 30, 2017 and December 31, 2016 by level within the fair value hierarchy:
| (in thousands) | Fair Value Measurements Using | |||||||||||||||
| Level 1 | Level 2 | Level 3 | Total | |||||||||||||
| September 30, 2017 | ||||||||||||||||
| Assets: | ||||||||||||||||
| Commodity derivatives | $ | - | $ | 247 | $ | - | $ | 247 | ||||||||
| Liabilities: | ||||||||||||||||
| Warrant derivatives | $ | - | $ | - | $ | 4,600 | $ | 4,600 | ||||||||
| December 31, 2016 | ||||||||||||||||
| Liabilities: | ||||||||||||||||
| Commodity derivatives | $ | - | $ | 1,932 | $ | - | $ | 1,932 | ||||||||
Level 2 Fair Value Measurements
As of September 30, 2017, the Company’s commodity derivative financial instruments are comprised of twelve natural gas swap agreements, ten oil swap agreements and one natural gas costless collar agreement. The fair values of these agreements are determined under an income valuation technique. The valuation requires a variety of inputs, including contractual terms, published forward prices, volatilities for options, and discount rates, as appropriate. The Company’s estimates of fair value of derivatives include consideration of the counterparty’s credit worthiness, the Company’s credit worthiness and the time value of money. The consideration of these factors resulted in an estimated exit-price for each derivative asset or liability under a market place participant’s view. All the significant inputs are observable, either directly or indirectly; therefore, the Company’s derivative instruments are included within the Level 2 fair value hierarchy. The counterparty for all the Company’s commodity financial instruments as of September 30, 2017 is BP Energy Company.
Level 3 Fair Value Measurements
A third-party valuation specialist is utilized to determine the fair value of the Company’s California Warrant and Appalachia Warrant. These warrants are designated as Level 3. The Company reviews these valuations, including the related model inputs and assumptions, and analyzes changes in fair value measurements between periods. The Company corroborates such inputs, calculations and fair value changes using various methodologies, and reviews unobservable inputs for reasonableness utilizing relevant information from other published sources. Due to the limited trading volume of the Company’s shares, adjustments are made to the per share value.
| 20 |
The Company estimated the fair value of the California Warrant on February 15, 2017, the grant date of the warrant, to be approximately $5.8 million, using a call option pricing model with the following assumptions: a seven-year term, exercise price of $7.20, volatility rate of 41.8% and a risk-free rate of 2.3%. As the Company will receive Class A units in Carbon California in the event the holder exercises the California Warrant, the Company also considered the fair value of the Class A units in its valuation. The Company remeasured the California Warrant as of September 30, 2017, using a Monte Carlo valuation model which utilized unobservable inputs including the percentage return on the Company’s shares at various timelines, the percentage return on the privately-held Carbon California Class A units at various timelines, an exercise price of $7.20, volatility rate of 45%, a risk-free rate of 2.1% and an estimated remaining term of 6.4 years. For the quarter ended September 30, 2017, it was determined that a change from the Black Scholes model to the Monte Carlo valuation model with the ability to incorporate the multitude of probabilities associated with various market participant exercise scenarios was appropriate given the passage of time between the formation and funding of Carbon California in February 2017. As of September 30, 2017, the fair value of the California Warrant was approximately $3.0 million.
The Company estimated the fair value of the Appalachia Warrant on April 3, 2017, the grant date of the warrant, to be approximately $1.3 million, using a call option pricing model with the following assumptions: a seven-year term, exercise price of $7.20, volatility rate of 39.3% and a risk-free rate of 2.1%. As the Company will receive Class A units in Carbon Appalachia in the event the holder exercises the Appalachia Warrant, the Company also considered the fair value of the Class A units in its valuation. The Company remeasured the Appalachia Warrant as of September 30, 2017, using a Monte Carlo valuation model which utilized unobservable inputs including the percentage return on the Company’s shares at various timelines, the percentage return on the privately-held Carbon Appalachia Class A units at various timelines, an exercise price of $7.20, volatility rate of 45%, a risk-free rate of 2.1% and an estimated remaining term of 6.5 years. For the quarter ended September 30, 2017, it was determined that a change from the Black Scholes model to the Monte Carlo valuation model with the ability to incorporate the multitude of probabilities associated with various market participant exercise scenarios was appropriate given the passage of time between the formation and funding of Carbon Appalachia in April 2017. As of September 30, 2017, the fair value of the Appalachia Warrant was approximately $1.6 million.
The following table summarizes the changes in fair value of our financial instruments classified as Level 3 in the fair value hierarchy:
| (in thousands) | California Warrant | Appalachia Warrant | Total | |||||||||
| Balance, December 31, 2016 | $ | - | $ | - | $ | - | ||||||
| Warrant derivative liability | 5,769 | 1,325 | 7,094 | |||||||||
| Unrealized (gain) loss included in warrant derivative gain | (2,817 | ) | 323 | 2,494 | ||||||||
| Balance, September 30, 2017 | $ | 2,952 | $ | 1,648 | $ | 4,600 | ||||||
Assets Measured and Recorded at Fair Value on a Non-Recurring Basis
The fair value of the Company’s asset retirement obligations are measured and recorded at fair value on a non-recurring basis, are based on unobservable pricing inputs and therefore, are included within the Level 3 fair value hierarchy.
The Company uses the income valuation technique to estimate the fair value of asset retirement obligations using the amounts and timing of expected future dismantlement costs, credit-adjusted risk-free rates and time value of money. During the nine months ended September 30, 2017 and 2016, the Company recorded additions to asset retirement obligations of approximately $5,000 in each period. See Note 2 for additional information.
Note 11 – Physical Delivery Contracts and Gas Derivatives
The Company has historically used commodity-based derivative contracts to manage exposures to commodity price on a portion of its oil and natural gas production. The Company does not hold or issue derivative financial instruments for speculative or trading purposes. The Company also enters into, on occasion, oil and natural gas physical delivery contracts to effectively provide commodity price hedges. Because these contracts are not expected to be net cash settled, they are considered to be normal sales contracts and not derivatives. Therefore, these contracts are not recorded at fair value in the unaudited Consolidated Financial Statements.
Pursuant to the terms of the Company’s credit facility with LegacyTexas Bank, the Company has entered into swap and costless collar derivative agreements to hedge a portion of its oil and natural gas production for 2017 through 2019. As of September 30, 2017, these derivative agreements consisted of the following:
| Natural Gas Swaps | Natural Gas Collars | Oil Swaps | ||||||||||||||||||||||
| Weighted | Weighted | Weighted | ||||||||||||||||||||||
| Average | Average Price | Average | ||||||||||||||||||||||
| Year | MMBtu | Price (a) | MMBtu | Range (a) | Bbl | Price (b) | ||||||||||||||||||
| 2017 | 900,000 | $ | 3.27 | 30,000 | $3.00 - $3.48 | 23,000 | $ | 52.64 | ||||||||||||||||
| 2018 | 3,390,000 | $ | 3.01 | 90,000 | $3.00 - $3.48 | 60,000 | $ | 53.36 | ||||||||||||||||
| 2019 | 1,920,000 | $ | 2.85 | - | - | 48,000 | $ | 53.76 | ||||||||||||||||
| (a) | NYMEX Henry Hub Natural Gas futures contract for the respective delivery month. |
| (b) | NYMEX Light Sweet Crude West Texas Intermediate futures contract for the respective delivery month |
| 21 |
For its swap instruments, the Company receives a fixed price for the hedged commodity and pays a floating price to the counterparty. The fixed-price payment and the floating-price payment are netted, resulting in a net amount due to or from the counterparty. Costless collars are designed to establish floor and ceiling prices on anticipated future oil and gas production. The ceiling establishes a maximum price that the Company will receive for the volumes under contract, while the floor establishes a minimum price.
The following table summarizes the fair value of the derivatives recorded in the unaudited Consolidated Balance Sheets.
These derivative instruments are not designated as cash flow hedging instruments for accounting purposes:
| (in thousands) | September 30, 2017 | December 31, 2016 | ||||||
| Commodity derivative contracts: | ||||||||
| Current assets | $ | 190 | $ | - | ||||
| Non-current assets | $ | 57 | $ | - | ||||
| Current liabilities | $ | - | $ | 1,341 | ||||
| Non-current liabilities | $ | - | $ | 591 | ||||
The table below summarizes the commodity settlements and unrealized gains and losses related to the Company’s derivative instruments for the three and nine months ended September 30, 2017 and 2016. These commodity derivative settlements and unrealized gains and losses are recorded and included in commodity derivative income or loss in the accompanying unaudited Consolidated Statements of Operations.
| (in thousands) | Three Months Ended September 30, | Nine Months Ended September 30, | ||||||||||||||
| 2017 | 2016 | 2017 | 2016 | |||||||||||||
| Commodity derivative contracts: | ||||||||||||||||
| Settlement gains | $ | 345 | $ | 17 | $ | 463 | $ | 349 | ||||||||
| Unrealized (losses) gains | (844 | ) | 143 | 2,179 | (823 | ) | ||||||||||
| Total settlement and unrealized (losses) gains, net | $ | (499 | ) | $ | 160 | $ | 2,642 | $ | (474 | ) | ||||||
Commodity derivative settlement gains and losses are included in cash flows from operating activities in the Company’s unaudited Consolidated Statements of Cash Flows.
The counterparty in all the Company’s derivative instruments is BP Energy Company. The Company has entered into an ISDA Master Agreement with BP Energy Company that establishes standard terms for the derivative contracts and an inter-creditor agreement with LegacyTexas Bank and BP Energy Company whereby any credit exposure related to the derivative contracts entered into by the Company and BP Energy Company is secured by the collateral and backed by the guarantees supporting the credit facility.
The Company nets its derivative instrument fair value amounts executed with its counterparty pursuant to an ISDA master agreement, which provides for the net settlement over the term of the contracts and in the event of default or termination of the contracts. The following table summarizes the location and fair value amounts of all derivative instruments in the unaudited Consolidated Balance Sheet, as well as the gross recognized derivative assets, liabilities and amounts offset in the unaudited Consolidated Balance Sheet as of September 30, 2017.
| Net | ||||||||||||
| Gross | Recognized | |||||||||||
| Recognized | Gross | Fair Value | ||||||||||
| Assets/ | Amounts | Assets/ | ||||||||||
| Balance Sheet Classification | Liabilities | Offset | Liabilities | |||||||||
| Commodity derivative assets: | ||||||||||||
| Current assets | $ | 448 | $ | (258 | ) | $ | 190 | |||||
| Other long-term assets | 305 | (248 | ) | 57 | ||||||||
| Total derivative assets | $ | 753 | $ | (506 | ) | $ | 247 | |||||
| Commodity derivative liabilities: | ||||||||||||
| Current liability | $ | 258 | $ | (258 | ) | $ | - | |||||
| Non-current liabilities | 248 | (248 | ) | - | ||||||||
| Total derivative liabilities | $ | 506 | $ | (506 | ) | $ | - | |||||
Due to the volatility of oil and natural gas prices, the estimated fair values of the Company’s derivatives are subject to fluctuations from period to period.
| 22 |
Note 12 – Commitments
Employment Agreements
The Company has entered into employment agreements with certain executives and officers of the Company. The term of the agreements generally range from one to two years and provide for renewal provisions in one year increments thereafter. The agreements provide for, among other items, severance and continuation of benefit payments upon termination of employment or certain change of control events.
Firm Transportation Contracts
The Company has entered into long-term firm transportation contracts to ensure the transport for a portion of its gas production to purchasers. Firm transportation volumes and the related demand charges for the remaining term of these contracts at September 30, 2017 are summarized in the table below.
| Period | Dekatherms
per day | Demand
Charges | ||||||
| Oct 2017 - Apr 2018 | 5,530 | $ | 0.20 - $0.65 | |||||
| May 2018 - May 2020 | 3,230 | $ | 0.20 - $0.62 | |||||
| Apr 2020 – May 2020 | 2,150 | $ | 0.20 | |||||
| Jun 2020 – May 2036 | 1,000 | $ | 0.20 | |||||
A liability of approximately $400,000 related to firm transportation contracts assumed in asset acquisitions, which represents the remaining commitment, is reflected on the Company’s unaudited Consolidated Balance Sheet as of September 30, 2017. The fair value of these firm transportation obligations was determined based upon the contractual obligations assumed by the Company and discounted based upon the Company’s effective borrowing rate. These contractual obligations are being amortized on a monthly basis as the Company pays these firm transportation obligations.
Capital Commitments
In its participation as a Class A member of Carbon Appalachia, the Company has made a capital commitment of $23.6 million, of which it has contributed $6.9 million as of September 30, 2017.
Litigation
From time to time, the Company is a party to various commercial and regulatory claims, pending or threatened legal action, and other proceedings that arise in the ordinary course of business. It is the opinion of management that none of the current matters of contention are reasonably likely to have a material adverse impact on our business, financial position, results of operations, or cash flows.
Note 13 – Supplemental Cash Flow Disclosure
Supplemental cash flow disclosures for the nine months ended September 30, 2017 and 2016 are presented below:
| Nine Months Ended September 30, | ||||||||
| (in thousands) | 2017 | 2016 | ||||||
| Cash paid during the period for: | ||||||||
| Interest | $ | 645 | $ | 117 | ||||
| Non-cash transactions: | ||||||||
| Increase in net asset retirement obligations | $ | 5 | $ | 5 | ||||
| Decrease in accounts payable and accrued liabilities included in oil and gas properties | $ | (12 | ) | $ | (23 | ) | ||
| Issuance of warrants for investment in affiliates | $ | 7,094 | $ | - | ||||
Note 14 – Subsequent Events
On November 1, 2017, the holder of the Appalachia Warrant (see Note 5) exercised the warrant resulting in the issuance of 432,051 shares of the Company’s common stock in exchange for Class A Units representing approximately 7.95% of then outstanding Class A Units of Carbon Appalachia. After giving effect to the exercise, Carbon owns 26.5% of Carbon Appalachia outstanding Class A Units along with its 1% Class C ownership. The Company is evaluating any accounting effects of the exercise.
On November 13, 2017, LegacyTexas Bank reaffirmed the Company’s borrowing base associated with the credit facility at $23.0 million.
| 23 |
ITEM 2. Management’s Discussion and Analysis of Financial Condition and Results of Operations
General Overview
All expectations, forecasts, assumptions and beliefs about our future results, condition, operations and performance are forward-looking statements as described under the heading “Forward Looking Statements” at the end of this Item. Our actual results may differ materially because of a number of risks and uncertainties. The following discussion and analysis should be read in conjunction with the Company’s Consolidated Financial Statements and Notes thereto and the information included or incorporated by reference in the Company’s 2016 Annual Report on Form 10-K as filed with the Securities and Exchange Commission (“SEC”) under the headings “Risk Factors” and “Management’s Discussion and Analysis of Financial Condition and Results of Operations.”
Carbon is an independent oil and natural gas company engaged in the acquisition, exploration, development and production of oil and natural gas properties located in the United States. We focus on conventional and unconventional reservoirs, including shale, tight sands and coalbed methane. Our executive offices are in Denver, Colorado and we maintain offices in Lexington, Kentucky, and Santa Paula, California from which we conduct our oil and gas operations.
At September 30, 2017, our proved developed reserves were comprised of 7% oil and 93% natural gas. Our current capital expenditure program is focused on the acquisition and development of oil and natural gas properties in areas where we currently operate. We believe that our asset and lease position, combined with our low operating expense structure and technical expertise, provides us with a portfolio of opportunities for the development of our oil and natural gas properties. Our growth plan is centered on the following activities:
| ● | Additional acquisition and development of oil and gas properties through our equity method investments in Carbon Appalachia and Carbon California; | |
| ● | Producing property and land acquisitions and development projects that provide attractive risk adjusted rates of return and complement our existing asset base; and | |
| ● | Development, optimization and maintenance of a portfolio of low risk, long-lived oil and natural gas properties that provide stable cash flows and attractive risk adjusted rates of return. |
Our revenue, profitability and future growth rate depend on many factors which are beyond our control, including but not limited to, economic, political and regulatory developments and competition from other industry participants. Our financial results are sensitive to fluctuations in oil and natural gas prices. Oil and gas prices historically have been volatile and may fluctuate widely in the future. The following table highlights the quarterly average of NYMEX oil and natural gas prices for the last eight calendar quarters:
| 2015 | 2016 | 2017 | ||||||||||||||||||||||||||||||
| Q4 | Q1 | Q2 | Q3 | Q4 | Q1 | Q2 | Q3 | |||||||||||||||||||||||||
| Oil (Bbl) | $ | 42.17 | $ | 33.51 | $ | 45.60 | $ | 44.94 | $ | 49.33 | $ | 51.86 | $ | 48.29 | $ | 48.19 | ||||||||||||||||
| Natural Gas (MMBtu) | $ | 2.17 | $ | 2.06 | $ | 1.98 | $ | 2.93 | $ | 2.98 | $ | 3.07 | $ | 3.09 | $ | 2.89 | ||||||||||||||||
Low oil and natural gas prices may decrease our revenues, may reduce the amount of oil and natural gas that the Company can produce economically and potentially lower our oil and natural gas reserves. The Company’s estimated proved reserves may decrease if the economic life of the underlying producing wells is shortened as a result of lower oil and natural gas prices. A substantial or extended decline in oil or natural gas prices may result in future impairments of our proved reserves and may materially and adversely affect our future business, financial condition, cash flows, results of operations or liquidity. Lower oil and natural gas prices may also reduce the amount of borrowing base under our bank credit facility, which is determined at the discretion of our lender and may make it more difficult to comply with the covenants and other restrictions under our bank credit facility.
| 24 |
The Company uses the full cost method of accounting for its oil and gas properties and performs a ceiling test quarterly. The ceiling calculation utilizes a rolling 12 month average commodity price. Due to the effect of lower commodity prices in 2016, the Company recognized an impairment of approximately $4.3 million for the year ended December 31, 2016. The Company has not recorded an impairment in 2017.
Future write downs or impairments, if any, are difficult to predict and will depend not only on commodity prices, but also other factors that include, but are not limited to, incremental proved reserves that may be added each period, revisions to previous reserve estimates, capital expenditures and operating costs. There are numerous uncertainties inherent in the estimation of proved reserves and accounting for oil and natural gas properties in subsequent periods. The estimates described in this paragraph should not be construed as indicative of our future results.
Impairment charges do not affect cash flows from operating activities, but do adversely affect net income and stockholders’ equity. An extended decline in oil or natural gas prices may materially and adversely affect our future business, financial condition, cash flows and liquidity.
Future property acquisitions or dispositions could have a material impact on our financial condition and results of operations by increasing or decreasing our reserves, production and revenues as well as expenses and future capital expenditures. We currently anticipate that we would finance any future acquisitions with available borrowings under our credit facility, sales of properties or the issuance of additional equity or debt.
Operational Highlights
Weakness in commodity prices has had an adverse impact on our results of operations and the amount of cash flow available to invest in exploration and development activities. Based on recent and expected future prices for oil and natural gas and the resultant reduced rate of return on drilling projects, we reduced our drilling activity to manage and optimize the utilization of our capital resources. During 2016 and for the nine months ended September 30, 2017, we concentrated our efforts on the acquisition of producing properties including the EXCO Acquisition and our equity investments in Carbon California Company, LLC (“Carbon California”) and Carbon Appalachian Company, LLC (“Carbon Appalachia”). Our field development activities have consisted principally of the optimization of our gathering facilities and marketing arrangements to provide greater flexibility in transporting our natural gas production to markets with more favorable pricing.
At September 30, 2017, we had approximately 411,000 net acres of mineral leases located in the Appalachian and Illinois Basins of the United States. Approximately 66% of this acreage is held by production and of the remaining acreage, approximately 55% have lease terms of greater than five years remaining in the primary term or contractual extension periods.
In the Appalachia Basin, the principal focus of our producing property acquisition and development activities has related to the EXCO Acquisition. Since the acquisition of these properties in October 2016, we have focused on the reduction of operating expenses, optimization of natural gas gathering and compression facilities and the identification of development project opportunities. In addition, since 2010, we have drilled 56 horizontal wells in a Berea sandstone oil formation located in Eastern Kentucky, including two wells in 2017. These activities have enhanced our well performance, improved well drilling and completion performance, including reduced drilling days, increased horizontal lateral length, decreased cost per frac stage and reduced days from spud to first production. In addition, we have established an infrastructure of oil and natural gas gathering and water handling and disposal facilities which will benefit the economics of future drilling.
Our natural gas properties are largely held by production and contain a low risk multi-year development inventory of potential future drilling locations which, at the appropriate level of natural gas commodity price, will provide significant drilling and completion opportunities from multiple proven producing formations.
| 25 |
Recent Developments and Factors Affecting Comparability
The Company is evaluating producing property and land acquisition opportunities in its operating area, including investments through its affiliates, in California and the Appalachian Basin that would expand the Company’s operations and provide attractive risk adjusted rates of return on invested capital. The drilling of oil and natural gas wells during 2017 is contingent on our expectation of future oil and natural gas prices.
Effective March 15, 2017 and pursuant to a reverse stock split approved by the shareholders and Board of Directors, each 20 shares of issued and outstanding common stock became one share of common stock and no fractional shares were issued. All references to the number of shares of common stock and per share amounts give retroactive effect to the reverse stock split for all periods presented.
Acquisitions
EXCO Acquisition
In October 2016, Nytis LLC completed the acquisition of producing natural gas wells and natural gas gathering facilities located primarily in West Virginia from EXCO Production Company (WV), LLC; BG Production Company (WV), LLC; and EXCO Resources (PA) LLC. The purchase price of the acquired assets was $9.0 million subject to customary closing adjustments plus certain assumed obligations.
The acquired assets increased the natural gas production, reserves and cash flow of the Company and have resulted in a reduction in general and administrative expenses (per unit of production). The assets also contain an inventory of development projects. The acquired assets consisted of the following:
| ● | Approximately 2,300 natural gas wells and over 900 miles of associated natural gas gathering pipelines and compression facilities operated by the Company that are primarily used for the acquired wells. As of September 30, 2017, these wells were producing approximately 8,100 net Mcfe per day (95% natural gas). |
| ● | Average working and net revenue interest of the acquired wells of 94% and 79%, respectively. |
| ● | Estimated proved developed producing reserves of approximately 46.4 Bcfe (97% natural gas). |
| ● | Approximately 201,000 net acres of oil and natural gas mineral interests. |
In connection with and concurrently with the closing of the EXCO Acquisition, Carbon entered into a 4-year $100.0 million senior secured asset-based revolving credit facility with LegacyTexas Bank. Borrowings under the credit facility were used (i) to pay off and terminate Nytis LLC’s then existing credit facility, (ii) to pay the purchase price of the EXCO Acquisition, (iii) to pay costs and expenses associated with the acquisition and the credit facility and (iv) provide working capital for the Company. The initial borrowing base established under the credit facility was $17.0 million. The borrowing base is subject to semi-annual redeterminations in March and September, commencing March 2017. On March 30, 2017, the borrowing base was increased to $23.0 million.
Investments in Affiliates
Carbon California
On February 15, 2017, the Company entered into a limited liability company agreement (the “Carbon California LLC Agreement”) of Carbon California. Carbon California was formed by Carbon and two institutional investors to acquire producing assets in California.
Carbon California (i) issued and sold Class A Units to two institutional investors for an aggregate cash consideration of $22.0 million, (ii) entered into a Note Purchase Agreement (the “Note Purchase Agreement”) with two institutional investors for the issuance and sale of up to $25.0 million of Senior Secured Revolving Notes (the “Senior Revolving Notes”) due February 15, 2022 and (iii) entered into a Securities Purchase Agreement (the “Securities Purchase Agreement”) with one institutional investor for the issuance and sale of $10.0 million of Senior Subordinated Notes (the “Subordinated Notes”) due February 15, 2024. The Company is not a guarantor of the Senior Revolving Notes or the Subordinate Notes. The closing of the Note Purchase Agreement and the Securities Purchase Agreement on February 15, 2017, resulted in the sale and issuance by Carbon California of (i) Senior Revolving notes in the principal amount of $10.0 million and (ii) Subordinated Notes in the original principal amount of $10.0 million. The maximum principal amount available under the Senior Revolving Notes is based upon the borrowing base attributable to Carbon California’s proved oil and gas reserves which is to be determined at least semi-annually. The current borrowing base is $15.0 million, of which $10.0 million is outstanding as of September 30, 2017.
Pursuant to the Carbon California LLC Agreement, Carbon acquired a 17.8% interest in Carbon California represented by Class B Units. The Class B Units were acquired for no cash consideration. In connection with its role as the manager of Carbon California, $600,000 of general and administrative expenses on an annual basis is to be reimbursed to the Company by Carbon California.
| 26 |
Net proceeds from the offering transactions were used by Carbon California to complete the acquisitions of oil and gas assets in the Ventura Basin of California, which acquisitions also closed on February 15, 2017. The remainder of the net proceeds are being used to fund field development projects and to fund future complementary acquisitions and for general working capital purposes of Carbon California. The Company formed Carbon California Operating Company, LLC (“CCOC”) to operate the acquired assets.
In connection with the Company entering into the Carbon California LLC Agreement described above and Carbon California engaging in the transactions also described above, the Company issued to an affiliate of one of the institutional investors which purchased Class A Units of Carbon California (which is also an affiliate of the Company’s largest stockholders), a warrant to purchase approximately 1.5 million shares of the Company’s common stock at an exercise price of $7.20 per share (the “Warrant”). The exercise price for the Warrant is payable exclusively with Class A Units of Carbon California held by this investor and the number of shares of the Company’s common stock for which the Warrant is exercisable is determined, as of the time of exercise, by dividing (a) the aggregate unreturned capital of the warrantholder’s Class A Units of Carbon California by (b) the exercise price. The Warrant has a term of seven years and includes certain standard registration rights with respect to the shares of the Company’s common stock issuable upon exercise of the Warrant. If exercised, the Warrant provides the Company an opportunity to increase its ownership stake in Carbon California without requiring the payment of cash.
As of grant date of the California Warrant, the Company estimated that the fair market value of the California Warrant was approximately $5.8 million and recorded that amount to its investment in Carbon California and a long-term liability. As of September 30, 2017, the Company estimated that the fair value of the California Warrant was approximately $3.0 million. The difference in the fair value of the California Warrant from the grant date though September 30, 2017 was approximately $2.8 million and approximately $1.3 million and $2.8 million was recognized in warrant derivative gain in the Company’s unaudited Consolidated Statements of Operations for the three and nine months ended September 30, 2017, respectively.
The following table sets forth, for the periods presented, selected unaudited historical statements of operations data for Carbon California.
| Three Months Ended | February 15, 2017 (Inception) through | |||||||
| (in thousands except production data) | September 30, 2017 | September 30, 2017 | ||||||
| (Unaudited) | (Unaudited) | |||||||
| Revenue: | ||||||||
| Natural gas sales | $ | 329 | $ | 777 | ||||
| Oil sales | 2,130 | 4,839 | ||||||
| NGL sales | 186 | 393 | ||||||
| Commodity derivative (loss) gain | (651 | ) | 502 | |||||
| Total revenues | 1,994 | 6,511 | ||||||
| Expenses: | ||||||||
| Lease operating and transportation expenses | 1,691 | 3,627 | ||||||
| Production and property taxes | 84 | 369 | ||||||
| General and administrative | 398 | 1,481 | ||||||
| Depreciation, depletion and amortization | 391 | 935 | ||||||
| Accretion of asset retirement obligations | 52 | 156 | ||||||
| Other | 9 | 10 | ||||||
| Total operating expenses | 2,625 | 6,578 | ||||||
| Other expense: | ||||||||
| Interest expense | 504 | 1,246 | ||||||
| Net loss | $ | (1,135 | ) | $ | (1,313 | ) | ||
| Production data: | ||||||||
| Natural gas (Mcf) | 110,839 | 269,234 | ||||||
| Oil (Bbl) | 44,363 | 103,055 | ||||||
| NGLs (Bbl) | 7,519 | 18,132 | ||||||
| Combined (Mcfe) | 422,131 | 996,356 | ||||||
The Company uses the hypothetical liquidation at book value method (“HLBV”), to determine its share of profits or losses in Carbon California and adjusts the carrying value of its investment accordingly. The HLBV is a balance-sheet approach that calculates the amount each member of Carbon California would receive if the membership were liquidated at book value at the end of each measurement period. The change in the allocated amount to each member during the period represents the income or loss allocated to that member. In the event of liquidation of Carbon California, to the extent that Carbon California has net income, available proceeds are first distributed to members holding Class A and Class B Units and any remaining proceeds are then distributed to members holding Class A units, of which the Company holds none. For the three months ended September 30, 2017, and for the period of February 15, 2017 (inception) through September 30, 2017, Carbon California incurred a net loss. For purposes of the HLBV, the Company’s membership interest in Carbon California is zero. Therefore, no adjustment is made to the Company’s membership interest, and accordingly the Company did not record any equity method investment gain or loss. While income may be recorded in future periods, the ability of Carbon California to make distributions to its owners, including us, is dependent upon the terms of its credit facilities, which currently prohibit distributions unless agreed to by the lender.
| 27 |
Carbon Appalachia
Outlined below is a summary of i) the Company’s contributions, ii) its resulting percent of Class A unit ownership and iii) the Company’s overall resulting sharing percentage of Carbon Appalachia after giving effect of all classes of ownership. Each contribution and its use is described in detail following the table.
| Timing | Capital Contribution | Resulting Class A Units (%) | Resulting Sharing % | |||
| April 2017 | $0.24 million | 2.00% | 2.98% | |||
| August 2017 | $3.71 million | 15.20% | 16.04% | |||
| September 2017 | $2.92 million | 18.55% | 19.37% | |||
| November 2017* | Warrant exercise* | 26.50% | 27.24% |
| * | SeeNote 14 to the unaudited Consolidated Financial Statements for further details regarding the November 1, 2017 exercise of the Appalachia Warrant |
On April 3, 2017, the Company entered in to a limited liability company agreement (the “Carbon Appalachia LLC Agreement”). Carbon Appalachia was formed by Carbon and two institutional investors to acquire producing assets in Southern Appalachia and has an initial equity commitment of $100.0 million, of which $37.0 million has been contributed as of September 30, 2017.
Pursuant to the Carbon Appalachia LLC Agreement, Carbon acquired a 2.0% interest in Carbon Appalachia for $240,000 of Class A Units associated with its initial Class A equity commitment of $2.0 million. Carbon also has the ability to earn up to an additional 19.6% of Carbon Appalachia distributions (represented by Class B Units) after certain return thresholds to the holders of Class A Units are met. The Class B Units were acquired for no cash consideration.
In addition, Carbon acquired a 1.0% interest represented by Class C Units which were obtained in connection with the contribution to Carbon Appalachia of a portion of its working interest in the Company’s undeveloped properties in Tennessee. If Carbon Appalachia agrees to drill wells on these properties, it will pay 100% of the cost of drilling and completion of the first 20 wells to earn a 75% working interest in such properties. Carbon, through its subsidiary, Nytis LLC, will retain a 25% working interest in the properties.
In connection with and concurrently with the closing of the acquisition described below, Carbon Appalachia Enterprises, LLC, formerly known as Carbon Tennessee Company, LLC (“Carbon Appalachia Enterprises”), an indirect subsidiary of Carbon Appalachia, entered into a 4-year $100.0 million senior secured asset-based revolving credit facility with LegacyTexas Bank with an initial borrowing base of $10.0 million.
Borrowings under the credit facility, along with the initial equity contributions made to Carbon Appalachia, were used to complete the acquisition of natural gas producing properties and related facilities located predominantly in Tennessee (the “April 2017 Acquisition”). The purchase price was $20.0 million, subject to normal and customary pre and post-closing adjustments, and Carbon Appalachia Enterprises used $8.5 million drawn from the credit facility toward the purchase price.
During the quarter ended September 30, 2017, CAC completed two acquisitions, one on August 15, 2015 and the other on September 29, 2017. Each acquisition is described in more detail below.
On August 15, 2017, Carbon Appalachia completed the acquisition of natural gas producing properties and related facilities located predominantly in the state of West Virginia (the “August 2017 Acquisition”). The purchase price was $21.5 million, subject to normal and customary pre- and post-closing adjustments.
On August 15, 2017, the Carbon Appalachia LLC Agreement was amended and restated. Pursuant to the amended and restated Carbon Appalachia LLC Agreement, Carbon increased its Class A equity capital commitment from $2.0 million to $23.6 million and its portion of any subsequent capital call from 2.0% to 26.5%. Aggregate capital commitments of all Members remained at $100.0 million. As each subsequent captial call is made, Carbon will contribute equity at 26.5%. The Company is the sole manager of Carbon Appalachia and maintains the ability to earn additional ownership interests of Carbon Appalachia (represented by Class B Units) after certain thresholds to the holders of Class A Units are met. The Company also maintains its 1.0% interest represented by Class C Units.
In connection with and concurrently with the closing of the August 2017 Acquisition, the borrowing base of its existing credit facility with LegacyTexas Bank increased to $22.0 million and Carbon Appalachia Enterprises borrowed $8.0 million from its existing credit facility with LegacyTexas Bank. Carbon Appalachia received equity funding in the amount of $14.0 million from its members, including $3.7 million from Carbon. The contributed funds and funds drawn from the credit facility were used to pay the purchase price.
On September 29, 2017, Carbon Appalachia Enterprises amended its 4-year $100.0 million senior secured asset-based revolving credit facility with LegacyTexas Bank, resulting in a borrowing base of $50.0 million with redeterminations as of April 1 and October 1 each year and the addition of East West Bank as a participating lender. As of September 30, 2017, there was approximately $38.0 million outstanding under the credit facility.
On September 29, 2017, Carbon Appalachia completed the acquisition of natural gas producing properties, natural gas gathering pipelines and related facilities located predominantly in the state of West Virginia (the “September 2017 Acquisition”). The purchase price was $41.3 million, subject to normal and customary pre- and post-closing adjustments.
| 28 |
In connection with and concurrently with the closing of the September 2017 Acquisition described above, Carbon Appalachia Enterprises borrowed $20.4 million from its existing credit facility. Carbon Appalachia received equity funding in the amount of $11.0 million from its members, including $2.9 million from Carbon. The contributed funds and funds drawn from the credit facility were used to pay the purchase price.
In connection with the Company entering into the Carbon Appalachia LLC Agreement described above and Carbon Appalachia Enterprises engaging in the April 2017 Acquisition, the Company issued to an affiliate of one of the institutional investors which purchased Class A Units of Carbon Appalachia (which is also an affiliate of the Company’s largest stockholders), a warrant to purchase approximately 408,000 shares of the Company’s common stock at an exercise price of $7.20 per share (the “Appalachia Warrant”). The exercise price for the Appalachia Warrant is payable exclusively with Class A Units of Carbon Appalachia held by this investor and the number of shares of the Company common stock for which the Appalachia Warrant is exercisable is determined, as of the time of exercise, by dividing (a) the aggregate unreturned capital of the warrantholder’s Class A Units of Carbon Appalachia plus a 10% internal rate of return by (b) the exercise price. The Appalachia Warrant has a term of seven years and includes certain standard registration rights with respect to the shares of Carbon’s common stock issuable upon exercise of the Appalachia Warrant. If exercised, the Appalachia Warrant provides Carbon an opportunity to increase its ownership stake in Carbon Appalachia without requiring the payment of cash.
The Company accounted for the Appalachia Warrant, at issuance, as an investment in Carbon Appalachia and a liability based on the fair value of the Appalachia Warrant as of the date of grant (April 3, 2017). Future changes to the fair value of the Appalachia Warrant are recognized in earnings.
As of the grant date of the Appalachia Warrant, the Company estimated that the fair value of the Appalachia Warrant was approximately $1.3 million and recorded that amount to its investment in Carbon Appalachia and a long-term liability. As of September 30, 2017, the Company estimated that the fair value of the Appalachia Warrant was approximately $1.6 million. The difference in the fair value of the Appalachia Warrant from the grant date through September 30, 2017 was approximately $323,000 and approximately $497,000 and $323,000 was recognized in warrant derivative gain in the Company’s unaudited Consolidated Statements of Operations for the three and nine months ended September 30, 2017. On November 1, 2017, the holder of the Appalachia Warrant exercised the warrant.
The following table sets forth, for the periods presented, selected unaudited historical statements of operations data for Carbon Appalachia.
| Three Months Ended | April 3, 2017 (Inception) through | |||||||
| (in thousands except production data) | September 30, 2017 | September 30, 2017 | ||||||
| (Unaudited) | (Unaudited) | |||||||
| Revenue: | ||||||||
| Natural gas sales | $ | 2,153 | $ | 3,160 | ||||
| Oil sales | 126 | 280 | ||||||
| Gas transportation | 77 | 318 | ||||||
| Commodity derivative loss | (1,008 | ) | (853 | ) | ||||
| Total revenues | 1,348 | 2,905 | ||||||
| Expenses: | ||||||||
| Lease operating and transportation expenses | 1,056 | 1,437 | ||||||
| Production and property taxes | 237 | 272 | ||||||
| General and administrative | 964 | 1,809 | ||||||
| Depreciation, depletion and amortization | 414 | 907 | ||||||
| Accretion of asset retirement obligations | 20 | 24 | ||||||
| Total expenses | 2,691 | 4,449 | ||||||
| Other expense: | ||||||||
| Interest expense | 202 | 330 | ||||||
| Net loss | $ | (1,545 | ) | $ | (1,874 | ) | ||
| Production data: | ||||||||
| Natural gas (Mcf) | 722,795 | 1,009,084 | ||||||
| Oil (Bbl) | 3,133 | 6,892 | ||||||
| Combined (Mcfe) | 741,593 | 1,050,436 | ||||||
The Company uses the HLBV to determine its share of profits or losses in Carbon Appalachia and adjust the value of its investment accordingly. The HLBV is a balance-sheet approach that calculates the amount each member of Carbon Appalachia would receive if the entity were liquidated at book value at the end of each measurement period. The change in the allocated amount to each member during the period represents the income or loss allocated to that member. In the event of liquidation of Carbon Appalachia, available proceeds are first distributed to holders of Class A and Class C units until their contributed capital is recovered with an internal rate of return of 10%. Any additional distributions would then be shared between holders of Class A, Class B and Class C Units. For purposes of the HLBV, the Company’s membership interest in Carbon Appalachia is represented by its approximate $6.9 million contributed capital. For the period of April 3, 2017 (inception) through September 30, 2017, Carbon Appalachia incurred a net loss, of which the Company’s share is approximately $348,000, and accordingly the Company recorded this amount to equity investment loss. While income may be recorded in future periods, the ability of Carbon Appalachia to make distributions to its owners, including us, is dependent upon the terms of its credit facility, which currently prohibits distributions unless agreed to by the lender.
| 29 |
Results of Operations
Three Months Ended September 30, 2017 Compared to Three Months Ended September 30, 2016
The following discussion and analysis relates to items that have affected our results of operations for the three months ended September 30, 2017 and 2016. The following table sets forth, for the periods presented, selected historical statements of operations data. The information contained in the table below should be read in conjunction with the Company’s Consolidated Financial Statements and Notes thereto and the information under “Forward Looking Statements” below.
| Three Months Ended | ||||||||||||
| September 30, | Percent | |||||||||||
| (in thousands except production and per unit data) | 2017 | 2016 | Change | |||||||||
| Revenue: | ||||||||||||
| Natural gas sales | $ | 3,689 | $ | 1,431 | 158 | % | ||||||
| Oil sales | 997 | 765 | 30 | % | ||||||||
| Commodity derivative (loss) gain | (499 | ) | 160 | (413 | %) | |||||||
| Other income | 8 | 9 | * | |||||||||
| Total revenues | 4,195 | 2,365 | 77 | % | ||||||||
| Expenses: | ||||||||||||
| Lease operating expenses | 1,605 | 622 | 158 | % | ||||||||
| Transportation costs | 556 | 364 | 53 | % | ||||||||
| Production and property taxes | 331 | 184 | 80 | % | ||||||||
| General and administrative | 2,129 | 2,327 | (8 | %) | ||||||||
| General and administrative – related party reimbursement | (423 | ) | - | * | ||||||||
| Depreciation, depletion and amortization | 613 | 393 | 56 | % | ||||||||
| Accretion of asset retirement obligations | 77 | 35 | 118 | % | ||||||||
| Total expenses | 4,888 | 3,925 | 25 | % | ||||||||
| Operating income (loss) | $ | (693 | ) | $ | (1,560 | ) | * | |||||
| Other income and (expense): | ||||||||||||
| Interest expense | (299 | ) | (38 | ) | 691 | % | ||||||
| Warrant derivative gain | 811 | - | * | |||||||||
| Other | 20 | - | * | |||||||||
| Equity investment income (loss) | (285 | ) | (4 | ) | * | |||||||
| Total other income (expense) | $ | 247 | $ | (42 | ) | * | ||||||
| Production data: | ||||||||||||
| Natural gas (Mcf) | 1,244,951 | 507,608 | 145 | % | ||||||||
| Oil (Bbl) | 21,848 | 17,626 | 24 | % | ||||||||
| Combined (Mcfe) | 1,376,039 | 613,364 | 124 | % | ||||||||
| Average prices before effects of hedges: | ||||||||||||
| Natural gas (per Mcf) | $ | 2.96 | $ | 2.82 | 5 | % | ||||||
| Oil (per Bbl) | $ | 45.62 | $ | 43.40 | 5 | % | ||||||
| Combined (per Mcfe) | $ | 3.40 | $ | 3.58 | (5 | %) | ||||||
| Average prices after effects of hedges**: | ||||||||||||
| Natural gas (per Mcf) | $ | 2.84 | $ | 3.08 | (8 | %) | ||||||
| Oil (per Bbl) | $ | 29.52 | $ | 44.99 | (34 | %) | ||||||
| Combined (per Mcfe) | $ | 3.04 | $ | 3.84 | (21 | %) | ||||||
| Average costs (per Mcfe): | ||||||||||||
| Lease operating expenses | $ | 1.17 | $ | 1.01 | 16 | % | ||||||
| Transportation costs | $ | 0.40 | $ | 0.59 | (32 | %) | ||||||
| Production and property taxes | $ | 0.24 | $ | 0.30 | 20 | % | ||||||
| Cash-based general and administrative expense, net of related party reimbursement | $ | 1.08 | $ | 1.55 | (30 | %) | ||||||
| Depreciation, depletion and amortization | $ | 0.45 | $ | 0.64 | (30 | %) | ||||||
| * | Not meaningful or applicable |
| ** | Includes settled and unrealized commodity derivative gains and losses. |
| 30 |
Oil and natural gas sales- Revenues from sales of oil and natural gas increased 113% to approximately $4.7 million for the three months ended September 30, 2017 from approximately $2.2 million for the three months ended September 30, 2016. This increase was primarily due to a 24% and 145% increase in oil and natural gas sales volumes, respectively, combined with a 5% increase for both oil and natural gas prices. The increases in production were primarily attributable to properties acquired in the EXCO Acquisition, which occurred in the fourth quarter of 2016.
Commodity derivative gains and losses- To achieve more predictable cash flows and to reduce our exposure to downward price fluctuations, we enter into derivative contracts including fixed price swap contracts and costless collars. Because we do not designate these derivatives as cash flow hedges, they do not receive hedge accounting treatment and all mark-to-markets gains or losses, as well as settlement gains or losses on the derivative instruments, are currently recognized in our results of operations. The unrealized gains and losses represent the changes in the fair value of these contracts as oil and natural gas futures prices fluctuate relative to the fixed price we will receive from these contracts. For the three months ended September 30, 2017 and 2016, we had hedging losses of approximately $499,000 and hedging gains of approximately $160,000, respectively.
Lease operating expenses- Lease operating expenses for the three months ended September 30, 2017 increased 158% compared to the three months ended September 30, 2016. The increase was primarily attributable to the acquisition of the EXCO properties and resultant increased production volumes. On a per Mcfe basis, lease operating expenses increased from $1.01 per Mcfe for the three months ended September 30, 2016 to $1.17 per Mcfe for the three months ended September 30, 2017. The increase was primarily attributable to decreases in personnel related costs during the three months ended September 30, 2016 attributable to cost reduction measures implemented by the Company in response to low commodity prices.
Transportation costs- Transportation costs for the three months ended September 30, 2017 increased 53% compared to the three months ended September 30, 2016. This increase is attributable to an increase in production as a result of properties acquired in the EXCO Acquisition. On a per Mcfe basis, these expenses decreased from $0.59 per Mcfe for the three months ended September 30, 2016 to $0.40 per Mcfe for the three months ended September 30, 2017. The decrease on a per Mcfe basis is primarily due to lower transportation costs per unit for the properties acquired in the EXCO Acquisition in the fourth quarter of 2016 compared to the Company’s other natural gas properties.
Production and property taxes- Production and property taxes increased from approximately $184,000 for the three months ended September 30, 2016 to approximately $331,000 for the three months ended September 30, 2017. This increase is primarily attributable to increased oil and natural gas sales as a result of properties acquired in the EXCO Acquisition. Production taxes averaged approximately 4.1% and 4.0% of oil and natural gas sales for the three months ended September 30, 2017 and 2016, respectively. Ad valorem tax rates, which can fluctuate by year, are determined by individual counties where the Company has production and are assessed on the Company’s sales one or two years in arrears depending on the location of the production.
Depreciation, depletion and amortization (DD&A)- DD&A increased from approximately $393,000 for the three months ended September 30, 2016 to approximately $613,000 for the three months ended September 30, 2017 primarily due to an increase in oil and natural gas production offset, in part, by a decrease in the depletion rate. The decrease in depletion rate is primarily attributable to the properties acquired in the EXCO Acquisition in the fourth quarter of 2016 which reduced the Company’s blended depletion rate. On a per Mcfe basis, DD&A decreased from $0.64 per Mcfe for the three months ended September 30, 2016 to $0.45 per Mcfe for the three months ended September 30, 2017.
Impairment of oil and gas properties- The Company did not record an impairment for the three months ended September 30, 2017 and 2016. The ceiling limitation calculation is not intended to be indicative of the fair market value of our proved reserves or future results. Impairment charges do not affect cash flow from operating activities, but do adversely affect our net income and various components of our balance sheet. Any recorded impairment is not reversible at a later date.
General and administrative expenses- Cash-based general and administrative expenses increased from approximately $954,000 for the three months ended September 30, 2016 to approximately $1.9 million for the three months ended September 30, 2017. This increase is primarily attributable to personnel-related costs and other costs associated with completed acquisition and potential acquisition opportunities incurred during the three months ended September 30, 2017 and decreases in personnel related costs during the three months ended September 30, 2016 attributable to cost reduction measures implemented by the Company in response to low commodity prices. The increase was partially offset by reimbursements of approximately $423,000 the Company received from Carbon California and Carbon Appalachia in connection with its role as manager of the entities. Non-cash stock based compensation and other general and administrative expenses for the three months ended September 30, 2017 and 2016 are summarized in the following table:
| General and administrative expenses | ||||||||||||
| (in thousands) | Increase/ | |||||||||||
| 2017 | 2016 | (Decrease) | ||||||||||
| Stock-based compensation | $ | 213 | $ | 1,373 | $ | (1,160 | ) | |||||
| Other general and administrative expenses | 1,916 | 954 | 962 | |||||||||
| General and administrative expense, net | $ | 2,129 | $ | 2,327 | $ | (198 | ) | |||||
Interest expense- Interest expense increased from approximately $38,000 for the three months ended September 30, 2016 to approximately $299,000 for the three months ended September 30, 2017 primarily due to higher outstanding debt balances related to borrowings i) to complete the EXCO Acquisition in October 2016 and ii) to fund Carbon’s share of the August 2017 acquisition.
| 31 |
Nine Months Ended September 30, 2017 Compared to Nine Months Ended September 30, 2016
The following discussion and analysis relates to items that have affected our results of operations for the nine months ended September 30, 2017 and 2016. The following table sets forth, for the periods presented, selected historical statements of operations data. The information contained in the table below should be read in conjunction with the Company’s unaudited Consolidated Financial Statements and Notes thereto and the information under “Forward Looking Statements” below.
| Nine Months Ended | ||||||||||||
| September 30, | Percent | |||||||||||
| (in thousands except production and per unit data) | 2017 | 2016 | Change | |||||||||
| Revenue: | ||||||||||||
| Natural gas sales | $ | 11,706 | $ | 3,484 | 236 | % | ||||||
| Oil sales | 3,189 | 2,201 | 45 | % | ||||||||
| Commodity derivative gain (loss) | 2,642 | (474 | ) | 657 | % | |||||||
| Other income | 28 | 10 | 177 | % | ||||||||
| Total revenues | 17,565 | 5,221 | 236 | % | ||||||||
| Expenses: | ||||||||||||
| Lease operating expenses | 4,311 | 1,864 | 131 | % | ||||||||
| Transportation costs | 1,571 | 1,121 | 40 | % | ||||||||
| Production and property taxes | 1,186 | 443 | 168 | % | ||||||||
| General and administrative | 5,623 | 5,402 | 4 | % | ||||||||
| General and administrative – related party reimbursement | (723 | ) | - | * | ||||||||
| Depreciation, depletion and amortization | 1,847 | 1,332 | 39 | % | ||||||||
| Accretion of asset retirement obligations | 232 | 105 | 120 | % | ||||||||
| Impairment of oil and gas properties | - | 4,299 | * | |||||||||
| Total expenses | 14,047 | 14,566 | (4 | %) | ||||||||
| Operating income (loss) | $ | 3,518 | $ | (9,345 | ) | * | ||||||
| Other income and (expense): | ||||||||||||
| Interest expense | (821 | ) | (141 | ) | 485 | % | ||||||
| Warrant derivative gain | 2,494 | - | * | |||||||||
| Other income | 20 | 17 | * | |||||||||
| Equity investment income (loss) | (285 | ) | (10 | ) | * | |||||||
| Total other income (expense) | $ | 1,408 | $ | (134 | ) | * | ||||||
| Production data: | ||||||||||||
| Natural gas (Mcf) | 3,601,946 | 1,502,505 | 140 | % | ||||||||
| Oil (Bbl) | 66,959 | 55,530 | 21 | % | ||||||||
| Combined (Mcfe) | 4,003,700 | 1,835,685 | 118 | % | ||||||||
| Average prices before effects of hedges: | ||||||||||||
| Natural gas (per Mcf) | $ | 3.25 | $ | 2.32 | 40 | % | ||||||
| Oil (per Bbl) | $ | 47.63 | $ | 39.63 | 20 | % | ||||||
| Combined (per Mcfe) | $ | 3.72 | $ | 3.10 | 20 | % | ||||||
| Average prices after effects of hedges**: | ||||||||||||
| Natural gas (per Mcf) | $ | 3.77 | $ | 2.08 | 81 | % | ||||||
| Oil (per Bbl) | $ | 58.88 | $ | 37.59 | 57 | % | ||||||
| Combined (per Mcfe) | $ | 4.38 | $ | 2.84 | 54 | % | ||||||
| Average costs (per Mcfe): | ||||||||||||
| Lease operating expenses | $ | 1.08 | $ | 1.02 | 6 | % | ||||||
| Transportation costs | $ | 0.39 | $ | 0.61 | (36 | %) | ||||||
| Production and property taxes | $ | 0.30 | $ | 0.24 | 25 | % | ||||||
| Cash-based general and administrative expense, net of related party reimbursement | $ | 1.04 | $ | 1.83 | (43 | %) | ||||||
| Depreciation, depletion and amortization | $ | 0.46 | $ | 0.73 | (37 | %) | ||||||
| * | Not meaningful or applicable |
| ** | Includes settled and unrealized commodity derivative gains and losses. |
Oil and natural gas sales- Revenues from sales of oil and natural gas increased 162% to approximately $14.9 million for the nine months ended September 30, 2017 from approximately $5.7 million for the nine months ended September 30, 2016. This increase was primarily due to a 21% and 140% increase in oil and natural gas sales volumes, respectively, combined with a 20% and 40% increase in oil and natural gas prices, respectively. The increases in production were primarily attributable to properties acquired in the EXCO Acquisition, which occurred in October 2016.
| 32 |
Commodity derivative gains and losses- To achieve more predictable cash flows and to reduce our exposure to downward price fluctuations, we enter into derivative contracts including fixed price swap contracts and costless collars. Because we do not designate these derivatives as cash flow hedges, they do not receive hedge accounting treatment and all mark-to-markets gains or losses, as well as settlement gains or losses on the derivative instruments, are currently recognized in our results of operations. The unrealized gains and losses represent the changes in the fair value of these contracts as oil and natural gas futures prices fluctuate relative to the fixed price we will receive from these contracts. For the nine months ended September 30, 2017 we had hedging gains of approximately $2.6 million compared with hedging losses of approximately $474,000 for the nine months ended September 30, 2016.
Lease operating expenses- Lease operating expenses for the nine months ended September 30, 2017 increased 131% compared to the first nine months of 2016. The increase was primarily attributable to the acquisition of the EXCO properties and resultant increased production volumes. On a per Mcfe basis, lease operating expenses were $1.02 per Mcfe for the nine months ended September 30, 2016 and $1.08 per Mcfe for the nine months ended September 30, 2017. The increase was primarily attributable to decreases in personnel related costs during the three months ended September 30, 2016 attributable to cost reduction measures implemented by the Company in response to low commodity prices.
Transportation costs- Transportation costs for the nine months ended September 30, 2017 increased 40% compared to the nine months ended September 30, 2016. This increase is attributable to an increase in production as a result of properties acquired in the EXCO Acquisition. On a per Mcfe basis, these expenses decreased from $0.61 per Mcfe for the nine months ended September 30, 2016 to $0.39 per Mcfe for the nine months ended September 30, 2017. The decrease on a per Mcfe basis is primarily due to lower transportation costs per unit for the properties acquired in the EXCO Acquisition in the fourth quarter of 2016 compared to the Company’s other natural gas properties.
Production and property taxes- Production and property taxes increased from approximately $443,000 for the nine months ended September 30, 2016 to approximately $1.2 million for the nine months ended September 30, 2017. This increase is primarily attributable to increased oil and natural gas sales as a result of properties acquired in the EXCO Acquisition. Production taxes averaged 4.2% and 4.1% of oil and natural gas sales for the nine months ended September 30, 2017 and 2016, respectively. Ad valorem tax rates, which can fluctuate by year, are determined by individual counties where the Company has production and are assessed on the Company’s oil and gas sales one or two years in arrears depending on the location of the production.
Depreciation, depletion and amortization (DD&A)- DD&A increased from approximately $1.3 million for the nine months ended September 30, 2016 to approximately $1.8 million for the nine months ended September 30, 2017 primarily due to an increase in oil and natural gas production offset, in part, by a decrease in the depletion rate. The decrease in depletion rate is primarily attributable to the properties acquired in the EXCO Acquisition in the fourth quarter of 2016 which reduced the Company’s blended depletion rate. On a per Mcfe basis, DD&A decreased from $0.73 per Mcfe for the nine months ended September 30, 2016 to $0.46 per Mcfe for the nine months ended September 30, 2017.
Impairment of oil and gas properties- Due to low commodity prices used in the ceiling calculation based on the required trailing 12-month average at March 31, 2016 and June 30, 2016, the Company had impairment expenses of approximately $4.3 million for the nine months ended September 30, 2016. The Company did not record an impairment for the nine months ended September 30, 2017. The ceiling limitation calculation is not intended to be indicative of the fair market value of our proved reserves or future results. Impairment charges do not affect cash flow from operating activities, but do adversely affect our net income and various components of our balance sheet. Any recorded impairment is not reversible at a later date.
General and administrative expenses- Cash-based general and administrative expenses increased from approximately $3.4 million for the nine months ended September 30, 2016 to approximately $4.9 million for the nine months ended September 30, 2017. This increase is primarily attributable to personnel-related costs and other costs associated with completed acquisition and potential acquisition opportunities incurred during the nine months ended September 30, 2017 and decreases in personnel related costs during the nine months ended September 30, 2016 attributable to cost reduction measures implemented by the Company in response to low commodity prices. This increase was partially offset by approximately $723,000 in reimbursements the Company received from Carbon California and Carbon Appalachia in connection with its role as manager of these entities. Non-cash stock based compensation and other general and administrative expenses for the nine months ended September 30, 2017 and 2016 are summarized in the following table:
| General and administrative expenses | ||||||||||||
| (in thousands) | Increase | |||||||||||
| 2017 | 2016 | (Decrease) | ||||||||||
| Stock-based compensation | $ | 752 | $ | 2,037 | $ | (1,285 | ) | |||||
| Other general and administrative expenses | 4,871 | 3,365 | 1,506 | |||||||||
| General and administrative expense, net | $ | 5,623 | $ | 5,402 | $ | 221 | ||||||
| 33 |
Interest expense- Interest expense increased from approximately $141,000 for the nine months ended September 30, 2016 to approximately $821,000 for the nine months ended September 30, 2017 primarily due to higher outstanding debt balances related to borrowings i) to complete the EXCO Acquisition in October 2016 and ii) to fund Carbon’s share of the August 2017 acquisition.
Liquidity and Capital Resources
Our exploration, development and acquisition activities may require us to make significant operating and capital expenditures. Historically, we have used cash flow from operations and our bank credit facility as our primary sources of liquidity and on occasion, we have engaged in the sale of assets. Changes in the market prices for oil and natural gas directly impact our level of cash flow generated from operations. The prices we receive for our production are determined by prevailing market conditions and greatly influence our revenue, cash flow, profitability, access to capital and future rate of growth. We employ a commodity hedging strategy in an attempt to moderate the effects of commodity price fluctuations on our cash flow.
In connection with the closing of the EXCO Acquisition and entering into the credit facility with LegacyTexas Bank, the Company entered into derivative agreements to hedge a portion of its oil and natural gas production.
The following table reflects the Company’s outstanding derivative hedges as of September 30, 2017:
| Natural Gas Swaps | Natural Gas Collars | Oil Swaps | ||||||||||||||||||||||
| Weighted | Weighted | Weighted | ||||||||||||||||||||||
| Average | Average Price | Average | ||||||||||||||||||||||
| Year | MMBtu | Price (a) | MMBtu | Range (a) | Bbl | Price (b) | ||||||||||||||||||
| 2017 | 900,000 | $ | 3.27 | 30,000 | $3.00 - $3.48 | 23,000 | $ | 52.64 | ||||||||||||||||
| 2018 | 3,390,000 | $ | 3.01 | 90,000 | $3.00 - $3.48 | 60,000 | $ | 53.36 | ||||||||||||||||
| 2019 | 1,920,000 | $ | 2.85 | - | - | 48,000 | $ | 53.76 | ||||||||||||||||
| (a) | NYMEX Henry Hub Natural Gas futures contract for the respective period. |
| (b) | NYMEX Light Sweet Crude West Texas Intermediate future contract for the respective period. |
This hedge program mitigates uncertainty regarding cash flow that we will receive with respect to a portion of our expected production through 2019. Future hedging activities may result in reduced income or even financial losses to us. See “Risk Factors—The use of derivative instruments used in hedging arrangements could result in financial losses or reduce income,” in our Annual Report on Form 10-K for further details of the risks associated with our hedging activities. In the future, we may determine to increase or decrease our hedging positions.
The Company is manager of both Carbon California and Carbon Appalachia, and in connection with its role as manager, certain general and administrative expenses will be reimbursed. The amount of reimbursement by Carbon California is $600,000 annually, payable quarterly. The amount of the reimbursement from Carbon Appalachia varies quarterly based upon the percentage of production of Carbon Appalachia assets in comparison to the Company’s historical assets. The reimbursement from Carbon Appalachia was approximately $273,000 during the three months ended September 30, 2017.
Historically, the primary source of liquidity has been our credit facility (described below). In October 2016, the Company entered into a four-year $100.0 million senior secured asset-based revolving credit facility with LegacyTexas Bank with an initial borrowing base of $17.0 million. The borrowing base is subject to semi-annual redeterminations in March and September. On March 30, 2017, the Borrowing base was increased to $23.0 million. As of September 30, 2017, the borrowing base remained at $23.0 million. See “Bank Credit Facility” below for further details.
| 34 |
As of September 30, 2017, there was approximately $22.1 million in borrowings and approximately $860,000 of additional borrowing capacity under the credit facility. We have made aggregate cash contributions of approximately $6.9 million to date under equity commitments of $23.6 million associated with Carbon California and Carbon Appalachia. The potential acquisition of additional oil and natural gas properties or increased equity commitments associated with Carbon California or Carbon Appalachia may result in a need for additional capital.
Our ability to access the debt and equity capital markets on desired terms is affected by general economic conditions, the domestic and global financial markets, our operational and financial performance, the value of our equity securities, prevailing commodity prices, and other factors which may be outside of our control.
We expect to fund our future activities and equity commitments with cash flow from operations, our credit facility or the issuance of additional equity or debt. Such transactions, if any, will depend on general economic conditions, domestic and global financial markets, the Company’s operational and financial performance, the value of our equity securities, prevailing commodity prices, potential adjustments to our borrowing base and other factors which may be outside of our control. Current market conditions may limit our ability to source attractive acquisition opportunities and to issue new debt or equity securities in the public or private markets. We expect that our net cash provided by operating activities may be adversely affected by continued low commodity prices. We believe that our expected future cash flows provided by operating activities will be sufficient to fund our normal recurring activities and contractual obligations.
If low commodity prices continue, we may continue to defer our planned capital expenditures. We believe that our financial flexibility to adjust our spending levels will provide us with sufficient liquidity to meet our financial obligations should economic conditions deteriorate. See “Risk Factors”, in our Annual Report filed on Form 10-K with the SEC, for a discussion of the risks and uncertainties that affect our business and financial and operating results.
Bank Credit Facility
In 2016, Carbon entered into a 4-year $100.0 million senior secured asset-based revolving credit facility with LegacyTexas Bank. LegacyTexas Bank is the initial lender and acts as administrative agent.
The credit facility has a maximum availability of $100.0 million (with a $500,000 sublimit for letters of credit), which availability is subject to the amount of the borrowing base. The initial borrowing base established under the credit facility was $17.0 million. The borrowing base is subject to semi-annual redeterminations in March and September. On March 30, 2017, the borrowing base was increased to $23.0 million. As of September 30, 2017, the borrowing base was remained at $23.0 million, of which approximately $22.1 million was drawn. The Company’s effective borrowing rate at September 30, 2017 was approximately 5.82%.
The credit facility is guaranteed by each existing and future direct or indirect subsidiary of Carbon (subject to certain exceptions). The obligations of Carbon and the subsidiary guarantors under the credit facility are secured by essentially all tangible and intangible personal and real property of the Company (subject to certain exclusions).
Interest is payable quarterly and accrues on borrowings under the credit facility at a rate per annum equal to either (i) the base rate plus an applicable margin between 0.50% and 1.50% or (ii) the Adjusted LIBOR rate plus an applicable margin between 3.50% and 4.50% at Carbon’s option. The actual margin percentage is dependent on the credit facility utilization percentage. Carbon is obligated to pay certain fees and expenses in connection with the credit facility, including a commitment fee for any unused amounts of 0.50%.
The credit facility contains affirmative and negative covenants that, among other things, limit the Company’s ability to (i) incur additional debt; (ii) incur additional liens; (iii) sell, transfer or dispose of assets; (iv) merge or consolidate, wind-up, dissolve or liquidate; (v) make dividends and distributions on, or repurchases of, equity; (vi) make certain investments; (vii) enter into certain transactions with its affiliates; (viii) enter into sales-leaseback transactions; (ix) make optional or voluntary payment of debt; (x) change the nature of its business; (xi) change its fiscal year to make changes to the accounting treatment or reporting practices; (xii) amend constituent documents; and (xiii) enter into certain hedging transactions.
| 35 |
The affirmative and negative covenants are subject to various exceptions, including basket amounts and acceptable transaction levels. In addition, the credit facility requires Carbon’s compliance, on a consolidated basis, with (i) a maximum funded Debt/EBITDA ratio of 3.5 to 1.0 and (ii) a minimum current ratio of 1.0 to 1.0.
In the third quarter of 2017, the Company contributed approximately $6.6 to Carbon Appalachia to fund its share of producing oil and gas properties acquired during the third quarter. This funding was provided primarily with borrowings under the credit facility. The funded Debt/EBITDA and current ratio covenants negotiated at the time the credit facility was established did not contemplate the Company’s contributions for its investment in Carbon Appalachia and, as a result, the Company was not in compliance with the financial covenants associated with the credit facility as of September 30, 2017. However, the Company has obtained a waiver of the funded debt/EBITDA ratio and the current ratio covenants as of September 30, 2017. The Company has requested that LegacyTexas Bank amend such financial covenants to take into account the Company’s investment in Carbon Appalachia. While the Company believes its relationship with LegacyTexas Bank is such that the requested amendment is likely, there can be no assurance that the bank will agree to an amendment.
On November 13, 2017, LegacyTexas Bank reaffirmed the Company’s borrowing base associated with its credit facility at $23.0 million.
Carbon may at any time repay the loans under the credit facility, in whole or in part, without penalty. Carbon must pay down borrowings under the credit facility or provide mortgages of additional oil and natural gas properties to the extent that outstanding loans and letters of credit exceed the borrowing base.
As required under the terms of the credit facility, the Company entered into derivative contracts with fixed pricing for a certain percentage of its production. The Company is a party to an ISDA Master Agreement with BP Energy Company that established standard terms for the derivative contracts and an inter-creditor agreement with LegacyTexas Bank and BP Energy Company whereby any credit exposure related to the derivative contracts entered into by the Company and BP Energy Company is secured by the collateral and backed by the guarantees supporting the credit facility.
Sources and Uses of Cash
Our primary sources of liquidity and capital resources are operating cash flow and borrowings under our credit facility. Our primary uses of funds are expenditures for acquisition, exploration and development activities, leasehold and property acquisitions, other capital expenditures and debt service.
Low prices for our oil and natural gas production may adversely impact our operating cash flow and amount of cash available for development activities.
The following table presents net cash provided by or used in operations, investing and financing activities for the nine months ended September 30, 2017 and 2016.
| Nine Months Ended | ||||||||
| September 30, | ||||||||
| (in thousands) | 2017 | 2016 | ||||||
| Net cash provided by (used in) operating activities | $ | 2,580 | $ | (693 | ) | |||
| Net cash (used in) provided by investing activities | $ | (8,106 | ) | $ | 12 | |||
| Net cash provided by financing activities | $ | 5,787 | $ | 504 | ||||
| 36 |
Net cash provided by or used in operating activities is primarily affected by production volumes and commodity prices, net of the effects of settlements of our derivative contracts, and changes in working capital. Operating cash flows increased approximately $3.3 million for the nine months ended September 30, 2017 as compared to the same period in 2016. This increase was primarily due to increased revenues from the acquisition of producing oil and natural gas properties in the Appalachian Basin in the fourth quarter of 2016 and higher oil and natural gas prices in the nine months ended September 30, 2017 as compared to the same period in 2016.
Net cash provided by or used in investing activities is primarily comprised of the acquisition, exploration and development of oil and natural gas properties, net of dispositions of oil and natural gas properties in addition to expenditures to fund the Company’s equity investment in Carbon Appalachia. Net cash used in investing activities increased approximately $8.1 million for the nine months ended September 30, 2017 as compared to the same period in 2016. The Company increased its capital expenditures for the development and acquisition of properties and equipment in the nine months ended September 30, 2017 by approximately $940,000 compared to the nine months ended September 30, 2016. In addition, during the nine months ended September 30, 2017, the Company made an approximate $6.9 million equity investment in Carbon Appalachia partially offset by a $68,000 cash distribution from Crawford County Gas Gathering; whereas, during the nine months ended September 30, 2016, the Company received a cash distribution of $275,000 from Crawford County Gas Gathering Company.
The increase in cash provided by financing cash flows of approximately $5.3 million for the nine months ended September 30, 2017 as compared to the nine months ended September 30, 2016 was primarily due to $7.2 million in proceeds from borrowings under the credit facility partially offset by increased debt repayments in the nine months ended September 30, 2017 as compared to the same period in 2016.
Capital Expenditures
Capital expenditures incurred for the nine months ended September 30, 2017 and 2016 are summarized in the following table:
| Nine Months Ended September 30, | ||||||||
| (in thousands) | 2017 | 2016 | ||||||
| Unevaluated property acquisitions | $ | 230 | $ | 95 | ||||
| Drilling and development | 738 | 192 | ||||||
| Other | 284 | 41 | ||||||
| Total capital expenditures | $ | 1,252 | $ | 328 | ||||
Capital expenditures presented in the table above represent cash used for capital expenditures.
Due to low commodity prices, the Company reduced its drilling program in 2016 and for the nine months ended September 30, 2017 and has focused on the optimization of our gathering facilities and marketing arrangements to provide greater flexibility in moving natural gas production to markets with more favorable pricing. Other factors impacting the level of our capital expenditures include the cost and availability of oil field services, general economic and market conditions and weather disruptions.
Off-Balance Sheet Arrangements
From time-to-time, we enter into off-balance sheet arrangements and transactions that can give rise to off-balance sheet obligations. As of September 30, 2017, the off-balance sheet arrangements and transactions that we have entered into include (i) operating lease agreements and (ii) contractual obligations for which the ultimate settlement amounts are not fixed and determinable, such as natural gas transportation contracts, and (iii) oil and natural gas physical delivery contracts that are not expected to be net cash settled and are considered to be normal sales contracts and not derivatives. We do not believe that any of these arrangements are reasonably likely to materially affect our liquidity or availability of, or requirements for, capital resources.
| 37 |
Non-GAAP Measures
EBITDA and Adjusted EBITDA
“EBITDA” and “Adjusted EBITDA” are non-GAAP financial measures. We define EBITDA as net income (loss) before interest expense, taxes, depreciation, depletion and amortization. We define Adjusted EBITDA as EBITDA prior to accretion of asset retirement obligations, ceiling test write downs of oil and gas properties, non-cash stock-based compensation expense, non-cash warrant derivative gains and losses and the gain or loss on sold investments or properties. EBITDA and Adjusted EBITDA is consolidated including non-controlling interests and as used and defined by us, may not be comparable to similarly titled measures employed by other companies and are not measures of performance calculated in accordance with GAAP. EBITDA and Adjusted EBITDA should not be considered in isolation or as a substitute for operating income, net income or loss, cash flow provided by or used in operating, investing and financing activities, or other income or cash flow statement data prepared in accordance with GAAP. EBITDA and Adjusted EBITDA provide no information regarding a company’s capital structure, borrowings, interest costs, capital expenditures, and working capital movement or tax position. EBITDA and Adjusted EBITDA do not represent funds available for discretionary use because those funds are required for debt service, capital expenditures, working capital, income taxes, franchise taxes, exploration and development expenses, and other commitments and obligations. However, our management believes EBITDA and Adjusted EBITDA are useful to an investor in evaluating our operating performance because these measures:
| ● | are widely used by investors in the oil and natural gas industry to measure a company’s operating performance without regard to items excluded from the calculation of such term, which can vary substantially from company to company depending upon accounting methods, book value of assets, capital structure and the method by which assets were acquired, among other factors; and |
| ● | help investors to more meaningfully evaluate and compare the results of our operations from period to period by removing the effect of our capital structure from our operating structure; and are used by our management for various purposes, including as a measure of operating performance, in presentations to our board of directors, as a basis for strategic planning and forecasting and by our lenders pursuant to a covenant under the Company’s credit facility. |
There are significant limitations to using EBITDA and Adjusted EBITDA as a measure of performance, including the inability to analyze the effect of certain recurring and non-recurring items that materially affect our net income or loss, the lack of comparability of results of operations of different companies and the different methods of calculating EBITDA and Adjusted EBITDA reported by different companies.
The following table represents a reconciliation of our net earnings or losses, the most directly comparable GAAP measure to EBITDA and Adjusted EBITDA for the three and nine months ended September 30, 2017 and 2016.
| Three Months Ended | ||||||||
| September 30, | ||||||||
| (in thousands) | 2017 | 2016 | ||||||
| Net income (loss) | $ | (446 | ) | $ | (1,602 | ) | ||
| Adjustments: | ||||||||
| Interest expense | 299 | 38 | ||||||
| Depreciation, depletion and amortization | 613 | 393 | ||||||
| EBITDA | 466 | (1,171 | ) | |||||
| Adjusted EBITDA | ||||||||
| EBITDA | 466 | (1,171 | ) | |||||
| Adjustments: | ||||||||
| Non-cash stock-based compensation | 213 | 1,373 | ||||||
| Non-cash warrant derivative gains | (811 | ) | - | |||||
| Accretion of asset retirement obligations | 77 | 35 | ||||||
| Adjusted EBITDA | $ | (55 | ) | $ | 237 | |||
| 38 |
| Nine Months Ended | ||||||||
| September 30, | ||||||||
| (in thousands) | 2017 | 2016 | ||||||
| Net income (loss) | $ | 4,926 | $ | (9,479 | ) | |||
| Adjustments: | ||||||||
| Interest expense | 821 | 141 | ||||||
| Depreciation, depletion and amortization | 1,847 | 1,332 | ||||||
| EBITDA | 7,594 | (8,006 | ) | |||||
| Adjusted EBITDA | ||||||||
| EBITDA | 7,594 | (8,006 | ) | |||||
| Adjustments: | ||||||||
| Non-cash stock-based compensation | 752 | 2,037 | ||||||
| Non-cash warrant derivative gains | (2,494 | ) | - | |||||
| Impairment of oil and gas properties | - | 4,299 | ||||||
| Accretion of asset retirement obligations | 232 | 105 | ||||||
| Adjusted EBITDA | $ | 6,084 | $ | (1,565 | ) | |||
Forward Looking Statements
The information in this Quarterly Report on Form 10-Q includes “forward-looking statements” within the meaning of Section 27A of the Securities Act of 1933, as amended, and Section 21E of the Securities Exchange Act of 1934, as amended. Forward-looking statements are statements other than statements of historical or present facts, that address activities, events, outcomes, and other matters that the Company plans, expects, intends, assumes, believes, budgets, predicts, forecasts, projects, estimates, or anticipates (and other similar expressions) will, should, or may occur in the future. Generally, the words “expects,” “anticipates,” “targets,” “goals,” “projects,” “intends,” “plans,” “believes,” “seeks,” “estimates,” “may,” “will,” “could,” “should,” “future,” “potential,” “continue,” variations of such words, and similar expressions identify forward-looking statements. These forward-looking statements are based on our current expectations and assumptions about future events and are based on currently available information as to the outcome and timing of future events.
These forward-looking statements appear in a number of places in this report and include statements with respect to, among other things:
| ● | estimates of our oil and natural gas reserves; |
| ● | estimates of our future oil and natural gas production, including estimates of any increases or decreases in our production; |
| ● | our future financial condition and results of operations; |
| ● | our future revenues, cash flows, and expenses; |
| ● | our access to capital and our anticipated liquidity; |
| ● | our future business strategy and other plans and objectives for future operations; |
| ● | our outlook on oil and natural gas prices; |
| ● | the amount, nature, and timing of future capital expenditures, including future development costs; |
| ● | our ability to access the capital markets to fund capital and other expenditures; |
| ● | our assessment of our counterparty risk and the ability of our counterparties to perform their future obligations; and |
| ● | the impact of federal, state |
| 39 |
We believe the expectations and forecasts reflected in our forward-looking statements are reasonable, but we can give no assurance that they will prove to be correct. We caution you that these forward-looking statements can be affected by inaccurate assumptions and are subject to all of the risks and uncertainties, most of which are difficult to predict and many of which are beyond our control, incident to the exploration for and development, production, and sale of oil and natural gas. When considering forward-looking statements, you should keep in mind the risk factors and other cautionary statements described under the heading “Risk Factors” included or incorporated in our Annual Report filed on Form 10-K with the SEC.
Should one or more of the risks or uncertainties described above or elsewhere in this Form 10-Q occur, or should underlying assumptions prove incorrect, our actual results and plans could differ materially from those expressed in any forward-looking statements.
We caution you not to place undue reliance on these forward-looking statements, which speak only as of the date of this report, and we undertake no obligation to update this information to reflect events or circumstances after the filing of this report with the SEC, except as required by law. All forward-looking statements, expressed or implied, included in this Form 10-Q and attributable to the Company are expressly qualified in their entirety by this cautionary statement. This cautionary statement should also be considered in connection with any subsequent written or oral forward-looking statements that we may make or persons acting on our behalf may issue.
ITEM 4. Controls and Procedures
Evaluation of Disclosure Controls and Procedures
We have established disclosure controls and procedures to ensure that material information related to the Company and its consolidated subsidiaries is made known to the officers who certify the Company’s financial reports and the Board of Directors.
As required by Rule 13a - 15(b) under the Securities Exchange Act of 1934 as amended (the “Exchange Act”), we have evaluated under the supervision and with the participation of our management, including our principal executive officer and principal financial officer, the effectiveness of the design and operation of our disclosure controls and procedures as defined in Rules 13a - 15(e) and 15d-15(e) under the Exchange Act as of September 30, 2017. Our disclosure controls and procedures are designed to provide reasonable assurance that the information required to be disclosed by us in reports that we file under the Exchange Act with the SEC is recorded, processed, summarized and reported within the time periods specified in the SEC’s rules and forms and that such information is accumulated and communicated to our management, as appropriate, to allow such persons to make timely decisions regarding required disclosures.
Our principal executive officer and principal financial officer have concluded that our current disclosure controls and procedures were effective as of September 30, 2017 at the reasonable assurance level.
Changes in Internal Control over Financial Reporting
There has not been any change in our internal control over financial reporting that occurred during our quarterly period ended September 30, 2017 that has materially affected, or is reasonably likely to materially affect, our internal control over financial reporting.
| 40 |
PART II. OTHER INFORMATION
ITEM 2. Unregistered Sales of Equity Securities and Use of Proceeds
All sales of unregistered equity securities that occurred during the period covered by this report, and through November 14, 2017, have been previously reported on a current report on Form 8-K or in a quarterly report on Form 10-Q.
ITEM 6. Exhibits
| * | Filed herewith |
| † | Not considered to be “filed” for purposes of Section 18 of the Securities Exchange Act of 1934 or otherwise subject to the liabilities of that section |
| 41 |
Pursuant to the requirements of the Securities Exchange Act of 1934, the registrant has duly caused this report to be signed on its behalf by the undersigned thereunto duly authorized.
| CARBON NATURAL GAS COMPANY | ||
| (Registrant) | ||
| Date: November 14, 2017 | By: | /s/ Patrick R. McDonald |
| PATRICK R. MCDONALD, | ||
| Chief Executive Officer | ||
| Date: November 14, 2017 | By: | /s/ Kevin D. Struzeski |
| KEVIN D. STRUZESKI | ||
| Chief Financial Officer | ||
42