Attached files
| file | filename |
|---|---|
| EX-99.2 - EX-99.2 - WESBANCO INC | d455787dex992.htm |
| EX-2.1 - EX-2.1 - WESBANCO INC | d455787dex21.htm |
| 8-K - FORM 8-K - WESBANCO INC | d455787d8k.htm |
Acquisition of First Sentry Bancshares, Inc. 14 November 2017 Exhibit 99.1
Matters set forth in this presentation contain certain forward-looking statements, including certain plans, expectations, goals, and projections, and including statements about the benefits of the proposed Merger between WesBanco, Inc. (the “Company”, “WesBanco” or “WSBC”) and First Sentry Bancshares, Inc. (“First Sentry” or “FTSB”), which are subject to numerous assumptions, risks, and uncertainties. Actual results could differ materially from those contained or implied by such statements for a variety of factors including: the businesses of WesBanco and First Sentry may not be integrated successfully or such integration may take longer to accomplish than expected; the expected cost savings and any revenue synergies from the proposed Merger may not be fully realized within the expected timeframes; disruption from the proposed Merger may make it more difficult to maintain relationships with clients, associates, or suppliers; the required governmental approvals of the proposed Merger may not be obtained on the expected terms and schedule; First Sentry’s shareholders may not approve the proposed Merger; changes in economic conditions; movements in interest rates; competitive pressures on product pricing and services; success and timing of other business strategies; the nature, extent, and timing of governmental actions and reforms; and extended disruption of vital infrastructure; and other factors described in WesBanco’s 2016 Annual Report on Form 10-K, and documents subsequently filed by WesBanco, and potentially First Sentry (non-SEC reporting), with the Securities and Exchange Commission. All forward-looking statements included in this presentation are based on information available at the time of the presentation. Neither WesBanco nor First Sentry assume any obligation to update any forward-looking statement. Forward-Looking Statements
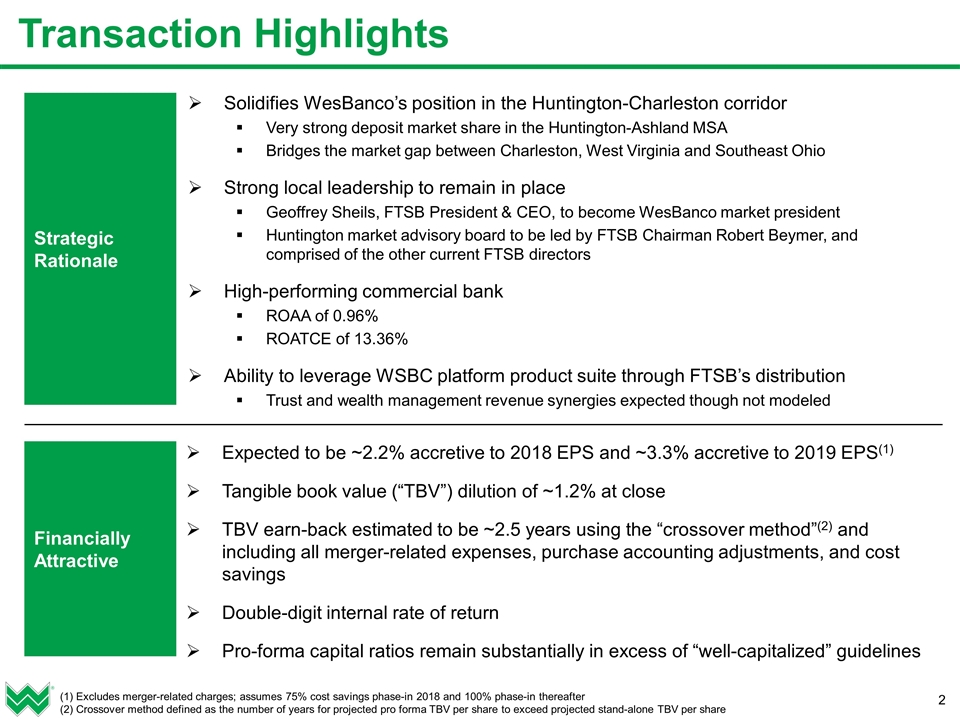
Transaction Highlights Solidifies WesBanco’s position in the Huntington-Charleston corridor Very strong deposit market share in the Huntington-Ashland MSA Bridges the market gap between Charleston, West Virginia and Southeast Ohio Strong local leadership to remain in place Geoffrey Sheils, FTSB President & CEO, to become WesBanco market president Huntington market advisory board to be led by FTSB Chairman Robert Beymer, and comprised of the other current FTSB directors High-performing commercial bank ROAA of 0.96% ROATCE of 13.36% Ability to leverage WSBC platform product suite through FTSB’s distribution Trust and wealth management revenue synergies expected though not modeled Strategic Rationale Financially Attractive Expected to be ~2.2% accretive to 2018 EPS and ~3.3% accretive to 2019 EPS(1) Tangible book value (“TBV”) dilution of ~1.2% at close TBV earn-back estimated to be ~2.5 years using the “crossover method”(2) and including all merger-related expenses, purchase accounting adjustments, and cost savings Double-digit internal rate of return Pro-forma capital ratios remain substantially in excess of “well-capitalized” guidelines (1) Excludes merger-related charges; assumes 75% cost savings phase-in 2018 and 100% phase-in thereafter (2) Crossover method defined as the number of years for projected pro forma TBV per share to exceed projected stand-alone TBV per share
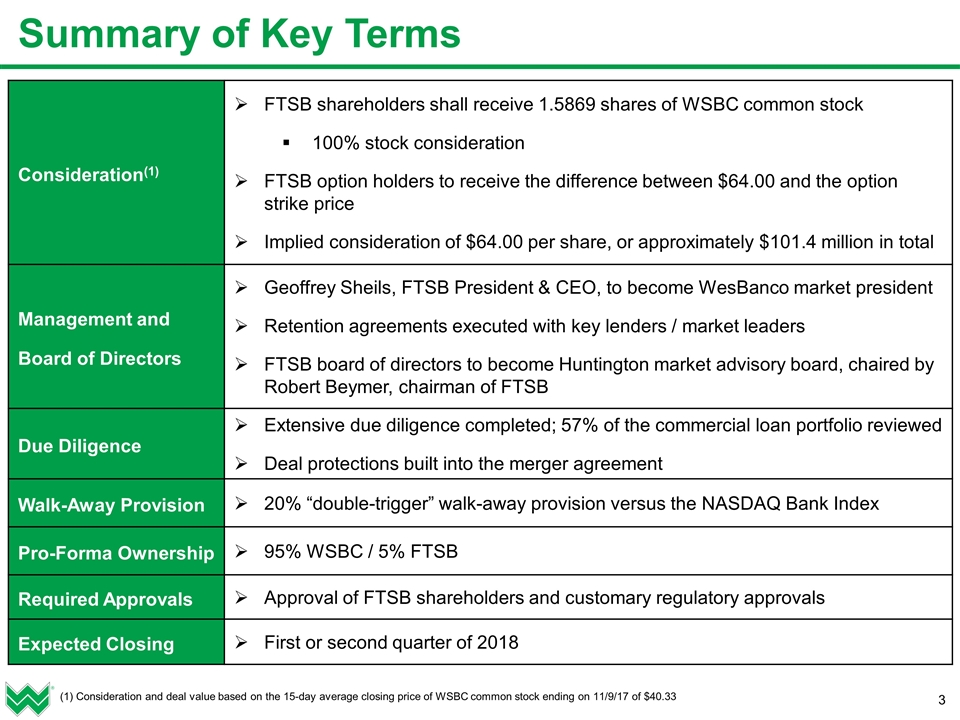
Consideration(1) FTSB shareholders shall receive 1.5869 shares of WSBC common stock 100% stock consideration FTSB option holders to receive the difference between $64.00 and the option strike price Implied consideration of $64.00 per share, or approximately $101.4 million in total Management and Board of Directors Geoffrey Sheils, FTSB President & CEO, to become WesBanco market president Retention agreements executed with key lenders / market leaders FTSB board of directors to become Huntington market advisory board, chaired by Robert Beymer, chairman of FTSB Due Diligence Extensive due diligence completed; 57% of the commercial loan portfolio reviewed Deal protections built into the merger agreement Walk-Away Provision 20% “double-trigger” walk-away provision versus the NASDAQ Bank Index Pro-Forma Ownership 95% WSBC / 5% FTSB Required Approvals Approval of FTSB shareholders and customary regulatory approvals Expected Closing First or second quarter of 2018 Summary of Key Terms (1) Consideration and deal value based on the 15-day average closing price of WSBC common stock ending on 11/9/17 of $40.33
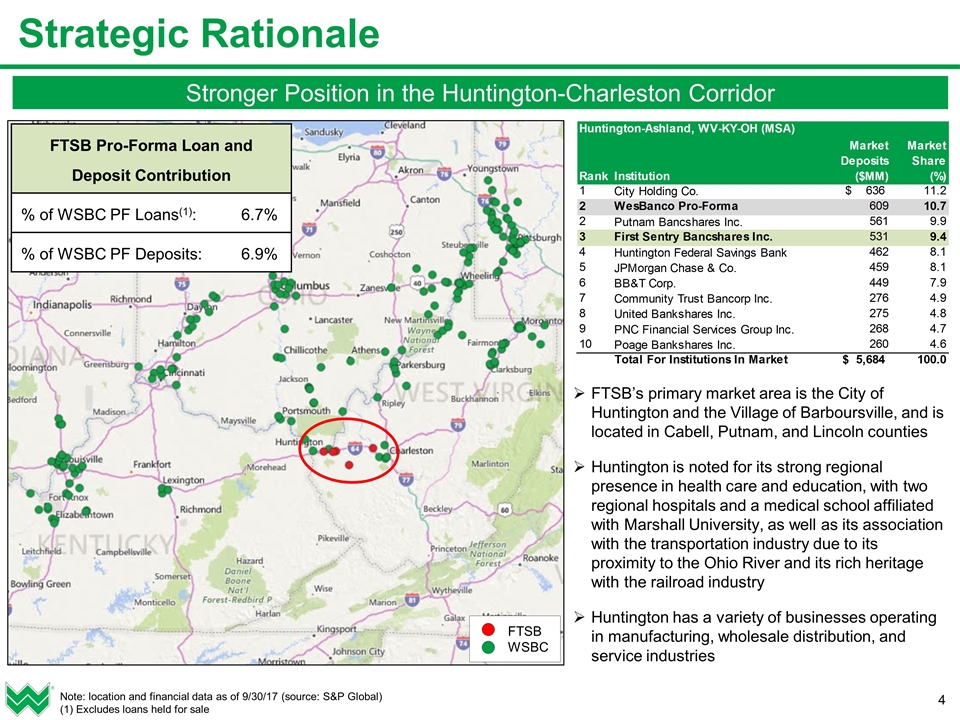
FTSB WSBC Strategic Rationale Note: location and financial data as of 9/30/17 (source: S&P Global) (1) Excludes loans held for sale FTSB Pro-Forma Loan and Deposit Contribution % of WSBC PF Loans(1): 6.7% % of WSBC PF Deposits: 6.9% FTSB’s primary market area is the City of Huntington and the Village of Barboursville, and is located in Cabell, Putnam, and Lincoln counties Huntington is noted for its strong regional presence in health care and education, with two regional hospitals and a medical school affiliated with Marshall University, as well as its association with the transportation industry due to its proximity to the Ohio River and its rich heritage with the railroad industry Huntington has a variety of businesses operating in manufacturing, wholesale distribution, and service industries Stronger Position in the Huntington-Charleston Corridor
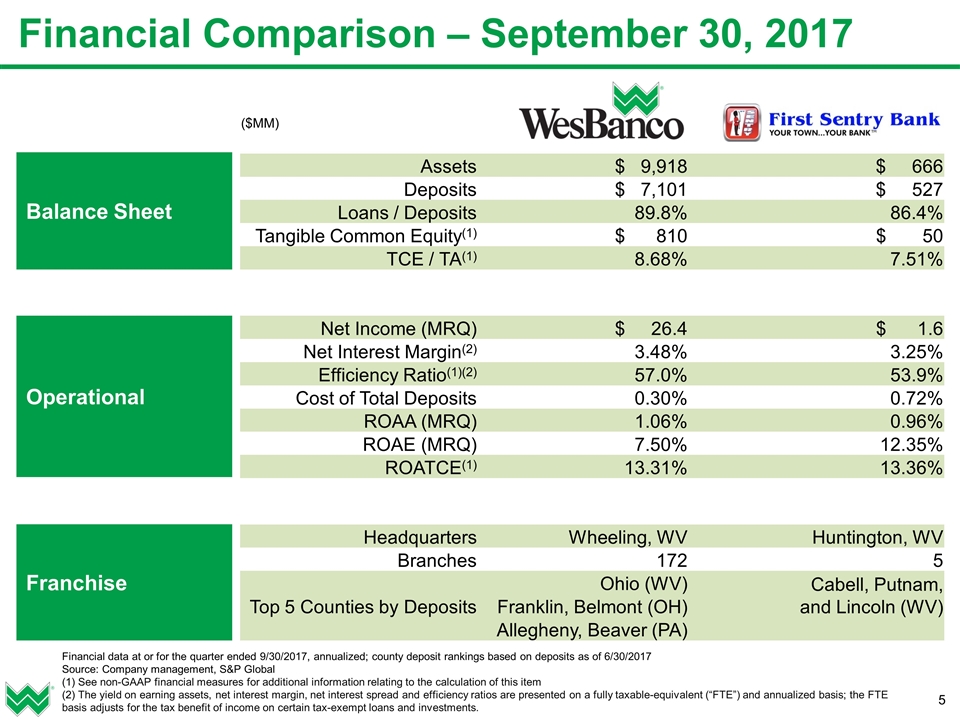
($MM) Assets $ 9,918 $ 666 Deposits $ 7,101 $ 527 Loans / Deposits 89.8% 86.4% Tangible Common Equity(1) $ 810 $ 50 TCE / TA(1) 8.68% 7.51% Net Income (MRQ) $ 26.4 $ 1.6 Net Interest Margin(2) 3.48% 3.25% Efficiency Ratio(1)(2) 57.0% 53.9% Cost of Total Deposits 0.30% 0.72% ROAA (MRQ) 1.06% 0.96% ROAE (MRQ) 7.50% 12.35% ROATCE(1) 13.31% 13.36% Headquarters Wheeling, WV Huntington, WV Branches 172 5 Top 5 Counties by Deposits Ohio (WV) Cabell, Putnam, and Lincoln (WV) Franklin, Belmont (OH) Allegheny, Beaver (PA) Financial Comparison – September 30, 2017 Balance Sheet Operational Franchise Financial data at or for the quarter ended 9/30/2017, annualized; county deposit rankings based on deposits as of 6/30/2017 Source: Company management, S&P Global (1) See non-GAAP financial measures for additional information relating to the calculation of this item (2) The yield on earning assets, net interest margin, net interest spread and efficiency ratios are presented on a fully taxable-equivalent (“FTE”) and annualized basis; the FTE basis adjusts for the tax benefit of income on certain tax-exempt loans and investments.
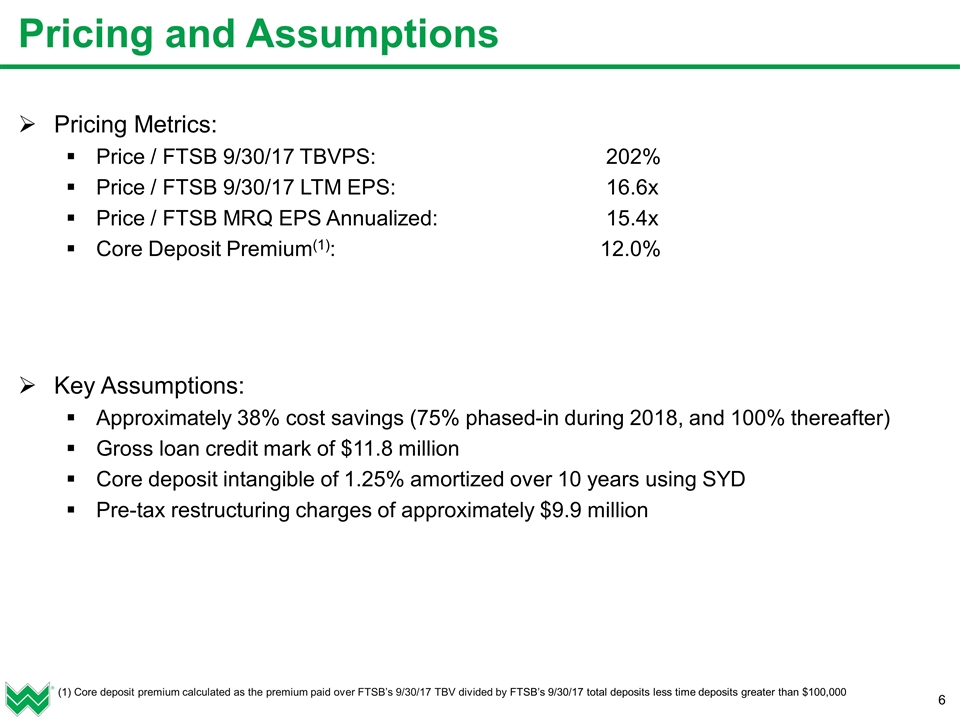
Pricing Metrics: Price / FTSB 9/30/17 TBVPS: 202% Price / FTSB 9/30/17 LTM EPS: 16.6x Price / FTSB MRQ EPS Annualized: 15.4x Core Deposit Premium(1): 12.0% Key Assumptions: Approximately 38% cost savings (75% phased-in during 2018, and 100% thereafter) Gross loan credit mark of $11.8 million Core deposit intangible of 1.25% amortized over 10 years using SYD Pre-tax restructuring charges of approximately $9.9 million Pricing and Assumptions (1) Core deposit premium calculated as the premium paid over FTSB’s 9/30/17 TBV divided by FTSB’s 9/30/17 total deposits less time deposits greater than $100,000
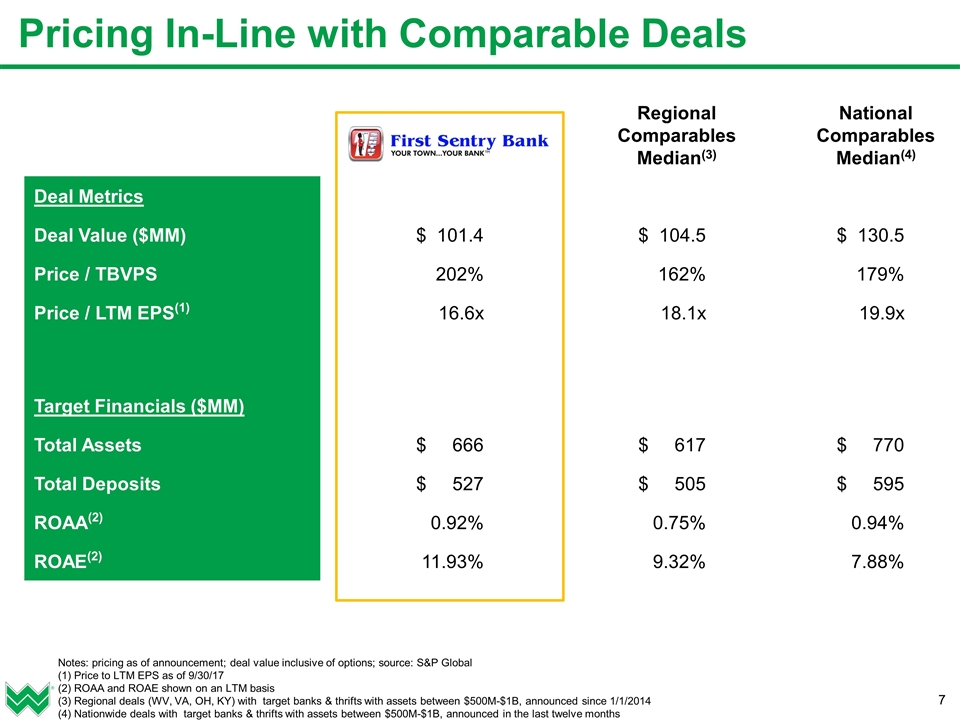
Pricing In-Line with Comparable Deals Notes: pricing as of announcement; deal value inclusive of options; source: S&P Global (1) Price to LTM EPS as of 9/30/17 (2) ROAA and ROAE shown on an LTM basis (3) Regional deals (WV, VA, OH, KY) with target banks & thrifts with assets between $500M-$1B, announced since 1/1/2014 (4) Nationwide deals with target banks & thrifts with assets between $500M-$1B, announced in the last twelve months Deal Metrics Deal Value ($MM) $ 101.4 $ 104.5 $ 130.5 Price / TBVPS 202% 162% 179% Price / LTM EPS(1) 16.6x 18.1x 19.9x Target Financials ($MM) Total Assets $ 666 $ 617 $ 770 Total Deposits $ 527 $ 505 $ 595 ROAA(2) 0.92% 0.75% 0.94% ROAE(2) 11.93% 9.32% 7.88% Regional Comparables Median(3) National Comparables Median(4)
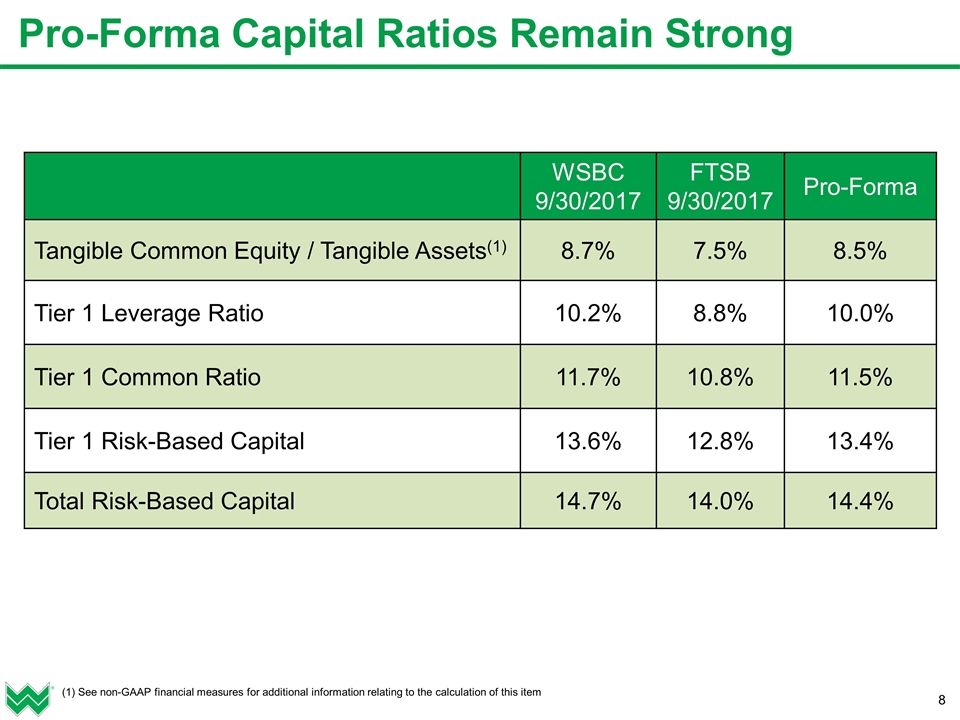
(1) See non-GAAP financial measures for additional information relating to the calculation of this item Pro-Forma Capital Ratios Remain Strong WSBC 9/30/2017 FTSB 9/30/2017 Pro-Forma Tangible Common Equity / Tangible Assets(1) 8.7% 7.5% 8.5% Tier 1 Leverage Ratio 10.2% 8.8% 10.0% Tier 1 Common Ratio 11.7% 10.8% 11.5% Tier 1 Risk-Based Capital 13.6% 12.8% 13.4% Total Risk-Based Capital 14.7% 14.0% 14.4%
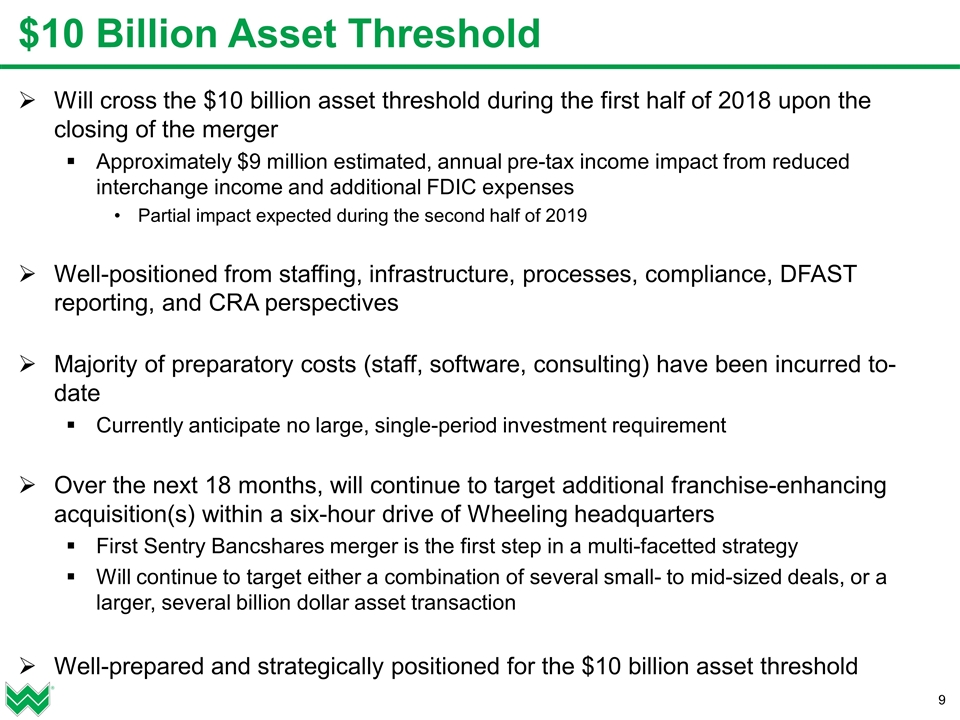
Will cross the $10 billion asset threshold during the first half of 2018 upon the closing of the merger Approximately $9 million estimated, annual pre-tax income impact from reduced interchange income and additional FDIC expenses Partial impact expected during the second half of 2019 Well-positioned from staffing, infrastructure, processes, compliance, DFAST reporting, and CRA perspectives Majority of preparatory costs (staff, software, consulting) have been incurred to-date Currently anticipate no large, single-period investment requirement Over the next 18 months, will continue to target additional franchise-enhancing acquisition(s) within a six-hour drive of Wheeling headquarters First Sentry Bancshares merger is the first step in a multi-facetted strategy Will continue to target either a combination of several small- to mid-sized deals, or a larger, several billion dollar asset transaction Well-prepared and strategically positioned for the $10 billion asset threshold $10 Billion Asset Threshold
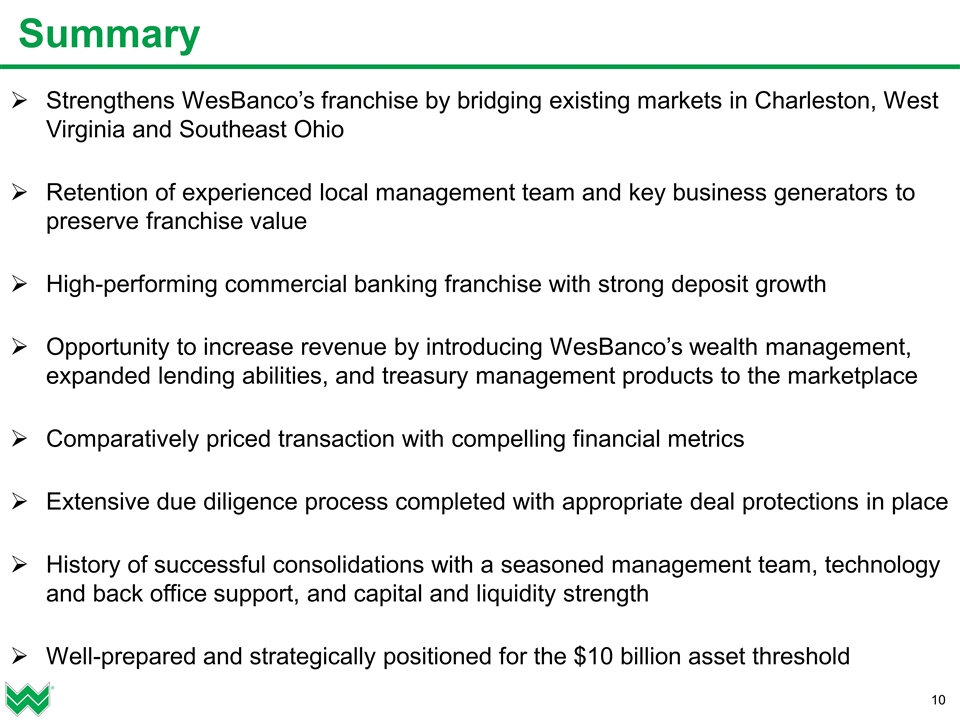
Summary Strengthens WesBanco’s franchise by bridging existing markets in Charleston, West Virginia and Southeast Ohio Retention of experienced local management team and key business generators to preserve franchise value High-performing commercial banking franchise with strong deposit growth Opportunity to increase revenue by introducing WesBanco’s wealth management, expanded lending abilities, and treasury management products to the marketplace Comparatively priced transaction with compelling financial metrics Extensive due diligence process completed with appropriate deal protections in place History of successful consolidations with a seasoned management team, technology and back office support, and capital and liquidity strength Well-prepared and strategically positioned for the $10 billion asset threshold
Appendix
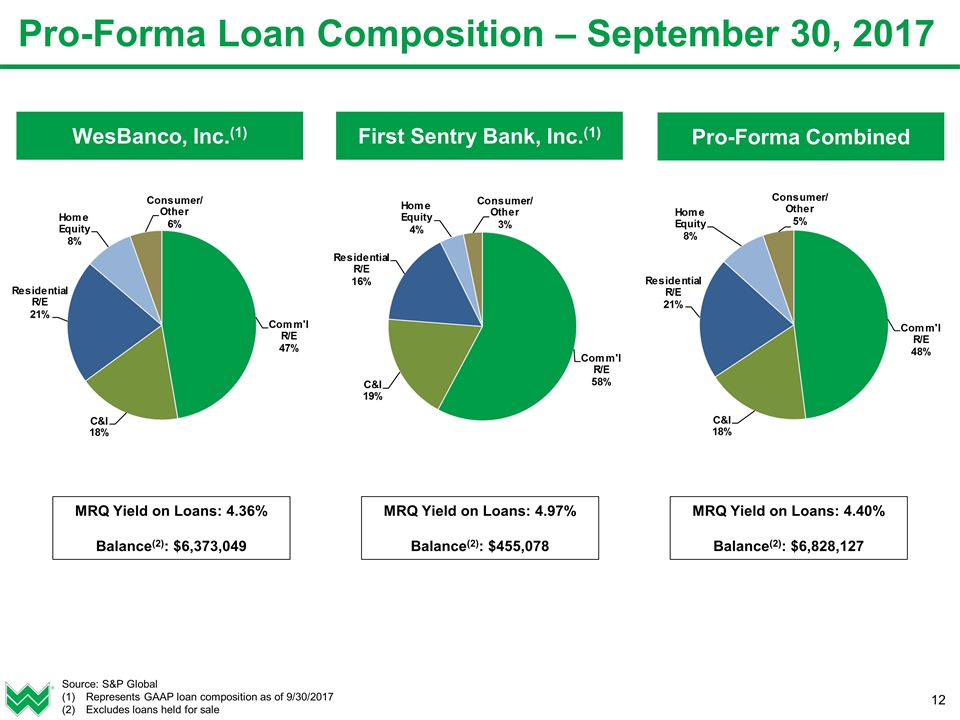
Pro-Forma Loan Composition – September 30, 2017 MRQ Yield on Loans: 4.36% Balance(2): $6,373,049 MRQ Yield on Loans: 4.97% Balance(2): $455,078 MRQ Yield on Loans: 4.40% Balance(2): $6,828,127 Source: S&P Global Represents GAAP loan composition as of 9/30/2017 Excludes loans held for sale Pro-Forma Combined WesBanco, Inc.(1) First Sentry Bank, Inc.(1)
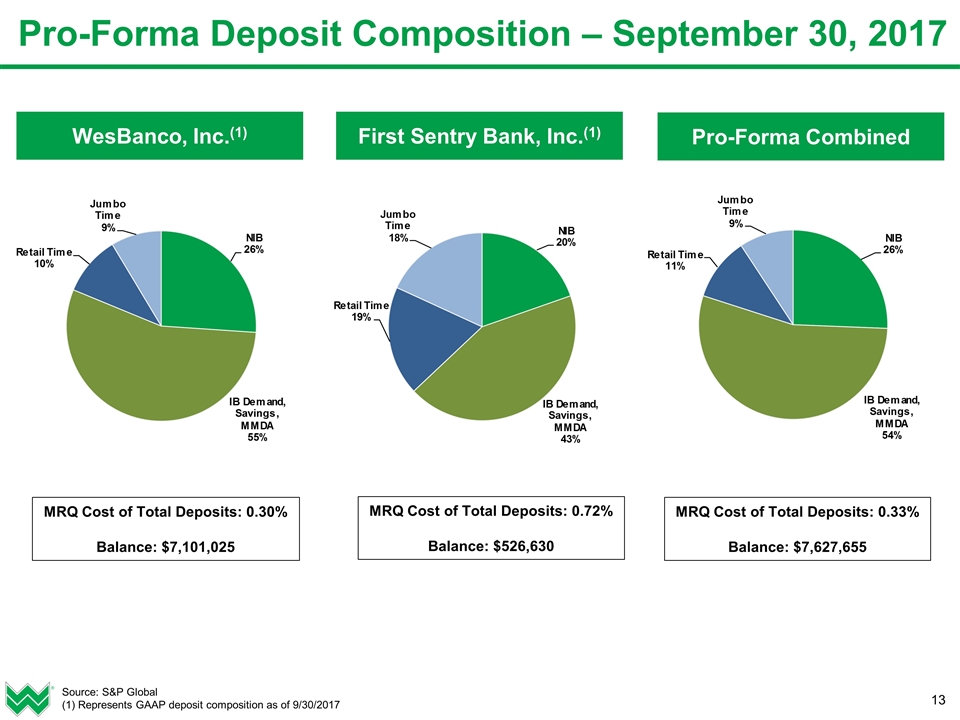
MRQ Cost of Total Deposits: 0.30% Balance: $7,101,025 Pro-Forma Deposit Composition – September 30, 2017 MRQ Cost of Total Deposits: 0.72% Balance: $526,630 MRQ Cost of Total Deposits: 0.33% Balance: $7,627,655 Source: S&P Global (1) Represents GAAP deposit composition as of 9/30/2017 Pro-Forma Combined WesBanco, Inc.(1) First Sentry Bank, Inc.(1)
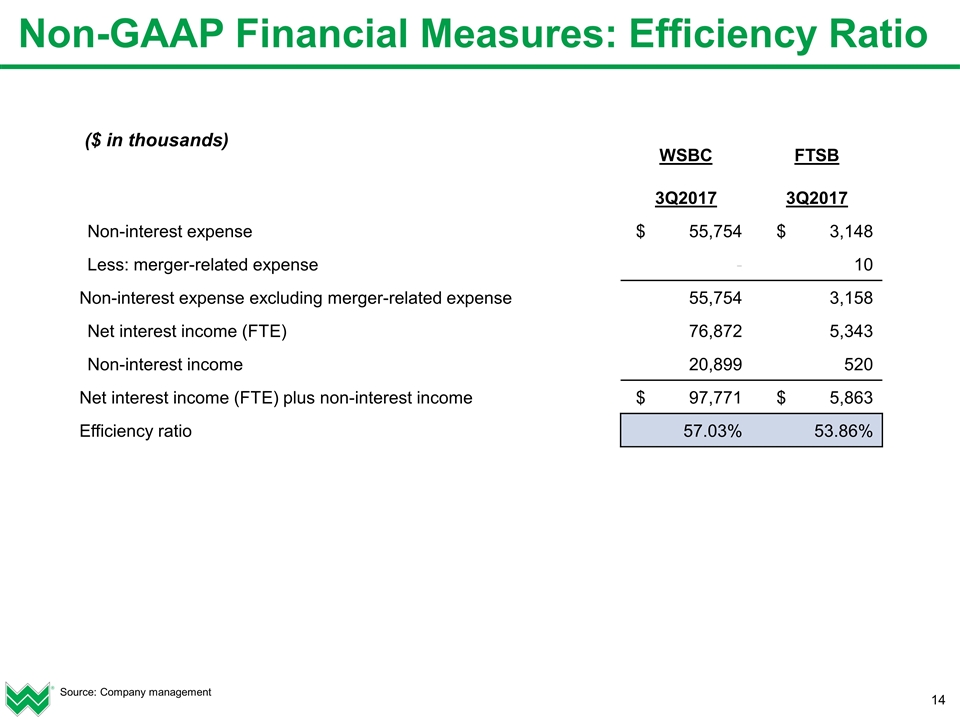
Non-GAAP Financial Measures: Efficiency Ratio ($ in thousands) WSBC FTSB 3Q2017 3Q2017 Non-interest expense $ 55,754 $ 3,148 Less: merger-related expense - 10 Non-interest expense excluding merger-related expense 55,754 3,158 Net interest income (FTE) 76,872 5,343 Non-interest income 20,899 520 Net interest income (FTE) plus non-interest income $ 97,771 $ 5,863 Efficiency ratio 57.03% 53.86% Source: Company management
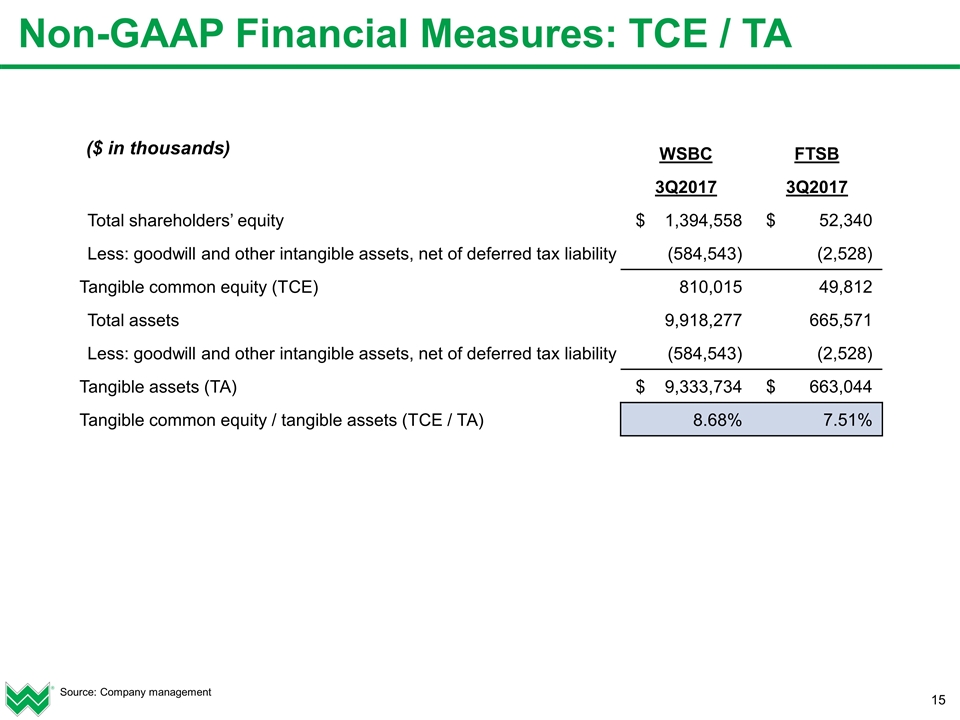
Non-GAAP Financial Measures: TCE / TA Source: Company management ($ in thousands) WSBC FTSB 3Q2017 3Q2017 Total shareholders’ equity $ 1,394,558 $ 52,340 Less: goodwill and other intangible assets, net of deferred tax liability (584,543) (2,528) Tangible common equity (TCE) 810,015 49,812 Total assets 9,918,277 665,571 Less: goodwill and other intangible assets, net of deferred tax liability (584,543) (2,528) Tangible assets (TA) $ 9,333,734 $ 663,044 Tangible common equity / tangible assets (TCE / TA) 8.68% 7.51%
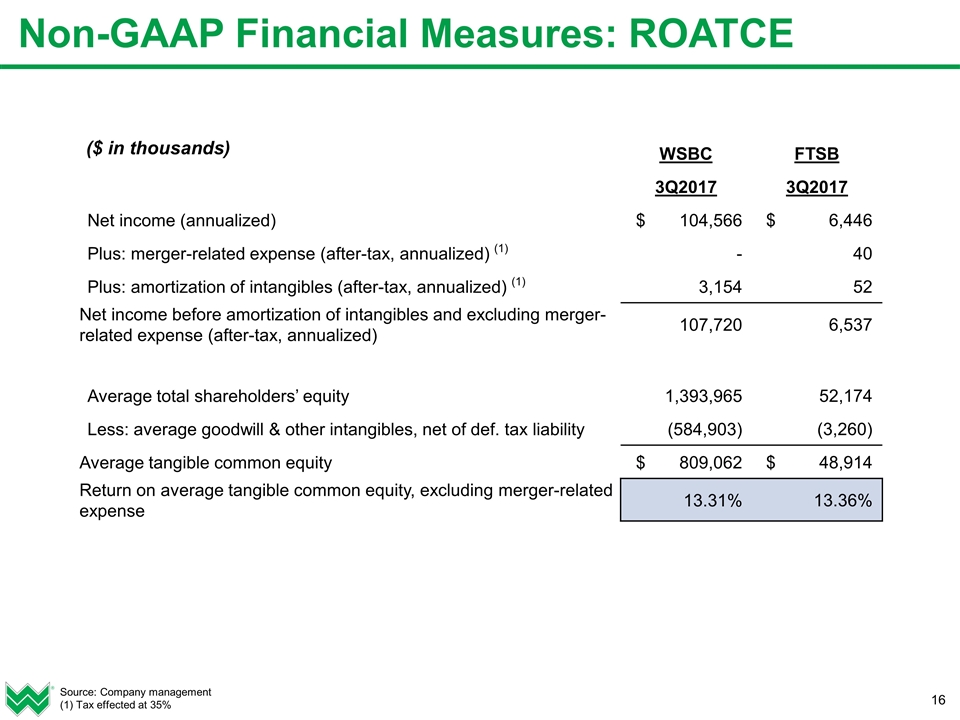
Non-GAAP Financial Measures: ROATCE Source: Company management (1) Tax effected at 35% ($ in thousands) WSBC FTSB 3Q2017 3Q2017 Net income (annualized) $ 104,566 $ 6,446 Plus: merger-related expense (after-tax, annualized) (1) - 40 Plus: amortization of intangibles (after-tax, annualized) (1) 3,154 52 Net income before amortization of intangibles and excluding merger-related expense (after-tax, annualized) 107,720 6,537 Average total shareholders’ equity 1,393,965 52,174 Less: average goodwill & other intangibles, net of def. tax liability (584,903) (3,260) Average tangible common equity $ 809,062 $ 48,914 Return on average tangible common equity, excluding merger-related expense 13.31% 13.36%
