Attached files
| file | filename |
|---|---|
| EX-32.1 - EX-32.1 - WESBANCO INC | d297762dex321.htm |
| EX-31.2 - EX-31.2 - WESBANCO INC | d297762dex312.htm |
| EX-31.1 - EX-31.1 - WESBANCO INC | d297762dex311.htm |
| EX-24 - EX-24 - WESBANCO INC | d297762dex24.htm |
| EX-23 - EX-23 - WESBANCO INC | d297762dex23.htm |
| EX-21 - EX-21 - WESBANCO INC | d297762dex21.htm |
Table of Contents
UNITED STATES
SECURITIES AND EXCHANGE COMMISSION
WASHINGTON, DC 20549
FORM 10-K
(Mark One)
| ☒ | ANNUAL REPORT PURSUANT TO SECTION 13 OR 15(d) OF THE SECURITIES EXCHANGE ACT OF 1934 |
For the fiscal year ended December 31, 2016
| ☐ | TRANSITION REPORT PURSUANT TO SECTION 13 OR 15(d) OF THE SECURITIES EXCHANGE ACT OF 1934 |
For the transition period from to
Commission File Number 000-08467
WESBANCO, INC.
(Exact name of Registrant as specified in its charter)
| WEST VIRGINIA | 55-0571723 | |
| (State or other jurisdiction of incorporation or organization) |
(IRS Employer Identification No.) | |
| 1 Bank Plaza, Wheeling, WV | 26003 | |
| (Address of principal executive offices) | (Zip Code) | |
Registrant’s telephone number, including area code: 304-234-9000
Securities registered pursuant to Section 12(b) of the Act:
| Title of each class |
Name of each Exchange on which registered | |
| Common Stock $2.0833 Par Value | NASDAQ Global Select Market |
Securities registered pursuant to Section 12(g) of the Act: None
Indicate by check mark if the registrant is a well-known seasoned issuer, as defined in Rule 405 of the Securities Act. Yes ☑ No ☐
Indicate by check mark if the registrant is not required to file reports pursuant to Section 13 or 15 (d) of the Act. Yes ☐ No ☑
Indicate by check mark whether the registrant (1) has filed all reports required to be filed by Section 13 or 15 (d) of the Securities Exchange Act of 1934 during the preceding 12 months (or for such shorter period that the registrant was required to file such reports), and (2) has been subject to such filing requirements for the past 90 days. Yes ☑ No ☐
Indicate by check mark whether the registrant has submitted electronically and posted on its corporate Web site, if any, every Interactive Data File required to be submitted and posted pursuant to Rule 405 of Regulation S-T (section 232.405 of this chapter) during the preceding 12 months (or for such shorter period that the registrant was required to submit and post such files). Yes ☑ No ☐
Indicate by check mark if disclosure of delinquent filers pursuant to Item 405 of Regulation S-K (section 229.405 of this chapter) is not contained herein, and will not be contained, to the best of registrant’s knowledge, in definitive proxy or information statements incorporated by reference in Part III of this Form 10-K or any amendment to this Form 10-K. ☑
Indicate by check mark whether the registrant is a large accelerated filer, an accelerated filer, a non-accelerated filer or a smaller reporting company. See definitions of “large accelerated filer,” “accelerated filer,” and “smaller reporting company” in Rule 12b-2 of the Exchange Act:
| Large accelerated filer ☑ | Accelerated filer ☐ | |
| Non-accelerated filer ☐ | Smaller reporting company ☐ | |
| (Do not check if a smaller reporting company) |
Indicate by check mark whether the registrant is a shell company (as defined in Rule 12b-2 of the Act.) Yes ☐ No ☑
The aggregate market value of the registrant’s outstanding voting and non-voting common stock held by non-affiliates on June 30, 2016, determined using a per share closing price on that date of $31.05, was $1,112,248,757.
As of February 17, 2017, there were 43,952,569 shares of WesBanco, Inc. common stock $2.0833 par value per share, outstanding.
DOCUMENTS INCORPORATED BY REFERENCE
Certain specifically designated portions of Wesbanco, Inc.’s definitive proxy statement which will be filed by April 30, 2017 for its Annual Meeting of Shareholders (the “Proxy Statement”) to be held in 2017 are incorporated by reference into Part III of this Form 10-K.
Table of Contents
WESBANCO, INC.
ANNUAL REPORT ON FORM 10-K
| ITEM # |
ITEM |
Page No. | ||||
| Part I | ||||||
| 1 |
Business | 3 - 13 | ||||
| 1A |
Risk Factors | 13 - 23 | ||||
| 1B |
Unresolved Staff Comments | 23 | ||||
| 2 |
Properties | 23 | ||||
| 3 |
Legal Proceedings | 23 | ||||
| 4 |
Mine Safety Disclosures | 23 | ||||
| Part II | ||||||
| 5 |
24 - 26 | |||||
| 6 |
27 - 30 | |||||
| 7 |
Management’s Discussion and Analysis of Financial Condition and Results of Operations |
31 - 77 | ||||
| 7A |
Quantitative and Qualitative Disclosures about Market Risk | 78 - 83 | ||||
| 8 |
84 - 149 | |||||
| 9 |
Changes in and Disagreements with Accountants on Accounting and Financial Disclosure |
150 | ||||
| 9A |
Controls and Procedures | 150 | ||||
| 9B |
Other Information | 150 | ||||
| Part III | ||||||
| 10 |
Directors, Executive Officers and Corporate Governance | 151 | ||||
| 11 |
Executive Compensation | 151 | ||||
| 12 |
Security Ownership of Certain Beneficial Owners and Management and Related Stockholder Matters |
151 | ||||
| 13 |
Certain Relationships and Related Transactions, and Director Independence | 152 | ||||
| 14 |
Principal Accounting Fees and Services | 152 | ||||
| Part IV | ||||||
| 15 |
Exhibits and Financial Statement Schedules | 153 - 158 | ||||
| 16 |
Form 10-K Summary | 153 | ||||
| Signatures | 159 | |||||
2
Table of Contents
| ITEM 1. | BUSINESS |
GENERAL
WesBanco, Inc. (“WesBanco”), a bank holding company incorporated in 1968 and headquartered in Wheeling, West Virginia, offers a full range of financial services including retail banking, corporate banking, personal and corporate trust services, brokerage services, mortgage banking and insurance. WesBanco offers these services through two reportable segments, community banking and trust and investment services. For additional information regarding WesBanco’s business segments please refer to Note 23, “Business Segments” in the Consolidated Financial Statements.
At December 31, 2016, WesBanco operated one commercial bank, WesBanco Bank, Inc. (“WesBanco Bank” or the “Bank”), through 174 branches and 163 ATM machines located in West Virginia, Ohio, western Pennsylvania, Kentucky and southern Indiana. Total assets of WesBanco Bank as of December 31, 2016 approximated $9.8 billion. WesBanco Bank also offers trust and investment services and various alternative investment products including mutual funds and annuities. The market value of assets under management of the trust and investment services segment was approximately $3.7 billion as of December 31, 2016. These assets are held by WesBanco Bank in fiduciary or agency capacities for its customers and therefore are not included as assets on WesBanco’s Consolidated Balance Sheets.
On September 9, 2016, WesBanco completed the acquisition of Your Community Bankshares, Inc. (“YCB”), a bank holding company headquartered in New Albany, Indiana with approximately $1.5 billion in assets excluding goodwill, with $1.2 billion in total deposits and $1.0 billion in total loans, and 34 branches in Kentucky and southern Indiana. The transaction has expanded WesBanco’s franchise in the Kentucky and southern Indiana region.
WesBanco offers additional services through its non-banking subsidiaries, WesBanco Insurance Services, Inc. (“WesBanco Insurance”), a multi-line insurance agency specializing in property, casualty, life and title insurance, with benefit plan sales and administration for personal and commercial clients; and WesBanco Securities, Inc. (“WesBanco Securities”), a full service broker-dealer, which also offers discount brokerage services.
WesBanco Asset Management, Inc., which was incorporated in 2002, holds certain investment securities and loans in a Delaware-based subsidiary.
WesBanco Properties, Inc. holds certain commercial real estate properties. The commercial property is leased to WesBanco Bank and to certain non-related third parties.
CBIN Insurance Inc. is a captive insurance company, which issues policies to the Company’s banking subsidiaries.
WesBanco has twelve capital trusts, which are all wholly-owned trust subsidiaries formed for the purpose of issuing trust preferred securities (“Trust Preferred Securities”) and lending the proceeds to WesBanco. For more information regarding WesBanco’s issuance of trust preferred securities please refer to Note 11, “Subordinated Debt and Junior Subordinated Debt” in the Consolidated Financial Statements.
In connection with WesBanco’s acquisition of ESB on February 10, 2015, WesBanco acquired ESB’s wholly owned subsidiary AMSCO, Inc., (“AMSCO”). AMSCO engages in the management of certain real estate development and construction of 1-4 family residential units through seven joint venture partnerships. For more information please refer to Note 8, “Investments in Limited Partnerships” in the Consolidated Financial Statements.
3
Table of Contents
In connection with WesBanco’s acquisition of YCB on September 9, 2016, WesBanco acquired YCB’s three wholly owned subsidiaries CBSI Holdings, Inc., CBSI Investments, Inc., and CBSI Investment Portfolio Management, LLC. CBSI Holdings, Inc. and CBSI Investments, Inc. are Nevada corporations, which jointly own CBSI Investment Portfolio Management, LLC, a Nevada limited liability corporation. In addition, WesBanco acquired Kentuckiana Real Estate Holdings, LLC, and Southern Indiana Real Estate Holdings, LLC, which are Indiana and Kentucky limited liability corporations.
WesBanco Bank’s Investment Department also serves as investment adviser to a family of mutual funds, namely the “WesMark Funds”. The fund family is comprised of the WesMark Growth Fund, the WesMark Balanced Fund, the WesMark Small Company Growth Fund, the WesMark Government Bond Fund, and the WesMark West Virginia Municipal Bond Fund.
As of December 31, 2016, none of WesBanco’s subsidiaries were engaged in any operations in foreign countries, and none had transactions with customers in foreign countries.
EMPLOYEES
There were 1,928 full-time equivalent employees employed by WesBanco and its subsidiaries at December 31, 2016. None of the employees were represented by collective bargaining agreements. WesBanco believes its employee relations to be satisfactory.
WEB SITE ACCESS TO WESBANCO’S FILINGS WITH THE SECURITIES AND EXCHANGE COMMISSION
All of WesBanco’s electronic filings for 2016 filed with the Securities and Exchange Commission (the “SEC”), including this Annual Report on Form 10-K, Quarterly Reports on Form 10-Q, Current Reports on Form 8-K and amendments to these reports filed or furnished pursuant to Section 13(a) or 15(d) of the Securities Exchange Act of 1934, are made available at no cost on WesBanco’s website, www.wesbanco.com, in the “About Us” section through the “Investor Relations” link as soon as reasonably practicable after WesBanco files such material with, or furnishes it to, the SEC. WesBanco’s SEC filings are also available through the SEC’s website at www.sec.gov.
Upon written request of any shareholder of record on December 31, 2016, WesBanco will provide, without charge, a printed copy of this 2016 Annual Report on Form 10-K, including financial statements and schedules, as required to be filed with the SEC. To obtain a copy of this report, contact: John Iannone, WesBanco, Inc., 1 Bank Plaza, Wheeling, WV 26003 (304) 905-7021.
COMPETITION
Competition in the form of price and service from other banks, including local, regional and national banks and financial companies such as savings and loans, internet banks, payday lenders, money services businesses, credit unions, finance companies, brokerage firms and other non-banking companies providing various regulated and non-regulated financial services and products, is intense in most of the markets served by WesBanco and its subsidiaries. WesBanco’s trust and investment services segment receives competition from commercial banks, trust companies, mutual fund companies, investment advisory firms, law firms, brokerage firms and other financial services companies. As a result of consolidation within the financial services industry, mergers between, and the expansion of, financial institutions both within and outside of WesBanco’s major markets have provided significant competitive pressure in those markets. Many of WesBanco’s competitors have greater resources and, as such, may have higher lending limits and may offer other products and services that are not provided by WesBanco. WesBanco generally competes on the basis of superior customer service and responsiveness to customer needs, available loan and deposit products, rates of interest charged on loans, rates of
4
Table of Contents
interest paid for deposits, and the availability and pricing of trust, brokerage and insurance services. As a result of WesBanco’s expansion into certain larger metropolitan markets, it has faced entrenched larger bank competitors with an already existing customer base that may far exceed WesBanco’s initial entry position into those markets. As a result, WesBanco may be forced to compete more aggressively for loans, deposits, trust and insurance products in order to grow its market share, potentially reducing its current and future profit potential from such markets.
SUPERVISION AND REGULATION
As a bank holding company and a financial holding company under federal law, WesBanco is subject to supervision and examination by the Board of Governors of the Federal Reserve System (“Federal Reserve Board”) under the Bank Holding Company Act of 1956, as amended (the “BHCA”), and is required to file with the Federal Reserve Board reports and other information regarding its business operations and the business operations of its subsidiaries. WesBanco also is required to obtain Federal Reserve Board approval prior to acquiring, directly or indirectly, ownership or control of certain voting shares of other banks, as described below. Since WesBanco is both a bank holding company and a financial holding company, WesBanco can offer customers virtually any type of service that is financial in nature or incidental thereto, including banking and activities closely related to banking, securities underwriting, insurance (both underwriting and agency) and merchant banking.
As indicated above, WesBanco presently operates one bank subsidiary, WesBanco Bank, which is a West Virginia banking corporation and is not a member bank of the Federal Reserve System. It is subject to examination and supervision by the Federal Deposit Insurance Corporation (the “FDIC”) and the West Virginia Division of Financial Institutions. The deposits of WesBanco Bank are insured by the Deposit Insurance Fund of the FDIC. WesBanco’s non-bank subsidiaries are subject to examination and supervision by the Federal Reserve Board and examination by other federal and state agencies, including, in the case of certain securities activities, regulation by the SEC, the Financial Institution Regulatory Authority (“FINRA”), the Municipal Securities Rulemaking Board and the Securities Investors Protection Corporation. WesBanco Bank maintains one designated financial subsidiary, WesBanco Insurance, which, as indicated above, is a multi-line insurance agency specializing in property, casualty, life and title insurance, with benefit plan sales and administration for personal and commercial clients.
WesBanco is also under the jurisdiction of the SEC and certain state securities commissions for matters relating to the offering and sale of its securities. WesBanco is subject to the disclosure and regulatory requirements of the Securities Act of 1933, as amended, and the Securities Exchange Act of 1934, as amended, as administered by the SEC. WesBanco is listed on the NASDAQ Global Select Market (the “NASDAQ”) under the trading symbol “WSBC” and is subject to the rules of the NASDAQ for listed companies.
Under the Riegle-Neal Interstate Banking and Branching Efficiency Act of 1994, as amended (the “Riegle-Neal Act”), a bank holding company may acquire banks in states other than its home state, subject to certain limitations. The Riegle-Neal Act also authorizes banks to merge across state lines, thereby creating interstate banking. Under the Dodd-Frank Wall Street Reform and Consumer Protection Act (the “Dodd-Frank Act”), banks are also permitted to establish de novo branches across state lines to the same extent that a state-chartered bank in each host state would be permitted to open branches.
Under the BHCA, prior Federal Reserve Board approval is required for WesBanco to acquire more than 5% of the voting stock of any bank. In determining whether to approve a proposed bank acquisition, federal banking regulators will consider, among other factors, the effect of the acquisition on competition, the public benefits expected to be received from the acquisition, the projected capital ratios and levels on a post-acquisition basis, and the acquiring institution’s record of addressing the credit needs of the communities it serves, including the needs of low and moderate income neighborhoods, consistent with safe and sound operation of the bank, under the Community Reinvestment Act, as amended (the “CRA”).
5
Table of Contents
HOLDING COMPANY REGULATIONS
As indicated above, WesBanco has one state bank subsidiary, WesBanco Bank, as well as non-bank subsidiaries, which are described further in “Item 1. Business—General” section of this Annual Report on Form 10-K. The subsidiary bank is subject to affiliate transaction restrictions under federal law, which limit “covered transactions” by the subsidiary bank with the parent and any non-bank subsidiaries of the parent, which are referred to in the aggregate in this paragraph as “affiliates” of the subsidiary bank. “Covered transactions” include loans or extensions of credit to an affiliate (including repurchase agreements), purchases of or investments in securities issued by an affiliate, purchases of assets from an affiliate, the acceptance of securities issued by an affiliate as collateral for a loan or extension of credit, the issuance of a guarantee, acceptance or letter of credit on behalf of an affiliate, certain transactions that involve borrowing or lending securities, and certain derivative transactions with an affiliate. Such covered transactions between the subsidiary bank and any single affiliate are limited in amount to 10% of the subsidiary bank’s capital and surplus, and, with respect to covered transactions with all affiliates in the aggregate, are limited in amount to 20% of the subsidiary bank’s capital and surplus. Furthermore, such loans or extensions of credit, guarantees, acceptances and letters of credit, and any credit exposure resulting from securities borrowing or lending transactions or derivatives transactions, are required to be secured by collateral at all times in amounts specified by law. In addition, all covered transactions must be conducted on terms and conditions that are consistent with safe and sound banking practices.
The Dodd-Frank Act requires a bank holding company to act as a source of financial strength to its subsidiary bank. Under this source of strength requirement, the Federal Reserve Board may require a bank holding company to make capital infusions into a troubled subsidiary bank, and may charge the bank holding company with engaging in unsafe and unsound practices for failure to commit resources to such a subsidiary bank. A capital infusion conceivably could be required at a time when WesBanco may not have the resources to provide it.
PAYMENT OF DIVIDENDS
Dividends from the subsidiary bank are a significant source of funds for payment of dividends to WesBanco’s shareholders. For the year ended December 31, 2016, WesBanco declared cash dividends to its common shareholders of approximately $39.5 million.
As of December 31, 2016, WesBanco Bank was “well capitalized” under the definition in Section 325.103 of the FDIC Regulations. Therefore, as long as the Bank remains “well capitalized” or even becomes “adequately capitalized,” there would be no basis under Section 325.105 to limit the ability of the Bank to pay dividends because it had not become undercapitalized, significantly undercapitalized or critically undercapitalized. As of January 1, 2016, WesBanco Bank and WesBanco became subject to “capital conservative buffer” rules, which require WesBanco and WesBanco Bank to have capital levels above the regulatory minimums in order to pay dividends (discussed below in connection with the Basel III initiative under “Item 1. Business—Capital Requirements”).
All financial institutions are subject to the prompt corrective action provisions set forth in Section 38 of the Federal Deposit Insurance Act (the “FDI Act”) and the provisions set forth in Section 325.105 of the FDIC Regulations. Immediately upon a state non-member bank receiving notice, or being deemed to have notice, that the bank is undercapitalized, significantly undercapitalized, or critically undercapitalized, as defined in Section 325.103 of the FDIC Regulations, the bank is precluded from being able to pay dividends to its shareholders based upon the requirements in Section 38(d) of the FDI Act, 12. U.S.C. § 1831o(d).
In addition, with respect to possible dividends by the Bank, under Section 31A-4-25 of the West Virginia Code, the prior approval of the West Virginia Commissioner of Banking would be required if the total of all dividends declared by the Bank in any calendar year would exceed the total of the Bank’s net profits for that year
6
Table of Contents
combined with its retained net profits of the preceding two years. Further, Section 31A-4-25 limits the ability of a West Virginia banking institution to pay dividends until the surplus fund of the banking institution equals the common stock of the banking institution and if certain specified amounts of recent profits of the banking institution have not been carried to the surplus fund.
If, in the opinion of the applicable regulatory authority, a bank under its jurisdiction is engaged in or is about to engage in an unsafe or unsound practice which, depending on the financial condition of the bank, could include the payment of dividends, such authority may require, after notice and hearing, that such bank cease and desist from such practice. The Federal Reserve Board has issued policy statements which provide that insured banks and bank holding companies should generally only pay dividends out of current operating earnings. Under applicable law, bank regulatory agency approval is required if the total of all dividends declared by a bank in any calendar year exceeds the available retained earnings or exceeds the aggregate of the bank’s net profits (as defined by regulatory agencies) for that year and its retained net profits for the preceding two years. As of December 31, 2016, under FDIC regulations, WesBanco could receive, without prior regulatory approval, a dividend of up to $42.2 million from WesBanco Bank. Additional information regarding dividend restrictions is set forth in Note 21, “Regulatory Matters,” in the Consolidated Financial Statements.
On February 24, 2009, the Federal Reserve Division of Banking Supervision and Regulation issued a letter providing direction to bank holding companies on the payment of dividends, capital repurchases and capital redemptions. Although the letter largely reiterates longstanding Federal Reserve supervisory policies, it emphasizes the need for a bank holding company to review various factors when considering the declaration of a dividend or taking action that would reduce regulatory capital provided by outstanding financial instruments. These factors include the potential need to increase loan loss reserves, write down assets and reflect declines in asset values in equity. In addition, the bank holding company should consider its past and anticipated future earnings, the dividend payout ratio in relation to earnings, and adequacy of regulatory capital before any action is taken. The consideration of capital adequacy should include a review of all known factors that may affect capital in the future.
In certain circumstances, defined by regulation relating to levels of earnings and capital, advance notification to, and in some circumstances, approval by the regulator could be required to declare a dividend or repurchase or redeem capital instruments.
FDIC INSURANCE
FDIC insurance premiums are assessed by the FDIC using a risk-based approach that places insured institutions into categories based on capital and risk profiles. In 2016, WesBanco Bank paid deposit insurance premiums of $4.0 million, compared to $4.1 million and $3.0 million in 2015 and 2014, respectively. The decrease from the prior year was due to the FDIC reducing its assessment base for banks with less than $10 billion in assets as of July 1, 2016. WesBanco Bank’s capital, net income and loan quality financial ratios used to calculate the assessment rate have continually improved, leading to a decrease in the assessment rate.
Effective July 1, 2016, the FDIC issued a final rule in order to implement section 334 of the Dodd-Frank Act (§334), which requires the FDIC to (1) raise the minimum reserve ratio for the FDIC Deposit Insurance Fund to 1.35 percent, from 1.15 percent, (2) assess premiums on banks to reach the 1.35 percent goal by September 30, 2020, and (3) offset the effect of the increase in the minimum reserve ratio on insured depository institutions with assets of less than $10 billion. The final rule imposes a surcharge on large banks, to be assessed over a period of eight quarters, as a means to implement §334. If this surcharge is insufficient to increase the reserve ratio to 1.35 percent by December 31, 2018, a one-time shortfall assessment will be imposed on institutions with total consolidated assets of $10 billion or more on March 31, 2019. WesBanco is currently not subject to the surcharge assessment. However, when and if WesBanco were to become subject to the surcharge, management currently estimates that, based on the final rule, FDIC expense will increase minimally as the surcharge is calculated only upon assets greater than $10 billion.
7
Table of Contents
CAPITAL REQUIREMENTS
The Federal Reserve Board has issued risk-based capital ratio and leverage ratio guidelines for bank holding companies. The risk-based capital ratio guidelines establish a systematic analytical framework that makes regulatory capital requirements more sensitive to differences in risk profiles among banking organizations, takes off-balance sheet exposures into explicit account in assessing capital adequacy, and minimizes disincentives to holding liquid, low-risk assets. Under the guidelines and related policies, bank holding companies must maintain capital sufficient to meet both a risk-based asset ratio test and a leverage ratio test on a consolidated basis. The risk-based ratio is determined by allocating assets and specified off-balance sheet commitments into four weighted categories, with higher weightings being assigned to categories perceived as representing greater risk. A bank holding company’s capital is then divided by total risk-weighted assets to yield the risk-based ratio. The leverage ratio is determined by relating core capital to total assets adjusted as specified in the guidelines. The Bank is subject to substantially similar capital requirements.
The federal regulatory authorities’ risk-based capital guidelines are based upon agreements reached by the Basel Committee on Banking Supervision (the “Basel Committee”). The Basel Committee is a committee of central banks and bank supervisors and regulators from the major industrialized countries that develops broad policy guidelines for use by each country’s supervisors in determining the supervisory policies they apply. In December 2010, the Basel Committee issued a strengthened set of international capital and liquidity standards for banks and bank holding companies, known as “Basel III.” In July 2013, the U.S. federal banking agencies issued a joint final rule that implements the Basel III capital standards and establishes the minimum capital levels required under the Dodd-Frank Act. The rule was effective January 1, 2015 subject to a transition period providing for full implementation on January 1, 2019.
Generally, under the applicable guidelines, a financial institution’s capital is divided into common equity Tier 1 (“CET1”), total Tier 1 and Tier 2. CET1 includes common shares and retained earnings less goodwill, intangible assets subject to limitation and certain deferred tax assets subject to limitation. In addition, under the final capital rule, an institution may make a one-time, permanent election to continue to exclude accumulated other comprehensive income from capital. If an institution does not make this election, unrealized gains and losses will be included in the calculation of its CET1. Total Tier 1 is comprised of CET1 and certain restricted capital instruments, including qualifying cumulative perpetual preferred stock and qualifying trust preferred securities, in their Tier 1 capital, up to a limit of 25% of Tier 1 capital. (See below within this section for more information regarding the capital treatment of trust preferred securities.)
Tier 2, or supplementary capital, includes, among other things, portions of trust preferred securities and cumulative perpetual preferred stock not otherwise counted in Tier 1 capital, as well as perpetual preferred stock, intermediate-term preferred stock, hybrid capital instruments, perpetual debt, mandatory convertible debt securities, term subordinated debt, unrealized holding gains on equity securities, and the allowance for loan and lease losses, all subject to certain limitations. “Total capital” is the sum of Tier 1 and Tier 2 capital. The amount of Tier 2 capital that exceeds the amount of Tier 1 capital must be excluded from the total capital calculation.
The Federal Reserve Board has established the following minimum capital levels banks and bank holding companies are required to maintain as a percentage of risk-weighted assets (including various off-balance sheet items): (i) CET1 of at least 4.5%, (ii) Tier 1 capital ratio of at least 6%, (iii) total capital ratio (Tier 1 and Tier 2 capital) of at least 8%; and (iv) a non-risk-based leverage ratio (Tier 1 capital to average consolidated assets) of 4%. The risk-based capital standards are designed to make regulatory capital requirements more sensitive to differences in credit and market risk profiles among banks and financial holding companies, to account for off-balance sheet exposure, and to minimize disincentives for holding liquid assets. Balance sheet and off-balance sheet exposures are assigned to one of several risk-weights primarily based on relative credit risk. The capital amounts and classifications are also subject to qualitative judgements by the regulators about components, risk-weightings, and other factors. Additionally, when the final capital rule is fully implemented, it will require an institution to maintain a 2.5% common equity Tier 1 capital conservation buffer over the
8
Table of Contents
minimum risk-based capital requirements to avoid restrictions on the ability to pay dividends, discretionary bonuses to executive officers, and engage in share repurchases. The capital conservative buffer was 0.625% for 2016 and increased to 1.25% effective January 1, 2017.
Failure to meet applicable capital guidelines could subject a financial institution to a variety of enforcement remedies available to the federal regulatory authorities, including limitations on the ability to pay dividends, the issuance by the regulatory authority of a capital directive to increase capital, and the termination of deposit insurance by the FDIC, as well as to the measures described below under “Prompt Corrective Action” as applicable to undercapitalized institutions.
As of December 31, 2016, WesBanco’s CET1, Tier 1 and total capital to risk-adjusted assets ratios were 11.28%, 13.16% and 14.18%, respectively. WesBanco made a timely permanent election to exclude accumulated other comprehensive income from regulatory capital. As of December 31, 2016, WesBanco Bank also had capital in excess of the minimum requirements. Neither WesBanco nor the Bank had been advised by the appropriate federal banking regulator of any specific leverage ratio applicable to it. As of December 31, 2016, WesBanco’s leverage ratio was 9.81%.
As of December 31, 2016, WesBanco had $163.6 million in subordinated and junior subordinated debt on its Consolidated Balance Sheets, which includes $137.6 million of junior subordinated debt. For regulatory purposes, Trust Preferred Securities totaling $138.0 million underlying such junior subordinated debt were included in Tier 1 capital as of December 31, 2016, in accordance with regulatory reporting requirements. In 2013, the federal banking agencies amended capital requirements to generally exclude trust preferred securities from Tier 1 capital. A grandfather provision, however, permits bank holding companies with consolidated assets of less than $15 billion, such as WesBanco, to continue counting existing trust preferred securities as Tier 1 capital until they mature. The final Basel III capital rule permanently grandfathers trust preferred securities issued before May 19, 2010 for institutions of less than $15 billion in size, subject to a 25% limit of Tier 1 capital. The amount of trust preferred securities and certain other elements in excess of the limit could be included in Tier 2 capital, subject to restrictions. For more information regarding trust preferred securities, please refer to Note 11, “Subordinated and Junior Subordinated Debt” in the Consolidated Financial Statements.
The risk-based capital standards of the Federal Reserve Board and the FDIC specify that evaluations by the banking agencies of a bank’s capital adequacy will include an assessment of the exposure to declines in the economic value of the bank’s capital due to changes in interest rates. These banking agencies issued a joint policy statement on interest rate risk describing prudent methods for monitoring such risk that rely principally on internal measures of exposure and active oversight of risk management activities by senior management.
PROMPT CORRECTIVE ACTION
The Federal Deposit Insurance Corporation Improvement Act of 1991 (“FDICIA”) requires federal banking regulatory authorities to take “prompt corrective action” with respect to depository institutions that do not meet minimum capital requirements. For these purposes, FDICIA establishes five capital tiers: well-capitalized, adequately capitalized, undercapitalized, significantly undercapitalized, and critically undercapitalized.
An institution is deemed to be “well-capitalized” if it has a total risk-based capital ratio of 10% or greater, a Tier 1 risk-based capital ratio of 8% or greater, a Tier 1 leverage ratio of 5% or greater, and a new common equity Tier 1 ratio of 6.5% or greater, and is not subject to a regulatory order, agreement, or directive to meet and maintain a specific capital level for any capital measure. An institution is deemed to be “adequately capitalized” if it has a total risk-based capital ratio of 8% or greater, a Tier 1 risk-based capital ratio of 6% or greater, generally a Tier 1 leverage ratio of 4% or greater, and a common equity Tier 1 ratio of 4.5% or greater, and the institution does not meet the definition of a “well-capitalized” institution. An institution that does not meet one or more of the “adequately capitalized” tests is deemed to be “undercapitalized.” If the institution has a total risk-based capital ratio that is less than 6%, a Tier 1 risk-based capital ratio that is less than 4%, or a Tier 1 leverage
9
Table of Contents
ratio that is less than 3%, it is deemed to be “significantly undercapitalized.” Finally, an institution is deemed to be “critically undercapitalized” if it has a ratio of tangible equity (as defined in the regulations) to total assets that is equal to or less than 2%. At December 31, 2016, WesBanco Bank had capital levels that met the “well-capitalized” standards under FDICIA and its implementing regulations.
FDICIA generally prohibits a depository institution from making any capital distribution, including payment of a cash dividend, or paying any management fee to its holding company, if the depository institution would thereafter be undercapitalized. Undercapitalized institutions are subject to growth limitations and are required to submit a capital restoration plan. If any depository institution subsidiary of a holding company is required to submit a capital restoration plan, the holding company would be required to provide a limited guarantee regarding compliance with the plan as a condition of approval of such plan by the appropriate federal banking agency. If an undercapitalized institution fails to submit an acceptable plan, it is treated as if it is significantly undercapitalized. Significantly undercapitalized institutions may be subject to a number of requirements and restrictions, including orders to sell sufficient voting stock to become adequately capitalized, requirements to reduce total assets, and cessation of receipt of deposits from correspondent banks. Critically undercapitalized institutions may not, beginning 60 days after becoming critically undercapitalized, make any payment of principal or interest on their subordinated debt and/or trust preferred securities. In addition, critically undercapitalized institutions are subject to appointment of a receiver or conservator within 90 days of becoming critically undercapitalized.
GRAMM-LEACH-BLILEY ACT
Under the Gramm-Leach-Bliley Act (the “GLB Act”), banks are no longer prohibited from associating with, or having management interlocks with, a business organization engaged principally in securities activities. By qualifying as a “financial holding company,” as authorized under the GLB Act, a bank holding company acquires new powers not otherwise available to it. WesBanco has elected to become a financial holding company under the GLB Act. It also has qualified a subsidiary of the Bank as a financial subsidiary under the GLB Act.
Financial holding company powers relate to “financial activities” that are determined by the Federal Reserve Board, in coordination with the Secretary of the Treasury, to be financial in nature, incidental to an activity that is financial in nature, or complementary to a financial activity, provided that the complementary activity does not pose a safety and soundness risk. The GLB Act itself defines certain activities as financial in nature, including but not limited to: underwriting insurance or annuities; providing financial or investment advice; underwriting, dealing in, or making markets in securities; merchant banking, subject to significant limitations; insurance company portfolio investing, subject to significant limitations; and any activities previously found by the Federal Reserve Board to be closely related to banking.
National and state banks are permitted under the GLB Act, subject to capital, management, size, debt rating, and CRA qualification factors, to have “financial subsidiaries” that are permitted to engage in financial activities not otherwise permissible. However, unlike financial holding companies, financial subsidiaries may not engage in insurance or annuity underwriting; developing or investing in real estate; merchant banking (for at least five years); or insurance company portfolio investing.
DODD-FRANK ACT
The Dodd-Frank Act contains numerous and wide-ranging reforms to the structure of the U.S. financial system. Portions of the Dodd-Frank Act are effective at different times, and many of the provisions are general statements directing regulators to draft more detailed rules. Although the full scope of the Dodd-Frank Act’s impact remains somewhat unclear, management expects that it will, over time, reduce revenue and increase expenses. However, on February 3, 2017, President Donald J. Trump issued an executive order that orders reform of the laws and regulations governing the financial system (“Executive Order”). The Executive Order outlines the Trump Administration’s policy related to financial system regulation, and it also directs the Secretary of the Treasury to consult with the member agencies of the Financial Stability Oversight Council and to provide a
10
Table of Contents
report regarding which laws and regulations do not conform to new policy. The Executive Order is an effort to scale back the provisions of the Dodd-Frank Act and reduce regulation on the financial system.
Bank holding companies will be subjected to increased capital requirements (discussed above under “Item 1. Business—Capital Requirements”). A provision known as the Volcker Rule limits WesBanco’s ability to engage in proprietary trading, as well as its ability to sponsor or invest in hedge funds or private equity funds. In December 2013, U.S. federal banking agencies issued joint final rules implementing this provision. The rules were effective April 1, 2014, and WesBanco is expected to bring its activities and investments into full compliance by July 21, 2017. Additionally, an interim final rule was issued in January 2014 that exempts investments in certain collateralized debt obligations backed primarily by trust preferred securities from the provisions of the Volcker Rule. This interim final rule issued in January 2014 did not have a material impact on WesBanco for the year ended December 31, 2016.
The Dodd-Frank Act makes several changes affecting the securitization markets, which may affect a bank’s ability or desire to use those markets to meet funding or liquidity needs. One of these changes calls for federal regulators to adopt regulations requiring the sponsor of a securitization to retain at least 5% of the credit risk, with exceptions for “qualified residential mortgages.”
Publicly traded companies are required by the Dodd-Frank Act to give shareholders an advisory vote on executive compensation, and, in some cases, golden parachute arrangements. Further, SEC and NASDAQ rulemaking under the Dodd-Frank Act requires NASDAQ-listed companies to have a compensation committee composed entirely of independent directors. WesBanco’s compensation committee members currently satisfy the independence criteria. The Dodd-Frank Act also calls for regulators to issue new rules relating to incentive-based compensation arrangements deemed excessive, and proxy access by shareholders.
All banks and other insured depository institutions will have increased authority to open new branches across state lines (discussed above under “Item 1. Business—Supervision and Regulation”). A provision authorizing insured depository institutions to pay interest on checking accounts will likely increase WesBanco’s interest expenses. The Consumer Financial Protection Bureau (the “CFPB”), created by the Dodd-Frank Act, has the authority to write rules implementing numerous consumer protection laws applicable to all banks (discussed below under “Item 1. Business—Consumer Protection Laws”).
CONSUMER PROTECTION LAWS
In connection with its lending and leasing activities, all banks are subject to a number of federal and state laws designed to protect consumers and promote lending and other financial services to various sectors of the economy and population. These laws include the Equal Credit Opportunity Act, the Fair Credit Reporting Act, the Truth in Lending Act, the Truth in Savings Act (“TILA”), the Home Mortgage Disclosure Act, the Real Estate Settlement Procedures Act (“RESPA”), the Electronic Fund Transfer Act, and, in some cases, their respective state law counterparts. The new CFPB created by the Dodd-Frank Act now has consolidated authority to write regulations implementing these and other laws. WesBanco’s other subsidiaries that provide services relating to consumer financial products and services will also be subject to the CFPB’s regulations. As an institution with assets of less than $10 billion, WesBanco Bank has historically been examined by the FDIC for compliance with these rules. When the Bank exceeds $10.0 billion in assets for four consecutive quarters, it will come under CFPB supervision and examination. Relating to mortgage lending, the Dodd-Frank Act authorized the CFPB to issue new regulations governing the ability to repay, qualified mortgages, mortgage servicing, appraisals and compensation of mortgage lenders, all of which have been issued and have taken effect. They limit the mortgage products offered by the Bank and have an impact on timely enforcement of delinquent mortgage loans. In addition, the Dodd-Frank Act required the Federal Reserve Board to write rules to limit debit card interchange fees to those “reasonable and proportional” to the cost of transactions, which were effective on October 1, 2011. Even though the limits on debit card interchange fees apply only to institutions with more than $10 billion in assets, market forces may over time limit debit card interchange fees as a source of revenue for all banks, including smaller banks like WesBanco Bank.
11
Table of Contents
The Dodd-Frank Act also directed the CFPB to integrate the mortgage loan disclosures under TILA and RESPA. The CFPB issued new integrated disclosures rules (“TRID”) which became effective October 3, 2015, and which have combined the prior good faith estimate and truth in lending disclosure form into a new form, the loan estimate. They have also combined the HUD-1 and final truth in lending disclosure forms into a new form, the closing disclosure. The new rule is extremely complex, contains significant uncertainties as to penalties, some of which can be quite material, contains prohibitions against correcting even technical mistakes, creates uncertainty regarding last minute changes in the transaction and has triggered significant ambiguity in compliance. Thus for covered transactions and most closed-end consumer credit transactions secured by real property, the TRID rules have presented significant and ongoing challenges to real estate lenders.
Federal law currently contains extensive customer privacy protection provisions. Under these provisions, a financial institution must provide to its customers, at the inception of the customer relationship and annually thereafter, the institution’s policies and procedures regarding the handling of customers’ nonpublic personal financial information. These provisions also provide that, except for certain limited exceptions, an institution may not provide such personal information to unaffiliated third parties unless the institution discloses to the customer that such information may be so provided and the customer is given the opportunity to opt out of such disclosure. Federal law makes it a criminal offense, except in limited circumstances, to obtain or attempt to obtain customer information of a financial nature by fraudulent or deceptive means.
The CRA requires WesBanco Bank’s primary federal bank regulatory agency, the FDIC, to assess WesBanco Bank’s record in meeting the credit needs of the communities served by the bank, including low and moderate-income neighborhoods and persons. Institutions are assigned one of four ratings: “Outstanding,” “Satisfactory,” “Needs to Improve” or “Substantial Noncompliance.” This assessment is reviewed when a bank applies to merge or consolidate with or acquire the assets or assume the liabilities of an insured depository institution, or to open or relocate a branch office. Our ongoing community development efforts recently culminated with the Federal Deposit Insurance Corporation assigning the Bank an Outstanding rating for our community development performance under the Community Reinvestment Act on February 21, 2017. The FDIC assigned this rating based on its examination of our performance from 2013 through June 30, 2016. It is the highest rating awarded by federal regulators. The Bank also received the America Saves Designation of Savings Excellence for Banks, a designation from America Saves that recognizes banks that went above and beyond to encourage people to save money during America Saves Week 2016. WesBanco has worked with America Saves for more than ten years, and has been an active participant in America Saves Week since its inception in 2007.
SECURITIES REGULATION
WesBanco’s full service broker-dealer subsidiary, WesBanco Securities, is registered as a broker-dealer with the SEC and in the states in which it does business. WesBanco Securities also is a member of FINRA. WesBanco Securities is subject to regulation by the SEC, FINRA and the securities administrators of the states in which it is registered. WesBanco Securities is a member of the Securities Investor Protection Corporation, which in the event of the liquidation of a broker-dealer, provides protection for customers’ securities accounts held by WesBanco Securities of up to $500,000 for each eligible customer, subject to a limitation of $250,000 for claims for cash balances.
In addition, WesBanco Bank’s Investment Department serves as an investment adviser to a family of mutual funds and is registered as an investment adviser with the SEC and in some states.
On April 8, 2016, the Department of Labor issued its final version of the new regulation revising the definition of a “fiduciary” with respect to the Employee Retirement Income Security Act of 1974 (hereinafter “ERISA”) and the Internal Revenue Act of 1986 (hereinafter the “Code”). The new regulation categorizes persons who provide investment advice or recommendations for a fee or other compensation to ERISA retirement plans and Individual Retirement Accounts (hereinafter “IRAs”) as fiduciaries. The new regulation is set to become effective on April 10, 2017.
12
Table of Contents
On February 3, 2017, President Donald Trump issued a Presidential Memorandum on the “Fiduciary Duty Rule”. The Memorandum directed the Department of Labor to review the new regulation. The Presidential Memorandum then required the Department of Labor to: should it affirmatively determine that the new regulation would (i) cause harm to investors, (ii) result in disruptions or dislocations within the retirement services industry, or (iii) increase litigation and the prices investors and retirees pay for advice publish for notice and comment a proposed rule rescinding or revising the new regulation.
Given the new guidance and review memorandum issued by President Donald Trump and his Administration, the effect the new regulation will have on the business of the Bank is not yet determinable. Nevertheless, the Bank continues to move forward with the creation and implementation of policies and procedures necessary to ensure the Bank will be in compliance with the new regulation if it becomes effective.
ANTI-MONEY LAUNDERING INITIATIVES AND THE USA PATRIOT ACT
A major focus of governmental policy on financial institutions in recent years has been aimed at combating money laundering and terrorist financing. The USA PATRIOT Act of 2001 (the “USA Patriot Act”) substantially broadened the scope of United States anti-money laundering laws and regulations by imposing significant new compliance and due diligence obligations, creating new crimes and penalties and expanding the extra-territorial jurisdiction of the United States. The United States Treasury Department has issued various implementing regulations which apply certain requirements of the USA Patriot Act to financial institutions, such as WesBanco Bank and WesBanco’s broker-dealer subsidiary. These regulations impose obligations on financial institutions to maintain appropriate policies, procedures and controls to detect, prevent and report money laundering and terrorist financing and to verify the identity of their customers. Failure of WesBanco and its subsidiaries to maintain and implement adequate programs to combat money laundering and terrorist financing, or to comply with all of the relevant laws or regulations, could have serious legal and reputational consequences for WesBanco and its subsidiaries.
The risks described below are not the only ones we face in our business. Additional risks and uncertainties not presently known to us or that we currently believe to be immaterial may also impair our business operations. If any of the following risks occur, our business, financial condition or operating results could be materially harmed.
DUE TO INCREASED COMPETITION, WESBANCO MAY NOT BE ABLE TO ATTRACT AND RETAIN BANKING CUSTOMERS AT CURRENT LEVELS.
WesBanco operates in a highly competitive banking and financial industry that could become even more competitive as a result of legislative, regulatory and technological changes. WesBanco faces banking competition in all the markets it serves from the following:
| • | local, regional and national banks; |
| • | savings and loans; |
| • | internet banks; |
| • | credit unions; |
| • | payday lenders and money services businesses; |
| • | finance companies; |
| • | online trading and robo-advisors; and |
| • | brokerage firms serving WesBanco’s market areas. |
13
Table of Contents
In particular, the Bank’s competitors include several major national financial companies whose greater resources may afford them a marketplace advantage by enabling them to maintain numerous banking locations and mount extensive promotional and advertising campaigns. Additionally, banks and other financial institutions may have products and services not offered by WesBanco, which may cause current and potential customers to choose those institutions. Areas of competition include interest rates for loans and deposits, efforts to obtain deposits and range and quality of services provided. WesBanco also faces competition from financial technology (“FinTech”) companies. In addition to providing products and services traditionally offered by banks, some FinTech companies allow customers to complete financial transactions without the need for bank intermediaries. This could result in the loss of revenue from transaction fees and fewer customer accounts. If WesBanco is unable to attract new and retain current customers, loan and deposit growth could decrease, causing WesBanco’s results of operations and financial condition to be negatively impacted.
WESBANCO MAY NOT BE ABLE TO EXPAND ITS TRUST AND INVESTMENT SERVICES SEGMENT AND RETAIN ITS CURRENT CUSTOMERS.
WesBanco may not be able to attract new and retain current investment management clients due to competition from the following:
| • | commercial banks and trust companies; |
| • | mutual fund companies; |
| • | investment advisory firms; |
| • | law firms; |
| • | brokerage firms; and |
| • | other financial services companies. |
Its ability to successfully attract and retain investment management clients is dependent upon its ability to compete with competitors’ investment products, level of investment performance, client services and marketing and distribution capabilities. Due to changes in economic conditions, the performance of the trust and investment services segment may be negatively impacted by the financial markets in which investment clients’ assets are invested, causing clients to seek other alternative investment options. If WesBanco is not successful, its results from operations and financial position may be negatively impacted.
CUSTOMERS MAY DEFAULT ON THE REPAYMENT OF LOANS WHICH COULD SIGNIFICANTLY IMPACT RESULTS OF OPERATIONS THROUGH INCREASES IN THE PROVISION AND ALLOWANCE FOR LOAN LOSSES.
The Bank’s customers may default on the repayment of loans, which may negatively impact WesBanco’s earnings due to loss of principal and interest income. Increased operating expenses may result from the allocation of management time and resources to the collection and work-out of the loan. Collection efforts may or may not be successful causing WesBanco to write off the loan or repossess the collateral securing the loan, which may or may not exceed the balance of the loan.
WesBanco maintains an allowance for loan losses, which is a reserve established through a provision for loan losses charged to expense, to provide for probable incurred losses in our loan portfolio. Management evaluates the adequacy of the allowance for loan losses at least quarterly, which includes testing certain individual loans as well as collective pools of loans for impairment. This evaluation includes an assessment of actual loss experience within each category of the portfolio, individual commercial and commercial real estate loans that exhibit credit weakness; current economic events, including employment statistics, trends in bankruptcy filings, and other pertinent factors; industry or geographic concentrations; and regulatory guidance.
14
Table of Contents
WesBanco’s regulatory agencies periodically review the allowance for loan losses. Based on their assessment the regulatory agencies may require WesBanco to adjust the allowance for loan losses. These adjustments could negatively impact WesBanco’s results of operations or financial position.
ECONOMIC CONDITIONS IN WESBANCO’S MARKET AREAS COULD NEGATIVELY IMPACT EARNINGS.
WesBanco Bank serves both individuals and business customers throughout West Virginia, Ohio, western Pennsylvania, Kentucky and southern Indiana. The substantial majority of WesBanco’s loan portfolio is to individuals and businesses in these markets. As a result, the financial condition, results of operations and cash flows of WesBanco are affected by local and regional economic conditions. A downturn in these economies could have a negative impact on WesBanco and the ability of the Bank’s customers to repay their loans. The value of the collateral securing loans to borrowers may also decline as the economy declines. As a result, deteriorating economic conditions in these markets could cause a decline in the overall quality of WesBanco’s loan portfolio requiring WesBanco to charge-off a higher percentage of loans and/or increase its allowance for loan losses. A decline in economic conditions in these markets may also force customers to utilize deposits held by WesBanco Bank in order to pay current expenses causing the Bank’s deposit base to shrink. As a result the Bank may have to borrow funds at higher rates in order to meet liquidity needs. Lower oil and gas prices have reduced shale gas activity in the region which may negatively impact local and regional economic conditions and affect both commercial and retail customers, resulting in lower deposits and credit deterioration in the loan portfolio. These events may have a negative impact on WesBanco’s earnings and financial condition.
CURRENT MARKET INTEREST RATES AND COST OF FUNDS MAY NEGATIVELY IMPACT WESBANCO’S BANKING BUSINESS.
Fluctuations in interest rates may negatively impact the business of the Bank. The Bank’s main source of income from operations is net interest income, which is equal to the difference between the interest income received on interest-bearing assets (usually loans and investment securities) and the interest expense incurred in connection with interest-bearing liabilities (usually deposits and borrowings). These rates are highly sensitive to many factors beyond WesBanco’s control, including general economic conditions, both domestic and foreign, and the monetary and fiscal policies of various governmental and regulatory authorities. WesBanco Bank’s net interest income can be affected significantly by changes in market interest rates. Changes in relative interest rates may reduce the Bank’s net interest income as the difference between interest income and interest expense decreases. As a result, the Bank has adopted asset and liability management policies to minimize the potential adverse effects of changes in interest rates on net interest income, primarily by altering the mix and maturity of loans, investments and funding sources. However, even with these policies in place, WesBanco cannot be certain that changes in interest rates or the shape of the interest rate yield curve will not negatively impact its results of operations or financial position.
WesBanco’s cost of funds for banking operations may not decrease at the same pace as asset yields, particularly in the current interest rate environment, where certain rates are subject to artificial floors or are less than 1%. Cost of funds also may increase as a result of future general economic conditions, interest rates and competitive pressures. The Bank has traditionally obtained funds principally through deposits and borrowings from the Federal Home Loan Bank (FHLB), correspondent banks, and other wholesale borrowing sources. As a general matter, deposits are a cheaper source of funds than borrowings because interest rates paid for deposits are typically less than interest rates charged for borrowings. If, as a result of general economic conditions, market interest rates, competitive pressures or otherwise, the value of deposits at the Bank decreases relative to its overall banking operations, the Bank may have to rely more heavily on borrowings as a source of funds in the future.
15
Table of Contents
SIGNIFICANT DECLINES IN U.S. AND GLOBAL MARKETS COULD HAVE A NEGATIVE IMPACT ON WESBANCO’S EARNINGS.
The capital and credit markets could experience extreme disruption. These conditions result in less liquidity, greater volatility, widening of credit spreads and a lack of price transparency in certain asset types. In many cases, markets could exert downward pressure on stock prices, security prices and credit capacity for certain issuers without regard to those issuers’ underlying financial strength. Sustained weakness in business and economic conditions in any or all of the domestic or foreign financial markets could result in credit deterioration in investment securities held by us, rating agency downgrades for such securities or other market factors that (such as lack of liquidity for re-sales, absence of reliable pricing information or unanticipated changes in the competitive market) could result in us having to recognize other-than-temporary impairment in the value of such investment securities, with a corresponding charge against earnings. Furthermore, our pension assets are primarily invested in equity and debt securities, and weakness in capital and credit markets could result in deterioration of these assets, and changes in certain key pension assumptions based on current interest rates, long-term rates of return and other economic or actuarial assumptions may increase minimum funding contributions and future pension expense. If the markets deteriorate further, these conditions may be material to WesBanco’s ability to access capital and may adversely impact results of operations.
Further, WesBanco’s trust and investment services income could be impacted by fluctuations in the securities market. A portion of this revenue is based on the value of the underlying investment portfolios. If the values of those investment portfolios decline, the Bank’s revenue could be negatively impacted.
RISKS INHERENT IN MUNICIPAL BONDS COULD HAVE A NEGATIVE IMPACT ON WESBANCO’S EARNINGS.
As of December 31, 2016, approximately 40% of WesBanco’s total securities portfolio was invested in municipal bonds. Although WesBanco’s municipal portfolio is broadly spread across the U.S., any downturn in the economy of a state or municipality in which WesBanco holds municipal obligations could increase the default risk of the respective debt. In addition, a portion of WesBanco’s municipal portfolio is comprised of Build America bonds. Due to the current government sequester reducing the interest subsidy that the government provides to the issuing municipalities, extraordinary redemption provisions (ERP) may be executed by the municipality if it is in their favor to do so. There is a risk that when an ERP is executed, WesBanco may not recover its amortized cost in the bond if it was purchased at a premium. Credit risks are also prevalent when downgrades of credit ratings are issued by major credit rating agencies, which are caused by creditworthiness issues of both bond insurers and the municipality itself. Credit rating downgrades to a non-investment grade level may force WesBanco to sell a municipal bond at a price where amortized cost may not be recovered. Any of the above default risks, early redemption risks and credit risks could cause WesBanco to take impairment charges, which could be significant, that would negatively impact earnings.
WESBANCO MAY BE REQUIRED TO WRITE DOWN GOODWILL AND OTHER INTANGIBLE ASSETS, CAUSING ITS FINANCIAL CONDITION AND RESULTS TO BE NEGATIVELY AFFECTED.
When WesBanco acquires a business, a portion of the purchase price of the acquisition is allocated to goodwill and other identifiable intangible assets. The amount of the purchase price which is allocated to goodwill and other intangible assets is determined by the excess of the purchase price over the net identifiable assets acquired. WesBanco’s goodwill is 43% of stockholders’ equity as of December 31, 2016 and 2015. Under current accounting standards, if WesBanco determines that goodwill or intangible assets are impaired, it is required to write down the carrying value of these assets. WesBanco conducts an annual review to determine whether goodwill and other identifiable intangible assets are impaired. WesBanco completed such an impairment analysis in 2016 and concluded that no impairment charge was necessary for the year ended December 31, 2016. WesBanco cannot provide assurance that it will not be required to take an impairment charge in the future. Any impairment charge would have a negative effect on its shareholders’ equity and financial results and may cause a decline in our stock price.
16
Table of Contents
SUITABLE ACQUISITION OPPORTUNITIES MAY NOT BE AVAILABLE TO WESBANCO IN THE FUTURE.
WesBanco continually evaluates opportunities to acquire other businesses. However, WesBanco may not have the opportunity to make suitable acquisitions on favorable terms in the future, which could negatively impact the growth of its business. WesBanco expects that other banking and financial companies, many of which have significantly greater resources, will compete to acquire compatible businesses. This competition could increase prices for acquisitions that WesBanco would likely pursue, and its competitors may have greater resources than it does. Also, acquisitions of regulated businesses such as banks are subject to various regulatory approvals. If WesBanco fails to receive the appropriate regulatory approvals, it will not be able to consummate an acquisition that it believes is in its best interests.
WESBANCO IS SUBJECT TO EXTENSIVE GOVERNMENT REGULATION AND SUPERVISION.
WesBanco is subject to extensive federal and state regulation, supervision and examination. Banking regulations are primarily intended to protect depositors’ funds, federal deposit insurance funds and the banking system as a whole, rather than corporate shareholders. These regulations affect WesBanco’s lending practices, capital structure, investment practices, dividend policy, operations and growth, among other things. These regulations also impose obligations to maintain appropriate policies, procedure and controls. Congress and federal regulatory agencies continually review banking laws, regulations and policies for possible changes. Changes to statutes, regulations or regulatory policies, including changes in interpretation or implementation of statutes, regulations or policies, could affect WesBanco in substantial and unpredictable ways. Such changes could subject WesBanco to additional costs, limit the types of financial services and products that could be offered, and/or increase the ability of non-banks to offer competing financial services and products, among other things. Failure to comply with laws, regulations or policies could result in sanctions by regulatory agencies, civil penalties and/or reputation damage, which could have a material adverse effect on WesBanco’s business, financial condition and result of operations.
As of December 31, 2016, WesBanco had $163.6 million in subordinated and junior subordinated debt presented as a separate category of long-term debt on its Consolidated Balance Sheets, which includes $137.6 million in junior subordinated debt. For regulatory purposes, Trust Preferred Securities totaling $138.0 million underlying such junior subordinated debt are included in Tier 1 capital in accordance with regulatory reporting requirements. On March 1, 2005, the Federal Reserve Board adopted a rule that retains trust preferred securities in Tier 1 capital, but with stricter quantitative limits and clearer qualitative standards. Under the rule, the aggregate amount of trust preferred securities and certain other capital elements is limited to 25% of Tier 1 capital elements, net of goodwill. The amount of trust preferred securities and certain other elements in excess of the limit can be included in Tier 2 capital, subject to restrictions. The Dodd-Frank Act required the federal banking agencies to develop new consolidated capital requirements applicable to bank holding companies and banks. Rules issued in 2013 generally exclude trust preferred securities from Tier 1 capital beginning in 2015, however, a grandfather provision will permit bank holding companies with consolidated assets of less than $15 billion, such as WesBanco, to continue counting existing trust preferred securities as Tier 1 capital until they mature. For bank holding companies with consolidated assets greater than $15 billion, the existing trust preferred securities would be included as Tier 2 capital until the instruments are redeemed or mature.
In addition, new international capital standards known as Basel III, which were implemented by a U.S. federal banking agencies’ joint final rule issued in July 2013, and effective January 1, 2015, further increases the minimum capital requirements applicable to WesBanco and the Bank, which may negatively impact both entities. Additional information about these changes in capital requirements are described above in “Item 1. Business—Capital Requirements.”
Regulation of WesBanco and its subsidiaries is expected to continue to expand in scope and complexity in the future. These laws are expected to have the effect of increasing WesBanco’s costs of doing business and reducing its revenues, and may limit its ability to pursue business opportunities or otherwise adversely affect its
17
Table of Contents
business and financial condition. The Dodd-Frank Act and other laws, as well as rules implementing or related to them, may adversely affect WesBanco. Specifically, any governmental or regulatory action having the effect of requiring WesBanco to obtain additional capital could reduce earnings and have a material dilutive effect on current shareholders, including the Dodd-Frank Act source of strength requirement that bank holding companies make capital infusions into a troubled subsidiary bank. Legislation and regulation of debit card fees, credit cards and other bank services, as well as changes in WesBanco’s practices relating to those and other bank services, may affect WesBanco’s revenue and other financial results. Additional information about increased regulation is provided in “Item 1. Business” under the headings “Supervision and Regulation,” “Holding Company Regulations,” “Capital Requirements,” “Dodd-Frank Act,” and “Consumer Protection Laws.”
WesBanco is also subject to tax laws and regulations promulgated by the United States government and the states in which it operates. Changes to these laws and regulations or the interpretations of such laws and regulations by taxing authorities could impact future tax expense and the value of deferred tax assets.
ADDITIONAL GROWTH WILL SUBJECT WESBANCO TO ADDITIONAL REGULATION AND INCREASED SUPERVISION.
The Dodd-Frank Act imposes additional regulatory requirements on institutions with $10 billion or more in assets. WesBanco had $9.8 billion in assets as of December 31, 2016. Additional growth that results in WesBanco having assets of $10 billion or more would subject WesBanco to the following:
| • | Supervision, examination and enforcement by the CFPB with respect to consumer financial protection laws; |
| • | Regulatory stress testing requirements, whereby WesBanco would be required to conduct an annual stress test (using assumptions for baseline, adverse and severely adverse scenarios); |
| • | A modified methodology for calculating FDIC insurance assessments and potentially higher assessment rates as a result of institutions with $10 billion or more in assets being required to bear a greater portion of the cost of raising the reserve ratio; |
| • | Heightened compliance standards under the Volcker Rule; |
| • | Significantly reduced debit card interchange revenue from applicability of the Durbin Amendment; and |
| • | Enhanced supervision as a larger financial institution. |
The imposition of these regulatory requirements and increased supervision may require additional commitment of financial resources to regulatory compliance and may increase WesBanco’s cost of operations. Further, the results of the stress testing process may lead WesBanco to retain additional capital or alter the mix of its capital components.
A NEW ACCOUNTING STANDARD WILL RESULT IN A SIGNIFICANT CHANGE IN HOW WE RECOGNIZE CREDIT LOSSES AND MAY HAVE A MATERIAL IMPACT ON OUR FINANCIAL CONDITION OR RESULTS OF OPERATIONS.
In June 2016, the Financial Accounting Standards Board (“FASB”) issued an accounting standard update, “Financial Instruments-Credit Losses (Topic 326), Measurement of Credit Losses on Financial Instruments,” which replaces the current “incurred loss” model for recognizing credit losses with an “expected loss” model referred to as the Current Expected Credit Loss (“CECL”) model. Under the CECL model, we will be required to present certain financial assets carried at amortized cost, such as loans held for investment and held-to-maturity debt securities, at the net amount expected to be collected. The measurement of expected credit losses is to be based on information about past events, including historical experience, current conditions, and reasonable and supportable forecasts that affect the collectability of the reported amount. This measurement will take place at the time the financial asset is first added to the balance sheet and periodically thereafter. This differs significantly
18
Table of Contents
from the “incurred loss” model required under current generally accepted accounting principles (“GAAP”), which delays recognition until it is probable a loss has been incurred. Accordingly, we expect that the adoption of the CECL model will materially affect how we determine our allowance for loan losses and could require us to significantly increase our allowance. Moreover, the CECL model may create more volatility in the level of our allowance for loan losses. If we are required to materially increase our level of allowance for loan losses for any reason, such increase could adversely affect our business, financial condition and results of operations.
The new CECL standard will become effective for us for fiscal years beginning after December 15, 2019 and for interim periods within those fiscal years. We are currently evaluating the impact the CECL model will have on our accounting, but we expect to recognize a one-time cumulative-effect adjustment to our allowance for loan losses as of the beginning of the first reporting period in which the new standard is effective, consistent with regulatory expectations set forth in interagency guidance issued at the end of 2016. We cannot yet determine the magnitude of any such one-time cumulative adjustment or of the overall impact of the new standard on our financial condition or results of operations.
LIMITED AVAILABILITY OF BORROWINGS AND LIQUIDITY FROM THE FEDERAL HOME LOAN BANK SYSTEM AND OTHER SOURCES COULD NEGATIVELY IMPACT EARNINGS.
WesBanco Bank is currently a member bank of the Federal Home Loan Bank (“FHLB”) of Pittsburgh, and while it retains certain short-term borrowings from the FHLB of Cincinnati from prior bank acquisitions, it is no longer considered a member bank of such FHLB. Membership in this system of quasi-governmental, regional home-loan oriented agency banks allows us to participate in various programs offered by the FHLB. We borrow funds from the FHLB, which are secured by a blanket lien on certain residential and commercial mortgage loans, and if applicable, investment securities with collateral values in excess of the outstanding balances. Future earnings shortfalls and minimum capital requirements of the FHLB may impact the collateral necessary to secure borrowings and limit the borrowings extended to their member banks, as well as require additional capital contributions by member banks. The FHLB’s rating assigned to WesBanco Bank may also negatively impact the amount of term collateral and other conditions imposed by the FHLB upon WesBanco Bank. Should these situations occur, WesBanco’s short-term liquidity needs could be negatively impacted. If WesBanco was restricted from using FHLB advances due to weakness in the system or with the FHLB of Pittsburgh, WesBanco may be forced to find alternative funding sources. If WesBanco is required to rely more heavily on higher cost funding sources, revenues may not increase proportionately to cover these costs, which would adversely affect WesBanco’s results of operations and financial position.
THE SOUNDNESS OF OTHER FINANCIAL INSTITUTIONS COULD ADVERSELY IMPACT WESBANCO
Financial service institutions are interrelated as a result of trading, clearing, counterparty, or other relationships. WesBanco has exposure to various industries and counterparties, and WesBanco routinely executes transactions with counterparties in the financial industry, including brokers and dealers, commercial banks, investment banks, mutual and hedge funds and other institutions. As a result, a default by, or potential default by, a financial institution could result in market-wide liquidity problems, losses or other financial institution defaults. Many of these transactions could expose WesBanco to credit risk in the event of default of our counterparty or client. These losses or defaults could adversely effect on our business, financial condition, and results of operations.
WESBANCO’S FINANCIAL CONDITION AND RESULTS OF OPERATIONS DEPEND ON THE SUCCESSFUL GROWTH OF ITS SUBSIDIARIES.
WesBanco’s primary business activity for the foreseeable future will be to act as the holding company of its banking and other subsidiaries. Therefore, WesBanco’s future profitability will depend on the success and growth of these subsidiaries. In the future, part of WesBanco’s growth may come from buying other banks and
19
Table of Contents
buying or establishing other companies. Such entities may not be profitable after they are purchased or established, and they may lose money or be dilutive to earnings per share, particularly for the first few years. A new bank or company may bring with it unexpected liabilities, bad loans, or poor employee relations, or the new bank or company may lose customers and the associated revenue. Dilution of book and tangible book value may occur as a result of an acquisition that may not be earned back for several years, if at all.
WESBANCO’S ABILITY TO PAY DIVIDENDS IS LIMITED, AND COMMON STOCK DIVIDENDS MAY HAVE TO BE REDUCED OR ELIMINATED.
Holders of shares of WesBanco’s common stock are entitled to dividends if, when, and as declared by WesBanco’s Board of Directors out of funds legally available for that purpose. Although the Board of Directors has declared cash dividends in the past, the current ability to pay dividends is largely dependent upon the receipt of dividends from the Bank. Federal and state laws impose restrictions on the ability of the Bank to pay dividends, which restrictions are more fully described in “Item 1. Business—Payment of Dividends.” In general, future dividend policy is subject to the discretion of the Board of Directors and will depend upon a number of factors, including WesBanco’s and the Bank’s future earnings, liquidity and capital requirements, regulatory constraints and financial condition.
FUTURE EXPANSION BY WESBANCO MAY ADVERSELY AFFECT OUR FINANCIAL CONDITION AND RESULTS OF OPERATIONS AS WELL AS DILUTE THE INTERESTS OF OUR SHAREHOLDERS AND NEGATIVELY AFFECT THE PRICE OF OUR COMMON STOCK.
WesBanco may acquire other financial institutions, or branches or assets of other financial institutions, in the future. WesBanco may also open new branches and enter into new lines of business or offer new products or services. Any such expansion of our business will involve a number of expenses and risks, which may include:
| • | the time and expense associated with identifying and evaluating potential expansions; |
| • | the potential inaccuracy of estimates and judgments used to evaluate credit, operations, management and market risk with respect to target institutions; |
| • | the time and costs of evaluating new markets, hiring local management and opening new offices, and the delay between commencing these activities and the generation of profits from the expansion; |
| • | the risk we could discover undisclosed liabilities resulting from any acquisitions for which we may become responsible; |
| • | our financing of the expansion; |
| • | the diversion of management’s attention to the negotiation of a transaction and the integration of the operations and personnel of the combining businesses; |
| • | entry into unfamiliar markets; |
| • | the introduction of new products and services into our existing business; |
| • | the incurrence and possible impairment of goodwill associated with an acquisition and possible adverse short-term effects on our results of operations; |
| • | the risk that benefits such as enhanced earnings that we anticipate from any new acquisitions may not develop and future results of the combined companies may be materially lower from those estimated; and |
| • | the risk of loss of key employees and customers. |
We can give no assurance that integration efforts for any future acquisitions will be successful. We may issue equity securities in connection with acquisitions, which could dilute the economic and voting interests of our existing shareholders. WesBanco completed the acquisition of YCB on September 9, 2016 and integration issues such as those described above could be experienced in the future as a result.
20
Table of Contents
HIGHER FDIC DEPOSIT INSURANCE PREMIUMS AND ASSESSMENTS COULD ADVERSELY AFFECT WESBANCO’S FINANCIAL CONDITION.
Since 2008, the economic environment caused higher levels of bank failures, which dramatically increased FDIC resolution costs and led to a significant reduction in the deposit insurance fund. In order to restore reserve ratios of the deposit insurance fund, the FDIC has in the past significantly increased the assessment rates paid by financial institutions for deposit insurance. In addition, in May 2009, the FDIC imposed a special assessment on all insured institutions, and in November 2009, it adopted a rule requiring banks to prepay their FDIC assessments for years through 2012, which accompanied a rate increase beginning in 2011. In 2016, the FDIC achieved their targeted reserve fund ratio of 1.15 percent, which allowed banks with total assets of less than $10 billion to have a reduction in costs. Banks greater than $10 billion in total assets will continue to have higher assessed rates until the reserve fund ratio reaches 1.35 percent, including a 4.5 basis point surcharge until late 2018. Additionally, if and when WesBanco’s total assets surpass $10 billion, under the Dodd Frank Act, to the extent the FDIC increases reserves against future losses, the increased assessments (including the above mentioned surcharge) are to be borne primarily by institutions with assets of greater than $10 billion. Additional increases in FDIC insurance premiums and future special assessments may adversely affect WesBanco’s results of operations and financial condition.
INTERRUPTION TO OUR INFORMATION SYSTEMS OR BREACHES IN SECURITY COULD ADVERSELY AFFECT WESBANCO’S OPERATIONS.
WesBanco relies on information systems and communications for operating and monitoring all major aspects of business, as well as internal management functions. Any failure, interruption, intrusion or breach in security of these systems could result in failures or disruptions in the WesBanco customer relationship, management, general ledger, deposit, loan and other systems. While WesBanco has policies, procedures and technical safeguards designed to prevent or limit the effect of any failure, interruption, intrusion or security breach of its information systems, and also performs testing of business continuity and disaster recovery plans, there can be no absolute assurance that the above-noted issues will not occur or, if they do occur, that they will be adequately addressed.
There have been efforts on the part of third parties to breach data security at financial institutions. The ability of our customers to bank remotely, including online and through mobile devices, requires secure transmission of confidential information and increases the risk of data security breaches. Because the techniques used to attack financial services company communications and information systems change frequently (and generally increase in sophistication), often attacks are not recognized until launched against a target, may be supported by foreign governments or other well-financed entities, and may originate from less regulated and remote areas around the world, we may be unable to address these techniques in advance of attacks, including by implementing adequate preventative measures. Certain financial institutions in the United States have also experienced attacks from technically sophisticated and well-resourced third parties that were intended to disrupt normal business activities by making internet banking systems inaccessible to customers for extended periods. These “denial-of-service” attacks, if attempted, would require substantial resources to defend, and may affect customer satisfaction and behavior.
Cyber-attacks on third party retailers or other business establishments that widely accept debit card or check payments could compromise sensitive bank customer information, such as debit card and account numbers. Such an attack could result in significant costs to the bank, such as costs to reimburse customers, reissue debit cards and open new customer accounts.
The occurrence of any such failure, disruption or security breach of WesBanco’s information systems, particularly if widespread or resulting in financial losses to our customers, could damage WesBanco’s reputation, result in a loss of customer business, subject WesBanco to additional regulatory scrutiny, and expose WesBanco to civil litigation and possible financial liability. In addition, the prevalence of cyber-attacks and other efforts to
21
Table of Contents
breach or disrupt our systems has led, and will continue to lead, to costs to WesBanco with respect to prevention and mitigation of these risks, as well as costs reimbursing customers for losses suffered as a result of these actions. Successful attacks or systems failures at other large financial institutions, whether or not WesBanco is included, could lead to a general loss of customer confidence in financial institutions with a potential negative impact on WesBanco’s business, additional demands on the part of our regulators, and increased costs to deal with risks identified as a result of the problems affecting others. The risks described above could have a material effect on WesBanco’s business, results of operations and financial condition.
LOSS OF KEY EMPLOYEES COULD IMPACT GROWTH AND EARNINGS AND MAY HAVE AN ADVERSE IMPACT ON BUSINESS.
Our operating results and ability to adequately manage our growth are highly dependent on the services, managerial abilities and performance of our key employees, including executive officers and senior management. Our success depends upon our ability to attract and retain highly skilled and qualified management, loan origination, finance, administrative, marketing and technical personnel and upon the continued contributions of this management and personnel. The loss of services, or the inability to successfully complete planned or unplanned transitions of key personnel approaching normal retirement age, could have an adverse impact on WesBanco’s business, operating results and financial condition because of their skills, knowledge of the local markets, years of industry experience and the difficulty of promptly finding qualified replacement personnel.
A HIGH PERCENTAGE OF WESBANCO’S LOAN PORTFOLIO IS IN WEST VIRGINIA, OHIO, AND PENNSYLVANIA AND IN COMMERCIAL AND RESIDENTIAL REAL ESTATE. DETERIORATIONS IN ECONOMIC CONDITIONS IN THIS AREA OR IN THE REAL ESTATE MARKET GENERALLY COULD BE MORE HARMFUL TO THE COMPANY COMPARED TO MORE DIVERSIFIED INSTITUTIONS.
As of December 31, 2016, approximately 22% of WesBanco’s loan portfolio was comprised of residential real estate loans, and 46% was comprised of commercial real estate loans.
Inherent risks of commercial real estate (“CRE”) lending include the cyclical nature of the real estate market, construction risk and interest rate risk. The cyclical nature of real estate markets can cause CRE loans to suffer considerable distress. During these times of distress, a property’s performance can be negatively affected by tenants’ deteriorating credit strength and lease expirations in times of softening demand caused by economic deterioration or over-supply conditions. Even if borrowers are able to meet their payment obligations, they may find it difficult to refinance their full loan amounts at maturity due to declines in property value. Other risks associated with CRE lending include regulatory changes and environmental liability. Regulatory changes in tax legislation, zoning or similar external conditions including environmental liability may affect property values and the economic feasibility of existing and proposed real estate projects.
The company’s CRE loan portfolio is concentrated in West Virginia, Ohio and Pennsylvania. There are a wide variety of economic conditions within the local markets of the three states in which most of the company’s CRE loan portfolio is situated. Rates of employment, consumer loan demand, household formation, and the level of economic activity can vary widely from state to state and among metropolitan areas, cities and towns. Metropolitan markets comprise various submarkets where property values and demand can be affected by many factors, such as demographic makeup, geographic features, transportation, recreation, local government, school systems, utility infrastructure, tax burden, building-stock age, zoning and building codes, and available land for development. As a result of the high concentration of the company’s loan portfolio, it may be more sensitive, as compared to more diversified institutions, to future disruptions in and deterioration of this market, which could lead to losses which could have a material adverse effect on the business, financial condition and results of operations of the company.
22
Table of Contents
WESBANCO MAY NEED TO RAISE CAPITAL IN THE FUTURE, BUT CAPITAL MAY NOT BE AVAILABLE WHEN NEEDED OR AT ACCEPTABLE TERMS.
Federal and state banking regulators require WesBanco and its banking subsidiary, WesBanco Bank, to maintain adequate levels of capital to support its operations. In addition, in the future WesBanco may need to raise additional capital to support its business or to finance acquisitions, if any, or WesBanco may otherwise elect to raise additional capital in anticipation of future growth opportunities. If WesBanco’s total assets were to increase to $15 billion due to acquisitions, certain trust preferred securities would no longer be included in the Tier 1 capital of the risk-based capital guidelines. WesBanco has $137.6 million and $106.2 million in junior subordinated debt in its Consolidated Balance Sheet as of December 31, 2016 and 2015, respectively.
WesBanco’s ability to raise additional capital for parent company or banking subsidiary needs will depend on conditions at that time in the capital markets, overall economic conditions, WesBanco’s financial performance and condition, and other factors, many of which are outside our control. There is no assurance that, if needed, WesBanco will be able to raise additional capital on favorable terms or at all. An inability to raise additional capital may have a material adverse effect on our ability to expand operations, and on our financial condition, results of operations and future prospects.
ITEM 1B. UNRESOLVED STAFF COMMENTS
None.
| ITEM 2. | PROPERTIES |
WesBanco’s subsidiaries generally own their respective offices, related facilities and any unimproved real property held for future expansion. At December 31, 2016, WesBanco operated 174 banking offices in West Virginia, Ohio, western Pennsylvania, Kentucky, and southern Indiana, of which 132 were owned and 42 were leased. WesBanco also operated three loan production offices leased in Ohio and western Pennsylvania. These leases expire at various dates through November 2040 and generally include options to renew. The Bank also owns several regional headquarters buildings in various markets, most of which also house a banking office and/or certain back office functions.
The main office of WesBanco is located at 1 Bank Plaza, Wheeling, West Virginia, in a building owned by the Bank. The building contains approximately 100,000 square feet and serves as the main office for both WesBanco’s community banking segment and its trust and investment services segment, as well as its executive offices. The Bank’s major back office operations currently occupy approximately 90% of the space available in an office building connected via sky-bridge to the main office. This adjacent back office building is owned by WesBanco Properties, Inc., a subsidiary of WesBanco, with the remainder of the building leased to unrelated businesses.
At various building locations, WesBanco rents or makes available commercial office space to unrelated businesses. Rental income totaled $0.8 million, $0.6 million and $0.7 million in 2016, 2015 and 2014, respectively. For additional disclosures related to WesBanco’s properties, other fixed assets and leases, please refer to Note 6, “Premises and Equipment” in the Consolidated Financial Statements.
| ITEM 3. | LEGAL PROCEEDINGS |
WesBanco is also involved in lawsuits, claims, investigations and proceedings, which arise in the ordinary course of business. While any litigation contains an element of uncertainty, WesBanco does not believe that a material loss related to such proceedings or claims pending or known to be threatened is reasonably possible.
| ITEM 4. | MINE SAFETY DISCLOSURES |
Not Applicable.
23
Table of Contents
| ITEM 5. | MARKET FOR THE REGISTRANT’S COMMON EQUITY, RELATED STOCKHOLDER MATTERS AND ISSUER PURCHASES OF EQUITY SECURITIES |
WesBanco’s common stock is quoted on the NASDAQ Global Select Stock Market under the symbol WSBC. The approximate number of record holders of WesBanco’s $2.0833 par value common stock as of February 17, 2017 was 6,869, not including shares held in nominee positions. The number of holders does not include WesBanco employees who have purchased stock or had stock allocated to them through WesBanco’s Employee Stock Ownership and 401(k) plan (the “KSOP”). All WesBanco employees who meet the eligibility requirements of the KSOP are included in this retirement plan.
The table below presents for each quarter in 2016 and 2015, the high and low sales price per share as reported by NASDAQ and cash dividends declared per share.
| 2016 | 2015 | |||||||||||||||||||||||
| High | Low | Dividend Declared |
High | Low | Dividend Declared |
|||||||||||||||||||
| Fourth quarter |
$ | 43.77 | $ | 32.06 | $ | 0.240 | $ | 34.32 | $ | 29.49 | $ | 0.230 | ||||||||||||
| Third quarter |
33.09 | 29.78 | 0.240 | 36.11 | 29.26 | 0.230 | ||||||||||||||||||
| Second quarter |
33.47 | 28.89 | 0.240 | 35.39 | 30.75 | 0.230 | ||||||||||||||||||
|
First quarter |
30.36 | 26.93 | 0.240 | 35.08 | 30.11 | 0.230 | ||||||||||||||||||
In April 2015, WesBanco shareholders approved an increase in the number of authorized shares of common stock from 50,000,000 shares to 100,000,000 shares.
At December 31, 2016, WesBanco had twelve capital trusts, which are all wholly-owned trust subsidiaries of WesBanco formed for the purpose of issuing Trust Preferred Securities and lending the proceeds to WesBanco. The debentures and trust preferred securities issued by the trusts provide that WesBanco has the right to elect to defer the payment of interest on the debentures and trust preferred securities for up to an aggregate of 20 quarterly periods. However, if WesBanco should defer the payment of interest or default on the payment of interest, it may not declare or pay any dividends on its common stock during any such period. For additional disclosure relating to WesBanco Trust Preferred Securities, refer to Note 11, “Subordinated Debt and Junior Subordinated Debt” in the Consolidated Financial Statements.
Federal and state laws impose restrictions on the ability of the Bank to pay dividends, which restrictions are more fully described in “Item 1. Business—Payment of Dividends.”
24
Table of Contents
As of December 31, 2016, WesBanco had two active one million share stock repurchase plans. The first plan was originally approved by the Board of Directors on March 21, 2007 and the second, which is incremental to the first, was approved October 22, 2015. Each provides for shares to be repurchased for general corporate purposes, which may include a subsequent resource for potential acquisitions, shareholder dividend reinvestment and employee benefit plans. The timing, price and quantity of purchases are at the discretion of WesBanco, and the plan may be discontinued or suspended at any time.
Repurchases in the fourth quarter include those for the KSOP and dividend reinvestment plans and repurchases to facilitate stock compensation transactions.
Certain information relating to securities authorized for issuance under equity compensation plans is set forth under the heading “Equity Compensation Plan Information” in Part III, “Item 12. Security Ownership of Certain Beneficial Owners and Management and Related Stockholder Matters.”
The following table shows the activity in WesBanco’s stock repurchase plan and other purchases for the quarter ended December 31, 2016:
| Period |
Total Number of Shares Purchased |
Average Price Paid per Share |
Total Number of Shares Purchased as Part of Publicly Announced Plans |
Maximum Number of Shares that May Yet Be Purchased Under the Plans | ||||||||||||||||
| Balance at September 30, 2016 |
1,123,944 | |||||||||||||||||||
| October 1, 2016 to October 31, 2016 |
||||||||||||||||||||
| Open market repurchases |
— | $ | — | — | 1,123,944 | |||||||||||||||
| Other repurchases (1) |
— | — | — | 1,123,944 | ||||||||||||||||
| Other transactions (2) |
17,902 | 33.06 | N/A | 1,123,944 | ||||||||||||||||
| November 1, 2016 to November 30, 2016 |
||||||||||||||||||||
| Open market repurchases |
— | — | — | 1,123,944 | ||||||||||||||||
| Other repurchases (1) |
3,637 | 32.68 | 3,637 | 1,120,307 | ||||||||||||||||
| Other transactions (2) |
1,556 | 36.21 | N/A | N/A | ||||||||||||||||
| December 1, 2016 to December 31, 2016 |
||||||||||||||||||||
| Open market repurchases |
— | — | — | 1,120,307 | ||||||||||||||||
| Other repurchases (1) |
— | — | — | 1,120,307 | ||||||||||||||||
| Other transactions (2) |
1,684 | 41.33 | N/A | N/A | ||||||||||||||||
|
|
|
|
|
|
|
|
|
|||||||||||||
| Fourth Quarter 2016 |
||||||||||||||||||||
| Open market repurchases |
— | — | — | 1,123,944 | ||||||||||||||||
| Other repurchases (1) |
3,637 | 32.68 | 3,637 | 1,120,307 | ||||||||||||||||
| Other transactions (2) |
21,142 | 33.95 | N/A | N/A | ||||||||||||||||
|
|
|
|
|
|
|
|
|
|||||||||||||
| Total |
24,779 | $ | 33.76 | 3,637 | 1,120,307 | |||||||||||||||
|
|
|
|
|
|
|
|
|
|||||||||||||
| (1) | Consists of shares purchased from employees for the payment of withholding taxes to facilitate stock compensation transactions. |
| (2) | Consists of open market purchases transacted in the KSOP and dividend reinvestment plans. |
N/A—Not applicable
25
Table of Contents
The following graph shows a comparison of cumulative total shareholder returns for WesBanco, the Russell 2000 Index and the SNL Small Cap Bank Index. The total shareholder return assumes a $100 investment in the common stock of WesBanco and each index since December 31, 2011 with reinvestment of dividends.
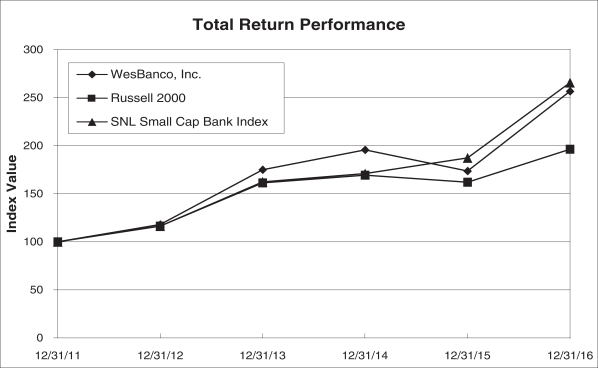
| Period Ending | ||||||||||||||||||||||||
| Index |
12/31/11 | 12/31/12 | 12/31/13 | 12/31/14 | 12/31/15 | 12/31/16 | ||||||||||||||||||
| WesBanco, Inc. |
100.00 | 118.13 | 175.12 | 195.82 | 173.88 | 256.68 | ||||||||||||||||||
| Russell 2000 |
100.00 | 116.35 | 161.52 | 169.43 | 161.95 | 196.45 | ||||||||||||||||||
| SNL Small Cap Bank Index |
100.00 | 116.48 | 162.46 | 171.24 | 187.53 | 265.89 | ||||||||||||||||||
26
Table of Contents
| ITEM 6. | SELECTED FINANCIAL DATA |
The following consolidated selected financial data is derived from WesBanco’s audited financial statements as of and for the five years ended December 31, 2016. The following consolidated financial data should be read in conjunction with Management’s Discussion and Analysis of Financial Condition and Results of Operations (“MD&A”) and the Consolidated Financial Statements and related notes included elsewhere in this report. WesBanco’s acquisitions during the five years ended December 31, 2016 include YCB on September 9, 2016, ESB on February 10, 2015 and Fidelity on November 30, 2012 and include the results of operations since the date of acquisition.
| For the years ended December 31, | ||||||||||||||||||||
| (dollars in thousands, except shares and per share amounts) |
2016 | 2015 | 2014 | 2013 | 2012 | |||||||||||||||
| PER COMMON SHARE INFORMATION |
||||||||||||||||||||
| Earnings per common share—basic |
$ | 2.16 | $ | 2.15 | $ | 2.39 | $ | 2.18 | $ | 1.84 | ||||||||||
| Earnings per common share—diluted |
2.16 | 2.15 | 2.39 | 2.18 | 1.84 | |||||||||||||||
| Dividends declared per common share |
0.96 | 0.92 | 0.88 | 0.78 | 0.70 | |||||||||||||||
| Book value at year end |
30.53 | 29.18 | 26.90 | 25.59 | 24.45 | |||||||||||||||
| Tangible book value at year end (1) |
17.19 | 16.51 | 16.09 | 14.68 | 13.48 | |||||||||||||||
| Average common shares outstanding—basic |
40,100,320 | 37,488,331 | 29,249,499 | 29,270,922 | 26,867,227 | |||||||||||||||
| Average common shares outstanding—diluted |
40,127,076 | 37,547,127 | 29,333,876 | 29,344,683 | 26,888,847 | |||||||||||||||
| SELECTED BALANCE SHEET INFORMATION |
||||||||||||||||||||
| Securities |
$ | 2,316,214 | $ | 2,422,450 | $ | 1,511,094 | $ | 1,532,906 | $ | 1,623,753 | ||||||||||
| Loans held for sale |
17,315 | 7,899 | 5,865 | 5,855 | 21,903 | |||||||||||||||
| Net portfolio loans |
6,205,762 | 5,024,132 | 4,042,112 | 3,847,549 | 3,635,063 | |||||||||||||||
| Total assets |
9,790,877 | 8,470,298 | 6,296,565 | 6,144,773 | 6,078,717 | |||||||||||||||
| Deposits |
7,040,879 | 6,066,299 | 5,048,983 | 5,062,530 | 4,944,284 | |||||||||||||||
| Total FHLB and other borrowings |
1,168,322 | 1,123,106 | 303,816 | 190,044 | 254,158 | |||||||||||||||
| Subordinated debt and junior subordinated debt |
163,598 | 106,196 | 106,176 | 106,137 | 113,832 | |||||||||||||||
| Shareholders’ equity |
1,341,408 | 1,122,132 | 788,190 | 746,595 | 714,184 | |||||||||||||||
| SELECTED RATIOS |
||||||||||||||||||||
| Return on average assets |
0.97 | % | 0.99 | % | 1.12 | % | 1.05 | % | 0.88 | % | ||||||||||
| Return on average tangible assets (1) |
1.06 | 1.08 | 1.20 | 1.13 | 0.96 | |||||||||||||||
| Return on average equity |
7.13 | 7.62 | 8.97 | 8.72 | 7.54 | |||||||||||||||
| Return on average tangible equity (1) |
12.73 | 13.41 | 15.39 | 15.79 | 13.57 | |||||||||||||||
| Net interest margin (2) |
3.32 | 3.41 | 3.61 | 3.58 | 3.53 | |||||||||||||||
| Efficiency ratio (1) |
56.69 | 57.05 | 59.59 | 60.99 | 60.98 | |||||||||||||||
| Average loans to average deposits |
85.79 | 78.53 | 76.89 | 75.28 | 74.15 | |||||||||||||||
| Allowance for loan losses to total loans |
0.70 | 0.82 | 1.09 | 1.22 | 1.43 | |||||||||||||||
| Allowance for loan losses to total non-performing loans |
110.76 | 92.84 | 87.76 | 91.99 | 82.79 | |||||||||||||||
| Non-performing assets to total assets |
0.49 | 0.60 | 0.89 | 0.92 | 1.15 | |||||||||||||||
| Net loan charge-offs to average loans |
0.12 | 0.23 | 0.23 | 0.38 | 0.66 | |||||||||||||||
| Average shareholders’ equity to average assets |
13.60 | 13.04 | 12.48 | 12.00 | 11.71 | |||||||||||||||
| Tangible equity to tangible assets (1) |
8.20 | 7.95 | 7.88 | 7.35 | 6.84 | |||||||||||||||
| Tier 1 leverage ratio |
9.81 | 9.38 | 9.88 | 9.27 | 9.34 | |||||||||||||||
| Tier 1 capital to risk-weighted assets |
13.16 | 13.35 | 13.76 | 13.06 | 12.82 | |||||||||||||||
| Total capital to risk-weighted assets |
14.18 | 14.11 | 14.81 | 14.19 | 14.07 | |||||||||||||||
| Common equity tier 1 capital ratio (CET 1) |
11.28 | 11.66 | N/A | N/A | N/A | |||||||||||||||
| Dividend payout ratio |
44.44 | 42.79 | 36.82 | 35.78 | 38.04 | |||||||||||||||
| Trust assets at market value (3) |
$ | 3,723,142 | $ | 3,625,411 | $ | 3,840,540 | $ | 3,688,734 | $ | 3,238,556 | ||||||||||
| (1) | See non-GAAP Measures with this “Item 6. Selected Financial Data” for additional information relating to the calculation of this item. |
| (2) | Presented on a fully taxable-equivalent (FTE) and annualized basis. The FTE basis adjusts for the tax benefit of income on certain tax-exempt loans and investments using the federal statutory tax rate of 35% for each period presented. WesBanco believes this measure to be the preferred industry measurement of net interest income and provides relevant comparison between taxable and non-taxable amounts. |
| (3) | Trust assets are held by the Bank, in fiduciary or agency capacities for its customers and therefore are not included as assets on WesBanco’s Consolidated Balance Sheets. |
N/A—not applicable
27
Table of Contents
| For the years ended December 31, | ||||||||||||||||||||
| (dollars in thousands, except per share amounts) |
2016 | 2015 | 2014 | 2013 | 2012 | |||||||||||||||
| SUMMARY STATEMENTS OF INCOME |
||||||||||||||||||||
| Interest and dividend income |
$ | 286,097 | $ | 261,712 | $ | 215,991 | $ | 217,890 | $ | 211,686 | ||||||||||
| Interest expense |
32,767 | 24,725 | 22,763 | 32,403 | 43,335 | |||||||||||||||
|
|
|
|
|
|
|
|
|
|
|
|||||||||||
| Net interest income |
253,330 | 236,987 | 193,228 | 185,487 | 168,351 | |||||||||||||||
| Provision for credit losses |
8,478 | 8,353 | 6,405 | 9,086 | 19,874 | |||||||||||||||
|
|
|
|
|
|
|
|
|
|
|
|||||||||||
| Net interest income after provision for credit losses |
244,852 | 228,634 | 186,823 | 176,401 | 148,477 | |||||||||||||||
| Non-interest income |
81,499 | 74,466 | 68,504 | 69,285 | 64,775 | |||||||||||||||
| Non-interest expense |
208,680 | 193,923 | 161,633 | 160,998 | 150,120 | |||||||||||||||
|
|
|
|
|
|
|
|
|
|
|
|||||||||||
| Income before provision for income taxes |
117,671 | 109,177 | 93,694 | 84,688 | 63,132 | |||||||||||||||
| Provision for income taxes |
31,036 | 28,415 | 23,720 | 20,763 | 13,588 | |||||||||||||||
|
|
|
|
|
|
|
|
|
|
|
|||||||||||
| Net income |
$ | 86,635 | $ | 80,762 | $ | 69,974 | $ | 63,925 | $ | 49,544 | ||||||||||
|
|
|
|
|
|
|
|
|
|
|
|||||||||||
| Earnings per common share—basic |
$ | 2.16 | $ | 2.15 | $ | 2.39 | $ | 2.18 | $ | 1.84 | ||||||||||
|
|
|
|
|
|
|
|
|
|
|
|||||||||||
| Earnings per common share—diluted |
$ | 2.16 | $ | 2.15 | $ | 2.39 | $ | 2.18 | $ | 1.84 | ||||||||||
|
|
|
|
|
|
|
|
|
|
|
|||||||||||
Non-GAAP Measures
The following non-GAAP financial measures used by WesBanco provide information that WesBanco believes is useful to investors in understanding WesBanco’s operating performance and trends, and facilitates comparisons with the performance of WesBanco’s peers. The following tables summarize the non-GAAP financial measures derived from amounts reported in WesBanco’s financial statements.
| For the years ended December 31, | ||||||||||||||||||||
| (dollars in thousands, except per share amounts) |
2016 | 2015 | 2014 | 2013 | 2012 | |||||||||||||||
| Tangible equity to tangible assets: |
||||||||||||||||||||
| Total shareholders’ equity |
$ | 1,341,408 | $ | 1,122,132 | $ | 788,190 | $ | 746,595 | $ | 714,184 | ||||||||||
| Less: goodwill and other intangible assets, net of deferred tax liability |
(586,403 | ) | (487,270 | ) | (316,914 | ) | (318,161 | ) | (320,399 | ) | ||||||||||
|
|
|
|
|
|
|
|
|
|
|
|||||||||||
| Tangible equity |
755,005 | 634,862 | 471,276 | 428,434 | 393,785 | |||||||||||||||
| Total assets |
9,790,877 | 8,470,298 | 6,296,565 | 6,144,773 | 6,078,717 | |||||||||||||||
| Less: goodwill and other intangible assets, net of deferred tax liability |
(586,403 | ) | (487,270 | ) | (316,914 | ) | (318,161 | ) | (320,399 | ) | ||||||||||
|
|
|
|
|
|
|
|
|
|
|
|||||||||||
| Tangible assets |
9,204,474 | 7,983,028 | 5,979,651 | 5,826,612 | 5,758,318 | |||||||||||||||
|
|
|
|
|
|
|
|
|
|
|
|||||||||||
| Tangible equity to tangible assets |
8.20 | % | 7.95 | % | 7.88 | % | 7.35 | % | 6.84 | % | ||||||||||
|
|
|
|
|
|
|
|
|
|
|
|||||||||||
| Tangible book value: |
||||||||||||||||||||
| Total shareholders’ equity |
$ | 1,341,408 | $ | 1,122,132 | $ | 788,190 | $ | 746,595 | $ | 714,184 | ||||||||||
| Less: goodwill and other intangible assets, net of deferred tax liability |
(586,403 | ) | (487,270 | ) | (316,914 | ) | (318,161 | ) | (320,399 | ) | ||||||||||
|
|
|
|
|
|
|
|
|
|
|
|||||||||||
| Tangible equity |
755,005 | 634,862 | 471,276 | 428,434 | 393,785 | |||||||||||||||
| Common shares outstanding |
43,931,715 | 38,459,635 | 29,298,188 | 29,175,236 | 29,214,660 | |||||||||||||||
|
|
|
|
|
|
|
|
|
|
|
|||||||||||
| Tangible book value at year end |
$ | 17.19 | $ | 16.51 | $ | 16.09 | $ | 14.68 | $ | 13.48 | ||||||||||
|
|
|
|
|
|
|
|
|
|
|
|||||||||||
| Return on average tangible equity: |
||||||||||||||||||||
| Net income |
$ | 86,635 | $ | 80,762 | $ | 69,974 | $ | 63,925 | $ | 49,544 | ||||||||||
| Add: amortization of intangibles, net of tax |
2,339 | 2,038 | 1,248 | 1,487 | 1,398 | |||||||||||||||
|
|
|
|
|
|
|
|
|
|
|
|||||||||||
| Net income before amortization of intangibles |
88,974 | 82,800 | 71,222 | 65,412 | 50,942 | |||||||||||||||
| Average total shareholders’ equity |
1,215,888 | 1,059,490 | 780,423 | 733,249 | 656,684 | |||||||||||||||
| Less: average goodwill and other intangibles, net of deferred tax liability |
(516,840 | ) | (442,215 | ) | (317,523 | ) | (318,913 | ) | (281,326 | ) | ||||||||||
|
|
|
|
|
|
|
|
|
|
|
|||||||||||
| Average tangible equity |
699,048 | 617,275 | 462,900 | 414,336 | 375,358 | |||||||||||||||
|
|
|
|
|
|
|
|
|
|
|
|||||||||||
| Return on average tangible equity |
12.73 | % | 13.41 | % | 15.39 | % | 15.79 | % | 13.57 | % | ||||||||||
|
|
|
|
|
|
|
|
|
|
|
|||||||||||
28
Table of Contents
| For the years ended December 31, | ||||||||||||||||||||
| (dollars in thousands, except per share amounts) |
2016 | 2015 | 2014 | 2013 | 2012 | |||||||||||||||
| Return on average tangible assets: |
||||||||||||||||||||
| Net income |
$ | 86,635 | $ | 80,762 | $ | 69,974 | $ | 63,925 | $ | 49,544 | ||||||||||
| Add: amortization of intangibles, net of tax |
2,339 | 2,038 | 1,248 | 1,487 | 1,398 | |||||||||||||||
|
|
|
|
|
|
|
|
|
|
|
|||||||||||
| Net income before amortization of intangibles |
88,974 | 82,800 | 71,222 | 65,412 | 50,942 | |||||||||||||||
| Average total assets |
8,939,886 | 8,123,981 | 6,253,253 | 6,109,311 | 5,606,386 | |||||||||||||||
| Less: average goodwill and other intangibles, net of deferred tax liability |
(516,840 | ) | (442,215 | ) | (317,523 | ) | (318,913 | ) | (281,326 | ) | ||||||||||
|
|
|
|
|
|
|
|
|
|
|
|||||||||||
| Average tangible assets |
8,423,046 | 7,681,766 | 5,935,730 | 5,790,398 | 5,325,060 | |||||||||||||||
|
|
|
|
|
|
|
|
|
|
|
|||||||||||
| Return on average tangible assets |
1.06 | % | 1.08 | % | 1.20 | % | 1.13 | % | 0.96 | % | ||||||||||
|
|
|
|
|
|
|
|
|
|
|
|||||||||||
| Efficiency Ratio |
||||||||||||||||||||
| Non-interest expense |
$ | 208,680 | $ | 193,923 | $ | 161,633 | $ | 160,998 | $ | 150,120 | ||||||||||
| Less: restructuring and merger-related expense |
(13,261 | ) | (11,082 | ) | (1,309 | ) | (1,310 | ) | (3,888 | ) | ||||||||||
|
|
|
|
|
|
|
|
|
|
|
|||||||||||
| Non-interest expense excluding restructuring and merger-related expense |
195,419 | 182,841 | 160,324 | 159,688 | 146,232 | |||||||||||||||
| Net interest income on a fully taxable equivalent basis |
263,232 | 246,014 | 200,545 | 192,556 | 175,027 | |||||||||||||||
| Non-interest income |
81,499 | 74,466 | 68,504 | 69,285 | 64,775 | |||||||||||||||
|
|
|
|
|
|
|
|
|
|
|
|||||||||||
| Net interest income on a fully taxable equivalent basis plus non-interest income |
344,731 | 320,480 | 269,049 | 261,841 | 239,802 | |||||||||||||||
|
|
|
|
|
|
|
|
|
|
|
|||||||||||
| Efficiency Ratio |
56.69 | % | 57.05 | % | 59.59 | % | 60.99 | % | 60.98 | % | ||||||||||
|
|
|
|
|
|
|
|
|
|
|
|||||||||||
| Net income, excluding after-tax merger-related expenses: |
||||||||||||||||||||
| Net income |
$ | 86,635 | $ | 80,762 | $ | 69,974 | $ | 63,925 | $ | 49,544 | ||||||||||
| Add: after-tax merger-related expenses (1) |
8,619 | 7,203 | 851 | 851 | 2,527 | |||||||||||||||
|
|
|
|
|
|
|
|
|
|
|
|||||||||||
| Net income, excluding after-tax merger-related expenses |
$ | 95,254 | $ | 87,965 | $ | 70,825 | $ | 64,776 | $ | 52,071 | ||||||||||
|
|
|
|
|
|
|
|
|
|
|
|||||||||||
| Net income, excluding after-tax merger-related expenses per diluted share: |
||||||||||||||||||||
| Net income per diluted share |
$ | 2.16 | $ | 2.15 | $ | 2.39 | $ | 2.18 | $ | 1.84 | ||||||||||
| Add: after-tax merger-related expenses per diluted share (1) |
0.21 | 0.19 | 0.03 | 0.03 | 0.09 | |||||||||||||||
|
|
|
|
|
|
|
|
|
|
|
|||||||||||
| Net income, excluding after-tax merger-related expenses per diluted share |
$ | 2.37 | $ | 2.34 | $ | 2.42 | $ | 2.21 | $ | 1.93 | ||||||||||
|
|
|
|
|
|
|
|
|
|
|
|||||||||||
| Return on average tangible equity, excluding after-tax merger-related expenses: |
||||||||||||||||||||
| Net income |
$ | 86,635 | $ | 80,762 | $ | 69,974 | $ | 63,925 | $ | 49,544 | ||||||||||
| Add: after-tax merger-related expenses (1) |
8,619 | 7,203 | 851 | 851 | 2,527 | |||||||||||||||
| Add: amortization of intangibles, net of tax |
2,339 | 2,038 | 1,248 | 1,487 | 1,398 | |||||||||||||||
|
|
|
|
|
|
|
|
|
|
|
|||||||||||
| Net income before amortization of intangibles and excluding after-tax merger-related expenses |
97,593 | 90,003 | 72,073 | 66,263 | 53,469 | |||||||||||||||
| Average total shareholders’ equity |
1,215,888 | 1,059,490 | 780,423 | 733,249 | 656,684 | |||||||||||||||
| Less: average goodwill and other intangibles, net of deferred tax liability |
(516,840 | ) | (442,215 | ) | (317,523 | ) | (318,913 | ) | (281,326 | ) | ||||||||||
|
|
|
|
|
|
|
|
|
|
|
|||||||||||
| Average tangible equity |
699,048 | 617,275 | 462,900 | 414,336 | 375,358 | |||||||||||||||
|
|
|
|
|
|
|
|
|
|
|
|||||||||||
| Return on average tangible equity, excluding after-tax merger-related expenses |
13.96 | % | 14.58 | % | 15.57 | % | 15.99 | % | 14.24 | % | ||||||||||
|
|
|
|
|
|
|
|
|
|
|
|||||||||||
29
Table of Contents
| For the years ended December 31, | ||||||||||||||||||||
| (dollars in thousands, except per share amounts) |
2016 | 2015 | 2014 | 2013 | 2012 | |||||||||||||||
| Return on average assets, excluding after-tax merger-related expenses: |
||||||||||||||||||||
| Net income |
$ | 86,635 | $ | 80,762 | $ | 69,974 | $ | 63,925 | $ | 49,544 | ||||||||||
| Add: after-tax merger-related expenses (1) |
8,619 | 7,203 | 851 | 851 | 2,527 | |||||||||||||||
|
|
|
|
|
|
|
|
|
|
|
|||||||||||
| Net income, excluding after-tax merger-related expenses |
95,254 | 87,965 | 70,825 | 64,776 | 52,071 | |||||||||||||||
|
|
|
|
|
|
|
|
|
|
|
|||||||||||
| Average total assets |
8,939,886 | 8,123,981 | 6,253,253 | 6,109,311 | 5,606,386 | |||||||||||||||
|
|
|
|
|
|
|
|
|
|
|
|||||||||||
| Return on average tangible assets, excluding after-tax merger-related expenses |
1.07 | % | 1.08 | % | 1.13 | % | 1.06 | % | 0.93 | % | ||||||||||
|
|
|
|
|
|
|
|
|
|
|
|||||||||||
| (1) | Tax effected at 35% |
30
Table of Contents
| ITEM 7. | MANAGEMENT’S DISCUSSION AND ANALYSIS OF FINANCIAL CONDITION AND RESULTS OF OPERATIONS |
Management’s Discussion and Analysis represents an overview of the results of operations and financial condition of WesBanco. This discussion and analysis should be read in conjunction with the Consolidated Financial Statements and Notes thereto.
FORWARD-LOOKING STATEMENTS
Forward-looking statements in this report relating to WesBanco’s plans, strategies, objectives, expectations, intentions and adequacy of resources, are made pursuant to the safe harbor provisions of the Private Securities Litigation Reform Act of 1995. The information contained in this report should be read in conjunction with WesBanco’s Form 10-Qs for the prior quarters ended March 31, June 30 and September 30, 2016, respectively, and documents subsequently filed by WesBanco which are available at the SEC’s website, www.sec.gov or at WesBanco’s website, www.wesbanco.com. Investors are cautioned that forward-looking statements, which are not historical fact, involve risks and uncertainties, including those detailed under “Risk Factors” in Part I, Item 1A of this Annual Report on Form 10-K. Such statements are subject to important factors that could cause actual results to differ materially from those contemplated by such statements, including, without limitation, the effects of changing regional and national economic conditions; changes in interest rates, spreads on earning assets and interest-bearing liabilities, and associated interest rate sensitivity; sources of liquidity available to WesBanco and its related subsidiary operations; potential future credit losses and the credit risk of commercial, real estate, and consumer loan customers and their borrowing activities; actions of the Federal Reserve Board, the FDIC, the SEC, FINRA, the Municipal Securities Rulemaking Board, the Securities Investors Protection Corporation, and other regulatory bodies; potential legislative and federal and state regulatory actions and reform, including, without limitation, the impact of the implementation of the Dodd-Frank Act; adverse decisions of federal and state courts; fraud, scams and schemes of third parties; internet hacking; competitive conditions in the financial services industry; rapidly changing technology affecting financial services; marketability of debt instruments and corresponding impact on fair value adjustments; and/or other external developments materially impacting WesBanco’s operational and financial performance. WesBanco does not assume any duty to update forward-looking statements.
APPLICATION OF CRITICAL ACCOUNTING POLICIES AND ESTIMATES
WesBanco’s Consolidated Financial Statements are prepared in accordance with GAAP and follow general practices within the industries in which it operates. Application of these principles requires management to make estimates, assumptions and judgments that affect the amounts reported in the financial statements and accompanying notes. These estimates, assumptions and judgments are based on information available as of the date of the financial statements; accordingly, as this information changes, the financial statements could reflect different estimates, assumptions and judgments. Certain policies inherently have a greater reliance on the use of estimates, assumptions and judgments and as such have a greater possibility of producing results that could be materially different than originally reported.
The most significant accounting policies followed by WesBanco are included in Note 1, “Summary of Significant Accounting Policies,” of the Consolidated Financial Statements. These policies, along with other Notes to the Consolidated Financial Statements and this MD&A, provide information on how significant assets and liabilities are valued in the financial statements and how those values are determined. Management has identified the allowance for loan losses and the evaluation of goodwill and other intangible assets for impairment to be the accounting estimates that require the most subjective or complex judgments, and as such could be most subject to revision as new information becomes available.
Allowance for Credit Losses—The allowance for credit losses represents management’s estimate of probable losses inherent in the loan portfolio and in future advances against loan commitments. Determining the
31
Table of Contents
amount of the allowance requires significant judgment about the collectability of loans and the factors that deserve consideration in estimating probable credit losses. The allowance is increased by a provision charged to operating expense and reduced by charge-offs, net of recoveries. Management evaluates the adequacy of the allowance at least quarterly. This evaluation is inherently subjective as it requires material estimates that may be susceptible to significant change from period to period.
The evaluation includes an assessment of quantitative factors such as actual loss experience within each category of loans and testing of certain commercial loans for impairment. The evaluation also considers qualitative factors such as economic trends and conditions, which includes levels of unemployment, real estate values and the impact on specific industries and geographical markets, changes in lending policies and underwriting standards, delinquency and other credit quality trends, concentrations of credit risk, if any, the results of internal loan reviews and examinations by bank regulatory agencies, the volatility of historical loss rates, the velocity of changes in historical loss rates, and regulatory guidance pertaining to the allowance for credit losses. Management relies on observable data from internal and external sources to the extent it is available to evaluate each of these factors and adjusts the actual historical loss rates to reflect the impact these factors may have on probable losses in the portfolio.
Commercial real estate and commercial and industrial loans greater than $1 million that are reported as non-accrual or as a troubled debt restructuring are tested individually for impairment. Specific reserves are established when appropriate for such loans based on the present value of expected future cash flows of the loan or the estimated realizable value of the collateral, if any.
General reserves are established for loans that are not individually tested for impairment based on historical loss rates adjusted for the impact of the qualitative factors discussed above. Historical loss rates for commercial real estate and commercial and industrial loans are determined for each internal risk grade or group of pass grades using a migration analysis. Historical loss rates for commercial real estate land and construction, residential real estate, home equity and consumer loans that are not risk graded are determined for the total of each category of loans. Historical loss rates for deposit account overdrafts are based on actual losses in relation to average overdrafts for the period.
Management may also adjust its assumptions to account for differences between estimated and actual incurred losses from period to period. The variability of management’s assumptions could alter the level of the allowance for credit losses and may have a material impact on future results of operations and financial condition. The loss estimation models and methods used to determine the allowance for credit losses are continually refined and enhanced; however, there have been no material substantive changes compared to prior periods.
Goodwill and Other Intangible Assets—WesBanco accounts for business combinations using the acquisition method of accounting. Accordingly, the identifiable assets acquired, the liabilities assumed, and any non-controlling interest of an acquired business are recorded at their estimated fair values as of the date of acquisition with any excess of the cost of the acquisition over the fair value recorded as goodwill. Other intangible assets represent purchased assets that lack physical substance but can be distinguished from goodwill because of contractual or other legal rights or because the asset is capable of being sold or exchanged either on its own or in combination with a related contract, asset, or liability. At December 31, 2016, the carrying value of goodwill and other intangibles was $573.8 million and $19.4 million, respectively, which represents approximately 42.8% and 1.4% of total shareholders’ equity, respectively. At December 31, 2016, WesBanco’s Community Banking segment had two reporting units with Goodwill.
Goodwill is not amortized but is evaluated for impairment annually, or more often if events or circumstances indicate it may be impaired. Finite-lived intangible assets, which consist primarily of core deposit and customer list intangibles (long-term customer-relationship intangible assets) are amortized using straight-line and accelerated methods over their weighted-average estimated useful lives, ranging from ten to sixteen years in
32
Table of Contents
total, and are tested for impairment whenever events or circumstances indicate that their carrying amount may not be recoverable. Non-compete agreements are recognized in other assets on the balance sheet and are amortized on a straight-line basis over the life of the respective agreements, ranging from one to four years.
WesBanco evaluated goodwill for impairment by performing the two-step goodwill impairment test. WesBanco uses market capitalization, multiples of tangible book value, a discounted cash flow model, and various other market-based methods to estimate the current fair value of its reporting units. In particular, the discounted cash flow model includes various assumptions regarding an investor’s required rate of return on WesBanco common stock, future loan loss provisions, future net interest margins, along with various growth and economic recovery and stabilization assumptions of the economy as a whole. The resulting fair values of each method are then weighted based on the relevance and reliability of each respective method in light of the current economic environment to arrive at a weighted average fair value. The evaluation also considered macroeconomic conditions such as the general economic outlook, regional and national unemployment rates, and recent trends in equity and credit markets. Additionally, industry and market considerations, such as market-dependent multiples and metrics relative to peers, were evaluated. WesBanco also considered recent trends in credit quality, overall financial performance, stock price appreciation, internal forecasts and various other market-based methods to estimate the current fair value of its reporting units.
WesBanco concluded that goodwill at the reporting units was not impaired as of November 30, 2016 and determined that goodwill was not impaired as of December 31, 2016 as there were no significant changes in market conditions, consolidated operating results, or forecasted future results from November 30, 2016, the date of the most recent goodwill impairment evaluation.
Intangible assets with finite useful lives are evaluated for impairment whenever events or changes in circumstances indicate that their carrying amount may not be recoverable. An impairment loss is recognized when the carrying amount of an intangible asset with a finite useful life is not recoverable from its undiscounted cash flows and is measured as the difference between the carrying amount and the fair value of the asset. WesBanco does not have any indefinite-lived intangible assets. Intangible assets with finite useful lives at December 31, 2016 are comprised of $19.3 million in core deposit intangibles held at the Bank and customer list intangibles of $0.1 million held at WesBanco Securities. At December 31, 2016 there were no indicators of impairment related to intangible assets with finite useful lives.
33
Table of Contents
EXECUTIVE OVERVIEW
On September 9, 2016, WesBanco completed the acquisition of YCB, a bank holding company headquartered in New Albany, Indiana with approximately $1.5 billion in assets and 34 branches in Kentucky and southern Indiana. As a result of organic growth and the acquisition, for the seventh consecutive year, financial performance improved in 2016 as WesBanco continued to achieve significant loan growth in the legacy markets and through the acquisition, maintained credit quality as the loan portfolio expanded, increased interest and non-interest income and enhanced operating efficiency through cost management programs.
Net income increased $5.9 million or 7.3% to $86.6 million. Net income excluding after-tax, merger-related expenses(1) increased 8.3% to $95.3 million compared to $88.0 million for 2015. Net interest income improved $16.3 million or 6.9%, primarily through a 10.0% increase in average earning assets from the acquisition and from 3.4% of organic loan growth, partially offset by a lower net interest margin of 3.32% compared to 3.41% in 2015. The organic loan growth was primarily driven by our expanded market areas and additional commercial lending personnel in our core markets. The provision for credit losses only increased 1.5% primarily due to stability or improvement in the quality inherent in the portfolio as shown through associated credit quality metrics, offset somewhat by loan growth. Growth was achieved in certain categories of non-interest income: service charges on deposits increased $1.6 million, electronic banking fees increased $1.2 million and other income increased $4.2 million related to swap fee income. Excluding merger-related costs, non-interest expenses increased 6.9%, primarily in salaries and wages, employee benefits, net occupancy and equipment, relating primarily to the cost of YCB employees and facilities added to WesBanco operations in 2016. Overall WesBanco’s costs were well controlled in 2016 as WesBanco achieved the best efficiency ratio in the last five years of 56.69%(1), a 36 basis point improvement from 2015.
Total assets at December 31, 2016 increased 15.6% or $1.3 billion compared to December 31, 2015 due to the acquisition of YCB. Portfolio loans increased $1.2 billion, with $1.0 billion from the acquisition and $171.9 million from loan growth exclusive of the YCB acquisition. Organic loan growth in 2016 was 3.4%, primarily achieved through $2.0 billion in loan originations compared to $1.8 billion last year. Organic loan growth occurred in all loan categories, with approximately 10.5% of the growth in commercial and industrial loans and 7.8% in home equity loans. Loan growth was driven by expanded market areas and additional commercial personnel in our core markets. Deposits increased $974.6 million compared to December 31, 2015, due to the acquisition. Total organic deposits, excluding certificates of deposit (“CDs”), increased 2.3%, driven by 10.8% organic growth in interest bearing and non-interest bearing demand deposits. Reflecting customer preferences, total demand deposits as of December 31, 2016, now represent 47.4% of total deposits, an increase from 40.6% as of December 31, 2015. Organic certificates of deposit decreased 20.8% from December 31, 2015 due to customer preferences for other deposit types and as we remix our deposits to emphasize transaction account types that can be generated at a lower cost.
WesBanco continues to maintain strong regulatory capital ratios after the YCB acquisition and implementation of the new BASEL III capital standards. At December 31, 2016, Tier I leverage was 9.81%, Tier I risk-based capital was 13.16%, and total risk-based capital was 14.18% and the Common Equity Tier 1 capital ratio, was 11.28%. Both consolidated and bank-level regulatory capital ratios are well above the applicable “well-capitalized” standards promulgated by bank regulators, as well as the BASEL III capital standards. Total tangible equity to tangible assets(1) was 8.20% at December 31, 2016, increasing from 7.95% at December 31, 2015, which reflects the acquisition of YCB and lower accumulated other comprehensive income, as well as an increase in retained earnings.
Strong earnings and improved total capital have enabled WesBanco to increase the quarterly dividend rate, at $0.24 per share for the fourth quarter, nine times over the last six years, cumulatively representing a 71% increase, with a 2016 increase of 4%. The dividend was increased again in February 2017 to $0.26 per share, a $0.02 per share or 8.3% increase to be paid April 1, 2017.
34
Table of Contents
WesBanco had numerous operating accomplishments in 2016 including:
| • | The merger with YCB was consummated on September 9, 2016 in a little over four months from the date of its announcement on May 3rd. YCB, a commercial bank headquartered in New Albany, IN, had approximately $1.5 billion of assets and operated through 34 financial centers in Southern Indiana and Kentucky. |
| • | With the addition of our new Indiana and Kentucky markets, we now have strong market share across five states, including our legacy West Virginia market as well as several major metropolitan areas. While maintaining top ten market share in our legacy markets, including the Columbus and Pittsburgh Metropolitan Statistical Areas (“MSA” or “MSAs”), we added top ten market share in the Bardstown, Elizabethtown-Fort Knox and Louisville MSAs. |
| • | During 2016, the financial and business press again recognized WesBanco as our financial performance and workplace quality were highlighted. Recently, we were named one of the best banks in America by a leading financial magazine which ranked WesBanco 26th among the top 100 banks, as compared to our ranking of 33rd last year. Bauer Financial, Inc., a financial analysis and reporting company, again awarded WesBanco their highest rating as a “five-star” bank. |
| • | Expense management remains one of the keys to our growth and success. Through this company-wide focus on costs, we generated positive operating leverage and greater efficiencies, as evidenced by the improvement in our efficiency ratio. During 2016, we delivered an efficiency ratio of 56.69%(1) (exclusive of restructuring and merger-related expenses), an improvement of 0.6% when compared to 2015. In fact, since 2012, the year we expanded our Western Pennsylvania market with the acquisition of Fidelity Bancorp, we have reduced our efficiency ratio by more than 400 basis points. |
Consistent enhancement of the products and processes that support customers and employees expands WesBanco’s growth opportunities and assists in improving operating efficiency.
| (1) | See non-GAAP Measures within Item 6. “Selected Financial Data” for additional information relating to the calculation of this item. |
35
Table of Contents
RESULTS OF OPERATIONS
EARNINGS SUMMARY
Net income for 2016 was $86.6 million or $2.16 per diluted share compared to $80.8 million or $2.15 per diluted share for 2015. Net income for the three months ended December 31, 2016 was $24.2 million, while diluted earnings per share were $0.55, compared to $23.0 million or $0.60 per diluted share for the fourth quarter of 2015. Excluding after-tax merger-related expenses (non-GAAP measure) for 2016, net income increased 8.3% to $95.3 million compared to $88.0 million for 2015, while diluted earnings per share totaled $2.37, compared to $2.34 per share for 2015. Excluding after-tax merger-related expenses (non-GAAP measure), net income for the three months ended December 31, 2016 was $26.0 million, while diluted earnings per share were $0.59, compared to $23.0 million or $0.60 per diluted share for the fourth quarter of 2015.
The net interest margin increased by 10 basis points to 3.42% in the fourth quarter of 2016 compared to the third quarter of 2016 as a result of higher yielding assets acquired through the acquisition. The increased yield on assets in the fourth quarter of 2016 of 15 basis points more than offset an 8 basis point increase in the cost of interest bearing liabilities as compared to fourth quarter of 2015. Net interest income increased $11.1 million or 18.3% in the fourth quarter of 2016 compared to the fourth quarter of 2015 due to a 25.2% increase in average loan balances resulting in a 14.4% increase in average earning assets, partially due to a 10 basis point increase in the net interest margin. The increase in average loan balances in 2016 was due to a combination of the acquisition and the 3.4% organic loan growth highlighted by 6.2% of commercial loan growth.
The year-over-year net interest margin decreased to 3.32% in 2016 compared to 3.41% in 2015. This decrease in the net interest margin is primarily due to 10 basis points of increased funding costs and an asset yield decline of 2 basis points. Total average loan rates decreased by 9 basis points year-over-year due to repricing of existing loans at lower spreads, competitive pricing on new loans and the extended low interest rate environment. The funding cost increase of 10 basis points in 2016, compared to 2015, is primarily due to an increase in the percentage of borrowings, primarily FHLB, to 19.8% of interest bearing liabilities from 14.3% in 2015, as well as a 27 basis point increase in the average total cost of these borrowings year-over-year. Average interest bearing deposits in 2016 increased 1.1%, as increases in interest bearing demand and savings accounts more than offset declines in CDs and money market accounts. During the last few quarters, the net interest margin has been relatively stable, ranging from 3.29% to 3.32% with an improvement in the fourth quarter of 2016 to 3.42%.
For 2016, non-interest income increased $7.0 million or 9.4% compared to 2015. Service charges on deposits increased $1.6 million or 9.5% and electronic banking fees increased $1.2 million or 8.6% through a larger customer deposit base from the addition of YCB. Net securities gains increased $1.4 million in 2016 compared to 2015, primarily due to sales of securities to maintain total assets below $10 billion as a result of the acquisition of YCB, and calls of agency notes and municipal bonds. Net securities brokerage revenue decreased $1.2 million or 16.2% primarily as a result of our strategy to retain deposits. Other income increased $4.2 million due to a $2.7 million increase in commercial customer loan swap fee and market value-related income and improvement in various other income categories.
The following comments on non-interest expense exclude merger-related expenses in both years. Non-interest expense in 2016 grew $12.6 million or 6.9%, compared to 2015. With net revenue growth of 7.5% in 2016, this positive operating leverage helped to improve the efficiency ratio in 2016 to 56.7% from 57.1% in 2015. For 2016, salaries and wages increased $6.9 million or 9.0% due to increased compensation expense related to an 18.1% increase in full-time equivalent employees, primarily late in the third quarter of 2016 from the YCB acquisition, and routine annual adjustments to compensation. Employee benefits expense increased $1.1 million, or 3.9%, primarily from increased health insurance, social security contributions and other benefit plan costs resulting from a larger employee base. Increases in net occupancy and equipment were also primarily from costs related to the additional branches from the YCB acquisition. At the end of the fourth quarter, a portion of the intended post-conversion cost savings were experienced as a result of branch and system conversions.
36
Table of Contents
The provision for federal and state income taxes increased to $31.0 million in 2016 compared to $28.4 million in 2015. The increase in income tax expense was due to an $8.5 million increase in pre-tax income, which caused a higher effective tax rate of 26.4% for 2016 compared to 26.0% for 2015.
TABLE 1. NET INTEREST INCOME
| For the years ended December 31, | ||||||||||||
| (dollars in thousands) |
2016 | 2015 | 2014 | |||||||||
| Net interest income |
$ | 253,330 | $ | 236,987 | $ | 193,228 | ||||||
| Taxable-equivalent adjustments to net interest income |
9,902 | 9,027 | 7,317 | |||||||||
|
|
|
|
|
|
|
|||||||
| Net interest income, fully taxable-equivalent |
$ | 263,232 | $ | 246,014 | $ | 200,545 | ||||||
|
|
|
|
|
|
|
|||||||
| Net interest spread, non-taxable-equivalent |
3.08 | % | 3.19 | % | 3.37 | % | ||||||
| Benefit of net non-interest bearing liabilities |
0.12 | % | 0.09 | % | 0.11 | % | ||||||
|
|
|
|
|
|
|
|||||||
| Net interest margin |
3.20 | % | 3.28 | % | 3.48 | % | ||||||
| Taxable-equivalent adjustment |
0.12 | % | 0.13 | % | 0.13 | % | ||||||
|
|
|
|
|
|
|
|||||||
| Net interest margin, fully taxable-equivalent |
3.32 | % | 3.41 | % | 3.61 | % | ||||||
|
|
|
|
|
|
|
|||||||
Net interest income, which is WesBanco’s largest source of revenue, is the difference between interest income on earning assets, primarily loans and securities, and interest expense on liabilities (deposits and short and long-term borrowings). Net interest income is affected by the general level and changes in interest rates, the steepness and shape of the yield curve, changes in the amount and composition of interest earning assets and interest bearing liabilities, as well as the frequency of repricing of existing assets and liabilities. Net interest income increased $16.3 million or 6.9% in 2016 compared to 2015, due to a 10.0% increase in average earning assets, partially offset by a 9 basis point decrease in the net interest margin. Total average loan balances increased by $672.6 million, or 13.9%, in 2016 due to a combination of the YCB acquisition and 3.4% in organic loan growth. Total average deposits increased in 2016 by $262.2 million or 4.3% compared to 2015, also due to the YCB acquisition. Excluding the YCB acquisition, average deposits decreased $103.9 million or 1.7%, primarily due to the runoff of certificates of deposit of $270.6 million, which have the highest interest cost among interest bearing deposits. Partially offsetting the decrease in certificates of deposit was an increase in average demand deposits of $217.4 million, reflecting customer preferences. The net interest margin decreased to 3.32% in 2016 from 3.41% in 2015. This decrease is due to a 10 basis point increase in funding costs and an asset yield decline of 2 basis points. Asset yields declined due to a 9 basis point decrease in average loan yields, partially offset by increases in loan balances. The funding cost increase was due to an increase in borrowings, primarily FHLB, from 2015, in addition to a 27 basis point increase in the average cost of these borrowings.
Interest income increased in 2016 by $24.4 million or 9.3% compared to 2015 due to higher average loan balances from the YCB acquisition and organic growth, and higher security yields, partially offset by lower loan yields. Loan yields decreased 9 basis points in 2016 due to the repricing of existing loans at lower spreads, competitive pricing on new loans and the extended low interest rate environment with a relatively flat yield curve. However, the increase in average loan balances helped to mitigate the effect of the lower rates, as rates earned on loans are higher than those on securities. In 2016, average loans represented 69.5% of average earning assets, an increase compared to 67.1% in 2015. Total securities yields increased by 5 basis points in 2016 from 2015 due to scheduled maturities and select sales of short-term, lower yielding investment securities as well as a higher percentage of average tax-exempt securities to total securities. The average balance of tax-exempt securities, which provide the highest yield within securities, increased 17.3% or $98.4 million over the last year, and were 28.5% of total average securities in 2016 compared to 24.4% in 2015, which helped to mitigate their 30 basis point decline in yield. While the yield on taxable securities increased by 5 basis points in 2016, taxable securities balances decreased by $80.2 million or 4.6% from 2015 due to maturities, calls, sales and paydowns that were not fully replaced due to management’s focus on maintaining the size of the balance sheet in order to manage the financial impact of crossing $10 billion in assets through acquisitions.
37
Table of Contents
Portfolio loans increased $1.2 billion or 23.4% in the twelve months ended December 31, 2016 with $1.0 billion from the YCB acquisition and $171.9 million, or 3.4% from organic loan growth. Organic loan growth was achieved through $2.0 billion in loan originations in 2016, partially offset by certain large commercial real estate payoffs. Organic loan growth was driven by expanded market areas and additional commercial personnel in our core markets, and occurred primarily in the commercial real estate, commercial and industrial and home equity lending categories. Total business loan originations were up approximately 26.7% compared to 2015.
Interest expense increased $8.0 million or 32.5% in 2016 compared to 2015, primarily due to increases in the average balance and rate paid on FHLB borrowings. The average rate on FHLB borrowings increased by 27 basis points in 2016 compared to 2015, due to a shift in term length from short to medium. The average balance of FHLB borrowings increased 68.3% in 2016 to manage normal liquidity needs including the funding of loan growth, and, to a lesser degree, securities growth in the first half of 2015 after the acquisition of ESB, and was 16.1% of interest bearing liabilities as compared to 10.4% in 2015. The overall increase in total average interest bearing liabilities of $464.4 million or 8.1%, was due to the increases in FHLB borrowings and interest bearing demand deposits and was offset partially by the decreases in higher cost CDs. The average balance of CDs decreased $190.1 million from 2015, even after the YCB acquisition. This decrease was accomplished through WesBanco’s planned funding strategy intentionally allowing the runoff of certain higher cost CDs and CDARS® balances and by customers’ preference toward demand deposits. In addition, non-interest bearing demand deposits increased to 23.0% of total average deposits in 2016 compared to 20.6% in 2015, helping to partially offset the increase in more expensive interest bearing liabilities.
38
Table of Contents
TABLE 2. AVERAGE BALANCE SHEETS AND NET INTEREST MARGIN ANALYSIS
| For the years ended December 31, | ||||||||||||||||||||||||||||||||||||
| 2016 | 2015 | 2014 | ||||||||||||||||||||||||||||||||||
| (dollars in thousands) |
Average Balance |
Interest | Average Rate |
Average Balance |
Interest | Average Rate |
Average Balance |
Interest | Average Rate |
|||||||||||||||||||||||||||
| ASSETS |
||||||||||||||||||||||||||||||||||||
| Due from banks-interest bearing |
$ | 27,193 | $ | 145 | 0.53 | % | $ | 15,467 | $ | 27 | 0.17 | % | $ | 28,713 | $ | 60 | 0.23 | % | ||||||||||||||||||
| Loans, net of unearned income (1) |
5,513,277 | 226,993 | 4.12 | % | 4,840,637 | 203,993 | 4.21 | % | 3,953,823 | 172,182 | 4.35 | % | ||||||||||||||||||||||||
| Securities: (2) |
||||||||||||||||||||||||||||||||||||
| Taxable |
1,677,128 | 38,490 | 2.29 | % | 1,757,288 | 39,314 | 2.24 | % | 1,158,738 | 29,233 | 2.52 | % | ||||||||||||||||||||||||
| Tax-exempt (3) |
667,066 | 28,292 | 4.24 | % | 568,671 | 25,791 | 4.54 | % | 403,088 | 20,906 | 5.19 | % | ||||||||||||||||||||||||
|
|
|
|
|
|
|
|
|
|
|
|
|
|
|
|
|
|
|
|||||||||||||||||||
| Total securities |
2,344,194 | 66,782 | 2.85 | % | 2,325,959 | 65,105 | 2.80 | % | 1,561,826 | 50,139 | 3.21 | % | ||||||||||||||||||||||||
| Federal funds sold |
— | — | — | — | — | — | — | — | — | |||||||||||||||||||||||||||
| Other earning assets |
45,704 | 2,079 | 4.55 | % | 28,721 | 1,614 | 5.61 | % | 11,726 | 927 | 7.91 | % | ||||||||||||||||||||||||
|
|
|
|
|
|
|
|
|
|
|
|
|
|
|
|
|
|
|
|||||||||||||||||||
| Total earning assets (3) |
7,930,368 | 295,999 | 3.73 | % | 7,210,784 | 270,739 | 3.75 | % | 5,556,088 | 223,308 | 4.02 | % | ||||||||||||||||||||||||
|
|
|
|
|
|
|
|
|
|
|
|
|
|
|
|
|
|
|
|||||||||||||||||||
| Other assets |
1,009,518 | 913,197 | 700,165 | |||||||||||||||||||||||||||||||||
|
|
|
|
|
|
|
|||||||||||||||||||||||||||||||
| Total Assets |
$ | 8,939,886 | $ | 8,123,981 | $ | 6,256,253 | ||||||||||||||||||||||||||||||
|
|
|
|
|
|
|
|||||||||||||||||||||||||||||||
| LIABILITIES AND SHAREHOLDERS’ EQUITY |
||||||||||||||||||||||||||||||||||||
| Interest bearing demand deposits |
$ | 1,340,001 | $ | 2,817 | 0.21 | % | $ | 1,143,965 | $ | 1,943 | 0.17 | % | $ | 899,887 | $ | 1,568 | 0.17 | % | ||||||||||||||||||
| Money market accounts |
961,847 | 1,860 | 0.19 | % | 1,003,980 | 1,914 | 0.19 | % | 972,496 | 1,877 | 0.19 | % | ||||||||||||||||||||||||
| Savings deposits |
1,134,755 | 696 | 0.06 | % | 1,044,079 | 640 | 0.06 | % | 822,221 | 532 | 0.06 | % | ||||||||||||||||||||||||
| Certificates of deposit |
1,514,767 | 10,419 | 0.69 | % | 1,704,871 | 11,033 | 0.65 | % | 1,418,459 | 13,286 | 0.94 | % | ||||||||||||||||||||||||
|
|
|
|
|
|
|
|
|
|
|
|
|
|
|
|
|
|
|
|||||||||||||||||||
| Total interest bearing deposits |
4,951,370 | 15,792 | 0.32 | % | 4,896,895 | 15,530 | 0.32 | % | 4,113,063 | 17,263 | 0.42 | % | ||||||||||||||||||||||||
| Federal Home Loan Bank borrowings |
995,644 | 11,985 | 1.20 | % | 591,506 | 5,510 | 0.93 | % | 81,159 | 968 | 1.19 | % | ||||||||||||||||||||||||
| Other borrowings |
105,735 | 478 | 0.45 | % | 109,165 | 370 | 0.34 | % | 101,291 | 1,333 | 1.32 | % | ||||||||||||||||||||||||
| Junior subordinated debt |
124,318 | 4,512 | 3.63 | % | 115,088 | 3,315 | 2.88 | % | 106,156 | 3,199 | 3.01 | % | ||||||||||||||||||||||||
|
|
|
|
|
|
|
|
|
|
|
|
|
|
|
|
|
|
|
|||||||||||||||||||
| Total interest bearing liabilities |
6,177,067 | 32,767 | 0.53 | % | 5,712,654 | 24,725 | 0.43 | % | 4,401,669 | 22,763 | 0.52 | % | ||||||||||||||||||||||||
| Non-interest bearing demand deposits |
1,474,883 | 1,267,158 | 1,029,370 | |||||||||||||||||||||||||||||||||
| Other liabilities |
72,048 | 84,679 | 41,791 | |||||||||||||||||||||||||||||||||
| Shareholders’ equity |
1,215,888 | 1,059,490 | 780,423 | |||||||||||||||||||||||||||||||||
|
|
|
|
|
|
|
|||||||||||||||||||||||||||||||
| Total Liabilities and Shareholders’ Equity |
$ | 8,939,886 | $ | 8,123,981 | $ | 6,253,253 | ||||||||||||||||||||||||||||||
|
|
|
|
|
|
|
|||||||||||||||||||||||||||||||
| Net interest spread |
3.20 | % | 3.32 | % | 3.50 | % | ||||||||||||||||||||||||||||||
| Taxable equivalent net interest margin (3) |
$ | 263,232 | 3.32 | % | $ | 246,014 | 3.41 | % | $ | 200,545 | 3.61 | % | ||||||||||||||||||||||||
|
|
|
|
|
|
|
|
|
|
|
|
|
|||||||||||||||||||||||||
| (1) | Gross of allowance for loan losses and net of unearned income. Includes non-accrual and loans held for sale. Loan fees included in interest income on loans were $2.8 million, $1.5 million and $3.5 million for the years ended December 31, 2016, 2015 and 2014, respectively. Additionally, loan accretion included in interest income on loans acquired from prior acquisitions was $4.4 million, $3.9 million and $1.4 million for the years ended December 31, 2016, 2015 and 2014, respectively, while accretion on interest bearing liabilities acquired from the prior acquisitions was $1.8 million, $3.4 million, and $0.7 million for the years ended December 31, 2016, 2015 and 2014, respectively. |
| (2) | Average yields on securities available-for-sale have been calculated based on amortized cost. |
| (3) | Taxable equivalent basis is calculated on tax-exempt securities using a rate of 35% for each period presented. |
39
Table of Contents
TABLE 3. RATE/VOLUME ANALYSIS OF CHANGES IN INTEREST INCOME AND INTEREST EXPENSE (1)
| 2016 Compared to 2015 | 2015 Compared to 2014 | |||||||||||||||||||||||
| (in thousands) |
Volume | Rate | Net Increase (Decrease) |
Volume | Rate | Net Increase (Decrease) |
||||||||||||||||||
| Increase (decrease) in interest income: |
||||||||||||||||||||||||
| Due from banks—interest bearing |
$ | 32 | $ | 86 | $ | 118 | $ | (26 | ) | $ | (5 | ) | $ | (31 | ) | |||||||||
| Loans, net of unearned income |
27,787 | (4,787 | ) | 23,000 | 37,529 | (5,718 | ) | 31,811 | ||||||||||||||||
| Taxable securities |
(1,705 | ) | 881 | (824 | ) | 13,699 | (3,618 | ) | 10,081 | |||||||||||||||
| Tax-exempt securities (2) |
4,251 | (1,750 | ) | 2,501 | 7,763 | (2,878 | ) | 4,885 | ||||||||||||||||
| Other earning assets |
814 | (349 | ) | 465 | 1,019 | (334 | ) | 685 | ||||||||||||||||
|
|
|
|
|
|
|
|
|
|
|
|
|
|||||||||||||
| Total interest income change (2) |
31,179 | (5,919 | ) | 25,260 | 59,984 | (12,553 | ) | 47,431 | ||||||||||||||||
|
|
|
|
|
|
|
|
|
|
|
|
|
|||||||||||||
| Increase (decrease) in interest expense: |
||||||||||||||||||||||||
| Interest bearing demand deposits |
366 | 508 | 874 | 416 | (41 | ) | 375 | |||||||||||||||||
| Money market |
(81 | ) | 27 | (54 | ) | 60 | (23 | ) | 37 | |||||||||||||||
| Savings deposits |
55 | 1 | 56 | 137 | (29 | ) | 108 | |||||||||||||||||
| Certificates of deposit |
(1,280 | ) | 666 | (614 | ) | 2,355 | (4,608 | ) | (2,253 | ) | ||||||||||||||
| Federal Home Loan Bank borrowings |
4,535 | 1,940 | 6,475 | 4,799 | (257 | ) | 4,542 | |||||||||||||||||
| Other borrowings |
(12 | ) | 120 | 108 | 96 | (1,059 | ) | (963 | ) | |||||||||||||||
| Junior subordinated debt |
282 | 915 | 1,197 | 261 | (145 | ) | 116 | |||||||||||||||||
|
|
|
|
|
|
|
|
|
|
|
|
|
|||||||||||||
| Total interest expense change |
3,865 | 4,177 | 8,042 | 8,124 | (6,162 | ) | 1,962 | |||||||||||||||||
|
|
|
|
|
|
|
|
|
|
|
|
|
|||||||||||||
| Net interest income increase (decrease) (2) |
$ | 27,314 | $ | (10,096 | ) | $ | 17,218 | $ | 51,860 | $ | (6,391 | ) | $ | 45,469 | ||||||||||
|
|
|
|
|
|
|
|
|
|
|
|
|
|||||||||||||
| (1) | Changes to rate/volume are allocated to both rate and volume on a proportionate dollar basis. |
| (2) | The yield on earning assets and the net interest margin are presented on a fully taxable-equivalent (FTE) and annualized basis. The FTE basis adjusts for the tax benefit of income on certain tax-exempt loans and investments using the federal statutory tax rate of 35% for each period presented. WesBanco believes this measure to be the preferred industry measurement of net interest income and provides relevant comparison between taxable and non-taxable amounts. |
PROVISION FOR CREDIT LOSSES
The provision for credit losses is the amount to be added to the allowance for loan losses after net charge-offs have been deducted to bring the allowance to a level considered appropriate to absorb probable losses in the loan portfolio. The provision for credit losses also includes the amount to be added to the reserve for loan commitments to bring that reserve to a level considered appropriate to absorb probable losses on unfunded commitments. The provision for credit losses for the year ended December 31, 2016 increased $0.1 million or 1.5% to $8.5 million. This increase is primarily the result of overall loan growth as historical loss rates and other credit quality indicators either improved or were stable. The provision for credit losses was higher than net charge-offs by $1.9 million in 2016 and was lower than net charge-offs by $2.8 million in 2015. (Please see the “Credit Quality” and “Allowance for Credit Losses” sections of this MD&A for additional discussion).
40
Table of Contents
TABLE 4. NON-INTEREST INCOME
| For the Years Ended December 31, |
||||||||||||||||
| (dollars in thousands) |
2016 | 2015 | $ Change | % Change | ||||||||||||
| Trust fees |
$ | 21,630 | $ | 21,900 | $ | (270 | ) | (1.2 | ) | |||||||
| Service charges on deposits |
18,333 | 16,743 | 1,590 | 9.5 | ||||||||||||
| Electronic banking fees |
15,596 | 14,361 | 1,235 | 8.6 | ||||||||||||
| Net securities brokerage revenue |
6,449 | 7,692 | (1,243 | ) | (16.2 | ) | ||||||||||
| Bank-owned life insurance |
4,064 | 4,863 | (799 | ) | (16.4 | ) | ||||||||||
| Net gains on sales of mortgage loans |
2,529 | 2,071 | 458 | 22.1 | ||||||||||||
| Net securities gains |
2,357 | 948 | 1,409 | 148.6 | ||||||||||||
| Net gain on other real estate owned and other assets |
790 | 356 | 434 | 121.9 | ||||||||||||
| Net insurance services revenue |
3,023 | 3,083 | (60 | ) | (1.9 | ) | ||||||||||
| Swap fee and valuation income |
2,962 | 253 | 2,709 | 1,070.8 | ||||||||||||
| Other |
3,766 | 2,196 | 1,570 | 71.5 | ||||||||||||
|
|
|
|
|
|
|
|
|
|||||||||
| Total non-interest income |
$ | 81,499 | $ | 74,466 | $ | 7,033 | 9.4 | |||||||||
|
|
|
|
|
|
|
|
|
|||||||||
Non-interest income is a significant source of revenue and an important part of WesBanco’s results of operations. WesBanco offers its customers a wide range of retail, commercial, investment and electronic banking services, which are viewed as a vital component of WesBanco’s ability to attract and maintain customers, as well as providing additional fee income beyond normal spread-related income to WesBanco. Non-interest income increased $7.0 million or 9.4% compared to 2015.
Trust fees decreased $0.3 million compared to 2015 as average trust assets in 2016 were slightly lower than in 2015 due to market declines early in the year, which reduced fee income. At December 31, 2016, total trust assets of $3.7 billion increased 2.8% from $3.6 billion at December 31, 2015 due to overall market improvements in the second half of 2016. At December 31, 2016, trust assets include managed assets of $3.0 billion and non-managed (custodial) assets of $0.7 billion. Assets managed for the WesMark Funds, a proprietary group of mutual funds that is advised by WesBanco’s trust and investment services group, were $884.1 million as of December 31, 2016 and $903.6 million at December 31, 2015 and are included in trust managed assets.
Service charges on deposits increased $1.6 million or 9.5% compared to the prior year due to the larger customer deposit base from the ESB and YCB acquisitions and adjustments to the fee schedule in the second half of last year.
Electronic banking fees, which include debit card interchange fees, continued to grow, increasing $1.2 million or 8.6% compared to 2015, due to a higher volume of debit card transactions from the ESB and YCB acquisitions and WesBanco’s legacy customers. The volume increase in our legacy markets is due to marketing and process initiatives as well as a higher percentage of customers using these products.
Net securities brokerage revenue decreased $1.2 million or 16.2% compared to 2015 due to staff restructuring, deposit retention strategies, and lower Marcellus and Utica gas lease and royalty payments in the region. Additional market coverage in the western Pennsylvania market from the ESB acquisition as well as the new YCB markets in Kentucky and southern Indiana should provide additional growth opportunities in the future.
Bank-owned life insurance decreased $0.8 million compared to 2015 due to death claims in the first and fourth quarters of 2015.
Net gains on sales of mortgage loans increased $0.5 million or 22.1% compared to the prior year from increased production volumes as well as an increase in the margin earned on loans sold. Total mortgage
41
Table of Contents
production was $389.1 million in 2016, up 27.4% from 2015. Mortgages sold into the secondary market represented $167.6 million or 43.1% of overall mortgage loan production in 2016 compared to $136.1 million or 44.5% in 2015. Net gains on sales of mortgage loans also included a $0.5 million charge from lower of cost or market adjustments on loans held for sale and loan commitments due to the increase in interest rates in the fourth quarter. This adjustment is expected to reverse in the first quarter of 2017 once the loans have sold.
Net gains on other assets improved by $0.4 million primarily due to a $0.3 million recovery in the fourth quarter related to one large commercial other-real estate owned property sold at a gain.
Swap fee and valuation income has increased $2.7 million from new lender incentives implemented in the spring of 2016 as well as the desire of customers to lock in longer term fixed rated financing in the low interest rate environment, for much of 2016.
Other income increased $1.6 million in 2016 as a result of $0.5 million of income related to the AMSCO joint venture partnerships and $0.5 million on the increase in the valuation of trading securities, which are recorded at fair value. Trading securities are investments in various mutual funds held in grantor trusts formed in connection with a deferred compensation plan.
TABLE 5. NON-INTEREST EXPENSE
| For the Years Ended December 31, |
||||||||||||||||||||
| (dollars in thousands) |
2016 | 2015 | $ Change | % Change | ||||||||||||||||
| Salaries and wages |
$ | 84,281 | $ | 77,340 | $ | 6,941 | 9.0 | |||||||||||||
| Employee benefits |
27,952 | 26,896 | 1,056 | 3.9 | ||||||||||||||||
| Net occupancy |
14,664 | 13,635 | 1,029 | 7.5 | ||||||||||||||||
| Equipment |
14,543 | 13,194 | 1,349 | 10.2 | ||||||||||||||||
| Marketing |
5,391 | 5,646 | (255 | ) | (4.5 | ) | ||||||||||||||
| FDIC insurance |
3,990 | 4,107 | (117 | ) | (2.8 | ) | ||||||||||||||
| Amortization of intangible assets |
3,598 | 3,136 | 462 | 14.7 | ||||||||||||||||
| Restructuring and merger-related expenses |
13,261 | 11,082 | 2,179 | 19.7 | ||||||||||||||||
| Franchise and other miscellaneous taxes |
6,825 | 5,924 | 901 | 15.2 | ||||||||||||||||
| Consulting, regulatory, accounting and advisory fees |
6,270 | 4,959 | 1,311 | 26.4 | ||||||||||||||||
| ATM and electronic banking interchange expenses |
4,297 | 4,463 | (166 | ) | (3.7 | ) | ||||||||||||||
| Postage and courier expenses |
3,306 | 3,720 | (414 | ) | (11.1 | ) | ||||||||||||||
| Supplies |
2,919 | 2,841 | 78 | 2.7 | ||||||||||||||||
| Legal fees |
2,406 | 2,418 | (12 | ) | (0.5 | ) | ||||||||||||||
| Communications |
1,800 | 1,537 | 263 | 17.1 | ||||||||||||||||
| Other real estate owned and foreclosure expenses |
1,210 | 546 | 664 | 121.6 | ||||||||||||||||
| Other |
11,967 | 12,479 | (512 | ) | (4.1 | ) | ||||||||||||||
|
|
|
|
|
|
|
|
|
|||||||||||||
| Total non-interest expense |
$ | 208,680 | $ | 193,923 | $ | 14,757 | 7.6 | |||||||||||||
|
|
|
|
|
|
|
|
|
|||||||||||||
Non-interest expense in 2016 increased $14.8 million or 7.6% compared to 2015, principally from the YCB acquisition, which increased assets by $1.5 billion, excluding goodwill, and added 34 offices to our branch network, and from $13.3 million of merger-related expenses in 2016 compared to $11.1 million in 2015.
Salaries and wages increased $6.9 million or 9.0%, due to an 18.1% increase in full-time equivalent employees from the merger and routine annual adjustments to compensation. Salaries and wages in 2016 also include temporary post-merger personnel costs incurred due to the timing of the November 4th systems and branch conversions. Employee benefits expense increased $1.1 million or 3.9%, primarily from increased health insurance, social security contributions and other benefit plan costs resulting from a larger employee base, while pension expense was lower in 2016.
42
Table of Contents
Net occupancy and equipment increased $1.0 million and $1.3 million, respectively, in 2016 principally due to increased building-related costs including utilities, lease expense, depreciation and other maintenance costs, as well as improvements in technology and communications infrastructure resulting primarily from the additional YCB offices.
FDIC insurance decreased 2.8% or $0.1 million compared to 2015, despite a larger balance sheet from the YCB acquisition, due to the Deposit Insurance Fund reaching 1.15% prior to July 1, 2016, thus allowing the FDIC to institute new favorable assessment rate calculations beginning on that date for banks under $10 billion in size, as well as improved risk-based factors for the Bank.
Amortization of intangible assets increased $0.5 million in 2016 due to the YCB acquisition, which added approximately $12.0 million in core deposit intangibles and $0.8 million in non-compete agreements with former YCB executives covering a three year term.
Restructuring and merger-related expenses of $13.3 million in 2016 related to the YCB acquisition include $7.5 million from contract termination and conversion costs, $2.4 million from change-in-control payments and employee severance, $1.5 million in investment banking services, $0.8 million in legal expenses, $0.5 million in audit and valuation services, $0.3 million in rebranding and $0.3 million in various other expenses. All restructuring and merger-related expenses in 2015 related to the ESB acquisition.
Miscellaneous taxes increased $0.9 million in 2016 due to the YCB acquisition, which expanded our branch network into Kentucky and southern Indiana.
Consulting, regulatory, accounting and advisory fees increased due to the larger volume of transactions from the YCB acquisition as well as additional expenses related to planning for expanded regulatory requirements that begin to take effect upon crossing $10.0 billion in assets.
Other real estate owned and foreclosure expenses increased $0.7 million in 2016 compared to 2015 due to normal foreclosure and liquidation activity, as well as a property tax refund on a large other real estate owned commercial property in 2015. Other real estate owned and repossessed assets increased $2.5 million from December 31, 2015 to $8.3 million as of December 31, 2016 primarily due to the YCB acquisition.
Other non-interest expense decreased $0.5 million in 2016 compared to 2015 due to lower customer fraud losses recognized in 2016.
INCOME TAXES
The provision for federal and state income taxes increased to $31.0 million in 2016 compared to $28.4 million in 2015. The increase in income tax expense was primarily due to a $8.5 million increase in pre-tax income and a 0.4% increase in the effective tax rate to 26.4% compared to 26.0% for 2015.
FINANCIAL CONDITION
Total assets increased 15.6% in 2016, while deposits and shareholders’ equity increased 16.1% and 19.5%, respectively, compared to December 31, 2015, primarily due to the acquisition of YCB. Total portfolio loans increased $1.2 billion or 23.4% with $1.0 billion from the YCB acquisition and the remaining $0.2 million from WesBanco’s originations outpacing pay downs, which were a result of expanded market areas and additional commercial and lending personnel in WesBanco’s core markets. Deposits increased $974.6 million, primarily due to the acquisition of YCB. Organic deposits decreased 3.6% as a result of a 20.8% decrease in certificates of deposit and a 16.8% decrease in money market deposits, which were partially offset by increases of 10.8% and 0.3% in demand deposits and savings deposits, respectively. The decrease in certificates of deposit is a result of
43
Table of Contents
lower rate offerings for maturing certificates of deposit and customer preferences for other deposit types. The increase in demand deposits and savings deposits were attributable to marketing, incentives paid to customers, focused retail and business strategies to obtain more account relationships, and customers’ preference for short-term maturities, coupled with initial deposits from bonus and royalty payments for Marcellus and Utica shale gas payments from energy companies in WesBanco’s southwestern Pennsylvania, eastern Ohio and northern West Virginia markets. Total borrowings increased 8.3% during 2016, due to an increase in short-term borrowings of $118.0 million and an increase of $57.4 million in subordinated debentures and junior subordinated debentures owed to unconsolidated trusts acquired in the YCB transaction, offset somewhat by a reduction of $72.8 million in FHLB borrowings. Total shareholders’ equity increased by approximately $219.3 million or 19.5%, compared to December 31, 2015, primarily due to $177.1 million of common stock issued in the YCB acquisition and net income exceeding dividends for the period by $47.2 million, which was partially offset by a $6.2 million loss in accumulated other comprehensive income. The loss in accumulated other comprehensive income resulted from $6.0 million in unrealized losses in the securities portfolio, coupled with a $0.2 million unrealized loss in the defined benefit pension plan during the year. The tangible equity to tangible assets ratio (non-GAAP measure) increased to 8.20%(1) at December 31, 2016 from 7.95% at December 31, 2015, primarily as a result of the increase in shareholders’ equity at a faster pace than the increase in tangible assets, net of the accumulated other comprehensive income decrease.
| (1) | See “Item 6. Selected Financial Data—Non-GAAP Measures” for additional information relating to the calculation of this item. |
44
Table of Contents
SECURITIES
TABLE 6. COMPOSITION OF SECURITIES (1)
| December 31, | 2016-2015 | December 31, | ||||||||||||||||||
| (dollars in thousands) |
2016 | 2015 | $ Change | % Change | 2014 | |||||||||||||||
| Trading securities (at fair value) |
$ | 7,071 | $ | 6,451 | $ | 620 | 9.6 | $ | 6,188 | |||||||||||
| Available-for-sale (at fair value) |
||||||||||||||||||||
| U.S. Government sponsored entities and agencies |
54,043 | 83,505 | (29,462 | ) | (35.3 | ) | 87,736 | |||||||||||||
| Residential mortgage-backed securities and collateralized mortgage obligations of government agencies |
1,035,099 | 1,176,080 | (140,981 | ) | (12.0 | ) | 701,113 | |||||||||||||
| Obligations of states and political subdivisions |
111,663 | 80,265 | 31,398 | 39.1 | 91,433 | |||||||||||||||
| Corporate debt securities |
35,301 | 58,593 | (23,292 | ) | (39.8 | ) | 25,996 | |||||||||||||
|
|
|
|
|
|
|
|
|
|
|
|||||||||||
| Total debt securities |
$ | 1,236,106 | $ | 1,398,443 | $ | (162,337 | ) | (11.6 | ) | $ | 906,278 | |||||||||
| Equity securities |
5,070 | 4,626 | 444 | 9.6 | 4,958 | |||||||||||||||
|
|
|
|
|
|
|
|
|
|
|
|||||||||||
| Total available-for-sale securities |
$ | 1,241,176 | $ | 1,403,069 | $ | (161,893 | ) | (11.5 | ) | $ | 911,236 | |||||||||
|
|
|
|
|
|
|
|
|
|
|
|||||||||||
| Held-to-maturity (at amortized cost) |
||||||||||||||||||||
| U.S. Government sponsored entities and agencies |
$ | 13,394 | $ | — | $ | 13,394 | 100.0 | $ | — | |||||||||||
| Residential mortgage-backed securities and collateralized mortgage obligations of government agencies |
215,141 | 216,419 | (1,278 | ) | (0.6 | ) | 79,004 | |||||||||||||
| Obligations of states and political subdivisions |
805,019 | 762,039 | 42,980 | 5.6 | 507,927 | |||||||||||||||
| Corporate debt securities |
34,413 | 34,472 | (59 | ) | (0 | ) | 6,739 | |||||||||||||
|
|
|
|
|
|
|
|
|
|
|
|||||||||||
| Total held-to-maturity securities |
$ | 1,067,967 | $ | 1,012,930 | $ | 41,643 | 4.1 | $ | 593,670 | |||||||||||
|
|
|
|
|
|
|
|
|
|
|
|||||||||||
| Total securities |
$ | 2,316,214 | $ | 2,422,450 | $ | (106,236 | ) | (4.4 | ) | $ | 1,504,906 | |||||||||
|
|
|
|
|
|
|
|
|
|
|
|||||||||||
| Available-for-sale securities: |
||||||||||||||||||||
| Weighted average yield at the respective year end (2) |
2.22 | % | 2.14 | % | 2.34 | % | ||||||||||||||
| As a % of total securities |
53.6 | % | 57.9 | % | 60.6 | % | ||||||||||||||
| Weighted average life (in years) |
4.3 | 4.1 | 4.0 | |||||||||||||||||
|
|
|
|
|
|
|
|||||||||||||||
| Held-to-maturity securities: |
||||||||||||||||||||
| Weighted average yield at the respective year end (2) |
3.76 | % | 3.94 | % | 4.67 | % | ||||||||||||||
| As a % of total securities |
46.4 | % | 42.1 | % | 39.4 | % | ||||||||||||||
| Weighted average life (in years) |
5.0 | 5.0 | 5.1 | |||||||||||||||||
|
|
|
|
|
|
|
|||||||||||||||
| Total securities: |
||||||||||||||||||||
| Weighted average yield at the respective year end (2) |
2.93 | % | 2.90 | % | 3.27 | % | ||||||||||||||
| As a % of total securities |
100.0 | % | 100.0 | % | 100.0 | % | ||||||||||||||
| Weighted average life (in years) |
4.6 | 4.5 | 4.4 | |||||||||||||||||
|
|
|
|
|
|
|
|||||||||||||||
| (1) | At December 31, 2016, 2015 and 2014, there were no holdings of any one issuer, other than the U.S. government and certain federal or federally-related agencies, in an amount greater than 10% of WesBanco’s shareholders’ equity. |
| (2) | Weighted average yields have been calculated on a taxable-equivalent basis using the federal statutory tax rate of 35%. |
Total investment securities, which represent a source of liquidity for WesBanco as well as a contributor to interest income, decreased $106.2 million or 4.4% from December 31, 2015 to December 31, 2016. The overall securities decrease was due to management’s focus on controlling overall growth, primarily through control of the securities portfolio, in order to manage the financial impact of crossing $10 billion in assets. The acquisition of YCB contributed $173.2 million in additional securities to the portfolio in 2016, as approximately $105.8 million of YCB’s securities were sold prior to the acquisition date, in order to facilitate staying below the $10 billion threshold.
45
Table of Contents
The portfolio’s weighted average tax-equivalent yield improved slightly in 2016 even through the YCB acquisition, increasing 3 basis points from last year to 2.93% at December 31, 2016. The acquisition of YCB’s securities portfolio at lower market rates was offset by increased purchases of tax-exempt securities, which have the highest yield within the securities portfolio.
Total gross unrealized securities losses increased by $11.6 million, from $17.7 million at December 31, 2015 to $29.3 million at December 31, 2016. WesBanco had $1.5 billion in investment securities in an unrealized loss position for less than twelve months at December 31, 2016, which increased from $1.2 billion in the same category at December 31, 2015. This increase was due to a late 2016 increase in intermediate and long-term market interest rates. In addition, at December 31, 2016, WesBanco had $67.5 million in investment securities in an unrealized loss position for more than twelve months, which was a decrease from the $171.8 million for the same category at December 31, 2015. WesBanco believes that all of the unrealized securities losses at December 31, 2016 were temporary impairment losses. Please refer to Note 4, “Securities,” of the Consolidated Financial Statements for additional information. WesBanco does not have any investments in private mortgage-backed securities or those that are collateralized by sub-prime mortgages, nor does WesBanco have any exposure to collateralized debt obligations or government-sponsored enterprise preferred stocks.
Net unrealized pre-tax losses on available-for-sale securities were $15.6 million at December 31, 2016, compared to $6.6 million at December 31, 2015. These net unrealized pre-tax losses represent temporary fluctuations resulting from changes in market rates in relation to fixed yields in the available-for-sale portfolio, and on an after-tax basis are accounted for as an adjustment to other comprehensive income in shareholders’ equity. Net unrealized pre-tax gains in the held-to-maturity portfolio, which are not accounted for in other comprehensive income, were $8.8 million at December 31, 2016, compared to $25.3 million at December 31, 2015.
46
Table of Contents
TABLE 7. MATURITY DISTRIBUTION AND YIELD ANALYSIS OF SECURITIES
The following table presents the amortized cost and tax-equivalent yields of available-for-sale and held-to-maturity securities by contractual maturity at December 31, 2016. In some instances, the issuers may have the right to call or prepay obligations without penalty prior to the contractual maturity date.
| December 31, 2016 | ||||||||||||||||||||||||||||||||||||||||||||||||
| One Year or less |
One to Five Years |
Five to Ten Years |
Over Ten Years |
Mortgage- backed and equity |
Total | |||||||||||||||||||||||||||||||||||||||||||
| (dollars in thousands) |
Amount | Yield (1) |
Amount | Yield (1) |
Amount | Yield (1) |
Amount | Yield (1) |
Amount | Yield (1) |
Amount | Yield (1) |
||||||||||||||||||||||||||||||||||||
| Available-for-sale |
||||||||||||||||||||||||||||||||||||||||||||||||
| U.S. Government sponsored entities and agencies |
$ | 2,000 | 0.74 | % | $ | 12,000 | 1.38 | % | $ | 17,000 | 1.81 | % | $ | 14,526 | 2.00 | % | $ | 9,277 | 1.93 | % | $ | 54,803 | 1.75 | % | ||||||||||||||||||||||||
| Residential mortgage-backed securities and |
— | — | — | — | 1,052,397 | |||||||||||||||||||||||||||||||||||||||||||
| collateralized mortgage obligations of government agencies (2) |
— | — | — | — | 1,052,397 | 1.98 | % | 1.98 | % | |||||||||||||||||||||||||||||||||||||||
| Obligations of states and political subdivisions (3) |
7,917 | 6.50 | % | 21,474 | 4.25 | % | 34,431 | 5.42 | % | 46,386 | 3.95 | % | — | — | 110,208 | 4.65 | % | |||||||||||||||||||||||||||||||
| Corporate debt securities |
— | — | 30,305 | 2.36 | % | 3,000 | 1.88 | % | 1,987 | 3.66 | % | — | — | 35,292 | 2.39 | % | ||||||||||||||||||||||||||||||||
| Equity securities (4) |
— | — | — | — | — | — | — | — | 4,062 | 3.63 | % | 4,062 | 3.63 | % | ||||||||||||||||||||||||||||||||||
|
|
|
|
|
|
|
|
|
|
|
|
|
|
|
|
|
|
|
|
|
|
|
|
|
|||||||||||||||||||||||||
| Total available-for-sale securities |
$ | 9,917 | 5.34 | % | $ | 63,779 | 2.81 | % | $ | 54,431 | 4.10 | % | $ | 62,899 | 3.29 | % | $ | 1,065,736 | 1.99 | % | $ | 1,256,762 | 2.22 | % | ||||||||||||||||||||||||
|
|
|
|
|
|
|
|
|
|
|
|
|
|
|
|
|
|
|
|
|
|
|
|
|
|||||||||||||||||||||||||
| Held-to-maturity |
||||||||||||||||||||||||||||||||||||||||||||||||
| U.S. Government sponsored entities and agencies |
$ | — | — | $ | — | — | $ | — | — | $ | — | — | $ | 13,394 | 1.41 | % | $ | 13,394 | 1.41 | % | ||||||||||||||||||||||||||||
| Residential mortgage-backed securities and collateralized mortgage obligations of government agencies (2) |
— | — | — | — | — | — | — | — | 215,141 | 2.42 | % | 215,141 | 2.42 | % | ||||||||||||||||||||||||||||||||||
| Obligations of states and political subdivisions (3) |
728 | 6.85 | % | 68,927 | 3.79 | % | 398,842 | 4.25 | % | 336,522 | 4.07 | % | — | — | 805,019 | 4.14 | % | |||||||||||||||||||||||||||||||
| Corporate debt securities |
— | — | 996 | 2.76 | % | 33,417 | 3.50 | % | — | — | — | — | 34,413 | 3.48 | % | |||||||||||||||||||||||||||||||||
|
|
|
|
|
|
|
|
|
|
|
|
|
|
|
|
|
|
|
|
|
|
|
|
|
|||||||||||||||||||||||||
| Total held-to-maturity securities |
$ | 728 | 6.85 | % | $ | 69,923 | 3.78 | % | $ | 432,259 | 4.19 | % | $ | 336,522 | 3.97 | % | $ | 228,535 | 2.42 | % | $ | 1,067,967 | 3.76 | % | ||||||||||||||||||||||||
|
|
|
|
|
|
|
|
|
|
|
|
|
|
|
|
|
|
|
|
|
|
|
|
|
|||||||||||||||||||||||||
| Total (5) |
$ | 10,645 | 5.44 | % | $ | 133,702 | 3.32 | % | $ | 486,690 | 4.18 | % | $ | 399,421 | 3.85 | % | $ | 1,294,271 | 2.06 | % | $ | 2,324,729 | 2.93 | % | ||||||||||||||||||||||||
|
|
|
|
|
|
|
|
|
|
|
|
|
|
|
|
|
|
|
|
|
|
|
|
|
|||||||||||||||||||||||||
| (1) | Yields are determined based on the lower of the yield-to-call or yield-to-maturity. |
| (2) | Mortgage-backed and collateralized mortgage securities, which have prepayment provisions, are not assigned to maturity categories due to fluctuations in their prepayment speeds. Projected maturities based on current speeds within one year, between one and five years, between five and ten years and over ten years are expected to be approximately $0 million, $1,077.3 million, $149.3 million and $40.9 million, respectively. |
| (3) | Average yields on obligations of states and political subdivisions have been calculated on a taxable-equivalent basis using the federal statutory tax rate of 35%. |
| (4) | Equity securities, which have no stated maturity, are not assigned a maturity category. |
| (5) | This table does not include trading securities, which consist of investments in various mutual funds held in grantor trusts formed in connection with a deferred compensation plan, are recorded at fair value and totaled $7.1 million at December 31, 2016. |
Cost-method investments consist primarily of FHLB of Pittsburgh and FHLB of Cincinnati stock totaling $46.4 and $45.5 million at December 31, 2016 and 2015, respectively, and are included in other assets in the Consolidated Balance Sheets.
47
Table of Contents
WesBanco’s municipal portfolio, comprised of both tax-exempt and taxable securities, totals 39.6% of the overall securities portfolio as of December 31, 2016, and it carries different risks that are not as prevalent in other security types contained in the portfolio. The following table presents the allocation of the municipal bond portfolio based on the combined S&P and Moody’s ratings of the individual bonds:
TABLE 8. MUNICIPAL BOND RATINGS
| December 31, 2016 | December 31, 2015 | |||||||||||||||||||
| (dollars in thousands) |
Amount | % of Total | Amount | % of Total | ||||||||||||||||
| Municipal bonds (at fair value) (1): |
||||||||||||||||||||
| Moody’s: Aaa / S&P: AAA |
$ | 93,676 | 10.1 | $ | 82,005 | 9.5 | ||||||||||||||
| Moody’s: Aa1 ; Aa2 ; Aa3 / S&P: AA+ ; AA ; AA- |
700,506 | 75.5 | 652,198 | 75.1 | ||||||||||||||||
| Moody’s: A1 ; A2 ; A3 / S&P: A+ ; A ; A- |
121,903 | 13.2 | 127,243 | 14.7 | ||||||||||||||||
| Moody’s: Baa1 ; Baa2 ; Baa3 / S&P: BBB+ ; BBB ; BBB- (2) |
729 | 0.1 | 1,820 | 0.2 | ||||||||||||||||
| Not rated by either agency |
9,991 | 1.1 | 4,433 | 0.5 | ||||||||||||||||
|
|
|
|
|
|
|
|
|
|||||||||||||
| Total municipal bond portfolio |
$ | 926,805 | 100.0 | $ | 867,699 | 100.0 | ||||||||||||||
|
|
|
|
|
|
|
|
|
|||||||||||||
| (1) | The highest available rating was used when placing the bond into a category in the table. |
| (2) | As of December 31, 2016 and 2015, there are no securities in the municipal portfolio rated below investment grade. |
WesBanco’s municipal bond portfolio consists of both taxable (primarily Build America Bonds) and tax-exempt general obligation and revenue bonds. The following table presents additional information regarding the municipal bond type and issuer (at fair value):
TABLE 9. COMPOSITION OF MUNICIPAL SECURITIES
| December 31, 2016 | December 31, 2015 | |||||||||||||||||||
| (dollars in thousands) |
Amount | % of Total | Amount | % of Total | ||||||||||||||||
| Municipal bond type: |
||||||||||||||||||||
| General Obligation |
$ | 638,868 | 68.9 | $ | 613,436 | 70.7 | ||||||||||||||
| Revenue |
287,937 | 31.1 | 254,263 | 29.3 | ||||||||||||||||
|
|
|
|
|
|
|
|
|
|||||||||||||
| Total municipal bond portfolio |
$ | 926,805 | 100.0 | $ | 867,699 | 100.0 | ||||||||||||||
|
|
|
|
|
|
|
|
|
|||||||||||||
| Municipal bond issuer: |
||||||||||||||||||||
| State Issued |
$ | 92,241 | 10.0 | $ | 77,952 | 9.0 | ||||||||||||||
| Local Issued |
834,564 | 90.0 | 789,747 | 91.0 | ||||||||||||||||
|
|
|
|
|
|
|
|
|
|||||||||||||
| Total municipal bond portfolio |
$ | 926,805 | 100.0 | $ | 867,699 | 100.0 | ||||||||||||||
|
|
|
|
|
|
|
|
|
|||||||||||||
48
Table of Contents
WesBanco’s municipal bond portfolio is broadly spread across the United States. The following table presents the top five states of municipal bond concentration based on total fair value at December 31, 2016:
TABLE 10. CONCENTRATION OF MUNICIPAL SECURITIES
| December 31, 2016 | ||||||||||
| (dollars in thousands) |
Fair Value | % of Total | ||||||||
| Pennsylvania |
$ | 195,403 | 21.1 | |||||||
| Texas |
111,528 | 12.0 | ||||||||
| Ohio |
107,096 | 11.6 | ||||||||
| Illinois |
52,611 | 5.7 | ||||||||
| West Virginia |
33,621 | 3.6 | ||||||||
| All other states |
426,546 | 46.0 | ||||||||
|
|
|
|
|
|||||||
| Total municipal bond portfolio |
$ | 926,805 | 100.0 | |||||||
|
|
|
|
|
|||||||
WesBanco uses prices from independent pricing services and, to a lesser extent, indicative (non-binding) quotes from independent brokers, to measure the fair value of its securities. WesBanco validates prices received from pricing services or brokers using a variety of methods, including, but not limited to, comparison to secondary pricing services, corroboration of pricing by reference to other independent market data such as secondary broker quotes and relevant benchmark indices, review of pricing by personnel familiar with market liquidity and other market-related conditions, review of pricing service methodologies, review of independent auditor reports received from the pricing service regarding its internal controls, and through review of inputs and assumptions used in pricing certain securities thinly traded or with limited observable data points. The procedures in place provide management with a sufficient understanding of the valuation models, assumptions, inputs and pricing to reasonably measure the fair value of WesBanco’s securities. For additional disclosure relating to fair value measurement, refer to Note 16, “Fair Value Measurement” in the Consolidated Financial Statements.
49
Table of Contents
LOANS AND LOAN COMMITMENTS
Loans represent WesBanco’s largest balance sheet asset classification and the largest source of interest income. Commercial loans include commercial real estate (“CRE”), which is further differentiated between land and construction, and improved property loans; as well as other commercial and industrial (“C&I”) loans that are not secured by real estate. Retail loans include residential real estate mortgage loans, home equity lines of credit (“HELOC”), and loans for other consumer purposes.
Loan commitments, which are not reported on the balance sheet, represent available balances on commercial and consumer lines of credit, commercial letters of credit, deposit account overdraft protection limits, certain loan guarantee contracts, and approved commitments to extend credit. Approved commitments, which have been accepted by the customer, are included net of any WesBanco loan balances that are to be refinanced by the new commitment. However, typically not all approved commitments will ultimately be funded.
Loans and loan commitments are summarized in Table 11.
TABLE 11. LOANS AND COMMITMENTS
| December 31, | ||||||||||||||||||||||||||||||||||||||||
| 2016 | 2015 | 2014 | 2013 | 2012 | ||||||||||||||||||||||||||||||||||||
| (dollars in thousands) |
Amount | % of Total |
Amount | % of Total |
Amount | % of Total |
Amount | % of Total |
Amount | % of Total |
||||||||||||||||||||||||||||||
| LOANS |
||||||||||||||||||||||||||||||||||||||||
| Commercial real estate: |
||||||||||||||||||||||||||||||||||||||||
| Land and construction |
$ | 496,539 | 7.9 | $ | 344,748 | 6.8 | $ | 262,643 | 6.4 | $ | 263,117 | 6.7 | $ | 193,004 | 5.2 | |||||||||||||||||||||||||
| Improved property |
2,376,972 | 37.9 | 1,911,633 | 37.7 | 1,682,817 | 41.1 | 1,649,802 | 42.3 | 1,665,341 | 44.9 | ||||||||||||||||||||||||||||||
|
|
|
|
|
|
|
|
|
|
|
|
|
|
|
|
|
|
|
|
|
|||||||||||||||||||||
| Total commercial real estate |
2,873,511 | 45.8 | 2,256,381 | 44.5 | 1,945,460 | 47.5 | 1,912,919 | 49.0 | 1,858,345 | 50.1 | ||||||||||||||||||||||||||||||
| Commercial and industrial |
1,088,118 | 17.4 | 737,878 | 14.5 | 638,410 | 15.6 | 556,249 | 14.3 | 478,025 | 12.9 | ||||||||||||||||||||||||||||||
|
|
|
|
|
|
|
|
|
|
|
|
|
|
|
|
|
|
|
|
|
|||||||||||||||||||||
| Total commercial loans |
3,961,629 | 63.2 | 2,994,259 | 59.0 | 2,583,870 | 63.1 | 2,469,168 | 63.3 | 2,336,370 | 63.0 | ||||||||||||||||||||||||||||||
|
|
|
|
|
|
|
|
|
|
|
|
|
|
|
|
|
|
|
|
|
|||||||||||||||||||||
| Residential real estate: |
||||||||||||||||||||||||||||||||||||||||
| Land and construction |
46,226 | 0.7 | 40,261 | 0.8 | 19,681 | 0.5 | 27,559 | 0.7 | 11,805 | 0.3 | ||||||||||||||||||||||||||||||
| Other mortgages |
1,337,164 | 21.4 | 1,207,539 | 23.8 | 909,089 | 22.2 | 863,245 | 22.1 | 781,897 | 21.0 | ||||||||||||||||||||||||||||||
| Home equity lines of credit |
508,359 | 8.1 | 416,889 | 8.2 | 330,031 | 8.1 | 284,687 | 7.3 | 277,226 | 7.5 | ||||||||||||||||||||||||||||||
|
|
|
|
|
|
|
|
|
|
|
|
|
|
|
|
|
|
|
|
|
|||||||||||||||||||||
| Total residential real estate |
1,891,749 | 30.2 | 1,664,689 | 32.8 | 1,258,801 | 30.8 | 1,175,491 | 30.1 | 1,070,928 | 28.8 | ||||||||||||||||||||||||||||||
| Consumer |
396,058 | 6.3 | 406,894 | 8.0 | 244,095 | 6.0 | 250,258 | 6.4 | 280,464 | 7.6 | ||||||||||||||||||||||||||||||
|
|
|
|
|
|
|
|
|
|
|
|
|
|
|
|
|
|
|
|
|
|||||||||||||||||||||
| Total retail loans |
2,287,807 | 36.5 | 2,071,583 | 40.8 | 1,502,896 | 36.8 | 1,425,749 | 36.5 | 1,351,392 | 36.4 | ||||||||||||||||||||||||||||||
|
|
|
|
|
|
|
|
|
|
|
|
|
|
|
|
|
|
|
|
|
|||||||||||||||||||||
| Total portfolio loans |
6,249,436 | 99.7 | 5,065,842 | 99.8 | 4,086,766 | 99.9 | 3,894,917 | 99.8 | 3,687,762 | 99.4 | ||||||||||||||||||||||||||||||
| Loans held for sale |
17,315 | 0.3 | 7,899 | 0.2 | 5,865 | 0.1 | 5,855 | 0.2 | 21,903 | 0.6 | ||||||||||||||||||||||||||||||
|
|
|
|
|
|
|
|
|
|
|
|
|
|
|
|
|
|
|
|
|
|||||||||||||||||||||
| Total loans |
$ | 6,266,751 | 100.0 | $ | 5,073,741 | 100.0 | $ | 4,092,631 | 100.0 | $ | 3,900,772 | 100.0 | $ | 3,709,665 | 100.0 | |||||||||||||||||||||||||
|
|
|
|
|
|
|
|
|
|
|
|
|
|
|
|
|
|
|
|
|
|||||||||||||||||||||
| LOAN COMMITMENTS |
||||||||||||||||||||||||||||||||||||||||
| Commercial real estate: |
||||||||||||||||||||||||||||||||||||||||
| Land and construction |
$ | 392,355 | 22.0 | $ | 380,704 | 24.6 | $ | 276,075 | 22.5 | $ | 305,600 | 26.4 | $ | 188,764 | 17.0 | |||||||||||||||||||||||||
| Improved property |
151,797 | 8.6 | 130,415 | 8.5 | 81,715 | 6.7 | 60,387 | 5.2 | 113,164 | 10.2 | ||||||||||||||||||||||||||||||
|
|
|
|
|
|
|
|
|
|
|
|
|
|
|
|
|
|
|
|
|
|||||||||||||||||||||
| Total commercial real estate |
544,152 | 30.6 | 511,119 | 33.1 | 357,790 | 29.2 | 365,987 | 31.6 | 301,928 | 27.2 | ||||||||||||||||||||||||||||||
| Commercial and industrial |
540,647 | 30.4 | 482,799 | 31.2 | 420,577 | 34.2 | 383,327 | 33.0 | 408,322 | 36.8 | ||||||||||||||||||||||||||||||
|
|
|
|
|
|
|
|
|
|
|
|
|
|
|
|
|
|
|
|
|
|||||||||||||||||||||
| Total commercial commitments |
1,084,799 | 61.1 | 993,918 | 64.3 | 778,367 | 63.4 | 749,314 | 64.6 | 710,250 | 64.0 | ||||||||||||||||||||||||||||||
|
|
|
|
|
|
|
|
|
|
|
|
|
|
|
|
|
|
|
|
|
|||||||||||||||||||||
| Residential real estate: |
||||||||||||||||||||||||||||||||||||||||
| Land and construction |
25,468 | 1.4 | 17,369 | 1.1 | 17,402 | 1.4 | 15,661 | 1.4 | 5,817 | 0.6 | ||||||||||||||||||||||||||||||
| Other mortgages |
37,418 | 2.1 | 17,191 | 1.1 | 9,227 | 0.8 | 5,461 | 0.5 | 10,226 | 0.9 | ||||||||||||||||||||||||||||||
| Home equity lines of credit |
447,993 | 25.2 | 369,152 | 23.9 | 297,888 | 24.2 | 268,302 | 23.1 | 256,324 | 23.1 | ||||||||||||||||||||||||||||||
|
|
|
|
|
|
|
|
|
|
|
|
|
|
|
|
|
|
|
|
|
|||||||||||||||||||||
| Total residential real estate |
510,879 | 28.8 | 403,712 | 26.1 | 324,517 | 26.4 | 289,424 | 25.0 | 272,367 | 24.6 | ||||||||||||||||||||||||||||||
| Consumer |
36,811 | 2.1 | 35,360 | 2.3 | 26,115 | 2.1 | 23,256 | 2.0 | 26,283 | 2.4 | ||||||||||||||||||||||||||||||
|
|
|
|
|
|
|
|
|
|
|
|
|
|
|
|
|
|
|
|
|
|||||||||||||||||||||
| Total retail commitments |
547,690 | 30.8 | 439,072 | 28.4 | 350,632 | 28.5 | 312,680 | 27.0 | 298,650 | 27.0 | ||||||||||||||||||||||||||||||
|
|
|
|
|
|
|
|
|
|
|
|
|
|
|
|
|
|
|
|
|
|||||||||||||||||||||
| Total portfolio commitments |
1,632,489 | 91.9 | 1,432,990 | 92.7 | 1,128,999 | 91.9 | 1,061,994 | 91.6 | 1,008,900 | 91.0 | ||||||||||||||||||||||||||||||
| Deposit overdraft limits |
126,517 | 7.1 | 106,252 | 6.9 | 95,965 | 7.8 | 96,291 | 8.3 | 93,654 | 8.5 | ||||||||||||||||||||||||||||||
| Commitments held for sale |
17,037 | 1.0 | 6,865 | 0.4 | 3,784 | 0.3 | 1,733 | 0.1 | 5,902 | 0.5 | ||||||||||||||||||||||||||||||
|
|
|
|
|
|
|
|
|
|
|
|
|
|
|
|
|
|
|
|
|
|||||||||||||||||||||
| Total loan commitments |
$ | 1,776,043 | 100.0 | $ | 1,546,107 | 100.0 | $ | 1,228,748 | 100.0 | $ | 1,160,018 | 100.0 | $ | 1,108,456 | 100.0 | |||||||||||||||||||||||||
|
|
|
|
|
|
|
|
|
|
|
|
|
|
|
|
|
|
|
|
|
|||||||||||||||||||||
| Letters of credit included above |
$ | 32,907 | 1.9 | $ | 27,408 | 1.8 | $ | 23,362 | 1.9 | $ | 20,447 | 1.8 | $ | 20,078 | 1.8 | |||||||||||||||||||||||||
|
|
|
|
|
|
|
|
|
|
|
|
|
|
|
|
|
|
|
|
|
|||||||||||||||||||||
50
Table of Contents
Total portfolio loans increased $1,183.6 million or 23.4% from December 31, 2015 to December 31, 2016, primarily due to the acquisition of YCB that represented $1,011.7 million or 20.0% in growth, along with organic growth of $171.9 million or 3.4%. On the merger date, YCB’s loans (including loans held for sale) were recorded at their estimated fair value of $1,014.0 million, with $1,006.9 million purchased without deteriorated credit quality from origination. Loans acquired with deteriorated credit quality having a book value of $11.1 million and contractually required payments of $13.3 million were recorded at their estimated fair value of $7.1 million. The difference between the amount of loan growth attributed to YCB at year-end and the recorded amount on the merger date represents scheduled amortization, refinancings and payoffs. The acquisition of YCB also changed the composition of loans as they had a higher percentage of CRE-improved property and C&I loans than WesBanco.
CRE represents a significant component of the loan portfolio at 45.8%, which was a 1.3% increase for the year. CRE—land and construction loan balances increased $151.8 million or 44.0% from December 31, 2015 to December 31, 2016. The YCB acquisition accounted for $84.6 million or 24.5% of this growth while organic growth was $67.1 million or 19.5%. CRE—improved property loans increased $465.3 million or 24.3% from December 31, 2015 to December 31, 2016, primarily from the acquisition of YCB which contributed $424.7 million or 22.2%, and organic growth of $40.6 million or 2.1%.
C&I loans increased $350.2 million or 47.5% from December 31, 2015 to December 31, 2016. YCB contributed $273.0 million or 37.0% of the growth, and $77.2 million or 10.5% was organic growth. The organic growth was achieved through the addition of lending personnel and increased business development efforts that resulted in obtaining new customer relationships, new opportunities created by the acquisitions of Fidelity in November 2012 and ESB in February 2015, both of which resulted in an expanded presence in the greater Pittsburgh MSA and western Pennsylvania market. The portfolio also benefited from increased business activity due to generally improved economic conditions in all markets.
Residential real estate mortgage loans increased $135.6 million or 10.9% from December 31, 2015 to December 31, 2016. The portfolio growth came from YCB, providing $145.0 million or 11.6%, while the legacy portfolio declined $9.5 million or 0.7%. The decline in the legacy portfolio was due to a competitive rate environment, factors related to the implementation of new mortgage disclosure and closing rules, and an increase in mortgage refinancing activity. Approximately 32% of mortgages originated in 2016 were refinances of existing mortgages compared to 25% in 2015. WesBanco retained approximately 57% of mortgages originated in 2016 for the portfolio compared to 56% in 2015.
HELOC loans increased $91.5 million or 21.9% from December 31, 2015 to December 31, 2016. YCB provided $59.1 million or 14.1% of this growth, while organic growth was $32.4 million or 7.8%. This growth was achieved primarily through regular marketing activities and a competitive HELOC product containing features that customers found desirable, even though product pricing increased somewhat during the year.
Consumer loans decreased $10.8 million or 2.7% from December 31, 2015 to December 31, 2016. YCB provided an increase of $25.2 million or 6.2% while the legacy portfolio declined $36.0 million or 8.9%. The decline in legacy portfolio balances was in the indirect loan portfolio for new and used auto and truck financing and primarily due to two rate increases during 2016, and other product pricing changes, along with competitive factors.
Total loan commitments increased $229.9 million or 14.9% from December 31, 2015 to December 31, 2016. Commitments in the HELOC portfolio increased approximately $78.8 million, C&I commitments increased $57.8 million and total CRE commitments increased $33.0 million.
Geographic Distribution—WesBanco extends credit primarily within the market areas where it has branch offices. Loans outside of these markets are generally only made to established customers that have other business relationships with WesBanco in its markets. Loans outside of WesBanco’s markets represented less than 2% of
51
Table of Contents
total loans at December 31, 2016 and December 31, 2015. These loans consist primarily of CRE-land and construction loans, residential real estate loans for second residences or vacation homes, consumer purpose lines of credit to wealth management customers and automobile loans to family members of local customers. Management does not plan to significantly increase out-of-market loans.
The geographic distribution of the loan portfolio, excluding deposit overdraft limits and loans held for sale, is summarized in Table 12.
TABLE 12. GEOGRAPHIC DISTRIBUTION OF LOANS
| December 31, 2016 (1) | |||||||||||||||||||||||||||||||||||
| Commercial Real Estate | Commercial and Industrial |
Residential Real Estate |
Home Equity Lines |
||||||||||||||||||||||||||||||||
| (percentage of exposure, rounded to nearest whole |
Land and Construction |
Improved Property |
Consumer | Total | |||||||||||||||||||||||||||||||
| Upper Ohio Valley MSAs |
4 | % | 9 | % | 22 | % | 11 | % | 17 | % | 21 | % | 12 | % | |||||||||||||||||||||
| Morgantown, WV MSA |
4 | 5 | 6 | 4 | 6 | 5 | 5 | ||||||||||||||||||||||||||||
| Parkersburg, WV-Marietta, OH MSA |
1 | 5 | 2 | 3 | 6 | 6 | 4 | ||||||||||||||||||||||||||||
| Other West Virginia Locations |
4 | 7 | 6 | 10 | 12 | 21 | 8 | ||||||||||||||||||||||||||||
| Pittsburgh, PA MSA & Western Pennsylvania |
10 | 20 | 17 | 29 | 18 | 26 | 21 | ||||||||||||||||||||||||||||
| Columbus, OH MSA |
29 | 13 | 9 | 9 | 7 | 2 | 12 | ||||||||||||||||||||||||||||
| Western Ohio MSAs |
15 | 13 | 4 | 12 | 10 | 2 | 10 | ||||||||||||||||||||||||||||
| Other Ohio Locations |
9 | 9 | 8 | 11 | 12 | 9 | 9 | ||||||||||||||||||||||||||||
| Louisville KY—Jefferson County MSA |
12 | 12 | 20 | 4 | 6 | 3 | 11 | ||||||||||||||||||||||||||||
| Other Indiana Locations |
0 | 1 | 1 | 0 | 0 | 0 | 1 | ||||||||||||||||||||||||||||
| Other Kentucky Locations |
5 | 5 | 4 | 5 | 6 | 3 | 5 | ||||||||||||||||||||||||||||
| Adjacent States & Outside-of-Market |
7 | 1 | 1 | 2 | 0 | 2 | 2 | ||||||||||||||||||||||||||||
|
|
|
|
|
|
|
|
|
|
|
|
|
|
|
||||||||||||||||||||||
| Total |
100 | % | 100 | % | 100 | % | 100 | % | 100 | % | 100 | % | 100 | % | |||||||||||||||||||||
|
|
|
|
|
|
|
|
|
|
|
|
|
|
|
||||||||||||||||||||||
| (1) | Real estate secured loans are categorized based on the address of the collateral. All other loans are categorized based on the borrower’s address. |
The Upper Ohio Valley MSAs include the Wheeling, West Virginia and Weirton, West Virginia-Steubenville, Ohio MSAs. Other West Virginia locations include the Fairmont-Clarksburg and Charleston MSAs as well as communities that are not located within an MSA primarily in the northern, central and eastern parts of the state. The western Ohio MSAs include the Dayton-Springfield and the Cincinnati-Middletown MSAs. Other Ohio locations include communities in Ohio that are not located within an MSA, the majority of which are located in southeastern Ohio. Other Indiana locations include communities in Indiana that are not located within an MSA, the majority of which are located in southern Indiana. Other Kentucky locations include the Louisville, Lexington-Fayette and Elizabethtown KY MSAs along with other Kentucky locations that are not located within an MSA. Adjacent states include parts of Maryland and Tennessee that are within close proximity to WesBanco’s markets. Outside-of-market loans consist of loans in all other locations not included in any of the other defined areas and have remained relatively unchanged overall from 2014.
The only significant change in the geographic distribution of loans from December 31, 2015 to December 31, 2016 was the overall increase in loans within the Louisville KY-Jefferson County MSA and other locations in Indiana and Kentucky due to the acquisition of YCB.
CREDIT RISK
The risk that borrowers will be unable or unwilling to repay their obligations is inherent in all lending activities. Repayment risk can be impacted by external events such as adverse economic conditions, social and political influences that impact entire industries or major employers, individual loss of employment or other
52
Table of Contents
personal calamities and changes in interest rates. This inherent risk may be further exacerbated by the terms and structure of each loan as well as potential concentrations of risk. The primary goal of managing credit risk is to minimize the impact of all of these factors on the quality of the loan portfolio.
Credit risk is managed through the initial underwriting process as well as through ongoing monitoring and administration of the portfolio. Credit policies establish standard underwriting guidelines for each type of loan and require an appropriate evaluation of the credit characteristics of each borrower. This evaluation focuses on the sufficiency and sustainability of the primary source of repayment, the adequacy of collateral, if any, as a secondary source of repayment and other factors unique to each type of loan that may increase or mitigate their risk. The manner and degree of monitoring and administration of the portfolio varies by type and size of loan.
Credit risk is also managed by closely monitoring delinquency levels and trends and initiating collection efforts at the earliest stage of delinquency. WesBanco also monitors general economic conditions, including unemployment, housing activity and real estate values in its markets. Underwriting standards are modified when appropriate based on market conditions, the performance of one or more loan categories, and other external factors. An independent loan review function also performs periodic reviews of the portfolio to assess the adequacy and effectiveness of underwriting, loan documentation and portfolio administration.
Each category of loans contain distinct elements of risk that impact the manner in which those loans are underwritten, structured, documented, administered and monitored. Customary terms and underwriting practices, together with specific risks associated with each category of loans and WesBanco’s processes for managing those risks are discussed in the remainder of this section.
Commercial Loans—The commercial portfolio consists of loans to a wide range of business enterprises. The average commercial loan approximates $400,000 at December 31, 2016 compared to $412,000 at December 31, 2015. However, many commercial loans are for larger amounts and often involve multiple loans to one borrower or a group of related borrowers, therefore the potential for loss on any single transaction can be significantly greater for commercial loans than for retail loans. Commercial loan risk is mitigated by limiting total credit exposure to individual borrowers or groups of borrowers, industries and geographic markets and by requiring appropriate collateral or guarantors.
Commercial loans are monitored for potential concentrations of loans to any one borrower or group of related borrowers. At December 31, 2016, WesBanco’s legal lending limit to any single borrower or their related interests approximated $130 million. The ten largest commercial relationships in total ranged from $450 million to $500 million throughout 2016 and 2015, but only four relationships exceeded $50 million at December 31, 2016. These large relationships generally consist of more than one loan to a borrower or their related entities. The single largest relationship exposure approximated $65 million at December 31, 2016 and consists of multiple loans to a customer in the retail sector. The largest CRE loan exposure by property type and industry are set forth in tables 14 and 16.
Commercial loans, including renewals and extensions of maturity, are approved within a framework of individual lending authorities based on the total credit exposure of the borrower. Loans with credit exposure up to $500,000 are approved by underwriters that are not responsible for loan origination. Loans with credit exposure greater than $500,000 minimally require the approval of a senior commercial banking officer, and credit exposures greater than $1.5 million require approval of a credit officer that is not responsible for loan origination. Credit exposures greater than $10 million require approval of a credit committee comprised of executive management, directors, and other qualified persons that are not responsible for loan origination. Underwriters and credit officers do not receive incentive compensation based on loan origination volume. Senior commercial banking officers receive incentive compensation based on multiple factors that include loan origination, net growth in outstanding loan balances, fees, credit quality, and portfolio administration requirements.
53
Table of Contents
CRE – land and construction consists of loans to finance land for development, investment, use in a commercial business enterprise, agricultural or minerals extraction; construction of residential dwellings for resale, multi-family apartments and other commercial buildings that may be owner-occupied or income generating investments for the owner. Construction loans generally are made only when WesBanco also commits to the permanent financing of the project, has a takeout commitment from another lender for the permanent loan, or the loan is expected to be repaid from the sale of subdivided property. However, even if WesBanco has a takeout commitment, construction loans are underwritten as if WesBanco will retain the loan upon completion of construction. In recent years, due to the low interest rate environment and low property capitalization rates, many construction loans that did not have a takeout commitment when the loan originated have been sold or refinanced in the secondary market immediately upon completion of construction at times, resulting in significant unscheduled payoffs of loans.
CRE – improved property loans consist of loans to purchase or refinance owner-occupied and investment properties. Owner-occupied CRE consists of loans to borrowers in a diverse range of industries and property types. Investment properties include multi-family apartment buildings, 1-to-4 family rental units, and various types of commercial buildings that are rented or leased to unrelated parties of the owner.
C&I loans consist of revolving lines of credit to finance accounts receivable, inventory and other general business purposes; term loans to finance fixed assets other than real estate, and letters of credit to support trade, insurance or governmental requirements for a variety of businesses. Most C&I borrowers are privately-held companies with annual sales up to $100 million.
CRE – land and construction loans require payment of interest only during the construction period, with initial terms ranging from six months to up to three years for larger, multiple-phase projects such as residential housing developments and large scale commercial projects. Interest rates are often fully floating based on an appropriate index but may also be structured in the same manner as the interest rate that will apply to the permanent loan upon completion of construction. Interest during the construction period is typically included in the project costs and therefore is often funded by loan advances. Advances are monitored to ensure that the project is at the appropriate stage of completion with each advance and that interest reserves are not exhausted prior to completion of the project. In the event a project is not completed within the initial term, the loan is re-underwritten at maturity but interest beyond the initial term must be paid by the borrower and in some instances an additional interest reserve is required as a condition of extending the maturity. Upon completion of construction, the loan is converted to permanent financing and reclassified to CRE—improved property.
CRE – improved property loans generally require monthly principal and interest payments based on amortization periods ranging from ten to twenty-five years depending on the type, age and condition of the property. Loans with amortization periods exceeding twenty years typically also have a maturity date or call option of ten years or less. Interest rates are generally adjustable ranging from one to five years based on an appropriate index of comparable duration. Interest rates may also be fixed for longer than five years but the borrower may be required to enter into an interest rate derivative contract that converts WesBanco’s rate to an adjustable rate.
C&I term loans secured by equipment and other types of collateral generally require monthly principal and interest payments based on amortization periods up to ten years depending on the estimated useful life of the collateral with interest rates that may be fixed for the term of the loan or adjustable ranging from one to seven years based on an appropriate index.
Commercial lines and letters of credit are generally categorized as C&I but may also be categorized as CRE—improved property loans if they are secured primarily by real estate. Lines of credit typically require payment of interest only with principal due on demand or at maturity. Interest rates on lines of credit are generally fully adjustable based on an appropriate short-term index. Letters of credit typically require a periodic fee with principal and interest due on demand in the event the beneficiary of the letter requests an advance on the
54
Table of Contents
commitment. Lines of credit may also include a fee based on the amount of the line that is not advanced. Lines and letters of credit are generally renewable or may be cancelled annually by WesBanco but may also be committed for up to three years when appropriate. Letters of credit may also require WesBanco to notify the beneficiary within a specified time in the event WesBanco does not intend to renew or extend the commitment.
Table 13 summarizes the distribution of maturities by rate type for all commercial loans.
TABLE 13. MATURITIES OF COMMERCIAL LOANS
| December 31, 2016 | ||||||||||||||||||||||||||||||||
| Fixed Rate Loans | Variable Rate Loans | |||||||||||||||||||||||||||||||
| (in thousands) |
In One Year or Less |
After One Year Through Five Years |
After Five Years |
Total | In One Year or Less |
After One Year Through Five Years |
After Five Years |
Total | ||||||||||||||||||||||||
| Commercial real estate: |
||||||||||||||||||||||||||||||||
| Land and construction |
$ | 47,500 | $ | 44,308 | $ | 21,112 | $ | 112,920 | $ | 80,134 | $ | 189,478 | $ | 114,007 | $ | 383,619 | ||||||||||||||||
| Improved property |
67,923 | 309,380 | 293,055 | 670,358 | 88,349 | 302,382 | 1,315,883 | 1,706,614 | ||||||||||||||||||||||||
| Commercial and industrial |
34,093 | 179,072 | 191,175 | 404,340 | 349,326 | 117,412 | 217,040 | 683,778 | ||||||||||||||||||||||||
|
|
|
|
|
|
|
|
|
|
|
|
|
|
|
|
|
|||||||||||||||||
| Total commercial loans |
$ | 149,516 | $ | 532,760 | $ | 505,342 | $ | 1,187,618 | $ | 517,809 | $ | 609,272 | $ | 1,646,930 | $ | 2,774,011 | ||||||||||||||||
|
|
|
|
|
|
|
|
|
|
|
|
|
|
|
|
|
|||||||||||||||||
The primary factors that are considered in underwriting CRE—land and construction loans are the overall viability of each project, the experience and financial capacity of the developer or builder to successfully complete the project, market absorption rates and property values. These loans also have the unique risk that the developer or builder may not complete the project, or not complete it on time or within budget. Risk is generally mitigated by extending credit to developers and builders with established reputations who operate in WesBanco’s markets and have the liquidity or other resources to absorb unanticipated increases in the cost of a project or longer than anticipated absorption, periodically inspecting construction in progress, and disbursing the loan at specified stages of completion. Certification of completed construction by a licensed architect or engineer and performance and payment bonds may also be required for certain types of projects. Since speculative projects are inherently riskier, WesBanco may require a specified percentage of pre-sales for land and residential development or pre-lease commitments for investment property before construction can begin.
The primary factors that are considered in underwriting investment real estate are the net rental income generated by the property, the composition of the tenants occupying the property, and the terms of leases, all of which may vary depending on the specific type of property. Other factors that are considered include the overall financial capacity of the investors and their experience owning and managing investment property.
Repayment of owner-occupied loans must come from the cash flow generated by the occupant’s commercial business. Therefore, the primary factors that are considered in underwriting owner-occupied CRE and C&I loans are the historical and projected earnings, cash flow, capital resources, liquidity and leverage of the business. Other factors that are considered for their potential impact on repayment capacity include the borrower’s industry, competitive advantages and disadvantages, demand for the business’s products and services, business model viability, quality, experience and depth of management, and external influences that may impact the business such as general economic conditions and social or political changes.
The type, age, condition and location of real estate as well as any environmental risks associated with the property are considered for both owner-occupied and investment CRE. Environmental risk is mitigated by requiring assessments performed by qualified inspectors whenever the current or previous uses of the property or any adjacent properties are likely to have resulted in contamination of the property financed. Risk is further mitigated by requiring borrowers to have adequate down payments or cash equity, thereby limiting the loan amount in relation to the lower of the cost or the market value of the property, unless there are sufficient mitigating factors that would reduce the risk of a higher loan-to-value. Market values are determined by
obtaining current appraisals or evaluations, whichever is appropriate or required by banking regulations based on
55
Table of Contents
the amount financed prior to the loan being made. New appraisals or evaluations may be obtained throughout the life of each loan to more accurately assess current market value when the initial term of a loan is being extended, market conditions indicate that the property value may have declined, and/or the primary source of repayment is no longer adequate to repay the loan under its original terms.
CRE loan-to-value (“LTV”) ratios are generally limited to the maximum percentages prescribed by WesBanco credit policy or banking regulations which range from 65% for unimproved land to 85% for improved commercial property. Regulatory guidelines also limit the aggregate of CRE loans that exceed prescribed LTV ratios to 30% of the Bank’s total risk-based capital. The aggregate of all CRE loans and loan commitments that exceeded the regulatory guidelines approximated $109 million or 12% of the Bank’s total risk-based capital at December 31, 2016 compared to $99 million or 13% at December 31, 2015. Regardless of credit policy or regulatory guidelines, lower LTV ratios may be required for certain types of properties or when other factors exist that increase the risk of volatility in market values such as single or special use properties that cannot be easily converted to other uses or may have limited marketability. Conversely, higher LTV ratios may be acceptable when there are other factors to adequately mitigate the risk.
The type and amount of collateral for C&I loans varies depending on the overall financial strength of the borrower, the amount and terms of the loan, and available collateral or guarantors. Loans secured by bank deposit accounts and marketable securities represent the lowest risk. Marketable securities are subject to changes in market value and are monitored regularly to ensure they remain appropriately margined. The total of C&I exposure secured by bank deposit accounts and marketable securities approximate $258 million at December 31, 2016 compared to $163 million at December 31, 2015. Unsecured C&I loans, which represent the highest risk, approximated $150 million at December 31, 2016 compared to $113 million at December 31, 2015. Unsecured credit is only extended to those borrowers that exhibit consistently strong repayment capacity and the financial condition to withstand a temporary decline in their operating cash flows. The single largest unsecured exposure is $7.5 million. Collateral other than real estate that fluctuates with business activity, such as accounts receivable and inventory, may also be subject to regular reporting and certification by the borrower and, in some instances, independent inspection or verification by WesBanco. Approximately $110 million or 6.7% of C&I exposure at December 31, 2016 is secured solely by accounts receivable and inventory compared to $98 million or 8.6% at December 31, 2015. Another $144 million or 8.8% of C&I exposure is secured by equipment or motorized vehicles at December 31, 2016 compared to $110 million or 9.7% at December 31, 2015. The increase in accounts receivable, inventory and equipment financing is a result of the Bank’s emphasis on growing the C&I category of loans in 2016. The remainder of the C&I portfolio is secured by multiple types of collateral, which at times includes real estate that is taken as collateral for reasons other than its value.
Most commercial loans are originated directly by WesBanco. Participation in loans originated by other financial institutions represent $280 million or 5.6% of total commercial loans at December 31, 2016 compared to $225 million or 5.6% at December 31, 2015. Included in this total are Shared National Credits of $53 million at December 31, 2016 and $71 million at December 31, 2015. Shared National Credits are defined as loans in excess of $20 million that are financed by three or more lending institutions. WesBanco performs its own customary credit evaluation and underwriting before purchasing loan participations. The credit risk associated with these loans is similar to that of loans originated by WesBanco, but additional risk may arise from the limited ability to control the actions of the lead, agent or servicing institution.
The commercial portfolio is monitored for potential concentrations of credit risk by market, type of lending, CRE property type, C&I and owner-occupied CRE by industry, investment CRE dependence on common tenants and industries or property types that are similarly impacted by external factors. Total credit exposure by real estate property type and industry sectors are summarized in Tables 14 and 16.
The global decline in coal, oil and natural gas prices have both a positive impact on the commercial portfolio by lowering all borrowers’ energy costs but may also result in a reduction in coal, oil and gas activity that may adversely impact certain industries or property types. At December 31, 2016, total exposure to core
56
Table of Contents
energy industries such as drilling, extraction, pipeline construction, mining equipment, investment real estate with energy-related tenants and other related support activities approximated $51 million or 0.6% of the total loan portfolio as compared to $73.0 million or 1.1% of the total loan portfolio at December 31, 2015. Exposure to ancillary industries such as utility distribution and transportation, engineering services, manufacturers and retailers of other heavy equipment used in core energy industries, approximates an additional $78 million in exposure or 1.0% of the total loan portfolio as compared to $57.0 million or 0.9% of the total loan portfolio at December 31, 2015. The largest exposure to any one borrower in either core energy or ancillary industries was $9.8 million to a company that leases industrial/workshop facilities to tenants in the oil and gas production sector. Lodging properties located in the shale gas areas that may be impacted by a reduction in shale gas activities represent an additional $133 million of exposure at December 31, 2016 as compared to $148 million at December 31, 2015. Not all borrowers in these categories will be impacted by a further reduction in energy sector activity, and some may not be at all dependent or may be able to replace revenue associated with this industry.
TABLE 14. CRE EXPOSURE BY PROPERTY TYPE
| December 31, 2016 | |||||||||||||||||||||||||||||||||||||||||||||
| CRE Land and Construction |
CRE Improved Investment |
CRE Improved Owner Occupied |
|||||||||||||||||||||||||||||||||||||||||||
| (dollars in thousands) |
Loan Balance |
Loan Commitment |
Loan Balance |
Loan Commitment |
Loan Balance |
Loan Commitment |
Total Exposure |
Largest Loan (1) |
% of Capital (2) | ||||||||||||||||||||||||||||||||||||
| Land |
$ | 97,334 | $ | 47,505 | $ | 18,584 | $ | 3,706 | $ | 2,881 | $ | 353 | $ | 170,363 | $ | 13,000 | 19.0 | ||||||||||||||||||||||||||||
| 1-to-4 family |
42,383 | 36,247 | 175,116 | 5,674 | 1,119 | 285 | 260,824 | 12,800 | 29.1 | ||||||||||||||||||||||||||||||||||||
| Multi-family |
125,613 | 186,470 | 369,504 | 13,983 | — | — | 695,570 | 30,500 | 77.6 | ||||||||||||||||||||||||||||||||||||
| Retail |
48,825 | 18,506 | 268,507 | 6,032 | 55,674 | 3,221 | 400,765 | 16,473 | 44.7 | ||||||||||||||||||||||||||||||||||||
| Office |
64,864 | 29,101 | 213,584 | 12,786 | 95,324 | 4,007 | 419,666 | 17,707 | 46.8 | ||||||||||||||||||||||||||||||||||||
| Industrial |
7,308 | 1,504 | 50,664 | 9,626 | 68,281 | 15,270 | 152,653 | 10,000 | 17.0 | ||||||||||||||||||||||||||||||||||||
| Lodging |
33,563 | 5,493 | 200,113 | 12,682 | — | — | 251,851 | 20,691 | 28.1 | ||||||||||||||||||||||||||||||||||||
| Senior living |
21,730 | 9,173 | 48,494 | 163 | 40,336 | 238 | 120,134 | 20,123 | 13.4 | ||||||||||||||||||||||||||||||||||||
| Hospital |
3,481 | 5,448 | 754 | — | 28,418 | 110 | 38,211 | 11,216 | 4.3 | ||||||||||||||||||||||||||||||||||||
| Self-storage |
— | — | 19,972 | 1,170 | 382 | 543 | 22,067 | 3,350 | 2.5 | ||||||||||||||||||||||||||||||||||||
| Eating place |
2,947 | 850 | 20,319 | 24 | 26,030 | 1,579 | 51,749 | 3,880 | 5.8 | ||||||||||||||||||||||||||||||||||||
| Gas station |
1,835 | 1,304 | 10,257 | 107 | 58,970 | 121 | 72,594 | 5,701 | 8.1 | ||||||||||||||||||||||||||||||||||||
| Recreational |
— | — | 1,795 | — | 14,228 | 228 | 16,251 | 5,484 | 1.8 | ||||||||||||||||||||||||||||||||||||
| Dormitory |
13,934 | 25,216 | 33,266 | 428 | — | — | 72,844 | 16,000 | 8.1 | ||||||||||||||||||||||||||||||||||||
| House of worship |
796 | 261 | 3,052 | 305 | 44,562 | 2,321 | 51,297 | 4,570 | 5.7 | ||||||||||||||||||||||||||||||||||||
| Other special use |
2,089 | 1,127 | 21,268 | 201 | 72,172 | 19,400 | 116,257 | 17,422 | 13.0 | ||||||||||||||||||||||||||||||||||||
| Mixed use |
28,658 | 22,187 | 235,767 | 8,307 | 132,817 | 10,455 | 438,191 | 21,021 | 48.9 | ||||||||||||||||||||||||||||||||||||
| Unclassified |
1,179 | 1,963 | 21,626 | 16,682 | 23,136 | 1,790 | 66,376 | 15,000 | 7.4 | ||||||||||||||||||||||||||||||||||||
|
|
|
|
|
|
|
|
|
|
|
|
|
|
|
|
|
|
|
||||||||||||||||||||||||||||
| Total |
$ | 496,539 | $ | 392,355 | $ | 1,712,642 | $ | 91,876 | $ | 664,330 | $ | 59,921 | $ | 3,417,663 | $ | 30,500 | 381.2 | ||||||||||||||||||||||||||||
|
|
|
|
|
|
|
|
|
|
|
|
|
|
|
|
|
|
|
||||||||||||||||||||||||||||
| (1) | Largest loan represents the largest contractual obligation of WesBanco, which may not be fully funded. |
| (2) | Bank total risk-based capital. |
Multi-family apartments represent the single largest category of CRE. Including construction loans, multi-family apartment exposure increased 2.4% from $679 million at December 31, 2015 to $696 million at December 31, 2016. This exposure represent 77.6% of total risk-based capital at December 31, 2016 compared to 91.3% at December 31, 2015. Approximately 15% of the total multi-family exposure is for new construction projects, many of which are expected to be refinanced in the secondary market over the next 24 months. During 2016, a number of properties refinanced in the secondary market immediately upon completion and prior to stabilization. These early payoffs enabled WesBanco to finance new multi-family projects without significantly increasing multi-family exposure, which was management’s objective. The central Ohio market represents approximately 37% of the total multi-family apartment exposure and the Pittsburgh/Western PA market represents approximately 19% of the total exposure.
57
Table of Contents
Mixed use properties exposure of $438 million is the second largest category of CRE and represents 48.9% of total risk-based capital at December 31, 2016 compared to 30.4% at December 31, 2015. This category of loans include various combinations of other property types such as retail and office in one facility. Approximately 46% of the total exposure is in the Kentucky, southern Indiana market with 25% in the Pittsburgh, Western PA market. Approximately $114 million of mixed use properties also include multi-family apartments in addition to the multi-family exposure summarized above. Other special use properties consist of facilities that have a unique purpose other than those identified in Table 14, and includes properties such as funeral homes, carwashes, other auto care facilities, fire stations, parking garages, other municipal service facilities and school buildings. Unclassified properties are generally smaller, general purpose buildings and store fronts that can typically be adapted to any number of potential commercial uses.
Office buildings represent the third largest category of CRE with total exposure of $420 million. This represents 46.8% of total risk-based capital compared to 39.5% at December 31, 2015. Approximately 25% of the office building exposure is in the Central Ohio market with 20% located in the Pittsburgh/Western PA market.
Retail property is the fourth largest category, which includes shopping centers, single-tenant buildings, and neighborhood retail store fronts. With $401 million in total exposure, this category represents 44.7% of total risk-based capital at December 31, 2016 as compared to 43.5% at December 31, 2015. There is no known concentration of loans secured by retail investment property occupied by a common tenant or group of tenants in the same industry. Approximately 25% of the retail exposure is in the Central Ohio market with 24% in the Western Ohio market.
In addition to the methods in which WesBanco monitors the CRE portfolio for possible concentrations of risk, the regulatory agencies use a two-tiered assessment to determine whether a bank has an overall concentration of CRE lending as a percentage of bank total risk-based capital. Loan balances used to determine compliance are based upon Call Report instructions and therefore do not necessarily match the balances displayed in Table 14. The first tier measures loans for land, land development, residential and commercial construction. This tier totals $528 million or 58.9% of risk based capital at December 31, 2016 compared to $375 million or 50.4%, respectively, at December 31, 2015. The regulatory guidance for the first tier is 100.0% of total risk-based capital. The second tier measures loans included in the first tier plus multi-family apartments and other commercial investment property, along with improved owner-occupied real estate. This tier totals $2,735 million or 305.0% of total risk-based capital at December 31, 2016 compared to $2,121 million or 285.1% at December 31, 2015. The acquisition of YCB contributed approximately $520 million of the $613 million increase. The regulatory guidance for the second tier is 300% of total risk-based capital. If the second tier measure excluded improved owner-occupied real estate, the bank would have $2,058 million or 229.6% of the Bank’s total risk-based capital. The regulatory agencies also consider whether a bank’s CRE portfolio has increased by 50% or more within the prior thirty-six months of the assessment date. All CRE exposure increased $940 million or 34.4% for the thirty-six month period ended December 31, 2016, including acquisition-related growth.
Basel III requires banks to identify High Volatility Commercial Real Estate (“HVCRE”) loans in their portfolios. These loans are subject to 150% weighting in the risk-based capital calculation effective January 1, 2015. These regulations require, among other things, that all CRE loans (either investment or owner-occupied) for acquisition, development or construction that are not in permanent amortizing loan status, meet the statutory LTV guidelines, have a minimum contributed equity of 15% in cash or marketable securities, and the loan documentation must contain a requirement that the initial capital injection remain in the project until the loan has converted to permanent financing or is paid in full. The bank has approximately $341 million in HVCRE exposure representing 10.0% of total CRE exposure and 38% of total risk-based capital at December 31, 2016. This compares to $409 million in HVCRE exposure representing 14.8% of total CRE exposure and 55% of total risk-based capital at December 31, 2015. These loans are classified as HVCRE primarily for legal documentation reasons rather than contributed equity being less than 15%.
58
Table of Contents
TABLE 15. C&I AND OWNER-OCCUPIED CRE EXPOSURE BY INDUSTRY
| December 31, 2016 | |||||||||||||||||||||||||||||||||||
| C&I | CRE Improved Owner Occupied Property |
||||||||||||||||||||||||||||||||||
| (dollars in thousands) |
Loan Balance |
Loan Commitment |
Loan Balance |
Loan Commitment |
Total Exposure |
Largest Loan (1) |
% of Capital (2) | ||||||||||||||||||||||||||||
| Agriculture and farming |
$ | 6,263 | $ | 4,074 | $ | 1,754 | $ | 500 | $ | 12,591 | $ | 2,500 | 1.4 | ||||||||||||||||||||||
| Energy—oil and gas |
7,756 | 5,220 | 7,893 | — | 20,869 | 3,000 | 2.3 | ||||||||||||||||||||||||||||
| Energy—mining and utilities |
39,150 | 3,605 | 128 | — | 42,883 | 8,835 | 4.8 | ||||||||||||||||||||||||||||
| Construction—general |
40,899 | 54,786 | 15,957 | 19,067 | 130,709 | 10,000 | 14.6 | ||||||||||||||||||||||||||||
| Construction—trades |
37,408 | 35,221 | 12,871 | 972 | 86,472 | 12,500 | 9.6 | ||||||||||||||||||||||||||||
| Manufacturing—primary metals |
17,349 | 26,825 | 6,288 | 201 | 50,663 | 32,000 | 5.7 | ||||||||||||||||||||||||||||
| Manufacturing—other |
111,854 | 70,521 | 28,194 | 2,102 | 212,671 | 19,760 | 23.7 | ||||||||||||||||||||||||||||
| Wholesale and distribution |
49,131 | 32,333 | 14,887 | 1,650 | 98,001 | 10,000 | 10.9 | ||||||||||||||||||||||||||||
| Retail—automobile dealers |
31,455 | 13,823 | 16,255 | 1,062 | 62,595 | 10,000 | 7.0 | ||||||||||||||||||||||||||||
| Retail—other sales |
43,144 | 18,435 | 98,104 | 2,671 | 162,354 | 10,000 | 18.1 | ||||||||||||||||||||||||||||
| Transportation and warehousing |
29,160 | 9,793 | 22,301 | 811 | 62,065 | 4,353 | 6.9 | ||||||||||||||||||||||||||||
| Information and communications |
2,890 | 387 | 1,816 | — | 5,093 | 1,107 | 0.6 | ||||||||||||||||||||||||||||
| Finance and insurance |
52,200 | 84,078 | 6,181 | 396 | 142,855 | 15,000 | 15.9 | ||||||||||||||||||||||||||||
| Equipment leasing |
26,590 | 15,845 | 10,403 | — | 52,838 | 5,750 | 5.9 | ||||||||||||||||||||||||||||
| Services—real estate |
118,617 | 23,077 | 99,612 | 5,152 | 246,458 | 18,037 | 27.5 | ||||||||||||||||||||||||||||
| Services—business and professional |
59,416 | 41,264 | 18,935 | 1,299 | 120,914 | 6,000 | 13.5 | ||||||||||||||||||||||||||||
| Services—personal and other |
20,335 | 5,043 | 51,723 | 12,135 | 89,236 | 17,422 | 10.0 | ||||||||||||||||||||||||||||
| Schools and education services |
74,989 | 3,820 | 10,481 | 583 | 89,873 | 12,681 | 10.0 | ||||||||||||||||||||||||||||
| Healthcare—medical practitioners |
23,051 | 8,368 | 43,689 | 658 | 75,766 | 17,707 | 8.5 | ||||||||||||||||||||||||||||
| Healthcare—hospitals and other |
61,364 | 21,933 | 73,296 | 1,024 | 157,617 | 25,976 | 17.6 | ||||||||||||||||||||||||||||
| Entertainment and recreation |
5,767 | 4,490 | 17,323 | 232 | 27,812 | 5,484 | 3.1 | ||||||||||||||||||||||||||||
| Restaurants and lodging |
38,533 | 5,157 | 30,450 | 1,822 | 75,962 | 5,456 | 8.5 | ||||||||||||||||||||||||||||
| Religious organizations |
34,953 | 15,831 | 43,404 | 2,321 | 96,509 | 15,000 | 10.8 | ||||||||||||||||||||||||||||
| Government |
68,095 | 3,372 | 9,468 | 4 | 80,939 | 9,118 | 9.0 | ||||||||||||||||||||||||||||
| Unclassified |
87,749 | 33,346 | 22,917 | 5,259 | 149,271 | 10,000 | 16.6 | ||||||||||||||||||||||||||||
|
|
|
|
|
|
|
|
|
|
|
|
|
|
|
||||||||||||||||||||||
| Total |
$ | 1,088,118 | $ | 540,647 | $ | 664,330 | $ | 59,921 | $ | 2,353,016 | $ | 32,000 | 262.4 | ||||||||||||||||||||||
|
|
|
|
|
|
|
|
|
|
|
|
|
|
|
||||||||||||||||||||||
| (1) | Largest loan represents the largest contractual obligation of WesBanco, which may not be fully funded. |
| (2) | Bank total risk-based capital. |
All of the services sectors combined represent the largest industry exposure at $457 million or 51.0% of capital; however, these sectors include a variety of service-providing businesses. Combined exposure to the services sectors increased $189 million from December 31, 2015 to December 31, 2016. Approximately $123 million of exposure to lessors of non-residential buildings is the single largest industry group exposure in the services sector and represents approximately 26.9% of the combined total.
The manufacturing sectors represent the second largest industry exposure at 29.4% of capital, increasing from 26.7% at the end of the previous year. Total exposure to manufacturing increased 32.7% from $198 million at December 31, 2015 to $263 million at December 31, 2016. Machinery and equipment, food and beverage manufacturing, along with petroleum and chemical manufacturing, collectively represent 55% of the other manufacturing sector.
59
Table of Contents
The healthcare sector including medical practitioners represents the third largest industry at 26.1 % of capital compared to 26.5% at the end of the previous year. Total exposure to healthcare increased 18.7% from $197 million at December 31, 2015 to $233 million at December 31, 2016. The increase in healthcare exposure came primarily in the medical practitioners segment, which increased 68%.
The retail sales sectors including automobile dealers represent the fourth largest industry exposure at 25.1% of capital and is the only other category that represents more than 25% of capital. Total exposure to the retail sectors increased $37.4 million or 20.0% from December 31, 2015. Excluding automobile dealers, gasoline stations and convenience stores represent approximately 59% of the exposure to the other retail businesses.
Retail Loans—Retail loans are a homogenous group, generally consisting of standardized products that are smaller in amount and distributed over a larger number of individual borrowers. The average residential real estate loan approximates $106,000 at December 31, 2016 compared to $103,000 at December 31, 2015 while the average of all retail loans approximates $45,000 at December 31, 2016 compared to $43,000 at December 31, 2015.
Residential real estate consists of loans to purchase, construct or refinance the borrower’s primary dwelling, second residence or vacation home. Residential real estate also includes approximately $17 million of 1-to-4 family rental properties, half of which were originated primarily in western Ohio markets by acquired banks prior to their acquisition by WesBanco.
WesBanco originates residential real estate loans for its portfolio as well as for sale in the secondary market. Portfolio loans also include loans to finance vacant land upon which the owner intends to construct a dwelling at a future date. Except for construction loans that require interest-only during the construction period, portfolio loans require monthly principal and interest payments to amortize the loan within terms up to thirty years. Construction periods range from six to twelve months but may be longer for larger residences. Loans for vacant land generally begin amortizing immediately and are refinanced when the owner begins construction of a dwelling. Interest rates on portfolio loans may be fixed for up to fifteen years. Adjustable rate loans are based primarily on the Treasury Constant Maturity index and can adjust annually or in increments up to five years.
HELOC loans are secured by first or second liens on a borrower’s primary residence. HELOCs are generally limited to an amount which when combined with the first mortgage on the property, if any, does not exceed 90% of the market value. Maximum LTV ratios are also tiered based on the amount of the line and the borrower’s credit history. Most HELOCs originated prior to 2005 are available for draws by the borrower for up to fifteen years at which time the outstanding balance is converted to a term loan requiring monthly principal and interest payments sufficient to repay the loan in not more than seven years. Most HELOCs originated since 2005 through 2013 are available to the borrower for an indefinite period as long as the borrower’s credit characteristics do not materially change, but may be cancelled by WesBanco under certain circumstances. Generally, lines originated since 2013 have a 15 year draw period, a ten year repayment period and also give borrowers the option to convert portions of the balance of their line into an installment loan requiring monthly principal and interest payments, with availability to draw on the line restored as the installment portions are repaid. HELOCs that originated prior to 2000 began reaching the end of their availability period starting in 2015 and years thereafter. These lines have the additional risk that the borrower will not have the capacity to make higher payments of interest and principal or may not qualify for a new line of credit. The amount of such lines that will reach the end of their availability period in 2017 represents less than 2% of the total HELOC exposure.
Consumer loans consist of installment loans originated directly by WesBanco and indirectly through dealers to finance purchases of automobiles, trucks, motorcycles, boats, and other recreational vehicles; home equity installment loans, unsecured home improvement loans, and revolving lines of credit that can be secured or unsecured. The maximum term for installment loans is generally eighty-four months for automobiles, trucks, motorcycles and boats; one hundred eighty months for travel trailers; one hundred twenty months for home equity/improvement loans; and sixty months if the loan is unsecured. Maximum terms may be less depending on
60
Table of Contents
age of collateral. Revolving lines of credit are generally available for an indefinite period of time as long as the borrower’s credit characteristics do not materially change but may be cancelled by WesBanco under certain circumstances. Interest rates on installment obligations are generally fixed for the term of the loan, while lines of credit are adjustable daily based on the Prime Rate.
TABLE 16. MATURITIES OF RETAIL LOANS
| December 31, 2016 | ||||||||||||||||||||||||||||||||
| Fixed Rate Loans | Variable Rate Loans | |||||||||||||||||||||||||||||||
| (in thousands) |
In One Year or Less |
After One Year Through Five Years |
After Five Years |
Total | In One Year or Less |
After One Year Through Five Years |
After Five Years |
Total | ||||||||||||||||||||||||
| Residential real estate |
$ | 5,081 | $ | 44,547 | $ | 776,167 | $ | 825,795 | $ | 178 | $ | 3,918 | $ | 553,499 | $ | 557,595 | ||||||||||||||||
| Home equity lines of credit |
2,100 | 7,022 | 21,809 | 30,931 | 137,223 | 34,893 | 305,312 | 477,428 | ||||||||||||||||||||||||
| Consumer |
16,835 | 145,388 | 184,578 | 346,801 | 31,477 | 9,907 | 7,873 | 49,257 | ||||||||||||||||||||||||
|
|
|
|
|
|
|
|
|
|
|
|
|
|
|
|
|
|||||||||||||||||
| Total retail loans |
$ | 24,016 | $ | 196,957 | $ | 982,554 | $ | 1,203,527 | $ | 168,878 | $ | 48,718 | $ | 866,684 | $ | 1,084,280 | ||||||||||||||||
|
|
|
|
|
|
|
|
|
|
|
|
|
|
|
|
|
|||||||||||||||||
The primary factors that are considered in underwriting retail loans are the borrower’s credit history and their current and reasonably anticipated ability to repay their obligations as measured by their total debt-to-income ratio. Portfolio residential real estate loans are generally underwritten to secondary market lending standards using automated underwriting systems developed for the secondary market that rely on empirical data to evaluate each loan application and assess credit risk. The amount of the borrower’s down payment is an important consideration for residential real estate, as is the borrower’s equity in the property for HELOCs. It is common practice to finance the total amount of the purchase price of motor vehicles and other consumer products plus certain allowable additions for tax, title, service contracts and credit insurance.
Effective January 10, 2014 underwriting of residential real estate loans also became subject to new regulations promulgated by the CFPB which among other things defined the characteristics of a “qualified mortgage” and imposed new standards for determining and documenting a borrower’s ability to repay. One impact of these regulations is the risk of liability to a borrower at a future date if the borrower claims the institution had knowledge when the loan was made that the borrower did not have the ability to repay.
In October 2015, the TILA-RESPA Integrated Disclosure Rule, also known as TRID, became effective for all residential mortgage originations. The lender prepared Closing Disclosure (CD) replaced the traditional HUD-1 and is presented to the consumer three days prior to the loan closing date. The TRID rule requires that the full monthly payment as well as the full amount of funds needed to close including down payment, closing costs and prepaid costs be disclosed.
Risk is further mitigated by requiring residential real estate borrowers to have adequate down payments or cash equity, thereby limiting the loan amount in relation to the lower of the cost or the market value of the property, unless there are sufficient mitigating factors that would reduce the risk of a higher loan-to-value. Market values are determined by obtaining current appraisals or evaluations, whichever is appropriate or required by banking regulations based on the amount financed prior to the loan being made. New appraisals or evaluations are not obtained unless the borrower requests a modification or refinance of the loan or there is increased dependence on the value of the collateral because the borrower is in default.
WesBanco does not maintain current information about the industry in which retail borrowers are employed. While such information is obtained when each loan is underwritten, it often becomes inaccurate with the passage of time or if borrowers change employment. Instead, WesBanco estimates potential exposure based on consumer
61
Table of Contents
demographics, market share, and other available information when there is a significant risk of loss of employment within an industry or a significant employer in WesBanco’s markets. To management’s knowledge there are no concentrations of employment that would have a material adverse impact on the retail portfolio.
Most retail loans are originated directly by WesBanco except for indirect consumer loans originated by automobile dealers and other sellers of consumer goods. WesBanco performs its own customary credit evaluation and underwriting before purchasing indirect loans. The credit risk associated with these loans is similar to that of loans originated by WesBanco, but additional risk may arise from WesBanco’s limited ability to control a dealer’s compliance with applicable consumer lending laws. Indirect consumer loans represented $236 million or 59% of consumer loans at December 31, 2016 compared to $240 million or 59% at December 31, 2015.
Loans Held For Sale—Loans held for sale consist of residential real estate loans originated for sale in the secondary market. Credit risk associated with such loans is mitigated by entering into sales commitments with third party investors to purchase the loans when they are originated. This practice has the effect of minimizing the amount of such loans that are unsold and the interest rate risk at any point in time. WesBanco generally does not service these loans after they are sold. While all loans are sold without recourse, WesBanco may be required to repurchase loans under certain circumstances for contractual periods of generally up to one year or less. The number and principal balance of loans that WesBanco has been required to repurchase has not been material and therefore reserves established for this exposure are not material.
Banks that have been acquired by WesBanco serviced many of the residential real estate loans that were sold to the secondary market prior to being acquired. Although these loans are not carried as an asset on the balance sheet, WesBanco continues to service these loans. As of December 31, 2016 and 2015, WesBanco serviced loans for others aggregating approximately $40.9 million and $50.6 million, respectively. The unamortized balance of mortgage servicing rights related to these loans is less than $1 million.
CREDIT QUALITY
The quality of the loan portfolio is measured by various factors, including the amount of loans that are past due, required to be reported as non-performing, or are adversely graded in accordance with internal risk classifications that are consistent with regulatory adverse risk classifications. Non-performing loans consist of non-accrual loans and troubled debt restructurings (“TDRs”). Non-performing assets also include real estate owned (“REO”) and repossessed assets. Net charge-offs are also an important measure of credit quality. WesBanco seeks to develop individual strategies for all assets that have adverse risk characteristics in order to minimize potential loss. However, there is no assurance such strategies will be successful and loans may ultimately proceed to foreclosure or other course of liquidation that does not fully repay the amount of the loan.
Past Due Loans—Loans that are past due but not reported as non-performing generally consist of loans that are between 30 and 89 days contractually past due. Certain loans that are 90 days or more past due also continue to accrue interest because they are deemed to be well-secured and in the process of collection. Earlier stage delinquency requires routine collection efforts to prevent them from becoming more seriously delinquent. Early stage delinquency represents potential future non-performing loans if routine collection efforts are unsuccessful. Table 17 summarizes loans that are contractually past due 30 days or more, excluding non-accrual and TDR loans.
62
Table of Contents
TABLE 17. PAST DUE AND ACCRUING LOANS EXLUDING NON-ACCRUAL AND TDR LOANS
| December 31, | ||||||||||||||||||||||||||||||||||||||||
| 2016 | 2015 | 2014 | 2013 | 2012 | ||||||||||||||||||||||||||||||||||||
| (dollars in thousands) |
Amount | % of Total Loans |
Amount | % of Total Loans |
Amount | % of Total Loans |
Amount | % of Total Loans |
Amount | % of Total Loans |
||||||||||||||||||||||||||||||
| 90 days or more: |
||||||||||||||||||||||||||||||||||||||||
| Commercial real estate—land and construction |
$ | — | — | $ | — | — | $ | 71 | 0.03 | $ | 248 | 0.09 | $ | — | — | |||||||||||||||||||||||||
| Commercial real estate—improved property |
318 | 0.01 | — | — | — | — | 318 | 0.02 | 338 | 0.02 | ||||||||||||||||||||||||||||||
| Commercial and industrial |
229 | 0.02 | 33 | — | 22 | — | — | — | 98 | 0.02 | ||||||||||||||||||||||||||||||
| Residential real estate |
1,922 | 0.14 | 2,159 | 0.17 | 1,306 | 0.14 | 1,289 | 0.14 | 3,199 | 0.40 | ||||||||||||||||||||||||||||||
| Home equity lines of credit |
626 | 0.12 | 407 | 0.10 | 570 | 0.17 | 411 | 0.14 | 722 | 0.26 | ||||||||||||||||||||||||||||||
| Consumer |
644 | 0.16 | 527 | 0.13 | 319 | 0.13 | 325 | 0.13 | 937 | 0.33 | ||||||||||||||||||||||||||||||
|
|
|
|
|
|
|
|
|
|
|
|
|
|
|
|
|
|
|
|
|
|||||||||||||||||||||
| Total 90 days or more |
3,739 | 0.06 | 3,126 | 0.06 | 2,288 | 0.06 | 2,591 | 0.07 | 5,294 | 0.14 | ||||||||||||||||||||||||||||||
|
|
|
|
|
|
|
|
|
|
|
|
|
|
|
|
|
|
|
|
|
|||||||||||||||||||||
| 30 to 89 days: |
||||||||||||||||||||||||||||||||||||||||
| Commercial real estate—land and construction |
— | — | — | — | — | — | 2 | — | 750 | 0.39 | ||||||||||||||||||||||||||||||
| Commercial real estate—improved property |
747 | 0.03 | 318 | 0.02 | 480 | 0.03 | 2,897 | 0.18 | 6,328 | 0.38 | ||||||||||||||||||||||||||||||
| Commercial and industrial |
1,522 | 0.14 | 275 | 0.04 | 216 | 0.03 | 1,310 | 0.24 | 500 | 0.10 | ||||||||||||||||||||||||||||||
| Residential real estate |
6,080 | 0.44 | 3,216 | 0.26 | 3,105 | 0.33 | 4,894 | 0.55 | 7,972 | 1.00 | ||||||||||||||||||||||||||||||
| Home equity lines of credit |
2,949 | 0.58 | 2,470 | 0.59 | 2,524 | 0.76 | 1,934 | 0.68 | 1,322 | 0.48 | ||||||||||||||||||||||||||||||
| Consumer |
4,731 | 1.19 | 4,726 | 1.16 | 3,022 | 1.24 | 3,794 | 1.52 | 5,666 | 2.02 | ||||||||||||||||||||||||||||||
|
|
|
|
|
|
|
|
|
|
|
|
|
|
|
|
|
|
|
|
|
|||||||||||||||||||||
| Total 30 to 89 days |
16,029 | 0.26 | 11,005 | 0.22 | 9,347 | 0.23 | 14,831 | 0.38 | 22,538 | 0.61 | ||||||||||||||||||||||||||||||
|
|
|
|
|
|
|
|
|
|
|
|
|
|
|
|
|
|
|
|
|
|||||||||||||||||||||
| Total 30 days or more |
$ | 19,768 | 0.32 | $ | 14,131 | 0.28 | $ | 11,635 | 0.29 | $ | 17,422 | 0.45 | $ | 27,832 | 0.75 | |||||||||||||||||||||||||
|
|
|
|
|
|
|
|
|
|
|
|
|
|
|
|
|
|
|
|
|
|||||||||||||||||||||
Loans past due 30 days or more and accruing interest and not reported as TDRs increased $5.6 million due to the YCB acquisition, representing 0.32% of total loans at December 31, 2016 as compared to 0.28% at December 31, 2015. This overall low level of delinquency is the result of management’s continued focus on sound initial underwriting, timely collection of loans at their earliest stage of delinquency, stable unemployment and generally improved economic conditions.
Non-Performing Assets—Non-performing assets consist of non-accrual loans, TDRs, REO and repossessed assets.
Loans are categorized as TDRs when WesBanco, for economic or legal reasons related to a borrower’s financial difficulties, grants a concession to the borrower that it would not otherwise consider unless the modification results in only an insignificant delay in the payments to be received. Concessions may include a reduction of either the interest rate, the amount of accrued interest, or the principal balance of the loan. Other possible concessions are an interest rate that is less than the market rate for loans with comparable risk characteristics, an extension of the maturity date or an extension of the amortization schedule. Loans reported in this category continue to accrue interest so long as the borrower is able to continue repayment in accordance with the restructured terms. TDRs that are also placed on non-accrual are reported in the non-accrual category and not included with accruing TDRs.
Loans are generally placed on non-accrual when they become past due 90 days or more unless they are both well-secured and in the process of collection. Non-accrual loans include certain loans that are also TDRs as set
63
Table of Contents
forth in Note 5, “Loans and the Allowance for Credit Losses,” of the Consolidated Financial Statements. Non-accrual loans also include retail loans that were recently discharged in Chapter 7 bankruptcy but for which the borrower has continued to make payments for less than six consecutive months after the discharge.
REO consists primarily of property acquired through or in lieu of foreclosure but may also include bank premises held for sale and residences of bank employees purchased to facilitate the relocation of those employees with WesBanco. Repossessed assets primarily consist of automobiles and other types of collateral acquired to satisfy defaulted consumer loans.
Table 18 summarizes non-performing assets.
TABLE 18. NON-PERFORMING ASSETS
| December 31, | ||||||||||||||||||||
| (dollars in thousands) |
2016 | 2015 | 2014 | 2013 | 2012 | |||||||||||||||
| TDRs accruing interest: |
||||||||||||||||||||
| Commercial real estate—land and construction |
$ | — | $ | 967 | $ | — | $ | — | $ | 2,537 | ||||||||||
| Commercial real estate—improved property |
1,618 | 2,064 | 2,437 | 3,052 | 10,198 | |||||||||||||||
| Commercial and industrial |
152 | 205 | 329 | 415 | 632 | |||||||||||||||
| Residential real estate |
5,311 | 7,227 | 8,215 | 9,850 | 9,022 | |||||||||||||||
| Home equity lines of credit |
473 | 642 | 740 | 902 | 1,022 | |||||||||||||||
| Consumer |
92 | 443 | 345 | 642 | 870 | |||||||||||||||
|
|
|
|
|
|
|
|
|
|
|
|||||||||||
| Total TDRs accruing interest |
7,646 | 11,548 | 12,066 | 14,861 | 24,281 | |||||||||||||||
|
|
|
|
|
|
|
|
|
|
|
|||||||||||
| Non-accrual loans: |
||||||||||||||||||||
| Commercial real estate—land and construction |
766 | 1,023 | 1,488 | 2,564 | 4,668 | |||||||||||||||
| Commercial real estate—improved property |
9,535 | 11,507 | 20,227 | 17,305 | 18,239 | |||||||||||||||
| Commercial and industrial |
4,299 | 8,148 | 4,110 | 4,380 | 3,387 | |||||||||||||||
| Residential real estate |
12,994 | 9,461 | 10,329 | 10,240 | 11,247 | |||||||||||||||
| Home equity lines of credit |
3,538 | 2,391 | 1,923 | 1,604 | 1,184 | |||||||||||||||
| Consumer |
652 | 851 | 741 | 540 | 647 | |||||||||||||||
|
|
|
|
|
|
|
|
|
|
|
|||||||||||
| Total non-accrual loans |
31,784 | 33,381 | 38,818 | 36,633 | 39,372 | |||||||||||||||
|
|
|
|
|
|
|
|
|
|
|
|||||||||||
| Total non-performing loans |
39,430 | 44,929 | 50,884 | 51,494 | 63,653 | |||||||||||||||
| Real estate owned and repossessed assets |
8,346 | 5,825 | 5,082 | 4,860 | 5,988 | |||||||||||||||
|
|
|
|
|
|
|
|
|
|
|
|||||||||||
| Total non-performing assets |
$ | 47,776 | $ | 50,754 | $ | 55,966 | $ | 56,354 | $ | 69,641 | ||||||||||
|
|
|
|
|
|
|
|
|
|
|
|||||||||||
| Non-performing loans as a percentage of total portfolio loans |
0.63 | % | 0.89 | % | 1.25 | % | 1.32 | % | 1.73 | % | ||||||||||
| Non-performing assets as a percentage of total assets |
0.49 | 0.60 | 0.89 | 0.92 | 1.15 | |||||||||||||||
| Non-performing assets as a percentage of total portfolio loans, real estate owned and repossessed assets |
0.76 | 1.00 | 1.37 | 1.45 | 1.89 | |||||||||||||||
Accruing TDRs decreased $3.9 million or 33.8% from December 31, 2015 to December 31, 2016. There were no TDRs greater than $1 million or more at December 31, 2015 or 2016. Accruing TDRs are not concentrated in any industry, property or type of loan; however, retail loans represent 76.9% of accruing TDR’s at December 31, 2016 compared to 72.0% at December 31, 2015. This includes loans that were discharged in Chapter 7 bankruptcy in the current or prior year but for which the borrower has continued to make payments for at least six consecutive months after the discharge. Most accruing TDRs continue to pay in accordance with their modified terms; however, total accruing TDRs with aggregate balances of $0.6 million or 8.3% of total accruing TDRs were past due 30 days or more at December 31, 2016, as compared to $0.8 million or 7.3% at December 31, 2015.
64
Table of Contents
Non-accrual loans decreased $1.6 million or 4.8% from December 31, 2015 to December 31, 2016 as WesBanco successfully reduced or exited a number of non-accrual loans throughout 2016. Approximately $3.5 million or 11.2% of total non-accrual loans at December 31, 2016 also have restructured terms that would require them to be reported as a TDR if they were accruing interest, compared to $4.6 million or 13.8% of the total at December 31, 2015. Commercial loans of $1 million or more represent over 10% and all retail loans represent 54% of the total non-accrual loans at December 31, 2016. These non-accrual loans are not concentrated in any industry, property or type of loan.
REO and repossessed assets increased $2.5 million or 43.3% from December 31, 2015 to December 31, 2016. One commercial property acquired in the Fidelity acquisition represents $2.9 million or 34.9% of the total carrying value of REO at December 31, 2016 compared to 49.9% at December 31, 2015. Consummation of a sale of this property pursuant to a purchase agreement executed in 2013 was expected to take some time due to the complexity of the proposed purchaser’s development plans but has been further delayed by other external factors. No other REO property has a carrying value of $1 million or more. WesBanco seeks to minimize the period for which it holds REO and repossessed assets while also attempting to obtain a fair value from their disposition. Therefore, the sales price of these assets is dependent on current market conditions that affect the value of real estate, used automobiles, and other collateral. The average holding period of REO other than the one property described above approximated 8 months at December 31, 2016 compared to 7 months at December 31, 2015. Repossessed assets are generally sold at auction within 60 days after repossession. Expenses associated with owning REO and repossessed assets charged to other expenses were $1.2 million for 2016 compared to $0.5 million for 2015. Net gains or losses on the disposition of REO and repossessed assets are credited or charged to non-interest income and approximated $1.0 million of net gains in 2016 compared to $0.2 million of net gains for 2015.
Classified Loans—Please refer to Note 5, “Loans and the Allowance for Credit Losses,” of the consolidated Financial Statements for a description of internally assigned risk grades for commercial loans and a summary of loans by grade. WesBanco’s classified loan grades are equivalent to the classifications used by banking regulators to identify those loans that have significant adverse characteristics. A classified loan grade is assigned to all non-accrual commercial loans and most commercial TDRs; however, TDRs may be upgraded after the borrower has repaid the loan in accordance with the restructured terms for a period of time, but such loans would generally continue to be reported as TDRs regardless of their grade. Classified loans decreased $3.4 million or 6.5% from December 31, 2015 to December 31, 2016, and represented 0.8% of total loans on December 31, 2016 compared to 1.1% on December 31, 2015.
Charge-offs and Recoveries—Total charge-offs decreased $3.9 million or 26.4% to $10.9 million, while total recoveries increased to $4.3 million, resulting in a 41.1% decrease in net charge-offs for 2016 compared to 2015. The total net loan charge-off rate of 0.12% of average loans is consistent with the overall percentage reductions in criticized and classified loans, non-performing loans, an improved economy and a return of commercial and residential real estate values to pre-recession levels. Table 19 summarizes charge-offs and recoveries as well as net charge-offs as a percentage of average loans for each category of the loan portfolio.
65
Table of Contents
TABLE 19. CHARGE-OFFS AND RECOVERIES
| December 31, | ||||||||||||||||||||
| (dollars in thousands) |
2016 | 2015 | 2014 | 2013 | 2012 | |||||||||||||||
| Charge-offs: |
||||||||||||||||||||
| Commercial real estate—land and construction |
$ | 73 | $ | — | $ | — | $ | 536 | $ | 3,879 | ||||||||||
| Commercial real estate—improved property |
1,886 | 4,915 | 2,426 | 6,915 | 7,693 | |||||||||||||||
| Commercial and industrial |
3,070 | 2,785 | 3,485 | 1,505 | 4,625 | |||||||||||||||
| Residential real estate |
937 | 1,803 | 2,437 | 3,079 | 3,902 | |||||||||||||||
| Home equity lines of credit |
397 | 1,502 | 652 | 549 | 1,144 | |||||||||||||||
| Consumer |
3,606 | 2,892 | 3,120 | 3,819 | 3,851 | |||||||||||||||
|
|
|
|
|
|
|
|
|
|
|
|||||||||||
| Total loan charge-offs |
9,969 | 13,897 | 12,120 | 16,403 | 25,094 | |||||||||||||||
| Deposit account overdrafts |
884 | 846 | 779 | 880 | 871 | |||||||||||||||
|
|
|
|
|
|
|
|
|
|
|
|||||||||||
| Total charge-offs |
10,853 | 14,743 | 12,899 | 17,283 | 25,965 | |||||||||||||||
|
|
|
|
|
|
|
|
|
|
|
|||||||||||
| Recoveries: |
||||||||||||||||||||
| Commercial real estate—land and construction |
5 | 1 | — | 125 | 607 | |||||||||||||||
| Commercial real estate—improved property |
1,543 | 840 | 603 | 615 | 1,107 | |||||||||||||||
| Commercial and industrial |
320 | 435 | 1,194 | 471 | 390 | |||||||||||||||
| Residential real estate |
445 | 604 | 454 | 401 | 407 | |||||||||||||||
| Home equity lines of credit |
274 | 262 | 115 | 116 | 30 | |||||||||||||||
| Consumer |
1,485 | 1,240 | 1,034 | 1,144 | 1,035 | |||||||||||||||
|
|
|
|
|
|
|
|
|
|
|
|||||||||||
| Total loan recoveries |
4,072 | 3,382 | 3,400 | 2,872 | 3,576 | |||||||||||||||
| Deposit account overdrafts |
225 | 222 | 233 | 255 | 277 | |||||||||||||||
|
|
|
|
|
|
|
|
|
|
|
|||||||||||
| Total recoveries |
4,297 | 3,604 | 3,633 | 3,127 | 3,853 | |||||||||||||||
|
|
|
|
|
|
|
|
|
|
|
|||||||||||
| Net charge-offs |
$ | 6,556 | $ | 11,139 | $ | 9,266 | $ | 14,156 | $ | 22,112 | ||||||||||
|
|
|
|
|
|
|
|
|
|
|
|||||||||||
| Net charge-offs as a percentage of average loans: |
||||||||||||||||||||
| Commercial real estate—land and construction |
0.02 | % | — | % | — | % | 0.18 | % | 1.81 | % | ||||||||||
| Commercial real estate—improved property |
0.02 | 0.22 | 0.11 | 0.38 | 0.43 | |||||||||||||||
| Commercial and industrial |
0.31 | 0.33 | 0.39 | 0.20 | 1.00 | |||||||||||||||
| Residential real estate |
0.04 | 0.10 | 0.22 | 0.32 | 0.52 | |||||||||||||||
| Home equity lines of credit |
0.03 | 0.33 | 0.18 | 0.15 | 0.44 | |||||||||||||||
| Consumer |
0.53 | 0.45 | 0.88 | 1.01 | 1.13 | |||||||||||||||
|
|
|
|
|
|
|
|
|
|
|
|||||||||||
| Total net loan charge-offs |
0.12 | 0.23 | 0.22 | 0.37 | 0.65 | |||||||||||||||
|
|
|
|
|
|
|
|
|
|
|
|||||||||||
ALLOWANCE FOR CREDIT LOSSES
The provision for credit losses increased $0.1 million in 2016 compared to 2015, and the total allowance for loan losses (“allowance”) increased $1.9 million or 4.5% from December 31, 2015 to December 31, 2016. The increase in the dollar amount of the allowance is attributable to management’s decision to increase some of the qualitative factors that determine the adequacy of the allowance, offset by lower historical loss rates, improved credit quality, and charge-offs of loans that were specifically reserved in prior years with replacement of such specific reserves not being warranted.
The allowance represented 0.70% of total portfolio loans at December 31, 2016 compared to 0.82% at December 31, 2015. However, the allowance does not include the credit portion of the fair market value adjustment for acquired loans. The decrease in the allowance as a percentage of loans is primarily attributable to improved credit quality metrics and acquired loans recorded at fair value for YCB in 2016, ESB in 2015 and Fidelity in 2012. If these acquired loans were excluded from total loans, the allowance as a percentage of the legacy portfolio would approximate 0.88% of total loans at December 31, 2016 and 0.97% at December 31, 2015.
66
Table of Contents
Table 20 summarizes the allowance together with selected relationships of the allowance and provision for credit losses to total loans and certain categories of loans.
TABLE 20. ALLOWANCE FOR CREDIT LOSSES
| December 31, | ||||||||||||||||||||
| (dollars in thousands) |
2016 | 2015 | 2014 | 2013 | 2012 | |||||||||||||||
| Balance at beginning of year: |
||||||||||||||||||||
| Allowance for loan losses |
$ | 41,710 | $ | 44,654 | $ | 47,368 | $ | 52,699 | $ | 54,810 | ||||||||||
| Allowance for loan commitments |
613 | 455 | 602 | 341 | 468 | |||||||||||||||
|
|
|
|
|
|
|
|
|
|
|
|||||||||||
| Total beginning balance |
42,323 | 45,109 | 47,970 | 53,040 | 55,278 | |||||||||||||||
|
|
|
|
|
|
|
|
|
|
|
|||||||||||
| Provision for credit losses: |
||||||||||||||||||||
| Provision for loan losses |
8,520 | 8,195 | 6,552 | 8,825 | 20,001 | |||||||||||||||
| Provision for loan commitments |
(42 | ) | 158 | (147 | ) | 261 | (127 | ) | ||||||||||||
|
|
|
|
|
|
|
|
|
|
|
|||||||||||
| Total provision for credit losses |
8,478 | 8,353 | 6,405 | 9,086 | 19,874 | |||||||||||||||
|
|
|
|
|
|
|
|
|
|
|
|||||||||||
| Net charge-offs: |
||||||||||||||||||||
| Total charge-offs |
(10,853 | ) | (14,743 | ) | (12,899 | ) | (17,283 | ) | (25,965 | ) | ||||||||||
| Total recoveries |
4,297 | 3,604 | 3,633 | 3,127 | 3,853 | |||||||||||||||
|
|
|
|
|
|
|
|
|
|
|
|||||||||||
| Net charge-offs |
(6,556 | ) | (11,139 | ) | (9,266 | ) | (14,156 | ) | (22,112 | ) | ||||||||||
|
|
|
|
|
|
|
|
|
|
|
|||||||||||
| Balance at end of year: |
||||||||||||||||||||
| Allowance for loan losses |
43,674 | 41,710 | 44,654 | 47,368 | 52,699 | |||||||||||||||
| Allowance for loan commitments |
571 | 613 | 455 | 602 | 341 | |||||||||||||||
|
|
|
|
|
|
|
|
|
|
|
|||||||||||
| Total ending balance |
$ | 44,245 | $ | 42,323 | $ | 45,109 | $ | 47,970 | $ | 53,040 | ||||||||||
|
|
|
|
|
|
|
|
|
|
|
|||||||||||
| Allowance for loan losses as a percentage of total loans |
0.70 | % | 0.82 | % | 1.09 | % | 1.22 | % | 1.43 | % | ||||||||||
| Allowance for loan losses to non-accrual loans |
1.37x | 1.25x | 1.15x | 1.29x | 1.34x | |||||||||||||||
| Allowance for loan losses to total non-performing loans |
1.11x | 0.93x | 0.88x | 0.92x | 0.83x | |||||||||||||||
| Allowance for loan losses to total non-performing loans and loans past due 90 days or more |
1.01x | 0.87x | 0.84x | 0.88x | 0.76x | |||||||||||||||
The allowance consists of specific reserves for certain impaired loans and a general reserve for all other loans. WesBanco uses historical loss rates by risk grade for CRE—improved property and C&I loans, and the historical loss rates for the total of CRE—land and construction loans, retail loans and deposit overdrafts as a base loss rate for the general allowance. The base loss rate is adjusted for the impact of qualitative factors which in management’s judgment are appropriate to accurately reflect probable loss in each loan category. Qualitative factors include the impact of historical loss rates for the most recent sixty months, the volatility and velocity with which historical loss rates have changed during the economic cycle, economic conditions, delinquency levels and trends, non-performing and classified loan levels and trends, changes in credit policies and lending standards, concentrations of credit exposure if any, the results of regulatory examinations and internal loan reviews, and other external factors when appropriate.
67
Table of Contents
Table 21 summarizes the components of the allowance.
TABLE 21. COMPONENTS OF THE ALLOWANCE FOR CREDIT LOSSES
| December 31, | ||||||||||||||||||||
| (in thousands) |
2016 | 2015 | 2014 | 2013 | 2012 | |||||||||||||||
| General allowance: |
||||||||||||||||||||
| Based on historical loss experience |
$ | 20,865 | $ | 28,490 | $ | 29,359 | $ | 38,545 | $ | 39,761 | ||||||||||
| Based on qualitative factors |
21,932 | 11,699 | 11,497 | 8,091 | 11,195 | |||||||||||||||
| Specific reserves |
877 | 1,521 | 3,798 | 732 | 1,743 | |||||||||||||||
|
|
|
|
|
|
|
|
|
|
|
|||||||||||
| Total allowance for loan losses |
43,674 | 41,710 | 44,654 | 47,368 | 52,699 | |||||||||||||||
| Allowance for loan commitments |
571 | 613 | 455 | 602 | 341 | |||||||||||||||
|
|
|
|
|
|
|
|
|
|
|
|||||||||||
| Total allowance for credit losses |
$ | 44,245 | $ | 42,323 | $ | 45,109 | $ | 47,970 | $ | 53,040 | ||||||||||
|
|
|
|
|
|
|
|
|
|
|
|||||||||||
The general allowance based on historical loss experience decreased $7.6 million or 26.8% from December 31, 2015 to December 31, 2016, which is consistent with decreasing historical loss rates for the past twelve and thirty-six month periods. However, the general allowance based on qualitative factors increased $10.2 million or 87.5% from December 31, 2015 to December 31, 2016 primarily due to organic growth in the legacy portfolio, an increase in new lending staff due to market expansion and normal attrition, and the consideration of higher loss rates experienced through a longer economic cycle than 36 months. Specific reserves decreased $0.6 million from December 31, 2015 to December 31, 2016 and the allowance for loan commitments did not materially change from December 31, 2015 to December 31, 2016.
Table 22 summarizes the allocation of the allowance for credit losses to each category of loans.
TABLE 22. ALLOCATION OF THE ALLOWANCE FOR CREDIT LOSSES
| December 31, | ||||||||||||||||||||
| (in thousands) |
2016 | 2015 | 2014 | 2013 | 2012 | |||||||||||||||
| Allowance for loan losses: |
||||||||||||||||||||
| Commercial real estate—land and construction |
$ | 4,348 | $ | 4,390 | $ | 5,654 | $ | 6,056 | $ | 3,741 | ||||||||||
| Commercial real estate—improved property |
18,628 | 14,748 | 17,573 | 18,157 | 23,614 | |||||||||||||||
| Commercial and industrial |
8,412 | 10,002 | 9,063 | 9,925 | 9,326 | |||||||||||||||
| Residential real estate |
4,106 | 4,582 | 5,382 | 5,673 | 7,182 | |||||||||||||||
| Home equity lines of credit |
3,422 | 2,883 | 2,329 | 2,017 | 2,458 | |||||||||||||||
| Consumer |
3,998 | 4,763 | 4,078 | 5,020 | 5,557 | |||||||||||||||
| Deposit account overdrafts |
760 | 342 | 575 | 520 | 821 | |||||||||||||||
|
|
|
|
|
|
|
|
|
|
|
|||||||||||
| Total allowance for loan losses |
43,674 | 41,710 | 44,654 | 47,368 | 52,699 | |||||||||||||||
|
|
|
|
|
|
|
|
|
|
|
|||||||||||
| Allowance for loan commitments: |
||||||||||||||||||||
| Commercial real estate—land and construction |
151 | 157 | 194 | 301 | 27 | |||||||||||||||
| Commercial real estate—improved property |
17 | 26 | 10 | 62 | 25 | |||||||||||||||
| Commercial and industrial |
188 | 260 | 112 | 130 | 215 | |||||||||||||||
| Residential real estate |
9 | 7 | 9 | 5 | 6 | |||||||||||||||
| Home equity lines of credit |
162 | 117 | 90 | 85 | 49 | |||||||||||||||
| Consumer |
44 | 46 | 40 | 19 | 19 | |||||||||||||||
|
|
|
|
|
|
|
|
|
|
|
|||||||||||
| Total allowance for loan commitments |
571 | 613 | 455 | 602 | 341 | |||||||||||||||
|
|
|
|
|
|
|
|
|
|
|
|||||||||||
| Total allowance for credit losses |
$ | 44,245 | $ | 42,323 | $ | 45,109 | $ | 47,970 | $ | 53,040 | ||||||||||
|
|
|
|
|
|
|
|
|
|
|
|||||||||||
Please refer to Note 5, “Loans and the Allowance for Credit Losses,” of the consolidated Financial Statements for a summary of changes in the allowance for credit losses applicable to each category of loans.
68
Table of Contents
Changes in the allowance for all categories of loans also reflect the net effect of changes in historical loss rates, loan balances, specific reserves and management’s judgment with respect to the impact of qualitative factors on each category of loans. Decreases in the allowances for all loan categories generally reflect lower historical loss rates and reductions in non-performing and classified commercial loans. The increase in the allowance for all CRE loans of $3.8 million was due primarily to an $8.0 million increase in qualitative factors, partially offset by lower historical loss rates and a reduction in non-performing loans. The allowance for C&I loans decreased $1.6 million due to lower historical loss rates and reductions in non-performing and classified commercial loans. However, qualitative factors increased $1.3 million in the C&I portfolio. The allowance for residential real estate loans decreased as a result of decreasing historical loss rates and a more stable residential real estate market. The allowance for HELOCs increased due to loan growth and repayment risk associated with lines that are nearing the end of their availability period. The allowance for consumer loans decreased due to a decline in legacy portfolio balances and lower historical loss rates. The allowance for deposit account overdrafts increased but is not material to the total allowance. Although the allowance for credit losses is allocated as described in Table 22, the total allowance is available to absorb losses in any category of loans. However, differences between management’s estimation of probable losses and actual incurred losses in subsequent periods may necessitate future adjustments to the provision for credit losses. Management believes the allowance for credit losses is appropriate to absorb probable losses at December 31, 2016.
69
Table of Contents
DEPOSITS
TABLE 23. DEPOSITS
| December 31, | ||||||||||||||||||||
| (dollars in thousands) |
2016 | 2015 | $ Change | % Change | ||||||||||||||||
| Deposits |
||||||||||||||||||||
| Non-interest bearing demand |
$ | 1,789,522 | $ | 1,311,455 | $ | 478,067 | 36.5 | |||||||||||||
| Interest bearing demand |
1,546,890 | 1,152,071 | 394,819 | 34.3 | ||||||||||||||||
| Money market |
995,477 | 967,561 | 27,916 | 2.9 | ||||||||||||||||
| Savings deposits |
1,213,168 | 1,077,374 | 135,794 | 12.6 | ||||||||||||||||
| Certificates of deposit |
1,495,822 | 1,557,838 | (62,016 | ) | (4.0 | ) | ||||||||||||||
|
|
|
|
|
|
|
|
|
|||||||||||||
| Total deposits |
$ | 7,040,879 | $ | 6,066,299 | $ | 974,580 | 16.1 | |||||||||||||
|
|
|
|
|
|
|
|
|
|||||||||||||
Deposits, which represent WesBanco’s primary source of funds, are offered in various account forms at various rates through WesBanco’s 174 branches in West Virginia, Ohio, western Pennsylvania, Kentucky, and southern Indiana. The FDIC insures all deposits up to $250,000 per account.
Total deposits increased by $974.6 million or 16.1% in 2016 primarily due to the YCB acquisition, which provided $1.2 billion of additional deposits, while organic deposits decreased 3.6% from December 31, 2015. Non-interest-bearing demand and interest-bearing demand deposits increased 36.5% and 34.3%, respectively, while savings and money market deposits increased 12.6% and 2.9%, respectively, due to the YCB acquisition and corresponding marketing initiatives, incentive compensation paid to customers and employees, focused retail and business strategies to obtain more account relationships and customers’ overall preference for shorter-term maturities. Deposit balances were also impacted by bonus and royalty payments from Marcellus and Utica shale energy companies in WesBanco’s southwestern Pennsylvania, eastern Ohio and northern West Virginia markets totaling $74.6 million and $140.9 million for the years ended December 31, 2016 and 2015, respectively. At December 31, 2016, demand deposits, savings deposits and money market deposits at former YCB branches were $654.2 million, $176.3 million and $107.4 million, respectively, compared to $607.2 million, $190.8 million and $132.7 million, respectively, at the date of acquisition.
70
Table of Contents
Certificates of deposit decreased by $62.0 million. Certificates of deposit acquired from YCB totaled $262.4 million, of which $244.9 million remain as of December 31, 2016, while organic deposits decreased by 20.8%, including an $88.3 million or 19.3% decrease in certificate of deposits acquired in the 2015 ESB acquisition. In addition, the decrease was affected by an overall corporate strategy designed to increase and remix retail deposit relationships with a focus on overall products that can be offered at a lower cost to the Bank. The decrease is also impacted by lower offered rates on maturing certificates of deposit and customer preferences for other non-maturity deposit types. WesBanco does not generally solicit brokered or other deposits out-of-market or over the internet, but does participate in the Certificate of Deposit Account Registry Services (CDARS®) program and the Insured Cash Sweep (ICS®) money market deposit program. CDARS® balances totaled $135.2 million in total outstanding balances at December 31, 2016, of which $100.1 million represented one-way buys, compared to $243.7 million in total outstanding balances at December 31, 2015, of which $182.7 million represented one-way buys. ICS® balances totaled $5.7 million and $147.3 million at December 31, 2016 and 2015, respectively. Certificates of deposit greater than $250,000 were approximately $219.3 million at December 31, 2016 compared to $232.6 million at December 31, 2015. Certificates of deposit of $100,000 or more were approximately $681.5 million at December 31, 2016 compared to $780.1 million at December 31, 2015. Certificates of deposit totaling approximately $840.8 million at December 31, 2016 with a cost of 0.56% are scheduled to mature within the next year. The average rate on certificates of deposit increased 4 basis points to 0.69% for the year ended December 31, 2016 from 0.65% in 2015 with a similar increase experienced for jumbo certificates of deposit. WesBanco will continue to focus on its core deposit strategies and improving its overall mix of transaction accounts to total deposits, which includes offering special promotions on certain certificates of deposit maturities and savings products based on competition, sales strategies, liquidity needs and wholesale borrowing costs.
TABLE 24. MATURITY DISTRIBUTION OF CERTIFICATES OF DEPOSIT OF $100,000 OR MORE
| December 31, | ||||||||||||||||||||
| (dollars in thousands) |
2016 | 2015 | $ Change | % Change | ||||||||||||||||
| Maturity: |
||||||||||||||||||||
| Within three months |
$ | 171,156 | $ | 208,791 | $ | (37,635 | ) | (18.0 | ) | |||||||||||
| Over three to six months |
90,532 | 134,465 | (43,933 | ) | (32.7 | ) | ||||||||||||||
| Over six to twelve months |
126,824 | 149,599 | (22,775 | ) | (15.2 | ) | ||||||||||||||
| Over twelve months |
292,947 | 287,216 | 5,731 | 2.0 | ||||||||||||||||
|
|
|
|
|
|
|
|
|
|||||||||||||
| Total certificates of deposit of $100,000 or more |
$ | 681,459 | $ | 780,071 | $ | (98,612 | ) | (12.6 | ) | |||||||||||
|
|
|
|
|
|
|
|
|
|||||||||||||
Interest expense on certificates of deposit of $100,000 or more totaled approximately $5.0 million, $4.9 million and $7.5 million in 2016, 2015 and 2014, respectively.
71
Table of Contents
BORROWINGS
TABLE 25. BORROWINGS
| December 31, | ||||||||||||||||
| (dollars in thousands) |
2016 | 2015 | $ Change | % Change |
||||||||||||
| Federal Home Loan Bank Borrowings |
$ | 968,946 | $ | 1,041,750 | $ | (72,804 | ) | (7.0 | ) | |||||||
| Other short-term borrowings |
199,376 | 81,355 | 118,021 | 145.1 | ||||||||||||
| Subordinated debentures and junior subordinated debt |
163,598 | 106,196 | 57,402 | 54.1 | ||||||||||||
|
|
|
|
|
|
|
|
|
|||||||||
| Total |
$ | 1,331,920 | $ | 1,229,301 | $ | 102,619 | 8.3 | |||||||||
|
|
|
|
|
|
|
|
|
|||||||||
Borrowings are a less significant source of funding for WesBanco as compared to total deposits. During 2016, FHLB borrowings decreased $72.8 million from December 31, 2015. The acquisition of YCB provided $21.3 million in FHLB borrowings, which were coupled with $255.0 million from WesBanco advances and were offset by $349.1 million in maturities, of which $20.0 million were acquired from YCB. WesBanco utilized funds provided by investment securities sales and other available cash flows, along with new borrowings, to fund the maturities.
WesBanco is a member of the FHLB system. The FHLB system functions as a borrowing source for regulated financial institutions that are engaged in residential and commercial real estate lending along with securities investing. WesBanco uses term FHLB borrowings as a general funding source and to more appropriately match interest maturities for certain assets. FHLB borrowings are secured by blanket liens on certain residential and other mortgage loans with a market value in excess of the outstanding borrowing balances. The terms of the security agreement with the FHLB include a specific assignment of collateral that requires the maintenance of qualifying mortgage and other types of loans as pledged collateral with unpaid principal amounts in excess of the FHLB advances, when discounted at certain pre-established percentages of the loans’ unpaid balances. FHLB stock, which is recorded at cost of $46.4 million at December 31, 2016, is also pledged as collateral for these advances. WesBanco’s remaining maximum borrowing capacity, subject to the collateral requirements noted, with the FHLB at December 31, 2016 and 2015 was estimated to be approximately $1.7 billion and $1.1 billion, respectively.
Other short-term borrowings, which may consist of federal funds purchased, callable repurchase agreements, overnight sweep checking accounts and borrowings on a revolving line of credit at December 31, 2016 were $199.4 million compared to $81.4 million at December 31, 2015. The YCB acquisition provided $44.3 million in other short-term borrowings. The YCB transaction also provided $26.1 million in subordinated debentures at the bank and $31.2 million in junior subordinated debentures at the parent company.
In September 2016, WesBanco renewed a revolving line of credit, which is a senior obligation of the parent company, with another financial institution. The revolving line of credit, which accrues interest at an adjusted LIBOR rate, provides for aggregate unsecured borrowings of up to $25.0 million. The new revolving line of credit also requires WesBanco to maintain at all times a consolidated four quarter average return on average assets of > 0.70%, a Texas ratio of less than 25% (broadly defined as the ratio of non-performing assets to tangible common equity and the allowance for loan losses), unencumbered cash and marketable securities of at least $12.0 million, and to maintain at all times on a consolidated basis and for the Bank a total risk-based capital ratio of > 12.0%, a Tier 1 risk-based capital ratio of > 10.0% and a Tier 1 leverage ratio of > 7.0%. WesBanco was in compliance with all terms and conditions at December 31, 2016. There was no outstanding balance as of December 31, 2016 or 2015.
72
Table of Contents
CONTRACTUAL OBLIGATIONS
TABLE 26. CONTRACTUAL OBLIGATIONS
| December 31, 2016 (1) | ||||||||||||||||||||||||||||||
| (in thousands) |
Footnote Reference |
Less than One Year |
One to Three Years |
Three to Five Years |
More Than Five Years |
Total | ||||||||||||||||||||||||
| Deposits without a stated maturity |
N/A | $ | 5,545,057 | $ | — | $ | — | $ | — | $ | 5,545,057 | |||||||||||||||||||
| Certificates of deposit |
9 | 840,796 | 400,571 | 218,506 | 35,949 | 1,495,822 | ||||||||||||||||||||||||
| Federal Home Loan Bank borrowings |
10 | 649,756 | 315,598 | 1,419 | 2,173 | 968,946 | ||||||||||||||||||||||||
| Other short term borrowings |
10 | 199,376 | — | — | — | 199,376 | ||||||||||||||||||||||||
| Subordinated debt and junior subordinated debt |
11 | — | — | — | 163,598 | 163,598 | ||||||||||||||||||||||||
| Future benefit payments under pension plans (2)(3) |
13 | 3,903 | 8,559 | 9,960 | 236,234 | 258,656 | ||||||||||||||||||||||||
| Director and executive officer retirement plans (2) |
N/A | 1,433 | 2,611 | 2,086 | 4,837 | 10,967 | ||||||||||||||||||||||||
| Consulting agreements (2) |
N/A | 42 | 57 | 50 | — | 149 | ||||||||||||||||||||||||
| Leases (2) |
6 | 4,340 | 6,189 | 4,915 | 14,649 | 30,093 | ||||||||||||||||||||||||
| Software licenses and maintenance agreements (2) |
N/A | 1,043 | 1,215 | — | — | 2,258 | ||||||||||||||||||||||||
| Naming rights |
N/A | 250 | 500 | 500 | 500 | 1,750 | ||||||||||||||||||||||||
| Limited partnership funding commitments |
8 | 2,498 | 4,176 | 870 | 845 | 8,389 | ||||||||||||||||||||||||
|
|
|
|
|
|
|
|
|
|
|
|||||||||||||||||||||
| Total |
$ | 7,248,494 | $ | 739,476 | $ | 238,306 | $ | 458,785 | $ | 8,685,061 | ||||||||||||||||||||
|
|
|
|
|
|
|
|
|
|
|
|||||||||||||||||||||
| (1) | Represents maturities of principal and excludes interest payments. |
| (2) | These payments are recognized as expense in the income statement when incurred and not necessarily at the time of payment. |
| (3) | Pension plan assets of $121.6 million were available at December 31, 2016 to absorb the undiscounted future estimated payments to plan participants. |
Significant fixed and determinable contractual obligations as of December 31, 2016 are presented in the table above by due date. The amounts shown do not include future interest payments, accrued interest or other similar carrying value adjustments. Additional information related to each obligation is included in the referenced footnote to the Consolidated Financial Statements.
WesBanco’s future benefit payments under pension plans are estimated based on actuarial assumptions and do not necessarily represent the actual contractual cash flows that may be required by WesBanco in the future. Please refer to Note 13, “Employee Benefit Plans,” of the Consolidated Financial Statements for more information on employee benefit plans.
OFF-BALANCE SHEET ARRANGEMENTS
WesBanco enters into financial instruments with off-balance sheet risk in the normal course of business to meet the financing needs of its customers. These financial instruments include commitments to extend credit, letters of credit, loans approved but not closed, overdraft limits and contingent obligations to purchase loans funded by other entities. Since many of these commitments expire unused or partially used, these commitments may not reflect future cash requirements. Please refer to Note 18, “Commitments and Contingent Liabilities,” of the Consolidated Financial Statements and the “Loans and Loan Commitments” section of this MD&A for additional information.
73
Table of Contents
CAPITAL RESOURCES
Shareholders’ equity increased to $1.3 billion at December 31, 2016 from $1.1 billion at December 31, 2015. The increase was due primarily to $177.1 million of common stock issued in the YCB acquisition, coupled with net income of $86.6 million, which was partially offset by the declaration of dividends to common shareholders of $39.5 million and a $6.2 million other comprehensive loss. The other comprehensive loss was due to an unrealized loss in the securities portfolio, coupled with a smaller unrealized loss in the defined benefit pension plan.
For 2016, common dividends increased to $0.96 per share, or 4.3% on an annualized basis, compared to $0.92 per share in 2015. The common dividend per share payout ratio increased to 44.4% in 2016 from 42.8% in 2015, which is primarily attributable to common dividends increasing more rapidly than earnings year-over-year. A board-approved policy generally targets dividends as a percent of net income in a range of 35% to 55%, subject to capital levels, earnings history and prospects, regulatory concerns, and other factors. The quarterly dividend was increased again in February 2017 to $0.26 per share, or 8.3%.
WesBanco purchased 133,678 shares during 2016 under the current share repurchase plans. Of these shares, 117,100 were open market purchases and occurred during the first quarter while 16,578 were shares purchased from employees for the payment of withholding taxes upon vesting of restricted stock during the second and fourth quarters. At December 31, 2016, the remaining shares authorized to be purchased under the current repurchase plans totaled 1,120,307 shares.
WesBanco is subject to risk-based capital guidelines that measure capital relative to risk-weighted assets and off-balance sheet instruments. WesBanco and its banking subsidiary WesBanco Bank maintain Tier 1 risk-based, total risk-based and Tier 1 leverage capital ratios significantly above minimum regulatory levels. WesBanco Bank paid $85.0 million in dividends to WesBanco during 2016, or 92.5% of the Bank’s net income. There are various legal limitations under federal and state laws that limit the payment of dividends from the Bank to the parent company. As of December 31, 2016, under FDIC and State of West Virginia regulations, WesBanco could receive, without prior regulatory approval, dividends of approximately $42.2 million from the Bank.
WesBanco currently has $163.6 million in subordinated debt and junior subordinated debt in its Consolidated Balance Sheet, $137.6 million of which is junior subordinated debt. For regulatory purposes, trust preferred securities totaling $138.0 million, issued by unconsolidated trust subsidiaries of WesBanco underlying such junior subordinated debt, is included in Tier 1 capital in accordance with current regulatory reporting requirements. A grandfather provision of the Dodd-Frank Act permits bank holding companies with consolidated assets of less than $15 billion, such as WesBanco, to continue counting existing trust preferred securities as Tier 1 capital until they mature. In July 2013, the U.S. federal banking agencies issued a joint final rule that implements the Basel III capital standards effective January 1, 2015 with a phase-in period ending January 1, 2019. The final capital rule establishes the minimum capital levels required under the Dodd-Frank Act, permanently grandfathers trust preferred securities issued before May 19, 2010, and increases the capital required for certain categories of assets.
Please refer to Note 21, “Regulatory Matters,” of the Consolidated Financial Statements for more information on capital amounts, ratios and minimum regulatory requirements. Also refer to “Item 1. Business” within this Annual Report on Form 10-K for more information on the Dodd-Frank Wall Street Reform and Consumer Protection Act and Basel III Capital Standards.
74
Table of Contents
LIQUIDITY RISK
Liquidity is defined as a financial institution’s capacity to meet its cash and collateral obligations at a reasonable cost. Liquidity risk is the risk that an institution’s financial condition or overall safety and soundness is adversely affected by an inability, or perceived inability, to meet its obligations. An institution’s obligations, and the funding sources to meet them, depend significantly on its business mix, balance sheet structure, and the cash flows of its on- and off-balance sheet obligations. Institutions confront various internal and external situations that can give rise to increased liquidity risk including funding mismatches, market constraints on funding sources, contingent liquidity events, changes in economic conditions, and exposure to credit, market, operation, legal and reputation risk. WesBanco actively manages liquidity risk through its ability to provide adequate funds to meet changes in loan demand, unexpected outflows in deposits and other borrowings as well as to take advantage of market opportunities and meet operating cash needs. This is accomplished by maintaining liquid assets in the form of securities, sufficient borrowing capacity and a stable core deposit base. Liquidity is centrally monitored by WesBanco’s Asset/Liability Committee (“ALCO”).
WesBanco determines the degree of required liquidity by the relationship of total holdings of liquid assets to the possible need for funds to meet unexpected deposit losses and/or loan demands. The ability to quickly convert assets to cash at a minimal loss is a primary function of WesBanco’s investment portfolio management. WesBanco believes its cash flow from the loan portfolio, the investment portfolio, and other sources, adequately meet its liquidity requirements. WesBanco’s net loans to assets ratio was 63.4% at December 31, 2016 and deposit balances funded 71.9% of assets.
The following table lists the sources of liquidity from assets at December 31, 2016 expected within the next year:
| (in thousands) |
||||
| Cash and cash equivalents |
$ | 128,170 | ||
| Securities with a maturity date within the next year and callable securities |
127,313 | |||
| Projected payments and prepayments on mortgage-backed securities and collateralized mortgage obligations (1) |
259,284 | |||
| Loans held for sale |
17,315 | |||
| Accruing loans scheduled to mature |
742,017 | |||
| Normal loan repayments |
762,039 | |||
|
|
|
|||
| Total sources of liquidity expected within the next year |
$ | 2,036,138 | ||
|
|
|
|||
| (1) | Projected prepayments are based on current prepayment speeds. |
Deposit flows are another principal factor affecting overall WesBanco liquidity. Deposits totaled $7.0 billion at December 31, 2016. Deposit flows are impacted by current interest rates, products and rates offered by WesBanco versus various forms of competition, as well as customer behavior. Certificates of deposit scheduled to mature within one year totaled $840.8 million at December 31, 2016, which includes jumbo regular certificates of deposit totaling $326.5 million with a weighted-average cost of 0.61%, and jumbo CDARS® deposits of $62.0 million with a weighted-average cost of 0.90%.
WesBanco maintains a line of credit with the FHLB as an additional funding source. Available credit with the FHLB at December 31, 2016 approximated $1.7 billion, compared to $1.1 billion at December 31, 2015. The FHLB requires securities to be specifically pledged to the FHLB and maintained in a FHLB-approved custodial arrangement if the member wishes to include such securities in the maximum borrowing capacity calculation. WesBanco has elected not to specifically pledge to the FHLB otherwise unpledged securities. At December 31, 2016, the Bank had unpledged available-for-sale securities with an amortized cost of $160.6 million. A portion of these securities could be sold for additional liquidity, or such securities could be pledged to secure additional FHLB borrowings. Available liquidity through the sale of investment securities is currently limited as only
75
Table of Contents
approximately 13% of the available-for-sale portfolio is unpledged, due to the pledging agreements that WesBanco has with their public deposit customers. Public deposit balances have increased significantly through the ESB and YCB acquisitions of the past two years. WesBanco’s held-to-maturity portfolio currently contains $856.7 million of unpledged securities, which generally can still be pledged. Except for limited, special circumstances, these securities cannot be sold without tainting the remainder of the held-to-maturity portfolio. If tainting occurs, all remaining securities with the held-to-maturity designation would be required to go to available-for-sale, and the held-to-maturity designation would not be available to WesBanco for several years.
WesBanco participates in the Federal Reserve Bank’s Borrower-in-Custody Program (“BIC”) whereby WesBanco pledges certain consumer loans as collateral for borrowings. At December 31, 2016, WesBanco had a BIC line of credit totaling $219.1 million, none of which was outstanding. Alternative funding sources may include the utilization of existing overnight lines of credit with third party banks totaling $285.0 million, of which $58.0 million was outstanding at December 31, 2016, along with seeking other lines of credit, borrowings under repurchase agreement lines, increasing deposit rates to attract additional funds, accessing brokered deposits, or selling securities available-for-sale or certain types of loans.
Other short-term borrowings of $141.4 million at December 31, 2016 consisted of callable repurchase agreements and overnight sweep checking accounts for large commercial customers. There has not been a significant fluctuation in the average deposit balances of the overnight sweep checking accounts during 2016. The overnight sweep checking accounts require U.S. Government securities to be pledged equal to or greater than the average deposit balance in the related customer accounts.
The principal sources of parent company liquidity are dividends from the Bank, $49.2 million in cash and investments on hand, and a $25.0 million revolving line of credit with another bank, which did not have an outstanding balance at December 31, 2016. WesBanco is in compliance with all loan covenants. There are various legal limitations under federal and state laws that limit the payment of dividends from the Bank to the parent company. As of December 31, 2016, under FDIC and State of West Virginia regulations, WesBanco could receive, without prior regulatory approval, dividends of approximately $42.2 million from the Bank. Management believes these are appropriate levels of cash for WesBanco given the current environment. Management continuously monitors the adequacy of parent company cash levels and sources of liquidity through the use of metrics that relate current cash levels to historical and forecasted cash inflows and outflows.
WesBanco had outstanding commitments to extend credit in the ordinary course of business approximating $1.8 billion and $1.5 billion at December 31, 2016 and 2015, respectively. On a historical basis, only a small portion of these commitments will result in an outflow of funds. Please refer to Note 18, “Commitments and Contingent Liabilities,” of the Consolidated Financial Statements and the “Loans and Loan Commitments” section of this MD&A for additional information.
Federal financial regulatory agencies previously have issued guidance to provide for sound practices for managing funding and liquidity risk and strengthening liquidity risk management practices. WesBanco maintains a comprehensive management process for identifying, measuring, monitoring, and controlling liquidity risk which is fully integrated into its risk management process. Management believes WesBanco has sufficient current liquidity to meet current obligations to borrowers, depositors and others as of December 31, 2016 and that WesBanco’s current liquidity risk management policies and procedures adequately address this guidance.
76
Table of Contents
COMPARISON OF 2015 VERSUS 2014
Net income for 2015 was $80.8 million or $2.15 per diluted share compared to $70.0 million or $2.39 per diluted share for 2014. Net income excluding after-tax merger-related expenses (non-GAAP measure) increased 24.2% to $88.0 million compared to $70.8 million for 2014, while diluted earnings per share, excluding after-tax merger-related expenses (non-GAAP measure), totaled $2.34, compared to $2.41 per share for 2014.
Net interest income increased $43.8 million or 22.6% in 2015 compared to 2014 due to a 29.9% increase in average earning assets, primarily through the ESB acquisition, and through a 6.7% increase in average loan balances, exclusive of ESB, partially offset by a 20 basis point decrease in the net interest margin. The net interest margin decreased to 3.41% in 2015 compared to 3.61% in 2014. The decrease in the net interest margin was primarily due to a change in the mix of investments to total average earning assets from 28.1% in 2014 to 32.3% in 2015, a 41 basis point decline in the average rate earned on securities due to lower yields from a restructuring of the ESB portfolio and a decrease of 14 basis points for total loans due to repricing of existing loans and competitive pricing on new loans. The lower rates were due to the low interest rate environment and were somewhat mitigated by a reduction in funding costs of 9 basis points.
The provision for credit losses increased 30.4% due to organic loan growth in 2015. Net charge-offs for 2015 as a percentage of average portfolio loans of 0.23% were unchanged from 2014. Non-performing loans, including TDRs, as well as criticized and classified loans, improved as a percentage of total portfolio loans from their pre-acquisition levels in the fourth quarter of 2014.
For 2015, non-interest income increased $6.0 million or 8.7% compared to 2014. Trust fees increased $0.8 million or 3.9% from customer and revenue development initiatives. Service charges on deposits increased $0.6 million or 3.8% from the addition of ESB and an overall evaluation of the fee schedule. Electronic banking fees increased $1.7 million or 13.0% from increases in transaction volume. Net securities brokerage revenue increased by $0.8 million or 11.1% through the addition of support and sales staff in several regions. Net gains on sales of mortgage loans increased $0.5 million or 29.1% from increases in originations and a larger percentage of originations being sold in the secondary market. Net losses on other assets improved by $1.4 million due to a $1.4 million charge in the third quarter of 2014 relating to the prepayment of certain repurchase agreements.
Non-interest expense increased $32.3 million or 20.0% in 2015, principally from the ESB acquisition which increased assets by $1.9 billion, excluding goodwill, and added 23 offices to our branch network. Salaries and wages increased $9.9 million or 14.7%, due to a 13.0% increase in average full-time equivalent employees from the merger and routine annual adjustments to compensation, partially offset by increased deferrals of compensation costs on new loan originations. Employee benefits expense increased $5.4 million or 25.0%, primarily from increased pension, health insurance, social security contributions and other benefit plan costs. Net occupancy increased $1.5 million principally due to increased building-related costs including utilities, lease expense, and depreciation. Equipment costs increased $1.7 million related to continuous improvements in computer system infrastructure, and origination and customer support systems. Amortization of intangible assets increased $1.2 million from additional ESB intangible assets related to core deposits and non-compete agreements.
The provision for federal and state income taxes increased to $28.4 million in 2015 compared to $23.7 million in 2014. The increase in income tax expense was due to a $15.5 million increase in pre-tax income, which caused a higher effective tax rate of 26.0% compared to 25.3% for 2014.
77
Table of Contents
ITEM 7A. QUANTITATIVE AND QUALITATIVE DISCLOSURES ABOUT MARKET RISK
The disclosures set forth in this item are qualified by the section captioned “Forward-Looking Statements” included in “Item 7. Management’s Discussion and Analysis of Financial Condition and Results of Operations” of this report.
MARKET RISK
The primary objective of WesBanco’s ALCO is to maximize net interest income within established policy parameters. This objective is accomplished through the management of balance sheet composition, market risk exposures arising from changing economic conditions and liquidity risk.
Market risk is defined as the risk of loss due to adverse changes in the fair value of financial instruments resulting from fluctuations in interest rates and equity prices. Management considers interest rate risk to be WesBanco’s most significant market risk. Interest rate risk is the exposure to adverse changes in net interest income due to changes in interest rates. The relative consistency of WesBanco’s net interest income is largely dependent on effective management of interest rate risk. As interest rates change in the market, rates earned on interest rate sensitive assets and rates paid on interest rate sensitive liabilities do not necessarily move concurrently. Differing rate sensitivities may arise because fixed rate assets and liabilities may not have the same maturities, or because variable rate assets and liabilities differ in the timing and/or the percentage of rate changes.
WesBanco’s ALCO is considered a Board-level committee with one current board member on the committee, as well as several members of senior management from various functional areas, including the Chief Executive Officer, the Chief Financial Officer, the Chief Risk Management Officer and the Senior Treasury Officer. It monitors and manages interest rate risk within Board approved policy limits. Interest rate risk is monitored primarily through the use of an earnings simulation model and an economic value-at-risk model to measure the fair value of net equity. These models are highly dependent on various assumptions, which change regularly as the balance sheet and market interest rates change. The key assumptions and strategies employed are analyzed and reviewed quarterly by the ALCO, while appropriate documentation is maintained in meeting minutes and treasury department files.
The earnings simulation model projects changes in net interest income resulting from the effect of changes in interest rates. Forecasting changes in net interest income requires management to make certain assumptions regarding loan and security prepayment rates, bond call dates, adjustments to various non-maturity deposit product rates, or “betas”, and decay rates for deposits, which may not necessarily reflect the manner in which actual yields and costs respond to changes in market interest rates. Assumptions used are based primarily on both historical experience and current market rates, and are periodically back-tested and reviewed by third-party experts. Security portfolio maturities and prepayments are assumed to be reinvested in similar instruments and callable bond forecasts are adjusted at varying levels of interest rates. While management believes such assumptions to be reasonable, there can be no assurance that assumed prepayment rates, callable bond forecasts and non-maturity deposit product behavior assumptions will approximate actual future results. Moreover, the net interest income sensitivity chart presented in Table 1, “Net Interest Income Sensitivity,” assumes that the balance sheet composition of interest sensitive assets and liabilities existing at the end of the period remains constant over the period being measured, and also assumes that a particular change in interest rates is reflected uniformly across the yield curve, regardless of the duration of the maturity or re-pricing of specific assets and liabilities. Since the assumptions used in the model relative to changes in interest rates are uncertain, the simulation analysis may not be indicative of actual results. In addition, the analysis may not consider all actions that management could employ in response to changes in interest rates and various earning asset and costing liability balances.
Management is aware of the significant effect inflation or deflation has upon interest rates and ultimately upon financial performance. WesBanco’s ability to cope with inflation or deflation is best determined by analyzing its capability to respond to changing market interest rates, as well as its ability to manage the various elements of non-interest income and expense during periods of increasing or decreasing inflation or deflation.
78
Table of Contents
WesBanco monitors the level and mix of interest-rate sensitive assets and liabilities through ALCO in order to reduce the impact of inflation or deflation on net interest income. Management also controls the effects of inflation or deflation by conducting periodic reviews of the prices and terms of its various products and services, both in terms of the costs to offer the services as well as outside market influences upon such pricing, by introducing new products and services or reducing the availability of existing products and services, and by controlling overhead expenses.
Interest rate risk policy limits are determined by measuring the anticipated change in net interest income over a twelve-month period assuming an immediate and sustained 100, 200, 300 and 400 basis point increase or decrease in market interest rates compared to a stable rate environment or base model. WesBanco’s current policy limits this exposure to a reduction of 10%, 12.5%, 15%, and 20% or less, respectively, of net interest income from the base model over a twelve-month period. The table below shows WesBanco’s interest rate sensitivity at December 31, 2016 and December 31, 2015 assuming the above-noted interest rate increases as compared to a base model. Due to the current lower interest rate environment, particularly for short-term rates, the 200 and 300 basis point decreasing change cannot be calculated due to the unrealistic nature of the results.
TABLE 1. NET INTEREST INCOME SENSITIVITY
| Immediate Change in Interest Rates (basis points) |
Percentage Change in Net Interest Income from Base over One Year |
ALCO Guidelines | ||||
| December 31, 2016 | December 31, 2015 | |||||
| +400 |
4.5% | N/A (1) | (20.0%) | |||
| +300 |
4.7% | 6.2% | (15.0%) | |||
| +200 |
4.6% | 5.5% | (12.5%) | |||
| +100 |
3.1% | 3.6% | (10.0%) | |||
| -100 |
(2.3%) | (2.7%) | (10.0%) | |||
| (1) | Up 400 basis points shock was not calculated prior to 2016. |
As per the table above, the earnings simulation model at December 31, 2016 currently projects that net interest income for the next twelve-month period would decrease by 2.3% if interest rates were to fall immediately by 100 basis points, compared to a decrease of 2.7% for the same scenario as of December 31, 2015.
For rising rate scenarios, net interest income would increase by 3.1%, 4.6%, 4.7% and 4.5% if rates were to increase by 100, 200, 300 and 400 basis points, respectively, as of December 31, 2016, compared to increases of 3.6%, 5.5% and 6.2% in a 100, 200 and 300 basis point increasing rate environment as of December 31, 2015.
The balance sheet remains asset sensitive as of December 31, 2016, as compared to December 31, 2015, with differences resulting from changes in the mix of and growth in various earning assets and costing liabilities, changes due to the acquisition of YCB, as well as periodic adjustments in modeling assumptions such as deposit beta rates and new loan and investment rates. Overall asset sensitivity in non-parallel rising rate scenarios may be somewhat neutralized due to slower prepayment speeds and extension risk associated with residential mortgages and mortgage-backed securities, as well as other earning asset and costing liability differences versus currently modeled assumptions. In addition, variable rate commercial loans with rate floors averaging 4.12% approximated $1.3 billion at December 31, 2016, which represent approximately 32% of commercial loans, as compared to $1.0 billion or 34% of commercial loans at December 31, 2015. Approximately 53% or $671.9 million of these loans are currently priced at their floor, as compared to 52% or $526.6 million at December 31, 2015. In a less than 100 basis point rising rate environment, these loans may not significantly re-price from their current floor level as compared to loans without floors. As a result of the December, 2016 federal funds rate increase affecting short-term market rates such as one and three month LIBOR, an index used frequently in the setting of commercial loan rates, fixed rate loan spreads, and back-to-back loan swaps for certain commercial loan customers, more commercial loans with floors should experience a rate increase in a rising rate environment of 100 basis points or more, which would assist overall asset sensitivity.
79
Table of Contents
Given the interest rate environment and flatter yield curve for much of 2016, affecting the repricing of loans and investments, WesBanco previously expected that the base case net interest margin would somewhat decrease without loan growth. However, post-YCB, the net interest margin is expected to increase 5 to 10 basis points as compared to the first three quarters of 2016 from the mix of the acquired earning assets and costing liabilities and the positive impact from purchase accounting adjustments on the net financial assets acquired from YCB. A margin increase of 10 basis points was experienced in the fourth quarter of 2016, the first full quarter after the acquisition, as compared to the third quarter margin. Net purchase accounting accretion is expected to decrease throughout 2017, offset somewhat by the asset sensitivity of the balance sheet in a rising rate scenario. Management currently anticipates that two additional short-term federal funds rate increases may occur during 2017, and potentially one to two more in 2018, relatively consistent with general market and consensus economist expectations. Delays in implementing further rate increases for an asset-sensitive balance sheet typically would have a negative impact on management’s estimates of the future direction and level of the net interest margin.
Maturities and repricing of higher-costing certificates of deposit prior to 2016 had the beneficial impact of mitigating compression from lower loan spreads in the current competitive loan environment, along with actual organic loan growth. However, with current CDs costing an average of 0.67%, this factor does not assist the net interest margin as new CD rates are generally similar to, or slightly higher than the rates on maturing CDs. While customers over the past few years have elected to move maturing CD balances to lower-costing transaction account types and non-deposit accounts, a portion of these balances may move to higher-costing CDs upon a more significant short-term rate increase over a period of time. Certificates of deposit runoff over the last two years, somewhat due to customer preferences for other deposit and non-deposit products from former single service customers at ESB and YCB and due to our own retail focus on customers with multiple relationships versus single service CD customers, has been replaced with FHLB borrowings and other short-term borrowings. Certificates of deposit totaling approximately $840.8 million mature within the next year at an average cost of 0.56%. The decrease in FHLB borrowings in 2016 replaced with other short-term borrowings, was somewhat intended to reduce balance sheet asset sensitivity in a continuing low rate environment before the YCB acquisition and fourth quarter short-term market rate increases. Such borrowings may be lengthened in 2017 as they mature, at a higher cost, to improve various short-term liquidity ratios that management monitors, and in anticipation of further rate increases over the course of the next two years. Also, management is currently controlling the size of the balance sheet after the YCB acquisition, to remain under $10 billion in total assets for some period of time, currently anticipated through the end of 2017 or into 2018. In anticipation of the merger, which occurred September 9, 2016, management elected to reduce the size of the investment portfolio by approximately $200 million, in combination with YCB’s pre-acquisition investment portfolio, and pay-down certain borrowings and higher cost wholesale CDs.
The Bank has significant additional borrowing capacity with the FHLB of Pittsburgh, the Federal Reserve Bank of Cleveland, and various correspondent banks, and may utilize these funding sources or interest rate swaps as necessary to lengthen liabilities, help offset mismatches in various asset maturities, and manage short-term cash needs. CDARS® and ICS® deposits also continue to be used to lengthen maturities in certificates of deposit, and for customers seeking higher-yielding instruments and/or to maintain their total deposit levels below FDIC insurance limits.
Current balance sheet strategies to manage the net interest margin in the expected rate environment include:
| • | increasing total loans; primarily commercial and home equity loans that have variable or adjustable rates; |
| • | selling an increasing amount of new residential mortgage loan production into the secondary market: |
| • | increasing available short-term liquidity; |
| • | continuing marketing programs to increase home equity loans and demand deposit account types; |
80
Table of Contents
| • | employing back-to-back loan swaps for customers desiring a longer-term fixed rate loan such that the Bank receives a variable rate; |
| • | re-mixing a portion of investment securities cash flows into loans based upon demand, or into new investments such as medium duration MBS and CMO securities and 10—15 year tax-exempt municipal securities; |
| • | extending or renewing FHLB term borrowings as necessary to balance asset/liability mismatches, |
| • | using the CDARS® and ICS® deposit programs as necessary to manage overall liability mix, and |
| • | managing the overall size of the balance sheet to remain under $10 billion in total assets on an organic basis to avoid certain costs associated with the Dodd-Frank Act. |
As an alternative to the immediate rate shock analysis, the ALCO monitors interest rate risk by ramping or increasing interest rates 200 basis points gradually over a twelve-month period. WesBanco’s current policy limits this exposure to a change of minus 10% in net interest income from the base model for a twelve-month period and also for an extended two year rate ramp of 400 basis points. Management believes that the ramping analysis reflects a more realistic movement of interest rates, whereas the immediate rate shock reflects a less likely scenario. The simulation model at December 31, 2016 using the 200 basis point increasing rate ramp analysis, projects that net interest income would increase 3.2% over the next twelve months, compared to a 3.0% increase at December 31, 2015. For the first twelve months of a 400 basis point rate ramp over two years, the increase in net interest income would be 3.9% in year one as compared to the base, and 7.1% in year two when compared year two’s base. In addition, management utilizes a most likely forecast scenario to forecast net interest income over a rolling two year time frame, which is updated and reviewed quarterly, incorporating current budget or re-forecast assumptions into the model such as estimated loan and deposit growth, asset and liability re-mixing, competitive market rates for various products and marketing promotions, and other assumptions. Such model helps to predict changes in forecasted outcomes and necessary adjustments to the plan to achieve management’s budgeted earnings goals.
On at least a quarterly basis, WesBanco measures the economic value of equity, which is defined as the market value of tangible equity in various increasing and decreasing rate scenarios. At December 31, 2016, the market value of tangible equity as a percent of base in a 200 basis point rising rate environment indicates an increase of 6.7%, compared to an increase of 1.9% at December 31, 2015. In a 100 basis point falling rate environment, the model indicates a decrease of 9.8%, compared to a decrease of 8.8% as of December 31, 2015. WesBanco’s policy is to limit such change to minus 10% for a 100 basis point change in interest rates, minus 20% for a 200 basis point change in interest rates, minus 30% for a 300 basis point rate change in interest rates, and minus 40% for a 400 basis point rate change in interest rates. The acquisition of YCB and related changes to various assets and liabilities, as well as certain changes to the market values associated with non-maturity deposits, which are periodically updated by an independent third-party vendor contracted by WesBanco, caused the change in market value of tangible equity as compared to December 31, 2015.
81
Table of Contents
MANAGEMENT’S REPORT ON INTERNAL CONTROL OVER FINANCIAL REPORTING
The management of WesBanco is responsible for establishing and maintaining adequate internal control over financial reporting. WesBanco’s internal control over financial reporting is a process designed under the supervision of WesBanco’s chief executive officer and chief financial officer to provide reasonable assurance regarding the reliability of financial reporting and the preparation of WesBanco’s financial statements for external reporting purposes in accordance with U.S. generally accepted accounting principles.
WesBanco’s management assessed the effectiveness of WesBanco’s internal control over financial reporting as of December 31, 2016 based on criteria established in Internal Control—Integrated Framework issued by the Committee of Sponsoring Organizations of the Treadway Commission (2013 framework) (the COSO criteria). Based on the assessment, management determined that, as of December 31, 2016, WesBanco’s internal control over financial reporting is effective, based on the COSO criteria. The effectiveness of WesBanco’s internal control over financial reporting as of December 31, 2016 has been audited by Ernst & Young LLP, WesBanco’s independent registered public accounting firm, as stated in their attestation report appearing below.
| /s/ Todd F. Clossin |
/s/ Robert H. Young | |
| Todd F. Clossin | Robert H. Young | |
| President and Chief Executive Officer | Executive Vice President and Chief Financial Officer |
82
Table of Contents
Report of Independent Registered Public Accounting Firm
The Board of Directors and Shareholders of WesBanco, Inc.
We have audited WesBanco, Inc.’s internal control over financial reporting as of December 31, 2016, based on criteria established in Internal Control—Integrated Framework issued by the Committee of Sponsoring Organizations of the Treadway Commission 2013 framework (the COSO criteria). WesBanco, Inc.’s management is responsible for maintaining effective internal control over financial reporting, and for its assessment of the effectiveness of internal control over financial reporting included in the accompanying Management’s Report on Internal Control Over Financial Reporting. Our responsibility is to express an opinion on the company’s internal control over financial reporting based on our audit.
We conducted our audit in accordance with the standards of the Public Company Accounting Oversight Board (United States). Those standards require that we plan and perform the audit to obtain reasonable assurance about whether effective internal control over financial reporting was maintained in all material respects. Our audit included obtaining an understanding of internal control over financial reporting, assessing the risk that a material weakness exists, testing and evaluating the design and operating effectiveness of internal control based on the assessed risk, and performing such other procedures as we considered necessary in the circumstances. We believe that our audit provides a reasonable basis for our opinion.
A company’s internal control over financial reporting is a process designed to provide reasonable assurance regarding the reliability of financial reporting and the preparation of financial statements for external purposes in accordance with generally accepted accounting principles. A company’s internal control over financial reporting includes those policies and procedures that (1) pertain to the maintenance of records that, in reasonable detail, accurately and fairly reflect the transactions and dispositions of the assets of the company; (2) provide reasonable assurance that transactions are recorded as necessary to permit preparation of financial statements in accordance with generally accepted accounting principles, and that receipts and expenditures of the company are being made only in accordance with authorizations of management and directors of the company; and (3) provide reasonable assurance regarding prevention or timely detection of unauthorized acquisition, use, or disposition of the company’s assets that could have a material effect on the financial statements.
Because of its inherent limitations, internal control over financial reporting may not prevent or detect misstatements. Also, projections of any evaluation of effectiveness to future periods are subject to the risk that controls may become inadequate because of changes in conditions, or that the degree of compliance with the policies or procedures may deteriorate.
In our opinion, WesBanco, Inc. maintained, in all material respects, effective internal control over financial reporting as of December 31, 2016, based on the COSO criteria.
We also have audited, in accordance with the standards of the Public Company Accounting Oversight Board (United States), the consolidated balance sheets of WesBanco Inc. as of December 31, 2016 and 2015, and the related consolidated statements of income, comprehensive income, changes in shareholders’ equity and cash flows for each of the three years in the period ended December 31, 2016, of WesBanco, Inc. and our report dated February 24, 2017 expressed an unqualified opinion thereon.
/s/ Ernst & Young LLP
Pittsburgh, Pennsylvania
February 24, 2017
83
Table of Contents
| ITEM 8. | FINANCIAL STATEMENTS AND SUPPLEMENTARY DATA |
Report of Independent Registered Public Accounting Firm
The Board of Directors and Shareholders of WesBanco, Inc.
We have audited the accompanying consolidated balance sheets of WesBanco, Inc. as of December 31, 2016 and 2015, and the related consolidated statements of income, comprehensive income, changes in shareholders’ equity and cash flows for each of the three years in the period ended December 31, 2016. These financial statements are the responsibility of the Company’s management. Our responsibility is to express an opinion on these financial statements based on our audits.
We conducted our audits in accordance with the standards of the Public Company Accounting Oversight Board (United States). Those standards require that we plan and perform the audit to obtain reasonable assurance about whether the financial statements are free of material misstatement. An audit includes examining, on a test basis, evidence supporting the amounts and disclosures in the financial statements. An audit also includes assessing the accounting principles used and significant estimates made by management, as well as evaluating the overall financial statement presentation. We believe that our audits provide a reasonable basis for our opinion.
In our opinion, the financial statements referred to above present fairly, in all material respects, the consolidated financial position of WesBanco, Inc. at December 31, 2016 and 2015, and the consolidated results of its operations and its cash flows for each of the three years in the period ended December 31, 2016, in conformity with U.S. generally accepted accounting principles.
We also have audited, in accordance with the standards of the Public Company Accounting Oversight Board (United States), WesBanco Inc.’s internal control over financial reporting as of December 31, 2016, based on criteria established in Internal Control-Integrated Framework issued by the Committee of Sponsoring Organizations of the Treadway Commission (2013 framework), and our report dated February 24, 2017 expressed an unqualified opinion thereon.
/s/ Ernst & Young LLP
Pittsburgh, Pennsylvania
February 24, 2017
84
Table of Contents
WESBANCO, INC. CONSOLIDATED BALANCE SHEETS
| December 31, | ||||||||
| (in thousands, except shares) |
2016 | 2015 | ||||||
| ASSETS |
||||||||
| Cash and due from banks, including interest bearing amounts of $21,913 and $10,978, respectively |
$ | 128,170 | $ | 86,685 | ||||
| Securities: |
||||||||
| Trading securities, at fair value |
7,071 | 6,451 | ||||||
| Available-for-sale, at fair value |
1,241,176 | 1,403,069 | ||||||
| Held-to-maturity (fair values of $1,076,790 and $1,038,207, respectively) |
1,067,967 | 1,012,930 | ||||||
|
|
|
|
|
|||||
| Total securities |
2,316,214 | 2,422,450 | ||||||
|
|
|
|
|
|||||
| Loans held for sale |
17,315 | 7,899 | ||||||
|
|
|
|
|
|||||
| Portfolio loans, net of unearned income |
6,249,436 | 5,065,842 | ||||||
| Allowance for loan losses |
(43,674 | ) | (41,710 | ) | ||||
|
|
|
|
|
|||||
| Net portfolio loans |
6,205,762 | 5,024,132 | ||||||
|
|
|
|
|
|||||
| Premises and equipment, net |
133,297 | 112,203 | ||||||
| Accrued interest receivable |
28,299 | 25,759 | ||||||
| Goodwill and other intangible assets, net |
593,187 | 490,888 | ||||||
| Bank-owned life insurance |
188,145 | 150,980 | ||||||
| Other assets |
180,488 | 149,302 | ||||||
|
|
|
|
|
|||||
| Total Assets |
$ | 9,790,877 | $ | 8,470,298 | ||||
|
|
|
|
|
|||||
| LIABILITIES |
||||||||
| Deposits: |
||||||||
| Non-interest bearing demand |
$ | 1,789,522 | $ | 1,311,455 | ||||
| Interest bearing demand |
1,546,890 | 1,152,071 | ||||||
| Money market |
995,477 | 967,561 | ||||||
| Savings deposits |
1,213,168 | 1,077,374 | ||||||
| Certificates of deposit |
1,495,822 | 1,557,838 | ||||||
|
|
|
|
|
|||||
| Total deposits |
7,040,879 | 6,066,299 | ||||||
|
|
|
|
|
|||||
| Federal Home Loan Bank borrowings |
968,946 | 1,041,750 | ||||||
| Other short-term borrowings |
199,376 | 81,356 | ||||||
| Subordinated debt and junior subordinated debt |
163,598 | 106,196 | ||||||
|
|
|
|
|
|||||
| Total borrowings |
1,331,920 | 1,229,302 | ||||||
|
|
|
|
|
|||||
| Accrued interest payable |
2,204 | 1,715 | ||||||
| Other liabilities |
74,466 | 50,850 | ||||||
|
|
|
|
|
|||||
| Total Liabilities |
8,449,469 | 7,348,166 | ||||||
|
|
|
|
|
|||||
| SHAREHOLDERS’ EQUITY |
||||||||
| Preferred Stock, no par value; 1,000,000 shares authorized; none outstanding |
— | — | ||||||
| Common stock, $2.0833 par value; 100,000,000 shares authorized; 43,931,715 and 38,546,042 shares issued in 2016 and 2015, respectively; 43,931,715 and 38,459,635 shares outstanding in 2016 and 2015, respectively |
91,524 | 80,304 | ||||||
| Capital surplus |
680,507 | 516,294 | ||||||
| Retained earnings |
597,071 | 549,921 | ||||||
| Treasury stock (0 shares and 86,407 shares in 2016 and 2015, respectively, at cost) |
— | (2,640 | ) | |||||
| Accumulated other comprehensive loss |
(27,126 | ) | (20,954 | ) | ||||
| Deferred benefits for directors |
(568 | ) | (793 | ) | ||||
|
|
|
|
|
|||||
| Total Shareholders’ Equity |
1,341,408 | 1,122,132 | ||||||
|
|
|
|
|
|||||
| Total Liabilities and Shareholders’ Equity |
$ | 9,790,877 | $ | 8,470,298 | ||||
|
|
|
|
|
|||||
See Notes to Consolidated Financial Statements.
85
Table of Contents
WESBANCO, INC. CONSOLIDATED STATEMENTS OF INCOME
| For the years ended December 31, | ||||||||||||
| (in thousands, except shares and per share amounts) |
2016 | 2015 | 2014 | |||||||||
| INTEREST AND DIVIDEND INCOME |
||||||||||||
| Loans, including fees |
$ | 226,993 | $ | 203,993 | $ | 172,182 | ||||||
| Interest and dividends on securities: |
||||||||||||
| Taxable |
38,490 | 39,314 | 29,233 | |||||||||
| Tax-exempt |
18,390 | 16,764 | 13,589 | |||||||||
|
|
|
|
|
|
|
|||||||
| Total interest and dividends on securities |
56,880 | 56,078 | 42,822 | |||||||||
|
|
|
|
|
|
|
|||||||
| Other interest income |
2,224 | 1,641 | 987 | |||||||||
|
|
|
|
|
|
|
|||||||
| Total interest and dividend income |
286,097 | 261,712 | 215,991 | |||||||||
|
|
|
|
|
|
|
|||||||
| INTEREST EXPENSE |
||||||||||||
| Interest bearing demand deposits |
2,817 | 1,943 | 1,568 | |||||||||
| Money market deposits |
1,860 | 1,914 | 1,877 | |||||||||
| Savings deposits |
696 | 640 | 532 | |||||||||
| Certificates of deposit |
10,419 | 11,033 | 13,286 | |||||||||
|
|
|
|
|
|
|
|||||||
| Total interest expense on deposits |
15,792 | 15,530 | 17,263 | |||||||||
|
|
|
|
|
|
|
|||||||
| Federal Home Loan Bank borrowings |
11,985 | 5,510 | 968 | |||||||||
| Other short-term borrowings |
478 | 370 | 1,333 | |||||||||
| Subordinated debt and junior subordinated debt |
4,512 | 3,315 | 3,199 | |||||||||
|
|
|
|
|
|
|
|||||||
| Total interest expense |
32,767 | 24,725 | 22,763 | |||||||||
|
|
|
|
|
|
|
|||||||
| NET INTEREST INCOME |
253,330 | 236,987 | 193,228 | |||||||||
| Provision for credit losses |
8,478 | 8,353 | 6,405 | |||||||||
|
|
|
|
|
|
|
|||||||
| Net interest income after provision for credit losses |
244,852 | 228,634 | 186,823 | |||||||||
|
|
|
|
|
|
|
|||||||
| NON-INTEREST INCOME |
||||||||||||
| Trust fees |
21,630 | 21,900 | 21,069 | |||||||||
| Service charges on deposits |
18,333 | 16,743 | 16,135 | |||||||||
| Electronic banking fees |
15,596 | 14,361 | 12,708 | |||||||||
| Net securities brokerage revenue |
6,449 | 7,692 | 6,922 | |||||||||
| Bank-owned life insurance |
4,064 | 4,863 | 4,614 | |||||||||
| Net gains on sales of mortgage loans |
2,529 | 2,071 | 1,604 | |||||||||
| Net securities gains |
2,357 | 948 | 903 | |||||||||
| Net gain / (loss) on other real estate owned and other assets |
790 | 356 | (1,006 | ) | ||||||||
| Other income |
9,751 | 5,532 | 5,555 | |||||||||
|
|
|
|
|
|
|
|||||||
| Total non-interest income |
81,499 | 74,466 | 68,504 | |||||||||
|
|
|
|
|
|
|
|||||||
| NON-INTEREST EXPENSE |
||||||||||||
| Salaries and wages |
84,281 | 77,340 | 67,408 | |||||||||
| Employee benefits |
27,952 | 26,896 | 21,518 | |||||||||
| Net occupancy |
14,664 | 13,635 | 12,122 | |||||||||
| Equipment |
14,543 | 13,194 | 11,542 | |||||||||
| Marketing |
5,391 | 5,646 | 5,242 | |||||||||
| FDIC insurance |
3,990 | 4,107 | 3,376 | |||||||||
| Amortization of intangible assets |
3,598 | 3,136 | 1,920 | |||||||||
| Restructuring and merger-related expense |
13,261 | 11,082 | 1,309 | |||||||||
| Other operating expenses |
41,000 | 38,887 | 37,196 | |||||||||
|
|
|
|
|
|
|
|||||||
| Total non-interest expense |
208,680 | 193,923 | 161,633 | |||||||||
|
|
|
|
|
|
|
|||||||
| Income before provision for income taxes |
117,671 | 109,177 | 93,694 | |||||||||
| Provision for income taxes |
31,036 | 28,415 | 23,720 | |||||||||
|
|
|
|
|
|
|
|||||||
| NET INCOME |
$ | 86,635 | $ | 80,762 | $ | 69,974 | ||||||
|
|
|
|
|
|
|
|||||||
| EARNINGS PER COMMON SHARE |
||||||||||||
| Basic |
$ | 2.16 | $ | 2.15 | $ | 2.39 | ||||||
| Diluted |
2.16 | 2.15 | 2.39 | |||||||||
|
|
|
|
|
|
|
|||||||
| AVERAGE COMMON SHARES OUTSTANDING |
||||||||||||
| Basic |
40,100,320 | 37,488,331 | 29,249,499 | |||||||||
| Diluted |
40,127,076 | 37,547,127 | 29,333,876 | |||||||||
|
|
|
|
|
|
|
|||||||
| DIVIDENDS DECLARED PER COMMON SHARE |
$ | 0.96 | $ | 0.92 | $ | 0.88 | ||||||
|
|
|
|
|
|
|
|||||||
See Notes to Consolidated Financial Statements.
86
Table of Contents
WESBANCO, INC. CONSOLIDATED STATEMENTS OF COMPREHENSIVE INCOME
| For the years ended December 31, | ||||||||||||
| (in thousands) |
2016 | 2015 | 2014 | |||||||||
| Net income |
$ | 86,635 | $ | 80,762 | $ | 69,974 | ||||||
| Securities available-for-sale: |
||||||||||||
| Net change in unrealized (losses) gains on securities available-for-sale |
(6,761 | ) | (10,552 | ) | 15,242 | |||||||
| Related income tax benefit (expense) |
2,461 | 3,875 | (5,604 | ) | ||||||||
| Net securities gains reclassified into earnings |
(2,251 | ) | (596 | ) | (981 | ) | ||||||
| Related income tax expense |
823 | 219 | 361 | |||||||||
|
|
|
|
|
|
|
|||||||
| Net effect on other comprehensive income for the period |
(5,728 | ) | (7,054 | ) | 9,018 | |||||||
|
|
|
|
|
|
|
|||||||
| Securities held-to-maturity: |
||||||||||||
| Amortization of unrealized gain transferred from available-for-sale |
(357 | ) | (494 | ) | (472 | ) | ||||||
| Related income tax expense |
132 | 182 | 173 | |||||||||
|
|
|
|
|
|
|
|||||||
| Net effect on other comprehensive income for the period |
(225 | ) | (312 | ) | (299 | ) | ||||||
|
|
|
|
|
|
|
|||||||
| Defined benefit pension plan: |
||||||||||||
| Amortization of net loss and prior service costs |
3,046 | 3,205 | 1,516 | |||||||||
| Related income tax benefit |
(1,153 | ) | (1,201 | ) | (558 | ) | ||||||
| Recognition of unrealized (loss) gain |
(3,329 | ) | 5,106 | (24,934 | ) | |||||||
| Related income tax benefit (expense) |
1,217 | (1,873 | ) | 9,166 | ||||||||
|
|
|
|
|
|
|
|||||||
| Net effect on other comprehensive income for the period |
(219 | ) | 5,237 | (14,810 | ) | |||||||
|
|
|
|
|
|
|
|||||||
| Total other comprehensive loss |
(6,172 | ) | (2,129 | ) | (6,091 | ) | ||||||
|
|
|
|
|
|
|
|||||||
| Comprehensive income |
$ | 80,463 | $ | 78,633 | $ | 63,883 | ||||||
|
|
|
|
|
|
|
|||||||
See Notes to Consolidated Financial Statements.
87
Table of Contents
WESBANCO, INC. CONSOLIDATED STATEMENTS OF CHANGES IN SHAREHOLDERS’ EQUITY
| For the years ended December 31, 2016, 2015 and 2014 | ||||||||||||||||||||||||||||||||
| Common Stock | Capital Surplus |
Retained Earnings |
Treasury Stock |
Accumulated Other Comprehensive Loss |
Deferred Benefits for Directors |
Total | ||||||||||||||||||||||||||
| (dollars in thousands, except |
Shares Outstanding |
Amount | ||||||||||||||||||||||||||||||
| January 1, 2014 |
29,175,236 | $ | 61,182 | $ | 244,974 | $ | 460,351 | $ | (5,969 | ) | $ | (12,734 | ) | $ | (1,209 | ) | $ | 746,595 | ||||||||||||||
|
|
|
|
|
|
|
|
|
|
|
|
|
|
|
|
|
|||||||||||||||||
| Net income |
— | — | — | 69,974 | — | — | — | 69,974 | ||||||||||||||||||||||||
| Other comprehensive loss |
— | — | — | — | — | (6,091 | ) | — | (6,091 | ) | ||||||||||||||||||||||
|
|
|
|||||||||||||||||||||||||||||||
| Comprehensive income |
63,883 | |||||||||||||||||||||||||||||||
| Common dividends declared ($0.88 per share) |
— | — | — | (25,747 | ) | — | — | — | (25,747 | ) | ||||||||||||||||||||||
| Stock options exercised |
82,656 | — | (399 | ) | — | 2,566 | — | — | 2,167 | |||||||||||||||||||||||
| Restricted stock granted |
42,554 | — | (1,321 | ) | — | 1,321 | — | — | — | |||||||||||||||||||||||
| Treasury shares acquired |
(2,258 | ) | — | 49 | — | (69 | ) | — | — | (20 | ) | |||||||||||||||||||||
| Stock compensation expense |
— | — | 1,312 | — | — | — | — | 1,312 | ||||||||||||||||||||||||
| Deferred benefits for directors—net |
— | — | 46 | — | — | — | (46 | ) | — | |||||||||||||||||||||||
|
|
|
|
|
|
|
|
|
|
|
|
|
|
|
|
|
|||||||||||||||||
| December 31, 2014 |
29,298,188 | $ | 61,182 | $ | 244,661 | $ | 504,578 | $ | (2,151 | ) | $ | (18,825 | ) | $ | (1,255 | ) | $ | 788,190 | ||||||||||||||
|
|
|
|
|
|
|
|
|
|
|
|
|
|
|
|
|
|||||||||||||||||
| Net income |
— | — | — | 80,762 | — | — | — | 80,762 | ||||||||||||||||||||||||
| Other comprehensive loss |
— | — | — | — | — | (2,129 | ) | — | (2,129 | ) | ||||||||||||||||||||||
|
|
|
|||||||||||||||||||||||||||||||
| Comprehensive income |
78,633 | |||||||||||||||||||||||||||||||
| Common dividends declared ($0.92 per share) |
— | — | — | (35,419 | ) | — | — | — | (35,419 | ) | ||||||||||||||||||||||
| Shares issued for acquisition |
9,178,531 | 19,122 | 274,507 | — | — | — | — | 293,629 | ||||||||||||||||||||||||
| Stock options exercised |
60,275 | — | (324 | ) | — | 1,925 | — | — | 1,601 | |||||||||||||||||||||||
| Restricted stock granted |
49,550 | — | (1,558 | ) | — | 1,558 | — | — | — | |||||||||||||||||||||||
| Repurchase of stock warrant |
— | — | (2,247 | ) | — | — | — | — | (2,247 | ) | ||||||||||||||||||||||
| Treasury shares acquired |
(126,909 | ) | — | 51 | — | (3,972 | ) | — | — | (3,921 | ) | |||||||||||||||||||||
| Stock compensation expense |
— | — | 1,666 | — | — | — | — | 1,666 | ||||||||||||||||||||||||
| Deferred benefits for directors—net |
— | — | (462 | ) | — | — | — | 462 | — | |||||||||||||||||||||||
|
|
|
|
|
|
|
|
|
|
|
|
|
|
|
|
|
|||||||||||||||||
| December 31, 2015 |
38,459,635 | $ | 80,304 | $ | 516,294 | $ | 549,921 | $ | (2,640 | ) | $ | (20,954 | ) | $ | (793 | ) | $ | 1,122,132 | ||||||||||||||
|
|
|
|
|
|
|
|
|
|
|
|
|
|
|
|
|
|||||||||||||||||
| Net income |
— | — | — | 86,635 | — | — | — | 86,635 | ||||||||||||||||||||||||
| Other comprehensive loss |
— | — | — | — | — | (6,172 | ) | — | (6,172 | ) | ||||||||||||||||||||||
|
|
|
|||||||||||||||||||||||||||||||
| Comprehensive income |
80,463 | |||||||||||||||||||||||||||||||
| Common dividends declared ($0.96 per share) |
— | — | — | (39,485 | ) | — | — | — | (39,485 | ) | ||||||||||||||||||||||
| Shares issued for acquisition |
5,423,348 | 11,071 | 162,934 | — | 3,144 | — | — | 177,149 | ||||||||||||||||||||||||
| Stock options exercised |
101,190 | 139 | 1,707 | — | 1,074 | — | — | 2,920 | ||||||||||||||||||||||||
| Restricted stock granted |
81,220 | 10 | (2,281 | ) | — | 2,271 | — | — | — | |||||||||||||||||||||||
| Treasury shares acquired |
(133,678 | ) | — | 56 | — | (3,849 | ) | — | — | (3,793 | ) | |||||||||||||||||||||
| Stock compensation expense |
— | — | 2,022 | — | — | — | — | 2,022 | ||||||||||||||||||||||||
| Deferred benefits for directors—net |
— | — | (225 | ) | — | — | — | 225 | — | |||||||||||||||||||||||
|
|
|
|
|
|
|
|
|
|
|
|
|
|
|
|
|
|||||||||||||||||
| December 31, 2016 |
43,931,715 | $ | 91,524 | $ | 680,507 | $ | 597,071 | $ | — | $ | (27,126 | ) | $ | (568 | ) | $ | 1,341,408 | |||||||||||||||
|
|
|
|
|
|
|
|
|
|
|
|
|
|
|
|
|
|||||||||||||||||
See Notes to Consolidated Financial Statements.
88
Table of Contents
WESBANCO, INC. CONSOLIDATED STATEMENTS OF CASH FLOWS
| For the Years Ended December 31, | ||||||||||||
| (in thousands) |
2016 | 2015 | 2014 | |||||||||
| OPERATING ACTIVITIES |
|
|||||||||||
| Net income |
$ | 86,635 | $ | 80,762 | $ | 69,974 | ||||||
| Adjustments to reconcile net income to net cash provided by operating activities: |
||||||||||||
| Depreciation and amortization of premises and equipment |
9,242 | 8,122 | 7,386 | |||||||||
| Other net amortization |
8,768 | 6,460 | 1,742 | |||||||||
| Provision for credit losses |
8,478 | 8,353 | 6,405 | |||||||||
| Net securities gains |
(2,357 | ) | (948 | ) | (903 | ) | ||||||
| Net gains on sales of mortgage loans |
(2,529 | ) | (2,071 | ) | (1,604 | ) | ||||||
| Decrease in deferred income tax assets |
10,824 | 10,665 | 8,690 | |||||||||
| Increase in cash surrender value of bank-owned life insurance |
(4,064 | ) | (4,863 | ) | (4,614 | ) | ||||||
| Contribution to pension plan |
(5,750 | ) | (7,500 | ) | (7,500 | ) | ||||||
| Loans originated for sale |
(167,370 | ) | (135,892 | ) | (102,321 | ) | ||||||
| Proceeds from the sale of loans originated for sale |
159,831 | 135,928 | 103,916 | |||||||||
| Net change in: accrued interest receivable and other assets |
13,137 | (4,293 | ) | 10,205 | ||||||||
| Net change in: accrued interest payable and other liabilities |
7,404 | (7,988 | ) | (1,896 | ) | |||||||
| Other—net |
1,448 | 1,914 | 5,328 | |||||||||
|
|
|
|
|
|
|
|||||||
| Net cash provided by operating activities |
123,697 | 88,649 | 94,808 | |||||||||
|
|
|
|
|
|
|
|||||||
| INVESTING ACTIVITIES |
||||||||||||
| Net increase in loans held for investment |
(174,952 | ) | (293,306 | ) | (199,760 | ) | ||||||
| Securities available-for-sale: |
||||||||||||
| Proceeds from sales |
277,225 | 635,609 | 16,249 | |||||||||
| Proceeds from maturities, prepayments and calls |
285,318 | 319,370 | 214,934 | |||||||||
| Purchases of securities |
(214,514 | ) | (526,765 | ) | (201,272 | ) | ||||||
| Securities held-to-maturity: |
||||||||||||
| Proceeds from maturities, prepayments and calls |
110,954 | 75,295 | 47,820 | |||||||||
| Purchases of securities |
(93,444 | ) | (390,471 | ) | (45,955 | ) | ||||||
| Net cash received (paid) to acquire a business |
4,863 | (28,551 | ) | — | ||||||||
| Proceeds from bank-owned life insurance |
19 | 7,803 | 2,352 | |||||||||
| Purchases of premises and equipment—net |
(2,061 | ) | (9,575 | ) | (7,374 | ) | ||||||
| Sale of portfolio loans—net |
560 | — | — | |||||||||
|
|
|
|
|
|
|
|||||||
| Net cash provided (used in) by investing activities |
193,968 | (210,591 | ) | (173,006 | ) | |||||||
|
|
|
|
|
|
|
|||||||
| FINANCING ACTIVITIES |
||||||||||||
| Decrease in deposits |
(216,785 | ) | (233,684 | ) | (12,869 | ) | ||||||
| Proceeds from Federal Home Loan Bank borrowings |
140,000 | 941,910 | 200,532 | |||||||||
| Repayment of Federal Home Loan Bank borrowings |
(233,988 | ) | (515,388 | ) | (16,775 | ) | ||||||
| Increase (decrease) in other short-term borrowings |
15,711 | (4,334 | ) | (51,021 | ) | |||||||
| Increase (decrease) in federal funds purchased |
58,000 | — | (20,000 | ) | ||||||||
| Repayment of junior subordinated debt |
— | (36,083 | ) | — | ||||||||
| Repurchase of common stock warrant |
— | (2,247 | ) | — | ||||||||
| Dividends paid to common shareholders |
(37,805 | ) | (33,007 | ) | (25,136 | ) | ||||||
| Issuance of common stock |
1,713 | — | — | |||||||||
| Treasury shares (purchased) sold—net |
(3,026 | ) | (2,542 | ) | 1,918 | |||||||
|
|
|
|
|
|
|
|||||||
| Net cash (used in) provided by financing activities |
(276,180 | ) | 114,625 | 76,649 | ||||||||
|
|
|
|
|
|
|
|||||||
| Net increase (decrease) in cash and cash equivalents |
41,485 | (7,317 | ) | (1,549 | ) | |||||||
| Cash and cash equivalents at beginning of the year |
86,685 | 94,002 | 95,551 | |||||||||
|
|
|
|
|
|
|
|||||||
| Cash and cash equivalents at end of the year |
$ | 128,170 | $ | 86,685 | $ | 94,002 | ||||||
|
|
|
|
|
|
|
|||||||
| SUPPLEMENTAL DISCLOSURES |
||||||||||||
| Interest paid on deposits and other borrowings |
$ | 34,028 | $ | 27,969 | $ | 24,521 | ||||||
| Income taxes paid |
22,075 | 15,855 | 11,706 | |||||||||
| Transfers of loans to other real estate owned |
4,757 | 1,501 | 2,464 | |||||||||
| Transfers of portfolio loans to loans held for sale |
560 | — | — | |||||||||
| Non-cash transactions related to YCB and ESB acquisitions |
177,149 | 301,933 | — | |||||||||
See Notes to Consolidated Financial Statements.
89
Table of Contents
NOTE 1. SUMMARY OF SIGNIFICANT ACCOUNTING POLICIES
Nature of Operations—WesBanco, Inc. (“WesBanco”) is a bank holding company offering a full range of financial services, including trust and investment services, mortgage banking, insurance and brokerage services. WesBanco’s defined business segments are community banking and trust and investment services. WesBanco’s banking subsidiary, WesBanco Bank, Inc. (“WesBanco Bank” or the “Bank”), headquartered in Wheeling, West Virginia, operates through 174 branches and 163 ATM machines in West Virginia, Ohio, western Pennsylvania, Kentucky, and southern Indiana. In addition, WesBanco operates an insurance brokerage company, WesBanco Insurance Services, Inc., and a full service broker/dealer, WesBanco Securities, Inc.
Use of Estimates—The preparation of financial statements in conformity with U.S. generally accepted accounting principles requires management to make estimates and assumptions that affect the reported amounts of assets and liabilities and disclosure of contingent assets and liabilities at the date of the financial statements and the reported amounts of revenues and expenses during the reporting period. Actual results could differ from those estimates.
Principles of Consolidation—The Consolidated Financial Statements include the accounts of WesBanco and those entities in which WesBanco has a controlling financial interest. All intercompany balances and transactions have been eliminated in consolidation.
WesBanco determines whether it has a controlling financial interest in an entity by first evaluating whether the entity is a voting interest entity or a variable interest entity. A voting interest entity is an entity in which the total equity investment at risk is sufficient to enable the entity to finance itself independently and provides the equity holders with the obligation to absorb losses, the right to receive residual returns and the right to make financial and operating decisions. WesBanco consolidates voting interest entities in which it owns all, or at least a majority (generally, greater than 50%) of the voting interest.
Variable Interest Entities—Variable interest entities (“VIE”) are entities that in general either do not have equity investors with voting rights or that have equity investors that do not provide sufficient financial resources for the entity to support its activities. WesBanco uses VIEs in various legal forms to conduct normal business activities. WesBanco reviews the structure and activities of VIEs for possible consolidation.
A controlling financial interest in a VIE is present when an enterprise has both the power to direct the activities of the VIE that most significantly impact the VIE’s economic performance and the obligation to absorb losses of the VIE that could potentially be significant to the VIE or the right to receive benefits of the VIE that could potentially be significant to the VIE. A VIE often holds financial assets, including loans or receivables, real estate or other property. The company with a controlling financial interest, known as the primary beneficiary, is required to consolidate the VIE. WesBanco has twelve wholly-owned trust subsidiaries (collectively, the “Trusts”), for which it does not absorb a majority of expected losses or receive a majority of the expected residual returns. Accordingly, the Trusts and their net assets are not included in the Consolidated Financial Statements. However, the junior subordinated deferrable interest debentures issued by WesBanco to the Trusts (refer to Note 11, “Subordinated Debt and Junior Subordinated Debt”) and the common stock issued by the Trusts is included in the Consolidated Balance Sheets. WesBanco also owns non-controlling variable interests in certain limited partnerships for which it does not absorb a majority of expected losses or receive a majority of expected residual returns which are not included in the Consolidated Financial Statements or the power to direct the activities of a VIE that most significantly impact the VIE’s economic performance. Refer to Note 8, “Investments in Limited Partnerships” for further detail.
Revenue Recognition—Interest and dividend income, loan fees, trust fees, fees and charges on deposit accounts, insurance commissions and other ancillary income related to the Bank’s deposits and lending activities, as well as income at WesBanco’s other subsidiary companies, are accrued as earned.
Cash and Cash Equivalents—Cash and cash equivalents include cash and due from banks, due from banks—interest bearing and federal funds sold. Generally, federal funds are sold for one-day periods.
90
Table of Contents
Securities—Trading securities: Trading securities include various mutual funds held in a grantor trust in connection with a deferred compensation plan. These securities are reported at fair value with the gains and losses included in non-interest income.
Available-for-sale securities: Debt securities not classified as trading or held-to-maturity are classified as available-for-sale. These securities may be sold at any time based upon management’s assessment of changes in economic or financial market conditions, interest rate or prepayment risks, liquidity considerations and other factors. These securities are stated at fair value, with the fair value adjustment, net of tax, reported as a separate component of accumulated other comprehensive income.
Held-to-maturity securities: Securities that are purchased with the positive intent and ability to be held until their maturity are stated at cost and adjusted for amortization of premiums and accretion of discounts. Transfers of debt securities into the held-to-maturity category from the available-for-sale category are made at fair value at the date of transfer. The unrealized gain or loss at the date of transfer is retained in other comprehensive income and in the carrying value of the held-to-maturity securities. Such amounts are amortized over the remaining life of the security. Certain securities with less than 15% of their original purchase price remaining may be sold to improve portfolio efficiency or have experienced measurable credit deterioration.
Cost method investments: Securities that do not have readily determinable fair values and for which WesBanco does not exercise significant influence are carried at cost. Cost method investments consist primarily of Federal Home Loan Bank (“FHLB”) stock and are included in other assets in the Consolidated Balance Sheets. Cost method investments are evaluated for impairment whenever events or circumstances suggest that their carrying value may not be recoverable.
Securities acquired in acquisitions are recorded at fair value with the premium or discount derived from the fair market value adjustment recognized into interest income on a level yield basis over the remaining life of the security.
Gains and losses: Net realized gains and losses on sales of securities are included in non-interest income. The cost of securities sold is based on the specific identification method. The gain or loss is determined as of the trade date. Unrealized gains and losses on available-for-sale securities are recorded through other comprehensive income.
Amortization and accretion: Generally, premiums are amortized to call date and discounts are accreted to maturity, on a level yield basis.
Other-than-temporary impairment losses: An investment security is considered impaired if its fair value is less than its cost or amortized cost basis. If WesBanco intends to sell or will be required to sell the investment prior to recovery of cost, the entire impairment will be recognized in the Consolidated Statements of Income. If WesBanco does not intend to sell, nor is it more likely than not that it will be required to sell, impaired securities prior to the recovery of their cost, a review is conducted each quarter to determine if the impairment is other-than-temporary due to credit impairment. In estimating other-than-temporary impairment losses, WesBanco considers the financial condition and near-term prospects of the issuer, evaluating any credit downgrades or other indicators of a potential credit problem, the extent and duration of the decline in fair value, the type of security, either fixed or equity, and the receipt of principal and interest according to the contractual terms. If the impairment is to be considered temporary, the impairment for available-for-sale securities is recognized in other comprehensive income in the Consolidated Balance Sheet. If the impairment is to be considered other-than-temporary based on management’s review of the various factors that indicate credit impairment, the impairment must be separated into credit and non-credit portions. The credit portion is recognized in the Consolidated Statements of Income. For available-for-sale securities, the non-credit portion is calculated as the difference between the present value of the future cash flows at the contract rate and the fair value of the security and is recognized in other comprehensive income.
91
Table of Contents
Loans and Loans Held for Sale—Loans originated by WesBanco are reported at the principal amount outstanding, net of unearned income, credit valuation adjustments, and unamortized deferred loan fee income and loan origination costs. Interest is accrued as earned on loans except where doubt exists as to collectability, in which case accrual of income is discontinued. Loans originated and intended for sale are carried, in aggregate, at the lower of cost or estimated market value. Portfolio loans specifically identified as held for sale are recorded either at the contractual sales price or third party valuation less selling costs.
Loans acquired in acquisitions are recorded at fair value with no carryover of related allowance for credit losses. The premium or discount derived from the fair market value adjustment is recognized into interest income using a level yield method over the remaining expected life of the loan. Refer to the “Acquired Loans” policy below for additional detail.
Loan origination fees and direct costs are deferred and accreted or amortized into interest income, as an adjustment to the yield, over the life of the loan using the level yield method. When a loan is paid off, the remaining unaccreted or unamortized net origination fees or costs are immediately recognized into income.
Loans are generally placed on non-accrual when they are 90 days past due, unless the loan is well-secured and in the process of collection. Loans may be returned to accrual status when a borrower has resumed paying principal and interest for a sustained period of at least six months and the Bank is reasonably assured of collecting the remaining contractual principal and interest. Loans are returned to accrual status at an amount equal to the principal balance of the loan at the time of non-accrual status less any payments applied to principal during the non-accrual period. Loans are reported as a troubled debt restructuring when WesBanco for economic or legal reasons related to a borrower’s financial difficulties grants a concession to the borrower that it would not otherwise consider. Refer to the “Troubled Debt Restructuring” policy below for additional detail.
A loan is considered impaired, based on current information and events, if it is probable that WesBanco will be unable to collect the payments of principal and interest when due according to the contractual terms of the loan agreement. Impaired loans include all non-accrual loans and troubled debt restructurings. WesBanco recognizes interest income on non-accrual loans on the cash basis only if recovery of principal is reasonably assured.
Consumer loans are charged down to the net realizable value at 120 days past due for closed-end loans and 180 days past due for open-end revolving lines of credit. Residential real estate loans are charged down to the net realizable value of the collateral at 180 days past due. Commercial loans are charged down to the net realizable value when it is determined that WesBanco will be unable to collect the principal amount in full. Loans are reclassified to other assets at the net realizable value when foreclosure or repossession of the collateral occurs. Refer to the “Other Real Estate Owned and Repossessed Assets” policy below for additional detail.
Troubled Debt Restructurings (“TDR”)—A restructuring of a debt constitutes a TDR if the creditor, for economic or legal reasons related to the debtor’s financial difficulties, grants a concession to the debtor that it would not otherwise consider. The determination of [whether a concession has been granted includes an evaluation of the debtor’s ability to access funds at a market rate for debt with similar risk characteristics and among other things, the significance of the modification relative to unpaid principal or collateral value of the debt, and/or the significance of a delay in the timing of payments relative to the frequency of payments, original maturity date, or the expected duration of the loan. The most common concessions granted generally include one or more modifications to the terms of the debt such as a reduction in the interest rate for the remaining life of the debt, an extension of the maturity date at an interest rate lower than the current market rate for new debt with similar risk, or reduction of the unpaid principal or interest. Additionally, all consumer bankruptcies are considered TDR; all TDRs are considered impaired loans.
When determining whether a debtor is experiencing financial difficulties, consideration is given to any known default on any of its debt or whether it is probable that the debtor would be in payment default in the
92
Table of Contents
foreseeable future without the modification. Other indicators of financial difficulty include whether the debtor has declared or is in the process of declaring bankruptcy, the debtor’s ability to continue as a going concern, or the debtor’s projected cash flow to service its debt (including principal & interest) in accordance with the contractual terms for the foreseeable future, without a modification. If the payment of principal at original maturity is primarily dependent on the value of collateral, the current value of that collateral is considered in determining whether the principal will be paid.
The restructuring of a loan does not have a material effect on the allowance or provision for credit losses as the internal risk grade of a loan has more influence on the allowance than the classification of a loan as a TDR. The internal risk rating is the primary factor for establishing the allowance for commercial loans, including commercial real estate except for loans that are individually evaluated for impairment, in which case a specific reserve is established pursuant to GAAP. Portfolio segment loss history is the primary factor for establishing the allowance for residential real estate, home equity and consumer loans.
Non-accrual loans that are restructured remain on non-accrual, but may move to accrual status after they have performed according to the restructured terms for a period of time. TDRs on accrual status generally remain on accrual as long as they continue to perform in accordance with their modified terms. TDRs may also be placed on non-accrual if they do not perform in accordance with the restructured terms. Loans may be removed from TDR status after they have performed according to the renegotiated terms for a period of time if the interest rate under the modified terms is at or above market, or if the loan returns to its original terms.
Acquired Loans—Loans acquired in connection with acquisitions are recorded at their acquisition-date fair value with no carryover of related allowance for credit losses. Any allowance for loan loss on these pools reflect only losses incurred after the acquisition (meaning the present value of all cash flows expected at acquisition that ultimately are not to be received). Determining the fair value of the acquired loans involves estimating the principal and interest cash flows expected to be collected on the loans and discounting those cash flows at a market rate of interest. Management considers a number of factors in evaluating the acquisition-date fair value including the remaining life of the acquired loans, delinquency status, estimated prepayments, payment options and other loan features, internal risk grade, estimated value of the underlying collateral and interest rate environment.
Acquired loans that meet the criteria for non-accrual of interest prior to acquisition are considered to be performing upon acquisition, regardless of whether the customer is contractually delinquent, if WesBanco can reasonably estimate the timing and amount of expected cash flows on such loans. Accordingly, WesBanco does not consider acquired contractually delinquent loans to be non-accrual or non-performing and continues to recognize interest income on these loans using the accretion method.
Loans acquired with deteriorated credit quality are accounted for in accordance with Accounting Standards Codification (“ASC”) 310-30, Loans and Debt Securities Acquired with Deteriorated Credit Quality (ASC 310-30) if, at acquisition, the loans have evidence of credit quality deterioration since origination and it is probable that all contractually required payments will not be collected. At acquisition, WesBanco considers several factors as indicators that an acquired loan has evidence of deterioration in credit quality. These factors include loans 90 days or more past due, loans with an internal risk grade of substandard or below, loans classified as non-accrual by the acquired institution, and loans that have been previously modified in a troubled debt restructuring.
Under the ASC 310-30 model, the excess of cash flows expected to be collected at acquisition over recorded fair value is referred to as the accretable yield and is the interest component of expected cash flow. The accretable yield is recognized into income over the remaining life of the loan if the timing and/or amount of cash flows expected to be collected can be reasonably estimated (the accretion method). If the timing or amount of cash flows expected to be collected cannot be reasonably estimated, the cost recovery method of income recognition is used. The difference between the loan’s total scheduled principal and interest payments over all
93
Table of Contents
cash flows expected to be collected at acquisition, considering the impact of prepayments, is referred to as the non-accretable difference. The non-accretable difference represents contractually required principal and interest payments which WesBanco does not expect to collect.
Over the life of the loan, management continues to estimate cash flows expected to be collected. Decreases in expected cash flows are recognized as impairments through a charge to the provision for loan losses resulting in an increase in the allowance for loan losses. Subsequent improvements in cash flows result in first, reversal of existing valuation allowances recognized subsequent to acquisition, if any, and next, an increase in the amount of accretable yield to be subsequently recognized in interest income on a prospective basis over the loan’s remaining life.
Acquired loans that were not individually determined to be purchased with deteriorated credit quality are accounted for in accordance with ASC 310-20, Nonrefundable Fees and Other Costs (ASC 310-20), whereby the premium or discount derived from the fair market value adjustment, on a loan-by-loan or pooled basis, is recognized into interest income on a level yield basis over the remaining expected life of the loan or pool.
Allowance for Credit Losses—The allowance for credit losses represents management’s estimate of probable losses inherent in the loan portfolio and in future advances against loan commitments. Determining the amount of the allowance requires significant judgment about the collectability of loans and the factors that deserve consideration in estimating probable credit losses. The allowance is increased by a provision charged to operating expense and reduced by charge-offs, net of recoveries. Management evaluates the adequacy of the allowance at least quarterly. This evaluation is inherently subjective as it requires material estimates that may be susceptible to significant change from period to period.
The evaluation includes an assessment of quantitative factors such as actual loss experience within each category of loans and testing of certain commercial loans for impairment. The evaluation also considers qualitative factors such as economic trends and conditions, which includes levels of unemployment, real estate values and the impact on specific industries and geographical markets, changes in lending policies and underwriting standards, delinquency and other credit quality trends, concentrations of credit risk, if any, the results of internal loan reviews and examinations by bank regulatory agencies, the volatility of historical loss rates, the velocity of changes in historical loss rates, and regulatory guidance pertaining to the allowance for credit losses. Management relies on observable data from internal and external sources to the extent it is available to evaluate each of these factors and adjusts the actual historical loss rates to reflect the impact these factors may have on probable losses in the portfolio.
Commercial real estate and commercial and industrial loans greater than $1 million that are reported as non-accrual or as a troubled debt restructuring are tested individually for impairment. Specific reserves are established when appropriate for such loans based on the present value of expected future cash flows of the loan or the estimated realizable value of the collateral, if any.
General reserves are established for loans that are not individually tested for impairment based on historical loss rates adjusted for the impact of the qualitative factors discussed above. Historical loss rates for commercial real estate and commercial and industrial loans are determined for each internal risk grade or group of pass grades using a migration analysis. Historical loss rates for commercial real estate land and construction, residential real estate, home equity and consumer loans that are not risk graded are determined for the total of each category of loans. Historical loss rates for deposit account overdrafts are based on actual losses in relation to average overdrafts for the period.
Management may also adjust its assumptions to account for differences between estimated and actual incurred losses from period to period. The variability of management’s assumptions could alter the level of the allowance for credit losses and may have a material impact on future results of operations and financial condition. The loss estimation models and methods used to determine the allowance for credit losses are continually refined and enhanced; however, there have been no material substantive changes compared to prior periods.
94
Table of Contents
Mortgage Servicing Rights—Mortgage servicing rights (“MSRs”) represent the right to service loans for third party investors. MSRs are recognized as a separate asset for the rights to service mortgage loans for others, regardless of how those servicing rights are acquired. MSRs are recognized upon the sale of mortgage loans to a third party investor with the servicing rights retained by WesBanco. Servicing loans for others generally consists of collecting mortgage payments from borrowers, maintaining escrow accounts, remitting payments to third party investors and when necessary, foreclosure processing. Serviced loans are not included in the Consolidated Balance Sheets. Loan servicing income includes servicing fees received from the third party investors and certain charges collected from the borrowers. Originated MSRs are recorded at allocated fair value at the time of the sale of the loans to the third party investor. MSRs are amortized in proportion to and over the estimated period of net servicing income. MSRs are carried at amortized cost, less a valuation allowance for impairment, if any. Impairment exists if the carrying value of MSRs exceeds the estimated fair value of the MSRs.
Premises and Equipment—Premises and equipment are stated at cost less accumulated depreciation and amortization. Depreciation is computed using the straight-line method over the estimated useful lives of the assets. Leasehold improvements are amortized over the shorter of the estimated economic useful lives of the leased assets or the remaining terms of the underlying leases. Useful lives range from 3 to 10 years for furniture and equipment, 15 to 39 years for buildings and building improvements, and 15 years for land improvements. Maintenance and repairs are expensed as incurred while major improvements that extend the useful life of an asset are capitalized and depreciated over the estimated remaining useful life of the asset.
Other Real Estate Owned and Repossessed Assets—Other real estate owned and repossessed assets, which are considered available-for-sale and are reported in other assets, are carried at the lower of cost or their estimated current fair value, less estimated costs to sell. Other real estate owned consists primarily of properties acquired through, or in lieu of, foreclosures. Repossessed collateral primarily consists of automobiles and other types of collateral acquired to satisfy defaulted consumer loans. Subsequent declines in fair value, if any, income and expense associated with the management of the collateral, and gains or losses on the disposition of these assets are recognized in the Consolidated Statements of Income.
Goodwill and Other Intangible Assets—WesBanco accounts for business combinations using the acquisition method of accounting. Accordingly, the identifiable assets acquired, the liabilities assumed, and any non-controlling interest of an acquired business are recorded at their estimated fair values as of the date of acquisition with any excess of the cost of the acquisition over the fair value recorded as goodwill. Other intangible assets represent purchased assets that lack physical substance but can be distinguished from goodwill because of contractual or other legal rights or because the asset is capable of being sold or exchanged either on its own or in combination with a related contract, asset, or liability.
Goodwill is not amortized but is evaluated for impairment annually, or more often if events or circumstances indicate it may be impaired. Finite-lived intangible assets, which consist primarily of core deposit and customer list intangibles (long-term customer-relationship intangible assets) are amortized using straight-line and accelerated methods over their weighted-average estimated useful lives, ranging from ten to sixteen years in total, and are tested for impairment whenever events or circumstances indicate that their carrying amount may not be recoverable. Non-compete agreements are recognized in other assets on the balance sheet and are amortized on a straight-line basis over the life of the respective agreements, ranging from one to four years.
Goodwill is evaluated for impairment by either assessing qualitative factors to determine whether it is necessary to perform the two-step goodwill impairment test, or WesBanco may elect to perform the two-step goodwill impairment test. Under the qualitative assessment, WesBanco assesses qualitative factors to determine whether it is more likely than not that the fair value of its reporting units are less than their carrying amounts, including goodwill. If it is more likely than not, the two-step goodwill impairment test is used to identify potential goodwill impairment and measure the amount of a goodwill impairment loss to be recognized, if any. In the first step, the estimated fair value of each reporting unit is compared to its carrying value, including goodwill. If the estimated fair value of a reporting unit exceeds its carrying amount, the goodwill of that reporting unit is
95
Table of Contents
not considered impaired, and no impairment loss is recognized. However, if the carrying amount of the reporting unit exceeds its fair value, step two, which involves comparing the implied fair value of goodwill to its carrying value, is completed and to the extent that the carrying value of goodwill exceeds its implied fair value, an impairment loss is recognized.
Intangible assets with finite useful lives are evaluated for impairment whenever events or changes in circumstances indicate that their carrying amount may not be recoverable. An impairment loss is recognized when the carrying amount of an intangible asset with a finite useful life is not recoverable from its undiscounted cash flows and is measured as the difference between the carrying amount and the fair value of the asset. WesBanco does not have any indefinite-lived intangible assets.
Bank-Owned Life Insurance—WesBanco has purchased life insurance policies on certain executive officers and employees. WesBanco receives the cash surrender value of each policy upon its termination or benefits are payable upon the death of the insured. These policies are recorded in the Consolidated Balance Sheets at their net cash surrender value. Changes in net cash surrender value are recognized in non-interest income in the Consolidated Statements of Income.
Interest Rate Lock Commitments—In order to attract potential home borrowers, WesBanco offers interest rate lock commitments (“IRLC”) to such potential borrowers. IRLC are generally for sixty days and guarantee a specified interest rate for a loan if underwriting standards are met, but the commitment does not obligate the potential borrower to close on the loan. Accordingly, some IRLC expire prior to the funding of the related loan. For all IRLC issued in connection with potential loans intended for sale, which consist primarily of originated longer-term fixed rate residential home mortgage loans that qualify for secondary market sale, the Bank enters into one-to-one forward sales contracts on a best efforts basis (if the loan does not close for whatever reason, there is no obligation on WesBanco’s part to sell the loan to the investor). WesBanco enters into such contracts in order to control interest rate risk during the period between the IRLC and loan funding. The IRLC is executed between the mortgagee and WesBanco, and in turn a forward sales contract is executed between WesBanco and an investor. Both the IRLC and the corresponding forward sales contract for each customer are considered a derivative. As such, changes in the fair value of the derivatives during the commitment period are recorded in current earnings and included in other income in the Consolidated Statements of Income. The fair value of IRLC is the gain or loss that would be realized on the underlying loans assuming exercise of the commitments under current market rates versus the rate incorporated in the commitments, taking into consideration fallout. The fair value of forward sales contracts is based on quoted market prices. Since loans typically close before receipt of funding from an investor, they are accounted for at the lower of cost or market as “Loans Held for Sale” in the Consolidated Balance Sheets.
Derivative Instruments and Hedging Activities—WesBanco records all derivatives on the balance sheet at fair value. The accounting for changes in the fair value of derivatives depends on the intended use of the derivative, whether WesBanco has elected to designate a derivative in a hedging relationship and apply hedge accounting and whether the hedging relationship has satisfied the criteria necessary to apply hedge accounting. Currently, none of WesBanco’s derivatives are designated in qualifying hedging relationships, as the derivatives are not used to manage risks within WesBanco’s assets or liabilities. As such, all changes in fair value of WesBanco’s derivatives are recognized directly in earnings.
Income Taxes—The provision for income taxes included in the Consolidated Statements of Income includes both federal and state income taxes and is based on income in the financial statements, rather than amounts reported on WesBanco’s income tax returns. Deferred tax assets and liabilities are recognized for the future tax consequences attributable to differences between the financial statement carrying amounts of existing assets and liabilities and their respective tax bases. A test of the anticipated realizeability of deferred tax assets is performed at least annually.
Fair Value—Fair value is an exit price, representing the amount that would be received to sell an asset or paid to transfer a liability in an orderly transaction between market participants. Fair value
96
Table of Contents
measurements are not adjusted for transaction costs. The ASC also establishes a fair value hierarchy that prioritizes the inputs to valuation techniques used to measure fair value. The hierarchy gives the highest priority to unadjusted quoted prices in active markets for identical assets or liabilities (Level 1 measurement) and the lowest priority to unobservable inputs (Level 3 measurement). The three levels of the fair value hierarchy are described below:
Level 1—Unadjusted quoted prices in active markets that are accessible at the measurement date for identical, unrestricted assets or liabilities;
Level 2—Quoted prices for similar instruments in active markets, quoted prices for identical or similar instruments in markets that are not active, or model-based valuation techniques where all significant assumptions are observable, either directly or indirectly, in the market;
Level 3—Valuation is generated from model-based techniques where all significant assumptions are not observable, either directly or indirectly, in the market. These unobservable assumptions reflect our own estimates of assumptions that market participants would use in pricing the asset or liability. Valuation techniques may include use of discounted cash flow models and similar techniques.
A financial instrument’s level within the fair value hierarchy is based on the lowest level of input that is significant to the fair value measurement.
Earnings Per Common Share—Basic earnings per common share (“EPS”) are calculated by dividing net income by the weighted-average number of shares of common stock outstanding during the period. For diluted EPS, the weighted-average number of shares for the period is increased by the number of shares, which would be issued assuming the exercise of in-the-money common stock options and any outstanding warrants. Restricted stock shares are recorded as issued and outstanding upon their grant, rather than upon vesting, and therefore are included in the weighted-average shares outstanding due to voting rights granted at the time restricted stock is granted.
Trust Assets—Assets held by the Bank in fiduciary or agency capacities for its customers are not included as assets in the Consolidated Balance Sheets. Certain money market trust assets are held on deposit at the Bank and are accounted for as such.
Stock-Based Compensation—Stock-based compensation awards granted, comprised of stock options, restricted stock, and total shareholder return (“TSR”) awards are valued at fair value and compensation cost is recognized on a straight-line basis, net of estimated forfeitures, over the requisite service or performance period of each award. For service-based awards with graded vesting schedules, compensation expense is divided equally among the vesting periods with each separately vested portion of the award recognized in compensation expense on a straight-line basis over the requisite service period. For TSR awards, compensation expense is recognized evenly over the performance period, based on the probability of the achievements of the market conditions set forth in the plan.
Defined Benefit Pension Plan—WesBanco recognizes in the statement of financial position an asset for the plan’s overfunded status or a liability for the plan’s underfunded status. WesBanco recognizes fluctuations in the funded status in the year in which the changes occur through other comprehensive income. Plan assets are determined based on fair value generally representing observable market prices. The projected benefit obligation is determined based on the present value of projected benefit distributions at an assumed discount rate. The discount rate utilized is based on a fitted yield curve approach whereby the yield curve compares the expected stream of future benefit payments for the plan to high quality corporate bonds available in the marketplace to determine an equivalent discount rate. Periodic pension expense includes service costs, interest costs based on an assumed discount rate, an expected return on plan assets based on an actuarially-derived market-related value, an assumed rate of annual compensation increase, and amortization or accretion of actuarial gains and losses as well as other actuarial assumptions. WesBanco utilizes a full yield curve approach in the estimation of service and
97
Table of Contents
interest components by applying the specific spot rates along the yield curve used in the determination of the benefit obligation to the relevant projected cash flows. The plan has been closed to new entrants since August, 2007; however, benefits are still earned for those plan participants with continuing employment after August, 2007.
Recent Accounting Pronouncements—In January 2017, the Financial Accounting Standards Board (the “FASB”) issued an Accounting Standards Update (“ASU”) (ASU 2017-04) that eliminated the requirement to calculate the implied fair value of goodwill to measure a goodwill impairment charge. Instead, entities will record an impairment charge based on the excess of a reporting unit’s carrying amount over its fair value. Public business entities that are a U.S. Securities and Exchange Commission filer should adopt this update for its annual or any interim goodwill impairment tests in fiscal years beginning after December 15, 2019. Early adoption is permitted. The adoption of this pronouncement is not expected to have a material impact on WesBanco’s Consolidated Financial Statements.
In October 2016, the FASB issued ASU 2016-16 that provides the recognition of income tax consequences of an intra-entity transfer of an asset other than inventory when the transfer occurs. Current guidance prohibits the recognition of current and deferred income taxes for an intra-entity asset transfer until the asset has been sold to an outside party. This prohibition on recognition is an exception to the principle of comprehensive recognition of current and deferred income taxes in generally accepted accounting principles. The exception has led to diversity in practice and is a source of complexity in financial reporting. FASB decided that an entity should recognize the income tax consequences of an intra-entity transfer of an asset other than inventory when the transfer occurs. Consequently, the amendments in this update eliminate the exception for an intra-entity transfer of an asset other than inventory. The amendments in this update do not include new disclosure requirements; however, existing disclosure requirements might be applicable when accounting for the current and deferred income taxes for an intra-entity transfer of an asset other than inventory. For public business entities, the amendments in this update are effective for annual reporting periods beginning after December 15, 2017, including interim reporting periods within those annual reporting periods. The amendments in this update should be applied on a modified retrospective basis through a cumulative-effect adjustment directly to retained earnings as of the beginning of the period of adoption. The adoption of this pronouncement is not expected to have a material impact on WesBanco’s Consolidated Financial Statements.
In August 2016, the FASB issued ASU 2016-15 that provides guidance for the classification of cash flows related to (1) debt prepayment or extinguishment costs, (2) settlement of zero-coupon debt instruments or other debt instruments with coupon rates that are insignificant in relation to the effective interest rate on the borrowing, (3) contingent consideration payments made after a business combination, (4) proceeds from the settlement of insurance claims, (5) proceeds from the settlement of corporate-owned life insurance policies, (6) distributions received from equity method investees, (7) beneficial interests in securitization transactions and (8) separately identifiable cash flows and application of the predominance principle. Public business entities must apply the new requirements for fiscal years beginning after December 15, 2017, including interim periods within those fiscal years, which for WesBanco will be effective for the fiscal year beginning January 1, 2018 Early adoption is permitted. The adoption of this pronouncement is not expected to have a material impact on WesBanco’s Consolidated Financial Statements.
In June 2016, the FASB issued ASU 2016-13 that will require entities to use a new forward-looking “expected loss” model on trade and other receivables, held-to-maturity debt securities, loans and other instruments that generally will result in the earlier recognition of allowances for credit losses. For available-for-sale debt securities with unrealized losses, entities will measure credit losses in a manner similar to what they do today, except that the losses will be recognized as allowances rather than reductions in the amortized cost of the securities. Entities will have to disclose significantly more information, including information they use to track credit quality by year of origination for most financing receivables. Public business entities must apply the new requirements for fiscal years beginning after December 15, 2019, including interim periods within those fiscal years, which for WesBanco will be effective for the fiscal year beginning January 1,
98
Table of Contents
2020. Early adoption is permitted for fiscal years beginning after December 15, 2018. WesBanco is currently evaluating the impact of the adoption of this pronouncement on its Consolidated Financial Statements.
In March 2016, the FASB issued ASU 2016-09 that will require all excess income tax benefits or tax deficiencies of stock awards to be recognized in the income statement when the awards vest or are settled. It also will allow an employer to repurchase more of an employee’s shares than it can today for tax withholding purposes without triggering liability accounting and to make a policy election to account for forfeitures as they occur. Public business entities must apply the new requirements for fiscal years beginning after December 15, 2016, including interim periods within those fiscal years. Early adoption is permitted. The adoption of this pronouncement is not expected to have a material impact on WesBanco’s Consolidated Financial Statements.
In March 2016, the FASB issued ASU 2016-07 that eliminates the requirement to retrospectively apply the equity method in previous periods when an investor initially obtains significant influence over an investee. The update is effective for interim and annual reporting periods in fiscal years beginning after December 15, 2016, and requires prospective adoption. Early adoption is permitted. The adoption of this pronouncement is not expected to have a material impact on WesBanco’s Consolidated Financial Statements.
In February 2016, the FASB issued ASU 2016-02 that will require entities to recognize lease assets and lease liabilities on the balance sheet and disclose key information about leasing arrangements. The principal difference from previous guidance is that the lease assets and lease liabilities arising from operating leases were not previously recognized in the balance sheet. Public business entities must apply the new requirements for fiscal years beginning after December 15, 2018, including interim periods within those fiscal years. Early adoption is permitted. WesBanco is currently evaluating the impact of the adoption of this pronouncement on its Consolidated Financial Statements.
In January 2016, the FASB issued ASU 2016-01 that will require entities to measure equity investments that do not result in consolidation and are not accounted for under the equity method at fair value and recognize any changes in fair value in net income unless the investments qualify for the new practicability exception. The standard does not change the guidance for classifying and measuring investments in debt securities and loans. Entities will have to record changes in instrument-specific credit risk for financial liabilities measured under the fair value option in other comprehensive income. Public business entities must apply the new requirements for fiscal years beginning after December 15, 2017, including interim periods within those fiscal years. Early adoption is permitted. The adoption of this pronouncement is not expected to have a material impact on WesBanco’s Consolidated Financial Statements.
In September 2015, the FASB issued ASU 2015-16 that eliminates the requirement that an acquirer in a business combination account for measurement-period adjustments retrospectively. Instead, acquirers must recognize measurement-period adjustments during the period in which they determine the amounts, including the effect on earnings of any amounts they would have recorded in previous periods if the accounting had been completed at the acquisition date. The acquirer still must disclose the amounts and reasons for adjustments to the provisional amounts. The acquirer also must disclose, by line item, the amount of the adjustment reflected in the current-period income statement that would have been recognized in previous periods if the adjustment to provisional amounts had been recognized as of the acquisition date. Alternatively, an acquirer may present those amounts separately on the face of the income statement. Public business entities must apply the new requirements for fiscal years beginning after December 15, 2015, including interim periods with those fiscal years. WesBanco adopted the ASU in the first quarter of 2016, which was the first interim period after December 15, 2015. The adoption of this pronouncement did not have a material impact on WesBanco’s Consolidated Financial Statements.
In May 2015, the FASB issued ASU 2015-07 related to disclosures for investments in certain entities that calculate net asset value (NAV) per share (or its equivalent). This update removes the requirement to categorize within the fair value hierarchy all investments for which fair value is measured using the net asset value per share
99
Table of Contents
practical expedient and modifies certain disclosure requirements. The update is effective for interim and annual reporting periods in fiscal years beginning after December 15, 2015, and requires retrospective adoption. WesBanco retrospectively adopted the ASU in the first quarter of 2016, which was the first interim period after December 15, 2015. The adoption of this pronouncement did not have a material impact on WesBanco’s Consolidated Financial Statements.
In April 2015, the FASB issued ASU 2015-05 that provides guidance on when to account for a cloud computing arrangement as a software license. The guidance applies only to internal-use software that a customer obtains access to in a hosting arrangement if both of the following criteria are met: (1) The customer has the contractual right to take possession of the software at any time during the hosting period without significant penalty, (2) it is feasible for the customer to either run the software on its own hardware or contract with another party unrelated to the vendor to host the software. The pronouncement is effective for fiscal years, and for interim periods within those fiscal years, beginning after December 15, 2015. WesBanco adopted the ASU in the first quarter of 2016, which is the first interim period after December 15, 2015. The adoption of this pronouncement did not have a material impact on WesBanco’s Consolidated Financial Statements.
In February 2015, the FASB issued ASU 2015-02 that revised the consolidation model, requiring reporting entities to reevaluate whether they should consolidate certain legal entities under the revised model. The amendments in this update modify the evaluation of whether limited partnerships and similar legal entities are variable interest entities (VIEs) or voting interest entities, and eliminate the presumption that a general partner should consolidate and affect the consolidation analysis of reporting entities that are involved with VIEs, particularly those that have fee arrangements and related party relationships. The pronouncement also provides for a scope exception from consolidation guidance for reporting entities with interests in legal entities that are required to comply with or operate in accordance with requirements similar to those in Rule 2a-7 of the Investment Company Act of 1940 for registered money market funds. The pronouncement is effective for fiscal years, and for interim periods within those fiscal years, beginning after December 15, 2015. WesBanco adopted the ASU in the first quarter of 2016, which was the first interim period after December 15, 2015. The adoption of this pronouncement did not have a material impact on WesBanco’s Consolidated Financial Statements.
In May 2014, the FASB issued ASU 2014-09 related to the recognition of revenue from contracts with customers. The new revenue pronouncement creates a single source of revenue guidance for all companies in all industries and is more principles-based than current revenue guidance. The pronouncement provides a five-step model for a company to recognize revenue when it transfers control of goods or services to customers at an amount that reflects the consideration to which it expects to be entitled in exchange for those goods or services. The five steps are, (1) identify the contract with the customer, (2) identify the separate performance obligations in the contract, (3) determine the transaction price, (4) allocate the transaction price to the separate performance obligations and (5) recognize revenue when each performance obligation is satisfied. The pronouncement was originally effective for annual periods, and interim periods within those annual periods, beginning after December 15, 2016 using either a full retrospective approach for all periods presented in the period of adoption or a modified retrospective approach. Early adoption was not permitted. On July 9, 2015, the FASB approved a one-year deferral of the effective date of the update. The update is effective for interim and annual reporting periods in fiscal years beginning after December 15, 2017. Early adoption is now permitted as of the original effective date for interim and annual reporting periods in fiscal years beginning after December 15, 2016. In March 2016, the FASB issued ASU 2016-08 which amends the principle versus agent guidance in the revenue standard. In April 2016, the FASB issued ASU 2016-10 which clarifies when promised goods or services are separately identifiable in the revenue standard. In May 2016, FASB issued ASU 2016-12 which provides narrow-scope improvements and practical expedients to the revenue standard. While WesBanco is currently evaluating the impact of this standard on individual customer contracts, management has evaluated the impact of this standard on the broad categories of its customer contracts and revenue streams. WesBanco currently anticipates this standard will not have a material impact on its Consolidated Financial Statements because revenue related to financial instruments, including loans and securities are not in scope of these updates. Loan interest income, investment interest income, insurance services revenue and BOLI are accounted for under other U.S. GAAP
100
Table of Contents
standards and out of scope of ASC 606 revenue standard. The Company plans to adopt the revenue recognition standard as of January 1, 2018. The Company is currently reviewing all streams of revenue that may be subject to this revised guidance. While WesBanco has not yet identified any material changes to the timing of revenue recognition, the Company’s review is ongoing.
In January 2014, the FASB issued ASU No. 2014-01, which applies to all reporting entities that invest in qualified affordable housing projects through limited liability entities. The pronouncement permits reporting entities to make an accounting policy election to account for these investments using the proportional amortization method if certain conditions exist. The pronouncement also requires disclosure that enables users of its financial statements to understand the nature of these investments in proportion to the tax credits and other tax benefits received and recognizes the net investment performance in the income statement as a component of income tax expense (benefit). The pronouncement is effective for annual periods, and interim periods within those annual periods, beginning after December 15, 2014. WesBanco will adopt the ASU in the first quarter of 2017. With the adoption of this pronouncement, WesBanco will reclassify the tax credits from other operating expense to a component of income tax expense (benefit). The amount for 2016 is $0.9 million, which is currently included in other operating expense within WesBanco’s Consolidated Financial Statements.
NOTE 2. MERGERS AND ACQUISITIONS
On September 9, 2016, WesBanco completed its acquisition of Your Community Bankshares, Inc. (“YCB”), and its wholly-owned banking subsidiary, Your Community Bank (“YCB Bank”), an Indiana state-chartered commercial bank headquartered in New Albany, Indiana. The transaction expanded WesBanco’s franchise into Kentucky and southern Indiana.
On the acquisition date, YCB had approximately $1.5 billion in assets, excluding goodwill, which included approximately $1.0 billion in loans, and $173.2 million in securities. The YCB acquisition was valued at $220.5 million, based on WesBanco’s closing stock price on September 9, 2016 of $32.62, and resulted in WesBanco issuing 5,423,348 shares of its common stock and $43.3 million in cash in exchange for all of the outstanding shares of YCB common stock. The assets and liabilities of YCB were recorded on WesBanco’s balance sheet at their preliminary estimated fair value as of September 9, 2016, the acquisition date, and YCB’s results of operations have been included in WesBanco’s Consolidated Statements of Income since that date. Due to the timing of the acquisition relative to the end of the reporting period, the fair values for certain assets and liabilities acquired from YCB on September 9, 2016 represent preliminary estimates. Based on a preliminary purchase price allocation, WesBanco recorded $92.9 million in goodwill and $12.0 million in core deposit intangibles in its Community Banking segment, representing the principal change in goodwill and intangibles from December 31, 2015. None of the goodwill is deductible for income tax purposes as the acquisition is accounted for as a tax-free exchange for tax purposes. As a result of the full integration of the operations of YCB, it is not practicable to determine revenue or net income included in WesBanco’s operating results relating to YCB since the date of acquisition, as YCB’s results cannot be separately identified.
For the twelve months ended December 31, 2016, WesBanco recorded merger-related expenses of $13.3 million associated with the YCB acquisition.
101
Table of Contents
The purchase price of the YCB acquisition and resulting goodwill is summarized as follows:
| (in thousands) |
September 9, 2016 | ||||
| Purchase Price: |
|||||
| Fair value of WesBanco shares issued |
$ | 177,149 | |||
| Cash consideration for outstanding YCB shares |
43,349 | ||||
|
|
|
||||
| Total purchase price |
$ | 220,498 | |||
| Fair value of: |
|||||
| Tangible assets acquired |
$ | 1,398,596 | |||
| Core deposit and other intangible assets acquired |
11,957 | ||||
| Liabilities assumed |
(1,331,156 | ) | |||
| Net cash received in the acquisition |
48,212 | ||||
|
|
|
||||
| Fair value of net assets acquired |
127,609 | ||||
|
|
|
||||
| Goodwill recognized |
$ | 92,889 | |||
|
|
|
||||
The following table presents the preliminary allocation of the purchase price of the assets acquired and the liabilities assumed at the date of acquisition, as WesBanco intends to finalize its accounting for the acquisition of YCB within one year from the date of acquisition:
| (in thousands) |
September 9, 2016 | ||||
| Assets acquired |
|||||
| Cash and due from banks |
$ | 48,212 | |||
| Securities |
173,223 | ||||
| Loans |
1,013,566 | ||||
| Goodwill and other intangible assets |
104,846 | ||||
| Accrued income and other assets (1) |
211,807 | ||||
|
|
|
||||
| Total assets acquired |
$ | 1,551,654 | |||
|
|
|
||||
| Liabilities assumed |
|||||
| Deposits |
$ | 1,193,010 | |||
| Borrowings |
123,001 | ||||
| Accrued expenses and other liabilities |
15,145 | ||||
|
|
|
||||
| Total liabilities assumed |
1,331,156 | ||||
|
|
|
||||
| Net assets acquired |
$ | 220,498 | |||
|
|
|
||||
| (1) | Includes receivables of $105.8 million from the sale of available-for-sale securities prior to the acquisition date. |
102
Table of Contents
The following table presents the changes in the preliminary allocation of the purchase price of the assets acquired and the liabilities assumed at the date of the acquisition previously reported as of September 30, 2016:
| (in thousands) |
September 9, 2016 | ||||
| Change in fair value of net assets acquired: |
|||||
| Assets |
|||||
| Loans |
$ | (1,505 | ) | ||
| Accrued income and other assets |
31 | ||||
| Liabilities |
|||||
| Borrowings |
(184 | ) | |||
| Accrued expenses and other liabilities |
(637 | ) | |||
|
|
|
||||
| Fair value of net assets acquired |
(2,295 | ) | |||
|
|
|
||||
| Additional goodwill recognized |
$ | 2,295 | |||
|
|
|
||||
| Goodwill recognized as of September 30, 2016 |
90,594 | ||||
|
|
|
||||
| Goodwill recognized as of December 31, 2016 |
$ | 92,889 | |||
|
|
|
||||
The fair value estimates for loans, properties, deferred taxes, borrowings and other liabilities have continued to fluctuate as the final valuations and/or appraisals are completed. The Company expects to finalize the purchase accounting of YCB within one year of the date of the acquisition.
NOTE 3. EARNINGS PER COMMON SHARE
Earnings per common share are calculated as follows:
| For the years ended December 31, | ||||||||||||
| (in thousands, except shares and per share amounts) |
2016 | 2015 | 2014 | |||||||||
| Numerator for both basic and diluted earnings per common share: |
||||||||||||
| Net income |
$ | 86,635 | $ | 80,762 | $ | 69,974 | ||||||
|
|
|
|
|
|
|
|||||||
| Denominator: |
||||||||||||
| Total average basic common shares outstanding |
40,100,320 | 37,488,331 | 29,249,499 | |||||||||
| Effect of dilutive stock options and warrant |
26,756 | 58,796 | 84,377 | |||||||||
|
|
|
|
|
|
|
|||||||
| Total diluted average common shares outstanding |
40,127,076 | 37,547,127 | 29,333,876 | |||||||||
|
|
|
|
|
|
|
|||||||
| Earnings per common share—basic |
$ | 2.16 | $ | 2.15 | $ | 2.39 | ||||||
| Earnings per common share—diluted |
2.16 | 2.15 | 2.39 | |||||||||
|
|
|
|
|
|
|
|||||||
Stock options representing shares of 95,700 were not included in the computation of diluted earnings per share for the year ended December 31, 2016 because to do so would have been anti-dilutive. All stock options were included in the computation for the years ended December 31, 2015 and 2014. No contingently issuable shares were estimated to be awarded under the 2015 total shareholder return plan as the stock performance targets were not met for the year ended December 31, 2016.
On September 9, 2016, WesBanco issued 5,423,348 shares of common stock (109,257 of which shares were treasury stock) to complete its acquisition of YCB. These shares are included in average shares outstanding beginning on that date. For additional information relating to the YCB acquisition, refer to Note 2, “Mergers and Acquisitions.”
103
Table of Contents
NOTE 4. SECURITIES
The following table shows the amortized cost and fair values of available-for-sale and held-to-maturity securities:
| December 31, 2016 | December 31, 2015 | |||||||||||||||||||||||||||||||
| (in thousands) |
Amortized Cost |
Gross Unrealized Gains |
Gross Unrealized Losses |
Estimated Fair Value |
Amortized Cost |
Gross Unrealized Gains |
Gross Unrealized Losses |
Estimated Fair Value |
||||||||||||||||||||||||
| Available-for-sale |
||||||||||||||||||||||||||||||||
| U.S. Government sponsored entities and agencies |
$ | 54,803 | $ | 3 | $ | (763 | ) | $ | 54,043 | $ | 82,725 | $ | 1,183 | $ | (403 | ) | $ | 83,505 | ||||||||||||||
| Residential mortgage-backed securities and collateralized mortgage obligations of government agencies |
1,052,397 | 911 | (18,209 | ) | 1,035,099 | 1,188,256 | 1,720 | (13,896 | ) | 1,176,080 | ||||||||||||||||||||||
| Obligations of states and political subdivisions |
110,208 | 3,114 | (1,659 | ) | 111,663 | 76,106 | 4,205 | (46 | ) | 80,265 | ||||||||||||||||||||||
| Corporate debt securities |
35,292 | 117 | (108 | ) | 35,301 | 58,745 | 181 | (333 | ) | 58,593 | ||||||||||||||||||||||
|
|
|
|
|
|
|
|
|
|
|
|
|
|
|
|
|
|||||||||||||||||
| Total debt securities |
$ | 1,252,700 | $ | 4,145 | $ | (20,739 | ) | $ | 1,236,106 | $ | 1,405,832 | $ | 7,289 | $ | (14,678 | ) | $ | 1,398,443 | ||||||||||||||
| Equity securities |
4,062 | 1,032 | (24 | ) | 5,070 | 3,812 | 816 | (2 | ) | 4,626 | ||||||||||||||||||||||
|
|
|
|
|
|
|
|
|
|
|
|
|
|
|
|
|
|||||||||||||||||
| Total available-for-sale securities |
$ | 1,256,762 | $ | 5,177 | $ | (20,763 | ) | $ | 1,241,176 | $ | 1,409,644 | $ | 8,105 | $ | (14,680 | ) | $ | 1,403,069 | ||||||||||||||
|
|
|
|
|
|
|
|
|
|
|
|
|
|
|
|
|
|||||||||||||||||
| Held-to-maturity |
||||||||||||||||||||||||||||||||
| U.S. Government sponsored entities and agencies |
$ | 13,394 | $ | — | $ | (414 | ) | $ | 12,980 | $ | — | $ | — | $ | — | $ | — | |||||||||||||||
| Residential mortgage-backed securities and collateralized mortgage obligations of government agencies |
215,141 | 1,279 | (2,563 | ) | 213,857 | 216,419 | 1,922 | (2,014 | ) | 216,327 | ||||||||||||||||||||||
| Obligations of states and political subdivisions |
805,019 | 15,652 | (5,529 | ) | 815,142 | 762,039 | 26,121 | (726 | ) | 787,434 | ||||||||||||||||||||||
| Corporate debt securities |
34,413 | 418 | (20 | ) | 34,811 | 34,472 | 237 | (263 | ) | 34,446 | ||||||||||||||||||||||
|
|
|
|
|
|
|
|
|
|
|
|
|
|
|
|
|
|||||||||||||||||
| Total held-to-maturity securities |
$ | 1,067,967 | $ | 17,349 | $ | (8,526 | ) | $ | 1,076,790 | $ | 1,012,930 | $ | 28,280 | $ | (3,003 | ) | $ | 1,038,207 | ||||||||||||||
|
|
|
|
|
|
|
|
|
|
|
|
|
|
|
|
|
|||||||||||||||||
| Total |
$ | 2,324,729 | $ | 22,526 | $ | (29,289 | ) | $ | 2,317,966 | $ | 2,422,574 | $ | 36,385 | $ | (17,683 | ) | $ | 2,441,276 | ||||||||||||||
|
|
|
|
|
|
|
|
|
|
|
|
|
|
|
|
|
|||||||||||||||||
Trading securities, which consist of investments in various mutual funds held in grantor trusts formed in connection with a deferred compensation plan, are recorded at fair value and totaled $7.1 million and $6.5 million, at December 31, 2016 and 2015, respectively.
At December 31, 2016 and 2015, there were no holdings of any one issuer, other than the U.S. government sponsored entities and its agencies, in an amount greater than 10% of WesBanco’s shareholders’ equity.
104
Table of Contents
The following table presents the fair value of available-for-sale and held-to-maturity securities by contractual maturity at December 31, 2016. In many instances, the issuers may have the right to call or prepay obligations without penalty prior to the contractual maturity date.
| December 31, 2016 | ||||||||||||||||||||||||
| (in thousands) |
One Year or less |
One to Five Years |
Five to Ten Years |
After Ten Years |
Mortgage-backed and Equity |
Total | ||||||||||||||||||
| Available-for-sale |
||||||||||||||||||||||||
| U.S. Government sponsored entities and agencies |
$ | 2,000 | $ | 11,896 | $ | 16,729 | $ | 14,525 | $ | 8,893 | $ | 54,043 | ||||||||||||
| Residential mortgage-backed securities and collateralized mortgage obligations of government agencies (1) |
— | — | — | — | 1,035,099 | 1,035,099 | ||||||||||||||||||
| Obligations of states and political subdivisions |
8,062 | 21,835 | 36,571 | 45,195 | — | 111,663 | ||||||||||||||||||
| Corporate debt securities |
— | 30,323 | 3,037 | 1,941 | — | 35,301 | ||||||||||||||||||
| Equity securities (2) |
— | — | — | — | 5,070 | 5,070 | ||||||||||||||||||
|
|
|
|
|
|
|
|
|
|
|
|
|
|||||||||||||
| Total available-for-sale securities |
$ | 10,062 | $ | 64,054 | $ | 56,337 | $ | 61,661 | $ | 1,049,062 | $ | 1,241,176 | ||||||||||||
|
|
|
|
|
|
|
|
|
|
|
|
|
|||||||||||||
| Held-to-maturity (3) |
||||||||||||||||||||||||
| U.S. Government sponsored entities and agencies |
$ | — | $ | — | $ | — | $ | — | $ | 12,980 | $ | 12,980 | ||||||||||||
| Residential mortgage-backed securities and collateralized mortgage obligations of government agencies (1) |
— | — | — | — | 213,857 | 213,857 | ||||||||||||||||||
| Obligations of states and political subdivisions |
735 | 69,980 | 407,752 | 336,675 | — | 815,142 | ||||||||||||||||||
| Corporate debt securities |
— | 976 | 33,835 | — | — | 34,811 | ||||||||||||||||||
|
|
|
|
|
|
|
|
|
|
|
|
|
|||||||||||||
| Total held-to-maturity securities |
$ | 735 | $ | 70,956 | $ | 441,587 | $ | 336,675 | $ | 226,837 | $ | 1,076,790 | ||||||||||||
|
|
|
|
|
|
|
|
|
|
|
|
|
|||||||||||||
| Total |
$ | 10,797 | $ | 135,010 | $ | 497,924 | $ | 398,336 | $ | 1,275,899 | $ | 2,317,966 | ||||||||||||
|
|
|
|
|
|
|
|
|
|
|
|
|
|||||||||||||
| (1) | Mortgage-backed and collateralized mortgage securities, which have prepayment provisions, are not assigned to maturity categories due to fluctuations in their prepayment speeds. |
| (2) | Equity securities, which have no stated maturity, are not assigned a maturity category. |
| (3) | The held-to-maturity portfolio is carried at an amortized cost of $1.1 billion. |
Securities with aggregate fair values of $1.2 billion and $1.0 billion at December 31, 2016 and 2015, respectively, were pledged as security for public and trust funds, and securities sold under agreements to repurchase. Proceeds from the sale of available-for-sale securities were $277.2 million, $635.6 million and $16.2 million for the years ended December 31, 2016, 2015 and 2014, respectively. Net unrealized (losses) gains on available-for-sale securities included in accumulated other comprehensive income net of tax, as of December 31, 2016, 2015 and 2014 were ($9.9) million, ($4.2) million and $2.9 million, respectively.
105
Table of Contents
The following table presents the gross realized gains and losses on sales and calls of securities for the years ended December 31, 2016, 2015 and 2014, respectively.
| For the Years Ended December 31, |
||||||||||||
| (in thousands) |
2016 | 2015 | 2014 | |||||||||
| Gross realized gains |
$ | 2,638 | $ | 1,029 | $ | 1,131 | ||||||
| Gross realized losses |
(281 | ) | (81 | ) | (228 | ) | ||||||
|
|
|
|
|
|
|
|||||||
| Net realized gains |
$ | 2,357 | $ | 948 | $ | 903 | ||||||
|
|
|
|
|
|
|
|||||||
The following tables provide information on unrealized losses on investment securities that have been in an unrealized loss position for less than twelve months and twelve months or more as of December 31, 2016 and 2015:
| December 31, 2016 | |||||||||||||||||||||||||||||||||||||||||||||
| Less than 12 months | 12 months or more | Total | |||||||||||||||||||||||||||||||||||||||||||
| (dollars in thousands) |
Fair Value |
Unrealized Losses |
# of Securities |
Fair Value |
Unrealized Losses |
# of Securities |
Fair Value |
Unrealized Losses |
# of Securities | ||||||||||||||||||||||||||||||||||||
| U.S. Government sponsored entities and agencies |
$ | 58,108 | $ | (1,177 | ) | 11 | $ | — | $ | — | — | $ | 58,108 | $ | (1,177 | ) | 11 | ||||||||||||||||||||||||||||
| Residential mortgage-backed securities and collateralized mortgage obligations of government agencies |
1,057,343 | (18,558 | ) | 246 | 59,518 | (2,214 | ) | 16 | 1,116,861 | (20,772 | ) | 262 | |||||||||||||||||||||||||||||||||
| Obligations of states and political subdivisions |
364,583 | (7,121 | ) | 604 | 2,047 | (67 | ) | 3 | 366,630 | (7,188 | ) | 607 | |||||||||||||||||||||||||||||||||
| Corporate debt securities |
10,011 | (78 | ) | 3 | 5,973 | (50 | ) | 2 | 15,984 | (128 | ) | 5 | |||||||||||||||||||||||||||||||||
| Equity securities |
2,938 | (24 | ) | 2 | — | — | — | 2,938 | (24 | ) | 2 | ||||||||||||||||||||||||||||||||||
|
|
|
|
|
|
|
|
|
|
|
|
|
|
|
|
|
|
|
||||||||||||||||||||||||||||
| Total temporarily impaired securities |
$ | 1,492,983 | $ | (26,958 | ) | 866 | $ | 67,538 | $ | (2,331 | ) | 21 | $ | 1,560,521 | $ | (29,289 | ) | 887 | |||||||||||||||||||||||||||
|
|
|
|
|
|
|
|
|
|
|
|
|
|
|
|
|
|
|
||||||||||||||||||||||||||||
| December 31, 2015 | |||||||||||||||||||||||||||||||||||||||||||||
| Less than 12 months | 12 months or more | Total | |||||||||||||||||||||||||||||||||||||||||||
| (dollars in thousands) |
Fair Value |
Unrealized Losses |
# of Securities |
Fair Value |
Unrealized Losses |
# of Securities |
Fair Value |
Unrealized Losses |
# of Securities | ||||||||||||||||||||||||||||||||||||
| U.S. Government sponsored entities and agencies |
$ | 49,826 | $ | (403) | 11 | $ | — | $ | — | — | $ | 49,826 | $ | (403) | 11 | ||||||||||||||||||||||||||||||
| Residential mortgage-backed securities and collateralized mortgage obligations of government agencies |
1,003,397 | (10,981 | ) | 187 | 146,182 | (4,929 | ) | 31 | 1,149,579 | (15,910 | ) | 218 | |||||||||||||||||||||||||||||||||
| Obligations of states and political subdivisions |
58,705 | (400 | ) | 76 | 23,691 | (372 | ) | 29 | 82,396 | (772 | ) | 105 | |||||||||||||||||||||||||||||||||
| Corporate debt securities |
41,326 | (541 | ) | 12 | 1,931 | (55 | ) | 1 | 43,257 | (596 | ) | 13 | |||||||||||||||||||||||||||||||||
| Equity securities |
1,378 | (2 | ) | 1 | — | — | — | 1,378 | (2 | ) | 1 | ||||||||||||||||||||||||||||||||||
|
|
|
|
|
|
|
|
|
|
|
|
|
|
|
|
|
|
|
||||||||||||||||||||||||||||
| Total temporarily impaired securities |
$ | 1,154,632 | $ | (12,327 | ) | 287 | $ | 171,804 | $ | (5,356 | ) | 61 | $ | 1,326,436 | $ | (17,683 | ) | 348 | |||||||||||||||||||||||||||
|
|
|
|
|
|
|
|
|
|
|
|
|
|
|
|
|
|
|
||||||||||||||||||||||||||||
Unrealized losses on debt securities in the tables represent temporary fluctuations resulting from changes in market rates in relation to fixed yields. Unrealized losses in the available-for-sale portfolio are accounted for as an adjustment, net of taxes, to other comprehensive income in shareholders’ equity.
106
Table of Contents
WesBanco does not believe the securities presented above are impaired due to reasons of credit quality, as substantially all debt securities are rated above investment grade and all are paying principal and interest according to their contractual terms. WesBanco does not intend to sell, nor is it more likely than not that it will be required to sell, loss position securities prior to recovery of their cost, and therefore, management believes the unrealized losses detailed above are temporary and no impairment loss relating to these securities has been recognized.
Securities that do not have readily determinable fair values and for which WesBanco does not exercise significant influence are carried at cost. Cost method investments consist primarily of FHLB of Pittsburgh, Cincinnati and Indianapolis stock totaling $46.4 million and $45.5 million at December 31, 2016 and 2015, respectively, and are included in other assets in the Consolidated Balance Sheets. Cost method investments are evaluated for impairment whenever events or circumstances suggest that their carrying value may not be recoverable.
NOTE 5. LOANS AND THE ALLOWANCE FOR CREDIT LOSSES
The recorded investment in loans is presented in the Consolidated Balance Sheets net of deferred loan fees and costs and discounts on purchased loans. The deferred loan fees and costs were $0.3 million and $1.0 million at December 31, 2016 and 2015, respectively. The discounts on purchased loans from acquisitions were $24.1 million, including $11.0 million related to YCB, and $15.7 million at December 31, 2016 and 2015, respectively.
| December 31, | December 31, | |||||||
| (in thousands) |
2016 | 2015 | ||||||
| Commercial real estate: |
||||||||
| Land and construction |
$ | 496,539 | $ | 344,748 | ||||
| Improved property |
2,376,972 | 1,911,633 | ||||||
|
|
|
|
|
|||||
| Total commercial real estate |
2,873,511 | 2,256,381 | ||||||
|
|
|
|
|
|||||
| Commercial and industrial |
1,088,118 | 737,878 | ||||||
| Residential real estate |
1,383,390 | 1,247,800 | ||||||
| Home equity |
508,359 | 416,889 | ||||||
| Consumer |
396,058 | 406,894 | ||||||
|
|
|
|
|
|||||
| Total portfolio loans |
6,249,436 | 5,065,842 | ||||||
|
|
|
|
|
|||||
| Loans held for sale |
17,315 | 7,899 | ||||||
|
|
|
|
|
|||||
| Total loans |
$ | 6,266,751 | $ | 5,073,741 | ||||
|
|
|
|
|
|||||
107
Table of Contents
The following tables summarize changes in the allowance for credit losses applicable to each category of the loan portfolio:
| For the Year Ended December 31, 2016 | ||||||||||||||||||||||||||||||||||||||||
| (in thousands) |
Commercial Real Estate- Land and Construction |
Commercial Real Estate- Improved Property |
Commercial & Industrial |
Residential Real Estate |
Home Equity |
Consumer | Deposit Overdraft |
Total | ||||||||||||||||||||||||||||||||
| Balance at beginning of year: |
||||||||||||||||||||||||||||||||||||||||
| Allowance for loan losses |
$ | 4,390 | $ | 14,748 | $ | 10,002 | $ | 4,582 | $ | 2,883 | $ | 4,763 | $ | 342 | $ | 41,710 | ||||||||||||||||||||||||
| Allowance for loan commitments |
157 | 26 | 260 | 7 | 117 | 46 | — | 613 | ||||||||||||||||||||||||||||||||
|
|
|
|
|
|
|
|
|
|
|
|
|
|
|
|
|
|||||||||||||||||||||||||
| Total beginning allowance for credit losses |
4,547 | 14,774 | 10,262 | 4,589 | 3,000 | 4,809 | 342 | 42,323 | ||||||||||||||||||||||||||||||||
|
|
|
|
|
|
|
|
|
|
|
|
|
|
|
|
|
|||||||||||||||||||||||||
| Provision for credit losses: |
||||||||||||||||||||||||||||||||||||||||
| Provision for loan losses |
26 | 4,223 | 1,160 | 16 | 662 | 1,356 | 1,077 | 8,520 | ||||||||||||||||||||||||||||||||
| Provision for loan commitments |
(6 | ) | (9 | ) | (72 | ) | 2 | 45 | (2 | ) | — | (42 | ) | |||||||||||||||||||||||||||
|
|
|
|
|
|
|
|
|
|
|
|
|
|
|
|
|
|||||||||||||||||||||||||
| Total provision for credit losses |
20 | 4,214 | 1,088 | 18 | 707 | 1,354 | 1,077 | 8,478 | ||||||||||||||||||||||||||||||||
|
|
|
|
|
|
|
|
|
|
|
|
|
|
|
|
|
|||||||||||||||||||||||||
| Charge-offs |
(73 | ) | (1,886 | ) | (3,070 | ) | (937 | ) | (397 | ) | (3,606 | ) | (884 | ) | (10,853 | ) | ||||||||||||||||||||||||
| Recoveries |
5 | 1,543 | 320 | 445 | 274 | 1,485 | 225 | 4,297 | ||||||||||||||||||||||||||||||||
|
|
|
|
|
|
|
|
|
|
|
|
|
|
|
|
|
|||||||||||||||||||||||||
| Net charge-offs |
(68 | ) | (343 | ) | (2,750 | ) | (492 | ) | (123 | ) | (2,121 | ) | (659 | ) | (6,556 | ) | ||||||||||||||||||||||||
|
|
|
|
|
|
|
|
|
|
|
|
|
|
|
|
|
|||||||||||||||||||||||||
| Balance at end of period: |
||||||||||||||||||||||||||||||||||||||||
| Allowance for loan losses |
4,348 | 18,628 | 8,412 | 4,106 | 3,422 | 3,998 | 760 | 43,674 | ||||||||||||||||||||||||||||||||
| Allowance for loan commitments |
151 | 17 | 188 | 9 | 162 | 44 | — | 571 | ||||||||||||||||||||||||||||||||
|
|
|
|
|
|
|
|
|
|
|
|
|
|
|
|
|
|||||||||||||||||||||||||
| Total ending allowance for credit losses |
$ | 4,499 | $ | 18,645 | $ | 8,600 | $ | 4,115 | $ | 3,584 | $ | 4,042 | $ | 760 | $ | 44,245 | ||||||||||||||||||||||||
|
|
|
|
|
|
|
|
|
|
|
|
|
|
|
|
|
|||||||||||||||||||||||||
| For the Year Ended December 31, 2015 | ||||||||||||||||||||||||||||||||||||||||
| (in thousands) |
Commercial Real Estate- Land and Construction |
Commercial Real Estate- Improved Property |
Commercial & Industrial |
Residential Real Estate |
Home Equity |
Consumer | Deposit Overdraft |
Total | ||||||||||||||||||||||||||||||||
| Balance at beginning of year: |
||||||||||||||||||||||||||||||||||||||||
| Allowance for loan losses |
$ | 5,654 | $ | 17,573 | $ | 9,063 | $ | 5,382 | $ | 2,329 | $ | 4,078 | $ | 575 | $ | 44,654 | ||||||||||||||||||||||||
| Allowance for loan commitments |
194 | 10 | 112 | 9 | 90 | 40 | — | 455 | ||||||||||||||||||||||||||||||||
|
|
|
|
|
|
|
|
|
|
|
|
|
|
|
|
|
|||||||||||||||||||||||||
| Total beginning allowance for credit losses |
5,848 | 17,583 | 9,175 | 5,391 | 2,419 | 4,118 | 575 | 45,109 | ||||||||||||||||||||||||||||||||
|
|
|
|
|
|
|
|
|
|
|
|
|
|
|
|
|
|||||||||||||||||||||||||
| Provision for credit losses: |
||||||||||||||||||||||||||||||||||||||||
| Provision for loan losses |
(1,265 | ) | 1,250 | 3,289 | 399 | 1,794 | 2,337 | 391 | 8,195 | |||||||||||||||||||||||||||||||
| Provision for loan commitments |
(37 | ) | 16 | 148 | (2 | ) | 27 | 6 | — | 158 | ||||||||||||||||||||||||||||||
|
|
|
|
|
|
|
|
|
|
|
|
|
|
|
|
|
|||||||||||||||||||||||||
| Total provision for credit losses |
(1,302 | ) | 1,266 | 3,437 | 397 | 1,821 | 2,343 | 391 | 8,353 | |||||||||||||||||||||||||||||||
|
|
|
|
|
|
|
|
|
|
|
|
|
|
|
|
|
|||||||||||||||||||||||||
| Charge-offs |
— | (4,915 | ) | (2,785 | ) | (1,803 | ) | (1,502 | ) | (2,892 | ) | (846 | ) | (14,743 | ) | |||||||||||||||||||||||||
| Recoveries |
1 | 840 | 435 | 604 | 262 | 1,240 | 222 | 3,604 | ||||||||||||||||||||||||||||||||
|
|
|
|
|
|
|
|
|
|
|
|
|
|
|
|
|
|||||||||||||||||||||||||
| Net charge-offs |
1 | (4,075 | ) | (2,350 | ) | (1,199 | ) | (1,240 | ) | (1,652 | ) | (624 | ) | (11,139 | ) | |||||||||||||||||||||||||
|
|
|
|
|
|
|
|
|
|
|
|
|
|
|
|
|
|||||||||||||||||||||||||
| Balance at end of period: |
||||||||||||||||||||||||||||||||||||||||
| Allowance for loan losses |
4,390 | 14,748 | 10,002 | 4,582 | 2,883 | 4,763 | 342 | 41,710 | ||||||||||||||||||||||||||||||||
| Allowance for loan commitments |
157 | 26 | 260 | 7 | 117 | 46 | — | 613 | ||||||||||||||||||||||||||||||||
|
|
|
|
|
|
|
|
|
|
|
|
|
|
|
|
|
|||||||||||||||||||||||||
| Total ending allowance for credit losses |
$ | 4,547 | $ | 14,774 | $ | 10,262 | $ | 4,589 | $ | 3,000 | $ | 4,809 | $ | 342 | $ | 42,323 | ||||||||||||||||||||||||
|
|
|
|
|
|
|
|
|
|
|
|
|
|
|
|
|
|||||||||||||||||||||||||
108
Table of Contents
| For the Year Ended December 31, 2014 | ||||||||||||||||||||||||||||||||||||||||
| (in thousands) |
Commercial Real Estate- Land and Construction |
Commercial Real Estate- Improved Property |
Commercial & Industrial |
Residential Real Estate |
Home Equity |
Consumer | Deposit Overdraft |
Total | ||||||||||||||||||||||||||||||||
| Balance at beginning of year: |
||||||||||||||||||||||||||||||||||||||||
| Allowance for loan losses |
$ | 6,056 | $ | 18,157 | $ | 9,925 | $ | 5,673 | $ | 2,017 | $ | 5,020 | $ | 520 | $ | 47,368 | ||||||||||||||||||||||||
| Allowance for loan commitments |
301 | 62 | 130 | 5 | 85 | 19 | — | 602 | ||||||||||||||||||||||||||||||||
|
|
|
|
|
|
|
|
|
|
|
|
|
|
|
|
|
|||||||||||||||||||||||||
| Total beginning allowance for credit losses |
6,357 | 18,219 | 10,055 | 5,678 | 2,102 | 5,039 | 520 | 47,970 | ||||||||||||||||||||||||||||||||
|
|
|
|
|
|
|
|
|
|
|
|
|
|
|
|
|
|||||||||||||||||||||||||
| Provision for credit losses: |
||||||||||||||||||||||||||||||||||||||||
| Provision for loan losses |
(402 | ) | 1,239 | 1,429 | 1,692 | 849 | 1,144 | 601 | 6,552 | |||||||||||||||||||||||||||||||
| Provision for loan commitments |
(107 | ) | (52 | ) | (18 | ) | 4 | 5 | 21 | — | (147 | ) | ||||||||||||||||||||||||||||
|
|
|
|
|
|
|
|
|
|
|
|
|
|
|
|
|
|||||||||||||||||||||||||
| Total provision for credit losses |
(509 | ) | 1,187 | 1,411 | 1,696 | 854 | 1,165 | 601 | 6,405 | |||||||||||||||||||||||||||||||
|
|
|
|
|
|
|
|
|
|
|
|
|
|
|
|
|
|||||||||||||||||||||||||
| Charge-offs |
— | (2,426 | ) | (3,485 | ) | (2,437 | ) | (652 | ) | (3,120 | ) | (779 | ) | (12,899 | ) | |||||||||||||||||||||||||
| Recoveries |
— | 603 | 1,194 | 454 | 115 | 1,034 | 233 | 3,633 | ||||||||||||||||||||||||||||||||
|
|
|
|
|
|
|
|
|
|
|
|
|
|
|
|
|
|||||||||||||||||||||||||
| Net charge-offs |
— | (1,823 | ) | (2,291 | ) | (1,983 | ) | (537 | ) | (2,086 | ) | (546 | ) | (9,266 | ) | |||||||||||||||||||||||||
|
|
|
|
|
|
|
|
|
|
|
|
|
|
|
|
|
|||||||||||||||||||||||||
| Balance at end of period: |
||||||||||||||||||||||||||||||||||||||||
| Allowance for loan losses |
5,654 | 17,573 | 9,063 | 5,382 | 2,329 | 4,078 | 575 | 44,654 | ||||||||||||||||||||||||||||||||
| Allowance for loan commitments |
194 | 10 | 112 | 9 | 90 | 40 | — | 455 | ||||||||||||||||||||||||||||||||
|
|
|
|
|
|
|
|
|
|
|
|
|
|
|
|
|
|||||||||||||||||||||||||
| Total ending allowance for credit losses |
$ | 5,848 | $ | 17,583 | $ | 9,175 | $ | 5,391 | $ | 2,419 | $ | 4,118 | $ | 575 | $ | 45,109 | ||||||||||||||||||||||||
|
|
|
|
|
|
|
|
|
|
|
|
|
|
|
|
|
|||||||||||||||||||||||||
109
Table of Contents
The following tables present the allowance for credit losses and recorded investments in loans by category:
| Allowance for Credit Losses and Recorded Investment in Loans | ||||||||||||||||||||||||||||||||
| (in thousands) |
Commercial Real Estate- Land and Construction |
Commercial Real Estate- Improved Property |
Commercial and Industrial |
Residential Real Estate |
Home Equity |
Consumer | Deposit Over- draft |
Total | ||||||||||||||||||||||||
| December 31, 2016 |
||||||||||||||||||||||||||||||||
| Allowance for credit losses: |
||||||||||||||||||||||||||||||||
| Allowance for loans individually evaluated for impairment |
$ | — | $ | 470 | $ | 407 | $ | — | $ | — | $ | — | $ | — | $ | 877 | ||||||||||||||||
| Allowance for loans collectively evaluated for impairment |
4,348 | 18,158 | 8,005 | 4,106 | 3,422 | 3,998 | 760 | 42,797 | ||||||||||||||||||||||||
| Allowance for loan commitments |
151 | 17 | 188 | 9 | 162 | 44 | — | 571 | ||||||||||||||||||||||||
|
|
|
|
|
|
|
|
|
|
|
|
|
|
|
|
|
|||||||||||||||||
| Total allowance for credit losses |
$ | 4,499 | $ | 18,645 | $ | 8,600 | $ | 4,115 | $ | 3,584 | $ | 4,042 | $ | 760 | $ | 44,245 | ||||||||||||||||
|
|
|
|
|
|
|
|
|
|
|
|
|
|
|
|
|
|||||||||||||||||
| Portfolio loans: |
||||||||||||||||||||||||||||||||
| Individually evaluated for impairment (1) |
$ | — | $ | 3,012 | $ | 1,270 | $ | — | $ | — | $ | — | $ | — | $ | 4,282 | ||||||||||||||||
| Collectively evaluated for impairment |
494,928 | 2,364,067 | 1,086,445 | 1,382,447 | 508,359 | 396,049 | — | 6,232,295 | ||||||||||||||||||||||||
| Acquired with deteriorated credit quality |
1,611 | 9,893 | 403 | 943 | — | 9 | — | 12,859 | ||||||||||||||||||||||||
|
|
|
|
|
|
|
|
|
|
|
|
|
|
|
|
|
|||||||||||||||||
| Total portfolio loans |
$ | 496,539 | $ | 2,376,972 | $ | 1,088,118 | $ | 1,383,390 | $ | 508,359 | $ | 396,058 | $ | — | $ | 6,249,436 | ||||||||||||||||
|
|
|
|
|
|
|
|
|
|
|
|
|
|
|
|
|
|||||||||||||||||
| December 31, 2015 |
||||||||||||||||||||||||||||||||
| Allowance for credit losses: |
||||||||||||||||||||||||||||||||
| Allowance for loans individually evaluated for impairment |
$ | — | $ | 668 | $ | 853 | $ | — | $ | — | $ | — | $ | — | $ | 1,521 | ||||||||||||||||
| Allowance for loans collectively evaluated for impairment |
4,390 | 14,080 | 9,149 | 4,582 | 2,883 | 4,763 | 342 | 40,189 | ||||||||||||||||||||||||
| Allowance for loan commitments |
157 | 26 | 260 | 7 | 117 | 46 | — | 613 | ||||||||||||||||||||||||
|
|
|
|
|
|
|
|
|
|
|
|
|
|
|
|
|
|||||||||||||||||
| Total allowance for credit losses |
$ | 4,547 | $ | 14,774 | $ | 10,262 | $ | 4,589 | $ | 3,000 | $ | 4,809 | $ | 342 | $ | 42,323 | ||||||||||||||||
|
|
|
|
|
|
|
|
|
|
|
|
|
|
|
|
|
|||||||||||||||||
| Portfolio loans: |
||||||||||||||||||||||||||||||||
| Individually evaluated for impairment (1) |
$ | — | $ | 4,031 | $ | 4,872 | $ | — | $ | — | $ | — | $ | — | $ | 8,903 | ||||||||||||||||
| Collectively evaluated for impairment |
343,832 | 1,899,738 | 732,957 | 1,247,639 | 416,862 | 406,622 | — | 5,047,650 | ||||||||||||||||||||||||
| Acquired with deteriorated credit quality |
916 | 7,864 | 49 | 161 | 27 | 272 | — | 9,289 | ||||||||||||||||||||||||
|
|
|
|
|
|
|
|
|
|
|
|
|
|
|
|
|
|||||||||||||||||
| Total portfolio loans |
$ | 344,748 | $ | 1,911,633 | $ | 737,878 | $ | 1,247,800 | $ | 416,889 | $ | 406,894 | $ | — | $ | 5,065,842 | ||||||||||||||||
|
|
|
|
|
|
|
|
|
|
|
|
|
|
|
|
|
|||||||||||||||||
| (1) | Commercial loans greater than $1 million that are reported as non-accrual or as a TDR are individually evaluated for impairment. |
WesBanco maintains an internal loan grading system to reflect the credit quality of commercial loans. Commercial loan risk grades are determined based on an evaluation of the relevant characteristics of each loan, assigned at the inception of each loan and adjusted thereafter at any time to reflect changes in the risk profile throughout the life of each loan. The primary factors used to determine the risk grade are the reliability and sustainability of the primary source of repayment and overall financial strength of the borrower. This includes an analysis of cash flow available to repay debt, profitability, liquidity, leverage, and overall financial trends. Other factors include management, industry or property type risks, an assessment of secondary sources of repayment such as collateral or guarantees, other terms and conditions of the loan that may increase or reduce its risk, and economic conditions and other external factors that may influence repayment capacity and financial condition.
Commercial real estate—land and construction consists of loans to finance investments in vacant land, land development, construction of residential housing, and construction of commercial buildings. Commercial real estate—improved property consists of loans for the purchase or refinance of all types of improved owner-
110
Table of Contents
occupied and investment properties. Factors that are considered in assigning the risk grade vary depending on the type of property financed. The risk grade assigned to construction and development loans is based on the overall viability of the project, the experience and financial capacity of the developer or builder to successfully complete the project, project specific and market absorption rates and comparable property values, and the amount of pre-sales for residential housing construction or pre-leases for commercial investment property. The risk grade assigned to commercial investment property loans is based primarily on the adequacy of net rental income generated by the property to service the debt, the type, quality, industry and mix of tenants, and the terms of leases, but also considers the overall financial capacity of the investors and their experience in owning and managing investment property. The risk grade assigned to owner-occupied commercial real estate and commercial and industrial loans is based primarily on historical and projected earnings, the adequacy of operating cash flow to service all of the business’ debt, and the capital resources, liquidity and leverage of the business, but also considers the industry in which the business operates, the business’ specific competitive advantages or disadvantages, the quality and experience of management, and external influences on the business such as economic conditions. Other factors that are considered for commercial and industrial loans include the type, quality and marketability of non-real estate collateral and whether the structure of the loan increases or reduces its risk. The type, age, condition, location and any environmental risks associated with a property are also considered for all types of commercial real estate. The overall financial condition and repayment capacity of any guarantors is also evaluated to determine the extent to which they mitigate other risks of the loan. The following paragraphs provide descriptions of risk grades that are applicable to commercial real estate and commercial and industrial loans.
Pass loans are those that exhibit a history of positive financial results that are at least comparable to the average for their industry or type of real estate. The primary source of repayment is acceptable and these loans are expected to perform satisfactorily during most economic cycles. Pass loans typically have no significant external factors that are expected to adversely affect these borrowers more than others in the same industry or property type. Any minor unfavorable characteristics of these loans are outweighed or mitigated by other positive factors including but not limited to adequate secondary or tertiary sources of repayment.
Criticized or compromised loans are currently protected but have weaknesses, which, if not corrected, may be inadequately protected at some future date. These loans represent an unwarranted credit risk and would generally not be extended in the normal course of lending. Specific issues which may warrant this grade include declining financial results, increased reliance on secondary sources of repayment or guarantor support and adverse external influences that may negatively impact the business or property.
Substandard and doubtful loans are equivalent to the classifications used by banking regulators. Substandard loans are inadequately protected by the current repayment capacity and equity of the borrower or collateral pledged, if any. Substandard loans have one or more well-defined weaknesses that jeopardize their repayment or collection in full. These loans may or may not be reported as non-accrual. Doubtful loans have all the weaknesses inherent to a substandard loan with the added characteristic that full repayment is highly questionable or improbable on the basis of currently existing facts, conditions and collateral values. However, recognition of loss may be deferred if there are reasonably specific pending factors that will reduce the risk if they occur.
111
Table of Contents
The following tables summarize commercial loans by their assigned risk grade:
| Commercial Loans by Internally Assigned Risk Grade | ||||||||||||||||
| (in thousands) |
Commercial Real Estate- Land and Construction |
Commercial Real Estate- Improved Property |
Commercial & Industrial |
Total Commercial Loans |
||||||||||||
| As of December 31, 2016 |
||||||||||||||||
| Pass |
$ | 489,380 | $ | 2,324,755 | $ | 1,072,751 | $ | 3,886,886 | ||||||||
| Criticized—compromised |
4,405 | 15,295 | 5,078 | 24,778 | ||||||||||||
| Classified—substandard |
2,754 | 36,922 | 10,289 | 49,965 | ||||||||||||
| Classified—doubtful |
— | — | — | — | ||||||||||||
|
|
|
|
|
|
|
|
|
|||||||||
| Total |
$ | 496,539 | $ | 2,376,972 | $ | 1,088,118 | $ | 3,961,629 | ||||||||
|
|
|
|
|
|
|
|
|
|||||||||
| As of December 31, 2015 |
||||||||||||||||
| Pass |
$ | 335,989 | $ | 1,864,986 | $ | 713,578 | $ | 2,914,553 | ||||||||
| Criticized—compromised |
5,527 | 10,911 | 9,860 | 26,298 | ||||||||||||
| Classified—substandard |
3,232 | 35,736 | 14,440 | 53,408 | ||||||||||||
| Classified—doubtful |
— | — | — | — | ||||||||||||
|
|
|
|
|
|
|
|
|
|||||||||
| Total |
$ | 344,748 | $ | 1,911,633 | $ | 737,878 | $ | 2,994,259 | ||||||||
|
|
|
|
|
|
|
|
|
|||||||||
Residential real estate, home equity and consumer loans are not assigned internal risk grades other than as required by regulatory guidelines that are based primarily on the age of past due loans. WesBanco primarily evaluates the credit quality of residential real estate, home equity and consumer loans based on repayment performance and historical loss rates. The aggregate amount of residential real estate, home equity and consumer loans classified as substandard in accordance with regulatory guidelines were $20.6 million at December 31, 2016 and $15.8 million at December 31, 2015, of which $3.4 and $3.1 million were accruing, for each period, respectively. The aggregate amount of residential real estate, home equity and consumer loans classified as substandard are not included in the tables above.
Acquired YCB Loans—In conjunction with the YCB acquisition, WesBanco acquired loans with a book value of $1,027.2 million. These loans were recorded at their fair value of $1,014.0 million, with $1,006.9 million categorized as ASC 310-20 loans. The fair market value adjustment on these loans of $9.2 million at acquisition date is expected to be recognized into interest income on a level yield basis over the remaining expected life of the loans.
Loans acquired with deteriorated credit quality with a book value of $11.1 million and contractually required payments of $13.3 million were recorded at their estimated fair value of $7.1 million, of which $2.7 million were accounted for under the cost recovery method in accordance with ASC 310-30 as cash flows cannot be reasonably estimated, and categorized as non-accrual. The accretable yield on the acquired impaired loans was estimated at $0.8 million, while the non-accretable difference is estimated at $5.3 million on the date of acquisition.
At December 31, 2016, the carrying amount of loans acquired with deteriorated credit quality was $5.7 million, while the outstanding customer balance was $9.2 million. At December 31, 2016, no allowance for loan losses has been recognized related to the acquired impaired loans.
Acquired ESB Loans—The carrying amount of loans acquired from ESB with deteriorated credit quality at December 31, 2016 and 2015 were $7.2 million and $9.3 million, respectively. At December 31, 2016, the accretable yield was $0.9 million. At December 31, 2016 an allowance for loan loss of $1.8 million was recognized related to the acquired impaired loans, as the estimates for future cash flows on these loans have been negatively impacted. At December 31, 2015, no allowance for loan losses was recognized related to the acquired impaired loans.
112
Table of Contents
The following table provides changes in accretable yield for all loans acquired with deteriorated credit quality:
| For the Years Ended | ||||||||||
| (in thousands) |
December 31, 2016 |
December 31, 2015 | ||||||||
| Balance at beginning of period |
$ | 1,206 | $ | — | ||||||
| Acquisitions |
837 | 1,815 | ||||||||
| Reduction due to change in projected cash flows |
(484 | ) | — | |||||||
| Reclass from non-accretable difference |
1,065 | — | ||||||||
| Transfers out |
(328 | ) | — | |||||||
| Accretion |
(579 | ) | (609 | ) | ||||||
|
|
|
|
|
|||||||
| Balance at end of period |
$ | 1,717 | $ | 1,206 | ||||||
|
|
|
|
|
|||||||
The following tables summarize the age analysis of all categories of loans.
| Age Analysis of Loans | |||||||||||||||||||||||||||||||||||
| (in thousands) |
Current | 30-59 Days Past Due |
60-89 Days Past Due |
90 Days or More Past Due |
Total Past Due |
Total Loans |
90 Days or More Past Due and Accruing (1) | ||||||||||||||||||||||||||||
| As of December 31, 2016 |
|||||||||||||||||||||||||||||||||||
| Commercial real estate: |
|||||||||||||||||||||||||||||||||||
| Land and construction |
$ | 496,245 | $ | — | $ | — | $ | 294 | $ | 294 | $ | 496,539 | $ | — | |||||||||||||||||||||
| Improved property |
2,367,790 | 1,154 | 363 | 7,665 | 9,182 | 2,376,972 | 318 | ||||||||||||||||||||||||||||
|
|
|
|
|
|
|
|
|
|
|
|
|
|
|
||||||||||||||||||||||
| Total commercial real estate |
2,864,035 | 1,154 | 363 | 7,959 | 9,476 | 2,873,511 | 318 | ||||||||||||||||||||||||||||
| Commercial and industrial |
1,082,390 | 2,508 | 1,011 | 2,209 | 5,728 | 1,088,118 | 229 | ||||||||||||||||||||||||||||
| Residential real estate |
1,365,956 | 6,701 | 1,043 | 9,690 | 17,434 | 1,383,390 | 1,922 | ||||||||||||||||||||||||||||
| Home equity |
502,087 | 2,358 | 862 | 3,052 | 6,272 | 508,359 | 626 | ||||||||||||||||||||||||||||
| Consumer |
390,354 | 3,674 | 1,149 | 881 | 5,704 | 396,058 | 644 | ||||||||||||||||||||||||||||
|
|
|
|
|
|
|
|
|
|
|
|
|
|
|
||||||||||||||||||||||
| Total portfolio loans |
6,204,822 | 16,395 | 4,428 | 23,791 | 44,614 | 6,249,436 | 3,739 | ||||||||||||||||||||||||||||
| Loans held for sale |
17,315 | — | — | — | — | 17,315 | — | ||||||||||||||||||||||||||||
|
|
|
|
|
|
|
|
|
|
|
|
|
|
|
||||||||||||||||||||||
| Total loans |
$ | 6,222,137 | $ | 16,395 | $ | 4,428 | $ | 23,791 | $ | 44,614 | $ | 6,266,751 | $ | 3,739 | |||||||||||||||||||||
|
|
|
|
|
|
|
|
|
|
|
|
|
|
|
||||||||||||||||||||||
| Impaired loans included above are as follows: |
|||||||||||||||||||||||||||||||||||
| Non-accrual loans |
$ | 7,570 | $ | 3,479 | $ | 923 | $ | 19,812 | 24,214 | $ | 31,784 | ||||||||||||||||||||||||
| TDRs accruing interest (1) |
7,014 | 342 | 50 | 240 | 632 | 7,646 | |||||||||||||||||||||||||||||
|
|
|
|
|
|
|
|
|
|
|
|
|
||||||||||||||||||||||||
| Total impaired |
$ | 14,584 | $ | 3,821 | $ | 973 | $ | 20,052 | $ | 24,846 | $ | 39,430 | |||||||||||||||||||||||
|
|
|
|
|
|
|
|
|
|
|
|
|
||||||||||||||||||||||||
| As of December 31, 2015 |
|||||||||||||||||||||||||||||||||||
| Commercial real estate: |
|||||||||||||||||||||||||||||||||||
| Land and construction |
$ | 344,184 | $ | — | $ | — | $ | 564 | $ | 564 | $ | 344,748 | $ | — | |||||||||||||||||||||
| Improved property |
1,901,466 | 909 | 1,097 | 8,161 | 10,167 | 1,911,633 | — | ||||||||||||||||||||||||||||
|
|
|
|
|
|
|
|
|
|
|
|
|
|
|
||||||||||||||||||||||
| Total commercial real estate |
2,245,650 | 909 | 1,097 | 8,725 | 10,731 | 2,256,381 | — | ||||||||||||||||||||||||||||
| Commercial and industrial |
734,660 | 298 | 714 | 2,206 | 3,218 | 737,878 | 33 | ||||||||||||||||||||||||||||
| Residential real estate |
1,234,839 | 1,389 | 2,871 | 8,701 | 12,961 | 1,247,800 | 2,159 | ||||||||||||||||||||||||||||
| Home equity |
412,450 | 2,252 | 314 | 1,873 | 4,439 | 416,889 | 407 | ||||||||||||||||||||||||||||
| Consumer |
401,242 | 4,115 | 764 | 773 | 5,652 | 406,894 | 527 | ||||||||||||||||||||||||||||
|
|
|
|
|
|
|
|
|
|
|
|
|
|
|
||||||||||||||||||||||
| Total portfolio loans |
5,028,841 | 8,963 | 5,760 | 22,278 | 37,001 | 5,065,842 | 3,126 | ||||||||||||||||||||||||||||
| Loans held for sale |
7,899 | — | — | — | — | 7,899 | — | ||||||||||||||||||||||||||||
|
|
|
|
|
|
|
|
|
|
|
|
|
|
|
||||||||||||||||||||||
| Total loans |
$ | 5,036,740 | $ | 8,963 | $ | 5,760 | $ | 22,278 | $ | 37,001 | $ | 5,073,741 | $ | 3,126 | |||||||||||||||||||||
|
|
|
|
|
|
|
|
|
|
|
|
|
|
|
||||||||||||||||||||||
| Impaired loans included above are as follows: |
|||||||||||||||||||||||||||||||||||
| Non-accrual loans |
$ | 11,349 | $ | 943 | $ | 2,147 | $ | 18,942 | $ | 22,032 | $ | 33,381 | |||||||||||||||||||||||
| TDRs accruing interest (1) |
10,710 | 390 | 238 | 210 | 838 | 11,548 | |||||||||||||||||||||||||||||
|
|
|
|
|
|
|
|
|
|
|
|
|
||||||||||||||||||||||||
| Total impaired |
$ | 22,059 | $ | 1,333 | $ | 2,385 | $ | 19,152 | $ | 22,870 | $ | 44,929 | |||||||||||||||||||||||
|
|
|
|
|
|
|
|
|
|
|
|
|
||||||||||||||||||||||||
| (1) | Loans 90 days or more past due and accruing interest exclude TDRs 90 days or more past due and accruing interest. |
113
Table of Contents
The following tables summarize impaired loans:
| Impaired Loans | ||||||||||||||||||||||||||||||
| December 31, 2016 | December 31, 2015 | |||||||||||||||||||||||||||||
| (in thousands) |
Unpaid Principal Balance (1) |
Recorded Investment |
Related Allowance |
Unpaid Principal Balance (1) |
Recorded Investment |
Related Allowance | ||||||||||||||||||||||||
| With no related specific allowance recorded: |
||||||||||||||||||||||||||||||
| Commercial real estate: |
||||||||||||||||||||||||||||||
| Land and construction |
$ | 1,212 | $ | 766 | $ | — | $ | 2,126 | $ | 1,990 | $ | — | ||||||||||||||||||
| Improved property |
9,826 | 8,141 | — | 14,817 | 10,559 | — | ||||||||||||||||||||||||
| Commercial and industrial |
4,456 | 3,181 | — | 4,263 | 3,481 | — | ||||||||||||||||||||||||
| Residential real estate |
20,152 | 18,305 | — | 18,560 | 16,688 | — | ||||||||||||||||||||||||
| Home equity |
4,589 | 4,011 | — | 3,562 | 3,033 | — | ||||||||||||||||||||||||
| Consumer |
884 | 744 | — | 1,603 | 1,294 | — | ||||||||||||||||||||||||
|
|
|
|
|
|
|
|
|
|
|
|
|
|||||||||||||||||||
| Total impaired loans without a specific allowance |
41,119 | 35,148 | — | 44,931 | 37,045 | — | ||||||||||||||||||||||||
|
|
|
|
|
|
|
|
|
|
|
|
|
|||||||||||||||||||
| With a specific allowance recorded: |
||||||||||||||||||||||||||||||
| Commercial real estate: |
||||||||||||||||||||||||||||||
| Land and construction |
— | — | — | — | — | — | ||||||||||||||||||||||||
| Improved property |
3,012 | 3,012 | 470 | 3,012 | 3,012 | 668 | ||||||||||||||||||||||||
| Commercial and industrial |
4,875 | 1,270 | 407 | 6,176 | 4,872 | 853 | ||||||||||||||||||||||||
|
|
|
|
|
|
|
|
|
|
|
|
|
|||||||||||||||||||
| Total impaired loans with a specific allowance |
7,887 | 4,282 | 877 | 9,188 | 7,884 | 1,521 | ||||||||||||||||||||||||
|
|
|
|
|
|
|
|
|
|
|
|
|
|||||||||||||||||||
| Total impaired loans |
$ | 49,006 | $ | 39,430 | $ | 877 | $ | 54,119 | $ | 44,929 | $ | 1,521 | ||||||||||||||||||
|
|
|
|
|
|
|
|
|
|
|
|
|
|||||||||||||||||||
| (1) | The difference between the unpaid principal balance and the recorded investment generally reflects amounts that have been previously charged-off and fair market value adjustments on acquired impaired loans. |
| Impaired Loans | ||||||||||||||||||||||||||||||
| For the Year Ended December 31, 2016 |
For the Year Ended December 31, 2015 |
For the Year Ended December 31, 2014 | ||||||||||||||||||||||||||||
| (in thousands) |
Average Recorded Investment |
Interest Income Recognized |
Average Recorded Investment |
Interest Income Recognized |
Average Recorded Investment |
Interest Income Recognized | ||||||||||||||||||||||||
| With no related specific allowance recorded: |
||||||||||||||||||||||||||||||
| Commercial real estate: |
||||||||||||||||||||||||||||||
| Land and construction |
$ | 993 | $ | — | $ | 2,156 | $ | 41 | $ | 1,977 | $ | 35 | ||||||||||||||||||
| Improved property |
9,128 | 115 | 17,192 | 437 | 17,669 | 441 | ||||||||||||||||||||||||
| Commercial and industrial |
3,188 | 9 | 2,979 | 170 | 3,561 | 103 | ||||||||||||||||||||||||
| Residential real estate |
17,021 | 308 | 17,876 | 862 | 18,829 | 855 | ||||||||||||||||||||||||
| Home equity |
3,502 | 20 | 2,924 | 90 | 2,356 | 75 | ||||||||||||||||||||||||
| Consumer |
909 | 8 | 1,199 | 105 | 1,122 | 97 | ||||||||||||||||||||||||
|
|
|
|
|
|
|
|
|
|
|
|
|
|||||||||||||||||||
| Total impaired loans without a specific allowance |
34,741 | 460 | 44,326 | 1,705 | 45,514 | 1,606 | ||||||||||||||||||||||||
|
|
|
|
|
|
|
|
|
|
|
|
|
|||||||||||||||||||
| With a specific allowance recorded: |
||||||||||||||||||||||||||||||
| Commercial real estate: |
||||||||||||||||||||||||||||||
| Land and construction |
— | — | — | — | — | — | ||||||||||||||||||||||||
| Improved property |
3,012 | — | 5,896 | — | 2,795 | 348 | ||||||||||||||||||||||||
| Commercial and industrial |
3,214 | — | 3,579 | 292 | 2,075 | 95 | ||||||||||||||||||||||||
|
|
|
|
|
|
|
|
|
|
|
|
|
|||||||||||||||||||
| Total impaired loans with a specific allowance |
6,226 | — | 9,475 | 292 | 4,870 | 443 | ||||||||||||||||||||||||
|
|
|
|
|
|
|
|
|
|
|
|
|
|||||||||||||||||||
| Total impaired loans |
$ | 40,967 | $ | 460 | $ | 53,801 | $ | 1,997 | $ | 50,384 | $ | 2,049 | ||||||||||||||||||
|
|
|
|
|
|
|
|
|
|
|
|
|
|||||||||||||||||||
114
Table of Contents
The following tables present the recorded investment in non-accrual loans and TDRs:
| Non-accrual Loans (1) | ||||||||||
| (in thousands) |
December 31, 2016 |
December 31, 2015 | ||||||||
| Commercial real estate: |
||||||||||
| Land and construction |
$ | 766 | $ | 1,023 | ||||||
| Improved property |
9,535 | 11,507 | ||||||||
|
|
|
|
|
|||||||
| Total commercial real estate |
10,301 | 12,530 | ||||||||
|
|
|
|
|
|||||||
| Commercial and industrial |
4,299 | 8,148 | ||||||||
| Residential real estate |
12,994 | 9,461 | ||||||||
| Home equity |
3,538 | 2,391 | ||||||||
| Consumer |
652 | 851 | ||||||||
|
|
|
|
|
|||||||
| Total |
$ | 31,784 | $ | 33,381 | ||||||
|
|
|
|
|
|||||||
| (1) | At December 31, 2016, there were two borrowers with loans greater than $1.0 million totaling $4.3 million. Total non-accrual loans include loans that are also restructured. Such loans are also set forth in the following table as non-accrual TDRs. |
| TDRs | ||||||||||||||||||||||||||||||
| December 31, 2016 | December 31, 2015 | |||||||||||||||||||||||||||||
| (in thousands) |
Accruing | Non-Accrual | Total | Accruing | Non-Accrual | Total | ||||||||||||||||||||||||
| Commercial real estate: |
||||||||||||||||||||||||||||||
| Land and construction |
$ | — | $ | 8 | $ | 8 | $ | 967 | $ | 431 | $ | 1,398 | ||||||||||||||||||
| Improved property |
1,618 | 688 | 2,306 | 2,064 | 1,442 | 3,506 | ||||||||||||||||||||||||
|
|
|
|
|
|
|
|
|
|
|
|
|
|||||||||||||||||||
| Total commercial real estate |
1,618 | 696 | 2,314 | 3,031 | 1,873 | 4,904 | ||||||||||||||||||||||||
|
|
|
|
|
|
|
|
|
|
|
|
|
|||||||||||||||||||
| Commercial and industrial |
152 | 151 | 303 | 205 | 282 | 487 | ||||||||||||||||||||||||
| Residential real estate |
5,311 | 2,212 | 7,523 | 7,227 | 2,060 | 9,287 | ||||||||||||||||||||||||
| Home equity |
473 | 297 | 770 | 642 | 218 | 860 | ||||||||||||||||||||||||
| Consumer |
92 | 190 | 282 | 443 | 184 | 627 | ||||||||||||||||||||||||
|
|
|
|
|
|
|
|
|
|
|
|
|
|||||||||||||||||||
| Total |
$ | 7,646 | $ | 3,546 | $ | 11,192 | $ | 11,548 | $ | 4,617 | $ | 16,165 | ||||||||||||||||||
|
|
|
|
|
|
|
|
|
|
|
|
|
|||||||||||||||||||
As of December 31, 2016, there were no TDRs greater than $1.0 million. The concessions granted in the majority of loans reported as accruing and non-accrual TDRs are extensions of the maturity date or the amortization period, reductions in the interest rate below the prevailing market rate for loans with comparable characteristics, and/or permitting interest-only payments for longer than three months. WesBanco had no unfunded commitments to debtors whose loans were classified as impaired as of December 31, 2016 and $0.2 million as of December 31, 2015.
115
Table of Contents
The following table presents details related to loans identified as TDRs during the years ended December 31, 2016 and 2015:
| New TDRs (1) For the Year Ended December 31, 2016 |
New TDRs (1) For the Year Ended December 31, 2015 | |||||||||||||||||||||||||||||
| (dollars in thousands) |
Number of Modifications |
Pre- Modification Outstanding Recorded Investment |
Post- Modification Outstanding Recorded Investment |
Number of Modifications |
Pre- Modification Outstanding Recorded Investment |
Post- Modification Outstanding Recorded Investment | ||||||||||||||||||||||||
| Commercial real estate: |
||||||||||||||||||||||||||||||
| Land and construction |
— | $ | — | $ | — | 3 | $ | 128 | $ | 115 | ||||||||||||||||||||
| Improved property |
— | — | — | 5 | 1,084 | 603 | ||||||||||||||||||||||||
|
|
|
|
|
|
|
|
|
|
|
|
|
|||||||||||||||||||
| Total commercial real estate |
— | — | — | 8 | 1,212 | 718 | ||||||||||||||||||||||||
|
|
|
|
|
|
|
|
|
|
|
|
|
|||||||||||||||||||
| Commercial and industrial |
2 | 125 | 120 | 1 | 57 | 43 | ||||||||||||||||||||||||
| Residential real estate |
4 | 178 | 166 | 7 | 456 | 426 | ||||||||||||||||||||||||
| Home equity |
1 | 44 | 40 | 1 | 7 | 6 | ||||||||||||||||||||||||
| Consumer |
14 | 98 | 74 | 7 | 69 | 58 | ||||||||||||||||||||||||
|
|
|
|
|
|
|
|
|
|
|
|
|
|||||||||||||||||||
| Total |
21 | $ | 445 | $ | 400 | 24 | $ | 1,801 | $ | 1,251 | ||||||||||||||||||||
|
|
|
|
|
|
|
|
|
|
|
|
|
|||||||||||||||||||
| (1) | Excludes loans that were either paid off or charged-off by period end. The pre-modification balance represents the balance outstanding at the beginning of the period. The post-modification balance represents the outstanding balance at period end. |
The following table summarizes TDRs which defaulted (defined as past due 90 days) during the years ended December 31, 2016 and 2015 that were restructured within the last twelve months prior to December 31, 2016 and 2015:
| Defaulted TDRs (1) For the Year Ended December 31, 2016 |
Defaulted TDRs (1) For the Year Ended December 31, 2015 | |||||||||||||||||||
| (dollars in thousands) |
Number of Defaults |
Recorded Investment |
Number of Defaults |
Recorded Investment | ||||||||||||||||
| Commercial real estate: |
||||||||||||||||||||
| Land and construction |
— | $ | — | — | $ | — | ||||||||||||||
| Improved property |
— | — | 2 | 370 | ||||||||||||||||
|
|
|
|
|
|
|
|
|
|||||||||||||
| Total commercial real estate |
— | — | 2 | 370 | ||||||||||||||||
|
|
|
|
|
|
|
|
|
|||||||||||||
| Commercial and industrial |
— | — | — | — | ||||||||||||||||
| Residential real estate |
— | — | 1 | 22 | ||||||||||||||||
| Home equity |
— | — | — | — | ||||||||||||||||
| Consumer |
1 | 16 | — | — | ||||||||||||||||
|
|
|
|
|
|
|
|
|
|||||||||||||
| Total |
1 | $ | 16 | 3 | $ | 392 | ||||||||||||||
|
|
|
|
|
|
|
|
|
|||||||||||||
| (1) | Excludes loans that were either charged-off or cured by period end. The recorded investment is as of December 31, 2016 and 2015. |
TDRs that defaulted during the twelve month period that were restructured during the twelve months ended December 31, 2016 represented 0.1% of the total TDR balance at December 31, 2016. These loans are placed on non-accrual status unless they are both well-secured and in the process of collection. At December 31, 2016, the loan in the table above was not accruing interest.
116
Table of Contents
The following table summarizes the recognition of interest income on impaired loans:
| For the years ended December 31, | ||||||||||||
| (in thousands) |
2016 | 2015 | 2014 | |||||||||
| Average impaired loans |
$ | 40,967 | $ | 53,801 | $ | 50,384 | ||||||
| Amount of contractual interest income on impaired loans |
2,747 | 3,061 | 3,260 | |||||||||
| Amount of interest income recognized on impaired loans |
460 | 1,997 | 2,049 | |||||||||
The following table summarizes other real estate owned and repossessed assets included in other assets:
| December 31, | ||||||||
| (in thousands) |
2016 | 2015 | ||||||
| Other real estate owned |
$ | 8,206 | $ | 5,669 | ||||
| Repossessed assets |
140 | 156 | ||||||
|
|
|
|
|
|||||
| Total other real estate owned and repossessed assets |
$ | 8,346 | $ | 5,825 | ||||
|
|
|
|
|
|||||
At December 31, 2016, other real estate owned included $3.1 million from the YCB acquisition. Residential real estate included in other real estate owned at December 31, 2016 and December 31, 2015 was $1.6 million and $2.0 million, respectively. At December 31, 2016, formal foreclosure proceedings were in process on residential real estate loans totaling $4.1 million.
NOTE 6. PREMISES AND EQUIPMENT
Premises and equipment include:
| December 31, | ||||||||
| (in thousands) |
2016 | 2015 | ||||||
| Land and improvements |
$ | 43,059 | $ | 32,665 | ||||
| Buildings and improvements |
136,546 | 121,645 | ||||||
| Furniture and equipment |
72,050 | 71,959 | ||||||
|
|
|
|
|
|||||
| Total cost |
251,655 | 226,269 | ||||||
| Accumulated depreciation and amortization |
(118,358 | ) | (114,066 | ) | ||||
|
|
|
|
|
|||||
| Total premises and equipment, net |
$ | 133,297 | $ | 112,203 | ||||
|
|
|
|
|
|||||
Depreciation and amortization expense of premises and equipment charged to operations for the years ended December 31, 2016, 2015 and 2014 was $9.2 million, $8.1 million and $7.4 million, respectively.
WesBanco leases certain premises and equipment under non-cancellable operating leases. Certain leases contain renewal options and rent escalation clauses calling for rent increases over the term of the lease. All leases which contain a rent escalation clause are accounted for on a straight-line basis. Rent expense under leases was $3.5 million, $3.1 million and $2.7 million for the years ended December 31, 2016, 2015 and 2014, respectively.
117
Table of Contents
Future minimum lease payments under non-cancellable leases with initial or remaining lease terms in excess of one year at December 31, 2016 are as follows (in thousands):
| Year |
Amount | |||
| 2017 |
$ | 4,340 | ||
| 2018 |
3,366 | |||
| 2019 |
2,823 | |||
| 2020 |
2,694 | |||
| 2021 |
2,221 | |||
| 2022 and thereafter |
14,649 | |||
|
|
|
|||
| Total |
$ | 30,093 | ||
|
|
|
|||
NOTE 7. GOODWILL AND OTHER INTANGIBLE ASSETS
WesBanco’s Consolidated Balance Sheets include goodwill of $573.8 million and $480.6 million at December 31, 2016 and 2015, respectively all of which relates to the Community Banking segment. WesBanco’s other intangible assets of $19.4 million and $10.3 million at December 31, 2016 and 2015, respectively, primarily consist of core deposit and other customer list intangibles which have finite lives and are amortized using straight line and accelerated methods. WesBanco recognized $92.9 million in goodwill and $12.0 million in core deposit intangibles in connection with the YCB acquisition and $168.8 million in goodwill and $5.3 million in core deposit intangibles in connection with the ESB acquisition. Other intangible assets are being amortized over estimated useful lives ranging from ten to sixteen years. Amortization of core deposit and customer list intangible assets totaled $2.9 million, $2.4 million and $1.9 million for the years ended December 31, 2016, 2015 and 2014, respectively. WesBanco completed its annual goodwill impairment evaluation as of November 30, 2016 and determined that goodwill was not impaired as of December 31, 2016 as there were no significant changes in market conditions, consolidated operating results, or forecasted future results from November 30, 2016. Additionally, there were no events or changes in circumstances indicating impairment of intangible assets as of December 31, 2016.
The following table shows WesBanco’s capitalized other intangible assets and related accumulated amortization:
| December 31, | ||||||||
| (in thousands) |
2016 | 2015 | ||||||
| Other intangible assets: |
||||||||
| Gross carrying amount |
$ | 37,725 | $ | 28,674 | ||||
| Accumulated amortization |
(18,341 | ) | (18,338 | ) | ||||
|
|
|
|
|
|||||
| Net carrying amount of other intangible assets |
$ | 19,384 | $ | 10,336 | ||||
|
|
|
|
|
|||||
The following table shows the amortization on WesBanco’s other intangible assets for each of the next five years (in thousands):
| Year |
Amount | |||
| 2017 |
$ | 4,066 | ||
| 2018 |
3,543 | |||
| 2019 |
3,037 | |||
| 2020 |
2,564 | |||
| 2021 |
2,122 | |||
As part of the YCB and ESB acquisitions, WesBanco entered into non-compete agreements with former YCB and ESB executives with terms ranging from one to four years. The non-compete agreements are
118
Table of Contents
recognized in other assets on the balance sheet with the amortization expense recognized in amortization of intangible assets on the income statement. Amortization expense of non-compete agreements totaled $0.7 million in 2016 and 2015, respectively and is expected to be $0.9 million, $0.6 million and $0.2 million in the next three years, respectively.
NOTE 8. INVESTMENTS IN LIMITED PARTNERSHIPS
WesBanco is a limited partner in several tax-advantaged limited partnerships whose purpose is to invest in approved low-income housing investment tax credit projects. These investments are accounted for using the equity method of accounting and are included in other assets in the Consolidated Balance Sheets. The limited partnerships are considered to be VIEs as they generally do not have equity investors with voting rights or have equity investors that do not provide sufficient financial resources to support their activities. The VIEs have not been consolidated because WesBanco is not considered the primary beneficiary. All of WesBanco’s investments in limited partnerships are privately held, and their market values are not readily available. Investments in low-income housing partnerships are evaluated for impairment at the end of each reporting period. At December 31, 2016 and 2015, WesBanco had $14.3 million and $3.1 million, respectively, invested in these partnerships. WesBanco also recognizes the unconditional unfunded equity commitments of $8.2 million and $2.1 million at December 31, 2016 and 2015, respectively, in other liabilities. For the years ended December 31, 2016, 2015 and 2014, WesBanco included in operations under the equity method of accounting its share of the partnerships’ losses and impairment of $0.9 million, $0.6 million, and $0.9 million, respectively. Tax benefits attributed to these partnerships include low-income housing and historic tax credits which totaled $0.8 million, $0.5 million and $0.7 million for the years ended December 31, 2016, 2015 and 2014, respectively.
WesBanco is also a limited partner in seven other limited partnerships which provide seed money and capital to startup companies, and financing to low-income housing projects. At December 31, 2016 and 2015, WesBanco had $5.2 million invested in these partnerships, which are recorded in other assets using the equity method. WesBanco included in operations under the equity method of accounting its share of the partnerships’ net income of $19 thousand, net loss of $1 thousand and net income $0.3 million for the years ended December 31, 2016, 2015 and 2014, respectively.
In connection with WesBanco’s acquisition of ESB on February 10, 2015, WesBanco acquired ESB’s wholly-owned subsidiary AMSCO, Inc. (“AMSCO”), which engages in the management of certain real estate development and construction of 1-4 family residential units through seven joint venture partnerships. The Bank has provided all development and construction financing. The joint ventures, which are majority-owned by AMSCO, have been included in the consolidated financial statements and are reflected within other non-interest income or expense. At December 31, 2016 and 2015, respectively, WesBanco had an $8.3 million and $7.7 million net investment in AMSCO. WesBanco included in operations net income of $0.5 million and $0.3 million for the years ended December 31, 2016 and 2015, respectively. WesBanco is in the process of winding down these partnerships, which is expected to be relatively complete by December 31, 2017.
NOTE 9. CERTIFICATES OF DEPOSIT
Certificates of deposit in denominations of $100 thousand or more were $681.5 million and $780.1 million as of December 31, 2016 and 2015, respectively. Interest expense on certificates of deposit of $100 thousand or more was $5.0 million, $4.9 million and $7.5 million for the years ended December 31, 2016, 2015 and 2014, respectively.
119
Table of Contents
At December 31, 2016, the scheduled maturities of total certificates of deposit are as follows (in thousands):
| Year |
Amount | |||
| 2017 |
$ | 840,796 | ||
| 2018 |
265,666 | |||
| 2019 |
134,905 | |||
| 2020 |
135,763 | |||
| 2021 |
82,743 | |||
| 2022 and thereafter |
35,949 | |||
|
|
|
|||
| Total |
$ | 1,495,822 | ||
|
|
|
|||
NOTE 10. FHLB AND OTHER SHORT-TERM BORROWINGS
WesBanco is a member of the FHLB system. WesBanco’s FHLB borrowings, which consist of borrowings from both the FHLB of Pittsburgh and the FHLB of Cincinnati, are secured by a blanket lien by the FHLB on certain residential mortgages and other loan types or securities with a market value in excess of the outstanding balances of the borrowings. At December 31, 2016 and 2015, WesBanco had FHLB borrowings of $968.9 million and $1,041.8 million, with a remaining weighted-average interest rate of 1.19% and 1.17%, respectively. The terms of the security agreement with the FHLB include a specific assignment of collateral that requires the maintenance of qualifying mortgage and other types of loans as pledged collateral with unpaid principal amounts in excess of the FHLB advances, when discounted at certain pre-established percentages of the loans’ unpaid principal balances. FHLB stock owned by WesBanco totaling $46.4 million and $45.5 million at December 31, 2016 and 2015, respectively, is also pledged as collateral on these advances. The remaining maximum borrowing capacity by WesBanco with the FHLB at December 31, 2016 and 2015 was estimated to be approximately $1.7 billion and $1.1 billion, respectively.
The following table presents the aggregate annual maturities and weighted-average interest rates of FHLB borrowings at December 31, 2016 based on their contractual maturity dates and interest rates (dollars in thousands):
| Year |
Scheduled Maturity |
Weighted Average Rate | ||||||||
| 2017 |
$ | 649,756 | 1.11 | % | ||||||
| 2018 |
310,998 | 1.32 | % | |||||||
| 2019 |
4,600 | 3.72 | % | |||||||
| 2020 |
1,105 | 4.40 | % | |||||||
| 2021 |
314 | 5.25 | % | |||||||
| 2022 and thereafter |
2,173 | 1.43 | % | |||||||
|
|
|
|
|
|||||||
| Total |
$ | 968,946 | 1.19 | % | ||||||
|
|
|
|
|
|||||||
Other short-term borrowings of $199.4 million and $81.4 million at December 31, 2016, and 2015, respectively, consist of securities sold under agreements to repurchase, federal funds purchased, and outstanding borrowings on a revolving line of credit. At December 31, 2016 and 2015, securities sold under agreements to repurchase were $141.4 million and $81.4 million, with a weighted average interest rate during the year of 0.38% and 0.32%, respectively. There were $58.0 million in outstanding balances of fed funds purchased at December 31, 2016 with an interest rate of 0.85%. There were no outstanding balances of fed funds purchased at December 31, 2015.
In September 2016, WesBanco renewed a revolving line of credit, which is a senior obligation of the parent company with another financial institution. This line of credit, which accrues interest at an adjusted LIBOR rate, provides for aggregate unsecured borrowings of up to $25.0 million. There were no outstanding balances as of December 31, 2016 or 2015.
120
Table of Contents
NOTE 11. SUBORDINATED DEBT AND JUNIOR SUBORDINATED DEBT
WesBanco had $26.0 million of subordinated debt outstanding at December 31, 2016 that was issued by the former YCB, acquired by WesBanco in 2016. These notes have a fixed rate of 6.25%, mature on December 15, 2025, and are callable on December 15, 2020. The interest rate will become a variable rate equal to 3-month LIBOR plus 4.59% on the call date. The subordinated debt is considered Tier 2 regulatory capital for WesBanco and WesBanco Bank.
The Trusts, consisting of WesBanco Capital Trust II, WesBanco Capital Statutory Trust III, WesBanco Capital Trusts IV, V and VI, Oak Hill Capital Trusts 2, 3 and 4, Community Bank Shares Statutory Trusts I and II, and First Federal Statutory Trusts II and III are all wholly-owned trust subsidiaries of WesBanco formed for the purpose of issuing Trust Preferred Securities (“Trust Preferred Securities”) into a pool of other financial services entity trust preferred securities, and lending the proceeds to WesBanco. The Trust Preferred Securities were issued and sold in private placement offerings. The proceeds from the sale of the securities and the issuance of common stock by the Trusts were invested in Junior Subordinated Deferrable Interest Debentures (“Junior Subordinated Debt”) issued by WesBanco, the former Oak Hill Financial, Inc., acquired by WesBanco in 2007, and the former YCB, acquired by WesBanco in 2016, which are the sole assets of the Trusts. The Trusts pay dividends on the Trust Preferred Securities at the same rate as the distributions paid by WesBanco on the Junior Subordinated Debt held by the Trusts. The Trusts provide WesBanco with the option to defer payment of interest on the Junior Subordinated Debt for an aggregate of 20 consecutive quarterly periods. Should any of these options be utilized, WesBanco may not declare or pay dividends on its common stock during any such period. Undertakings made by WesBanco with respect to the Trust Preferred Securities for the Trusts constitute a full and unconditional guarantee by WesBanco of the obligations of these Trust Preferred Securities. WesBanco organized Trusts II and III in June 2003, Trusts IV and V in June 2004 and Trust VI in March 2005. The Oak Hill Trusts 2 and 3 were organized in 2004 and Trust 4 was organized in 2005. The Community Bank Trust I was organized in 2004, and Trust II was organized in 2006. The First Federal Trust II was organized in 2007, and Trust III was organized in 2008.
The Junior Subordinated Debt is presented as a separate category of long-term debt on the Consolidated Balance Sheets. For regulatory purposes, the Federal Reserve Board has allowed bank holding companies to include trust preferred securities in Tier 1 capital up to a certain limit. Provisions in the Dodd-Frank Act require the Federal Reserve Board to generally exclude trust preferred securities from Tier 1 capital, but a grandfather provision will permit bank holding companies with consolidated assets of less than $15 billion, such as WesBanco, to continue counting existing trust preferred securities as Tier 1 capital until they mature. All of the Trust Preferred Securities qualified under the current rules as Tier 1 instruments at December 31, 2016, but no such securities issued in the future will count as Tier 1 capital. The Trust Preferred Securities provide the issuer with a unique capital instrument that has a tax deductible interest feature not normally associated with the equity of a corporation.
121
Table of Contents
The following table shows WesBanco’s trust subsidiaries with outstanding Trust Preferred Securities as of December 31, 2016:
| (in thousands) |
Trust Preferred Securities |
Common Securities |
Junior Subordinated Debt |
Stated Maturity Date |
Optional Redemption Date | ||||||||||||||||||||
| WesBanco Capital Trust II (1) |
$ | 13,000 | $ | 410 | $ | 13,410 | 6/30/2033 | 6/30/2008 | |||||||||||||||||
| WesBanco Capital Statutory Trust III (2) |
17,000 | 526 | 17,526 | 6/26/2033 | 6/26/2008 | ||||||||||||||||||||
| WesBanco Capital Trust IV (3) |
20,000 | 619 | 20,619 | 6/17/2034 | 6/17/2009 | ||||||||||||||||||||
| WesBanco Capital Trust V (3) |
20,000 | 619 | 20,619 | 6/17/2034 | 6/17/2009 | ||||||||||||||||||||
| WesBanco Capital Trust VI (4) |
15,000 | 464 | 15,464 | 3/17/2035 | 3/17/2010 | ||||||||||||||||||||
| Oak Hill Capital Trust 2 (5) |
5,000 | 155 | 5,155 | 10/18/2034 | 10/18/2009 | ||||||||||||||||||||
| Oak Hill Capital Trust 3 (6) |
8,000 | 248 | 8,248 | 10/18/2034 | 10/18/2009 | ||||||||||||||||||||
| Oak Hill Capital Trust 4 (7) |
5,000 | 155 | 5,155 | 6/30/2035 | 6/30/2015 | ||||||||||||||||||||
| Community Bank Shares Statutory Trust I (3) |
5,905 | 217 | 6,122 | 6/17/2034 | 6/17/2014 | ||||||||||||||||||||
| Community Bank Shares Statutory Trust II (8) |
7,901 | 310 | 8,211 | 6/15/2036 | 6/15/2016 | ||||||||||||||||||||
| First Federal Statutory Trust II (9) |
8,145 | 310 | 8,455 | 3/22/2037 | 3/15/2017 | ||||||||||||||||||||
| First Federal Statutory Trust III (10) |
8,335 | 240 | 8,575 | 6/24/2038 | 6/24/2018 | ||||||||||||||||||||
|
|
|
|
|
|
|
||||||||||||||||||||
| Total |
$ | 133,286 | $ | 4,273 | $ | 137,559 | |||||||||||||||||||
|
|
|
|
|
|
|
||||||||||||||||||||
| (1) | Variable rate based on the three-month LIBOR plus 3.15% with a current rate of 4.15% through March 30, 2017, adjustable quarterly. |
| (2) | Variable rate based on the three-month LIBOR plus 3.10% with a current rate of 4.10% through March 26, 2017, adjustable quarterly. |
| (3) | Variable rate based on the three-month LIBOR plus 2.65% with a current rate of 3.64% through March 17, 2017, adjustable quarterly. |
| (4) | Variable rate based on the three-month LIBOR plus 1.77% with a current rate of 2.76% through March 17, 2017, adjustable quarterly. |
| (5) | Variable rate based on the three-month LIBOR plus 2.40% with a current rate of 3.28% through January 18, 2017, adjustable quarterly. |
| (6) | Variable rate based on the three-month LIBOR plus 2.30% with a current rate of 3.18% through January 18, 2017, adjustable quarterly. |
| (7) | Variable rate based on the three-month LIBOR plus 1.60% with a current rate of 2.60% through March 30, 2017, adjustable quarterly. |
| (8) | Variable rate based on the three-month LIBOR plus 1.70% with a current rate of 2.66% through March 15, 2017, adjustable quarterly. |
| (9) | Fixed rate of 6.69% through March 15, 2017, then variable rate based on the three-month LIBOR plus 1.60%. |
| (10) | Fixed rate of 8.00% through maturity, callable June 24, 2018 and thereafter at par. |
NOTE 12. DERIVATIVES AND HEDGING ACTIVITIES
Risk Management Objective of Using Derivatives
WesBanco is exposed to certain risks arising from both its business operations and economic conditions. WesBanco principally manages its exposures to a wide variety of business and operational risks through management of its core business activities. WesBanco manages economic risks, including interest rate, liquidity, and credit risk, primarily by managing the amount, sources, and duration of its assets and liabilities. WesBanco’s existing interest rate derivatives result from a service provided to certain qualifying customers and, therefore, are not used to manage interest rate risk in WesBanco’s assets or liabilities. WesBanco manages a matched book with respect to its derivative instruments in order to minimize its net risk exposure resulting from such transactions. A matched book is when the Bank’s assets and liabilities are equally distributed but also have similar maturities.
122
Table of Contents
In addition, commitments to fund certain mortgage loans (interest rate lock commitments) and forward commitments for the future delivery of mortgage loans to third party investors are considered derivatives. WesBanco enters into such contracts in order to control interest rate risk during the period between the interest rate lock commitments and loan funding. The notional amount of the interest rate lock commitments and forward commitments was $19.5 million and $14.5 million at December 31, 2016 and 2015, respectively. The loss related to the fair value was $44 thousand and $20 thousand for the years ended December 31, 2016 and 2015, respectively.
Fair Values of Derivative Instruments on the Balance Sheet
All derivatives are carried on the consolidated balance sheet at fair value. Derivative assets are classified in the consolidated balance sheet under other assets, and derivative liabilities are classified in the consolidated balance sheet under other liabilities. Changes in fair value are recognized in earnings.
The table below presents the fair value of WesBanco’s derivative financial instruments as well as their classification on the Balance Sheet as of December 31, 2016 and December 31, 2015:
| December 31, 2016 | December 31, 2015 | |||||||||||||||||||
| (in thousands) |
Asset Derivatives |
Liability Derivatives |
Asset Derivatives |
Liability Derivatives | ||||||||||||||||
| Derivatives not designated as hedging instruments |
||||||||||||||||||||
| Interest rate product |
$ | 5,596 | $ | 5,199 | $ | 1,893 | $ | 1,991 | ||||||||||||
|
|
|
|
|
|
|
|
|
|||||||||||||
| Total derivatives not designated as hedging instruments |
$ | 5,596 | $ | 5,199 | $ | 1,893 | $ | 1,991 | ||||||||||||
|
|
|
|
|
|
|
|
|
|||||||||||||
Non-designated Hedges
None of WesBanco’s derivatives are designated in qualifying hedging relationships under FASB ASC 815. Derivatives not designated as hedges are not speculative and result from a service WesBanco provides to certain customers. WesBanco executes interest rate swaps with commercial banking customers to facilitate their respective risk management strategies. Those interest rate swaps are simultaneously hedged by offsetting interest rate swaps that WesBanco executes with a third party, such that WesBanco minimizes its net risk exposure resulting from such transactions. As the interest rate swaps associated with this program do not meet the strict hedge accounting requirements of FASB ASC 815, changes in the fair value of both the customer swaps and the offsetting third-party swaps are recognized directly in earnings. As of December 31, 2016 and 2015, WesBanco had 24 and 12 interest rate swaps with an aggregate notional amount of $206.9 and $69.6 million, respectively, related to this program. During the years ended December 31, 2016, 2015, and 2014, WesBanco recognized a net gain of $0.5 million and $3 thousand and a net loss of $0.2 million, respectively, related to the changes in fair value of these swaps. Additionally, WesBanco recognized $2.5 million, $0.2 million and $0.6 million income for the related swap fees for the years ended December 31, 2016, 2015, and 2014, respectively.
Effect of Derivative Instruments on the Income Statement
The table below presents the change in the fair value of the Company’s derivative financial instruments reflected within the other non-interest income line item of the consolidated income statement for the years ended December 31, 2016, 2015 and 2014, respectively.
| For the Years Ended December 31, | |||||||||||||||
| (in thousands) |
2016 | 2015 | 2014 | ||||||||||||
| Derivatives not designated as hedging instruments |
|||||||||||||||
| Interest Rate Products |
$ | 495 | $ | 3 | $ | (162 | ) | ||||||||
|
|
|
|
|
|
|
||||||||||
| Total |
$ | 495 | $ | 3 | $ | (162 | ) | ||||||||
|
|
|
|
|
|
|
||||||||||
123
Table of Contents
Credit-risk-related Contingent Features
WesBanco has agreements with its derivative counterparties that contain a provision where if WesBanco defaults on any of its indebtedness, including default where repayment of the indebtedness has not been accelerated by the lender, then WesBanco could also be declared in default on its derivative obligations.
WesBanco also has agreements with certain of its derivative counterparties that contain a provision where if WesBanco fails to maintain its status as either a well or adequately capitalized institution, then the counterparty could terminate the derivative positions and WesBanco would be required to settle its obligations under the agreements.
WesBanco has minimum collateral posting thresholds with certain of its derivative counterparties and has posted collateral with a market value of $7.2 million as of December 31, 2016. If WesBanco had breached any of these provisions at December 31, 2016, it could have been required to settle its obligations under the agreements at the termination value and would have been required to pay any additional amounts due in excess of amounts previously posted as collateral with the respective counterparty.
NOTE 13. EMPLOYEE BENEFIT PLANS
Defined Benefit Pension Plan—The WesBanco, Inc. Defined Benefit Pension Plan (“the Plan”) established on January 1, 1985, is a non-contributory, defined benefit pension plan. The Plan covers all employees of WesBanco and its subsidiaries who were hired on or before August 1, 2007 who satisfy minimum age and length of service requirements. Benefits of the Plan are generally based on years of service and the employee’s compensation during the last five years of employment. Contributions are intended to provide not only for benefits attributed to service to date, but also for those expected to be earned in the future. WesBanco uses a December 31 measurement date for the Plan.
124
Table of Contents
The benefit obligations and funded status of the Plan are as follows:
| December 31, | ||||||||
| (dollars in thousands) |
2016 | 2015 | ||||||
| Accumulated benefit obligation at end of year |
$ | 104,775 | $ | 99,312 | ||||
|
|
|
|
|
|||||
| Change in projected benefit obligation: |
||||||||
| Projected benefit obligation at beginning of year |
$ | 109,400 | $ | 118,261 | ||||
| Service cost |
2,799 | 3,355 | ||||||
| Interest cost |
5,094 | 4,870 | ||||||
| Actuarial (gain) loss |
2,569 | (13,413 | ) | |||||
| Acquisition |
1,392 | — | ||||||
| Benefits paid |
(5,796 | ) | (3,673 | ) | ||||
|
|
|
|
|
|||||
| Projected benefit obligation at end of year |
$ | 115,458 | $ | 109,400 | ||||
|
|
|
|
|
|||||
| Change in fair value of plan assets: |
||||||||
| Fair value of plan assets at beginning of year |
$ | 113,292 | $ | 110,037 | ||||
| Actual return on plan assets |
7,125 | (572 | ) | |||||
| Employer contribution |
5,750 | 7,500 | ||||||
| Acquisition |
1,226 | — | ||||||
| Benefits paid |
(5,796 | ) | (3,673 | ) | ||||
|
|
|
|
|
|||||
| Fair value of plan assets at end of year |
$ | 121,597 | $ | 113,292 | ||||
|
|
|
|
|
|||||
| Amounts recognized in the statement of financial position: |
||||||||
| Funded status |
$ | 6,139 | $ | 3,892 | ||||
|
|
|
|
|
|||||
| Net amounts recognized as receivable pension costs in the consolidated balance sheets |
$ | 6,139 | $ | 3,892 | ||||
|
|
|
|
|
|||||
| Amounts recognized in accumulated other comprehensive income consist of: |
||||||||
| Unrecognized prior service cost |
$ | 130 | $ | 156 | ||||
| Unrecognized net loss |
27,857 | 27,549 | ||||||
|
|
|
|
|
|||||
| Net amounts recognized in accumulated other comprehensive income (before tax) |
$ | 27,987 | $ | 27,705 | ||||
|
|
|
|
|
|||||
| Weighted average assumptions used to determine benefit obligations: |
||||||||
| Discount rate |
4.46 | % | 4.74 | % | ||||
| Rate of compensation increase |
3.74 | % | 3.82 | % | ||||
| Expected long-term return on assets |
6.30 | % | 6.79 | % | ||||
125
Table of Contents
The components of and weighted-average assumptions used to determine net periodic benefit costs are as follows:
| For the years ended December 31, |
||||||||||||
| (dollars in thousands) |
2016 | 2015 | 2014 | |||||||||
| Components of net periodic benefit cost: |
||||||||||||
| Service cost—benefits earned during year |
$ | 2,799 | $ | 3,355 | $ | 2,909 | ||||||
| Interest cost on projected benefit obligation |
5,094 | 4,870 | 4,745 | |||||||||
| Expected return on plan assets |
(7,719 | ) | (7,735 | ) | (7,229 | ) | ||||||
| Amortization of prior service cost |
26 | 26 | 45 | |||||||||
| Amortization of net loss |
3,020 | 3,179 | 1,471 | |||||||||
|
|
|
|
|
|
|
|||||||
| Net periodic pension cost |
$ | 3,220 | $ | 3,695 | $ | 1,941 | ||||||
|
|
|
|
|
|
|
|||||||
| Other changes in plan assets and benefit obligations recognized in other comprehensive income: |
||||||||||||
| Net (gain) loss for period |
$ | 3,329 | $ | (5,106 | ) | $ | 24,934 | |||||
| Amortization of prior service cost |
(26 | ) | (26 | ) | (45 | ) | ||||||
| Amortization of net loss |
(3,020 | ) | (3,179 | ) | (1,471 | ) | ||||||
|
|
|
|
|
|
|
|||||||
| Total recognized in other comprehensive income |
$ | 283 | $ | (8,311 | ) | $ | 23,418 | |||||
|
|
|
|
|
|
|
|||||||
| Total recognized in net periodic pension cost and other comprehensive income |
$ | 3,503 | $ | (4,616 | ) | $ | 25,359 | |||||
|
|
|
|
|
|
|
|||||||
| Weighted-average assumptions used to determine net periodic pension cost: |
||||||||||||
| Discount rate |
4.74 | % | 4.33 | % | 5.17 | % | ||||||
| Rate of compensation increase |
3.82 | % | 3.77 | % | 3.97 | % | ||||||
| Expected long-term return on assets |
6.79 | % | 7.00 | % | 7.25 | % | ||||||
On December 31, 2016, WesBanco changed the method used to estimate the service and interest components of net periodic benefit cost for pension benefits. This change compared to the previous method will result in a decrease in the service and interest components for pension cost. Historically, WesBanco estimated these service and interest cost components utilizing a single weighted-average discount rate derived from the yield curve used to measure the benefit obligation at the beginning of the period. WesBanco has elected to utilize a full yield curve approach in the estimation of these components by applying the specific spot rates along the yield curve used in the determination of the benefit obligation to the relevant projected cash flows. The change has been made to provide a more precise measurement of service and interest costs by improving the correlation between projected benefit cash flows to the corresponding spot yield curve rates. This change does not affect the measurement of the plan’s total benefit obligations as the change in the service and interest costs is completely offset in the actuarial (gain) loss reported. Based on current economic conditions, we estimate the service cost and interest cost for the plan will be reduced by approximately $1.0 million in 2017 as a result of this change. WesBanco will account for this change as a change in accounting estimate that is inseparable from a change in accounting principle and accordingly will account for it prospectively.
The estimated net loss and prior service credit for the Plan that will be amortized from accumulated other comprehensive income into the net periodic pension cost over the next fiscal year are $3.1 million and $26 thousand, respectively. Unrecognized prior service cost and unrecognized net losses are amortized on a straight-line basis. All unrecognized net losses are being amortized over the average remaining service period of approximately 9 years.
The expected long-term rate of return for the Plan’s total assets is based on the expected return of each of the Plan asset categories, weighted based on the median of the target allocation for each class.
Pension Plan Investment Policy and Strategy—The investment policy as established by the Retirement Plans Committee, to be followed by the Trustee, which is WesBanco’s Trust and Investment Services
126
Table of Contents
department, is to invest assets based on the target allocations shown in the table below. Assets are reallocated periodically by the Trustee based on the ranges set forth by the Retirement Plans Committee to meet the target allocations. The investment policy is also subject to review periodically to determine if the policy should be changed. Plan assets are to be invested with the principal objective of maximizing long-term total return without exposing Plan assets to undue risk, taking into account the Plan’s funding needs and benefit obligations. Assets are to be invested in a balanced portfolio composed primarily of equities, fixed income and cash or cash equivalent money market investments.
A maximum of 5% may be invested in any one stock. Foreign stocks may be included, either through direct investment or by the purchase of mutual funds which invest in foreign stock. WesBanco common stock can represent up to 5% of the total market value. Corporate bonds selected for purchase must be rated Baa1 by Moody’s or BBB+ by Standard and Poor’s or higher. No more than 5% shall be invested in bonds or notes issued by the same corporation with a maximum term of twenty years. There is no limit on the holdings of U.S. Treasury or Federal Agency Securities. At December 31, 2016 and 2015, the Plan’s equity securities included 55,300 shares of WesBanco common stock with a fair market value of $2.4 million and $1.7 million, respectively.
The following table sets forth the Plan’s weighted-average asset allocations by asset category:
| Target Allocation for 2016 |
|||||||||||||||
| December 31, | |||||||||||||||
| 2016 | 2015 | ||||||||||||||
| Asset Category: |
|||||||||||||||
| Equity securities |
55-75 | % | 62 | % | 61 | % | |||||||||
| Debt securities |
25-55 | % | 35 | % | 34 | % | |||||||||
| Cash and cash equivalents |
0-5 | % | 3 | % | 5 | % | |||||||||
|
|
|
|
|
||||||||||||
| Total |
100 | % | 100 | % | |||||||||||
|
|
|
|
|
||||||||||||
The fair values of WesBanco’s pension plan assets at December 31, 2016 and 2015, by asset category are as follows:
| December 31, 2016 Fair Value Measurements Using: | ||||||||||||||||||||
| (in thousands) |
Assets at Fair Value |
Quoted Prices in Active Markets for Identical Assets (Level 1) |
Significant Other Observable Inputs (Level 2) |
Significant Unobservable Inputs (Level 3) | ||||||||||||||||
| Defined benefit pension plan assets: |
||||||||||||||||||||
| Registered investment companies |
$ | 21,935 | $ | 21,935 | $ | — | $ | — | ||||||||||||
| Equity securities |
60,144 | 60,144 | — | — | ||||||||||||||||
| Corporate debt securities |
18,110 | — | 18,110 | — | ||||||||||||||||
| Municipal obligations |
2,998 | — | 2,998 | — | ||||||||||||||||
| Residential mortgage-backed securities and collateralized mortgage obligations of government agencies |
17,176 | — | 17,176 | — | ||||||||||||||||
|
|
|
|
|
|
|
|
|
|||||||||||||
| Total defined benefit pension plan assets (1) |
$ | 120,363 | $ | 82,079 | $ | 38,284 | $ | — | ||||||||||||
|
|
|
|
|
|
|
|
|
|||||||||||||
| (1) | The defined benefit pension plan statement of net assets also includes cash, accrued interest and dividends, and due to/from brokers resulting in net assets available for benefits of $121.6 million. |
127
Table of Contents
| December 31, 2015 Fair Value Measurements Using: | ||||||||||||||||||||
| (in thousands) |
Assets at Fair Value |
Quoted Prices in Active Markets for Identical Assets (Level 1) |
Significant Other Observable Inputs (Level 2) |
Significant Unobservable Inputs (Level 3) | ||||||||||||||||
| Defined benefit pension plan assets: |
||||||||||||||||||||
| Registered investment companies |
$ | 23,741 | $ | 23,741 | $ | — | $ | — | ||||||||||||
| Equity securities |
56,098 | 56,098 | — | — | ||||||||||||||||
| Corporate debt securities |
16,802 | — | 16,802 | — | ||||||||||||||||
| Municipal obligations |
3,034 | — | 3,034 | — | ||||||||||||||||
| Residential mortgage-backed securities and collateralized mortgage obligations of government agencies |
15,386 | — | 15,386 | — | ||||||||||||||||
|
|
|
|
|
|
|
|
|
|||||||||||||
| Total defined benefit pension plan assets (1) |
$ | 115,061 | $ | 79,839 | $ | 35,222 | $ | — | ||||||||||||
|
|
|
|
|
|
|
|
|
|||||||||||||
| (1) | The defined benefit pension plan statement of net assets also includes cash, accrued interest and dividends, and due to/from brokers resulting in net assets available for benefits of $113.3 million. |
Registered investment companies and equity securities: Valued at the closing price reported on the active market on which the individual securities are traded.
Corporate debt securities, municipal obligations, and U.S. government agency securities: Valued at fair value based on models that consider criteria such as dealer quotes, available trade data, issuer creditworthiness, market movements, sector news, and bond and swap yield curves.
Cash Flows—WesBanco has no required minimum contribution to the Plan for 2017 and as of December 31, 2016; however, WesBanco expects to make a voluntary contribution of $5.0 million in 2017. WesBanco contributed $5.8 million, $7.5 million and $7.5 million for the years ended December 31, 2016, 2015 and 2014, respectively.
The following table presents estimated benefits to be paid in each of the next five years and in the aggregate for the five years thereafter (in thousands):
| Year |
Amount | |||
| 2017 |
$ | 3,903 | ||
| 2018 |
4,150 | |||
| 2019 |
4,409 | |||
| 2020 |
4,748 | |||
| 2021 |
5,212 | |||
| 2022 to 2026 |
31,684 | |||
On September 9, 2016, WesBanco assumed YCB’s obligation for a predecessor bank’s participation in the Pentegra Defined Benefit Plan for Financial Institutions (“Pentegra Plan”). The participating employer plan has been frozen to new participants since 2002. WesBanco is in the process of spinning off the assets from the Pentegra Plan, contributing approximately $3.3 million to satisfy the estimated final costs to do so. This estimated spin off will have no impact on earnings as the liability was included in YCB’s balance sheet as of the acquisition date. The distributed assets from the Pentegra Plan will be transferred to a plan providing substantially the same benefits to the participants.
WesBanco also assumed YCB’s single employer pension plan that was amended in 1997 such that there could be no new participants or increases to existing participants. This plan was merged into the WesBanco Defined Benefit Pension Plan as of December 31, 2016, with plan assets of $1.2 million and projected benefit obligations of $1.4 million.
128
Table of Contents
Employee Stock Ownership and 401(k) Plan (“KSOP”)—WesBanco sponsors a KSOP plan consisting of a non-contributory leveraged ESOP and a contributory 401(k) profit sharing plan covering substantially all of its employees. Under the provisions of the 401(k) plan, WesBanco matches a portion of eligible employee contributions based on rates established and approved by the Board of Directors. For each of the past three years, WesBanco matched 100% of the first 3% and 50% of the next 2% of eligible employee contributions. No ESOP contribution has been made for any of the past three years.
As of December 31, 2016, the KSOP held 508,066 shares of WesBanco common stock of which all shares were allocated to specific employee accounts. Dividends on shares are either distributed to employee accounts or paid in cash to the participant. Total expense for the KSOP was $2.8 million, $2.5 million, and $2.2 million in 2016, 2015 and 2014, respectively. WesBanco had 445,978 and 484,430 shares registered on Form S-8 remaining for future issuance under the KSOP plan at December 31, 2016 and 2015, respectively.
Incentive Bonus, Option and Restricted Stock Plan—The Incentive Bonus, Option and Restricted Stock Plan (the “Incentive Plan”), is a non-qualified plan that includes the following components: an Annual Bonus, a Long-Term Incentive, including a Total Shareholder Return Plan, a Stock Option component, and a Restricted Stock component. The components allow for payments of cash, a mixture of cash and stock, granting of stock options, or granting of restricted stock, depending upon the component of the Incentive Plan in which the award is earned through the attainment of certain performance goals or on a time-based vesting requirement. Performance goals or service vesting requirements are established by WesBanco’s Compensation Committee. WesBanco had 117,266 and 288,541 shares, registered on Form S-8, remaining for future issuance under equity compensation plans at December 31, 2016 and 2015, respectively.
Annual Bonus
Compensation expense for the Annual Bonus was $1.6 million, $1.3 million and $1.5 million for 2016, 2015, and 2014, respectively. There was no Long-Term Incentive Bonus granted for any of these periods.
Total Shareholder Return Plan
On November 18, 2015, WesBanco’s Compensation Committee adopted Administrative Rules for a Total Shareholder Return Plan (“TSRP”). The TSRP measures the TSR on WesBanco common stock over a three-year measurement period relative to the return of an established peer group of publicly traded companies over the same performance period. The award is determined at the end of the three-year period if the TSR of WesBanco common stock is equal to or greater than the 50th percentile of the TSR of the peer group. The number of shares to be earned by the participant shall be 200% of the grant-date award if the TSR of WesBanco common stock is equal to or greater than the 75th percentile of the TSR of the peer group. Upon achieving the market-based metric, shares determined to be earned by the participant become service-based and vest in three equal annual installments. No TSRP shares were granted in 2016. In late 2015, WesBanco granted 12,000 TSRP shares for the performance period beginning January 1, 2016 and ending December 31, 2018 to certain executive officers.
Stock Options
On May 25, 2016, WesBanco granted 96,600 stock options to selected participants, including certain named executive officers at an exercise price of $32.37 per share. The options granted in 2016 are service-based and vest in two equal installments on December 31, 2016 and December 31, 2017, and expire seven years from the date of grant.
Compensation expense for the stock option component of the Incentive Plan was $0.5 million, $0.5 million and $0.4 million for 2016, 2015 and 2014, respectively. At December 31, 2016, the total unrecognized compensation expense related to non-vested stock option grants totaled $0.2 million with an expense recognition period of one year remaining. The maximum term of options granted under WesBanco’s stock option plan is ten years from the original grant date; however, options granted in 2016 had a term of seven years.
129
Table of Contents
The total intrinsic value of options exercised was $1.2 million and $0.6 million for the years ended December 31, 2016 and 2015, respectively. The cash received and related tax benefit realized from stock options exercised was $2.5 million and $0.4 million in 2016 and was $1.4 million and $0.2 million in 2015. Shares issued in connection with options exercised are issued from treasury shares acquired under WesBanco’s share repurchase plans or from issuance of authorized but unissued shares, subject to prior SEC registration.
The fair value of stock options granted is estimated at the date of grant using the Black-Scholes option-pricing model. This model requires the input of highly subjective assumptions, changes to which can materially affect the fair value estimate. Additionally, there may be other factors that might otherwise have a significant effect on the value of stock options granted that are not considered by the model.
The following table sets forth the significant assumptions used in calculating the fair value of the grants:
| For the years ended December 31, | ||||||||||||
| 2016 | 2015 | 2014 | ||||||||||
| Weighted-average life |
5.1 years | 4.9 years | 4.8 years | |||||||||
| Risk-free interest rate |
1.43 | % | 1.54 | % | 1.37 | % | ||||||
| Dividend yield |
2.97 | % | 2.91 | % | 3.06 | % | ||||||
| Volatility factor |
23.92 | % | 26.27 | % | 28.82 | % | ||||||
| Fair value of the grants |
$ | 5.09 | $ | 5.57 | $ | 5.41 | ||||||
The weighted-average life assumption is an estimate of the length of time that an employee might hold an option before option exercise, option expiration or employment termination. The weighted-average life assumption was developed using historical experience. WesBanco used a weighted historical volatility of its common stock price over the weighted average life prior to each issuance as the volatility factor assumption, adjusted for abnormal volatility during certain periods, and current and future dividend payment expectations for the dividend assumption.
The following table shows the activity for the Stock Option component of the Incentive Plan:
| For the year ended December 31, 2016 | ||||||||||
| Number of Options |
Weighted Average Exercise Price Per Share | |||||||||
| Outstanding at beginning of the year |
287,500 | $ | 27.02 | |||||||
| Granted during the year |
96,600 | 32.37 | ||||||||
| Exercised during the year |
(101,190 | ) | 24.58 | |||||||
| Forfeited or expired during the year |
(6,788 | ) | 30.09 | |||||||
|
|
|
|
|
|||||||
| Outstanding at end of the year |
276,122 | $ | 29.71 | |||||||
|
|
|
|
|
|||||||
| Exercisable at year end |
228,272 | $ | 29.15 | |||||||
|
|
|
|
|
|||||||
The aggregate intrinsic value of the outstanding shares and the shares exercisable at year-end was $3.7 million and $3.2 million, respectively.
130
Table of Contents
The following table shows the average remaining life of the stock options at December 31, 2016:
| Year Issued |
Exercisable at Year End |
Exercise Price Range Per Share |
Options Outstanding |
Weighted Average Exercise Price |
Weighted
Avg. Remaining Contractual Life in Years | ||||||||||||||||||||
| 2010 |
3,234 | $ | 19.27 | 3,234 | $ | 19.27 | 0.38 | ||||||||||||||||||
| 2011 |
6,250 | 19.76 | 6,250 | 19.76 | 1.38 | ||||||||||||||||||||
| 2012 |
12,000 | 20.02 | 12,000 | 20.02 | 2.37 | ||||||||||||||||||||
| 2013 |
30,750 | 25.00 | 30,750 | 25.00 | 3.37 | ||||||||||||||||||||
| 2014 |
49,550 | 28.79 | 49,550 | 28.79 | 4.39 | ||||||||||||||||||||
| 2015 |
78,638 | 31.58 | 78,638 | 31.58 | 5.42 | ||||||||||||||||||||
| 2016 |
47,850 | 32.37 | 95,700 | 32.37 | 6.40 | ||||||||||||||||||||
|
|
|
|
|
|
|
|
|
|
|
||||||||||||||||
| Total |
228,272 | $ | 19.27 to $32.37 | 276,122 | $ | 29.71 | 5.06 | ||||||||||||||||||
|
|
|
|
|
|
|
|
|
|
|
||||||||||||||||
Restricted Stock
During 2016, WesBanco granted 76,400 shares of restricted stock to certain officers. The restricted shares are service-based and cliff vest 36 months from the date of grant. The weighted average fair value of the restricted stock granted was $32.45 per share. Compensation expense relating to all restricted stock was $1.4 million, $1.2 million, and $1.0 million in 2016, 2015 and 2014, respectively. At December 31, 2016, the total unrecognized compensation expense related to non-vested restricted stock grants totaled $2.7 million with a weighted average expense recognition period of 1.7 years remaining. The restricted stock grant provides the recipient with voting rights from the date of issuance. Dividends paid on the restricted shares during the restriction period are converted into additional shares of restricted stock on the date the cash dividend would have otherwise been paid, but do not vest until the related grant of the restricted shares complete their vesting. The Compensation Committee has discretion to elect to pay such dividends to participants.
The following table shows the activity for the Restricted Stock component of the Incentive Plan:
| For the year ended December 31, 2016 |
Restricted Stock |
Weighted Average Grant Date Fair Value Per Share | ||||||||
| Non-vested at January 1, 2016 |
143,456 | $ | 28.92 | |||||||
| Granted during the year |
76,400 | 32.45 | ||||||||
| Vested during the year |
(52,485 | ) | 26.35 | |||||||
| Forfeited or expired during the year |
(1,725 | ) | 30.92 | |||||||
| Dividend reinvestment |
4,836 | 33.43 | ||||||||
|
|
|
|
|
|||||||
| Non-vested at end of the year |
170,482 | $ | 31.40 | |||||||
|
|
|
|
|
|||||||
131
Table of Contents
NOTE 14. OTHER OPERATING EXPENSES
Other operating expenses consist of miscellaneous taxes, consulting fees, ATM expenses, postage, supplies, legal fees, communications, other real estate owned and foreclosure expenses, and other expenses. Other operating expenses are presented below:
| For the years ended December 31, | ||||||||||||
| (in thousands) |
2016 | 2015 | 2014 | |||||||||
| Franchise and other miscellaneous taxes |
$ | 6,825 | $ | 5,924 | $ | 6,748 | ||||||
| Consulting, regulatory and advisory fees |
6,270 | 4,959 | 4,405 | |||||||||
| ATM and electronic banking interchange expenses |
4,297 | 4,463 | 4,222 | |||||||||
| Postage and courier expenses |
3,306 | 3,720 | 3,373 | |||||||||
| Supplies |
2,919 | 2,841 | 2,425 | |||||||||
| Legal fees |
2,406 | 2,418 | 2,531 | |||||||||
| Communications |
1,800 | 1,537 | 1,555 | |||||||||
| Other real estate owned and foreclosure expenses |
1,210 | 546 | 1,101 | |||||||||
| Other |
11,967 | 12,479 | 10,836 | |||||||||
|
|
|
|
|
|
|
|||||||
| Total other operating expenses |
$ | 41,000 | $ | 38,887 | $ | 37,196 | ||||||
|
|
|
|
|
|
|
|||||||
NOTE 15. INCOME TAXES
Reconciliation from the federal statutory income tax rate to the effective tax rate is as follows:
| For the years ended December 31, | |||||||||||||||
| 2016 | 2015 | 2014 | |||||||||||||
| Federal statutory tax rate |
35.0 | % | 35.0 | % | 35.0 | % | |||||||||
| Net tax-exempt interest income on securities of state and political subdivisions |
(7.0 | %) | (6.8 | %) | (6.4 | %) | |||||||||
| State income taxes, net of federal tax effect |
1.4 | % | 1.6 | % | 1.4 | % | |||||||||
| Bank-owned life insurance |
(1.2 | %) | (1.6 | %) | (1.7 | %) | |||||||||
| General business credits |
(2.1 | %) | (2.1 | %) | (3.1 | %) | |||||||||
| All other—net |
0.3 | % | (0.1 | %) | 0.1 | % | |||||||||
|
|
|
|
|
|
|
||||||||||
| Effective tax rate |
26.4 | % | 26.0 | % | 25.3 | % | |||||||||
|
|
|
|
|
|
|
||||||||||
The provision for income taxes applicable to income before taxes consists of the following:
| For the years ended December 31, | ||||||||||||
| (in thousands) |
2016 | 2015 | 2014 | |||||||||
| Current: |
||||||||||||
| Federal |
$ | 18,053 | $ | 15,661 | $ | 13,346 | ||||||
| State |
2,159 | 2,089 | 1,684 | |||||||||
| Deferred: |
||||||||||||
| Federal |
10,519 | 10,047 | 8,337 | |||||||||
| State |
305 | 618 | 353 | |||||||||
|
|
|
|
|
|
|
|||||||
| Total |
$ | 31,036 | $ | 28,415 | $ | 23,720 | ||||||
|
|
|
|
|
|
|
|||||||
The following income tax amounts were recorded in shareholders’ equity as elements of other comprehensive income:
| For the years ended December 31, |
||||||||||||
| (in thousands) |
2016 | 2015 | 2014 | |||||||||
| Securities and defined benefit pension plan unrecognized items |
$ | (3,480 | ) | $ | (1,202 | ) | $ | (3,538 | ) | |||
|
|
|
|
|
|
|
|||||||
132
Table of Contents
Deferred tax assets and liabilities consist of the following:
| December 31, | ||||||||||||
| (in thousands) |
2016 | 2015 | 2014 | |||||||||
| Deferred tax assets: |
||||||||||||
| Allowance for loan losses |
$ | 16,198 | $ | 15,246 | $ | 16,386 | ||||||
| Compensation and benefits |
5,444 | 6,114 | 8,764 | |||||||||
| Security gains and losses |
2,854 | 2,964 | 2,817 | |||||||||
| Purchase accounting adjustments |
— | 1,275 | 1,497 | |||||||||
| Partnership adjustments |
— | 1,921 | 1,158 | |||||||||
| Non-accrual interest income |
2,392 | 2,254 | 2,129 | |||||||||
| Tax credit carryforwards |
12,744 | 13,580 | 10,163 | |||||||||
| Federal net operating loss carryforwards |
12,020 | — | 597 | |||||||||
| Fair value adjustments on securities available-for-sale |
5,394 | 1,979 | — | |||||||||
| Other |
5,194 | 2,264 | 2,169 | |||||||||
|
|
|
|
|
|
|
|||||||
| Gross deferred tax assets |
62,240 | 47,597 | 45,680 | |||||||||
|
|
|
|
|
|
|
|||||||
| Deferred tax liabilities: |
||||||||||||
| Depreciation and amortization |
(3,448 | ) | (1,530 | ) | (1,900 | ) | ||||||
| Accretion on securities |
(421 | ) | (2 | ) | (295 | ) | ||||||
| Fair value adjustments on securities available-for-sale |
— | — | (2,297 | ) | ||||||||
| Purchase accounting adjustments |
(149 | ) | — | — | ||||||||
| Partnership adjustments |
(1,128 | ) | — | — | ||||||||
| Other |
(2,519 | ) | (1,511 | ) | (1,728 | ) | ||||||
|
|
|
|
|
|
|
|||||||
| Gross deferred tax liabilities |
(7,665 | ) | (3,043 | ) | (6,220 | ) | ||||||
|
|
|
|
|
|
|
|||||||
| Net deferred tax assets |
$ | 54,575 | $ | 44,554 | $ | 39,460 | ||||||
|
|
|
|
|
|
|
|||||||
WesBanco has a $0.1 million valuation allowance on certain capital loss carryforwards. However, no valuation allowance was established for the remaining deferred tax assets since management believes that deferred tax assets are likely to be realized through a carry-back to taxable income in prior years, future reversals of existing taxable temporary differences and future taxable income.
Under the provisions of the Internal Revenue Code, WesBanco has approximately $3.0 million of general business credit carryforwards which expire between 2031 and 2033. WesBanco also has $9.8 million of alternative minimum tax credits that may be carried forward indefinitely. As a results of the acquisition of YCB, WesBanco has federal net operating loss carryforwards of $31.0 million, which expire between 2030 and 2036; and Indiana net operating loss carryforwards of $27.9 million, which expire between 2027 and 2035.
As a result of the acquisition of YCB in 2016, and the previous acquisitions of ESB, Fidelity, Western Ohio Financial Corporation, Winton Financial Corporation and Oak Hill Financial, Inc., retained earnings at December 31, 2016 and 2015 includes $45.9 million and $32.9 million, respectively, of qualifying and non-qualifying tax bad debt reserves existing as of December 31, 1987, upon which no provision for income taxes has been recorded. The related amount of unrecognized deferred tax liability is $17.1 million and $12.0 million for 2016 and 2015, respectively. If this portion of retained earnings is used in the future for any purpose other than to absorb bad debts, it will be added to future taxable income.
Federal and state income taxes applicable to securities transactions totaled $0.9 million, $0.3 million, and $0.3 million for the years ended December 31, 2016, 2015 and 2014, respectively.
At December 31, 2016 and 2015, WesBanco had approximately $0.4 million and $0.3 million, respectively, of unrecognized tax benefits and interest. As of December 31, 2016, $0.4 million of these tax benefits would
133
Table of Contents
affect the effective tax rate if recognized. At December 31, 2016 and December 31, 2015, accrued interest related to uncertain tax positions was $22 thousand and $15 thousand, respectively, net of the related federal tax benefit. WesBanco provides for interest and penalties related to uncertain tax positions as part of its provision for federal and state income taxes.
WesBanco is subject to U.S. federal income tax as well as to tax in various state income tax jurisdictions. WesBanco, ESB and YCB are no longer subject to any income tax examinations for years prior to 2013.
Unrecognized Tax Benefits
A reconciliation of the beginning and ending amount of unrecognized tax benefits (excluding interest and the federal income tax benefit of unrecognized state tax benefits) is as follows:
| For the years ended December 31, |
||||||||||||
| (in thousands) |
2016 | 2015 | 2014 | |||||||||
| Balance at beginning of year |
$ | 326 | $ | 701 | $ | 673 | ||||||
| Additions based on tax positions related to the current year |
110 | 104 | 155 | |||||||||
| Reductions for tax positions of prior years |
— | (100 | ) | — | ||||||||
| Reductions due to the statute of limitations |
— | (379 | ) | (127 | ) | |||||||
| Settlements |
— | — | — | |||||||||
|
|
|
|
|
|
|
|||||||
| Balance at end of year |
$ | 436 | $ | 326 | $ | 701 | ||||||
|
|
|
|
|
|
|
|||||||
NOTE 16. FAIR VALUE MEASUREMENT
Fair value estimates are based on quoted market prices, if available, quoted market prices of similar assets or liabilities, or the present value of expected future cash flows and other valuation techniques. These valuations are significantly affected by discount rates, cash flow assumptions, and risk assumptions used. Therefore, fair value estimates may not be substantiated by comparison to independent markets and are not intended to reflect the proceeds that may be realizable in an immediate settlement of the instruments.
Fair value is determined at one point in time and is not representative of future value. These amounts do not reflect the total value of a going concern organization. Management does not have the intention to dispose of a significant portion of its assets and liabilities and therefore, the unrealized gains or losses should not be interpreted as a forecast of future earnings and cash flows.
The following is a discussion of assets and liabilities measured at fair value on a recurring basis and valuation techniques applied:
Investment securities: The fair value of investment securities which are measured on a recurring basis are determined primarily by obtaining quoted prices on nationally recognized securities exchanges or matrix pricing, which is a mathematical technique used widely in the industry to value debt securities without relying exclusively on quoted prices for the specific securities but rather by relying on the securities’ relationship to other similar securities. These securities are classified within level 1 or 2 in the fair value hierarchy. Certain equity securities that are lightly traded in over-the-counter markets are classified as level 2 in the fair value hierarchy, as quoted market prices may not be available on the fair value measurement date. Positions that are not traded in active markets for which valuations are generated using assumptions not observable in the market or management’s best estimate are classified within level 3 of the fair value hierarchy. This includes certain specific municipal debt issues for which the credit quality and discount rate must be estimated.
Derivatives: WesBanco enters into interest rate swap agreements with qualifying commercial customers to meet their financing, interest rate and other risk management needs. These agreements provide the customer the ability to convert from variable to fixed interest rates. The credit risk associated with derivatives executed with
134
Table of Contents
customers is essentially the same as that involved in extending loans and is subject to normal credit policies and monitoring. Those interest rate swaps are simultaneously hedged by offsetting interest rate swaps that WesBanco executes with derivative counterparties in order to offset its exposure on the fixed components of the customer interest rate swap agreements. The interest rate swap agreement with the loan customer and with the counterparty is reported at fair value in other assets and other liabilities on the consolidated balance sheet with any resulting gain or loss recorded in current period earnings as other income and other expense.
WesBanco determines the fair value for derivatives using widely accepted valuation techniques including discounted cash flow analysis on the expected cash flows of each derivative. This analysis reflects contractual terms of the derivative, including the period to maturity, and uses observable market based inputs, including interest rate curves and implied volatilities. WesBanco incorporates credit valuation adjustments to appropriately reflect both its own non-performance risk and the respective counterparty’s non-performance risk in the fair value measurements.
We may be required from time to time to measure certain assets and liabilities at fair value on a nonrecurring basis in accordance with GAAP. These adjustments to fair value usually result from the application of lower of cost or market accounting or write-downs of individual assets and liabilities.
Impaired loans: Impaired loans are carried at the lower of cost or the fair value of the collateral for collateral-dependent loans. Collateral may be in the form of real estate or business assets including equipment, inventory and accounts receivable. The use of independent appraisals, discounted cash flow models and management’s best judgment are significant inputs in arriving at the fair value measure of the underlying collateral and impaired loans are therefore classified within level 3 of the fair value hierarchy.
Other real estate owned and repossessed assets: Other real estate owned and repossessed assets are carried at the lower of the investment in the assets or the fair value of the assets less estimated selling costs. The use of independent appraisals and management’s best judgment are significant inputs in arriving at the fair value measure of the underlying collateral, and therefore other real estate owned and repossessed assets are classified within level 3 of the fair value hierarchy.
Loans held for sale: Loans held for sale are carried, in aggregate, at the lower of cost or fair value. The use of a valuation model using quoted prices of similar instruments are significant inputs in arriving at the fair value and therefore loans held for sale are classified within level 2 of the fair value hierarchy.
135
Table of Contents
Certain investments that are measured at fair value using the net asset value per share (or its equivalent) practical expedient have not been categorized in the fair value hierarchy. The fair value amounts presented in the table below are intended to permit reconciliation of the fair value hierarchy to the amounts presented in the statement of financial position. The following tables set forth WesBanco’s financial assets and liabilities that were accounted for at fair value on a recurring and nonrecurring basis by level within the fair value hierarchy as of December 31, 2016 and 2015:
| (in thousands) |
December 31, 2016 |
Quoted Prices in Active Markets for Identical Assets (level 1) |
Significant Other Observable Inputs (level 2) |
Significant Unobservable Inputs (level 3) |
Investments Measured at Net Asset Value | ||||||||||||||||||||
| Recurring fair value measurements |
|||||||||||||||||||||||||
| Trading securities |
$ | 7,071 | $ | 5,633 | $ | — | $ | — | $ | 1,438 | |||||||||||||||
|
Securities—available-for-sale |
|||||||||||||||||||||||||
| U.S. Government sponsored entities and agencies |
54,043 | — | 54,043 | — | — | ||||||||||||||||||||
| Residential mortgage-backed securities and collateralized mortgage obligations of government agencies |
1,035,099 | — | 1,035,099 | — | — | ||||||||||||||||||||
| Obligations of state and political subdivisions |
111,663 | — | 111,663 | — | — | ||||||||||||||||||||
| Corporate debt securities |
35,301 | — | 35,301 | — | — | ||||||||||||||||||||
| Equity securities |
5,070 | 2,938 | 2,132 | — | — | ||||||||||||||||||||
|
|
|
|
|
|
|
|
|
|
|
||||||||||||||||
| Total securities—available-for-sale |
$ | 1,241,176 | $ | 2,938 | $ | 1,238,238 | $ | — | $ | — | |||||||||||||||
|
|
|
|
|
|
|
|
|
|
|
||||||||||||||||
| Other assets—interest rate derivatives agreements |
$ | 5,596 | $ | — | $ | 5,596 | $ | — | $ | — | |||||||||||||||
|
|
|
|
|
|
|
|
|
|
|
||||||||||||||||
| Total assets recurring fair value measurements |
$ | 1,253,843 | $ | 8,571 | $ | 1,243,834 | $ | — | $ | 1,438 | |||||||||||||||
|
|
|
|
|
|
|
|
|
|
|
||||||||||||||||
| Other liabilities—interest rate derivatives agreements |
$ | 5,199 | $ | — | $ | 5,199 | $ | — | $ | — | |||||||||||||||
|
|
|
|
|
|
|
|
|
|
|
||||||||||||||||
| Total liabilities recurring fair value measurements |
$ | 5,199 | $ | — | $ | 5,199 | $ | — | $ | — | |||||||||||||||
|
|
|
|
|
|
|
|
|
|
|
||||||||||||||||
| Nonrecurring fair value measurements |
|||||||||||||||||||||||||
| Impaired loans |
$ | 3,405 | $ | — | $ | — | $ | 3,405 | $ | — | |||||||||||||||
| Other real estate owned and repossessed assets |
8,346 | — | — | 8,346 | — | ||||||||||||||||||||
| Loans held for sale |
17,315 | — | 17,315 | — | — | ||||||||||||||||||||
|
|
|
|
|
|
|
|
|
|
|
||||||||||||||||
| Total nonrecurring fair value measurements |
$ | 29,066 | $ | — | $ | 17,315 | $ | 11,751 | $ | — | |||||||||||||||
|
|
|
|
|
|
|
|
|
|
|
||||||||||||||||
136
Table of Contents
| December 31, 2015 Fair Value Measurements Using: | |||||||||||||||||||||||||
| (in thousands) |
December 31, 2015 |
Quoted Prices in Active Markets for Identical Assets (level 1) |
Significant Other Observable Inputs (level 2) |
Significant Unobservable Inputs (level 3) |
Investments Measured at Net Asset Value | ||||||||||||||||||||
| Recurring fair value measurements |
|||||||||||||||||||||||||
| Trading securities |
$ | 6,451 | $ | 5,226 | $ | — | $ | — | $ | 1,225 | |||||||||||||||
|
Securities—available-for-sale |
|||||||||||||||||||||||||
| U.S. Government sponsored entities and agencies |
83,505 | — | 83,505 | — | — | ||||||||||||||||||||
| Residential mortgage-backed securities and collateralized mortgage obligations of government agencies |
1,176,080 | — | 1,176,080 | — | — | ||||||||||||||||||||
| Obligations of state and political subdivisions |
80,265 | — | 80,265 | — | — | ||||||||||||||||||||
| Corporate debt securities |
58,593 | — | 58,593 | — | — | ||||||||||||||||||||
| Equity securities |
4,626 | 2,735 | 1,891 | — | — | ||||||||||||||||||||
|
|
|
|
|
|
|
|
|
|
|
||||||||||||||||
| Total securities—available-for-sale |
$ | 1,403,069 | $ | 2,735 | $ | 1,400,334 | $ | — | $ | — | |||||||||||||||
|
|
|
|
|
|
|
|
|
|
|
||||||||||||||||
| Other assets—interest rate derivatives agreements |
$ | 1,893 | $ | — | $ | 1,893 | $ | — | $ | — | |||||||||||||||
|
|
|
|
|
|
|
|
|
|
|
||||||||||||||||
| Total assets recurring fair value measurements |
$ | 1,411,413 | $ | 7,961 | $ | 1,402,227 | $ | — | $ | 1,225 | |||||||||||||||
|
|
|
|
|
|
|
|
|
|
|
||||||||||||||||
| Other liabilities—interest rate derivatives agreements |
$ | 1,991 | $ | — | $ | 1,991 | $ | — | $ | — | |||||||||||||||
|
|
|
|
|
|
|
|
|
|
|
||||||||||||||||
| Total liabilities recurring fair value measurements |
$ | 1,991 | $ | — | $ | 1,991 | $ | — | $ | — | |||||||||||||||
|
|
|
|
|
|
|
|
|
|
|
||||||||||||||||
| Nonrecurring fair value measurements |
|||||||||||||||||||||||||
| Impaired loans |
$ | 6,363 | $ | — | $ | — | $ | 6,363 | $ | — | |||||||||||||||
| Other real estate owned and repossessed assets |
5,825 | — | — | 5,825 | — | ||||||||||||||||||||
| Loans held for sale |
7,899 | — | 7,899 | — | — | ||||||||||||||||||||
|
|
|
|
|
|
|
|
|
|
|
||||||||||||||||
| Total nonrecurring fair value measurements |
$ | 20,087 | $ | — | $ | 7,899 | $ | 12,188 | $ | — | |||||||||||||||
|
|
|
|
|
|
|
|
|
|
|
||||||||||||||||
WesBanco’s policy is to recognize transfers between levels as of the actual date of the event or change in circumstances that caused the transfer. There were no transfers between levels 1, 2, or 3 for the years ended December 31, 2016 and 2015.
137
Table of Contents
The following table presents additional quantitative information about assets measured at fair value on a nonrecurring basis and for which WesBanco has utilized level 3 inputs to determine fair value:
| Quantitative Information about Level 3 Fair Value Measurements | ||||||||||
| (in thousands) |
Fair Value Estimate |
Valuation Techniques |
Unobservable Input |
Range / Weighted Average | ||||||
| December 31, 2016: |
||||||||||
| Impaired loans |
$ | 3,405 | Appraisal of collateral (1) | Appraisal adjustments (2) | 0% to (70.0%) / (36.6%) | |||||
| Liquidation expenses (2) | (1.5%) to (8.0%) / (4.6%) | |||||||||
| Other real estate owned and repossessed assets |
8,346 | Appraisal of collateral (1)(3) | ||||||||
| December 31, 2015: |
||||||||||
| Impaired loans |
$ | 6,363 | Appraisal of collateral (1) | Appraisal adjustments (2) | 0% to (40.6%) / (25.1%) | |||||
| Liquidation expenses (2) | (3.0%) to (8.0%) / (6.7%) | |||||||||
| Other real estate owned and repossessed assets |
5,825 | Appraisal of collateral (1)(3) | ||||||||
| (1) | Fair value is generally determined through independent appraisals of the underlying collateral, which generally include various level 3 inputs which are not identifiable. |
| (2) | Appraisals may be adjusted by management for qualitative factors such as economic conditions and estimated liquidation expenses. The range and weighted average of appraisal adjustments and liquidation expenses are presented as a percent of the appraisal. |
| (3) | Includes estimated liquidation expenses and numerous dissimilar qualitative adjustments by management which are not identifiable. |
The estimated fair values of WesBanco’s financial instruments are summarized below:
| Carrying Amount |
Fair Value Estimate |
Fair Value Measurements at December 31, 2016 | ||||||||||||||||||||||||||||
| (in thousands) |
Quoted Prices in Active Markets for Identical Assets (level 1) |
Significant Other Observable Inputs (level 2) |
Significant Unobservable Inputs (level 3) |
Investments Measured at Net Asset Value | ||||||||||||||||||||||||||
| Financial Assets |
||||||||||||||||||||||||||||||
| Cash and due from banks |
$ | 128,170 | $ | 128,170 | $ | 128,170 | $ | — | $ | — | $ | — | ||||||||||||||||||
| Trading securities |
7,071 | 7,071 | 5,633 | — | — | 1,438 | ||||||||||||||||||||||||
| Securities available-for-sale |
1,241,176 | 1,241,176 | 2,938 | 1,238,238 | — | — | ||||||||||||||||||||||||
| Securities held-to-maturity |
1,067,967 | 1,076,790 | — | 1,076,189 | 601 | — | ||||||||||||||||||||||||
| Net loans |
6,205,762 | 6,073,558 | — | — | 6,073,558 | — | ||||||||||||||||||||||||
| Loans held for sale |
17,315 | 17,315 | — | 17,315 | — | — | ||||||||||||||||||||||||
| Other assets—interest rate derivatives |
5,596 | 5,596 | — | 5,596 | — | — | ||||||||||||||||||||||||
| Accrued interest receivable |
28,299 | 28,299 | 28,299 | — | — | — | ||||||||||||||||||||||||
| Financial Liabilities |
||||||||||||||||||||||||||||||
| Deposits |
7,040,879 | 7,052,501 | 5,545,057 | 1,507,444 | — | — | ||||||||||||||||||||||||
| Federal Home Loan Bank borrowings |
968,946 | 974,430 | — | 974,430 | — | — | ||||||||||||||||||||||||
| Other borrowings |
199,376 | 199,385 | 197,164 | 2,221 | — | — | ||||||||||||||||||||||||
| Subordinated debt and junior subordinated debt |
163,598 | 134,859 | — | 134,859 | — | — | ||||||||||||||||||||||||
| Other liabilities—interest rate derivatives |
5,199 | 5,199 | — | 5,199 | — | — | ||||||||||||||||||||||||
| Accrued interest payable |
2,204 | 2,204 | 2,204 | — | — | — | ||||||||||||||||||||||||
138
Table of Contents
| Carrying Amount |
Fair Value Estimate |
Fair Value Measurements at December 31, 2015 | ||||||||||||||||||||||||||||
| (in thousands) |
Quoted Prices in Active Markets for Identical Assets (level 1) |
Significant Other Observable Inputs (level 2) |
Significant Unobservable Inputs (level 3) |
Investments Measured at Net Asset Value | ||||||||||||||||||||||||||
| Financial Assets |
||||||||||||||||||||||||||||||
| Cash and due from banks |
$ | 86,685 | $ | 86,685 | $ | 86,685 | $ | — | $ | — | $ | — | ||||||||||||||||||
| Trading securities |
6,451 | 6,451 | 5,226 | — | — | 1,225 | ||||||||||||||||||||||||
| Securities available-for-sale |
1,403,069 | 1,403,069 | 2,735 | 1,400,334 | — | — | ||||||||||||||||||||||||
| Securities held-to-maturity |
1,012,930 | 1,038,207 | — | 1,037,490 | 717 | — | ||||||||||||||||||||||||
| Net loans |
5,024,132 | 4,936,236 | — | — | 4,936,236 | — | ||||||||||||||||||||||||
| Loans held for sale |
7,899 | 7,899 | — | 7,899 | — | — | ||||||||||||||||||||||||
| Other assets—interest rate derivatives |
1,893 | 1,893 | — | 1,893 | — | — | ||||||||||||||||||||||||
| Accrued interest receivable |
25,759 | 25,759 | 25,759 | — | — | — | ||||||||||||||||||||||||
| Financial Liabilities |
||||||||||||||||||||||||||||||
| Deposits |
6,066,299 | 6,075,433 | 4,508,461 | 1,566,972 | — | — | ||||||||||||||||||||||||
| Federal Home Loan Bank borrowings |
1,041,750 | 1,041,752 | — | 1,041,752 | — | — | ||||||||||||||||||||||||
| Other borrowings |
81,356 | 81,361 | 78,682 | 2,679 | — | — | ||||||||||||||||||||||||
| Junior subordinated debt |
106,196 | 79,681 | — | 79,681 | — | — | ||||||||||||||||||||||||
| Other liabilities—interest rate derivatives |
1,991 | 1,991 | — | 1,991 | — | — | ||||||||||||||||||||||||
| Accrued interest payable |
1,715 | 1,715 | 1,715 | — | — | — | ||||||||||||||||||||||||
The following methods and assumptions were used to measure the fair value of financial instruments recorded at cost on WesBanco’s consolidated balance sheets:
Cash and due from banks: The carrying amount for cash and due from banks is a reasonable estimate of fair value.
Securities held-to-maturity: Fair values for securities held-to-maturity are determined in the same manner as the investment securities which are described above.
Net loans: Fair values for loans are estimated using a discounted cash flow methodology. The discount rates take into account interest rates currently being offered to customers for loans with similar terms, the credit risk associated with the loan and other market factors, including liquidity. WesBanco believes the discount rates are consistent with transactions occurring in the marketplace for both performing and distressed loan types. The carrying value is net of the allowance for loan losses and other associated premiums and discounts. Due to the significant judgment involved in evaluating credit quality, loans are classified within level 3 of the fair value hierarchy.
Accrued interest receivable: The carrying amount of accrued interest receivable approximates its fair value.
Deposits: The carrying amount is considered a reasonable estimate of fair value for demand, savings and other variable rate deposit accounts. The fair value of fixed maturity certificates of deposit is estimated by a discounted cash flow method using rates currently offered for deposits of similar remaining maturities.
Federal Home Loan Bank borrowings: The fair value of FHLB borrowings is based on rates currently available to WesBanco for borrowings with similar terms and remaining maturities.
139
Table of Contents
Other borrowings: The carrying amount of federal funds purchased and overnight sweep accounts generally approximate fair value. Other repurchase agreements are based on quoted market prices if available. If market prices are not available, for certain fixed and adjustable rate repurchase agreements, then quoted market prices of similar instruments are used.
Subordinated debt and junior subordinated debt: The fair value of subordinated debt is estimated using discounted cash flow analyses based on the current borrowing rates for similar types of borrowing arrangements. Due to the pooled nature of junior subordinated debt owed to unconsolidated subsidiary trusts, which are not actively traded, estimated fair value is based on recent similar transactions of single-issuer trust preferred securities.
Accrued interest payable: The carrying amount of accrued interest payable approximates its fair value.
Off-balance sheet financial instruments: Off-balance sheet financial instruments consist of commitments to extend credit, including letters of credit. Fair values for commitments to extend credit are estimated using the fees currently charged to enter into similar agreements, taking into account the remaining terms of the agreements and the present credit standing of the counterparties. The estimated fair value of the commitments to extend credit and letters of credit are insignificant and therefore are not presented in the above tables.
NOTE 17. COMPREHENSIVE INCOME/(LOSS)
The activity in accumulated other comprehensive income/(loss) for the years ended December 31, 2016, 2015 and 2014 is as follows:
| Accumulated Other Comprehensive Income/(Loss) (1) | ||||||||||||||||||||
| (in thousands) |
Defined Benefit Pension Plan |
Unrealized Gains (Losses) on Securities Available-for-Sale |
Unrealized Gains on Securities Transferred from Available-for-Sale to Held-to-Maturity |
Total | ||||||||||||||||
| Balance at December 31, 2015 |
$ | (17,539 | ) | $ | (4,162 | ) | $ | 747 | $ | (20,954 | ) | |||||||||
|
|
|
|
|
|
|
|
|
|||||||||||||
| Other comprehensive income/(loss) before reclassifications |
(2,112 | ) | (4,300 | ) | — | (6,412 | ) | |||||||||||||
| Amounts reclassified from accumulated other comprehensive income/(loss) |
1,893 | (1,428 | ) | (225 | ) | 240 | ||||||||||||||
|
|
|
|
|
|
|
|
|
|||||||||||||
| Period change |
(219 | ) | (5,728 | ) | (225 | ) | (6,172 | ) | ||||||||||||
|
|
|
|
|
|
|
|
|
|||||||||||||
| Balance at December 31, 2016 |
$ | (17,758 | ) | $ | (9,890 | ) | $ | 522 | $ | (27,126 | ) | |||||||||
|
|
|
|
|
|
|
|
|
|||||||||||||
| Balance at December 31, 2014 |
$ | (22,776 | ) | $ | 2,892 | $ | 1,059 | $ | (18,825 | ) | ||||||||||
|
|
|
|
|
|
|
|
|
|||||||||||||
| Other comprehensive income/(loss) before reclassifications |
3,233 | (6,677 | ) | — | (3,444 | ) | ||||||||||||||
| Amounts reclassified from accumulated other comprehensive income/(loss) |
2,004 | (377 | ) | (312 | ) | 1,315 | ||||||||||||||
|
|
|
|
|
|
|
|
|
|||||||||||||
| Period change |
5,237 | (7,054 | ) | (312 | ) | (2,129 | ) | |||||||||||||
|
|
|
|
|
|
|
|
|
|||||||||||||
| Balance at December 31, 2015 |
$ | (17,539 | ) | $ | (4,162 | ) | $ | 747 | $ | (20,954 | ) | |||||||||
|
|
|
|
|
|
|
|
|
|||||||||||||
| Balance at December 31, 2013 |
$ | (7,966 | ) | $ | (6,126 | ) | $ | 1,358 | $ | (12,734 | ) | |||||||||
|
|
|
|
|
|
|
|
|
|||||||||||||
| Other comprehensive (loss)/income before reclassifications |
(15,768 | ) | 9,638 | — | (6,130 | ) | ||||||||||||||
| Amounts reclassified from accumulated other comprehensive income/(loss) |
958 | (620 | ) | (299 | ) | 39 | ||||||||||||||
|
|
|
|
|
|
|
|
|
|||||||||||||
| Period change |
(14,810 | ) | 9,018 | (299 | ) | (6,091 | ) | |||||||||||||
|
|
|
|
|
|
|
|
|
|||||||||||||
| Balance at December 31, 2014 |
$ | (22,776 | ) | $ | 2,892 | $ | 1,059 | $ | (18,825 | ) | ||||||||||
|
|
|
|
|
|
|
|
|
|||||||||||||
| (1) | All amounts are net of tax. Related income tax expense or benefit is calculated using a combined Federal and State income tax rate approximating 37%. |
140
Table of Contents
| Details about Accumulated Other Comprehensive Income/(Loss) Components |
Amounts Reclassified from Accumulated Other Comprehensive Income/ (Loss) For the Years Ended December 31, |
Affected Line Item in the Statement of
Net | ||||||||||||
| (in thousands) |
2016 | 2015 | 2014 | |||||||||||
| Securities available-for-sale (1): |
||||||||||||||
| Net securities gains reclassified into earnings |
$ | (2,251 | ) | $ | (596 | ) | $ | (981 | ) | Net securities gains (Non-interest income) | ||||
| Related income tax expense |
823 | 219 | 361 | Provision for income taxes | ||||||||||
|
|
|
|
|
|
|
|||||||||
| Net effect on accumulated other comprehensive income/(loss) for the period |
(1,428 | ) | (377 | ) | (620 | ) | ||||||||
|
|
|
|
|
|
|
|||||||||
| Securities held-to-maturity (1): |
||||||||||||||
| Amortization of unrealized gain transferred from available-for-sale |
(357 | ) | (494 | ) | (472 | ) | Interest and dividends on securities (Interest and dividend income) | |||||||
| Related income tax expense |
132 | 182 | 173 | Provision for income taxes | ||||||||||
|
|
|
|
|
|
|
|||||||||
| Net effect on accumulated other comprehensive income/(loss) for the period |
(225 | ) | (312 | ) | (299 | ) | ||||||||
|
|
|
|
|
|
|
|||||||||
| Defined benefit pension plan (2): |
||||||||||||||
| Amortization of net loss and prior service costs |
3,046 | 3,205 | 1,516 | Employee benefits (Non-interest expense) | ||||||||||
| Related income tax benefit |
(1,153 | ) | (1,201 | ) | (558 | ) | Provision for income taxes | |||||||
|
|
|
|
|
|
|
|||||||||
| Net effect on accumulated other comprehensive income/(loss) for the period |
1,893 | 2,004 | 958 | |||||||||||
|
|
|
|
|
|
|
|||||||||
| Total reclassifications for the period |
$ | 240 | $ | 1,315 | $ | 39 | ||||||||
|
|
|
|
|
|
|
|||||||||
| (1) | For additional detail related to unrealized gains on securities and related amounts reclassified from accumulated other comprehensive income/(loss) see Note 4, “Securities.” |
| (2) | Included in the computation of net periodic pension cost. See Note 13, “Employee Benefit Plans” for additional detail. |
NOTE 18. COMMITMENTS AND CONTINGENT LIABILITIES
Commitments—In the normal course of business, WesBanco offers off-balance sheet credit arrangements to enable its customers to meet their financing objectives. Those instruments involve, to varying degrees, elements of credit and interest rate risk in excess of the amount recognized in the financial statements. WesBanco’s exposure to credit losses in the event of non-performance by the other parties to the financial instruments for commitments to extend credit and standby letters of credit is limited to the contractual amount of those instruments. WesBanco uses the same credit policies in making commitments and conditional obligations as for all other lending. Commitments generally have fixed expiration dates or other termination clauses and may require payment of a fee. Since many of the commitments are expected to expire without being drawn upon, the total commitment amounts do not necessarily represent future cash requirements. The allowance for credit losses associated with commitments was $0.6 million as of December 31, 2016 and 2015, and is included in other liabilities on the Consolidated Balance Sheets.
Letters of credit are conditional commitments issued by banks to guarantee the performance of a customer to a third party. Those guarantees are primarily issued to support public and private borrowing arrangements, including normal business activities, bond financing and similar transactions. Letters of credit are considered guarantees. The liability associated with letters of credit was $0.2 million as of December 31, 2016 and 2015.
141
Table of Contents
Contingent obligations to purchase loans funded by other entities include affordable housing plan guarantees, credit card guarantees and mortgages sold into the secondary market with recourse. Affordable housing plan guarantees are performance guarantees for various building project loans. The guarantee amortizes as the loan balances decrease. Credit card guarantees are credit card balances not owned by WesBanco, whereby the Bank guarantees the performance of the cardholder. Certain mortgages sold with recourse obligate WesBanco to repurchase mortgages sold if the borrower exceeds certain delinquency metrics within the first year.
The following table presents total commitments to extend credit, guarantees and various letters of credit outstanding:
| December 31, | ||||||||
| (in thousands) |
2016 | 2015 | ||||||
| Lines of credit |
$ | 1,418,329 | $ | 1,159,769 | ||||
| Loans approved but not closed |
185,254 | 234,599 | ||||||
| Overdraft limits |
126,517 | 106,252 | ||||||
| Letters of credit |
32,907 | 27,408 | ||||||
| Contingent obligations to purchase loans funded by other entities |
13,036 | 18,079 | ||||||
Contingent Liabilities—WesBanco is a party to various legal and administrative proceedings and claims. While any litigation contains an element of uncertainty, management does not believe that a material loss related to such proceedings or claims pending or known to be threatened is reasonably possible.
NOTE 19. WESBANCO BANK COMMUNITY DEVELOPMENT CORPORATION
WesBanco Bank Community Development Corporation (“WBCDC”), a consolidated subsidiary of WesBanco Bank, is a Certified Development Entity (“CDE”) with $60.0 million of New Markets Tax Credits (“NMTC”) all of which had been invested in WBCDC at December 31, 2016. The NMTC program is administered by the Community Development Financial Institutions Fund of the U.S. Treasury and is aimed at stimulating economic and community development and job creation in low-income communities. The program provides federal tax credits to investors who make qualified equity investments (“QEIs”) in a CDE. The CDE is required to invest the proceeds of each QEI in low-income communities, which are generally defined as those census tracts with poverty rates greater than 20% and/or median family incomes that are less than or equal to 80% of the area median family income.
The credit provided to the investor totals 39% of each QEI in a CDE and is claimed over a seven-year credit allowance period. In each of the first three years, the investor receives a credit equal to 5% of the total amount the investor paid to the CDE for each QEI. For each of the remaining four years, the investor receives a credit equal to 6% of the total amount the investor paid to the CDE for each QEI. As of December 31, 2016, WesBanco has received $21.5 million in tax credits over the seven-year credit allowance periods for its $60.0 million NMTC authority invested in WBCDC. WesBanco is eligible to receive an additional $1.9 million in tax credits as set forth in the following table with respect to aggregate QEI amounts invested with a remaining seven-year credit allowance period.
142
Table of Contents
WesBanco Bank recognized $1.8 million, $1.9 million and $2.3 million in NMTC in its income tax provision for the years ended December 31, 2016, 2015 and 2014, respectively. These tax credits are subject to certain general business tax credit limitations, as well as the alternative minimum tax, and are therefore limited in deductibility currently due to the applicability of alternative minimum tax on WesBanco’s federal income tax return. A total of $1.2 million of such NMTC have been carried forward to future tax years.
| (in thousands) |
Aggregate QEI Amount (1) |
New Markets Tax Credit | ||||||||||||||
| Year |
2017 | 2018 | 2019 | |||||||||||||
| 2011 |
$ | 5,000 | $ | 300 | $ | — | $ | — | ||||||||
| 2012 |
6,000 | 360 | 360 | — | ||||||||||||
| 2013 |
5,000 | 300 | 300 | 300 | ||||||||||||
|
|
|
|
|
|
|
|
|
|||||||||
| Total |
$ | 16,000 | $ | 960 | $ | 660 | $ | 300 | ||||||||
|
|
|
|
|
|
|
|
|
|||||||||
| (1) | The seven-year credit allowance period has expired for $44.0 million in QEI investments in WBCDC. |
The NMTC claimed by WesBanco Bank with respect to each QEI remain subject to recapture over each QEI’s credit allowance period upon the occurrence of any of the following:
| • | if less than substantially all (generally defined as 85%) of the QEI proceeds are not used by WBCDC to make qualified low income community investments; |
| • | WBCDC ceases to be a CDE; or |
| • | WBCDC redeems its QEI investment prior to the end of the current credit allowance periods. |
At December 31, 2016, 2015 and 2014, none of the above recapture events had occurred, nor in the opinion of management are such events anticipated to occur in the foreseeable future.
The following condensed financial statements summarize the financial position of WBCDC as of December 31, 2016, and the results of its operations and cash flows for the year ended December 31, 2016:
BALANCE SHEET
| (in thousands) |
December 31, 2016 | ||||
| Assets |
|||||
| Cash and due from banks |
$ | 31,303 | |||
| Loans, net of allowance for loan losses of $249 |
39,589 | ||||
| Investments |
968 | ||||
| Other assets |
286 | ||||
|
|
|
||||
| Total Assets |
$ | 72,146 | |||
|
|
|
||||
| Liabilities |
$ | 274 | |||
| Shareholder Equity |
71,872 | ||||
|
|
|
||||
| Total Liabilities and Shareholder Equity |
$ | 72,146 | |||
|
|
|
||||
143
Table of Contents
STATEMENT OF INCOME
| (in thousands) |
For the year ended December 31, 2016 | ||||
| Interest income |
|||||
| Loans |
$ | 1,383 | |||
|
|
|
||||
| Total interest income |
1,383 | ||||
| Provision for loan losses |
32 | ||||
|
|
|
||||
| Net interest income after provision for loan losses |
1,351 | ||||
| Loss on investments |
(94 | ) | |||
| Non-interest expense |
79 | ||||
|
|
|
||||
| Income before provision for income taxes |
1,178 | ||||
| Provision for income taxes |
436 | ||||
|
|
|
||||
| Net income |
$ | 742 | |||
|
|
|
||||
STATEMENT OF CASH FLOWS
| (in thousands) |
For the year ended December 31, 2016 | ||||
| Operating Activities |
|||||
| Net income |
$ | 742 | |||
| Provision for loan losses |
32 | ||||
| Loss on investments |
94 | ||||
| Net change in other assets |
757 | ||||
| Net change in other liabilities |
24 | ||||
|
|
|
||||
| Net cash provided by operating activities |
1,649 | ||||
|
|
|
||||
| Investing Activities |
|||||
| Decrease in loans |
3,337 | ||||
|
|
|
||||
| Net cash provided by investing activities |
3,337 | ||||
|
|
|
||||
| Financing Activities |
|||||
| Qualified equity investment by parent company |
— | ||||
|
|
|
||||
| Net cash provided by financing activities |
— | ||||
|
|
|
||||
| Net increase in cash and cash equivalents |
4,986 | ||||
| Cash and cash equivalents at beginning of year |
26,317 | ||||
|
|
|
||||
| Cash and cash equivalents at end of year |
$ | 31,303 | |||
|
|
|
||||
NOTE 20. TRANSACTIONS WITH RELATED PARTIES
Certain directors and officers (including their affiliates, families and entities in which they are principal owners) of WesBanco and its subsidiaries are customers of, or suppliers to, those subsidiaries and have had, and are expected to have, transactions with the subsidiaries in the ordinary course of business. In addition, certain directors are also directors or officers of corporations that are customers of, or suppliers to, the Bank and have had, and are expected to have, transactions with the Bank in the ordinary course of business. In the opinion of management, such transactions are consistent with prudent banking practices and are within applicable banking regulations. Indebtedness of related parties aggregated approximately $18.7 million, $9.6 million and $4.4 million as of December 31, 2016, 2015, and 2014, respectively. During 2016, $17.5 million in related party loans were funded and $8.4 million were repaid or no longer related. At December 31, 2016, 2015 and 2014, none of the outstanding related party loans were past due 90 days or more, on non-accrual, or considered to be a TDR.
144
Table of Contents
NOTE 21. REGULATORY MATTERS
The Federal Reserve Bank is the primary regulator for the parent company, WesBanco. WesBanco Bank is a state non-member bank jointly regulated by the FDIC and the West Virginia Department of Banking. WesBanco is a legal entity separate and distinct from its subsidiaries and is dependent upon dividends from its subsidiary bank, WesBanco Bank, to provide funds for the payment of dividends to shareholders, fund its current stock repurchase plan and to provide for other cash requirements. The payment of dividends by WesBanco Bank to WesBanco is subject to state and federal banking regulations. Under applicable law, bank regulatory agency approval is required if the total of all dividends declared by a bank in any calendar year exceeds the available retained earnings or exceeds the aggregate of the bank’s net profits (as defined by regulatory agencies) for that year and its retained net profits for the preceding two years. As of December 31, 2016, under FDIC regulations, WesBanco could receive, without prior regulatory approval, a dividend of up to $42.2 million from WesBanco Bank.
WesBanco and WesBanco Bank are also required to maintain non-interest bearing reserve balances with the Federal Reserve Bank. The average required reserve balance was $2.0 million and $5.0 million during 2016 and 2015, respectively.
Additionally, WesBanco and WesBanco Bank are subject to various regulatory capital requirements (risk-based capital ratios) administered by federal banking agencies. Failure to meet minimum capital requirements can initiate certain mandatory and possibly additional discretionary actions by the regulators that, if undertaken, could have a material adverse effect on WesBanco’s financial results.
All bank holding companies and banking subsidiaries are required to have common equity Tier 1 (“CET1”) of at least 4.5%, core capital (“Tier 1”) of at least 6% of risk-weighted assets, total capital of at least 8% of risk-weighted assets, and a minimum Tier 1 leverage ratio of 4%. Tier 1 capital consists principally of shareholders’ equity; excluding items recorded in accumulated other comprehensive income, less goodwill and other intangibles. Total capital consists of Tier 1 capital plus the allowance for loan losses subject to limitation. The regulations also define “well-capitalized” levels of CET1, Tier 1 risk-based capital, total risk-based capital, and Tier 1 leverage capital as 6.5%, 8%, 10%, and 5%, respectively. WesBanco and WesBanco Bank were categorized as “well-capitalized” under the Federal Deposit Insurance Corporation Improvement Act at December 31, 2016 and 2015. There are no conditions or events since December 31, 2016 that management believes have changed WesBanco’s “well-capitalized” category.
The Basel III capital standards effective January 1, 2015 with a phase-in period ending January 1, 2019, establishes the minimum capital levels required under the Dodd-Frank Act, permanently grandfathers trust preferred securities as tier 1 capital issued before May 19, 2010 for bank holding companies under $15 billion, and increases the capital required for certain categories of assets.
WesBanco currently has $137.6 million in junior subordinated debt in its Consolidated Balance Sheets presented as a separate category of long-term debt. For regulatory purposes, trust preferred securities totaling $138.0 million, issued by unconsolidated trust subsidiaries of WesBanco underlying such junior subordinated debt, are included in Tier 1 capital in accordance with current regulatory reporting requirements.
145
Table of Contents
The following table summarizes risk-based capital amounts and ratios for WesBanco and the Bank:
| December 31, 2016 | December 31, 2015 | |||||||||||||||||||||||||||||||||||||||
| (dollars in thousands) |
Minimum Value (1) |
Well Capitalized (2) |
Amount | Ratio | Minimum Amount (1) |
Amount | Ratio | Minimum Amount (1) | ||||||||||||||||||||||||||||||||
| WesBanco, Inc. |
||||||||||||||||||||||||||||||||||||||||
| Tier 1 leverage |
4.00 | % | 5.00 | % | $ | 901,873 | 9.81 | % | $ | 367,843 | $ | 751,748 | 9.38 | % | $ | 320,575 | ||||||||||||||||||||||||
| Common equity Tier 1 |
4.50 | % | 6.50 | % | 773,306 | 11.28 | % | 308,462 | 656,911 | 11.66 | % | 253,418 | ||||||||||||||||||||||||||||
| Tier 1 capital to risk-weighted assets |
6.00 | % | 8.00 | % | 901,873 | 13.16 | % | 411,283 | 751,748 | 13.35 | % | 337,891 | ||||||||||||||||||||||||||||
| Total capital to risk-weighted assets |
8.00 | % | 10.00 | % | 971,762 | 14.18 | % | 548,378 | 794,643 | 14.11 | % | 450,521 | ||||||||||||||||||||||||||||
| WesBanco Bank, Inc. |
||||||||||||||||||||||||||||||||||||||||
| Tier 1 leverage |
4.00 | % | 5.00 | % | $ | 827,173 | 9.02 | % | $ | 366,903 | $ | 701,384 | 8.77 | % | $ | 320,020 | ||||||||||||||||||||||||
| Common equity Tier 1 |
4.50 | % | 6.50 | % | 827,173 | 12.10 | % | 307,728 | 701,384 | 12.49 | % | 252,793 | ||||||||||||||||||||||||||||
| Tier 1 capital to risk-weighted assets |
6.00 | % | 8.00 | % | 827,173 | 12.10 | % | 410,305 | 701,384 | 12.49 | % | 337,057 | ||||||||||||||||||||||||||||
| Total capital to risk-weighted assets |
8.00 | % | 10.00 | % | 896,598 | 13.11 | % | 547,073 | 743,923 | 13.24 | % | 449,409 | ||||||||||||||||||||||||||||
| (1) | Minimum requirements to remain adequately capitalized. |
| (2) | Well capitalized under prompt corrective action regulations. |
NOTE 22. CONDENSED PARENT COMPANY FINANCIAL STATEMENTS
Presented below are the Condensed Balance Sheets, Statements of Income and Statements of Cash Flows for the parent company:
BALANCE SHEETS
| December 31, | ||||||||
| (in thousands) |
2016 | 2015 | ||||||
| ASSETS |
||||||||
| Cash and short-term investments |
$ | 47,035 | $ | 33,172 | ||||
| Investment in subsidiaries—Bank |
1,404,565 | 1,175,005 | ||||||
| Investment in subsidiaries—Nonbank |
8,228 | 5,604 | ||||||
| Securities available-for-sale, at fair value |
2,133 | 1,891 | ||||||
| Other assets |
28,602 | 21,817 | ||||||
|
|
|
|
|
|||||
| Total Assets |
$ | 1,490,563 | $ | 1,237,489 | ||||
|
|
|
|
|
|||||
| LIABILITIES |
||||||||
| Junior subordinated debt owed to unconsolidated subsidiary trusts |
$ | 137,559 | $ | 106,196 | ||||
| Dividends payable and other liabilities |
11,596 | 9,161 | ||||||
|
|
|
|
|
|||||
| Total Liabilities |
149,155 | 115,357 | ||||||
| SHAREHOLDERS’ EQUITY |
1,341,408 | 1,122,132 | ||||||
|
|
|
|
|
|||||
| Total Liabilities and Shareholders’ Equity |
$ | 1,490,563 | $ | 1,237,489 | ||||
|
|
|
|
|
|||||
146
Table of Contents
STATEMENTS OF INCOME
| For the years ended December 31, | ||||||||||||
| (in thousands) |
2016 | 2015 | 2014 | |||||||||
| Dividends from subsidiaries—Bank |
$ | 85,000 | $ | 60,000 | $ | 59,500 | ||||||
| Dividends from subsidiaries—Nonbank |
800 | 500 | 1,200 | |||||||||
| Income from securities |
75 | 75 | 128 | |||||||||
| Net securities gain |
— | — | 745 | |||||||||
| Other income |
147 | 104 | 416 | |||||||||
|
|
|
|
|
|
|
|||||||
| Total income |
86,022 | 60,679 | 61,989 | |||||||||
| Interest expense |
4,136 | 3,315 | 3,199 | |||||||||
| Other expense |
5,628 | 5,547 | 3,940 | |||||||||
|
|
|
|
|
|
|
|||||||
| Total expense |
9,764 | 8,862 | 7,139 | |||||||||
|
|
|
|
|
|
|
|||||||
| Income before income tax benefit and undistributed net income of subsidiaries |
76,258 | 51,817 | 54,850 | |||||||||
| Income tax benefit |
(3,149 | ) | (2,971 | ) | (2,006 | ) | ||||||
|
|
|
|
|
|
|
|||||||
| Income before undistributed net income of subsidiaries |
79,407 | 54,788 | 56,856 | |||||||||
| Equity in undistributed net income of subsidiaries |
7,228 | 25,974 | 13,118 | |||||||||
|
|
|
|
|
|
|
|||||||
| NET INCOME |
$ | 86,635 | $ | 80,762 | $ | 69,974 | ||||||
|
|
|
|
|
|
|
|||||||
The details of other comprehensive income and accumulated other comprehensive income are included in the consolidated financial statements.
STATEMENTS OF CASH FLOWS
| For the years ended December 31, | ||||||||||||
| (in thousands) |
2016 | 2015 | 2014 | |||||||||
| OPERATING ACTIVITIES |
||||||||||||
| Net income |
$ | 86,635 | $ | 80,762 | $ | 69,974 | ||||||
| Adjustments to reconcile net income to net cash provided by operating activities: |
||||||||||||
| Equity in undistributed net income |
(7,228 | ) | (25,974 | ) | (13,118 | ) | ||||||
| Gain on securities |
— | — | (745 | ) | ||||||||
| Decrease in other assets |
14,679 | 199 | 1,908 | |||||||||
| Other—net |
2,094 | 1,657 | 1,968 | |||||||||
|
|
|
|
|
|
|
|||||||
| Net cash provided by operating activities |
96,180 | 56,644 | 59,987 | |||||||||
|
|
|
|
|
|
|
|||||||
| INVESTING ACTIVITIES |
||||||||||||
| Proceed from sales—securities available-for-sale |
— | 210 | 1,990 | |||||||||
| Acquisitions and additional capitalization of subsidiaries, net of cash (paid) acquired |
(43,199 | ) | 1,465 | — | ||||||||
|
|
|
|
|
|
|
|||||||
| Net cash (used in) provided by investing activities |
(43,199 | ) | 1,675 | 1,990 | ||||||||
|
|
|
|
|
|
|
|||||||
| FINANCING ACTIVITIES |
||||||||||||
| Repayment of junior subordinated debt |
— | (36,083 | ) | — | ||||||||
| Repayment of other borrowings |
— | (13,000 | ) | — | ||||||||
| Issuance of common stock |
1,713 | — | — | |||||||||
| Repurchase of common stock warrant |
— | (2,247 | ) | — | ||||||||
| Treasury shares (purchased) sold—net |
(3,026 | ) | (2,542 | ) | 1,918 | |||||||
| Dividends paid to common and preferred shareholders |
(37,805 | ) | (33,007 | ) | (25,136 | ) | ||||||
|
|
|
|
|
|
|
|||||||
| Net cash used in financing activities |
(39,118 | ) | (86,879 | ) | (23,218 | ) | ||||||
|
|
|
|
|
|
|
|||||||
| Net increase (decrease) in cash and cash equivalents |
13,863 | (28,560 | ) | 38,759 | ||||||||
| Cash and short-term investments at beginning of year |
33,172 | 61,732 | 22,973 | |||||||||
|
|
|
|
|
|
|
|||||||
| Cash and short-term investments at end of year |
$ | 47,035 | $ | 33,172 | $ | 61,732 | ||||||
|
|
|
|
|
|
|
|||||||
147
Table of Contents
NOTE 23. BUSINESS SEGMENTS
WesBanco operates two reportable segments: (i) Community Banking and (ii) Trust and Investment Services. WesBanco’s community banking segment offers services traditionally offered by full-service commercial banks, including commercial demand, individual demand and time deposit accounts, as well as commercial, mortgage and individual installment loans, and certain non-traditional offerings, such as insurance and securities brokerage services. The trust and investment services segment offers trust services as well as various alternative investment products including mutual funds. The market value of assets of the trust and investment services segment was approximately $3.7 billion, $3.6 billion and $3.8 billion at December 31, 2016, 2015, and 2014, respectively. These assets are held by WesBanco, in fiduciary or agency capacities for their customers and therefore are not included as assets on WesBanco’s Consolidated Balance Sheets.
Condensed financial information by business segment is presented below:
| (in thousands) |
Community Banking |
Trust and Investment Services |
Consolidated | |||||||||
| For the year ended December 31, 2016: |
||||||||||||
| Interest and dividend income |
$ | 286,097 | $ | — | $ | 286,097 | ||||||
| Interest expense |
32,767 | — | 32,767 | |||||||||
|
|
|
|
|
|
|
|||||||
| Net interest income |
253,330 | — | 253,330 | |||||||||
| Provision for credit losses |
8,478 | — | 8,478 | |||||||||
|
|
|
|
|
|
|
|||||||
| Net interest income after provision for credit losses |
244,852 | — | 244,852 | |||||||||
| Non-interest income |
59,869 | 21,630 | 81,499 | |||||||||
| Non-interest expense |
196,784 | 11,896 | 208,680 | |||||||||
|
|
|
|
|
|
|
|||||||
| Income before provision for income taxes |
107,937 | 9,734 | 117,671 | |||||||||
| Provision for income taxes |
27,142 | 3,894 | 31,036 | |||||||||
|
|
|
|
|
|
|
|||||||
| Net income |
$ | 80,795 | $ | 5,840 | $ | 86,635 | ||||||
|
|
|
|
|
|
|
|||||||
| For the year ended December 31, 2015: |
||||||||||||
| Interest and dividend income |
$ | 261,712 | $ | — | $ | 261,712 | ||||||
| Interest expense |
24,725 | — | 24,725 | |||||||||
|
|
|
|
|
|
|
|||||||
| Net interest income |
236,987 | — | 236,987 | |||||||||
| Provision for credit losses |
8,353 | — | 8,353 | |||||||||
|
|
|
|
|
|
|
|||||||
| Net interest income after provision for credit losses |
228,634 | — | 228,634 | |||||||||
| Non-interest income |
52,566 | 21,900 | 74,466 | |||||||||
| Non-interest expense |
181,821 | 12,102 | 193,923 | |||||||||
|
|
|
|
|
|
|
|||||||
| Income before provision for income taxes |
99,379 | 9,798 | 109,177 | |||||||||
| Provision for income taxes |
24,496 | 3,919 | 28,415 | |||||||||
|
|
|
|
|
|
|
|||||||
| Net income |
$ | 74,883 | $ | 5,879 | $ | 80,762 | ||||||
|
|
|
|
|
|
|
|||||||
| For the year ended December 31, 2014: |
||||||||||||
| Interest and dividend income |
$ | 215,991 | $ | — | $ | 215,991 | ||||||
| Interest expense |
22,763 | — | 22,763 | |||||||||
|
|
|
|
|
|
|
|||||||
| Net interest income |
193,228 | — | 193,228 | |||||||||
| Provision for credit losses |
6,405 | — | 6,405 | |||||||||
|
|
|
|
|
|
|
|||||||
| Net interest income after provision for credit losses |
186,823 | — | 186,823 | |||||||||
| Non-interest income |
47,435 | 21,069 | 68,504 | |||||||||
| Non-interest expense |
149,429 | 12,204 | 161,633 | |||||||||
|
|
|
|
|
|
|
|||||||
| Income before provision for income taxes |
84,829 | 8,865 | 93,694 | |||||||||
| Provision for income taxes |
20,174 | 3,546 | 23,720 | |||||||||
|
|
|
|
|
|
|
|||||||
| Net income |
$ | 64,655 | $ | 5,319 | $ | 69,974 | ||||||
|
|
|
|
|
|
|
|||||||
148
Table of Contents
Total non-fiduciary assets of the trust and investment services segment were $4.3 million, $3.3 million, and $4.0 million at December 31, 2016, 2015, and 2014, respectively. All other assets, including goodwill and other intangible assets, were allocated to the Community Banking segment.
NOTE 24. CONDENSED QUARTERLY STATEMENTS OF INCOME (UNAUDITED)
The following tables set forth unaudited consolidated selected quarterly statements of income for the years ended December 31, 2016 and 2015.
| 2016 Quarter ended | |||||||||||||||||||||||||
| (dollars in thousands, except per share amounts) |
March 31, | June 30, | September 30, | December 31, | Annual Total | ||||||||||||||||||||
| Interest and dividend income |
$ | 67,601 | $ | 67,585 | $ | 70,092 | $ | 80,819 | $ | 286,097 | |||||||||||||||
| Interest expense |
7,759 | 7,811 | 8,066 | 9,131 | 32,767 | ||||||||||||||||||||
|
|
|
|
|
|
|
|
|
|
|
||||||||||||||||
| Net interest income |
59,842 | 59,774 | 62,026 | 71,688 | 253,330 | ||||||||||||||||||||
| Provision for credit losses |
2,324 | 1,811 | 2,214 | 2,128 | 8,478 | ||||||||||||||||||||
|
|
|
|
|
|
|
|
|
|
|
||||||||||||||||
| Net interest income after provision for credit losses |
57,518 | 57,963 | 59,812 | 69,560 | 244,852 | ||||||||||||||||||||
| Non-interest income |
18,282 | 19,006 | 20,419 | 21,357 | 79,142 | ||||||||||||||||||||
| Net securities gains |
1,111 | 585 | 598 | 63 | 2,357 | ||||||||||||||||||||
| Non-interest expense |
45,343 | 47,360 | 57,601 | 58,298 | 208,680 | ||||||||||||||||||||
|
|
|
|
|
|
|
|
|
|
|
||||||||||||||||
| Income before provision for income taxes |
31,568 | 30,194 | 23,228 | 32,682 | 117,671 | ||||||||||||||||||||
| Provision for income taxes |
8,694 | 8,085 | 5,793 | 8,464 | 31,036 | ||||||||||||||||||||
|
|
|
|
|
|
|
|
|
|
|
||||||||||||||||
| Net income |
$ | 22,874 | $ | 22,109 | $ | 17,435 | $ | 24,218 | $ | 86,635 | |||||||||||||||
|
|
|
|
|
|
|
|
|
|
|
||||||||||||||||
| Earnings per common share—basic |
$ | 0.60 | $ | 0.58 | $ | 0.44 | $ | 0.55 | $ | 2.16 | |||||||||||||||
|
|
|
|
|
|
|
|
|
|
|
||||||||||||||||
| Earnings per common share—diluted |
$ | 0.60 | $ | 0.58 | $ | 0.44 | $ | 0.55 | $ | 2.16 | |||||||||||||||
|
|
|
|
|
|
|
|
|
|
|
||||||||||||||||
| 2015 Quarter ended | |||||||||||||||||||||||||
| (dollars in thousands, except per share amounts) |
March 31, | June 30, | September 30, | December 31, | Annual Total | ||||||||||||||||||||
| Interest and dividend income |
$ | 60,379 | $ | 66,729 | $ | 66,935 | $ | 67,660 | $ | 261,712 | |||||||||||||||
| Interest expense |
5,424 | 5,936 | 6,326 | 7,040 | 24,725 | ||||||||||||||||||||
|
|
|
|
|
|
|
|
|
|
|
||||||||||||||||
| Net interest income |
54,955 | 60,793 | 60,609 | 60,620 | 236,987 | ||||||||||||||||||||
| Provision for credit losses |
1,289 | 2,681 | 1,798 | 2,585 | 8,353 | ||||||||||||||||||||
|
|
|
|
|
|
|
|
|
|
|
||||||||||||||||
| Net interest income after provision for credit losses |
53,666 | 58,112 | 58,811 | 58,035 | 228,634 | ||||||||||||||||||||
| Non-interest income |
18,168 | 18,072 | 18,139 | 19,146 | 73,518 | ||||||||||||||||||||
| Net securities gains |
22 | — | 47 | 880 | 948 | ||||||||||||||||||||
| Non-interest expense |
53,441 | 46,589 | 46,981 | 46,894 | 193,923 | ||||||||||||||||||||
|
|
|
|
|
|
|
|
|
|
|
||||||||||||||||
| Income before provision for income taxes |
18,415 | 29,595 | 30,016 | 31,167 | 109,177 | ||||||||||||||||||||
| Provision for income taxes |
4,528 | 7,962 | 7,768 | 8,165 | 28,415 | ||||||||||||||||||||
|
|
|
|
|
|
|
|
|
|
|
||||||||||||||||
| Net income |
$ | 13,887 | $ | 21,633 | $ | 22,248 | $ | 23,002 | $ | 80,762 | |||||||||||||||
|
|
|
|
|
|
|
|
|
|
|
||||||||||||||||
| Earnings per common share—basic |
$ | 0.40 | $ | 0.56 | $ | 0.58 | $ | 0.60 | $ | 2.15 | |||||||||||||||
|
|
|
|
|
|
|
|
|
|
|
||||||||||||||||
| Earnings per common share—diluted |
$ | 0.40 | $ | 0.56 | $ | 0.58 | $ | 0.60 | $ | 2.15 | |||||||||||||||
|
|
|
|
|
|
|
|
|
|
|
||||||||||||||||
149
Table of Contents
| ITEM 9. | CHANGES IN AND DISAGREEMENTS WITH ACCOUNTANTS ON ACCOUNTING AND FINANCIAL DISCLOSURE |
None.
| ITEM 9A. | CONTROLS AND PROCEDURES |
WesBanco’s management carried out an evaluation, under the supervision and with the participation of the chief executive officer and the chief financial officer, of the effectiveness of the design and operation of WesBanco’s disclosure controls and procedures (as such term is defined in Rules 13a-15(e) and 15d-15(e) under the Exchange Act) as of December 31, 2016, pursuant to Exchange Act Rule 13a-15. Based upon that evaluation, the chief executive officer along with the chief financial officer concluded that WesBanco’s disclosure controls and procedures as of December 31, 2016, are effective in timely alerting them to material information relating to WesBanco (including its consolidated subsidiaries) required to be included in WesBanco’s periodic filings under the Exchange Act.
No changes in WesBanco’s internal control over financial reporting have occurred during our fiscal quarter ended December 31, 2016 that have materially affected, or are reasonably likely to materially affect, WesBanco’s internal control over financial reporting.
Management’s Report on Internal Control Over Financial Reporting
Management’s Report on internal control over financial reporting and the audit report of Ernst & Young LLP, the Company’s independent registered public accounting firm, on internal control over financial reporting is included within this report immediately following “Item 7A. Quantitative and Qualitative Disclosures about Market Risk” and is incorporated in this Item 9A by reference.
| ITEM 9B. | OTHER INFORMATION |
None.
150
Table of Contents
| ITEM 10. | DIRECTORS, EXECUTIVE OFFICERS AND CORPORATE GOVERNANCE |
The information required by this Item 10 is incorporated by reference to the applicable information in our Proxy Statement set forth under the headings Election of Directors, Continuing Directors, Executive Officers of the Corporation, Section 16(a) Beneficial Ownership Reporting Compliance and Audit Committee.
CODE OF ETHICS
WesBanco has adopted a Code of Business Conduct and Ethics that applies to our directors, officers and employees, including WesBanco’s Chief Executive Officer, Chief Financial Officer, Controller and other executive officers. WesBanco’s “Code of Business Conduct and Ethics” can be found posted on our website at http://www.wesbanco.com in the “About Us” section under “Investor Relations” under “Governance Documents”. WesBanco intends to disclose any changes or amendments to or waivers from this code of ethics on its website as well as the required filing of Form 8-K, under Item 5.05.
WesBanco will provide a printed copy, free of charge, of WesBanco’s Code of Ethics to any shareholder requesting such information. To obtain a copy of WesBanco’s Code of Ethics, contact: John Iannone, WesBanco, Inc., 1 Bank Plaza, Wheeling, WV 26003. (304) 905-7021
| ITEM 11. | EXECUTIVE COMPENSATION |
The information required by this Item 11 is incorporated by reference to the applicable information in our Proxy Statement set forth under the headings Summary Compensation Table, Meetings of Board of Directors and Committees and Compensation of Members, Compensation Committee Interlocks and Insider Participation, Compensation Committee Report, Compensation Discussion and Analysis, Annual Incentive Awards and certain other sections.
| ITEM 12. | SECURITY OWNERSHIP OF CERTAIN BENEFICIAL OWNERS AND MANAGEMENT AND RELATED STOCKHOLDER MATTERS |
The information required by this Item 12 (other than the information provided below under the heading Equity Compensation Plan Information) is incorporated by reference to the applicable information in our Proxy Statement set forth under the headings Ownership of Securities by Directors, Nominees and Officers and Beneficial Owners of More Than 5% of the Common Stock of the Corporation.
The following table sets forth certain information with respect to securities authorized for issuance under our equity compensation plans as of December 31, 2016.
Equity Compensation Plan Information
| Plan Category |
Number of securities to be issued upon exercise of outstanding options |
Weighted average exercise price of outstanding options |
Number of securities remaining for future issuance under equity compensation plans | ||||||||||||
| Equity compensation plans approved by security holders |
288,122 | $ | 28.47 | 117,266 | |||||||||||
| Equity compensation plans not approved by security holders |
None | None | None | ||||||||||||
151
Table of Contents
| ITEM 13. | CERTAIN RELATIONSHIPS AND RELATED TRANSACTIONS, AND DIRECTOR INDEPENDENCE |
The information required by this Item 13 is incorporated by reference to the applicable information in our Proxy Statement set forth under the headings Transactions with Directors and Officers and Election of Directors. Additional information concerning related party transactions is set forth in the Annual Report under Note 20, “Transactions with Related Parties” in the Consolidated Financial Statements.
| ITEM 14. | PRINCIPAL ACCOUNTING FEES AND SERVICES |
The information required by this Item 14 is incorporated by reference to the applicable information in our Proxy Statement set forth under the heading Independent Auditors.
152
Table of Contents
| ITEM 15. | EXHIBITS AND FINANCIAL STATEMENT SCHEDULES |
(A) CERTAIN DOCUMENTS FILED AS PART OF THE FORM 10-K
(1) CONSOLIDATED FINANCIAL STATEMENTS: Reference is made to Part II Item 8, of this Annual Report on Form 10-K.
(2) FINANCIAL STATEMENT SCHEDULES: No financial statement schedules are being filed since the required information is inapplicable or the information is presented in the Consolidated Financial Statements or related Notes.
(3) EXHIBIT LISTING Exhibits listed in the Exhibit Index of this Annual Report on Form 10-K are filed herein or are incorporated by reference.
| ITEM 16. | FORM 10-K SUMMARY |
None.
153
Table of Contents
EXHIBIT INDEX
| Exhibit |
Document |
Location | ||
| 2.1 | Agreement and Plan of Merger dated October 29, 2014 by and between Wesbanco, Inc., Wesbanco Bank, Inc., ESB Financial Corporation and ESB Bank. | Incorporated by reference to Form 8-K filed by the Registrant with the Securities and Exchange Commission on October 29, 2014. | ||
| 2.2 | Agreement and Plan of Merger dated May 3, 2016 by and between Wesbanco, Inc., Wesbanco Bank, Inc., Your Community Bankshares, Inc. and Your Community Bank. | Incorporated by reference to Form 8-K filed by the Registrant with the Securities and Exchange Commission on May 3, 2016. | ||
| 3.1 | Restated Articles of Incorporation of WesBanco, Inc. | Incorporated by reference to a prior Registration Statement on Form S-4 under Registration No. 333-03905 filed by the Registrant with the Securities and Exchange Commission on May 16, 1996. | ||
| 3.2 | Articles of Amendment to the Articles of Incorporation of WesBanco, Inc. | Incorporated by reference to Form 10-Q filed by the Registrant with the Securities and Exchange Commission on May 15, 1998. | ||
| 3.3 | Bylaws of WesBanco, Inc. (As Amended and Restated February 24, 2011). | Incorporated by reference to Form 8-K filed by the Registrant with the Securities and Exchange Commission on February 25, 2011. | ||
| 3.4 | Articles of Amendment to the Articles of Incorporation of WesBanco, Inc., dated April 24, 2015, increasing authorized common shares from 50,000,000 to 100,000,000. | Incorporated by reference to Form 10-Q filed by the Registrant with the Securities and Exchange Commission on July 30, 2015. | ||
| 4.1 | Specimen Certificate of WesBanco, Inc. Common Stock. | Incorporated by reference to a prior Registration Statement on Form S-4 under Registration No. 33-42157 filed by the Registrant with the Securities and Exchange Commission on August 9, 1991. | ||
| 4.2 | Junior Subordinated Indenture dated June 19, 2003 entered into between WesBanco, Inc., as issuer and The Bank of New York, as Trustee and Amended and Restated Declaration of Trust of WesBanco, Inc. Capital Trust II. | Incorporated by reference to Form 10-Q filed by the Registrant with the Securities and Exchange Commission on August 13, 2003. | ||
| 4.3 | Indenture dated June 26, 2003 entered into between WesBanco, Inc., as issuer and U.S. Bank National Association, as Trustee and Amended and Restated Declaration of Trust of WesBanco, Inc. Capital Statutory Trust III. | Incorporated by reference to Form 10-Q filed by the Registrant with the Securities and Exchange Commission on August 13, 2003. | ||
| 4.4 | Indenture dated June 17, 2004 entered into between WesBanco, Inc., as issuer and Wilmington Trust Company, as Trustee and Amended and Restated Declaration of Trust of WesBanco Capital Trust IV dated June 17, 2004. | Incorporated by reference to Form 10-Q filed by the Registrant with the Securities and Exchange Commission on August 9, 2004. | ||
154
Table of Contents
| Exhibit |
Document |
Location | ||
| 4.5 | Indenture dated June 17, 2004 entered into between WesBanco, Inc., as issuer and Wilmington Trust Company, as Trustee and Amended and Restated Declaration of Trust of WesBanco Capital Trust V dated June 17, 2004. | Incorporated by reference to Form 10-Q filed by the Registrant with the Securities and Exchange Commission on August 9, 2004. | ||
| 4.6 | Indenture dated March 17, 2005 entered into between WesBanco, Inc. and Wilmington Trust Company, as Trustee and Amended and Restated Declaration of Trust of WesBanco Capital Trust VI dated March 17, 2005. | Incorporated by reference to Form 8-K filed by the Registrant with the Securities and Exchange Commission on March 18, 2005. | ||
| 10.1 | WesBanco, Inc. Incentive Bonus, Option and Restricted Stock Plan as adopted February 13, 1998 and as amended and restated February 25, 2010.** | Incorporated by reference to Form 8-K filed by the Registrant with the Securities and Exchange Commission on April 22, 2010. | ||
| 10.2 | Employment Agreement, dated November 30, 2001, by and between WesBanco Bank, Inc., WesBanco, Inc. and Brent E. Richmond.** | Incorporated by reference to a prior Registration Statement on Form S-4 under Registration No. 333-74814 filed by the Registrant with the Securities and Exchange Commission on December 10, 2001. | ||
| 10.3 | Employment Agreement dated June 30, 2001, by and between WesBanco Bank, Inc., Robert H. Young and WesBanco, Inc.** | Incorporated by reference to Form 10-K filed by the Registrant with the Securities and Exchange Commission on March 29, 2002. | ||
| 10.4 | Letter Agreement and Committed Line of Credit Note, dated September 5, 2014, between WesBanco, Inc. and PNC Bank, National Association. | Incorporated by reference to Form 8-K filed by the Registrant with the Securities and Exchange Commission on September 8, 2014. | ||
| 10.5 | Form of Amended and Restated Change in Control Agreement by and between WesBanco, Inc., WesBanco Bank, Inc., and Robert H. Young.** | Incorporated by reference to Form 10-Q filed by the Registrant with the Securities and Exchange Commission on August 5, 2005. | ||
| 10.6 | Form of Amended and Restated Salary Continuation Agreement—With Change in Control Provision by and between WesBanco Bank, Inc. and executive officers (along with their related 10 year benefit at age 65) as follows: Robert H. Young ($40,000) and Brent E. Richmond ($12,000).** | Incorporated by reference to Form 10-Q filed by the Registrant with the Securities and Exchange Commission on August 5, 2005. | ||
| 10.7 | WesBanco, Inc. Deferred Compensation Plan—For Directors and Eligible Employees (as amended).** | Incorporated by reference to Form 10-K filed by the Registrant with the Securities and Exchange Commission on March 10, 2006. | ||
| 10.8 | Form of Amended and Restated Change in Control Agreement by and between WesBanco, Inc., WesBanco Bank, Inc., Brent E. Richmond, Michael L. Perkins and Jayson M. Zatta.** | Incorporated by reference to Form 8-K filed by the Registrant with the Securities and Exchange Commission on April 28, 2006. | ||
| 10.9 | Form of Executive Compensation Amendment Agreement by and between WesBanco, Inc., WesBanco Bank, Inc., and Robert H. Young.** | Incorporated by reference to Form 10-K filed by the Registrant with the Securities and Exchange Commission on March 10, 2009. | ||
155
Table of Contents
| Exhibit |
Document |
Location | ||
| 10.10 | Form of Executive Compensation Amendment Agreement by and between WesBanco, Inc., WesBanco Bank, Inc., and Robert H. Young.** | Incorporated by reference to Form 10-Q filed by the Registrant with the Securities and Exchange Commission on August 10, 2009. | ||
| 10.11 | Form of WesBanco, Inc. Incentive Bonus, Option & Restricted Stock Plan—Stock Option Agreement.** | Incorporated by reference to Form 10-Q filed by the Registrant with the Securities and Exchange Commission on July 30, 2010. | ||
| 10.12 | Form of WesBanco, Inc. Incentive Bonus, Option & Restricted Stock Plan—Restricted Stock Agreement.** | Incorporated by reference to Form 10-Q filed by the Registrant with the Securities and Exchange Commission on July 30, 2010. | ||
| 10.13 | Form of Amended and Restated Employment Agreement by and between WesBanco, Inc., WesBanco Bank, Inc. and employee as follows: Lynn D. Asensio and Jonathan D. Dargusch.** | Incorporated by reference to Form 10-Q filed by the Registrant with the Securities and Exchange Commission on August 13, 2003. | ||
| 10.14 | Form of Change in Control Agreement by and between WesBanco, Inc., WesBanco Bank, Inc., and executive officers: Lynn D. Asensio, Jonathan D. Dargusch and Todd F. Clossin.** | Incorporated by reference to Form 8-K filed by the Registrant with the Securities and Exchange Commission on June 5, 2013. | ||
| 10.15 | Restricted Stock Agreement by and between WesBanco, Inc. and Todd F. Clossin.** | Incorporated by reference to Form 8-K filed by the Registrant with the Securities and Exchange Commission on October 24, 2013. | ||
| 10.16 | Amended and Restated Employment Agreement, dated April 24, 2014, by and between WesBanco Bank, Inc., Todd F. Clossin and WesBanco, Inc.** | Incorporated by reference to Form 8-K filed by the Registrant with the Securities and Exchange Commission on April 24, 2014. | ||
| 10.17 | WesBanco, Inc. KSOP, Amended and Restated, effective January 1, 2014.** | Incorporated by reference to Form 10-K filed by the Registrant with the Securities and Exchange Commission on February 27, 2015. | ||
| 10.18 | First Amendment to the WesBanco, Inc. KSOP, effective January 1, 2014.** | Incorporated by reference to Form 10-K filed by the Registrant with the Securities and Exchange Commission on February 27, 2015. | ||
| 10.19 | Second Amendment to the WesBanco, Inc. KSOP, effective January 1, 2014.** | Incorporated by reference to Form 10-K filed by the Registrant with the Securities and Exchange Commission on February 27, 2015. | ||
| 10.20 | Separation Agreement and Release and Waiver of Claims, dated October 29, 2014, by and among ESB Financial Corporation, ESB Bank, Charlotte A. Zuschlag, Wesbanco, Inc. and Wesbanco Bank, Inc.** | Incorporated by reference to Form 8-K filed by the Registrant with the Securities and Exchange Commission on February 10, 2015. | ||
| 10.21 | Employment Agreement, dated October 29, 2014, by and between Wesbanco Bank, Inc., Charlotte A. Zuschlag, and Wesbanco, Inc.** | Incorporated by reference to Form 8-K filed by the Registrant with the Securities and Exchange Commission on February 10, 2015. | ||
| 10.22 | Non-competition Agreement, dated October 29, 2014, by and between Wesbanco, Inc., Wesbanco Bank, Inc. and Charlotte A. Zuschlag.** | Incorporated by reference to Form 8-K filed by the Registrant with the Securities and Exchange Commission on February 10, 2015. | ||
156
Table of Contents
| Exhibit |
Document |
Location | ||
| 10.23 | Form of Employment Agreement by and between WesBanco Bank, Inc., WesBanco Inc., and executive officers (effective date): Jayson M. Zatta (effective March 1, 2015)** | Incorporated by reference to Form 10-Q filed by the Registrant with the Securities and Exchange Commission on July 30, 2015. | ||
| 10.24 | Wesbanco, Inc. Administrative Rules for the Total Shareholder Return Plan.** | Incorporated by reference to Form 8-K filed by the Registrant with the Securities and Exchange Commission on November 24, 2015. | ||
| 10.25 | Form of WesBanco, Inc. Incentive Bonus, Option & Restricted Stock Plan—Total Shareholder Return Agreement.** | Incorporated by reference to Form 10-K filed by the Registrant with the Securities and Exchange Commission on February 26, 2016. | ||
| 10.26 | Amendment to Employment Agreement by and between James D. Rickard, Your Community Bankshares, Inc., Your Community Bank, WesBanco, Inc. and WesBanco Bank, Inc. dated May 27, 2016.** | Incorporated by reference to Exhibit 10.1 to Amendment No. 1 to Form S-4 filed by the Registrant on June 30, 2016. | ||
| 10.27 | Amendment to Employment Agreement by and between Paul A. Chrisco, Your Community Bankshares, Inc., Your Community Bank, WesBanco, Inc. and WesBanco Bank, Inc. dated May 3, 2016.** | Incorporated by reference to Exhibit 10.2 to Amendment No. 1 to Form S-4 filed by the Registrant on June 30, 2016. | ||
| 10.28 | Amendment to Employment Agreement by and between Michael K. Bauer, Your Community Bankshares, Inc., Your Community Bank, WesBanco, Inc. and WesBanco Bank, Inc. dated May 3, 2016.** | Incorporated by reference to Exhibit 10.3 to Amendment No. 1 to Form S-4 filed by the Registrant on June 30, 2016. | ||
| 10.29 | Amendment to Employment Agreement by and between Kevin J. Cecil, Your Community Bankshares, Inc., Your Community Bank, WesBanco, Inc. and WesBanco Bank, Inc. dated May 3, 2016.** | Incorporated by reference to Exhibit 10.4 to Amendment No. 1 to Form S-4 filed by the Registrant on June 30, 2016. | ||
| 10.30 | Merger Payment and Restrictive Covenant Agreement by and between Bill D. Wright, Your Community Bankshares, Inc., Your Community Bank, WesBanco, Inc., and WesBanco Bank, Inc. dated May 3, 2016.** | Incorporated by reference to Exhibit 10.5 to Amendment No. 1 to Form S-4 filed by the Registrant on June 30, 2016. | ||
| 11 | Computation of Earnings Per Common Share. | Computation of earnings per common share is set forth under Note 3, “Earnings Per Common Share” of this Annual Report on Form 10-K. | ||
| 21 | Significant Subsidiaries of the Registrant. | * | ||
| 23 | Consent of Independent Registered Public Accounting Firm, Ernst & Young LLP. | * | ||
| 24 | Power of Attorney. | * | ||
| 31.1 | Certification of Chief Executive Officer of Periodic Report Pursuant to Rule 13a-15(e) or Rule 15d-15(e). | * | ||
157
Table of Contents
| Exhibit |
Document |
Location | ||
| 31.2 | Certification of Chief Financial Officer of Periodic Report Pursuant to Rule 13a-15(e) or Rule 15d-15(e). | * | ||
| 32.1 | Certification Pursuant to 18 U.S.C. Section 1350, as adopted pursuant to Section 906 of the Sarbanes-Oxley Act of 2002. | * | ||
| 101 | The following materials from WesBanco’s Annual Report on Form 10-K for the year ended December 31, 2016, formatted in XBRL (Extensible Business Reporting Language): (i) the Consolidated Balance Sheets at December 31, 2016 and 2015, (ii) the Consolidated Statements of Income and Comprehensive Income for the years ended December 31, 2016, 2015 and 2014, (iii) the Consolidated Statements of Changes in Stockholders’ Equity for the years ended December 31, 2016, 2015 and 2014, (iv) the Consolidated Statements of Cash Flows for the years ended December 31, 2016, 2015 and 2014, and (v) the Notes to Consolidated Financial Statements. | *** | ||
| * | Filed herewith |
| ** | Indicates management compensatory plan, contract, or arrangement |
| *** | Filed electronically |
158
Table of Contents
Pursuant to the Requirements of Section 13 or 15(d) of the Securities Exchange Act of 1934, the Registrant has duly caused this report to be signed on its behalf by the undersigned, thereunto duly authorized, on February 24, 2017.
| WESBANCO, INC. | ||
| By: |
/s/ Todd F. Clossin | |
| Todd F. Clossin | ||
| President and Chief Executive Officer | ||
Pursuant to the requirements of the Securities Exchange Act of 1934, this report has been signed below by the following persons on behalf of the registrant and in the capacities indicated, on February 24, 2017.
| By: |
/s/ Todd F. Clossin | |
| Todd F. Clossin | ||
| President, Chief Executive Officer, and Director | ||
| (Principal Executive Officer) | ||
| By: |
/s/ Robert H. Young | |
| Robert H. Young | ||
| Executive Vice President and Chief Financial Officer | ||
| (Principal Financial and Accounting Officer) | ||
| By: |
/s/ James C. Gardill | |
| James C. Gardill | ||
| Chairman of the Board | ||
The Directors of WesBanco (listed below) executed a power of attorney appointing Todd F. Clossin their attorney-in-fact, empowering him to sign this report on their behalf.
| By: |
/s/ Todd F. Clossin | |
| Todd F. Clossin | ||
| Attorney-in-fact |
| Stephen J. Callen |
Paul M. Limbert | |
| Christopher V. Criss |
Jay T. McCamic | |
| Abigail M. Feinknopf |
Ronald W. Owen | |
| Ernest S. Fragale |
Richard G. Spencer | |
| Denise Knouse-Synder |
Kerry M. Stemler | |
| D. Bruce Knox |
Reed J. Tanner | |
| Lisa A. Knutson |
Charlotte A. Zuschlag | |
| Gary L. Libs |
159