Attached files
| file | filename |
|---|---|
| 8-K - 8-K - Black Creek Diversified Property Fund Inc. | q317form8-k.htm |
| EX-99.1 - EXHIBIT 99.1 - Black Creek Diversified Property Fund Inc. | ex991q317pressrelease.htm |
Exhibit 99.2


CAUTIONARY NOTE REGARDING FORWARD LOOKING STATEMENTS
Statements included in this portfolio performance and review package that are not historical facts (including any statements concerning investment objectives, other plans and objectives of management for future operations or economic performance or assumptions or forecasts related thereto) are forward looking statements. These statements are only predictions. We caution that forward looking statements are not guarantees. Actual events or our investments and results of operations could differ materially from those expressed or implied in the forward looking statements. Forward looking statements are typically identified by the use of terms such as “may,” “will,” “should,” “expect,” “could,” “intend,” “plan,” “anticipate,” “estimate,” “believe,” “continue,” “predict,” “potential” or the negative of such terms and other comparable terminology.
The forward looking statements included herein are based upon our current expectations, plans, estimates, assumptions and beliefs that involve numerous risks and uncertainties. Assumptions relating to the foregoing involve judgments with respect to, among other things, future economic, competitive and market conditions and future business decisions, all of which are difficult or impossible to predict accurately and many of which are beyond our control. Although we believe that the expectations reflected in such forward looking statements are based on reasonable assumptions, our actual results and performance could differ materially from those set forth in the forward looking statements. Factors which could have a material adverse effect on our operations and future prospects include, but are not limited to: the continuing impact of high unemployment and the slow economic recovery, which is having and may continue to have a negative effect on the following, among other things, the fundamentals of our business, including overall market demand and occupancy, tenant space utilization, and rental rates; the value of our real estate assets, which may limit our ability to dispose of assets at attractive prices or obtain or maintain debt financing secured by our properties or on an unsecured basis; general risks affecting the real estate industry (including, without limitation, the inability to enter into or renew leases, dependence on tenants’ financial condition, and competition from other developers, owners and operators of real estate); our ability to effectively raise and deploy proceeds from our equity offerings; risks associated with the availability and terms of debt and equity financing and refinancing and the use of debt to fund acquisitions and developments, including the risk associated with interest rates impacting the cost and/or availability of financing and refinancing; the business opportunities that may be presented to and pursued by us; changes in laws or regulations (including changes to laws governing the taxation of real estate investment trusts); changes in accounting principles, policies and guidelines applicable to real estate investment trusts; environmental, regulatory and/or safety requirements; and the availability and cost of comprehensive insurance, including coverage for terrorist acts and earthquakes. Except as otherwise required by the federal securities laws, we undertake no obligation to publicly update or revise any forward looking statements after the date of this supplemental package, whether as a result of new information, future events, changed circumstances or any other reason. You should review the risk factors contained in Part I, Item 1A of our 2016 Annual Report on Form 10-K, filed with the Securities and Exchange Commission on March 3, 2017, and in our subsequent quarterly reports.
Please see the section titled “Definitions” at the end of this portfolio performance and review package for definitions of terms used herein.
Page | 2
PERFORMANCE |
Black Creek Diversified Property Fund Inc. is a monthly NAV-based REIT and has invested in a diverse portfolio of real property and real estate related investments. As used herein, “the Portfolio,” “we,” “our” and “us” refer to Black Creek Diversified Property Fund Inc. and its consolidated subsidiaries and partnerships except where the context otherwise requires.
Quarter Highlights
• | On September 1, 2017, we amended our charter and restructured our outstanding share classes as part of a broader restructuring (the "Restructuring"). For a description of the changes made as part of the Restructuring, please refer to "Note 1 Organization" in Part I, Item 1 of our Q3 2017 Quarterly Report on Form 10-Q. |
• | Total return of 0.70% for the quarter; 4.65% for the last 12 months. |
• | Entered into one mortgage note borrowing for $98.6 million with an interest rate spread of 2.75% over one-month LIBOR. |
• | Acquired (i) one industrial property in East Bay, CA for $16.2 million and (ii) one industrial property in Las Vegas, NV for $24.5 million. Sold one industrial property in Dallas, TX for $7.7 million. The disposed property was a single building from a three-building industrial property. We continue to own the remaining portion of the property. |
• | Percentage leased of 89.5% as of September 30, 2017. |
• | Paid weighted-average distribution of $0.0892/share. |
Shareholder Returns | Key Statistics | ||||||||
Q3 2017 | Year-to-Date | 1-Year | 3-Year | Since Inception (9/30/12) - Annualized(5) | As of September 30, 2017 | ||||
Fair Value(1) of Investments | $2,283.1 million | ||||||||
Number of Real Properties | 53 | ||||||||
Number of Real Property Markets | 20 | ||||||||
Total Square Feet | 8.6 million | ||||||||
Distribution returns(3)(4) | 1.20% | 3.59% | 4.86% | 5.01% | 5.14% | Number of Tenants | approximately 500 | ||
Net change in NAV, per share(4) | (0.50)% | (1.45)% | (0.21)% | 1.72% | 2.35% | Percentage Leased | 89.5 | % | |
Total return(4)(5) | 0.70% | 2.14% | 4.65% | 6.73% | 7.49% | Debt to Fair Value of Investments | 50.5 | % | |
(1) | As determined in accordance with our Valuation Procedures, filed as Exhibit 4.6 to our Post-Effective Amendment No. 10. See a discussion of some of the differences between the definition of "fair value" of our real estate assets as used in our Valuation Procedures and in this document versus GAAP values in the section titled "Definitions" beginning on page 25. For a description of key assumptions used in calculating the value of our real properties as of September 30, 2017, please refer to “Management’s Discussion and Analysis of Financial Condition and Results of Operations” in Part I, Item 2 of our Q3 2017 Quarterly Report on Form 10-Q. |
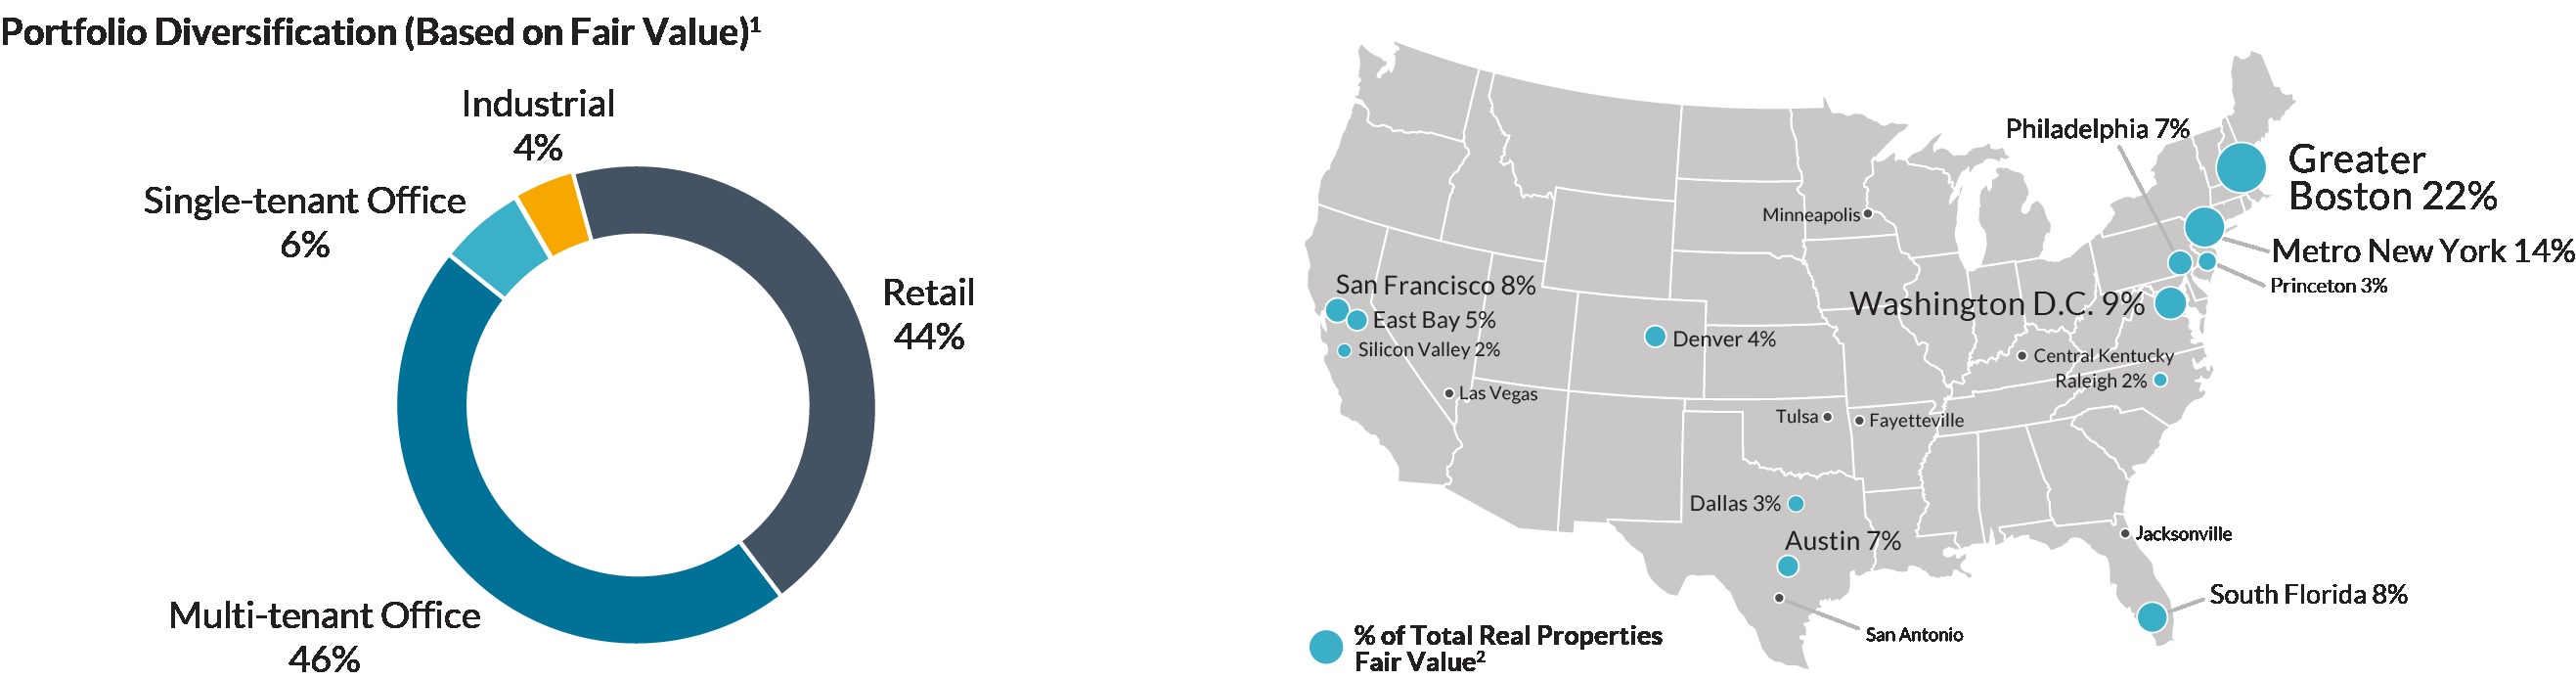
(2) | Any market for which we do not show a corresponding percentage of our total fair value comprises 1% or less of the total fair value of our real property portfolio. |
(3) | Represents the compounded return realized from reinvested distributions before ongoing class specific expenses. We pay our dealer manager (1) a distribution fee equal to 0.85% per annum of the aggregate NAV of our outstanding Class T and S shares (2) a distribution fee equal to 0.25% per annum of the aggregate NAV of our outstanding Class D shares. |
(4) | Excludes the impact of up-front sales commissions and dealer manager fees paid with respect to certain Class T and S shares. We pay (1) upfront selling commissions of up to 3.0% and dealer manager fees of 0.5% of the transaction price of each Class T shares and (2) upfront selling commissions of up to 3.5% of the transaction price of each Class S share sold in our ongoing public primary offering. |
(5) | Total return represents the compound annual rate of return assuming reinvestment of all dividend distributions. Past performance is not a guarantee of future results. Q4 2012 represents the first full quarter for which we have complete NAV return data. As such, we use 9/30/12 as “inception” for the purpose of calculating cumulative returns since inception. Investors in our fixed price offering prior to NAV inception are likely to have a lower total return. |
Page | 3
FINANCIAL HIGHLIGHTS |
Amounts in thousands, except per share information and percentages.
As of or For the Three Months Ended | As of or For Nine Months Ended | ||||||||||||||||||||||||||
Selected Operating Data (as adjusted) | September 30, 2017 | June 30, 2017 | March 31, 2017 | December 31, 2016 | September 30, 2016 | September 30, 2017 | September 30, 2016 | ||||||||||||||||||||
Total revenue | $ | 49,672 | $ | 50,265 | $ | 52,739 | $ | 53,956 | $ | 53,493 | $ | 152,676 | $ | 162,214 | |||||||||||||
Gain on sale of real property | 670 | 10,352 | — | 2,165 | 2,095 | 11,022 | 43,495 | ||||||||||||||||||||
Net (loss) income | (2,145 | ) | 8,415 | 1,827 | 3,357 | 3,318 | 8,097 | 51,690 | |||||||||||||||||||
Net (loss) income per share | $ | (0.01 | ) | $ | 0.05 | $ | 0.01 | $ | 0.02 | $ | 0.02 | $ | 0.04 | $ | 0.29 | ||||||||||||
Weighted average number of common shares outstanding - basic | 139,925 | 145,288 | 149,891 | 154,807 | 158,688 | 144,998 | 161,274 | ||||||||||||||||||||
Weighted average number of common shares outstanding - diluted | 151,739 | 157,209 | 161,919 | 166,942 | 170,952 | 156,918 | 173,760 | ||||||||||||||||||||
Portfolio Statistics | |||||||||||||||||||||||||||
Operating properties | 53 | 51 | 55 | 55 | 55 | 53 | 55 | ||||||||||||||||||||
Square feet | 8,569 | 8,315 | 8,971 | 8,971 | 8,988 | 8,569 | 8,988 | ||||||||||||||||||||
Percentage leased at end of period | 89.5 | % | 86.9 | % | 87.8 | % | 91.2 | % | 91.5 | % | 89.5 | % | 91.5 | % | |||||||||||||
Non-GAAP Supplemental Financial Measures | |||||||||||||||||||||||||||
Real property net operating income ("NOI") (1) | $ | 31,962 | $ | 33,475 | $ | 35,065 | $ | 36,523 | $ | 36,821 | $ | 100,502 | $ | 113,116 | |||||||||||||
Funds from Operations ("FFO") per share (2) | $ | 0.09 | $ | 0.11 | $ | 0.12 | $ | 0.13 | $ | 0.14 | $ | 0.33 | $ | 0.40 | |||||||||||||
Net Asset Value ("NAV") (3) | |||||||||||||||||||||||||||
NAV per share at the end of period | $ | 7.45 | $ | 7.50 | $ | 7.52 | $ | 7.57 | $ | 7.48 | $ | 7.45 | $ | 7.48 | |||||||||||||
Weighted average distributions per share | $ | 0.0892 | $ | 0.0891 | $ | 0.0891 | $ | 0.0892 | $ | 0.0892 | $ | 0.2674 | $ | 0.2677 | |||||||||||||
Weighted average closing dividend yield - annualized | 4.78 | % | 4.75 | % | 4.74 | % | 4.71 | % | 4.77 | % | 4.78 | % | 4.77 | % | |||||||||||||
Weighted average total return for the period | 0.70 | % | 0.87 | % | 0.55 | % | 2.45 | % | 2.59 | % | 2.14 | % | 3.78 | % | |||||||||||||
Aggregate fund NAV at end of period | $ | 1,129,437 | $ | 1,137,640 | $ | 1,184,021 | $ | 1,229,300 | $ | 1,232,985 | $ | 1,129,437 | $ | 1,232,985 | |||||||||||||
Consolidated Debt | |||||||||||||||||||||||||||
Leverage (4) | 50.5 | % | 49.1 | % | 47.7 | % | 45.9 | % | 45.9 | % | 50.5 | % | 45.9 | % | |||||||||||||
Weighted average stated interest rate of total borrowings | 3.4 | % | 3.3 | % | 3.2 | % | 3.4 | % | 3.2 | % | 3.4 | % | 3.2 | % | |||||||||||||
Secured borrowings | $ | 482,034 | $ | 383,852 | $ | 360,063 | $ | 343,470 | $ | 388,070 | $ | 482,034 | $ | 388,070 | |||||||||||||
Secured borrowings as % of total borrowings | 42 | % | 35 | % | 33 | % | 33 | % | 37 | % | 42 | % | 37 | % | |||||||||||||
Unsecured borrowings | $ | 677,000 | $ | 728,000 | $ | 735,000 | $ | 711,000 | $ | 668,000 | $ | 677,000 | $ | 668,000 | |||||||||||||
Unsecured borrowings as % of total borrowings | 58 | % | 65 | % | 67 | % | 67 | % | 63 | % | 58 | % | 63 | % | |||||||||||||
Fixed rate borrowings (5) | $ | 478,934 | $ | 479,352 | $ | 542,593 | $ | 653,093 | $ | 697,785 | $ | 478,934 | $ | 697,785 | |||||||||||||
Fixed rate borrowings as % of total borrowings | 41 | % | 43 | % | 50 | % | 62 | % | 66 | % | 41 | % | 66 | % | |||||||||||||
Floating rate borrowings | $ | 680,100 | $ | 632,500 | $ | 552,470 | $ | 401,377 | $ | 358,285 | $ | 680,100 | $ | 358,285 | |||||||||||||
Floating rate borrowings as % of total borrowings | 59 | % | 57 | % | 50 | % | 38 | % | 34 | % | 59 | % | 34 | % | |||||||||||||
Total borrowings | $ | 1,159,034 | $ | 1,111,852 | $ | 1,095,063 | $ | 1,054,470 | $ | 1,056,070 | $ | 1,159,034 | $ | 1,056,070 | |||||||||||||
Net GAAP adjustments (6) | $ | (7,533 | ) | $ | (6,700 | ) | $ | (6,618 | ) | $ | (5,669 | ) | $ | (5,360 | ) | $ | (7,533 | ) | $ | (5,360 | ) | ||||||
Total borrowings (GAAP Basis) | $ | 1,151,501 | $ | 1,105,152 | $ | 1,088,445 | $ | 1,048,801 | $ | 1,050,710 | $ | 1,151,501 | $ | 1,050,710 | |||||||||||||
(1) | NOI is a non-GAAP measure. For a reconciliation of NOI to GAAP net (loss) income, see the section titled "Results From Operations" beginning on page 12. |
(2) | FFO is a non-GAAP measure. For a reconciliation of FFO to GAAP net (loss) income, see the section titled “Funds From Operations” beginning on page 10. |
(3) | As determined in accordance with our Valuation Procedures, filed as Exhibit 4.6 to our Post-Effective Amendment No. 10. See a discussion of some of the differences between the definition of "fair value" of our real estate assets as used in our Valuation Procedures and in this document versus GAAP values in the section titled "Definitions" beginning on page 25. For a description of key assumptions used in calculating the value of our real properties as of September 30, 2017, please refer to “Management’s Discussion and Analysis of Financial Condition and Results of Operations” in Part I, Item 2 of our Q3 2017 Quarterly Report on Form 10-Q. |
(4) | Leverage presented represents the total principal outstanding under our total borrowings divided by the fair value of our real property and debt investments. |
(5) | Fixed rate borrowings presented includes floating rate borrowings that are effectively fixed by a derivative instrument such as a swap through maturity or substantially through maturity. |
(6) | Net GAAP adjustments include net deferred issuance costs and mark-to-market adjustments on assumed debt. These items are included in mortgage notes and unsecured borrowings in our condensed consolidated balance sheets in accordance with GAAP. |
Page | 4
NET ASSET VALUE |
The following table sets forth the components of NAV for the Portfolio as of the end of each of the five quarters ending September 30, 2017, as determined in accordance with our valuation procedures. For information about the valuation procedures and key assumptions used in these calculations, please refer to our Annual Report on Form 10-K or Quarterly Report on Form 10-Q for the applicable period. On September 1, 2017, as part of the Restructuring, we changed the frequency of our NAV calculations from daily to monthly and made other changes to our valuation policies. For additional discussion related to our Restructuring, please refer to "Note 1 Organization" in Part I, Item 1 of our Q3 2017 Quarterly Report on Form 10-Q. As used below, “Fund Interests” means our Class E shares, Class T shares, Class D shares, Class I shares, and Class S shares, along with the OP Units held by third parties, and “Aggregate Fund NAV” means the NAV of all of the Fund Interests (amounts in thousands, except per share information).
As of | |||||||||||||||||||
September 30, 2017 | June 30, 2017 | March 31, 2017 | December 31, 2016 | September 30, 2016 | |||||||||||||||
Office | $ | 1,190,050 | $ | 1,187,550 | $ | 1,186,100 | $ | 1,187,600 | $ | 1,185,850 | |||||||||
Industrial | 86,550 | 54,850 | 81,050 | 81,750 | 80,850 | ||||||||||||||
Retail | 1,006,500 | 1,007,600 | 1,013,300 | 1,012,850 | 1,020,750 | ||||||||||||||
Real properties | 2,283,100 | 2,250,000 | 2,280,450 | 2,282,200 | 2,287,450 | ||||||||||||||
Cash and other assets, net of other liabilities | 5,916 | (508 | ) | 1,233 | 5,158 | 5,231 | |||||||||||||
Debt obligations | (1,159,579 | ) | (1,111,852 | ) | (1,095,063 | ) | (1,054,470 | ) | (1,056,070 | ) | |||||||||
Outside investors' interests | — | — | (2,599 | ) | (3,588 | ) | (3,626 | ) | |||||||||||
Aggregate Fund NAV | $ | 1,129,437 | $ | 1,137,640 | $ | 1,184,021 | $ | 1,229,300 | $ | 1,232,985 | |||||||||
Total Fund Interests outstanding | 151,550 | 151,738 | 157,409 | 162,396 | 164,930 | ||||||||||||||
NAV per Fund Interest | $ | 7.45 | $ | 7.50 | $ | 7.52 | $ | 7.57 | $ | 7.48 | |||||||||
Page | 5
NET ASSET VALUE (continued) |
The following table sets forth the quarterly changes to the components of NAV for the Portfolio, for each of the most recent four quarters and for the nine and twelve month period ended September 30, 2017 (amounts in thousands, except per share information):
Three Months Ended | Nine Months Ended September 30, 2017 | ||||||||||||||||||||||
September 30, 2017 | June 30, 2017 | March 31, 2017 | December 31, 2016 | Previous Four Quarters | |||||||||||||||||||
NAV as of beginning of period | $ | 1,137,640 | $ | 1,184,021 | $ | 1,229,300 | $ | 1,232,985 | $ | 1,232,985 | $ | 1,229,300 | |||||||||||
Fund level changes to NAV | |||||||||||||||||||||||
Realized/unrealized (losses) gains on net assets | (6,035 | ) | (6,011 | ) | (9,067 | ) | 12,163 | (8,950 | ) | (21,113 | ) | ||||||||||||
Income accrual | 16,173 | 19,923 | 19,564 | 22,407 | 78,067 | 55,660 | |||||||||||||||||
Dividend accrual | (13,546 | ) | (14,020 | ) | (14,448 | ) | (14,901 | ) | (56,915 | ) | (42,014 | ) | |||||||||||
Advisory fee | (3,283 | ) | (3,431 | ) | (3,468 | ) | (3,624 | ) | (13,806 | ) | (10,182 | ) | |||||||||||
Performance-based fee | — | — | (1 | ) | (94 | ) | (95 | ) | (1 | ) | |||||||||||||
Class specific changes to NAV | |||||||||||||||||||||||
Dealer Manager fee | (79 | ) | (116 | ) | (112 | ) | (107 | ) | (414 | ) | (307 | ) | |||||||||||
Distribution fee | (28 | ) | (19 | ) | (19 | ) | (18 | ) | (84 | ) | (66 | ) | |||||||||||
NAV as of end of period before share/unit sale/redemption activity | $ | 1,130,842 | $ | 1,180,347 | $ | 1,221,749 | $ | 1,248,811 | $ | 1,230,788 | $ | 1,211,277 | |||||||||||
Dollar/unit sale/redemption activity | |||||||||||||||||||||||
Amount sold | 9,202 | 11,535 | 11,210 | 44,371 | 76,318 | 31,947 | |||||||||||||||||
Amount redeemed | (10,607 | ) | (54,242 | ) | (48,938 | ) | (63,882 | ) | (177,669 | ) | (113,787 | ) | |||||||||||
NAV as of end of period | $ | 1,129,437 | $ | 1,137,640 | $ | 1,184,021 | $ | 1,229,300 | $ | 1,129,437 | $ | 1,129,437 | |||||||||||
Shares outstanding beginning of period | 151,738 | 157,409 | 162,396 | 164,930 | 164,930 | 162,396 | |||||||||||||||||
Shares/units sold | 1,229 | 1,535 | 1,484 | 5,925 | 10,173 | 4,248 | |||||||||||||||||
Shares/units redeemed | (1,417 | ) | (7,206 | ) | (6,471 | ) | (8,459 | ) | (23,553 | ) | (15,094 | ) | |||||||||||
Shares outstanding end of period | 151,550 | 151,738 | 157,409 | 162,396 | 151,550 | 151,550 | |||||||||||||||||
NAV per share as of beginning of period | $ | 7.50 | $ | 7.52 | $ | 7.57 | $ | 7.48 | $ | 7.48 | $ | 7.57 | |||||||||||
Change in NAV per share | (0.05 | ) | (0.02 | ) | (0.05 | ) | 0.09 | (0.03 | ) | (0.12 | ) | ||||||||||||
NAV per share as of end of period | $ | 7.45 | $ | 7.50 | $ | 7.52 | $ | 7.57 | $ | 7.45 | $ | 7.45 | |||||||||||
Page | 6
PORTFOLIO PROFILE |
As of September 30, 2017, our real property investments were geographically diversified across 20 markets throughout the United States. The following table presents information about the fair value of our real property portfolio as of September 30, 2017 and about the operating results for the three and trailing twelve months ended September 30, 2017 (dollar and square footage amount in thousands).
Office | Industrial | Retail | Total | |||||||||||||
As of September 30, 2017: | ||||||||||||||||
Number of investments | 16 | 4 | 33 | 53 | ||||||||||||
Square footage | 3,429 | 1,389 | 3,751 | 8,569 | ||||||||||||
Percentage leased at period end | 83.3 | % | 88.3 | % | 95.7 | % | 89.5 | % | ||||||||
Fair value (1) | $ | 1,190,050 | $ | 86,550 | $ | 1,006,500 | $ | 2,283,100 | ||||||||
% of total Fair Value | 52.1 | % | 3.8 | % | 44.1 | % | 100.0 | % | ||||||||
For the three months ended September 30, 2017: | ||||||||||||||||
Rental revenue | $ | 27,099 | $ | 1,538 | $ | 20,841 | $ | 49,478 | ||||||||
NOI (2) | 15,730 | 1,194 | 15,038 | 31,962 | ||||||||||||
% of total NOI | 49.3 | % | 3.7 | % | 47.0 | % | 100.0 | % | ||||||||
NOI - cash basis (3) | $ | 15,956 | $ | 1,177 | $ | 14,232 | $ | 31,365 | ||||||||
For the trailing twelve months ended September 30, 2017: | ||||||||||||||||
Rental revenue | $ | 114,910 | $ | 5,817 | $ | 85,018 | $ | 205,745 | ||||||||
NOI (2) | 69,767 | 4,150 | 63,108 | 137,025 | ||||||||||||
% of total NOI | 50.9 | % | 3.0 | % | 46.1 | % | 100.0 | % | ||||||||
NOI - cash basis (3) | $ | 72,237 | $ | 4,178 | $ | 59,782 | $ | 136,197 | ||||||||
(1) | As determined in accordance with our Valuation Procedures, filed as Exhibit 4.6 to our Post-Effective Amendment No. 10. See a discussion of some of the differences between the definition of "fair value" of our real estate assets as used in our Valuation Procedures and in this document versus GAAP values in the section titled "Definitions" beginning on page 25. For a description of key assumptions used in calculating the value of our real properties as of September 30, 2017, please refer to “Management’s Discussion and Analysis of Financial Condition and Results of Operations” in Part I, Item 2 of our Q3 2017 Quarterly Report on Form 10-Q. |
(2) | NOI is a non-GAAP measure. For a reconciliation of NOI to GAAP net income, see the section titled "Results From Operations" beginning on page 12. |
(3) | NOI - cash basis is a non-GAAP measure. For a reconciliation of NOI - Cash Basis to NOI and to GAAP net income, see the section titled "Results From Operations" beginning on page 12. |
Page | 7
BALANCE SHEETS |
The following table presents our consolidated balance sheets, as adjusted, as of the end of each of the five quarters ended September 30, 2017 (dollar amounts in thousands):
As of | ||||||||||||||||||||
September 30, 2017 | June 30, 2017 | March 31, 2017 | December 31, 2016 | September 30, 2016 | ||||||||||||||||
ASSETS | ||||||||||||||||||||
Investments in real property | $ | 2,221,700 | $ | 2,178,358 | $ | 2,207,409 | $ | 2,204,322 | $ | 2,201,127 | ||||||||||
Accumulated depreciation and amortization | (529,846 | ) | (515,840 | ) | (511,532 | ) | (492,911 | ) | (473,211 | ) | ||||||||||
Total net investments in real property | 1,691,854 | 1,662,518 | 1,695,877 | 1,711,411 | 1,727,916 | |||||||||||||||
Debt-related investments, net | 11,259 | 14,941 | 15,076 | 15,209 | 15,340 | |||||||||||||||
Total net investments | 1,703,113 | 1,677,459 | 1,710,953 | 1,726,620 | 1,743,256 | |||||||||||||||
Cash and cash equivalents | 5,841 | 5,362 | 10,894 | 13,864 | 34,403 | |||||||||||||||
Restricted cash | 8,268 | 7,160 | 8,765 | 7,282 | 7,836 | |||||||||||||||
Other assets, net | 40,549 | 35,297 | 36,947 | 35,962 | 36,166 | |||||||||||||||
Total Assets | $ | 1,757,771 | $ | 1,725,278 | $ | 1,767,559 | $ | 1,783,728 | $ | 1,821,661 | ||||||||||
LIABILITIES AND EQUITY | ||||||||||||||||||||
Liabilities: | ||||||||||||||||||||
Mortgage notes | $ | 477,946 | $ | 380,934 | $ | 357,565 | $ | 342,247 | $ | 386,861 | ||||||||||
Unsecured borrowings | 673,555 | 724,218 | 730,880 | 706,554 | 663,849 | |||||||||||||||
Intangible lease liabilities, net | 55,856 | 56,637 | 58,119 | 59,545 | 61,357 | |||||||||||||||
Other liabilities | 58,917 | 57,812 | 62,635 | 67,291 | 81,968 | |||||||||||||||
Total Liabilities | 1,266,274 | 1,219,601 | 1,209,199 | 1,175,637 | 1,194,035 | |||||||||||||||
Equity: | ||||||||||||||||||||
Stockholders' equity: | ||||||||||||||||||||
Common stock | 1,399 | 1,399 | 1,458 | 1,506 | 1,531 | |||||||||||||||
Additional paid-in capital | 1,282,495 | 1,280,621 | 1,324,200 | 1,361,638 | 1,383,191 | |||||||||||||||
Distributions in excess of earnings | (872,249 | ) | (857,792 | ) | (851,636 | ) | (839,896 | ) | (829,162 | ) | ||||||||||
Accumulated other comprehensive loss | (4,618 | ) | (5,550 | ) | (4,926 | ) | (6,905 | ) | (20,166 | ) | ||||||||||
Total stockholders' equity | 407,027 | 418,678 | 469,096 | 516,343 | 535,394 | |||||||||||||||
Noncontrolling interests | 84,470 | 86,999 | 89,264 | 91,748 | 92,232 | |||||||||||||||
Total Equity | 491,497 | 505,677 | 558,360 | 608,091 | 627,626 | |||||||||||||||
Total Liabilities and Equity | $ | 1,757,771 | $ | 1,725,278 | $ | 1,767,559 | $ | 1,783,728 | $ | 1,821,661 | ||||||||||
Page | 8
STATEMENTS OF INCOME |
The following table presents our condensed consolidated statements of income, as adjusted, for each of the five quarters ended September 30, 2017, and for the the nine months ended September 30, 2017 and 2016 (amounts in thousands, except per share data):
Three Months Ended | Nine Months Ended | |||||||||||||||||||||||||||
September 30, 2017 | June 30, 2017 | March 31, 2017 | December 31, 2016 | September 30, 2016 | September 30, 2017 | September 30, 2016 | ||||||||||||||||||||||
REVENUE: | ||||||||||||||||||||||||||||
Rental revenue | $ | 49,478 | $ | 50,036 | $ | 52,508 | $ | 53,723 | $ | 53,258 | $ | 152,022 | $ | 161,504 | ||||||||||||||
Debt-related income | 194 | 229 | 231 | 233 | 235 | 654 | 710 | |||||||||||||||||||||
Total Revenue | 49,672 | 50,265 | 52,739 | 53,956 | 53,493 | 152,676 | 162,214 | |||||||||||||||||||||
EXPENSES: | ||||||||||||||||||||||||||||
Rental expense | 17,516 | 16,561 | 17,443 | 17,200 | 16,437 | 51,520 | 48,388 | |||||||||||||||||||||
Real estate depreciation and amortization expense | 16,927 | 18,798 | 17,936 | 20,083 | 19,989 | 53,661 | 60,022 | |||||||||||||||||||||
General and administrative expenses | 2,760 | 2,024 | 2,250 | 2,257 | 2,234 | 7,034 | 7,192 | |||||||||||||||||||||
Advisory fees, related party | 3,274 | 3,451 | 3,490 | 3,740 | 3,681 | 10,215 | 11,118 | |||||||||||||||||||||
Acquisition-related expenses | — | — | — | 6 | 136 | — | 661 | |||||||||||||||||||||
Impairment of real estate property | — | 1,116 | — | — | 2,090 | 1,116 | 2,677 | |||||||||||||||||||||
Total Operating Expenses | 40,477 | 41,950 | 41,119 | 43,286 | 44,567 | 123,546 | 130,058 | |||||||||||||||||||||
OTHER (EXPENSES) INCOME: | ||||||||||||||||||||||||||||
Other (expense) and income | (664 | ) | (89 | ) | (109 | ) | (90 | ) | 2,308 | (862 | ) | 2,297 | ||||||||||||||||
Interest expense | (11,346 | ) | (10,163 | ) | (9,684 | ) | (9,388 | ) | (10,011 | ) | (31,193 | ) | (31,394 | ) | ||||||||||||||
Gain on extinguishment of debt and financing commitments | — | — | — | — | — | — | 5,136 | |||||||||||||||||||||
Gain on sale of real property | 670 | 10,352 | — | 2,165 | 2,095 | 11,022 | 43,495 | |||||||||||||||||||||
Net (loss) income | (2,145 | ) | 8,415 | 1,827 | 3,357 | 3,318 | 8,097 | 51,690 | ||||||||||||||||||||
Net loss (income) attributable to noncontrolling interests | 185 | (1,610 | ) | (166 | ) | (245 | ) | (353 | ) | (1,591 | ) | (4,826 | ) | |||||||||||||||
NET (LOSS) INCOME ATTRIBUTABLE TO COMMON STOCKHOLDERS | $ | (1,960 | ) | $ | 6,805 | $ | 1,661 | $ | 3,112 | $ | 2,965 | $ | 6,506 | $ | 46,864 | |||||||||||||
NET (LOSS) INCOME PER BASIC AND DILUTED COMMON SHARE | $ | (0.01 | ) | $ | 0.05 | $ | 0.01 | $ | 0.02 | $ | 0.02 | $ | 0.04 | $ | 0.29 | |||||||||||||
WEIGHTED AVERAGE NUMBER OF COMMON SHARES OUTSTANDING | ||||||||||||||||||||||||||||
Basic | 139,925 | 145,288 | 149,891 | 154,807 | 158,688 | 144,998 | 161,274 | |||||||||||||||||||||
Diluted | 151,739 | 157,209 | 161,919 | 166,942 | 170,952 | 156,918 | 173,760 | |||||||||||||||||||||
Weighted average distributions declared per common share | $ | 0.0892 | $ | 0.0891 | $ | 0.0891 | $ | 0.0892 | $ | 0.0892 | $ | 0.2674 | $ | 0.2677 | ||||||||||||||
Page | 9
FUNDS FROM OPERATIONS |
NAREIT-Defined Funds From Operations (“FFO”) is a non-GAAP measure. The following tables present a reconciliation of FFO to GAAP net (loss) income attributable to common stockholders for each of the five quarters ended September 30, 2017, and for the nine months ended September 30, 2017 and 2016 (amounts in thousands except for per share amounts and percentages):
Three Months Ended | Nine Months Ended | |||||||||||||||||||||||||||
September 30, 2017 | June 30, 2017 | March 31, 2017 | December 31, 2016 | September 30, 2016 | September 30, 2017 | September 30, 2016 | ||||||||||||||||||||||
Reconciliation of net earnings to FFO: | ||||||||||||||||||||||||||||
Net (loss) income attributable to common stockholders | $ | (1,960 | ) | $ | 6,805 | $ | 1,661 | $ | 3,112 | $ | 2,965 | $ | 6,506 | $ | 46,864 | |||||||||||||
Add (deduct) NAREIT-defined adjustments: | ||||||||||||||||||||||||||||
Depreciation and amortization expense | 16,927 | 18,798 | 17,936 | 20,083 | 19,989 | 53,661 | 60,022 | |||||||||||||||||||||
Gain on sale of real property | (670 | ) | (10,352 | ) | — | (2,165 | ) | (2,095 | ) | (11,022 | ) | (43,495 | ) | |||||||||||||||
Impairment of real estate property | — | 1,116 | — | — | 2,090 | 1,116 | 2,677 | |||||||||||||||||||||
Noncontrolling interests' share of adjustments | (1,266 | ) | 200 | (1,361 | ) | (1,331 | ) | (1,366 | ) | (2,427 | ) | (1,472 | ) | |||||||||||||||
FFO attributable to common shares-basic | 13,031 | 16,567 | 18,236 | 19,699 | 21,583 | 47,834 | 64,596 | |||||||||||||||||||||
FFO attributable to dilutive OP units | 1,100 | 1,360 | 1,463 | 1,544 | 1,668 | 3,923 | 5,002 | |||||||||||||||||||||
FFO attributable to common shares-diluted | $ | 14,131 | $ | 17,927 | $ | 19,699 | $ | 21,243 | $ | 23,251 | $ | 51,757 | $ | 69,598 | ||||||||||||||
FFO per share-basic and diluted | $ | 0.09 | $ | 0.11 | $ | 0.12 | $ | 0.13 | $ | 0.14 | $ | 0.33 | $ | 0.40 | ||||||||||||||
FFO payout ratio | 96 | % | 78 | % | 73 | % | 70 | % | 66 | % | 81 | % | 67 | % | ||||||||||||||
Weighted average number of shares outstanding | ||||||||||||||||||||||||||||
Basic | 139,925 | 145,288 | 149,891 | 154,807 | 158,688 | 144,998 | 161,274 | |||||||||||||||||||||
Diluted | 151,739 | 157,209 | 161,919 | 166,942 | 170,952 | 156,918 | 173,760 | |||||||||||||||||||||
Page | 10
FUNDS FROM OPERATIONS (continued) |
The following table presents certain other supplemental information for each of the five quarters ended September 30, 2017, and for the nine months ended September 30, 2017 and 2016 (amounts in thousands):
Three Months Ended | Nine Months Ended | |||||||||||||||||||||||||||
September 30, 2017 | June 30, 2017 | March 31, 2017 | December 31, 2016 | September 30, 2016 | September 30, 2017 | September 30, 2016 | ||||||||||||||||||||||
Other Supplemental Information | ||||||||||||||||||||||||||||
Capital expenditures summary: | ||||||||||||||||||||||||||||
Recurring capital expenditures (1) | $ | 10,862 | $ | 5,952 | $ | 2,801 | $ | 8,039 | $ | 4,165 | $ | 19,615 | $ | 18,657 | ||||||||||||||
Non-recurring capital expenditures | 1,104 | 586 | 469 | 1,078 | 748 | 2,159 | 2,430 | |||||||||||||||||||||
Total capital expenditures | 11,966 | 6,538 | 3,270 | 9,117 | 4,913 | 21,774 | 21,087 | |||||||||||||||||||||
Other non-cash adjustments: | ||||||||||||||||||||||||||||
Straight-line rent decrease to rental revenue | 109 | 238 | 117 | 522 | 296 | 464 | 742 | |||||||||||||||||||||
Amortization of above- and below- market rent (increase) decrease to rental revenue | (714 | ) | (710 | ) | (559 | ) | 143 | (127 | ) | (1,983 | ) | (678 | ) | |||||||||||||||
Amortization of loan costs and hedges - increase to interest expense | 1,372 | 1,074 | 1,032 | 873 | 909 | 3,478 | 2,877 | |||||||||||||||||||||
Amortization of mark-to-market adjustments on borrowings - decrease to interest expense | (34 | ) | (33 | ) | (33 | ) | (33 | ) | (32 | ) | (100 | ) | (645 | ) | ||||||||||||||
Total other non-cash adjustments | $ | 733 | $ | 569 | $ | 557 | $ | 1,505 | $ | 1,046 | $ | 1,859 | $ | 2,296 | ||||||||||||||
(1) | Recurring capital expenditures include lease incentives. Unlike other capital expenditures, we record lease incentives as other assets in our balance sheet and we classify payments for lease incentives as cash used in operating activities in our statement of cash flows. |
Page | 11
RESULTS FROM OPERATIONS |
Net operating income (“NOI”) and NOI - cash basis are non-GAAP measures. See page 13 for a reconciliation of GAAP net (loss) income attributable to common stockholders to NOI and NOI - cash basis. The following tables present revenue and NOI of our three operating segments for each of the five quarters ending September 30, 2017, and for the nine months ended September 30, 2017 and 2016. Our same store portfolio includes all operating properties owned for the entirety of all periods presented and totals 50 properties, comprising approximately 8.1 million square feet or 95.0% of our total portfolio when measured by square feet (amounts in thousands):
Three Months Ended | Nine Months Ended | |||||||||||||||||||||||||||
September 30, 2017 | June 30, 2017 | March 31, 2017 | December 31, 2016 | September 30, 2016 | September 30, 2017 | September 30, 2016 | ||||||||||||||||||||||
Revenue: | ||||||||||||||||||||||||||||
Same store real property: | ||||||||||||||||||||||||||||
Office (1) | $ | 27,100 | $ | 27,624 | $ | 29,439 | $ | 30,743 | $ | 31,207 | $ | 84,163 | $ | 92,970 | ||||||||||||||
Industrial | 960 | 876 | 1,026 | 955 | 967 | 2,862 | 2,994 | |||||||||||||||||||||
Retail | 19,352 | 19,666 | 19,989 | 20,331 | 19,402 | 59,007 | 58,323 | |||||||||||||||||||||
Total same store real property revenue | 47,412 | 48,166 | 50,454 | 52,029 | 51,576 | 146,032 | 154,287 | |||||||||||||||||||||
2016/2017 Acquisitions/Dispositions | 2,066 | 1,870 | 2,054 | 1,694 | 1,682 | 5,990 | 7,217 | |||||||||||||||||||||
Total | $ | 49,478 | $ | 50,036 | $ | 52,508 | $ | 53,723 | $ | 53,258 | $ | 152,022 | $ | 161,504 | ||||||||||||||
NOI: | ||||||||||||||||||||||||||||
Same store real property: | ||||||||||||||||||||||||||||
Office (1) | $ | 15,669 | $ | 16,221 | $ | 18,307 | $ | 19,591 | $ | 20,665 | $ | 50,197 | $ | 62,497 | ||||||||||||||
Industrial | 736 | 686 | 677 | 805 | 706 | 2,099 | 2,315 | |||||||||||||||||||||
Retail | 14,121 | 15,278 | 14,854 | 15,180 | 14,263 | 44,253 | 43,285 | |||||||||||||||||||||
Total same store real property NOI | 30,526 | 32,185 | 33,838 | 35,576 | 35,634 | 96,549 | 108,097 | |||||||||||||||||||||
2016/2017 Acquisitions/Dispositions | 1,436 | 1,290 | 1,227 | 947 | 1,187 | 3,953 | 5,019 | |||||||||||||||||||||
Total | $ | 31,962 | $ | 33,475 | $ | 35,065 | $ | 36,523 | $ | 36,821 | $ | 100,502 | $ | 113,116 | ||||||||||||||
NOI - cash basis: | ||||||||||||||||||||||||||||
Same store real property: | ||||||||||||||||||||||||||||
Office (1) | $ | 15,894 | $ | 16,581 | $ | 18,681 | $ | 21,102 | $ | 21,711 | $ | 51,156 | $ | 65,052 | ||||||||||||||
Industrial | 768 | 710 | 700 | 822 | 715 | 2,178 | 2,326 | |||||||||||||||||||||
Retail | 13,386 | 14,518 | 14,123 | 14,385 | 13,404 | 42,027 | 40,715 | |||||||||||||||||||||
Total same store real property NOI - cash basis | 30,048 | 31,809 | 33,504 | 36,309 | 35,830 | 95,361 | 108,093 | |||||||||||||||||||||
2016/2017 Acquisitions/Dispositions | 1,317 | 1,200 | 1,124 | 886 | 1,165 | 3,641 | 5,102 | |||||||||||||||||||||
Total | $ | 31,365 | $ | 33,009 | $ | 34,628 | $ | 37,195 | $ | 36,995 | $ | 99,002 | $ | 113,195 | ||||||||||||||
(1) | In January 2017, our lease with Sybase Inc. ("Sybase"), our second largest tenant based on annualized base rent as of December 31, 2016, was terminated which had an adverse impact on our results from operations for three and nine months ended September 30, 2017. Sybase had leased our entire 405,000 square foot office property in East Bay, CA ("Park Place") and, as of September 30, 2017, we have leased 17.5% of Park Place to a replacement tenant; however the lease does not commence until the first half of 2018. Please see the table below for revenue, NOI and NOI - cash basis for our same store office portfolio excluding Park Place for each of the five quarters ending September 30, 2017, and for the nine months ended September 30, 2017 and 2016. |
Three Months Ended | Nine Months Ended | |||||||||||||||||||||||||||
September 30, 2017 | June 30, 2017 | March 31, 2017 | December 31, 2016 | September 30, 2016 | September 30, 2017 | September 30, 2016 | ||||||||||||||||||||||
Same store office portfolio excluding Sybase: | ||||||||||||||||||||||||||||
Revenue | $ | 27,069 | $ | 27,750 | $ | 27,879 | $ | 27,416 | $ | 27,678 | $ | 82,698 | $ | 82,378 | ||||||||||||||
NOI | 16,461 | 17,067 | 17,357 | 16,525 | 17,154 | 50,885 | 51,988 | |||||||||||||||||||||
NOI - cash basis | 16,687 | 17,427 | 17,352 | 16,689 | 17,055 | 51,466 | 51,117 | |||||||||||||||||||||
Page | 12
RESULTS FROM OPERATIONS (continued) |
The following tables present a reconciliation of GAAP net (loss) income attributable to common stockholders to NOI and NOI - Cash Basis of our three operating segments for each of the five quarters ending September 30, 2017, and for the the nine months ended September 30, 2017 and 2016 (amounts in thousands):
Three Months Ended | Nine Months Ended | |||||||||||||||||||||||||||
September 30, 2017 | June 30, 2017 | March 31, 2017 | December 31, 2016 | September 30, 2016 | September 30, 2017 | September 30, 2016 | ||||||||||||||||||||||
Net (loss) income attributable to common stockholders | $ | (1,960 | ) | $ | 6,805 | $ | 1,661 | $ | 3,112 | $ | 2,965 | $ | 6,506 | $ | 46,864 | |||||||||||||
Debt-related income | (194 | ) | (229 | ) | (231 | ) | (233 | ) | (235 | ) | (654 | ) | (710 | ) | ||||||||||||||
Real estate depreciation and amortization expense | 16,927 | 18,798 | 17,936 | 20,083 | 19,989 | 53,661 | 60,022 | |||||||||||||||||||||
General and administrative expenses | 2,760 | 2,024 | 2,250 | 2,257 | 2,234 | 7,034 | 7,192 | |||||||||||||||||||||
Advisory fees, related party | 3,274 | 3,451 | 3,490 | 3,740 | 3,681 | 10,215 | 11,118 | |||||||||||||||||||||
Acquisition-related expenses | — | — | — | 6 | 136 | — | 661 | |||||||||||||||||||||
Impairment of real estate property | — | 1,116 | — | — | 2,090 | 1,116 | 2,677 | |||||||||||||||||||||
Other expense and (income) | 664 | 89 | 109 | 90 | (2,308 | ) | 862 | (2,297 | ) | |||||||||||||||||||
Interest expense | 11,346 | 10,163 | 9,684 | 9,388 | 10,011 | 31,193 | 31,394 | |||||||||||||||||||||
Gain on extinguishment of debt and financing commitments | — | — | — | — | — | — | (5,136 | ) | ||||||||||||||||||||
Gain on sale of real property | (670 | ) | (10,352 | ) | — | (2,165 | ) | (2,095 | ) | (11,022 | ) | (43,495 | ) | |||||||||||||||
Net (loss) income attributable to noncontrolling interests | (185 | ) | 1,610 | 166 | 245 | 353 | 1,591 | 4,826 | ||||||||||||||||||||
NOI | $ | 31,962 | $ | 33,475 | $ | 35,065 | $ | 36,523 | $ | 36,821 | $ | 100,502 | $ | 113,116 | ||||||||||||||
Net amortization of above- and below-market lease assets and liabilities, and other non-cash adjustments to rental revenue | (706 | ) | (704 | ) | (554 | ) | 150 | (122 | ) | (1,964 | ) | (663 | ) | |||||||||||||||
Straight line rent | 109 | 238 | 117 | 522 | 296 | 464 | 742 | |||||||||||||||||||||
NOI - cash basis | $ | 31,365 | $ | 33,009 | $ | 34,628 | $ | 37,195 | $ | 36,995 | $ | 99,002 | $ | 113,195 | ||||||||||||||
The following tables present details regarding our capital expenditures for each of the five quarters ending September 30, 2017, and for the nine months ended September 30, 2017 and 2016 (amounts in thousands):
Three Months Ended | Nine Months Ended | |||||||||||||||||||||||||||
September 30, 2017 | June 30, 2017 | March 31, 2017 | December 31, 2016 | September 30, 2016 | September 30, 2017 | September 30, 2016 | ||||||||||||||||||||||
Recurring capital expenditures: | ||||||||||||||||||||||||||||
Land and building improvements | $ | 4,003 | $ | 3,276 | $ | 1,108 | $ | 5,740 | $ | 1,949 | $ | 8,387 | $ | 4,972 | ||||||||||||||
Tenant improvements | 4,610 | 1,438 | 1,046 | 1,267 | 1,680 | 7,094 | 7,239 | |||||||||||||||||||||
Leasing costs (1) | 2,249 | 1,238 | 647 | 1,032 | 536 | 4,134 | 6,446 | |||||||||||||||||||||
Total recurring capital expenditures | $ | 10,862 | $ | 5,952 | $ | 2,801 | $ | 8,039 | $ | 4,165 | $ | 19,615 | $ | 18,657 | ||||||||||||||
Non-recurring capital expenditures: | ||||||||||||||||||||||||||||
Land and building improvements | $ | 384 | $ | 266 | $ | 292 | $ | 782 | $ | 553 | $ | 942 | $ | 1,231 | ||||||||||||||
Tenant improvements | 646 | 64 | 93 | 165 | 111 | 803 | 896 | |||||||||||||||||||||
Leasing costs | 74 | 256 | 84 | 131 | 84 | 414 | 303 | |||||||||||||||||||||
Total non-recurring capital expenditures | $ | 1,104 | $ | 586 | $ | 469 | $ | 1,078 | $ | 748 | $ | 2,159 | $ | 2,430 | ||||||||||||||
(1) | Recurring leasing costs include lease incentives. Unlike other capital expenditures, we record lease incentives as other assets in our balance sheet and we classify payments for lease incentives as cash used in operating activities in our statement of cash flows. |
Page | 13
FINANCE & CAPITAL |
The following table describes certain information about our capital structure. Amounts reported as financing capital represent the total principal outstanding under our total borrowings. Amounts reported as equity capital are presented based on the NAV as of September 30, 2017 (shares and dollar amounts other than price per share / unit in thousands).
FINANCING: | As of September 30, 2017 | ||||||||
Mortgage notes | $ | 482,034 | |||||||
Unsecured line of credit | 202,000 | ||||||||
Unsecured term loans | 475,000 | ||||||||
Total Financing (1) | $ | 1,159,034 | |||||||
EQUITY: | Shares / Units | Percentage of Aggregate Shares and Units Outstanding | NAV Per Share / Unit | Value | |||||||||
Class E Common Stock (2) | 101,153 | 66.7 | % | $ | 7.45 | $ | 753,847 | ||||||
Class T Common Stock (3) | 2,092 | 1.4 | % | 7.45 | 15,593 | ||||||||
Class S Common Stock (3) | 17 | — | % | 7.45 | 125 | ||||||||
Class D Common Stock (3) | 2,508 | 1.7 | % | 7.45 | 18,693 | ||||||||
Class I Common Stock (4) | 34,114 | 22.5 | % | 7.45 | 254,240 | ||||||||
Class E OP Units | 11,666 | 7.7 | % | 7.45 | 86,939 | ||||||||
Total/Weighted Average | 151,550 | 100.0 | % | $ | 7.45 | $ | 1,129,437 | ||||||
TOTAL CAPITALIZATION | $ | 2,288,471 | |||||||||||
(1) | For a reconciliation of the total outstanding principal balance under our total borrowings to total borrowings on a GAAP basis see page 15. |
(2) | As part of the Restructuring, we changed our outstanding unclassified shares of common stock (which, since 2012, we have referred to as “Class E” shares ) to a new formally designated class of Class E shares. Please refer to “Management’s Discussion and Analysis of Financial Condition and Results of Operations” in Part I, Item 2 of our Q3 2017 Quarterly Report on Form 10-Q for further discussion of changes in share classes. |
(3) | As part of the Restructuring, we changed our outstanding Class A, Class W and Class I shares of common stock to Class T, Class D and a new version of Class I shares of common stock, respectively, and created a new class of common stock called Class S shares. Please refer to “Management’s Discussion and Analysis of Financial Condition and Results of Operations” in Part I, Item 2 of our Q3 2017 Quarterly Report on Form 10-Q for further discussion of changes in share classes. |
(4) | Amounts reported do not include approximately 66,000 restricted stock units granted to the Advisor that remain unvested as of September 30, 2017. |
Page | 14
FINANCE & CAPITAL (continued) |
The following table presents a summary of our borrowings as of September 30, 2017 (dollar amounts in thousands):
| Outstanding Principal Balance | Weighted Average Stated Interest Rate | Fair Value of Real Properties Securing Borrowings (1) | ||||||
Fixed-rate mortgages (2) | $ | 128,934 | 3.9% | $ | 251,900 | ||||
Floating-rate mortgages (3) | 353,100 | 3.5% | 667,050 | ||||||
Total secured borrowings | 482,034 | 3.6% | 918,950 | ||||||
Line of credit | 202,000 | 2.9% | N/A | ||||||
Term loans (4) | 475,000 | 3.5% | N/A | ||||||
Total unsecured borrowings | 677,000 | 3.3% | N/A | ||||||
Total borrowings | $ | 1,159,034 | 3.4% | N/A | |||||
Less: net debt issuance costs | (8,059 | ) | |||||||
Add: mark-to-market adjustment on assumed debt | 526 | ||||||||
Total borrowings (GAAP basis) | $ | 1,151,501 | |||||||
(1) | Fair value of real properties was determined in accordance with our Valuation Procedures, filed as Exhibit 4.6 to our Post-Effective Amendment No. 10. See a discussion of some of the differences between the definition of "fair value" of our real estate assets as used in our Valuation Procedures and in this document versus GAAP values in the section titled "Definitions" beginning on page 25. For a description of key assumptions used in calculating the value of our real properties as of September 30, 2017, please refer to “Management’s Discussion and Analysis of Financial Condition and Results of Operations” in Part I, Item 2 of our Q3 2017 Quarterly Report on Form 10-Q. |
(2) | As of September 30, 2017, fixed-rate mortgages included one floating rate mortgage note subject to an interest rate spread of 1.60% over one-month LIBOR, which we have effectively fixed using an interest rate swap at 3.051% for the term of the borrowing. |
(3) | As of September 30, 2017, our floating rate mortgage notes were subject to a weighted average interest rate spread of 2.30% over one-month LIBOR. |
(4) | $350.0 million of our unsecured floating rate term loans are effectively fixed by the use of fixed-for-floating rate swap instruments as of September 30, 2017. The stated interest rate disclosed above includes the impact of these swaps. |
The following table presents a summary of our covenants and our actual results for each of the five quarters ended September 30, 2017, calculated in accordance with the terms of our credit facilities:
Covenant | September 30, 2017 | June 30, 2017 | March 31, 2017 | December 31, 2016 | September 30, 2016 | ||||||||||||
Leverage | < 60% | 53.9 | % | 52.3 | % | 50.8 | % | 47.5 | % | 46.5 | % | ||||||
Fixed Charge Coverage | > 1.50 | 2.4 | 3.0 | 3.3 | 3.3 | 3.0 | |||||||||||
Secured Indebtedness | < 55% | 22.4 | % | 18.1 | % | 16.7 | % | 15.5 | % | 17.0 | % | ||||||
Unencumbered Pool Covenants: | |||||||||||||||||
Leverage | < 60% | 52.7 | % | 51.2 | % | 50.7 | % | 45.5 | % | 41.4 | % | ||||||
Unsecured Interest Coverage | >2.0 | 3.2 | 4.2 | 5.2 | 6.8 | 7.8 | |||||||||||
Page | 15
FINANCE & CAPITAL (continued) |
The following table presents a detailed analysis of our borrowings outstanding as of September 30, 2017 (dollar amounts in thousands):
Borrowings | Principal Balance | Secured / Unsecured | Maturity Date | Extension Options | % of Total Borrowings | Fixed or Floating Interest Rate | Current Interest Rate | |||||||||||
Bank of America Term Loan (1) | $ | 275,000 | Unsecured | 1/31/2018 | 2 - 1 Year | 23.7 | % | Floating | 3.10 | % | ||||||||
Line of Credit | 202,000 | Unsecured | 1/31/2019 | 1 - 1 Year | 17.5 | % | Floating | 2.94 | % | |||||||||
Centerton Square (2) | 75,000 | Secured | 7/10/2019 | 2 - 1 Year | 6.5 | % | Floating | 3.48 | % | |||||||||
3 Second Street (3) | 127,000 | Secured | 1/10/2020 | 2 - 1 Year | 11.0 | % | Floating | 3.50 | % | |||||||||
655 Montgomery (4) | 98,600 | Secured | 9/7/2020 | 2 - 1 Year | 8.5 | % | Floating | 3.98 | % | |||||||||
Shenandoah | 10,280 | Secured | 9/1/2021 | None | 0.9 | % | Fixed | 4.84 | % | |||||||||
Wells Fargo Term Loan (1) | 200,000 | Unsecured | 2/27/2022 | None | 17.3 | % | Fixed | 3.94 | % | |||||||||
Norwell | 3,919 | Secured | 10/1/2022 | None | 0.3 | % | Fixed | 6.76 | % | |||||||||
Preston Sherry Plaza (5) | 33,000 | Secured | 3/1/2023 | None | 2.8 | % | Fixed | 3.05 | % | |||||||||
1300 Connecticut (6) | 52,500 | Secured | 8/5/2023 | None | 4.5 | % | Floating | 2.89 | % | |||||||||
270 Center | 70,000 | Secured | 12/1/2025 | None | 6.0 | % | Fixed | 3.80 | % | |||||||||
Harwich | 4,797 | Secured | 9/1/2028 | None | 0.4 | % | Fixed | 5.24 | % | |||||||||
New Bedford | 6,938 | Secured | 12/1/2029 | None | 0.6 | % | Fixed | 5.91 | % | |||||||||
Total borrowings | 1,159,034 | 100.0 | % | 3.44 | % | |||||||||||||
Add: mark-to-market adjustment on assumed debt | 526 | |||||||||||||||||
Less: net debt issuance costs | (8,059 | ) | ||||||||||||||||
Total Borrowings (GAAP basis) | $ | 1,151,501 | ||||||||||||||||
(1) | $350.0 million of our term loan and line of credit borrowings are effectively fixed by the use of fixed-for-floating rate swap instruments as of September 30, 2017. The stated interest rates disclosed above include the impact of these swaps. |
(2) | The Centerton Square term loan was subject to an interest rate spread of 2.25% over one-month LIBOR as of September 30, 2017. However, in conjunction with this borrowing, we entered into an interest rate protection agreement with a LIBOR strike rate of 3.00%. |
(3) | The 3 Second Street term loan was subject to an interest rate spread of 2.25% over one-month LIBOR as of September 30, 2017. However, in conjunction with this borrowing, we entered into an interest rate protection agreement with a LIBOR strike rate of 3.00%. |
(4) | The 655 Montgomery term loan was subject to an interest rate spread of 2.75% over one-month LIBOR as of September 30, 2017. However, in conjunction with this borrowing, we entered into an interest rate protection agreement with a LIBOR strike rate of 3.00%. |
(5) | The Preston Sherry Plaza term loan was subject to an interest rate spread of 1.60% over one-month LIBOR. However, we have effectively fixed the interest rate of the borrowing using an interest rate swap at 3.051% for the term of the borrowing as of September 30, 2017. |
(6) | As of September 30, 2017, the 1300 Connecticut term loan was subject to an interest rate spread of 1.65% over one-month LIBOR. However, we entered into an interest rate swap which will effectively fix the interest rate of the borrowing at 2.852% from July 1, 2018 to July 1, 2021. |
Page | 16
REAL PROPERTIES |
The following table describes our operating property portfolio as of September 30, 2017 (dollar and square feet amounts in thousands):
Market | Number of Properties | Gross Investment Amount | % of Gross Investment Amount | Net Rentable Square Feet | % of Total Net Rentable Square Feet | % Leased (1) | Secured Indebtedness (2) | |||||||||||||||
Office Properties: | ||||||||||||||||||||||
Metro New York (f/k/a Northern New Jersey) | 1 | $ | 231,803 | 10.5 | % | 594 | 6.9 | % | 100.0 | % | $ | 127,000 | ||||||||||
Austin, TX | 3 | 156,619 | 7.0 | % | 585 | 6.8 | % | 93.6 | % | — | ||||||||||||
East Bay, CA | 1 | 149,515 | 6.7 | % | 417 | 4.9 | % | 17.5 | % | — | ||||||||||||
San Francisco, CA | 1 | 122,327 | 5.5 | % | 263 | 3.1 | % | 83.3 | % | 98,600 | ||||||||||||
Denver, CO | 1 | 83,573 | 3.8 | % | 262 | 3.0 | % | 77.9 | % | — | ||||||||||||
South Florida | 2 | 83,086 | 3.7 | % | 376 | 4.4 | % | 84.8 | % | — | ||||||||||||
Washington, DC | 1 | 71,136 | 3.2 | % | 126 | 1.5 | % | 99.1 | % | 52,500 | ||||||||||||
Princeton, NJ | 1 | 51,331 | 2.3 | % | 167 | 1.9 | % | 100.0 | % | — | ||||||||||||
Philadelphia, PA | 1 | 47,319 | 2.1 | % | 173 | 2.0 | % | 89.2 | % | — | ||||||||||||
Silicon Valley, CA | 1 | 42,800 | 1.9 | % | 143 | 1.7 | % | 100.0 | % | — | ||||||||||||
Dallas, TX | 1 | 38,559 | 1.7 | % | 155 | 1.8 | % | 92.3 | % | 33,000 | ||||||||||||
Minneapolis/St Paul, MN | 1 | 29,528 | 1.3 | % | 107 | 1.3 | % | 100.0 | % | — | ||||||||||||
Fayetteville, AR | 1 | 12,084 | 0.5 | % | 61 | 0.7 | % | 100.0 | % | — | ||||||||||||
Total/Weighted Average Office: 13 markets with average annual rent of $30.58 per sq. ft. | 16 | 1,119,680 | 50.2 | % | 3,429 | 40.0 | % | 83.3 | % | 311,100 | ||||||||||||
Industrial Properties: | ||||||||||||||||||||||
Central Kentucky | 1 | 30,840 | 1.4 | % | 727 | 8.5 | % | 100.0 | % | — | ||||||||||||
Dallas, TX | 1 | 26,482 | 1.2 | % | 318 | 3.7 | % | 49.1 | % | — | ||||||||||||
Las Vegas, NV | 1 | 24,656 | 1.1 | % | 248 | 2.9 | % | 100.0 | % | — | ||||||||||||
East Bay, CA | 1 | 16,899 | 0.8 | % | 96 | 1.1 | % | 100.0 | % | — | ||||||||||||
Total/Weighted Average Industrial: four markets with average annual rent of $4.83 per sq. ft. | 4 | 98,877 | 4.5 | % | 1,389 | 16.2 | % | 88.3 | % | — | ||||||||||||
Retail Properties: | ||||||||||||||||||||||
Greater Boston | 24 | 536,495 | 24.2 | % | 2,183 | 25.5 | % | 94.8 | % | 15,654 | ||||||||||||
South Florida | 2 | 106,657 | 4.8 | % | 206 | 2.4 | % | 94.7 | % | 10,280 | ||||||||||||
Philadelphia, PA | 1 | 105,684 | 4.8 | % | 426 | 5.0 | % | 100.0 | % | 75,000 | ||||||||||||
Washington, DC | 1 | 62,867 | 2.8 | % | 233 | 2.7 | % | 100.0 | % | 70,000 | ||||||||||||
Metro New York (f/k/a Northern New Jersey) | 1 | 59,080 | 2.7 | % | 225 | 2.6 | % | 93.1 | % | — | ||||||||||||
Raleigh, NC | 1 | 45,765 | 2.1 | % | 143 | 1.6 | % | 100.0 | % | — | ||||||||||||
Tulsa, OK | 1 | 34,068 | 1.5 | % | 101 | 1.2 | % | 100.0 | % | — | ||||||||||||
San Antonio, TX | 1 | 32,517 | 1.5 | % | 161 | 1.9 | % | 89.6 | % | — | ||||||||||||
Jacksonville, FL | 1 | 20,010 | 0.9 | % | 73 | 0.9 | % | 93.6 | % | — | ||||||||||||
Total/Weighted Average Retail: nine markets with average annual rent of $17.66 per sq. ft. | 33 | 1,003,143 | 45.3 | % | 3,751 | 43.8 | % | 95.7 | % | 170,934 | ||||||||||||
Grand Total/Weighted Average | 53 | $ | 2,221,700 | 100.0 | % | 8,569 | 100.0 | % | 89.5 | % | $ | 482,034 | ||||||||||
(1) | Based on executed leases as of September 30, 2017. |
(2) | Secured indebtedness represents the principal balance outstanding and does not include our mark-to-market adjustment on debt or net debt issuance costs. |
Page | 17
LEASING ACTIVITY |
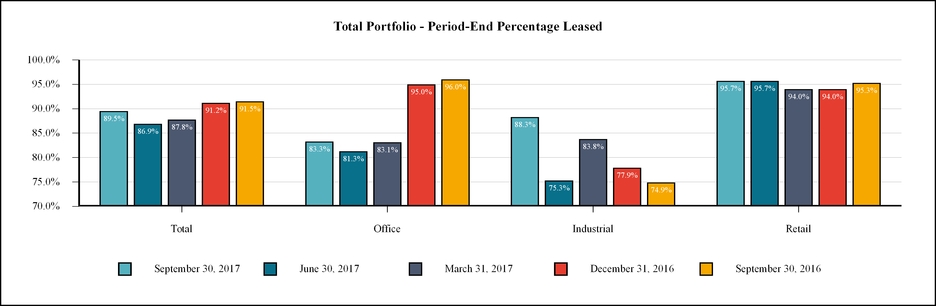
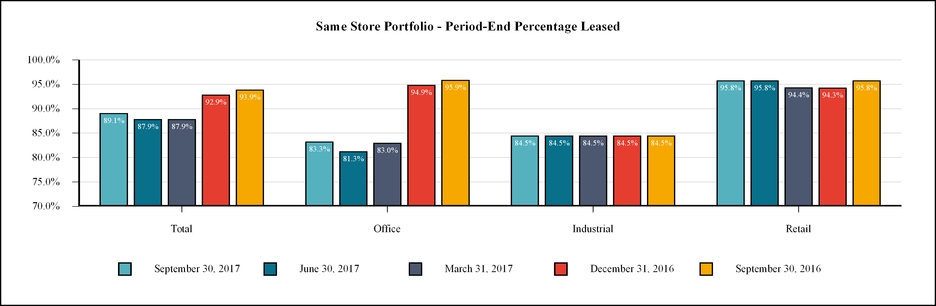
The following graphs highlight our total portfolio and same store portfolio percentage leased at the end of each of the five quarters ended September 30, 2017, by segment and in total:
Page | 18
LEASING ACTIVITY (continued) |
As of September 30, 2017, the weighted average remaining term of our leases was approximately 5.0 years, based on annualized base rent, and 5.1 years, based on leased square footage. The following table presents our lease expirations, by segment and in total, as of September 30, 2017 (dollars and square feet in thousands):
Total | Office | Industrial | Retail | |||||||||||||||||||||||||||||||||||||
Year | Number of Leases Expiring | Annualized Base Rent | % of Total Annualized Base Rent (1) | Square Feet | Number of Leases Expiring | Annualized Base Rent | Square Feet | Number of Leases Expiring | Annualized Base Rent | Square Feet | Number of Leases Expiring | Annualized Base Rent | Square Feet | |||||||||||||||||||||||||||
2017 (2) | 21 | $ | 9,276 | 5.9 | % | 253 | 9 | $ | 8,824 | 223 | — | $ | — | — | 12 | $ | 452 | 30 | ||||||||||||||||||||||
2018 | 95 | 8,590 | 5.5 | % | 361 | 50 | 5,516 | 215 | — | — | — | 45 | 3,074 | 146 | ||||||||||||||||||||||||||
2019 | 103 | 24,972 | 15.9 | % | 1,114 | 49 | 14,804 | 459 | 1 | 1,131 | 156 | 53 | 9,037 | 499 | ||||||||||||||||||||||||||
2020 | 125 | 24,743 | 15.8 | % | 1,115 | 50 | 10,834 | 418 | 1 | 95 | 13 | 74 | 13,814 | 684 | ||||||||||||||||||||||||||
2021 | 68 | 17,117 | 10.9 | % | 1,279 | 26 | 7,806 | 238 | 2 | 3,082 | 763 | 40 | 6,229 | 278 | ||||||||||||||||||||||||||
2022 | 63 | 13,154 | 8.4 | % | 715 | 21 | 5,543 | 202 | — | — | — | 42 | 7,611 | 513 | ||||||||||||||||||||||||||
2023 | 46 | 20,289 | 12.9 | % | 791 | 19 | 14,832 | 489 | — | — | — | 27 | 5,457 | 302 | ||||||||||||||||||||||||||
2024 | 27 | 5,432 | 3.5 | % | 336 | 7 | 2,180 | 100 | — | — | — | 20 | 3,252 | 236 | ||||||||||||||||||||||||||
2025 | 22 | 4,997 | 3.2 | % | 214 | 10 | 2,805 | 98 | 1 | 158 | 19 | 11 | 2,034 | 97 | ||||||||||||||||||||||||||
2026 | 18 | 3,442 | 2.2 | % | 210 | 6 | 1,193 | 31 | 1 | 206 | 28 | 11 | 2,043 | 151 | ||||||||||||||||||||||||||
Thereafter | 50 | 24,787 | 15.8 | % | 1,246 | 15 | 13,091 | 379 | 1 | 1,251 | 248 | 34 | 10,445 | 619 | ||||||||||||||||||||||||||
Total | 638 | $ | 156,799 | 100.0 | % | 7,634 | 262 | $ | 87,428 | 2,852 | 7 | $ | 5,923 | 1,227 | 369 | $ | 63,448 | 3,555 | ||||||||||||||||||||||
(1) | Includes three retail leases with combined annualized base rent of approximately $34,000 that are on a month-to-month basis. In January 2017, our lease with Sybase, our second largest tenant as of December 31, 2016 based upon annualized base rent, was terminated and is no longer included in the above table. |
Page | 19
LEASING ACTIVITY (continued) |
The following table presents our top 10 tenants by annualized base rent and their related industry sector, as of September 30, 2017 (dollars and square feet in thousands):
Tenant | Locations | Industry Sector (1) | Annualized Base Rent(2) | % of Total Annualized Base Rent | Square Feet | % of Occupied Square Feet | |||||||||||||
1 | Charles Schwab & Co, Inc (3) | 2 | Securities, Commodities, Fin. Inv./Rel. Activities | $ | 23,650 | 15.1 | % | 602 | 7.9 | % | |||||||||
2 | Stop & Shop | 13 | Food and Beverage Stores | 13,498 | 8.6 | % | 803 | 10.5 | % | ||||||||||
3 | Novo Nordisk | 1 | Chemical Manufacturing | 4,721 | 3.0 | % | 167 | 2.2 | % | ||||||||||
4 | Seton Health Care | 1 | Hospitals | 4,339 | 2.8 | % | 156 | 2.0 | % | ||||||||||
5 | Shaw's Supermarket | 4 | Food and Beverage Stores | 4,055 | 2.6 | % | 240 | 3.1 | % | ||||||||||
6 | Amazon.com | 2 | Non-Store Retailers | 3,618 | 2.3 | % | 975 | 12.8 | % | ||||||||||
7 | TJX Companies | 7 | Clothing and Clothing Accessories Stores | 3,312 | 2.1 | % | 319 | 4.2 | % | ||||||||||
8 | I.A.M. National Pension Fund | 1 | Funds, Trusts and Other Financial Vehicles | 3,207 | 2.0 | % | 63 | 0.8 | % | ||||||||||
9 | Trinet Group, Inc. | 1 | Professional, Scientific and Technical Services | 2,713 | 1.7 | % | 73 | 1.0 | % | ||||||||||
10 | WeWork LLC | 1 | Rental and Leasing Services | 2,536 | 1.6 | % | 53 | 0.7 | % | ||||||||||
Total | 33 | $ | 65,649 | 41.8 | % | 3,451 | 45.2 | % | |||||||||||
(1) | Industry sector based upon the North American Industry Classification System. |
(2) | Annualized base rent represents the annualized monthly base rent of executed leases as of September 30, 2017. |
(3) | The amount presented for Charles Schwab & Co, Inc. ("Schwab") reflects the total annualized base rent for our two leases in place with Schwab as of September 30, 2017. One of these leases, which expired on September 30, 2017, entailed the lease of all 594,000 square feet of our 3 Second Street office property and accounted for $23.5 million or 15.0% of our annualized base rent as of September 30, 2017. Schwab did not renew this lease. Schwab has subleased 100% of 3 Second Street to 25 sub-tenants through September 2017. We have executed leases directly with 15 of these subtenants that comprise 389,000 square feet or 65% of 3 Second Street that effectively extend their leases beyond the Schwab lease expiration. These direct leases will expire between September 2020 and September 2032. |
Page | 20
The top tenant in the table on the previous page comprises 15.1% of annualized base rent as of September 30, 2017. However, due to the expiration of the Schwab lease at 3 Second Street, Schwab is no longer in the top 25 tenants based on future minimum rental revenue. The following table presents our top 10 tenants by future minimum rental revenue and their related industry sector, as of September 30, 2017 (dollars and square feet in thousands):
Tenant | Locations | Industry Sector (1) | Future Minimum Rental Revenue | % of Total Future Minimum Rental Revenue | Square Feet | % of Total Portfolio Square Feet | |||||||||||||
1 | Mizuho Bank Ltd. | 1 | Credit Intermediation and Related Activities | $ | 66,433 | 8.2 | % | 116 | 1.5 | % | |||||||||
2 | Stop & Shop | 13 | Food and Beverage Stores | 64,379 | 7.9 | % | 803 | 10.5 | % | ||||||||||
3 | Shaw's Supermarket | 4 | Food and Beverage Stores | 41,269 | 5.1 | % | 240 | 3.1 | % | ||||||||||
4 | WeWork LLC | 1 | Rental and Leasing Services | 34,934 | 4.3 | % | 53 | 0.7 | % | ||||||||||
5 | Trinet Group, Inc. | 1 | Professional, Scientific and Technical Services | 31,872 | 3.9 | % | 73 | 1.0 | % | ||||||||||
6 | Novo Nordisk | 1 | Chemical Manufacturing | 28,213 | 3.5 | % | 167 | 2.2 | % | ||||||||||
7 | Amazon.com | 2 | Non-Store Retailers | 22,869 | 2.8 | % | 975 | 12.8 | % | ||||||||||
8 | TJX Companies | 7 | Clothing and Clothing Accessories Stores | 16,299 | 2.0 | % | 319 | 4.2 | % | ||||||||||
9 | Alliant Techsystems Inc | 1 | Fabricated Metal Product Manufacturing | 14,861 | 1.8 | % | 107 | 1.4 | % | ||||||||||
10 | CVS | 8 | Health and Personal Care Services | 14,662 | 1.8 | % | 86 | 1.1 | % | ||||||||||
Total | 39 | $ | 335,791 | 41.3 | % | 2,939 | 38.5 | % | |||||||||||
(1) | Industry sector based upon the North American Industry Classification System. |
Page | 21
LEASING ACTIVITY (continued) |
The following series of tables details leasing activity during the four quarters ended September 30, 2017:
Number of Leases Signed | Gross Leasable Area ("GLA") Signed | Weighted Average Rent Per Sq. Ft. | Weighted Average Growth / Straight Line Rent | Weighted Average Lease Term (mos) | Tenant Improvements & Incentives Per Sq. Ft. | Average Free Rent (mos) | ||||||||||||||
Office Comparable (1) | ||||||||||||||||||||
Q3 2017 | 14 | 129,151 | $ | 23.02 | 22.8 | % | 103 | $ | 28.09 | 4.1 | ||||||||||
Q2 2017 (2) | 15 | 95,858 | 47.49 | 110.5 | % | 136 | 111.25 | 4.7 | ||||||||||||
Q1 2017 | 8 | 24,088 | 23.53 | 40.8 | % | 52 | 23.84 | 3.3 | ||||||||||||
Q4 2016 | 14 | 52,455 | 29.81 | 45.0 | % | 72 | 23.17 | 1.4 | ||||||||||||
Total - twelve months (2) | 51 | 301,552 | $ | 35.35 | 67.7 | % | 115 | $ | 73.62 | 4.0 | ||||||||||
Industrial Comparable (1) | ||||||||||||||||||||
Q3 2017 | — | — | $ | — | — | % | — | $ | — | — | ||||||||||
Q2 2017 | — | — | — | — | % | — | — | — | ||||||||||||
Q1 2017 | 2 | 156,896 | 3.06 | 13.6 | % | 30 | 0.35 | 1.7 | ||||||||||||
Q4 2016 | — | — | — | — | % | — | — | — | ||||||||||||
Total - twelve months | 2 | 156,896 | $ | 3.06 | 13.6 | % | 30 | $ | 0.35 | 1.7 | ||||||||||
Retail Comparable (1) | ||||||||||||||||||||
Q3 2017 | 17 | 112,791 | $ | 30.81 | 19.3 | % | 72 | $ | 9.32 | — | ||||||||||
Q2 2017 | 15 | 72,487 | 25.91 | 12.7 | % | 133 | 29.96 | 0.1 | ||||||||||||
Q1 2017 | 16 | 92,674 | 19.13 | 13.5 | % | 96 | 0.85 | — | ||||||||||||
Q4 2016 | 14 | 87,871 | 20.48 | 15.8 | % | 56 | 0.73 | — | ||||||||||||
Total - twelve months | 62 | 365,823 | $ | 24.42 | 15.7 | % | 95 | $ | 12.30 | — | ||||||||||
Total Comparable Leasing (1) | ||||||||||||||||||||
Q3 2017 | 31 | 241,942 | $ | 26.64 | 18.5 | % | 91 | $ | 20.90 | 2.5 | ||||||||||
Q2 2017 (2) | 30 | 168,345 | 41.30 | 54.8 | % | 135 | 89.17 | 3.4 | ||||||||||||
Q1 2017 | 26 | 273,658 | 10.30 | 16.9 | % | 54 | 2.59 | 1.2 | ||||||||||||
Q4 2016 | 28 | 140,326 | 23.97 | 28.2 | % | 62 | 9.12 | 0.5 | ||||||||||||
Total - twelve months (2) | 115 | 824,271 | $ | 28.15 | 32.2 | % | 102 | $ | 48.09 | 2.5 | ||||||||||
Total Leasing | ||||||||||||||||||||
Q3 2017 | 53 | 442,748 | $ | 28.67 | 102 | $ | 53.54 | 3.7 | ||||||||||||
Q2 2017 | 41 | 216,786 | 40.23 | 133 | 85.14 | 3.2 | ||||||||||||||
Q1 2017 | 38 | 358,544 | 10.15 | 54 | 54.82 | 1.4 | ||||||||||||||
Q4 2016 | 36 | 235,614 | 18.25 | 53 | 4.87 | 0.5 | ||||||||||||||
Total - twelve months | 168 | 1,253,692 | $ | 27.26 | 85 | $ | 46.22 | 2.3 | ||||||||||||
(1) | Comparable leases comprise leases for which prior leases were in place for the same suite within 12 months of executing a new lease. Comparable leases must have terms of at least six months and the square footage of the suite occupied by the new tenant cannot deviate by more than 50% from the size of the old lease’s suite. |
(2) | In Q2 2017, we signed a 53,000 square foot lease with WeWork LLC ("WeWork") at an office property in San Fransisco, CA. Excluding WeWork, our weighted average growth for comparable office leases for the three months ended June 30, 2017 and for the trailing twelve months ended September 30, 2017 was 29.5% and 31.9%, respectively. Excluding WeWork, our weighted average growth for total comparable leases for the three months ended June 30, 2017 and for the trailing twelve months ended September 30, 2017 was 14.6% and 19.8%, respectively. |
Page | 22
INVESTMENT ACTIVITY |
The following tables describe changes in our portfolio from December 31, 2015 through September 30, 2017 (dollars and square feet in thousands):
Square Feet | ||||||||||||||
Properties and Square Feet Activity | Number of Properties | Total | Office | Industrial | Retail | |||||||||
Properties owned as of | ||||||||||||||
December 31, 2015 | 60 | 10,133 | 4,461 | 1,909 | 3,763 | |||||||||
2016 Acquisitions | 1 | 82 | — | — | 82 | |||||||||
2016 Dispositions | (7) | (1,236 | ) | (1,058 | ) | (126 | ) | (52 | ) | |||||
Building remeasurement and other (1) | 1 | (8 | ) | (3 | ) | (1 | ) | (4 | ) | |||||
December 31, 2016 | 55 | 8,971 | 3,400 | 1,782 | 3,789 | |||||||||
2017 Acquisitions | 2 | 344 | — | 344 | — | |||||||||
2017 Dispositions | (5) | (788 | ) | — | (737 | ) | (51 | ) | ||||||
Building remeasurement and other (1) | 1 | 42 | 29 | — | 13 | |||||||||
September 30, 2017 | 53 | 8,569 | 3,429 | 1,389 | 3,751 | |||||||||
(1) | Building remeasurements reflect changes in gross leasable area due to renovations or expansions of existing properties. In the fourth quarter of 2016 we sold one building of a multi-building grocery-anchored retail property, and continue to own the remaining buildings. In the third quarter of 2017 we sold one building from a three-building industrial property, and continue to own the remaining buildings. |
Property Acquisitions | Segment | Market | Acquisition Date | Number of Properties | Contract Purchase Price | Square Feet | |||||||||
(dollars and square feet in thousands) | |||||||||||||||
During 2016: | |||||||||||||||
Suniland | Retail | South Florida | 5/27/2016 | 1 | $ | 66,500 | 82 | ||||||||
During 2017: | |||||||||||||||
Vasco Road | Industrial | East Bay, CA | 7/21/2017 | 1 | $ | 16,248 | 96 | ||||||||
Northgate | Industrial | Las Vegas, NV | 7/26/2017 | 1 | 24,500 | 248 | |||||||||
Total 2017 | 2 | $ | 40,748 | 344 | |||||||||||
Page | 23
INVESTMENT ACTIVITY (continued) |
Property Dispositions | Segment | Market | Disposition Date | Number of Properties | Contract Sales Price | Square Feet | |||||||||
(dollars and square feet in thousands) | |||||||||||||||
During 2016 | |||||||||||||||
Colshire Drive | Office | Washington, DC | 2/18/2016 | 1 | $ | 158,400 | 574 | ||||||||
40 Boulevard | Office | Chicago, IL | 3/1/2016 | 1 | 9,850 | 107 | |||||||||
Washington Commons | Office | Chicago, IL | 3/1/2016 | 1 | 18,000 | 199 | |||||||||
Rockland 360-372 Market | Retail | Greater Boston | 8/5/2016 | 1 | 3,625 | 39 | |||||||||
6900 Riverport | Industrial | Louisville, KY | 9/2/2016 | 1 | 5,400 | 126 | |||||||||
Sunset Hills | Office | Washington, DC | 9/30/2016 | 1 | 18,600 | 178 | |||||||||
CVS Holbrook (1) | Retail | Greater Boston | 11/18/2016 | 1 | 6,200 | 13 | |||||||||
Total for the year ended December 31, 2016 | 7 | $ | 220,075 | 1,236 | |||||||||||
During 2017 | |||||||||||||||
Hanover | Retail | Greater Boston | 5/31/2017 | 1 | $ | 4,500 | 51 | ||||||||
Industrial Portfolio | Industrial | Louisville, KY | 6/9/2017 | 3 | 26,800 | 609 | |||||||||
620 Shiloh Road (2) | Industrial | Dallas, TX | 7/21/2017 | 1 | 7,661 | 128 | |||||||||
Total for the nine months ended September 30, 2017 | 5 | $ | 38,961 | 788 | |||||||||||
(1) | We sold CVS Holbrook, one building of a multi-building grocery-anchored retail property, and continue to own the remaining buildings. |
(2) | We sold 620 Shiloh Road, one building from a three-building industrial property, and continue to own the remaining buildings. |
Page | 24
DEFINITIONS |
This section contains an explanation of certain non-GAAP financial measures we provide in other sections of this document, as well as the reasons why management believes these measures provide useful information to investors about the Company’s financial condition or results of operations. Additional detail can be found in the Portfolio’s most recent annual report on Form 10-K and quarterly report on Form 10-Q, as well as other documents filed with or furnished to the Securities and Exchange Commission from time to time.
2016 Annual Report on Form 10-K
We refer to our Annual Report on Form 10-K for the period ended December 31, 2016, filed with the Securities and Exchange Commission on March 3, 2017, as our “2016 Annual Report on Form 10-K.”
Annualized Base Rent
Annualized base rent represents the annualized monthly base rent of leases executed as of September 30, 2017.
Comparable leases
Comparable leases comprise leases for which prior leases were in place for the same suite within 12 months of executing a new lease. Comparable leases must have terms of at least six months and the square footage of the suite occupied by the new tenant cannot deviate by more than 50% from the size of the old lease’s suite.
Funds From Operations (“FFO”)
We believe that FFO, as defined by the National Association of Real Estate Investment Trusts (“NAREIT”), is a meaningful supplemental measure of our operating performance because historical cost accounting for real estate assets in accordance with U.S. Generally Accepted Accounting Principles (“GAAP”) implicitly assumes that the value of real estate assets diminishes predictably over time, as reflected through depreciation and amortization expense. However, since real estate values have historically risen or fallen with market and other conditions, many industry investors and analysts have considered presentation of operating results for real estate companies that use historical cost accounting to be insufficient. Thus, NAREIT created FFO as a supplemental measure of operating performance for real estate investment trusts that consists of net income (loss), calculated in accordance with GAAP, plus real estate-related depreciation and amortization and impairment of depreciable real estate, less gains (or losses) from dispositions of real estate held for investment purposes.
Limitations of FFO
FFO is presented herein as a supplemental financial measure and has inherent limitations. We do not use FFO as, nor should it be considered to be, an alternative to net income (loss) computed under GAAP as an indicator of our operating performance, or as an alternative to cash from operating activities computed under GAAP, or as an indicator of liquidity or our ability to fund our short or long-term cash requirements, including distributions to stockholders. Management uses FFO, in addition to net income (loss) computed under GAAP and cash flows from operating activities computed under GAAP, to evaluate our consolidated operating performance and as a guide to making decisions about future investments. Our FFO calculation does not present, nor do we intend it to present, a complete picture of our financial condition and operating performance. We caution investors against using FFO to determine a price to earnings ratio or yield relative to our NAV. We believe that net income (loss) computed under GAAP remains the primary measure of performance and that FFO is only meaningful when used in conjunction with net income (loss) computed under GAAP. Further, we believe that our consolidated financial statements, prepared in accordance with GAAP, provide the most meaningful picture of our financial condition and operating performance.
Further, FFO is not comparable to the performance measure established by the Investment Program Association (the “IPA”), referred to as “modified funds from operations,” or “MFFO,” as MFFO makes further adjustments including certain mark-to-market items and adjustments for the effects of straight-line rent. As such, FFO may not be comparable to the MFFO of non-listed REITs that disclose MFFO in accordance with the IPA standard.
Page | 25
DEFINITIONS (continued) |
Gross Investment Amount
The allocated gross basis of real property and debt-related investments, after certain adjustments. Gross Investment Amount for real property (i) includes the effect of intangible lease liabilities, (ii) excludes accumulated depreciation and amortization, and (iii) includes the impact of impairments. Amounts reported for debt-related investments represent our net accounting basis of the debt investments, which includes (i) unpaid principal balances, (ii) unamortized discounts, premiums, and deferred charges, and (iii) allowances for loan loss.
Net Operating Income (“NOI”) and NOI - Cash Basis
We also use NOI as a supplemental financial performance measure because NOI reflects the specific operating performance of our real properties and excludes certain items that are not considered to be controllable in connection with the management of each property, such as other-than-temporary impairment, losses related to provisions for losses on debt-related investments, gains or losses on derivatives, acquisition-related expenses, gains or losses on extinguishment of debt and financing commitments, interest income, depreciation and amortization, general and administrative expenses, advisory fees, interest expense and noncontrolling interests. However, NOI should not be viewed as an alternative measure of our operating financial performance as a whole, since it does exclude such items that could materially impact our results of operations. Further, our NOI may not be comparable to that of other real estate companies, as they may use different methodologies for calculating NOI. Therefore, we believe net income, as defined by GAAP, to be the most appropriate measure to evaluate our overall financial performance. “NOI - Cash Basis” is NOI after eliminating the effects of straight-lining of rent and the impact of above- and below-market lease amortization and other non-cash amortization adjustments to rental revenue.
Non-Recurring Capital Expenditures
We classify capital expenditures that significantly increase a property’s ability to generate additional revenues relative to our initial underwriting as non-recurring capital expenditures. Examples of such capital expenditures may include property expansions, renovations or other significant strategic upgrades. Conversely, we classify capital expenditures incurred to maintain a property’s ability to generate expected revenues as “recurring.” In addition, we also classify the following capital expenditures as non-recurring:
• | First Generation Leasing Costs: We classify capital expenditures incurred to lease spaces for which we have either (i) never had a tenant or (ii) we expected a vacancy of the leasable space within two years of acquisition as non-recurring capital expenditures. |
• | Value-Add Acquisitions: We define a Value-Add Acquisition as a property that we acquire with one or more of the following characteristics: (i) existing vacancy equal to or in excess of 20%, (ii) short-term lease roll-over, typically during the first two years of ownership, that results in vacancy in excess of 20% when combined with the existing vacancy at the time of acquisition or (iii) significant capital improvement requirements in excess of 20% of the purchase price within the first two years of ownership. We classify any capital expenditures in Value-Add Acquisitions as non-recurring until the property reaches the earlier of (i) stabilization, which we define as 90% leased or (ii) five years after the date we acquire the property. |
• | Other Acquisitions: For property acquisitions that do not meet the criteria to qualify as Value-Add Acquisitions, we classify all anticipated capital expenditures within the first year of ownership as non-recurring. |
Post-Effective Amendment No.10
We refer to our Post-Effective Amendment No.10 to our Registration Statement on Form S-11 (File No. 333-197767) filed with the Commission on September 1, 2017 as our "Post-Effective Amendment No.10".
Q3 2017 Quarterly Report on Form 10-Q
We refer to our Quarterly Report on Form 10-Q for the quarter ended September 30, 2017, filed with the Securities and Exchange Commission on November 13, 2017, as our "Q3 Quarterly Report on Form 10-Q".
Same Store Properties
In our analysis of NOI, particularly to make comparisons of NOI between periods meaningful, it is important to provide information for properties that were in-service and owned by us throughout each period presented. We refer to properties acquired or placed in-service prior to the beginning of the earliest period presented and owned by us through the end of the latest period presented as “Same Store Properties.” “Same Store Properties” therefore exclude properties placed in-service, acquired, repositioned, or in development or redevelopment after the beginning of the earliest period presented or disposed of prior to the end of the latest period presented. Accordingly, it takes at least one year and one quarter after a property is acquired or treated as “in-service” for that property to be included in “Same Store Properties.” For the purposes of this supplement, our “Same Store Properties” include properties classified as held for sale in our annual financial statements at the end of the most recently completed period.
Valuation Procedures
We refer to our Valuation Procedures filed as Exhibit 4.6 to our Post-Effective Amendment No. 10 as our “Valuation Procedures.”
Page | 26