TELEPHONE & DATA SYSTEMS INC /DE/ - FORM 10-Q - November 8, 2017
Attached files
|
|
|
|
|
|
|
|
|
|
|
|
|
|
|
|
|
|
|
|
|
|
UNITED STATES
|
|
SECURITIES AND EXCHANGE COMMISSION
|
|
Washington, D.C. 20549
|
|
FORM 10-Q
|
|
(Mark One)
|
|
[x]
|
QUARTERLY REPORT PURSUANT TO SECTION 13 OR 15(d) OF THE SECURITIES EXCHANGE ACT OF 1934
|
|
For the quarterly period ended September 30, 2017
|
|
|
|
|
|
|
|
|
|
OR
|
|
|
|
|
|
|
|
|
|
[ ]
|
TRANSITION REPORT PURSUANT TO SECTION 13 OR 15(d) OF THE SECURITIES EXCHANGE ACT OF 1934
|
|
For the transition period from to
|
|
|
|
|
|
|
|
|
|
|
|
|
|
|
|
|
|
|
|
|
Commission file number 001-14157
|
|

|
|
TELEPHONE AND DATA SYSTEMS, INC.
|
|
(Exact name of Registrant as specified in its charter)
|
|
Delaware
|
|
|
36-2669023
|
|
(State or other jurisdiction of incorporation or organization)
|
|
|
(IRS Employer Identification No.)
|
|
|
|
|
|
|
|
|
|
|
|
|
|
|
|
|
|
|
|
|
30 North LaSalle Street, Suite 4000, Chicago, Illinois 60602
|
|
(Address of principal executive offices) (Zip code)
|
|
|
|
|
|
|
|
|
|
|
|
|
|
|
|
|
|
|
|
|
Registrant’s telephone number, including area code: (312) 630-1900
|
|
|
Yes
|
No
|
|
Indicate by check mark whether the registrant (1) has filed all reports required to be filed by Section 13 or 15(d) of the Securities Exchange Act of 1934 during the preceding 12 months (or for such shorter period that the registrant was required to file such reports), and (2) has been subject to such filing requirements for the past 90 days.
|
[x]
|
[ ]
|
|
|
|
|
|
|
|
|
|
|
|
|
|
|
|
|
|
|
|
|
Indicate by check mark whether the registrant has submitted electronically and posted on its corporate Web site, if any, every Interactive Data File required to be submitted and posted pursuant to Rule 405 of Regulation S-T during the preceding 12 months (or for such shorter period that the registrant was required to submit and post such files).
|
[x]
|
[ ]
|
|
|
|
|
|
|
|
|
|
|
|
|
|
|
|
|
|
|
|
|
Indicate by check mark whether the registrant is a large accelerated filer, an accelerated filer, a non-accelerated filer, smaller reporting company, or an emerging growth company. See the definitions of “large accelerated filer,” “accelerated filer,” “smaller reporting company,” and “emerging growth company” in Rule 12b-2 of the Exchange Act.
|
|
Large accelerated filer
|
[x]
|
|
|
|
|
|
|
|
Accelerated filer
|
[ ]
|
|
Non-accelerated filer
|
[ ]
|
(Do not check if a smaller reporting company)
|
|
Smaller reporting company
|
[ ]
|
|
|
|
|
|
|
|
|
|
|
|
|
|
Emerging growth company
|
[ ]
|
|
|
|
|
|
|
|
|
|
|
|
|
|
|
|
|
|
|
|
|
If an emerging growth company, indicate by check mark if the registrant has elected not to use the extended transition period for complying with any new or revised financial accounting standards provided pursuant to Section 13(a) of the Exchange Act.
|
[ ]
|
|
Indicate by check mark whether the registrant is a shell company (as defined in Rule 12b-2 of the Exchange Act).
|
[ ]
|
[x]
|
|
|
|
|
|
|
|
|
|
|
|
|
|
|
|
|
|
|
|
|
Indicate the number of shares outstanding of each of the issuer's classes of common stock, as of the latest practicable date.
|
|
|
|
|
|
|
|
|
|
|
|
|
|
|
|
|
|
|
|
|
Class
|
|
|
Outstanding at September 30, 2017
|
|
Common Shares, $0.01 par value
|
|
|
103,536,879 Shares
|
|
Series A Common Shares, $0.01 par value
|
|
|
7,250,102 Shares
|
|
|
|
|
|
|
|
|
|
|
|
|
|
|
|
|
|
|
|
|
|
|

|
Telephone and Data Systems, Inc.
Management’s Discussion and Analysis of
Financial Condition and Results of Operations
|
Executive Overview
The following discussion and analysis compares Telephone and Data Systems, Inc.’s (TDS) financial results for the three and nine months ended September 30, 2017, to the three and nine months ended September 30, 2016. It should be read in conjunction with TDS’ interim consolidated financial statements and notes included herein, and with the description of TDS’ business, its audited consolidated financial statements and Management's Discussion and Analysis (MD&A) of Financial Condition and Results of Operations included in TDS’ Annual Report on Form 10-K (Form 10-K) for the year ended December 31, 2016. Certain numbers included herein are rounded to millions for ease of presentation; however, calculated amounts and percentages are determined using the unrounded numbers.
This report contains statements that are not based on historical facts, including the words “believes,” “anticipates,” “estimates,” “expects,” “plans,” “intends,” “projects” and similar expressions. These statements constitute and represent “forward looking statements” as this term is defined in the Private Securities Litigation Reform Act of 1995. Such forward looking statements involve known and unknown risks, uncertainties and other factors that may cause actual results, events or developments to be significantly different from any future results, events or developments expressed or implied by such forward looking statements. See Private Securities Litigation Reform Act of 1995 Safe Harbor Cautionary Statement for additional information.
TDS uses certain “non-GAAP financial measures” and each such measure is identified in the MD&A. A discussion of the reason TDS determines these metrics to be useful and a reconciliation of these measures to their most directly comparable measures determined in accordance with accounting principles generally accepted in the United States of America (GAAP) are included in the Supplemental Information Relating to Non-GAAP Financial Measures section within the MD&A of this Form 10-Q Report.
|
General
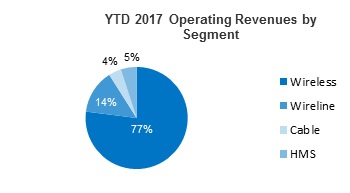
TDS is a diversified telecommunications company that provides high-quality communications services to approximately 6 million connections nationwide. TDS provides wireless services through its 83%-owned subsidiary, United States Cellular Corporation (U.S. Cellular). TDS also provides wireline services, cable services and hosted and managed services (HMS), through its wholly-owned subsidiary, TDS Telecommunications LLC (TDS Telecom). TDS’ segments operate almost entirely in the United States. See Note 10 — Business Segment Information in the Notes to Consolidated Financial Statements for summary financial information on each business segment.
|
|
TDS Mission and Strategy
TDS’ mission is to provide outstanding communications services to its customers and meet the needs of its shareholders, its people, and its communities. In pursuing this mission, TDS seeks to profitably grow its businesses, create opportunities for its associates and employees, and build value over the long-term for its shareholders. Across all of its businesses, TDS is focused on providing exceptional customer experiences through best-in-class services and products and superior customer service.
TDS’ long-term strategy calls for the majority of its capital to be reinvested in its operating businesses to strengthen their competitive positions and financial performance, while also returning value to TDS shareholders through the payment of a regular quarterly cash dividend and share repurchases.
In 2017, TDS is working to build shareholder value by continuing to execute on its strategies to build strong, competitive businesses providing high-quality, data-focused services and products. Strategic efforts include:
- U.S. Cellular continues to devote efforts to enhance its network capabilities. During the first half of 2017, U.S. Cellular commercially deployed VoLTE technology for the first time in one key market and will continue to build out VoLTE services over the next few years. The next commercial launch is expected to occur in several additional operating markets in early 2018. VoLTE technology allows customers to utilize a 4G LTE network for both voice and data services, and offers enhanced services such as high definition voice, video calling and simultaneous voice and data sessions. In addition, the deployment of VoLTE technology expands U.S. Cellular’s ability to offer roaming services to other carriers.
- U.S. Cellular continues to enhance its spectrum position and monetize non-strategic assets by participating in auctions and entering into agreements with third parties. During the nine months ended September 30, 2017, the FCC announced by way of public notice that U.S. Cellular was the winning bidder for 188 licenses for an aggregate purchase price of $329 million. In addition, U.S. Cellular closed on certain license exchange agreements and received $15 million of cash and recognized gains of $19 million. See Note 5 — Acquisitions, Divestitures and Exchanges in the Notes to Consolidated Financial Statements for additional information related to certain of these transactions.
- U.S. Cellular is focused on expanding its solutions available to business and government customers, including a growing suite of connected machine-to-machine solutions and software applications across various categories. U.S. Cellular will continue to enhance its advanced wireless services and connected solutions for consumer, business and government customers.
Significant Financial Matter
Net loss available to TDS common shareholders was $181 million and $134 million for the three and nine months ended September 30, 2017, respectively. Such net losses include a non-cash charge related to goodwill impairment of $262 million ($190 million, net of tax and noncontrolling interests impact), which was recorded for the three months ended September 30, 2017. See Note 6 — Intangible Assets for a detailed discussion regarding the goodwill impairment. Refer to Supplemental Information to Non-GAAP Financial Measures within this MD&A for a reconciliation of the goodwill impairment, net of tax and noncontrolling interests.
Terms Used by TDS
The following is a list of definitions of certain industry terms that are used throughout this document:
- 4G LTE – fourth generation Long-Term Evolution which is a wireless broadband technology.
- Account – represents an individual or business financially responsible for one or multiple associated connections. An account may include a variety of types of connections such as handsets and connected devices.
- Alternative Connect America Cost Model (A-CAM) – a USF support mechanism for rate-of-return carriers, which provides revenue support annually for ten years beginning in 2017. This support comes with an obligation to build defined broadband speeds to a certain number of locations.
- Auctions 1000, 1001, and 1002 – Auction 1000 is an FCC auction of 600 MHz spectrum licenses that started in 2016 and continued into 2017 involving: (1) a “reverse auction” in which broadcast television licensees submit bids to voluntarily relinquish spectrum usage rights in exchange for payments (referred to as Auction 1001); (2) a “repacking” of the broadcast television bands in order to free up certain broadcast spectrum for other uses; and (3) a “forward auction” of licenses for spectrum cleared through this process to be used for wireless communications (referred to as Auction 1002).
- Broadband Connections – refers to the number of Wireline customers provided high-capacity data circuits via various technologies, including DSL and dedicated internet circuit technologies or the Cable billable number of lines into a building for high-speed data services.
- Churn Rate – represents the percentage of the connections that disconnect service each month. These rates represent the average monthly churn rate for each respective period.
- Connected Devices – non-handset devices that connect directly to the U.S. Cellular network. Connected devices include products such as tablets, modems, and hotspots.
- EBITDA – refers to earnings before interest, taxes, depreciation, amortization and accretion and is used in the non-GAAP metric Adjusted EBITDA throughout this document.
- FCC – Federal Communications Commission.
- Gross Additions – represents the total number of new connections added during the period, without regard to connections that were terminated during that period.
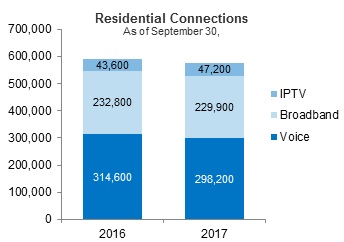
- IPTV Connections – represents the number of Wireline customers provided video services using IP networking technology.
- Machine-to-Machine or M2M – technology that involves the transmission of data between networked devices, as well as the performance of actions by devices without human intervention. U.S. Cellular sells and supports M2M solutions to customers, provides connectivity for M2M solutions via the U.S. Cellular network, and has agreements with device manufacturers and software developers which offer M2M solutions.
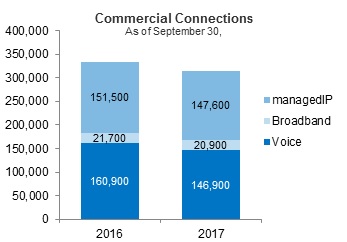
- ManagedIP Connections – refers to the number of telephone handsets, data lines and IP trunks providing communications using IP networking technology.
- Net Additions – represents the total number of new connections added during the period, net of connections that were terminated during that period.
- OIBDA – refers to operating income before depreciation, amortization and accretion and is used in the non-GAAP metric Adjusted OIBDA throughout this document.
- Postpaid Average Billings per Account (Postpaid ABPA) – non-GAAP metric is calculated by dividing total postpaid service revenues plus equipment installment plan billings by the average number of postpaid accounts and by the number of months in the period.
- Postpaid Average Billings per User (Postpaid ABPU) – non-GAAP metric is calculated by dividing total postpaid service revenues plus equipment installment plan billings by the average number of postpaid connections and by the number of months in the period.
- Postpaid Average Revenue per Account (Postpaid ARPA) – metric is calculated by dividing total postpaid service revenues by the average number of postpaid accounts and by the number of months in the period.
- Postpaid Average Revenue per User (Postpaid ARPU) – metric is calculated by dividing total postpaid service revenues by the average number of postpaid connections and by the number of months in the period.
- Retail Connections – the sum of U.S. Cellular postpaid connections and U.S. Cellular prepaid connections.
- Universal Service Fund (USF) – a system of telecommunications collected fees and support payments managed by the FCC intended to promote universal access to telecommunications services in the United States.
- U.S. Cellular Connections - individual lines of service associated with each device activated by a customer. This includes smartphones, feature phones, tablets, modems, and machine-to-machine devices.
- Video Connections – generally, a home or business receiving video programming counts as one video connection. In counting bulk residential or commercial connections, such as an apartment building or a hotel, connections are counted based on the number of units/rooms within the building receiving service.
- Voice Connections – refers to the individual circuits connecting a customer to Wireline’s central office facilities or the Cable billable number of lines into a building for voice services.
- VoLTE – Voice over Long-Term Evolution is a technology specification that defines the standards and procedures for delivering voice communications and related services over 4G LTE networks.
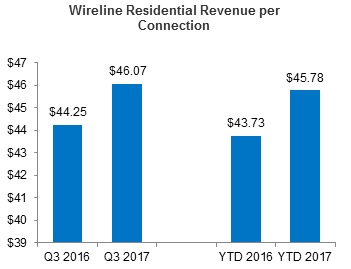
- Wireline Residential Revenue per Connection – is calculated by dividing total Wireline residential revenue by the average number of Wireline residential connections and by the number of months in the period.
Results of Operations — TDS Consolidated
|
|
|
|
|
|
Three Months Ended
|
|
Nine Months Ended
|
|
|
|
|
|
|
September 30,
|
|
September 30,
|
|
|
|
2017
|
|
2016
|
|
2017 vs. 2016
|
|
2017
|
|
2016
|
|
2017 vs. 2016
|
|
(Dollars in millions)
|
|
|
|
|
|
|
|
|
|
|
|
|
|
|
|
|
|
Operating revenues
|
|
|
|
|
|
|
|
|
|
|
|
|
|
|
|
|
|
|
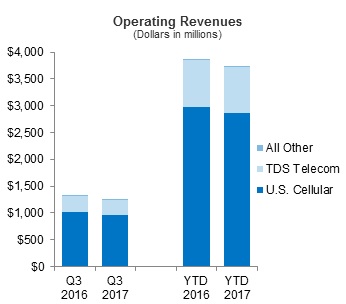
U.S. Cellular1
|
|
$
|
963
|
|
$
|
1,023
|
|
(6)%
|
|
$
|
2,862
|
|
$
|
2,985
|
|
(4)%
|
|
|
TDS Telecom
|
|
|
285
|
|
|
287
|
|
(1)%
|
|
|
865
|
|
|
868
|
|
–
|
|
|
All other2
|
|
|
3
|
|
|
4
|
|
–
|
|
|
9
|
|
|
10
|
|
(2)%
|
|
|
|
Total operating revenues1
|
|
|
1,251
|
|
|
1,314
|
|
(5)%
|
|
|
3,736
|
|
|
3,863
|
|
(3)%
|
|
Operating expenses
|
|
|
|
|
|
|
|
|
|
|
|
|
|
|
|
|
|
|
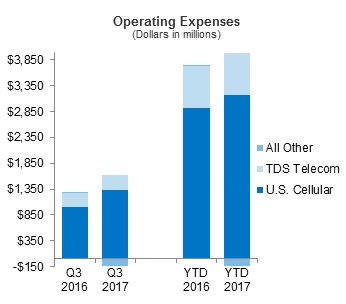
U.S. Cellular
|
|
|
1,323
|
|
|
1,001
|
|
32%
|
|
|
3,163
|
|
|
2,922
|
|
8%
|
|
|
TDS Telecom
|
|
|
297
|
|
|
276
|
|
8%
|
|
|
824
|
|
|
816
|
|
1%
|
|
|
All other2,3
|
|
|
(137)
|
|
|
4
|
|
>(100)%
|
|
|
(129)
|
|
|
12
|
|
>(100)%
|
|
|
|
Total operating expenses
|
|
|
1,483
|
|
|
1,281
|
|
16%
|
|
|
3,858
|
|
|
3,750
|
|
3%
|
|
Operating income (loss)
|
|
|
|
|
|
|
|
|
|
|
|
|
|
|
|
|
|
|
U.S. Cellular1
|
|
|
(360)
|
|
|
22
|
|
>(100)%
|
|
|
(301)
|
|
|
63
|
|
>(100)%
|
|
|
TDS Telecom
|
|
|
(13)
|
|
|
12
|
|
>(100)%
|
|
|
41
|
|
|
53
|
|
(23)%
|
|
|
All other2,3
|
|
|
141
|
|
|
(1)
|
|
>100%
|
|
|
138
|
|
|
(3)
|
|
>100%
|
|
|
|
Total operating income (loss)1
|
|
|
(232)
|
|
|
33
|
|
>(100)%
|
|
|
(122)
|
|
|
113
|
|
>(100)%
|
|
Investment and other income (expense)
|
|
|
|
|
|
|
|
|
|
|
|
|
|
|
|
|
|
|
Equity in earnings of unconsolidated entities
|
|
|
35
|
|
|
38
|
|
(6)%
|
|
|
101
|
|
|
109
|
|
(8)%
|
|
|
Interest and dividend income1
|
|
|
4
|
|
|
2
|
|
>100%
|
|
|
12
|
|
|
7
|
|
53%
|
|
|
Interest expense
|
|
|
(43)
|
|
|
(42)
|
|
(2)%
|
|
|
(128)
|
|
|
(127)
|
|
(1)%
|
|
|
Other, net
|
|
|
–
|
|
|
(1)
|
|
>100%
|
|
|
–
|
|
|
1
|
|
>100%
|
|
|
|
Total investment and other income (expense)1
|
|
|
(4)
|
|
|
(3)
|
|
(38)%
|
|
|
(15)
|
|
|
(10)
|
|
(50)%
|
|
|
|
|
|
|
|
|
|
|
|
|
|
|
|
|
|
|
|
|
|
|
Income (loss) before income taxes
|
|
|
(236)
|
|
|
30
|
|
>(100)%
|
|
|
(137)
|
|
|
103
|
|
>(100)%
|
|
|
Income tax expense (benefit)
|
|
|
(5)
|
|
|
14
|
|
>(100)%
|
|
|
39
|
|
|
45
|
|
(12)%
|
|
|
|
|
|
|
|
|
|
|
|
|
|
|
|
|
|
|
|
|
|
|
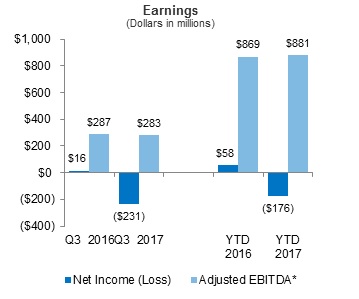
Net income (loss)
|
|
|
(231)
|
|
|
16
|
|
>(100)%
|
|
|
(176)
|
|
|
58
|
|
>(100)%
|
|
|
Less: Net income (loss) attributable to
noncontrolling interests, net of tax
|
|
|
(50)
|
|
|
3
|
|
>(100)%
|
|
|
(42)
|
|
|
9
|
|
>(100)%
|
|
Net income (loss) attributable to TDS shareholders
|
|
$
|
(181)
|
|
$
|
13
|
|
>(100)%
|
|
$
|
(134)
|
|
$
|
49
|
|
>(100)%
|
|
|
|
|
|
|
|
|
|
|
|
|
|
|
|
|
|
|
|
|
|
|
Adjusted OIBDA (Non-GAAP)1,4
|
|
$
|
244
|
|
$
|
248
|
|
(1)%
|
|
$
|
768
|
|
$
|
752
|
|
2%
|
|
Adjusted EBITDA (Non-GAAP)4
|
|
$
|
283
|
|
$
|
287
|
|
(1)%
|
|
$
|
881
|
|
$
|
869
|
|
1%
|
|
Capital expenditures
|
|
$
|
172
|
|
$
|
145
|
|
18%
|
|
$
|
402
|
|
$
|
412
|
|
(2)%
|
|
|
|
|
|
|
|
|
|
|
|
|
|
|
|
|
|
|
|
|
|
|
1
|
Equipment installment plan interest income is reflected as a component of Service revenues consistent with an accounting policy change effective January 1, 2017. All prior period numbers have been recast to conform to this accounting change. See Note 1 — Basis of Presentation in the Notes to Consolidated Financial Statements for additional details.
|
|
|
|
|
|
|
|
|
|
|
|
|
|
|
|
|
|
|
|
|
|
|
2
|
Consists of corporate and other operations and intercompany eliminations.
|
|
|
|
|
|
|
|
|
|
|
|
|
|
|
|
|
|
|
|
|
|
|
3
|
During the three months ended September 30, 2017, U.S. Cellular recorded a goodwill impairment of $370 million while TDS recorded a goodwill impairment of the U.S. Cellular reporting unit of $227 million. Prior to 2009, TDS accounted for U.S. Cellular's share repurchases as step acquisitions, allocating a portion of the share repurchase value to TDS' Goodwill. Further, goodwill of the U.S. Cellular reporting unit was impaired at the TDS level in 2003 but not at U.S. Cellular. Consequently, U.S. Cellular's goodwill on a stand-alone basis and any resulting impairments of goodwill does not equal the TDS consolidated goodwill related to U.S. Cellular. For further information on the goodwill impairment see Note 6 — Intangible Assets in the Notes to Consolidated Financial Statements.
|
|
|
|
|
|
|
|
|
|
|
|
|
|
|
|
|
|
|
|
|
|
|
4
|
Refer to Supplemental Information Relating to Non-GAAP Financial Measures within this MD&A for a reconciliation of this measure.
|
|
|
|
|
|
|
|
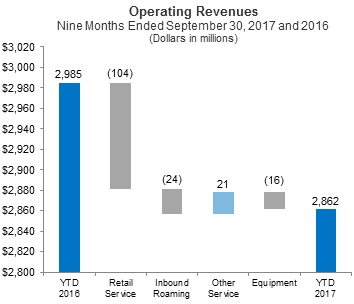
TDS’ 5% and 3% decrease in operating revenues for the three and nine months ended September 30, 2017, respectively, was due primarily to decreases in retail service, inbound roaming, and equipment sales revenues at U.S. Cellular. Retail service revenues continue to be impacted by industry-wide price competition.
|
TDS’ 16% and 3% increase in operating expenses for the three and nine months ended September 30, 2017, respectively, was due primarily to a loss on impairment of goodwill at the U.S. Cellular and HMS reporting units. See Note 6 — Intangible Assets in the Notes to Consolidated Financial Statements for additional information. This loss was partially offset by decreases in system operations, cost of equipment sold, and selling, general and administrative expenses at U.S. Cellular.
|
Refer to individual segment discussions in this MD&A for additional details on operating revenues and expenses at the segment level.
Equity in earnings of unconsolidated entities
Equity in earnings of unconsolidated entities represents TDS’ share of net income from entities in which it has a noncontrolling interest and that are accounted for by the equity method. TDS’ investment in the Los Angeles SMSA Limited Partnership (LA Partnership) contributed $17 million in both the three months ended September 30, 2017 and 2016, and $50 million and $57 million for the nine months ended September 30, 2017 and 2016, respectively, to Equity in earnings of unconsolidated entities. See Note 7 — Investments in Unconsolidated Entities in the Notes to Consolidated Financial Statements for additional information.
Income tax expense
TDS’ effective tax rate on Income (loss) before income taxes for the three and nine months ended September 30, 2017, was not meaningful due primarily to the recognition of a loss on impairment of goodwill and for the three and nine months ended September 30, 2016, was 46.6% and 43.6%, respectively. Due to difficulty in reliably projecting an annual tax rate, TDS calculated income taxes for the nine months ended September 30, 2017, based on an estimated year-to-date tax rate.
A reconciliation of TDS’ income tax expense (benefit) computed at the statutory rate to the reported income tax expense (benefit) and effective tax rate is as follows:
|
|
|
Nine Months Ended
|
|
|
|
September 30,
|
|
|
|
|
2017
|
|
|
2016
|
|
|
|
|
Amount
|
|
Rate
|
|
|
Amount
|
|
Rate
|
|
(Dollars in millions)
|
|
|
|
|
|
|
|
|
|
|
Pretax income (loss)
|
$
|
(137)
|
|
N/A
|
|
$
|
103
|
|
N/A
|
|
|
|
|
|
|
|
|
|
|
|
|
Statutory federal income tax expense (benefit) and rate
|
|
(48)
|
|
35.0 %
|
|
|
36
|
|
35.0%
|
|
Goodwill impairment1
|
|
80
|
|
(58.2)%
|
|
|
–
|
|
0.0%
|
|
Other differences, net
|
|
8
|
|
(5.6)%
|
|
|
9
|
|
8.6%
|
|
Total tax expense (benefit) and rate
|
$
|
39
|
|
(28.8)%
|
|
$
|
45
|
|
43.6%
|
|
|
|
|
|
|
|
|
|
|
|
|
|
Numbers may not foot due to rounding
|
|
|
|
|
|
|
|
|
|
|
|
|
|
|
|
|
|
|
|
|
|
1
|
Goodwill impairment reflects an adjustment to increase federal and state income tax expense by $80 million related to a portion of the goodwill impairment of the U.S. Cellular and HMS reporting units which is nondeductible for tax purposes. See Note 6 - Intangible Assets for a detailed discussion regarding the goodwill impairment.
|
Net income (loss) attributable to noncontrolling interests, net of tax
|
|
Three Months Ended
|
|
Nine Months Ended
|
|
|
September 30,
|
|
September 30,
|
|
|
2017
|
|
2016
|
|
2017
|
|
2016
|
|
(Dollars in millions)
|
|
|
|
|
|
|
|
|
|
|
|
|
U.S. Cellular noncontrolling public shareholders’
|
$
|
(50)
|
|
$
|
3
|
|
$
|
(44)
|
|
$
|
9
|
|
Noncontrolling shareholders’ or partners’
|
|
–
|
|
|
–
|
|
|
2
|
|
|
–
|
|
Net income (loss) attributable to noncontrolling interests, net of tax
|
$
|
(50)
|
|
$
|
3
|
|
$
|
(42)
|
|
$
|
9
|
Net income (loss) attributable to noncontrolling interests, net of tax includes the noncontrolling public shareholders’ share of U.S. Cellular’s net income (loss) and the noncontrolling shareholders’ or partners’ share of certain U.S. Cellular subsidiaries’ net income (loss).
|
|
Three and Nine Months Ended
Net income (loss) decreased due primarily to a loss on impairment of goodwill at the U.S. Cellular and HMS reporting units. The loss on impairment of goodwill is added back into Adjusted EBITDA causing the metric to remain relatively flat.
|
|
*Represents a non-GAAP financial measure. Refer to Supplemental Information Relating to Non-GAAP Financial Measures within this MD&A for a reconciliation of this measure.
|
|

|
U.S. CELLULAR OPERATIONS
|
Business Overview
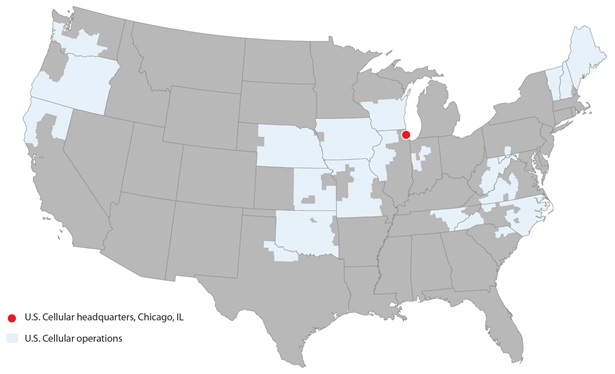
U.S. Cellular owns, operates, and invests in wireless markets throughout the United States. U.S. Cellular is an 83%-owned subsidiary of TDS. U.S. Cellular’s strategy is to attract and retain wireless customers through a value proposition comprised of a high-quality network, outstanding customer service, and competitive devices, plans, and pricing, all provided with a local focus.
|
OPERATIONS
|
|
|
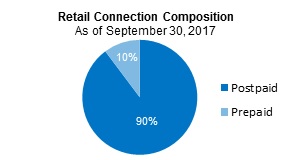
- Serves customers with approximately 5.1 million connections including 4.5 million postpaid, 0.5 million prepaid and 0.1 million reseller and other connections
- Operates in 22 states
- Employs approximately 6,000 associates
- Headquartered in Chicago, Illinois
- 6,436 cell sites including 4,051 owned towers in service
|
|
|
|
|
|
|
|
Q3
|
Q3
|
YTD
|
YTD
|
|
|
|
|
|
|
2017
|
2016
|
2017
|
2016
|
|
|
Postpaid Activity and Churn
|
|
|
|
|
|
|
|
Gross Additions:
|
191,000
|
174,000
|
511,000
|
586,000
|
|
|
|
|
|
|
|
|
Handsets
|
139,000
|
115,000
|
357,000
|
363,000
|
|
|
|
|
|
|
|
|
|
|
Connected Devices
|
52,000
|
59,000
|
154,000
|
223,000
|
|
|
|
|
|
|
As of September 30,
|
|
|
Net Additions (Losses):
|
35,000
|
(6,000)
|
31,000
|
75,000
|
|
|
|
|
|
|
2017
|
|
2016
|
|
|
|
|
Handsets
|
29,000
|
(27,000)
|
20,000
|
(45,000)
|
|
|
|
|
|
|
|
|
|
Retail Connections – End of Period
|
|
|
|
|
Connected Devices
|
6,000
|
21,000
|
11,000
|
120,000
|
|
|
|
|
|
|
|
Postpaid
|
4,513,000
|
|
4,484,000
|
|
|
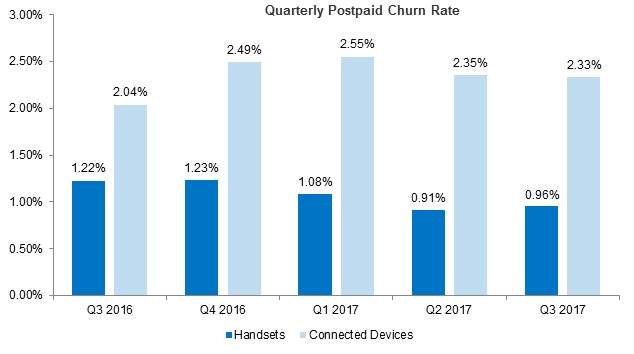
Churn:
|
1.16%
|
1.34%
|
1.19%
|
1.27%
|
|
|
|
|
|
|
|
Prepaid
|
515,000
|
|
480,000
|
|
|
|
|
Handsets
|
0.96%
|
1.22%
|
0.98%
|
1.17%
|
|
|
|
|
|
|
|
|
|
Total
|
5,028,000
|
|
4,964,000
|
|
|
|
|
Connected Devices
|
2.33%
|
2.04%
|
2.41%
|
1.97%
|
|
|
|
|
|
|
|
The increase in postpaid net additions for the three months ended September 30, 2017, when compared to the same period last year, was driven mainly by higher handsets gross additions as well as lower handsets churn. These impacts were slightly offset by a decline in tablet gross additions and higher tablet churn which are included in the connected devices line above.
The decrease in postpaid net additions for the nine months ended September 30, 2017, when compared to the same period last year, was driven mainly by lower tablet gross additions and an increase in tablet churn, partially offset by an improvement in handsets net additions largely reflecting a decline in handsets churn.
Postpaid Revenue
|
|
|
Three Months Ended
|
|
|
Nine Months Ended
|
|
|
|
September 30,
|
|
|
September 30,
|
|
|
|
2017
|
|
2016
|
|
2017
|
|
2016
|
|
Average Revenue Per User (ARPU)
|
$
|
43.41
|
|
$
|
47.08
|
|
$
|
44.46
|
|
$
|
47.54
|
|
Average Billings Per User (ABPU)1
|
$
|
54.71
|
|
$
|
56.79
|
|
$
|
55.21
|
|
$
|
56.34
|
|
|
|
|
|
|
|
|
|
|
|
|
|
|
Average Revenue Per Account (ARPA)
|
$
|
116.36
|
|
$
|
125.31
|
|
$
|
119.26
|
|
$
|
125.21
|
|
Average Billings Per Account (ABPA)1
|
$
|
146.65
|
|
$
|
151.16
|
|
$
|
148.12
|
|
$
|
148.37
|
|
|
|
|
|
|
|
|
|
|
|
|
|
|
|
1
|
Postpaid ABPU and Postpaid ABPA are non-GAAP financial measures. Refer to Supplemental Information Relating to Non-GAAP Financial Measures within this MD&A for a reconciliation of these measures.
|
Postpaid ARPU and Postpaid ARPA decreased for the three and nine months ended September 30, 2017, due primarily to industry-wide price competition resulting in overall price reductions on plan offerings.
Equipment installment plans increase equipment sales revenue as customers pay for their wireless devices in installments at a total device price that is generally higher than the device price offered to customers in conjunction with alternative plans that are subject to a service contract. Equipment installment plans also have the impact of reducing service revenues as certain equipment installment plans provide for reduced monthly service charges. In order to show the trends in total service and equipment revenues received, U.S. Cellular has presented Postpaid ABPU and Postpaid ABPA, which are calculated as Postpaid ARPU and Postpaid ARPA plus average monthly equipment installment plan billings per connection and account, respectively.
Equipment installment plan billings increased for the three and nine months ended September 30, 2017, when compared to the same periods last year, mainly due to increased penetration of equipment installment plans. Postpaid ABPU and ABPA decreased for the three and nine months ended September 30, 2017, when compared to the same periods last year, as the increase in equipment installment plan billings was more than offset by the decline in Postpaid ARPU and ARPA discussed above. U.S. Cellular expects the penetration of equipment installment plans to continue to increase over time due to the fact that, effective in September 2016, all equipment sales to retail customers are made under installment plans.
Financial Overview — U.S. Cellular
|
|
|
|
|
|
Three Months Ended
|
|
Nine Months Ended
|
|
|
|
|
|
|
September 30,
|
|
September 30,
|
|
|
|
|
|
|
|
|
|
|
2017 vs.
|
|
|
|
|
2017 vs.
|
|
|
|
|
|
|
2017
|
|
2016
|
|
2016
|
|
2017
|
|
2016
|
|
2016
|
|
(Dollars in millions)
|
|
|
|
|
|
|
|
|
|
|
|
|
|
|
|
|
|
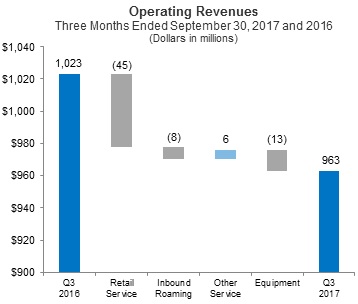
Retail service
|
|
$
|
636
|
|
$
|
681
|
|
(7)%
|
|
$
|
1,940
|
|
$
|
2,044
|
|
(5)%
|
|
Inbound roaming
|
|
|
37
|
|
|
45
|
|
(17)%
|
|
|
94
|
|
|
118
|
|
(20)%
|
|
Other1
|
|
|
64
|
|
|
58
|
|
12%
|
|
|
189
|
|
|
168
|
|
13%
|
|
|
Service revenues1
|
|
|
737
|
|
|
784
|
|
(6)%
|
|
|
2,223
|
|
|
2,330
|
|
(5)%
|
|
Equipment sales
|
|
|
226
|
|
|
239
|
|
(5)%
|
|
|
639
|
|
|
655
|
|
(3)%
|
|
|
Total operating revenues1
|
|
|
963
|
|
|
1,023
|
|
(6)%
|
|
|
2,862
|
|
|
2,985
|
|
(4)%
|
|
|
|
|
|
|
|
|
|
|
|
|
|
|
|
|
|
|
|
|
|
|
System operations (excluding Depreciation, amortization and accretion reported below)
|
|
|
185
|
|
|
196
|
|
(6)%
|
|
|
549
|
|
|
572
|
|
(4)%
|
|
Cost of equipment sold
|
|
|
261
|
|
|
280
|
|
(7)%
|
|
|
749
|
|
|
799
|
|
(6)%
|
|
Selling, general and administrative
|
|
|
350
|
|
|
370
|
|
(5)%
|
|
|
1,041
|
|
|
1,089
|
|
(4)%
|
|
Depreciation, amortization and accretion
|
|
|
153
|
|
|
155
|
|
(2)%
|
|
|
460
|
|
|
462
|
|
–
|
|
Loss on impairment of goodwill
|
|
|
370
|
|
|
–
|
|
N/M
|
|
|
370
|
|
|
–
|
|
N/M
|
|
(Gain) loss on asset disposals, net
|
|
|
5
|
|
|
7
|
|
(26)%
|
|
|
14
|
|
|
16
|
|
(17)%
|
|
(Gain) loss on sale of business and other exit costs, net
|
|
|
(1)
|
|
|
–
|
|
N/M
|
|
|
(1)
|
|
|
–
|
|
>(100)%
|
|
(Gain) loss on license sales and exchanges, net
|
|
|
–
|
|
|
(7)
|
|
100%
|
|
|
(19)
|
|
|
(16)
|
|
(16)%
|
|
|
Total operating expenses
|
|
|
1,323
|
|
|
1,001
|
|
32%
|
|
|
3,163
|
|
|
2,922
|
|
8%
|
|
|
|
|
|
|
|
|
|
|
|
|
|
|
|
|
|
|
|
|
|
|
Operating income (loss)¹
|
|
$
|
(360)
|
|
$
|
22
|
|
>(100)%
|
|
$
|
(301)
|
|
$
|
63
|
|
>(100)%
|
|
|
|
|
|
|
|
|
|
|
|
|
|
|
|
|
|
|
|
|
|
|
Net income (loss)
|
|
$
|
(298)
|
|
$
|
18
|
|
>(100)%
|
|
$
|
(259)
|
|
$
|
54
|
|
>(100)%
|
|
Adjusted OIBDA (Non-GAAP)1,2
|
|
$
|
167
|
|
$
|
177
|
|
(6)%
|
|
$
|
523
|
|
$
|
525
|
|
–
|
|
Adjusted EBITDA (Non-GAAP)2
|
|
$
|
204
|
|
$
|
216
|
|
(6)%
|
|
$
|
631
|
|
$
|
639
|
|
(1)%
|
|
Capital expenditures
|
|
$
|
112
|
|
$
|
103
|
|
8%
|
|
$
|
257
|
|
$
|
275
|
|
(7)%
|
|
|
|
|
|
|
|
|
|
|
|
|
|
|
|
|
|
|
|
|
|
|
N/M - Percentage change not meaningful
|
|
|
|
|
|
|
|
|
|
|
|
|
|
|
|
|
|
|
|
|
|
|
1
|
Equipment installment plan interest income is reflected as a component of Service revenues consistent with an accounting policy change effective January 1, 2017. All prior period numbers have been recast to conform to this accounting change. See Note 1 — Basis of Presentation in the Notes to Consolidated Financial Statements for additional details.
|
|
|
|
|
|
|
|
|
|
|
|
|
|
|
|
|
|
|
|
|
|
|
2
|
Refer to Supplemental Information Relating to Non-GAAP Financial Measures within this MD&A for a reconciliation of this measure.
|
|
|
|
|
|
|
|
Service revenues consist of:
- Retail Service – Charges for access, airtime, roaming, recovery of regulatory costs and value added services, including data services and products
- Inbound Roaming – Charges to other wireless carriers whose customers use U.S. Cellular’s wireless systems when roaming
- Other Service – Primarily amounts received from the Federal USF, imputed interest recognized on equipment installment plan contracts and tower rental revenues
Equipment revenues consist of:
- Sales of wireless devices and related accessories to new and existing customers, agents, and third-party distributors
|
Key components of changes in the statement of operations line items were as follows:
Total operating revenues
On January 1, 2017, U.S. Cellular elected to change the classification of interest income on equipment installment plan contracts from Interest and dividend income to Service revenues in the Consolidated Statement of Operations. All prior period numbers have been recast to conform to this accounting change. See Note 1 — Basis of Presentation in the Notes to Consolidated Financial Statements for additional details.
Service revenues decreased for the three and nine months ended September 30, 2017, as a result of (i) a decrease in retail service revenues primarily driven by industry-wide price competition resulting in overall price reductions on plan offerings; and (ii) a decrease in inbound roaming revenues primarily driven by lower roaming rates. Such reductions were partially offset by an increase in imputed interest income due to an increase in the total number of active equipment installment plans.
Federal USF revenue remained flat at $23 million and $69 million for the three and nine months ended September 30, 2017, respectively, when compared to the same periods last year. See the Regulatory Matters section in this MD&A for a description of the FCC Mobility Fund II Order (MF2 Order) and its expected impacts on U.S. Cellular’s current Federal USF support.
Equipment sales revenues decreased for the three months ended September 30, 2017, when compared to the same period last year, due a reduction in guarantee liability amortization for equipment installment contracts as a result of changes in plan offerings and an overall reduction in the number of devices sold. See Note 3 – Equipment Installment Plans in the Notes to Consolidated Financial Statements for additional details regarding the amortization of the guarantee liability. These impacts were partially offset by a mix shift to higher end smartphone devices as well as an increase in accessories revenues.
Equipment sales revenues decreased for the nine months ended September 30, 2017, when compared to the same period last year, as a result of an overall reduction in the number of devices sold and, as a result of changes in plan offerings, a decrease in guarantee liability amortization for equipment installment contracts and lower device activation fees. These impacts were partially offset by an increase in the proportion of new device sales made under equipment installment plans, a mix shift from feature phones and connected devices to smartphones and, to a lesser extent, an increase in accessories revenues.
System operations expenses
System operations expenses decreased for the three and nine months ended September 30, 2017, when compared to the same periods last year, as a result of (i) a decrease in roaming expenses driven primarily by lower roaming rates, partially offset by increased data roaming usage; and (ii) a decrease in customer usage expenses primarily driven by decreased circuit costs.
Cost of equipment sold
The decrease in Cost of equipment sold for the three and nine months ended September 30, 2017, when compared to the same periods last year, was mainly due to a reduction in the number of devices sold as well as a decrease in the average cost of smartphones, partially offset by a mix shift from feature phones and connected devices to higher cost smartphones. Loss on equipment, defined as Equipment sales revenues less Cost of equipment sold, was $35 million and $41 million for the three months ended September 30, 2017 and 2016, respectively, and $110 million and $144 million for the nine months ended September 30, 2017 and 2016, respectively.
Selling, general and administrative expenses
Selling expenses for the three and nine months ended September 30, 2017, decreased by $8 million and $24 million, respectively, mainly due to lower advertising expenses, including a decrease in sponsorship expenses related to the termination of a naming rights agreement during the third quarter of 2016; increases in commissions expenses were partially offsetting. General and administrative expenses for the three and nine months ended September 30, 2017, decreased $11 million and $25 million, respectively, mainly due to lower bad debts and phone program expenses together with reductions in numerous other general and administrative categories.
Loss on impairment of goodwill
During the third quarter of 2017, U.S. Cellular recorded a $370 million loss on impairment related to goodwill. See Note 6 — Intangible Assets in the Notes to Consolidated Financial Statements for additional information.
(Gain) loss on license sales and exchanges, net
Net gains in 2017 and 2016 were due to gains recognized on license exchange transactions with third parties. See Note 5 — Acquisitions, Divestitures and Exchanges in the Notes to Consolidated Financial Statements for additional information.
|

|
TDS TELECOM OPERATIONS
|
Business Overview
TDS Telecom operates in three reportable segments: Wireline, Cable and HMS. The overall strategy for the Wireline and Cable businesses is to provide the best broadband connection in the market in order to capitalize on data growth and customers’ need for higher speeds and leverage that growth by bundling services with video and voice. In addition, through its HMS business, TDS Telecom provides a wide range of Information Technology (IT) services including colocation, cloud and hosting solutions, managed services, applications management, and sales of IT hardware and related maintenance and professional services.
|
OPERATIONS
|
|
|
- TDS Telecom operates in 34 states, and through its Wireline and Cable operations provides broadband, video and voice services to approximately 1.2 million connections.
- Employs approximately 3,300 employees.
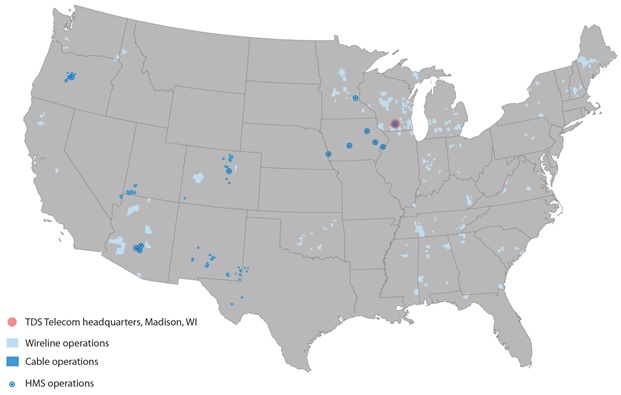
- Wireline operates incumbent local exchange carriers (ILEC) and competitive local exchange carriers (CLEC) in 27 states.
- Cable operates primarily in Oregon, Utah, Colorado, New Mexico and Texas.
- HMS operates a total of eight data centers. It owns two data centers in Iowa, one each in Minnesota, Wisconsin, Colorado and Oregon and it leases two data centers in Arizona.
|
Financial Overview — TDS Telecom
|
|
|
|
|
|
Three Months Ended
|
|
Nine Months Ended
|
|
|
|
|
|
|
September 30,
|
|
September 30,
|
|
|
|
|
|
|
|
|
|
|
|
|
2017 vs.
|
|
|
|
|
|
|
|
2017 vs.
|
|
|
|
2017
|
|
2016
|
|
2016
|
|
2017
|
|
2016
|
|
2016
|
|
(Dollars in millions)
|
|
|
|
|
|
|
|
|
|
|
|
|
|
|
|
|
|
Operating revenues
|
|
|
|
|
|
|
|
|
|
|
|
|
|
|
|
|
|
|
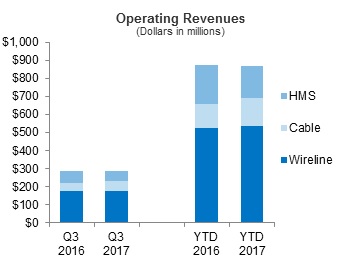
Wireline
|
|
$
|
179
|
|
$
|
175
|
|
2%
|
|
$
|
538
|
|
$
|
523
|
|
3%
|
|
|
Cable
|
|
|
52
|
|
|
46
|
|
12%
|
|
|
152
|
|
|
137
|
|
11%
|
|
|
HMS
|
|
|
56
|
|
|
68
|
|
(18)%
|
|
|
178
|
|
|
212
|
|
(16)%
|
|
|
Intra-company elimination
|
|
|
(1)
|
|
|
(1)
|
|
(10)%
|
|
|
(3)
|
|
|
(3)
|
|
–
|
|
|
|
TDS Telecom operating revenues
|
|
|
285
|
|
|
287
|
|
(1)%
|
|
|
865
|
|
|
868
|
|
–
|
|
|
|
|
|
|
|
|
|
|
|
|
|
|
|
|
|
|
|
|
|
|
Operating expenses
|
|
|
|
|
|
|
|
|
|
|
|
|
|
|
|
|
|
|
Wireline
|
|
|
152
|
|
|
159
|
|
(4)%
|
|
|
455
|
|
|
462
|
|
(2)%
|
|
|
Cable
|
|
|
50
|
|
|
46
|
|
8%
|
|
|
145
|
|
|
136
|
|
7%
|
|
|
HMS
|
|
|
96
|
|
|
72
|
|
33%
|
|
|
227
|
|
|
221
|
|
3%
|
|
|
Intra-company elimination
|
|
|
(1)
|
|
|
(1)
|
|
(10)%
|
|
|
(3)
|
|
|
(3)
|
|
–
|
|
|
|
TDS Telecom operating expenses
|
|
|
297
|
|
|
276
|
|
8%
|
|
|
824
|
|
|
816
|
|
1%
|
|
|
|
|
|
|
|
|
|
|
|
|
|
|
|
|
|
|
|
|
|
|
TDS Telecom operating income (loss)
|
|
$
|
(13)
|
|
$
|
12
|
|
>(100)%
|
|
$
|
41
|
|
$
|
53
|
|
(23)%
|
|
|
|
|
|
|
|
|
|
|
|
|
|
|
|
|
|
|
|
|
|
|
Net income (loss)
|
|
$
|
(15)
|
|
$
|
7
|
|
>(100)%
|
|
$
|
18
|
|
$
|
32
|
|
(44)%
|
|
Adjusted OIBDA (Non-GAAP)1
|
|
$
|
78
|
|
$
|
70
|
|
12%
|
|
$
|
244
|
|
$
|
225
|
|
9%
|
|
Adjusted EBITDA (Non-GAAP)1
|
|
$
|
80
|
|
$
|
71
|
|
14%
|
|
$
|
248
|
|
$
|
226
|
|
10%
|
|
Capital expenditures
|
|
$
|
58
|
|
$
|
40
|
|
44%
|
|
$
|
139
|
|
$
|
128
|
|
9%
|
|
|
|
|
|
|
|
|
|
|
|
|
|
|
|
|
|
|
|
|
|
|
Numbers may not foot due to rounding.
|
|
|
|
|
|
|
|
|
|
|
|
|
|
|
|
|
|
|
|
|
|
|
1
|
Refer to Supplemental Information Relating to Non-GAAP Financial Measures within this MD&A for a reconciliation of this measure.
|
|
|
Three and Nine Months Ended
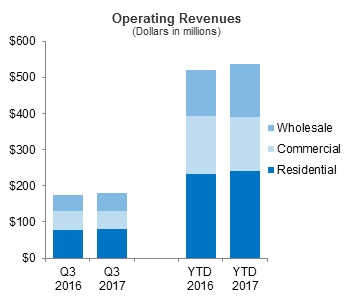
Operating revenues decreased for the three and nine months ended September 30, 2017, due to lower HMS equipment and product sales revenues offset by higher Wireline support revenue provided through the A-CAM program, IPTV and Cable broadband connection growth, and price increases for video and broadband services.
|
Total operating expenses
Operating expenses increased for the three and nine months ended September 30, 2017, due primarily to a $35 million loss on impairment related to HMS goodwill during the third quarter of 2017. See Note 6 — Intangible Assets in the Notes to Consolidated Financial Statements for additional information. In addition, lower HMS equipment cost of goods sold was partially offset by higher Wireline and Cable video programming costs.
|

|
WIRELINE OPERATIONS
|
Business Overview
TDS Telecom’s Wireline business provides broadband, video and voice services. These services are provided to residential, commercial, and wholesale customers in a mix of rural, small town and suburban markets, with the largest concentration of its customers in the Upper Midwest and the Southeast. TDS Telecom’s strategy is to offer its residential customers broadband, video, and voice services through value-added bundling. In its commercial business, TDS Telecom’s focus is on small- to medium-sized businesses and its sales efforts emphasize advanced IP-based data and voice services.
Operational Overview
|
|
|
|
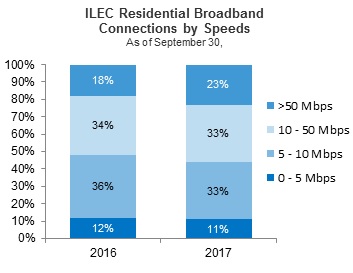
Residential broadband customers are increasingly choosing higher speeds in ILEC markets with 56% choosing speeds of 10 Mbps or greater and 23% choosing speeds of 50 Mbps or greater.
|
Wireline residential revenue per connection increased for the three and nine months ended September 30, 2017, due primarily to higher broadband speeds, IPTV connection growth, and price increases.
|
|
|
|
|
|
|
|
|
|
Total residential connections decreased by 3% as declines in voice and broadband connections outpaced the growth in IPTV connections.
|
|
Total commercial connections decreased by 6% due primarily to a 9% decrease in voice connections, mostly in CLEC markets.
|
Financial Overview — Wireline
|
|
|
|
|
|
|
Three Months Ended
|
|
Nine Months Ended
|
|
|
|
|
|
|
|
September 30,
|
|
September 30,
|
|
|
|
2017
|
|
2016
|
|
2017 vs. 2016
|
|
2017
|
|
2016
|
|
2017 vs. 2016
|
|
(Dollars in millions)
|
|
|
|
|
|
|
|
|
|
|
|
|
|
|
|
|
|
Residential
|
|
$
|
80
|
|
$
|
78
|
|
2%
|
|
$
|
240
|
|
$
|
232
|
|
3%
|
|
Commercial
|
|
|
50
|
|
|
53
|
|
(6)%
|
|
|
151
|
|
|
160
|
|
(6)%
|
|
Wholesale
|
|
|
49
|
|
|
43
|
|
13%
|
|
|
147
|
|
|
130
|
|
13%
|
|
|
Service revenues
|
|
|
178
|
|
|
174
|
|
2%
|
|
|
537
|
|
|
522
|
|
3%
|
|
Equipment and product sales
|
|
|
–
|
|
|
–
|
|
(28)%
|
|
|
1
|
|
|
1
|
|
(34)%
|
|
|
Total operating revenues
|
|
|
179
|
|
|
175
|
|
2%
|
|
|
538
|
|
|
523
|
|
3%
|
|
|
|
|
|
|
|
|
|
|
|
|
|
|
|
|
|
|
|
Cost of services (excluding Depreciation, amortization and accretion reported below)
|
|
|
66
|
|
|
67
|
|
(1)%
|
|
|
194
|
|
|
192
|
|
1%
|
|
Cost of equipment and products
|
|
|
–
|
|
|
1
|
|
(37)%
|
|
|
2
|
|
|
2
|
|
(7)%
|
|
Selling, general and administrative
|
|
|
49
|
|
|
50
|
|
(3)%
|
|
|
145
|
|
|
148
|
|
(2)%
|
|
Depreciation, amortization and accretion
|
|
|
38
|
|
|
41
|
|
(8)%
|
|
|
114
|
|
|
119
|
|
(5)%
|
|
(Gain) loss on asset disposals, net
|
|
|
–
|
|
|
1
|
|
(76)%
|
|
|
1
|
|
|
2
|
|
(54)%
|
|
|
Total operating expenses
|
|
|
152
|
|
|
159
|
|
(4)%
|
|
|
455
|
|
|
462
|
|
(2)%
|
|
|
|
|
|
|
|
|
|
|
|
|
|
|
|
|
|
|
|
|
|
|
|
Operating income
|
|
$
|
26
|
|
$
|
16
|
|
63%
|
|
$
|
84
|
|
$
|
61
|
|
37%
|
|
|
|
|
|
|
|
|
|
|
|
|
|
|
|
|
|
|
|
|
|
|
|
Income before income taxes
|
|
$
|
28
|
|
$
|
17
|
|
66%
|
|
$
|
88
|
|
$
|
63
|
|
39%
|
|
Adjusted OIBDA (Non-GAAP)1
|
|
$
|
64
|
|
$
|
57
|
|
11%
|
|
$
|
198
|
|
$
|
182
|
|
9%
|
|
Adjusted EBITDA (Non-GAAP)1
|
|
$
|
66
|
|
$
|
58
|
|
13%
|
|
$
|
202
|
|
$
|
183
|
|
10%
|
|
Capital expenditures
|
|
$
|
41
|
|
$
|
27
|
|
54%
|
|
$
|
91
|
|
$
|
82
|
|
11%
|
|
|
|
|
|
|
|
|
|
|
|
|
|
|
|
|
|
|
|
|
|
|
|
Numbers may not foot due to rounding.
|
|
|
|
|
|
|
|
|
|
|
|
|
|
|
|
|
|
|
|
|
|
|
|
|
|
|
|
|
|
|
|
1
|
Refer to Supplemental Information Relating to Non-GAAP Financial Measures within this MD&A for a reconciliation of this measure.
|
|
|
Residential revenues consist of:
- Broadband services, including fiber-based and other digital, premium and enhanced data services
- IPTV and satellite video
Commercial revenues consist of:
- TDS managedIP voice and data services
- High-speed and dedicated business internet services
Wholesale revenues consist of:
- Network access services to interexchange carriers for the origination and termination of interstate and intrastate long distance phone calls on TDS Telecom’s network and special access services to carriers and others
- State and Federal USF support
|
Key components of changes in the statement of operations items were as follows:
Total operating revenues
Residential revenues increased for the three and nine months ended September 30, 2017, as growth in broadband speeds and IPTV connections and price increases for broadband and video services more than offset the decline in voice services. Average year to date IPTV connections grew 14%, offset by a 4% decline in average voice connections.
Commercial revenues decreased for the three and nine months ended September 30, 2017, due to declining connections mostly in CLEC markets.
Wholesale revenues increased for the three and nine months ended September 30, 2017, due primarily to increased support received from the A-CAM program.
Cost of services
Cost of services increased for the nine months ended September 30, 2017, due to increased charges related to growth in IPTV, offset by reduced costs of provisioning circuits, purchasing unbundled network elements and providing long-distance services.
Selling, general and administrative
Selling, general and administrative decreased for the three and nine months ended September 30, 2017, due to decreases in employee related expense and decreases in contributions to the Federal Universal Service Fund.
Depreciation, amortization and accretion
Depreciation, amortization and accretion decreased for the three and nine months ended September 30, 2017, as certain assets became fully depreciated.
|
 
|
CABLE OPERATIONS
|
Business Overview
TDS Telecom’s Cable strategy is to expand its broadband services and leverage that growth by bundling with video and voice services. TDS Telecom seeks to be the leading provider of broadband services in its targeted markets by leveraging its core competencies in network management and customer focus.
Operational Overview
|
|
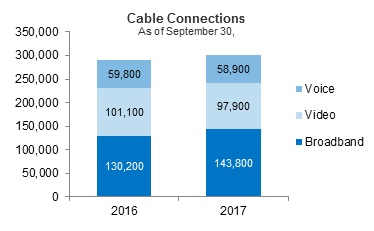
Cable connections grew 3% over 2016 due to a 10% increase in broadband connections.
|
Financial Overview — Cable
|
|
|
|
|
|
|
Three Months Ended
|
|
Nine Months Ended
|
|
|
|
|
|
|
|
September 30,
|
|
September 30,
|
|
|
|
2017
|
|
2016
|
|
2017 vs. 2016
|
|
2017
|
|
2016
|
|
2017 vs. 2016
|
|
(Dollars in millions)
|
|
|
|
|
|
|
|
|
|
|
|
|
|
|
|
|
|
Residential
|
|
$
|
43
|
|
$
|
37
|
|
16%
|
|
$
|
125
|
|
$
|
108
|
|
15%
|
|
Commercial
|
|
|
9
|
|
|
9
|
|
(2)%
|
|
|
27
|
|
|
28
|
|
(3)%
|
|
|
Total operating revenues
|
|
|
52
|
|
|
46
|
|
12%
|
|
|
152
|
|
|
137
|
|
11%
|
|
|
|
|
|
|
|
|
|
|
|
|
|
|
|
|
|
|
|
Cost of services (excluding Depreciation, amortization and accretion reported below)
|
|
|
25
|
|
|
23
|
|
8%
|
|
|
73
|
|
|
69
|
|
5%
|
|
Selling, general and administrative
|
|
|
13
|
|
|
13
|
|
2%
|
|
|
39
|
|
|
37
|
|
3%
|
|
Depreciation, amortization and accretion
|
|
|
11
|
|
|
9
|
|
24%
|
|
|
32
|
|
|
27
|
|
17%
|
|
(Gain) loss on asset disposals, net
|
|
|
1
|
|
|
1
|
|
(33)%
|
|
|
1
|
|
|
2
|
|
(24)%
|
|
|
Total operating expenses
|
|
|
50
|
|
|
46
|
|
8%
|
|
|
145
|
|
|
136
|
|
7%
|
|
|
|
|
|
|
|
|
|
|
|
|
|
|
|
|
|
|
|
|
|
|
|
Operating income
|
|
$
|
2
|
|
$
|
–
|
|
>100%
|
|
$
|
7
|
|
$
|
1
|
|
>100%
|
|
|
|
|
|
|
|
|
|
|
|
|
|
|
|
|
|
|
|
|
|
|
|
Income before income taxes
|
|
$
|
2
|
|
$
|
–
|
|
>100%
|
|
$
|
7
|
|
$
|
1
|
|
>100%
|
|
Adjusted OIBDA (Non-GAAP)1
|
|
$
|
13
|
|
$
|
10
|
|
36%
|
|
$
|
40
|
|
$
|
30
|
|
35%
|
|
Adjusted EBITDA (Non-GAAP)1
|
|
$
|
14
|
|
$
|
10
|
|
36%
|
|
$
|
41
|
|
$
|
30
|
|
36%
|
|
Capital expenditures
|
|
$
|
14
|
|
$
|
11
|
|
29%
|
|
$
|
35
|
|
$
|
41
|
|
(13)%
|
|
|
|
|
|
|
|
|
|
|
|
|
|
|
|
|
|
|
|
|
|
|
|
Numbers may not foot due to rounding.
|
|
|
|
|
|
|
|
|
|
|
|
|
|
|
|
|
|
|
|
|
|
|
|
1
|
Refer to Supplemental Information Relating to Non-GAAP Financial Measures within this MD&A for a reconciliation of this measure.
|
|
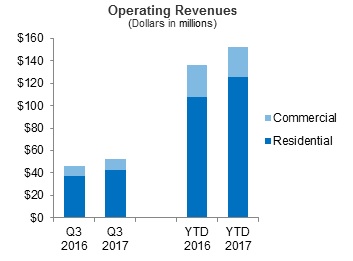
|
Residential and Commercial revenues consist of:
- Broadband services, including high-speed internet, security and support services
- Video services, including premium programming in HD, multi-room, and TV Everywhere offerings
- Voice services
|
Key components of changes in the statement of operations items were as follows:
Commentary
Residential revenues increased for the three and nine months ended September 30, 2017, due primarily to growth in broadband connections and price increases. A change in classification of certain bulk broadband and video connections increased residential revenues and reduced commercial revenues by $1 million and $4 million for the three and nine months ended September 30, 2017, respectively. Cost of services increased for the three and nine months ended September 30, 2017, due primarily to increases in programming fees. Selling, general and administrative expenses increased for the three and nine months ended September 30, 2017, due to increased IT-related expenses, offset by lower property and other taxes.
|

|
HMS OPERATIONS
|
Business Overview
Under TDS Telecom’s OneNeck IT Solutions brand, TDS Telecom offers a full suite of IT solutions ranging from equipment resale to full management and hosting of a customer’s IT infrastructure and applications. The goal of HMS operations is to create, deliver, and support a platform of IT products and services tailored for mid-market business customers.
Financial Overview — HMS
|
|
|
|
|
|
|
Three Months Ended
|
|
Nine Months Ended
|
|
|
|
|
|
|
|
September 30,
|
|
September 30,
|
|
|
|
2017
|
|
2016
|
|
2017 vs. 2016
|
|
2017
|
|
2016
|
|
2017 vs. 2016
|
|
(Dollars in millions)
|
|
|
|
|
|
|
|
|
|
|
|
|
|
|
|
|
|
Service revenues
|
|
$
|
28
|
|
$
|
29
|
|
(2)%
|
|
$
|
84
|
|
$
|
91
|
|
(7)%
|
|
Equipment and product sales
|
|
|
27
|
|
|
39
|
|
(30)%
|
|
|
93
|
|
|
121
|
|
(23)%
|
|
|
Total operating revenues
|
|
|
56
|
|
|
68
|
|
(18)%
|
|
|
178
|
|
|
212
|
|
(16)%
|
|
|
|
|
|
|
|
|
|
|
|
|
|
|
|
|
|
|
|
Cost of services (excluding Depreciation, amortization and accretion reported below)
|
|
|
21
|
|
|
21
|
|
–
|
|
|
63
|
|
|
61
|
|
2%
|
|
Cost of equipment and products
|
|
|
22
|
|
|
33
|
|
(31)%
|
|
|
77
|
|
|
101
|
|
(24)%
|
|
Selling, general and administrative
|
|
|
11
|
|
|
12
|
|
(3)%
|
|
|
32
|
|
|
37
|
|
(12)%
|
|
Depreciation, amortization and accretion
|
|
|
7
|
|
|
7
|
|
(3)%
|
|
|
21
|
|
|
22
|
|
(6)%
|
|
Loss on impairment of goodwill
|
|
|
35
|
|
|
–
|
|
N/M
|
|
|
35
|
|
|
–
|
|
N/M
|
|
|
Total operating expenses
|
|
|
96
|
|
|
72
|
|
33%
|
|
|
227
|
|
|
221
|
|
3%
|
|
|
|
|
|
|
|
|
|
|
|
|
|
|
|
|
|
|
|
|
|
|
|
Operating loss
|
|
$
|
(41)
|
|
$
|
(5)
|
|
>(100)%
|
|
$
|
(50)
|
|
$
|
(9)
|
|
>(100)%
|
|
|
|
|
|
|
|
|
|
|
|
|
|
|
|
|
|
|
|
|
|
|
|
Loss before income taxes
|
|
$
|
(42)
|
|
$
|
(6)
|
|
>(100)%
|
|
$
|
(53)
|
|
$
|
(12)
|
|
>(100)%
|
|
Adjusted OIBDA (Non-GAAP)1
|
|
$
|
1
|
|
$
|
3
|
|
(54)%
|
|
$
|
6
|
|
$
|
13
|
|
(58)%
|
|
Adjusted EBITDA (Non-GAAP)1
|
|
$
|
1
|
|
$
|
3
|
|
(52)%
|
|
$
|
6
|
|
$
|
13
|
|
(56)%
|
|
Capital expenditures
|
|
$
|
2
|
|
$
|
2
|
|
6%
|
|
$
|
13
|
|
$
|
6
|
|
>100%
|
|
|
|
|
|
|
|
|
|
|
|
|
|
|
|
|
|
|
|
|
|
|
|
Numbers may not foot due to rounding.
|
|
|
|
|
|
|
|
|
|
|
|
|
|
|
|
|
|
|
|
|
|
|
|
N/M - Percentage change not meaningful
|
|
|
|
|
|
|
|
|
|
|
|
|
|
|
|
|
|
|
|
|
|
|
|
|
|
|
|
|
|
|
|
1
|
Refer to Supplemental Information Relating to Non-GAAP Financial Measures within this MD&A for a reconciliation of this measure.
|
|
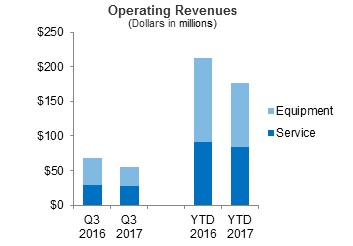
|
Service revenues consist of:
- Cloud and hosting solutions
- Managed services
- Enterprise Resource Planning (ERP) application management
- Professional services
- Colocation services
- IT hardware maintenance services
Equipment revenues consist of:
|
Key components of changes in the statement of operations items were as follows:
Commentary
Declines in hardware maintenance and installation services resulted in a decrease in Service revenues for the three and nine months ended September 30, 2017. Equipment and product sales revenues from sales of IT infrastructure hardware solutions decreased for the three and nine months ended September 30, 2017, due primarily to lower spending by existing customers in the third quarter. There was a corresponding decrease in Cost of equipment and products. Cost of services increased for the three and nine months ended September 30, 2017, due to increased employee expenses and maintenance and support costs. Selling, general and administrative expenses decreased due primarily to lower commissions associated with decreased sales.
Loss on impairment of goodwill
During the third quarter of 2017, HMS recorded a $35 million loss on impairment related to goodwill. See Note 6 – Intangible Assets in the Notes to Consolidated Financial Statements for additional information.
Liquidity and Capital Resources
Sources of Liquidity
TDS and its subsidiaries operate capital-intensive businesses. Historically, TDS has used internally-generated funds and also has obtained substantial funds from external sources for general corporate purposes. In the past, TDS’ existing cash and investment balances, funds available under its revolving credit facilities, funds from other financing sources, including a term loan and other long-term debt, and cash flows from operating, certain investing and financing activities, including sales of assets or businesses, provided sufficient liquidity and financial flexibility for TDS to meet its normal day-to-day operating needs and debt service requirements, to finance the build-out and enhancement of markets and to fund acquisitions. There is no assurance that this will be the case in the future. See Market Risk for additional information regarding maturities of long-term debt.
Although TDS currently has a significant cash balance, in certain recent periods, TDS has incurred negative free cash flow (non-GAAP metric defined as Cash flows from operating activities less Cash paid for additions to property, plant and equipment) and this will continue in the future if operating results do not improve or capital expenditures are not reduced. TDS currently expects to have negative free cash flow in 2017. However, TDS believes that existing cash and investment balances, funds available under its revolving credit facilities, and expected cash flows from operating and investing activities provide liquidity for TDS to meet its normal day-to-day operating needs and debt service requirements for the coming year.
TDS may require substantial additional capital for, among other uses, funding day-to-day operating needs including working capital, acquisitions of providers of cable, wireless or wireline telecommunications services, IT services or other businesses, spectrum license or system acquisitions, system development and network capacity expansion, debt service requirements, the repurchase of shares, the payment of dividends, or making additional investments. It may be necessary from time to time to increase the size of the existing revolving credit facilities, to put in place new credit facilities, or to obtain other forms of financing in order to fund potential expenditures. TDS is exploring a potential securitized borrowing using its equipment installment plan receivables, which may occur in 2018. TDS’ liquidity would be adversely affected if, among other things, TDS is unable to obtain short or long-term financing on acceptable terms, TDS makes significant spectrum license purchases, TDS makes significant business acquisitions, the LA Partnership discontinues or reduces distributions compared to historical levels, or Federal USF and/or other regulatory support payments decline. In addition, although sales of assets or businesses by TDS have been an important source of liquidity in prior periods, TDS does not expect a similar level of such sales in the future.
TDS’ credit rating has been sub-investment grade since 2014. There can be no assurance that sufficient funds will continue to be available to TDS or its subsidiaries on terms or at prices acceptable to TDS. Insufficient cash flows from operating activities, changes in its credit ratings, defaults of the terms of debt or credit agreements, uncertainty of access to capital, deterioration in the capital markets, reduced regulatory capital at banks which in turn limits their ability to borrow and lend, other changes in the performance of TDS or in market conditions or other factors could limit or restrict the availability of financing on terms and prices acceptable to TDS, which could require TDS to reduce its acquisition, capital expenditure and business development programs, reduce the acquisition of spectrum licenses, and/or reduce or cease share repurchases and/or the payment of dividends. TDS cannot provide assurance that circumstances that could have a material adverse effect on its liquidity or capital resources will not occur. Any of the foregoing would have an adverse impact on TDS’ businesses, financial condition or results of operations.
Cash and Cash Equivalents
Cash and cash equivalents include cash and money market investments. The primary objective of TDS’ Cash and cash equivalents investment activities is to preserve principal. Cash held by U.S. Cellular is for its operational needs and acquisition, capital expenditure and business development programs. TDS does not have direct access to U.S. Cellular cash unless U.S. Cellular pays a dividend on its common stock. U.S. Cellular has no current intention to pay a dividend to its shareholders.
|
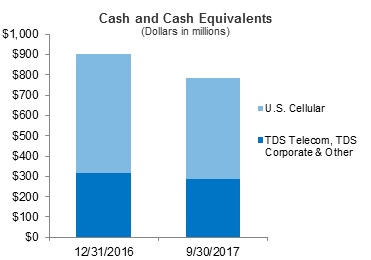
|
At December 31, 2016, TDS’ consolidated cash and cash equivalents totaled $900 million compared to $784 million at September 30, 2017.
The majority of TDS’ Cash and cash equivalents was held in bank deposit accounts and in money market funds that purchase only debt issued by the U.S. Treasury or U.S. government agencies across a range of eligible money market investments that may include, but are not limited to, government agency repurchase agreements, government agency debt, U.S. Treasury repurchase agreements, U.S. Treasury debt, and other securities collateralized by U.S. government obligations. TDS monitors the financial viability of the money market funds and direct investments in which it invests and believes that the credit risk associated with these investments is low.
|
Short-term investments
At September 30, 2017, TDS held $100 million of Short-term investments which consisted of U.S. Treasury Bills with original maturities of six months. For these investments, TDS’ objective is to earn a higher rate of return on funds that are not anticipated to be required to meet liquidity needs in the immediate future while maintaining low investment risk. See Note 2 – Fair Value Measurements in the Notes to Consolidated Financial Statements for additional details on short-term investments.
Financing
TDS and U.S. Cellular have revolving credit facilities available for general corporate purposes, including acquisitions, spectrum purchases and capital expenditures. These credit facilities mature in June 2021.
TDS and U.S. Cellular’s unused capacity under their revolving credit facilities was $399 million and $298 million, respectively, as of September 30, 2017. TDS and U.S. Cellular believe they were in compliance with all of the financial covenants and requirements set forth in their revolving credit facilities as of that date.
TDS and U.S. Cellular have in place effective shelf registration statements on Form S-3 to issue senior or subordinated debt securities.
Long-term debt payments due for the remainder of 2017 and the next four years represent less than 3% of TDS’ total long-term debt obligation as of September 30, 2017.
Capital Expenditures
Capital expenditures (i.e., additions to property, plant and equipment and system development expenditures), which include the effects of accruals and capitalized interest, in 2017 and 2016 were as follows:
|
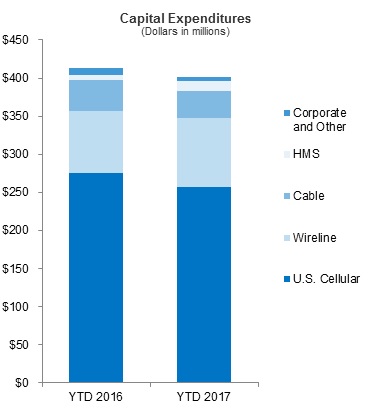
|
U.S. Cellular’s capital expenditures for the nine months ended September 30, 2016 and 2017, were $275 million and $257 million, respectively.
Capital expenditures for the full year 2017 are expected to be approximately $500 million. These expenditures are expected to be for the following general purposes:
- Expand and enhance network coverage, including providing additional capacity to accommodate increased network usage, principally data usage, by current customers;
- Deployment of VoLTE technology in certain markets;
- Expand and enhance the retail store network;
- Consolidate and upgrade its office facilities; and
- Develop and enhance billing and other systems.
TDS Telecom’s capital expenditures for the nine months ended September 30, 2016 and 2017, were $128 million and $139 million, respectively.
Capital expenditures for the full year 2017 are expected to be approximately $225 million including A-CAM. These expenditures are expected to be for the following general purposes:
- Maintain and enhance existing infrastructure at Wireline, Cable and HMS;
- Upgrade broadband capacity and speeds; and
- Support success-based spending to sustain IPTV, Cable and HMS growth.
|
TDS plans to finance its capital expenditures program for 2017 using primarily Cash flows from operating activities and existing cash balances.
Acquisitions, Divestitures and Exchanges
TDS may be engaged from time to time in negotiations (subject to all applicable regulations) relating to the acquisition, divestiture or exchange of companies, properties, wireless spectrum and other possible businesses. In general, TDS may not disclose such transactions until there is a definitive agreement. TDS assesses its business interests on an ongoing basis with a goal of improving the competitiveness of its operations and maximizing its long-term return on capital. As part of this strategy, TDS reviews attractive opportunities to acquire additional wireless operating markets and wireless spectrum; and telecommunications, cable, HMS or other possible businesses. TDS also may seek to divest outright or include in exchanges for other interests those interests that are not strategic to its long-term success.
In July 2016, the FCC announced U.S. Cellular as a qualified bidder in the FCC’s forward auction of 600 MHz spectrum licenses, referred to as Auction 1002. In April 2017, the FCC announced by way of public notice that U.S. Cellular was the winning bidder for 188 licenses for an aggregate purchase price of $329 million. Prior to commencement of the forward auction, U.S. Cellular made an upfront payment to the FCC of $143 million in June 2016. U.S. Cellular paid the remaining $186 million to the FCC and was granted the licenses during the second quarter of 2017.
In February 2016, U.S. Cellular entered into an agreement with a third party to exchange certain 700 MHz licenses for certain AWS and PCS licenses and $28 million of cash. This license exchange was accomplished in two closings. The first closing occurred in the second quarter of 2016, at which time U.S. Cellular received $13 million of cash and recorded a gain of $9 million. The second closing occurred in the first quarter of 2017, at which time U.S. Cellular received $15 million of cash and recorded a gain of $17 million.
Variable Interest Entities
TDS consolidates certain “variable interest entities” as defined under GAAP. See Note 8 — Variable Interest Entities in the Notes to Consolidated Financial Statements for additional information related to these variable interest entities. TDS may elect to make additional capital contributions and/or advances to these variable interest entities in future periods in order to fund their operations.
During the first quarter of 2017, U.S. Cellular formed USCC EIP LLC, a special purpose entity (SPE), to facilitate a potential securitized borrowing using its equipment installment plan receivables in the future. During the nine months ended September 30, 2017, net equipment installment plan receivables totaling $1,093 million were transferred to the newly formed SPE from affiliated entities. On a consolidated basis, the transfer of receivables into this SPE did not have a material impact to the financial condition of TDS.
Common Share Repurchase Programs
TDS and U.S. Cellular have repurchased and expect to continue to repurchase their Common Shares, in each case subject to any available repurchase program. Share repurchases made under these programs in 2017 and 2016 were as follows:
|
|
Number of
|
|
Average Cost
|
|
Dollar Amount
|
|
Nine Months Ended September 30,
|
Shares
|
|
Per Share
|
|
(in millions)
|
|
2017
|
|
|
|
|
|
|
|
|
|
TDS Common Shares
|
–
|
|
$
|
–
|
|
$
|
–
|
|
|
U.S. Cellular Common Shares
|
–
|
|
$
|
–
|
|
$
|
–
|
|
|
|
|
|
|
|
|
|
|
2016
|
|
|
|
|
|
|
|
|
|
TDS Common Shares
|
111,700
|
|
$
|
22.56
|
|
$
|
3
|
|
|
U.S. Cellular Common Shares
|
46,861
|
|
$
|
34.77
|
|
$
|
2
|
For additional information related to the current TDS repurchase authorization, see Unregistered Sales of Equity Securities and Use of Proceeds.
U.S. Cellular also has a share repurchase authorization. As of September 30, 2017, the total cumulative amount of U.S. Cellular Common Shares authorized to be purchased is 5,900,849.
All outstanding TDS Preferred Shares were redeemed in April 2017 for $1 million.
Contractual and Other Obligations
There were no material changes outside the ordinary course of business between December 31, 2016 and September 30, 2017, to the Contractual and Other Obligations disclosed in Management’s Discussion and Analysis of Financial Condition and Results of Operations included in TDS’ Form 10-K for the year ended December 31, 2016.
Off-Balance Sheet Arrangements
TDS had no transactions, agreements or other contractual arrangements with unconsolidated entities involving “off-balance sheet arrangements,” as defined by SEC rules, that had or are reasonably likely to have a material current or future effect on its financial condition, results of operations, liquidity, capital expenditures or capital resources.
Consolidated Cash Flow Analysis
TDS operates a capital- and marketing-intensive business. TDS makes substantial investments to acquire wireless licenses and properties and to construct and upgrade communications networks and facilities as a basis for creating long-term value for shareholders. In recent years, rapid changes in technology and new opportunities have required substantial investments in potentially revenue‑enhancing and cost-reducing upgrades to TDS’ networks. TDS utilizes cash on hand, cash from operating activities, cash proceeds from divestitures and dispositions of investments, short-term credit facilities and long-term debt financing to fund its acquisitions (including spectrum licenses), construction costs, operating expenses and share repurchases. Cash flows may fluctuate from quarter to quarter and year to year due to seasonality, the timing of acquisitions and divestitures, capital expenditures and other factors. The following discussion summarizes TDS' cash flow activities for the nine months ended September 30, 2017 and 2016.
2017 Commentary
TDS’ Cash and cash equivalents decreased $116 million in 2017. Net cash provided by operating activities was $621 million and was offset by Cash flows used for investing activities of $678 million and Cash flows used for financing activities of $59 million.
Net cash provided by operating activities consisted of net income adjusted for non-cash items of $694 million, distributions received from unconsolidated entities of $85 million, including $30 million in distributions from the LA Partnership, and changes in working capital items which decreased net cash by $158 million. The non-cash items included a $262 million loss on impairment of goodwill. The decrease resulting from changes in working capital items was due in part to a $164 million increase in equipment installment plan receivables, which are expected to continue to increase and further require the use of working capital in the near term.
Cash flows used for investing activities were $678 million. Cash paid in 2017 for additions to property, plant and equipment totaled $398 million. Cash paid for acquisitions and licenses was $200 million which included the remaining $186 million due to the FCC for licenses U.S. Cellular won in Auction 1002. Cash paid for investments was $100 million which included the purchase of short-term Treasury bills. This was partially offset by Cash received from divestitures and exchanges of $19 million. See Note 5 — Acquisitions, Divestitures and Exchanges in the Notes to Consolidated Financial Statements for additional information related to these transactions.
Cash flows used for financing activities were $59 million for the nine months ended September 30, 2017, reflecting ordinary activity such as the payment of dividends and the scheduled repayments of debt.
2016 Commentary
TDS’ Cash and cash equivalents remained flat since December 31, 2015. Net cash provided by operating activities was $638 million in 2016 due primarily to net income of $58 million plus non-cash items of $641 million and distributions received from unconsolidated entities of $55 million, including a $10 million distribution from the LA Partnership. This was partially offset by changes in working capital items which decreased cash by $116 million. The decrease in working capital items was due primarily to a $160 million increase in equipment installment plan receivables. This was partially offset by a federal tax refund of $63 million related to an overpayment of the 2015 tax liability, which resulted from the enactment of federal bonus depreciation in December 2015.
The net cash provided by operating activities was offset by Cash flows used for investing activities of $594 million. Cash paid in 2016 for additions to property, plant and equipment totaled $426 million. In June 2016, U.S. Cellular made a deposit of $143 million to the FCC for its participation in Auction 1002. Cash paid for acquisitions and licenses in 2016 was $46 million partially offset by Cash received from divestitures and exchanges of $20 million.
Cash flows used for financing activities were $44 million, reflecting ordinary activity such as the payment of dividends and the scheduled repayments of debt.
Consolidated Balance Sheet Analysis
The following discussion addresses certain captions in the consolidated balance sheet and changes therein. This discussion is intended to highlight the significant changes and is not intended to fully reconcile the changes. Changes in financial condition during 2017 are as follows:
Cash and cash equivalents
Cash and cash equivalents decreased $116 million due primarily to the purchase of $100 million in short-term investments. See the Consolidated Cash Flow analysis above for a discussion of cash and cash equivalents.
Short-term investments
Short-term investments increased $100 million due to the purchase of short-term investments, which consisted of U.S. Treasury Bills with original maturities of six months. See Note 2 — Fair Value Measurements in the Notes to Consolidated Financial Statements for additional details on short-term investments.
Inventory, net
Inventory, net decreased $44 million due primarily to overall improvements in inventory planning and procurement practices.
Licenses
Licenses increased $339 million due primarily to an aggregate winning bid of $329 million in FCC Auction 1002. These licenses were granted by the FCC in the second quarter of 2017. See Note 5 — Acquisitions, Divestitures and Exchanges in the Notes to Consolidated Financial Statements for more information about this transaction.
Goodwill
Goodwill decreased $258 million due primarily to the impairment loss recorded in the third quarter of 2017. See Note 6 — Intangible Assets in the Notes to Consolidated Financial Statements for additional information.
Accounts payable
Accounts payable decreased $57 million due primarily to reduction of expenses in 2017 as well as payment timing differences.
Accrued taxes
Accrued taxes increased $28 million due primarily to the excess of current income tax expense over federal estimated payments made during the nine months ended September 30, 2017.
Supplemental Information Relating to Non-GAAP Financial Measures
TDS sometimes uses information derived from consolidated financial information but not presented in its financial statements prepared in accordance with U.S. GAAP to evaluate the performance of its business. Certain of these measures are considered “non-GAAP financial measures” under U.S. Securities and Exchange Commission Rules. Specifically, TDS has referred to the following measures in this Form 10-Q Report:
- EBITDA
- Adjusted EBITDA
- Adjusted OIBDA
- Free cash flow
- Postpaid ABPU
- Postpaid ABPA
- Goodwill impairment, net of tax and noncontrolling interests
Following are explanations of each of these measures.
Adjusted EBITDA and Adjusted OIBDA
Adjusted EBITDA is defined as net income (loss) adjusted for the items set forth in the reconciliation below. Adjusted OIBDA is defined as net income (loss) adjusted for the items set forth in the reconciliation below. Adjusted EBITDA and Adjusted OIBDA are not measures of financial performance under GAAP and should not be considered as alternatives to Net income (loss) or Cash flows from operating activities, as indicators of cash flows or as measures of liquidity. TDS does not intend to imply that any such items set forth in the reconciliation below are non-recurring, infrequent or unusual; such items may occur in the future.
Adjusted EBITDA is a segment measure reported to the chief operating decision maker for purposes of making decisions about allocating resources to the segments and assessing their performance. See Note 10 — Business Segment Information in the Notes to Consolidated Financial Statements for additional information.
Management uses Adjusted EBITDA and Adjusted OIBDA as measurements of profitability and, therefore, reconciliations to applicable GAAP income measures are deemed appropriate. Management believes Adjusted EBITDA and Adjusted OIBDA are useful measures of TDS’ operating results before significant recurring non-cash charges, gains and losses, and other items as presented below as they provide additional relevant and useful information to investors and other users of TDS’ financial data in evaluating the effectiveness of its operations and underlying business trends in a manner that is consistent with management’s evaluation of business performance. Adjusted EBITDA shows adjusted earnings before interest, taxes, depreciation, amortization and accretion, and gains and losses, while Adjusted OIBDA reduces this measure further to exclude Equity in earnings of unconsolidated entities and Interest and dividend income in order to more effectively show the performance of operating activities excluding investment activities. The following table reconciles Adjusted EBITDA and Adjusted OIBDA to the corresponding GAAP measure, Net income or Income (loss) before income taxes. Income tax expense is not provided at the individual segment level for Wireline, Cable and HMS. TDS calculates income tax expense (benefit) for TDS Telecom in total.
|
|
|
|
Three Months Ended
|
|
Nine Months Ended
|
|
|
|
|
September 30,
|
|
September 30,
|
|
TDS ̶ CONSOLIDATED
|
2017
|
|
2016
|
|
2017
|
|
2016
|
|
(Dollars in millions)
|
|
|
|
|
|
|
|
|
|
|
|
|
Net income (loss) (GAAP)
|
$
|
(231)
|
|
$
|
16
|
|
$
|
(176)
|
|
$
|
58
|
|
Add back:
|
|
|
|
|
|
|
|
|
|
|
|
|
|
Income tax expense (benefit)
|
|
(5)
|
|
|
14
|
|
|
39
|
|
|
45
|
|
|
Interest expense
|
|
43
|
|
|
42
|
|
|
128
|
|
|
127
|
|
|
Depreciation, amortization and accretion
|
|
209
|
|
|
214
|
|
|
632
|
|
|
636
|
|
EBITDA (Non-GAAP)
|
|
16
|
|
|
286
|
|
|
623
|
|
|
866
|
|
Add back or deduct:
|
|
|
|
|
|
|
|
|
|
|
|
|
|
Loss on impairment of goodwill
|
|
262
|
|
|
–
|
|
|
262
|
|
|
–
|
|
|
(Gain) loss on sale of business and other exit costs, net
|
|
(1)
|
|
|
–
|
|
|
(1)
|
|
|
(1)
|
|
|
(Gain) loss on license sales and exchanges, net
|
|
–
|
|
|
(7)
|
|
|
(19)
|
|
|
(16)
|
|
|
(Gain) loss on asset disposals, net
|
|
6
|
|
|
8
|
|
|
16
|
|
|
20
|
|
Adjusted EBITDA (Non-GAAP)
|
|
283
|
|
|
287
|
|
|
881
|
|
|
869
|
|
Deduct:
|
|
|
|
|
|
|
|
|
|
|
|
|
|
Equity in earnings of unconsolidated entities
|
|
35
|
|
|
38
|
|
|
101
|
|
|
109
|
|
|
Interest and dividend income1
|
|
4
|
|
|
2
|
|
|
12
|
|
|
7
|
|
|
Other, net
|
|
–
|
|
|
(1)
|
|
|
–
|
|
|
1
|
|
Adjusted OIBDA (Non-GAAP)1
|
|
244
|
|
|
248
|
|
|
768
|
|
|
752
|
|
Deduct:
|
|
|
|
|
|
|
|
|
|
|
|
|
|
Depreciation, amortization and accretion
|
|
209
|
|
|
214
|
|
|
632
|
|
|
636
|
|
|
Loss on impairment of goodwill
|
|
262
|
|
|
–
|
|
|
262
|
|
|
–
|
|
|
(Gain) loss on sale of business and other exit costs, net
|
|
(1)
|
|
|
–
|
|
|
(1)
|
|
|
(1)
|
|
|
(Gain) loss on license sales and exchanges, net
|
|
–
|
|
|
(7)
|
|
|
(19)
|
|
|
(16)
|
|
|
(Gain) loss on asset disposals, net
|
|
6
|
|
|
8
|
|
|
16
|
|
|
20
|
|
Operating income (loss) (GAAP)¹
|
$
|
(232)
|
|
$
|
33
|
|
$
|
(122)
|
|
$
|
113
|
|
|
|
|
|
|
|
|
|
|
|
|
|
|
|
|
|
|
|
Three Months Ended
|
|
Nine Months Ended
|
|
|
|
|
September 30,
|
|
September 30,
|
|
U.S. CELLULAR
|
2017
|
|
2016
|
|
2017
|
|
2016
|
|
(Dollars in millions)
|
|
|
|
|
|
|
|
|
|
|
|
|
Net income (loss) (GAAP)
|
$
|
(298)
|
|
$
|
18
|
|
$
|
(259)
|
|
$
|
54
|
|
Add back:
|
|
|
|
|
|
|
|
|
|
|
|
|
|
Income tax expense (benefit)
|
|
(53)
|
|
|
15
|
|
|
(19)
|
|
|
39
|
|
|
Interest expense
|
|
28
|
|
|
28
|
|
|
85
|
|
|
84
|
|
|
Depreciation, amortization and accretion
|
|
153
|
|
|
155
|
|
|
460
|
|
|
462
|
|
EBITDA (Non-GAAP)
|
|
(170)
|
|
|
216
|
|
|
267
|
|
|
639
|
|
Add back or deduct:
|
|
|
|
|
|
|
|
|
|
|
|
|
|
Loss on impairment of goodwill
|
|
370
|
|
|
–
|
|
|
370
|
|
|
–
|
|
|
(Gain) loss on sale of business and other exit costs, net
|
|
(1)
|
|
|
–
|
|
|
(1)
|
|
|
–
|
|
|
(Gain) loss on license sales and exchanges, net
|
|
–
|
|
|
(7)
|
|
|
(19)
|
|
|
(16)
|
|
|
(Gain) loss on asset disposals, net
|
|
5
|
|
|
7
|
|
|
14
|
|
|
16
|
|
Adjusted EBITDA (Non-GAAP)
|
|
204
|
|
|
216
|
|
|
631
|
|
|
639
|
|
Deduct:
|
|
|
|
|
|
|
|
|
|
|
|
|
|
Equity in earnings of unconsolidated entities
|
|
35
|
|
|
38
|
|
|
101
|
|
|
110
|
|
|
Interest and dividend income1
|
|
2
|
|
|
1
|
|
|
6
|
|
|
4
|
|
|
Other, net
|
|
–
|
|
|
–
|
|
|
1
|
|
|
–
|
|
Adjusted OIBDA (Non-GAAP)1
|
|
167
|
|
|
177
|
|
|
523
|
|
|
525
|
|
Deduct:
|
|
|
|
|
|
|
|
|
|
|
|
|
|
Depreciation, amortization and accretion
|
|
153
|
|
|
155
|
|
|
460
|
|
|
462
|
|
|
Loss on impairment of goodwill
|
|
370
|
|
|
–
|
|
|
370
|
|
|
–
|
|
|
(Gain) loss on sale of business and other exit costs, net
|
|
(1)
|
|
|
–
|
|
|
(1)
|
|
|
–
|
|
|
(Gain) loss on license sales and exchanges, net
|
|
–
|
|
|
(7)
|
|
|
(19)
|
|
|
(16)
|
|
|
(Gain) loss on asset disposals, net
|
|
5
|
|
|
7
|
|
|
14
|
|
|
16
|
|
Operating income (loss) (GAAP)¹
|
$
|
(360)
|
|
$
|
22
|
|
$
|
(301)
|
|
$
|
63
|
|
|
|
|
|
|
|
|
|
|
|
|
|
|
|
|
|
|
|
Three Months Ended
|
|
Nine Months Ended
|
|
|
|
|
September 30,
|
|
September 30,
|
|
TDS TELECOM
|
2017
|
|
2016
|
|
2017
|
|
2016
|
|
(Dollars in millions)
|
|
|
|
|
|
|
|
|
|
|
|
|
Net income (loss) (GAAP)
|
$
|
(15)
|
|
$
|
7
|
|
$
|
18
|
|
$
|
32
|
|
Add back:
|
|
|
|
|
|
|
|
|
|
|
|
|
|
Income tax expense
|
|
3
|
|
|
4
|
|
|
24
|
|
|
20
|
|
|
Interest expense
|
|
1
|
|
|
1
|
|
|
3
|
|
|
2
|
|
|
Depreciation, amortization and accretion
|
|
56
|
|
|
57
|
|
|
166
|
|
|
168
|
|
EBITDA (Non-GAAP)
|
|
45
|
|
|
69
|
|
|
211
|
|
|
223
|
|
Add back or deduct:
|
|
|
|
|
|
|
|
|
|
|
|
|
|
Loss on impairment of goodwill
|
|
35
|
|
|
–
|
|
|
35
|
|
|
–
|
|
|
(Gain) loss on asset disposals, net
|
|
1
|
|
|
2
|
|
|
2
|
|
|
4
|
|
Adjusted EBITDA (Non-GAAP)
|
|
80
|
|
|
71
|
|
|
248
|
|
|
226
|
|
Deduct:
|
|
|
|
|
|
|
|
|
|
|
|
|
|
Interest and dividend income
|
|
2
|
|
|
1
|
|
|
4
|
|
|
2
|
|
Adjusted OIBDA (Non-GAAP)
|
|
78
|
|
|
70
|
|
|
244
|
|
|
225
|
|
Deduct:
|
|
|
|
|
|
|
|
|
|
|
|
|
|
Depreciation, amortization and accretion
|
|
56
|
|
|
57
|
|
|
166
|
|
|
168
|
|
|
Loss on impairment of goodwill
|
|
35
|
|
|
–
|
|
|
35
|
|
|
–
|
|
|
(Gain) loss on asset disposals, net
|
|
1
|
|
|
2
|
|
|
2
|
|
|
4
|
|
Operating income (loss) (GAAP)
|
$
|
(13)
|
|
$
|
12
|
|
$
|
41
|
|
$
|
53
|
|
|
|
|
|
|
|
|
|
|
|
|
|
|
|
|
Numbers may not foot due to rounding.
|
|
|
|
|
|
|
|
|
|
|
|
|
|
|
|
Three Months Ended
|
|
Nine Months Ended
|
|
|
|
|
September 30,
|
|
September 30,
|
|
WIRELINE
|
2017
|
|
2016
|
|
2017
|
|
2016
|
|
(Dollars in millions)
|
|
|
|
|
|
|
|
|
|
|
|
|
Income before income taxes (GAAP)
|
$
|
28
|
|
$
|
17
|
|
$
|
88
|
|
$
|
63
|
|
Add back:
|
|
|
|
|
|
|
|
|
|
|
|
|
|
Interest expense
|
|
–
|
|
|
–
|
|
|
–
|
|
|
(1)
|
|
|
Depreciation, amortization and accretion
|
|
38
|
|
|
41
|
|
|
114
|
|
|
119
|
|
EBITDA (Non-GAAP)
|
|
65
|
|
|
57
|
|
|
201
|
|
|
182
|
|
Add back or deduct:
|
|
|
|
|
|
|
|
|
|
|
|
|
|
(Gain) loss on asset disposals, net
|
|
–
|
|
|
1
|
|
|
1
|
|
|
2
|
|
Adjusted EBITDA (Non-GAAP)
|
|
66
|
|
|
58
|
|
|
202
|
|
|
183
|
|
Deduct:
|
|
|
|
|
|
|
|
|
|
|
|
|
|
Interest and dividend income
|
|
2
|
|
|
1
|
|
|
4
|
|
|
2
|
|
Adjusted OIBDA (Non-GAAP)
|
|
64
|
|
|
57
|
|
|
198
|
|
|
182
|
|
Deduct:
|
|
|
|
|
|
|
|
|
|
|
|
|
|
Depreciation, amortization and accretion
|
|
38
|
|
|
41
|
|
|
114
|
|
|
119
|
|
|
(Gain) loss on asset disposals, net
|
|
–
|
|
|
1
|
|
|
1
|
|
|
2
|
|
Operating income (GAAP)
|
$
|
26
|
|
$
|
16
|
|
$
|
84
|
|
$
|
61
|
|
|
|
|
|
|
|
|
|
|
|
|
|
|
|
|
Numbers may not foot due to rounding.
|
|
|
|
|
|
|
|
|
|
|
|
|
|
|
|
Three Months Ended
|
|
Nine Months Ended
|
|
|
|
|
September 30,
|
|
September 30,
|
|
CABLE
|
2017
|
|
2016
|
|
2017
|
|
2016
|
|
(Dollars in millions)
|
|
|
|
|
|
|
|
|
|
|
|
|
Income before income taxes (GAAP)
|
$
|
2
|
|
$
|
–
|
|
$
|
7
|
|
$
|
1
|
|
Add back:
|
|
|
|
|
|
|
|
|
|
|
|
|
|
Depreciation, amortization and accretion
|
|
11
|
|
|
9
|
|
|
32
|
|
|
27
|
|
EBITDA (Non-GAAP)
|
|
13
|
|
|
9
|
|
|
39
|
|
|
28
|
|
Add back or deduct:
|
|
|
|
|
|
|
|
|
|
|
|
|
|
(Gain) loss on asset disposals, net
|
|
1
|
|
|
1
|
|
|
1
|
|
|
2
|
|
Adjusted EBITDA (Non-GAAP)
|
|
14
|
|
|
10
|
|
|
41
|
|
|
30
|
|
Deduct:
|
|
|
|
|
|
|
|
|
|
|
|
|
|
Interest and dividend income
|
|
–
|
|
|
–
|
|
|
–
|
|
|
–
|
|
Adjusted OIBDA (Non-GAAP)
|
|
13
|
|
|
10
|
|
|
40
|
|
|
30
|
|
Deduct:
|
|
|
|
|
|
|
|
|
|
|
|
|
|
Depreciation, amortization and accretion
|
|
11
|
|
|
9
|
|
|
32
|
|
|
27
|
|
|
(Gain) loss on asset disposals, net
|
|
1
|
|
|
1
|
|
|
1
|
|
|
2
|
|
Operating income (GAAP)
|
$
|
2
|
|
$
|
–
|
|
$
|
7
|
|
$
|
1
|
|
|
|
|
|
|
|
|
|
|
|
|
|
|
|
|
Numbers may not foot due to rounding.
|
|
|
|
|
|
|
|
|
|
|
|
|
|
|
|
Three Months Ended
|
|
Nine Months Ended
|
|
|
|
|
September 30,
|
|
September 30,
|
|
HMS
|
2017
|
|
2016
|
|
2017
|
|
2016
|
|
(Dollars in millions)
|
|
|
|
|
|
|
|
|
|
|
|
|
Loss before income taxes (GAAP)
|
$
|
(42)
|
|
$
|
(6)
|
|
$
|
(53)
|
|
$
|
(12)
|
|
Add back:
|
|
|
|
|
|
|
|
|
|
|
|
|
|
Interest expense
|
|
1
|
|
|
1
|
|
|
3
|
|
|
3
|
|
|
Depreciation, amortization and accretion
|
|
7
|
|
|
7
|
|
|
21
|
|
|
22
|
|
EBITDA (Non-GAAP)
|
|
(34)
|
|
|
3
|
|
|
(29)
|
|
|
13
|
|
Add back or deduct:
|
|
|
|
|
|
|
|
|
|
|
|
|
|
Loss on impairment of goodwill
|
|
35
|
|
|
–
|
|
|
35
|
|
|
–
|
|
Adjusted EBITDA (Non-GAAP)
|
|
1
|
|
|
3
|
|
|
6
|
|
|
13
|
|
Deduct:
|
|
|
|
|
|
|
|
|
|
|
|
|
|
Interest and dividend income
|
|
–
|
|
|
–
|
|
|
–
|
|
|
–
|
|
Adjusted OIBDA (Non-GAAP)
|
|
1
|
|
|
3
|
|
|
6
|
|
|
13
|
|
Deduct:
|
|
|
|
|
|
|
|
|
|
|
|
|
|
Depreciation, amortization and accretion
|
|
7
|
|
|
7
|
|
|
21
|
|
|
22
|
|
|
Loss on impairment of goodwill
|
|
35
|
|
|
–
|
|
|
35
|
|
|
–
|
|
Operating loss (GAAP)
|
$
|
(41)
|
|
$
|
(5)
|
|
$
|
(50)
|
|
$
|
(9)
|
|
|
|
|
|
|
|
|
|
|
|
|
|
|
|
|
Numbers may not foot due to rounding.
|
|
|
|
|
|
|
|
|
|
|
|
|
|
|
|
|
|
|
|
|
|
|
|
|
|
|
|
1
|
Equipment installment plan interest income is reflected as a component of Service revenues consistent with an accounting policy change effective January 1, 2017. All prior period numbers have been recast to conform to this accounting change. See Note 1 — Basis of Presentation in the Notes to Consolidated Financial Statements for additional details.
|
Free Cash Flow
The following table presents Free cash flow. Management uses Free cash flow as a liquidity measure and it is defined as Cash flows from operating activities less Cash paid for additions to property, plant and equipment. Free cash flow is a non-GAAP financial measure which TDS believes may be useful to investors and other users of its financial information in evaluating liquidity, specifically, the amount of net cash generated by business operations after deducting Cash paid for additions to property, plant and equipment.
|
|
|
|
Nine Months Ended September 30,
|
|
|
2017
|
|
2016
|
|
(Dollars in millions)
|
|
|
|
|
|
|
Cash flows from operating activities (GAAP)
|
$
|
621
|
|
$
|
638
|
|
Less: Cash paid for additions to property, plant and equipment
|
|
398
|
|
|
426
|
|
|
Free cash flow (Non-GAAP)
|
$
|
223
|
|
$
|
212
|
|
|
|
|
|
|
|
|
|
Postpaid ABPU and Postpaid ABPA
U.S. Cellular presents Postpaid ABPU and Postpaid ABPA to reflect the revenue shift from Service revenues to Equipment and product sales resulting from the increased adoption of equipment installment plans. Postpaid ABPU and Postpaid ABPA, as previously defined herein, are non-GAAP financial measures which U.S. Cellular believes are useful to investors and other users of its financial information in showing trends in both service and equipment and product sales revenues received from customers.
|
|
|
|
Three Months Ended September 30,
|
|
Nine Months Ended September 30,
|
|
|
2017
|
|
2016
|
|
2017
|
|
2016
|
|
(Dollars and connection counts in millions)
|
|
|
|
|
|
|
|
|
|
|
|
|
Calculation of Postpaid ARPU
|
|
|
|
|
|
|
|
|
|
|
|
|
Postpaid service revenues
|
$
|
586
|
|
$
|
635
|
|
$
|
1,791
|
|
$
|
1,910
|
|
Average number of postpaid connections
|
|
4.50
|
|
|
4.49
|
|
|
4.48
|
|
|
4.46
|
|
Number of months in period
|
|
3
|
|
|
3
|
|
|
9
|
|
|
9
|
|
|
Postpaid ARPU (GAAP metric)
|
$
|
43.41
|
|
$
|
47.08
|
|
$
|
44.46
|
|
$
|
47.54
|
|
|
|
|
|
|
|
|
|
|
|
|
|
|
|
|
Calculation of Postpaid ABPU
|
|
|
|
|
|
|
|
|
|
|
|
|
Postpaid service revenues
|
$
|
586
|
|
$
|
635
|
|
$
|
1,791
|
|
$
|
1,910
|
|
Equipment installment plan billings
|
|
152
|
|
|
131
|
|
|
433
|
|
|
353
|
|
|
Total billings to postpaid connections
|
$
|
738
|
|
$
|
766
|
|
$
|
2,224
|
|
$
|
2,263
|
|
Average number of postpaid connections
|
|
4.50
|
|
|
4.49
|
|
|
4.48
|
|
|
4.46
|
|
Number of months in period
|
|
3
|
|
|
3
|
|
|
9
|
|
|
9
|
|
|
Postpaid ABPU (Non-GAAP metric)
|
$
|
54.71
|
|
$
|
56.79
|
|
$
|
55.21
|
|
$
|
56.34
|
|
|
|
|
|
|
|
|
|
|
|
|
|
|
|
|
Calculation of Postpaid ARPA
|
|
|
|
|
|
|
|
|
|
|
|
|
Postpaid service revenues
|
$
|
586
|
|
$
|
635
|
|
$
|
1,791
|
|
$
|
1,910
|
|
Average number of postpaid accounts
|
|
1.68
|
|
|
1.69
|
|
|
1.67
|
|
|
1.69
|
|
Number of months in period
|
|
3
|
|
|
3
|
|
|
9
|
|
|
9
|
|
|
Postpaid ARPA (GAAP metric)
|
$
|
116.36
|
|
$
|
125.31
|
|
$
|
119.26
|
|
$
|
125.21
|
|
|
|
|
|
|
|
|
|
|
|
|
|
|
|
|
Calculation of Postpaid ABPA
|
|
|
|
|
|
|
|
|
|
|
|
|
Postpaid service revenues
|
$
|
586
|
|
$
|
635
|
|
$
|
1,791
|
|
$
|
1,910
|
|
Equipment installment plan billings
|
|
152
|
|
|
131
|
|
|
433
|
|
|
353
|
|
|
Total billings to postpaid accounts
|
$
|
738
|
|
$
|
766
|
|
$
|
2,224
|
|
$
|
2,263
|
|
Average number of postpaid accounts
|
|
1.68
|
|
|
1.69
|
|
|
1.67
|
|
|
1.69
|
|
Number of months in period
|
|
3
|
|
|
3
|
|
|
9
|
|
|
9
|
|
|
Postpaid ABPA (Non-GAAP metric)
|
$
|
146.65
|
|
$
|
151.16
|
|
$
|
148.12
|
|
$
|
148.37
|
Goodwill impairment, net of tax and noncontrolling interests
The following non-GAAP financial measure isolates the total effects on net income of the current period loss on impairment of goodwill including tax and related noncontrolling interests impacts. TDS believes this measure may be useful to investors and other users of its financial information to assist in comparing the current period financial results with periods that were not impacted by such a charge.
|
|
|
Three Months Ended September 30,
|
|
Nine Months Ended September 30,
|
|
|
|
|
2017
|
|
2016
|
2017
|
|
2016
|
|
(Dollars in millions)
|
|
|
|
|
|
|
|
|
|
|
|
Goodwill impairment:
|
|
|
|
|
|
|
|
|
|
|
|
|
|
Loss on impairment of goodwill
|
$
|
262
|
|
$
|
–
|
|
$
|
262
|
|
$
|
–
|
|
|
Tax benefit on impairment of goodwill1
|
|
(20)
|
|
|
–
|
|
|
(20)
|
|
|
–
|
|
|
Net income (loss) attributable to noncontrolling interests, net of tax
|
|
(52)
|
|
|
–
|
|
|
(52)
|
|
|
–
|
|
|
Goodwill impairment, net of tax and noncontrolling interests (Non-GAAP)
|
$
|
190
|
|
$
|
–
|
|
$
|
190
|
|
$
|
–
|
|
|
|
|
|
|
|
|
|
|
|
|
|
|
1
|
Tax benefit represents the amount associated with the tax-deductible portion of the loss on goodwill impairment.
|
Application of Critical Accounting Policies and Estimates
TDS prepares its consolidated financial statements in accordance with GAAP. TDS’ significant accounting policies are discussed in detail in Note 1 — Summary of Significant Accounting Policies and Recent Accounting Pronouncements in the Notes to Consolidated Financial Statements and TDS’ Application of Critical Accounting Policies and Estimates is discussed in detail in Management’s Discussion and Analysis of Financial Condition and Results of Operations, both of which are included in TDS’ Form 10-K for the year ended December 31, 2016.
Effective January 1, 2017, TDS elected to change the classification of interest income on equipment installment plan contracts from Interest and dividend income to Service revenues in the Consolidated Statement of Operations. All prior period numbers have been recast to conform to the current year presentation. See Note 1 — Basis of Presentation in the Notes to Consolidated Financial Statements for additional information regarding this accounting change. There were no other material changes to TDS’ application of critical accounting policies and estimates during the nine months ended September 30, 2017.
Goodwill Interim Impairment Assessment
TDS adopted ASU 2017-04, Intangibles – Goodwill and Other: Simplifying the Test for Goodwill Impairment, in the third quarter of 2017 and applied the guidance to its interim goodwill impairment tests. During the third quarter of 2017, TDS recorded a loss on impairment of goodwill totaling $262 million, $227 million associated with the U.S. Cellular reporting unit and $35 million associated with the HMS reporting unit. Further, the U.S. Cellular asset group was assessed for recoverability, which resulted in no impairment. No triggering events were identified for indefinite-lived intangible assets or goodwill associated with the Wireline and Cable reporting units and the units will be tested for impairment as of part of TDS’ annual impairment review during the fourth quarter of 2017. See Note 6 — Intangible Assets in the Notes to Consolidated Financial Statements for additional details.
Management continues to monitor industry conditions and other economic factors such as the success of new and existing products and services, competition, and/or operational difficulties for negative trends. Such trends if identified, could adversely influence future forecasted cash flows, market prices on key assets such as spectrum licenses, goodwill, and franchise rights or recoverability of long-lived assets, which could result in possible impairments of such assets in future periods.
Recent Accounting Pronouncements
See Note 1 — Basis of Presentation in the Notes to Consolidated Financial Statements for information on recent accounting pronouncements.
Regulatory Matters
FCC Auction 1002
U.S. Cellular was a bidder in the FCC’s forward auction of 600 MHz spectrum licenses, referred to as Auction 1002, which concluded in March 2017. In April 2017, the FCC announced by way of public notice that U.S. Cellular was the winning bidder for 188 licenses for an aggregate purchase price of $329 million. Prior to commencement of the forward auction, U.S. Cellular made an upfront payment to the FCC of $143 million in June 2016. U.S. Cellular paid the remaining $186 million to the FCC and was granted the licenses during the second quarter of 2017.
FCC Mobility Fund Phase II Order
In October 2011, the FCC adopted its USF/Intercarrier Compensation Transformation Order (USF Order). Pursuant to this order, U.S. Cellular’s then current Federal USF support was to be phased down at the rate of 20% per year beginning July 1, 2012. The USF Order contemplated the establishment of a new mobile USF program and provided for a pause in the phase down if that program was not timely implemented by July 2014. The Phase II Connect America Mobility Fund (MF2) was not operational as of July 2014 and, therefore, as provided by the USF Order, the phase down was suspended at 60% of the baseline amount until such time as the FCC had taken steps to establish the MF2. In February 2017, the FCC adopted the MF2 Order addressing the framework for MF2 and the resumption of the phase down. The MF2 Order establishes a support fund of $453 million annually for ten years to be distributed through a market-based, multi-round reverse auction. The MF2 Order further states that the phase down of legacy support for areas that do not receive support under MF2 will commence on the first day of the month following the completion of the auction and will conclude two years later.
In August 2017, the FCC adopted the MF2 Challenge Process Order, which laid out procedures for establishing areas that would be eligible for support under the MF2 program. This will include a collection process to be followed by a challenge window, a challenge response window, and finally adjudication of any coverage disputes. In September 2017, the FCC issued a public notice initiating the collection of 4G LTE coverage data. Responses submitting the collected data are due on January 4, 2018.
In October 2017, the FCC issued a public notice proposing and seeking comment on detailed challenge procedures and a schedule for the challenge process. Under this proposal, the challenge window would begin no earlier than four weeks after the January 4 collection date and would last 150 days. No earlier than five business days after the close of the challenge window, the FCC would open a thirty-day challenge response window. Following the challenge response window, the FCC would adjudicate any disputes. This entire process must be completed before an auction can be commenced.
U.S. Cellular cannot predict at this time when the MF2 auction will occur, when the phase down period for its existing legacy support from the Federal USF will commence, or whether the MF2 auction will provide opportunities to U.S. Cellular to offset any loss in existing support. However, the FCC has indicated that it currently plans to hold the MF2 auction in 2018. U.S. Cellular currently expects that its legacy support will continue at the current level for the remainder of 2017.
FCC Notice of Proposed Rulemaking – “Restoring Internet Freedom”
In May 2017, the FCC adopted a Notice of Proposed Rulemaking (NPRM) proposing to revise decisions made in the FCC’s 2015 Open Internet and Title II Order (Restoring Internet Freedom). If adopted as proposed, the item would reverse the FCC’s decision to reclassify Broadband Internet Access Services as telecommunications services subject to regulation under Title II of the Telecommunications Act. The NPRM also sought comment on blocking, throttling, paid prioritization, and transparency rules adopted as part of the FCC’s previous rulemaking.
The NPRM is subject to public comment and further action by the FCC, and any final rules adopted may differ from those proposed in the NPRM. Also, there may be legal proceedings challenging any rule changes that are ultimately adopted. TDS cannot predict the outcome of these proceedings or the impact on its business.
Other Regulatory Matters
In March 2017, both the U.S. Senate and U.S. House of Representatives approved a joint resolution under the Congressional Review Act to repeal regulations approved by the FCC in October 2016 governing consumer privacy by broadband Internet service providers. The President approved the resolution in April 2017. The repeal removed the pending FCC rules, which would have gone into effect in 2017. The rules would have prohibited broadband internet service providers from sharing certain sensitive customer information unless customers opted in and expressly agreed to share such information. TDS will continue to protect customer information in accordance with Section 222 of the Telecommunications Act and its publicly available Privacy Statement until such time as regulators adopt other privacy requirements.
Private Securities Litigation Reform Act of 1995
Safe Harbor Cautionary Statement
This Form 10-Q, including exhibits, contains statements that are not based on historical facts and represent forward-looking statements, as this term is defined in the Private Securities Litigation Reform Act of 1995. All statements, other than statements of historical facts, that address activities, events or developments that TDS intends, expects, projects, believes, estimates, plans or anticipates will or may occur in the future are forward-looking statements. The words “believes,” “anticipates,” “estimates,” “expects,” “plans,” “intends,” “projects” and similar expressions are intended to identify these forward-looking statements, but are not the exclusive means of identifying them. Such forward-looking statements involve known and unknown risks, uncertainties and other factors that may cause actual results, events or developments to be significantly different from any future results, events or developments expressed or implied by such forward-looking statements. Such risks, uncertainties and other factors include those set forth below, as more fully described under “Risk Factors” in TDS’ Form 10-K for the year ended December 31, 2016. Each of the following risks could have a material adverse effect on TDS’ business, financial condition or results of operations. However, such factors are not necessarily all of the important factors that could cause actual results, performance or achievements to differ materially from those expressed in, or implied by, the forward-looking statements contained in this document. Other unknown or unpredictable factors also could have material adverse effects on future results, performance or achievements. TDS undertakes no obligation to update publicly any forward-looking statements whether as a result of new information, future events or otherwise. You should carefully consider the Risk Factors in TDS’ Form 10-K for the year ended December 31, 2016, the following factors and other information contained in, or incorporated by reference into, this Form 10-Q to understand the material risks relating to TDS’ business, financial condition or results of operations.
- Intense competition in the markets in which TDS operates could adversely affect TDS’ revenues or increase its costs to compete.
- A failure by TDS to successfully execute its business strategy (including planned acquisitions, spectrum acquisitions, divestitures and exchanges) or allocate resources or capital could have an adverse effect on TDS’ business, financial condition or results of operations.
- Uncertainty in TDS’ future cash flow and liquidity or in the ability to access capital, deterioration in the capital markets, other changes in TDS’ performance or market conditions, changes in TDS’ credit ratings or other factors could limit or restrict the availability of financing on terms and prices acceptable to TDS, which could require TDS to reduce its construction, development or acquisition programs, reduce the acquisition of spectrum licenses, and/or reduce or cease share repurchases and/or the payment of dividends.
- TDS has a significant amount of indebtedness which could adversely affect its financial performance and in turn adversely affect its ability to make payments on its indebtedness, comply with terms of debt covenants and incur additional debt.
- Changes in roaming practices or other factors could cause TDS’ roaming revenues to decline from current levels, roaming expenses to increase from current levels and/or impact TDS’ ability to service its customers in geographic areas where TDS does not have its own network, which could have an adverse effect on TDS’ business, financial condition or results of operations.
- A failure by TDS to obtain access to adequate radio spectrum to meet current or anticipated future needs and/or to accurately predict future needs for radio spectrum could have an adverse effect on TDS’ business, financial condition or results of operations.
- To the extent conducted by the FCC, TDS may participate in FCC auctions of additional spectrum in the future directly or indirectly and, during certain periods, will be subject to the FCC’s anti-collusion rules, which could have an adverse effect on TDS.
- Failure by TDS to timely or fully comply with any existing applicable legislative and/or regulatory requirements or changes thereto could adversely affect TDS’ business, financial condition or results of operations.
- An inability to attract people of outstanding potential, to develop their potential through education and assignments, and to retain them by keeping them engaged, challenged and properly rewarded could have an adverse effect on TDS' business, financial condition or results of operations.
- TDS’ assets are concentrated primarily in the U.S. telecommunications industry. Consequently, its operating results may fluctuate based on factors related primarily to conditions in this industry.
- TDS’ smaller scale relative to larger competitors that may have greater financial and other resources than TDS could cause TDS to be unable to compete successfully, which could adversely affect its business, financial condition or results of operations.
- Changes in various business factors, including changes in demand, customer preferences and perceptions, price competition, churn from customer switching activity and other factors, could have an adverse effect on TDS’ business, financial condition or results of operations.
- Advances or changes in technology could render certain technologies used by TDS obsolete, could put TDS at a competitive disadvantage, could reduce TDS’ revenues or could increase its costs of doing business.
- Complexities associated with deploying new technologies present substantial risk and TDS’ investments in unproven technologies may not produce the benefits that TDS expects.
- TDS receives regulatory support and is subject to numerous surcharges and fees from federal, state and local governments, and the applicability and the amount of the support and fees are subject to great uncertainty, which could have an adverse effect on TDS’ business, financial condition or results of operations.
- Performance under device purchase agreements could have a material adverse impact on TDS' business, financial condition or results of operations.
- Changes in TDS’ enterprise value, changes in the market supply or demand for wireless licenses, wireline or cable markets or IT service providers, adverse developments in the businesses or the industries in which TDS is involved and/or other factors could require TDS to recognize impairments in the carrying value of its licenses, goodwill, franchise rights and/or physical assets.
- Costs, integration problems or other factors associated with acquisitions, divestitures or exchanges of properties or licenses and/or expansion of TDS’ businesses could have an adverse effect on TDS’ business, financial condition or results of operations.
- TDS offers customers the option to purchase certain devices under installment contracts which, compared to fixed-term service contracts, includes risks that TDS may possibly incur greater churn, lower cash flows, increased costs and/or increased bad debts expense due to differences in contract terms, which could have an adverse impact on TDS' financial condition or results of operations.
- A failure by TDS to complete significant network construction and systems implementation activities as part of its plans to improve the quality, coverage, capabilities and capacity of its network, support and other systems and infrastructure could have an adverse effect on its operations.
- Difficulties involving third parties with which TDS does business, including changes in TDS’ relationships with or financial or operational difficulties of key suppliers or independent agents and third party national retailers who market TDS’ services, could adversely affect TDS’ business, financial condition or results of operations.
- TDS has significant investments in entities that it does not control. Losses in the value of such investments could have an adverse effect on TDS’ financial condition or results of operations.
- A failure by TDS to maintain flexible and capable telecommunication networks or information technology, or a material disruption thereof, could have an adverse effect on TDS’ business, financial condition or results of operations.
- TDS has experienced and, in the future, expects to experience cyber-attacks or other breaches of network or information technology security of varying degrees on a regular basis, which could have an adverse effect on TDS' business, financial condition or results of operations.
- The market price of TDS’ Common Shares is subject to fluctuations due to a variety of factors.
- Changes in facts or circumstances, including new or additional information, could require TDS to record charges in excess of amounts accrued in the financial statements, which could have an adverse effect on TDS’ business, financial condition or results of operations.
- Disruption in credit or other financial markets, a deterioration of U.S. or global economic conditions or other events could, among other things, impede TDS’ access to or increase the cost of financing its operating and investment activities and/or result in reduced revenues and lower operating income and cash flows, which would have an adverse effect on TDS’ business, financial condition or results of operations.
- Settlements, judgments, restraints on its current or future manner of doing business and/or legal costs resulting from pending and future litigation could have an adverse effect on TDS’ business, financial condition or results of operations.
- The possible development of adverse precedent in litigation or conclusions in professional studies to the effect that radio frequency emissions from wireless devices and/or cell sites cause harmful health consequences, including cancer or tumors, or may interfere with various electronic medical devices such as pacemakers, could have an adverse effect on TDS’ wireless business, financial condition or results of operations.
- Claims of infringement of intellectual property and proprietary rights of others, primarily involving patent infringement claims, could prevent TDS from using necessary technology to provide products or services or subject TDS to expensive intellectual property litigation or monetary penalties, which could have an adverse effect on TDS’ business, financial condition or results of operations.
- Certain matters, such as control by the TDS Voting Trust and provisions in the TDS Restated Certificate of Incorporation, may serve to discourage or make more difficult a change in control of TDS.
- Any of the foregoing events or other events could cause revenues, earnings, capital expenditures and/or any other financial or statistical information to vary from TDS’ forward-looking estimates by a material amount.
Risk Factors
In addition to the information set forth in this Form 10-Q, you should carefully consider the factors discussed in Part I, “Item 1A. Risk Factors” in TDS’ Annual Report on Form 10-K for the year ended December 31, 2016, which could materially affect TDS’ business, financial condition or future results. The risks described in this Form 10-Q and the Form 10-K for the year ended December 31, 2016, may not be the only risks that could affect TDS. Additional unidentified or unrecognized risks and uncertainties could materially adversely affect TDS’ business, financial condition and/or operating results. Subject to the foregoing, TDS has not identified for disclosure any material changes to the risk factors as previously disclosed in TDS’ Annual Report on Form 10-K for the year ended December 31, 2016.
Quantitative and Qualitative Disclosures about Market Risk
Market Risk
Refer to the disclosure under Market Risk in TDS’ Form 10-K for the year ended December 31, 2016, for additional information, including information regarding required principal payments and the weighted average interest rates related to TDS’ Long-term debt. There have been no material changes to such information since December 31, 2016.
See Note 2 — Fair Value Measurements in the Notes to Consolidated Financial Statements for additional information related to the fair value of TDS’ Long-term debt as of September 30, 2017.
Financial Statements
Telephone and Data Systems, Inc.
Consolidated Statement of Operations
(Unaudited)
|
|
|
|
|
Three Months Ended
|
|
Nine Months Ended
|
|
|
|
|
|
September 30,
|
|
September 30,
|
|
|
2017
|
|
2016
|
|
2017
|
|
2016
|
|
(Dollars and shares in millions, except per share amounts)
|
|
|
|
|
|
|
|
|
|
|
|
|
Operating revenues
|
|
|
|
|
|
|
|
|
|
|
|
|
|
Service
|
$
|
988
|
|
$
|
1,026
|
|
$
|
2,976
|
|
$
|
3,058
|
|
|
Equipment and product sales
|
|
263
|
|
|
288
|
|
|
760
|
|
|
805
|
|
|
|
Total operating revenues
|
|
1,251
|
|
|
1,314
|
|
|
3,736
|
|
|
3,863
|
|
|
|
|
|
|
|
|
|
|
|
|
|
|
|
|
|
Operating expenses
|
|
|
|
|
|
|
|
|
|
|
|
|
|
Cost of services (excluding Depreciation,
amortization and accretion reported below)
|
|
294
|
|
|
305
|
|
|
874
|
|
|
891
|
|
|
Cost of equipment and products
|
|
291
|
|
|
321
|
|
|
848
|
|
|
921
|
|
|
Selling, general and administrative
|
|
422
|
|
|
440
|
|
|
1,246
|
|
|
1,299
|
|
|
Depreciation, amortization and accretion
|
|
209
|
|
|
214
|
|
|
632
|
|
|
636
|
|
|
Loss on impairment of goodwill
|
|
262
|
|
|
–
|
|
|
262
|
|
|
–
|
|
|
(Gain) loss on asset disposals, net
|
|
6
|
|
|
8
|
|
|
16
|
|
|
20
|
|
|
(Gain) loss on sale of business and other exit costs, net
|
|
(1)
|
|
|
–
|
|
|
(1)
|
|
|
(1)
|
|
|
(Gain) loss on license sales and exchanges, net
|
|
–
|
|
|
(7)
|
|
|
(19)
|
|
|
(16)
|
|
|
|
Total operating expenses
|
|
1,483
|
|
|
1,281
|
|
|
3,858
|
|
|
3,750
|
|
|
|
|
|
|
|
|
|
|
|
|
|
|
|
|
|
Operating income (loss)
|
|
(232)
|
|
|
33
|
|
|
(122)
|
|
|
113
|
|
|
|
|
|
|
|
|
|
|
|
|
|
|
|
|
|
Investment and other income (expense)
|
|
|
|
|
|
|
|
|
|
|
|
|
|
Equity in earnings of unconsolidated entities
|
|
35
|
|
|
38
|
|
|
101
|
|
|
109
|
|
|
Interest and dividend income
|
|
4
|
|
|
2
|
|
|
12
|
|
|
7
|
|
|
Interest expense
|
|
(43)
|
|
|
(42)
|
|
|
(128)
|
|
|
(127)
|
|
|
Other, net
|
|
–
|
|
|
(1)
|
|
|
–
|
|
|
1
|
|
|
|
Total investment and other income (expense)
|
|
(4)
|
|
|
(3)
|
|
|
(15)
|
|
|
(10)
|
|
|
|
|
|
|
|
|
|
|
|
|
|
|
|
|
|
Income (loss) before income taxes
|
|
(236)
|
|
|
30
|
|
|
(137)
|
|
|
103
|
|
|
Income tax expense (benefit)
|
|
(5)
|
|
|
14
|
|
|
39
|
|
|
45
|
|
Net income (loss)
|
|
(231)
|
|
|
16
|
|
|
(176)
|
|
|
58
|
|
Less: Net income (loss) attributable to noncontrolling
|
|
|
|
|
|
|
|
|
|
|
|
|
interests, net of tax
|
|
(50)
|
|
|
3
|
|
|
(42)
|
|
|
9
|
|
Net income (loss) attributable to TDS shareholders
|
|
(181)
|
|
|
13
|
|
|
(134)
|
|
|
49
|
|
TDS Preferred dividend requirement
|
|
–
|
|
|
–
|
|
|
–
|
|
|
–
|
|
Net income (loss) available to TDS common shareholders
|
$
|
(181)
|
|
$
|
13
|
|
$
|
(134)
|
|
$
|
49
|
|
|
|
|
|
|
|
|
|
|
|
|
|
|
|
|
|
Basic weighted average shares outstanding
|
|
111
|
|
|
110
|
|
|
111
|
|
|
110
|
|
Basic earnings (loss) per share available to TDS common
shareholders
|
$
|
(1.64)
|
|
$
|
0.12
|
|
$
|
(1.21)
|
|
$
|
0.44
|
|
|
|
|
|
|
|
|
|
|
|
|
|
|
|
|
|
Diluted weighted average shares outstanding
|
|
111
|
|
|
111
|
|
|
111
|
|
|
111
|
|
Diluted earnings (loss) per share available to TDS common
shareholders
|
$
|
(1.64)
|
|
$
|
0.11
|
|
$
|
(1.21)
|
|
$
|
0.44
|
|
|
|
|
|
|
|
|
|
|
|
|
|
|
|
|
|
Dividends per share to TDS shareholders
|
$
|
0.155
|
|
$
|
0.148
|
|
$
|
0.465
|
|
$
|
0.444
|
|
|
|
|
|
|
|
|
|
|
|
|
|
|
|
|
|
The accompanying notes are an integral part of these consolidated financial statements.
|
Telephone and Data Systems, Inc.
Consolidated Statement of Comprehensive Income
(Unaudited)
|
|
|
|
|
|
Three Months Ended
|
|
Nine Months Ended
|
|
|
|
|
|
|
September 30,
|
|
September 30,
|
|
|
2017
|
|
2016
|
|
2017
|
|
2016
|
|
(Dollars in millions)
|
|
|
|
|
|
|
|
|
|
|
|
|
Net income (loss)
|
$
|
(231)
|
|
$
|
16
|
|
$
|
(176)
|
|
$
|
58
|
|
|
Net change in accumulated other comprehensive income (loss)
|
|
|
|
|
|
|
|
|
|
|
|
|
|
|
Change related to retirement plan
|
|
|
|
|
|
|
|
|
|
|
|
|
|
|
|
Amounts included in net periodic benefit cost
|
|
|
|
|
|
|
|
|
|
|
|
|
|
|
|
|
for the period
|
|
|
|
|
|
|
|
|
|
|
|
|
|
|
|
|
Amortization of prior service cost
|
|
–
|
|
|
–
|
|
|
(1)
|
|
|
(1)
|
|
|
|
|
Change in deferred income taxes
|
|
–
|
|
|
–
|
|
|
–
|
|
|
1
|
|
Comprehensive income (loss)
|
|
(231)
|
|
|
16
|
|
|
(177)
|
|
|
58
|
|
|
Less: Net income (loss) attributable to noncontrolling
|
|
|
|
|
|
|
|
|
|
|
|
|
|
|
interests, net of tax
|
|
(50)
|
|
|
3
|
|
|
(42)
|
|
|
9
|
|
Comprehensive income (loss) attributable to TDS shareholders
|
$
|
(181)
|
|
$
|
13
|
|
$
|
(135)
|
|
$
|
49
|
|
|
|
|
|
|
|
|
|
|
|
|
|
|
|
|
|
|
The accompanying notes are an integral part of these consolidated financial statements.
|
Telephone and Data Systems, Inc.
Consolidated Statement of Cash Flows
(Unaudited)
|
|
|
|
|
|
Nine Months Ended
|
|
|
|
|
|
|
September 30,
|
|
|
2017
|
|
2016
|
|
(Dollars in millions)
|
|
|
|
|
|
|
Cash flows from operating activities
|
|
|
|
|
|
|
|
Net income (loss)
|
$
|
(176)
|
|
$
|
58
|
|
|
Add (deduct) adjustments to reconcile net income (loss) to net cash flows
|
|
|
|
|
|
|
|
from operating activities
|
|
|
|
|
|
|
|
|
|
Depreciation, amortization and accretion
|
|
632
|
|
|
636
|
|
|
|
|
Bad debts expense
|
|
68
|
|
|
72
|
|
|
|
|
Stock-based compensation expense
|
|
34
|
|
|
29
|
|
|
|
|
Deferred income taxes, net
|
|
(23)
|
|
|
11
|
|
|
|
|
Equity in earnings of unconsolidated entities
|
|
(101)
|
|
|
(109)
|
|
|
|
|
Distributions from unconsolidated entities
|
|
85
|
|
|
55
|
|
|
|
|
Loss on impairment of goodwill
|
|
262
|
|
|
–
|
|
|
|
|
(Gain) loss on asset disposals, net
|
|
16
|
|
|
20
|
|
|
|
|
(Gain) loss on sale of business and other exit costs, net
|
|
(1)
|
|
|
(1)
|
|
|
|
|
(Gain) loss on license sales and exchanges, net
|
|
(19)
|
|
|
(16)
|
|
|
|
|
Noncash interest
|
|
2
|
|
|
2
|
|
|
|
|
Other operating activities
|
|
–
|
|
|
(3)
|
|
|
Changes in assets and liabilities from operations
|
|
|
|
|
|
|
|
|
|
Accounts receivable
|
|
(6)
|
|
|
(9)
|
|
|
|
|
Equipment installment plans receivable
|
|
(164)
|
|
|
(160)
|
|
|
|
|
Inventory
|
|
44
|
|
|
3
|
|
|
|
|
Accounts payable
|
|
(59)
|
|
|
47
|
|
|
|
|
Customer deposits and deferred revenues
|
|
(16)
|
|
|
(41)
|
|
|
|
|
Accrued taxes
|
|
41
|
|
|
77
|
|
|
|
|
Accrued interest
|
|
11
|
|
|
7
|
|
|
|
|
Other assets and liabilities
|
|
(9)
|
|
|
(40)
|
|
|
|
|
|
Net cash provided by operating activities
|
|
621
|
|
|
638
|
|
|
|
|
|
|
|
|
|
|
|
|
Cash flows from investing activities
|
|
|
|
|
|
|
|
Cash paid for additions to property, plant and equipment
|
|
(398)
|
|
|
(426)
|
|
|
Cash paid for acquisitions and licenses
|
|
(200)
|
|
|
(46)
|
|
|
Cash paid for investments
|
|
(100)
|
|
|
–
|
|
|
Cash received from divestitures and exchanges
|
|
19
|
|
|
20
|
|
|
Federal Communications Commission deposit
|
|
–
|
|
|
(143)
|
|
|
Other investing activities
|
|
1
|
|
|
1
|
|
|
|
|
|
Net cash used in investing activities
|
|
(678)
|
|
|
(594)
|
|
|
|
|
|
|
|
|
|
|
|
|
Cash flows from financing activities
|
|
|
|
|
|
|
|
Repayment of long-term debt
|
|
(9)
|
|
|
(9)
|
|
|
Issuance of long-term debt
|
|
–
|
|
|
2
|
|
|
TDS Common Shares reissued for benefit plans, net of tax payments
|
|
(1)
|
|
|
7
|
|
|
U.S. Cellular Common Shares reissued for benefit plans, net of tax payments
|
|
–
|
|
|
4
|
|
|
Repurchase of TDS Common Shares
|
|
–
|
|
|
(3)
|
|
|
Repurchase of U.S. Cellular Common Shares
|
|
–
|
|
|
(2)
|
|
|
Repurchase of TDS Preferred Shares
|
|
(1)
|
|
|
–
|
|
|
Dividends paid to TDS shareholders
|
|
(51)
|
|
|
(49)
|
|
|
Payment of debt issuance costs
|
|
–
|
|
|
(4)
|
|
|
Distributions to noncontrolling interests
|
|
(2)
|
|
|
(1)
|
|
|
Other financing activities
|
|
5
|
|
|
11
|
|
|
|
|
|
Net cash used in financing activities
|
|
(59)
|
|
|
(44)
|
|
|
|
|
|
|
|
|
|
|
|
|
Net increase (decrease) in cash and cash equivalents
|
|
(116)
|
|
|
–
|
|
|
|
|
|
|
|
|
|
|
|
|
Cash and cash equivalents
|
|
|
|
|
|
|
|
Beginning of period
|
|
900
|
|
|
985
|
|
|
End of period
|
$
|
784
|
|
$
|
985
|
|
|
|
|
|
|
|
|
|
|
|
|
The accompanying notes are an integral part of these consolidated financial statements.
|
Telephone and Data Systems, Inc.
Consolidated Balance Sheet — Assets
(Unaudited)
|
|
September 30,
|
|
December 31,
|
|
|
2017
|
|
2016
|
|
(Dollars in millions)
|
|
|
|
|
|
|
Current assets
|
|
|
|
|
|
|
|
Cash and cash equivalents
|
$
|
784
|
|
$
|
900
|
|
|
Short-term investments
|
|
100
|
|
|
–
|
|
|
Accounts receivable
|
|
|
|
|
|
|
|
|
Customers and agents, less allowances of $57 and $55, respectively
|
|
775
|
|
|
753
|
|
|
|
Other, less allowances of $1 and $2, respectively
|
|
96
|
|
|
98
|
|
|
Inventory, net
|
|
107
|
|
|
151
|
|
|
Prepaid expenses
|
|
109
|
|
|
115
|
|
|
Income taxes receivable
|
|
2
|
|
|
10
|
|
|
Other current assets
|
|
31
|
|
|
32
|
|
|
|
|
Total current assets
|
|
2,004
|
|
|
2,059
|
|
|
|
|
|
|
|
|
|
|
|
Assets held for sale
|
|
5
|
|
|
8
|
|
|
|
|
|
|
|
|
|
|
|
Licenses
|
|
2,234
|
|
|
1,895
|
|
Goodwill
|
|
508
|
|
|
766
|
|
Franchise rights
|
|
244
|
|
|
244
|
|
Other intangible assets, net of accumulated amortization of $139 and $153, respectively
|
|
26
|
|
|
33
|
|
Investments in unconsolidated entities
|
|
467
|
|
|
451
|
|
Other investments
|
|
–
|
|
|
1
|
|
|
|
|
|
|
|
|
|
|
|
Property, plant and equipment
|
|
|
|
|
|
|
|
In service and under construction
|
|
11,634
|
|
|
11,679
|
|
|
Less: Accumulated depreciation and amortization
|
|
8,297
|
|
|
8,124
|
|
|
|
|
Property, plant and equipment, net
|
|
3,337
|
|
|
3,555
|
|
|
|
|
|
|
|
|
|
|
|
Other assets and deferred charges
|
|
385
|
|
|
434
|
|
|
|
|
|
|
|
|
|
|
|
Total assets1
|
$
|
9,210
|
|
$
|
9,446
|
|
|
|
|
|
|
|
|
|
|
|
The accompanying notes are an integral part of these consolidated financial statements.
|
Telephone and Data Systems, Inc.
Consolidated Balance Sheet — Liabilities and Equity
(Unaudited)
|
|
September 30,
|
|
December 31,
|
|
|
2017
|
|
2016
|
|
(Dollars and shares in millions, except per share amounts)
|
|
|
|
|
|
|
Current liabilities
|
|
|
|
|
|
|
|
Current portion of long-term debt
|
$
|
20
|
|
$
|
12
|
|
|
Accounts payable
|
|
308
|
|
|
365
|
|
|
Customer deposits and deferred revenues
|
|
211
|
|
|
229
|
|
|
Accrued interest
|
|
22
|
|
|
11
|
|
|
Accrued taxes
|
|
72
|
|
|
44
|
|
|
Accrued compensation
|
|
112
|
|
|
127
|
|
|
Other current liabilities
|
|
84
|
|
|
99
|
|
|
|
|
Total current liabilities
|
|
829
|
|
|
887
|
|
|
|
|
|
|
|
|
|
|
|
Deferred liabilities and credits
|
|
|
|
|
|
|
|
Deferred income tax liability, net
|
|
898
|
|
|
922
|
|
|
Other deferred liabilities and credits
|
|
480
|
|
|
453
|
|
|
|
|
|
|
|
|
|
|
|
Long-term debt, net
|
|
2,443
|
|
|
2,433
|
|
|
|
|
|
|
|
|
|
|
|
Commitments and contingencies
|
|
|
|
|
|
|
|
|
|
|
|
|
|
|
|
|
Noncontrolling interests with redemption features
|
|
1
|
|
|
1
|
|
|
|
|
|
|
|
|
|
|
|
Equity
|
|
|
|
|
|
|
|
TDS shareholders’ equity
|
|
|
|
|
|
|
|
|
Series A Common and Common Shares
|
|
|
|
|
|
|
|
|
|
Authorized 290 shares (25 Series A Common and 265 Common Shares)
|
|
|
|
|
|
|
|
|
|
Issued 133 shares (7 Series A Common and 126 Common Shares)
|
|
|
|
|
|
|
|
|
|
Outstanding 111 shares (7 Series A Common and 104 Common Shares) and 110 shares (7 Series A Common and 103 Common Shares), respectively
|
|
|
|
|
|
|
|
|
|
Par Value ($.01 per share)
|
|
1
|
|
|
1
|
|
|
|
Capital in excess of par value
|
|
2,404
|
|
|
2,386
|
|
|
|
Treasury shares, at cost, 22 and 23 Common Shares, respectively
|
|
(679)
|
|
|
(698)
|
|
|
|
Accumulated other comprehensive income
|
|
–
|
|
|
1
|
|
|
|
Retained earnings
|
|
2,257
|
|
|
2,454
|
|
|
|
|
Total TDS shareholders' equity
|
|
3,983
|
|
|
4,144
|
|
|
|
|
|
|
|
|
|
|
|
|
Preferred shares
|
|
–
|
|
|
1
|
|
|
Noncontrolling interests
|
|
576
|
|
|
605
|
|
|
|
|
|
|
|
|
|
|
|
|
|
Total equity
|
|
4,559
|
|
|
4,750
|
|
|
|
|
|
|
|
|
|
|
|
Total liabilities and equity1
|
$
|
9,210
|
|
$
|
9,446
|
|
|
|
|
|
|
|
|
|
|
|
The accompanying notes are an integral part of these consolidated financial statements.
|
|
|
|
|
|
|
|
|
|
|
|
|
|
|
|
|
|
|
|
|
|
1
|
The consolidated total assets as of September 30, 2017 and December 31, 2016, include assets held by consolidated variable interest entities (VIEs) of $757 million and $804 million, respectively, which are not available to be used to settle the obligations of TDS. The consolidated total liabilities as of September 30, 2017 and December 31, 2016, include certain liabilities of consolidated VIEs of $17 million for which the creditors of the VIEs have no recourse to the general credit of TDS. See Note 8 — Variable Interest Entities for additional information.
|
|
|
|
|
|
|
|
|
|
Telephone and Data Systems, Inc.
Consolidated Statement of Changes in Equity
(Unaudited)
|
|
|
TDS Shareholders
|
|
|
|
|
|
|
|
|
|
|
|
Series A
Common and
Common
shares
|
|
Capital in
excess of
par value
|
|
Treasury
shares
|
|
Accumulated
other
comprehensive
income (loss)
|
|
Retained
earnings
|
|
Total TDS
shareholders'
equity
|
|
Preferred
shares
|
|
Noncontrolling
interests
|
|
Total equity
|
|
(Dollars in millions)
|
|
|
|
|
|
|
|
|
|
|
|
|
|
|
|
|
|
|
|
|
|
|
|
|
|
|
|
December 31, 2016
|
$
|
1
|
|
$
|
2,386
|
|
$
|
(698)
|
|
$
|
1
|
|
$
|
2,454
|
|
$
|
4,144
|
|
$
|
1
|
|
$
|
605
|
|
$
|
4,750
|
|
Net loss attributable to
TDS shareholders
|
|
–
|
|
|
–
|
|
|
–
|
|
|
–
|
|
|
(134)
|
|
|
(134)
|
|
|
–
|
|
|
–
|
|
|
(134)
|
|
Net loss attributable
to noncontrolling interests
classified as equity
|
|
–
|
|
|
–
|
|
|
–
|
|
|
–
|
|
|
–
|
|
|
–
|
|
|
–
|
|
|
(42)
|
|
|
(42)
|
|
Other comprehensive income
|
|
–
|
|
|
–
|
|
|
–
|
|
|
(1)
|
|
|
–
|
|
|
(1)
|
|
|
–
|
|
|
–
|
|
|
(1)
|
|
TDS Common and Series A
Common share dividends
|
|
–
|
|
|
–
|
|
|
–
|
|
|
–
|
|
|
(51)
|
|
|
(51)
|
|
|
–
|
|
|
–
|
|
|
(51)
|
|
Redemption of Preferred
shares
|
|
–
|
|
|
–
|
|
|
–
|
|
|
–
|
|
|
–
|
|
|
–
|
|
|
(1)
|
|
|
–
|
|
|
(1)
|
|
Dividend reinvestment plan
|
|
–
|
|
|
–
|
|
|
10
|
|
|
–
|
|
|
(2)
|
|
|
8
|
|
|
–
|
|
|
–
|
|
|
8
|
|
Incentive and compensation
plans
|
|
–
|
|
|
–
|
|
|
9
|
|
|
–
|
|
|
(10)
|
|
|
(1)
|
|
|
–
|
|
|
–
|
|
|
(1)
|
|
Adjust investment in
subsidiaries for repurchases,
issuances and other
compensation plans
|
|
–
|
|
|
5
|
|
|
–
|
|
|
–
|
|
|
–
|
|
|
5
|
|
|
–
|
|
|
15
|
|
|
20
|
|
Stock-based compensation
awards
|
|
–
|
|
|
13
|
|
|
–
|
|
|
–
|
|
|
–
|
|
|
13
|
|
|
–
|
|
|
–
|
|
|
13
|
|
Distributions to
noncontrolling interests
|
|
–
|
|
|
–
|
|
|
–
|
|
|
–
|
|
|
–
|
|
|
–
|
|
|
–
|
|
|
(2)
|
|
|
(2)
|
|
September 30, 2017
|
$
|
1
|
|
$
|
2,404
|
|
$
|
(679)
|
|
$
|
–
|
|
$
|
2,257
|
|
$
|
3,983
|
|
$
|
–
|
|
$
|
576
|
|
$
|
4,559
|
|
|
|
|
|
|
|
|
|
|
|
|
|
|
|
|
|
|
|
|
|
|
|
|
|
|
|
|
|
|
The accompanying notes are an integral part of these consolidated financial statements.
|
Telephone and Data Systems, Inc.
Consolidated Statement of Changes in Equity
(Unaudited)
|
|
|
TDS Shareholders
|
|
|
|
|
|
|
|
|
|
|
|
Series A
Common and
Common
shares
|
|
Capital in
excess of
par value
|
|
Treasury
shares
|
|
Accumulated
other
comprehensive
income (loss)
|
|
Retained
earnings
|
|
Total TDS
shareholders'
equity
|
|
Preferred
shares
|
|
Noncontrolling
interests
|
|
Total equity
|
|
(Dollars in millions)
|
|
|
|
|
|
|
|
|
|
|
|
|
|
|
|
|
|
|
|
|
|
|
|
|
|
|
|
December 31, 2015
|
$
|
1
|
|
$
|
2,365
|
|
$
|
(727)
|
|
$
|
–
|
|
$
|
2,487
|
|
$
|
4,126
|
|
$
|
1
|
|
$
|
577
|
|
$
|
4,704
|
|
Net income attributable to
TDS shareholders
|
|
–
|
|
|
–
|
|
|
–
|
|
|
–
|
|
|
49
|
|
|
49
|
|
|
–
|
|
|
–
|
|
|
49
|
|
Net income attributable
to noncontrolling interests
classified as equity
|
|
–
|
|
|
–
|
|
|
–
|
|
|
–
|
|
|
–
|
|
|
–
|
|
|
–
|
|
|
9
|
|
|
9
|
|
TDS Common and Series A
Common share dividends
|
|
–
|
|
|
–
|
|
|
–
|
|
|
–
|
|
|
(49)
|
|
|
(49)
|
|
|
–
|
|
|
–
|
|
|
(49)
|
|
Repurchase of Common
shares
|
|
–
|
|
|
–
|
|
|
(3)
|
|
|
–
|
|
|
–
|
|
|
(3)
|
|
|
–
|
|
|
–
|
|
|
(3)
|
|
Dividend reinvestment plan
|
|
–
|
|
|
2
|
|
|
5
|
|
|
–
|
|
|
–
|
|
|
7
|
|
|
–
|
|
|
–
|
|
|
7
|
|
Incentive and compensation
plans
|
|
–
|
|
|
(5)
|
|
|
22
|
|
|
–
|
|
|
(10)
|
|
|
7
|
|
|
–
|
|
|
–
|
|
|
7
|
|
Adjust investment in
subsidiaries for repurchases,
issuances and other
compensation plans
|
|
–
|
|
|
1
|
|
|
–
|
|
|
–
|
|
|
–
|
|
|
1
|
|
|
–
|
|
|
20
|
|
|
21
|
|
Stock-based compensation
awards
|
|
–
|
|
|
10
|
|
|
–
|
|
|
–
|
|
|
–
|
|
|
10
|
|
|
–
|
|
|
–
|
|
|
10
|
|
Distributions to
noncontrolling interests
|
|
–
|
|
|
–
|
|
|
–
|
|
|
–
|
|
|
–
|
|
|
–
|
|
|
–
|
|
|
(1)
|
|
|
(1)
|
|
September 30, 2016
|
$
|
1
|
|
$
|
2,373
|
|
$
|
(703)
|
|
$
|
–
|
|
$
|
2,477
|
|
$
|
4,148
|
|
$
|
1
|
|
$
|
605
|
|
$
|
4,754
|
|
|
|
|
|
|
|
|
|
|
|
|
|
|
|
|
|
|
|
|
|
|
|
|
|
|
|
|
|
|
The accompanying notes are an integral part of these consolidated financial statements.
|
Telephone and Data Systems, Inc.
Notes to Consolidated Financial Statements
Note 1 Basis of Presentation
The accounting policies of Telephone and Data Systems, Inc. (TDS) conform to accounting principles generally accepted in the United States of America (GAAP) as set forth in the Financial Accounting Standards Board (FASB) Accounting Standards Codification (ASC). The consolidated financial statements include the accounts of TDS and subsidiaries in which it has a controlling financial interest, including TDS’ 83%-owned wireless telephone subsidiary, United States Cellular Corporation (U.S. Cellular) and TDS’ wholly-owned subsidiary, TDS Telecommunications LLC (TDS Telecom). In addition, the consolidated financial statements include certain entities in which TDS has a variable interest that require consolidation under GAAP. All material intercompany accounts and transactions have been eliminated.
TDS’ business segments reflected in this Quarterly Report on Form 10-Q for the period ended September 30, 2017, are U.S. Cellular, Wireline, Cable, and Hosted and Managed Services (HMS) operations. TDS’ non-reportable other business activities are presented as “Corporate, Eliminations and Other”, which includes the operations of TDS’ wholly-owned subsidiary Suttle-Straus, Inc. (Suttle-Straus). Suttle-Straus’ financial results were not significant to TDS’ operations. All of TDS’ segments operate only in the United States, except for HMS, which includes an insignificant foreign operation. See Note 10 — Business Segment Information for summary financial information on each business segment.
The unaudited consolidated financial statements included herein have been prepared by TDS pursuant to the rules and regulations of the Securities and Exchange Commission (SEC). Certain information and disclosures normally included in financial statements prepared in accordance with GAAP have been condensed or omitted pursuant to such rules and regulations. However, TDS believes that the disclosures included herein are adequate to make the information presented not misleading. Certain numbers included herein are rounded to millions for ease of presentation; however, calculated amounts and percentages are determined using the unrounded numbers. These unaudited consolidated financial statements should be read in conjunction with the consolidated financial statements and the notes thereto included in TDS’ Annual Report on Form 10-K (Form 10-K) for the year ended December 31, 2016.
The accompanying unaudited consolidated financial statements contain all adjustments (consisting of normal recurring items, unless otherwise disclosed) necessary for the fair statement of TDS’ financial position as of September 30, 2017 and December 31, 2016, its results of operations and comprehensive income for the three and nine months ended September 30, 2017 and 2016, and its cash flows and changes in equity for the nine months ended September 30, 2017 and 2016. These results are not necessarily indicative of the results to be expected for the full year. TDS has not changed its significant accounting and reporting policies from those disclosed in its Form 10-K for the year ended December 31, 2016, except as described below.
Equipment Installment Plans
TDS equipment revenue under equipment installment plan contracts is recognized at the time the device is delivered to the end-user customer for the selling price of the device, net of any deferred imputed interest or trade-in right, if applicable. Imputed interest is reflected as a reduction to the receivable balance and recognized over the duration of the plan as Service revenues. See Note 3 — Equipment Installment Plans. Effective January 1, 2017, TDS elected to change the classification of interest income on equipment installment plan contracts from Interest and dividend income to Service revenues in the Consolidated Statement of Operations. TDS believes this classification is preferable because financing of devices as part of enrolling customers for service is an activity that is central to TDS’ operations, and it is consistent with the presentation by others in the industry. Comparative financial statements of prior years have been adjusted to apply the new classification retrospectively. As a result of this change in classification, Service revenues for the three and nine months ended September 30, 2016, increased by $13 million and $37 million, respectively, from previously reported amounts, with a corresponding decrease in Interest and dividend income. In comparison, Service revenues for the three and nine months ended September 30, 2017, include $19 million and $52 million, respectively, of equipment installment plan interest income. This change did not have an impact on Income before income taxes, Net income, or Earnings per share for the three or nine months ended September 30, 2016, nor did it have a cumulative impact to Retained earnings as of any date presented.
Recently Adopted Accounting Pronouncements
In December 2016, the FASB issued Accounting Standards Update 2016-19 Technical Corrections and Improvements (ASU 2016-19). ASU 2016-19 includes an amendment to Accounting Standards Codification Subtopic 350-40, Intangibles – Goodwill and Other – Internal-Use Software, which clarifies that a software license within the scope of the Subtopic will be accounted for as the acquisition of an intangible asset and the incurrence of a liability to the extent that the license fees are not fully paid at acquisition. TDS adopted this standard prospectively for all arrangements entered into or materially modified after January 1, 2017.
In January 2017, the FASB issued Accounting Standards Update 2017-04, Intangibles – Goodwill and Other: Simplifying the Test for Goodwill Impairment (ASU 2017-04). ASU 2017-04 eliminates Step 2 of the current goodwill impairment test. Goodwill impairment loss will be measured as the amount by which a reporting unit’s carrying amount exceeds its fair value. The loss recognized should not exceed the total amount of goodwill allocated to that reporting unit. The ASU is effective prospectively for fiscal years beginning after December 15, 2019. Early adoption is permitted. TDS elected to early adopt ASU 2017-04 and applied the new guidance to interim goodwill impairment testing performed during the third quarter of 2017. See Note 6 – Intangible Assets for the discussion of TDS’ goodwill impairment.
Recently Issued Accounting Pronouncements Not Yet Adopted
In May 2014, the FASB issued Accounting Standards Update 2014-09, Revenue from Contracts with Customers (ASU 2014-09) and has since amended the standard with Accounting Standards Update 2015-14, Revenue from Contracts with Customers: Deferral of the Effective Date, Accounting Standards Update 2016-08, Revenue from Contracts with Customers: Principal versus Agent Considerations (Reporting Revenue Gross versus Net), Accounting Standards Update 2016-10, Revenue from Contracts with Customers: Identifying Performance Obligations and Licensing, Accounting Standards Update 2016-12, Revenue from Contracts with Customers: Narrow-Scope Improvements and Practical Expedients, and Accounting Standards Update 2016-20, Technical Corrections and Improvements to Topic 606, Revenue from Contracts with Customers. These standards replace existing revenue recognition rules with a single comprehensive model to use in accounting for revenue arising from contracts with customers. ASU 2014-09, as amended, impacts TDS’ revenue recognition related to the allocation of contract revenues between various services and equipment, and the timing of when those revenues are recognized. In addition, ASU 2014-09 requires deferral of incremental contract acquisition and fulfillment costs and subsequent expense recognition over the contract period or expected customer life. Upon adoption, the cumulative effect adjustment is expected to include the establishment of contract asset and contract liability accounts with a corresponding adjustment to retained earnings to reflect the reallocation of revenues between service and equipment performance obligations for which control is transferred to customers in different periods. Reallocation impacts generally arise when bundle discounts are provided in a contract arrangement that includes equipment and service performance obligations. In these cases, the revenue will be reallocated according to the relative stand-alone selling prices of the performance obligations included in the bundle and this may be different than how the revenue is billed to the customer and recognized under current guidance. In addition, contract cost assets will be established to reflect costs that will be deferred as incremental contract acquisition costs. Incremental contract acquisition costs generally relate to commissions paid to sales associates. TDS is required to adopt ASU 2014-09, as amended, on January 1, 2018. Early adoption as of January 1, 2017, is permitted; however, TDS did not adopt early. TDS expects to transition to the new standard under the modified retrospective transition method whereby a cumulative effect adjustment to retained earnings is recognized upon adoption and the guidance is applied prospectively. TDS has identified that new systems, processes and controls are required to adopt ASU 2014-09, as amended. TDS has substantially completed the design and development of new systems to perform revenue recognition accounting under the provisions of ASU 2014-09, as amended, and is currently engaged in the process of testing these new systems. TDS is evaluating the effects that adoption of ASU 2014-09, as amended, will have on its financial position and results of operations.
In February 2016, the FASB issued Accounting Standards Update 2016-02, Leases (ASU 2016-02). ASU 2016-02 requires lessees to record a right-of-use asset and lease liability for almost all leases. This ASU does not substantially impact the lessor accounting model. However, some changes to the lessor accounting guidance were made to align with lessee accounting changes within Accounting Standards Codification (ASC) 842, Leases and certain key aspects of ASC 606, Revenue from Contracts with Customers. TDS is required to adopt ASU 2016-02 on January 1, 2019. Early adoption is permitted. Upon adoption of ASU 2016-02, TDS expects a substantial increase to assets and liabilities on its balance sheet. TDS is evaluating the full effect that adoption of ASU 2016-02 will have on its financial condition, results of operations and disclosures.
In June 2016, the FASB issued Accounting Standards Update 2016-13, Financial Instruments – Credit Losses: Measurement of Credit Losses on Financial Instruments (ASU 2016-13). ASU 2016-13 requires entities to use a new forward-looking, expected loss model to estimate credit losses. It also requires additional disclosure relating to the credit quality of trade and other receivables, including information relating to management’s estimate of credit allowances. TDS is required to adopt ASU 2016-13 on January 1, 2020. Early adoption as of January 1, 2019 is permitted. TDS is evaluating the effects that adoption of ASU 2016-13 will have on its financial position, results of operations and disclosures.
In February 2017, the FASB issued Accounting Standards Update 2017-05, Other Income – Gains and Losses from the Derecognition of Nonfinancial Assets: Clarifying the Scope of Asset Derecognition Guidance and Accounting for Partial Sales of Nonfinancial Assets (ASU 2017-05). ASU 2017-05 clarifies how entities account for the derecognition of a nonfinancial asset and adds guidance for partial sales of nonfinancial assets. TDS is required to adopt ASU 2017-05 on January 1, 2018. Early adoption is permitted. The adoption of ASU 2017-05 is not expected to have a significant impact on TDS’ financial position or results of operations.
In March 2017, the FASB issued Accounting Standards Update 2017-07, Compensation – Retirement Benefits: Improving the Presentation of Net Periodic Pension Cost and Net Periodic Postretirement Benefit Cost (ASU 2017-07). ASU 2017-07 requires that an employer report the service cost component in the same line item or items as other compensation costs arising from services rendered by the pertinent employees during the period. The other components of net periodic benefit cost must be presented separately from the service cost component and outside of Operating income in the Consolidated Statement of Operations. The guidance also specifies that only the service cost component of net benefit cost is eligible for capitalization. TDS is required to adopt ASU 2017-07 on January 1, 2018. Early adoption is permitted. The adoption of ASU 2017-07 is not expected to have a significant impact on TDS’ results of operations.
In May 2017, the FASB issued Accounting Standards Update 2017-09, Compensation – Stock Compensation (ASU 2017-09). ASU 2017-09 clarifies when changes to the terms or conditions of share-based payment awards must be accounted for as modifications. TDS is required to adopt ASU 2017-09 on January 1, 2018. Early adoption is permitted. The adoption of ASU 2017-09 is not expected to have a significant impact on TDS’ financial position or results of operations.
In July 2017, the FASB issued Accounting Standards Update 2017-11, Earnings Per Share, Distinguishing Liabilities from Equity, Derivatives and Hedging: I. Accounting for Certain Financial Instruments with Down Round Features, II. Replacement of the Indefinite Deferral for Mandatorily Redeemable Financial Instruments of Certain Nonpublic Entities and Certain Mandatorily Redeemable Noncontrolling Interests with a Scope Exception (ASU 2017-11). The amendments in Part I of ASU 2017-11 that relate to liability or equity classification of financial instruments (or embedded features) affect all entities that issue financial instruments (for example, warrants or convertible instruments) that include down round features. The amendments in Part II ASU 2017-11 do not have an accounting effect since the amendments only replace the indefinite deferral of certain guidance with a scope exception. TDS is required to adopt ASU 2017-11 on January 1, 2019. Early adoption is permitted. The adoption of ASU 2017-11 is not expected to have a significant impact on TDS’ financial position or results of operations.
In August 2017, the FASB issued Accounting Standards Update 2017-12, Derivatives and Hedging: Targeted Improvements to Accounting for Hedging Activities (ASU 2017-12). ASU 2017-12 amends hedge accounting recognition and presentation requirements to improve transparency and understandability of information disclosed in the financials as well as simplifies the application of hedge accounting guidance. TDS is required to adopt ASU 2017-12 on January 1, 2019. Early adoption is permitted. The adoption of ASU 2017-12 is not expected to have a significant impact on TDS’ financial position or results of operations.
Amounts Collected from Customers and Remitted to Governmental Authorities
TDS records amounts collected from customers and remitted to governmental authorities on a net basis within a tax liability account if the tax is assessed upon the customer and TDS merely acts as an agent in collecting the tax on behalf of the imposing governmental authority. If the tax is assessed upon TDS, then amounts collected from customers as recovery of the tax are recorded in Service revenues and amounts remitted to governmental authorities are recorded in Selling, general and administrative expenses in the Consolidated Statement of Operations. The amounts recorded gross in revenues that are billed to customers and remitted to governmental authorities totaled $20 million and $58 million for the three and nine months ended September 30, 2017, respectively, and $21 million and $65 million for the three and nine months ended September 30, 2016, respectively.
Note 2 Fair Value Measurements
As of September 30, 2017 and December 31, 2016, TDS did not have any material financial or nonfinancial assets or liabilities that were required to be recorded at fair value in its Consolidated Balance Sheet in accordance with GAAP.
The provisions of GAAP establish a fair value hierarchy that contains three levels for inputs used in fair value measurements. Level 1 inputs include quoted market prices for identical assets or liabilities in active markets. Level 2 inputs include quoted market prices for similar assets and liabilities in active markets or quoted market prices for identical assets and liabilities in inactive markets. Level 3 inputs are unobservable. A financial instrument’s level within the fair value hierarchy is based on the lowest level of any input that is significant to the fair value measurement. A financial instrument’s level within the fair value hierarchy is not representative of its expected performance or its overall risk profile and, therefore, Level 3 assets are not necessarily higher risk than Level 2 assets or Level 1 assets.
TDS has applied the provisions of fair value accounting for purposes of computing the fair value of financial instruments for disclosure purposes as displayed below.
|
|
Level within the Fair Value Hierarchy
|
|
|
|
September 30, 2017
|
|
December 31, 2016
|
|
|
|
|
|
Book Value
|
|
Fair Value
|
|
Book Value
|
|
Fair Value
|
|
(Dollars in millions)
|
|
|
|
|
|
|
|
|
|
|
|
|
|
|
|
|
Cash and cash equivalents
|
1
|
|
|
|
$
|
784
|
|
$
|
784
|
|
$
|
900
|
|
$
|
900
|
|
Short-term Investments
|
1
|
|
|
|
|
100
|
|
|
100
|
|
|
–
|
|
|
–
|
|
Long-term debt
|
|
|
|
|
|
|
|
|
|
|
|
|
|
|
|
|
|
Retail
|
2
|
|
|
|
|
1,753
|
|
|
1,825
|
|
|
1,753
|
|
|
1,741
|
|
|
Institutional
|
2
|
|
|
|
|
534
|
|
|
572
|
|
|
533
|
|
|
532
|
|
|
Other
|
2
|
|
|
|
|
199
|
|
|
198
|
|
|
208
|
|
|
207
|
|
|
|
|
|
|
|
|
|
|
|
|
|
|
|
|
|
|
|
The fair value of Cash and cash equivalents and Short-term investments approximate their book values due to the short-term nature of these financial instruments. Long-term debt excludes capital lease obligations, product financing arrangements, the current portion of Long-term debt and debt financing costs. The fair value of “Retail” Long-term debt was estimated using market prices for TDS’ 7.0% Senior Notes, 6.875% Senior Notes, 6.625% Senior Notes and 5.875% Senior Notes, and U.S. Cellular’s 6.95% Senior Notes, 7.25% 2063 Senior Notes and 7.25% 2064 Senior Notes. TDS’ “Institutional” debt consists of U.S. Cellular’s 6.7% Senior Notes which are traded over the counter. TDS’ “Other” debt consists of a senior term loan credit facility and other borrowings with financial institutions. TDS estimated the fair value of its Institutional and Other debt through a discounted cash flow analysis using the interest rates or estimated yield to maturity for each borrowing, which ranged from 0.00% to 6.63% and 0.00% to 6.93% at September 30, 2017 and December 31, 2016, respectively.
Note 3 Equipment Installment Plans
TDS sells devices to customers under equipment installment contracts over a specified time period. For certain equipment installment plans, after a specified period of time or amount of payments, the customer may have the right to upgrade to a new device and have the remaining unpaid equipment installment contract balance waived, subject to certain conditions, including trading in the original device in good working condition and signing a new equipment installment contract. TDS values this trade-in right as a guarantee liability. The guarantee liability is initially measured at fair value and is determined based on assumptions including the probability and timing of the customer upgrading to a new device and the fair value of the device being traded-in at the time of trade-in. When a customer exercises the trade-in option, both the outstanding receivable and guarantee liability balances related to the respective device are reduced to zero, and the value of the used device that is received in the transaction is recognized as inventory. If the customer does not exercise the trade-in option at the time of eligibility, TDS begins amortizing the liability and records this amortization as additional equipment revenue. As of September 30, 2017 and December 31, 2016, the guarantee liability related to these plans was $20 million and $33 million, respectively, and is reflected in Customer deposits and deferred revenues in the Consolidated Balance Sheet.
TDS equipment installment plans do not provide for explicit interest charges. Because equipment installment plans have a duration of greater than twelve months, TDS imputes interest. TDS records imputed interest as a reduction to the related accounts receivable and recognizes it over the term of the installment agreement. Equipment installment plan receivables had a weighted average effective imputed interest rate of 12.2% and 11.2% as of September 30, 2017 and December 31, 2016, respectively.
The following table summarizes equipment installment plan receivables as of September 30, 2017 and December 31, 2016.
|
|
|
September 30, 2017
|
|
December 31, 2016
|
|
(Dollars in millions)
|
|
|
|
|
|
|
|
Equipment installment plan receivables, gross
|
|
$
|
776
|
|
$
|
628
|
|
Deferred interest
|
|
|
(69)
|
|
|
(53)
|
|
Equipment installment plan receivables, net of deferred interest
|
|
|
707
|
|
|
575
|
|
Allowance for credit losses
|
|
|
(58)
|
|
|
(50)
|
|
Equipment installment plan receivables, net
|
|
$
|
649
|
|
$
|
525
|
|
|
|
|
|
|
|
|
|
Net balance presented in the Consolidated Balance Sheet as:
|
|
|
|
|
|
|
|
Accounts receivable — Customers and agents (Current portion)
|
|
$
|
387
|
|
$
|
345
|
|
Other assets and deferred charges (Non-current portion)
|
|
|
262
|
|
|
180
|
|
Equipment installment plan receivables, net
|
|
$
|
649
|
|
$
|
525
|
TDS uses various inputs, including internal data, information from the credit bureaus and other sources, to evaluate the credit profiles of its customers. From this evaluation, a credit class is assigned to the customer that determines the number of eligible lines, the amount of credit available, and the down payment requirement, if any. Customers assigned to credit classes requiring no down payment represent a lower risk category, whereas those assigned to credit classes requiring a down payment represent a higher risk category. The balance and aging of the equipment installment plan receivables on a gross basis by credit category were as follows:
|
|
|
September 30, 2017
|
|
December 31, 2016
|
|
|
|
Lower Risk
|
|
Higher Risk
|
|
Total
|
|
Lower Risk
|
|
Higher Risk
|
|
Total
|
|
(Dollars in millions)
|
|
|
|
|
|
|
|
|
|
|
|
|
|
|
|
|
|
|
|
Unbilled
|
|
$
|
713
|
|
$
|
24
|
|
$
|
737
|
|
$
|
553
|
|
$
|
38
|
|
$
|
591
|
|
Billed — current
|
|
|
26
|
|
|
1
|
|
|
27
|
|
|
23
|
|
|
2
|
|
|
25
|
|
Billed — past due
|
|
|
10
|
|
|
2
|
|
|
12
|
|
|
10
|
|
|
2
|
|
|
12
|
|
Equipment installment plan receivables, gross
|
|
$
|
749
|
|
$
|
27
|
|
$
|
776
|
|
$
|
586
|
|
$
|
42
|
|
$
|
628
|
Activity for the nine months ended September 30, 2017 and 2016, in the allowance for credit losses balance for the equipment installment plan receivables was as follows:
|
|
|
September 30, 2017
|
|
September 30, 2016
|
|
(Dollars in millions)
|
|
|
|
|
|
|
|
Allowance for credit losses, beginning of period
|
|
$
|
50
|
|
$
|
26
|
|
Bad debts expense
|
|
|
42
|
|
|
46
|
|
Write-offs, net of recoveries
|
|
|
(34)
|
|
|
(28)
|
|
Allowance for credit losses, end of period
|
|
$
|
58
|
|
$
|
44
|
Note 4 Earnings Per Share
Basic earnings per share available to TDS common shareholders is computed by dividing Net income (loss) available to TDS common shareholders by the weighted average number of common shares outstanding during the period. Diluted earnings per share available to TDS common shareholders is computed by dividing Net income (loss) available to TDS common shareholders by the weighted average number of common shares outstanding during the period adjusted to include the effects of potentially dilutive securities. Potentially dilutive securities primarily include incremental shares issuable upon the exercise of outstanding stock options and the vesting of performance and restricted stock units.
The amounts used in computing earnings per common share and the effects of potentially dilutive securities on the weighted average number of common shares were as follows:
|
|
Three Months Ended
|
|
Nine Months Ended
|
|
|
September 30,
|
|
September 30,
|
|
|
2017
|
|
2016
|
|
2017
|
|
2016
|
|
(Dollars and shares in millions, except per share amounts)
|
|
|
|
|
|
|
|
|
|
|
|
|
Basic earnings (loss) per share available to TDS common
|
|
|
|
|
|
|
|
|
|
|
|
|
|
|
shareholders:
|
|
|
|
|
|
|
|
|
|
|
|
|
|
Net income (loss) available to TDS common shareholders
used in basic earnings (loss) per share
|
$
|
(181)
|
|
$
|
13
|
|
$
|
(134)
|
|
$
|
49
|
|
Adjustments to compute diluted earnings (loss):
|
|
|
|
|
|
|
|
|
|
|
|
|
|
Noncontrolling interest adjustment
|
|
–
|
|
|
–
|
|
|
–
|
|
|
(1)
|
|
|
Net income (loss) available to TDS common shareholders
|
|
|
|
|
|
|
|
|
|
|
|
|
|
|
used in diluted earnings (loss) per share
|
$
|
(181)
|
|
$
|
13
|
|
$
|
(134)
|
|
$
|
48
|
|
|
|
|
|
|
|
|
|
|
|
|
|
|
|
|
|
|
Weighted average number of shares used in basic
|
|
|
|
|
|
|
|
|
|
|
|
|
|
earnings (loss) per share:
|
|
|
|
|
|
|
|
|
|
|
|
|
|
|
Common Shares
|
|
104
|
|
|
103
|
|
|
104
|
|
|
103
|
|
|
|
Series A Common Shares
|
|
7
|
|
|
7
|
|
|
7
|
|
|
7
|
|
|
|
|
Total
|
|
111
|
|
|
110
|
|
|
111
|
|
|
110
|
|
|
|
|
|
|
|
|
|
|
|
|
|
|
|
|
|
|
Effects of dilutive securities
|
|
–
|
|
|
1
|
|
|
–
|
|
|
1
|
|
Weighted average number of shares used in diluted
|
|
|
|
|
|
|
|
|
|
|
|
|
|
earnings (loss) per share
|
|
111
|
|
|
111
|
|
|
111
|
|
|
111
|
|
|
|
|
|
|
|
|
|
|
|
|
|
|
|
|
|
|
Basic earnings (loss) per share available to TDS common
|
|
|
|
|
|
|
|
|
|
|
|
|
|
shareholders
|
$
|
(1.64)
|
|
$
|
0.12
|
|
$
|
(1.21)
|
|
$
|
0.44
|
|
|
|
|
|
|
|
|
|
|
|
|
|
|
|
|
|
|
Diluted earnings (loss) per share available to TDS common
|
|
|
|
|
|
|
|
|
|
|
|
|
|
shareholders
|
$
|
(1.64)
|
|
$
|
0.11
|
|
$
|
(1.21)
|
|
$
|
0.44
|
Certain Common Shares issuable upon the exercise of stock options, vesting of performance and restricted stock units or conversion of preferred shares were not included in average diluted shares outstanding for the calculation of Diluted earnings (loss) per share available to TDS common shareholders because their effects were antidilutive. The number of such Common Shares excluded was 5 million shares and 6 million shares for the three and nine months ended September 30, 2017, respectively, and 4 million shares for both the three and nine months ended September 30, 2016.
Note 5 Acquisitions, Divestitures and Exchanges
In February 2016, U.S. Cellular entered into an agreement with a third party to exchange certain 700 MHz licenses for certain AWS and PCS licenses and $28 million of cash. This license exchange was accomplished in two closings. The first closing occurred in the second quarter of 2016, at which time U.S. Cellular received $13 million of cash and recorded a gain of $9 million. The second closing occurred in the first quarter of 2017, at which time U.S. Cellular received $15 million of cash and recorded a gain of $17 million.
In July 2016, the FCC announced U.S. Cellular as a qualified bidder in the FCC’s forward auction of 600 MHz spectrum licenses, referred to as Auction 1002. Prior to commencement of the forward auction, U.S. Cellular made an upfront payment to the FCC of $143 million in June 2016 to establish its initial bidding eligibility. In April 2017, the FCC announced by way of public notice that U.S. Cellular was the winning bidder for 188 licenses for an aggregate purchase price of $329 million. U.S. Cellular paid the remaining $186 million to the FCC and was granted the licenses during the second quarter of 2017.
Note 6 Intangible Assets
Activity related to Licenses and Goodwill for the nine months ended September 30, 2017, is presented below. There were no changes to Franchise rights during the nine months ended September 30, 2017. Prior to 2009, TDS accounted for U.S. Cellular’s share repurchases as step acquisitions, allocating a portion of the share repurchase value to TDS’ Licenses and Goodwill. Further, a goodwill impairment loss on the U.S. Cellular reporting unit was recognized in 2003 at TDS but not at U.S. Cellular. Consequently, U.S. Cellular’s Licenses and Goodwill on a stand-alone basis do not equal the TDS consolidated Licenses and Goodwill related to U.S. Cellular.
|
Licenses
|
|
|
|
|
|
|
|
(Dollars in millions)
|
|
|
|
Balance December 31, 2016
|
$
|
1,895
|
|
|
Acquisitions
|
|
331
|
|
|
Transferred to Assets held for sale
|
|
(5)
|
|
|
Exchanges - Licenses received
|
|
18
|
|
|
Exchanges - Licenses surrendered
|
|
(5)
|
|
Balance September 30, 2017
|
$
|
2,234
|
|
Goodwill
|
|
|
|
|
|
|
|
|
|
|
|
|
|
|
|
|
U.S. Cellular
|
|
Wireline
|
|
Cable
|
|
HMS
|
|
Total
|
|
(Dollars in millions)
|
|
|
|
|
|
|
|
|
|
|
|
|
|
|
|
Balance December 31, 2016
|
$
|
227
|
|
$
|
409
|
|
$
|
95
|
|
$
|
35
|
|
$
|
766
|
|
|
Acquisitions
|
|
–
|
|
|
–
|
|
|
4
|
|
|
–
|
|
|
4
|
|
|
Loss on impairment
|
|
(227)
|
|
|
–
|
|
|
–
|
|
|
(35)
|
|
|
(262)
|
|
Balance September 30, 2017
|
$
|
–
|
|
$
|
409
|
|
$
|
99
|
|
$
|
–
|
|
$
|
508
|
Accumulated impairment losses in prior periods were $334 million for U.S. Cellular, $29 million for Wireline, $84 million for HMS, and $4 million for Corporate and Other.
Goodwill Interim Impairment Assessment
U.S. Cellular
U.S. Cellular operates in an intensely competitive wireless industry environment and has experienced declining service revenues in recent periods. Based on recent 2017 developments, including wireless expansion plans announced by other companies and the results of the FCC’s forward auction of 600 MHz spectrum licenses and other FCC actions, U.S. Cellular anticipates increased competition for customers in its primary operating markets from new and existing market participants over the long term. In addition, the widening adoption of unlimited data plans and other data pricing constructs across the industry, including U.S. Cellular’s introduction of unlimited plans earlier in 2017, may limit the industry’s ability to monetize future growth in data usage. These factors when assessed and considered as part of its annual planning process conducted in the third quarter of each year caused management to revise its long-range financial forecast in the third quarter of 2017. Based on the factors noted above, management identified a triggering event and performed a quantitative goodwill impairment test on an interim basis.
As permitted by ASU 2017-04, TDS used a one-step quantitative approach that compared the fair value of the U.S. Cellular reporting unit to its carrying value. A discounted cash flow approach was used to value the reporting unit, using value drivers and risks specific to U.S. Cellular and the industry and current economic factors. The cash flow estimates incorporated certain assumptions that market participants would use in their estimates of fair value and may not be indicative of U.S. Cellular specific assumptions. However, the discount rate used in the analysis considers any additional risk a market participant might place on integrating the U.S. Cellular reporting unit into its operations. The most significant assumptions made in this process were the revenue growth rate (shown as a compound annual growth rate in the table below), the terminal revenue growth rate, and the discount rate.
The following table represents key assumptions used in estimating the fair value of the U.S. Cellular reporting unit as using the discounted cash flow approach.
|
Key assumptions
|
|
|
Revenue growth rate
|
0.8%
|
|
Terminal revenue growth rate
|
2.0%
|
|
Discount rate
|
9.5%
|
The results of the interim goodwill impairment test indicated that the carrying value of the U.S. Cellular reporting unit exceeded its fair value. Therefore, TDS recognized a loss on impairment of goodwill of $227 million to reduce the carrying value of goodwill for the U.S. Cellular reporting unit to zero.
In connection with the interim goodwill impairment test, conditions existed that indicated U.S. Cellular’s long-lived asset group might not be recoverable. As a result, the company performed an interim long-lived asset recoverability assessment related to the U.S. Cellular asset group and determined that no impairment of the long-lived asset group existed as of the interim assessment date.
HMS
HMS has continued to experience slower than expected service revenue growth in 2017 due primarily to the competitive nature of the hosted and managed services industry, and the portfolio of services offered by HMS compared to the industry overall. Further, revenue mix has been trending towards a higher proportion of lower margin revenue streams. These factors when assessed and considered as part of its annual planning process caused HMS management to revise its long-range forecast in the third quarter of 2017. Based on the factors noted above, management identified a triggering event and performed a quantitative goodwill impairment test on an interim basis. No other triggering events for indefinite-lived intangible assets or long-lived assets were identified.
TDS used a one-step quantitative approach that compared the fair value of the HMS reporting unit to its carrying value. TDS used the discounted cash flow approach and guideline public company method to value the HMS reporting unit. The discounted cash flow approach uses value drivers and considers risks specific to the industry as well as current economic factors. The most significant assumptions made in this process were the revenue growth rate (shown as a compound annual growth rate in the table below), the terminal revenue growth rate and the discount rate. The guideline public company method develops an indication of fair value by calculating average market pricing multiples for selected publicly-traded companies. The developed multiples were applied to applicable financial measures of the HMS reporting unit to determine fair value. The discounted cash flow approach and guideline public company method were weighted to arrive at the total fair value used for impairment testing. The weighting of methods was consistently applied in both 2017 and 2016.
The following table represents key assumptions used in estimating the fair value of the HMS reporting unit using the discounted cash flow approach.
|
Key assumptions
|
|
|
Revenue growth rate
|
3.8%
|
|
Terminal revenue growth rate
|
2.5%
|
|
Discount rate
|
10.5%
|
The results of the interim goodwill impairment test indicated that the carrying value of the HMS reporting unit exceeded its fair value. Therefore, TDS recognized a loss on impairment of goodwill of $35 million to reduce the carrying value of goodwill for the HMS reporting unit to zero.
Note 7 Investments in Unconsolidated Entities
Investments in unconsolidated entities consist of amounts invested in wireless and wireline entities in which TDS holds a noncontrolling interest. These investments are accounted for using either the equity or cost method.
The following table, which is based in part on information provided by third parties, summarizes the combined results of operations of TDS’ equity method investments.
|
|
Three Months Ended September 30,
|
|
Nine Months Ended September 30,
|
|
|
2017
|
|
2016
|
|
2017
|
|
2016
|
|
(Dollars in millions)
|
|
|
|
|
|
|
|
|
|
|
|
|
Revenues
|
$
|
1,596
|
|
$
|
1,679
|
|
$
|
4,848
|
|
$
|
5,008
|
|
Operating expenses
|
|
1,184
|
|
|
1,254
|
|
|
3,631
|
|
|
3,662
|
|
Operating income
|
|
412
|
|
|
425
|
|
|
1,217
|
|
|
1,346
|
|
Other expense, net
|
|
(2)
|
|
|
(2)
|
|
|
(4)
|
|
|
(10)
|
|
Net income
|
$
|
410
|
|
$
|
423
|
|
$
|
1,213
|
|
$
|
1,336
|
Note 8 Variable Interest Entities
Consolidated VIEs
TDS consolidates variable interest entities (VIEs) in which it has a controlling financial interest as defined by GAAP and is therefore deemed the primary beneficiary. A controlling financial interest will have both of the following characteristics: (a) the power to direct the VIE activities that most significantly impact economic performance and (b) the obligation to absorb the VIE losses and right to receive benefits that are significant to the VIE. TDS reviews these criteria initially at the time it enters into agreements and subsequently when events warranting reconsideration occur. These VIEs have risks similar to those described in the “Risk Factors” in TDS’ Form 10-K for the year ended December 31, 2016.
During the first quarter of 2017, U.S. Cellular formed USCC EIP LLC, a special purpose entity (SPE), to facilitate a potential securitized borrowing using its equipment installment plan receivables in the future. Under a Receivables Sale Agreement, U.S. Cellular wholly-owned, majority-owned and unconsolidated entities, collectively referred to as “affiliated entities”, transfer device equipment installment contracts to USCC EIP LLC. This SPE will aggregate device equipment installment plan contracts for further transfer into a separate bankruptcy remote securitization trust structure, perform servicing, collection and all other administrative activities related to accounting for equipment installment plan contracts.
USCC EIP LLC’s sole business consists of the acquisition of the receivables from U.S. Cellular affiliated entities for the future transfer of receivables into a trust. Given that U.S. Cellular has the power to direct the activities of this SPE, and that this SPE lacks sufficient equity to finance its activities, U.S. Cellular is deemed to have a controlling financial interest in the SPE and, therefore, consolidates it.
During the nine months ended September 30, 2017, net equipment installment plan receivables totaling $1,093 million were transferred to the newly formed SPE from affiliated entities. There were no receivables transferred as of December 31, 2016. Because TDS fully consolidates USCC EIP LLC, the transfer of receivables into this SPE did not have a material impact to the consolidated financial statements of TDS. As of September 30, 2017, TDS had not executed a securitized borrowing from a third party specific to its equipment installment plan receivables.
The following VIEs were formed to participate in FCC auctions of wireless spectrum and to fund, establish, and provide wireless service with respect to any FCC licenses won in the auctions:
- Advantage Spectrum, L.P. (Advantage Spectrum) and Sunshine Spectrum, Inc. (Sunshine Spectrum), the general partner of Advantage Spectrum (former general partner was Frequency Advantage, L.P. (Frequency Advantage));
- Aquinas Wireless, L.P. (Aquinas Wireless); and
- King Street Wireless, L.P. (King Street Wireless) and King Street Wireless, Inc., the general partner of King Street Wireless.
These particular VIEs are collectively referred to as designated entities. The power to direct the activities that most significantly impact the economic performance of these VIEs is shared. Specifically, the general partner of these VIEs has the exclusive right to manage, operate and control the limited partnerships and make all decisions to carry on the business of the partnerships. The general partner of each partnership needs the consent of the limited partner, an indirect TDS subsidiary, to sell or lease certain licenses, to make certain large expenditures, admit other partners or liquidate the limited partnerships. Although the power to direct the activities of these VIEs is shared, TDS has the most significant level of exposure to the variability associated with the economic performance of the VIEs, indicating that TDS is the primary beneficiary of the VIEs. Therefore, in accordance with GAAP, these VIEs are consolidated.
In January 2017, Sunshine Spectrum and the other owner of Frequency Advantage (the previous general partner of Advantage Spectrum) completed a series of transactions whereby Frequency Advantage was dissolved and Sunshine Spectrum became the new general partner of Advantage Spectrum. Consistent with its previous treatment of Frequency Advantage and in accordance with GAAP, TDS consolidates Sunshine Spectrum in its financial statements.
TDS also consolidates other VIEs that are limited partnerships that provide wireless service. A limited partnership is a variable interest entity unless the limited partners hold substantive participating rights or kick-out rights over the general partner. For certain limited partnerships, U.S. Cellular is the general partner and manages the operations. In these partnerships, the limited partners do not have substantive kick-out or participating rights and, further, such limited partners do not have the authority to remove the general partner. Therefore, these limited partnerships are also recognized as VIEs and are consolidated under the variable interest model.
The following table presents the classification and balances of the consolidated VIEs’ assets and liabilities in TDS’ Consolidated Balance Sheet.
|
|
|
|
September 30,
|
|
December 31,
|
|
|
|
|
2017
|
|
2016
|
|
(Dollars in millions)
|
|
|
|
|
|
|
Assets
|
|
|
|
|
|
|
|
Cash and cash equivalents
|
$
|
1
|
|
$
|
2
|
|
|
Accounts receivable
|
|
430
|
|
|
39
|
|
|
Other current assets
|
|
6
|
|
|
6
|
|
|
Licenses
|
|
649
|
|
|
649
|
|
|
Property, plant and equipment, net
|
|
87
|
|
|
93
|
|
|
Other assets and deferred charges
|
|
264
|
|
|
15
|
|
|
|
Total assets
|
$
|
1,437
|
|
$
|
804
|
|
|
|
|
|
|
|
|
|
|
Liabilities
|
|
|
|
|
|
|
|
Current liabilities
|
$
|
36
|
|
$
|
18
|
|
|
Deferred liabilities and credits
|
|
12
|
|
|
12
|
|
|
|
Total liabilities
|
$
|
48
|
|
$
|
30
|
Unconsolidated VIEs
TDS manages the operations of and holds a variable interest in certain other limited partnerships, but is not the primary beneficiary of these entities and, therefore, does not consolidate them under the variable interest model.
TDS’ total investment in these unconsolidated entities was $4 million and $6 million at September 30, 2017 and December 31, 2016, respectively, and is included in Investments in unconsolidated entities in TDS’ Consolidated Balance Sheet. The maximum exposure from unconsolidated VIEs is limited to the investment held by TDS in those entities.
Other Related Matters
TDS made contributions, loans and/or advances to its VIEs totaling $724 million, of which $701 million is related to USCC EIP LLC as discussed above, and $100 million during the nine months ended September 30, 2017 and September 30, 2016, respectively. TDS may agree to make additional capital contributions and/or advances to these or other VIEs and/or to their general partners to provide additional funding for operations or the development of licenses granted in various auctions. TDS may finance such amounts with a combination of cash on hand, borrowings under its revolving credit agreement and/or other long-term debt. There is no assurance that TDS will be able to obtain additional financing on commercially reasonable terms or at all to provide such financial support.
Note 9 Noncontrolling Interests
The following schedule discloses the effects of Net income (loss) attributable to TDS shareholders and changes in TDS’ ownership interest in U.S. Cellular on TDS’ equity:
|
Nine Months Ended September 30,
|
2017
|
|
2016
|
|
(Dollars in millions)
|
|
|
|
|
|
|
Net income (loss) attributable to TDS shareholders
|
$
|
(134)
|
|
$
|
49
|
|
Transfers to noncontrolling interests
|
|
|
|
|
|
|
Change in TDS' Capital in excess of par value from U.S. Cellular's issuance of
U.S. Cellular shares
|
|
(12)
|
|
|
(15)
|
|
Change in TDS' Capital in excess of par value from U.S. Cellular's repurchases of
U.S. Cellular shares
|
|
–
|
|
|
–
|
|
Purchase of ownership in subsidiaries from noncontrolling interests
|
|
–
|
|
|
–
|
|
Net transfers to noncontrolling interests
|
|
(12)
|
|
|
(15)
|
|
Change from net income (loss) attributable to TDS and transfers to
noncontrolling interests
|
$
|
(146)
|
|
$
|
34
|
Note 10 Business Segment Information
U.S. Cellular and TDS Telecom are billed for all services they receive from TDS, consisting primarily of information processing, accounting and finance, and general management services. Such billings are based on expenses specifically identified to U.S. Cellular and TDS Telecom and on allocations of common expenses. Management believes the method used to allocate common expenses is reasonable and that all expenses and costs applicable to U.S. Cellular and TDS Telecom are reflected in the accompanying business segment information on a basis that is representative of what they would have been if U.S. Cellular and TDS Telecom operated on a stand-alone basis.
Financial data for TDS’ reportable segments for the three and nine month periods ended, or as of September 30, 2017 and 2016, is as follows. See Note 1 — Basis of Presentation for additional information.
|
|
|
|
|
|
|
|
TDS Telecom
|
|
|
|
|
|
|
|
Three Months Ended or as of September 30, 2017
|
|
U.S. Cellular
|
|
Wireline
|
|
Cable
|
|
HMS
|
|
TDS Telecom Eliminations
|
|
TDS Telecom Total
|
|
Corporate, Eliminations and Other
|
|
Total
|
|
(Dollars in millions)
|
|
|
|
|
|
|
|
|
|
|
|
|
|
|
|
|
|
|
|
|
|
|
|
|
|
Operating revenues
|
|
|
|
|
|
|
|
|
|
|
|
|
|
|
|
|
|
|
|
|
|
|
|
|
|
|
Service1
|
|
$
|
737
|
|
$
|
178
|
|
$
|
52
|
|
$
|
28
|
|
$
|
(1)
|
|
$
|
257
|
|
$
|
(6)
|
|
$
|
988
|
|
|
Equipment and product sales
|
|
|
226
|
|
|
–
|
|
|
–
|
|
|
27
|
|
|
–
|
|
|
28
|
|
|
9
|
|
|
263
|
|
|
|
Total operating revenues1
|
|
|
963
|
|
|
179
|
|
|
52
|
|
|
56
|
|
|
(1)
|
|
|
285
|
|
|
3
|
|
|
1,251
|
|
Cost of services (excluding Depreciation, amortization
|
|
|
|
|
|
|
|
|
|
|
|
|
|
|
|
|
|
|
|
|
|
|
|
|
|
|
and accretion reported below)
|
|
|
185
|
|
|
66
|
|
|
25
|
|
|
21
|
|
|
(1)
|
|
|
110
|
|
|
(1)
|
|
|
294
|
|
Cost of equipment and products
|
|
|
261
|
|
|
–
|
|
|
–
|
|
|
22
|
|
|
–
|
|
|
23
|
|
|
7
|
|
|
291
|
|
Selling, general and administrative
|
|
|
350
|
|
|
49
|
|
|
13
|
|
|
11
|
|
|
–
|
|
|
73
|
|
|
(1)
|
|
|
422
|
|
Depreciation, amortization and accretion
|
|
|
153
|
|
|
38
|
|
|
11
|
|
|
7
|
|
|
–
|
|
|
56
|
|
|
–
|
|
|
209
|
|
Loss on impairment of goodwill2
|
|
|
370
|
|
|
–
|
|
|
–
|
|
|
35
|
|
|
–
|
|
|
35
|
|
|
(143)
|
|
|
262
|
|
(Gain) loss on asset disposals, net
|
|
|
5
|
|
|
–
|
|
|
1
|
|
|
–
|
|
|
–
|
|
|
1
|
|
|
–
|
|
|
6
|
|
(Gain) loss on sale of business and other exit costs, net
|
|
|
(1)
|
|
|
–
|
|
|
–
|
|
|
–
|
|
|
–
|
|
|
–
|
|
|
–
|
|
|
(1)
|
|
Operating income (loss)1
|
|
|
(360)
|
|
|
26
|
|
|
2
|
|
|
(41)
|
|
|
–
|
|
|
(13)
|
|
|
141
|
|
|
(232)
|
|
Equity in earnings of unconsolidated entities
|
|
|
35
|
|
|
–
|
|
|
–
|
|
|
–
|
|
|
–
|
|
|
–
|
|
|
–
|
|
|
35
|
|
Interest and dividend income1
|
|
|
2
|
|
|
2
|
|
|
–
|
|
|
–
|
|
|
–
|
|
|
2
|
|
|
–
|
|
|
4
|
|
Interest expense
|
|
|
(28)
|
|
|
–
|
|
|
–
|
|
|
(1)
|
|
|
–
|
|
|
(1)
|
|
|
(14)
|
|
|
(43)
|
|
Other, net
|
|
|
–
|
|
|
–
|
|
|
–
|
|
|
–
|
|
|
–
|
|
|
–
|
|
|
–
|
|
|
–
|
|
Income (loss) before income taxes
|
|
|
(351)
|
|
|
28
|
|
|
2
|
|
|
(42)
|
|
|
–
|
|
|
(12)
|
|
|
127
|
|
|
(236)
|
|
Income tax expense (benefit)3
|
|
|
(53)
|
|
|
|
|
|
|
|
|
|
|
|
|
|
|
3
|
|
|
45
|
|
|
(5)
|
|
Net income (loss)
|
|
|
(298)
|
|
|
|
|
|
|
|
|
|
|
|
|
|
|
(15)
|
|
|
82
|
|
|
(231)
|
|
Add back:
|
|
|
|
|
|
|
|
|
|
|
|
|
|
|
|
|
|
|
|
|
|
|
|
|
|
Depreciation, amortization and accretion
|
|
|
153
|
|
|
38
|
|
|
11
|
|
|
7
|
|
|
–
|
|
|
56
|
|
|
–
|
|
|
209
|
|
Loss on impairment of goodwill2
|
|
|
370
|
|
|
–
|
|
|
–
|
|
|
35
|
|
|
–
|
|
|
35
|
|
|
(143)
|
|
|
262
|
|
(Gain) loss on asset disposals, net
|
|
|
5
|
|
|
–
|
|
|
1
|
|
|
–
|
|
|
–
|
|
|
1
|
|
|
–
|
|
|
6
|
|
(Gain) loss on sale of business and other exit costs, net
|
|
|
(1)
|
|
|
–
|
|
|
–
|
|
|
–
|
|
|
–
|
|
|
–
|
|
|
–
|
|
|
(1)
|
|
Interest expense
|
|
|
28
|
|
|
–
|
|
|
–
|
|
|
1
|
|
|
–
|
|
|
1
|
|
|
14
|
|
|
43
|
|
Income tax expense (benefit)3
|
|
|
(53)
|
|
|
|
|
|
|
|
|
|
|
|
|
|
|
3
|
|
|
45
|
|
|
(5)
|
|
Adjusted EBITDA4
|
|
$
|
204
|
|
$
|
66
|
|
$
|
14
|
|
$
|
1
|
|
$
|
–
|
|
$
|
80
|
|
$
|
(1)
|
|
$
|
283
|
|
|
|
|
|
|
|
|
|
|
|
|
|
|
|
|
|
|
|
|
|
|
|
|
|
|
|
|
|
Investments in unconsolidated entities
|
|
$
|
429
|
|
$
|
4
|
|
$
|
–
|
|
$
|
–
|
|
$
|
–
|
|
$
|
4
|
|
$
|
34
|
|
$
|
467
|
|
Total assets
|
|
$
|
6,780
|
|
$
|
1,201
|
|
$
|
619
|
|
$
|
208
|
|
$
|
–
|
|
$
|
2,028
|
|
$
|
402
|
|
$
|
9,210
|
|
Capital expenditures
|
|
$
|
112
|
|
$
|
41
|
|
$
|
14
|
|
$
|
2
|
|
$
|
–
|
|
$
|
58
|
|
$
|
2
|
|
$
|
172
|
|
|
|
|
|
|
|
|
|
|
|
|
|
|
|
|
|
|
|
|
|
|
|
|
|
|
|
|
|
Numbers may not foot due to rounding.
|
|
|
|
|
|
|
|
|
|
|
|
|
|
|
|
|
|
|
|
|
|
|
|
|
|
|
|
|
|
TDS Telecom
|
|
|
|
|
|
|
|
Three Months Ended or as of September 30, 2016
|
|
U.S. Cellular
|
|
Wireline
|
|
Cable
|
|
HMS
|
|
TDS Telecom Eliminations
|
|
TDS Telecom Total
|
|
Corporate, Eliminations and Other
|
|
Total
|
|
(Dollars in millions)
|
|
|
|
|
|
|
|
|
|
|
|
|
|
|
|
|
|
|
|
|
|
|
|
|
|
Operating revenues
|
|
|
|
|
|
|
|
|
|
|
|
|
|
|
|
|
|
|
|
|
|
|
|
|
|
|
Service1
|
|
$
|
784
|
|
$
|
174
|
|
$
|
46
|
|
$
|
29
|
|
$
|
(1)
|
|
$
|
248
|
|
$
|
(6)
|
|
$
|
1,026
|
|
|
Equipment and product sales
|
|
|
239
|
|
|
–
|
|
|
–
|
|
|
39
|
|
|
–
|
|
|
39
|
|
|
10
|
|
|
288
|
|
|
|
Total operating revenues1
|
|
|
1,023
|
|
|
175
|
|
|
46
|
|
|
68
|
|
|
(1)
|
|
|
287
|
|
|
4
|
|
|
1,314
|
|
Cost of services (excluding Depreciation, amortization
|
|
|
|
|
|
|
|
|
|
|
|
|
|
|
|
|
|
|
|
|
|
|
|
|
|
|
and accretion reported below)
|
|
|
196
|
|
|
67
|
|
|
23
|
|
|
21
|
|
|
(1)
|
|
|
110
|
|
|
(1)
|
|
|
305
|
|
Cost of equipment and products
|
|
|
280
|
|
|
1
|
|
|
–
|
|
|
33
|
|
|
–
|
|
|
33
|
|
|
8
|
|
|
321
|
|
Selling, general and administrative
|
|
|
370
|
|
|
50
|
|
|
13
|
|
|
12
|
|
|
–
|
|
|
75
|
|
|
(5)
|
|
|
440
|
|
Depreciation, amortization and accretion5
|
|
|
155
|
|
|
41
|
|
|
9
|
|
|
7
|
|
|
–
|
|
|
57
|
|
|
2
|
|
|
214
|
|
(Gain) loss on asset disposals, net
|
|
|
7
|
|
|
1
|
|
|
1
|
|
|
–
|
|
|
–
|
|
|
2
|
|
|
(1)
|
|
|
8
|
|
(Gain) loss on sale of business and other exit costs, net
|
|
|
–
|
|
|
–
|
|
|
–
|
|
|
–
|
|
|
–
|
|
|
–
|
|
|
–
|
|
|
–
|
|
(Gain) loss on license sales and exchanges, net
|
|
|
(7)
|
|
|
–
|
|
|
–
|
|
|
–
|
|
|
–
|
|
|
–
|
|
|
–
|
|
|
(7)
|
|
Operating income (loss)1
|
|
|
22
|
|
|
16
|
|
|
–
|
|
|
(5)
|
|
|
–
|
|
|
12
|
|
|
(1)
|
|
|
33
|
|
Equity in earnings of unconsolidated entities
|
|
|
38
|
|
|
–
|
|
|
–
|
|
|
–
|
|
|
–
|
|
|
–
|
|
|
–
|
|
|
38
|
|
Interest and dividend income1
|
|
|
1
|
|
|
1
|
|
|
–
|
|
|
–
|
|
|
–
|
|
|
1
|
|
|
–
|
|
|
2
|
|
Interest expense
|
|
|
(28)
|
|
|
–
|
|
|
–
|
|
|
(1)
|
|
|
–
|
|
|
(1)
|
|
|
(13)
|
|
|
(42)
|
|
Other, net
|
|
|
–
|
|
|
–
|
|
|
–
|
|
|
–
|
|
|
–
|
|
|
–
|
|
|
(1)
|
|
|
(1)
|
|
Income (loss) before income taxes
|
|
|
33
|
|
|
17
|
|
|
–
|
|
|
(6)
|
|
|
–
|
|
|
11
|
|
|
(14)
|
|
|
30
|
|
Income tax expense (benefit)3
|
|
|
15
|
|
|
|
|
|
|
|
|
|
|
|
|
|
|
4
|
|
|
(5)
|
|
|
14
|
|
Net income (loss)
|
|
|
18
|
|
|
|
|
|
|
|
|
|
|
|
|
|
|
7
|
|
|
(9)
|
|
|
16
|
|
Add back:
|
|
|
|
|
|
|
|
|
|
|
|
|
|
|
|
|
|
|
|
|
|
|
|
|
|
Depreciation, amortization and accretion5
|
|
|
155
|
|
|
41
|
|
|
9
|
|
|
7
|
|
|
–
|
|
|
57
|
|
|
2
|
|
|
214
|
|
(Gain) loss on asset disposals, net
|
|
|
7
|
|
|
1
|
|
|
1
|
|
|
–
|
|
|
–
|
|
|
2
|
|
|
(1)
|
|
|
8
|
|
(Gain) loss on sale of business and other exit costs, net
|
|
|
–
|
|
|
–
|
|
|
–
|
|
|
–
|
|
|
–
|
|
|
–
|
|
|
–
|
|
|
–
|
|
(Gain) loss on license sales and exchanges, net
|
|
|
(7)
|
|
|
–
|
|
|
–
|
|
|
–
|
|
|
–
|
|
|
–
|
|
|
–
|
|
|
(7)
|
|
Interest expense
|
|
|
28
|
|
|
–
|
|
|
–
|
|
|
1
|
|
|
–
|
|
|
1
|
|
|
13
|
|
|
42
|
|
Income tax expense (benefit)3
|
|
|
15
|
|
|
–
|
|
|
–
|
|
|
–
|
|
|
–
|
|
|
4
|
|
|
(5)
|
|
|
14
|
|
Adjusted EBITDA4
|
|
$
|
216
|
|
$
|
58
|
|
$
|
10
|
|
$
|
3
|
|
$
|
–
|
|
$
|
71
|
|
$
|
–
|
|
$
|
287
|
|
|
|
|
|
|
|
|
|
|
|
|
|
|
|
|
|
|
|
|
|
|
|
|
|
|
|
|
|
Investments in unconsolidated entities
|
|
$
|
420
|
|
$
|
4
|
|
$
|
–
|
|
$
|
–
|
|
$
|
–
|
|
$
|
4
|
|
$
|
35
|
|
$
|
459
|
|
Total assets
|
|
$
|
7,104
|
|
$
|
1,259
|
|
$
|
592
|
|
$
|
273
|
|
$
|
–
|
|
$
|
2,123
|
|
$
|
222
|
|
$
|
9,449
|
|
Capital expenditures
|
|
$
|
103
|
|
$
|
27
|
|
$
|
11
|
|
$
|
2
|
|
$
|
–
|
|
$
|
40
|
|
$
|
2
|
|
$
|
145
|
|
|
|
|
|
|
|
|
|
|
|
|
|
|
|
|
|
|
|
|
|
|
|
|
|
|
|
|
|
Numbers may not foot due to rounding.
|
|
|
|
|
|
|
|
|
|
|
|
|
|
|
|
|
|
|
|
|
|
|
|
|
|
|
|
|
|
|
|
|
|
|
|
|
|
|
|
|
|
|
|
|
|
|
|
|
|
|
|
|
|
|
|
|
|
TDS Telecom
|
|
|
|
|
|
|
|
Nine Months Ended or as of September 30, 2017
|
|
U.S. Cellular
|
|
Wireline
|
|
Cable
|
|
HMS
|
|
TDS Telecom Eliminations
|
|
TDS Telecom Total
|
|
Corporate, Eliminations and Other
|
|
Total
|
|
(Dollars in millions)
|
|
|
|
|
|
|
|
|
|
|
|
|
|
|
|
|
|
|
|
|
|
|
|
|
|
Operating revenues
|
|
|
|
|
|
|
|
|
|
|
|
|
|
|
|
|
|
|
|
|
|
|
|
|
|
|
Service1
|
|
$
|
2,223
|
|
$
|
537
|
|
$
|
152
|
|
$
|
84
|
|
$
|
(3)
|
|
$
|
770
|
|
$
|
(17)
|
|
$
|
2,976
|
|
|
Equipment and product sales
|
|
|
639
|
|
|
1
|
|
|
–
|
|
|
93
|
|
|
–
|
|
|
94
|
|
|
27
|
|
|
760
|
|
|
|
Total operating revenues1
|
|
|
2,862
|
|
|
538
|
|
|
152
|
|
|
178
|
|
|
(3)
|
|
|
865
|
|
|
9
|
|
|
3,736
|
|
Cost of services (excluding Depreciation, amortization
|
|
|
|
|
|
|
|
|
|
|
|
|
|
|
|
|
|
|
|
|
|
|
|
|
|
|
and accretion reported below)
|
|
|
549
|
|
|
194
|
|
|
73
|
|
|
63
|
|
|
(3)
|
|
|
327
|
|
|
(2)
|
|
|
874
|
|
Cost of equipment and products
|
|
|
749
|
|
|
2
|
|
|
–
|
|
|
77
|
|
|
–
|
|
|
79
|
|
|
20
|
|
|
848
|
|
Selling, general and administrative
|
|
|
1,041
|
|
|
145
|
|
|
39
|
|
|
32
|
|
|
–
|
|
|
215
|
|
|
(10)
|
|
|
1,246
|
|
Depreciation, amortization and accretion
|
|
|
460
|
|
|
114
|
|
|
32
|
|
|
21
|
|
|
–
|
|
|
166
|
|
|
6
|
|
|
632
|
|
Loss on impairment of goodwill2
|
|
|
370
|
|
|
–
|
|
|
–
|
|
|
35
|
|
|
–
|
|
|
35
|
|
|
(143)
|
|
|
262
|
|
(Gain) loss on asset disposals, net
|
|
|
14
|
|
|
1
|
|
|
1
|
|
|
–
|
|
|
–
|
|
|
2
|
|
|
–
|
|
|
16
|
|
(Gain) loss on sale of business and other exit costs, net
|
|
|
(1)
|
|
|
–
|
|
|
–
|
|
|
–
|
|
|
–
|
|
|
–
|
|
|
–
|
|
|
(1)
|
|
(Gain) loss on license sales and exchanges, net
|
|
|
(19)
|
|
|
–
|
|
|
–
|
|
|
–
|
|
|
–
|
|
|
–
|
|
|
–
|
|
|
(19)
|
|
Operating income (loss)1
|
|
|
(301)
|
|
|
84
|
|
|
7
|
|
|
(50)
|
|
|
–
|
|
|
41
|
|
|
138
|
|
|
(122)
|
|
Equity in earnings of unconsolidated entities
|
|
|
101
|
|
|
–
|
|
|
–
|
|
|
–
|
|
|
–
|
|
|
–
|
|
|
–
|
|
|
101
|
|
Interest and dividend income1
|
|
|
6
|
|
|
4
|
|
|
–
|
|
|
–
|
|
|
–
|
|
|
4
|
|
|
2
|
|
|
12
|
|
Interest expense
|
|
|
(85)
|
|
|
–
|
|
|
–
|
|
|
(3)
|
|
|
–
|
|
|
(3)
|
|
|
(40)
|
|
|
(128)
|
|
Other, net
|
|
|
1
|
|
|
–
|
|
|
–
|
|
|
–
|
|
|
–
|
|
|
–
|
|
|
(1)
|
|
|
–
|
|
Income (loss) before income taxes
|
|
|
(278)
|
|
|
88
|
|
|
7
|
|
|
(53)
|
|
|
–
|
|
|
42
|
|
|
99
|
|
|
(137)
|
|
Income tax expense (benefit)3
|
|
|
(19)
|
|
|
|
|
|
|
|
|
|
|
|
|
|
|
24
|
|
|
34
|
|
|
39
|
|
Net income (loss)
|
|
|
(259)
|
|
|
|
|
|
|
|
|
|
|
|
|
|
|
18
|
|
|
65
|
|
|
(176)
|
|
Add back:
|
|
|
|
|
|
|
|
|
|
|
|
|
|
|
|
|
|
|
|
|
|
|
|
|
|
Depreciation, amortization and accretion
|
|
|
460
|
|
|
114
|
|
|
32
|
|
|
21
|
|
|
–
|
|
|
166
|
|
|
6
|
|
|
632
|
|
Loss on impairment of goodwill2
|
|
|
370
|
|
|
–
|
|
|
–
|
|
|
35
|
|
|
–
|
|
|
35
|
|
|
(143)
|
|
|
262
|
|
(Gain) loss on asset disposals, net
|
|
|
14
|
|
|
1
|
|
|
1
|
|
|
–
|
|
|
–
|
|
|
2
|
|
|
–
|
|
|
16
|
|
(Gain) loss on sale of business and other exit costs, net
|
|
|
(1)
|
|
|
–
|
|
|
–
|
|
|
–
|
|
|
–
|
|
|
–
|
|
|
–
|
|
|
(1)
|
|
(Gain) loss on license sales and exchanges, net
|
|
|
(19)
|
|
|
–
|
|
|
–
|
|
|
–
|
|
|
–
|
|
|
–
|
|
|
–
|
|
|
(19)
|
|
Interest expense
|
|
|
85
|
|
|
–
|
|
|
–
|
|
|
3
|
|
|
–
|
|
|
3
|
|
|
40
|
|
|
128
|
|
Income tax expense (benefit)3
|
|
|
(19)
|
|
|
|
|
|
|
|
|
|
|
|
|
|
|
24
|
|
|
34
|
|
|
39
|
|
Adjusted EBITDA4
|
|
$
|
631
|
|
$
|
202
|
|
$
|
41
|
|
$
|
6
|
|
$
|
–
|
|
$
|
248
|
|
$
|
2
|
|
$
|
881
|
|
|
|
|
|
|
|
|
|
|
|
|
|
|
|
|
|
|
|
|
|
|
|
|
|
|
|
|
|
Investments in unconsolidated entities
|
|
$
|
429
|
|
$
|
4
|
|
$
|
–
|
|
$
|
–
|
|
$
|
–
|
|
$
|
4
|
|
$
|
34
|
|
$
|
467
|
|
Total assets
|
|
$
|
6,780
|
|
$
|
1,201
|
|
$
|
619
|
|
$
|
208
|
|
$
|
–
|
|
$
|
2,028
|
|
$
|
402
|
|
$
|
9,210
|
|
Capital expenditures
|
|
$
|
257
|
|
$
|
91
|
|
$
|
35
|
|
$
|
13
|
|
$
|
–
|
|
$
|
139
|
|
$
|
6
|
|
$
|
402
|
|
|
|
|
|
|
|
|
|
|
|
|
|
|
|
|
|
|
|
|
|
|
|
|
|
|
|
|
|
Numbers may not foot due to rounding.
|
|
|
|
|
|
|
|
|
|
|
|
|
|
|
|
|
|
|
|
|
|
|
|
|
|
|
|
|
|
TDS Telecom
|
|
|
|
|
|
|
|
Nine Months Ended or as of September 30, 2016
|
|
U.S. Cellular
|
|
Wireline
|
|
Cable
|
|
HMS
|
|
TDS Telecom Eliminations
|
|
TDS Telecom Total
|
|
Corporate, Eliminations and Other
|
|
Total
|
|
(Dollars in millions)
|
|
|
|
|
|
|
|
|
|
|
|
|
|
|
|
|
|
|
|
|
|
|
|
|
|
Operating revenues
|
|
|
|
|
|
|
|
|
|
|
|
|
|
|
|
|
|
|
|
|
|
|
|
|
|
|
Service1
|
|
$
|
2,330
|
|
$
|
522
|
|
$
|
136
|
|
$
|
91
|
|
$
|
(3)
|
|
$
|
746
|
|
$
|
(18)
|
|
$
|
3,058
|
|
|
Equipment and product sales
|
|
|
655
|
|
|
1
|
|
|
–
|
|
|
121
|
|
|
–
|
|
|
123
|
|
|
27
|
|
|
805
|
|
|
|
Total operating revenues1
|
|
|
2,985
|
|
|
523
|
|
|
137
|
|
|
212
|
|
|
(3)
|
|
|
868
|
|
|
10
|
|
|
3,863
|
|
Cost of services (excluding Depreciation, amortization
|
|
|
|
|
|
|
|
|
|
|
|
|
|
|
|
|
|
|
|
|
|
|
|
|
|
|
and accretion reported below)
|
|
|
572
|
|
|
192
|
|
|
69
|
|
|
61
|
|
|
(3)
|
|
|
320
|
|
|
(1)
|
|
|
891
|
|
Cost of equipment and products
|
|
|
799
|
|
|
2
|
|
|
–
|
|
|
101
|
|
|
–
|
|
|
103
|
|
|
19
|
|
|
921
|
|
Selling, general and administrative
|
|
|
1,089
|
|
|
148
|
|
|
37
|
|
|
37
|
|
|
–
|
|
|
222
|
|
|
(12)
|
|
|
1,299
|
|
Depreciation, amortization and accretion5
|
|
|
462
|
|
|
119
|
|
|
27
|
|
|
22
|
|
|
–
|
|
|
168
|
|
|
6
|
|
|
636
|
|
(Gain) loss on asset disposals, net
|
|
|
16
|
|
|
2
|
|
|
2
|
|
|
–
|
|
|
–
|
|
|
4
|
|
|
–
|
|
|
20
|
|
(Gain) loss on sale of business and other exit costs, net
|
|
|
–
|
|
|
–
|
|
|
–
|
|
|
–
|
|
|
–
|
|
|
–
|
|
|
(1)
|
|
|
(1)
|
|
(Gain) loss on license sales and exchanges, net
|
|
|
(16)
|
|
|
–
|
|
|
–
|
|
|
–
|
|
|
–
|
|
|
–
|
|
|
–
|
|
|
(16)
|
|
Operating income (loss)1
|
|
|
63
|
|
|
61
|
|
|
1
|
|
|
(9)
|
|
|
–
|
|
|
53
|
|
|
(3)
|
|
|
113
|
|
Equity in earnings of unconsolidated entities
|
|
|
110
|
|
|
–
|
|
|
–
|
|
|
–
|
|
|
–
|
|
|
–
|
|
|
(1)
|
|
|
109
|
|
Interest and dividend income1
|
|
|
4
|
|
|
2
|
|
|
–
|
|
|
–
|
|
|
–
|
|
|
2
|
|
|
1
|
|
|
7
|
|
Interest expense
|
|
|
(84)
|
|
|
1
|
|
|
–
|
|
|
(3)
|
|
|
–
|
|
|
(2)
|
|
|
(41)
|
|
|
(127)
|
|
Other, net
|
|
|
–
|
|
|
–
|
|
|
–
|
|
|
–
|
|
|
–
|
|
|
–
|
|
|
1
|
|
|
1
|
|
Income (loss) before income taxes
|
|
|
93
|
|
|
63
|
|
|
1
|
|
|
(12)
|
|
|
–
|
|
|
53
|
|
|
(43)
|
|
|
103
|
|
Income tax expense (benefit)3
|
|
|
39
|
|
|
|
|
|
|
|
|
|
|
|
|
|
|
20
|
|
|
(14)
|
|
|
45
|
|
Net income (loss)
|
|
|
54
|
|
|
|
|
|
|
|
|
|
|
|
|
|
|
32
|
|
|
(28)
|
|
|
58
|
|
Add back:
|
|
|
|
|
|
|
|
|
|
|
|
|
|
|
|
|
|
|
|
|
|
|
|
|
|
Depreciation, amortization and accretion5
|
|
|
462
|
|
|
119
|
|
|
27
|
|
|
22
|
|
|
–
|
|
|
168
|
|
|
6
|
|
|
636
|
|
(Gain) loss on asset disposals, net
|
|
|
16
|
|
|
2
|
|
|
2
|
|
|
–
|
|
|
–
|
|
|
4
|
|
|
–
|
|
|
20
|
|
(Gain) loss on sale of business and other exit costs, net
|
|
|
–
|
|
|
–
|
|
|
–
|
|
|
–
|
|
|
–
|
|
|
–
|
|
|
(1)
|
|
|
(1)
|
|
(Gain) loss on license sales and exchanges, net
|
|
|
(16)
|
|
|
–
|
|
|
–
|
|
|
–
|
|
|
–
|
|
|
–
|
|
|
–
|
|
|
(16)
|
|
Interest expense
|
|
|
84
|
|
|
(1)
|
|
|
–
|
|
|
3
|
|
|
–
|
|
|
2
|
|
|
41
|
|
|
127
|
|
Income tax expense (benefit)3
|
|
|
39
|
|
|
|
|
|
|
|
|
|
|
|
|
|
|
20
|
|
|
(14)
|
|
|
45
|
|
Adjusted EBITDA4
|
|
$
|
639
|
|
$
|
183
|
|
$
|
30
|
|
$
|
13
|
|
$
|
–
|
|
$
|
226
|
|
$
|
4
|
|
$
|
869
|
|
|
|
|
|
|
|
|
|
|
|
|
|
|
|
|
|
|
|
|
|
|
|
|
|
|
|
|
|
Investments in unconsolidated entities
|
|
$
|
420
|
|
$
|
4
|
|
$
|
–
|
|
$
|
–
|
|
$
|
–
|
|
$
|
4
|
|
$
|
35
|
|
$
|
459
|
|
Total assets
|
|
$
|
7,104
|
|
$
|
1,259
|
|
$
|
592
|
|
$
|
273
|
|
$
|
–
|
|
$
|
2,123
|
|
$
|
222
|
|
$
|
9,449
|
|
Capital expenditures
|
|
$
|
275
|
|
$
|
82
|
|
$
|
41
|
|
$
|
6
|
|
$
|
–
|
|
$
|
128
|
|
$
|
9
|
|
$
|
412
|
|
|
|
|
|
|
|
|
|
|
|
|
|
|
|
|
|
|
|
|
|
|
|
|
|
|
|
|
|
Numbers may not foot due to rounding.
|
|
|
|
|
|
|
|
|
|
|
|
|
|
|
|
|
|
|
|
|
|
|
|
|
|
|
|
|
|
|
|
|
|
|
|
|
|
|
|
|
|
|
|
|
|
|
|
|
|
|
1
|
Equipment installment plan interest income is reflected as a component of Service revenues consistent with an accounting policy change effective January 1, 2017. All prior period numbers have been recast to conform to this accounting change. See Note 1 — Basis of Presentation for additional details.
|
|
|
|
|
|
|
|
|
|
|
|
|
|
|
|
|
|
|
|
|
|
|
|
|
|
|
|
|
|
2
|
During the three months ended September 30, 2017, U.S. Cellular recorded a goodwill impairment of $370 million while TDS recorded a goodwill impairment of the U.S. Cellular reporting unit of $227 million. Prior to 2009, TDS accounted for U.S. Cellular's share repurchases as step acquisitions, allocating a portion of the share repurchase value to TDS' Goodwill. Further, goodwill of the U.S. Cellular reporting unit was impaired at the TDS level in 2003 but not at U.S. Cellular. Consequently, U.S. Cellular's goodwill on a stand-alone basis and any resulting impairments of goodwill does not equal the TDS consolidated goodwill related to U.S. Cellular. For further information on the goodwill impairment see Note 6 — Intangible Assets in the Notes to Consolidated Financial Statements.
|
|
|
|
|
|
|
|
|
|
|
|
|
|
|
|
|
|
|
|
|
|
|
|
|
|
|
|
|
|
3
|
Income tax expense (benefit) is not provided at the individual segment level for Wireline, Cable and HMS. TDS calculates income tax expense for “TDS Telecom Total”.
|
|
|
|
|
|
|
|
|
|
|
|
|
|
|
|
|
|
|
|
|
|
|
|
|
|
|
|
|
4
|
Adjusted earnings before interest, taxes, depreciation, amortization and accretion (Adjusted EBITDA) is a segment measure reported to the chief operating decision maker for purposes of making decisions about allocating resources to the segments and assessing their performance. Adjusted EBITDA is defined as net income, adjusted for the items set forth in the reconciliation above. TDS believes Adjusted EBITDA is a useful measure of TDS’ operating results before significant recurring non-cash charges, gains and losses, and other items as presented above as they provide additional relevant and useful information to investors and other users of TDS' financial data in evaluating the effectiveness of its operations and underlying business trends in a manner that is consistent with management's evaluation of business performance.
|
|
|
|
|
|
|
|
|
|
|
|
|
|
|
|
|
|
|
|
|
|
|
|
|
|
|
|
|
|
5
|
During the nine months ended September 30, 2016, TDS recorded an out-of-period adjustment attributable to the third quarter of 2014 through the first quarter of 2016 related to the over-depreciation of certain assets in the Wireline segment. TDS determined that this adjustment was not material to the quarterly periods or the annual results for 2016. As a result of this out-of-period adjustment, Depreciation, amortization and accretion expense decreased by $4 million for the nine months ended September 30, 2016.
|
Telephone and Data Systems, Inc.
Additional Required Information
Controls and Procedures
Evaluation of Disclosure Controls and Procedures
TDS maintains disclosure controls and procedures (as defined in Rules 13a-15(e) and 15d-15(e) under the Securities Exchange Act of 1934, as amended (the Exchange Act)) that are designed to ensure that information required to be disclosed in its reports filed or submitted under the Exchange Act is processed, recorded, summarized and reported within the time periods specified in the SEC’s rules and forms, and that such information is accumulated and communicated to TDS’ management, including its principal executive officer and principal financial officer, as appropriate, to allow for timely decisions regarding required disclosure. In designing and evaluating the disclosure controls and procedures, management recognizes that any controls and procedures, no matter how well designed and operated, can provide only reasonable assurance of achieving the desired control objectives.
As required by SEC Rules 13a-15(b), TDS carried out an evaluation, under the supervision and with the participation of management, including its principal executive officer and principal financial officer, of the effectiveness of the design and operation of TDS’ disclosure controls and procedures as of the end of the period covered by this Quarterly Report. Based on this evaluation, TDS’ principal executive officer and principal financial officer concluded that TDS' disclosure controls and procedures were effective as of September 30, 2017, at the reasonable assurance level.
Changes in Internal Control Over Financial Reporting
There have been no changes in internal controls over financial reporting that have occurred during the quarter ended September 30, 2017, that have materially affected, or are reasonably likely to materially affect, TDS’ internal control over financial reporting.
Legal Proceedings
Refer to the disclosure under Legal Proceedings in TDS’ Form 10-K for the year ended December 31, 2016. There have been no material changes to such information since December 31, 2016.
Unregistered Sales of Equity Securities and Use of Proceeds
On August 2, 2013, the Board of Directors of TDS authorized, and TDS announced by Form 8-K, a $250 million stock repurchase program for TDS Common Shares. Depending on market conditions, such shares may be repurchased in compliance with Rule 10b-18 of the Exchange Act, pursuant to Rule 10b5-1 under the Exchange Act, or pursuant to accelerated share repurchase arrangements, prepaid share repurchases, private transactions or as otherwise authorized. This authorization does not have an expiration date. TDS did not determine to terminate the foregoing Common Share repurchase program, or cease making further purchases thereunder, during the third quarter of 2017.
The following table provides certain information with respect to all purchases made by or on behalf of TDS, and any open market purchases made by any “affiliated purchaser” (as defined by the SEC) of TDS, of TDS Common Shares during the quarter covered by this Form 10-Q.
|
|
|
|
|
|
|
|
|
Total Number of
|
|
Maximum Dollar
|
|
|
|
|
|
|
Average
|
|
Shares Purchased
|
|
Value of Shares that
|
|
|
|
|
Total Number
|
|
Price
|
|
as Part of Publicly
|
|
May Yet Be
|
|
|
|
|
of Shares
|
|
Paid per
|
|
Announced Plans or
|
|
Purchased Under the
|
|
Period
|
|
Purchased
|
|
Share
|
|
Programs
|
|
Plans or Programs
|
|
July 1 – 31, 2017
|
|
–
|
|
$
|
–
|
|
–
|
|
$
|
198,691,355
|
|
August 1 – 31, 2017
|
|
–
|
|
|
–
|
|
–
|
|
|
198,691,355
|
|
September 1 – 30, 2017
|
|
–
|
|
|
–
|
|
–
|
|
|
198,691,355
|
|
|
Total for or as of the end of the
|
|
|
|
|
|
|
|
|
|
|
|
|
quarter ended September 30, 2017
|
|
–
|
|
$
|
–
|
|
–
|
|
$
|
198,691,355
|
Other Information
The following information is being provided to update prior disclosures made pursuant to the requirements of Form 8-K, Item 2.03 — Creation of a Direct Financial Obligation or an Obligation Under an Off-Balance Sheet Arrangement of a Registrant.
Neither TDS nor U.S. Cellular borrowed or repaid any cash amounts under their revolving credit facilities in the third quarter of 2017 or through the filing date of this Form 10-Q, and had no cash borrowings outstanding under their revolving credit facilities as of September 30, 2017, or as of the filing date of this Form 10-Q.
Exhibits
The foregoing exhibits include only the exhibits that relate specifically to this Form 10-Q or that supplement the exhibits identified in TDS’ Form 10-K for the year ended December 31, 2016. Reference is made to TDS’ Form 10-K for the year ended December 31, 2016, for a complete list of exhibits, which are incorporated herein except to the extent supplemented or superseded above.
SIGNATURES
Pursuant to the requirements of the Securities Exchange Act of 1934, the registrant has duly caused this report to be signed on its behalf by the undersigned thereunto duly authorized.
|
|
|
TELEPHONE AND DATA SYSTEMS, INC.
|
|
|
|
|
(Registrant)
|
|
|
|
|
|
|
|
|
Date:
|
November 8, 2017
|
|
/s/ LeRoy T. Carlson, Jr.
|
|
|
|
|
LeRoy T. Carlson, Jr.
President and Chief Executive Officer
(principal executive officer)
|
|
|
|
|
|
|
|
|
Date:
|
November 8, 2017
|
|
/s/ Douglas D. Shuma
|
|
|
|
|
Douglas D. Shuma
Senior Vice President - Finance and Chief Accounting Officer
(principal financial officer and principal accounting officer)
|
|
|
|
|
|
|
|
Date:
|
November 8, 2017
|
|
/s/ Anita J. Kroll
|
|
|
|
|
Anita J. Kroll
Vice President and Controller
|
|