Attached files
| file | filename |
|---|---|
| 8-K - 8-K 2017 EEI FINANCIAL - NORTHWESTERN CORP | a201711058keeifinancialcon.htm |

8-K November 3, 2017
EEI Financial Conference
November 5-7, 2017
Hebgen Reservoir – south of Big Sky, MT

2
Forward Looking Statements
Forward Looking Statements
During the course of this presentation, there will be forward-looking statements within
the meaning of the “safe harbor” provisions of the Private Securities Litigation Reform
Act of 1995. Forward-looking statements often address our expected future business
and financial performance, and often contain words such as “expects,” “anticipates,”
“intends,” “plans,” “believes,” “seeks,” or “will.”
The information in this presentation is based upon our current expectations as of the
date hereof unless otherwise noted. Our actual future business and financial
performance may differ materially and adversely from our expectations expressed in
any forward-looking statements. We undertake no obligation to revise or publicly
update our forward-looking statements or this presentation for any reason. Although
our expectations and beliefs are based on reasonable assumptions, actual results
may differ materially. The factors that may affect our results are listed in certain of our
press releases and disclosed in the Company‟s most recent Form 10-K and 10-Q
along with other public filings with the SEC.
NorthWestern Corporation
dba: NorthWestern Energy
Ticker: NWE
Trading on the NYSE
www.northwesternenergy.com
Corporate Office
3010 West 69th Street
Sioux Falls, SD 57108
(605) 978-2900
Investor Relations Officer
Travis Meyer
605-978-2967
travis.meyer@northwestern.com
Company Information

About NorthWestern
3
Montana Operations
Electric
363,800 customers
24,450 miles – transmission & distribution lines
809 MW nameplate owned power generation
Natural Gas
194,100 customers
7,250 miles of transmission and distribution pipeline
18 Bcf of gas storage capacity
Own 61 Bcf of proven natural gas reserves
Nebraska Operations
Natural Gas
42,300 customers
787 miles of distribution pipeline
South Dakota Operations
Electric
63,200 customers
3,550 miles – transmission & distribution lines
440 MW nameplate owned power generation
Natural Gas
46,200 customers
1,673 miles of transmission and distribution pipeline
NWE - An Investment for the Long Term
4
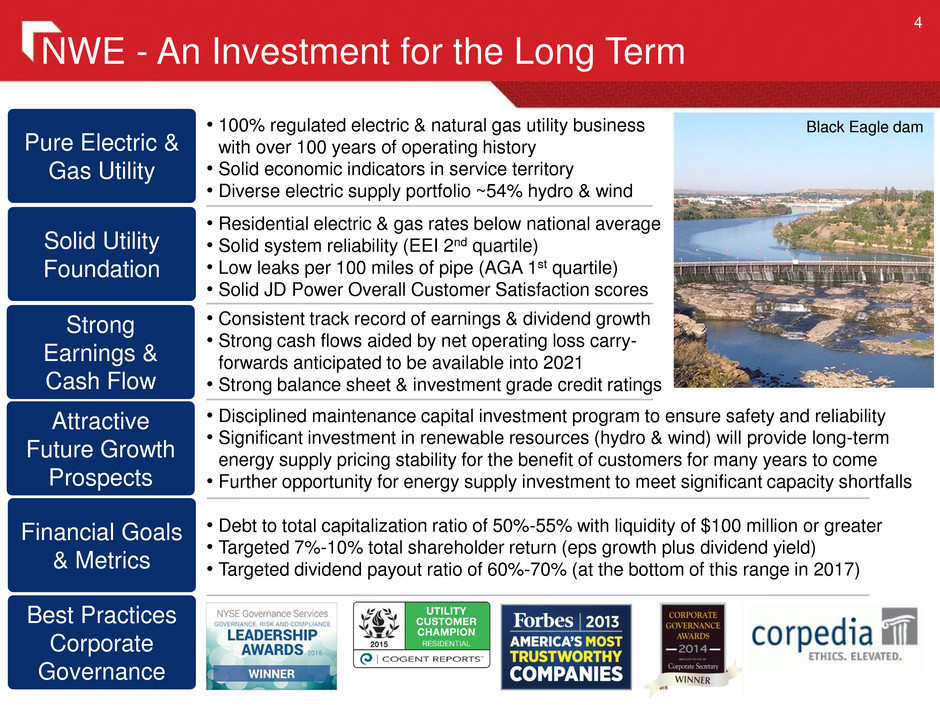
• 100% regulated electric & natural gas utility business
with over 100 years of operating history
• Solid economic indicators in service territory
• Diverse electric supply portfolio ~54% hydro & wind
Black Eagle dam
Pure Electric &
Gas Utility
Solid Utility
Foundation
Strong
Earnings &
Cash Flow
Attractive
Future Growth
Prospects
Financial Goals
& Metrics
Best Practices
Corporate
Governance
• Residential electric & gas rates below national average
• Solid system reliability (EEI 2nd quartile)
• Low leaks per 100 miles of pipe (AGA 1st quartile)
• Solid JD Power Overall Customer Satisfaction scores
• Disciplined maintenance capital investment program to ensure safety and reliability
• Significant investment in renewable resources (hydro & wind) will provide long-term
energy supply pricing stability for the benefit of customers for many years to come
• Further opportunity for energy supply investment to meet significant capacity shortfalls
• Consistent track record of earnings & dividend growth
• Strong cash flows aided by net operating loss carry-
forwards anticipated to be available into 2021
• Strong balance sheet & investment grade credit ratings
• Debt to total capitalization ratio of 50%-55% with liquidity of $100 million or greater
• Targeted 7%-10% total shareholder return (eps growth plus dividend yield)
• Targeted dividend payout ratio of 60%-70% (at the bottom of this range in 2017)

A Diversified Electric and Gas Utility
5
NorthWestern‟s „80/20‟ rules:
Approximately 80% Electric, 80% Residential and 80% Montana
Nearly $3.5 billion of rate base investment to serve our customers
Data as of 12/31/2016.
6
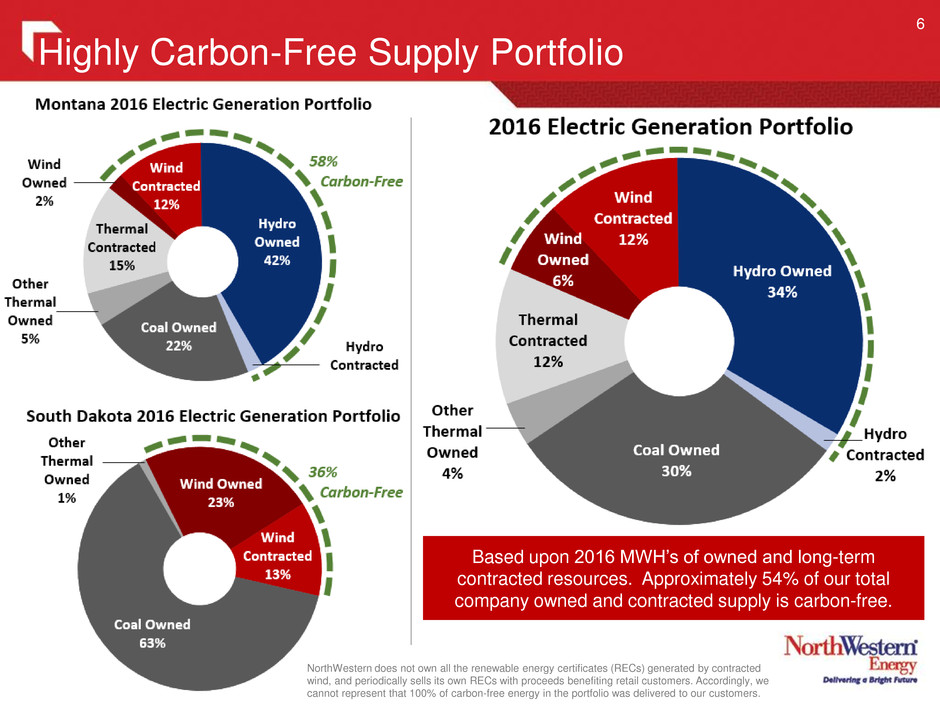
Highly Carbon-Free Supply Portfolio
Based upon 2016 MWH‟s of owned and long-term
contracted resources. Approximately 54% of our total
company owned and contracted supply is carbon-free.
NorthWestern does not own all the renewable energy certificates (RECs) generated by contracted
wind, and periodically sells its own RECs with proceeds benefiting retail customers. Accordingly, we
cannot represent that 100% of carbon-free energy in the portfolio was delivered to our customers.

Strong Utility Foundation
7
Solid and improving JD Power Overall Customer Satisfaction Scores
Residential electric and natural gas rates below national average
Solid electric system reliability and low gas leaks per mile
Solid Economic Indicators
8
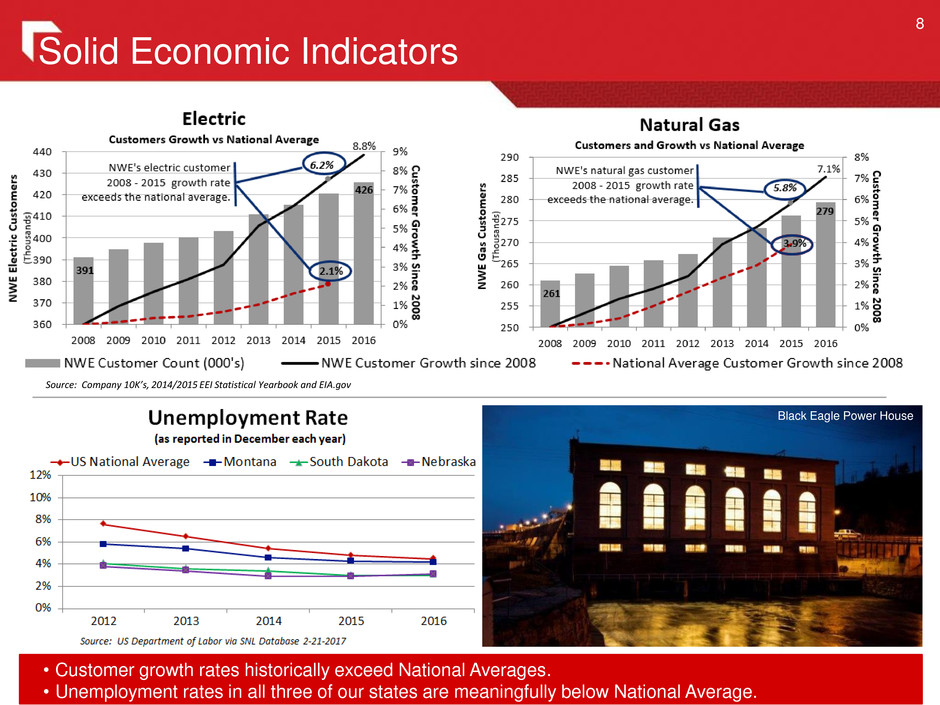
• Customer growth rates historically exceed National Averages.
• Unemployment rates in all three of our states are meaningfully below National Average.
Source: NorthWestern customer growth - 2008-2016 Forms 10-K
Unemployment Rate: US Department of Labor via SNL Database 2/21/17
Electric: EEI Statistical Yearbook (published December 2015, table 7.2)
Natural Gas: EIA.gov (Data table "Number of Natural Gas Consumers")
Source: Company 10K’s, 2014/2015 EEI Statistical Yearbook and EIA.gov
Black Eagle Power House

A History of Growth
9
2008-2016 CAGR‟s: GAAP EPS: 8.5% - Non-GAAP EPS: 7.6% - Dividend: 5.3%
See appendix for “Non-GAAP Financial Measures”
$2.60 - $2.75
$3.10 - $3.30 $3. 0-$3.40
$3.30-$3.50
Track Record of Delivering Results
10
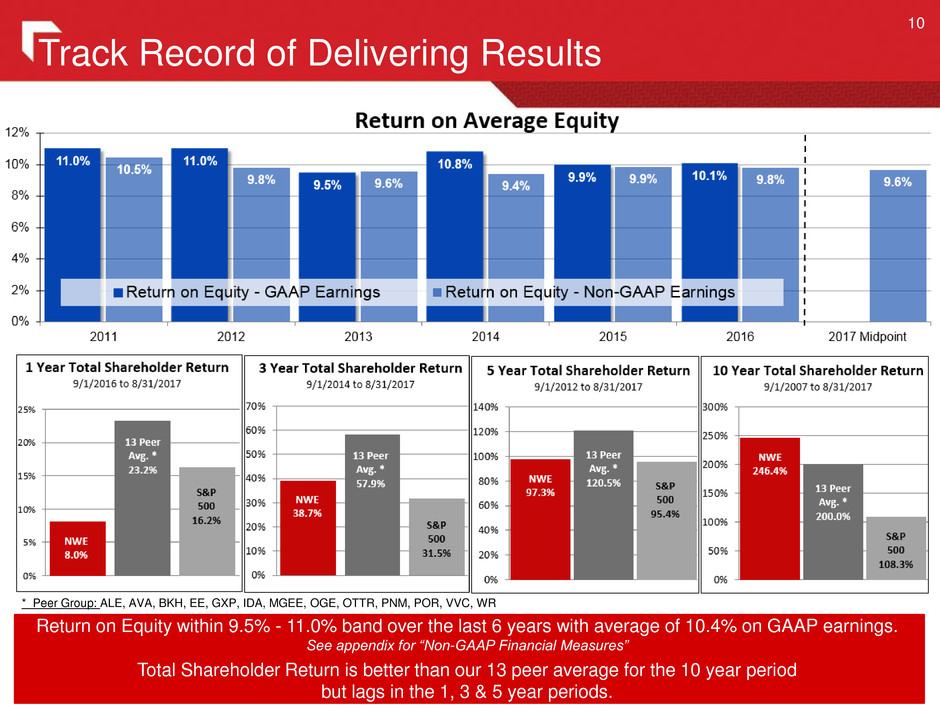
Return on Equity within 9.5% - 11.0% band over the last 6 years with average of 10.4% on GAAP earnings.
See appendix for “Non-GAAP Financial Measures”
Total Shareholder Return is better than our 13 peer average for the 10 year period
but lags in the 1, 3 & 5 year periods.
* Peer Group: ALE, AVA, BKH, EE, GXP, IDA, MGEE, OGE, OTTR, PNM, POR, VVC, WR

Investment for Our Customers‟ Benefit
11
Over the past 8 years we have been reintegrating our Montana energy supply portfolio and making additional investments across
our entire service territory to enhance system safety, reliability and capacity.
We have made these enhancements with minimal impact to customers‟ bills while maintaining bills lower than the US average.
As a result we have also been able to deliver solid earnings growth for our investors.
2008-2016 CAGRs Estimated Rate Base: 14.8% GAAP Diluted EPS: 8.4%
NWE typical electric bill: 2.2% NWE typical natural gas bill: (7.5%)
US average electric bill: 1.7%* US average natural gas bill: (4.0%)**

Balance Sheet Strength and Liquidity
12
Solid credit ratings, liquidity in excess of $100 million target, and debt to cap within our targeted 50%-55% range.
Our next debt maturity ($250 million 6.34% Montana First Mortgage Bonds due in 2019) is expected to be
redeemed with a recently signed bond purchase agreement to issue $250M of MT FMB at a fixed rate of 4.03%
maturing in 2047. We expect to close on transaction in early November 2017.
Dotted lines in 2019 & 2047 include refinancing to close in November 2017
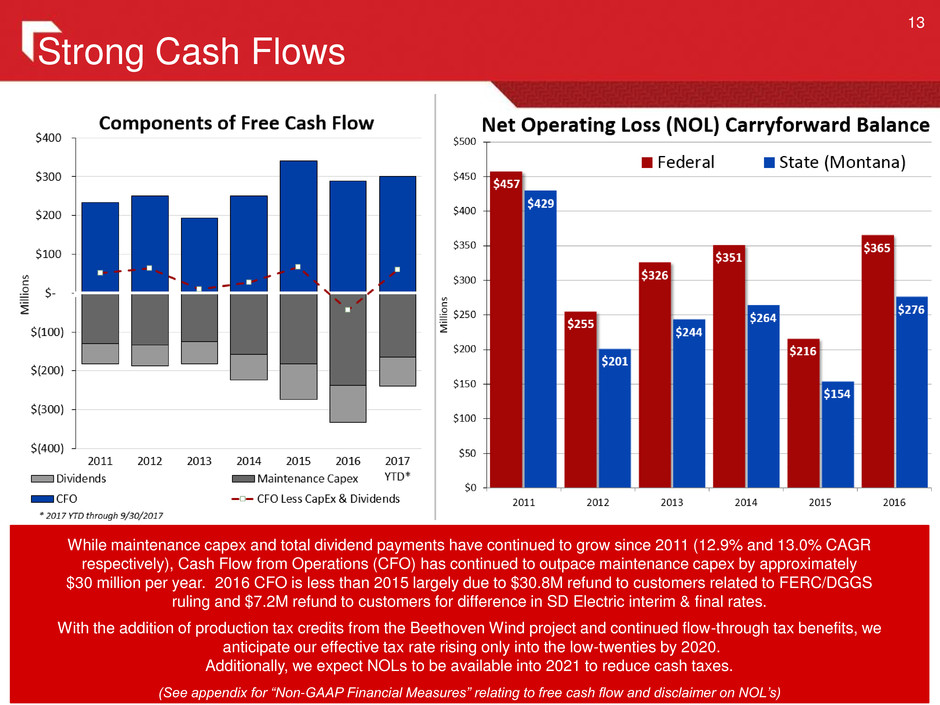
While maintenance capex and total dividend payments have continued to grow since 2011 (12.9% and 13.0% CAGR
respectively), Cash Flow from Operations (CFO) has continued to outpace maintenance capex by approximately
$30 million per year. 2016 CFO is less than 2015 largely due to $30.8M refund to customers related to FERC/DGGS
ruling and $7.2M refund to customers for difference in SD Electric interim & final rates.
With the addition of production tax credits from the Beethoven Wind project and continued flow-through tax benefits, we
anticipate our effective tax rate rising only into the low-twenties by 2020.
Additionally, we expect NOLs to be available into 2021 to reduce cash taxes.
(See appendix for “Non-GAAP Financial Measures” relating to free cash flow and disclaimer on NOL’s)
Strong Cash Flows
13

Experienced Leadership & Solid Corp. Governance
14
Board of Directors (left to right)
Executive Management Team (left to right)
Linda G. Sullivan – Independent Director since April 27, 2017 – Audit Committee
Dana J. Dykhouse – Independent Director since January 30, 2009 – Human
Resources (chair) and Audit Committees
Britt E. Ide – Independent Director since April 27, 2017 – Governance &
Innovation Committee
Jan R. Horsfall – Independent Director since April 23, 2015 – Audit and Governance &
Innovation Committees
Anthony T. Clark – Independent Director since December 6, 2016 – Governance &
Innovation Committee
Robert C. Rowe - CEO & President – Director since August 13, 2008
Dr. E. Linn Draper Jr. -Chairman of the Board – Independent Director since
November 1, 2004
Julia L. Johnson – Independent Director since November 1, 2004 – Governance &
Innovation (chair) and Human Resources Committees
Stephan P. Adik – Independent Director since November 1, 2004 – Audit (chair) and
Human Resources Committees
Patrick R. Corcoran – VP Gov’t & Regulatory Affairs – current position since 2002
Crystal D. Lail – VP & Controller – current position since 2015
Curtis T. Pohl – VP Distribution – current position since 2003
Bobbi L. Schroeppel – VP Customer Care, Communications & Human Resources –
current position since 2002
Brian B. Bird – VP & CFO – current position since 2003
Heather H. Grahame – VP & General Counsel – current position since 2010
Robert C. Rowe - President & CEO – current position since 2008
John D. Hines – VP Supply – current position since 2011
Michael R. Cashell – VP Transmission – current position since 2011

Recent Significant Achievements
15
Strong year for safety in 2016
• Fewest OSHA recordable events of any year.
• Best year for least lost time incidents.
Record best customer satisfaction scores
• Received our best Overall Customer Satisfaction scores in the
JD Power residential utility survey in 2016.
Corporate Governance Finalist
• NorthWestern‟s proxy statement has been recognized as a
finalist by Corporate Secretary magazine for Best Small to
Mid-Cap Proxy Statement for several years, including 2016 &
2017, and won the award in 2014.
Recognized for Strong Dividend
• In March 2016, NorthWestern was added to the NASDAQ US
Broad Dividend AchieversTM Index, which aims to represent the
country‟s leading stocks by dividend yield in addition to Dow
Jones US Dividend Select TM Index in 2015.
Echo Lake Nordic Trail
New Board Members
• Anthony T. Clark, senior advisor at Wilkenson Barker Knauer LLP and former
FERC commissioner and North Dakota Public Service Commissioner, joined in December 2016
• Britt E. Ide, president of Ide Energy & Strategy, joined in April 2017
• Linda G. Sullivan, exec. vice president and chief financial officer of American Water, joined in April 2017

Looking Forward
16
Montana Regulatory
• Working toward successful implementation of new
Power Cost and Credit Adjustment Mechanism (PCCAM)
• Anticipate filing an electric rate case by September 2018
(based on a 2017 test year).
Cost control efforts
• Continue to monitor costs, including labor, benefits and
property tax valuations to mitigate increases
Continue to invest in our T&D infrastructure.
• Transition from DSIP/TSIP to overall infrastructure
capital investment plan
• Natural gas pipeline investment (Integrity Verification Process
and PHMSA1 Requirements)
• Advanced Metering Infrastructure (AMI) investment
Refining our Supply Plan in Montana
• Continue to work with Montana Public Service
Commission and other stakeholders to refine energy
supply plan to resolve significant capacity deficit
Continue to search for natural gas reserve
acquisition opportunities
• Acquisitions at a price that benefits both customers
and shareholders
1. Pipeline & Hazardous Materials Safety Administration
Much of our focus in the next year will
be on the electric rate case in
Montana and controlling our costs to
benefit all stakeholders while
continuing to invest in our core
business to provide safe and reliable
energy for our all of our customers.

Financing Activities
17
Long-Term Debt Refinancing
• In October 2017, we priced $250 million
principal, 4.03% - 30 year Montana First
Mortgage Bonds
• We expect to close the transaction in early
November 2017.
• Proceeds used to redeem existing
$250 million – 6.34% Montana First
Mortgage Bonds due in 2019
At-The-Market
Equity Offering Program
• Initiated in September 2017
• Proceeds to repay or refinance debt (including
short-term debt), fund capital expenditures
and other general corporate purposes
• During the third quarter 2017 we sold 83,769
shares of common stock at an average price
of $59.56 per share, for a total of
approximately $5 million of proceeds.
Big Sky Substation
Expect annual interest expense savings of
over $5 million net of make-whole
amortization
We anticipate issuing the remaining $95 million,
from time to time, by the end of 2018.

Property Tax Tracker Rules Filing – In March 2017, the MPSC proposed new rules to establish minimum filing
requirements for property tax trackers.
• Current MT Property tax tracker rules allows recovery of 60 percent of the change in state and local taxes and fees.
• In June 2017, the MPSC adopted new rules to establish minimum filing requirements with some of the rules appearing
to be based on a narrow interpretation of the enabling statute and suggest that the MPSC will challenge the amount
and allocation of these taxes to customers. We expect to submit our annual filing in December 2017, with resolution
during the first quarter of 2018.
Montana Natural Gas Rate Filing
• In June 2017, we reached a settlement agreement with intervenors. In August 2017,the MPSC’s issued a final order accepting
the settlement with modifications resulting in an annual revenue increase $5.1 million, ROE at 9.55% with ROR of 6.96%
and including an annual reduction in production rates to reflect depletion until our next rate filing. Rates were effective
September 1, 2017.
• While the final order reflects an annual increase of approximately $5.1 million, we expect the increase in 2018 to be
approximately $2.0 million due to the inclusion in 2017 of four months of increased rates and the step down of gas production
rates to reflect depletion.
18
Regulatory & Legal Update
FERC / DGGS – April 2014 order regarding cost allocation
at DGGS between retail & wholesale customers
• FERC denied our request for rehearing in May 2016
• Required us to make refunds in June 2016 of $27.3 million plus interest
• We filed a petition for review with the US Circuit Court of Appeals for the District of
Columbia Circuit in June 2016 and oral argument is scheduled for December 1, 2017.
• We do not expect a decision until the first quarter of 2018, at the earliest.
Colstrip – In May 2016, the MPSC issued a final order disallowing recovery of certain
costs included in the electric supply tracker related to a 2013 Unit 4 outage
• Appeals have been filed in two Montana district courts regarding disallowance.
• We believe we are likely to receive orders from the courts in these matters within
the next 12 months.

Montana - Implementation of HB 193
19
PCCAM - as proposed by NorthWestern
Procedural Timeline:
May 2017 MPSC issued Notice of Commission Action (NCA) initiating process
July 7, 2017 MPSC issued additional NCA addressing arguments in our motion
to reconsider the original NCA. (July 7, 2017 – D2017.5.39).
July 14, 2017 We proposed electric Power Cost and Credit Adjustment
Mechanism (PCCAM) with the MPSC.
Aug. 1, 2017 MPSC concluded work session declining to require NWE to
submit additional filing.
Sept. 20, 2017 MPSC established procedural schedule for PCCAM.
Nov. 13, 2017 Final day for Intervenor testimony
Jan. 12, 2018 Final day for NWE to file rebuttal testimony
Mar. 12, 2018 Hearing on PCCAM.
Background: In April 2017, the Montana legislature passed House Bill
193 (HB 193), repealing the statutory language that provided for mandatory
recovery of our prudently incurred electric supply costs, effective July 1, 2017.
The enacted legislation gives the MPSC discretion whether to approve an
electric supply cost adjustment mechanism.
In support of the passage of HB 193, A
MPSC Commissioner testified before Senate
requesting the bill should be passed “to
subject NorthWestern to the exact same
regulatory treatment as Montana Dakota
Utilities.” The proposed PCCAM, with the
90% / 10% risk sharing mechanism was
designed to be responsive to the
Commission‟s advocacy.
If the MPSC approves the PCCAM, we
expect it will apply the mechanism to
variable costs on a retroactive basis to the
effective date of HB 193 (July 1, 2017)

20
Regulatory Update (continued)
Qualified Facilities (QF) Decision: Under the Public Utility Regulatory Policies
Act (PURPA), electric utilities are required, with exceptions, to purchase energy and
capacity from independent power producers that are Qualified Facilities (QF).
• In July 2017, the MPSC issued a final order in the QF-1 docket that adopted generally lower rates
and shortened the maximum contract length for new QFs to 10 years (with a rate adjustment after
5 years). The MPSC also ordered that any future resources, be subject to the same period, saying
it “will not initially authorize NorthWestern rate revenue for more than ten years” and “at the end of
the ten year period the Commission may provide for subsequent rate revenue based on a
consideration of the value of the asset to customers and not necessarily based on the costs of the
resource.”
• We and other parties filed motions for reconsideration of this decision. The MPSC voted in
October 2017 to revise the initial order extending the contract length to 15 years and to
continue to apply the contract term to both QF contracts and our future electric supply resources,
however, it has not yet issued a final order. Based on the MPSC‟s October 2017 vote, we expect
that the decision will result in substantially lower rates for future QF contracts.
• We have significant generation capacity deficits and negative reserve margins, and our 2016 resource plan identified price and
reliability risks to our customers if we rely solely upon market purchases to address these capacity needs. In addition to our
responsibility to meet peak demand, national reliability standards effective July 2016 require us to have even greater
dispatchable generation capacity available and be capable of increasing or decreasing output to address the irregular nature of
intermittent generation such as wind or solar.
As a result of the MPSC‟s July decision, we suspended a competitive solicitation process to determine
the lowest-cost / least-risk approach for addressing capacity needs in Montana.
A final determination regarding the competitive solicitation will be dependent upon reviewing the
MPSC‟s revised order (based on the October reconsideration). We anticipate the order to be issued
during the fourth quarter of 2017.

Critical Capacity Shortfall
21
The resource initiatives and actions developed in our 2015 Electricity Supply Resource Procurement Plan identify the critical
future needs of our portfolio, including solutions to resolve our current negative planning reserve margin of 28%, which is
projected to grow to 50% by 2035 without any additional owned or contracted resources added to our portfolio.
As a result of a July 2017 decision by the MPSC regarding maximum contract length for all new generation, we suspended a
competitive solicitation process to determine the lowest-cost / least-risk approach for addressing our intermittent capacity and
reserve margin needs in Montana. A final determination regarding the competitive solicitation will be dependent upon reviewing
the MPSC's revised order resulting from an October 2017 decision (expected during the fourth quarter 2017).
Planning Reserve Margin
Capital Spending
22
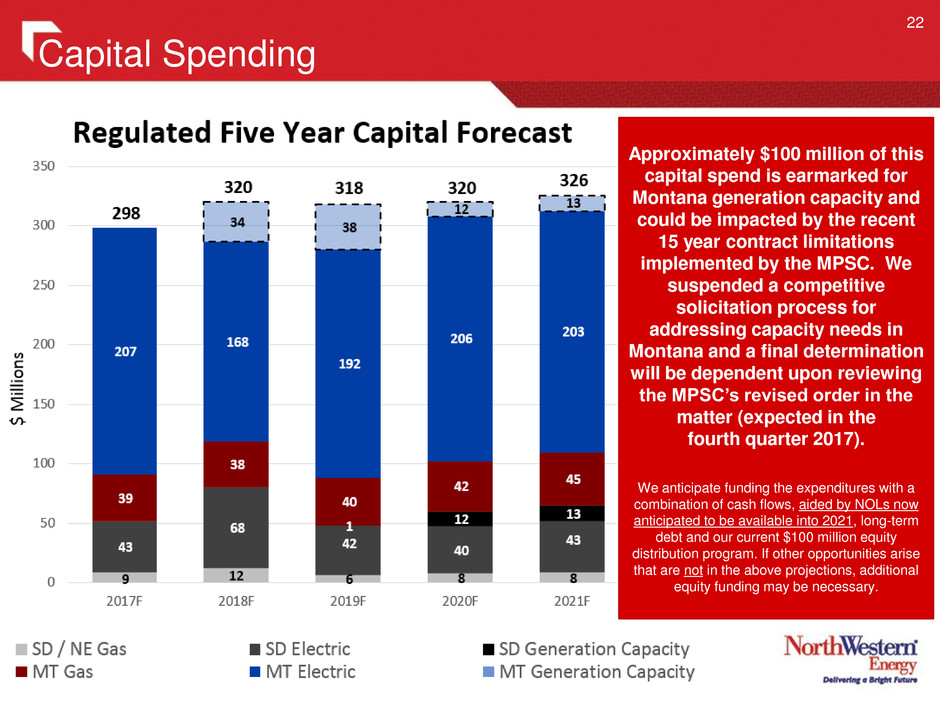
Approximately $100 million of this
capital spend is earmarked for
Montana generation capacity and
could be impacted by the recent
15 year contract limitations
implemented by the MPSC. We
suspended a competitive
solicitation process for
addressing capacity needs in
Montana and a final determination
will be dependent upon reviewing
the MPSC’s revised order in the
matter (expected in the
fourth quarter 2017).
We anticipate funding the expenditures with a
combination of cash flows, aided by NOLs now
anticipated to be available into 2021, long-term
debt and our current $100 million equity
distribution program. If other opportunities arise
that are not in the above projections, additional
equity funding may be necessary.
Preliminary 2017 to 2018 Bridge
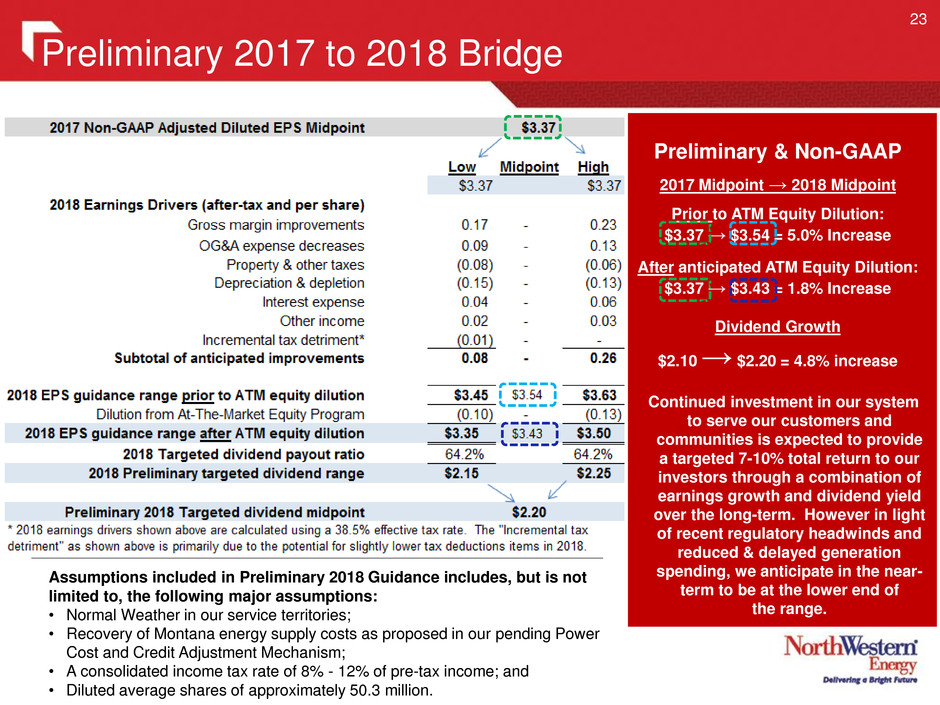
Preliminary & Non-GAAP
2017 Midpoint → 2018 Midpoint
Prior to ATM Equity Dilution:
$3.37 → $3.54 = 5.0% Increase
After anticipated ATM Equity Dilution:
$3.37 → $3.43 = 1.8% Increase
Dividend Growth
$2.10 → $2.20 = 4.8% increase
Continued investment in our system
to serve our customers and
communities is expected to provide
a targeted 7-10% total return to our
investors through a combination of
earnings growth and dividend yield
over the long-term. However in light
of recent regulatory headwinds and
reduced & delayed generation
spending, we anticipate in the near-
term to be at the lower end of
the range.
Assumptions included in Preliminary 2018 Guidance includes, but is not
limited to, the following major assumptions:
• Normal Weather in our service territories;
• Recovery of Montana energy supply costs as proposed in our pending Power
Cost and Credit Adjustment Mechanism;
• A consolidated income tax rate of 8% - 12% of pre-tax income; and
• Diluted average shares of approximately 50.3 million.
23

Conclusion
24
Best
Practices
Corporate
Governance
Pure Electric
& Gas Utility
Solid Utility
Foundation
Strong
Earnings &
Cash Flows
Attractive
Future
Growth
Prospects
Non-GAAP Financial Measures (1 of 2)
25
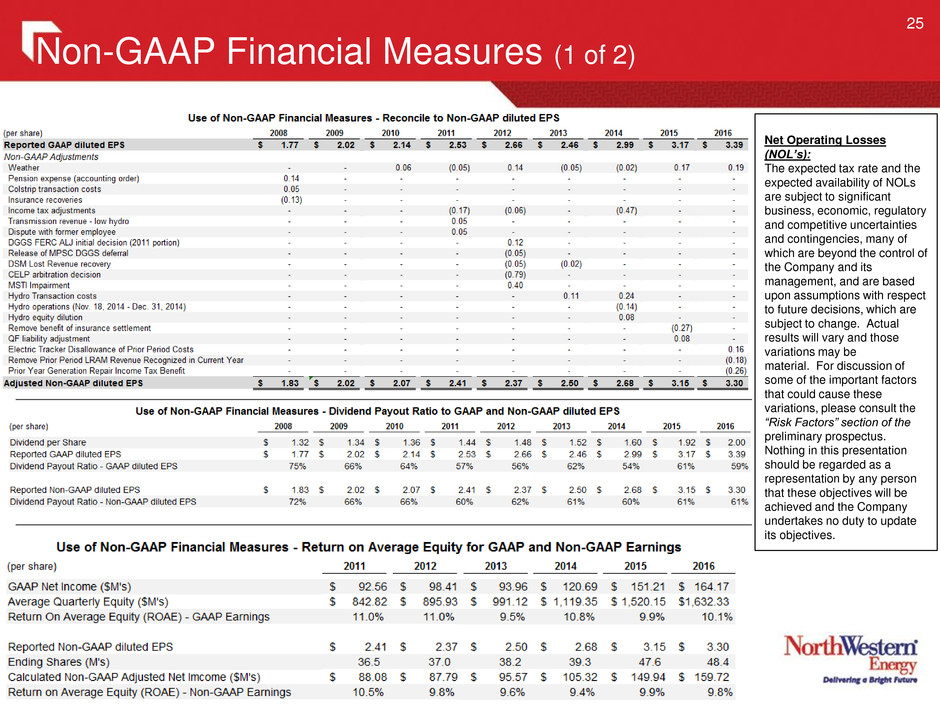
Disclaimer on Net Operating
Net Operating Losses
(NOL’s):
The expected tax rate and the
expected availability of NOLs
are subject to significant
business, economic, regulatory
and competitive uncertainties
and contingencies, many of
which are beyond the control of
the Company and its
management, and are based
upon assumptions with respect
to future decisions, which are
subject to change. Actual
results will vary and those
variations may be
material. For discussion of
some of the important factors
that could cause these
variations, please consult the
“Risk Factors” section of the
preliminary prospectus.
Nothing in this presentation
should be regarded as a
representation by any person
that these objectives will be
achieved and the Company
undertakes no duty to update
its objectives.

Non-GAAP Financial Measures (2 of 2)
26
The data presented in this presentation
includes financial information prepared in
accordance with GAAP, as well as other Non-
GAAP financial measures such as Gross
Margin (Revenues less Cost of Sales), Free
Cash Flows (Cash flows from operations less
maintenance capex and dividends) and Net
Debt (Total debt less capital leases), that are
considered “Non-GAAP financial measures.”
Generally, a Non-GAAP financial measure is a
numerical measure of a company’s financial
performance, financial position or cash flows
that exclude (or include) amounts that are
included in (or excluded from) the most
directly comparable measure calculated and
presented in accordance with GAAP. The
presentation of Gross Margin, Free Cash
Flows and Net Debt is intended to supplement
investors’ understanding of our operating
performance. Gross Margin is used by us to
determine whether we are collecting the
appropriate amount of energy costs from
customers to allow recovery of operating
costs. Net Debt is used by our company to
determine whether we are properly levered to
our Total Capitalization (Net Debt plus Equity).
Our Gross Margin, Free Cash Flows and Net
Debt measures may not be comparable to
other companies’ similarly labeled measures.
Furthermore, these measures are not
intended to replace measures as determined
in accordance with GAAP as an indicator of
operating performance.

27
