Attached files
| file | filename |
|---|---|
| EX-31.2 - EXHIBIT 31.2 CERTIFICATION OF CHIEF FINANCIAL OFFICER - NORTHWESTERN CORP | exhibit312certification10k.htm |
| EX-32.2 - EXHIBIT 32.2 CERTIFICATION OF BRIAN B. BIRD PURSUANT TO SECTION 906 - NORTHWESTERN CORP | exhibit322certification10k.htm |
| EX-32.1 - EXHIBIT 32.1 CERTIFICATION OF ROBERT C. ROWE PURSUANT TO SECTION 906 - NORTHWESTERN CORP | exhibit321certification10k.htm |
| EX-31.1 - EXHIBIT 31.1 CERTIFICATION OF CHIEF EXECUTIVE OFFICER - NORTHWESTERN CORP | exhibit311certification10k.htm |
| EX-23.1 - EXHIBIT 23.1 AUDITOR CONSENT - NORTHWESTERN CORP | exhibit231consent10k2016.htm |
| EX-21 - EXHIBIT 21 SUBSIDIARIES 10-K 2016 - NORTHWESTERN CORP | exhibit21subsidiaries10k20.htm |
| EX-12 - EXHIBIT 12.1 EARNINGS TO FIXED CHARGES 2016 - NORTHWESTERN CORP | exhibit121earningstofixedc.htm |
UNITED STATES
SECURITIES AND EXCHANGE COMMISSION
Washington, D.C. 20549
Form 10-K
(Mark One)
x | ANNUAL REPORT UNDER SECTION 13 OR 15(d) OF THE SECURITIES EXCHANGE ACT OF 1934 | |
For the fiscal year ended December 31, 2016
OR
o | TRANSITION REPORT PURSUANT TO SECTION 13 OR 15(d) OF THE SECURITIES EXCHANGE ACT OF 1934 | |
For the transition period from to
Commission File Number: 1-10499

NORTHWESTERN CORPORATION
(Exact name of registrant as specified in its charter)
Delaware | 46-0172280 | |
(State or other jurisdiction of incorporation or organization) | (I.R.S. Employer Identification No.) | |
3010 W. 69th Street, Sioux Falls, South Dakota | 57108 | |
(Address of principal executive offices) | (Zip Code) | |
Registrant’s telephone number, including area code: 605-978-2900
Securities registered pursuant to Section 12(b) of the Act:
(Title of each class) | (Name of each exchange on which registered) | |
Common Stock, $0.01 par value | New York Stock Exchange | |
Securities registered pursuant to Section 12(g) of the Act:
None
Indicate by check mark if the registrant is a well-known seasoned issuer, as defined in Rule 405 of the Securities Act. Yes x No o
Indicate by check mark if the registrant is not required to file reports pursuant to Section 13 or Section 15(d) of the Act. Yes o No x
Indicate by check mark whether the registrant (1) has filed all reports required to be filed by Section 13 or 15(d) of the Securities Exchange Act of 1934 during the past 12 months (or for such shorter period that the registrant was required to file such reports), and (2) has been subject to such filing requirements for the past 90 days. Yes x No o
Indicate by check mark whether the registrant has submitted electronically and posted on its corporate Website, if any, every Interactive Data File required to be submitted and posted pursuant to Rule 405 of Regulation S-T during the preceding 12 months (or for shorter period that the registrant was required to submit and post such files). Yes x No o
Indicate by check mark if disclosure of delinquent filers pursuant to Item 405 of Regulation S-K is not contained herein, and will not be contained, to the best of registrant’s knowledge, in definitive proxy or information statements incorporated by reference in Part III of this Form 10-K or any amendment to this Form 10-K. x
Indicate by check mark whether the registrant is a large accelerated filer, an accelerated filer, a non-accelerated filer or a smaller reporting company (as defined in Rule 12b-2 of the Exchange Act).
Large Accelerated Filer x Accelerated Filer o Non-accelerated Filer o Smaller Reporting Company o
Indicate by check mark whether the registrant is a shell company (as defined in Rule 12b-2 of the Act). Yes o No x
The aggregate market value of the voting and non-voting common stock held by nonaffiliates of the registrant was $3,046,980,000 computed using the last sales price of $63.07 per share of the registrant’s common stock on June 30, 2016, the last business day of the registrant’s most recently completed second fiscal quarter.
As of February 10, 2017, 48,354,198 shares of the registrant’s common stock, par value $0.01 per share, were outstanding.
Documents Incorporated by Reference
Certain sections of our Proxy Statement for the 2017 Annual Meeting of Shareholders
are incorporated by reference into Part III of this Form 10-K
1
INDEX | PAGE | |
Part I | ||
Part II | ||
Part III | ||
Part IV | ||
2
SPECIAL NOTE REGARDING FORWARD-LOOKING STATEMENTS
On one or more occasions, we may make statements in this Annual Report on Form 10-K regarding our assumptions, projections, expectations, targets, intentions or beliefs about future events. All statements other than statements of historical facts, included or incorporated by reference in this Annual Report, relating to management's current expectations of future financial performance, continued growth, changes in economic conditions or capital markets and changes in customer usage patterns and preferences are forward-looking statements within the meaning of Section 27A of the Securities Act of 1933 and Section 21E of the Securities Exchange Act of 1934.
Words or phrases such as “anticipates," “may," “will," “should," “believes," “estimates," “expects," “intends," “plans," “predicts," “projects," “targets," “will likely result," “will continue" or similar expressions identify forward-looking statements. Forward-looking statements involve risks and uncertainties, which could cause actual results or outcomes to differ materially from those expressed. We caution that while we make such statements in good faith and believe such statements are based on reasonable assumptions, including without limitation, management's examination of historical operating trends, data contained in records and other data available from third parties, we cannot assure you that we will achieve our projections. Factors that may cause such differences include, but are not limited to:
• | adverse determinations by regulators, as well as potential adverse federal, state, or local legislation or regulation, including costs of compliance with existing and future environmental requirements, could have a material effect on our liquidity, results of operations and financial condition; |
• | changes in availability of trade credit, creditworthiness of counterparties, usage, commodity prices, fuel supply costs or availability due to higher demand, shortages, weather conditions, transportation problems or other developments, may reduce revenues or may increase operating costs, each of which could adversely affect our liquidity and results of operations; |
• | unscheduled generation outages or forced reductions in output, maintenance or repairs, which may reduce revenues and increase cost of sales or may require additional capital expenditures or other increased operating costs; and |
• | adverse changes in general economic and competitive conditions in the U.S. financial markets and in our service territories. |
We have attempted to identify, in context, certain of the factors that we believe may cause actual future experience and results to differ materially from our current expectation regarding the relevant matter or subject area. In addition to the items specifically discussed above, our business and results of operations are subject to the uncertainties described under the caption “Risk Factors” which is part of the disclosure included in Part II, Item 1A of this Annual Report on Form 10-K.
From time to time, oral or written forward-looking statements are also included in our reports on Forms 10-Q and 8-K, Proxy Statements on Schedule 14A, press releases, analyst and investor conference calls, and other communications released to the public. We believe that at the time made, the expectations reflected in all of these forward-looking statements are and will be reasonable. However, any or all of the forward-looking statements in this Annual Report on Form 10-K, our reports on Forms 10-Q and 8-K, our Proxy Statements on Schedule 14A and any other public statements that are made by us may prove to be incorrect. This may occur as a result of assumptions, which turn out to be inaccurate, or as a consequence of known or unknown risks and uncertainties. Many factors discussed in this Annual Report on Form 10-K, certain of which are beyond our control, will be important in determining our future performance. Consequently, actual results may differ materially from those that might be anticipated from forward-looking statements. In light of these and other uncertainties, you should not regard the inclusion of any of our forward-looking statements in this Annual Report on Form 10-K or other public communications as a representation by us that our plans and objectives will be achieved, and you should not place undue reliance on such forward-looking statements.
We undertake no obligation to publicly update or revise any forward-looking statements, whether as a result of new information, future events or otherwise. However, your attention is directed to any further disclosures made on related subjects in our subsequent reports filed with the Securities and Exchange Commission (SEC) on Forms 10-K, 10-Q and 8-K and Proxy Statements on Schedule 14A.
Unless the context requires otherwise, references to “we,” “us,” “our,” “NorthWestern Corporation,” “NorthWestern Energy,” and “NorthWestern” refer specifically to NorthWestern Corporation and its subsidiaries.
3
GLOSSARY
Accounting Standards Codification (ASC) - The single source of authoritative nongovernmental GAAP, which supersedes all existing accounting standards.
Allowance for Funds Used During Construction (AFUDC) - A regulatory accounting convention that represents the estimated composite interest costs of debt and a return on equity funds used to finance construction. The allowance is capitalized in the property accounts and included in income.
Base-Load - The minimum amount of electric power or natural gas delivered or required over a given period of time at a steady rate. The minimum continuous load or demand in a power system over a given period of time usually is not temperature sensitive.
Base-Load Capacity - The generating equipment normally operated to serve loads on an around-the-clock basis.
COD - commercial operating date.
Commercial Customers - consists primarily of main street businesses, shopping malls, grocery stores, gas stations, bars and restaurants, professional offices, hospitals and medical offices, motels, and hotels.
Cushion Gas - The natural gas required in a gas storage reservoir to maintain a pressure sufficient to permit recovery of stored gas.
DGGS - The Dave Gates Generating Station at Mill Creek, a 150 MW natural gas fired facility, which provides up to 105 MW of regulation service.
Environmental Protection Agency (EPA) - A Federal agency charged with protecting the environment.
Federal Energy Regulatory Commission (FERC) - The Federal agency that has jurisdiction over interstate electricity sales, wholesale electric rates, hydroelectric licensing, natural gas transmission and related services pricing, oil pipeline rates and gas pipeline certification.
Franchise - A special privilege conferred by a unit of state or local government on an individual or corporation to occupy and use the public ways and streets for benefit to the public at large. Local distribution companies typically have franchises for utility service granted by state or local governments.
GAAP - Accounting principles generally accepted in the United States of America.
Hedging - Entering into transactions to manage various types of risk (e.g. commodity risk).
Industrial Customers - consists primarily of manufacturing and processing businesses that turn raw materials into products.
Lignite Coal - The lowest rank of coal, often referred to as brown coal, used almost exclusively as fuel for steam-electric power generation. It has high inherent moisture content, sometimes as high as 45 percent. The heat content of lignite ranges from 9 to 17 million Btu per ton on a moist, mineral-matter-free basis.
Midcontinent Independent System Operator (MISO) - MISO is a nonprofit organization created in compliance with FERC as a regional transmission organization, to improve the flow of electricity in the regional marketplace and to enhance electric reliability. Additionally, MISO is responsible for managing the energy markets, managing transmission constraints, managing the day-ahead, real-time and financial transmission rights markets and managing the ancillary market.
Midwest Reliability Organization (MRO) - MRO is one of eight regional electric reliability councils under NERC.
Montana Public Service Commission (MPSC) - The state agency that regulates public utilities doing business in Montana.
Nameplate Capacity - the intended full-load sustained output of a generating facility. Nameplate capacity is the number registered with authorities for classifying the power output of a power station usually expressed in megawatts (MW).
Nebraska Public Service Commission (NPSC) - The state agency that regulates public utilities doing business in Nebraska.
4
North American Electric Reliability Corporation (NERC) - NERC oversees eight regional reliability entities and encompasses all of the interconnected power systems of the contiguous United States. NERC's major responsibilities include developing standards for power system operation, monitoring and enforcing compliance with those standards, assessing resource adequacy, and providing educational and training resources as part of an accreditation program to ensure power system operators remain qualified and proficient.
Open Access - Non-discriminatory, fully equal access to transportation or transmission services offered by a pipeline or electric utility.
Open Access Transmission Tariff (OATT) -The OATT, which is established by the FERC, defines the terms and conditions of point-to-point and network integration transmission services offered by us, and requires that transmission owners provide open, non-discriminatory access on their transmission system to transmission customers.
Peak Load - A measure of the maximum amount of energy delivered at a point in time.
Qualifying Facility (QF) - As defined under the Public Utility Regulatory Policies Act of 1978 (PURPA), a QF sells power to a regulated utility at a price agreed to by the parties or determined by a public service commission that is intended to be equal to that which the utility would otherwise pay if it were to generate its own power or buy power from another source.
Regulation Services - FERC jurisdictional services that ensure reliability and support the transmission of electricity from generation sites to customer loads. Such services are also referred to as ancillary services and include regulating reserves, load balancing and voltage support.
Securities and Exchange Commission (SEC) - The U.S. agency charged with protecting investors, maintaining fair, orderly and efficient markets and facilitating capital formation.
South Dakota Public Utilities Commission (SDPUC) - The state agency that regulates public utilities doing business in South Dakota.
Southwest Power Pool (SPP) - A nonprofit organization created in compliance with FERC as a regional transmission organization to ensure reliable supplies of power, adequate transmission infrastructure, and a competitive wholesale electricity marketplace. SPP also serves as a regional electric reliability entity under NERC.
Sub-bituminous Coal - A coal whose properties range from those of lignite to those of bituminous coal and used primarily as fuel for steam-electric power generation. Sub-bituminous coal contains 20 to 30 percent inherent moisture by weight. The heat content of sub-bituminous coal ranges from 17 to 24 million Btu per ton on a moist, mineral-matter-free basis.
Tariffs - A collection of the rate schedules and service rules authorized by a federal or state commission. It lists the rates a regulated entity will charge to provide service to its customers as well as the terms and conditions that it will follow in providing service.
Tolling Contract - An arrangement whereby a party moves fuel to a power generator and receives kilowatt hours (kWh) in return for a pre-established fee.
Transmission - The flow of electricity from generating stations over high voltage lines to substations. The electricity then flows from the substations into a distribution network.
Western Area Power Administration (WAPA) - A federal power-marketing administration and electric transmission agency established by Congress.
Western Electricity Coordination Council (WECC) - WECC is one of eight regional electric reliability councils under NERC.
5
Measurements:
Billion Cubic Feet (Bcf) - A unit used to measure large quantities of gas, approximately equal to 1 trillion Btu.
British Thermal Unit (Btu) - a basic unit used to measure natural gas; the amount of natural gas needed to raise the temperature of one pound of water by one degree Fahrenheit.
Degree-Day - A measure of the coldness / warmness of the weather experienced, based on the extent to which the daily mean temperature falls below or above a reference temperature.
Dekatherm - A measurement of natural gas; ten therms or one million Btu.
Kilovolt (kV) - A unit of electrical power equal to one thousand volts.
Megawatt (MW) - A unit of electrical power equal to one million watts or one thousand kilowatts.
Megawatt Hour (MWH) - One million watt-hours of electric energy. A unit of electrical energy which equals one megawatt of power used for one hour.
6
Part I |
ITEM 1. BUSINESS
OVERVIEW | ||||
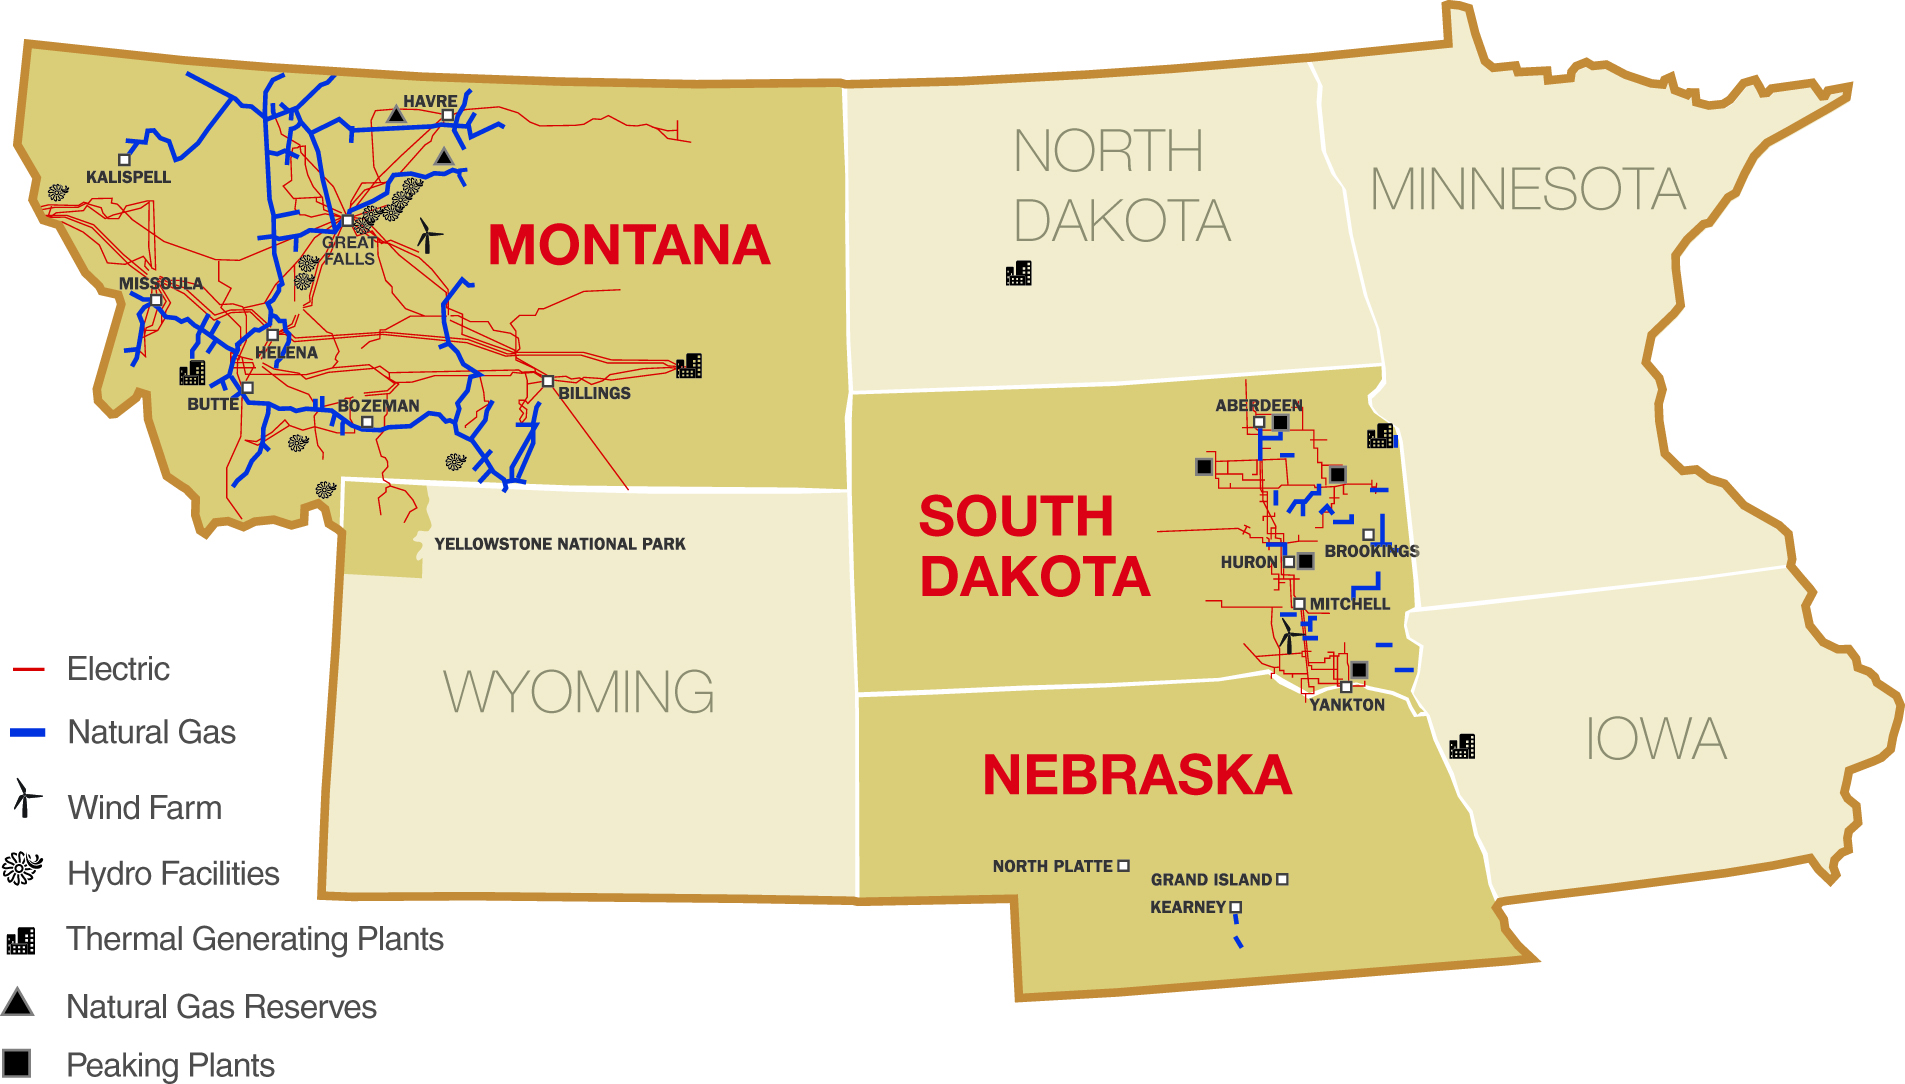
NorthWestern Corporation, doing business as NorthWestern Energy, provides electricity and natural gas to approximately 709,600 customers in Montana, South Dakota and Nebraska. We have generated and distributed electricity in South Dakota and distributed natural gas in South Dakota and Nebraska since 1923 and have generated and distributed electricity and distributed natural gas in Montana since 2002.
We operate our business in the following reporting segments:
• | Electric operations; |
• | Natural gas operations; |
• | All other, which primarily consists of unallocated corporate costs. |
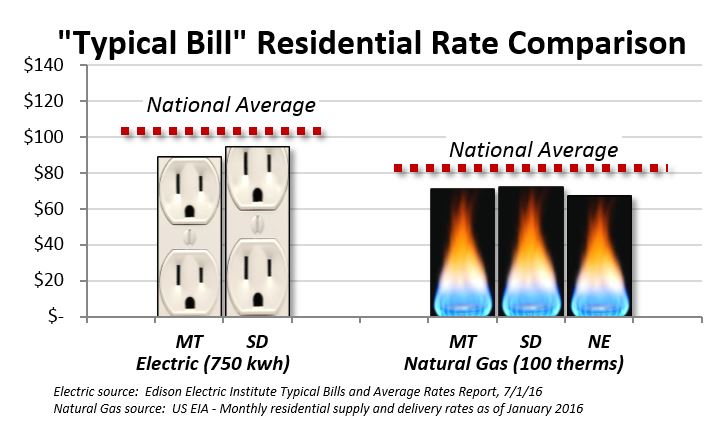
We seek to maintain attractive rates for our customers. As rates are largely cost-based, maintaining low rates requires a strategy focused on developing and maintaining a low-cost position. Our average residential customer bill is below the national average benchmark.
7
Environmental Stewardship
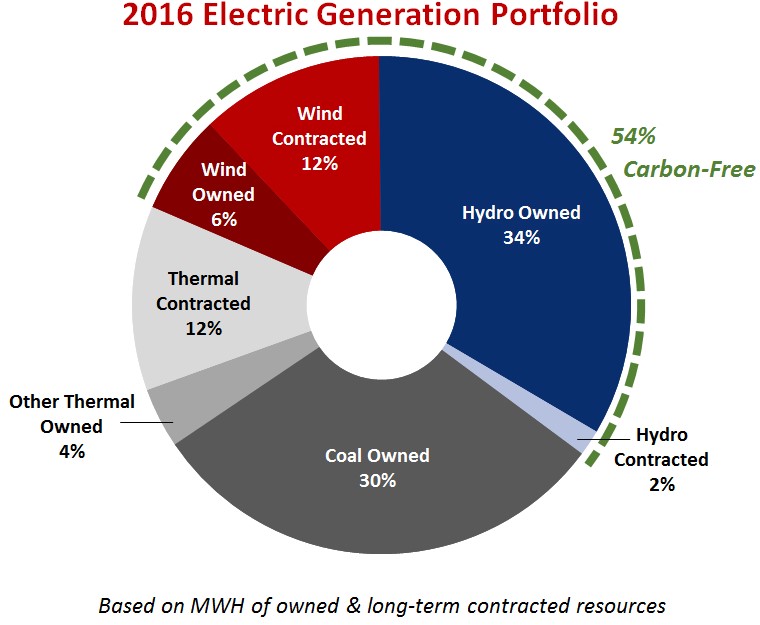
We strive to balance statutory requirements to provide cost-effective, reliable and stably priced energy with being good stewards of natural resources, with a diligent focus on sustainability. We own a mix of clean and carbon-free energy resources balanced with traditional energy sources that help us deliver affordable and reliable electricity to our customers 24/7. Our policies support both the role of cost-effective energy efficiency and the potential value of low or carbon-free resources as part of our diverse supply portfolio. In 2016, approximately 54%, based on megawatt hours generated, of our total company-owned generating assets and contracted electric supply is carbon-free. During 2015 and 2014, we added more than $1 billion of carbon-free electric generation, including the Montana run-of-the-river hydro system and wind generation in South Dakota.
8
ELECTRIC OPERATIONS | ||||
Montana
Our regulated electric utility business in Montana includes generation, transmission and distribution. Our service territory covers approximately 107,600 square miles, representing approximately 73% of Montana's land area, and includes a 2015 census estimated population of approximately 905,600. As of year-end 2016, we delivered electricity to approximately 363,800 customers in 187 communities and their surrounding rural areas, 15 rural electric cooperatives and, in Wyoming, to the Yellowstone National Park. In 2016, by category, residential, commercial, industrial, and other sales accounted for approximately 40%, 50%, 6%, and 4%, respectively, of our Montana retail electric utility revenue. We also transmit electricity for nonregulated entities owning generation, and utilities, cooperatives, and power marketers serving the Montana electricity market. Our total control area peak demand was approximately 1,808 MWs on December 17, 2016, which was a new all-time peak. Our control area average demand for 2016 was approximately 1,239 MWs per hour, with total energy delivered of more than 10.8 million MWHs.
Our Montana electric distribution system consists of approximately 17,750 miles of overhead and underground distribution lines and 393 transmission and distribution substations. Our Montana electric transmission system consists of approximately 6,700 miles of transmission lines, ranging from 50 kV to 500 kV, 288 circuit segments and approximately 104,000 transmission poles on approximately 74,000 structures with associated transformation and terminal facilities, and extends throughout the western two-thirds of Montana from Colstrip in the east to Thompson Falls in the west. We are directly interconnected with Avista Corporation; Idaho Power Company; PacifiCorp; the Bonneville Power Administration; WAPA; and Montana Alberta Tie Ltd. Such interconnections, coupled with transmission line capacity made available under agreements with some of the above entities, permit the interchange, purchase, and sale of power among all major electric systems in the west interconnecting with the winter-peaking northern and summer-peaking southern regions of the western power system. We provide wholesale transmission service and firm and non-firm transmission services for eligible transmission customers. Our 500 kV transmission system, which is jointly owned, along with our 230 kV and 161 kV facilities, form the key assets of our Montana transmission system. Lower voltage systems, which range from 50 kV to 115 kV, provide for local area service needs.
Energy Sources and Resource Planning
Resource planning is an important function necessary to meet our future energy needs. We filed a biennial Electric Supply Resource Procurement Plan with the MPSC during 2016, which guides future resource acquisition activities. Due to our acquisition of the hydroelectric generating facilities in Montana during 2014, adding additional base-load capacity was not identified as a priority. Instead, this plan identified meeting customers' peak requirements as the primary need. A scenario with new gas generation was identified as the most reliable, economical, lowest risk, and affordable means of serving our customers, consistent with state law. The benefits from this scenario hold true even assuming a high cost of carbon. The plan identifies a number of follow-up actions, one of which is to conduct a competitive solicitation in which all types of generation are allowed to participate. From this solicitation, we will identify the lowest cost/lowest risk means of meeting the portfolio's requirements and the most affordable and reliable ways of addressing our customers' peak needs.
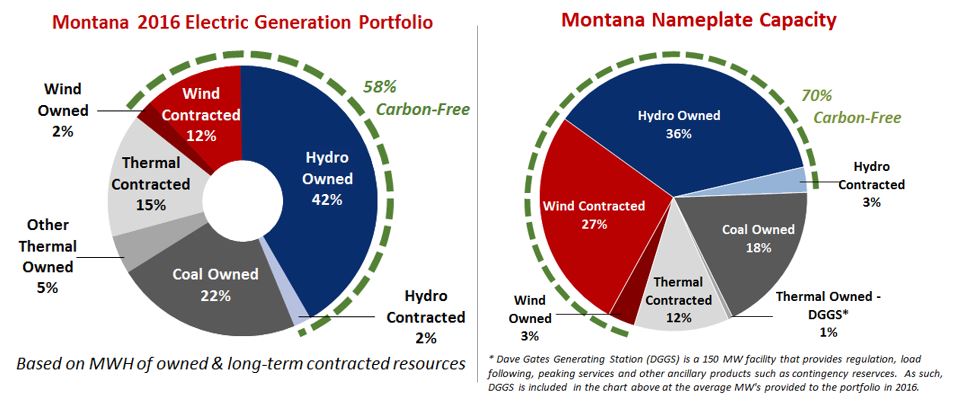
The following charts depict the makeup of our current Montana portfolio. Hydro generation is by far our largest and most important resource, as it is reliable, dramatically lowers the portfolio's carbon intensity, and reduces economic risks associated with future carbon costs.
9
Our annual retail electric supply load requirements averaged approximately 735 MWs, with a peak load of approximately 1,200 MWs, and are supplied by owned and contracted resources and market purchases with multiple counterparties. Owned generation resources supplied approximately 60% of our retail load requirements for 2016. We expect that approximately 60% of our retail obligations will be met by owned generation in 2017 as well. We also purchase power from QFs, which provide a total of 321 MWs of contracted capacity, including 87 MWs of capacity from waste petroleum coke and waste coal, 192 MWs of capacity from wind, 16 MWs of capacity from hydro, and 26 MWs of capacity from solar projects, located in Montana. We have several other long and medium-term power purchase agreements including contracts for 135 MWs of wind generation and 21 MWs of seasonal base-load hydro supply. For 2017, including both owned and contracted resources, we have resources to provide over 90% of the energy requirements necessary to meet our forecasted retail load requirements.
Generation Facilities
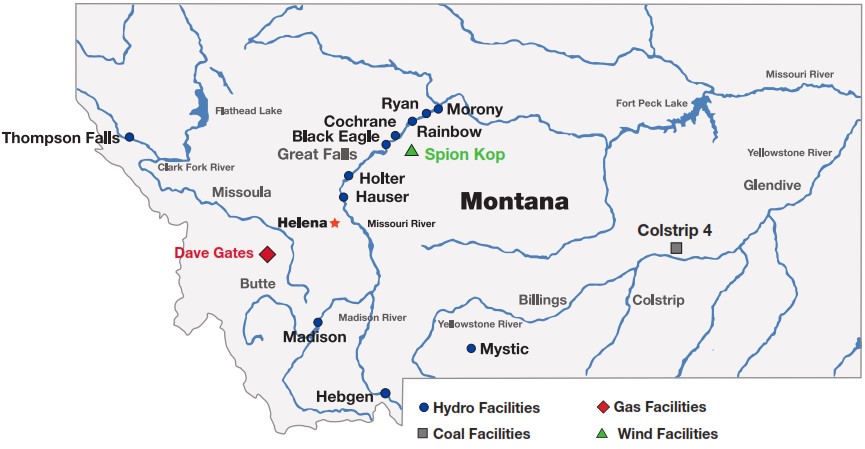
In 2014, we completed the purchase of hydroelectric generating facilities and associated assets located in Montana (Hydro Transaction). The Hydro Transaction included temporary ownership of the Kerr Project until it was conveyed to the Confederated Salish and Kootenai Tribes of the Flathead Reservation on September 5, 2015. The remaining hydro facilities are listed in the table below.
10
Plant | COD | River Source | FERC License Expiration | Net Capacity (MW) (1) |
Black Eagle | 1927 | Missouri | 2040 | 21 |
Cochrane | 1958 | Missouri | 2040 | 69 |
Hauser | 1911 | Missouri | 2040 | 19 |
Holter | 1918 | Missouri | 2040 | 48 |
Madison | 1906 | Madison | 2040 | 8 |
Morony | 1930 | Missouri | 2040 | 48 |
Mystic | 1925 | West Rosebud Creek | 2050 | 12 |
Rainbow | 1910/2013 | Missouri | 2040 | 60 |
Ryan | 1915 | Missouri | 2040 | 63 |
Thompson Falls | 1915 | Clark Fork | 2025 | 94 |
Total | 442 | |||
(1) Hebgen facility (0 MW net capacity) excluded from figures. These are run-of-river dams except for Mystic, which is storage generation.
We have a 30% joint ownership interest in Colstrip Unit 4, a coal-fired generating unit that provides base-load supply and is operated by Talen Energy. Talen Energy has a 30% joint ownership interest in Colstrip Unit 3. We have a risk sharing agreement with Talen Energy regarding the operation of Colstrip Units 3 and 4, in which each party receives 15% of the respective combined output and is responsible for 15% of the respective operating and construction costs, regardless of whether a particular cost is specified to Colstrip Unit 3 or 4. However, each party is responsible for its own fuel-related costs. Colstrip Unit 4 is supplied with fuel from adjacent coal reserves under coal supply and transportation agreements in effect through 2019. We also own the 40 MW Spion Kop wind project. The capacity of Spion Kop represents the nameplate MW, which varies from actual energy expected to be received as wind generation resources are highly dependent upon weather conditions.
We also own the Dave Gates Generating Station at Mill Creek (DGGS), a 150 MW natural gas fired facility. In 2016, DGGS typically operated with one unit providing regulation service, one unit providing other intra-hour balancing, and the third unit providing contingency reserves. In addition, DGGS provided approximately 7 MWs of retail base-load requirements in 2016.
Details of these generating facilities are described in the table below.
Name and Location of Plant | Fuel Source | Namplate Capacity (MW) | Ownership Interest | Owned Capacity (MW) | ||||
Colstrip Unit 4, located near Colstrip in southeastern Montana | Sub-bituminous coal | 740 | 30% | 222 | ||||
Dave Gates Generating Station, located near Anaconda, Montana | Natural Gas | 150 | 100% | 150 | ||||
Spion Kop Wind, located in Judith Basin County in Montana | Wind | 40 | 100% | 40 | ||||
Renewable portfolio standards (RPS) enacted in Montana currently require that 15% of our annual electric supply portfolio be derived from eligible sources, including resources such as wind, biomass, solar, and small hydroelectric. Eligible resources used to serve our load generate renewable energy credits (RECs). Any RECs in excess of the annual requirements for a given year are carried forward for up to two years to meet future RPS needs. Our owned hydro generation assets are not eligible resources under the RPS. Given contracts under negotiation and our portfolio resources, we expect to meet the Montana RPS requirements through at least 2026. The penalty for not meeting the RPS is up to $10 per MWH for each REC short of the requirement.
As a subset of the total RPS requirement, we were required to acquire, as of December 31, 2016, approximately 68 MW of community renewable energy projects, if cost effective. Since 2008, we have undertaken competitive solicitations to acquire this particular resource but have only contracted for 25 MW. We have filed waivers for the years 2012 through 2015, as we have not been able to contract with projects that meet the required qualifications. The MPSC granted waivers for 2012 through 2014, and the waiver request for 2015 is still pending. We expect to file a waiver request for 2016. If the requested waivers are
11
not granted, we may be liable for penalties. If penalties are applied, the amount of the penalty would depend on how the MPSC calculates the energy that a community renewable energy project would have produced.
South Dakota
Our South Dakota electric utility business operates as a vertically integrated generation, transmission and distribution utility. We have the exclusive right to serve an area in South Dakota comprised of 25 counties with a combined 2010 census population of approximately 226,200. We provide retail electricity to more than 63,200 customers in 110 communities in South Dakota. In 2016, by category, residential, commercial and other sales accounted for approximately 39%, 59%, and 2%, respectively, of our South Dakota retail electric utility revenue. Peak demand was approximately 330 MWs, the average load was approximately 189 MWs, and 1.66 million MWHs were supplied during the year ended December 31, 2016.
Our transmission and distribution network in South Dakota consists of approximately 3,550 miles of overhead and underground transmission and distribution lines as well as 124 substations. We have interconnection with the transmission facilities of Otter Tail Power Company; Montana-Dakota Utilities Co.; Xcel Energy Inc.; and WAPA. We have emergency interconnections with the transmission facilities of East River Electric Cooperative, Inc. and West Central Electric Cooperative.
Energy Sources and Resource Planning
We have a resource plan that includes estimates of customer usage and programs to provide for the economic, reliable and timely supply of energy. We continue to update our load forecast to identify the future electric energy needs of our customers, and we evaluate additional generating capacity requirements on an ongoing basis. We use market purchases and peaking generation to provide peak supply in excess of our base-load capacity. We have an agreement with Missouri River Energy Services to supply firm capacity of 30 MW in 2017 and 35 MW in 2018. We are a member of the SPP, which is a regional transmission organization that operates an organized energy market in the Central United States. As a market participant in SPP, we buy and sell wholesale energy and reserves in both day-ahead and real-time markets through the operation of a single, consolidated SPP balancing authority. We and other SPP members submit into the SPP market both offers to sell our generation and bids to purchase power to serve our load. SPP optimizes next-day and real-time generation dispatch across the region and provides participants with greater access to economic energy.
Our sources of energy by type during 2016 were as follows:
12
Generation Facilities
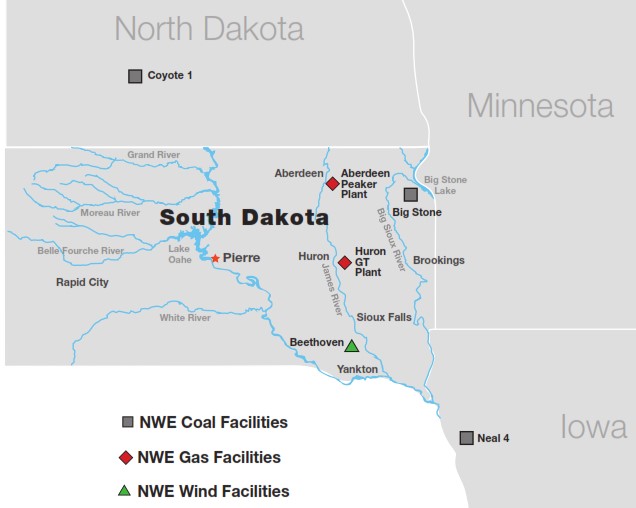
Our electric supply portfolio consists primarily of power plants that we own jointly with unaffiliated parties. Each of the jointly owned plants is subject to a joint management structure, and we are not the operator of any of these plants. Based upon our ownership interest, we are entitled to a proportionate share of the capacity of our jointly owned plants and are responsible for a proportionate share of the operating costs. Additional resources in our supply portfolio include several wholly owned peaking units and three wind projects. The Beethoven wind project is a 80 MW nameplate facility. Actual output varies as wind generation resources are highly dependent upon weather conditions. We also purchase the output of two wind projects, one of which is a QF, under power purchase agreements. We also have several wholly owned peaking/standby generating units at locations throughout our service territory.
Details of our generating facilities are described further in the chart below.
Name and Location of Plant | Fuel Source | Nameplate Capacity (MW) | Ownership Interest | Owned Capacity (MW) | ||||
Big Stone Plant, located near Big Stone City in northeastern South Dakota | Sub-bituminous coal | 475 | 23.4% | 111 | ||||
Coyote I Electric Generating Station, located near Beulah, North Dakota | Lignite coal | 427 | 10.0% | 43 | ||||
Neal Electric Generating Unit No. 4, located near Sioux City, Iowa | Sub-bituminous coal | 644 | 8.7% | 56 | ||||
Aberdeen Generating Unit, located near Aberdeen, South Dakota | Natural gas | 52 | 100.0% | 52 | ||||
Beethoven Wind Project, located near Tripp, South Dakota | Wind | 80 | 100.0% | 80 | ||||
Miscellaneous combustion turbine units and small diesel units (used only during peak periods) | Combination of fuel oil and natural gas | 100.0% | 98 | |||||
Total Capacity | 440 | |||||||
13
The fuel for our jointly owned base-load generating plants is provided through supply contracts of various lengths with several coal companies. Coyote is a mine-mouth generating facility. Neal #4 and Big Stone receive their fuel supply via rail. The average delivered cost by type of fuel burned varies between generation facilities due to differences in transportation costs and owner purchasing power for coal supply. Changes in our fuel costs are passed on to customers through the operation of the fuel adjustment clause in our South Dakota tariffs.
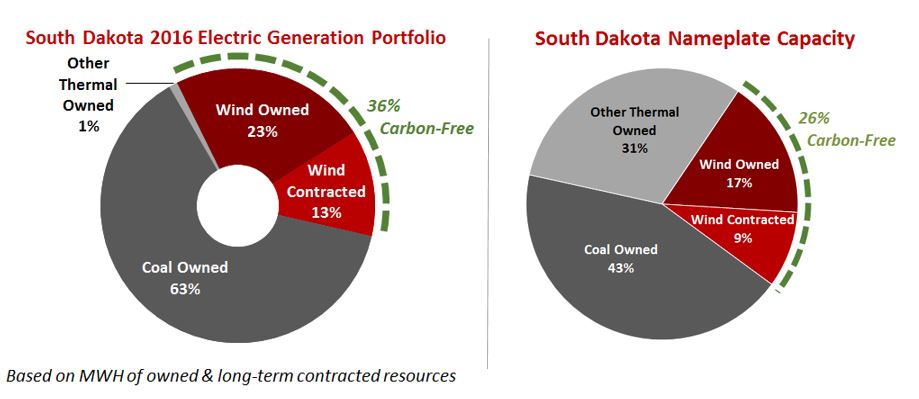
South Dakota has a voluntary renewable and recycled energy objective. The objective states that 10% of all electricity sold at retail within South Dakota be obtained from renewable and recycled energy sources. In 2016, approximately 26% of the South Dakota retail needs were generated from renewable resources. In 2017, we expect to continue to exceed South Dakota's voluntary objective at approximately the same level.
Since October 2015 when we joined the SPP as a transmission owning member we have continued to transfer control of qualifying South Dakota transmission assets into the SPP. To date, we have transferred control of over 330 line miles of 115 kV facilities and over 97 line miles of 69 kV facilities. All of our SPP controlled facilities reside in the Upper Missouri Zone (UMZ), which is also known as Zone 10 in the regional transmission organization. Along with us, other transmission owning members in the UMZ include Basin Electric Power Cooperative, Corn Belt Power Cooperative, Heartland Consumers Power District, Missouri River Energy Services, and WAPA. The Coyote and Big Stone power plants in which we are a joint owner, are connected directly to the MISO system, and we have ownership rights in the transmission lines from these plants to our distribution system. Marketing activities in SPP are handled for us by a third-party provider acting as our agent. Along with operating the transmission system, SPP also coordinates transmission planning for all members of the organization.
NATURAL GAS OPERATIONS | ||||
Montana
Our regulated natural gas utility business in Montana includes production, storage, transmission and distribution. As of year-end 2016, we distributed natural gas to approximately 194,100 customers in 105 Montana communities over a system that consists of approximately 5,150 miles of underground distribution pipelines. We also serve several smaller distribution companies that provide service to approximately 32,000 customers. We transmit natural gas in Montana from production receipt points and storage facilities to distribution points and other nonaffiliated transmission systems. We transported natural gas volumes of approximately 41.6 Bcf during the year ended December 31, 2016.
Our natural gas transmission system consists of more than 2,100 miles of pipeline, which vary in diameter from two inches to 24 inches, and serve more than 130 city gate stations. We have connections in Montana with four major, nonaffiliated transmission systems: Williston Basin Interstate Pipeline, NOVA Gas Transmission Ltd., Colorado Interstate Gas, and Spur Energy. Seven compressor sites provide more than 43,000 horsepower, capable of moving more than 335,000 dekatherms per day. In addition, we own and operate two transmission pipelines through our subsidiaries, Canadian-Montana Pipe Line Corporation and Havre Pipeline Company, LLC.
We have municipal franchises to transport and distribute natural gas in the Montana communities we serve. The terms of the franchises vary by community. They typically have a fixed 10-year term and continue for an additional 10-year term unless and until cancelled, with 5 years notice. If a cancellation notice is received, our policy generally is to work with the community to resolve any issues and execute a new franchise. We currently have four franchises, which account for approximately 7,500 or approximately four percent of our natural gas customers, where the fixed term has expired. We continue to serve those customers while we obtain formal renewals. During the next five years, four additional municipal franchises are scheduled to reach the end of their fixed term, which account for approximately 36,000 or 19 percent of our natural gas customers. We do not anticipate termination of any of these franchises.
Natural gas is used for residential and commercial heating, and for fuel for two electric generating facilities. The demand for natural gas largely depends upon weather conditions. Our Montana retail natural gas supply requirements for the year ended December 31, 2016, were approximately 18.7 Bcf. Our Montana natural gas supply requirements for electric generation fuel for the year ended December 31, 2016, were approximately 4.5 Bcf. We have contracted with several major producers and marketers with varying contract durations to provide the anticipated supply to meet ongoing requirements. Our natural gas supply requirements are fulfilled through third-party fixed-term purchase contracts, short-term market purchases and owned production. Our portfolio approach to natural gas supply is intended to enable us to maintain a diversified supply of natural gas sufficient to meet our supply requirements. We benefit from direct access to suppliers in the major natural gas producing regions in the United States, primarily the Rockies (Colorado), Montana, and Alberta, Canada.
14
Owned Production and Storage
Since 2010, we have acquired gas production and gathering system assets as a part of an overall strategy to provide rate stability and customer value: as we own these assets, which are regulated, our customers are protected from potential price spikes in the market. As of December 31, 2016, these owned reserves totaled approximately 60.6 Bcf and are estimated to provide approximately 4.7 Bcf in 2017, or about 23 percent of our expected annual retail natural gas load in Montana. In addition, we own and operate three working natural gas storage fields in Montana with aggregate working gas capacity of approximately 17.75 Bcf and maximum aggregate daily deliverability of approximately 195,000 dekatherms.
South Dakota and Nebraska
We provide natural gas to approximately 88,500 customers in 60 South Dakota communities and four Nebraska communities. We have approximately 2,405 miles of underground distribution pipelines and 55 miles of transmission pipeline in South Dakota and Nebraska. In South Dakota, we also transport natural gas for nine gas-marketing firms and three large end-user accounts. In Nebraska, we transport natural gas for three gas-marketing firms and one end-user account. We delivered approximately 26.5 Bcf of third-party transportation volume on our South Dakota distribution system and approximately 3.0 Bcf of third-party transportation volume on our Nebraska distribution system during 2016.
Our South Dakota natural gas supply requirements for the year ended December 31, 2016, were approximately 5.2 Bcf. We contract with a third party under an asset management agreement to manage transportation and storage of supply to minimize cost and price volatility to our customers. In Nebraska, our natural gas supply requirements for the year ended December 31, 2016, were approximately 3.9 Bcf. We contract with a third party under an asset management agreement that includes pipeline capacity, supply, and asset optimization activities. To supplement firm gas supplies in South Dakota and Nebraska, we contract for firm natural gas storage services to meet the heating season and peak day requirements of our customers.
We have municipal franchises to purchase, transport and distribute natural gas in the South Dakota and Nebraska communities we serve. The maximum term permitted under Nebraska law for these franchises is 25 years while the maximum term permitted under South Dakota law is 20 years. Our policy generally is to seek renewal or extension of a franchise in the last year of its term. During the next five years, 10 of our South Dakota franchises are scheduled to reach the end of their fixed term. We do not anticipate termination of any of these franchises.
15
REGULATION | ||||
Base rates are the rates we are allowed to charge our customers for the cost of providing delivery service and rate-based supply services, plus a reasonable rate of return on invested capital. We have both electric and natural gas base rates. We may ask the respective regulatory commission to increase base rates from time to time. We have historically been allowed to increase base rates to recover our utility plant investment and operating costs, plus a return on our capital investment. Rate increases are normally granted based on historical data and those increases may not always keep pace with increasing costs. For more information on current regulatory matters, see Note 4 - Regulatory Matters, to the Consolidated Financial Statements.
The following is a summary of our rate base and authorized rates of return in each jurisdiction:
Jurisdiction and Service | Implementation Date | Authorized Rate Base (millions) (1) | Estimated Rate Base (millions) (2) | Authorized Overall Rate of Return | Authorized Return on Equity | Authorized Equity Level | ||||||
Montana electric delivery (3) | July 2011 | $632.5 | $1,069.4 | 7.92% | 10.25% | 48% | ||||||
Montana - DGGS (3) | January 2011 | 172.7 | 121.0 | 8.16% | 10.25% | 50% | ||||||
Montana - Colstrip Unit 4 | January 2009 | 400.4 | 310.0 | 8.25% | 10.00% | 50% | ||||||
Montana Spion Kop | December 2012 | 81.7 | 49.4 | 7.0% | 10.00% | 48% | ||||||
Montana hydro assets | November 2014 | 870.0 | 796.7 | 6.91% | 9.80% | 48% | ||||||
Montana natural gas delivery | June 2013 | 309.2 | 383.2 | 7.48% | 9.80% | 47.65% | ||||||
Montana natural gas production (4) | November 2012 | 12.0 | 58.3 | 7.48% | 9.80% | 47.65% | ||||||
South Dakota electric (5) | December 2015 | 557.3 | 577.8 | 7.24% | n/a | n/a | ||||||
South Dakota natural gas (5) | December 2011 | 65.9 | 62.3 | 7.8% | n/a | n/a | ||||||
Nebraska natural gas (5) | December 2007 | 24.3 | 25.1 | 8.49% | 10.40% | n/a | ||||||
$3,126.0 | $3,453.2 | |||||||||||
(1) Rate base reflects amounts on which we are authorized to earn a return.
(2) Rate base amounts are estimated as of December 31, 2016.
(3) | The FERC regulated portion of Montana electric transmission and DGGS are included as revenue credits to our MPSC jurisdictional customers. Therefore, we do not separately reflect FERC authorized rate base or authorized returns. |
(4) | The authorized rate base represents our Battle Creek natural gas production assets. The estimated rate base also includes two natural gas production fields acquired in August 2012 and December 2013 in northern Montana's Bear Paw Basin, which are recovered in customer rates on an interim basis pending the resolution of our Montana natural gas delivery and production rate filing submitted in September 2016. |
(5) For those items marked as "n/a," the respective settlement and/or order was not specific as to these terms.
MPSC Regulation
Our Montana operations are subject to the jurisdiction of the MPSC with respect to rates, terms and conditions of service, accounting records, electric service territorial issues and other aspects of our operations, including when we issue, assume, or guarantee securities in Montana, or when we create liens on our regulated Montana properties. We have an obligation to provide service to our customers with an opportunity to earn a regulated rate of return.
Electric and Natural Gas Supply Trackers - Rates for our Montana electric and natural gas supply are set by the MPSC. Certain supply rates are adjusted on a monthly basis for volumes and costs during each July to June 12-month tracking period. Annually, supply rates are adjusted to include any differences in the previous tracking year's actual to estimated information for recovery during the subsequent tracking year. We submit annual electric and natural gas tracker filings for the actual 12-month period ended June 30 and for the projected supply costs for the next 12-month period. The MPSC reviews such filings and makes its cost recovery determination based on whether or not our electric and natural gas energy supply procurement activities were prudent. If the MPSC subsequently determines that a procurement activity was imprudent, then it may disallow such costs.
16
Montana Property Tax Tracker - We file an annual property tax tracker (including other state/local taxes and fees) with the MPSC for an automatic rate adjustment, which reflects 60% of the change in property taxes. Adjusted rates are typically effective January 1st of each year.
SDPUC Regulation
Our South Dakota operations are subject to SDPUC jurisdiction with respect to rates, terms and conditions of service, accounting records, electric service territorial issues and other aspects of our electric and natural gas operations. Our retail electric rates, approved by the SDPUC, provide several options for residential, commercial and industrial customers, including dual-fuel, interruptible, special all-electric heating, and other special rates. Our retail natural gas tariffs include gas transportation rates for transportation through our distribution systems by customers and natural gas marketers from the interstate pipelines at which our systems take delivery to the end-user. Such transporting customers nominate the amount of natural gas to be delivered daily. Usage for these customers is monitored daily by us through electronic metering equipment and balanced against respective supply agreements.
An electric adjustment clause provides for quarterly adjustment based on differences in the delivered cost of energy, delivered cost of fuel, ad valorem taxes paid and commission-approved fuel incentives. The adjustment goes into effect upon filing, and is deemed approved within 10 days after the information filing unless the SDPUC staff requests changes during that period. A purchased gas adjustment provision in our natural gas rate schedules permits the monthly adjustment of charges to customers to reflect increases or decreases in purchased gas, gas transportation and ad valorem taxes.
NPSC Regulation
Our Nebraska natural gas rates and terms and conditions of service for residential and smaller commercial customers are regulated by the NPSC. High volume customers are not subject to such regulation, but can file complaints if they allege discriminatory treatment. Under the Nebraska State Natural Gas Regulation Act, a regulated natural gas utility may propose a change in rates to its regulated customers, if it files an application for a rate increase with the NPSC and with the communities in which it serves customers. The utility may negotiate with those communities for a settlement with regard to the rate change if the affected communities representing more than 50% of the affected ratepayers agree to direct negotiations, or it may proceed to have the NPSC review the filing and make a determination. Our tariffs have been accepted by the NPSC, and the NPSC has adopted certain rules governing the terms and conditions of service of regulated natural gas utilities. Our retail natural gas tariffs provide residential, general service and commercial and industrial options, as well as firm and interruptible transportation service. A purchased gas adjustment clause provides for adjustments based on changes in gas supply and interstate pipeline transportation costs.
FERC Regulation
We are subject to FERC's jurisdiction and regulations with respect to rates for electric transmission service in interstate commerce and electricity sold at wholesale rates, hydro licensing and operations, the issuance of certain securities, incurrence of certain long-term debt, and compliance with mandatory reliability regulations, among other things. Under FERC's open access transmission policy promulgated in Order No. 888, as owners of transmission facilities, we are required to provide open access to our transmission facilities under filed tariffs at cost-based rates. In addition, we are required to comply with FERC's Standards of Conduct, as amended, governing the communication of non-public information between our transmission employees and wholesale merchant employees.
Our Montana wholesale transmission customers, such as cooperatives, are served under our OATT, which is on file with FERC. The OATT also defines the terms, conditions and rates of our Montana transmission service, including ancillary services. As discussed above, our South Dakota transmission operations joined the SPP during 2015, and the majority of transmission service in that territory is provided under the SPP OATT. We maintain an OATT in South Dakota, however, to provide discrete transmission service to a small number of transmission customers.
Our natural gas transportation pipelines are generally not subject to FERC's jurisdiction under the NGA, although we are subject to state regulation. We conduct limited interstate transportation in Montana and South Dakota that is subject to FERC jurisdiction, but FERC has allowed the MPSC and SDPUC to set the rates for this interstate service. We have capacity agreements in South Dakota and Nebraska with interstate pipelines that are also subject to FERC jurisdiction.
The facilities acquired in the Hydro Transaction are licensed by the FERC. In connection with the relicensing of these generating facilities, applicable law permits the FERC to issue a new license to the existing licensee or to a new licensee, and alternatively allows the U.S. government to take over the facility. If the existing licensee is not relicensed, it is compensated for
17
its net investment in the facility, not to exceed the fair value of the property taken, plus reasonable severance damages to other property affected by the lack of relicensing.
Reliability Standards - We must comply with the standards and requirements that apply to the NERC functions for which we have registered in both the MRO for our South Dakota operations and the WECC for our Montana operations. WECC and the MRO have responsibility for monitoring and enforcing compliance with the FERC approved mandatory Reliability Standards within their respective regions. Additional reliability standards continue to be developed and will be adopted in the future. We expect that the existing reliability standards will change often as a result of modifications, guidance and clarification following industry implementation and ongoing audits and enforcement.
SEASONALITY AND CYCLICALITY | ||||
Our electric and gas utility businesses are seasonal businesses, and weather patterns can have a material impact on operating performance. Because natural gas is used primarily for residential and commercial heating, the demand for this product depends heavily upon weather patterns throughout our market areas, and a significant amount of natural gas revenues are recognized in the first and fourth quarters related to the heating season. Demand for electricity is often greater in the summer and winter months for cooling and heating, respectively. Accordingly, our operations have historically generated less revenue and income when weather conditions are milder in the winter and cooler in the summer. When we experience unusually mild winters or summers in the future, these weather patterns could adversely affect our results of operations, financial condition and liquidity.
ENVIRONMENTAL | ||||
The operation of electric generating, transmission and distribution facilities, and gas gathering, transportation and distribution facilities, along with the development (involving site selection, environmental assessments, and permitting) and construction of these assets, are subject to extensive federal, state, and local environmental and land use laws and regulations. Our activities involve compliance with diverse laws and regulations that address emissions and impacts to the environment, including air and water, protection of natural resources and wildlife. We monitor federal, state, and local environmental initiatives to determine potential impacts on our financial results. As new laws or regulations are issued, we assess their applicability and implement the necessary modifications to our facilities or their operation to maintain ongoing compliance.
We strive to comply with all environmental regulations applicable to our operations. However, it is not possible to determine when or to what extent additional facilities or modifications of existing or planned facilities will be required as a result of changes to environmental regulations, interpretations or enforcement policies or, what effect future laws or regulations may have on our operations. The EPA is in the process of proposing and finalizing a number of environmental regulations that will directly affect the electric industry over the coming years. These initiatives cover all sources - air, water and waste. For more information on environmental regulations and contingencies and related capital expenditures, see Note 19 - Commitments and Contingencies, to the Consolidated Financial Statements.
CORPORATE INFORMATION AND WEBSITE | ||||
We were incorporated in Delaware in November 1923. Our Internet address is http://www.northwesternenergy.com. Our Annual Report on Form 10-K, Quarterly Reports on Form 10-Q, Current Reports on Form 8-K and amendments, along with our annual report to shareholders and other information related to us, are available, free of charge, on our Internet website as soon as reasonably practicable after we electronically file those documents with, or otherwise furnish them to, the SEC. This information is available in print to any shareholder who requests it. Requests should be directed to: Investor Relations, NorthWestern Corporation, 3010 W. 69th Street, Sioux Falls, South Dakota 57108 and our telephone number is (605) 978-2900. References to our website in this report are provided as a convenience and do not constitute, and should not be viewed as, an incorporation by reference of the information contained on, or available through, the website. Therefore, such information should not be considered part of this report.
18
EMPLOYEES | ||||
As of December 31, 2016, we had 1,552 employees. Of these, 1,231 employees were in Montana and 321 were in South Dakota or Nebraska. Of our Montana employees, 459 were covered by seven collective bargaining agreements involving five unions. Six of these agreements were renegotiated in 2016 with terms that will expire in 2020. Through the acquisition of PPL Montana's hydroelectric generating facilities, we assumed the terms of the remaining agreement, which will be renegotiated in 2017. Of our South Dakota and Nebraska employees, 187 were covered by a collective bargaining agreement that was renegotiated in 2016 with a term that expires at the end of 2019. We consider our relations with employees to be good.
Executive Officer | Current Title and Prior Employment | Age on Feb. 10, 2017 | ||
Robert C. Rowe | President, Chief Executive Officer and Director since August 2008. Prior to joining NorthWestern, Mr. Rowe was a co-founder and senior partner at Balhoff, Rowe & Williams, LLC, a specialized national professional services firm providing financial and regulatory advice to clients in the telecommunications and energy industries (January 2005-August, 2008); and served as Chairman and Commissioner of the Montana Public Service Commission (1993–2004). | 61 | ||
Brian B. Bird | Vice President and Chief Financial Officer since December 2003. Prior to joining NorthWestern, Mr. Bird was Chief Financial Officer and Principal of Insight Energy, Inc., a Chicago-based independent power generation development company (2002-2003). Previously, he was Vice President and Treasurer of NRG Energy, Inc., in Minneapolis, MN (1997-2002). Mr. Bird serves on the board of directors of a NorthWestern subsidiary. | 54 | ||
Michael R. Cashell | Vice President - Transmission since May 2011; formerly Chief Transmission Officer since November 2007; formerly Director Transmission Marketing and Business Planning since 2003. Mr. Cashell serves on the board of directors of a NorthWestern subsidiary. | 54 | ||
Patrick R. Corcoran | Vice President-Government and Regulatory Affairs since December 2004; formerly Vice President-Regulatory Affairs since February 2002; formerly Vice President-Regulatory Affairs for the former Montana Power Company (2000-2002). | 64 | ||
Heather H. Grahame | Vice President and General Counsel since August 2010. Prior to joining NorthWestern, Ms. Grahame was a partner in the law firm of Dorsey & Whitney, LLP, where she co-chaired its Telecommunications practice (1999-2010). | 61 | ||
John D. Hines | Vice President - Supply since May 2011; formerly Chief Energy Supply Officer since January 2008; formerly Director - Energy Supply Planning since 2006. Previously, Mr. Hines served as the Montana representative to the NorthWest Power and Conservation Council (2003-2006). | 58 | ||
Crystal D. Lail | Vice President and Controller since October 2015; formerly Assistant Controller since February 2008 and, prior to that an SEC Reporting Manager. Prior to joining NorthWestern, Ms. Lail was an auditor for KPMG LLP. | 38 | ||
Curtis T. Pohl | Vice President - Distribution since May 2011; formerly Vice President-Retail Operations since September 2005; Vice President-Distribution Operations since August 2003; formerly Vice President-South Dakota/Nebraska Operations since June 2002; formerly Vice President-Engineering and Construction since June 1999. Mr. Pohl serves on the board of directors of a NorthWestern subsidiary. | 52 | ||
Bobbi L. Schroeppel | Vice President, Customer Care, Communications and Human Resources since May 2009, formerly Vice President-Customer Care and Communications since September 2005; formerly Vice President-Customer Care since June 2002; formerly Director-Staff Activities and Corporate Strategy since August 2001; formerly Director-Corporate Strategy since June 2000. | 48 | ||
Officers are elected annually by, and hold office at the pleasure of the Board of Directors (Board), and do not serve a “term of office” as such.
19
ITEM 1A. RISK FACTORS
You should carefully consider the risk factors described below, as well as all other information available to you, before making an investment in our common stock or other securities.
We are subject to potential unfavorable state and federal regulatory outcomes. To the extent our incurred costs are deemed imprudent by the applicable regulatory commissions or certain regulatory mechanisms are not available, we may not recover some of our costs, which could adversely impact our results of operations and liquidity.
Our profitability is dependent on our ability to recover the costs of providing energy and utility services to our customers and earn a return on our capital investment in our utility operations. We provide service at rates established by several regulatory commissions. These rates are generally set based on an analysis of our costs incurred in a historical test year. In addition, each regulatory commission sets rates based in part upon their acceptance of an allocated share of total utility costs. When commissions adopt different methods to calculate inter-jurisdictional cost allocations, some costs may not be recovered. Thus, the rates we are allowed to charge may or may not match our costs at any given time. While rate regulation is premised on providing a reasonable opportunity to earn a reasonable rate of return on invested capital, there can be no assurance that the applicable regulatory commission will judge all of our costs to have been prudently incurred or that the regulatory process in which rates are determined will always result in rates that will produce full recovery of such costs.
In addition to rate cases, our cost tracking mechanisms are a significant component of how we recover our costs. Our wholesale costs for electricity and natural gas supply are recovered through various pass-through cost tracking mechanisms in each of the states we serve. The rates are established based upon projected market prices or contractual obligations. As these variables change, we adjust our rates through our monthly trackers, which are subject to approval by the applicable regulatory commissions. When electric generation outages occur, we may procure replacement power in the market. These costs have typically been included in our monthly trackers. To the extent our energy supply costs are deemed imprudent by the applicable state regulatory commissions, we may not recover some of our costs, which could adversely impact our results of operations.
We have received several unfavorable regulatory rulings in Montana, including:
•In 2016, the MPSC disallowed approximately $8.2 million of replacement power costs from a 2013 outage at Colstrip Unit 4, and approximately $1.3 million of costs related to generation portfolio modeling previously recovered through our electric tracker filings.
•In October 2015, the MPSC issued an order eliminating the lost revenue adjustment mechanism. This mechanism was established in 2005 by the MPSC as a component of an approved energy efficiency program, by which we recovered on an after-the-fact basis a portion of our fixed costs that would otherwise have been collected in the kWh sales lost due to energy efficiency programs through our supply tracker. Lost revenues were removed prospectively effective December 1, 2015.
•In October 2013, the MPSC concluded that $1.4 million of incremental costs associated with regulation service acquired from third parties during a 2012 outage at DGGS were imprudently incurred, and disallowed recovery.
We appealed the October 2013 decision regarding DGGS outage costs to the Montana District Court, which, in August 2015, upheld the MPSC’s decision. In October 2015, we appealed the District Court’s decision to the Montana Supreme Court, which, in September 2016, upheld the District Court's decision.
In June 2016, we filed an appeal of the MPSC decision regarding the disallowance of portfolio modeling costs in Montana District Court (Lewis & Clark County). Also, in September 2016, we appealed the MPSC’s decisions regarding the disallowance of Colstrip Unit 4 replacement power costs and the modeling/planning costs, arguing that these decisions were arbitrary and capricious, and violated Montana law. We brought this action in Montana District Court, as well (Yellowstone County). The briefing in this case is currently scheduled to conclude by the end of the second quarter of 2017. While the courts are not obligated to rule on these appeals within a certain period of time, based on our experience, we believe we are likely to receive orders from the courts in these matters within 9-20 months of filing.
In addition, the November 2016, MPSC order in our hydro compliance filing lowered our authorized recovery of certain costs and requires us to indicate by April 30, 2017, whether we intend to file a Montana electric rate case based on a 2016 test year. The order also indicated that if we do not intend to file a rate case in 2017, the MPSC may require us to make an
20
additional filing that would facilitate an assessment of whether additional action would be required to fulfill the MPSC's obligation to authorize just and reasonable rates.
In addition to our supply trackers, we file an annual property tax tracker with the MPSC for an automatic rate adjustment of our Montana property taxes, which allows recovery of 60 percent of the change in property taxes. Adjusted rates are typically effective January 1st of each year. The MPSC has identified concerns with the amount of annual increases proposed by the Montana Department of Revenue, and the MPSC is considering what, if any, alternatives it might pursue. Any change in recovery of property taxes could have a material impact on our results of operations.
In addition, in our regulatory filings related to DGGS, we proposed an allocation of approximately 80% of costs to retail customers subject to the MPSC's jurisdiction and approximately 20% allocated to wholesale customers subject to FERC's jurisdiction. In March 2012, the MPSC's final order approved using our proposed cost allocation methodology, but requires us to complete a study of the relative contribution of retail and wholesale customers to regulation capacity needs. The results of this study may be used in determining future cost allocations between retail and wholesale customers. However, there is no assurance that both the MPSC and FERC will agree on the results of this study, which could result in an inability to fully recover our costs.
In May 2016, we received an order from the FERC denying a May 2014 request for rehearing and requiring us to make refunds. The request for rehearing challenged a September 2012 FERC Administrative Law Judge's (ALJ) initial decision regarding cost allocation at DGGS between retail and wholesale customers. This decision concluded that only a portion of these costs should be allocated to FERC jurisdictional customers. We had deferred cumulative revenue of approximately $27.3 million, consistent with the ALJ's initial decision, which was refunded to wholesale and choice customers in June 2016 in accordance with the FERC order. In June 2016, we filed a petition for review with the U.S. Circuit Court of Appeals for the District of Columbia Circuit. A briefing schedule has been established, with final briefs due by the end of the first quarter of 2017. We do not expect a decision in this matter until the second half of 2017, at the earliest. The FERC order was assessed as a triggering event as to whether an impairment charge should be recorded with respect to DGGS.The cost recovery of any alternative use of DGGS would be subject to regulatory approval and we cannot provide assurance of such approval. If we are not able to obtain cost recovery of DGGS we may be required to record an impairment charge, which could have a material adverse effect on our operating results.
Our ability to invest in additional generation is impacted by regulatory and public policy. Under PURPA, electric utilities are required, with exceptions, to purchase energy and capacity from independent power producers that are qualifying co-generation facilities and qualifying small power production facilities (QFs). Our requirements to procure power from these sources could impact our ability to make generation investments depending upon the number and size of QF contracts we ultimately enter into. In addition, the cost to procure power from these QFs may not be a cost effective resource for customers, or the type of generation resource needed, resulting in increased supply costs.
We must also comply with established reliability standards and requirements, which apply to NERC functions in both the MRO for our South Dakota operations and WECC for our Montana operations. The FERC, NERC, or a regional reliability organization may assess penalties against any responsible entity that violates their rules, regulations or standards. Violations may be discovered through various means, including self-certification, self-reporting, compliance investigations, audits, periodic data submissions, exception reporting, and complaints. Penalties for the most severe violations can reach as high as approximately $1.2 million per violation, per day. If a serious reliability incident or other incidence of noncompliance did occur, it could have a material adverse effect on our operating and financial results.
We are also subject to changing federal and state laws and regulations. Congress and state legislatures may enact legislation that adversely affects our operations and financial results.
We are subject to existing, and potential future, federal and state legislation. In the planning and management of our operations, we must address the effects of legislation within a regulatory framework. Federal and state laws can significantly impact our operations, whether it is new or revised statutes directly affecting the electric and gas industry, or other issues such as taxes.
We are subject to changing tax laws, regulations, and interpretations in multiple jurisdictions. Corporate tax reform continues to be a priority in the U.S. Changes to the U.S. tax system could have significant effects, positive and negative, on our effective tax rate, and on our deferred tax assets and liabilities. In addition, the timing of realization of certain tax benefits may be further delayed in the event of future extensions of bonus depreciation or expensing of capital investments and impact our ability to utilize our federal and state net operating loss carryforwards.
21
In addition, new or revised statutes can also materially affect our operations through impacting existing regulations or requiring new regulations. These changes are ongoing, and we cannot predict the future course of changes or the ultimate effect that this changing environment will have on us. Changes in laws, and the resulting regulations and tariffs and how they are implemented and interpreted, may have a material adverse effect on our businesses, financial condition, results of operations and cash flows.
In April 2016, the U.S. Senate passed the Securing America’s Future Energy: Protecting our Infrastructure of Pipelines and Enhancing Safety Act (SAFE PIPES Act), which would reauthorize appropriations for the Department of Transportation's Pipeline and Hazardous Materials Safety Administration (PHMSA) safety programs through 2019. The bill prioritizes PHMSA's completion of outstanding regulations. In addition, PHMSA proposed revisions to safety standards for natural gas transmission and gathering pipelines. The long-anticipated proposal could impose significant regulatory requirements for additional miles of natural gas pipeline, including pipelines constructed prior to 1970 which were previously exempt from PHMSA regulations related to pressure testing. It would also create a new "Moderate Consequence Area" category to expand safety protocols to pipelines in moderately populated areas. The rule also would codify the Integrity Verification Process (IVP) which is a process that will require companies to have reliable, traceable, verifiable, and complete records for pipelines in certain areas. The rule would establish a deadline for IVP completion that we will be required to meet. Costs incurred to comply with the proposed regulations may be material.
We are subject to extensive and changing environmental laws and regulations and potential environmental liabilities, which could have a material adverse effect on our liquidity and results of operations.
We are subject to extensive laws and regulations imposed by federal, state, and local government authorities in the ordinary course of operations with regard to the environment, including environmental laws and regulations relating to air and water quality, protection of natural resources, migratory birds and other wildlife, solid waste disposal, coal ash and other environmental considerations. We believe that we are in compliance with environmental regulatory requirements; however, possible future developments, such as more stringent environmental laws and regulations, and the timing of future enforcement proceedings that may be taken by environmental authorities, could affect our costs and the manner in which we conduct our business and could require us to make substantial additional capital expenditures or abandon certain projects.
There is uncertainty associated with the new EPA Administration and the timeframe for actions that may be taken with regard to the existing and pending GHG-related regulations. National and international actions have been initiated to address global climate change and the contribution of greenhouse gas (GHG) emissions including, most significantly, carbon dioxide.
In October 2015, the EPA issued standards for states to implement to control GHG emissions from existing electric generating units. These standards are referred to as the Clean Power Plan or CPP. We, along with a number of states and other parties, filed lawsuits against the EPA standards. In February 2016, the U.S. Supreme Court entered an order staying the implementation of the CPP standards. In a separate proceeding, in January 2017, the EPA denied our administrative Petition for Reconsideration that had requested the EPA reconsider the CPP on the grounds that the carbon dioxide (CO2) reductions in the CPP were substantially greater in Montana than in the proposed rule. In response, we may file a Petition for Review in the U.S. Court of Appeals for the District of Columbia. Additional information regarding the CPP, the proposed reductions in South Dakota and Montana, and the pending litigation is included in Note 19 - Commitments and Contingencies to the Consolidated Financial Statements.
If the CPP standards survive judicial review and are implemented as written, they could result in significant additional compliance costs that would affect our future results of operations and financial position if such costs are not recovered through regulated rates. Due to the pending litigation and the uncertainties in the state approaches, the ultimate timing and impact of these standards on our operations cannot be determined with certainty at this time. Complying with the carbon emission standards, and with other future environmental rules, may make it economically impractical to continue operating all or a portion of our jointly owned facilities or for individual owners to participate in their proportionate ownership of the coal-fired generating units. This could lead to significant impacts to customer rates for recovery of plant improvements and / or closure related costs and costs to procure replacement power. In addition, these changes could impact system reliability due to changes in generation sources.
Many of these environmental laws and regulations provide for substantial civil and criminal fines for noncompliance which, if imposed, could result in material costs or liabilities. In addition, there is a risk of environmental damages claims from private parties or government entities. We may be required to make significant expenditures in connection with the investigation and remediation of alleged or actual spills, personal injury or property damage claims, and the repair, upgrade or expansion of our facilities to meet future requirements and obligations under environmental laws.
22
To the extent that costs exceed our estimated environmental liabilities, or we are not successful in recovering remediation costs or costs to comply with the proposed or any future changes in rules or regulations, our results of operations and financial position could be adversely affected.
Our revenues, results of operations and financial condition are impacted by customer growth and usage in our service territories and may fluctuate with current economic conditions or response to price increases. We are also impacted by market conditions outside of our service territories related to demand for transmission capacity and wholesale electric pricing.
Our revenues, results of operations and financial condition are impacted by customer growth and usage, which can be impacted by a number of factors, including the voluntary reduction of consumption of electricity and natural gas by our customers in response to increases in prices and demand-side management programs, economic conditions impacting decreases in their disposable income, and the use of distributed generation resources or other emerging technologies for electricity. Advances in distributed generation technologies that produce power, including fuel cells, micro-turbines, wind turbines and solar cells, may reduce the cost of alternative methods of producing power to a level competitive with central power station electric production. Customer-owned generation itself reduces the amount of electricity purchased from utilities and has the effect of increasing rates unless retail rates are designed to share the costs of the distribution grid across all customers that benefit from their use. Such developments could affect the price of energy, could affect energy deliveries as customer-owned generation becomes more cost-effective, could require further improvements to our distribution systems to address changing load demands and could make portions of our electric system power supply and transmission and/or distribution facilities obsolete prior to the end of their useful lives. Such technologies could also result in further declines in commodity prices or demand for delivered energy.
Both decreasing use per customer driven by appliance and lighting efficiency and the availability of cost-effective distributed generation put downward pressure on load growth. Our electricity supply resource procurement plan includes an expected load growth assumption of 0.8 percent annually, which reflects low customer and usage increases, offset in part by these efficiency measures. Reductions in usage, attributable to various factors could materially affect our results of operations, financial position, and cash flows through, among other things, reduced operating revenues, increased operating and maintenance expenses, and increased capital expenditures, as well as potential asset impairment charges or accelerated depreciation and decommissioning expenses over shortened remaining asset useful lives.
Demand for our Montana transmission capacity fluctuates with regional demand, fuel prices and weather related conditions. The levels of wholesale sales depend on the wholesale market price, market participants, transmission availability and the availability of generation, among other factors. Declines in wholesale market price, availability of generation, transmission constraints in the wholesale markets, or low wholesale demand could reduce wholesale sales. These events could adversely affect our results of operations, financial position and cash flows.
Weather and weather patterns, including normal seasonal and quarterly fluctuations of weather, as well as extreme weather events that might be associated with climate change, could adversely affect our results of operations and liquidity.
Our electric and natural gas utility business is seasonal, and weather patterns can have a material impact on our financial performance. Demand for electricity and natural gas is often greater in the summer and winter months associated with cooling and heating. Because natural gas is heavily used for residential and commercial heating, the demand for this product depends heavily upon weather patterns throughout our market areas, and a significant amount of natural gas revenues are recognized in the first and fourth quarters related to the heating season. Accordingly, our operations have historically generated less revenue and income when weather conditions are milder in the winter and cooler in the summer. In the event that we experience unusually mild winters or cool summers in the future, our results of operations and financial position could be adversely affected. Higher temperatures may also decrease the Montana snowpack, which may result in dry conditions and an increased threat of forest fires. Forest fires could threaten our communities and electric transmission lines and facilities. Any damage caused as a result of forest fires could negatively impact our financial condition, results of operations or cash flows. In addition, exceptionally hot summer weather or unusually cold winter weather could add significantly to working capital needs to fund higher than normal supply purchases to meet customer demand for electricity and natural gas. Our sensitivity to weather volatility is significant due to the absence of regulatory mechanisms, such as those authorizing revenue decoupling, lost margin recovery, and other innovative rate designs. There is also a concern that the physical risks of climate change could include changes in weather conditions, such as changes in the amount or type of precipitation and extreme weather events.
Climate change and the costs that may be associated with its impacts have the potential to affect our business in many ways, including increasing the cost incurred in providing electricity and natural gas, impacting the demand for and
23
consumption of electricity and natural gas (due to change in both costs and weather patterns), and affecting the economic health of the regions in which we operate. Extreme weather conditions creating high energy demand on our own and/or other systems may raise market prices as we buy short-term energy to serve our own system. Severe weather impacts our service territories, primarily through thunderstorms, tornadoes and snow or ice storms. To the extent the frequency of extreme weather events increase, this could increase our cost of providing service. We derive a significant portion of our power supply from hydroelectric facilities. Because of our heavy reliance on hydroelectric generation, snowpack, the timing of run-off, drought conditions, and the availability of water can significantly affect operations. In addition, extreme weather may exacerbate the risks to physical infrastructure. We may not recover all costs related to mitigating these physical and financial risks.
Cyber and physical attacks, threats of terrorism and catastrophic events that could result from terrorism, or individuals and/or groups attempting to disrupt our business, or the businesses of third parties, may affect our operations in unpredictable ways and could adversely affect our liquidity and results of operations.
We are subject to the potentially adverse operating and financial effects of terrorist acts and threats, as well as cyber (such as hacking and viruses) and physical security breaches and other disruptive activities of individuals or groups. Our generation, transmission and distribution facilities are deemed critical infrastructure and provide the framework for our service infrastructure. These assets and the information technology systems on which they depend could be direct targets of, or indirectly affected by, cyber attacks and other disruptive activities, including cyber attacks and other disruptive activities on third party facilities that are interconnected to us through the regional transmission grid or natural gas pipeline infrastructure. Any significant interruption of these assets or systems could prevent us from fulfilling our critical business functions including delivering energy to our customers, and sensitive, confidential and other data could be compromised.
We rely on information technology networks and systems to operate our critical infrastructure, engage in asset management activities, and process, transmit and store electronic information including customer and employee information. Further, our infrastructure, networks and systems are interconnected to external networks and neighboring critical infrastructure systems. Security breaches could lead to system disruptions, generating facility shutdowns or unauthorized disclosure of confidential information. In particular, any data loss or information security lapses resulting in the compromise of personal information or the improper use or disclosure of sensitive or classified information could result in claims, remediation costs, regulatory sanctions, loss of current and future contracts, and serious harm to our reputation.
We are subject to laws and rules issued by multiple government agencies concerning safeguarding and maintaining the confidentiality of our security, customer and business information. One of the agencies, NERC, has issued comprehensive regulations and standards surrounding the security of our operating systems, and is continually in the process of developing updated and additional requirements with which the utility industry must comply. The increasing promulgation of NERC rules and standards will increase our compliance costs and our exposure to the potential risk of violations of standards.
Security threats continue to evolve and adapt. Cyber or physical attacks, terrorist acts, or disruptive activities could harm our business by limiting our ability to generate, purchase or transmit power and by delaying the development and construction of new generating facilities and capital improvements to existing facilities. These events, and governmental actions in response, could result in a material decrease in revenues and significant additional costs to repair and insure assets, and could adversely affect our operations by contributing to the disruption of supplies and markets for natural gas, oil and other fuels. These events could also impair our ability to raise capital by contributing to financial instability and reduced economic activity.
Our plans for future expansion through the acquisition of assets including natural gas reserves, capital improvements to current assets, generation investments, and transmission grid expansion involve substantial risks.
Acquisitions include a number of risks, including but not limited to, regulatory approval, additional costs, the assumption of material liabilities, the diversion of management’s attention from daily operations to the integration of the acquisition, difficulties in assimilation and retention of employees, and securing adequate capital to support the transaction. The regulatory process in which rates are determined may not result in rates that produce full recovery of our investments, or a reasonable rate of return. Uncertainties also exist in assessing the value, risks, profitability, and liabilities associated with certain businesses or assets and there is a possibility that anticipated operating and financial synergies expected to result from an acquisition do not develop. The failure to successfully integrate future acquisitions that we may choose to undertake could have an adverse effect on our financial condition and results of operations.
Our business strategy also includes significant investment in capital improvements and additions to modernize existing infrastructure, generation investments and transmission capacity expansion. The completion of generation and natural gas investments and transmission projects are subject to many construction and development risks, including, but not limited to, risks related to permitting, financing, regulatory recovery, escalating costs of materials and labor, meeting construction budgets
24
and schedules, and environmental compliance. In addition, these capital projects may require a significant amount of capital expenditures. We cannot provide certainty that adequate external financing will be available to support such projects. Additionally, borrowings incurred to finance construction may adversely impact our leverage, which could increase our cost of capital.
Our electric and natural gas operations involve numerous activities that may result in accidents and other operating risks and costs.
Inherent in our electric and natural gas operations are a variety of hazards and operating risks, such as fires, electric contacts, leaks, explosions and mechanical problems. These risks could cause a loss of human life, significant damage to property, loss of customer load, environmental pollution, impairment of our operations, and substantial financial losses to us and others. In accordance with customary industry practice, we maintain insurance against some, but not all, of these risks and losses. The occurrence of any of these events not fully covered by insurance could have a material adverse effect on our financial position and results of operations. For our natural gas transmission and distribution lines located near populated areas, including residential areas, commercial business centers, industrial sites and other public gathering areas, the level of damages resulting from these risks potentially is greater.
Our owned and jointly owned electric generating facilities are subject to operational risks that could result in unscheduled plant outages, unanticipated operation and maintenance expenses and increased power purchase costs.
Operation of electric generating facilities involves risks, which can adversely affect energy output and efficiency levels. Operational risks include facility shutdowns due to breakdown or failure of equipment or processes, labor disputes, operator error, catastrophic events such as fires, explosions, floods, and intentional acts of destruction or other similar occurrences affecting the electric generating facilities; and operational changes necessitated by environmental legislation, litigation or regulation. The loss of a major electric generating facility would require us to find other sources of supply or ancillary services, if available, and expose us to higher purchased power costs.
The six owners of Colstrip currently share the operating costs pursuant to the terms of an operating agreement among the owners of Units 3 and 4 and a common facilities agreement among the owners of all four units. As a result of the Colstrip Litigation, discussed further in Note 19 - Commitments and Contingencies to the Consolidated Financial Statements, the proposed consent decree in this litigation calls for Units 1 and 2 to be shut down no later than July 2022. We do not have ownership in Units 1 and 2, and decisions regarding these units, including potential shut down, are made by the respective owners. When Units 1 and 2 discontinue operation, we anticipate incurring incremental operating costs with respect to our interest in Unit 4. In addition, in May 2016, Talen provided a two-year notice of its intent to resign as the operator of Colstrip. We and the other owners are working to select a new operator, which we expect will increase operating costs. At this time we do not anticipate these increases will be material to our results of operations and cash flows. However, the ultimate shutdown of Talen's share of Colstrip Units 1 and 2 will have a negative impact on our transmission revenue due to less energy available to transmit across our transmission lines.
In early July 2013, following the return to service from a scheduled maintenance outage, Colstrip Unit 4 tripped off-line and incurred damage to its stator and rotor. Colstrip Unit 4 returned to service in early 2014. As discussed above, we were not able to fully recover our costs for the purchase of replacement power while Colstrip Unit 4 was out of service.
Colstrip Units 3 and 4 are supplied with fuel from adjacent coal reserves under coal supply and transportation agreements in effect through 2019. These contracts are necessary for the long-term operation of the facility. Negotiation of a new coal supply contract anticipates environmental reviews and permitting, and we cannot predict when or if those permits will be granted. If a new coal supply contract is not in place, we could continue under the current arrangement for several years if the mining company agrees, however the extraction costs would increase.
We also rely on a limited number of suppliers of coal for our electric generation, making us vulnerable to increased prices for fuel as existing contracts expire or in the event of unanticipated interruptions in fuel supply. We are a captive rail shipper of the Burlington Northern Santa Fe Railway for shipments of coal to the Big Stone Plant (our largest source of generation in South Dakota), making us vulnerable to railroad capacity and operational issues and/or increased prices for coal transportation from a sole supplier.
Poor investment performance of plan assets of our defined benefit pension and post-retirement benefit plans, in addition to other factors impacting these costs, could unfavorably impact our results of operations and liquidity.
25
Our costs for providing defined benefit retirement and postretirement benefit plans are dependent upon a number of factors. Assumptions related to future costs, return on investments and interest rates have a significant impact on our funding requirements related to these plans. These estimates and assumptions may change based on economic conditions, actual stock market performance and changes in governmental regulations. Without sustained growth in the plan assets over time and depending upon interest rate changes as well as other factors noted above, the costs of such plans reflected in our results of operations and financial position and cash funding obligations may change significantly from projections.
Our obligation to include a minimum annual quantity of power in our Montana electric supply portfolio at an agreed upon price per MWH could expose us to material commodity price risk if certain QFs under contract with us do not perform during a time of high commodity prices, as we are required to make up the difference. In addition, we are subject to price escalation risk with one of our largest QF contracts.
As part of a stipulation in 2002 with the MPSC and other parties, we agreed to include a minimum annual quantity of power in our Montana electric supply portfolio at an agreed upon price per MWH through June 2029. The annual minimum energy requirement is achievable under normal QF operations, including normal periods of planned and forced outages. However, to the extent the supplied QF power for any year does not reach the minimum quantity set forth in the settlement, we are obligated to purchase the difference from other sources. The anticipated source for any QF shortfall is the wholesale market, which would subject us to commodity price risk if the cost of replacement power is higher than contracted QF rates.
In addition, we are subject to price escalation risk with one of our largest QF contracts due to variable contract terms. In estimating our QF liability, we have estimated an annual escalation rate of three percent over the remaining term of the contract (through June 2024). To the extent the annual escalation rate exceeds three percent, our results of operations, cash flows and financial position could be adversely affected.
We must meet certain credit quality standards. If we are unable to maintain investment grade credit ratings, our liquidity, access to capital and operations could be materially adversely affected.
A downgrade of our credit ratings to less than investment grade could adversely affect our liquidity. Certain of our credit agreements and other credit arrangements with counterparties require us to provide collateral in the form of letters of credit or cash to support our obligations if we fall below investment grade. Also, a downgrade below investment grade could hinder our ability to raise capital on favorable terms, including through the commercial paper markets. Higher interest rates on short-term borrowings with variable interest rates or on incremental commercial paper issuances could also have an adverse effect on our results of operations.
ITEM 1B. UNRESOLVED STAFF COMMENTS
None
ITEM 2. PROPERTIES
Our corporate support office is owned by us and located at 3010 West 69th Street, Sioux Falls, South Dakota 57108. Our operational support office for our Montana operations is owned by us and located at 11 East Park Street, Butte, Montana 59701. In addition, our operational support office for our South Dakota and Nebraska operations is owned by us and located at 600 Market Street West, Huron, South Dakota 57350. While we do lease some facilities, substantially all of our Montana, South Dakota and Nebraska facilities are owned by us.
Substantially all of our Montana electric and natural gas assets are subject to the lien of our Montana First Mortgage Bond indenture. Substantially all of our South Dakota and Nebraska electric and natural gas assets are subject to the lien of our South Dakota Mortgage Bond indenture. For further information regarding our operating properties, including generation and transmission, see the descriptions included in Item 1.
ITEM 3. LEGAL PROCEEDINGS
We discuss details of our legal proceedings in Note 19 - Commitments and Contingencies, to the Consolidated Financial Statements. Some of this information is about costs or potential costs that may be material to our financial results.
26
Part II |
ITEM 5. MARKET FOR REGISTRANT'S COMMON EQUITY, RELATED SHAREHOLDER MATTERS AND ISSUER PURCHASES OF EQUITY SECURITIES
Our common stock, which is traded under the ticker symbol NWE, is listed on the New York Stock Exchange (NYSE). As of February 10, 2017, there were approximately 1,029 common stockholders of record.
Dividends
We pay dividends on our common stock after our Board declares them. The Board reviews the dividend quarterly and establishes the dividend rate based upon such factors as our earnings, financial condition, capital requirements, debt covenant requirements and/or other relevant conditions. Although we expect to continue to declare and pay cash dividends with a targeted long-term dividend payout ratio of 60 - 70 percent of earnings per share, we cannot assure that dividends will be paid in the future or that, if paid, the dividends will be paid in the same amount as during 2016. Quarterly dividends were declared and paid on our common stock during 2016 and 2015 as set forth in the table below.
QUARTERLY COMMON STOCK PRICE RANGES AND DIVIDENDS | ||||
Prices | |||||
High | Low | Cash Dividends Paid | |||
2016- | |||||
Fourth Quarter | $59.13 | $53.85 | $0.50 | ||
Third Quarter | 63.75 | 56.18 | 0.50 | ||
Second Quarter | 63.30 | 55.34 | 0.50 | ||
First Quarter | 62.22 | 52.16 | 0.50 | ||
2015- | |||||
Fourth Quarter | $57.07 | $51.27 | $0.48 | ||
Third Quarter | 56.68 | 48.47 | 0.48 | ||
Second Quarter | 54.65 | 48.44 | 0.48 | ||
First Quarter | 59.71 | 50.75 | 0.48 | ||
On February 10, 2017, the last reported sale price on the NYSE for our common stock was $56.50.
27
ITEM 6. SELECTED FINANCIAL DATA
The following selected financial data has been derived from our Consolidated Financial Statements and should be read in conjunction with the Consolidated Financial Statements and notes thereto and with “Management's Discussion and Analysis of Financial Condition and Results of Operations" and other financial data included elsewhere in this report. The historical results are not necessarily indicative of results to be expected for any future period.
FIVE-YEAR FINANCIAL SUMMARY | ||||
Year Ended December 31, | |||||||||||||||||||
2016 | 2015 | 2014 | 2013 | 2012 | |||||||||||||||
Financial Results (in thousands, except per share data) | |||||||||||||||||||
Operating revenues | $ | 1,257,247 | $ | 1,214,299 | $ | 1,204,863 | $ | 1,154,519 | $ | 1,070,342 | |||||||||
Net income | 164,172 | 151,209 | 120,686 | 93,983 | 98,406 | ||||||||||||||
Basic earnings per share | $3.40 | $3.20 | $3.01 | $2.46 | $2.67 | ||||||||||||||
Diluted earnings per share | 3.39 | 3.17 | 2.99 | 2.46 | 2.66 | ||||||||||||||
Dividends declared per common share | 2.00 | 1.92 | 1.60 | 1.52 | 1.48 | ||||||||||||||
Financial Position | |||||||||||||||||||
Total assets | $ | 5,499,321 | $ | 5,264,695 | $ | 4,960,902 | $ | 3,701,645 | $ | 3,474,816 | |||||||||
Long-term debt and capital leases, including current portion and short-term borrowings | 2,120,474 | 2,026,219 | 1,946,790 | 1,313,989 | 1,200,465 | ||||||||||||||
Ratio of earnings to fixed charges | 2.6 | 2.9 | 2.3 | 2.5 | 2.7 | ||||||||||||||
28
ITEM 7. MANAGEMENT'S DISCUSSION AND ANALYSIS OF FINANCIAL CONDITION AND RESULTS OF OPERATIONS
The following discussion and analysis should be read in conjunction with “Item 6 Selected Financial Data" and our Consolidated Financial Statements and related notes contained elsewhere in this Annual Report on Form 10-K. For additional information related to our industry segments, see Note 20 - Segment and Related Information, to the Consolidated Financial Statements, which is included in Item 8 herein. For information regarding our revenues, net income and assets, see our Consolidated Financial Statements included in Item 8.
OVERVIEW | ||||
NorthWestern Corporation, doing business as NorthWestern Energy, provides electricity and natural gas to approximately 709,600 customers in Montana, South Dakota and Nebraska. As you read this discussion and analysis, refer to our Consolidated Statements of Income, which present the results of our operations for 2016, 2015 and 2014. Following is a brief overview of significant developments for 2016, and a discussion of our strategy and outlook.
SIGNIFICANT DEVELOPMENTS IN 2016 | ||||
Ÿ | An increase in net income of $13.0 million, primarily due to a $17.0 million tax benefit as part of a tax accounting change related to costs to repair generation property along with improved gross margin driven by an increase in South Dakota electric rates, partly offset by the inclusion in our 2015 results of a $20.8 million insurance recovery. | ||||
Ÿ | Filed a Montana natural gas delivery service and production rate case requesting an annual increase in base rates of approximately $10.9 million. | ||||
HOW WE PERFORMED AGAINST OUR 2015 RESULTS | ||||
Year-over-Year Change | ||||
Gross Margin by Segment(1) | ||||
Electric | $15.7M | é | 2.4 | % |
Natural Gas | $(0.8)M | ê | (0.4 | )% |
Operating Income | $(19.9)M | ê | (7.5 | )% |
Net Income | $13.0M | é | 8.6 | % |
EPS (Basic) | $0.20 | é | 6.3 | % |
(1) Non-GAAP financial measure. See "non-GAAP Financial Measure" under Results of Operations below.
29
SIGNIFICANT TRENDS AND REGULATION | ||||
Montana Natural Gas Delivery and Production Rate Filing
In September 2016, we filed a natural gas rate case with the MPSC requesting an annual increase to natural gas rates of approximately $10.9 million, which includes approximately $7.4 million for delivery service and approximately $3.5 million for natural gas production. Our request was based on a return on equity of 10.35%, rate base of $432.1 million, and a capital structure of 53% debt and 47% equity. This filing includes a request for cost-recovery of two natural gas production fields acquired in August 2012 and December 2013 in northern Montana's Bear Paw Basin, which are recovered in customer rates on an interim basis, and a request that these fields be placed in permanent rates based on the actual cost of production.
Finally, we requested that approximately $5.6 million of the rate increase for delivery service be approved on an interim basis to allow recovery of costs prior to the conclusion of the full rate case. We expect to receive a decision on our interim request by the end of the first quarter of 2017. The MPSC has nine months from the filing date in which to issue a final decision in this docket. A hearing is scheduled for May 2017.
Generation Repairs - Tax Accounting Method Change
In 2009, we received approval from the Internal Revenue Service (IRS) to change our tax accounting method related to the repair and maintenance of transmission and distribution utility assets and have recorded a current tax deduction in our Consolidated Financial Statements for each period since. In 2013, the IRS issued guidance related to the repair and maintenance of utility generation assets. During the third quarter of 2016, we filed a tax accounting method change with the IRS consistent with this IRS guidance for generation property. This allowed us to take a current tax deduction for a significant amount of repair costs that were previously capitalized for tax purposes. See Note 13 - Income Taxes, in the Notes to Consolidated Financial Statements for further discussion.
• | Consistent with this regulatory treatment, we recorded an income tax benefit of approximately $17.0 million during the twelve months ended December 31, 2016, of which approximately $12.5 million related to 2015 and prior tax years. |
Montana Electric and Natural Gas Tracker Filings
Electric Trackers - 2012/2013 - 2013/2014 (Consolidated Docket) and 2014/2015 (2015 Tracker) - The MPSC held a work session in March 2016 and directed staff to draft a final order in our Consolidated Docket that reflects a disallowance of both replacement power costs from a 2013 outage at Colstrip Unit 4 and portfolio modeling costs. On the same day, in a separate work session, the MPSC directed staff to draft a final order in the 2015 Tracker that approved a stipulation between us and the Montana Consumer Counsel, but disallowed portfolio modeling costs.
In April 2016, we received the final written order in the 2015 Tracker, which was consistent with the work session. In May 2016, we received the final written order in the Consolidated Docket. The written order disallowed the Colstrip Unit 4 replacement power costs and clarified the disallowance of modeling costs, resulting in a reduction of the disallowance recorded during the second quarter of 2016.
• | Based on the final orders, the impact of the disallowance totals $12.4 million, which includes $9.5 million of replacement power and modeling costs, and $2.9 million of interest and is recorded in the Consolidated Statement of Income for the twelve months ended December 31, 2016. |
In June 2016, we filed an appeal of the 2015 Tracker decision regarding the disallowance of portfolio modeling costs in Montana District Court (Lewis & Clark County). Also, in September 2016, we appealed the MPSC’s decisions in the Consolidated Docket regarding the disallowance of Colstrip Unit 4 replacement power costs and the modeling/planning costs, arguing that these decisions were arbitrary and capricious, and violated Montana law. We brought this action in Montana District Court, as well (Yellowstone County). The briefing in this case is currently scheduled to conclude by the end of the second quarter of 2017. While the courts are not obligated to rule on these appeals within a certain period of time, based on our experience, we believe we are likely to receive orders from the courts in these matters within 9-20 months of filing.
Electric and Natural Gas Lost Revenue Adjustment Mechanism - In October 2015, the MPSC issued an order eliminating the lost revenue adjustment mechanism. This mechanism was established in 2005 by the MPSC as a component of an approved energy efficiency program, by which we recovered on an after-the-fact basis a portion of our fixed costs that would otherwise
30
have been collected in the kWh sales lost due to energy efficiency programs through our electric and natural supply tracker. Lost revenues were removed prospectively effective December 1, 2015.
Based on an October 2013 MPSC order, for the period July 1, 2012 through November 30, 2015, we recognized $7.1 million of lost revenues for each annual electric supply tracker period and deferred the remaining $14.2 million of efficiency efforts collected through the trackers pending final approval of the open tracker filings discussed above. During the second quarter of 2016, we received final written orders resolving our prior period open tracker dockets. These orders allowed the recovery of the lost revenues included in each tracker period.
• | We recognized revenue deferred during the July 2012 - November 2015 periods of $14.2 million in the second quarter of 2016 based on the final orders in our tracker filings. |
Hydro Compliance Filing
The MPSC order approving our acquisition of the hydro assets provided that customers would have no financial risk related to our temporary ownership of the Kerr facility, with a compliance filing required upon completion of the transfer to the Confederated Salish and Kootenai Tribes (CSKT). We sold any excess system generation, which was primarily due to our temporary ownership of Kerr, in the market and provided revenue credits to our Montana retail customers until the transfer to the CSKT. Therefore, during our temporary ownership a net benefit of approximately $2.7 million was provided to customers and there was no benefit to shareholders. In December 2015, we submitted the required compliance filing to remove Kerr from cost of service, adjust for actual revenue credits and increase property taxes to actual amounts. In January 2016, the MPSC approved an interim adjustment to our hydro generation rate based on the compliance filing, and opened a separate contested docket requesting additional detail on the adjustment to rates due to the conveyance of Kerr. The MPSC identified additional issues and requested information. A hearing was held in September 2016. The only contested issue at the hearing was the level of administrative and general expenses that should be deducted from the approved revenue requirement due to the transfer of the Kerr Project.
In December 2016, the MPSC issued a final order in this compliance filing reducing the annual amount we are allowed to recover in hydro generation rates by approximately $1.2 million. As a result, in the fourth quarter of 2016 we reduced revenue by approximately $1.5 million in the Consolidated Statement of Income. In addition, the order requires us to indicate by April 30, 2017, whether we intend to file a Montana electric rate case based on a 2016 test year. The order also indicated that if we do not intend to file a rate case in 2017, the MPSC may require us to make an additional filing that would facilitate an assessment of whether additional action would be required to fulfill the MPSC's obligation to authorize just and reasonable rates.
FERC Filing - Dave Gates Generating Station at Mill Creek (DGGS)
In May 2016, we received an order from the FERC denying a May 2014 request for rehearing and requiring us to make refunds. The request for rehearing challenged a September 2012 FERC Administrative Law Judge's (ALJ) initial decision regarding cost allocation at DGGS between retail and wholesale customers. This decision concluded that only a portion of these costs should be allocated to FERC jurisdictional customers. We had cumulative deferred revenue of approximately $27.3 million, consistent with the ALJ's initial decision, which was refunded to wholesale and choice customers in June 2016 in accordance with the FERC order.
In June 2016, we filed a petition for review of the FERC's May 2016 order with the United States Circuit Court of Appeals for the District of Columbia Circuit. A briefing schedule has been established, with final briefs due by the end of the first quarter of 2017. We do not expect a decision in this matter until the last quarter of 2017, at the earliest.
The FERC order was assessed as a triggering event as to whether an impairment charge should be recorded with respect to DGGS. DGGS previously provided only regulation service, which is the basis for the cost allocation in our previous MPSC and FERC filings. With the addition of owned hydro generation in November 2014, we are able to shift the utilization of DGGS to additional alternative uses, optimizing our generation portfolio. In support of our biennial electricity supply resource procurement plan that we filed with the MPSC in March 2016, we conducted a portfolio optimization analysis to evaluate options to use DGGS in combination with other generation resources. This analysis indicates DGGS provides cost-effective products necessary to operate our Montana electricity portfolio, including regulation, load following, peaking services and other ancillary products such as contingency reserves, which should guide future cost recovery. The cost recovery of any alternative use of DGGS would be subject to regulatory approval and we cannot provide assurance of such approval. We do not believe an impairment loss is probable at this time; however, we will continue to evaluate recovery of this asset in the future as facts and circumstances change.
31
STRATEGY | ||||
We operate a fully regulated, multi-jurisdictional electric and natural gas utility. As a regulated utility, we function within a cost-based operating structure as approved by various regulatory bodies and operate under exclusive and non-exclusive franchises to provide service in Montana, South Dakota and Nebraska. We are focused on providing our customers with safe and reliable service at reasonable rates.
Our growth has been fueled by a combination of reintegrating supply resources and infrastructure investment. These opportunities have allowed us to improve the critical energy infrastructure in our service territory and should allow our shareholders to earn a reasonable return on invested capital.
• | We plan to continue growing through significant infrastructure investment. This investment includes distribution and transmission infrastructure projects to improve system reliability and safety, and environmental capital expenditures at our jointly owned plants. These investments also reflect our focus on maintaining our system reliability, and allow us to pursue the deployment of newer technology that promotes the efficient use of electricity. |
• | Integrating supply resources provides our customers the benefits associated with more predictable long-term commodity prices. Resource planning is an important function necessary to meet our future energy and reserve margin needs. Based on our current analysis, we are considering electric supply capacity investments and expect to continue to pursue opportunities to add to our natural gas reserves portfolio. |
We expect to pursue these investment opportunities in a manner that allows us to be flexible in adjusting to changing economic conditions by adjusting the timing and scale of the projects. See the “Capital Requirements" discussion below for further detail on planned capital expenditures.
Rate cases are necessary to cover the cost of providing safe, reliable service, while contributing to earnings growth and achieving our financial objectives. During the first quarter of each year we evaluate the need for electric and natural gas rate changes in each state in which we provide service.
32
INVESTMENT | ||||
Our estimated capital expenditures for the next five years, including our electric and natural gas transmission and distribution infrastructure investment plan, are as follows (in millions):
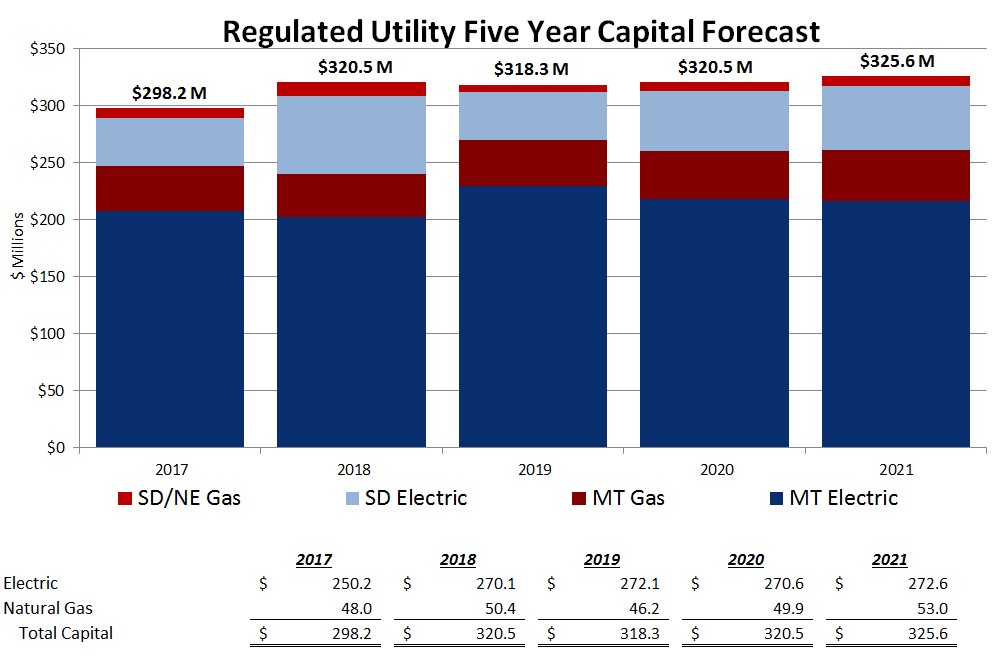
Supply Investments
Our resource plans identify portfolio resource requirements including potential investments. Since 2010, we have acquired gas production and gathering system assets as a part of an overall strategy to provide rate stability and customer value through the addition of regulated assets that are not subject to market forces. As of December 31, 2016, these owned reserves totaled approximately 60.6 Bcf and are estimated to provide approximately 4.7 Bcf in 2017, or about 23 percent of our expected annual retail natural gas load in Montana. We continue to pursue opportunities to secure low cost gas reserves for our customers, with a target of owning 50% of our supply.
Our estimated capital expenditure requirements above do not include estimates for incremental natural gas reserve acquisitions, potential peaking generation needs or other investment opportunities that may arise.
In March 2016, we submitted our electricity supply resource procurement plan (the Plan) to the MPSC, which is updated and filed every two years. The Plan is meant to provide a road map to our stakeholders, including our customers and regulators regarding our future portfolio requirements, of how we expect to respond to supply needs. The Plan is subject to review and public comment. The Plan identifies the need for additional dispatchable generation to address significant generation capacity deficits and negative reserve margins. In addition to meeting peak needs, national reliability standards effective July 2016 require us to have even greater dispatchable generation capacity available and be capable of increasing or decreasing output to address the irregular nature of intermittent generation such as wind or solar. The Plan identifies price and reliability risks to our customers of solely relying upon market purchases to address these needs. While the Plan identifies natural gas-fired generation as the lowest-cost / least-risk approach for addressing the portfolio's needs, it also identifies a competitive solicitation process as the means by which these needs will ultimately be met. In addition, we are evaluating adding incremental generation to our hydro capability as a carbon-free alternative.
33
Distribution and Transmission System Investment
As part of our commitment to maintain high level reliability and system performance we continue to evaluate the condition of our distribution and transmission assets to address aging infrastructure through our asset management process. The primary goals of our infrastructure investment are to reverse the trend in aging infrastructure, maintain reliability, proactively manage safety, build capacity into the system, and prepare our network for the adoption of new technologies. We are working on various solutions taking a proactive and pragmatic approach to replace these assets while also evaluating the implementation of additional technologies to prepare the overall system for smart grid applications.
Our Montana Distribution System Infrastructure Project (DSIP) is a multi-year effort through 2017 to accelerate the replacement and modernization of our existing electric and natural gas distribution system in Montana. During 2016, our DSIP capital expenditures totaled approximately $50.3 million. We are also working to define the project size, scope and timeline of our overall electric and natural gas transmission and distribution infrastructure investment plan. With this overall plan, we also intend to continue to address aging infrastructure, system reliability and safety, capacity and preparing the system for adoption of new technologies.
RESULTS OF OPERATIONS | ||||
Our consolidated results include the results of our divisions and subsidiaries constituting each of our business segments. The overall consolidated discussion is followed by a detailed discussion of gross margin by segment.
Non-GAAP Financial Measure
The following discussion includes financial information prepared in accordance with GAAP, as well as another financial measure, Gross Margin, that is considered a “non-GAAP financial measure.” Generally, a non-GAAP financial measure is a numerical measure of a company’s financial performance, financial position or cash flows that exclude (or include) amounts that are included in (or excluded from) the most directly comparable measure calculated and presented in accordance with GAAP. Gross Margin (Revenues less Cost of Sales) is a non-GAAP financial measure due to the exclusion of depreciation from the measure. The presentation of Gross Margin is intended to supplement investors’ understanding of our operating performance. Gross Margin is used by us to determine whether we are collecting the appropriate amount of energy costs from customers to allow recovery of operating costs. Our Gross Margin measure may not be comparable to other companies’ Gross Margin measures. Furthermore, this measure is not intended to replace operating income as determined in accordance with GAAP as an indicator of operating performance.
Factors Affecting Results of Operations
Our revenues may fluctuate substantially with changes in supply costs, which are generally collected in rates from customers. In addition, various regulatory agencies approve the prices for electric and natural gas utility service within their respective jurisdictions and regulate our ability to recover costs from customers.
Revenues are also impacted to a lesser extent by customer growth and usage, the latter of which is primarily affected by weather. Very cold winters increase demand for natural gas and to a lesser extent, electricity, while warmer than normal summers increase demand for electricity, especially among our residential and commercial customers. We measure this effect using degree-days, which is the difference between the average daily actual temperature and a baseline temperature of 65 degrees. Heating degree-days result when the average daily temperature is less than the baseline. Cooling degree-days result when the average daily temperature is greater than the baseline. The statistical weather information in our regulated segments represents a comparison of this data.
34
OVERALL CONSOLIDATED RESULTS | ||||
Year Ended December 31, 2016 Compared with Year Ended December 31, 2015
Year Ended December 31, | ||||||||||||||
2016 | 2015 | Change | % Change | |||||||||||
(in millions) | ||||||||||||||
Operating Revenues | ||||||||||||||
Electric | $ | 1,011.6 | $ | 944.4 | $ | 67.2 | 7.1 | % | ||||||
Natural Gas | 245.7 | 269.9 | (24.2 | ) | (9.0 | ) | ||||||||
$ | 1,257.3 | $ | 1,214.3 | $ | 43.0 | 3.5 | % | |||||||
Year Ended December 31, | ||||||||||||||
2016 | 2015 | Change | % Change | |||||||||||
(in millions) | ||||||||||||||
Cost of Sales | ||||||||||||||
Electric | $ | 332.8 | $ | 281.3 | $ | 51.5 | 18.3 | % | ||||||
Natural Gas | 68.2 | 91.6 | (23.4 | ) | (25.5 | ) | ||||||||
$ | 401.0 | $ | 372.9 | $ | 28.1 | 7.5 | % | |||||||
Year Ended December 31, | ||||||||||||||
2016 | 2015 | Change | % Change | |||||||||||
(in millions) | ||||||||||||||
Gross Margin | ||||||||||||||
Electric | $ | 678.8 | $ | 663.1 | $ | 15.7 | 2.4 | % | ||||||
Natural Gas | 177.5 | 178.3 | (0.8 | ) | (0.4 | ) | ||||||||
$ | 856.3 | $ | 841.4 | $ | 14.9 | 1.8 | % | |||||||
Consolidated gross margin in 2016 was $856.3 million, an increase of $14.9 million, or 1.8%, from gross margin in 2015. Factors that impacted gross margin included:
35
Gross Margin 2016 vs. 2015 | |||
(in millions) | |||
Gross Margin Items Impacting Net Income | |||
South Dakota electric rate increase | $ | 33.5 | |
Lost revenue adjustment mechanism | 7.7 | ||
Electric QF adjustment | 6.1 | ||
Natural gas retail volumes | 0.2 | ||
MPSC disallowance | (9.5 | ) | |
Electric transmission | (3.6 | ) | |
Electric retail volumes | (2.0 | ) | |
Hydro generation rates | (1.5 | ) | |
Natural gas production rates | (1.2 | ) | |
Other | (1.5 | ) | |
Consolidated Gross Margin Impacting Net Income | 28.2 | ||
Gross Margin Items Offset in Operating Expenses and Income Tax Expense | |||
Hydro operations - Kerr conveyance | (16.5 | ) | |
Production tax credits flowed-through trackers | (8.2 | ) | |
Natural gas production gathering fees | (1.1 | ) | |
Property taxes recovered in trackers | 12.5 | ||
Change in Items Offset Within Net Income | (13.3 | ) | |
Increase in Consolidated Gross Margin | $ | 14.9 | |
Consolidated gross margin for items impacting net income increased $28.2 million primarily due to the following:
• | An increase in South Dakota electric rates; |
• | The recognition of $14.2 million of deferred revenue as a result of a MPSC final order in our tracker filings, offset in part by the elimination of the lost revenue adjustment mechanism decreasing the recovery of our fixed costs by approximately $6.5 million; |
• | The inclusion in our 2015 results of an increase in supply costs due to the adjustment of the QF liability based on a review of contract assumptions; and |
• | An increase in our Montana jurisdiction residential and commercial natural gas volumes due to colder late summer and winter weather, and customer growth, offset by warmer winter weather in our South Dakota jurisdiction. |
These increases were partly offset by:
• | The MPSC disallowance of previously incurred replacement power and modeling / planning costs as discussed above; |
• | Lower demand to transmit energy across our transmission lines due to market conditions and pricing; |
• | A decrease in electric retail volumes due primarily to colder late summer weather in our Montana jurisdiction, along with lower industrial volumes of a large Montana customer, partly offset by warmer spring and summer weather in our South Dakota jurisdiction and customer growth; |
• | A reduction in hydro generation rates due to the MPSC order in the hydro compliance filing as discussed above in 'Significant Trends and Regulation'; and |
• | A decrease in natural gas production margin due to an $0.8 million decrease in overhead fees and a $0.4 million decrease in interim rates based on actual costs. |
The change in consolidated gross margin also includes the following items that had no impact on net income:
• | A decrease in revenues from the conveyance of the Kerr facility to the CSKT in September 2015 (offset by reduced operating expenses); |
36
• | A decrease in revenues for production tax credits primarily associated with the Beethoven wind generation project, which is a reduction in our customers rates (offset by reduced income tax expense); |
• | A decrease in natural gas production gathering fees (offset by reduced operating expenses); and |
• | An increase in revenues for property taxes included in trackers (offset by increased property tax expense). |
Year Ended December 31, | ||||||||||||||
2016 | 2015 | Change | % Change | |||||||||||
(in millions) | ||||||||||||||
Operating Expenses (excluding cost of sales) | ||||||||||||||
Operating, general and administrative | $ | 302.9 | $ | 297.5 | $ | 5.4 | 1.8 | % | ||||||
Property and other taxes | 148.1 | 133.4 | 14.7 | 11.0 | ||||||||||
Depreciation and depletion | 159.3 | 144.7 | 14.6 | 10.1 | ||||||||||
$ | 610.3 | $ | 575.6 | $ | 34.7 | 6.0 | % | |||||||
Consolidated operating, general and administrative expenses were $302.9 million in 2016 as compared with $297.5 million in 2015. Primary components of this change include the following:
Operating, General, & Administrative Expenses 2016 vs. 2015 | |||
(in millions) | |||
Insurance recovery, net | $ | 20.8 | |
Employee benefit and compensation costs | 2.7 | ||
Plant operator costs | 2.2 | ||
Non-employee directors deferred compensation | 1.5 | ||
Insurance reserves | 0.9 | ||
Hydro operations - Kerr conveyance | (15.2 | ) | |
DSIP expenses | (4.0 | ) | |
Natural gas production gathering expense | (1.1 | ) | |
Bad debt expense | (1.0 | ) | |
Other | (1.4 | ) | |
Increase in Operating, General & Administrative Expenses | $ | 5.4 | |
The increase in operating, general and administrative expenses of $5.4 million was primarily due to the following:
• | The inclusion in our second quarter 2015 results of an insurance recovery, primarily associated with electric generation related environmental remediation costs incurred in prior periods; |
• | An increase in employee related benefits costs due to higher compensation and pension costs; |
• | Higher plant operator costs primarily due to the Beethoven acquisition in September 2015; |
• | The change in value of non-employee directors deferred compensation due to changes in our stock price (offset by changes in other income with no impact on net income); and |
• | An increase in insurance reserves primarily due to the Billings, Montana refinery outage discussed in Note 19 to the Consolidated Financial Statements. |
These increases were offset in part by:
• | A decrease in hydro operations costs in the current period as a result of the conveyance of Kerr to the CSKT in September 2015 (offset by reduced revenue discussed above); |
• | Lower DSIP related expenses; |
• | A decrease in natural gas production gathering expense (offset by lower gathering fees discussed above); and |
• | Lower bad debt expense, due to improved collection of receivables from customers. |
In addition, cost control measures implemented in 2016 are included in Other.
37
Property and other taxes were $148.1 million in 2016 as compared with $133.4 million in 2015. This increase was primarily due to plant additions and higher estimated property valuations in Montana, offset in part by a $1.3 million decrease from the conveyance of Kerr to the CSKT in September 2015. Under Montana law, we are allowed to
track the increases in the actual level of state and local taxes and fees (primarily property taxes) and adjust our rates to recover approximately 60% of the increase between rate cases.
Depreciation and depletion expense was $159.3 million in 2016 as compared with $144.7 million in 2015. This increase was primarily due to plant additions, including approximately $4.3 million of incremental depreciation associated with the September 2015 Beethoven wind project acquisition.
Consolidated operating income in 2016 was $245.9 million, as compared with $265.8 million in 2015. This decrease was primarily due to the $20.8 million insurance recovery in 2015.
Consolidated interest expense in 2016 was $95.0 million, as compared with $92.2 million, in 2015. This increase was primarily due to $2.9 million of interest associated with the MPSC disallowance as discussed above, lower capitalization of allowance for funds used during construction (AFUDC), and increased debt outstanding, partly offset by the debt refinancing transactions. See "Liquidity and Capital Resources" for additional information regarding our financing activities.
Consolidated other income in 2016 was $5.5 million as compared with $7.6 million in 2015. This decrease was primarily due to lower capitalization of AFUDC, partly offset by a $1.5 million increase in the value of deferred shares held in trust for non-employee directors deferred compensation (which, as discussed above, is offset by a corresponding increase to operating, general and administrative expenses).
Consolidated income tax benefit in 2016 was $7.6 million as compared with income tax expense of $30.0 million in 2015. Our effective tax rate for the twelve months ended December 31, 2016 was (4.9)% as compared with 16.6% for the same period of 2015. During the third quarter of 2016, we filed a tax accounting method change with the IRS related to costs to repair generation property, as discussed above. This resulted in an income tax benefit of approximately $17.0 million during the twelve months ended December 31, 2016, of which approximately $12.5 million related to 2015 and prior tax years and is reflected in the flow-through repairs deductions line below. In addition, we adopted the provisions of a new accounting standard related to share-based payments, during the fourth quarter of 2016. The excess tax benefit of share awards that vested in 2016 was treated as a discrete item. We currently expect our 2017 effective tax rate to range between 7% - 11%.
The following table summarizes the differences between our effective tax rate and the federal statutory rate (in millions):
Year Ended December 31, | |||||||
2016 | 2015 | ||||||
Income Before Income Taxes | $156.5 | $181.2 | |||||
Income tax calculated at 35% Federal statutory rate | 54.8 | 35.0% | 63.4 | 35.0% | |||
Permanent or flow through adjustments: | |||||||
State income tax, net of federal provisions | (3.7) | (2.4) | 0.3 | 0.1 | |||
Flow through repairs deductions | (41.1) | (26.3) | (24.1) | (13.3) | |||
Production tax credits | (10.9) | (7.0) | (5.7) | (3.2) | |||
Plant and depreciation of flow through items | (4.6) | (2.9) | (2.9) | (1.6) | |||
Share based compensation | (1.6) | (1.1) | — | — | |||
Prior year permanent return to accrual adjustments | (0.1) | (0.1) | 0.2 | 0.1 | |||
Other, net | (0.4) | (0.1) | (1.2) | (0.5) | |||
(62.4) | (39.9) | (33.4) | (18.4) | ||||
Income Tax (Benefit) Expense | $(7.6) | (4.9)% | $30.0 | 16.6% | |||
38
Our effective tax rate typically differs from the federal statutory tax rate of 35% primarily due to the regulatory impact of flowing through the federal and state tax benefit of repairs deductions, state tax benefit of accelerated tax depreciation deductions (including bonus depreciation when applicable) and production tax credits.
Consolidated net income in 2016 was $164.2 million as compared with $151.2 million in 2015. This increase was primarily due to the tax benefit related to costs to repair generation property discussed above along with improved gross margin driven by an increase in South Dakota electric rates, partly offset by the inclusion in our 2015 results of a $20.8 million insurance recovery and higher property tax and depreciation expense in 2016.
Year Ended December 31, 2015 Compared with Year Ended December 31, 2014
Year Ended December 31, | ||||||||||||||
2015 | 2014 | Change | % Change | |||||||||||
(in millions) | ||||||||||||||
Operating Revenues | ||||||||||||||
Electric | $ | 944.4 | $ | 878.0 | $ | 66.4 | 7.6 | % | ||||||
Natural Gas | 269.9 | 326.9 | (57.0 | ) | (17.4 | ) | ||||||||
$ | 1,214.3 | $ | 1,204.9 | $ | 9.4 | 0.8 | % | |||||||
Year Ended December 31, | ||||||||||||||
2015 | 2014 | Change | % Change | |||||||||||
(in millions) | ||||||||||||||
Cost of Sales | ||||||||||||||
Electric | $ | 281.3 | $ | 348.6 | $ | (67.3 | ) | (19.3 | )% | |||||
Natural Gas | 91.6 | 134.0 | (42.4 | ) | (31.6 | ) | ||||||||
$ | 372.9 | $ | 482.6 | $ | (109.7 | ) | (22.7 | )% | ||||||
Year Ended December 31, | ||||||||||||||
2015 | 2014 | Change | % Change | |||||||||||
(in millions) | ||||||||||||||
Gross Margin | ||||||||||||||
Electric | $ | 663.1 | $ | 529.4 | $ | 133.7 | 25.3 | % | ||||||
Natural Gas | 178.3 | 192.9 | (14.6 | ) | (7.6 | ) | ||||||||
$ | 841.4 | $ | 722.3 | $ | 119.1 | 16.5 | % | |||||||
Consolidated gross margin in 2015 was $841.4 million, an increase of $119.1 million, or 16.5%, from gross margin in 2014. Factors that impacted gross margin included:
Gross Margin 2015 vs. 2014 | |||
(in millions) | |||
Hydro operations | $ | 135.0 | |
South Dakota electric rate increase | 5.6 | ||
Property tax trackers | 2.1 | ||
Electric and natural gas retail volumes | (12.8 | ) | |
Expenses recovered in trackers | (5.0 | ) | |
Electric QF adjustment | (3.2 | ) | |
Gas production rates and deferral | (1.9 | ) | |
Other | (0.7 | ) | |
Consolidated Gross Margin | $ | 119.1 | |
39
Consolidated gross margin increased $119.1 million primarily due to the following:
• | An increase in generation margin from the November 2014 Hydro Transaction; |
• | An increase in South Dakota electric rates effective July 2015; and |
• | An increase in property taxes included in trackers. |
These increases were partly offset by:
• | A decrease in electric and natural gas retail volumes due primarily to warmer winter weather, partly offset by customer growth; |
• | A $5.0 million decrease in costs recovered in our supply trackers, which includes: |
◦ | A $3.1 million increase in production tax credits, which is a reduction in our customer's rates, as a result of the Beethoven wind project acquisition (offset in income tax expense); |
◦ | A $1.0 million decrease in production taxes associated with our gas production operations (offset in property and other taxes); and |
◦ | A $0.9 million decrease in operating expenses, primarily related to efficiency measures implemented by customers (offset in operating, general and administrative expense). |
• | A $3.2 million QF adjustment, which includes: |
◦ | A $6.1 million increase in the QF liability recorded in the second quarter of 2015 based on a review of contract assumptions in our estimated liability; partly offset by |
◦ | A $2.9 million lower QF related supply costs based on actual QF pricing and output; and |
• | A decrease in gas production rates and deferral of interim gas production revenue based on actual costs. |
Year Ended December 31, | ||||||||||||||
2015 | 2014 | Change | % Change | |||||||||||
(in millions) | ||||||||||||||
Operating Expenses (excluding cost of sales) | ||||||||||||||
Operating, general and administrative | $ | 297.5 | $ | 305.9 | $ | (8.4 | ) | (2.7 | )% | |||||
Property and other taxes | 133.4 | 114.6 | 18.8 | 16.4 | ||||||||||
Depreciation and depletion | 144.7 | 123.8 | 20.9 | 16.9 | ||||||||||
$ | 575.6 | $ | 544.3 | $ | 31.3 | 5.8 | % | |||||||
Consolidated operating, general and administrative expenses were $297.5 million in 2015 as compared with $305.9 million in 2014. Primary components of this change include the following:
Operating, General, & Administrative Expenses 2015 vs. 2014 | |||
(in millions) | |||
Insurance recovery, net | $ | (20.8 | ) |
Hydro Transaction costs | (9.5 | ) | |
Non-employee directors deferred compensation | (4.7 | ) | |
Generator maintenance costs | (2.2 | ) | |
Bad debt expense | (1.5 | ) | |
Fleet fuel costs | (1.2 | ) | |
Environmental costs | (1.1 | ) | |
Operating expenses recovered in trackers | (0.9 | ) | |
Hydro operations | 33.2 | ||
Employee benefit and compensation costs | 3.8 | ||
Other | (3.5 | ) | |
Decrease in Operating, General & Administrative Expenses | $ | (8.4 | ) |
40
The decrease in operating, general and administrative expenses of $8.4 million was primarily due to the following:
• | A net insurance recovery primarily associated with electric generation related environmental remediation costs incurred in prior periods; |
• | Lower professional and legal fees due to Hydro Transaction costs incurred in the prior period; |
• | Non-employee directors deferred compensation decreased primarily due to a decrease in our stock price. Directors may defer their board fees into deferred shares held in a rabbi trust. If the market value of our stock goes down, deferred compensation expense decreases; however, we account for the deferred shares as trading securities and their decrease in value is also reflected in other income with no impact on net income; |
• | Lower generator maintenance costs at our Dave Gates Generating Station; |
• | Lower bad debt expense, due to improved collection of receivables from customers; |
• | Lower fleet expenses due primarily to lower average fuel costs; |
• | Lower environmental costs; and |
• | Lower operating expenses recovered through our supply trackers, primarily related to efficiency measures implemented by customers. |
These decreases were partly offset by hydro operating costs associated with the November 2014 Hydro Transaction and higher employee benefit costs primarily due to higher medical expense and compensation costs.
Property and other taxes were $133.4 million in 2015 as compared with $114.6 million in 2014. This increase was primarily due to plant additions and higher property valuations in Montana, which includes $16.2 million from the Hydro Transaction, partly offset by a $1.0 million decrease in production taxes recovered in trackers associated with our gas production operations.
Depreciation and depletion expense was $144.7 million in 2015 as compared with $123.8 million in 2014. This increase was primarily due to plant additions, including approximately $14.4 million of hydro related depreciation.
Consolidated operating income in 2015 was $265.8 million, as compared with $178.0 million in 2014. This increase was primarily due to the Hydro Transaction and insurance recovery.
Consolidated interest expense in 2015 was $92.2 million, an increase of $14.4 million, or 18.5%, from 2014. This increase was primarily due to increased debt outstanding associated with the Hydro Transaction.
Consolidated other income in 2015 was $7.6 million as compared with $10.2 million in 2014. This decrease was primarily due to a $4.7 million reduction in the value of deferred shares held in trust for non-employee directors deferred compensation (which, as discussed above, had a corresponding reduction to operating, general and administrative expenses) partially offset by higher capitalization of AFUDC.
41
Consolidated income tax expense in 2015 was $30.0 million as compared with a benefit of $10.3 million in 2014. This increase was due to higher pre-tax income and an increase in our effective tax rate to 16.6% for the twelve months ended December 31, 2015 as compared with (9.3)% for the twelve months ended December 31, 2014. The following table summarizes the differences between our effective tax rate and the federal statutory rate (in millions):
Year Ended December 31, | |||||||||||||
2015 | 2014 | ||||||||||||
Income Before Income Taxes | $ | 181.2 | $ | 110.4 | |||||||||
Income tax calculated at 35% Federal statutory rate | 63.4 | 35.0 | % | 38.6 | 35.0 | % | |||||||
Permanent or flow through adjustments: | |||||||||||||
State income, net of federal provisions | 0.3 | 0.1 | (2.0 | ) | (1.8 | ) | |||||||
Flow through repairs deductions | (24.1 | ) | (13.3 | ) | (25.3 | ) | (22.9 | ) | |||||
Release of unrecognized tax benefit | — | — | (12.6 | ) | (11.4 | ) | |||||||
Production tax credits | (5.7 | ) | (3.2 | ) | (3.1 | ) | (2.8 | ) | |||||
Plant and depreciation of flow through items | (2.9 | ) | (1.6 | ) | 0.1 | 0.1 | |||||||
Prior year permanent return to accrual adjustments | 0.2 | 0.1 | (5.2 | ) | (4.7 | ) | |||||||
Other, net | (1.2 | ) | (0.5 | ) | (0.8 | ) | (0.8 | ) | |||||
(33.4 | ) | (18.4 | ) | (48.9 | ) | (44.3 | ) | ||||||
Income Tax Expense (Benefit) | $ | 30.0 | 16.6 | % | $ | (10.3 | ) | (9.3 | )% | ||||
Consolidated net income in 2015 was $151.2 million as compared with $120.7 million in 2014. This increase was primarily due to the Hydro Transaction and insurance recovery as discussed above, partly offset by warmer winter weather and the inclusion in our 2014 results of an income tax benefit due to the release of previously unrecognized tax benefits.
42
`
ELECTRIC OPERATIONS | ||||
We have various classifications of electric revenues, defined as follows:
• | Retail: Sales of electricity to residential, commercial and industrial customers. |
• | Regulatory amortization: Primarily represents timing differences for electric supply costs and property taxes between when we incur these costs and when we recover these costs in rates from our customers. |
• | Transmission: Reflects transmission revenues regulated by the FERC. |
• | Ancillary Services: FERC jurisdictional services that ensure reliability and support the transmission of electricity from generation sites to customer loads. Such services include regulation services, reserves and voltage support. |
• | Wholesale and Other: In October 2015, we became a member of SPP, which is a regional transmission organization. As a market participant in SPP, we buy and sell wholesale energy and reserves through the operation of a single, consolidated SPP balancing authority. As such, the increase in wholesale revenues is offset through an increase in cost of sales. This line also includes miscellaneous electric revenues. |
Year Ended December 31, 2016 Compared with Year Ended December 31, 2015
Results | ||||||||||||||
2016 | 2015 | Change | % Change | |||||||||||
(in millions) | ||||||||||||||
Retail revenue | $ | 840.7 | $ | 819.8 | $ | 20.9 | 2.5 | % | ||||||
Regulatory amortization | 20.9 | 39.4 | (18.5 | ) | (47.0 | ) | ||||||||
Total retail revenues | 861.6 | 859.2 | 2.4 | 0.3 | ||||||||||
Transmission | 51.1 | 54.7 | (3.6 | ) | (6.6 | ) | ||||||||
Ancillary services | 1.6 | 1.5 | 0.1 | 6.7 | ||||||||||
Wholesale and other | 97.3 | 29.0 | 68.3 | 235.5 | ||||||||||
Total Revenues | 1,011.6 | 944.4 | 67.2 | 7.1 | ||||||||||
Total Cost of Sales | 332.8 | 281.3 | 51.5 | 18.3 | % | |||||||||
Gross Margin | $ | 678.8 | $ | 663.1 | $ | 15.7 | 2.4 | % | ||||||
Revenues | Megawatt Hours (MWH) | Avg. Customer Counts | |||||||||||||||||
2016 | 2015 | 2016 | 2015 | 2016 | 2015 | ||||||||||||||
(in thousands) | |||||||||||||||||||
Montana | $ | 280,379 | $ | 275,971 | 2,372 | 2,359 | 291,348 | 287,387 | |||||||||||
South Dakota | 57,369 | 49,469 | 548 | 551 | 50,016 | 49,807 | |||||||||||||
Residential | 337,748 | 325,440 | 2,920 | 2,910 | 341,364 | 337,194 | |||||||||||||
Montana | 343,982 | 344,743 | 3,177 | 3,207 | 65,568 | 64,711 | |||||||||||||
South Dakota | 87,199 | 75,442 | 985 | 974 | 12,591 | 12,473 | |||||||||||||
Commercial | 431,181 | 420,185 | 4,162 | 4,181 | 78,159 | 77,184 | |||||||||||||
Industrial | 40,577 | 43,838 | 2,204 | 2,260 | 74 | 75 | |||||||||||||
Other | 31,162 | 30,348 | 188 | 187 | 6,143 | 6,119 | |||||||||||||
Total Retail Electric | $ | 840,668 | $ | 819,811 | 9,474 | 9,538 | 425,740 | 420,572 | |||||||||||
Cooling Degree Days | 2016 as compared with: | ||||||||
2016 | 2015 | Historic Average | 2015 | Historic Average | |||||
Montana | 313 | 385 | 317 | 19% colder | 1% colder | ||||
South Dakota | 895 | 792 | 733 | 13% warmer | 22% warmer | ||||
43
Heating Degree Days | 2016 as compared with: | ||||||||
2016 | 2015 | Historic Average | 2015 | Historic Average | |||||
Montana | 7,300 | 7,172 | 7,837 | 2% colder | 7% warmer | ||||
South Dakota | 6,593 | 6,924 | 7,674 | 5% warmer | 14% warmer | ||||
The following summarizes the components of the changes in electric margin for the years ended December 31, 2016 and 2015:
Gross Margin 2016 vs. 2015 | |||
(in millions) | |||
Gross Margin Items Impacting Net Income | |||
South Dakota rate increase | $ | 33.5 | |
Lost revenue adjustment mechanism | 7.1 | ||
QF adjustment | 6.1 | ||
MPSC disallowance | (9.5 | ) | |
Transmission | (3.6 | ) | |
Retail volumes | (2.0 | ) | |
Hydro generation rates | (1.5 | ) | |
Consolidated Gross Margin Impacting Net Income | 30.1 | ||
Gross Margin Items Offset in Operating Expenses and Income Tax Expense | |||
Hydro operations - Kerr conveyance | (16.5 | ) | |
Production tax credits flowed-through trackers | (8.2 | ) | |
Property taxes recovered in trackers | 10.3 | ||
Change in Items Offset Within Net Income | (14.4 | ) | |
Increase in Consolidated Gross Margin | $ | 15.7 | |
Gross margin for items impacting net income increased $30.1 million including the following:
• | An increase in South Dakota electric rates; |
• | The recognition of $13.4 million of deferred revenue as a result of a MPSC final order in our tracker filings, offset in |
part by the elimination of the lost revenue adjustment mechanism decreasing the recovery of our fixed costs; and
• | The inclusion in our 2015 results of an increase in supply costs due to the adjustment of the QF liability based on a review of contract assumptions. |
These increases were partly offset by:
• | The MPSC disallowance of previously incurred costs as discussed above; |
• | Lower demand to transmit energy across our transmission lines due to market conditions and pricing; |
• | A decrease in electric retail volumes due primarily to colder late summer weather in our Montana jurisdiction, along with lower industrial volumes of a large Montana customer, partly offset by warmer spring and summer weather in our South Dakota jurisdiction and customer growth; and |
• | A reduction in hydro generation rates due to the MPSC order in the hydro compliance filing as discussed above; |
The change in consolidated gross margin also includes the following items that had no impact on net income:
• | A decrease in revenues from the conveyance of the Kerr facility to the CSKT in September 2015 (offset by reduced operating expenses); |
• | A decrease in revenues for production tax credits primarily associated with the Beethoven wind generation project, which is a reduction in our customers rates (offset by reduced income tax expense); and |
• | An increase in revenues for property taxes included in trackers (offset by increased property tax expense). |
44
In addition, the change in regulatory amortization revenue is due to timing differences between when we incur electric supply costs and when we recover these costs in rates from our customers, which has a minimal impact on gross margin. Our wholesale and other revenues are largely gross margin neutral as they are offset by changes in cost of sales.
Year Ended December 31, 2015 Compared with Year Ended December 31, 2014
Results | ||||||||||||||
2015 | 2014 | Change | % Change | |||||||||||
(in millions) | ||||||||||||||
Retail revenue | $ | 819.8 | $ | 778.7 | $ | 41.1 | 5.3 | % | ||||||
Regulatory amortization | 39.4 | 33.9 | 5.5 | 16.2 | ||||||||||
Total retail revenues | 859.2 | 812.6 | 46.6 | 5.7 | ||||||||||
Transmission | 54.7 | 56.0 | (1.3 | ) | (2.3 | ) | ||||||||
Regulation Services | 1.5 | 1.6 | (0.1 | ) | (6.3 | ) | ||||||||
Wholesale and other | 29.0 | 7.8 | 21.2 | 271.8 | ||||||||||
Total Revenues | 944.4 | 878.0 | 66.4 | 7.6 | ||||||||||
Total Cost of Sales | 281.3 | 348.6 | (67.3 | ) | (19.3 | )% | ||||||||
Gross Margin | $ | 663.1 | $ | 529.4 | $ | 133.7 | 25.3 | % | ||||||
Revenues | Megawatt Hours (MWH) | Avg. Customer Counts | |||||||||||||||||
2015 | 2014 | 2015 | 2014 | 2015 | 2014 | ||||||||||||||
(in thousands) | |||||||||||||||||||
Montana | $ | 275,971 | $ | 259,070 | 2,359 | 2,400 | 287,387 | 283,319 | |||||||||||
South Dakota | 49,469 | 50,687 | 551 | 582 | 49,807 | 49,590 | |||||||||||||
Residential | 325,440 | 309,757 | 2,910 | 2,982 | 337,194 | 332,909 | |||||||||||||
Montana | 344,743 | 323,943 | 3,207 | 3,211 | 64,711 | 63,769 | |||||||||||||
South Dakota | 75,442 | 75,084 | 974 | 979 | 12,473 | 12,330 | |||||||||||||
Commercial | 420,185 | 399,027 | 4,181 | 4,190 | 77,184 | 76,099 | |||||||||||||
Industrial | 43,838 | 41,692 | 2,260 | 2,203 | 75 | 76 | |||||||||||||
Other | 30,348 | 28,215 | 187 | 177 | 6,119 | 6,147 | |||||||||||||
Total Retail Electric | $ | 819,811 | $ | 778,691 | 9,538 | 9,552 | 420,572 | 415,231 | |||||||||||
Cooling Degree Days | 2015 as compared with: | ||||||||
2015 | 2014 | Historic Average | 2014 | Historic Average | |||||
Montana | 385 | 332 | 315 | 16% warmer | 22% warmer | ||||
South Dakota | 792 | 596 | 734 | 33% warmer | 8% warmer | ||||
Heating Degree Days | 2015 as compared with: | ||||||||
2015 | 2014 | Historic Average | 2014 | Historic Average | |||||
Montana | 7,172 | 7,882 | 7,908 | 9% warmer | 9% warmer | ||||
South Dakota | 6,924 | 8,399 | 7,681 | 18% warmer | 10% warmer | ||||
45
The following summarizes the components of the changes in electric margin for the years ended December 31, 2015 and 2014:
Gross Margin 2015 vs. 2014 | |||
(in millions) | |||
Hydro operations | $ | 135.0 | |
South Dakota rate increase | 5.6 | ||
Property tax trackers | 2.1 | ||
Expenses recovered in trackers | (3.4 | ) | |
QF adjustment | (3.2 | ) | |
Retail volumes | (2.0 | ) | |
Other | (0.4 | ) | |
Increase in Gross Margin | $ | 133.7 | |
This increase in margin is primarily due to:
• | An increase in generation margin from the November 2014 Hydro Transaction; |
• | An increase in South Dakota rates effective July 2015; and |
• | An increase in property taxes included in trackers. |
These increases were partly offset by:
• | A $3.4 million decrease in costs recovered in our supply trackers, which includes: |
◦ | A $3.1 million increase in production tax credits, which is a reduction in our customer's rates, as a result of the Beethoven wind project acquisition; and |
◦ | A $0.3 million decrease in operating expenses, primarily related to efficiency measures implemented by customers. |
• | A $3.2 million QF adjustment, which includes: |
◦ | A $6.1 million increase in the QF liability recorded in the second quarter of 2015 based on a review of contract assumptions in our estimated liability; partly offset by |
◦ | A $2.9 million lower QF related supply costs based on actual QF pricing and output; and |
• | A decrease in retail volumes due primarily to warmer winter weather partly offset by warmer spring weather, customer growth and warmer summer weather in South Dakota as compared with the same period of 2014. |
Billed revenues cover the costs of operating utility assets, paying taxes and interest, and earning a return on our
shareholders’ investments. As a result of the Hydro Transaction, we also earn a return on these assets, thereby increasing
revenue. In addition, our cost of sales are lower due to reduced market purchases of power, which are passed through to retail customers at actual cost with no return component.
The increase in regulatory amortization revenue is due to timing differences between when we incur electric supply costs and when we recover these costs in rates from our customers, which has a minimal impact on gross margin. In addition, our wholesale and other revenues are largely gross margin neutral as they are offset by changes in cost of sales.
46
NATURAL GAS OPERATIONS | ||||
We have various classifications of natural gas revenues, defined as follows:
• | Retail: Sales of natural gas to residential, commercial and industrial customers. |
• | Regulatory amortization: Primarily represents timing differences for natural gas supply costs and property taxes between when we incur these costs and when we recover these costs in rates from our customers, which is also reflected in cost of sales and therefore has minimal impact on gross margin. |
• | Wholesale: Primarily represents transportation and storage for others. |
Year Ended December 31, 2016 Compared with Year Ended December 31, 2015
Results | ||||||||||||||
2016 | 2015 | Change | % Change | |||||||||||
(in millions) | ||||||||||||||
Retail revenue | $ | 201.8 | $ | 223.5 | $ | (21.7 | ) | (9.7 | )% | |||||
Regulatory amortization | 4.8 | 5.9 | (1.1 | ) | (18.6 | ) | ||||||||
Total retail revenues | 206.6 | 229.4 | (22.8 | ) | (9.9 | ) | ||||||||
Wholesale and other | 39.1 | 40.5 | (1.4 | ) | (3.5 | ) | ||||||||
Total Revenues | 245.7 | 269.9 | (24.2 | ) | (9.0 | ) | ||||||||
Total Cost of Sales | 68.2 | 91.6 | (23.4 | ) | (25.5 | ) | ||||||||
Gross Margin | $ | 177.5 | $ | 178.3 | $ | (0.8 | ) | (0.4 | )% | |||||
Revenues | Dekatherms (Dkt) | Customer Counts | |||||||||||||||||
2016 | 2015 | 2016 | 2015 | 2016 | 2015 | ||||||||||||||
(in thousands) | |||||||||||||||||||
Montana | $ | 93,034 | $ | 98,030 | 12,178 | 11,809 | 168,220 | 166,070 | |||||||||||
South Dakota | 20,399 | 24,429 | 2,533 | 2,673 | 39,207 | 38,858 | |||||||||||||
Nebraska | 17,043 | 20,948 | 2,179 | 2,340 | 37,129 | 36,947 | |||||||||||||
Residential | 130,476 | 143,407 | 16,890 | 16,822 | 244,556 | 241,875 | |||||||||||||
Montana | 46,515 | 49,374 | 6,343 | 6,203 | 23,223 | 22,943 | |||||||||||||
South Dakota | 14,051 | 16,969 | 2,665 | 2,700 | 6,456 | 6,295 | |||||||||||||
Nebraska | 8,858 | 11,700 | 1,689 | 1,810 | 4,725 | 4,650 | |||||||||||||
Commercial | 69,424 | 78,043 | 10,697 | 10,713 | 34,404 | 33,888 | |||||||||||||
Industrial | 1,031 | 1,168 | 147 | 152 | 259 | 263 | |||||||||||||
Other | 888 | 854 | 137 | 123 | 157 | 153 | |||||||||||||
Total Retail Gas | $ | 201,819 | $ | 223,472 | 27,871 | 27,810 | 279,376 | 276,179 | |||||||||||
Heating Degree Days | 2016 as compared with: | ||||||||
2016 | 2015 | Historic Average | 2015 | Historic Average | |||||
Montana | 7,300 | 7,172 | 7,837 | 2% colder | 7% warmer | ||||
South Dakota | 6,593 | 6,924 | 7,674 | 5% warmer | 14% warmer | ||||
Nebraska | 5,322 | 5,663 | 6,333 | 6% warmer | 16% warmer | ||||
47
The following summarizes the components of the changes in natural gas margin for the years ended December 31, 2016 and 2015:
Gross Margin 2016 vs. 2015 | |||
(in millions) | |||
Gross Margin Items Impacting Net Income | |||
Production | $ | (1.2 | ) |
Lost revenue adjustment mechanism | 0.6 | ||
Retail volumes | 0.2 | ||
Other | (1.5 | ) | |
Change in Gross Margin Impacting Net Income | (1.9 | ) | |
Gross Margin Items Offset in Operating Expenses | |||
Property taxes recovered in trackers | 2.2 | ||
Production gathering fees | (1.1 | ) | |
Change in Items Offset Within Net Income | 1.1 | ||
Decrease in Consolidated Gross Margin | $ | (0.8 | ) |
Gross margin for items impacting net income decreased $1.9 million including the following:
• | A decrease in production margin due to an $0.8 million decrease in overhead fees and a $0.4 million decrease in interim rates based on actual costs; partly offset by |
• | The recognition of deferred revenue as a result of a MPSC final order in our tracker filings, which was offset in part by |
the elimination of the lost revenue adjustment mechanism decreasing the recovery of our fixed costs; and
• | An increase in our Montana jurisdiction residential and commercial volumes due to colder late summer and winter weather, and customer growth, partly offset by warmer winter weather in our South Dakota jurisdiction. |
The change in gross margin also includes the following items that had no impact on net income:
• | An increase in revenues for property taxes included in trackers (offset by increased property tax expense); and |
• | A decrease in production gathering fees (offset by reduced operating expenses). |
In addition, average natural gas supply prices decreased in 2016 as compared with 2015, resulting in lower retail revenues and cost of sales, with no impact to gross margin. Our wholesale and other revenues are largely gross margin neutral as they are offset by changes in cost of sales.
48
Year Ended December 31, 2015 Compared with Year Ended December 31, 2014
Results | ||||||||||||||
2015 | 2014 | Change | % Change | |||||||||||
(in millions) | ||||||||||||||
Retail revenue | $ | 223.5 | $ | 282.6 | $ | (59.1 | ) | (20.9 | )% | |||||
Regulatory amortization | 5.9 | 1.3 | 4.6 | 353.8 | ||||||||||
Total retail revenues | 229.4 | 283.9 | (54.5 | ) | (19.2 | ) | ||||||||
Wholesale and other | 40.5 | 43.0 | (2.5 | ) | (5.8 | ) | ||||||||
Total Revenues | 269.9 | 326.9 | (57.0 | ) | (17.4 | ) | ||||||||
Total Cost of Sales | 91.6 | 134.0 | (42.4 | ) | (31.6 | ) | ||||||||
Gross Margin | $ | 178.3 | $ | 192.9 | $ | (14.6 | ) | (7.6 | )% | |||||
Revenues | Dekatherms (Dkt) | Customer Counts | |||||||||||||||||
2015 | 2014 | 2015 | 2014 | 2015 | 2014 | ||||||||||||||
(in thousands) | |||||||||||||||||||
Montana | $ | 98,030 | $ | 124,635 | 11,809 | 12,797 | 166,070 | 163,920 | |||||||||||
South Dakota | 24,429 | 29,807 | 2,673 | 3,278 | 38,858 | 38,594 | |||||||||||||
Nebraska | 20,948 | 25,488 | 2,340 | 2,730 | 36,947 | 36,845 | |||||||||||||
Residential | 143,407 | 179,930 | 16,822 | 18,805 | 241,875 | 239,359 | |||||||||||||
Montana | 49,374 | 63,707 | 6,203 | 7,044 | 22,943 | 22,717 | |||||||||||||
South Dakota | 16,969 | 22,235 | 2,700 | 3,117 | 6,295 | 6,166 | |||||||||||||
Nebraska | 11,700 | 14,297 | 1,810 | 2,058 | 4,650 | 4,629 | |||||||||||||
Commercial | 78,043 | 100,239 | 10,713 | 12,219 | 33,888 | 33,512 | |||||||||||||
Industrial | 1,168 | 1,286 | 152 | 139 | 263 | 262 | |||||||||||||
Other | 854 | 1,130 | 123 | 139 | 153 | 153 | |||||||||||||
Total Retail Gas | $ | 223,472 | $ | 282,585 | 27,810 | 31,302 | 276,179 | 273,286 | |||||||||||
Heating Degree Days | 2015 as compared with: | ||||||||
2015 | 2014 | Historic Average | 2014 | Historic Average | |||||
Montana | 7,172 | 7,882 | 7,908 | 9% warmer | 9% warmer | ||||
South Dakota | 6,924 | 8,399 | 7,681 | 18% warmer | 10% warmer | ||||
Nebraska | 5,663 | 6,412 | 6,340 | 12% warmer | 11% warmer | ||||
49
The following summarizes the components of the changes in natural gas margin for the years ended December 31, 2015 and 2014:
Gross Margin 2015 vs. 2014 | |||
(in millions) | |||
Retail volumes | $ | (10.8 | ) |
Gas production rates | (1.9 | ) | |
Expenses recovered in trackers | (1.6 | ) | |
Other | (0.3 | ) | |
Decrease in Gross Margin | $ | (14.6 | ) |
This decrease in gross margin and volumes was primarily due to:
• | A decrease in retail volumes due primarily to warmer winter weather, partly offset by customer growth; |
• | A decrease in gas production rates and deferral of interim gas production revenue based on actual costs; and |
• | A $1.6 million decrease in costs recovered in our supply trackers, which includes: |
◦ | A $1.0 million decrease in production taxes associated with our gas production operations; and |
◦ | A $0.6 million decrease in operating expenses, primarily related to efficiency measures implemented by customers. |
Average natural gas supply prices decreased in 2015 resulting in lower retail revenues and cost of sales as compared with 2014, with no impact to gross margin. The decrease in regulatory amortization revenue is due to timing differences between when we incur natural gas supply costs and when we recover these costs in rates from our customers. In addition, our wholesale and other revenues are largely gross margin neutral as they are offset by changes in cost of sales.
50
LIQUIDITY AND CAPITAL RESOURCES | ||||
We require liquidity to support and grow our business, and use our liquidity for working capital needs, capital expenditures, investments in or acquisitions of assets, and to repay debt. We believe our cash flows from operations and existing borrowing capacity should be sufficient to fund our operations, service existing debt, pay dividends, and fund capital expenditures (excluding strategic growth opportunities). The amount of capital expenditures and dividends are subject to certain factors including the use of existing cash, cash equivalents and the receipt of cash from operations. In addition, a material change in operations or available financing could impact our current liquidity and ability to fund capital resource requirements, and we may defer a portion of our planned capital expenditures as necessary.
We issue debt securities to refinance retiring maturities, reduce short-term debt, fund construction programs and for other general corporate purposes. To fund our strategic growth opportunities we utilize available cash flow, debt capacity and equity issuances that allows us to maintain investment grade ratings. We plan to maintain a 50 - 55% debt to total capital ratio excluding capital leases, and expect to continue targeting a long-term dividend payout ratio of 60 - 70% of earnings per share; however, there can be no assurance that we will be able to meet these targets.
Short-term liquidity is provided by internal cash flows, the sale of commercial paper and use of our unsecured revolving credit facility. We utilize our short-term borrowings and / or revolver availability to manage our cash flows due to the seasonality of our business, and utilize any cash on hand in excess of current operating requirements to invest in our business and reduce borrowings. Short-term borrowings may also be used to temporarily fund utility capital requirements. As of December 31, 2016, our total net liquidity was approximately $104.3 million, including $5.1 million of cash and $99.2 million of revolving credit facility availability. As of December 31, 2016, there were no letters of credit outstanding.
During the second quarter of 2016, we issued $60 million of South Dakota First Mortgage Bonds at a fixed interest rate of 2.80% maturing in 2026. Proceeds were used to redeem $55 million of our 6.05% First Mortgage Bonds due in 2018. During the third quarter of 2016, the City of Forsyth, Montana, issued on our behalf $144.7 million aggregate principal amount of Pollution Control Revenue Refunding Bonds at a fixed interest rate of 2.00% maturing in 2023. Proceeds from the issuance and available funds were used to redeem the City of Forsyth's 4.65%, $170.2 million Pollution Control Revenue Bonds due 2023. Also during the third quarter of 2016, we issued $45.0 million aggregate principal amount of South Dakota First Mortgage Bonds at a fixed interest rate of 2.66% maturing in 2026. Proceeds from this issuance were used for general corporate purposes.
We closely monitor the financial institutions associated with our credit facility. A total of eight banks participate in our revolving credit facility, with no one bank providing more than 16% of the total availability. As of December 31, 2016, no bank has advised us of its intent to withdraw from the revolving credit facility or to not honor its obligations. Our revolving credit facility requires us to maintain a debt to capitalization ratio at or below 65%. At December 31, 2016, we were in compliance with this ratio. The revolving credit facility also contains default and related acceleration provisions related to default on other debt. The following table presents additional information about short term borrowings during the year ended December 31, 2016 (in millions):
Amount outstanding at year end | $ | 300.8 | |
Daily average amount outstanding | $ | 210.7 | |
Maximum amount outstanding | $ | 300.8 | |
Minimum amount outstanding | $ | 131.9 | |
As of February 10, 2017, our availability under our revolving credit facility was approximately $142.2 million.
51
Credit Ratings
In general, less favorable credit ratings make debt financing more costly and more difficult to obtain on terms that are favorable to us and impact our trade credit availability. Fitch Ratings (Fitch), Moody's Investors Service (Moody's) and Standard and Poor's Ratings Service (S&P) are independent credit-rating agencies that rate our debt securities. These ratings indicate the agencies' assessment of our ability to pay interest and principal when due on our debt. As of February 10, 2017, our current ratings with these agencies are as follows:
Senior Secured Rating | Senior Unsecured Rating | Commercial Paper | Outlook | ||||
Fitch | A | A- | F2 | Stable | |||
Moody’s | A1 | A3 | Prime-2 | Negative | |||
S&P | A- | BBB | A-2 | Stable | |||
In January 2016, Moody’s lowered our credit outlook from Stable to Negative citing our financial metrics and an average regulatory environment. We expect Moody's to take action on our ratings during the first half of 2017. A security rating is not a recommendation to buy, sell or hold securities. Such rating may be subject to revision or withdrawal at any time by the credit rating agency and each rating should be evaluated independently of any other rating.
Capital Requirements
Our capital expenditures program is subject to continuing review and modification. Actual utility construction expenditures may vary from estimates due to changes in electric and natural gas projected load growth, changing business operating conditions and other business factors. We anticipate funding capital expenditures through cash flows from operations, available credit sources, debt and equity issuances and future rate increases. Our estimated capital expenditures are discussed above in the "Strategy" section.
52
Contractual Obligations and Other Commitments
We have a variety of contractual obligations and other commitments that require payment of cash at certain specified periods. The following table summarizes our contractual cash obligations and commitments as of December 31, 2016. See additional discussion in Note 19 – Commitments and Contingencies to the Consolidated Financial Statements.
Total | 2017 | 2018 | 2019 | 2020 | 2021 | Thereafter | |||||||||||||||||||||
(in thousands) | |||||||||||||||||||||||||||
Long-term debt | $ | 1,793,338 | $ | — | $ | — | $ | 250,000 | $ | — | $ | — | $ | 1,543,338 | |||||||||||||
Capital leases | 26,325 | 1,979 | 2,133 | 2,298 | 2,476 | 2,668 | 14,771 | ||||||||||||||||||||
Short-term borrowings | 300,811 | 300,811 | — | — | — | — | — | ||||||||||||||||||||
Estimated pension and other postretirement obligations (1) | 67,342 | 13,713 | 13,684 | 13,577 | 13,274 | 13,094 | N/A | ||||||||||||||||||||
Qualifying facilities (2) liability | 882,028 | 74,607 | 76,703 | 78,836 | 80,984 | 82,941 | 487,957 | ||||||||||||||||||||
Supply and capacity contracts (3) | 2,020,802 | 206,056 | 155,905 | 156,168 | 122,784 | 106,985 | 1,272,904 | ||||||||||||||||||||
Contractual interest payments on debt (4) | 1,367,736 | 80,828 | 80,828 | 72,903 | 64,978 | 64,717 | 1,003,482 | ||||||||||||||||||||
Environmental remediation obligations (1) | 6,200 | 1,000 | 1,650 | 2,150 | 800 | 600 | N/A | ||||||||||||||||||||
Total Commitments (5) | $ | 6,464,582 | $ | 678,994 | $ | 330,903 | $ | 575,932 | $ | 285,296 | $ | 271,005 | $ | 4,322,452 | |||||||||||||
___________________________
(1) | We have estimated cash obligations related to our pension and other postretirement benefit programs and environmental remediation obligations for five years, as it is not practicable to estimate thereafter. The pension and other postretirement benefit estimates reflect our expected cash contributions, which may be in excess of minimum funding requirements. |
(2) | Certain QFs require us to purchase minimum amounts of energy at prices ranging from $74 to $136 per MWH through 2029. Our estimated gross contractual obligation related to these QFs is approximately $882.0 million. A portion of the costs incurred to purchase this energy is recoverable through rates authorized by the MPSC, totaling approximately $683.4 million. |
(3) | We have entered into various purchase commitments, largely purchased power, electric transmission, coal and natural gas supply and natural gas transportation contracts. These commitments range from one to 27 years. |
(4) | For our variable rate short-term borrowings outstanding, we have assumed an average interest rate of 1.07% through maturity. |
(5) | Potential tax payments related to uncertain tax positions are not practicable to estimate and have been excluded from this table. |
Factors Impacting our Liquidity
Supply Costs - Our operations are subject to seasonal fluctuations in cash flow. During the heating season, which is primarily from November through March, cash receipts from natural gas and electric sales typically exceed cash requirements. During the summer months, cash on hand, together with the seasonal increase in cash flows and utilization of our existing revolver, are used to purchase natural gas to place in storage, perform maintenance and make capital improvements.
The effect of this seasonality on our liquidity is also impacted by changes in the market prices of our electric and natural gas supply, which is recovered through various monthly cost tracking mechanisms. These energy supply tracking mechanisms are designed to provide stable and timely recovery of supply costs on a monthly basis during the July to June annual tracking period, with an adjustment in the following annual tracking period to correct for any under or over collection in our monthly trackers. Due to the lag between our purchases of electric and natural gas commodities and revenue receipt from customers, cyclical over and under collection situations arise consistent with the seasonal fluctuations discussed above; therefore, we usually under collect in the fall and winter and over collect in the spring. Fluctuations in recoveries under our cost tracking mechanisms can have a significant effect on cash flows from operations and make year-to-year comparisons difficult.
As of December 31, 2016, we are under collected on our natural gas and electric trackers by approximately $11.7 million, as compared with $29.4 million as of December 31, 2015, and $33.0 million as of December 31, 2014.
53
Cash Flows
The following table summarizes our consolidated cash flows for 2016, 2015 and 2014.
Year Ended December 31, | |||||||||||
2016 | 2015 | 2014 | |||||||||
Operating Activities | |||||||||||
Net income | $ | 164.2 | $ | 151.2 | $ | 120.7 | |||||
Non-cash adjustments to net income | 155.4 | 177.2 | 114.6 | ||||||||
Changes in working capital | (25.1 | ) | 10.1 | 10.9 | |||||||
Other noncurrent assets and liabilities | (5.5 | ) | 1.3 | 3.8 | |||||||
289.0 | 339.8 | 250.0 | |||||||||
Investing Activities | |||||||||||
Property, plant and equipment additions | (287.9 | ) | (283.7 | ) | (270.3 | ) | |||||
Acquisitions | — | (146.7 | ) | (903.6 | ) | ||||||
Change in restricted cash | — | 16.1 | (16.3 | ) | |||||||
Investment in New Market Tax Credit program | — | — | (18.2 | ) | |||||||
Proceeds from sale of assets | 1.4 | 30.2 | 1.5 | ||||||||
(286.5 | ) | (384.1 | ) | (1,206.9 | ) | ||||||
Financing Activities | |||||||||||
Proceeds from issuance of common stock, net | — | 56.7 | 399.2 | ||||||||
Issuances of long-term debt, net | 24.5 | 120.0 | 505.7 | ||||||||
Issuances (repayments) of short-term borrowings, net | 70.9 | (38.0 | ) | 126.9 | |||||||
Dividends on common stock | (95.8 | ) | (90.1 | ) | (65.0 | ) | |||||
Financing costs | (8.4 | ) | (12.1 | ) | (5.2 | ) | |||||
Other | (0.6 | ) | (0.6 | ) | (0.9 | ) | |||||
(9.4 | ) | 35.9 | 960.7 | ||||||||
Net (Decrease) Increase in Cash and Cash Equivalents | $ | (6.9 | ) | $ | (8.4 | ) | $ | 3.8 | |||
Cash and Cash Equivalents, beginning of period | $ | 12.0 | $ | 20.4 | $ | 16.6 | |||||
Cash and Cash Equivalents, end of period | $ | 5.1 | $ | 12.0 | $ | 20.4 | |||||
Cash Flows Provided By Operating Activities
As of December 31, 2016, our cash and cash equivalents were $5.1 million as compared with $12.0 million at December 31, 2015. Cash provided by operating activities totaled $289.0 million for the year ended December 31, 2016 as compared with $339.8 million during 2015. This decrease in operating cash flows is primarily due to refunds associated with the DGGS FERC ruling and interim rates in our South Dakota electric rate case of approximately $30.8 million and $7.2 million, respectively, to customers during 2016, and lower collections from customers compared to the prior period, which are reflected in the changes in working capital. In addition, net income after non-cash adjustments was lower in the current period.
Our 2015 operating cash flows increased by approximately $89.8 million as compared with 2014. This increase in operating cash flows is primarily due to higher net income after non-cash adjustments, primarily due to the results of the Hydro Transaction. This increase was offset in part by an $18.4 million settlement of interest rate swaps during the first quarter of 2015.
Cash Flows Used In Investing Activities
Cash used in investing activities totaled $286.5 million during the year ended December 31, 2016, as compared with $384.1 million during 2015, and $1.2 billion in 2014. Plant additions during 2016 include maintenance additions of approximately $158.6 million, capacity related capital expenditures of approximately $79.0 million, and infrastructure capital expenditures of approximately $50.3 million. During 2015, we purchased the 80 MW Beethoven wind project in South Dakota for approximately $143 million. Plant additions during 2015 include maintenance additions of approximately $103.9 million, capacity related capital expenditures of approximately $81.4 million, supply related capital expenditures of approximately
54
$26.4 million, primarily related to electric generation facilities in South Dakota, and infrastructure capital expenditures of approximately $54.6 million. Partially offsetting the impact of these expenditures was the receipt of $30 million for the sale of the Kerr Project. During 2014, we completed the Hydro Transaction for approximately $903.5 million. Property, plant and equipment additions during 2014 were $270.3 million.
Cash Flows (Used in) Provided By Financing Activities
Cash used in financing activities totaled $9.4 million during 2016 as compared with cash provided by financing activities of $35.9 million during 2015 and $960.7 million during 2014. During 2016, net cash used in financing activities includes the payment of dividends of $95.8 million and the payment of financing costs of $8.4 million, partially offset by net issuances of commercial paper of $70.9 million and net proceeds from the issuance of debt of $24.5 million. During 2015, net cash provided by financing activities includes net proceeds from the issuance of debt of $120.0 million and common stock issuances of $56.7 million, partially offset by net repayments of commercial paper of $38.0 million, the payment of dividends of $90.1 million and the payment of financing costs of $12.1 million. During 2014, primarily to fund the Hydro Transaction, we received proceeds from common stock issuances of $399.2 million, proceeds from the net issuance of debt of $505.7 million, and proceeds from the net issuance of commercial paper of $126.9 million, partially offset by the payment of dividends of $65.0 million.
Financing Transactions - In June 2016, we issued $60 million aggregate principal amount of South Dakota First Mortgage Bonds at a fixed interest rate of 2.80% maturing in 2026. Proceeds were used to redeem our 6.05%, $55 million South Dakota First Mortgage Bonds due 2018.
In addition, in September 2016, we issued $45.0 million aggregate principal amount of South Dakota First Mortgage Bonds at a fixed interest rate of 2.66% maturing in 2026. Proceeds from this issuance were used for general corporate purposes. These bonds are secured by our electric and natural gas assets in South Dakota, Nebraska, North Dakota, and Iowa and were issued in transactions exempt from the registration requirements of the Securities Act of 1933, as amended.
In August 2016, the City of Forsyth, Montana, issued on our behalf $144.7 million aggregate principal amount of Pollution Control Revenue Refunding Bonds at a fixed interest rate of 2.00% maturing in 2023. Proceeds from the issuance were loaned to us, and with available funds were used to redeem the City of Forsyth's 4.65%, $170.2 million Pollution Control Revenue Bonds due 2023. Our obligations to repay the loan are secured by the issuance of a series of our First Mortgage Bonds, which, in turn, are secured by our electric and natural gas assets in Montana and were issued in a transaction exempt from the registration requirements of the Securities Act of 1933, as amended.
55
CRITICAL ACCOUNTING POLICIES AND ESTIMATES | ||||
Management's discussion and analysis of financial condition and results of operations is based on our consolidated financial statements, which have been prepared in accordance with GAAP. The preparation of these financial statements requires us to make estimates and assumptions that affect the reported amounts of assets, liabilities, revenues and expenses, and related disclosure of contingent assets and liabilities. We base our estimates on historical experience and other assumptions that are believed to be proper and reasonable under the circumstances. We continually evaluate the appropriateness of our estimates and assumptions. Actual results could differ from those estimates.
We have identified the policies and related procedures below as critical to understanding our historical and future performance, as these polices affect the reported amounts of revenue and are the more significant areas involving management's judgments and estimates.
Goodwill and Long-lived Assets
We assess the carrying value of our goodwill for impairment at least annually (April 1) and more frequently if indications of impairment exist. We calculate the fair value of our reporting units by considering various factors, including valuation studies based primarily on a discounted cash flow methodology and published industry valuations and market data as supporting information. These calculations are dependent on subjective factors such as management’s estimate of future cash flows and the selection of appropriate discount and growth rates. These underlying assumptions and estimates are made as of a point in time; subsequent changes in these assumptions could result in a future impairment charge. We monitor for events or circumstances that may indicate an interim goodwill impairment test is necessary. Accounting standards require that if the fair value of a reporting unit is less than its carrying value including goodwill, an impairment charge for goodwill must be recognized in the financial statements. To measure the amount of an impairment loss, the implied fair value of the reporting unit's goodwill is compared with its carrying value.
As of April 1, 2016, the fair value of each of our reporting units substantially exceeded carrying value, including goodwill. In estimating cash flows, we incorporate expected long-term growth rates in our service territory, regulatory stability, and commodity prices (where appropriate), as well as other factors that affect our revenue, expense and capital expenditure projections. Due to our regulated environment, if an increase in the cost of capital occurred, the effect on the corresponding reporting unit's fair value should be ultimately offset by a similar increase in the reporting unit's regulated revenues since those rates include a component that is based on the reporting unit's cost of capital.
We evaluate our property, plant and equipment for impairment if an indicator of impairment exists. If the sum of the undiscounted cash flows from a company's asset, without interest charges, is less than the carrying value of the asset, impairment must be recognized in the financial statements. If an asset is deemed to be impaired, then the amount of the impairment loss recognized represents the excess of the asset's carrying value as compared to its estimated fair value, based on management's assumptions and projections.
We believe that the accounting estimate related to determining the fair value of goodwill and long-lived assets, and thus any impairment, is a “critical accounting estimate" because: (i) it is highly susceptible to change from period to period since it requires company management to make cash flow assumptions about future revenues, operating costs and discount rates over an indefinite life; and (ii) recognizing an impairment could have a significant impact on the assets reported in our Consolidated Balance Sheets and our Consolidated Statements of Income. Management's assumptions about future margins and volumes require significant judgment because actual margins and volumes have fluctuated in the past and are expected to continue to do so. In estimating future margins, we use our internal budgets.
Qualifying Facilities Liability
Our QF liability primarily consists of unrecoverable costs associated with three contracts covered under PURPA. Under the terms of these contracts, we are required to purchase minimum amounts of energy at prices ranging from $74 to $136 per MWH through 2029. Our estimated gross contractual obligation related to the QFs is approximately $882.0 million through 2029. A portion of the costs incurred to purchase this energy is recoverable through rates, totaling approximately $683.4 million through 2029. We maintain a liability based on the net present value (discounted at 7.75%) of the difference between our estimated obligations under the QFs and the fixed amounts recoverable in rates.
The liability was established based on certain assumptions and projections over the contract terms related to pricing, estimated output and recoverable amounts. Since the liability is based on projections over the next several years, actual QF
56
output, changes in pricing, contract amendments and regulatory decisions relating to QFs could significantly impact the liability and our results of operations in any given year. In assessing the liability each reporting period, we compare our assumptions to actual results and make adjustments as necessary for that period.
One of the QF contracts contains variable pricing terms, which exposes us to price escalation risks. The estimated annual escalation rate for this QF contract is a key assumption and is based on a combination of historical actual results and market data available for future projections. In estimating our QF liability, we have estimated an annual escalation rate of 3% over the remaining term of the contract (through June 2024). The actual escalation rate can change significantly on an annual basis, which could significantly impact the liability and our results of operations in any given year.
Revenue Recognition
Customers are billed on a monthly cycle basis. To match revenues with associated expenses, we accrue unbilled revenues for electric and natural gas services delivered to the customers but not yet billed at month-end. The calculation of unbilled revenue is affected by factors that include fluctuations in energy demand for the unbilled period, seasonality, weather, customer usage patterns, price in effect for each customer class and estimated transmission and distribution line losses. We base our estimate of unbilled revenue each period on the volume of energy delivered, as valued by the billing cycle and historical usage rates and growth by customer class for our service area. This figure is then adjusted for the projected impact of seasonal and weather variations.
Regulatory Assets and Liabilities
Our operations are subject to the provisions of ASC 980, Regulated Operations (ASC 980). Our regulatory assets are the probable future revenues associated with certain costs to be recovered from customers through the ratemaking process, including our estimate of amounts recoverable for natural gas and electric supply purchases. Regulatory liabilities are the probable future reductions in revenues associated with amounts to be credited to customers through the ratemaking process. We determine which costs are recoverable by consulting previous rulings by state regulatory authorities in jurisdictions where we operate or other factors that lead us to believe that cost recovery is probable. This accounting treatment is impacted by the uncertainties of our regulatory environment, anticipated future regulatory decisions and their impact. If any part of our operations becomes no longer subject to the provisions of ASC 980, or facts and circumstances lead us to conclude that a recorded regulatory asset is no longer probable of recovery, we would record a charge to earnings, which could be material. In addition, we would need to determine if there was any impairment to the carrying costs of the associated plant and inventory assets.
While we believe that our assumptions regarding future regulatory actions are reasonable, different assumptions could materially affect our results. See Note 5 – Regulatory Assets and Liabilities, to the Consolidated Financial Statements for further discussion.
Pension and Postretirement Benefit Plans
We sponsor and/or contribute to pension, postretirement health care and life insurance benefits for eligible employees. Our reported costs of providing pension and other postretirement benefits, as described in Note 15 - Employee Benefit Plans, to the Consolidated Financial Statements, are dependent upon numerous factors including the provisions of the plans, changing employee demographics, rate of return on plan assets and other economic conditions, and various actuarial calculations, assumptions, and accounting mechanisms. As a result of these factors, significant portions of pension and other postretirement benefit costs recorded in any period do not reflect (and are generally greater than) the actual benefits provided to plan participants. Due to the complexity of these calculations, the long-term nature of the obligations, and the importance of the assumptions utilized, the determination of these costs is considered a critical accounting estimate.
Assumptions
Key actuarial assumptions utilized in determining these costs include:
• | Discount rates used in determining the future benefit obligations; |
• | Expected long-term rate of return on plan assets; and |
• | Mortality assumptions. |
We review these assumptions on an annual basis and adjust them as necessary. The assumptions are based upon market interest rates, past experience and management's best estimate of future economic conditions.
57
We set the discount rate using a yield curve analysis, which projects benefit cash flows into the future and then discounts those cash flows to the measurement date using a yield curve. This is done by constructing a hypothetical bond portfolio whose cash flow from coupons and maturities matches the year-by-year, projected benefit cash flow from our plans. Based on this analysis as of December 31, 2016, our discount rate on the NorthWestern Corporation pension plan is 3.95% and on the NorthWestern Energy pension plan is 4.10%.
In determining the expected long-term rate of return on plan assets, we review historical returns, the future expectations for returns for each asset class weighted by the target asset allocation of the pension and postretirement portfolios, and long-term inflation assumptions. Our expected long-term rate of return on assets assumption is 4.70% for 2017.
Cost Sensitivity
The following table reflects the sensitivity of pension costs to changes in certain actuarial assumptions (in thousands):
Actuarial Assumption | Change in Assumption | Impact on Pension Cost | Impact on Projected Benefit Obligation | ||||||||
Discount rate | 0.25 | % | $ | (2,104 | ) | $ | (19,977 | ) | |||
(0.25 | )% | 2,207 | 20,913 | ||||||||
Rate of return on plan assets | 0.25 | % | (1,218 | ) | N/A | ||||||
(0.25 | )% | 1,218 | N/A | ||||||||
Accounting Treatment
We recognize the funded status of each plan as an asset or liability in the Consolidated Balance Sheets. Differences between actuarial assumptions and actual plan results are deferred and are recognized into earnings only when the accumulated differences exceed 10% of the greater of the projected benefit obligation or the market-related value of plan assets, which reduces the volatility of reported pension costs. If necessary, the excess is amortized over the average remaining service period of active employees.
Due to the various regulatory treatments of the plans, our financial statements reflect the effects of the different rate making principles followed by the jurisdictions regulating us. Pension costs in Montana and other postretirement benefit costs in South Dakota are included in rates on a pay as you go basis for regulatory purposes. Pension costs in South Dakota and other postretirement benefit costs in Montana are included in rates on an accrual basis for regulatory purposes. Regulatory assets have been recognized for the obligations that will be included in future cost of service.
Income Taxes
Judgment and the use of estimates are required in developing the provision for income taxes and reporting of tax-related assets and liabilities. Deferred income tax assets and liabilities represent the future effects on income taxes from temporary differences between the bases of assets and liabilities for financial reporting and tax purposes. Deferred tax assets and liabilities are measured using enacted tax rates expected to apply to taxable income in the years in which those temporary differences are expected to reverse. The probability of realizing deferred tax assets is based on forecasts of future taxable income and the availability of tax planning strategies that can be implemented, if necessary, to realize deferred tax assets. We establish a valuation allowance when it is more likely than not that all, or a portion of, a deferred tax asset will not be realized. Exposures exist related to various tax filing positions, which may require an extended period of time to resolve and may result in income tax adjustments by taxing authorities. We have reduced deferred tax assets or established liabilities based on our best estimate of future probable adjustments related to these exposures. On a quarterly basis, we evaluate exposures in light of any additional information and make adjustments as necessary to reflect the best estimate of the future outcomes. We currently estimate that as of December 31, 2016, we have approximately $365 million of consolidated NOLs prior to consideration of unrecognized tax benefits to offset federal taxable income in future years. We believe our deferred tax assets and established liabilities are appropriate for estimated exposures; however, actual results may differ significantly from these estimates.
The interpretation of tax laws involves uncertainty. Ultimate resolution of income tax matters may result in favorable or unfavorable impacts to net income and cash flows and adjustments to tax-related assets and liabilities could be material. The uncertainty and judgment involved in the determination and filing of income taxes is accounted for by prescribing a minimum recognition threshold that a tax position is required to meet before being recognized in the financial statements. We recognize tax positions that meet the more-likely-than-not threshold as the largest amount of tax benefit that is greater than 50 percent
58
likely of being realized upon ultimate settlement with a taxing authority that has full knowledge of all relevant information. We have unrecognized tax benefits of approximately $88.4 million as of December 31, 2016. The resolution of tax matters in a particular future period could have a material impact on our provision for income taxes, results of operations and our cash flows.
NEW ACCOUNTING STANDARDS
See Note 2 - Significant Accounting Policies, to the Consolidated Financial Statements, included in Item 8 herein for a discussion of new accounting standards.
59
ITEM 7A. QUANTITATIVE AND QUALITATIVE DISCLOSURES ABOUT MARKET RISK
We are exposed to market risks, including, but not limited to, interest rates, energy commodity price volatility, and credit exposure. Management has established comprehensive risk management policies and procedures to manage these market risks.
Interest Rate Risk
Interest rate risks include exposure to adverse interest rate movements for outstanding variable rate debt and for future anticipated financings. We manage our interest rate risk by issuing primarily fixed-rate long-term debt with varying maturities, refinancing certain debt and, at times, hedging the interest rate on anticipated borrowings. All of our debt has fixed interest rates, with the exception of our revolving credit facility. The revolving credit facility bears interest at the lower of prime or available rates tied to the Eurodollar rate plus a credit spread, ranging from 0.88% to 1.75%. To more cost effectively meet short-term cash requirements, we issue commercial paper supported by our revolving credit facility. Since commercial paper terms are short-term, we are subject to interest rate risk. As of December 31, 2016, we had approximately $300.8 million of commercial paper outstanding and no borrowings on our revolving credit facility. A 1% increase in interest rates would increase our annual interest expense by approximately $3.0 million.
Commodity Price Risk
We are exposed to commodity price risk due to our reliance on market purchases to fulfill a portion of our electric and natural gas supply requirements. We also participate in the wholesale electric market to balance our supply of power from our own generating resources. Several factors influence price levels and volatility. These factors include, but are not limited to, seasonal changes in demand, weather conditions, available generating assets within regions, transportation availability and reliability within and between regions, fuel availability, market liquidity, and the nature and extent of current and potential federal and state regulations.
As part of our overall strategy for fulfilling our electric and natural gas supply requirements, we employ the use of market purchases and sales, including forward contracts. These types of contracts are included in our supply portfolios and in some instances, are used to manage price volatility risk by taking advantage of seasonal fluctuations in market prices. These contracts are part of an overall portfolio approach intended to provide price stability for consumers. As a regulated utility, our exposure to market risk caused by changes in commodity prices is substantially mitigated because these commodity costs are included in our cost tracking mechanisms and are recoverable from customers subject to prudence reviews by applicable state regulatory commissions.
Counterparty Credit Risk
We are exposed to counterparty credit risk related to the ability of counterparties to meet their contractual payment obligations, and the potential non-performance of counterparties to deliver contracted commodities or services at the contracted price. If counterparties seek financial protection under bankruptcy laws, we are exposed to greater financial risks. We are also exposed to counterparty credit risk related to providing transmission service to our customers under our Open Access Transmission Tariff and under gas transportation agreements. We have risk management policies in place to limit our transactions to high quality counterparties. We monitor closely the status of our counterparties and take action, as appropriate, to further manage this risk. This includes, but is not limited to, requiring letters of credit or prepayment terms. There can be no assurance, however, that the management tools we employ will eliminate the risk of loss.
ITEM 8. FINANCIAL STATEMENTS AND SUPPLEMENTARY DATA
The consolidated financial information, including the reports of independent registered public accounting firm, the quarterly financial information, and the financial statement schedule, required by this Item 8 is set forth on pages F-1 to F- 50 of this Annual Report on Form 10-K and is hereby incorporated into this Item 8 by reference.
60
ITEM 9. CHANGES IN AND DISAGREEMENTS WITH ACCOUNTANTS ON ACCOUNTING AND FINANCIAL DISCLOSURE
None.
ITEM 9A. CONTROLS AND PROCEDURES
Evaluation of Disclosure Controls and Procedures
We have established disclosure controls and procedures designed to ensure that information required to be disclosed in the reports we file or submit under the Securities Exchange Act of 1934 is recorded, processed, summarized and reported, within the time periods specified in the SEC's rules and forms and accumulated and reported to management, including the principal executive officer and principal financial officer, to allow timely decisions regarding required disclosure.
We conducted an evaluation, under the supervision and with the participation of our principal executive officer and principal financial officer, of our disclosure controls and procedures (as defined in Rules 13a-15(e) and 15d-15(e) under the Securities Exchange Act of 1934). Based on this evaluation our principal executive officer and principal financial officer have concluded that, as of December 31, 2016, our disclosure controls and procedures are effective.
Changes in Internal Control over Financial Reporting
There have been no changes in our internal control over financial reporting during the most recent fiscal quarter that have materially affected, or are reasonably likely to materially affect, our internal control over financial reporting.
Management's Report on Internal Control over Financial Reporting
The management of NorthWestern is responsible for establishing and maintaining adequate internal control over financial reporting. Our internal control system was designed to provide reasonable assurance to our management and Board of Directors regarding the preparation and fair presentation of published financial statements.
All internal controls over financial reporting, no matter how well designed, have inherent limitations, including the possibility of human error and the circumvention or overriding of controls. Therefore, even effective internal control over financial reporting can provide only reasonable assurance with respect to financial statement preparation and presentation. Further, because of changes in conditions, the effectiveness of internal control over financial reporting may vary over time.
Our management, including our chief executive officer and chief financial officer, assessed the effectiveness of our internal control over financial reporting as of December 31, 2016. In making its assessment of internal control over financial reporting, management used the criteria set forth by the Committee of Sponsoring Organizations of the Treadway Commission (COSO) in Internal Control—Integrated Framework (2013). Based on our evaluation, management concluded that, as of December 31, 2016, our internal control over financial reporting was effective based on those criteria.
Our independent registered public accounting firm has issued an attestation report on our internal control over financial reporting. Their report appears on page F-3.
ITEM 9B. OTHER INFORMATION
Not applicable.
61
Part III |
ITEM 10. DIRECTORS, EXECUTIVE OFFICERS AND CORPORATE GOVERNANCE
The information required by this item with respect to directors and corporate governance will be set forth in NorthWestern Corporation's Proxy Statement for its 2017 Annual Meeting of Shareholders, which is incorporated by reference. Information with respect to our Executive Officers is included in Item 1 to this report.
ITEM 11. EXECUTIVE COMPENSATION
Information required by this Item will be set forth in NorthWestern Corporation's Proxy Statement for its 2017 Annual Meeting of Shareholders, which is incorporated by reference.
ITEM 12. SECURITY OWNERSHIP OF CERTAIN BENEFICIAL OWNERS AND MANAGEMENT AND RELATED SHAREHOLDER MATTERS
Information required by this item will be set forth in NorthWestern Corporation's Proxy Statement for its 2017 Annual Meeting of Shareholders, which is incorporated by reference.
ITEM 13. CERTAIN RELATIONSHIPS AND RELATED TRANSACTIONS, AND DIRECTOR INDEPENDENCE
Information concerning relationships and related transactions of the directors and officers of NorthWestern Corporation and director independence will be set forth in NorthWestern Corporation's Proxy Statement for its 2017 Annual Meeting of Shareholders, which is incorporated by reference.
ITEM 14. PRINCIPAL ACCOUNTING FEES AND SERVICES
Information concerning fees paid to the principal accountant for each of the last two years will be set forth in NorthWestern Corporation's Proxy Statement for its 2017 Annual Meeting of Shareholders, which is incorporated by reference.
62
Part IV |
ITEM 15. EXHIBITS AND FINANCIAL STATEMENT SCHEDULE
The following documents are filed as part of this report:
(1) | Consolidated Financial Statements. |
The following items are included in Part II, Item 8 of this annual report on Form 10-K:
CONSOLIDATED FINANCIAL STATEMENTS:
Page | |
Reports of Independent Registered Public Accounting Firm | |
Consolidated Statements of Income for the Years Ended December 31, 2016, 2015, and 2014 | |
Consolidated Statements of Comprehensive Income for the Years Ended December 31, 2016, 2015, and 2014 | |
Consolidated Balance Sheets as of December 31, 2016 and 2015 | |
Consolidated Statements of Cash Flows for the Years Ended December 31, 2016, 2015, and 2014 | |
Consolidated Statements of Common Shareholders' Equity for the Years Ended December 31, 2016, 2015, and 2014 | |
Notes to Consolidated Financial Statements | |
Quarterly Unaudited Financial Data for the Two Years Ended December 31, 2016 | |
(2) | Financial Statement Schedule |
Schedule II. Valuation and Qualifying Accounts | |
Schedule II, Valuation and Qualifying Accounts, is included in Part II, Item 8 of this annual report on Form 10-K. All other schedules are omitted because they are not applicable or the required information is shown in the Consolidated Financial Statements or the Notes thereto.
63
(3) | Exhibits. |
The exhibits listed below are hereby filed with the SEC, as part of this Annual Report on Form 10-K. Certain of the following exhibits have been previously filed with the SEC pursuant to the requirements of the Securities Act of 1933 or the Securities Exchange Act of 1934. Such exhibits are identified by the parenthetical references following the listing of each such exhibit and are incorporated by reference. We will furnish a copy of any exhibit upon request, but a reasonable fee may be charged to cover our expenses in furnishing such exhibit.
Exhibit Number | Description of Document | |
1.1 | Underwriting Agreement, dated September 29, 2015, between NorthWestern Corporation and RBC Capital Markets, LLC, as representative of the Underwriters named therein (incorporated by reference to Exhibit 1.1 of NorthWestern Corporation’s Current Report on Form 8-K, dated September 29, 2015, Commission File No. 1-10499). | |
2.1(a) | Second Amended and Restated Plan of Reorganization of NorthWestern Corporation (incorporated by reference to Exhibit 2.1 of NorthWestern Corporation's Current Report on Form 8-K, dated October 20, 2004, Commission File No. 1-10499). | |
2.1(b) | Order Confirming the Second Amended and Restated Plan of Reorganization of NorthWestern Corporation (incorporated by reference to Exhibit 2.2 of NorthWestern Corporation's Current Report on Form 8-K, dated October 20, 2004, Commission File No. 1-10499). | |
3.1(a) | Amended and Restated Certificate of Incorporation of NorthWestern Corporation, dated November 1, 2004 (incorporated by reference to Exhibit 3.1 of NorthWestern Corporation's Current Report on Form 8-K, dated October 20, 2004, Commission File No. 1-10499). | |
3.1(b) | Amended and Restated Certificate of Incorporation of NorthWestern Corporation, dated May 3, 2016 (incorporated by reference to Exhibit 3.1 of NorthWestern Corporation's Current Report on Form 8-K, dated May 18, 2016, Commission File No. 1-10499). | |
3.2(a) | Amended and Restated By-Laws of NorthWestern Corporation, dated October 31, 2011 (incorporated by reference to Exhibit 3.1 of NorthWestern Corporation's Current Report on Form 8-K, dated October 31, 2011, Commission File No. 1-10499). | |
3.2(b) | Amended and Restated Bylaws of NorthWestern Corporation, dated May 12, 2016 (incorporated by reference to Exhibit 3.2 of NorthWestern Corporation's Current Report on Form 8-K, dated May 18, 2016, Commission File No. 1-10499). | |
4.1(a) | General Mortgage Indenture and Deed of Trust, dated as of August 1, 1993, from NorthWestern Corporation to The Chase Manhattan Bank (National Association), as Trustee (incorporated by reference to Exhibit 4(a) of NorthWestern Corporation's Current Report on Form 8-K, dated August 16, 1993, Commission File No. 1-10499). | |
4.1(b) | Supplemental Indenture, dated as of November 1, 2004, by and between NorthWestern Corporation (formerly known as Northwestern Public Service Company) and JPMorgan Chase Bank (successor by merger to The Chase Manhattan Bank (National Association)), as Trustee under the General Mortgage Indenture and Deed of Trust dated as of August 1, 1993 (incorporated by reference to Exhibit 4.5 of NorthWestern Corporation's Current Report on Form 8-K, dated November 1, 2004, Commission File No. 1-10499). | |
4.1(c) | Eighth Supplemental Indenture, dated as of May 1, 2008, by and between NorthWestern Corporation and The Bank of New York, as trustee under the General Mortgage Indenture and Deed of Trust dated as of August 1, 1993 (incorporated by reference to Exhibit 4.1 of NorthWestern Corporation’s Current Report on Form 10-Q for the quarter ended June 30, 2008, Commission File No. 1-10499). | |
4.1(d) | Ninth Supplemental Indenture, dated as of May 1, 2010, by and between NorthWestern Corporation and The Bank of New York Mellon, as trustee under the General Mortgage Indenture and Deed of Trust dated as of August 1, 1993 (incorporated by reference to Exhibit 4.2 of NorthWestern Corporation’s Current Report on Form 10-Q for the quarter ended June 30, 2010, Commission File No. 1-10499). | |
4.1(e) | Thirtieth Supplemental Indenture, dated as of August 1, 2012, between NorthWestern Corporation and The Bank of New York Mellon and Philip L. Watson, as trustees under the Mortgage and Deed of Trust dated as of October 1, 1945 (incorporated by reference to Exhibit 4.1 of NorthWestern Corporation's Current Report on Form 8-K, dated August 10, 2012, Commission File No. 1-10499). | |
4.2(a) | Tenth Supplemental Indenture, dated as of August 1, 2012, between NorthWestern Corporation and The Bank of New York Mellon, as trustees under the General Mortgage Indenture and Deed of Trust dated as of August 1, 1993 (incorporated by reference to Exhibit 4.2 of NorthWestern Corporation's Current Report on Form 8-K, dated August 10, 2012, Commission File No. 1-10499). | |
4.2(b) | Eleventh Supplemental Indenture, dated as of December 1, 2013, among NorthWestern Corporation and The Bank of New York Mellon, as trustee (incorporated by reference to Exhibit 4.2 of NorthWestern Corporation’s Current Report on Form 8-K, dated December 19, 2013, Commission File No. 1-10499). | |
64
4.2(c) | Twelfth Supplemental Indenture, dated as of December 1, 2014, among NorthWestern Corporation and The Bank of New York Mellon, as trustee (incorporated by reference to Exhibit 4.1 of NorthWestern Corporation’s Current Report on Form 8-K, dated December 19, 2014, Commission File No. 1-10499). | |
4.2(d) | Thirteenth Supplemental Indenture, dated as of September 1, 2015, among NorthWestern Corporation and The Bank of New York Mellon, as trustee (incorporated by reference to Exhibit 4.1 of NorthWestern Corporation’s Current Report on Form 8-K, dated September 29, 2015, Commission File No. 1-10499). | |
4.2(e) | Fourteenth Supplemental Indenture, dated as of June 1, 2016, between the NorthWestern Corporation and The Bank of New York Mellon, as trustee (incorporated by reference to Exhibit 4.1 of NorthWestern Corporation's Current Report on Form 8-K, dated June 21, 2016, Commission File No. 1-10499). | |
4.2(f) | Fifteenth Supplemental Indenture, dated as of September 1, 2016, among NorthWestern Corporation and The Bank of New York Mellon, as trustee (incorporated by reference to Exhibit 4.1 of NorthWestern Corporation’s Current Report on Form 8-K, dated October 6, 2016, Commission File No. 1-10499). | |
4.2(g) | Indenture, dated as of August 1, 2016, between City of Forsyth, Rosebud County, Montana and U.S. Bank National Association, as trustee agent (incorporated by reference to Exhibit 4.1 of NorthWestern Corporation's Current Report on Form 8-K, dated August 16, 2016, Commission File No. 1-10499). | |
4.3(a) | Loan Agreement, dated as of August 1, 2016, between NorthWestern Corporation and the City of Forsyth, Montana, related to the issuance of City of Forsyth Pollution Control Revenue Bonds Series 2016 (incorporated by reference to Exhibit 4.2 of the Company's Report on Form 8-K, dated August 16, 2016, Commission File No. 1-10499). | |
4.3(b) | Bond Delivery Agreement, dated as of August 1, 2016, between NorthWestern Corporation and U.S. Bank National Association, as trustee agent (incorporated by reference to Exhibit 4.3 of NorthWestern Corporation's Current Report on Form 8-K, dated August 16, 2016, Commission File No. 1-10499). | |
4.4(a) | First Mortgage and Deed of Trust, dated as of October 1, 1945, by The Montana Power Company in favor of Guaranty Trust Company of New York and Arthur E. Burke, as trustees (incorporated by reference to Exhibit 7(e) of The Montana Power Company's Registration Statement, Commission File No. 002-05927). | |
4.4(b) | Eighteenth Supplemental Indenture to the Mortgage and Deed of Trust, dated as of August 5, 1994 (incorporated by reference to Exhibit 99(b) of The Montana Power Company's Registration Statement on Form S-3, dated December 5, 1994, Commission File No. 033-56739). | |
4.4(c) | Twenty-First Supplemental Indenture to the Mortgage and Deed of Trust, dated as of February 13, 2002 (incorporated by reference to Exhibit 4(v) of NorthWestern Energy, LLC's Annual Report on Form 10-K for the year ended December 31, 2001, Commission File No. 001-31276). | |
4.4(d) | Twenty-Second Supplemental Indenture to the Mortgage and Deed of Trust, dated as of November 15, 2002 (incorporated by reference to Exhibit 4.1 of NorthWestern Corporation's Current Report on Form 8-K, dated February 10, 2003, Commission File No. 1-10499). | |
4.4(e) | Twenty-Third Supplemental Indenture to the Mortgage and Deed of Trust, dated as of February 1, 2002 (incorporated by reference to Exhibit 4.2 of NorthWestern Corporation's Current Report on Form 8-K, dated February 10, 2003, Commission File No. 1-10499). | |
4.4(f) | Twenty-Fourth Supplemental Indenture, dated as of November 1, 2004, between NorthWestern Corporation and The Bank of New York and MaryBeth Lewicki, (incorporated by reference to Exhibit 4.4 of NorthWestern Corporation's Current Report on Form 8-K, dated November 1, 2004, Commission File No. 1-10499). | |
4.4(g) | Twenty-Fifth Supplemental Indenture, dated as of April 1, 2006, between NorthWestern Corporation and The Bank of New York and Ming Ryan, as trustees (incorporated by reference to Exhibit 4.4(n) of the Company's Annual Report on Form 10-K for the year ended December 31, 2006, Commission File No. 1-10499). | |
4.4(h) | Twenty-Sixth Supplemental Indenture, dated as of September 1, 2006, between NorthWestern Corporation and The Bank of New York and Ming Ryan, as trustees (incorporated by reference to Exhibit 4.4 of NorthWestern Corporation's Current Report on Form 8-K, dated September 13, 2006, Commission File No. 1-10499). | |
4.4(i) | Twenty-seventh Supplemental Indenture, dated as of March 1, 2009, among NorthWestern Corporation and The Bank of New York Mellon (formerly The Bank of New York) and Ming Ryan, as trustees (incorporated by reference to Exhibit 4.1 of NorthWestern Corporation’s Current Report on Form 8-K, dated March 23, 2009, Commission File No. 1-10499). | |
4.4(j) | Twenty-eighth Supplemental Indenture, dated as of October 1, 2009, by and between NorthWestern Corporation and The Bank of New York Mellon, as trustee (incorporated by reference to Exhibit 4.1 of NorthWestern Corporation’s Quarterly Report on Form 10-Q for the quarter ended September 30, 2009, Commission File No. 1-10499). | |
4.4(k) | Twenty-ninth Supplemental Indenture, dated as of May 1, 2010, among NorthWestern Corporation and The Bank of New York Mellon and Ming Ryan, as trustees (incorporated by reference to Exhibit 4.1 of NorthWestern Corporation’s Quarterly Report on Form 10-Q for the quarter ended June 30, 2010, Commission File No. 1-10499). | |
65
4.4(l) | Thirtieth Supplemental Indenture, dated as of August 1, 2012, between NorthWestern Corporation and The Bank of New York Mellon and Philip L. Watson, as trustees under the Mortgage and Deed of Trust dated as of October 1, 1945 (incorporated by reference to Exhibit 4.1 of NorthWestern Corporation's Current Report on Form 8-K, dated August 10, 2012, Commission File No. 1-10499). | |
4.4(m) | Thirty-first Supplemental Indenture, dated as of December 1, 2013, among NorthWestern Corporation and The Bank of New York Mellon and Phillip L. Watson, as trustees (incorporated by reference to Exhibit 4.1 of NorthWestern Corporation’s Current Report on Form 8-K, dated December 19, 2013, Commission File No. 1-10499). | |
4.4(n) | Thirty-second Supplemental Indenture, dated as of November 1, 2014, among NorthWestern Corporation and The Bank of New York Mellon and Phillip L. Watson, as trustees (incorporated by reference to Exhibit 4.4(n) of the Company's Report on Form 10-K for the year ended December 31, 2014, Commission File No. 1-10499). | |
4.4(o) | Thirty-third Supplemental Indenture, dated as of November 14, 2014, among NorthWestern Corporation and The Bank of New York Mellon and Phillip L. Watson, as trustees (incorporated by reference to Exhibit 4.1 of NorthWestern Corporation’s Current Report on Form 8-K, dated November 14, 2014, Commission File No. 1-10499). | |
4.4(p) | Thirty-fourth Supplemental Indenture, dated as of January 1, 2015, among NorthWestern Corporation and The Bank of New York Mellon and Phillip L. Watson, as trustees (incorporated by reference to Exhibit 4.4(p) of the Company's Report on Form 10-K for the year ended December 31, 2014, Commission File No. 1-10499). | |
4.4(q) | Thirty-fifth Supplemental Indenture, dated as of June 1, 2015, among NorthWestern Corporation and The Bank of New York Mellon and Beata Harvin, as trustees (incorporated by reference to Exhibit 4.1 of NorthWestern Corporation's Current Report on Form 8-K, dated June 29, 2015, Commission File No. 1-10499). | |
4.4(r) | Thirty-sixth Supplemental Indenture, dated as of August 1, 2016, among NorthWestern Corporation and The Bank of New York Mellon and Beata Harvin, as trustees (incorporated by reference to Exhibit 4.4 of NorthWestern Corporation's Current Report on Form 8-K, dated August 16, 2016, Commission File No. 1-10499). | |
10.1(a) † | NorthWestern Corporation 2005 Deferred Compensation Plan for Non-Employee Directors, as amended April 21, 2010 (incorporated by reference to Exhibit 10.3 of NorthWestern Corporation's Quarterly Report on Form 10-Q for the quarter ended June 30, 2010, Commission File No. 1-10499). | |
10.1(b) † | NorthWestern Corporation 2009 Officers Deferred Compensation Plan, as amended April 21, 2010 (incorporated by reference to Exhibit 10.4 of NorthWestern Corporation's Quarterly Report on Form 10-Q for the quarter ended June 30, 2010, Commission File No. 1-10499). | |
10.1(c) † | Form of NorthWestern Corporation Executive Retirement/Retention Program Restricted Share Unit Award Agreement (incorporated by reference to Exhibit 99.02 of NorthWestern Corporation's Current Report on Form 8-K, dated December 5, 2011, Commission File No. 1-10499). | |
10.1(d) † | Form of NorthWestern Corporation Executive Retirement/Retention Program Restricted Share Unit Award Agreement (incorporated by reference to Exhibit 99.02 of NorthWestern Corporation's Current Report on Form 8-K, dated December 12, 2012, Commission File No. 1-10499). | |
10.1(e) † | Form of NorthWestern Corporation Executive Retirement/Retention Program Restricted Share Unit Award Agreement (incorporated by reference to Exhibit 99.02 of NorthWestern Corporation's Current Report on Form 8-K, dated December 10, 2013, Commission File No. 1-10499). | |
10.1(f) † | Form of NorthWestern Corporation Performance Unit Award Agreement (incorporated by reference to Exhibit 99.1 of NorthWestern Corporation's Current Report on Form 8-K, dated February 18, 2014, Commission File No. 1-10499). | |
10.1(g) † | NorthWestern Corporation Amended and Restated Equity Compensation Plan, as amended effective July 1, 2014 (incorporated by reference to Appendix A to NorthWestern Corporation's Proxy Statement for the 2014 Annual Meeting of Shareholders filed on March 7, 2014, Commission File No. 1-10499). | |
10.1(h) † | Form of NorthWestern Corporation Executive Retirement/Retention Program Restricted Share Unit Award Agreement (incorporated by reference to Exhibit 99.02 of NorthWestern Corporation's Current Report on Form 8-K, dated December 22, 2014, Commission File No. 1-10499). | |
10.1(i) † | Form of NorthWestern Corporation Performance Unit Award Agreement (incorporated by reference to Exhibit 99.1 of NorthWestern Corporation's Current Report on Form 8-K, dated February 11, 2015, Commission File No. 1-10499). | |
10.1(j) † | NorthWestern Energy 2016 Annual Incentive Plan (incorporated by reference to Exhibit 99.1 of NorthWestern Corporation's Current Report on Form 8-K, dated February 16, 2016, Commission File No. 1-10499). | |
10.1(k) † | Form of NorthWestern Corporation Performance Unit Award Agreement (incorporated by reference to Exhibit 99.2 of NorthWestern Corporation's Current Report on Form 8-K, dated February 16, 2016, Commission File No. 1-10499). | |
66
10.1(l) † | NorthWestern Corporation Key Employee Severance Plan 2016 (incorporated by reference to Exhibit 10.1 of NorthWestern Corporation's Current Report on Form 8-K, dated October 25, 2016, Commission File No. 1-10499). | |
10.1(m) † | NorthWestern Energy 2017 Annual Incentive Plan (incorporated by reference to Exhibit 99.01 of NorthWestern Corporation's Current Report on Form 8-K, dated December 13, 2016, Commission File No. 1-10499). | |
10.1(n) † | Form of NorthWestern Corporation Executive Retirement/Retention Program Restricted Share Unit Award Agreement (incorporated by reference to Exhibit 99.02 of NorthWestern Corporation's Current Report on Form 8-K, dated December 13, 2016, Commission File No. 1-10499). | |
10.2(a) | Commercial Paper Dealer Agreement between NorthWestern Corporation and Merrill Lynch, Pierce, Fenner & Smith Incorporated, dated as of February 3, 2011 (incorporated by reference to Exhibit 10.1 of NorthWestern Corporation's Current Report on Form 8-K, dated February 8, 2011, Commission File No. 1-10499). | |
10.2(b) | Third Amended and Restated Credit Agreement, dated December 12, 2016, among NorthWestern Corporation, as borrower, the several banks and other financial institutions or entities from time to time parties to the agreement, as lenders, Merrill Lynch, Pierce, Fenner & Smith Incorporated and Credit Suisse Securities (USA) LLC as joint lead arrangers; Credit Suisse Securities (USA) LLC as syndication agent; Keybank National Association, MUFG Union Bank, N.A. and U.S. Bank National Association, as co-documentation agents; and Bank of America, N.A., as administrative agent (incorporated by reference to Exhibit 10.1 of NorthWestern Corporation's Current Report on Form 8-K, dated December 12, 2016, Commission File No. 1-10499). | |
12.1* | Statement Regarding Computation of Earnings to Fixed Charges. | |
21* | Subsidiaries of NorthWestern Corporation. | |
23.1* | Consent of Independent Registered Public Accounting Firm | |
24* | Power of Attorney (included on the signature page of this Annual Report on Form 10-K) | |
31.1* | Certification of Chief Executive Officer pursuant to Section 302 of the Sarbanes Oxley Act of 2002 | |
31.2* | Certification of Chief Financial Officer pursuant to Section 302 of the Sarbanes Oxley Act of 2002 | |
32.1* | Certification of Robert C. Rowe pursuant to Section 906 of the Sarbanes-Oxley Act of 2002. | |
32.2* | Certification of Brian B. Bird pursuant to Section 906 of the Sarbanes-Oxley Act of 2002. | |
101.INS* | XBRL Instance Document | |
101.SCH* | XBRL Taxonomy Extension Schema Document | |
101.CAL* | XBRL Taxonomy Extension Calculation Linkbase Document | |
101.DEF* | XBRL Taxonomy Extension Definition Linkbase Document | |
101.LAB* | XBRL Taxonomy Label Linkbase Document | |
101.PRE* | XBRL Taxonomy Extension Presentation Linkbase Document | |
† Management contract or compensatory plan or arrangement.
* Filed herewith.
All schedules for which provision is made in the applicable accounting regulations of the SEC are not required under the related instructions or are not applicable, and, therefore, have been omitted.
67
SIGNATURES
Pursuant to the requirements of Section 13 or 15(d) of the Securities Exchange Act of 1934, the Registrant has duly caused this Annual Report on Form 10-K to be signed on its behalf by the undersigned, thereunto duly authorized.
NORTHWESTERN CORPORATION | |||
February 17, 2017 | By: | /s/ ROBERT C. ROWE | |
Robert C. Rowe | |||
President and Chief Executive Officer | |||
68
POWER OF ATTORNEY
We, the undersigned directors and/or officers of NorthWestern Corporation, hereby severally constitute and appoint Robert C. Rowe and Crystal D. Lail, and each of them with full power to act alone, our true and lawful attorneys-in-fact and agents, with full power of substitution and resubstitution and revocation, for each of us and in our name, place, and stead, in any and all capacities, to sign any and all amendments to this Annual Report on Form 10-K, and to file or cause to be filed the same, with all exhibits thereto, and other documents in connection therewith, with the Securities and Exchange Commission, and hereby grant unto such attorneys-in-fact and agents, and each of them, the full power and authority to do each and every act and thing requisite and necessary to be done in and about the foregoing, as fully to all intents and purposes as each of us might or could do in person, hereby ratifying and confirming all that said attorneys-in-fact and agents, or any of them, or their respective substitute or substitutes, may lawfully do or cause to be done by virtue hereof.
Pursuant to the requirements of the Securities Exchange Act of 1934, this Annual Report on Form 10-K has been signed below by the following persons on behalf of the Registrant and in the capacities and on the dates indicated.
Signature | Title | Date | ||
/s/ E. LINN DRAPER JR. | Chairman of the Board | February 17, 2017 | ||
E. Linn Draper Jr. | ||||
/s/ ROBERT C. ROWE | President, Chief Executive Officer and Director | February 17, 2017 | ||
Robert C. Rowe | (Principal Executive Officer) | |||
/s/ BRIAN B. BIRD | Vice President and Chief Financial Officer | February 17, 2017 | ||
Brian B. Bird | (Principal Financial Officer) | |||
/s/ CRYSTAL D. LAIL | Vice President and Controller | February 17, 2017 | ||
Crystal D. Lail | (Principal Accounting Officer) | |||
/s/ STEPHEN P. ADIK | Director | February 17, 2017 | ||
Stephen P. Adik | ||||
/s/ DOROTHY M. BRADLEY | Director | February 17, 2017 | ||
Dorothy M. Bradley | ||||
/s/ ANTHONY T. CLARK | Director | February 17, 2017 | ||
Anthony T. Clark | ||||
/s/ DANA J. DYKHOUSE | Director | February 17, 2017 | ||
Dana J. Dykhouse | ||||
/s/ JAN R. HORSFALL | Director | February 17, 2017 | ||
Jan R. Horsfall | ||||
/s/ JULIA L. JOHNSON | Director | February 17, 2017 | ||
Julia L. Johnson | ||||
69
INDEX TO FINANCIAL STATEMENTS AND FINANCIAL STATEMENT SCHEDULES | ||||
Page | |
Consolidated Financial Statements | |
Reports of Independent Registered Public Accounting Firm | |
Consolidated statements of income for the years ended December 31, 2016, 2015, and 2014 | |
Consolidated statements of comprehensive income for the years ended December 31, 2016, 2015, and 2014 | |
Consolidated balance sheets as of December 31, 2016 and December 31, 2015 | |
Consolidated statements of cash flows for the years ended December 31, 2016, 2015, and 2014 | |
Consolidated statements of common shareholders' equity for the years ended December 31, 2016, 2015, and 2014 | |
Notes to consolidated financial statements | |
Financial Statement Schedule | |
Schedule II. Valuation and Qualifying Accounts | |
F-1
REPORT OF INDEPENDENT REGISTERED PUBLIC ACCOUNTING FIRM
To the Board of Directors and Shareholders of
NorthWestern Corporation
Sioux Falls, South Dakota
We have audited the accompanying consolidated balance sheets of NorthWestern Corporation and subsidiaries (the "Company") as of December 31, 2016 and 2015, and the related consolidated statements of income, comprehensive income, common shareholders’ equity, and cash flows for each of the three years in the period ended December 31, 2016. Our audits also included the financial statement schedule listed in the Index at Item 15. These consolidated financial statements and the financial statement schedule are the responsibility of the Company's management. Our responsibility is to express an opinion on the consolidated financial statements and financial statement schedule based on our audits.
We conducted our audits in accordance with the standards of the Public Company Accounting Oversight Board (United States). Those standards require that we plan and perform the audit to obtain reasonable assurance about whether the consolidated financial statements are free of material misstatement. An audit includes examining, on a test basis, evidence supporting the amounts and disclosures in the consolidated financial statements. An audit also includes assessing the accounting principles used and significant estimates made by management, as well as evaluating the overall financial statement presentation. We believe that our audits provide a reasonable basis for our opinion.
In our opinion, such consolidated financial statements present fairly, in all material respects, the financial position of NorthWestern Corporation and subsidiaries as of December 31, 2016 and 2015, and the results of their operations and their cash flows for each of the three years in the period ended December 31, 2016, in conformity with accounting principles generally accepted in the United States of America. Also, in our opinion, such financial statement schedule, when considered in relation to the basic consolidated financial statements taken as a whole, presents fairly, in all material respects, the information set forth therein.
We have also audited, in accordance with the standards of the Public Company Accounting Oversight Board (United States), the Company's internal control over financial reporting as of December 31, 2016, based on the criteria established in Internal Control - Integrated Framework (2013) issued by the Committee of Sponsoring Organizations of the Treadway Commission and our report dated February 16, 2017 expressed as unqualified opinion on the Company's internal control over financial reporting.
/s/ DELOITTE & TOUCHE LLP | |
Minneapolis, Minnesota | |
February 16, 2017 | |
F-2
REPORT OF INDEPENDENT REGISTERED PUBLIC ACCOUNTING FIRM
To the Board of Directors and Shareholders of
NorthWestern Corporation
Sioux Falls, South Dakota
We have audited the internal control over financial reporting of NorthWestern Corporation and subsidiaries (the "Company") as of December 31, 2016, based on criteria established in Internal Control - Integrated Framework (2013) issued by the Committee of Sponsoring Organizations of the Treadway Commission. The Company's management is responsible for maintaining effective internal control over financial reporting and for its assessment of the effectiveness of internal control over financial reporting, included in the accompanying “Management's Report on Internal Control over Financial Reporting.” Our responsibility is to express an opinion on the Company's internal control over financial reporting based on our audit.
We conducted our audit in accordance with the standards of the Public Company Accounting Oversight Board (United States). Those standards require that we plan and perform the audit to obtain reasonable assurance about whether effective internal control over financial reporting was maintained in all material respects. Our audit included obtaining an understanding of internal control over financial reporting, assessing the risk that a material weakness exists, testing and evaluating the design and operating effectiveness of internal control based on the assessed risk, and performing such other procedures as we considered necessary in the circumstances. We believe that our audit provides a reasonable basis for our opinion.
A company's internal control over financial reporting is a process designed by, or under the supervision of, the company's principal executive and principal financial officers, or persons performing similar functions, and effected by the company's board of directors, management, and other personnel to provide reasonable assurance regarding the reliability of financial reporting and the preparation of financial statements for external purposes in accordance with generally accepted accounting principles. A company's internal control over financial reporting includes those policies and procedures that (1) pertain to the maintenance of records that, in reasonable detail, accurately and fairly reflect the transactions and dispositions of the assets of the company; (2) provide reasonable assurance that transactions are recorded as necessary to permit preparation of financial statements in accordance with generally accepted accounting principles, and that receipts and expenditures of the company are being made only in accordance with authorizations of management and directors of the company; and (3) provide reasonable assurance regarding prevention or timely detection of unauthorized acquisition, use, or disposition of the company's assets that could have a material effect on the financial statements.
Because of the inherent limitations of internal control over financial reporting, including the possibility of collusion or improper management override of controls, material misstatements due to error or fraud may not be prevented or detected on a timely basis. Also, projections of any evaluation of the effectiveness of the internal control over financial reporting to future periods are subject to the risk that the controls may become inadequate because of changes in conditions, or that the degree of compliance with the policies or procedures may deteriorate.
In our opinion, the Company maintained, in all material respects, effective internal control over financial reporting as of December 31, 2016, based on the criteria established in Internal Control - Integrated Framework (2013) issued by the Committee of Sponsoring Organizations of the Treadway Commission.
We have also audited, in accordance with the standards of the Public Company Accounting Oversight Board (United States), the consolidated financial statements and financial statement schedule as of and for the year ended December 31, 2016 of the Company and our report dated February 16, 2017, expressed an unqualified opinion on those financial statements and financial statement schedule.
/s/ DELOITTE & TOUCHE LLP | |
Minneapolis, Minnesota | |
February 16, 2017 | |
F-3
NORTHWESTERN CORPORATION
CONSOLIDATED STATEMENTS OF INCOME
(in thousands, except per share amounts)
Year Ended December 31, | |||||||||||
2016 | 2015 | 2014 | |||||||||
Revenues | |||||||||||
Electric | $ | 1,011,595 | $ | 944,428 | $ | 877,967 | |||||
Gas | 245,652 | 269,871 | 326,896 | ||||||||
Total Revenues | 1,257,247 | 1,214,299 | 1,204,863 | ||||||||
Operating Expenses | |||||||||||
Cost of sales | 400,973 | 372,864 | 482,591 | ||||||||
Operating, general and administrative | 302,893 | 297,475 | 305,886 | ||||||||
Property and other taxes | 148,098 | 133,442 | 114,592 | ||||||||
Depreciation and depletion | 159,336 | 144,702 | 123,776 | ||||||||
Total Operating Expenses | 1,011,300 | 948,483 | 1,026,845 | ||||||||
Operating Income | 245,947 | 265,816 | 178,018 | ||||||||
Interest Expense, net | (94,970 | ) | (92,153 | ) | (77,802 | ) | |||||
Other Income, net | 5,548 | 7,583 | 10,198 | ||||||||
Income Before Income Taxes | 156,525 | 181,246 | 110,414 | ||||||||
Income Tax Benefit (Expense) | 7,647 | (30,037 | ) | 10,272 | |||||||
Net Income | $ | 164,172 | $ | 151,209 | $ | 120,686 | |||||
Average Common Shares Outstanding | 48,299 | 47,298 | 40,156 | ||||||||
Basic Earnings per Average Common Share | $ | 3.40 | $ | 3.20 | $ | 3.01 | |||||
Diluted Earnings per Average Common Share | $ | 3.39 | $ | 3.17 | $ | 2.99 | |||||
See Notes to Consolidated Financial Statements
F-4
NORTHWESTERN CORPORATION
CONSOLIDATED STATEMENTS OF COMPREHENSIVE INCOME
(in thousands, except per share amounts)
Year Ended December 31, | |||||||||||
2016 | 2015 | 2014 | |||||||||
Net Income | $ | 164,172 | $ | 151,209 | $ | 120,686 | |||||
Other comprehensive (loss) income, net of tax: | |||||||||||
Reclassification of net gains on derivative instruments | (1,338 | ) | (698 | ) | (684 | ) | |||||
Realized loss on cash flow hedging derivatives | — | — | (11,145 | ) | |||||||
Postretirement medical liability adjustment | 195 | 310 | 82 | ||||||||
Foreign currency translation | 25 | 558 | 265 | ||||||||
Total Other Comprehensive (Loss) Income | (1,118 | ) | 170 | (11,482 | ) | ||||||
Comprehensive Income | $ | 163,054 | $ | 151,379 | $ | 109,204 | |||||
See Notes to Consolidated Financial Statements
F-5
NORTHWESTERN CORPORATION
CONSOLIDATED BALANCE SHEETS
(in thousands, except per share amounts)
Year Ended December 31, | |||||||
2016 | 2015 | ||||||
ASSETS | |||||||
Current Assets: | |||||||
Cash and cash equivalents | $ | 5,079 | $ | 11,980 | |||
Restricted cash | 4,426 | 6,634 | |||||
Accounts receivable, net | 159,556 | 154,410 | |||||
Inventories | 49,206 | 53,458 | |||||
Regulatory assets | 50,041 | 51,348 | |||||
Other | 11,887 | 8,830 | |||||
Total current assets | 280,195 | 286,660 | |||||
Property, plant, and equipment, net | 4,214,892 | 4,059,499 | |||||
Goodwill | 357,586 | 357,586 | |||||
Regulatory assets | 602,943 | 517,223 | |||||
Other noncurrent assets | 43,705 | 43,727 | |||||
Total Assets | $ | 5,499,321 | $ | 5,264,695 | |||
LIABILITIES AND SHAREHOLDERS' EQUITY | |||||||
Current Liabilities: | |||||||
Current maturities of capital leases | $ | 1,979 | $ | 1,837 | |||
Short-term borrowings | 300,811 | 229,874 | |||||
Accounts payable | 79,311 | 74,511 | |||||
Accrued expenses | 205,370 | 183,988 | |||||
Regulatory liabilities | 26,361 | 80,990 | |||||
Total current liabilities | 613,832 | 571,200 | |||||
Long-term capital leases | 24,346 | 26,325 | |||||
Long-term debt | 1,793,338 | 1,768,183 | |||||
Deferred income taxes | 575,582 | 501,532 | |||||
Noncurrent regulatory liabilities | 396,225 | 378,711 | |||||
Other noncurrent liabilities | 419,771 | 418,570 | |||||
Total Liabilities | 3,823,094 | 3,664,521 | |||||
Commitments and Contingencies (Note 19) | |||||||
Shareholders' Equity: | |||||||
Common stock, par value $0.01; authorized 200,000,000 shares; issued and outstanding 51,957,840 and 48,331,675, respectively; Preferred stock, par value $0.01; authorized 50,000,000 shares; none issued | 520 | 518 | |||||
Treasury stock at cost | (95,769 | ) | (93,948 | ) | |||
Paid-in capital | 1,384,271 | 1,376,291 | |||||
Retained earnings | 396,919 | 325,909 | |||||
Accumulated other comprehensive loss | (9,714 | ) | (8,596 | ) | |||
Total Shareholders' Equity | 1,676,227 | 1,600,174 | |||||
Total Liabilities and Shareholders' Equity | $ | 5,499,321 | $ | 5,264,695 | |||
See Notes to Consolidated Financial Statements
F-6
NORTHWESTERN CORPORATION
CONSOLIDATED STATEMENTS OF CASH FLOWS
(in thousands)
Year Ended December 31, | |||||||||||
2016 | 2015 | 2014 | |||||||||
OPERATING ACTIVITIES: | |||||||||||
Net Income | $ | 164,172 | $ | 151,209 | $ | 120,686 | |||||
Items not affecting cash: | |||||||||||
Depreciation and depletion | 159,336 | 144,702 | 123,776 | ||||||||
Amortization of debt issue costs, discount and deferred hedge gain | 2,117 | 2,258 | 5,033 | ||||||||
Stock-based compensation costs | 6,731 | 5,082 | 3,262 | ||||||||
Equity portion of allowance for funds used during construction | (4,589 | ) | (8,684 | ) | (6,554 | ) | |||||
Gain on disposition of assets | (15 | ) | (20 | ) | (1,330 | ) | |||||
Deferred income taxes | (8,184 | ) | 33,886 | (9,612 | ) | ||||||
Changes in current assets and liabilities: | |||||||||||
Restricted cash | 2,208 | 6,920 | (6,408 | ) | |||||||
Accounts receivable | (5,146 | ) | 9,069 | 12,622 | |||||||
Inventories | 4,252 | 1,636 | 747 | ||||||||
Other current assets | (2,384 | ) | 5,514 | 4,201 | |||||||
Accounts payable | 3,639 | (11,169 | ) | (9,565 | ) | ||||||
Accrued expenses | 25,124 | (22,738 | ) | 8,530 | |||||||
Regulatory assets | 1,871 | (3,974 | ) | (8,952 | ) | ||||||
Regulatory liabilities | (54,629 | ) | 24,821 | 9,763 | |||||||
Other noncurrent assets | (7,311 | ) | (5,584 | ) | 2,853 | ||||||
Other noncurrent liabilities | 1,820 | 6,890 | 987 | ||||||||
Cash Provided by Operating Activities | 289,012 | 339,818 | 250,039 | ||||||||
INVESTING ACTIVITIES: | |||||||||||
Property, plant, and equipment additions | (287,901 | ) | (283,705 | ) | (270,384 | ) | |||||
Acquisitions | — | (146,668 | ) | (903,573 | ) | ||||||
Proceeds from sale of assets | 1,354 | 30,209 | 1,535 | ||||||||
Change in restricted cash | — | 16,108 | (16,358 | ) | |||||||
Investment in New Market Tax Credit program | — | — | (18,169 | ) | |||||||
Cash Used in Investing Activities | (286,547 | ) | (384,056 | ) | (1,206,949 | ) | |||||
FINANCING ACTIVITIES: | |||||||||||
Dividends on common stock | (95,765 | ) | (90,058 | ) | (65,019 | ) | |||||
Proceeds from issuance of common stock, net | — | 56,651 | 399,207 | ||||||||
Issuance of long-term debt | 249,660 | 270,000 | 505,789 | ||||||||
Repayment of long-term debt | (225,205 | ) | (150,025 | ) | (90 | ) | |||||
Issuances (repayments) of short-term borrowings, net | 70,937 | (37,966 | ) | 126,890 | |||||||
Treasury stock activity | (561 | ) | (664 | ) | (814 | ) | |||||
Financing costs | (8,432 | ) | (12,082 | ) | (5,248 | ) | |||||
Cash (Used In) Provided by Financing Activities | (9,366 | ) | 35,856 | 960,715 | |||||||
Net (Decrease) Increase in Cash and Cash Equivalents | (6,901 | ) | (8,382 | ) | 3,805 | ||||||
Cash and Cash Equivalents, beginning of period | 11,980 | 20,362 | 16,557 | ||||||||
Cash and Cash Equivalents, end of period | $ | 5,079 | $ | 11,980 | $ | 20,362 | |||||
See Notes to Consolidated Financial Statements
F-7
NORTHWESTERN CORPORATION
CONSOLIDATED STATEMENTS OF COMMON SHAREHOLDERS' EQUITY
(in thousands, except per share data)
Number of Common Shares | Number of Treasury Shares | Common Stock | Paid in Capital | Treasury Stock | Retained Earnings | Accumulated Other Comprehensive (Loss) Income | Total Shareholders' Equity | ||||||||||||||||||||||
Balance at December 31, 2013 | 42,340 | 3,595 | $ | 423 | $ | 910,184 | $ | (91,744 | ) | $ | 209,091 | $ | 2,716 | $ | 1,030,670 | ||||||||||||||
Net income | — | — | — | — | — | 120,686 | — | 120,686 | |||||||||||||||||||||
Foreign currency translation adjustment | — | — | — | — | — | — | 265 | 265 | |||||||||||||||||||||
Reclassification of net gains on derivative instruments from OCI to net income, net of tax | — | — | — | — | — | — | (684 | ) | (684 | ) | |||||||||||||||||||
Realized loss on cash flow hedging derivatives | — | — | — | — | — | — | (11,145 | ) | (11,145 | ) | |||||||||||||||||||
Postretirement medical liability adjustment, net of tax | — | — | — | — | — | — | 82 | 82 | |||||||||||||||||||||
Stock based compensation | 119 | 12 | — | 4,288 | (865 | ) | — | — | 3,423 | ||||||||||||||||||||
Issuance of shares | 8,063 | — | 82 | 399,372 | 51 | — | — | 399,505 | |||||||||||||||||||||
Dividends on common stock ($1.60 per share) | — | — | — | — | — | (65,019 | ) | — | (65,019 | ) | |||||||||||||||||||
Balance at December 31, 2014 | 50,522 | 3,607 | $ | 505 | $ | 1,313,844 | $ | (92,558 | ) | $ | 264,758 | $ | (8,766 | ) | $ | 1,477,783 | |||||||||||||
Net income | — | — | — | — | — | 151,209 | — | 151,209 | |||||||||||||||||||||
Foreign currency translation adjustment | — | — | — | — | — | — | 558 | 558 | |||||||||||||||||||||
Reclassification of net gains on derivative instruments from OCI to net income, net of tax | — | — | — | — | — | — | (698 | ) | (698 | ) | |||||||||||||||||||
Postretirement medical liability adjustment, net of tax | — | — | — | — | — | — | 310 | 310 | |||||||||||||||||||||
Stock based compensation | 167 | 10 | — | 4,345 | (1,856 | ) | — | — | 2,489 | ||||||||||||||||||||
Issuance of shares | 1,100 | — | 13 | 58,102 | 466 | — | — | 58,581 | |||||||||||||||||||||
Dividends on common stock ($1.92 per share) | — | — | — | — | — | (90,058 | ) | — | (90,058 | ) | |||||||||||||||||||
Balance at December 31, 2015 | 51,789 | 3,617 | $ | 518 | $ | 1,376,291 | $ | (93,948 | ) | $ | 325,909 | $ | (8,596 | ) | $ | 1,600,174 | |||||||||||||
Net income | — | — | — | — | — | 164,172 | — | 164,172 | |||||||||||||||||||||
Accounting standard adoption (1) | — | — | — | — | — | 2,603 | — | 2,603 | |||||||||||||||||||||
Foreign currency translation adjustment | — | — | — | — | — | — | 25 | 25 | |||||||||||||||||||||
Reclassification of net gains on derivative instruments from OCI to net income, net of tax | — | — | — | — | — | — | (1,338 | ) | (1,338 | ) | |||||||||||||||||||
Postretirement medical liability adjustment, net of tax | — | — | — | — | — | — | 195 | 195 | |||||||||||||||||||||
Stock based compensation | 169 | 9 | — | 6,690 | (2,874 | ) | — | — | 3,816 | ||||||||||||||||||||
Issuance of shares | — | — | 2 | 1,290 | 1,053 | — | — | 2,345 | |||||||||||||||||||||
Dividends on common stock ($2.00 per share) | — | — | — | — | — | (95,765 | ) | — | (95,765 | ) | |||||||||||||||||||
Balance at December 31, 2016 | 51,958 | 3,626 | $ | 520 | $ | 1,384,271 | $ | (95,769 | ) | $ | 396,919 | $ | (9,714 | ) | $ | 1,676,227 | |||||||||||||
____________________
(1) We elected to early adopt the provisions of Financial Accounting Standards Update No. 2016-09, Improvements to Employee Share-Based Payment Accounting, in the fourth quarter of 2016 as of January 1, 2016, resulting in a cumulative-effect adjustment to Retained Earnings for excess tax benefits. See Note 2 - Significant Accounting Policies, for further discussion of the impacts of this standard.
See Notes to Consolidated Financial Statements
F-8
NOTES TO CONSOLIDATED FINANCIAL STATEMENTS
(1) Nature of Operations and Basis of Consolidation | ||||
NorthWestern Corporation, doing business as NorthWestern Energy, provides electricity and natural gas to approximately 709,600 customers in Montana, South Dakota and Nebraska. We have generated and distributed electricity in South Dakota and distributed natural gas in South Dakota and Nebraska since 1923 and have generated and distributed electricity and distributed natural gas in Montana since 2002.
The Consolidated Financial Statements for the periods included herein have been prepared by NorthWestern Corporation (NorthWestern, we or us), pursuant to the rules and regulations of the SEC. The preparation of financial statements in conformity with GAAP requires management to make estimates and assumptions that may affect the reported amounts of assets, liabilities, revenues and expenses during the reporting period. Actual results could differ from those estimates. The accompanying Consolidated Financial Statements include our accounts together with those of our wholly and majority-owned or controlled subsidiaries. All intercompany balances and transactions have been eliminated from the Consolidated Financial Statements. Events occurring subsequent to December 31, 2016, have been evaluated as to their potential impact to the Consolidated Financial Statements through the date of issuance.
Variable Interest Entities
A reporting company is required to consolidate a variable interest entity (VIE) as its primary beneficiary, which means it has a controlling financial interest, when it has both the power to direct the activities of the VIE that most significantly impact the VIE's economic performance, and the obligation to absorb losses or the right to receive benefits from the VIE that could potentially be significant to the VIE. An entity is considered to be a VIE when its total equity investment at risk is not sufficient to permit the entity to finance its activities without additional subordinated financial support, or its equity investors, as a group, lack the characteristics of having a controlling financial interest. The determination of whether a company is required to consolidate an entity is based on, among other things, an entity's purpose and design and a company's ability to direct the activities of the entity that most significantly impact the entity's economic performance.
Certain long-term purchase power and tolling contracts may be considered variable interests. We have various long-term purchase power contracts with other utilities and certain QF plants. We identified one QF contract that may constitute a VIE. We entered into a power purchase contract in 1984 with this 35 MW coal-fired QF to purchase substantially all of the facility's capacity and electrical output over a substantial portion of its estimated useful life. We absorb a portion of the facility's variability through annual changes to the price we pay per MWH (energy payment). After making exhaustive efforts, we have been unable to obtain the information from the facility necessary to determine whether the facility is a VIE or whether we are the primary beneficiary of the facility. The contract with the facility contains no provision which legally obligates the facility to release this information. We have accounted for this QF contract as an executory contract. Based on the current contract terms with this QF, our estimated gross contractual payments aggregate approximately $246.3 million through 2024. For further discussion of our gross QF liability, see Note 19 - Commitments and Contingencies. During the years ended December 31, 2016, 2015 and 2014 purchases from this QF were approximately $25.5 million, $24.3 million, and $24.4 million, respectively.
(2) Significant Accounting Policies | ||||
Use of Estimates
The preparation of financial statements in conformity with GAAP requires us to make estimates and assumptions that affect the reported amounts of assets and liabilities and disclosure of contingent assets and liabilities at the date of the financial statements and the reported amounts of revenues and expenses during the reporting period. Estimates are used for such items as long-lived asset values and impairment charges, long-lived asset useful lives, tax provisions, asset retirement obligations, uncollectible accounts, our QF liability, environmental costs, unbilled revenues and actuarially determined benefit costs. We revise the recorded estimates when we receive better information or when we can determine actual amounts. Those revisions can affect operating results.
F-9
Revenue Recognition
Customers are billed monthly on a cycle basis. To match revenues with associated expenses, we accrue unbilled revenues for electrical and natural gas services delivered to customers, but not yet billed at month-end.
Cash Equivalents
We consider all highly liquid investments with maturities of three months or less at the time of purchase to be cash equivalents.
Restricted Cash
Restricted cash consists primarily of funds held in trust accounts to satisfy the requirements of certain stipulation agreements and insurance reserve requirements.
Accounts Receivable, Net
Accounts receivable are net of allowances for uncollectible accounts of $2.9 million and $4.0 million at December 31, 2016 and December 31, 2015, respectively. Receivables include unbilled revenues of $80.4 million and $74.5 million at December 31, 2016 and December 31, 2015, respectively.
Inventories
Inventories are stated at average cost. Inventory consisted of the following (in thousands):
December 31, | |||
2016 | 2015 | ||
Materials and supplies | $31,602 | $31,789 | |
Storage gas and fuel | 17,604 | 21,669 | |
Total Inventory | $49,206 | $53,458 | |
Regulation of Utility Operations
Our regulated operations are subject to the provisions of ASC 980. Regulated accounting is appropriate provided that (i) rates are established by or subject to approval by independent, third-party regulators, (ii) rates are designed to recover the specific enterprise's cost of service, and (iii) in view of demand for service, it is reasonable to assume that rates are set at levels that will recover costs and can be charged to and collected from customers.
Our Consolidated Financial Statements reflect the effects of the different rate making principles followed by the jurisdictions regulating us. The economic effects of regulation can result in regulated companies recording costs that have been, or are deemed probable to be, allowed in the ratemaking process in a period different from the period in which the costs would be charged to expense by an unregulated enterprise. When this occurs, costs are deferred as regulatory assets and recorded as expenses in the periods when those same amounts are reflected in rates. Additionally, regulators can impose liabilities upon a regulated company for amounts previously collected from customers and for amounts that are expected to be refunded to customers (regulatory liabilities).
If we were required to terminate the application of these provisions to our regulated operations, all such deferred amounts would be recognized in the Consolidated Statements of Income at that time. This would result in a charge to earnings, net of applicable income taxes, which could be material. In addition, we would determine any impairment to the carrying costs of deregulated plant and inventory assets.
Derivative Financial Instruments
We account for derivative instruments in accordance with ASC 815, Derivatives and Hedging. All derivatives are recognized in the Consolidated Balance Sheets at their fair value unless they qualify for certain exceptions, including the normal purchases and normal sales exception. Additionally, derivatives that qualify and are designated for hedge accounting are classified as either hedges of the fair value of a recognized asset or liability or of an unrecognized firm commitment (fair-value
F-10
hedge) or hedges of a forecasted transaction or the variability of cash flows to be received or paid related to a recognized asset or liability (cash-flow hedge). For fair-value hedges, changes in fair values for both the derivative and the underlying hedged exposure are recognized in earnings each period. For cash-flow hedges, the portion of the derivative gain or loss that is effective in offsetting the change in the cost or value of the underlying exposure is deferred in accumulated other comprehensive income (AOCI) and later reclassified into earnings when the underlying transaction occurs. Gains and losses from the ineffective portion of any hedge are recognized in earnings immediately. For other derivative contracts that do not qualify or are not designated for hedge accounting, changes in the fair value of the derivatives are recognized in earnings each period. Cash inflows and outflows related to derivative instruments are included as a component of operating, investing or financing cash flows in the Consolidated Statements of Cash Flows, depending on the underlying nature of the hedged items.
Revenues and expenses on contracts that are designated as normal purchases and normal sales are recognized when the underlying physical transaction is completed. While these contracts are considered derivative financial instruments, they are not required to be recorded at fair value, but on an accrual basis of accounting. Normal purchases and normal sales are contracts where physical delivery is probable, quantities are expected to be used or sold in the normal course of business over a reasonable period of time, and price is not tied to an unrelated underlying derivative. As part of our regulated electric and gas operations, we enter into contracts to buy and sell energy to meet the requirements of our customers. These contracts include short-term and long-term commitments to purchase and sell energy in the retail and wholesale markets with the intent and ability to deliver or take delivery. If it were determined that a transaction designated as a normal purchase or a normal sale no longer met the exceptions, the fair value of the related contract would be reflected as an asset or liability and immediately recognized through earnings. See Note 9, Risk Management and Hedging Activities, for further discussion of our derivative activity.
Property, Plant and Equipment
Property, plant and equipment are stated at original cost, including contracted services, direct labor and material, AFUDC, and indirect charges for engineering, supervision and similar overhead items. All expenditures for maintenance and repairs of utility property, plant and equipment are charged to the appropriate maintenance expense accounts. A betterment or replacement of a unit of property is accounted for as an addition and retirement of utility plant. At the time of such a retirement, the accumulated provision for depreciation is charged with the original cost of the property retired and also for the net cost of removal. Also included in plant and equipment are assets under capital lease, which are stated at the present value of minimum lease payments.
AFUDC represents the cost of financing construction projects with borrowed funds and equity funds. While cash is not realized currently from such allowance, it is realized under the ratemaking process over the service life of the related property through increased revenues resulting from a higher rate base and higher depreciation expense. The component of AFUDC attributable to borrowed funds is included as a reduction to interest expense, while the equity component is included in other income. We determine the rate used to compute AFUDC in accordance with a formula established by the FERC. This rate averaged 7.2%, 7.5%, and 8.0%, for Montana and South Dakota for 2016, 2015, and 2014, respectively. AFUDC capitalized totaled $7.0 million for the year ended December 31, 2016, $13.6 million for the year ended December 31, 2015 and $10.8 million for the year ended December 31, 2014 for Montana and South Dakota combined.
We record provisions for depreciation at amounts substantially equivalent to calculations made on a straight-line method by applying various rates based on useful lives of the various classes of properties (ranging from three to 50 years) determined from engineering studies. As a percentage of the depreciable utility plant at the beginning of the year, our provision for depreciation of utility plant was approximately 3.0%, 3.3%, and 2.9% for 2016, 2015, and 2014, respectively.
Depreciation rates include a provision for our share of the estimated costs to decommission our jointly owned plants at the end of the useful life. The annual provision for such costs is included in depreciation expense, while the accumulated provisions are included in noncurrent regulatory liabilities.
F-11
Other Noncurrent Liabilities
Other noncurrent liabilities consisted of the following (in thousands):
December 31, | |||
2016 | 2015 | ||
Future QF obligation, net | $134,324 | $138,310 | |
Pension and other employee benefits | 120,122 | 131,887 | |
Environmental | 30,501 | 30,226 | |
Customer advances | 40,209 | 36,046 | |
Asset retirement obligations | 39,402 | 35,532 | |
Other | 55,213 | 46,569 | |
Total | $419,771 | $418,570 | |
Income Taxes
Exposures exist related to various tax filing positions, which may require an extended period of time to resolve and may result in income tax adjustments by taxing authorities. We have reduced deferred tax assets or established liabilities based on our best estimate of future probable adjustments related to these exposures. On a quarterly basis, we evaluate exposures in light of any additional information and make adjustments as necessary to reflect the best estimate of the future outcomes. We believe our deferred tax assets and established liabilities are appropriate for estimated exposures; however, actual results may differ from these estimates. The resolution of tax matters in a particular future period could have a material impact on our Consolidated Income Statements and provision for income taxes.
Environmental Costs
We record environmental costs when it is probable we are liable for the costs and we can reasonably estimate the liability. We may defer costs as a regulatory asset if there is precedent for recovering similar costs from customers in rates. Otherwise, we expense the costs. If an environmental cost is related to facilities we currently use, such as pollution control equipment, then we may capitalize and depreciate the costs over the remaining life of the asset, assuming the costs are recoverable in future rates or future cash flows.
Our remediation cost estimates are based on the use of an environmental consultant, our experience, our assessment of the current situation and the technology currently available for use in the remediation. We regularly adjust the recorded costs as we revise estimates and as remediation proceeds. If we are one of several designated responsible parties, then we estimate and record only our share of the cost.
Accounting Standards Issued
In May 2014, the Financial Accounting Standards Board (FASB) issued accounting guidance on the recognition of revenue from contracts with customers, which will supersede nearly all existing revenue recognition guidance under GAAP. Under the new standard, entities will recognize revenue to depict the transfer of goods and services to customers in amounts that reflect the payment to which the entity expects to be entitled in exchange for those goods or services. The guidance also requires additional disclosure about the nature, amount, timing and uncertainty of revenue and cash flows from an entity’s contracts with customers. The FASB delayed the effective date of this guidance to the first quarter of 2018, with early adoption permitted as of the original effective date of the first quarter of 2017. We are in the process of evaluating the impact of adoption of this new guidance on our Financial Statements and disclosures. Our revenues are primarily from tariff based sales, which are in the scope of the standard. We provide gas or electricity to customers under these tariffs without a defined contractual term (‘at-will’). We expect that the revenue from these arrangements will be equivalent to the electricity or gas supplied and billed in that period (including estimated billings). As such, we do not expect that there will be a significant shift in the timing or pattern of revenue recognition for such sales. The evaluation of other revenue streams is ongoing, including those tied to longer term contractual commitments. We are also selecting the transition method, either full or modified retrospective, and developing an approach to complying with the disclosure requirements. In addition, there are open industry related transition issues being considered that may change whether the guidance has significant impact on us. We will continue to assess the guidance and expect to conclude our analysis of expected impact during the first half of 2017.
F-12
In February 2016, the FASB issued revised guidance on accounting for leases. The new standard requires a lessee to recognize in the balance sheet a liability to make lease payments (the lease liability) and a right-of-use asset representing its right to use the underlying asset for the lease term for all leases with terms longer than 12 months. Leases with a term of 12 months or less will be accounted for similar to existing guidance for operating leases. Recognition, measurement and presentation of expenses will depend on classification as a finance or operating lease. The new guidance will be effective for us in our first quarter of 2019 and early adoption is permitted. A modified retrospective transition approach is required for lessees for capital and operating leases existing at, or entered into after, the beginning of the earliest comparative period presented in the financial statements. We are currently evaluating the impact of adoption of this guidance. We do not have a significant amount of capital or operating leases. Therefore, based on our initial analysis we do not expect this guidance to have a significant impact on our Financial Statements and disclosures other than an expected increase in assets and liabilities.
In August 2016, the FASB issued guidance that addresses eight classification issues related to the presentation of cash receipts and cash payments in the statement of cash flows. The new guidance will be effective for us in our first quarter of 2018, with early adoption permitted. We are currently evaluating the impact of adoption of this guidance on our Statement of Cash Flows.
In November 2016, the FASB issued guidance that a statement of cash flows explain the change during the period in the total of cash, cash equivalents, and amounts generally described as restricted cash or restricted cash equivalents. The new guidance will be effective for us in our first quarter of 2018, with early adoption permitted. We are currently evaluating the impact of adoption of this guidance on our Statement of Cash Flows.
Accounting Standards Adopted
In April 2015, the FASB issued accounting guidance that changes the presentation of debt issuance costs. The core principle of this revised accounting guidance is that debt issuance costs are not assets, but adjustments to the carrying cost of debt. During the first quarter of 2016, we retrospectively adopted this guidance. The implementation of this accounting standard resulted in a reduction of other noncurrent assets and long-term debt of $13.9 million in the Consolidated Balance Sheet as of December 31, 2015.
In March 2016, the FASB issued Financial Accounting Standards Update No. 2016-09 (ASU 2016-09), Improvements to Employee Share-Based Payment Accounting, revising certain elements of the accounting for share-based payments. The new standard is intended to simplify several aspects of the accounting for share-based payment award transactions including: (a) income tax consequences; (b) classification of awards as either equity or liabilities; and (c) classification on the statement of cash flows. If an entity early adopts the amendments in an interim period, any adjustments should be reflected as of the beginning of the fiscal year that includes that interim period. We elected to early adopt in the fourth quarter of 2016 as of January 1, 2016. For each share award, we determine whether the difference between the deduction for tax purposes and the compensation cost recognized in the Consolidated Financial Statements results in either an excess tax benefit or an excess tax deficit. Previously, excess tax benefits were recognized in Paid-in capital on our Consolidated Balance Sheet. The new guidance increases income statement volatility by requiring all excess tax benefits and deficits to be recognized in income taxes and treated as discrete items in the period in which they occur. During the fourth quarter of 2016, excess tax benefits of $1.8 million related to vested share-based compensation awards were recorded as a decrease in income tax expense in the Consolidated Statement of Income. These provisions were adopted prospectively. We applied the modified-retrospective approach to excess tax benefits from prior periods, and recorded a cumulative-effect adjustment to retained earnings as of the date of adoption of $2.6 million in the Consolidated Balance Sheets. Additionally, the cash flow presentation guidance is consistent with our historical presentation, and therefore did not have an impact. Finally, we did not change our accounting policy with regard to estimating forfeitures at the date of grant.
F-13
Supplemental Cash Flow Information
Year Ended December 31, | |||||||||||
2016 | 2015 | 2014 | |||||||||
(in thousands) | |||||||||||
Cash (received) paid for: | |||||||||||
Income taxes | $ | (2,922 | ) | $ | (1,284 | ) | $ | 35 | |||
Interest | 84,953 | 81,572 | 63,482 | ||||||||
Significant non-cash transactions: | |||||||||||
Capital expenditures included in trade accounts payable | 13,783 | 12,834 | 8,555 | ||||||||
(3) Acquisitions | ||||
South Dakota Wind Generation
In September 2015, we completed the purchase of the 80 MW Beethoven wind project near Tripp, South Dakota, for approximately $143 million. The Beethoven purchase price was allocated based on the estimated fair values of the assets acquired and liabilities assumed at the date of the acquisition as follows:
Purchase Price Allocation | |||
Assets Acquired | |||
Property Plant and Equipment | $ | 143.0 | |
Other Prepayments | 0.1 | ||
Total Assets Acquired | 143.1 | ||
Liabilities Assumed | |||
Other Current Liabilities | 0.3 | ||
Total Liabilities Assumed | 0.3 | ||
Total Purchase Price | $ | 142.8 | |
The purchase accounting was completed during the fourth quarter of 2015.
(4) Regulatory Matters | ||||
Montana Natural Gas Delivery and Production Rate Filing
In September 2016, we filed a natural gas rate case with the Montana Public Service Commission (MPSC) requesting an annual increase to natural gas rates of approximately $10.9 million, which includes approximately $7.4 million for delivery service and approximately $3.5 million for natural gas production. Our request was based on a return on equity of 10.35%, rate base of $432.1 million, and a capital structure of 53% debt and 47% equity. This filing includes a request for cost-recovery of two natural gas production fields acquired in August 2012 and December 2013 in northern Montana's Bear Paw Basin, which are recovered in customer rates on an interim basis, and a request that these fields be placed in permanent rates based on the actual cost of production.
Finally, we requested that approximately $5.6 million of the rate increase for delivery service be approved on an interim basis to allow recovery of costs prior to the conclusion of the full rate case. We expect to receive a decision on our interim request by the end of the first quarter of 2017. The MPSC has nine months from the filing date in which to issue a final decision in this docket. A hearing is scheduled for May 2017.
Montana Electric and Natural Gas Tracker Filings
F-14
Each year we submit an electric and natural gas tracker filing for recovery of supply costs for the 12-month period ended June 30 and for the projected supply costs for the next 12-month period. The MPSC reviews such filings and makes its cost recovery determination based on whether or not our supply procurement activities were prudent.
During the second quarter of 2016, we filed our 2016 annual electric and natural gas tracker filings for the 2015/2016 tracker period. The MPSC issued orders in July 2016 approving the filings on an interim basis. In November 2016, the MPSC issued a final order approving the natural gas interim rates.
Electric Trackers - 2012/2013 - 2013/2014 (Consolidated Docket) and 2014/2015 (2015 Tracker) - The MPSC held a work session in March 2016 and directed staff to draft a final order in our Consolidated Docket that reflects a disallowance of both replacement power costs from a 2013 outage at Colstrip Unit 4 and portfolio modeling costs in each of the periods. On the same day, in a separate work session, the MPSC directed staff to draft a final order in the 2015 Tracker that approved a stipulation between us and the Montana Consumer Counsel, but disallowed portfolio modeling costs. Based on the March 2016 work sessions, we recorded a disallowance during the first quarter of 2016 totaling approximately $10.3 million, which included $8.2 million of replacement power costs and $2.1 million of modeling costs.
In April 2016, we received the final written order in the 2015 Tracker, which was consistent with the work session. In May 2016, we received the final written order in the Consolidated Docket. The written order upheld the March 2016 decision to disallow Colstrip Unit 4 replacement power costs and clarified the disallowance of modeling costs, resulting in a reduction of the disallowance of $0.8 million, which was reflected as a reduction in cost of sales in the second quarter of 2016. Based on the final orders, the impact of the disallowance totals $12.4 million, which includes $9.5 million of replacement power and modeling costs, and $2.9 million of interest and is recorded in the Consolidated Statement of Income for the twelve months ended December 31, 2016.
In June 2016, we filed an appeal of the 2015 Tracker decision regarding the disallowance of portfolio modeling costs in Montana District Court (Lewis & Clark County). Also, in September 2016, we appealed the MPSC’s decisions in the Consolidated Docket regarding the disallowance of Colstrip Unit 4 replacement power costs and the modeling/planning costs, arguing that these decisions were arbitrary and capricious, and violated Montana law. We brought this action in Montana District Court, as well (Yellowstone County). The briefing in this case is scheduled to conclude by the end of the second quarter of 2017. While the courts are not obligated to rule on these appeals within a certain period of time, based on our experience, we believe we are likely to receive orders from the courts in these matters within 9-20 months of filing.
Electric and Natural Gas Lost Revenue Adjustment Mechanism - In 2005, the MPSC approved an energy efficiency program, by which we recovered on an after-the-fact basis a portion of our fixed costs that would otherwise have been collected in kilowatt hour sales lost due to the implementation of energy saving measures. In an order issued in October 2013 related to our 2011/2012 electric supply tracker, the MPSC required us to lower the calculated lost revenue recovery and imposed a new burden of proof on us for future recovery. We appealed the October 2013 order to Montana District Court, which led to a docket being initiated in June 2014 by the MPSC to review lost revenue policy issues. In October 2015, the MPSC issued an order to eliminate the lost revenue adjustment mechanism prospectively effective December 1, 2015.
Based on the October 2013 MPSC order, for the period July 1, 2012 through November 30, 2015, we recognized $7.1 million of lost revenues for each annual electric supply tracker period and deferred the remaining $14.2 million of efficiency efforts collected through the trackers pending final approval of the open tracker filings discussed above. During the second quarter of 2016, we received final written orders resolving our prior period open tracker dockets. These orders allowed the recovery of lost revenues included in each tracker period. As a result, we recognized revenue deferred during the July 2012 - November 2015 periods of $14.2 million in the Consolidated Statement of Income in the second quarter of 2016.
Hydro Compliance Filing
In December 2015, we submitted the required compliance filing associated with our purchase of Montana hydro generation assets in 2014, to remove the Kerr Project from cost of service, adjust for actual revenue credits and increase property taxes to actual amounts. In January 2016, the MPSC approved an interim adjustment to our hydro rates based on the compliance filing, and opened a separate contested docket requesting additional detail on the adjustment to rates due to the conveyance of the Kerr Project. The MPSC identified additional issues and requested information. A hearing was held in September 2016. The only contested issue at the hearing was the level of administrative and general expenses that should be deducted from the approved revenue requirement due to the transfer of the Kerr Project.
In December 2016, the MPSC issued a final order in this compliance filing reducing the annual amount we are allowed to recover in hydro generation rates by approximately $1.2 million. As a result, in the fourth quarter of 2016 we reduced revenue
F-15
by $1.5 million in the Consolidated Statement of Income. As of December 31, 2016, we have cumulative deferred revenue of approximately $2.6 million related to the change in rates from the Kerr conveyance that we expect to refund to customers by the end of the first quarter 2017. In addition, the order requires us to indicate by April 30, 2017, whether we intend to file a Montana electric rate case based on a 2016 test year. The Commission indicated that if we do not intend to file a rate case in 2017, it may require us to make an additional financial filing that would facilitate the Commission assessing whether additional action would be required to fulfill its obligation to authorize just and reasonable rates.
FERC Filing - Dave Gates Generating Station at Mill Creek (DGGS)
In May 2016, we received an order from the Federal Energy Regulatory Commission (FERC) denying a May 2014 request for rehearing and requiring us to make refunds. The request for rehearing challenged a September 2012 FERC Administrative Law Judge's (ALJ) initial decision regarding cost allocation at DGGS between retail and wholesale customers. This decision concluded that only a portion of these costs should be allocated to FERC jurisdictional customers. We had cumulative deferred revenue of approximately $27.3 million, consistent with the ALJ's initial decision, which was refunded to wholesale and choice customers in June 2016 in accordance with the FERC order.
In June 2016, we filed a petition for review of the FERC's May 2016 order with the United States Circuit Court of Appeals for the District of Columbia Circuit. A briefing schedule has been established, with final briefs due by the end of the first quarter of 2017. We do not expect a decision in this matter until the last quarter of 2017, at the earliest.
The FERC order was assessed as a triggering event as to whether an impairment charge should be recorded with respect to DGGS. As of December 31, 2016, the DGGS net property, plant and equipment is approximately $158 million. DGGS previously provided only regulation service, which is the basis for the cost allocation in our previous MPSC and FERC filings. With the addition of owned hydro generation in November 2014, the utilization of DGGS has shifted to additional alternative uses, optimizing our generation portfolio. In support of our biennial electricity supply resource procurement plan that we filed with the MPSC in March 2016, we conducted a portfolio optimization analysis to evaluate options to use DGGS in combination with other generation resources. This analysis indicates DGGS provides cost-effective products necessary to operate our Montana electricity portfolio, including regulation, load following, peaking services and other ancillary products such as contingency reserves, which should guide future cost recovery.
The cost recovery of any alternative use of DGGS would be subject to regulatory approval and we cannot provide assurance of such approval. We do not believe an impairment loss is probable at this time; however, we will continue to evaluate recovery of this asset in the future as facts and circumstances change.
F-16
(5) Regulatory Assets and Liabilities | ||||
We prepare our Consolidated Financial Statements in accordance with the provisions of ASC 980, as discussed in Note 2 - Significant Accounting Policies. Pursuant to this guidance, certain expenses and credits, normally reflected in income as incurred, are deferred and recognized when included in rates and recovered from or refunded to the customers. Regulatory assets and liabilities are recorded based on management's assessment that it is probable that a cost will be recovered or that an obligation has been incurred. Accordingly, we have recorded the following major classifications of regulatory assets and liabilities that will be recognized in expenses and revenues in future periods when the matching revenues are collected or refunded. Of these regulatory assets and liabilities, energy supply costs are the only items earning a rate of return. The remaining regulatory items have corresponding assets and liabilities that will be paid for or refunded in future periods.
Note Reference | Remaining Amortization Period | December 31, | ||||||||||
2016 | 2015 | |||||||||||
(in thousands) | ||||||||||||
Income taxes | 13 | Plant Lives | $ | 411,546 | $ | 319,973 | ||||||
Pension | 15 | Undetermined | 127,133 | 135,057 | ||||||||
Deferred financing costs | Various | 24,810 | 19,978 | |||||||||
Employee related benefits | 15 | Undetermined | 20,256 | 21,055 | ||||||||
State & local taxes & fees | Various | 17,838 | 7,724 | |||||||||
Supply costs | 1 Year | 16,809 | 29,604 | |||||||||
Environmental clean-up | 19 | Various | 13,601 | 14,237 | ||||||||
Distribution infrastructure projects | 1 Year | 3,136 | 6,272 | |||||||||
Other | — | Various | 17,855 | 14,671 | ||||||||
Total Regulatory Assets | $ | 652,984 | $ | 568,571 | ||||||||
Removal cost | 7 | Various | $ | 386,373 | $ | 368,467 | ||||||
Supply costs | 1 Year | 14,041 | 13,685 | |||||||||
Gas storage sales | 23 Years | 9,569 | 9,990 | |||||||||
Environmental clean-up | Various | 6,383 | 7,089 | |||||||||
Deferred revenue | 4 | 1 Year | 5,066 | 58,868 | ||||||||
State & local taxes & fees | 1 Year | 1,154 | 1,566 | |||||||||
Other | Various | — | 36 | |||||||||
Total Regulatory Liabilities | $ | 422,586 | $ | 459,701 | ||||||||
Income Taxes
Tax assets primarily reflect the effects of plant related temporary differences such as flow-through of depreciation, repairs related deductions, removal costs, capitalized interest and contributions in aid of construction that we will recover or refund in future rates. We amortize these amounts as temporary differences reverse.
Pension and Employee Related Benefits
We recognize the unfunded portion of plan benefit obligations in the Consolidated Balance Sheets, which is remeasured at each year end, with a corresponding adjustment to regulatory assets/liabilities as the costs associated with these plans are recovered in rates. The portion of the regulatory asset related to our Montana pension plan will amortize as cash funding amounts exceed accrual expense under GAAP. The SDPUC allows recovery of pension costs on an accrual basis. The MPSC allows recovery of postretirement benefit costs on an accrual basis. The MPSC allows recovery of other employee related benefits on a cash basis.
Deferred Financing Costs
Consistent with our historical regulatory treatment, a regulatory asset has been established to reflect the remaining deferred financing costs on long-term debt that has been replaced through the issuance of new debt. These amounts are amortized over the life of the new debt.
F-17
State & Local Taxes & Fees (Montana Property Tax Tracker)
The MPSC has authorized recovery in the property tax tracker of approximately 60% of the estimated increase in property taxes as compared with the related amount included in rates during our last rate case.
Supply Costs
The MPSC, SDPUC and NPSC have authorized the use of electric and natural gas supply cost trackers that enable us to track actual supply costs and either recover the under collection or refund the over collection to our customers. Accordingly, we have recorded a regulatory asset and liability to reflect the future recovery of under collections and refunding of over collections through the ratemaking process. We earn interest on electric and natural gas supply costs under collected, or apply interest in an over collection, of 7.5%, in Montana; 7.2% and 7.8%, respectively, in South Dakota; and 8.5% for natural gas in Nebraska.
Environmental Clean-up
Environmental clean-up costs are the estimated costs of investigating and cleaning up contaminated sites we own. We discuss the specific sites and clean-up requirements further in Note 19 - Commitments and Contingencies. Environmental clean-up costs are typically recoverable in customer rates when they are actually incurred. We record changes in the regulatory asset consistent with changes in our environmental liabilities. When cost projections become known and measurable, we coordinate with the appropriate regulatory authority to determine a recovery period.
Montana Distribution System Infrastructure Project (DSIP)
We have an accounting order to defer certain incremental operating and maintenance expenses associated with DSIP. Pursuant to the order, we deferred expenses incurred during 2011 and 2012 as a regulatory asset associated with the phase-in portion of the DSIP. These costs are being amortized into expense over five years, which began in 2013.
Removal Cost
The anticipated costs of removing assets upon retirement are provided for over the life of those assets as a component of depreciation expense. Our depreciation method, including cost of removal, is established by the respective regulatory commissions. Therefore, consistent with this regulated treatment, we reflect this accrual of removal costs for our regulated assets by increasing our regulatory liability. See Note 7 - Asset Retirement Obligations, for further information regarding this item.
Gas Storage Sales
A regulatory liability was established in 2000 and 2001 based on gains on cushion gas sales in Montana. This gain is being flowed to customers over a period that matches the depreciable life of surface facilities that were added to maintain deliverability from the field after the withdrawal of the gas. This regulatory liability is a reduction of rate base.
Deferred Revenue
We have deferred revenue associated with DGGS, Hydro, and Gas Production, which may be subject to refund as we have open regulatory proceedings. See Note 4 - Regulatory Matters, for further information regarding these items.
F-18
(6) Property, Plant and Equipment | ||||
The following table presents the major classifications of our property, plant and equipment (in thousands):
Estimated Useful Life | December 31, | ||||||||
2016 | 2015 | ||||||||
(years) | (in thousands) | ||||||||
Land, land rights and easements | 54 – 96 | $ | 138,963 | $ | 135,930 | ||||
Building and improvements | 27 – 64 | 225,003 | 219,907 | ||||||
Transmission, distribution, and storage | 15 – 85 | 2,933,788 | 2,785,944 | ||||||
Generation | 25 – 50 | 1,167,525 | 1,154,513 | ||||||
Plant acquisition adjustment | 25 – 50 | 685,417 | 685,417 | ||||||
Other | 2 – 45 | 472,264 | 445,679 | ||||||
Construction work in process | –— | 116,995 | 75,694 | ||||||
Total property, plant and equipment | 5,739,955 | 5,503,084 | |||||||
Less accumulated depreciation | (1,525,063 | ) | (1,443,585 | ) | |||||
Net property, plant and equipment | $ | 4,214,892 | $ | 4,059,499 | |||||
In 2015, we acquired the Beethoven wind project, which resulted in an increase of approximately $143 million in property, plant and equipment. We recorded the plant assets at original cost, less accumulated depreciation with an acquisition adjustment in accordance with FERC rules. The plant acquisition adjustment balance above also includes an amount related to our hydro generating assets acquired in 2014 and the inclusion of our interest in Colstrip Unit 4 in rate base in 2009. The acquisition adjustment is being amortized on a straight-line basis over the estimated remaining useful life of each related asset in depreciation expense. Plant and equipment under capital lease were $19.3 million and $21.3 million as of December 31, 2016 and 2015, respectively, which included $19.1 million and $21.1 million as of December 31, 2016 and 2015, respectively, related to a long-term power supply contract with the owners of a natural gas fired peaking plant, which has been accounted for as a capital lease.
Jointly Owned Electric Generating Plant
We have an ownership interest in four base-load electric generating plants, all of which are coal fired and operated by other companies. We have an undivided interest in these facilities and are responsible for our proportionate share of the capital and operating costs while being entitled to our proportionate share of the power generated. Our interest in each plant is reflected in the Consolidated Balance Sheets on a pro rata basis and our share of operating expenses is reflected in the Consolidated Statements of Income. The participants each finance their own investment.
Information relating to our ownership interest in these facilities is as follows (in thousands):
Big Stone (SD) | Neal #4 (IA) | Coyote (ND) | Colstrip Unit 4 (MT) | ||||||||||||
December 31, 2016 | |||||||||||||||
Ownership percentages | 23.4 | % | 8.7 | % | 10.0 | % | 30.0 | % | |||||||
Plant in service | $ | 153,623 | $ | 60,491 | $ | 50,802 | $ | 297,289 | |||||||
Accumulated depreciation | 38,894 | 29,235 | 37,099 | 77,513 | |||||||||||
December 31, 2015 | |||||||||||||||
Ownership percentages | 23.4 | % | 8.7 | % | 10.0 | % | 30.0 | % | |||||||
Plant in service | $ | 153,740 | $ | 60,088 | $ | 46,387 | $ | 289,604 | |||||||
Accumulated depreciation | 37,522 | 27,940 | 37,160 | 73,328 | |||||||||||
F-19
(7) Asset Retirement Obligations | ||||
We are obligated to dispose of certain long-lived assets upon their abandonment. We recognize a liability for the legal obligation to perform an asset retirement activity in which the timing and/or method of settlement are conditional on a future event. We measure the liability at fair value when incurred and capitalize a corresponding amount as part of the book value of the related assets, which increases our property, plant and equipment and other noncurrent liabilities. The increase in the capitalized cost is included in determining depreciation expense over the estimated useful life of these assets. Since the fair value of the asset retirement obligation (ARO) is determined using a present value approach, accretion of the liability due to the passage of time is recognized each period and recorded as a regulatory asset until the settlement of the liability. Revisions to estimated ARO can result from changes in retirement cost estimates, revisions to estimated inflation rates, and changes in the estimated timing of abandonment. If the obligation is settled for an amount other than the carrying amount of the liability, we will recognize a gain or loss on settlement.
Our AROs relate to the reclamation and removal costs at our jointly-owned coal-fired generation facilities, Department of Transportation requirements to cut, purge and cap retired natural gas pipeline segments, and our obligation to plug and abandon oil and gas wells at the end of their life. The following table presents the change in our gross conditional ARO (in thousands):
December 31, | |||||||
2016 | 2015 | ||||||
Liability at January 1, | $ | 35,532 | $ | 21,435 | |||
Accretion expense | 1,885 | 1,437 | |||||
Liabilities incurred | 164 | 12,682 | |||||
Liabilities settled | — | (22 | ) | ||||
Revisions to cash flows | 1,821 | — | |||||
Liability at December 31, | $ | 39,402 | $ | 35,532 | |||
The EPA's rule regulating Coal Combustion Residuals (CCRs) became effective in October 2015. The rule imposes extensive new requirements, including location restrictions, design and operating standards, groundwater monitoring and corrective action requirements and closure and post-closure care requirements on CCR impoundments and landfills that are located on active power plants and not closed. Based on our assessment of these requirements, we recorded an increase to our existing AROs of approximately $12.0 million during the second quarter 2015, and an additional $1.9 million during the fourth quarter 2016 based on further information.
In addition, we have identified removal liabilities related to our electric and natural gas transmission and distribution assets that have been installed on easements over property not owned by us. The easements are generally perpetual and only require remediation action upon abandonment or cessation of use of the property for the specified purpose. The ARO liability is not estimable for such easements as we intend to utilize these properties indefinitely. In the event we decide to abandon or cease the use of a particular easement, an ARO liability would be recorded at that time. We also identified AROs associated with our Hydro Transaction; however, due to the indeterminate removal date, the fair value of the associated liabilities currently cannot be estimated and no amounts are recognized in the Consolidated Financial Statements.
We collect removal costs in rates for certain transmission and distribution assets that do not have associated AROs. Generally, the accrual of future non-ARO removal obligations is not required; however, long-standing ratemaking practices approved by applicable state and federal regulatory commissions have allowed provisions for such costs in historical depreciation rates. The recorded amounts of estimated future removal costs are considered regulatory liabilities and do not represent legal retirement obligations. See Note 5 - Regulatory Assets and Liabilities for removal costs recorded as regulatory liabilities on the Consolidated Balance Sheets as of December 31, 2016 and 2015.
(8) Goodwill | ||||
We completed our annual goodwill impairment test as of April 1, 2016 and no impairment was identified. We calculate the fair value of our reporting units by considering various factors, including valuation studies based primarily on a discounted cash flow analysis, with published industry valuations and market data as supporting information. Key assumptions in the determination of fair value include the use of an appropriate discount rate and estimated future cash flows. In estimating cash
F-20
flows, we incorporate expected long-term growth rates in our service territory, regulatory stability, and commodity prices (where appropriate), as well as other factors that affect our revenue, expense and capital expenditure projections.
Goodwill by segment is as follows (in thousands):
December 31, | |||||||
2016 | 2015 | ||||||
Electric | $ | 243,558 | $ | 243,558 | |||
Natural gas | 114,028 | 114,028 | |||||
Total | $ | 357,586 | $ | 357,586 | |||
(9) Risk Management and Hedging Activities | ||||
Nature of Our Business and Associated Risks
We are exposed to certain risks related to the ongoing operations of our business, including the impact of market fluctuations in the price of electricity and natural gas commodities and changes in interest rates. We rely on market purchases to fulfill a portion of our electric and natural gas supply requirements. Several factors influence price levels and volatility. These factors include, but are not limited to, seasonal changes in demand, weather conditions, available generating assets within regions, transportation availability and reliability within and between regions, fuel availability, market liquidity, and the nature and extent of current and potential federal and state regulations.
Objectives and Strategies for Using Derivatives
To manage our exposure to fluctuations in commodity prices we routinely enter into derivative contracts. These types of contracts are included in our electric and natural gas supply portfolios and are used to manage price volatility risk by taking advantage of fluctuations in market prices. While individual contracts may be above or below market value, the overall portfolio approach is intended to provide greater price stability for consumers. These commodity costs are included in our cost tracking mechanisms and are recoverable from customers subject to prudence reviews by the applicable state regulatory commissions. We do not maintain a trading portfolio, and our derivative transactions are only used for risk management purposes consistent with regulatory guidelines.
In addition, we may use interest rate swaps to manage our interest rate exposures associated with new debt issuances or to manage our exposure to fluctuations in interest rates on variable rate debt.
Accounting for Derivative Instruments
We evaluate new and existing transactions and agreements to determine whether they are derivatives. The permitted accounting treatments include: normal purchase normal sale; cash flow hedge; fair value hedge; and mark-to-market. Mark-to-market accounting is the default accounting treatment for all derivatives unless they qualify, and we specifically designate them, for one of the other accounting treatments. Derivatives designated for any of the elective accounting treatments must meet specific, restrictive criteria both at the time of designation and on an ongoing basis. The changes in the fair value of recognized derivatives are recorded each period in current earnings or other comprehensive income, depending on whether a derivative is designated as part of a hedge transaction and the type of hedge transaction.
Normal Purchases and Normal Sales
We have applied the normal purchase and normal sale scope exception (NPNS) to our contracts involving the physical purchase and sale of gas and electricity at fixed prices in future periods. During our normal course of business, we enter into full-requirement energy contracts, power purchase agreements and physical capacity contracts, which qualify for NPNS. All of these contracts are accounted for using the accrual method of accounting; therefore, there were no unrealized amounts recorded in the Consolidated Financial Statements at December 31, 2016 and 2015. Revenues and expenses from these contracts are reported on a gross basis in the appropriate revenue and expense categories as the commodities are received or delivered.
Credit Risk
F-21
Credit risk is the potential loss resulting from counterparty non-performance under an agreement. We manage credit risk with policies and procedures for, among other things, counterparty analysis and exposure measurement, monitoring and mitigation. We limit credit risk in our commodity and interest rate derivatives activities by assessing the creditworthiness of potential counterparties before entering into transactions with them and continuing to evaluate their creditworthiness on an ongoing basis.
We are exposed to credit risk through buying and selling electricity and natural gas to serve customers. We may request collateral or other security from our counterparties based on the assessment of creditworthiness and expected credit exposure. It is possible that volatility in commodity prices could cause us to have material credit risk exposures with one or more counterparties. We enter into commodity master enabling agreements with our counterparties to mitigate credit exposure, as these agreements reduce the risk of default by allowing us or our counterparty the ability to make net payments. The agreements generally are: (1) Western Systems Power Pool agreements – standardized power purchase and sales contracts in the electric industry; (2) International Swaps and Derivatives Association agreements – standardized financial gas and electric contracts; (3) North American Energy Standards Board agreements – standardized physical gas contracts; and (4) Edison Electric Institute Master Purchase and Sale Agreements – standardized power sales contracts in the electric industry.
Many of our forward purchase contracts contain provisions that require us to maintain an investment grade credit rating from each of the major credit rating agencies. If our credit rating were to fall below investment grade, the counterparties could require immediate payment or demand immediate and ongoing full overnight collateralization on contracts in net liability positions.
Interest Rate Swaps Designated as Cash Flow Hedges
We have previously used interest rate swaps designated as cash flow hedges to manage our interest rate exposures associated with new debt issuances. We have no interest rate swaps outstanding. These swaps were designated as cash flow hedges with the effective portion of gains and losses, net of associated deferred income tax effects, recorded in AOCL. We reclassify these gains from AOCL into interest expense during the periods in which the hedged interest payments occur. The following table shows the effect of these interest rate swaps previously terminated on the Consolidated Financial Statements (in thousands):
Cash Flow Hedges | Location of Amount Reclassified from AOCL to Income | Amount Reclassified from AOCL into Income during the Year Ended December 31, 2016 | ||||
Interest rate contracts | Interest Expense | $ | 2,169 | |||
A net pre-tax loss of approximately $17.1 million is remaining in AOCL as of December 31, 2016, and we expect to reclassify approximately $0.6 million of net pre-tax losses from AOCL into interest expense during the next twelve months. These amounts relate to terminated swaps.
F-22
(10) Fair Value Measurements | ||||
Fair value is defined as the price that would be received to sell an asset or paid to transfer a liability in an orderly transaction between market participants at the measurement date (i.e., an exit price). Measuring fair value requires the use of market data or assumptions that market participants would use in pricing the asset or liability, including assumptions about risk and the risks inherent in the inputs to the valuation technique. These inputs can be readily observable, corroborated by market data, or generally unobservable. Valuation techniques are required to maximize the use of observable inputs and minimize the use of unobservable inputs.
Applicable accounting guidance establishes a hierarchy that prioritizes the inputs used to measure fair value, and requires fair value measurements to be categorized based on the observability of those inputs. The hierarchy gives the highest priority to unadjusted quoted prices in active markets for identical assets or liabilities (Level 1 inputs) and the lowest priority to unobservable inputs (Level 3 inputs). The three levels of the fair value hierarchy are as follows:
• | Level 1 – Unadjusted quoted prices available in active markets at the measurement date for identical assets or liabilities; |
• | Level 2 – Pricing inputs, other than quoted prices included within Level 1, which are either directly or indirectly observable as of the reporting date; and |
• | Level 3 – Significant inputs that are generally not observable from market activity. |
We classify assets and liabilities within the fair value hierarchy based on the lowest level of input that is significant to the fair value measurement of each individual asset and liability taken as a whole. The table below sets forth by level within the fair value hierarchy the gross components of our assets and liabilities measured at fair value on a recurring basis. NPNS transactions are not included in the fair values by source table as they are not recorded at fair value. See Note 9 - Risk Management and Hedging Activities for further discussion.
We record transfers between levels of the fair value hierarchy, if necessary, at the end of the reporting period. There were no transfers between levels for the periods presented.
December 31, 2016 | Quoted Prices in Active Markets for Identical Assets or Liabilities (Level 1) | Significant Other Observable Inputs (Level 2) | Significant Unobservable Inputs (Level 3) | Margin Cash Collateral Offset | Total Net Fair Value | |||||||||||||||
(in thousands) | ||||||||||||||||||||
Restricted cash | $ | 4,164 | $ | — | $ | — | $ | — | $ | 4,164 | ||||||||||
Rabbi trust investments | 25,064 | — | — | — | 25,064 | |||||||||||||||
Total | $ | 29,228 | $ | — | $ | — | $ | — | $ | 29,228 | ||||||||||
December 31, 2015 | ||||||||||||||||||||
Restricted cash | $ | 6,240 | $ | — | $ | — | $ | — | $ | 6,240 | ||||||||||
Rabbi trust investments | 24,245 | — | — | — | 24,245 | |||||||||||||||
Total | $ | 30,485 | $ | — | $ | — | $ | — | $ | 30,485 | ||||||||||
Restricted cash represents amounts held in money market mutual funds. Rabbi trust assets represent assets held for non-qualified deferred compensation plans, which consist of our common stock and actively traded mutual funds with quoted prices in active markets.
Financial Instruments
The estimated fair value of financial instruments is summarized as follows (in thousands):
F-23
December 31, 2016 | December 31, 2015 | ||||||||||||||
Carrying Amount | Fair Value | Carrying Amount | Fair Value | ||||||||||||
Liabilities: | |||||||||||||||
Long-term debt | $ | 1,793,338 | $ | 1,852,052 | $ | 1,768,183 | $ | 1,844,974 | |||||||
Short-term borrowings consist of commercial paper and are not included in the table above as carrying value approximates fair value. The estimated fair value amounts have been determined using available market information and appropriate valuation methodologies; however, considerable judgment is required in interpreting market data to develop estimates of fair value. Accordingly, the estimates presented herein are not necessarily indicative of the amounts that we would realize in a current market exchange.
We determined fair value for long-term debt based on interest rates that are currently available to us for issuance of debt with similar terms and remaining maturities, except for publicly traded debt, for which fair value is based on market prices for the same or similar issues or upon the quoted market prices of U.S. treasury issues having a similar term to maturity, adjusted for our bond issuance rating and the present value of future cash flows. These are significant other observable inputs, or level 2 inputs, in the fair value hierarchy.
F-24
(11) Short-Term Borrowings and Credit Arrangements | ||||
Short-Term Borrowings
Short-term borrowings and the corresponding weighted average interest rates as of December 31 were as follows (dollars in millions):
2016 | 2015 | |||||||||||||
Short-Term Debt | Balance | Interest Rate | Balance | Interest Rate | ||||||||||
Commercial Paper | $ | 300.8 | 1.07 | % | $ | 229.9 | 0.82 | % | ||||||
The following information relates to commercial paper for the years ended December 31 (dollars in millions):
2016 | 2015 | ||||||
Maximum short-term debt outstanding | $ | 300.8 | $ | 267.8 | |||
Average short-term debt outstanding | $ | 210.7 | $ | 192.8 | |||
Weighted-average interest rate | 0.86 | % | 0.61 | % | |||
Under our commercial paper program we may issue unsecured commercial paper notes on a private placement basis up to a maximum aggregate amount outstanding at any time of $340 million to provide an additional financing source for our short-term liquidity needs. The maturities of the commercial paper issuances will vary, but may not exceed 270 days from the date of issue. Commercial paper issuances are supported by available capacity under our unsecured revolving credit facility.
Unsecured Revolving Line of Credit
On December 12, 2016, we amended and restated our existing revolving credit facility to, among other things, increase the size of the facility to $400 million (from $350 million) and extend the maturity date to December 12, 2021 (from November 5, 2018). We retained an accordion feature that allows us to increase the size up to $450 million with the consent of the lenders. The facility does not amortize and is unsecured. The facility bears interest at the lower of prime or available rates tied to the Eurodollar rate plus a credit spread, ranging from 0.875% to 1.75%. A total of eight banks participate in the facility, with no one bank providing more than 16% of the total availability. There were no direct borrowings or letters of credit outstanding as of December 31, 2016. Commitment fees for the unsecured revolving line of credit were $0.4 million for each of the years ended December 31, 2016 and 2015.
The credit facility includes covenants that require us to meet certain financial tests, including a maximum debt to capitalization ratio not to exceed 65%. The facility also contains covenants which, among other things, limit our ability to engage in any consolidation or merger or otherwise liquidate or dissolve, dispose of property, and enter into transactions with affiliates. A default on the South Dakota or Montana First Mortgage Bonds would trigger a cross default on the credit facility; however a default on the credit facility would not trigger a default on any other obligations.
F-25
(12) Long-Term Debt and Capital Leases | ||||
Long-term debt and capital leases consisted of the following (in thousands):
December 31, | ||||||||||
Due | 2016 | 2015 | ||||||||
Unsecured Debt: | ||||||||||
Unsecured Revolving Line of Credit | 2021 | $ | — | $ | — | |||||
Secured Debt: | ||||||||||
Mortgage bonds— | ||||||||||
South Dakota—6.05% | 2018 | — | 55,000 | |||||||
South Dakota—5.01% | 2025 | 64,000 | 64,000 | |||||||
South Dakota—4.15% | 2042 | 30,000 | 30,000 | |||||||
South Dakota—4.30% | 2052 | 20,000 | 20,000 | |||||||
South Dakota—4.85% | 2043 | 50,000 | 50,000 | |||||||
South Dakota—4.22% | 2044 | 30,000 | 30,000 | |||||||
South Dakota—4.26% | 2040 | 70,000 | 70,000 | |||||||
South Dakota—2.80% | 2026 | 60,000 | — | |||||||
South Dakota—2.66% | 2026 | 45,000 | — | |||||||
Montana—6.34% | 2019 | 250,000 | 250,000 | |||||||
Montana—5.71% | 2039 | 55,000 | 55,000 | |||||||
Montana—5.01% | 2025 | 161,000 | 161,000 | |||||||
Montana—4.15% | 2042 | 60,000 | 60,000 | |||||||
Montana—4.30% | 2052 | 40,000 | 40,000 | |||||||
Montana—4.85% | 2043 | 15,000 | 15,000 | |||||||
Montana—3.99% | 2028 | 35,000 | 35,000 | |||||||
Montana—4.176% | 2044 | 450,000 | 450,000 | |||||||
Montana—3.11% | 2025 | 75,000 | 75,000 | |||||||
Montana—4.11% | 2045 | 125,000 | 125,000 | |||||||
Pollution control obligations— | ||||||||||
Montana—4.65% | 2023 | — | 170,205 | |||||||
Montana—2.00% | 2023 | 144,660 | — | |||||||
Other Long Term Debt: | ||||||||||
New Market Tax Credit Financing—1.146% | 2046 | 26,977 | 26,977 | |||||||
Discount on Notes and Bonds and Debt Issuance Costs, Net | — | (13,299 | ) | (13,999 | ) | |||||
$ | 1,793,338 | $ | 1,768,183 | |||||||
Less current maturities | — | — | ||||||||
$ | 1,793,338 | $ | 1,768,183 | |||||||
Capital Leases: | ||||||||||
Total Capital Leases | Various | $ | 26,325 | $ | 28,162 | |||||
Less current maturities | (1,979 | ) | (1,837 | ) | ||||||
$ | 24,346 | $ | 26,325 | |||||||
Secured Debt
First Mortgage Bonds and Pollution Control Obligations
The South Dakota First Mortgage Bonds are a series of general obligation bonds issued under our South Dakota indenture. All of such bonds are secured by substantially all of our South Dakota and Nebraska electric and natural gas assets.
F-26
The Montana First Mortgage Bonds and Montana Pollution Control Obligations are secured by substantially all of our Montana electric and natural gas assets.
In August 2016, the City of Forsyth, Rosebud County, Montana issued $144.7 million aggregate principal amount of Pollution Control Revenue Refunding Bonds on our behalf. The bonds were issued at a fixed interest rate of 2.00% maturing in 2023. The proceeds of the issuance were loaned to us pursuant to a Loan Agreement and have been used to partially fund the redemption of the 4.65%, $170.2 million City of Forsyth Pollution Control Revenue Refunding Bonds due 2023 (Prior Bonds) issued on our behalf. We paid the remaining portion of the Prior Bonds with available funds. Our obligation under the Loan Agreement is secured by the issuance of $144.7 million of Montana First Mortgage Bonds. These bonds are secured by our electric and natural gas assets in Montana and Wyoming. The City of Forsyth bonds were issued in a transaction exempt from the registration requirements of the Securities Act of 1933, as amended.
In June 2016, we issued $60 million aggregate principal amount of South Dakota First Mortgage Bonds at a fixed interest rate of 2.80% maturing in 2026. Proceeds were used to redeem our 6.05%, $55 million South Dakota First Mortgage Bonds due 2018. In addition, in September 2016, we issued $45.0 million aggregate principal amount of South Dakota First Mortgage Bonds at a fixed interest rate of 2.66% maturing in 2026. Proceeds from this issuance were used for general corporate purposes. Both series of these bonds are secured by our electric and natural gas assets in South Dakota, Nebraska, North Dakota, and Iowa and were issued in transactions exempt from the registration requirements of the Securities Act of 1933, as amended.
During September 2015, we issued $70 million of South Dakota First Mortgage Bonds at a fixed interest rate of 4.26% maturing in 2040 to finance the Beethoven wind project. The bonds are secured by our electric and natural gas assets in South Dakota and were issued in a transaction exempt from the registration requirements of the Securities Act of 1933, as amended.
In June 2015, we issued $200 million aggregate principal amount of Montana First Mortgage Bonds, which includes $75 million at a fixed interest rate of 3.11% maturing in 2025 and $125 million at a fixed interest rate of 4.11% maturing in 2045. The bonds are secured by our electric and natural gas assets in Montana. The bonds were issued in transactions exempt from the registration requirements of the Securities Act of 1933, as amended. Proceeds were used to redeem our 6.04%, $150 million of Montana First Mortgage Bonds due 2016 and finance incremental Montana capital expenditures.
As of December 31, 2016, we are in compliance with our financial debt covenants.
Other Long-Term Debt
The New Market Tax Credit (NMTC) financing is pursuant to Section 45D of the Internal Revenue Code of 1986 as amended, which was issued in association with a tax credit program related to the development and construction of a new office building in Butte, Montana. This financing agreement is structured with unrelated third party financial institutions (the Investor) and their wholly-owned community development entities (CDEs) in connection with our participation in qualified transactions under the NMTC program. Upon closing of this transaction in 2014, we entered into two loans totaling $27.0 million payable to the CDEs sponsoring the project, and provided an $18.2 million investment. In exchange for substantially all of the benefits derived from the tax credits, the Investor contributed approximately $8.8 million to the project. The NMTC is subject to recapture for a period of seven years. If the expected tax benefits are delivered without risk of recapture to the Investor and our performance obligation is relieved, we expect $7.9 million of the loan to be forgiven in July 2021. If we do not meet the conditions for loan forgiveness, we would be required to repay $27.0 million and would concurrently receive the return of our $18.2 million investment. As we are the primary beneficiary of the entities created in relation to the NMTC transaction, they have been consolidated as variable interest entities. The loans of $27.0 million are recorded in long-term debt and the investment of $18.2 million is recorded in other noncurrent assets in the Consolidated Balance Sheets.
Maturities of Long-Term Debt
The aggregate minimum principal maturities of long-term debt and capital leases, during the next five years are $2.0 million in 2017, $2.1 million in 2018, $252.3 million in 2019, $2.5 million in 2020 and $2.7 million in 2021.
(13) Income Taxes | ||||
Income tax (benefit) expense is comprised of the following (in thousands):
F-27
Year Ended December 31, | |||||||||||
2016 | 2015 | 2014 | |||||||||
Federal | |||||||||||
Current | $ | 723 | $ | (3,527 | ) | $ | (405 | ) | |||
Deferred | (2,054 | ) | 33,031 | (5,658 | ) | ||||||
Investment tax credits | (196 | ) | (232 | ) | (273 | ) | |||||
State | |||||||||||
Current | 10 | (90 | ) | 18 | |||||||
Deferred | (6,130 | ) | 855 | (3,954 | ) | ||||||
Income Tax (Benefit) Expense | $ | (7,647 | ) | $ | 30,037 | $ | (10,272 | ) | |||
The following table reconciles our effective income tax rate to the federal statutory rate:
Year Ended December 31, | ||||||||
2016 | 2015 | 2014 | ||||||
Federal statutory rate | 35.0 | % | 35.0 | % | 35.0 | % | ||
State income tax, net of federal provisions | (2.4 | ) | 0.1 | (1.8 | ) | |||
Flow-through repairs deductions | (26.3 | ) | (13.3 | ) | (22.9 | ) | ||
Production tax credits | (7.0 | ) | (3.2 | ) | (2.8 | ) | ||
Plant and depreciation of flow through items | (2.9 | ) | (1.6 | ) | 0.1 | |||
Share-based compensation | (1.1 | ) | — | — | ||||
Prior year permanent return to accrual adjustments | (0.1 | ) | 0.1 | (4.7 | ) | |||
Recognition of unrecognized tax benefit | — | — | (11.4 | ) | ||||
Other, net | (0.1 | ) | (0.5 | ) | (0.8 | ) | ||
Effective tax rate | (4.9 | )% | 16.6 | % | (9.3 | )% | ||
The following table summarizes the significant differences in income tax (benefit) expense based on the differences between our effective tax rate and the federal statutory rate (in thousands):
Year Ended December 31, | |||||||||||
2016 | 2015 | 2014 | |||||||||
Income Before Income Taxes | $ | 156,525 | $ | 181,246 | $ | 110,414 | |||||
Income tax calculated at 35% federal statutory rate | 54,784 | 63,436 | 38,645 | ||||||||
Permanent or flow through adjustments: | |||||||||||
State tax income, net of federal provisions | (3,714 | ) | 301 | (1,969 | ) | ||||||
Flow-through repairs deductions | (41,111 | ) | (24,079 | ) | (25,268 | ) | |||||
Production tax credits | (10,941 | ) | (5,721 | ) | (3,136 | ) | |||||
Plant and depreciation of flow through items | (4,604 | ) | (2,893 | ) | 74 | ||||||
Share-based compensation | (1,646 | ) | — | — | |||||||
Prior year permanent return to accrual adjustments | (128 | ) | 207 | (5,172 | ) | ||||||
Recognition of unrecognized tax benefit | — | — | (12,607 | ) | |||||||
Other, net | (287 | ) | (1,214 | ) | (839 | ) | |||||
$ | (62,431 | ) | $ | (33,399 | ) | $ | (48,917 | ) | |||
Income Tax (Benefit) Expense | $ | (7,647 | ) | $ | 30,037 | $ | (10,272 | ) | |||
Our effective tax rate typically differs from the federal statutory tax rate of 35% primarily due to the regulatory impact of flowing through the federal and state tax benefit of repairs deductions, state tax benefit of accelerated tax depreciation deductions (including bonus depreciation when applicable) and production tax credits. The regulatory accounting treatment of these deductions requires immediate income recognition for temporary tax differences of this type, which is referred to as the
F-28
flow-through method. When the flow-through method of accounting for temporary differences is reflected in regulated revenues, we record deferred income taxes and establish related regulatory assets and liabilities.
We adopted the provisions of ASU 2016-09, Improvements to Employee Share-Based Payment Accounting, during the fourth quarter of 2016. The excess tax benefit of vested share awards is treated as a discrete item in the current quarter. See Note 2 - Significant Accounting Policies, for further discussion of the impacts of this standard.
In 2013, the IRS issued guidance related to the repair and maintenance of utility generation assets. During the third quarter of 2016, we filed a tax accounting method change with the IRS consistent with the guidance for generation property. This enabled us to take a current tax deduction for a significant amount of repair costs that were previously capitalized for tax purposes. As discussed above, we flow this current tax deduction through to our customers in rate cases. Consistent with this regulatory treatment, we recorded an income tax benefit of approximately $17.0 million during the twelve months ended December 31, 2016, of which approximately $12.5 million related to 2015 and prior tax years and is reflected in the flow-through repairs deductions line above.
The income tax benefit for 2014 reflects the release of approximately $12.6 million of unrecognized tax benefits due to the lapse of statutes of limitation in the third quarter of 2014. In addition, in the third quarter of 2014, we elected the safe harbor method related to the deductibility of repair costs. This resulted in an income tax benefit of approximately $4.3 million for the cumulative adjustment for years prior to 2014, which is included in the prior year permanent return to accrual adjustments.
Deferred income taxes relate primarily to the difference between book and tax methods of depreciating property, amortizing tax-deductible goodwill, the difference in the recognition of revenues and expenses for book and tax purposes, certain natural gas and electric costs which are deferred for book purposes but expensed currently for tax purposes, and NOL carry forwards. We have elected under Internal Revenue Code Section 46(f)(2) to defer investment tax credit benefits and amortize them against expense and customer billing rates over the book life of the underlying plant.
The components of the net deferred income tax liability recognized in our Consolidated Balance Sheets are related to the following temporary differences (in thousands):
December 31, | |||||||
2016 | 2015 | ||||||
NOL carryforward | $ | 72,964 | $ | 3,677 | |||
Pension / postretirement benefits | 45,847 | 54,440 | |||||
Compensation accruals | 18,715 | 17,441 | |||||
Production tax credit | 17,034 | 6,550 | |||||
Customer advances | 15,837 | 14,197 | |||||
AMT credit carryforward | 13,599 | 13,143 | |||||
Unbilled revenue | 12,743 | 28,390 | |||||
Environmental liability | 9,698 | 9,410 | |||||
Interest rate hedges | 7,192 | 6,483 | |||||
Property taxes | 3,767 | 24,650 | |||||
Regulatory liabilities | 2,290 | 2,862 | |||||
Reserves and accruals | 1,121 | — | |||||
QF obligations | 1,025 | 2,636 | |||||
Other, net | 3,173 | 3,696 | |||||
Deferred Tax Asset | 225,005 | 187,575 | |||||
Excess tax depreciation | (459,588 | ) | (392,113 | ) | |||
Goodwill amortization | (168,165 | ) | (152,065 | ) | |||
Flow through depreciation | (160,604 | ) | (125,441 | ) | |||
Regulatory assets | (12,230 | ) | (14,901 | ) | |||
Reserves and accruals | — | (4,587 | ) | ||||
Deferred Tax Liability | (800,587 | ) | (689,107 | ) | |||
Deferred Tax Liability, net | $ | (575,582 | ) | $ | (501,532 | ) | |
F-29
At December 31, 2016 we estimate our total federal NOL carryforward to be approximately $365.1 million prior to consideration of unrecognized tax benefits. If unused, our federal NOL carryforwards will expire as follows: $105.2 million in 2031; $13.3 million in 2033; $73.4 million in 2034 and $173.2 million in 2036. We estimate our state NOL carryforward as of December 31, 2016 is approximately $276.0 million. If unused, our state NOL carryforwards will expire as follows: $67.0 million in 2018; $10.5 million in 2020; $58.3 million in 2021 and $140.2 million in 2023. We believe it is more likely than not that sufficient taxable income will be generated to utilize these NOL carryforwards.
Uncertain Tax Positions
We recognize tax positions that meet the more-likely-than-not threshold as the largest amount of tax benefit that is greater than 50 percent likely of being realized upon ultimate settlement with a taxing authority that has full knowledge of all relevant information. The change in unrecognized tax benefits is as follows (in thousands):
2016 | 2015 | 2014 | |||||||||
Unrecognized Tax Benefits at January 1 | $ | 92,387 | $ | 95,929 | $ | 113,466 | |||||
Gross increases - tax positions in prior period | — | 44 | — | ||||||||
Gross decreases - tax positions in prior period | — | (2,903 | ) | — | |||||||
Gross increases - tax positions in current period | — | 494 | 909 | ||||||||
Gross decreases - tax positions in current period | (3,958 | ) | (1,177 | ) | (5,597 | ) | |||||
Lapse of statute of limitations | — | — | (12,849 | ) | |||||||
Unrecognized Tax Benefits at December 31 | $ | 88,429 | $ | 92,387 | $ | 95,929 | |||||
Our unrecognized tax benefits include approximately $66.5 million and $65.2 million related to tax positions as of December 31, 2016 and 2015, respectively, that if recognized, would impact our annual effective tax rate. We do not anticipate that total unrecognized tax benefits will significantly change due to the settlement of audits or the expiration of statutes of limitation within the next twelve months.
Our policy is to recognize interest and penalties related to uncertain tax positions in income tax expense. During the year ended December 31, 2016, we recognized $0.7 million of expense for interest and penalties in the Consolidated Statements of Income. As of December 31, 2016, we had $0.7 million of interest accrued in the Consolidated Balance Sheets. During the year ended December 31, 2015, we did not recognize expense for interest and penalties in the Consolidated Statements of Income and did not have any amounts accrued in the Consolidated Balance Sheets.
Our federal tax returns from 2000 forward remain subject to examination by the IRS.
(14) Comprehensive Loss | ||||
The following tables display the components of Other Comprehensive (Loss) Income, after-tax, and the related tax effects (in thousands):
F-30
December 31, | |||||||||||||||||||||||||||||||||||
2016 | 2015 | 2014 | |||||||||||||||||||||||||||||||||
Before-Tax Amount | Tax Benefit | Net-of-Tax Amount | Before-Tax Amount | Tax Benefit | Net-of-Tax Amount | Before-Tax Amount | Tax Benefit | Net-of-Tax Amount | |||||||||||||||||||||||||||
Foreign currency translation adjustment | $ | 25 | $ | — | $ | 25 | $ | 558 | — | $ | 558 | $ | 265 | $ | — | $ | 265 | ||||||||||||||||||
Reclassification of net gains on derivative instruments | (2,169 | ) | 831 | (1,338 | ) | (1,125 | ) | 427 | (698 | ) | (1,110 | ) | 426 | (684 | ) | ||||||||||||||||||||
Realized loss on cash flow hedging derivatives | — | — | — | — | — | — | (18,388 | ) | 7,243 | (11,145 | ) | ||||||||||||||||||||||||
Postretirement medical liability adjustment | 317 | (122 | ) | 195 | 504 | (194 | ) | 310 | 134 | (52 | ) | 82 | |||||||||||||||||||||||
Other comprehensive (loss) income | $ | (1,827 | ) | $ | 709 | $ | (1,118 | ) | $ | (63 | ) | $ | 233 | $ | 170 | $ | (19,099 | ) | $ | 7,617 | $ | (11,482 | ) | ||||||||||||
Balances by classification included within accumulated other comprehensive loss (AOCL) on the Consolidated Balance Sheets are as follows, net of tax (in thousands):
December 31, 2016 | December 31, 2015 | |||||||
Foreign currency translation | $ | 1,380 | $ | 1,355 | ||||
Derivative instruments designated as cash flow hedges | (10,352 | ) | (9,014 | ) | ||||
Postretirement medical plans | (742 | ) | (937 | ) | ||||
Accumulated other comprehensive loss | $ | (9,714 | ) | $ | (8,596 | ) | ||
F-31
The following table displays the changes in AOCL by component, net of tax (in thousands):
December 31, 2016 | |||||||||||||||||
Year Ended | |||||||||||||||||
Affected Line Item in the Consolidated Statements of Income | Interest Rate Derivative Instruments Designated as Cash Flow Hedges | Postretirement Medical Plans | Foreign Currency Translation | Total | |||||||||||||
Beginning balance | $ | (9,014 | ) | $ | (937 | ) | $ | 1,355 | $ | (8,596 | ) | ||||||
Other comprehensive income before reclassifications | — | — | 25 | 25 | |||||||||||||
Amounts reclassified from AOCL | Interest Expense | (1,338 | ) | — | — | (1,338 | ) | ||||||||||
Amounts reclassified from AOCL | — | 195 | — | 195 | |||||||||||||
Net current-period other comprehensive (loss) income | (1,338 | ) | 195 | 25 | (1,118 | ) | |||||||||||
Ending Balance | $ | (10,352 | ) | $ | (742 | ) | $ | 1,380 | $ | (9,714 | ) | ||||||
December 31, 2015 | |||||||||||||||||
Year Ended | |||||||||||||||||
Affected Line Item in the Consolidated Statements of Income | Interest Rate Derivative Instruments Designated as Cash Flow Hedges | Postretirement Medical Plans | Foreign Currency Translation | Total | |||||||||||||
Beginning balance | $ | (8,316 | ) | $ | (1,247 | ) | $ | 797 | $ | (8,766 | ) | ||||||
Other comprehensive income before reclassifications | — | — | 558 | 558 | |||||||||||||
Amounts reclassified from AOCL | Interest Expense | (698 | ) | — | — | (698 | ) | ||||||||||
Amounts reclassified from AOCL | — | 310 | — | 310 | |||||||||||||
Net current-period other comprehensive (loss) income | (698 | ) | 310 | 558 | 170 | ||||||||||||
Ending Balance | $ | (9,014 | ) | $ | (937 | ) | $ | 1,355 | $ | (8,596 | ) | ||||||
(15) Employee Benefit Plans | ||||
Pension and Other Postretirement Benefit Plans
We sponsor and/or contribute to pension and postretirement health care and life insurance benefit plans for eligible employees, which includes two cash balance pension plans. The plan for our South Dakota and Nebraska employees is referred to as the NorthWestern Corporation pension plan, and the plan for our Montana employees is referred to as the NorthWestern Energy pension plan. We utilize a number of accounting mechanisms that reduce the volatility of reported pension costs. Differences between actuarial assumptions and actual plan results are deferred and are recognized into earnings only when the accumulated differences exceed 10% of the greater of the projected benefit obligation or the market-related value of plan assets. If necessary, the excess is amortized over the average remaining service period of active employees. The Plan’s funded status is recognized as an asset or liability in our Consolidated Financial Statements. See Note 5 - Regulatory Assets and Liabilities, for further discussion on how these costs are recovered through rates charged to our customers.
F-32
Benefit Obligation and Funded Status
Following is a reconciliation of the changes in plan benefit obligations and fair value of plan assets, and a statement of the funded status (in thousands):
Pension Benefits | Other Postretirement Benefits | ||||||||||||||
December 31, | December 31, | ||||||||||||||
2016 | 2015 | 2016 | 2015 | ||||||||||||
Change in benefit obligation: | |||||||||||||||
Obligation at beginning of period | $ | 628,883 | $ | 688,444 | $ | 28,652 | $ | 30,004 | |||||||
Service cost | 11,759 | 12,362 | 492 | 526 | |||||||||||
Interest cost | 26,210 | 26,174 | 795 | 786 | |||||||||||
Plan amendments | — | — | — | 1,045 | |||||||||||
Actuarial loss (gain) | 7,006 | (47,351 | ) | (71 | ) | (616 | ) | ||||||||
Settlements | — | — | 390 | 390 | |||||||||||
Benefits paid | (27,826 | ) | (50,746 | ) | (4,041 | ) | (3,483 | ) | |||||||
Benefit Obligation at End of Period | $ | 646,032 | $ | 628,883 | $ | 26,217 | $ | 28,652 | |||||||
Change in Fair Value of Plan Assets: | |||||||||||||||
Fair value of plan assets at beginning of period | $ | 500,044 | $ | 556,051 | $ | 17,972 | $ | 18,040 | |||||||
Return on plan assets | 39,719 | (15,461 | ) | 1,277 | — | ||||||||||
Employer contributions | 12,700 | 10,200 | 3,397 | 3,415 | |||||||||||
Benefits paid | (27,826 | ) | (50,746 | ) | (4,041 | ) | (3,483 | ) | |||||||
Fair value of plan assets at end of period | $ | 524,637 | $ | 500,044 | $ | 18,605 | $ | 17,972 | |||||||
Funded Status | $ | (121,395 | ) | $ | (128,839 | ) | $ | (7,612 | ) | $ | (10,680 | ) | |||
Amounts Recognized in the Balance Sheet Consist of: | |||||||||||||||
Current liability | — | — | (1,789 | ) | (2,584 | ) | |||||||||
Noncurrent liability | (121,395 | ) | (128,839 | ) | (5,823 | ) | (8,096 | ) | |||||||
Net amount recognized | $ | (121,395 | ) | $ | (128,839 | ) | $ | (7,612 | ) | $ | (10,680 | ) | |||
Amounts Recognized in Regulatory Assets Consist of: | |||||||||||||||
Prior service (cost) credit | (9 | ) | (255 | ) | 11,988 | 14,021 | |||||||||
Net actuarial loss | (127,953 | ) | (142,305 | ) | (4,739 | ) | (5,219 | ) | |||||||
Amounts recognized in AOCL consist of: | |||||||||||||||
Prior service cost | — | — | (849 | ) | (1,000 | ) | |||||||||
Net actuarial gain | — | — | 38 | (102 | ) | ||||||||||
Total | $ | (127,962 | ) | $ | (142,560 | ) | $ | 6,438 | $ | 7,700 | |||||
The total projected benefit obligation and fair value of plan assets for the pension plans with accumulated benefit obligations in excess of plan assets were as follows (in millions):
Pension Benefits | |||||||
December 31, | |||||||
2016 | 2015 | ||||||
Projected benefit obligation | $ | 646.0 | $ | 628.9 | |||
Accumulated benefit obligation | 643.6 | 626.0 | |||||
Fair value of plan assets | 524.6 | 500.0 | |||||
F-33
Net Periodic Cost (Credit)
The components of the net costs (credits) for our pension and other postretirement plans are as follows (in thousands):
Pension Benefits | Other Postretirement Benefits | ||||||||||||||||||||||
December 31, | December 31, | ||||||||||||||||||||||
2016 | 2015 | 2014 | 2016 | 2015 | 2014 | ||||||||||||||||||
Components of Net Periodic Benefit Cost | |||||||||||||||||||||||
Service cost | $ | 11,759 | $ | 12,362 | $ | 10,830 | $ | 492 | $ | 526 | $ | 465 | |||||||||||
Interest cost | 26,210 | 26,174 | 26,147 | 795 | 786 | 859 | |||||||||||||||||
Expected return on plan assets | (28,248 | ) | (31,561 | ) | (29,506 | ) | (1,042 | ) | (969 | ) | (981 | ) | |||||||||||
Amortization of prior service cost (credit) | 246 | 246 | 246 | (1,882 | ) | (1,882 | ) | (1,998 | ) | ||||||||||||||
Recognized actuarial loss | 9,888 | 10,634 | 2,118 | 315 | 385 | 348 | |||||||||||||||||
Settlement loss recognized | — | — | — | 390 | 390 | 690 | |||||||||||||||||
Net Periodic Benefit Cost (Credit) | $ | 19,855 | $ | 17,855 | $ | 9,835 | $ | (932 | ) | $ | (764 | ) | $ | (617 | ) | ||||||||
For purposes of calculating the expected return on pension plan assets, the market-related value of assets is used, which is based upon fair value. The difference between actual plan asset returns and estimated plan asset returns are amortized equally over a period not to exceed five years.
We estimate amortizations from regulatory assets into net periodic benefit cost during 2017 will be as follows (in thousands):
Pension Benefits | Other Postretirement Benefits | ||||||
Prior service credit (cost) | $ | (9 | ) | $ | 1,882 | ||
Accumulated loss | (7,901 | ) | (313 | ) | |||
Actuarial Assumptions
The measurement dates used to determine pension and other postretirement benefit measurements for the plans are December 31, 2016 and 2015. The actuarial assumptions used to compute net periodic pension cost and postretirement benefit cost are based upon information available as of the beginning of the year, specifically, market interest rates, past experience and management's best estimate of future economic conditions. Changes in these assumptions may impact future benefit costs and obligations. In computing future costs and obligations, we must make assumptions about such things as employee mortality and turnover, expected salary and wage increases, discount rate, expected return on plan assets, and expected future cost increases. Two of these assumptions have the most impact on the level of cost: (1) discount rate and (2) expected rate of return on plan assets.
We set the discount rate using a yield curve analysis. This analysis includes constructing a hypothetical bond portfolio whose cash flow from coupons and maturities matches the year-by-year, projected benefit cash flow from our plans. The decrease in discount rate during 2016 increased our projected benefit obligation by approximately $16.1 million.
In determining the expected long-term rate of return on plan assets, we review historical returns, the future expectations for returns for each asset class weighted by the target asset allocation of the pension and postretirement portfolios, and long-term inflation assumptions. Based on the target asset allocation for our pension assets and future expectations for asset returns, we are lowering our long term rate of return on assets assumption to 4.70% for 2017.
The weighted-average assumptions used in calculating the preceding information are as follows:
F-34
Pension Benefits | Other Postretirement Benefits | |||||||||||
December 31, | December 31, | |||||||||||
2016 | 2015 | 2014 | 2016 | 2015 | 2014 | |||||||
Discount rate | 3.95-4.10 | % | 4.15-4.30 | % | 3.75-3.90 | % | 3.40-3.55 | % | 3.60-3.75 | % | 3.20-3.40 | % |
Expected rate of return on assets | 5.80 | 5.80 | 5.80 | 5.80 | 5.80 | 5.80 | ||||||
Long-term rate of increase in compensation levels (nonunion) | 3.28 | 3.58 | 3.58 | 3.28 | 3.58 | 3.58 | ||||||
Long-term rate of increase in compensation levels (union) | 3.20 | 3.50 | 3.50 | 3.20 | 3.50 | 3.50 | ||||||
The postretirement benefit obligation is calculated assuming that health care costs increase by 7.59% in 2017 and the rate of increase in the per capita cost of covered health care benefits thereafter was assumed to decrease to an ultimate trend of 4.5% by the year 2038. The company contribution toward the premium cost is capped, therefore future health care cost trend rates are expected to have a minimal impact on company costs and the accumulated postretirement benefit obligation.
Investment Strategy
Our investment goals with respect to managing the pension and other postretirement assets are to meet current and future benefit payment needs while maximizing total investment returns (income and appreciation) after inflation within the constraints of diversification, prudent risk taking, and the Prudent Man Rule of the Employee Retirement Income Security Act of 1974. Each plan is diversified across asset classes to achieve optimal balance between risk and return and between income and growth through capital appreciation. Our investment philosophy is based on the following:
• | Each plan should be substantially fully invested as long-term cash holdings reduce long-term rates of return; |
• | It is prudent to diversify each plan across the major asset classes; |
• | Equity investments provide greater long-term returns than fixed income investments, although with greater short-term volatility; |
• | Fixed income investments of the plans should strongly correlate with the interest rate sensitivity of the plan’s aggregate liabilities in order to hedge the risk of change in interest rates negatively impacting the overall funded status; |
• | Allocation to foreign equities increases the portfolio diversification and thereby decreases portfolio risk while providing for the potential for enhanced long-term returns; |
• | Active management can reduce portfolio risk and potentially add value through security selection strategies; |
• | A portion of plan assets should be allocated to passive, indexed management funds to provide for greater diversification and lower cost; and |
• | It is appropriate to retain more than one investment manager, provided that such managers offer asset class or style diversification. |
Investment risk is measured and monitored on an ongoing basis through quarterly investment portfolio reviews, annual liability measurements, and periodic asset/liability studies.
The most important component of an investment strategy is the portfolio asset mix, or the allocation between the various classes of securities available. The mix of assets is based on an optimization study that identifies asset allocation targets in order to achieve the maximum return for an acceptable level of risk, while minimizing the expected contributions and pension and postretirement expense. In the optimization study, assumptions are formulated about characteristics, such as expected asset class investment returns, volatility (risk), and correlation coefficients among the various asset classes, and making adjustments to reflect future conditions expected to prevail over the study period. Based on this, the target asset allocation established, within an allowable range of plus or minus 5%, is as follows:
Pension Benefits | Other Benefits | ||||||||||
December 31, | December 31, | ||||||||||
2016 | 2015 | 2016 | 2015 | ||||||||
Domestic debt securities | 55.0 | % | 55.0 | % | 40.0 | % | 40.0 | % | |||
International debt securities | 5.0 | 5.0 | — | — | |||||||
Domestic equity securities | 34.0 | 34.0 | 50.0 | 50.0 | |||||||
International equity securities | 6.0 | 6.0 | 10.0 | 10.0 | |||||||
F-35
The actual allocation by plan is as follows:
NorthWestern Energy Pension | NorthWestern Corporation Pension | NorthWestern Energy Health and Welfare | |||||||||||||||
December 31, | December 31, | December 31, | |||||||||||||||
2016 | 2015 | 2016 | 2015 | 2016 | 2015 | ||||||||||||
Cash and cash equivalents | — | % | 0.4 | % | 0.1 | % | — | % | 1.0 | % | 0.1 | % | |||||
Domestic debt securities | 53.4 | 54.9 | 64.4 | 65.8 | 37.0 | 37.0 | |||||||||||
International debt securities | 4.6 | 4.7 | 4.4 | 4.5 | — | — | |||||||||||
Domestic equity securities | 36.0 | 33.9 | 26.0 | 24.9 | 52.6 | 54.2 | |||||||||||
International equity securities | 6.0 | 6.1 | 5.1 | 4.8 | 9.4 | 8.7 | |||||||||||
100.0 | % | 100.0 | % | 100.0 | % | 100.0 | % | 100.0 | % | 100.0 | % | ||||||
Generally, the asset mix will be rebalanced to the target mix as individual portfolios approach their minimum or maximum levels. Debt securities consist of U.S. and international instruments. Core domestic portfolios can be invested in government, corporate, asset-backed and mortgage-backed obligation securities. While the portfolio may invest in high yield securities, the average quality must be rated at least “investment grade" by rating agencies. Performance of fixed income investments is measured by both traditional investment benchmarks as well as relative changes in the present value of the plan's liabilities. Equity investments consist primarily of U.S. stocks including large, mid and small cap stocks, which are diversified across investment styles such as growth and value. We also invest in international equities with exposure to developing and emerging markets. Derivatives, options and futures are permitted for the purpose of reducing risk but may not be used for speculative purposes.
Our plan assets are primarily invested in common collective trusts (CCTs), which are invested in equity and fixed income securities. In accordance with our investment policy, these pooled investment funds must have an adequate asset base relative to their asset class and be invested in a diversified manner and have a minimum of three years of verified investment performance experience or verified portfolio manager investment experience in a particular investment strategy and have management and oversight by an investment advisor registered with the SEC. Investments in a collective investment vehicle are valued by multiplying the investee company’s net asset value per share with the number of units or shares owned at the valuation date. Net asset value per share is determined by the trustee. Investments held by the CCT, including collateral invested for securities on loan, are valued on the basis of valuations furnished by a pricing service approved by the CCT’s investment manager, which determines valuations using methods based on quoted closing market prices on national securities exchanges, or at fair value as determined in good faith by the CCT’s investment manager if applicable. The funds do not contain any redemption restrictions. The direct holding of NorthWestern Corporation stock is not permitted; however, any holding in a diversified mutual fund or collective investment fund is permitted. In addition, the NorthWestern Corporation pension plan assets also include a participating group annuity contract in the John Hancock General Investment Account, which consists primarily of fixed-income securities. The participating group annuity contract is valued based on discounted cash flows of current yields of similar contracts with comparable duration based on the underlying fixed income investments.
Cash Flows
In accordance with the Pension Protection Act of 2006 (PPA), and the relief provisions of the Worker, Retiree, and Employer Recovery Act of 2008 (WRERA), we are required to meet minimum funding levels in order to avoid required contributions and benefit restrictions. We have elected to use asset smoothing provided by the WRERA, which allows the use of asset averaging, including expected returns (subject to certain limitations), for a 24-month period in the determination of funding requirements. We expect to continue to make contributions to the pension plans in 2017 and future years that reflect the minimum requirements and discretionary amounts consistent with the amounts recovered in rates. Additional legislative or regulatory measures, as well as fluctuations in financial market conditions, may impact our funding requirements.
Due to the regulatory treatment of pension costs in Montana, pension expense for 2016, 2015 and 2014 was based on actual contributions to the plan. Annual contributions to each of the pension plans are as follows (in thousands):
2016 | 2015 | 2014 | |||||||||
NorthWestern Energy Pension Plan (MT) | $ | 11,500 | $ | 9,000 | $ | 9,000 | |||||
NorthWestern Corporation Pension Plan (SD and NE) | 1,200 | 1,200 | 1,200 | ||||||||
$ | 12,700 | $ | 10,200 | $ | 10,200 | ||||||
F-36
We estimate the plans will make future benefit payments to participants as follows (in thousands):
Pension Benefits | Other Postretirement Benefits | ||||||
2017 | $ | 30,637 | $ | 3,513 | |||
2018 | 32,346 | 3,464 | |||||
2019 | 33,574 | 3,218 | |||||
2020 | 34,847 | 2,844 | |||||
2021 | 35,906 | 2,634 | |||||
2022-2026 | 198,236 | 9,195 | |||||
Defined Contribution Plan
Our defined contribution plan permits employees to defer receipt of compensation as provided in Section 401(k) of the Internal Revenue Code. Under the plan, employees may elect to direct a percentage of their gross compensation to be contributed to the plan. We contribute various percentage amounts of the employee's gross compensation contributed to the plan. Matching contributions for the year ended December 31, 2016, 2015 and 2014 were $9.8 million, $9.5 million, and $8.7 million.
(16) Stock-Based Compensation | ||||
We grant stock-based awards through our Amended and Restated Equity Compensation Plan (ECP), which includes restricted stock awards and performance share awards. In 2014, an additional 600,000 shares of common stock were authorized by the shareholders for issuance under the ECP. As of December 31, 2016, there were 870,186 shares of common stock remaining available for grants. The remaining vesting period for awards previously granted ranges from one to five years if the service and/or performance requirements are met. Nonvested shares do not receive dividend distributions. The long-term incentive plan provides for accelerated vesting in the event of a change in control.
We account for our share-based compensation arrangements by recognizing compensation costs for all share-based awards over the respective service period for employee services received in exchange for an award of equity or equity-based compensation. The compensation cost is based on the fair value of the grant on the date it was awarded.
Performance Unit Awards
Performance unit awards are granted annually under the ECP. These awards vest at the end of the three-year performance period if we have achieved certain performance goals and the individual remains employed by us. The exact number of shares issued will vary from 0% to 200% of the target award, depending on actual company performance relative to the performance goals. These awards contain both market- and performance-based components. The performance goals are independent of each other and equally weighted, and are based on two metrics: (i) EPS growth level and average return on equity; and (ii) total shareholder return (TSR) relative to a peer group.
Fair value is determined for each component of the performance unit awards. The fair value of the earnings per share component is estimated based upon the closing market price of our common stock as of the date of grant less the present value of expected dividends, multiplied by an estimated performance multiple determined on the basis of historical experience, which is subsequently trued up at vesting based on actual performance. The fair value of the TSR portion is estimated using a statistical model that incorporates the probability of meeting performance targets based on historical returns relative to the peer group. The following summarizes the significant assumptions used to determine the fair value of performance shares and related compensation expense as well as the resulting estimated fair value of performance shares granted:
F-37
2016 | 2015 | ||||
Risk-free interest rate | 0.85 | % | 1.06 | % | |
Expected life, in years | 3 | 3 | |||
Expected volatility | 17.1% to 22.1% | 14.2% to 19.0% | |||
Dividend yield | 3.4 | % | 3.5 | % | |
The risk-free interest rate was based on the U.S. Treasury yield of a three-year bond at the time of grant. The expected term of the performance shares is three years based on the performance cycle. Expected volatility was based on the historical volatility for the peer group. Both performance goals are measured over the three-year vesting period and are charged to compensation expense over the vesting period based on the number of shares expected to vest.
A summary of nonvested shares as of and changes during the year ended December 31, 2016, are as follows:
Performance Unit Awards | |||||||
Shares | Weighted-Average Grant-Date Fair Value | ||||||
Beginning nonvested grants | 187,572 | $ | 40.39 | ||||
Granted | 88,107 | 50.32 | |||||
Vested | (90,417 | ) | 38.33 | ||||
Forfeited | (10,005 | ) | 42.12 | ||||
Remaining nonvested grants | 175,257 | $ | 46.35 | ||||
We recognized compensation expense of $5.3 million, $4.4 million, and $3.1 million for the years ended December 31, 2016, 2015, and 2014, respectively, and a related income tax (expense) benefit of $(1.8) million, $(1.8) million, and $0.1 million for the years ended December 31, 2016, 2015, and 2014, respectively. As of December 31, 2016, we had $5.1 million of unrecognized compensation cost related to the nonvested portion of outstanding awards, which is reflected as nonvested stock as a portion of additional paid in capital in our Statements of Common Shareholders' Equity. The cost is expected to be recognized over a weighted-average period of 2.0 years. The total fair value of shares vested was $3.5 million, $2.8 million, and $2.1 million for the years ended December 31, 2016, 2015 and 2014, respectively.
Retirement/Retention Restricted Share Awards
In December 2011, an executive retirement / retention program was established that provides for the annual grant of restricted share units. These awards are subject to a five-year performance and vesting period. The performance measure for these awards requires net income for the calendar year of at least three of the five full calendar years during the performance period to exceed net income for the calendar year the awards are granted. Once vested, the awards will be paid out in shares of common stock in five equal annual installments after a recipient has separated from service. The fair value of these awards is measured based upon the closing market price of our common stock as of the date of grant less the present value of expected dividends.
A summary of nonvested shares as of and changes during the year ended December 31, 2016, are as follows:
Shares | Weighted-Average Grant-Date Fair Value | |||||
Beginning nonvested grants | 57,313 | $ | 37.76 | |||
Granted | 15,708 | 45.78 | ||||
Vested | (8,112 | ) | 28.00 | |||
Forfeited | (2,318 | ) | 35.11 | |||
Remaining nonvested grants | 62,591 | $ | 41.14 | |||
Director's Deferred Compensation
F-38
Nonemployee directors may elect to defer up to 100% of any qualified compensation that would be otherwise payable to him or her, subject to compliance with our 2005 Deferred Compensation Plan for Nonemployee Directors and Section 409A of the Internal Revenue Code. The deferred compensation may be invested in NorthWestern stock or in designated investment funds. Compensation deferred in a particular month is recorded as a deferred stock unit (DSU) on the first of the following month based on the closing price of NorthWestern stock or the designated investment fund. The DSUs are marked-to-market on a quarterly basis with an adjustment to director’s compensation expense. Based on the election of the nonemployee director, following separation from service on the Board, other than on account of death, he or she shall be paid a distribution either in a lump sum or in approximately equal installments over a designated number of years (not to exceed 10 years). During the years ended December 31, 2016, 2015 and 2014, DSUs issued to members of our Board totaled 28,338, 35,030 and 26,460, respectively. Total compensation expense attributable to the DSUs during the years ended December 31, 2016, 2015 and 2014 was approximately $2.4 million, $1.3 million and $2.3 million, respectively.
(17) Common Stock | ||||
We have 250,000,000 shares authorized consisting of 200,000,000 shares of common stock with a $0.01 par value and 50,000,000 shares of preferred stock with a $0.01 par value. Of these shares, 2,865,957 shares of common stock are reserved for the incentive plan awards. For further detail of grants under this plan see Note 16 - Stock-Based Compensation.
Beethoven Issuance - During October 2015, we issued 1,100,000 shares of our common stock at $51.81 per share, for aggregate net proceeds of $57 million to finance a portion of the Beethoven wind project.
Repurchase of Common Stock
Shares tendered by employees to us to satisfy the employees' tax withholding obligations in connection with the vesting of restricted stock awards totaled 49,514 and 39,504 during the years ended December 31, 2016 and 2015, respectively, and are reflected in treasury stock. These shares were credited to treasury stock based on their fair market value on the vesting date.
(18) Earnings Per Share | ||||
Basic earnings per share are computed by dividing earnings applicable to common stock by the weighted average number of common shares outstanding for the period. Diluted earnings per share reflect the potential dilution of common stock equivalent shares that could occur if unvested shares were to vest. Common stock equivalent shares are calculated using the treasury stock method, as applicable. The dilutive effect is computed by dividing earnings applicable to common stock by the weighted average number of common shares outstanding plus the effect of the outstanding unvested restricted stock and performance share awards. Average shares used in computing the basic and diluted earnings per share are as follows:
December 31, | |||||
2016 | 2015 | ||||
Basic computation | 48,298,896 | 47,298,350 | |||
Dilutive effect of | — | ||||
Performance and restricted share awards (1) | 176,166 | 344,451 | |||
Diluted computation | 48,475,062 | 47,642,801 | |||
_____________________
(1) Performance share awards are included in diluted weighted average number of shares outstanding based upon what would be issued if the end of the most recent reporting period was the end of the term of the award.
We adopted the provisions of ASU 2016-09, Improvements to Employee Share-Based Payment Accounting, during the fourth quarter of 2016. Under this ASU, the assumed proceeds from applying the treasury stock method when computing earnings per share no longer includes the amount of excess tax benefits or deficiencies that used to be recognized as additional paid-in capital. This change in the treasury stock method was made on a prospective basis, with adjustments reflected as of January 1, 2016. The changes to the treasury stock method required by this ASU increased dilutive shares by 22,044 shares for the year ended December 31, 2016. See Note 2 - Significant Accounting Policies, for further discussion of the impacts of this standard.
F-39
(19) Commitments and Contingencies | ||||
Qualifying Facilities Liability
Our QF liability primarily consists of unrecoverable costs associated with three contracts covered under the PURPA. The QFs require us to purchase minimum amounts of energy at prices ranging from $74 to $136 per MWH through 2029. Our estimated gross contractual obligation related to the QFs is approximately $882.0 million through 2029. A portion of the costs incurred to purchase this energy is recoverable through rates, totaling approximately $683.4 million through 2029. The present value of the remaining QF liability is recorded in our Consolidated Balance Sheets as a regulatory disallowance liability pursuant to ASC 980. The following summarizes the change in the QF liability (in thousands):
December 31, | |||||||
2016 | 2015 | ||||||
Beginning QF liability | $ | 138,310 | $ | 136,893 | |||
Unrecovered amount | (14,829 | ) | (9,379 | ) | |||
Interest expense | 10,843 | 10,796 | |||||
Ending QF liability | $ | 134,324 | $ | 138,310 | |||
The following summarizes the estimated gross contractual obligation less amounts recoverable through rates (in thousands):
Gross Obligation | Recoverable Amounts | Net | |||||||||
2017 | 74,607 | 57,789 | 16,818 | ||||||||
2018 | 76,703 | 58,401 | 18,302 | ||||||||
2019 | 78,836 | 59,020 | 19,816 | ||||||||
2020 | 80,984 | 59,647 | 21,337 | ||||||||
2021 | 82,941 | 60,136 | 22,805 | ||||||||
Thereafter | 487,957 | 388,411 | 99,546 | ||||||||
Total | $ | 882,028 | $ | 683,404 | $ | 198,624 | |||||
Long Term Supply and Capacity Purchase Obligations
We have entered into various commitments, largely purchased power, electric transmission, coal and natural gas supply and natural gas transportation contracts. These commitments range from one to 27 years. Costs incurred under these contracts are included in Cost of Sales in the Consolidated Statements of Income and were approximately $216.8 million, $241.6 million and $402.3 million for the years ended December 31, 2016, 2015, and 2014, respectively. As of December 31, 2016, our commitments under these contracts are $206.1 million in 2017, $155.9 million in 2018, $156.2 million in 2019, $122.8 million in 2020, $107.0 million in 2021, and $1.3 billion thereafter. These commitments are not reflected in our Consolidated Financial Statements.
Hydroelectric License Commitments
With the Hydro Transaction, we assumed two Memoranda of Understanding (MOUs) existing with state, federal and private entities. The MOUs are periodically updated and renewed and require us to implement plans to mitigate the impact of the projects on fish, wildlife and their habitats, and to increase recreational opportunities. The MOUs were created to maximize collaboration between the parties and enhance the possibility to receive matching funds from relevant federal agencies. Under these MOUs, we have a remaining commitment to spend approximately $22.0 million between 2017 and 2040. These commitments are not reflected in our Consolidated Financial Statements.
F-40
ENVIRONMENTAL LIABILITIES AND REGULATION | ||||
Environmental Matters
The operation of electric generating, transmission and distribution facilities, and gas gathering, transportation and distribution facilities, along with the development (involving site selection, environmental assessments, and permitting) and construction of these assets, are subject to extensive federal, state, and local environmental and land use laws and regulations. Our activities involve compliance with diverse laws and regulations that address emissions and impacts to the environment, including air and water, protection of natural resources, avian and wildlife. We monitor federal, state, and local environmental initiatives to determine potential impacts on our financial results. As new laws or regulations are implemented, our policy is to assess their applicability and implement the necessary modifications to our facilities or their operation to maintain ongoing compliance.
Our environmental exposure includes a number of components, including remediation expenses related to the cleanup of current or former properties, and costs to comply with changing environmental regulations related to our operations. At present, the majority of our environmental reserve relates to the remediation of former manufactured gas plant sites owned by us and is estimated to range between $27.9 million to $32.6 million. As of December 31, 2016, we have a reserve of approximately $31.5 million, which has not been discounted. Environmental costs are recorded when it is probable we are liable for the remediation and we can reasonably estimate the liability. We use a combination of site investigations and monitoring to formulate an estimate of environmental remediation costs for specific sites. Our monitoring procedures and development of actual remediation plans depend not only on site specific information but also on coordination with the different environmental regulatory agencies in our respective jurisdictions; therefore, while remediation exposure exists, it may be many years before costs are incurred.
Over time, as costs become determinable, we may seek authorization to recover such costs in rates or seek insurance reimbursement as applicable; therefore, although we cannot guarantee regulatory recovery, we do not expect these costs to have a material effect on our consolidated financial position or results of operations.
Manufactured Gas Plants - Approximately $24.7 million of our environmental reserve accrual is related to manufactured gas plants. A formerly operated manufactured gas plant located in Aberdeen, South Dakota, has been identified on the Federal Comprehensive Environmental Response, Compensation, and Liability Information System list as contaminated with coal tar residue. We are currently conducting feasibility studies, implementing remedial actions pursuant to work plans approved by the South Dakota Department of Environment and Natural Resources, and conducting ongoing monitoring and operation and maintenance activities. As of December 31, 2016, the reserve for remediation costs at this site is approximately $10.8 million, and we estimate that approximately $6.2 million of this amount will be incurred during the next five years.
We also own sites in North Platte, Kearney and Grand Island, Nebraska on which former manufactured gas facilities were located. We are currently working independently to fully characterize the nature and extent of potential impacts associated with these Nebraska sites. Our reserve estimate includes assumptions for site assessment and remedial action work. At present, we cannot determine with a reasonable degree of certainty the nature and timing of any risk-based remedial action at our Nebraska locations.
In addition, we own or have responsibility for sites in Butte, Missoula and Helena, Montana on which former manufactured gas plants were located. The Butte and Helena sites, both listed as high priority sites on Montana's state superfund list, were placed into the Montana Department of Environmental Quality (MDEQ) voluntary remediation program for cleanup due to soil and groundwater impacts. Soil and coal tar were removed at the sites in accordance with MDEQ requirements. Groundwater monitoring is conducted semiannually at both sites. In August 2016, the MDEQ sent us a letter of Notice of Potential Liability and Request for Remedial Action regarding the Helena site. An initial scoping meeting with MDEQ regarding this letter has not yet been scheduled. At MDEQ's direction, a Soil Vapor Analysis Plan for the two buildings located on the Helena site was submitted to confirm whether vapors are present in the soil that could seep into the two buildings. At this time, we cannot estimate with a reasonable degree of certainty the nature and timing of additional remedial actions and/or investigations, if any, at the Butte and Helena sites.
An investigation conducted at the Missoula site did not require remediation activities, but required preparation of a groundwater monitoring plan. Monitoring wells have been installed and groundwater is monitored semiannually. At the request of Missoula Valley Water Quality District (MVWQD), a draft risk assessment was prepared for the Missoula site and presented to the MVWQD. We and the MVWQD agreed additional site investigation work is appropriate. The additional investigation work began in December 2015 and has continued in 2016. Analytical results from an October 2016 sampling exceeded the
F-41
Montana Maximum Contaminant Level (MCL) for benzene and/or total cyanide in certain monitoring wells. These results were forwarded to MVWQD which shared the same with the MDEQ. In a December 21, 2016 letter to MVWQD, MDEQ requested that MVWQD file a formal complaint with MDEQ's Enforcement Division regarding groundwater contamination of the site. If MVWQD files a formal complaint, we expect it will prompt MDEQ to reevaluate its position concerning listing the Missoula site on the State's superfund list. At this time, we cannot estimate with a reasonable degree of certainty the nature and timing of risk-based remedial action, if any, at the Missoula site.
Global Climate Change - National and international actions have been initiated to address global climate change and the contribution of emissions of greenhouse gases (GHG) including, most significantly, carbon dioxide (CO2). These actions include legislative proposals, Executive and EPA actions at the federal level, actions at the state level, and private party litigation relating to GHG emissions. Coal-fired plants have come under particular scrutiny due to their level of GHG emissions. We have joint ownership interests in four coal-fired electric generating plants, all of which are operated by other companies. We are responsible for our proportionate share of the capital and operating costs while being entitled to our proportionate share of the power generated.
While numerous bills have been introduced that address climate change from different perspectives, including through direct regulation of GHG emissions, the establishment of cap and trade programs and the establishment of Federal renewable portfolio standards, Congress has not passed any federal climate change legislation and we cannot predict the timing or form of any potential legislation. In the absence of such legislation, EPA is presently regulating new and existing sources of GHG emissions. There is uncertainty associated with the new EPA Administration and the timeframe for actions that may be taken with regard to the existing and pending GHG-related regulations.
On August 3, 2015, the EPA released for publication in the Federal Register, the final standards of performance to limit GHG emissions from new, modified and reconstructed fossil fuel generating units and from newly constructed and reconstructed natural gas combined cycle (NGCC) units. The standards reflect the degree of emission limitations achievable through the application of the best system of emission reduction that the EPA determined has been demonstrated for each type of unit.
In a separate action that also affects power plants, on August 3, 2015, the EPA released its final rule establishing GHG performance standards for existing power plants under Clean Air Act Section 111(d) (the Clean Power Plan, or CPP). The CPP establishes CO2 emission performance standards for existing electric utility steam generating units and NGCC units. States may develop implementation plans for affected units to meet the individual state targets established in the CPP or may adopt a federal plan. The EPA has given states the option to develop compliance plans for annual rate-based reductions (pounds per megawatt hour (MWH)) or mass-based tonnage limits for CO2. The 2030 rate-based requirement for all existing affected generating units in South Dakota and Montana is 1,167 and 1,305 pounds per MWH, respectively. The rate-based approach requires a 38.4 percent reduction in South Dakota and a 47.4 percent reduction in Montana from 2012 levels by 2030. The mass-based approach for existing units in South Dakota requires a 30.9 percent decrease by 2030, while in Montana the mass-based approach requires a 41 percent decrease by 2030. States were required to submit initial plans for achieving GHG emission standards to EPA by September 2016, and could seek additional time to finalize State plans by September 2018. Due to the stay of the rule, discussed below, South Dakota and Montana have not submitted implementation plans. The initial performance period for compliance under the CPP would commence in 2022, with full implementation by 2030. The EPA also indicated that states may establish emission trading programs to facilitate compliance with the CPP and provides three options: an emission rate trading program that would allow the trading of emission reduction credits equal to one MWH of emission free generation; a mass-based program that would allow trading of allowances with an allowance equal to one short ton of CO2; and a state measures program that would allow intra-state trading to achieve the state-wide average emission rate.
On August 3, 2015, the EPA also proposed a federal plan that would be imposed if a state fails to submit a satisfactory plan under the CPP. The federal plan proposal included a "model trading rule" that described how the EPA would establish an emission trading program as part of the federal plan to allow affected units to comply with the emission rate requirements. On December 19, 2016, the EPA withdrew the final model emissions trading rule and posted a draft model rule and supporting documents to “guide” states that elect to move forward in complying with the CPP.
The CPP reduction of 47.4 percent in carbon dioxide emissions in Montana by 2030 is the greatest reduction target among the lower 48 states, according to a nationwide analysis. Our Montana generation portfolio emits less carbon on average than the EPA's 2030 target due to investments we made prior to 2013 in carbon-free generation resources. However, under the CPP, investments made in renewable energy prior to 2012 are not counted for compliance with the CPP's requirements. We asked the University of Montana’s Bureau of Business and Economic Research (BBER) to study the potential impacts of the CPP across Montana. The BBER study looked at the implications of closing all four of the generating units that comprise the Colstrip facility in southeast Montana as a scenario for complying with the federal rule. The study's conclusions describe the likely loss
F-42
of jobs and population, the decline in the local and state tax base, the impact on businesses statewide, and the closure's impact on electric reliability and affordability. The electricity produced at Colstrip Unit 4 represents approximately 25 percent of our customer needs. Closing all four Colstrip units would lead to higher utility rates in order to replace the base-load generation that currently is provided by Colstrip. Closing all four Colstrip units would also create significant issues with the transmission grid that serves Montana, and we would lose transmission revenues that are credited to and lower electric customer bills.
On October 23, 2015, the same date the CPP was published in the Federal Register, we along with other utilities, trade groups, coal producers, and labor and business organizations, filed Petitions for Review of the CPP with the United States Court of Appeals for the District of Columbia Circuit. Accompanying these Petitions for Review were Motions to Stay the implementation of the CPP. On January 21, 2016, the U.S. Court of Appeals for the District of Columbia denied the requests for stay but ordered expedited briefing on the merits. On January 26, 2016, 29 states and state agencies asked the U.S. Supreme Court to issue an immediate stay of the CPP. On January 27, 2016, 60 utilities and allied petitioners also requested the U.S. Supreme Court to immediately stay the CPP, and we were among the utilities seeking a stay. On February 9, 2016, the U.S. Supreme Court entered an order staying the CPP. The stay of the CPP will remain in place until the U.S. Supreme Court either denies a petition for certiorari following the U.S. Court of Appeals’ decision on the substantive challenges to the CPP, if one is submitted, or until the U.S. Supreme Court enters judgment following grant of a petition for certiorari. On May 16, 2016, the U.S. Court of Appeals for the District of Columbia entered an order declaring the challenge to the CPP would be reviewed en banc, and on September 27, 2016, the Court held oral argument in the matter. We expect a ruling this year from the U.S. Court of Appeals, and that ruling will likely be followed by a U.S. Supreme Court decision on challenges to the CPP, unless the new EPA administration withdraws, or significantly changes, the rule.
On December 22, 2015 we also filed an administrative Petition for Reconsideration with the EPA, requesting that it reconsider the CPP, on the grounds that the CO2 reductions in the CPP were substantially greater in Montana than in the proposed rule. We also requested EPA stay the CPP while it considered our Petition for Reconsideration. On January 11, 2017, the Petition for Reconsideration was denied. We have 60 days in which to file a Petition for Review in the U.S. Court of Appeals for the District of Columbia.
On June 23, 2014, the U.S. Supreme Court struck down the EPA's Tailoring Rule, which limited the sources subject to GHG permitting requirements to the largest fossil-fueled power plants, indicating that EPA had exceeded its authority under the Clean Air Act by "rewriting unambiguous statutory terms." However, the decision affirmed EPA's ability to regulate GHG emissions from sources already subject to regulation under the prevention of significant deterioration program, which includes most electric generating units.
Requirements to reduce GHG emissions could cause us to incur material costs of compliance, increase our costs of procuring electricity, decrease transmission revenue and impact cost recovery. Although there continues to be proposed legislation and regulations that affect GHG emissions from power plants, technology to efficiently capture, remove and/or sequester such emissions may not be available within a timeframe consistent with the implementation of such requirements. In addition, physical impacts of climate change may present potential risks for severe weather, such as droughts, floods and tornadoes, in the locations where we operate or have interests.
We are evaluating the implications of these rules and technology available to achieve the CO2 emission performance standards. We will continue working with federal and state regulatory authorities, other utilities, and stakeholders to seek relief from the final rules that, in our view, disproportionately impact customers in our region, and to seek relief from the final compliance requirements. We cannot predict the ultimate outcome of these matters or what our obligations might be under the state compliance plans with any degree of certainty until they are finalized; however, complying with the carbon emission standards, and with other future environmental rules, may make it economically impractical to continue operating all or a portion of our jointly owned facilities or for individual owners to participate in their proportionate ownership of the coal-fired generating units. This could lead to significant impacts to customer rates for recovery of plant improvements and / or closure related costs and costs to procure replacement power. In addition, these changes could impact system reliability due to changes in generation sources.
Water Intakes and Discharges - Section 316(b) of the Federal Clean Water Act requires that the location, design, construction and capacity of any cooling water intake structure reflect the “best technology available (BTA)” for minimizing environmental impacts. In May 2014, the EPA issued a final rule applicable to facilities that withdraw at least 2 million gallons per day of cooling water from waters of the US and use at least 25 percent of the water exclusively for cooling purposes. The final rule, which became effective in October 2014, gives options for meeting BTA, and provides a flexible compliance approach. Under the rule, permits required for existing facilities will be developed by the individual states and additional capital and/or increased operating costs may be required to comply with future water permit requirements. Challenges to the
F-43
final cooling water intake rule filed by industry and environmental groups are under review in the Second Circuit Court of Appeals.
In November 2015, the EPA published final regulations on effluent limitations for power plant wastewater discharges, including mercury, arsenic, lead and selenium. The rule became effective in January 2016. Some of the new requirements for existing power plants would be phased in starting in 2018 with full implementation of the rule by 2023. The EPA rule estimates that 12 percent of the steam electric power plants in the U.S. will have to make new investments to meet the requirements of the new effluent limitation regulations. Challenges to the final rule have been filed in the Fifth Circuit Court of Appeals, indicating that the EPA underestimated compliance costs. It is too early to determine whether the impacts of these rules will be material.
Clean Air Act Rules and Associated Emission Control Equipment Expenditures - The EPA has proposed or issued a number of rules under different provisions of the Clean Air Act that could require the installation of emission control equipment at the generation plants in which we have joint ownership.
In December 2011, the EPA issued a final rule relating to Mercury and Air Toxics Standards (MATS). Among other things, the MATS set stringent emission limits for acid gases, mercury, and other hazardous air pollutants from new and existing electric generating units. The rule was challenged by industry groups and states, and was upheld by the D.C. Circuit Court in April 2014. The decision was appealed to the Supreme Court and in June 2015, the Supreme Court issued an opinion that the EPA did not properly consider the costs to industry when making the requisite “appropriate and necessary” determination as part of its analysis in connection with the issuance of the MATS rule. The Supreme Court remanded the case back to the U.S. Court of Appeals for the District of Columbia Circuit, and the D.C. Circuit remanded, without vacatur, the MATS rule to the EPA, leaving the rule in place. In April 2016, the EPA published its final supplemental finding that it is "appropriate and necessary" to regulate coal and oil-fired units under Section 112 of the Clean Air Act. Although industry and trade associations have filed a lawsuit in the D.C. Circuit challenging the EPA's supplemental finding, installation or upgrading of relevant environmental controls at our affected plants is complete and we are controlling emissions of mercury under the state and Federal MATS rules.
In July 2011, the EPA finalized the Cross-State Air Pollution Rule (CSAPR) to reduce emissions from electric generating units that interfere with the ability of downwind states to achieve ambient air quality standards. Under CSAPR, significant reductions in emissions of nitrogen oxide (NOx) and sulfur dioxide (SO2) were to be required in certain states beginning in 2012. In April 2014 the Supreme Court reversed and remanded the 2012 decision of the U.S. Court of Appeals for the D.C. Circuit that had vacated the CSAPR. EPA has published proposed updates to the CSAPR rule and litigation of the remaining CSAPR lawsuits is pending.
In October 2013, the Supreme Court denied certiorari in Luminant Generation Co v. EPA, which challenged the EPA’s current approach to regulating air emissions during startup, shutdown and malfunction (SSM) events. As a result, fossil fuel power plants may need to address SSM in their permits to reduce the risk of enforcement or citizen actions.
The Clean Air Visibility Rule was issued by the EPA in June 2005, to address regional haze in national parks and wilderness areas across the United States. The Clean Air Visibility Rule requires the installation and operation of Best Available Retrofit Technology (BART) to achieve emissions reductions from designated sources (including certain electric generating units) that are deemed to cause or contribute to visibility impairment in 'Class I' areas.
In September 2012, a final Federal Implementation Plan for Montana was published in the Federal Register to address regional haze. As finalized, Colstrip Units 3 and 4 do not have to improve removal efficiency for pollutants that contribute to regional haze. On January 10, 2017, the EPA published amendments to the requirements under the CAA for state plans for protection of visibility, extending the due date for the next periodic comprehensive regional haze state implementation plan revisions from 2018 to 2021. Thus, by 2021, Montana, or EPA, must develop a revised plan that demonstrates reasonable progress toward eliminating man made emissions of visibility impairing pollutants, which could impact Colstrip Unit 4. In November 2012, PPL Montana (now Talen Montana), the operator of Colstrip, as well as environmental groups (National Parks Conservation Association, Montana Environmental Information Center (MEIC), and Sierra Club) jointly filed a petition for review of the Federal Implementation Plan in the U.S. Court of Appeals for the Ninth Circuit. MEIC and Sierra Club challenged the EPA's decision not to require any emissions reductions from Colstrip Units 3 and 4. In June 2015, the U.S. Court of Appeals for the Ninth Circuit rejected the challengers’ contention that the EPA should have required additional pollution-reduction technologies on Unit 4 beyond those in the regulations and the matter is back in EPA Region 8 for action.
Jointly Owned Plants - We have joint ownership in generation plants located in South Dakota, North Dakota, Iowa and Montana that are or may become subject to the various regulations discussed above that have been issued or proposed.
F-44
Regarding the CPP, as discussed above, we cannot predict the impact of the CPP on NorthWestern until there is a definitive judicial decision on the issue or other action is taken to withdraw or significantly change the CPP.
Compliance with the final rule on Water Intakes and Discharges discussed above, which became effective in January 2016, did not have a significant impact at any of our jointly owned facilities.
North Dakota. The North Dakota Regional Haze SIP requires the Coyote generating facility, in which we have 10% ownership, to reduce its NOx emissions by July 2018. In 2016, Coyote completed installation of control equipment to maintain compliance with the lower NOx emissions of 0.5 pounds per million Btu as calculated on a 30-day rolling average basis, including periods of start-up and shutdown. The cost of the control equipment was not significant.
Montana. Colstrip Unit 4, a coal fired generating facility in which we have a 30% interest, is subject to EPA's coal combustion residual rule. A compliance plan has been developed and is in the initial stages of implementation. The current estimate of the total project cost is approximately $90.0 million (our share is 30%) over the remaining life of the facility.
See 'Legal Proceedings - Colstrip Litigation' below for discussion of Sierra Club litigation.
Other - We continue to manage equipment containing polychlorinated biphenyl (PCB) oil in accordance with the EPA's Toxic Substance Control Act regulations. We will continue to use certain PCB-contaminated equipment for its remaining useful life and will, thereafter, dispose of the equipment according to pertinent regulations that govern the use and disposal of such equipment.
We routinely engage the services of a third-party environmental consulting firm to assist in performing a comprehensive evaluation of our environmental reserve. Based upon information available at this time, we believe that the current environmental reserve properly reflects our remediation exposure for the sites currently and previously owned by us. The portion of our environmental reserve applicable to site remediation may be subject to change as a result of the following uncertainties:
• | We may not know all sites for which we are alleged or will be found to be responsible for remediation; and |
• | Absent performance of certain testing at sites where we have been identified as responsible for remediation, we cannot estimate with a reasonable degree of certainty the total costs of remediation. |
LEGAL PROCEEDINGS |
Colstrip Litigation
On March 6, 2013, the Sierra Club and the MEIC (Plaintiffs) filed suit in the United States District Court for the District of Montana (Court) against the six individual owners of the Colstrip Generating Station (Colstrip), including us, as well as Talen Montana (Talen), the operator or managing agent of the station. Colstrip consists of four coal fired generating units. Colstrip Units 1 and 2 are older than Units 3 and 4. We do not have an ownership interest in Units 1 and 2. We have a 30 percent joint interest in Unit 4 and a reciprocal sharing agreement with Talen regarding the operation of Colstrip Units 3 and 4, in which each party receives 15% of the respective combined output of the units and is responsible for 15 percent of the respective operating and construction costs, regardless of whether a particular cost is specified to Colstrip Unit 3 or Unit 4.
On September 27, 2013, Plaintiffs filed an Amended Complaint for Injunctive and Declaratory Relief that dropped claims associated with projects completed before 2001, Title V claims and the opacity claims. The Amended Complaint alleged a total of 23 claims covering 64 projects.
In the Amended Complaint, Plaintiffs identified physical changes made at Colstrip between 2001 and 2012, that Plaintiffs allege (a) have increased emissions of SO2, NOx and particulate matter and (b) were “major modifications” subject to permitting requirements under the Clean Air Act. They also alleged violations of the requirements related to Part 70 Operating Permits.
In 2013, the Colstrip owners and operator filed partial motions to dismiss. On September 12, 2013, Plaintiffs filed a motion for partial summary judgment as to the applicable method for calculating emissions increases from modifications.
F-45
The parties filed a joint notice (Notice) on April 21, 2014, that advised the Court of Plaintiffs’ intent to file a Second Amended Complaint which dropped claims relating to 52 projects, and added one additional project. On May 6, 2014, the Court held oral argument on Defendants' motion to dismiss and on Plaintiffs’ motion for summary judgment on the applicable legal standard. On May 22, 2014, the United States Magistrate Judge (Magistrate) issued findings and recommendations, which denied Plaintiffs’ motion for summary judgment and denied most of the Colstrip owners’ motions to dismiss, but dismissed seven of Plaintiffs’ “best available control technology” claims and dismissed two of Plaintiffs' claims for injunctive relief. The Plaintiffs filed an objection to the Magistrate's findings and recommendations with the Court, and on August 13, 2014, the Court adopted the Magistrate's findings and conclusions.
On August 27, 2014, the Plaintiffs filed their Second Amended Complaint, which alleged a total of 13 claims covering eight projects and seeks injunctive and declaratory relief, civil penalties (including $100,000 of civil penalties to be used for beneficial environmental projects), and recovery of their attorney fees. Defendants filed their Answer to the Second Amended Complaint on September 26, 2014. After filing the Second Amended Complaint, Plaintiffs indicated that they were no longer pursuing a number of claims and projects thereby reducing their total to eight claims relating to four projects. The parties filed motions for summary judgment and briefs in support with regard to issues affecting the remaining claims.
On December 1, 2015, the Court held oral argument on all pending motions for summary judgment, and on December 31, 2015, the Magistrate issued findings and recommendations which (a) denied Plaintiffs’ motion for partial summary judgment regarding routine maintenance, repair and replacement; (b) denied Plaintiffs’ motion for partial summary judgment that the redesign projects for the Unit 1 and 4 turbines and the Unit 1 economizer were not “like kind replacements”; (c) granted Defendants’ motion for partial summary judgment regarding Plaintiffs’ use of the “actual-to-potential” emissions test; (d) granted in part and denied in part Plaintiffs’ motion for partial summary judgment regarding the allowable period from which to select a baseline for the Unit 3 reheater project; (e) granted in part and denied in part Defendants’ motion for partial summary judgment on baseline selection; and (f) granted Defendants’ motion for partial summary judgment on emissions calculations for alleged aggregated turbine and safety valve project.
With the matter scheduled to go to a bench trial, on April 26, 2016, the parties filed a joint motion to vacate the May 31, 2016, trial date and to stay all deadlines, to allow the parties to settle the litigation. On July 12, 2016, the parties lodged a proposed consent decree with the Court. The Court entered the consent decree on September 6, 2016, dismissing all of the claims against all units, including Colstrip Unit 4, the only unit in which we have an ownership interest. While the consent decree does not provide a shut-down date for Units 3 and 4, it does provide that Units 1 and 2 must be shut down by July 1, 2022. Units 1 and 2 are owned solely by Talen and Puget Sound Energy. We had no role in the decisions regarding Units 1 and 2 as we have no ownership interest in those units. With the anticipated shutdown of Units 1 and 2, we anticipate incurring incremental operating costs with respect to our interest in Unit 4. We do not anticipate that this increase will have a significant impact on our results of operations or cash flows. However, the ultimate shutdown of Talen's share of Colstrip Units 1 and 2 will have a negative impact on our transmission revenue due to less energy available to transmit across our transmission lines.
The consent decree gave the Plaintiffs and Defendants each the right to seek recovery of attorneys’ fees and costs from the other party by filing a motion with the Court by October 6, 2016. Each party filed such a motion on a timely basis. On January 30, 2017 the United States Magistrate Judge (Magistrate) issued his Findings and Recommendation on the competing fee applications. The Magistrate recommended the Defendants’ fee request be denied and the Plaintiffs’ fee request should be granted, but only to the extent of fifty percent of their request. The 50% reduction was due to the Plaintiffs’ limited success in the case, citing failure of Plaintiffs to obtain civil penalties and failure to achieve any relief as to Units 3 and 4. As a result, while the Plaintiffs had requested approximately $3.1 million in fees and costs, the Magistrate recommended that they recover approximately $1.6 million. Our share of this amount would be approximately $0.2 million. The parties had 14 days following issuance of the Magistrate’s Findings and Recommendation in which to object. Neither Plaintiffs or Defendants filed an objection. On February 15, 2017, the District Court adopted the Magistrate’s Findings and Recommendation, and dismissed the case.
Billings, Montana Refinery Outage Claim
In August 2014, we received a letter from the ExxonMobil refinery in Billings, Montana claiming that it had sustained approximately $48.5 million in damages as a result of a January 2014 electrical outage. In December 2015, ExxonMobil increased the estimated losses related to that incident to approximately $61.7 million. On January 13, 2016, a second electrical outage shut down the ExxonMobil refinery. On January 22, 2016, ExxonMobil filed suit against NorthWestern in U.S. District Court in Billings, Montana, seeking unspecified compensatory and punitive damages arising from both outages. ExxonMobil currently claims property damages and economic losses of at least $108.0 million. We dispute ExxonMobil’s claims and intend to vigorously defend this lawsuit. We have reported the refinery's claims and lawsuit to our liability insurance carriers under our liability insurance coverage, which has a $2.0 million per occurrence retention. We also have brought third-party complaints
F-46
against the City of Billings and General Electric International, Inc. alleging that they are responsible in whole or in part for the outages. This matter is in the initial stages and we cannot predict an outcome or estimate the amount or range of loss that would be associated with an adverse result.
Pacific Northwest Solar Litigation
Pacific Northwest Solar, LLC (PNWS) is an Oregon solar QF developer with which we began negotiating in early 2016 to purchase capacity and energy at our avoided cost under the QF-1 option 1(a) tariff standard rates in accordance with the requirements of PURPA as implemented by the FERC and the MPSC.
On June 16, 2016, however, the MPSC entered a Notice of Commission Action (MPSC Notice) suspending the availability of QF-1 option 1(a) standard rates for solar projects greater than 100 kW, which included the various projects proposed by PNWS. The MPSC exempted from the suspension any contracts with solar QFs greater than 100 kW, but no larger than 3 MW, at the standard tariff rate, if prior to the date of the MPSC Notice, the QF had submitted a signed power purchase agreement and executed an interconnection agreement. PNWS had not obtained interconnection agreements for any of its projects as of June 16, 2016 and, based on the MPSC Notice and subsequent July 25, 2016 Order 7500 of like effect from the MPSC, we discontinued further negotiations with PNWS.
On August 30, 2016, PNWS sent us a demand letter demanding that we enter into power purchase agreements for 21 solar projects and threatening to sue us for $106 million if we did not accede to its demand. We declined to do so, and on November 16, 2016, PNWS sued us in state court seeking unspecified damages for breach of contract and other relief, including a judicial declaration that some or all of the proposed power purchase agreements were in effect. We removed the state lawsuit to the United States District Court for the District of Montana.
We dispute PNWS' claims and intend to vigorously defend the lawsuit. This matter is in the initial stages, and we cannot predict an outcome or estimate the amount or range of loss that would be associated with an adverse result.
State of Montana - Riverbed Rents
On April 1, 2016, the State of Montana filed a complaint on remand with the Montana First Judicial District Court (State District Court), naming us, along with Talen, as defendants. The State claims it owns the riverbeds underlying 10 of our hydroelectric facilities (dams, along with reservoirs and tailraces) on the Missouri, Madison and Clark Fork Rivers, and seeks rents for Talen’s and our use and occupancy of such lands. The facilities at issue in the litigation include the Hebgen, Madison, Hauser, Holter, Black Eagle, Rainbow, Cochrane, Ryan and Morony facilities on the Missouri-Madison Rivers and the Thompson Falls facility on the Clark Fork River. We acquired these facilities from Talen in November 2014.
Prior to our acquisition of the facilities, Talen litigated this issue against the State in State District Court, the Montana Supreme Court and in the United States Supreme Court. In August 2007, the State District Court determined that the 10 hydroelectric facilities were located on rivers which were navigable and that the State held title to the riverbeds. Subsequently, in June 2008, the State District Court awarded the State compensation with respect to all 10 facilities of approximately $34 million for the 2000-2006 period and approximately $6 million for 2007. The District Court deferred the determination of compensation for 2008 and future years to the Montana State Land Board.
Talen appealed the issue of navigability to the Montana Supreme Court, which in March 2010 affirmed the State District Court decision. In June 2011, the United States Supreme Court granted Talen's petition to review the Montana Supreme Court decision. The United States Supreme Court issued an opinion in February 2012, overturning the Montana Supreme Court and holding that the Montana courts erred first by not considering the navigability of the rivers on a segment-by-segment basis and second in relying on present day recreational use of the rivers. The United States Supreme Court also considered the navigability of what it referred to as the Great Falls Reach and concluded, at least from the head of the first waterfall to the foot of the last, that the Great Falls Reach was not navigable for title purposes, and thus the State did not own the riverbeds in that segment. The United States Supreme Court remanded the case to the Montana Supreme Court for further proceedings not inconsistent with its opinion.
Following the 2012 remand, the case laid dormant for four years until the State filed its complaint on remand with the State District Court. The complaint on remand renews all of the State’s claims that the rivers on which the 10 hydroelectric facilities are located are navigable (including the Great Falls Reach), and that because they were navigable the riverbeds became State lands upon Montana’s statehood in 1889 and that the State is entitled to rent for their use. The State’s complaint on remand does not claim any specific rental amount. Pursuant to the terms of our acquisition of the hydroelectric facilities, Talen and
F-47
NorthWestern will share jointly the expense of this litigation, and Talen is responsible for any rents applicable to the periods of time prior to the acquisition (i.e., before November 18, 2014), while we are responsible for periods thereafter.
On April 20, 2016, we removed the case from State District Court to the United States District Court for the District of Montana (Federal District Court), and Talen consented to our removal. On April 27, 2016, we and Talen filed motions with the Federal District Court seeking to dismiss the portion of the litigation dealing with the Great Falls Reach in light of the United States Supreme Court’s decision that the Great Falls Reach was not navigable for title purposes, and thus the State did not own the riverbeds in that segment.
On May 19, 2016, the State asked the Federal District Court to remand the case back to the State District Court. The parties briefed the remand issue and oral argument was held on January 17, 2017. On January 23, 2017 the Magistrate issued his Findings and Recommendation. The Magistrate recommended the Federal District Court remand the case to State District Court. We plan to file objections to the Magistrate’s Findings and Recommendation and argue that the Federal District Court should retain jurisdiction. Talen's and our motions to dismiss the State's claim regarding the Great Falls Reach remain pending but will not be taken up by the Federal District Court unless it retains jurisdiction. If the case is remanded to State District Court, we will file new motions to dismiss regarding the Great Falls Reach.
We dispute the State’s claims and intend to vigorously defend the lawsuit. This matter is in the initial stages, and we cannot predict an outcome. If the Federal District Court (or the State District Court if the case is remanded to it) determines the riverbeds under all 10 of the hydroelectric facilities are navigable (including the five hydroelectric facilities on the Great Falls Reach) and if it calculates damages as the State District Court did in 2008, we estimate the annual rents could be approximately $7.0 million commencing in November 2014, when we acquired the facilities. We anticipate that any obligation to pay the State rent for use and occupancy of the riverbeds would be recoverable in rates from customers, although there can be no assurances that the MPSC would approve any such recovery.
Other Legal Proceedings
We are also subject to various other legal proceedings, governmental audits and claims that arise in the ordinary course of business. In the opinion of management, the amount of ultimate liability with respect to these other actions will not materially affect our financial position, results of operations, or cash flows.
(20) Segment and Related Information | ||||
Our reportable business segments are primarily engaged in the electric and natural gas business. The remainder of our operations are presented as other, which primarily consists of unallocated corporate costs.
We evaluate the performance of these segments based on gross margin. The accounting policies of the operating segments are the same as the parent except that the parent allocates some of its operating expenses to the operating segments according to a methodology designed by management for internal reporting purposes and involves estimates and assumptions.
F-48
Financial data for the business segments for the twelve months ended are as follows (in thousands):
December 31, 2016 | Electric | Gas | Other | Eliminations | Total | ||||||||||||||
Operating revenues | $ | 1,011,595 | $ | 245,652 | $ | — | $ | — | $ | 1,257,247 | |||||||||
Cost of sales | 332,817 | 68,156 | — | — | 400,973 | ||||||||||||||
Gross margin | 678,778 | 177,496 | — | — | 856,274 | ||||||||||||||
Operating, general and administrative | 216,736 | 86,713 | (556 | ) | — | 302,893 | |||||||||||||
Property and other taxes | 115,583 | 32,505 | 10 | — | 148,098 | ||||||||||||||
Depreciation and depletion | 130,236 | 29,067 | 33 | — | 159,336 | ||||||||||||||
Operating income | 216,223 | 29,211 | 513 | — | 245,947 | ||||||||||||||
Interest expense, net | (86,038 | ) | (6,589 | ) | (2,343 | ) | — | (94,970 | ) | ||||||||||
Other income, net | 3,246 | 1,329 | 973 | — | 5,548 | ||||||||||||||
Income tax benefit (expense) | 7,392 | (1,687 | ) | 1,942 | — | 7,647 | |||||||||||||
Net income | $ | 140,823 | $ | 22,264 | $ | 1,085 | $ | — | $ | 164,172 | |||||||||
Total assets | $ | 4,363,848 | $ | 1,129,355 | $ | 6,118 | $ | — | $ | 5,499,321 | |||||||||
Capital expenditures | $ | 236,014 | $ | 51,887 | $ | — | $ | — | $ | 287,901 | |||||||||
December 31, 2015 | Electric | Gas | Other | Eliminations | Total | ||||||||||||||
Operating revenues | $ | 944,428 | $ | 269,871 | $ | — | $ | — | $ | 1,214,299 | |||||||||
Cost of sales | 281,251 | 91,613 | — | — | 372,864 | ||||||||||||||
Gross margin | 663,177 | 178,258 | — | — | 841,435 | ||||||||||||||
Operating, general and administrative | 233,416 | 84,219 | (20,160 | ) | — | 297,475 | |||||||||||||
Property and other taxes | 104,264 | 29,168 | 10 | — | 133,442 | ||||||||||||||
Depreciation and depletion | 115,701 | 28,968 | 33 | — | 144,702 | ||||||||||||||
Operating income | 209,796 | 35,903 | 20,117 | — | 265,816 | ||||||||||||||
Interest expense, net | (79,044 | ) | (11,433 | ) | (1,676 | ) | — | (92,153 | ) | ||||||||||
Other income, net | 6,300 | 1,821 | (538 | ) | — | 7,583 | |||||||||||||
Income tax expense | (19,950 | ) | (3,752 | ) | (6,335 | ) | — | (30,037 | ) | ||||||||||
Net income | $ | 117,102 | $ | 22,539 | $ | 11,568 | $ | — | $ | 151,209 | |||||||||
Total assets | $ | 4,185,192 | $ | 1,072,613 | $ | 6,890 | $ | — | $ | 5,264,695 | |||||||||
Capital expenditures | $ | 234,451 | $ | 49,254 | $ | — | $ | — | $ | 283,705 | |||||||||
December 31, 2014 | Electric | Gas | Other | Eliminations | Total | ||||||||||||||
Operating revenues | $ | 877,967 | $ | 326,896 | $ | — | $ | — | $ | 1,204,863 | |||||||||
Cost of sales | 348,640 | 133,951 | — | — | 482,591 | ||||||||||||||
Gross margin | 529,327 | 192,945 | — | — | 722,272 | ||||||||||||||
Operating, general and administrative | 200,186 | 91,437 | 14,263 | — | 305,886 | ||||||||||||||
Property and other taxes | 84,759 | 29,821 | 12 | — | 114,592 | ||||||||||||||
Depreciation and depletion | 94,813 | 28,930 | 33 | — | 123,776 | ||||||||||||||
Operating income (loss) | 149,569 | 42,757 | (14,308 | ) | — | 178,018 | |||||||||||||
Interest expense, net | (60,424 | ) | (10,618 | ) | (6,760 | ) | — | (77,802 | ) | ||||||||||
Other income, net | 4,758 | 1,324 | 4,116 | — | 10,198 | ||||||||||||||
Income tax (expense) benefit | (1,490 | ) | (7,463 | ) | 19,225 | — | 10,272 | ||||||||||||
Net income | $ | 92,413 | $ | 26,000 | $ | 2,273 | $ | — | $ | 120,686 | |||||||||
Total assets | $ | 3,434,035 | $ | 1,519,196 | $ | 7,671 | $ | — | $ | 4,960,902 | |||||||||
Capital expenditures | $ | 233,538 | $ | 36,846 | $ | — | $ | — | $ | 270,384 | |||||||||
F-49
(21) Quarterly Financial Data (Unaudited) | ||||
Our quarterly financial information has not been audited, but, in management's opinion, includes all adjustments necessary for a fair presentation. Our business is seasonal in nature with the peak sales periods generally occurring during the summer and winter months. Accordingly, comparisons among quarters of a year may not represent overall trends and changes in operations. Amounts presented are in thousands, except per share data:
2016 | First | Second | Third | Fourth | ||||||||||||
Operating revenues | $ | 332,539 | $ | 293,120 | $ | 300,998 | $ | 330,590 | ||||||||
Operating income | 61,933 | 63,742 | 56,116 | 64,156 | ||||||||||||
Net income (1) | $ | 39,867 | $ | 35,569 | $ | 44,605 | $ | 44,131 | ||||||||
Average common shares outstanding | 48,242 | 48,309 | 48,315 | 48,329 | ||||||||||||
Income per average common share: | ||||||||||||||||
Basic | $ | 0.83 | $ | 0.74 | $ | 0.92 | $ | 0.91 | ||||||||
Diluted | $ | 0.82 | $ | 0.73 | $ | 0.92 | $ | 0.92 | ||||||||
Dividends per share | $ | 0.50 | $ | 0.50 | $ | 0.50 | $ | 0.50 | ||||||||
Stock price: | ||||||||||||||||
High | $ | 62.22 | $ | 63.30 | $ | 63.75 | $ | 59.13 | ||||||||
Low | 52.16 | 55.34 | 56.18 | 53.85 | ||||||||||||
Quarter-end close | 61.75 | 63.07 | 57.53 | 56.87 | ||||||||||||
_____________________
(1) We adopted the provisions of ASU 2016-09, Improvements to Employee Share-Based Payment Accounting, during the fourth quarter of 2016, which resulted in the recognition of $1.8 million in excess tax benefits. In accordance with the guidance, the $1.8 million impact of this adoption is reflected as of January 1, 2016, which resulted in an increase in net income and earnings per share for the three months ended March 31, 2016 above.
2015 | First | Second | Third | Fourth | ||||||||||||
Operating revenues | $ | 346,011 | $ | 270,560 | $ | 272,739 | $ | 324,989 | ||||||||
Operating income | 83,891 | 61,132 | 48,461 | 72,332 | ||||||||||||
Net income | $ | 51,425 | $ | 30,973 | $ | 23,798 | $ | 45,013 | ||||||||
Average common shares outstanding | 46,977 | 47,044 | 47,065 | 48,098 | ||||||||||||
Income per average common share: | ||||||||||||||||
Basic | $ | 1.09 | $ | 0.66 | $ | 0.51 | $ | 0.94 | ||||||||
Diluted | $ | 1.09 | $ | 0.65 | $ | 0.51 | $ | 0.92 | ||||||||
Dividends per share | $ | 0.48 | $ | 0.48 | $ | 0.48 | $ | 0.48 | ||||||||
Stock price: | ||||||||||||||||
High | $ | 59.71 | $ | 54.65 | $ | 56.68 | $ | 57.07 | ||||||||
Low | 50.75 | 48.44 | 48.47 | 51.27 | ||||||||||||
Quarter-end close | 53.79 | 48.75 | 53.83 | 54.25 | ||||||||||||
F-50
SCHEDULE II. VALUATION AND QUALIFYING ACCOUNTS | ||||
NORTHWESTERN CORPORATION AND SUBSIDIARIES
Column A | Column B | Column C | Column D | Column E | |||||||||||
Balance at Beginning of Period | Charged to Costs and Expenses | Deductions | Balance End of Period | ||||||||||||
Description | (in thousands) | ||||||||||||||
FOR THE YEAR ENDED DECEMBER 31, 2016 | |||||||||||||||
RESERVES DEDUCTED FROM APPLICABLE ASSETS | |||||||||||||||
Uncollectible accounts | $ | 3,999 | $ | 1,307 | $ | (2,358 | ) | $ | 2,948 | ||||||
FOR THE YEAR ENDED DECEMBER 31, 2015 | |||||||||||||||
RESERVES DEDUCTED FROM APPLICABLE ASSETS | |||||||||||||||
Uncollectible accounts | 4,302 | 2,322 | (2,625 | ) | 3,999 | ||||||||||
FOR THE YEAR ENDED DECEMBER 31, 2014 | |||||||||||||||
RESERVES DEDUCTED FROM APPLICABLE ASSETS | |||||||||||||||
Uncollectible accounts | 4,452 | 3,813 | (3,963 | ) | 4,302 | ||||||||||
F-51