Attached files
| file | filename |
|---|---|
| 8-K - 8-K - ELECTRONICS FOR IMAGING INC | d485054d8k.htm |

Investor Day 2017 Print is Everywhere, & It’s Going Digital Exhibit 99.1
Safe Harbor For Forward-Looking Statements Certain statements in this presentation are forward-looking statements within the meaning of Section 27A of the Securities Act of 1933, as amended, and Section 21E of the Securities Exchange Act of 1934, as amended. Statements other than statements of historical fact including words such as “address”, “anticipate”, “believe”, “consider”, “continue”, “develop”, “estimate”, “expect”, “further”, “look”, “plan”, and “progress” and statements in the future tense are forward looking statements. The statements in this presentation that could be deemed forward-looking statements include statements regarding EFI’s strategy, plans, expectations regarding its revenue growth, product portfolio, productivity, future opportunities for EFI and its customers, demand for products, and any statements or assumptions underlying any of the foregoing. Forward-looking statements are subject to certain risks and uncertainties that could cause our actual future results to differ materially, or cause a material adverse impact on our results. Potential risks and uncertainties include, but are not necessarily limited to, intense competition in each of our businesses, including competition from products developed by EFI’s customers; our ability to remediate the material weaknesses identified in EFI’s internal control over financial reporting; the uncertainty of the outcome of the pending securities lawsuits against EFI; unforeseen expenses; fluctuations in currency exchange rates; the difficulty of aligning expense levels with revenue; management’s ability to forecast revenues, expenses and earnings; our ability to successfully integrate acquired businesses; changes in the mix of products sold; the uncertainty of market acceptance of new product introductions; challenge of managing asset levels, including inventory and variations in inventory levels; the uncertainty of continued success in technological advances; the challenges of obtaining timely, efficient and quality product manufacturing and supply of components; any world-wide financial and economic difficulties and downturns; adverse tax-related matters such as tax audits, changes in our effective tax rate or new tax legislative proposals; the unpredictability of development schedules and commercialization of products by the leading printer manufacturers and declines or delays in demand for our related products; the impact of changing consumer preferences on demand for our textile products; litigation involving intellectual property rights or other related matters; the uncertainty regarding the amount and timing of future share repurchases by EFI and the origin of funds used for such repurchases; the market prices of EFI's common stock prior to, during and after the share repurchases; and any other risk factors that may be included from time to time in the Company’s SEC reports. The statements in this presentation are made as of the date of this and are subject to revision until the Company will have filed its Quarterly Report on Form 10-Q for the period ended September 30, 2017. EFI undertakes no obligation to update information contained in this presentation. Amounts are subject to rounding. For further information regarding risks and uncertainties associated with EFI’s businesses, please refer to the section entitled “Risk Factors” in the Company’s SEC filings, including, but not limited to, its annual report on Form 10-K and its quarterly reports on Form 10-Q, copies of which may be obtained by contacting EFI’s Investor Relations Department by phone at 650-357-3828 or by email at investor.relations@efi.com or EFI’s Investor Relations website at www.efi.com.

Opening Remarks Guy Gecht CEO
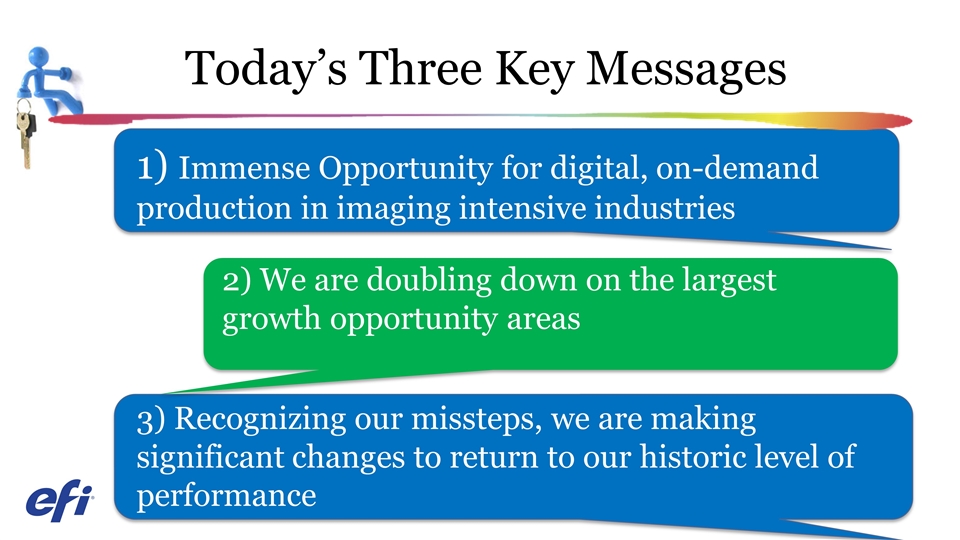
Today’s Three Key Messages 1) Immense Opportunity for digital, on-demand production in imaging intensive industries 2) We are doubling down on the largest growth opportunity areas 3) Recognizing our missteps, we are making significant changes to return to our historic level of performance
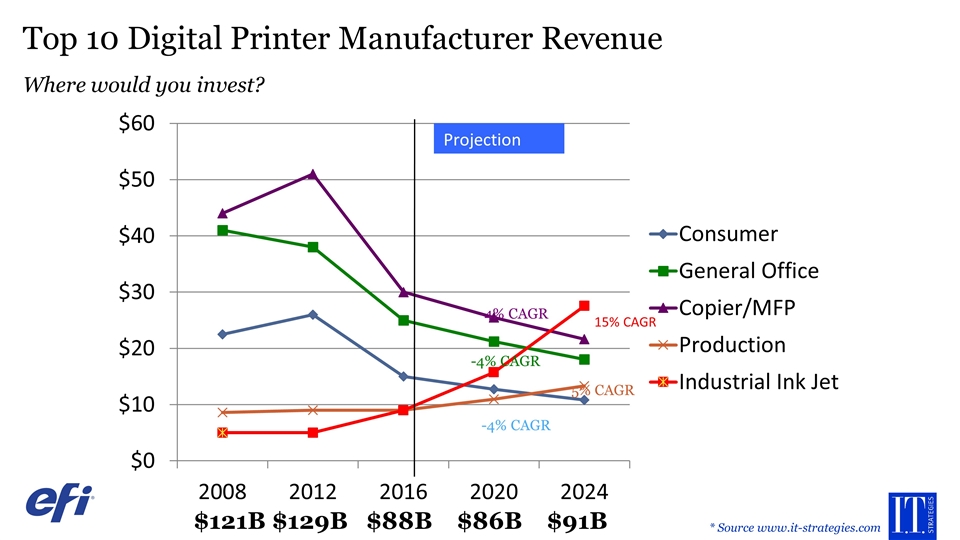
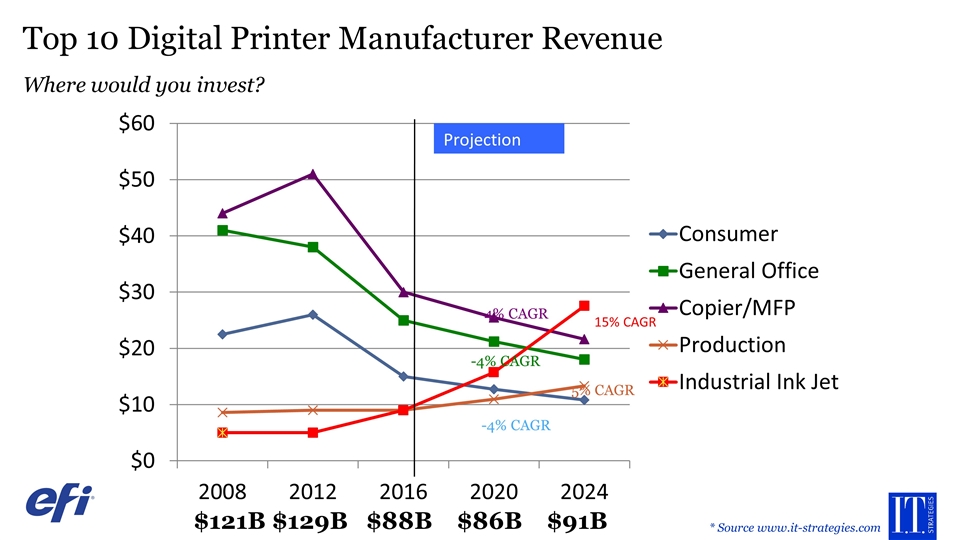
Top 10 Digital Printer Manufacturer Revenue Where would you invest? -4% CAGR -4% CAGR -4% CAGR 5% CAGR $121B $129B $88B $86B $91B * Source www.it-strategies.com
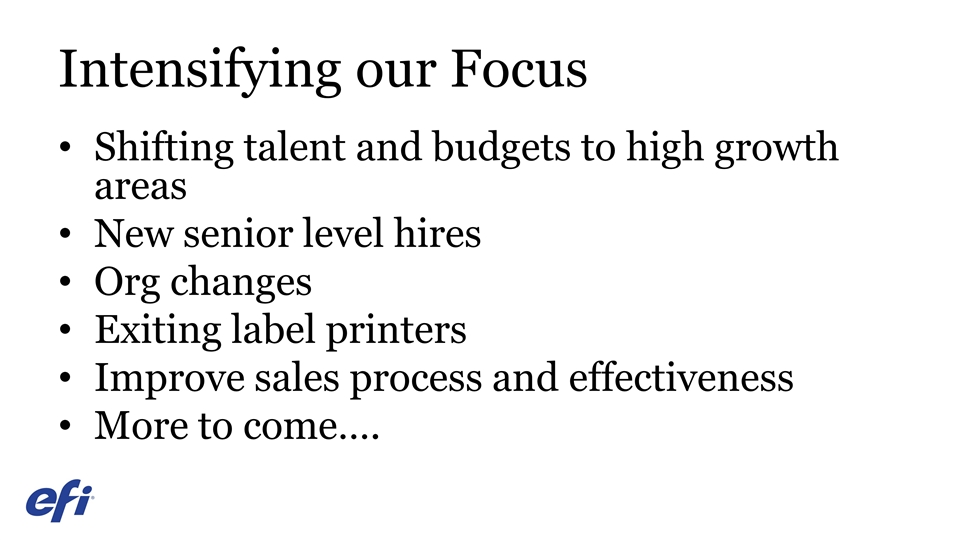
Intensifying our Focus Shifting talent and budgets to high growth areas New senior level hires Org changes Exiting label printers Improve sales process and effectiveness More to come….
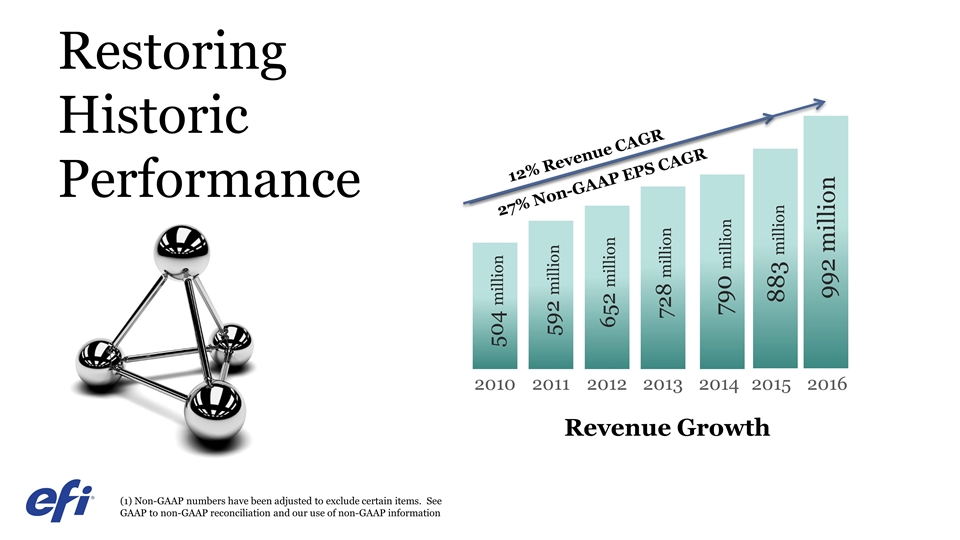
Restoring Historic Performance 504 million 592 million 652 million 728 million 2010 2011 2012 2013 2014 Revenue Growth 2015 992 million 2016 790 million 12% Revenue CAGR 883 million 28% Non-GAAP EPS CAGR 27% Non-GAAP EPS CAGR (1) Non-GAAP numbers have been adjusted to exclude certain items. See GAAP to non-GAAP reconciliation and our use of non-GAAP information
Financials/Model Marc Olin Chief Financial Officer
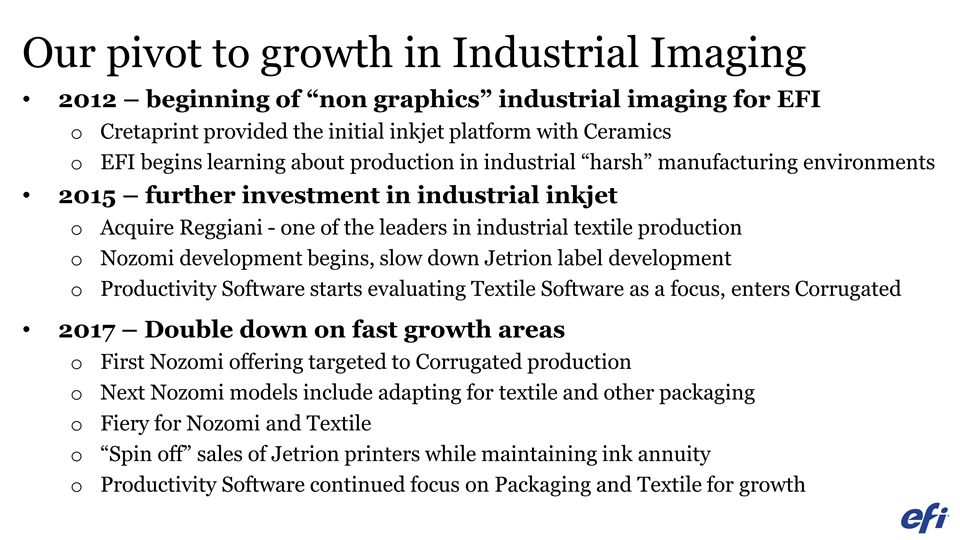
Our pivot to growth in Industrial Imaging 2012 – beginning of “non graphics” industrial imaging for EFI Cretaprint provided the initial inkjet platform with Ceramics EFI begins learning about production in industrial “harsh” manufacturing environments 2015 – further investment in industrial inkjet Acquire Reggiani - one of the leaders in industrial textile production Nozomi development begins, slow down Jetrion label development Productivity Software starts evaluating Textile Software as a focus, enters Corrugated 2017 – Double down on fast growth areas First Nozomi offering targeted to Corrugated production Next Nozomi models include adapting for textile and other packaging Fiery for Nozomi and Textile “Spin off” sales of Jetrion printers while maintaining ink annuity Productivity Software continued focus on Packaging and Textile for growth
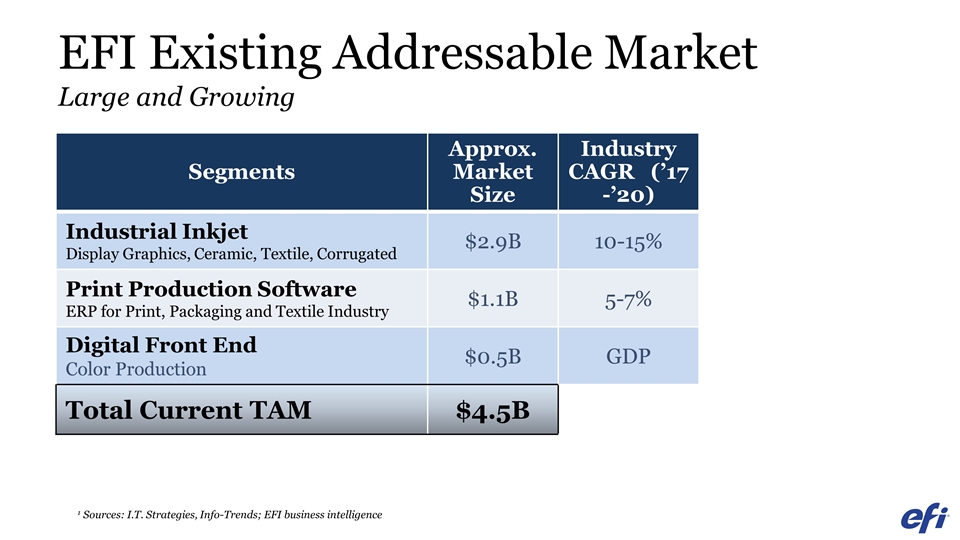
EFI Existing Addressable Market Large and Growing Segments Approx. Market Size Industry CAGR (’17-’20) Industrial Inkjet Display Graphics, Ceramic, Textile, Corrugated $2.9B 10-15% Print Production Software ERP for Print, Packaging and Textile Industry $1.1B 5-7% Digital Front End Color Production $0.5B GDP Total Current TAM $4.5B 1 Sources: I.T. Strategies, Info-Trends; EFI business intelligence
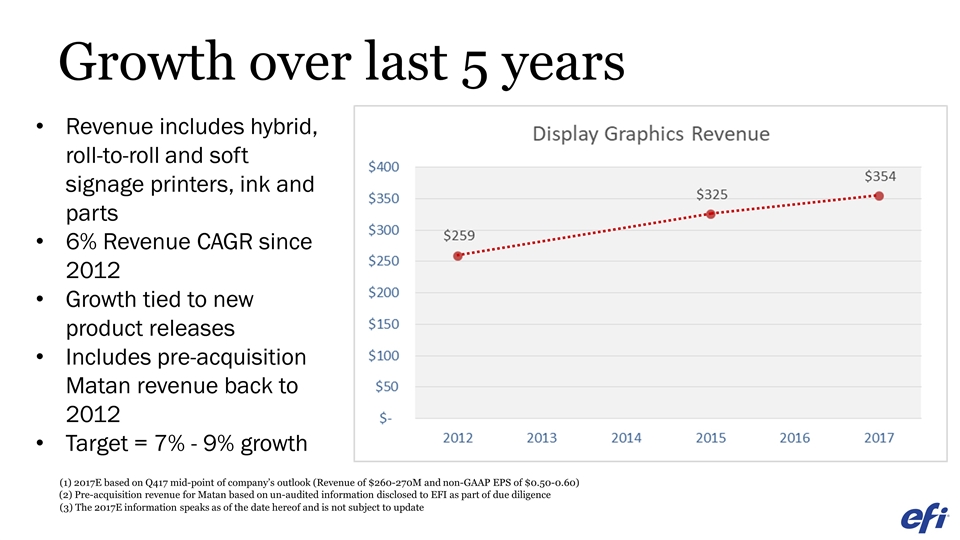
Growth over last 5 years Revenue includes hybrid, roll-to-roll and soft signage printers, ink and parts 6% Revenue CAGR since 2012 Growth tied to new product releases Includes pre-acquisition Matan revenue back to 2012 Target = 7% - 9% growth (1) 2017E based on Q417 mid-point of company’s outlook (Revenue of $260-270M and non-GAAP EPS of $0.50-0.60) (3) The 2017E information speaks as of the date hereof and is not subject to update (2) Pre-acquisition revenue for Matan based on un-audited information disclosed to EFI as part of due diligence
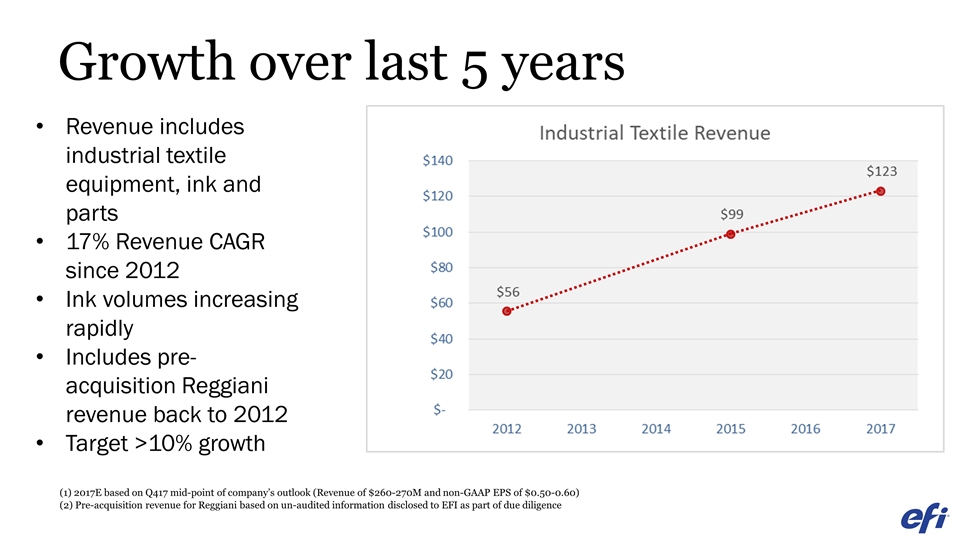
Growth over last 5 years Revenue includes industrial textile equipment, ink and parts 17% Revenue CAGR since 2012 Ink volumes increasing rapidly Includes pre-acquisition Reggiani revenue back to 2012 Target >10% growth (1) 2017E based on Q417 mid-point of company’s outlook (Revenue of $260-270M and non-GAAP EPS of $0.50-0.60) (2) Pre-acquisition revenue for Reggiani based on un-audited information disclosed to EFI as part of due diligence
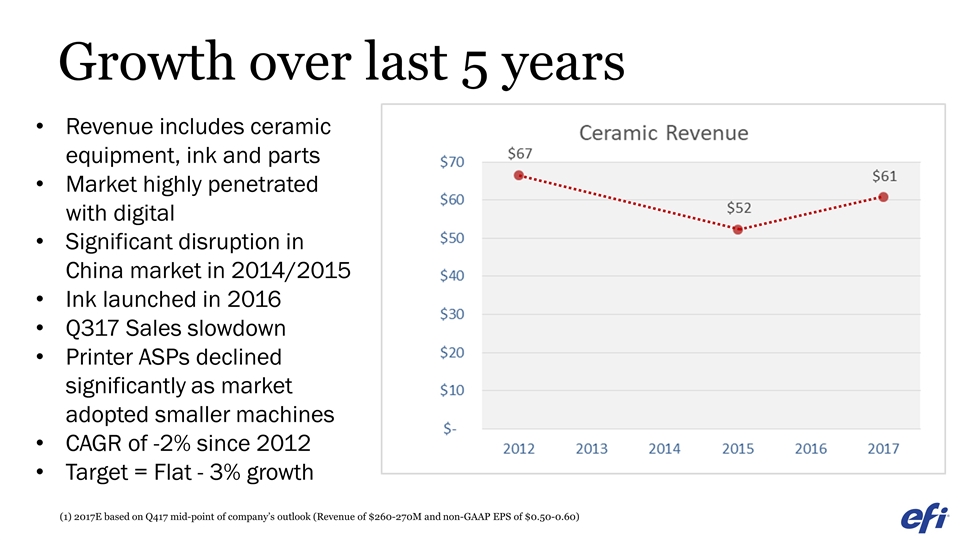
Growth over last 5 years Revenue includes ceramic equipment, ink and parts Market highly penetrated with digital Significant disruption in China market in 2014/2015 Ink launched in 2016 Q317 Sales slowdown Printer ASPs declined significantly as market adopted smaller machines CAGR of -2% since 2012 Target = Flat - 3% growth (1) 2017E based on Q417 mid-point of company’s outlook (Revenue of $260-270M and non-GAAP EPS of $0.50-0.60)
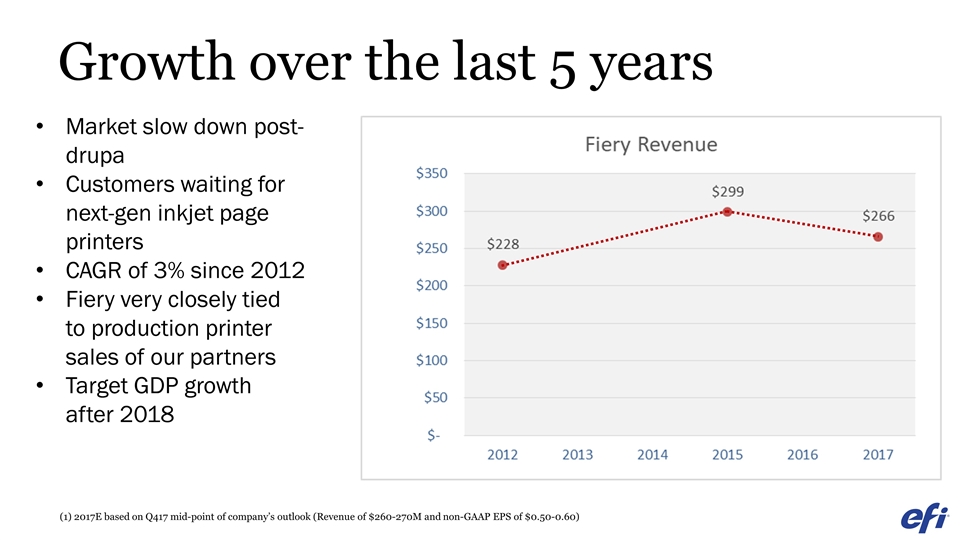
Growth over the last 5 years Market slow down post-drupa Customers waiting for next-gen inkjet page printers CAGR of 3% since 2012 Fiery very closely tied to production printer sales of our partners Target GDP growth after 2018 (1) 2017E based on Q417 mid-point of company’s outlook (Revenue of $260-270M and non-GAAP EPS of $0.50-0.60)
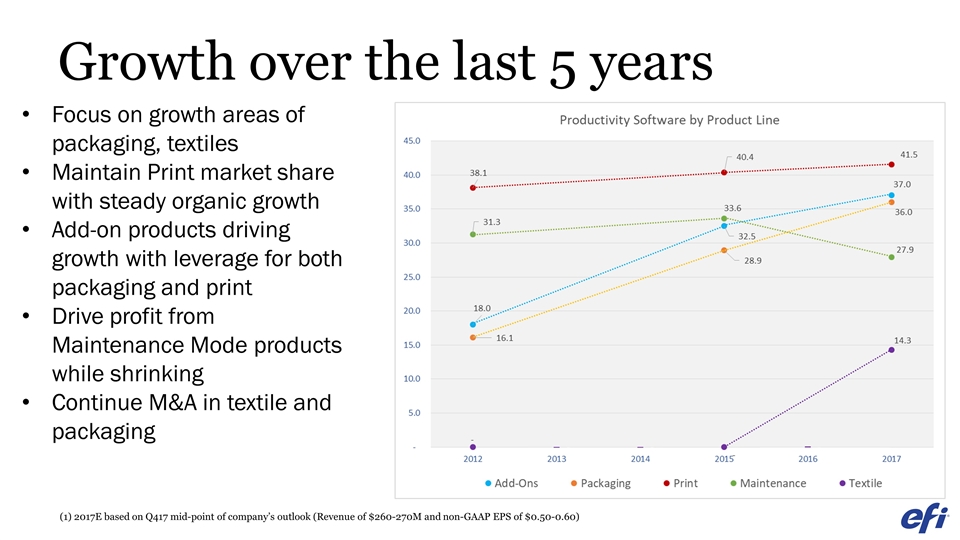
Growth over the last 5 years Focus on growth areas of packaging, textiles Maintain Print market share with steady organic growth Add-on products driving growth with leverage for both packaging and print Drive profit from Maintenance Mode products while shrinking Continue M&A in textile and packaging (1) 2017E based on Q417 mid-point of company’s outlook (Revenue of $260-270M and non-GAAP EPS of $0.50-0.60)
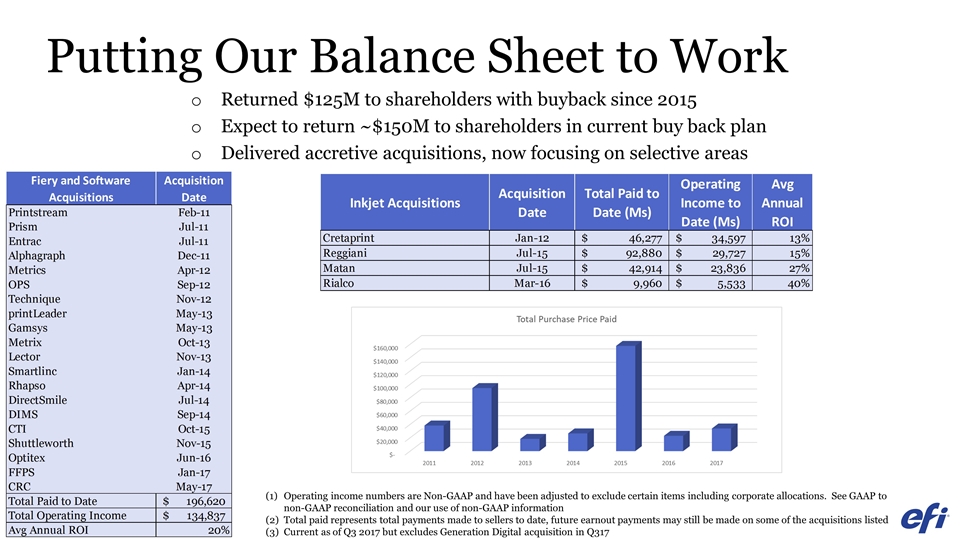
Putting Our Balance Sheet to Work Returned $125M to shareholders with buyback since 2015 Expect to return ~$150M to shareholders in current buy back plan Delivered accretive acquisitions, now focusing on selective areas Operating income numbers are Non-GAAP and have been adjusted to exclude certain items including corporate allocations. See GAAP to non-GAAP reconciliation and our use of non-GAAP information Total paid represents total payments made to sellers to date, future earnout payments may still be made on some of the acquisitions listed Current as of Q3 2017 but excludes Generation Digital acquisition in Q317
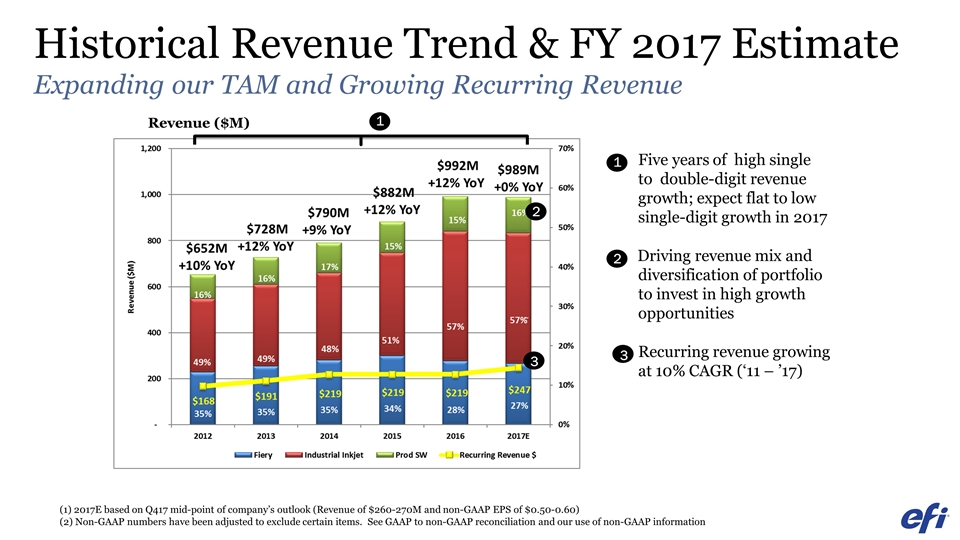
Historical Revenue Trend & FY 2017 Estimate Expanding our TAM and Growing Recurring Revenue Revenue ($M) 1 1 2 2 3 3 ~ ~ ~ Five years of high single to double-digit revenue growth; expect flat to low single-digit growth in 2017 Driving revenue mix and diversification of portfolio to invest in high growth opportunities Recurring revenue growing at 10% CAGR (‘11 – ’17) (1) 2017E based on Q417 mid-point of company’s outlook (Revenue of $260-270M and non-GAAP EPS of $0.50-0.60) (2) Non-GAAP numbers have been adjusted to exclude certain items. See GAAP to non-GAAP reconciliation and our use of non-GAAP information
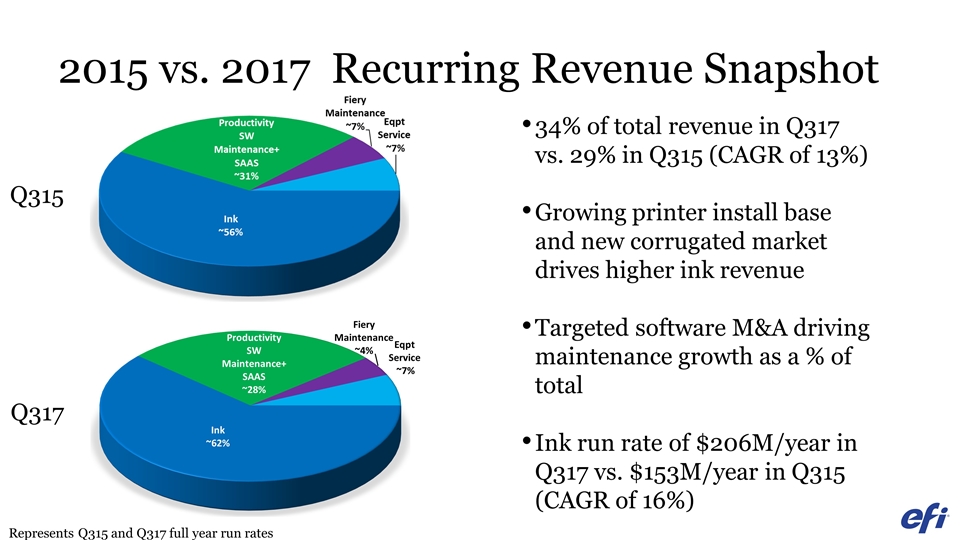
2015 vs. 2017 Recurring Revenue Snapshot 34% of total revenue in Q317 vs. 29% in Q315 (CAGR of 13%) Growing printer install base and new corrugated market drives higher ink revenue Targeted software M&A driving maintenance growth as a % of total Ink run rate of $206M/year in Q317 vs. $153M/year in Q315 (CAGR of 16%) Represents Q315 and Q317 full year run rates Q315 Q317
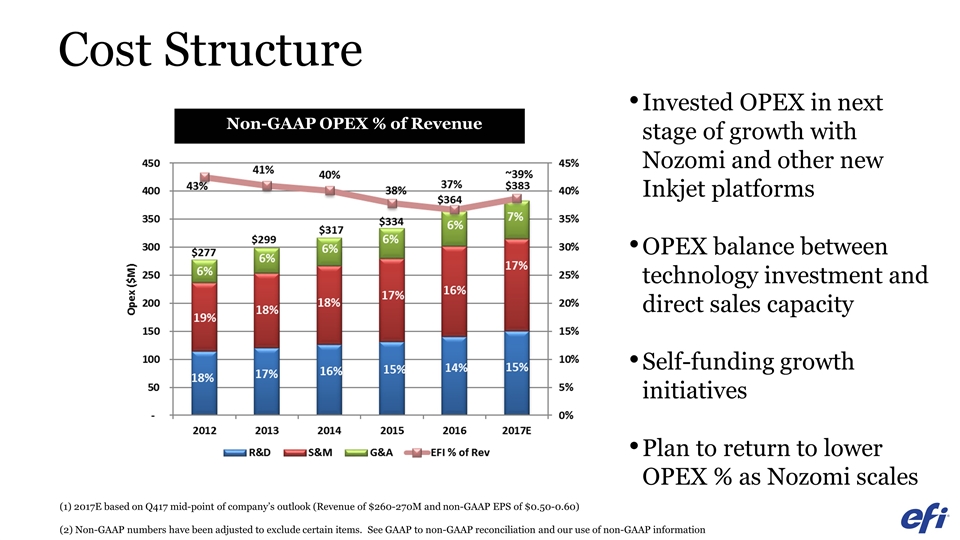
Cost Structure Invested OPEX in next stage of growth with Nozomi and other new Inkjet platforms OPEX balance between technology investment and direct sales capacity Self-funding growth initiatives Plan to return to lower OPEX % as Nozomi scales Non-GAAP OPEX % of Revenue (1) 2017E based on Q417 mid-point of company’s outlook (Revenue of $260-270M and non-GAAP EPS of $0.50-0.60) (2) Non-GAAP numbers have been adjusted to exclude certain items. See GAAP to non-GAAP reconciliation and our use of non-GAAP information
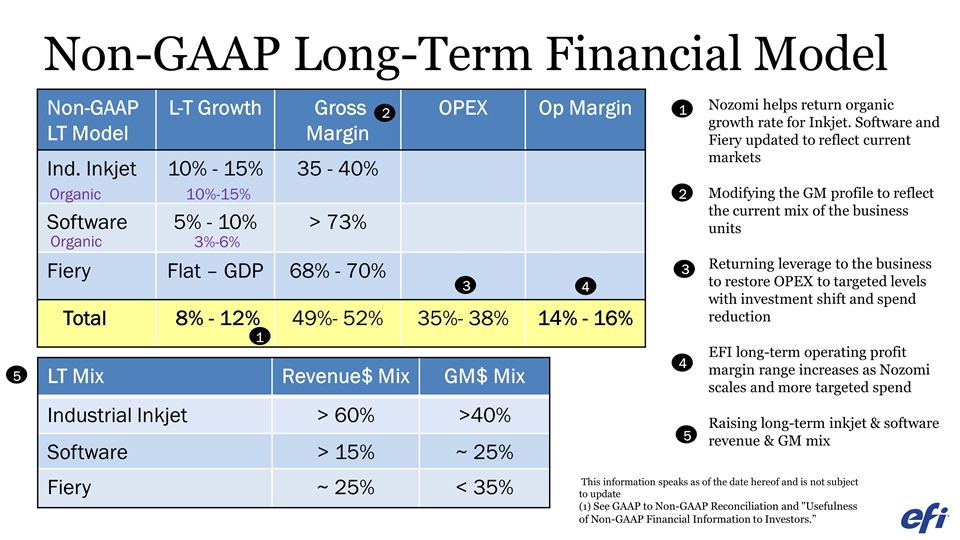
5 5 Non-GAAP LT Model L-T Growth Gross Margin OPEX Op Margin Ind. Inkjet 10% - 15% 35 - 40% Software 5% - 10% > 73% Fiery Flat – GDP 68% - 70% Total 8% - 12% 49%- 52% 35%- 38% 14% - 16% 10%-15% Organic Organic 3%-6% Non-GAAP Long-Term Financial Model 1 2 2 4 3 3 4 Nozomi helps return organic growth rate for Inkjet. Software and Fiery updated to reflect current markets Modifying the GM profile to reflect the current mix of the business units Returning leverage to the business to restore OPEX to targeted levels with investment shift and spend reduction EFI long-term operating profit margin range increases as Nozomi scales and more targeted spend Raising long-term inkjet & software revenue & GM mix 1 LT Mix Revenue$ Mix GM$ Mix Industrial Inkjet > 60% >40% Software > 15% ~ 25% Fiery ~ 25% < 35% This information speaks as of the date hereof and is not subject to update (1) See GAAP to Non-GAAP Reconciliation and "Usefulness of Non-GAAP Financial Information to Investors.”
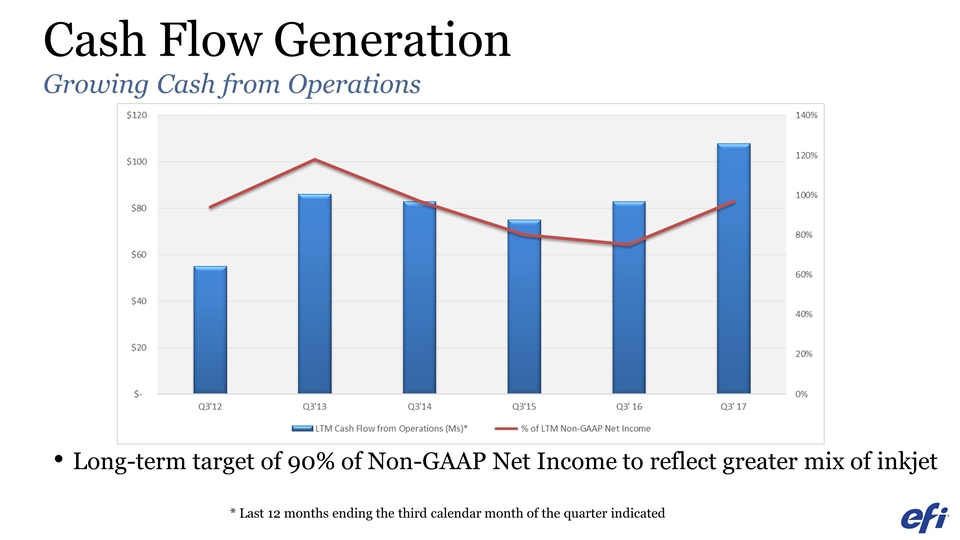
Cash Flow Generation Growing Cash from Operations * Last 12 months ending the third calendar month of the quarter indicated 90-95% is the cash target Long-term target of 90% of Non-GAAP Net Income to reflect greater mix of inkjet
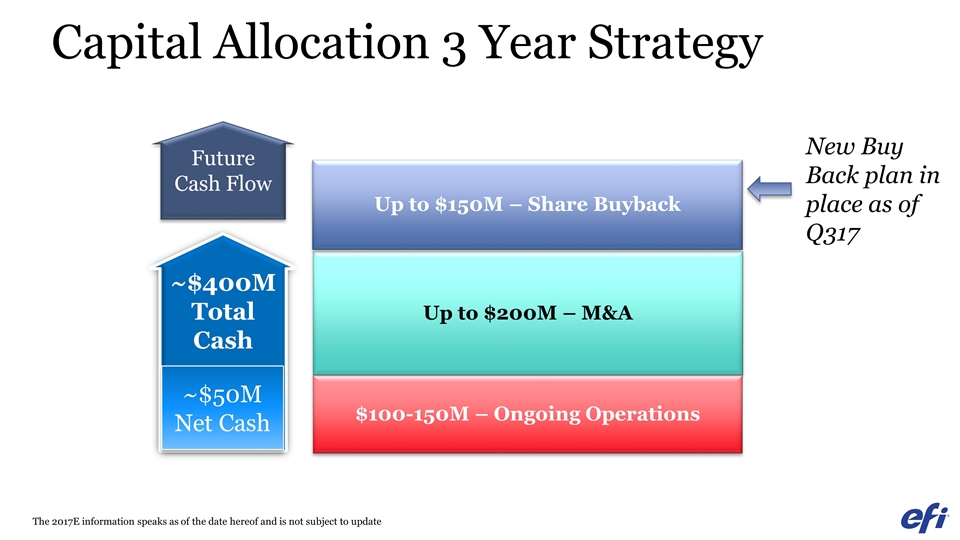
Capital Allocation 3 Year Strategy Up to $200M – M&A Up to $150M – Share Buyback $100-150M – Ongoing Operations ~$400M Total Cash Future Cash Flow The 2017E information speaks as of the date hereof and is not subject to update New Buy Back plan in place as of Q317 ~$50M Net Cash
What changes are we making? Created new Chief Process Officer role to work on addressing process inefficiencies and gaps Hiring a new CAO Adding new technical accounting and revenue recognition resources Putting in place new processes throughout the organization to monitor operational changes Changed process at prior vendor to avoid “bill and hold” transactions in the future

Closing Remarks
Today’s Three Key Messages 1) Immense Opportunity for digital, on-demand production in imaging intensive industries 2) We are doubling down on the largest growth opportunity areas 3) Recognizing our missteps, we are making significant changes to return to our historic level of performance
Top 10 Digital Printer Manufacturer Revenue Where would you invest? -4% CAGR -4% CAGR -4% CAGR 5% CAGR $121B $129B $88B $86B $91B * Source www.it-strategies.com
Appendix
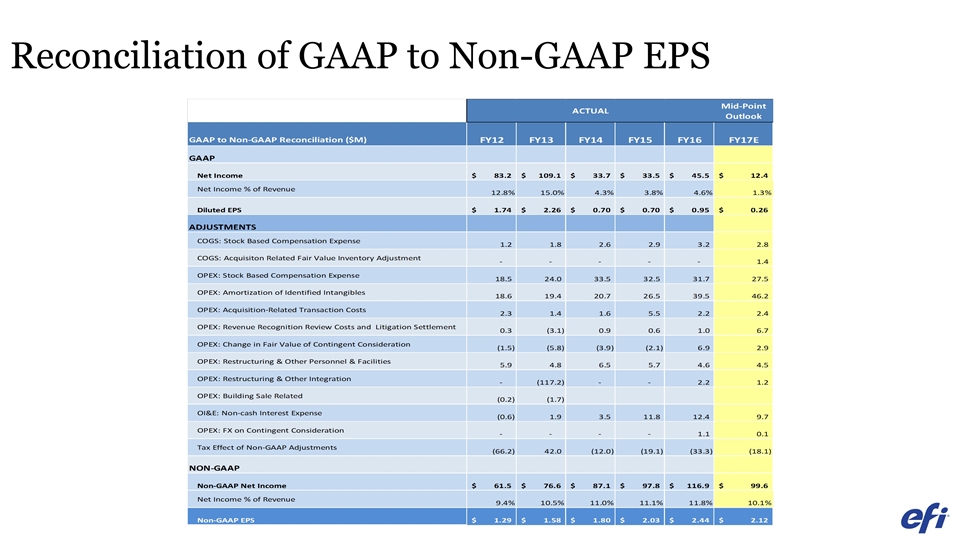
Reconciliation of GAAP to Non-GAAP EPS
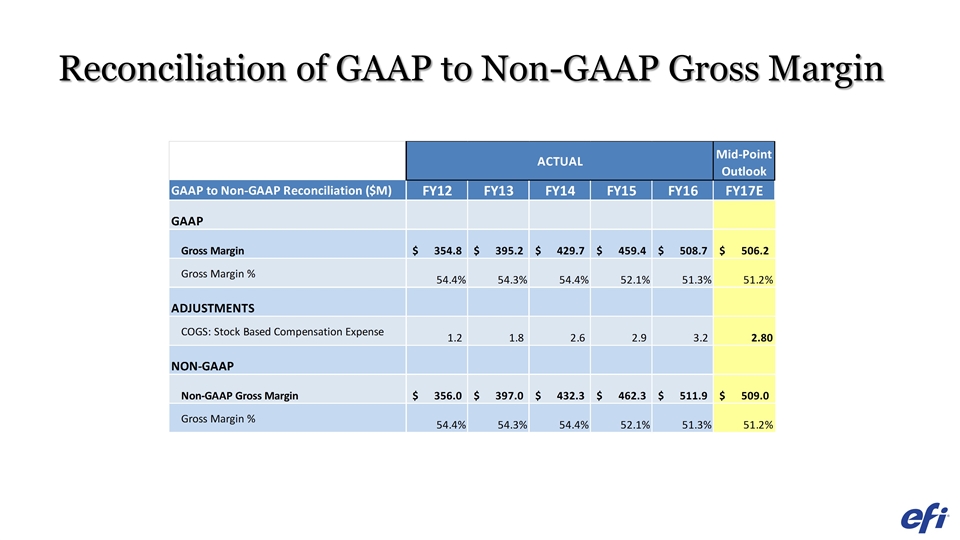
Reconciliation of GAAP to Non-GAAP Gross Margin
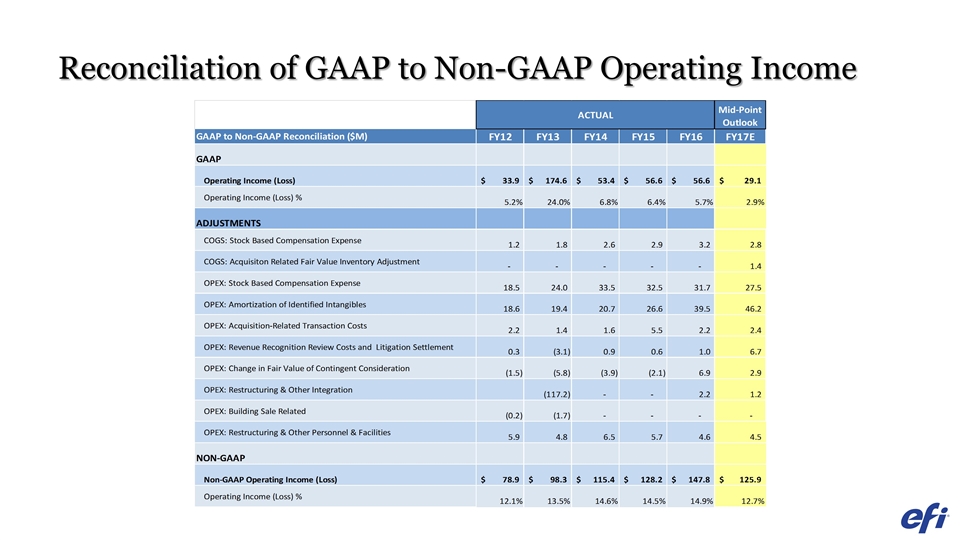
Reconciliation of GAAP to Non-GAAP Operating Income
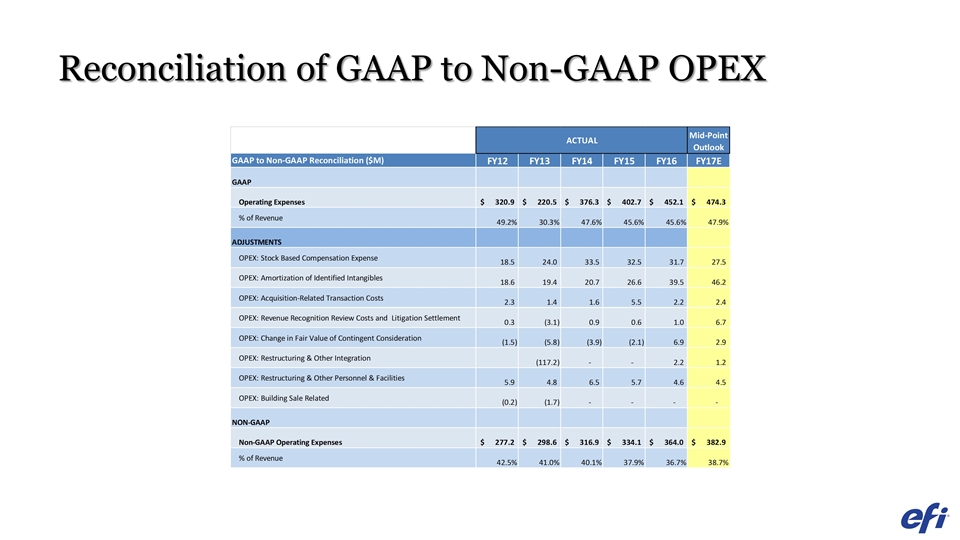
Reconciliation of GAAP to Non-GAAP OPEX
About our Non-GAAP Financial Measures and Adjustments Use of Non-GAAP Financial Information To supplement our condensed consolidated financial results prepared in accordance with GAAP, we use non-GAAP measures of operating income, net income, and earnings per diluted share that are GAAP operating income, GAAP net income, GAAP operating expenses, GAAP gross margin, GAAP operating profit , GAAP earnings, operating expenses, gross margin, and operating profit per diluted share adjusted to exclude certain cost, expenses, and gains. We believe that the presentation of non-GAAP operating income, non-GAAP net income, and non-GAAP earnings per diluted share provides important supplemental information regarding non-cash expenses and significant items that we believe are important to understanding financial and business trends relating to our financial condition and results of operations. Non-GAAP operating income, non-GAAP net income, and non-GAAP earnings per diluted share are among the primary indicators used by management as a basis for planning and forecasting future periods and by management and our Board of Directors to determine whether our operating performance has met specified targets and thresholds. Management uses non-GAAP operating income, non-GAAP net income, and non-GAAP earnings per diluted share when evaluating operating performance because it believes the exclusion of the items described below, for which the amounts and/or timing may vary significantly depending on our activities and other factors, facilitates comparability of our operating performance from period to period. We have chosen to provide this information to investors so they can analyze our operating results in the same way that management does and use this information in their assessment of our business and the valuation of our Company. Use and Economic Substance of Non-GAAP Financial Measures We compute non-GAAP operating income, non-GAAP net income, and non-GAAP earnings per diluted share by adjusting GAAP operating income, GAAP net income, and GAAP earnings per diluted share to remove the impact of amortization of acquisition-related intangibles, stock-based compensation expense, restructuring and other expenses, acquisition-related transaction expenses, costs to integrate such acquisitions into our business, incremental cost of revenue due to the fair value adjustment to inventories acquired in business combinations, changes in the fair value of contingent consideration, revenue recognition review costs and litigation settlement charges, and non-cash interest expense related to our 0.75% convertible senior notes (“Notes”). We use a constant non-GAAP tax rate of 19%, which we believe reflects the long term average tax rate based on our international structure and geographic distribution of revenue and profit. Ex-Currency. To better understand trends in our business, we believe it is helpful to adjust our statement of operations to exclude the impact of year-over-year changes in the translation of foreign currencies into U.S. dollars. This is a non-GAAP measure that is calculated by adjusting revenue, non-GAAP operating income, and non-GAAP net income by using historical exchange rates in effect during the comparable prior year period and removing the balance sheet currency remeasurement impact from interest income and other expense, net, including removal of any hedging gains and losses. We refer to these adjustments as “ex-currency.” Management believes the ex-currency measures provide investors with an additional perspective on year-over-year financial trends and enables investors to analyze our operating results in the same way management does. The year-over-year currency impact can be determined as the difference between year-over-year actual growth rates and year-over-year ex-currency growth rates. These excluded items are described below: Inventory acquired in the acquisition of FreeFlow print server business from Xerox Corporation is required to be recorded at fair value rather than historical cost in accordance with ASC 805. The fair value of FreeFlow print server inventory reflects the manufacturing cost plus a portion of the expected gross profit. We have adjusted our cost of revenue to reflect the expected gross profit that was included in the inventory valuation under ASC 805. We believe this adjustment is useful to investors to understand the gross profit trends of our ongoing business. Intangible assets acquired to date are being amortized on a straight-line basis. Stock-based compensation expense of $22.5 and $29.7 million during the nine months ended September 30, 2017 and 2016, respectively, consists of $22.5 and $26.9 million of stock-based compensation expense recognized in accordance with ASC 718, Stock Compensation, and the non-cash settlement of $2.8 million of vacation liabilities settled through the issuance of RSUs during the nine months ended September 30, 2016, which is not included in the GAAP presentation of our stock-based compensation expense.
About our Non-GAAP Financial Measures and Adjustments (continued) Restructuring and other expenses consist of: Restructuring charges incurred as we consolidate the number and size of our facilities and, as a result, reduce the size of our workforce. Expenses incurred to integrate businesses acquired of $0.2 and $1.0 million for the three and six months ended September 30, 2017, respectively, and $0.6 and $1.5 million for the three and six months ended September 30, 2016 respectively. Acquisition-related transaction costs associated with businesses acquired during the periods reported and anticipated transactions of $0.6 and $1.8 million for the three and six months ended September 30, 2017, respectively, and $0.4 and $1.7 million for the three and six months ended September 30, 2016, respectively. Changes in fair value of contingent consideration. Our management determined that we should analyze the total return provided by the investment when evaluating operating results of an acquired entity. The total return consists of operating profit generated from the acquired entity compared to the purchase price paid, including the final amounts paid for contingent consideration without considering any post-acquisition adjustments related to changes in the fair value of the contingent consideration. Because our management believes the final purchase price paid for the acquisition reflects the accounting value assigned to both contingent consideration and to the intangible assets, we exclude the GAAP impact of any adjustments to the fair value of acquisition-related contingent consideration from the operating results of an acquisition in subsequent periods, including the related foreign exchange fluctuation impact. We believe this approach is useful in understanding the long-term return provided by our acquisitions and that investors benefit from a supplemental non-GAAP financial measure that excludes the impact of this adjustment. Non-cash interest expense on our Notes. Our Notes may be settled in cash on conversion. We are required to separately account for the liability (debt) and equity (conversion option) components of the Notes in a manner that reflects our non-convertible debt borrowing rate. Accordingly, for GAAP purposes, we are required to amortize a debt discount equal to the fair value of the conversion option as interest expense on our $345 million of 0.75% convertible senior notes that were issued in a private placement in September 2014 over the term of the Notes. Revenue recognition costs and Litigation settlements. As described in “Item 9A, Controls and Procedures” of our annual report on Form 10-K, for the year ended December 31, 2016, as amended, our management concluded that we had material weaknesses in our internal control over financial reporting as of December 31, 2016 related to revenue recognition practices and therefore did not maintain effective internal control over financial reporting or effective disclosure controls and procedures, both of which are requirements of the Securities Exchange Act of 1934, as of that date. The review of our revenue recognition practices has required that we expend significant management time and incur significant accounting, legal, and other expenses totaling $4.7 million during the three and nine months ended September 30, 2017, and we expect to incur additional costs in the future periods. We settled or accrued reserves related to several litigation claims of $0.1 and $0.4 million for the three and nine months ended September 30, 2017, respectively, and $0.1 and $0.9 million during the three and nine months ended September 30, 2016, respectively. Tax effect of non-GAAP adjustments. We use a constant non-GAAP tax rate of 19%, which we believe reflects the long term average tax rate based on our international structure and geographic distribution of revenue and profit. The long-term average tax rate is calculated in accordance with the principles of ASC 740, Income Taxes, to estimate the non-GAAP income tax provision in each jurisdiction in which we operate after excluding the tax effect of the non-GAAP items described above. Usefulness of Non-GAAP Financial Information to Investors Our non-GAAP measures are not in accordance with or an alternative to GAAP and may be materially different from other non-GAAP measures, including similarly titled non-GAAP measures, used by other companies. The presentation of this additional information should not be considered in isolation from, as a substitute for, or superior to, net income or earnings per diluted share prepared in accordance with GAAP. Non-GAAP financial measures have limitations in that they do not reflect certain items that may have a material impact upon our reported financial results. We expect to continue to incur expenses of a nature similar to the non-GAAP adjustments described above, and exclusion of these items from our non-GAAP financial metrics should not be construed as an inference that these costs are unusual, infrequent, or non-recurring.
