Attached files
Table of Contents
UNITED STATES
SECURITIES AND EXCHANGE COMMISSION
Washington D.C. 20549
FORM 10-K
(Mark One)
| x | ANNUAL REPORT PURSUANT TO SECTION 13 OR 15(d) OF THE SECURITIES EXCHANGE ACT OF 1934 |
For the fiscal year ended December 31, 2010
| ¨ | TRANSITION REPORT PURSUANT TO SECTION 13 OR 15(d) OF THE SECURITIES EXCHANGE ACT OF 1934 |
Commission File Number: 000-18805
ELECTRONICS FOR IMAGING, INC.
(Exact name of registrant as specified in its charter)
| Delaware | 94-3086355 | |
| (State or other Jurisdiction of incorporation or organization) |
(I.R.S. Employer Identification No.) |
303 Velocity Way, Foster City, CA 94404
(Address of principal executive offices) (Zip Code)
(650) 357-3500
(Registrant’s telephone number, including area code)
Securities registered pursuant to Section 12(b) of the Act:
| Title of Each Class |
Name of Exchange on which Registered | |
| Common Stock, $.01 Par Value | The NASDAQ Stock Market LLC |
Securities registered pursuant to Section 12(g) of the Act: None
Indicate by check mark if the registrant is a well-known seasoned issuer, as defined in Rule 405 of the Securities Act. Yes ¨ No x
Indicate by check mark if the registrant is not required to file reports pursuant to Section 13 or Section 15(d) of the Act. Yes ¨ No x
Indicate by check mark whether the registrant (1) has filed all reports required to be filed by Section 13 or 15(d) of the Securities Exchange Act of 1934 during the preceding 12 months (or for such shorter period that the registrant was required to file such reports) and (2) has been subject to such filing requirements for the past 90 days. Yes x No ¨
Indicate by check mark whether the registrant has submitted electronically and posted on its corporate Web site, if any, every Interactive Data File required to be submitted and posted pursuant to Rule 405 of Regulation S-T (§ 232.405 of this chapter) during the preceding 12 months (or for such shorter period that the registrant was required to submit and post such files). Yes ¨ No ¨
Indicate by check mark if disclosure of delinquent filers pursuant to Item 405 of Regulation S-K (§ 229.405 of this chapter) is not contained herein, and will not be contained, to the best of registrant’s knowledge, in definitive proxy or information statements incorporated by reference in Part III of this Form 10-K or any amendment to this Form 10-K. x
Indicate by check mark whether the registrant is a large accelerated filer, an accelerated filer, a non-accelerated filer, or a smaller reporting company. See the definitions of “large accelerated filer”, “accelerated filer” and “smaller reporting company” in Rule 12b-2 of the Exchange Act.
| Large accelerated filer ¨ | Accelerated filer x | |||
| Non-accelerated filer ¨ | Smaller reporting company ¨ | |||
Indicate by check mark whether the registrant is a shell company (as defined in Rule 12b-2 of the Exchange Act). Yes ¨ No x
The aggregate market value of the voting and non-voting common stock held by non-affiliates computed by reference to the price at which the common stock was last sold on June 30, 2010 was $355,940,608.**
The number of shares outstanding of the registrant’s common stock, $.01 par value per share, as of February 25, 2011 was 46,854,952.
DOCUMENTS INCORPORATED BY REFERENCE
Portions of the definitive Proxy Statement to be delivered to stockholders in connection with the 2011 Annual Meeting of Stockholders are incorporated by reference into Part III hereof.
** Based upon the last trade price of the registrant’s common stock reported on The NASDAQ Global Select Market on June 30, 2010, the last business day of the registrant’s second quarter of the 2010 fiscal year. Excludes approximately 8,776,038 shares of common stock held by directors, executive officers and holders known to the registrant to hold 10% or more of the registrant’s outstanding common stock in that such persons may be deemed to be affiliates. This determination of executive officer or affiliate status is not necessarily a conclusive determination for other purposes. Exclusion of shares held by any person should not be construed to indicate that such person possesses the power, direct or indirect, to direct or cause the direction of the management or policies of the registrant, or that such person is controlled by or under common control with the registrant.
Table of Contents
Table of Contents
FORWARD-LOOKING STATEMENTS
Certain of the information contained in this Annual Report on Form 10-K, including, without limitation, statements made under this Part I, Item 1, “Business,” Part II, Item 7, “Management’s Discussion and Analysis of Financial Condition and Results of Operations,” and Part II Item 7A, “Quantitative and Qualitative Disclosures about Market Risk,” which are not historical facts, may include “forward-looking statements” within the meaning of Section 27A of the Securities Act of 1933, as amended (“Securities Act”), and Section 21E of the Securities Exchange Act of 1934, as amended (“Exchange Act”), and is subject to risks and uncertainties and actual results or events may differ materially. When used herein, the words “anticipate,” “believe,” “estimate,” “expect,” “intend,” “will,” “may,” “should,” “plan,” “potential,” “seek,” “continue,” and similar expressions as they relate to the Company or its management are intended to identify such statements as “forward-looking statements.” Such statements reflect the current views of the Company and its management with respect to future events and are subject to certain risks, uncertainties, and assumptions. Should one or more of these risks or uncertainties materialize, or should underlying assumptions prove incorrect, the Company’s actual results, performance, or achievements could differ materially from the results expressed in, or implied by, these forward-looking statements. Important factors that could cause the Company’s actual results to differ materially from those included in the forward-looking statements made herein include, without limitation, those factors discussed in Item 1, “Business,” in Item 1A, “Risk Factors,” and elsewhere in this Annual Report on Form 10-K and in the Company’s other filings with the Securities and Exchange Commission (“SEC”), including the Company’s most recent Quarterly Report on Form 10-Q and Current Reports on Form 8-K, and any amendments thereto. The Company assumes no obligation to revise or update these forward-looking statements to reflect actual results, events, or changes in factors or assumptions affecting such forward-looking statements.
1
Table of Contents
PART I
This Annual Report on Form 10-K includes certain registered trademarks, trademarks, and trade names of Electronics For Imaging, Inc., its subsidiaries, and others. Electronics For Imaging, the EFI logo, the Fiery logo, Fiery, Inkware, Jetrion, VUTEk, and PrintFlow are registered trademarks of the Company in the U.S. and/or certain other countries. Digital StoreFront, Hagen, Logic, Pace, PrintSmith, and Rastek are trademarks of the Company in the U.S. and/or certain other countries. All other terms and product names may be trademarks or registered trademarks of their respective owners, and are hereby acknowledged. References to “EFI,” the “Company,” “we,” “us,” and “our” mean Electronics For Imaging, Inc. and its subsidiaries, unless the context means otherwise.
Filings
We file Annual Reports on Form 10-K, Quarterly Reports on Form 10-Q, Current Reports on Form 8-K, proxy statements, and other documents with the SEC under the Exchange Act. The public may read and copy any materials that we file with the SEC at the SEC’s Public Reference Room at Room 1580, 100 F Street, N.E., Washington, D.C. 20549. The public may obtain information on the operation of the Public Reference Room by calling the SEC at 1-800-SEC-0330. The SEC also maintains an Internet website that contains reports, proxy statements, information statements, and other information regarding issuers, including EFI, that file electronically with the SEC. The public can obtain any documents that we file with the SEC at http://www.sec.gov.
We also make available free of charge through our Internet website (http://www.efi.com) our Annual Reports on Form 10-K, Quarterly Reports on Form 10-Q, Current Reports on Form 8-K, proxy statements, and if applicable, amendments to those reports filed or furnished pursuant to the Exchange Act as soon as reasonably practicable after we electronically file such material with, or furnish it to, the SEC.
General
EFI was incorporated in Delaware in 1988 and commenced operations in 1989. In 1992, we made our initial public offering of common stock. Our common stock is traded on The NASDAQ Global Select Market under the symbol EFII. Our corporate offices are located at 303 Velocity Way, Foster City, California 94404.
We are a world leader in customer-focused digital printing innovation, including color digital print controllers, super-wide and wide format printers and ink, and print management solutions. Our award-winning print management solutions are integrated from creation to print. Our product portfolio includes Fiery digital color print servers (“Fiery”); Inkjet products (“Inkjet”) including VUTEk super-wide digital inkjet printers, Jetrion industrial inkjet printing systems, Rastek wide format digital inkjet printers, and ink for each of these product lines; and Advanced Professional Print Software (“APPS”) consisting of print production workflow, management information software, and corporate printing and packaging solutions. Our integrated solutions and award-winning technologies are designed to automate print and business processes, streamline workflow, provide profitable value-added services, and produce accurate digital output.
Products and Services
Fiery
EFI’s Fiery brand consists of print servers, controllers, or digital front ends (“DFEs”), which transform digital copiers and printers into high performance networked printing devices. Once networked, Fiery-powered printers and copiers can be shared across workgroups, departments, the enterprise, and the Internet to quickly and economically produce high-quality color and black & white documents. Our Fiery servers are primarily sold to
2
Table of Contents
original equipment manufacturers (“OEMs”) for sale to end-users and are comprised of (i) stand-alone print controllers connected to digital copiers and other peripheral devices, (ii) embedded and design-licensed solutions used in digital copiers and multi-functional devices, (iii) optional software integrated into our controller solutions, and (iv) stand-alone software-based solutions such as our proofing and scanning solutions.
Our main controller platforms, primary OEM customers, and user environments are as follows:
| Platform |
Primary OEMs |
User environments | ||
| Fiery external print servers | Canon, Fuji Xerox, Konica Minolta, OKI Data, Ricoh, Toshiba, Xerox |
Print for Pay, Corporate Reprographic Departments, Graphic Arts, Advertising Agencies, Transactional Printers, Commercial Printers | ||
| Fiery embedded and design-licensed solutions |
Canon, Fuji Xerox, Konica Minolta, OKI Data, Ricoh, Toshiba, Xerox |
Office Environments, Print for Pay, and Quick Printers | ||
| Splash | Xerox | Graphic Arts, Advertising Agencies | ||
| MicroPress | Canon, Konica Minolta, Ricoh | Corporate Reprographic Departments, Commercial Printers | ||
| Proofing software: ColorProof XF, Fiery XF, ColorProof eXpress, and Xflow | Digital color proofing and inkjet production print solutions offering fast, flexible workflow, power, and expandability | Digital, commercial and hybrid printers, prepress providers, publishers, creative agencies and photographers, and super-wide & wide format print providers | ||
Inkjet—VUTEk, Jetrion, and Rastek
Our industry-leading VUTEk super-wide format digital inkjet printers and ink are used by billboard graphics printers, commercial photo labs, large sign shops, graphic screen printers, and digital graphics providers to print billboards, building wraps, banners, art exhibits, point of purchase signage, customized interior design, and other large displays. We introduced the GS series of high-speed, high-resolution super-wide format printers in 2009. VUTEk printers primarily use ultra-violet (“UV”) curable ink, although solvent ink printers remain in use in the field.
Our Jetrion products specialize in industrial label digital printing and provide a wide array of industrial inkjet systems, custom high-performance integration solutions, and specialty ink to the converting, packaging, and direct mail industries. In 2008, we launched our Jetrion 4000 Full Color Digital Label printer focused on short run, on-demand, color label printing. Our Jetrion 4830 printer was launched in 2009 and accommodates wider printing requirements and significantly increases throughput. We launched our Jetrion 4830LED printer with full LED UV curing technology accommodates printing on flexible packaging materials in 2010.
Rastek develops, manufacturers, and markets our early stage hybrid and flatbed UV wide format graphics printers to the mid-range inkjet printer market. In 2009, the launch of the H650 and T660 Rastek wide format printers offered high image quality to mid-size print companies. This was followed by the increased speed of the H652 and flexibility of the T1000 wide format printers, which were launched in 2010.
We also manufacture and market the ink used in our inkjet printers. Our ink is customized for each of our printers to provide optimum performance on that printer. In addition, we manufacture and sell private label ink to third party inkjet printer manufacturers. Our ink provides a recurring revenue stream generated from sales to our existing customer base as well as sales to third parties.
3
Table of Contents
Some of our printers and their related features are as follows:
| Printer Type |
Models |
Capabilities |
Application Examples | |||
| VUTEk | UltraVU Series VUTEk 3360 PressVu Series GS and QS Series |
Printing widths of 1.5 to 5.0 meters; 4, 6, 7, and 8 colors; Flexible and rigid substrates; UV curable and solvent inks | Banners, Billboards, Signage, Building Wraps, Flags, Point of purchase and exhibition signage, Backlit displays, and Photo-quality graphics | |||
| Jetrion | 4000 Series | Print resolutions up to 1000 dpi; 4 or 6 colors; Precise color-color registration | Primary and secondary label applications, Industrial label or flexible packaging markets | |||
| Rastek | H Series T Series |
Speeds up to 29.7 square meters per hour and up to 1,200 dpi; Handles media of thicknesses up to 5 centimeters | Indoor and outdoor graphics with photographic image quality | |||
APPS
To provide our customers with solutions to manage their printing operations, we have developed technology that enhances printing workflow and makes printing operations more powerful, productive, and easier to manage. Most of our software solutions have been developed with the express goal of automating print processes and streamlining workflow via open, integrated, and interoperable EFI products, services, and solutions. The APPS operating segment includes our management systems software, including Monarch (formerly Hagen), Pace, PSI, Logic, PrintSmith, and PrintFlow; Digital StoreFront, our web-based order entry and order management software; and Radius, our print management packaging software. We acquired privately held Golflane Limited (“Golflane”), a U.K. private limited company, the parent holding company of Radius Solutions Incorporated (“Radius”) in July 2010, to establish our presence in the packaging industry. Radius is a leading provider of print management information systems (“PMIS”) to the packaging industry.
We sell PrintSmith to small print-for-pay and small commercial print shops; Pace to medium and large commercial print shops, display graphics providers, in-plant printing operations, and government printing operations; Monarch to large commercial, publication, and digital print shops; and Radius to the packaging industry.
Our enterprise resource planning and collaborative supply chain software print management solutions are designed to enable printers and print buyers to improve productivity and customer service while reducing costs. Procurement applications for print buyers and print producers facilitate web-based collaboration across the print supply chain. Customers recognize that PMIS are essential to improving their business practices and profitability. We are focused on making our PMIS solutions the global industry standard.
4
Table of Contents
Our primary software offerings currently include:
| Product Name |
Description |
User | ||
| Print management information systems: Monarch (previously Hagen), PSI, PrintSmith, PrintFlow, and Radius | Collect, organize, and present critical information to improve process control and profit potential | Commercial, publishing, digital, in-plant, print for pay, large format, and specialty printing and packaging companies | ||
| Web-based order entry and order management systems: Digital StoreFront, PrinterSite, and PrintSmith Site | Web interface to manage print transactions between customer and printer | Commercial, publishing, digital, in-plant, print for pay, large format, and specialty printers | ||
| Web-based print management system: EFI Pace | Software modules for: estimating, scheduling, print production, accounting, and e-commerce | Commercial, Digital, Display Graphics, In- Plant, and Print for Pay | ||
Growth and Expansion Strategies
Our overall objective is to continue to introduce new generations of digital print controllers and expand and improve our offerings in inkjet, professional printing software applications, and other new product lines related to digital printing, workflow, and print management. With respect to our current products, our primary goal is to offer best of breed solutions that are interoperable and conform to open standards, which will allow customers to configure the most efficient solution for their business. Our strategy to accomplish these goals consists of four key elements: proliferate and expand product lines; develop and expand relationships with key industry participants; establish enterprise coherence and leverage industry standardization; and leverage technology and industry expertise to expand the scope of products, channels and markets. Each of these items is discussed below.
Proliferate and Expand Product Lines
We intend to continue to develop new digital print controllers that are “scalable,” meaning products that continue to meet the changing needs of the user as their business grows. Our products offer a broad range of features and functionality when connected to, or integrated with, digital color and black & white copiers.
We intend to continue our development of platform enhancements that advance the performance and usability of our software applications in order to provide cohesive, integrated solutions for our customers.
In 2009, we introduced our next generation Fiery hardware along with new versions of our Fiery workflow solutions, document scanning solutions, and production management application, “Command Workstation 5.” In 2010, we have continued to launch various upgrades to our Fiery product line including the next generation Fiery platform with new color tools, support of Adobe® PDF Print Engine v2 for pure PDF workflows, and improved Job Definition Format (“JDF”) integration.
Also in 2009, we added the Jetrion 4830 UV Inkjet System with a wider web width (8.3 inches) and faster linear speeds. The 4830 increases throughput compared to the market leading Jetrion 4000. The Jetrion 4830LED printer was launched in 2010 with full LED UV curing technology, which accommodates printing on flexible packaging materials.
In 2009, we introduced the GS series of super-wide format printers. The GS2000 is a 2-meter printer that delivers photorealistic quality at high speeds. The GS3200 3.2 meter printer also delivers photorealistic quality and higher speed, while expanding the reach of the super-wide format printer into new industries and innovative applications. The GS5000r printer was launched in 2010 and offers higher quality and speed that focuses on markets that demand point-of-purchase-quality graphics.
5
Table of Contents
We explore acquisition possibilities as a means of expanding our product line-up and customer base. Although there can be no assurance that acquisitions will be successful, acquisitions have allowed us to broaden our product lines. Examples include the Radius and Pace acquisitions within the APPS product line in 2010 and 2008, respectively, and the addition of Rastek to the Inkjet product line in 2008.
We have announced an intention to continue to explore additional acquisition opportunities in the APPS operating segment to further consolidate the PMIS and web-based print order entry and order management industries in both the Americas and other geographies worldwide. For example, subsequent to year-end, on February 16, 2011, we acquired Streamline Development, LLC (“Streamline”). Streamline is the provider of PrintStream PMIS software focused on mailing and fulfillment services for the printing industry.
Develop and Expand Relationships with Key Industry Participants
Our customer relationships are one of our most important assets. We have established relationships with leading printer and copier industry companies, including Canon, Fuji Xerox, Konica Minolta, Kyocera Mita, OKI Data, Ricoh, Toshiba, and Xerox, which we collectively refer to as our OEM customers.
Our relationships with our OEM customers are based upon business relationships we have established over time. Our agreements with our OEM customers generally do not require them to make any future purchases from us. They are generally free to purchase products from our competitors or build their own products and cease purchasing our products at any time, for any reason, or no reason.
Our Inkjet and APPS products are sold both direct and via distribution arrangements to all sizes of print providers. We have established relationships with many leading distribution companies in the office, graphic arts, and commercial print industries such as Nazdar, Heidelberg, 3M, xpedx, Global Imaging, as well as OEM customers including Ricoh, Canon, and Konica Minolta.
We have also established global relationships with many of the leading print providers, such as R.R. Donnelley, Fedex Office, and Staples. These direct sales relationships, along with dealer arrangements, are important for our understanding of the end markets for our products and serve as a source of future product development ideas. In many cases, our products are customized for the needs of large customers, yet maintain the common intuitive interfaces that we are known for around the world.
Establish Enterprise Coherence and Leverage Industry Standardization
In developing new products and platforms, we establish coherence across our entire product line by designing products that provide a consistent “look and feel” to the end-user. We believe cross-product coherence creates higher productivity levels as a result of shortened learning curves. We believe the integrated coherence that end-users can achieve using our products for all of their digital printing and imaging needs leads to a lower total cost of ownership. We advocate open architecture utilizing industry-established standards to provide interoperability across a range of digital printing devices and software applications, ultimately providing end-users more choice and flexibility in their selection of products. For example, integration between our web-based Digital StoreFront application, our Monarch PMIS application, and our Fiery XF Production Color RIP including integration to our Fiery or VUTEk product lines, is achieved by leveraging the industry standard JDF.
Leverage Technology and Industry Expertise to Expand the Scope of Products, Channels, and Markets
We have assembled, internally and through acquisitions, an experienced team of technical support and sales and marketing personnel with backgrounds in color reproduction, digital pre-press, image processing, management information systems, networking, and software and hardware engineering, as well as market knowledge of enterprise printing, graphic arts, and commercial printing. By applying our expertise in these areas, we expect to continue to expand the scope and sophistication of our products and gain access to new markets and channels of distribution.
6
Table of Contents
For example, the scope of our software applications was expanded in 2010 through the launch of PrintMe Connect, which is a software application that enables direct printing from Apple® iPad, iPhone®, and iPod touch® iOS 4.2-enabled devices to EFI Fiery-driven printers or multi-function peripherals. PrintMe was the world’s first cloud-based printing platform that enabled mobile workers to upload their documents to the PrintMe cloud and securely print them on any PrintMe-enabled printer.
Significant Relationships
We have established and continue to build and expand relationships with our OEM customers and distributors of digital printing technology to benefit from their products, distribution channels, and marketing resources. Our customers include domestic and international manufacturers, distributors, and sellers of color and black & white digital copiers and wide format printers. We work closely with our OEM customers to develop solutions that incorporate leading technology and work optimally in conjunction with their products. The top revenue-generating OEM customers, in alphabetical order, that we sold products to in 2010 were Canon, Fuji Xerox, Konica Minolta, OKI Data, Ricoh, Toshiba, and Xerox. Together, sales to Canon and Xerox accounted for approximately 27% of our 2010 revenue, with sales to each of these two customers accounting for more than 10% of our revenue. Because sales of our printer and copier-related products constitute a significant portion of our Fiery revenue and there are a limited number of OEMs producing copiers and printers in sufficient volume to be attractive customers for us, we expect to continue to depend on a relatively small number of OEM customers for a significant portion of our revenue in future periods. Accordingly, if we experience reduced sales or lose an important OEM customer, we will have difficulty replacing the revenue traditionally generated from such OEM customer with sales to new or existing OEM customers and our revenue may decline.
We customarily enter into development and distribution agreements with our OEM customers. These agreements can be terminated under a range of circumstances and often upon relatively short notice. The circumstances under which an agreement can be terminated vary from agreement to agreement and there can be no assurance that our OEM customers will continue to purchase products from us in the future, despite such agreements. Our agreements with our OEM customers generally do not commit such customers to make future purchases from us and they could decline to purchase products from us in the future and could purchase products from our competitors, or build the products themselves. We recognize the importance of, and work hard to maintain, our relationships with our customers. Relationships with our customers are affected by a number of factors including, among others: competition from other suppliers, competition from internal development efforts by the OEMs themselves, and changes in general economic, competitive, or market conditions such as changes in demand for our products, changes in demand for our OEM customers’ products, industry consolidation, or fluctuations in currency exchange rates. There can be no assurance that we will continue to maintain or build the relationships we have developed to date. See Item 1A—We face competition from other suppliers as well as our own OEM customers. If we are not able to compete successfully, our business may be harmed.
We have a continuing relationship pursuant to a license agreement with Adobe Systems, Inc. (“Adobe”). We license PostScript® software from Adobe for use in many of our Fiery solutions under the OEM Distribution and License Agreement entered into in September 2005. Under our agreement with Adobe, we have a non-exclusive, non-transferable license to use the Adobe deliverables (including any software, development tools, utilities, software development kits, fonts, drivers, documentation, or related materials). The scope of additional licensing terms varies depending on the type of the Adobe deliverables. The initial term of the agreement was five years, unless either party gave written notice of termination for cause at least 180 days prior to September 19, 2010. Thereafter, the agreement renews automatically on each anniversary date for additional one year periods and can be terminated by either party for any or no cause upon 120 days prior written notice. All royalties due to Adobe under the agreement are payable within 45 days after the end of each calendar quarter.
Each Fiery solution requires page description language software to operate such as that provided by Adobe. Adobe’s PostScript® software is widely used to manage the geometry, shape, and typography of hard copy documents. Adobe is a leader in providing page description software. Adobe can terminate our current PostScript® software license agreement without cause. Although to date we have successfully obtained licenses
7
Table of Contents
to use Adobe’s PostScript® software when required, Adobe is not required to, and we cannot be certain that Adobe will, grant future licenses to Adobe PostScript® software on reasonable terms, in a timely manner, or at all. In addition, to obtain licenses from Adobe, Adobe requires that we obtain quality assurance approvals from them for our products that use Adobe software. If Adobe does not grant us such licenses or approvals, if the Adobe licenses are terminated, or if our relationship with Adobe is otherwise materially impaired, we would likely be unable to sell products that incorporate Adobe PostScript® software. If that occurred, we would have to license, acquire, develop, or re-establish our own competing software as a viable alternative for Adobe Postscript® and our financial condition and results of operations could be significantly harmed for a period of time.
Our inkjet printers are constructed with inkjet print heads, which are manufactured by a limited number of suppliers. If we experience difficulty obtaining print heads, our inkjet printer production would be limited and our revenue would be harmed. In addition, we manufacture ink for use in our printers and rely on a limited number of suppliers for certain pigments used in our ink. Our ink sales would decline significantly if we were unable to obtain the pigments as needed. See Item 1A—We depend on a limited group of suppliers for key components in our products. The loss of any of these suppliers, the inability of any of these suppliers to meet our requirements, or delays or shortages of supply of these components could adversely affect our business.
Human Resources
As of December 31, 2010, we employed 1,886 full time employees. Approximately 527 were in sales and marketing, 237 were in general and administrative, 288 were in manufacturing, and 834 were in research and development. Of the total number of employees, we had approximately 1,232 employees located in the Americas (primarily the U.S.) and 654 employees located in offices outside of the Americas.
Distribution and Marketing
Our primary distribution channel for Fiery products is to sell them to our OEM customers. Our OEM customers in turn sell these products to OEM-affiliated and independent distributors/dealers/resellers and end-users for use with our OEM customers’ copiers or printers as part of an integrated printing system. See Item 1A—We rely on sales to a relatively small number of OEM customers. The loss of any of these OEM customers could substantially decrease our revenue.
The PMIS solutions within our APPS portfolio are primarily sold directly to end-users by our own sales force in North America and Europe. Our Inkjet products are sold by a direct sales force in North America and Europe and by distributors in all regions. Any interruption of either of these distribution channels could negatively impact us in the future.
An additional distribution channel for our APPS software products is to utilize a mix of distributors. We sell directly to our authorized distributors, dealers, and resellers who in turn sell the solutions to end-users either stand-alone or bundled with other solutions they offer. Primary customers with whom we have established distribution agreements include Canon, Ricoh, Konica Minolta, Oce, xpedx, and other sales companies. There can be no assurance that we will continue to successfully distribute our products through these channels.
Our proofing products are sold primarily to authorized distributors, dealers and resellers who in turn sell the solutions to end-users either stand-alone or bundled with other solutions they offer. Primary customers with whom we have established distribution agreements include Canon, Xerox, Heidelberg,, Hewlett-Packard, and other sales companies. There can be no assurance that we will continue to successfully distribute our products through these channels.
We promote our products through public relations, direct mail, advertising, promotional material, trade shows, and ongoing customer communication programs. The majority of sales leads for our inkjet printer sales are generated from trade shows. Any interruption in our trade show participation could materially impact our revenue and profitability.
8
Table of Contents
Research and Development
Research and development costs were $105.8, $110.8, and $140.4 million for the years ended December 31, 2010, 2009, and 2008, respectively. As of December 31, 2010, 834 of our 1,886 full-time employees were involved in research and development. We believe that development of new products and enhancement of existing products are essential to our continued success. Management intends to continue to devote substantial resources to research and new product development. We expect to make significant expenditures to support research and development in the foreseeable future.
We are developing products to support additional color and black & white printing devices including high-end color copiers, digital black & white copiers, and multi-functional devices. We are also developing new software applications designed to maximize workflow efficiencies and meet the needs of the graphic arts and commercial print professional, including proofing and PMIS solutions. We also expect to continue to develop new platforms of inkjet print technologies to meet the needs of existing and future markets. We have research and development sites in 12 U.S. locations, as well as in India, Japan, and Europe. Please refer to “Growth and Expansion Strategies—Proliferate and Expand Product Lines” above. Substantial additional expense is required to complete and bring to market each of the products currently being developed by us.
Manufacturing
We utilize subcontractors to manufacture our Fiery products and, to a lesser extent, our Inkjet products. These subcontractors work closely with us to promote low costs and high quality in the manufacture of our products. Subcontractors purchase components needed for our products from third parties. We are completely dependent on the ability of our subcontractors to produce products sold by us. Although we supervise our subcontractors, there can be no assurance that such subcontractors will perform efficiently or effectively. In 2008, a significant portion of our Fiery line of products was manufactured at a single subcontractor: Celestica, Inc. (“Celestica”). We transferred outsourced Fiery production to Bell Microproducts, Inc. in 2009. Bell Microproducts, Inc. was acquired by Avnet, Inc. (“Avnet”) in 2010. We also initiated outsourced production of certain solvent ink with Nazdar Company (“Nazdar”) during 2009.
Should our subcontractors experience inability or unwillingness to manufacture or deliver our products, then our business, financial condition, and operations could be harmed. Since we generally do not maintain long-term agreements with our subcontractors and such agreements may be terminated with relatively short notice, any of our subcontractors could terminate their relationship with us and/or enter into agreements with our competitors that might restrict or prohibit them from manufacturing our products or could otherwise lead to an inability or unwillingness of such subcontractor to fill our orders in a timely manner or at all. See Item 1A—We are dependent on a limited number of subcontractors, with whom we do not have long-term contracts, to manufacture and deliver products to our customers. The loss of any of these subcontractors could adversely affect our business.
Our VUTEk printers are manufactured at our Meredith, New Hampshire facility. Meredith is not located in a major metropolitan area. Consequently, we have encountered difficulties in hiring and retaining adequate skilled labor and management. Most components used in manufacturing the printers and ink are available from multiple suppliers, except for inkjet print heads and certain key ingredients (primarily pigments and photoinitiators) for our ink. Although typically in low volumes, many key components are sourced from single vendors. If we were unable to obtain the print heads currently used, we would be required to redesign our printers to use different print heads. If we were to change pigments, we would be required to reformulate and test the ink. In two of our locations, we use hazardous materials to formulate UV-based ink. The storage, use, and disposal of those materials must meet the requirements of various environmental regulations. See Item 1A— If we are not able to hire and retain skilled employees, we may not be able to develop products, or meet demand for our products, in a timely fashion; We depend on a limited group of suppliers for key components in our product. The loss of any of these suppliers, the inability of any of these suppliers to meet our requirements, or delays or shortages of supply
9
Table of Contents
of these components, could adversely affect our business; and We may be subject to environmental-related liabilities due to our use of hazardous materials and solvents.
A significant number of the components necessary for manufacturing our Fiery and Inkjet products are obtained from a sole supplier or a limited group of suppliers. We depend largely on the following sole and limited source suppliers for our components and manufacturing services:
| Supplier |
Components | |||
| Intel |
Central processing units (“CPUs”); chip sets | |||
| Toshiba |
Application-specific integrated circuits (“ASIC”) & Inkjet print heads | |||
| Open Silicon |
ASICs | |||
| Altera |
ASICs & Programmable devices | |||
| Tundra |
Chip sets | |||
| Avnet |
Contract manufacturing (Fiery) | |||
| Nazdar |
Contract manufacturing (solvent ink) | |||
| Columbia Tech |
Inkjet sub-assemblies | |||
| Roberts Tool |
Inkjet sub-assemblies | |||
| Evolve |
Inkjet sub-assemblies | |||
| Shenzen Runtianzhi Tech |
Inkjet sub-assemblies | |||
| Seiko |
Inkjet print heads | |||
| Fuji |
Inkjet print heads | |||
| Xaar |
Inkjet print heads | |||
| Dimatix |
Inkjet print heads | |||
| Progress Software |
Monarch and Radius operating system |
We generally do not maintain long-term agreements with our component suppliers. We primarily conduct business with such suppliers solely on a purchase order basis. If any of our sole or limited source suppliers were unwilling or unable to supply us with the components for which we rely on them, we may be unable to continue manufacturing our products utilizing such components.
The absence of agreements with most of our suppliers also subjects us to pricing fluctuations, which is a factor we believe is partially offset by our suppliers benefitting from selling as many components to us as possible. Many of our components are similar to those used in personal computers; consequently, the demand and price fluctuations of personal computer components could affect our component costs. In the event of unanticipated volatility in demand for our products, we may be unable to manufacture certain products in quantities sufficient to meet end-user demand or we may hold excess quantities of inventory because the purchase of key components involves long lead times. We maintain an inventory of components for which we are dependent upon sole or limited source suppliers and of components with prices that fluctuate significantly. We cannot ensure that at any given time we will have sufficient inventory to enable us to meet demand for our products, which would harm our financial results. See Item 1A—We depend on a limited group of suppliers for key components in our products. The loss of any of these suppliers, the inability of any of these suppliers to meet our requirements, or delays or shortages of supply of these components could adversely affect our business.
Competition
Competition in our markets is intense and involves rapidly changing technologies and frequent new product introductions. To maintain and improve our competitive position, we must continue to develop and introduce new products and features on a timely and cost-effective basis that keep pace with the evolving needs of our customers. The principal competitive factors affecting the markets for our Fiery solutions include, among others, customer service and support, product reputation, quality, performance, price, and product features such as functionality, scalability, ability to interface with OEM products, and ease of use. We believe we have generally
10
Table of Contents
competed effectively against product offerings of our competitors on the basis of such factors; however, there can be no assurance that we will continue to compete effectively in the future based on these or any other competitive factors.
Our primary competitors for third party stand-alone color controllers, embedded controllers, and design-licensed solutions are our OEM customers. Our market position, vis-à-vis internally developed controllers, is small; however, we are the largest third party controller vendor. We believe that our advantages include our continuously advancing technology, time-to-market, brand recognition, end-user loyalty, sizable installed base, number of products supported, price driven by lower development costs, and market knowledge. We intend to continue to develop new digital print controllers with capabilities that meet the changing needs of our OEM customers’ product development roadmaps. A significant disadvantage is our lack of control of the distribution channels and direct connections with our end-users. However, we do provide a variety of features as well as a unique “look and feel” to our OEM customers’ products to differentiate our customers’ products from those of their competitors.
The VUTEk line of super-wide format inkjet printers competes with printers produced by Agfa, Durst, Hewlett-Packard, Oce, and Inca throughout most of the world. There are Chinese and Korean printer manufacturers in the marketplace, but their products are typically sold in their domestic markets and are not perceived as alternatives in most other markets. Although we recommend that our ink be used in our VUTEk printers, users can purchase UV and solvent-based ink from other ink manufacturers. Third party ink is typically priced at a lower price than our proprietary ink; however, third party ink may not provide the same quality. In addition, the use of third party ink with our printer products may void the ink delivery system warranty on the printer. We believe that our broad product line and leading technology provide a competitive advantage.
Our APPS operating segment, which includes our PMIS and web-based order entry and order management systems, faces competition from software application vendors that specifically target the printing industry. These vendors are typically small, privately-owned companies. We also face competition from larger vendors that currently offer, or are seeking to develop, printer-focused enterprise resource planning products. We believe the principal competitive factor affecting our markets is the market acceptance rates for new printing technology. There can be no assurance that we will be able to continue to advance our technology and products or compete effectively against other companies’ product offerings. Any failure to do so could have a material adverse affect on our business, operating results, and financial condition.
Sale of Building and Land
On January 29, 2009, we sold a portion of our Foster City campus to Gilead Sciences, Inc. (“Gilead”) for $137.3 million. The property sold included an approximately 163,000 square foot building at 301 Velocity Way, Foster City, California, approximately 30 acres of land, and certain other assets related to the property. We retain ownership of the remaining approximately five acres of land and remain obligated under a synthetic lease with respect to the office building at 303 Velocity Way, Foster City, California, where our headquarters are located. As more fully disclosed in Note 8—Commitments and Contingencies of the Notes to Consolidated Financial Statements, both buildings were subject to synthetic lease agreements. The 301 Velocity Way synthetic lease agreement was terminated in conjunction with the sale. The 303 Velocity Way synthetic lease agreement remains outstanding as of December 31, 2010.
Intellectual Property Rights
We rely on a combination of patent, copyright, trademark, and trade secret laws, non-disclosure agreements, and other contractual provisions to establish, maintain, and protect our intellectual property rights. Although we believe that our intellectual property rights are important to our business, no single patent, copyright, trademark, or trade secret is solely responsible for the development and manufacturing of our products.
11
Table of Contents
We are currently pursuing patent applications in the U.S. and certain foreign jurisdictions to protect various inventions. Over time, we have accumulated a portfolio of patents issued in these jurisdictions. We own or have rights to the copyrights to the software code in our products and the rights to the trademarks under which our products are marketed. We have registered certain trademarks in the U.S. and certain foreign jurisdictions and will continue to evaluate the registration of additional trademarks as appropriate.
Certain of our products include intellectual property licensed from our customers. We have also granted and may continue to grant licenses under our intellectual property, when and as we deem appropriate.
For a discussion of risks relating to our intellectual property, see Item 1A—We may be unable to adequately protect our proprietary information and may incur expenses to defend our proprietary information.
Goodwill and Long-Lived Asset Impairment
We perform our annual goodwill impairment analysis in the fourth quarter of each year according to the provisions of Accounting Standards Codification (“ASC”) 350-20-35, Goodwill—Intangibles and Other—Subsequent Measurement. A two-step impairment test of goodwill is required. In the first step, the fair value of each reporting unit is compared to its carrying value. If the fair value exceeds carrying value, goodwill is not impaired and further testing is not required. If the carrying value exceeds fair value, then the second step of the impairment test is required to determine the implied fair value of the reporting unit’s goodwill. The implied fair value of goodwill is calculated by deducting the fair value of all tangible and intangible net assets of the reporting unit, excluding goodwill, from the fair value of the reporting unit as determined in the first step. If the carrying value of the reporting unit’s goodwill exceeds its implied fair value, then an impairment loss must be recorded equal to the difference.
Based on the outcome of conditions existing during the fourth quarter of 2008, we determined that a triggering event requiring an interim impairment analysis had occurred relating to the Inkjet reporting unit. The resulting impairment analysis resulted in a non-cash goodwill impairment charge of $104 million during the fourth quarter of 2008. The goodwill valuation analysis was performed based on our respective reporting units—Fiery, Inkjet, and APPS—which are consistent with our operating segments identified in Note 15—Segment Information, Geographic Data, and Major Customers of the Notes to Consolidated Financial Statements.
We determined the fair value of the Inkjet and APPS reporting units as of December 31, 2010 by equally weighting the market and income approaches. The fair value of the Fiery reporting unit was determined based on the market approach. Under the market approach, we estimated fair value based on market multiples of revenue or earnings of comparable companies. Under the income approach, we measured fair value of the Inkjet and APPS reporting units based on a projected cash flow method using a discount rate determined by our management to be commensurate with the risk inherent in our current business model. Based on our valuation results, we have determined that the fair values of our reporting units exceed their carrying values. Fiery, Inkjet, and APPS fair values are $226, $192, and $67 million, respectively, which exceed carrying value by 124%, 34%, and 26%, respectively.
Please see Note 4—Goodwill and Long-Lived Asset Impairment of the Notes to Consolidated Financial Statements.
Financial Information about Foreign and Domestic Operations and Export Sales
See Note 15—Segment Information, Geographic Data, and Major Customers and Note 11—Income Taxes of the Notes to Consolidated Financial Statements. See also Item 1A—We face risks from our international operations and We face risks from currency fluctuations.
12
Table of Contents
We rely on sales to a relatively small number of OEM customers. The loss of any of our OEM customers could substantially decrease our revenue.
A significant portion of our revenue is, and has been, generated by sales of our printer and copier related products to a relatively small number of OEMs. For example, Canon and Xerox each contributed over 10% of our revenue and together accounted for approximately 27%, 26%, and 29% of our revenue for the years ended December 31, 2010, 2009, and 2008, respectively. Because sales of our printer and copier-related products constitute a significant portion of our revenue and there are a limited number of OEMs producing copiers and printers in sufficient volume to be attractive customers for us, we expect that we will continue to depend on a relatively small number of OEM customers for a significant portion of our controller revenue in future periods.
In addition, our OEM customers have developed, and may continue to develop, their own controller products, which may compete directly with our Fiery products. Accordingly, if we lose or experience reduced sales to an important OEM customer, we will have difficulty replacing the revenue previously generated from such customers with sales to new or existing OEM customers and our Fiery revenue will likely decline significantly.
We do not typically have long-term purchase contracts with our OEM customers. Our OEM customers have in the past reduced or ceased, and could at any time in the future reduce or cease, purchasing products from us, thereby harming our operating results and business.
With the exception of certain minimum purchase obligations, we typically do not have long-term volume purchase contracts with our OEM customers, including Canon, Xerox, and Konica Minolta, and they are not obligated to purchase products from us. Accordingly, our customers could at any time reduce their purchases from us or cease purchasing our products altogether. In the past, some of our OEM customers have elected to develop products on their own, rather than rely, solely or partially, on our products. We expect that customers will continue to make such elections in the future.
Because our OEM customers incorporate our products into products they manufacture and sell, any decline in demand for copiers or laser printers or any other negative developments affecting our major customers or the computer industry in general, including reduced demand for products sold by our OEM customers, would likely harm our results of operations. For example, certain customers have in the past experienced serious financial difficulties, which led to a decline in sales of our products to these customers. If any significant customers face such difficulties in the future, our operating results could be harmed through, among other things, decreased sales volume and write-off of accounts receivables and inventories related to products we have manufactured for these customers’ products.
A significant portion of our operating expenses are fixed in advance based on projected sales levels and margins, sales forecasts from our OEM customers, and product development programs. A substantial portion of our shipments are scheduled for delivery within 90 days or less and our customers may cancel orders and change volume levels or delivery times for product they have ordered from us without penalty. Accordingly, if sales to our OEM customers are below expectations in any given quarter, the adverse impact of the shortfall in revenue on operating results may be, and has been in the past, increased by our inability to adjust expenses in the short-term to compensate for this shortfall.
We rely on our OEM customers to develop and sell products incorporating our Fiery technology. If they fail to successfully develop and sell these products, or curtail or cease the use of our technology in their products, our business will be harmed.
We rely on our OEM customers to develop new products, applications, and product enhancements utilizing our controller technologies in a timely and cost-effective manner. Our continued success in the controller industry depends upon the ability of these OEM customers to utilize our technologies while meeting changing end-user
13
Table of Contents
customer needs and responding to emerging industry standards and other technological changes. We cannot provide assurance that our OEM customers will effectively meet these challenges. Our OEM customers are generally not obligated to purchase products from us and we cannot provide assurance that they will continue to carry our products. For example, our OEM customers have incorporated the technologies of other companies into their products or internally developed technologies in addition to, or instead of, our technologies and will likely continue to do so in the future. If our OEM customers do not effectively and successfully market products containing our technologies, our revenue will likely be materially and adversely affected.
Our OEM customers work closely with us to develop products that are specific to each OEM customer’s copiers and printers. Many of the products and technologies we are developing require that we coordinate development, quality testing, marketing, and other tasks with our OEM customers. We cannot control our OEM customers’ development efforts or the timing of these efforts. Coordinating with our OEM customers may cause delays in our own product development efforts that are outside of our control. If our OEM customers delay the release of their products, our revenue and results of operations may be adversely affected. In addition, our revenue and results of operations may be adversely affected if we cannot meet our OEM customers’ product needs for their specific copiers and printers, as well as successfully manage the additional engineering and support effort and other risks associated with such a wide range of products.
We face competition from other suppliers as well as our own OEM customers. If we are not able to compete successfully, our business may be harmed.
The digital printing marketplace is highly competitive and is characterized by rapid technological changes. We compete against a number of other suppliers of imaging products and technologies, including our OEM customers themselves. Although we attempt to develop and support innovative products that end-users demand, products or technologies developed by competing suppliers, including our own OEM customers, could render our products or technologies obsolete or noncompetitive.
While many of our OEM customers incorporate our technologies into their end products on an exclusive basis, we do not have any formal agreements that prevent these OEM customers from offering alternative products that do not incorporate our technologies. If, as has occurred in the past, an OEM customer offers products incorporating technologies from alternative suppliers instead of, or in addition to, products incorporating our technologies, our market share could decrease, which would likely reduce our revenue and adversely affect our financial results.
Many OEMs in the printer and copier industry, including most of our OEM customers, internally develop and sell products that compete directly with our current products. These OEMs have significant investments in their existing solutions and have substantial resources that may enable them to develop or improve, more quickly than us, technologies similar to ours that are compatible with their own products. Our OEM customers have marketed in the past, and likely will continue to market in the future, their own internal technologies and solutions in addition to ours, even when their technologies and solutions are less advanced, have lower performance, or cost more than our products. Given the significant financial, marketing, and other resources of our larger OEM customers and other significant OEMs in the imaging industry who are not our customers, we may not be able to successfully compete against these OEMs selling similar products that they develop internally. If we cannot compete successfully against the OEMs’ internally developed products, we will lose sales and market share in those areas where the OEMs choose to compete and our business will be harmed.
The market for our super-wide format printers is very competitive.
The printing equipment industry is extremely competitive. Our VUTEk products compete against several companies that market digital printing systems based on electrostatic, drop-on-demand, and continuous drop-on-demand inkjet, and other technologies and printers utilizing UV curable and solvent ink including Agfa, Durst, Hewlett-Packard, Oce, and Inca. Certain competitors have greater resources to develop new products and
14
Table of Contents
technologies and market those products, as well as acquire or develop critical components at lower costs, which would provide them with a competitive advantage. They could also exert downward pressure on product pricing to gain market share.
We have witnessed the recent growth of local Chinese and Korean markets where local competitors are developing, manufacturing, and selling inexpensive printers, mainly to the local Chinese and Korean markets. These Chinese and Korean manufacturers have begun penetrating the international market and have partnered with other super-wide format printer manufacturers. Our ability to compete depends on factors both within and outside of our control, including the price, performance, and acceptance of our current printers and any products we develop in the future.
We also face competition from existing conventional wide format and super-wide format printing methods, including screen printing and offset printing. Our competitors could develop new products, with existing or new technology, that could be more competitive in our market than our printers. We cannot assure you that we can compete effectively with any such products.
We face strong competition in our APPS operating segment.
Our APPS operating segment, which includes our workflow, PMIS, and web-based order entry and order management systems, faces competition from software application vendors that specifically target the printing industry. These vendors are typically small, privately-owned companies. We also face competition from larger vendors that currently offer or are seeking to develop printer-focused enterprise resource planning products. We believe the principal competitive factor affecting our markets is the market acceptance rates for new printing technology.
There can be no assurance that we will be able to continue to advance our technology and products or compete effectively against other companies’ product offerings. Any failure to do so could have a material adverse affect on our business, operating results, and financial condition.
We face strong competition in the market for printing supplies such as ink.
We compete with independent manufacturers in the ink market. We cannot guarantee we will be able to remain the exclusive or even principal ink supplier for our printers. The loss of ink sales to our printer installed base could adversely impact our revenue and gross profit.
We could experience an overall price reduction within the ink markets, which would also adversely affect our gross profit. Solvent ink is relatively easy to replicate and additional manufacturers could increase pricing competition or divert customers away from us.
Price reductions for all of our products may affect our revenue in the future.
We have made, and may in the future make, price reductions for our products to drive demand and remain competitive. Depending upon the price-elasticity of demand for our products, the pricing and quality of competitive products, and other economic and competitive conditions, such price reductions may have an adverse impact on our revenue and profit. If we are not able to compensate for lower gross profit that may result from price reductions with an increased volume of sales, our results of operations could be adversely affected.
Ongoing economic uncertainty has negatively affected our business in the past and may negatively affect it in the future.
The revenue and profitability of our business depends significantly on the overall demand for information technology products that enable printing of digital data, which in turn depends on a variety of macro- and
15
Table of Contents
micro-economic conditions. In addition, revenue growth and profitability in our Inkjet operating segment depends on demand and spending for advertising and marketing products and programs, which also depends on a variety of macro- and micro-economic conditions.
Uncertainty about current global economic conditions poses a risk as our customers may delay purchases of our products in response to tighter credit, negative financial news, and/or declines in income or asset values. Any financial turmoil affecting the banking system and financial markets and the possibility that financial institutions may consolidate or terminate their activities have resulted in a tightening in the credit markets, a low level of liquidity in many financial markets, and extreme volatility in fixed income, credit, currency, and equity markets. There could be a number of follow-on effects from the credit crisis on our business, including insolvency of key suppliers resulting in product delays; inability of customers and distributors to obtain credit to finance purchases of our products and/or customer and distributor insolvencies; increased difficulty in managing inventories; and other financial institutions negatively impacting our treasury operations. Economic downturns can lead to restructuring actions and associated expenses. Our financial performance could vary materially from expectations depending on gains or losses realized on the sale or exchange of financial instruments or cash equivalents, impairment charges on our assets, gains or losses related to equity and other investments, and interest rates. The current volatility in the financial markets and overall economic uncertainty increases the risk that actual amounts realized in the future on our financial instruments could differ significantly from the fair values currently assigned to them.
Sustained uncertainty about current global economic conditions together with delays or reductions in information technology spending could cause a decline in demand for our products and services and consequently harm our business, operating results, financial condition, prospects, and continue to increase the volatility of our stock price.
Our operating results may fluctuate based on many factors, which could adversely affect our stock price.
Stock prices of high technology companies such as ours tend to be volatile as a result of various factors, including variations in operating results and, consequently, fluctuations in our operating results could adversely affect our stock price. Factors that have caused our operating results and stock price to fluctuate in the past and that may cause future fluctuations include:
| • | varying demand for our products, due to seasonality, OEM customer product development and marketing efforts, OEM customer financial and operational condition, OEM inventory management practices, and general economic conditions; |
| • | shrinking OEM customer base due to business consolidation in the industry; |
| • | shifts in customer demand to lower cost products; |
| • | success and timing of new product introductions by our OEM customers and us; |
| • | success and timing of new inkjet product introductions; |
| • | the performance of our products generally; |
| • | volatility in foreign exchange rates, changes in interest rates, and/or financing credit to consumers of digital copiers and printers; |
| • | price reductions by our competitors and us, which may be exacerbated by competitive pressures caused by economic conditions generally; |
| • | substitution of third party ink for our own ink products by users of our super-wide format inkjet printers; |
| • | delay, cancellation, or rescheduling of orders or projects; |
| • | delays or shortages of supply of our key components including, without limitation, inkjet print heads, ink components, and inability of our suppliers to meet our requirements; |
16
Table of Contents
| • | availability of key components and licenses, including possible delays in deliveries from suppliers, the performance of third party manufacturers, and the status of our relationships with key suppliers; |
| • | potential excess or shortage of employees and location of research and development centers; |
| • | shrinking customer base in our APPS operating segment due to business consolidations and shrinking installed base due to print shops ceasing operations; |
| • | changes in our product mix such as shifts from higher gross profit products to lower gross profit products such as our inkjet products; |
| • | costs associated with complying with any applicable governmental regulations; |
| • | cost associated with possible SEC and regulatory actions regarding our historical stock option granting practices and remedial measures with respect to our historical stock option granting practices; |
| • | acquisitions and integration of new businesses; |
| • | costs related to our entry into new markets, such as commercial printing and office equipment service automation; |
| • | general economic conditions, such as the current economic uncertainty; |
| • | commencement of litigation or adverse results in pending litigation; and |
| • | other risks described herein. |
Entry into new markets or distribution channels could result in higher operating expenses that may not be offset by increased revenue.
We continue to explore opportunities to develop or acquire additional product lines, such as print management software, document scanning solutions, and inkjet printers. We expect to continue to invest funds to develop new distribution and marketing channels for these and additional new products and services, which will increase our operating expenses.
We do not know if we will be successful in developing these channels, or whether the market will accept any of our new products or services, or if we will generate sufficient revenue from these activities to offset the additional operating expenses we incur. Even if we are able to introduce new products or services, if customers do not accept these new products or services, or if we are not able to price such products or services competitively, our results of operations will likely be adversely affected.
We license software used in most of our Fiery products and certain APPS products from Adobe and the loss of these licenses would prevent shipment of these products.
Many of our current products include software that we must license from Adobe. Specifically, we are required to obtain separate licenses from Adobe for the right to use Adobe PostScript®, software in each type of copier or printer used with a Fiery controller, and other Adobe software for certain APPS products. Although to date we have successfully obtained licenses to use Adobe PostScript® and other Adobe software when required, Adobe is not required to, and we cannot be certain that Adobe will, grant future licenses to Adobe PostScript® and other Adobe software on reasonable terms, in a timely manner, or at all. To obtain licenses from Adobe, Adobe requires that we obtain from them quality assurance approvals for our products that use Adobe software. Although to date we have successfully obtained such quality assurances from Adobe, we cannot be certain Adobe will grant us such approvals in the future. If Adobe does not grant us such licenses or approvals, if the Adobe licenses are terminated, or if our relationship with Adobe is otherwise materially impaired, we would likely be unable to sell products that incorporate Adobe PostScript® or other Adobe software. Our financial condition and results of operations would be significantly harmed.
17
Table of Contents
We depend on a limited group of suppliers for key components in our products. The loss of any of these suppliers, the inability of any of these suppliers to meet our requirements, or delays or shortages of supply of these components could adversely affect our business.
Certain components necessary for the manufacture of our products are obtained from a sole supplier or a limited group of suppliers. These include processors from Intel and other related semiconductor components, inkjet print heads for our wide and super-wide format printers, and ink. We generally do not maintain long-term agreements with our component suppliers and conduct business with such suppliers solely on a purchase order basis. If we are unable to continue to procure these sole-sourced components from our current suppliers in the required quantities, we will have to qualify other sources, if possible, or design our products so that they no longer require these components.
These suppliers may be concentrated within similar industries or geographic locations, which could potentially exacerbate these risks. We cannot provide assurance that other sources of these components exist or will be willing to supply us on reasonable terms or at all, or that we will be able to design around these components. Any unavailability, delays, or shortages of supply of these components or any inability of our suppliers to meet our requirements could harm our business. Because the purchase of certain key components involves long lead times, in the event of unanticipated volatility in demand for our products, we have in the past been, and may in the future be, unable to manufacture certain products in a quantity sufficient to meet demand. Further, as has occurred in the past, in the event that anticipated demand does not materialize, we may hold excess quantities of inventory that could become obsolete. To meet projected demand, we maintain an inventory of components for which we are dependent on sole or limited source suppliers and components with prices that fluctuate significantly. As a result, we are subject to risk of inventory obsolescence, which could adversely affect our operating results and financial condition.
Market prices and availability of certain components, particularly memory and Intel-designed components, which collectively represent a substantial portion of the total manufactured cost of our products, have fluctuated significantly in the past. Such fluctuations could have a material adverse effect on our operating results and financial condition including reduced gross profit.
We are dependent on a limited number of subcontractors, with whom we do not have long-term contracts, to manufacture and deliver products to our customers. The loss of any of these subcontractors could adversely affect our business.
We subcontract with other companies to manufacture our products and we generally do not have long-term agreements with these subcontractors. We rely on the ability of our subcontractors to manufacture products to be sold to our customers. While we closely monitor our subcontractors’ performance, we cannot assure you that such subcontractors will continue to manufacture our products in a timely and effective manner. In the past, a weakened economy led to the dissolution, bankruptcy, or consolidation of some of our subcontractors, decreasing the available number of subcontractors. If the available number of subcontractors were to again decrease, it is possible that we would not be able to secure appropriate subcontractors to fulfill our demand in a timely manner, or at all, particularly if demand for our products increases.
The existence of fewer subcontractors may also reduce our negotiating leverage, thereby potentially resulting in higher product costs. Difficulties experienced by our subcontractors, including financial problems and the inability to make or ship our products or fix quality assurance problems, could harm our business, operating results, and financial condition. If we decide to change subcontractors, we could experience delays in finding, qualifying, and commencing business with new subcontractors, which would result in both delay in delivery of our products and also potentially the cancellation of orders for our products.
Since 2009, a high concentration of Fiery controllers has been manufactured at a single subcontractor location, Avnet in San Jose, California. Certain solvent ink is manufactured by Nazdar. Certain Inkjet product lines are
18
Table of Contents
manufactured by two subcontractors. Should our subcontractors experience any inability, or unwillingness, to manufacture or deliver our products, then our business, financial condition, and operations could be harmed. Since we generally do not maintain long-term agreements with our subcontractors, any of our subcontractors could enter into agreements with our competitors that might restrict or prohibit them from manufacturing our products or could otherwise lead to an inability to fill our orders in a timely manner. In such event, we may not be able to find suitable replacement subcontractors, in which case our financial condition and operations would likely be harmed.
We may face increased risk of inventory obsolescence, excess, or shortages related to our super-wide format inkjet printers and ink.
We procure raw materials and internally manufacture our super-wide printers and ink products based on our sales forecasts. If we do not accurately forecast demand for our products, we may end up with excess inventory, or we may lose sales because we do not have the correct products available for sale. If we have excess printers, ink, or other products, we may have to lower prices to stimulate demand. We may also run the risk that our inventory of raw materials may become obsolete. Our ink products have a defined shelf life. If we do not sell the ink before the end of its shelf life, it will no longer be sellable and will have to be written off. In addition, we have experienced in the past and may continue to experience in the future, UV ink shortages occasioned by increased demand that may require that we incur additional costs to respond to increased demand and overcome such shortages.
If we are not able to hire and retain skilled employees, we may not be able to develop products, or meet demand for our products, in a timely fashion.
We depend upon skilled employees, such as software and hardware engineers, quality assurance engineers, and other technical professionals with specialized skills. We are headquartered in the Silicon Valley and additionally have research and development offices in India. Competition in both locations has historically been intense among companies hiring engineering and technical professionals. In times of professional labor imbalances, it has in the past and is likely in the future, to be difficult to locate and hire qualified engineers and technical professionals and for us to retain these people. There are many technology companies located near our corporate offices in the Silicon Valley and our operations in India that may try to hire our employees.
Our VUTEk printers are manufactured at our Meredith, New Hampshire facility. Meredith is not located in a major metropolitan area and we have encountered difficulties in hiring and retaining adequate skilled labor and management.
The movement of our stock price may also impact our ability to hire and retain employees. If we do not offer competitive compensation, we may not be able to recruit or retain employees, which may have an adverse effect on our ability to develop products in a timely fashion, which could harm our business, financial condition, and operating results.
We offer a broad-based equity compensation plan based on granting stock options and restricted stock from stockholder-approved plans to remain competitive in the labor market. Any difficulty in obtaining stockholder approval of equity compensation plans could limit our ability to grant equity awards to employees in the future. If we cannot offer equity awards when necessary to offer compensation competitive with those offered by other companies seeking the same employees, it may be difficult to hire and retain skilled employees.
Our acquisitions in the APPS and Inkjet operating segments increased the possibility we will experience additional bad debt expense.
Our OEM customers in the Fiery operating segment are typically large profitable customers with little credit risk to us. Our APPS and Inkjet businesses sell primarily via a direct sales force to a broader base of customers, many
19
Table of Contents
of whom are smaller and potentially less creditworthy. In addition, if we increase our percentage of revenue from our Inkjet customers, many of whom are located overseas in many countries, it may be challenging to enforce our legal rights should collection issues arise.
We sell our products to distributors and, with respect to some regions and products, directly to end-users. If we are unable to effectively manage a direct sales force, revenue could decline.
We have traditionally sold our Fiery products to our OEM customers, who in turn sold our products to end-users. Our Fiery marketing is focused on manufacturers and distributors of the manufacturers’ equipment, not the end-users of the product. We sell our professional printing applications and our inkjet printers and ink to both distributors and directly to end-users. If we are unable to effectively manage a direct sales force and develop marketing programs that reach end-users, we are likely to see a decline in revenue from those products.
Acquisitions may result in unanticipated accounting charges or otherwise adversely affect our results of operations and result in difficulties assimilating and integrating operations, personnel, technologies, products, and information systems of acquired companies or businesses.
We seek to develop new technologies and products from both internal and external sources. As part of this effort, we have in the past made, and will likely continue to make, acquisitions of other companies or other companies’ assets.
Acquisitions involve numerous risks, such as:
| • | if we issue equity securities in connection with an acquisition, the issuance may be dilutive to our existing stockholders; alternatively, acquisitions made entirely or partially for cash (such as our recent acquisition of Radius) will reduce cash reserves; |
| • | difficulties integrating operations, employees, technologies, or products and the related diversion of management time and effort to accomplish successful integration; |
| • | risks of entering markets in which we have little or no prior experience, or entering markets where competitors have stronger market positions; |
| • | possible write-downs of impaired assets; |
| • | possible restructuring of head count or leased facilities; |
| • | potential loss of key employees of the acquired company; |
| • | possible expense overruns; |
| • | an adverse reaction by customers, suppliers or partners of the acquired company or EFI; |
| • | the risk of changes in ratings by stock analysts; |
| • | potential litigation surrounding transactions or the prior actions of the acquired company or any administrative proceedings; |
| • | the inability to protect or secure technology rights; and |
| • | increased operating costs. |
Mergers and acquisitions of companies are inherently risky. We cannot provide assurance that previous or future acquisitions will be successful or will not harm our business, operating results, financial condition, or stock price.
We face risks relating to the potential impairment of goodwill and long-lived assets.
We complete a review of the carrying value of our assets annually and, based on a combination of factors, we may be required to perform an interim analysis. During the fourth quarter of 2008, our market capitalization
20
Table of Contents
declined significantly as a result of declining worldwide economic conditions caused by the tightening of global credit markets. Based on a combination of factors including the recent economic environment, the resulting erosion in our market capitalization, and the degradation of our revenue forecast subsequent to the third quarter of 2008, we performed an interim impairment analysis during the fourth quarter of 2008. Based on the outcome of the interim impairment analysis, we concluded that an impairment had occurred relating to the Inkjet reporting unit resulting in a non-cash impairment charge of $111.9 million during the quarter related to goodwill and other long-lived assets. Additional asset impairment charges of $0.7 and $3.2 million were recognized during 2010 and 2009, respectively, resulting primarily from equipment and non-cancellable purchase orders incurred relating to a planned product that was cancelled, a facility closure, and the write-off of a private minority investment. Additional goodwill impairment charges have not been required based on the results of the goodwill impairment assessments completed during 2010 and 2009.
Given the uncertainty of the economic environment and its potential impact on our business, there can be no assurance that our estimates and assumptions regarding the duration of the ongoing economic downturn, or the period or strength of recovery, made for purposes of our goodwill impairment testing at December 31, 2010 will prove to be accurate predictions of the future. If our assumptions regarding forecasted revenue or gross profit rates are not achieved, we may be required to record additional goodwill impairment charges in future periods relating to any of our reporting units, whether in connection with the next annual impairment testing in the fourth quarter of 2011 or prior to that, if any such change constitutes an interim triggering event. It is not possible to determine if any such future impairment charge would result or, if it does, whether such charge would be material.
While impairment does not impact reported cash flows, it does result in a non-cash charge in the Consolidated Statements of Operations and thus no assurance can be given that any future impairments would not affect our financial performance and valuation of assets and, as a result, harm our business, operating results, financial condition, or stock price.
We face risks from currency fluctuations.
Approximately $210.3 (42%), $171.8 (43%), and $262.5 (47%) million of our revenue for the years ended December 31, 2010, 2009, and 2008, respectively, shipped to locations outside the Americas, primarily to Europe, Middle East and Africa (“EMEA”) and Japan. We expect that sales shipped outside the Americas will continue to represent a significant portion of total revenue. The majority of our revenue is invoiced in U.S. dollars.
Given the significance of non-U.S. sales to our total revenue, we face a continuing risk from the fluctuation of the U.S. dollar versus foreign currencies. When we invoice our customers in their respective local currencies, our cash flows and earnings are exposed to fluctuations in interest rates and foreign currency exchange rates between the invoiced currency and the U.S. dollar.
We have a substantial number of international employees, resulting in material operating costs denominated in foreign currencies. Changes in exchange rates, and in particular a weakening of the U.S. dollar, may adversely affect our consolidated operating expenses and operating income (loss) as expressed in U.S. dollars. We have attempted to limit these exposures through operational strategies where we have considered it appropriate in the past, although no hedging activities occurred prior to 2009. The notional amount of our cash flow hedge of our operating expense exposure in Indian rupees was $2.5 million at December 31, 2010.
Our efforts to reduce risk from our international operations and from fluctuations in foreign currencies or interest rates may not be successful, which could harm our financial condition and operating results.
We face risks from our international operations.
We are subject to certain risks because of our international operations. Changes to and compliance with a variety of foreign laws and regulations may increase our cost of doing business. Our inability or failure to obtain
21
Table of Contents
required approvals could harm our international and domestic sales. Trade legislation in either the U.S. or other countries, such as a change in the current tariff structures, export compliance laws, or other trade policies, could adversely affect our ability to sell or manufacture in international markets. Some of our sales to international customers are made under export licenses that must be obtained from the U.S. Department of Commerce (“DOC”) and certain transactions require prior approval of the DOC or other governmental agencies. Changes in governmental regulation and our inability or failure to obtain required approvals, permits, or registrations could harm our international and domestic sales and adversely affect our revenue, business, and operations. Any violations could result in fines and penalties, including prohibiting us from exporting our products to one or more countries, and could materially and adversely affect our business.
Local laws and customs in many countries differ significantly from those in the U.S. We incur additional legal compliance costs associated with our international operations and could become subject to legal penalties in foreign countries if we do not comply with local laws and regulations, which may be substantially different from those in the U.S. In many foreign countries, particularly those with developing economies, it may be common to engage in business practices that are prohibited by U.S. regulations such as the Foreign Corrupt Practices Act. Although we implement policies and procedures designed to ensure compliance with these laws, there can be no assurance that all of our employees, contractors, and agents, as well as companies to which we outsource business operations, including those based in or from countries where practices that violate such U.S. laws may be customary, will not take actions in violation of our policies. Any such violation, even if prohibited by our policies, could have a material adverse effect on our business.
Other risks include natural disasters and political or economic conditions in a specific country or region. In addition, many countries in which we derive revenue do not have comprehensive and highly developed legal systems, particularly with respect to the protection of intellectual property rights, which, among other things, can result in a prevalence of infringing products and counterfeit goods in certain countries, which could harm our business and reputation.
We may be unable to adequately protect our proprietary information and may incur expenses to defend our proprietary information.
We rely on a combination of copyright, patent, trademark, and trade secret protection, nondisclosure agreements, licensing, and cross-licensing arrangements to establish, maintain, and protect our intellectual property rights, all of which afford only limited protection. We have patents and pending patent applications in the U.S. and various foreign countries. There can be no assurance that patents will issue from our pending applications or from any future applications, or that, if issued, any claims allowed will be sufficiently broad to protect our technology. Any failure to adequately protect our proprietary information could harm our financial condition and operating results. We cannot be certain that any patents that have been, or may in the future be issued to us, or which we license from third parties, or any other proprietary rights will not be challenged, invalidated, or circumvented. In addition, we cannot be certain that any rights granted to us under any patents, licenses, or other proprietary rights will provide adequate protection of our proprietary information.
As different areas of our business change or mature, from time to time we evaluate our patent portfolio and decide to either pursue or not pursue specific patents and patent applications related to such areas. Choosing not to pursue certain patents, patentable applications, and failing to file applications for potentially patentable inventions, may harm our business by, among other things, enabling our competitors to more effectively compete with us, reducing potential claims we can bring against third parties for patent infringement and limiting our potential defenses to intellectual property claims brought by third parties.
Litigation has been, and may continue to be, necessary to defend and enforce our proprietary rights. Such litigation, whether or not concluded successfully, could involve significant expense and the diversion of our attention and other resources, which could harm our financial condition and operating results.
22
Table of Contents
We face risks from third party claims of infringement and potential litigation.
Third parties have claimed in the past, and may claim in the future, that our products infringe, or may infringe, their proprietary rights. Such claims have resulted in lengthy and expensive litigation in the past and could have a similar result in the future. Such claims and any related litigation, whether or not we are successful in the litigation, could result in substantial costs and diversion of our resources, which could harm our financial condition and operating results. Although we may seek licenses from third parties covering intellectual property that we are allegedly infringing, we cannot assure you that any such licenses could be obtained on acceptable terms, if at all.
We may be subject to environmental-related liabilities due to our use of hazardous materials and solvents.
Our business operations involve the use of certain hazardous materials at three separate locations. At these facilities, we manufacture and/or store ink used in some of our printers with solvents and other hazardous materials. Those materials are subject to various governmental regulations relating to their transfer, handling, packaging, use, and disposal. We store ink at warehouses worldwide, including Europe and the U.S., and shipping companies ship it at our direction. We face potential liability for problems such as large spills or fires that may arise at ink manufacturing locations. While we customarily obtain insurance coverage typical for this kind of risk, such insurance may not be sufficient. If we fail to comply with these laws or an accident involving our ink waste or chemicals occurs, or if our insurance coverage is not sufficient, then our business and financial results could be harmed. We continue to monitor environmental compliance regulations to ensure that our products are made fully compliant prior to the implementation of any potential new requirements. However, new unforeseen legislation could require us to reengineer our products, complete costly analyses, or perform supplier surveys, which could harm our business and negatively impact our financial results. We could also incur additional costs and liabilities in connection with non-compliant product recalls, regulatory fines, and exclusion of non-compliant products from certain markets.
Future sales of our hardware products could be limited if we don’t comply with current and future environmental/chemical content regulation in electrical and electronic equipment.
We believe that our products are currently compliant with RoHS, WEEE, REACH, and other regulations for the European Union as well as with China RoHS, and other applicable international, U.S., state, and local environmental regulations. We continue to monitor environmental compliance regulations to ensure that our products are made fully compliant prior to the implementation of any potential new requirements. However, new unforeseen legislation could require us to reengineer our products, complete costly analyses, or perform supplier surveys, which could harm our business and negatively impact our financial results. We could also incur additional costs, sanctions, and liabilities in connection with non-compliant product recalls, regulatory fines, and exclusion of non-compliant products from certain markets.
Our products may contain defects, which are not discovered until after shipping, which could subject us to warranty claims in excess of our warranty reserves.
Our products consist of hardware and software developed by ourselves and others, which may contain undetected errors. We have in the past discovered software and hardware errors in certain of our products after their introduction, resulting in warranty expense and other expenses incurred in connection with rectifying such errors or, in certain circumstances, replacing the defective product, which may damage our relationship with our customers. Errors could be found in new versions of our products after commencement of commercial shipment and any such errors could result in a loss or delay in market acceptance of such products and thus harm our reputation and revenue. Errors in our products (including errors in licensed third party software) detected prior to new product releases could result in delays in the introduction of new products and the incurrence of additional expense, which could harm our operating results. We generally provide a twelve month warranty from date of shipment for certain Fiery controller and Inkjet printer products, which may cover both parts and labor. Our standard warranties contain limits on damages and exclusions, including but not limited to alteration,
23
Table of Contents
modification, misuse, mishandling, storage, or operation in improper environments. While we record an accrual for estimated warranty costs when estimable and probable, based on historical experience, we may incur additional costs of revenue and operating expenses if our warranty provision does not reflect the actual cost of resolving issues related to defects in our products or if our liability limitations are declared enforceable, which could harm our business, financial condition, and operating results.
Actual or perceived security vulnerabilities in our products could adversely affect our revenue.
Maintaining the security of our software and hardware products is an issue of critical importance to our customers and for us. There are individuals and groups who develop and deploy viruses, worms, and other malicious software programs that could attack our products. Although we take preventative measures to protect our products, and we have a response team that is notified of high risk malicious events, these procedures may not be sufficient to mitigate damage to our products. Actual or perceived security vulnerabilities in our products could lead some customers to seek to return products, reduce or delay future purchases, or purchase competitive products. Customers may also increase their expenditures to protect their computer systems from attack, which could delay or reduce purchases of our products. Any of these actions or responses by customers could adversely affect our revenue.
System failures, or system unavailability, could harm our business.
We rely on our network infrastructure, internal technology systems, and internal and external websites for our development, marketing, operational, support, and sales activities. Our hardware and software systems related to such activities are subject to damage from malicious code released into the public Internet through vulnerabilities in popular software programs. These systems are also subject to acts of vandalism and to potential disruption by actions or inactions of third parties. Any event that causes failures or interruption in our hardware or software systems could harm our business, financial condition, and operating results.
The location and concentration of our facilities subjects us to risk of earthquakes, floods, or other natural disasters.
Our corporate headquarters, including most of our research and development facilities, are located in the San Francisco Bay Area, which is known for seismic activity. This area has also experienced flooding in the past. Many of the components necessary for our products are purchased from suppliers based in areas including the San Francisco Bay Area, Taiwan, and Japan and are therefore subject to risk from natural disasters. A significant natural disaster, such as an earthquake, flood, tsunami, hurricane, typhoon, or other business interruptions due, for example, to power shortages and other interruptions could harm our business, financial condition, and operating results.
We are subject to numerous federal and state employment laws and may face claims in the future under such laws.
We are subject to numerous federal and state employment laws and from time to time we face claims by our employees and former employees under such laws. Although there are no pending or threatened claims under wage and hour laws against us, we cannot assure you that claims under such laws or other employment-related laws will not be made in the future against us, nor can we predict the likely impact of any such claims on us, or that, if asserted, we would be able to successfully resolve any such claims without incurring significant expense.
We may be subject to risk of loss due to fire because certain materials we use in our ink manufacturing process are flammable.
We use flammable materials in the ink manufacturing process and may, therefore, be subject to a risk of loss resulting from fire. The risk of fire associated with these materials cannot be completely eliminated. We own
24
Table of Contents
certain facilities that manufacture our ink, which increases our exposure to such risk if these facilities are destroyed. We maintain insurance policies to cover losses caused by fire, including business interruption insurance. If one or more of these facilities is damaged or otherwise ceases operations as a result of fire, it would reduce manufacturing capacity and, consequently, may reduce revenue and adversely affect our business.
The value of our investment portfolio is subject to interest rate volatility.
We have an investment portfolio of fixed income securities classified as available-for-sale securities. As a result, our investment portfolio is subject to counterparty risk and volatility if market interest rates fluctuate. We attempt to limit this exposure to interest rate risk by investing in securities with maturities of less than three years; however, we may be unable to successfully limit our risk to interest rate fluctuations and this may cause volatility in our investment portfolio value.
Our stock price has been volatile historically and may continue to be volatile.
The market price for our common stock has been and may continue to be volatile. During the twelve months ended December 31, 2010, the price of our common stock as reported on The NASDAQ Global Select Market ranged from a low of $9.18 to a high of $14.87. We expect our stock price to be subject to fluctuations as a result of a variety of factors, including factors beyond our control. These factors include:
| • | actual or anticipated variations in our quarterly or annual operating results; |
| • | ability to complete stock repurchase programs; |
| • | our failure to meet analyst expectations; |
| • | announcements of technological innovations or new products or services by our competitors or by us; |
| • | announcements relating to strategic relationships, acquisitions, or investments; |
| • | announcements by our customers regarding their businesses or the products in which our products are included; |
| • | changes in financial estimates or other statements by securities analysts; |
| • | terrorist attacks and the affects of military engagements or natural disasters; |
| • | changes in the rating of our securities; |
| • | commencement of litigation or adverse results of pending litigation; |
| • | changes in the financial performance and/or market valuations of other software and high technology companies; and |
| • | changes in general economic conditions. |
Because of this volatility, we may fail to meet the expectations of our stockholders or of securities analysts from time to time and the trading prices of our securities could decline as a result. The stock market has experienced significant price and volume fluctuations that have particularly affected the trading prices of equity securities of many high technology companies, including the continuing uncertainty in our economy. These fluctuations have often been unrelated or disproportionate to the operating performance of these companies. Any negative change in the public’s perception of high technology companies could depress our stock price regardless of our operating results.
Our stock repurchase program could affect our stock price and add volatility.
On February 9, 2011, our Board of Directors approved a $30 million stock repurchase program. Any repurchases pursuant to our stock repurchase program could affect our stock price and add volatility. There can be no
25
Table of Contents
assurance that repurchases will be made at the best possible price. Potential risks and uncertainties also include, but are not necessarily limited to, the amount and timing of future stock repurchases and the origin of funds used for such repurchases. The existence of a stock repurchase program could also cause our stock price to be higher than it would be in the absence of such a program and could potentially reduce the market liquidity for our stock. Depending on market conditions and other factors, these repurchases may be commenced or suspended from time to time. Any such suspension could cause the market price of our stock to decline.
Under regulations required by the Sarbanes-Oxley Act of 2002, our internal controls over financial reporting may be deemed to be ineffective and this could have a negative impact on our stock price.
Section 404 of the Sarbanes-Oxley Act of 2002 requires that we establish and maintain an adequate internal control structure and procedures for financial reporting and assess on an ongoing basis the design and operating effectiveness of our internal control structure and procedures for financial reporting. Although no known material weaknesses are believed to exist at this time, it is possible that material weaknesses could be identified. If we are unable to remediate the weaknesses, our management would be required to conclude and disclose that our internal controls over financial reporting were not effective. In addition to their inherent limitations, internal controls over financial reporting may not prevent or detect misstatements, errors, omissions, or fraud.
A reduction in our net income as reported in our financial statements could increase the likelihood of identifying a material weakness in our internal controls over financial reporting.
The threshold for determining whether we have a material weakness in internal controls over financial reporting as defined by the Sarbanes-Oxley Act of 2002 is, in part, based on our net income. Lowered net income, with an associated lowered materiality threshold, may increase our risk that internal control weaknesses may result in a material misstatement in the financial statements.
Our remaining synthetic lease arrangement may adversely affect our cash flow.
As of December 31, 2008, we were a party to two synthetic leases (the “301 Lease” and the “303 Lease”, together “Leases”) covering our Foster City facilities located at 301 and 303 Velocity Way, Foster City, California. These leases provided a cost effective means of providing adequate office space for our corporate offices. Both Leases were scheduled to expire in July 2014. The Leases included an option to purchase the facilities for the amount expended by the lessor to purchase the facilities. We exercised our purchase option in January 2009 with respect to the 301 Lease in conjunction with the sale of building and land for $137.3 million. The property sold included approximately thirty acres of land and the 163,000 square foot office building located on the land at 301 Velocity Way, Foster City, California, and certain other assets related to the property.
We guaranteed to the lessor a residual value associated with the buildings equal to 82% of their funding of the respective Leases. Under the financial covenants, we must maintain a minimum net worth and a minimum tangible net worth as of the end of each quarter. There is an additional covenant regarding mergers. We are liable to the lessor for the financed amount of the buildings if we default on our covenants. Since we exercised our purchase option with respect to the 301 Lease, our exposure under our remaining synthetic lease arrangement is $56.9 million as of December 31, 2010. We were in compliance with all such financial and merger-related covenants as of December 31, 2010.
Our remaining synthetic lease arrangement with respect to the 303 Lease could have significant negative consequences. For example, it could:
| • | increase our vulnerability to general adverse economic and industry conditions, as we are required to maintain compliance with financial covenants regardless of external conditions; |
| • | limit our ability to obtain additional financing due to covenants and the existing leverage; |
26
Table of Contents
| • | require the dedication of funds to comply with the financial covenants, thereby reducing the availability of cash and/or ability to obtain financing to fund our growth strategy, working capital, capital expenditures, and other general corporate purposes; and |
| • | limit our flexibility in planning for, or reacting to, changes in our business and our industry by restricting funds available to address such changes; and place us at a competitive disadvantage relative to our competitors. |
Our profitability may be affected by unanticipated changes in our tax provisions, the adoption of new U.S. tax legislation, or exposure to additional income tax liabilities.
We are subject to income taxes in the U.S. and many foreign countries. The amounts we charge for intercompany transactions can impact our tax liabilities. We are potentially subject to tax audits in various countries and tax authorities may disagree with our intercompany charges or other matters and assess additional taxes. We regularly review the likely outcomes of these audits to determine whether our tax provisions are sufficient. However, there can be no assurance that we will accurately predict the outcomes of these audits, and the final assessments of these audits can have a material impact on our net income. In addition, our effective tax rate in the future may be impacted by changes in the mix of earnings in countries with differing statutory tax rates, changes in the valuation of deferred tax assets and liabilities, changes in tax laws, and new information discovered during the preparation of our tax returns. In addition, U.S. tax legislative proposals could adversely affect our effective tax rate, if enacted. Any of these changes could negatively impact our net income.
We make estimates and assumptions in connection with the preparation of our consolidated financial statements. Any changes to those estimates and assumptions could adversely affect our results of operations.
In connection with the preparation of our consolidated financial statements, we use certain estimates and assumptions based on historical experience and other factors. Our most critical accounting estimates are described in “Critical Accounting Policies” within “Management’s Discussion and Analysis of Financial Condition and Results of Operations”. We make certain estimates, including decisions related to provisions for legal proceedings, revenue recognition, inventory obsolescence, uncollectible receivables, warranty exposures, stock-based compensation, restructuring reserves, valuation of acquired businesses, goodwill and asset impairment assessment, and other contingencies. While we believe that these estimates and assumptions are reasonable under the circumstances, they are subject to significant uncertainties, some of which are beyond our control. Should any of these estimates and assumptions change or prove to have been incorrect, it could adversely affect our results of operations.
Certain provisions contained in our amended and restated certificate of incorporation and our amended and restated bylaws and under Delaware law could delay or impair a change in control.
Certain provisions in our amended and restated certificate of incorporation and amended and restated bylaws could have the effect of rendering more difficult or discouraging an acquisition of the Company deemed undesirable by our Board of Directors. Our amended and restated certificate of incorporation allows the Board of Directors to issue preferred stock, which may include powers, preferences, privileges, and other rights superior to our common stock, and which could limit our stockholders’ ability to transfer their shares and may affect the price they are able to obtain. Our amended and restated bylaws do not allow stockholders to call special meetings and include, among other things, procedures for advance notification of stockholder nominations and proposals, which may have the effect of delaying or impairing attempts by our stockholders to remove or replace management, to commence proxy contests, or to effect changes in control or hostile takeovers of the Company. In addition, as a Delaware corporation, we are subject to Delaware law, including Section 203 of the Delaware General Corporation Law, which imposes restrictions on certain transactions between a corporation
27
Table of Contents
and certain significant stockholders. These provisions could also have the effect of delaying or impairing the removal or replacement of management, proxy contests, or changes in control. Any provision of our amended and restated certificate of incorporation and amended and restated bylaws that has the effect of delaying or impairing a change in control of the Company could limit the opportunity for our stockholders to receive a premium for their shares of our common stock and could also affect the price that certain investors may be willing to pay for our common stock.
Item 1B: Unresolved Staff Comments
None.
As of December 31, 2010 we owned or leased a total of approximately 0.9 million square feet worldwide. The following table sets forth the location, size, and use of our principal facilities (square footage in thousands):
| Location |
Square footage |
Percent Utilized |
Leased or owned |
Operating |
Principal uses | |||||||||
| Foster City, California (303 Velocity Way) |
295 | 100 | % | Leased* | Corporate | Corporate offices, design and engineering, product testing, sales, customer service | ||||||||
| Meredith, New Hampshire |
163 | 100 | % | Owned | Inkjet | Manufacturing (VUTEk printers), design and engineering, sales, customer service | ||||||||
| Bangalore, India |
145 | *** | 100 | % | Leased | All | Design and engineering, sales, administrative services | |||||||
| Ypsilanti, Michigan |
70 | 100 | % | Leased | Inkjet | Manufacturing (ink), design and engineering, sales, customer service | ||||||||
| Norcross, Georgia |
52 | 100 | % | Leased | APPS | Design and engineering | ||||||||
| Minneapolis, Minnesota |
44 | 100 | % | Owned | APPS | Design and engineering, customer service, software engineering | ||||||||
| Scottsdale, Arizona |
29 | 58 | %** | Leased | APPS | Administrative services, customer service | ||||||||
| Ratingen, Germany |
27 | 100 | % | Leased | Fiery | Software engineering, sales, customer service | ||||||||
| Pittsburgh, Pennsylvania |
18 | 100 | % | Leased | APPS | Software engineering, sales | ||||||||
| Brussels, Belgium |
17 | 100 | % | Leased | Inkjet | Sales, customer service | ||||||||
| Schiphol-Rijk, The Netherlands |
17 | 100 | % | Leased | Inkjet | European corporate offices, sales, support services | ||||||||
| Parsippany, New Jersey |
12 | 69 | %** | Leased | APPS | Design and engineering | ||||||||
| Lebanon, New Hampshire |
9 | 100 | % | Leased | APPS | Software engineering | ||||||||
| Jacksonville, Florida |
8 | 100 | % | Leased | APPS | Software engineering | ||||||||
| San Jose, California |
6 | 100 | % | Leased | Inkjet | Manufacturing (Rastek printers), design and engineering, customer service | ||||||||
| Dronfield, United Kingdom |
5 | 100 | % | Leased | Inkjet | Software engineering, sales, customer service | ||||||||
| * | We have an option to purchase this facility during or at the end of the lease term for the amount expended by the lessor to purchase the facility. Please see Note 8—Commitment and Contingencies of the Notes to Consolidated Financial Statements. |
| ** | Non-utilized square footage has been fully reserved. |
| *** | Currently occupying two facilities as part of our transition into a new facility in 2011. |
We lease eight additional domestic and international regional operations and sales offices, excluding facilities that have been fully reserved. We believe that our facilities, in general, are adequate for our present needs. We do not expect that we would experience difficulties in obtaining additional space at fair market rates, if the need arose.
28
Table of Contents
Legal Proceedings
We may be involved, from time to time, in a variety of claims, lawsuits, investigations, and proceedings relating to contractual disputes, securities laws, intellectual property rights, employment matters, and other litigation matters relating to various claims that arise in the normal course of business. We determine whether an estimated loss from a contingency should be accrued by assessing whether a loss is deemed probable and can be reasonably estimated. We assess our potential liability by analyzing specific litigation and regulatory matters using available information. We develop our views on estimated losses in consultation with inside and outside counsel, which involves a subjective analysis of potential results and outcomes, assuming various combinations of appropriate litigation and settlement strategies. Because of the uncertainties related to both the amount and ranges of possible loss from pending litigation matters, we are unable to predict with certainty the precise liability that could finally result from a range of possible unfavorable outcomes. Taking all of the above factors into account, we reserve an amount that we could reasonably expect to pay for the cases discussed. However, our estimates may be incorrect and we could pay more or less than our current accrual. Litigation can be costly, diverting management’s attention and could, upon resolution, have a material adverse effect on our business, results of operations, financial condition, and cash flow.
As of December 31, 2010, we were subject to the various claims, lawsuits, investigations, or proceedings discussed below, as well as certain other legal proceedings that have arisen in the ordinary course of business.
Durst Fototechnik Technology GmbH (“Durst”) v. Electronics for Imaging GmbH (“EFI GmbH”) and EFI, et al.:
On February 23, 2007, Durst brought an action to enforce a utility model registration patent right against EFI GmbH in the Mannheim District Court in Germany. On May 10, 2007, EFI GmbH filed its Statement of Defenses. These defenses include lack of jurisdiction, non-infringement, invalidity, and unenforceability based on Durst’s improper actions before the German patent office. EFI filed its Statement of Defense on August 29, 2007. EFI’s defenses include those for EFI GmbH, as well as an additional defense for prior use based on EFI’s own European patent rights. The Mannheim court conducted a trial on November 30, 2008, and, following a recess to receive additional expert testimony, finished the trial on August 28, 2009.
In a subsequent decision, the Manheim court invalidated Durst’s utility model registration patent and dismissed Durst’s actions against EFI on February 26, 2010. Durst has appealed the decision and the appeal is currently pending at the court of appeal in Karlsruhe, Germany.
N.V. Perfectproof Europe v. BEST GmbH
On December 31, 2001, N.V. Perfectproof Europe (“Perfectproof”) filed a complaint against BEST GmbH, currently Electronics for Imaging, GmbH (“BEST”) in the Tribunal de Commerce of Brussels, Belgium (the “Commercial Court”), alleging unlawful unilateral termination of an alleged “exclusive” distribution agreement and claiming damages of approximately EUR 599,946 for such termination and additional damages of EUR 247,894, or a total of approximately $1.1 million. In a judgment issued by the Commercial Court on June 24, 2002, the court declared that the distribution agreement was not “exclusive” and challenged its jurisdiction over the claim. Perfectproof appealed the judgment, and by decision dated November 30, 2004, the Court d’Appel of Brussels (the “Court of Appeal”) rejected the appeal and sent the case back to the Commercial Court. Subsequently, by judgment dated November 17, 2009, the Commercial Court dismissed the action for lack of jurisdiction of Belgian courts over the claim. On March 25, 2009, Pefectproof appealed to the Court of Appeal. On November 16, 2010, the Court of Appeal declared, among other things, that the Commercial Court was competent to hear the case and that the agreement between BEST and Perfectproof should be analyzed as an “exclusive” distribution agreement and as such, was subject to reasonable notice prior to termination. The court
29
Table of Contents
further determined that Perfectproof is entitled to damages, for lack of receiving such notice, and appointed an expert to determine the amount of damages within the court’s guidelines. While the determination of damages by the expert is in process, BEST intends to appeal the decision of the Court of Appeal to the Cour de cassation (the Supreme Court) of Brussels.
30
Table of Contents
PART II
Item 5: Market for Registrant’s Common Equity, Related Stockholder Matters and Issuer Purchases of Equity Securities
Our common stock has traded on The NASDAQ Global Select Market (formerly The NASDAQ National Market) under the symbol EFII since October 2, 1992. The table below lists the high and low sales price during each quarter the stock was traded in 2010 and 2009.
| 2010 | 2009 | |||||||||||||||||||||||||||||||
| Q1 | Q2 | Q3 | Q4 | Q1 | Q2 | Q3 | Q4 | |||||||||||||||||||||||||
| High |
$ | 13.61 | $ | 14.86 | $ | 12.20 | $ | 14.87 | $ | 10.40 | $ | 12.00 | $ | 12.93 | $ | 13.15 | ||||||||||||||||
| Low |
$ | 11.25 | $ | 9.22 | $ | 9.18 | $ | 11.95 | $ | 7.75 | $ | 8.81 | $ | 10.18 | $ | 11.10 | ||||||||||||||||
As of February 25, 2011 there were 153 stockholders of record, which does not include a substantially greater number of “street name” holders or beneficial holders of our common stock, whose shares are held of record by banks, brokers, and other financial institutions.
We did not declare or pay cash dividends on our common stock in either 2010 or 2009. We currently anticipate that we will retain all available funds for the operation of our business and do not plan to pay any cash dividends in the foreseeable future.
Equity Compensation Plan Information
Information regarding our equity compensation plans may be found in Item 12 of this Annual Report on Form 10-K and is incorporated herein by reference.
Repurchases of Equity Securities
Repurchases of equity securities during the twelve months ended December 31, 2010 were as follows (in thousands except per share amounts):
| Fiscal month |
Total number of shares purchased(1) |
Average price paid per share |
Total number of shares purchased as part of publicly announced plans |
Approximate dollar value of shares that may yet be purchased under the plans |
||||||||||||
| January 2010 |
4 | $ | 11.86 | — | $ | — | ||||||||||
| February 2010 |
51 | 11.80 | — | — | ||||||||||||
| March 2010 |
72 | 11.99 | — | — | ||||||||||||
| April 2010 |
1 | 11.90 | — | — | ||||||||||||
| May 2010 |
7 | 12.64 | — | — | ||||||||||||
| June 2010 |
— | — | — | — | ||||||||||||
| July 2010 |
— | — | — | — | ||||||||||||
| August 2010 |
64 | 10.91 | — | — | ||||||||||||
| September 2010 |
1 | 11.35 | — | — | ||||||||||||
| October 2010 |
— | — | — | — | ||||||||||||
| November 2010 |
7 | 13.09 | — | — | ||||||||||||
| December 2010 |
36 | 14.65 | — | — | ||||||||||||
| Total |
243 | — | $ | — | ||||||||||||
| (1) | Represents shares purchased from employees to satisfy tax withholding obligations that arose on the vesting of restricted stock units (“RSUs”). |
31
Table of Contents
Comparison of Cumulative Total Return among Electronics For Imaging, Inc., NASDAQ Composite, and NASDAQ Computer Manufacturers Index
The stock price performance graph below includes information required by the SEC and shall not be deemed incorporated by reference by any general statement incorporating by reference in this Annual Report on Form 10-K into any filing under the Securities Act or under the Exchange Act, except to the extent the Company specifically incorporates this information by reference, and shall not otherwise be deemed soliciting material or filed under the Securities Act or the Exchange Act, or subject to the liabilities of Section 18 of the Exchange Act.
The following graph compares cumulative total returns based upon an initial investment of $100 in the Company’s common stock to the NASDAQ Composite and the NASDAQ Computer Manufacturers Index. The stock price performance shown on the graph below is not indicative of future price performance and only reflects the Company’s relative stock price for the five-year period ending on December 31, 2010. All values assume reinvestment of dividends and are calculated at December 31 of each year.
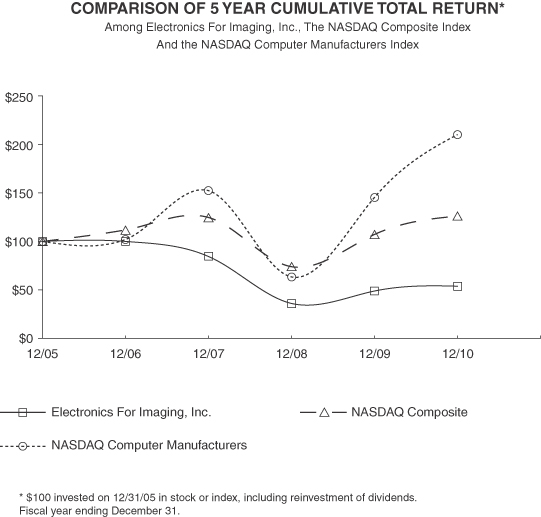
32
Table of Contents
Item 6: Selected Financial Data
The following table summarizes selected consolidated financial data as of and for the five years ended December 31, 2010. This information should be read in conjunction with Item 7, “Management’s Discussion and Analysis of Financial Condition and Results of Operations” and the audited consolidated financial statements and related notes thereto. For a more detailed description, see Part II, Item 7, “Management’s Discussion and Analysis of Financial Condition and Results of Operations.”
| For the years ended December 31, | ||||||||||||||||||||
| (in thousands, except per share amounts) |
2010 | 2009 | 2008 | 2007 | 2006 | |||||||||||||||
| Operations(1) |
||||||||||||||||||||
| Revenue |
$ | 504,007 | $ | 401,108 | $ | 560,380 | $ | 620,586 | $ | 564,611 | ||||||||||
| Gross profit(2) |
267,685 | 211,483 | 317,417 | 361,147 | 335,170 | |||||||||||||||
| Income (loss) from operations(2)(3) |
(1,630 | ) | (67,017 | ) | (145,015 | ) | (2,231 | ) | 15,561 | |||||||||||
| Net income (loss)(2)(3)(4) |
$ | 7,487 | $ | (2,171 | ) | $ | (113,444 | ) | $ | 26,843 | $ | (183 | ) | |||||||
| Earnings per share |
||||||||||||||||||||
| Net income (loss) per basic common share |
$ | 0.16 | $ | (0.04 | ) | $ | (2.16 | ) | $ | 0.47 | $ | (0.00 | ) | |||||||
| Net income (loss) per diluted common share |
$ | 0.16 | $ | (0.04 | ) | $ | (2.16 | ) | $ | 0.44 | $ | (0.00 | ) | |||||||
| Shares used in basic per-share calculation |
45,387 | 49,682 | 52,553 | 56,679 | 56,559 | |||||||||||||||
| Shares used in diluted per-share calculation |
47,152 | 49,682 | 52,553 | 68,102 | 56,559 | |||||||||||||||
| Financial Position |
||||||||||||||||||||
| Cash, cash equivalents, and short-term investments |
$ | 229,663 | $ | 204,201 | $ | 189,351 | $ | 499,852 | $ | 510,171 | ||||||||||
| Working capital |
265,250 | 246,652 | 293,830 | 270,677 | 261,774 | |||||||||||||||
| Total assets |
706,581 | 661,181 | 751,948 | 1,157,739 | 1,144,651 | |||||||||||||||
| Convertible senior debentures |
— | — | — | 240,000 | 240,000 | |||||||||||||||
| Stockholders’ equity |
551,749 | 522,426 | 601,218 | 743,996 | 751,578 | |||||||||||||||
| (1) | Includes acquired company results of operations beginning on the date of acquisition. See Note 2—Acquisitions of the Notes to Consolidated Financial Statements for a summary of recent acquisitions with respect to the years ended December 31, 2010, 2009, and 2008. |
| (2) | Gross profit includes $2.3 million provision for excess solvent inventories and related end-of-life purchases resulting from the accelerating transition from solvent to UV technology for the year ended December 31, 2010. |
| (3) | Income (loss) from operations includes the following: |
| • | Stock-based compensation expense of $15.9, $18.6, $33.4, $24.5, and $23.7 million for the years ended December 31, 2010, 2009, 2008, 2007, and 2006, respectively. We implemented ASC 718, Stock Compensation, as of January 1, 2006. See Note 12—Employee Benefit Plans of the Notes to Consolidated Financial Statements. |
| • | Goodwill and long-lived asset impairment charges of $0.7, $3.2, and $111.9 million for the years ended December 31, 2010, 2009, and 2008, respectively. |
| • | Restructuring and other charges of $3.6, $9.0, $11.0, $1.5, and $1.0 million for the years ended December 31, 2010, 2009, 2008, 2007, and 2006, respectively. |
| • | Acquisition-related costs of $1.2 million for the year ended December 31, 2010 in connection with our acquisition of Radius consistent with the new accounting guidance with respect to business combinations. |
33
Table of Contents
| • | Acquired in-process research & development (“IPR&D”) costs of $2.7 and $8.5 million for the years ended December 31, 2008 and 2006, respectively, were incurred in association with acquisitions that closed prior to the new accounting guidance with respect to business combinations becoming effective. |
| (4) | Net income (loss) includes the following: |
| • | Benefit from the release of previously unrecognized tax benefits of $8.7 million for the year ended December 31, 2010 resulting from the expiration of U.S. federal and state statutes of limitations in 2010. |
| • | Gain on sale of building and land of $80 million for the year ended December 31, 2009 resulting from the sale of a portion of our Foster City, California campus in January 2009 for $137.3 million to Gilead. |
Item 7: Management’s Discussion and Analysis of Financial Condition and Results of Operations
The following discussion and analysis should be read in conjunction with the audited consolidated financial statements and related notes thereto included in this Annual Report on Form 10-K.
All assumptions, anticipations, expectations, and forecasts contained herein are forward-looking statements within the meaning of Section 27A of the Securities Act and Section 21E of the Exchange Act that involve risks and uncertainties. Forward-looking statements include, among others, those statements including the words “expects,” “anticipates,” “intends,” “believes,” and similar language. Our actual results could differ materially from those discussed here. For a discussion of the factors that could impact our results, readers are referred to Item 1A, “Risk Factors,” in Part I of this Annual Report on Form 10-K and to our other reports filed with the SEC. We do not assume any obligation to update the forward-looking statements provided to reflect events that occur or circumstances that exist after the date on which they were made.
Overview
Key financial results for 2010 were as follows:
| • | Our consolidated revenue increased by approximately 26%, or $102.9 million, from $401.1 million for the year ended December 31, 2009 to $504.0 million for the year ended December 31, 2010 consisting of increased Fiery, Inkjet, and APPS revenue of $45.6, $47.9, and $9.4 million, respectively. |
| • | Fiery revenue increased by 24% primarily due to strong demand for our digital color controllers in the high-end production market. Recent new and refreshed OEM engine launches contributed to the revenue increase. |
| • | Inkjet revenue increased by 30% primarily due to GS series printer sales and significantly increased UV printer and ink sales. Coming out of the 2009 downturn, the transition from solvent to UV printers has accelerated. UV ink and service part sales increased reflecting the high utilization that our UV printers are experiencing in the field, partially offset by decreased solvent printer installed base demand, also measured by solvent ink usage and service parts. Prior year Inkjet revenue had decreased significantly due to tightened credit markets, which made it difficult for our customers to obtain financing in 2009. |
| • | APPS revenue increased by 19% due to revenue realized from our recently acquired Radius packaging software, in addition to increased Pace and web-to-print revenue. |
| • | Gross profits were 53% of revenue in 2010, which was comparable to the 2009 gross profit percentage. Improving Inkjet gross profits due to fixed manufacturing costs being spread over higher Inkjet revenue, higher selling prices for new products launched in 2010, and favorable product mix shift toward higher margin printers, partially offset by the provision for excess solvent inventories and related end-of-life purchases resulting from the accelerating transition from solvent to UV technology and engineering design modifications to improve quality and reduce warranty exposure. |
34
Table of Contents
| • | Operating expenses as a percent of revenue decreased from 70% in 2009 to 53% in 2010 primarily due to decreased amortization of identified intangibles, restructuring and other, and asset impairment. Decreased intangible amortization resulted from full amortization of VUTEk existing technology in 2009, partially offset by increased intangible amortization in 2010 due to the Radius acquisition. Restructuring and other and asset impairment decreased in 2010 as compared with 2009 primarily due to higher personnel-related restructuring charges in 2009 and the write-off of equipment and non-cancellable purchase orders incurred relating to a planned product that was cancelled in 2009. |
| • | Interest and other income (expense) decreased by $4.4 million primarily driven by realized and unrealized foreign exchange losses in 2010 and decreased interest income on our investments, offset by losses on equity method investments in 2009. |
| • | The $3.4 million foreign exchange fluctuation primarily resulted from recovery in the value of the Euro and, to a lesser extent, from recovery in the value of the British pound during 2010. |
| • | Interest income on our investments decreased by $2.1 million in 2010 resulting from lower investment balances and interest rates as we sold a substantial portion of our investment portfolio during 2009 to generate cash for the repurchase of our common stock under the accelerated share repurchase (“ASR”) during the first quarter of 2009 and the “modified Dutch auction” tender offer during the fourth quarter of 2009. |
| • | We incurred losses on equity method investments of $1.4 million in 2009. |
| • | In 2010, we recorded a tax benefit of $9.1 million on a pre-tax operating loss of $1.6 million compared to a tax provision of $18.2 million recorded in 2009 on pre-tax operating income of $16.0 million. The change from 2010 to 2009 primarily related to the benefit realized from the release of previously unrecognized tax benefits resulting from the expiration of U.S. federal and state statutes of limitations in 2010 compared to the charge related to the sale of building and land in 2009. |
Results of Operations
The following table sets forth items in our consolidated statements of operations as a percentage of total revenue for 2010, 2009, and 2008. These operating results are not necessarily indicative of results for any future period.
| Years ended December 31, | ||||||||||||
| 2010 | 2009 | 2008 | ||||||||||
| Revenue |
100 | % | 100 | % | 100 | % | ||||||
| Gross profit |
53 | 53 | 57 | |||||||||
| Operating expenses: |
||||||||||||
| Research and development |
21 | 28 | 25 | |||||||||
| Sales and marketing |
21 | 25 | 21 | |||||||||
| General and administrative |
8 | 9 | 8 | |||||||||
| Amortization of identified intangibles |
2 | 5 | 5 | |||||||||
| In-process research & development |
— | — | 1 | |||||||||
| Restructuring and other |
1 | 2 | 2 | |||||||||
| Goodwill and asset impairment |
0 | 1 | 20 | |||||||||
| Total operating expenses |
53 | 70 | 82 | |||||||||
| Loss from operations |
(0 | ) | (17 | ) | (25 | ) | ||||||
| Interest and other income (expense), net |
(0 | ) | 1 | 2 | ||||||||
| Gain on sale of building and land |
— | 20 | — | |||||||||
| Income (loss) before income taxes |
(0 | ) | 4 | (23 | ) | |||||||
| Benefit from (provision for) income taxes |
2 | (5 | ) | 4 | ||||||||
| Net income (loss) |
2 | % | (1 | )% | (19 | )% | ||||||
35
Table of Contents
Revenue
We classify our revenue, gross profit, assets, and liabilities in accordance with our three operating segments as follows:
| • | “Fiery” includes products, services, and technology, which transform digital copiers and printers into high performance networked printing devices, and is made up of stand-alone and embedded controllers, bundled solutions, and design-licensed solutions primarily for the office market and commercial printing markets. This operating segment includes our Fiery series (external print servers and embedded servers), Splash and MicroPress, color and black & white server products, software options for Fiery products, including proofing and scanning solutions, and parts. |
| • | “Inkjet” consists of sales of super-wide and wide format inkjet printers, industrial inkjet printers, ink, parts, and service revenue from the VUTEk, Jetrion, and Rastek businesses. |
| • | “APPS” consists of software technology focused on printing workflow, PMIS, e-commerce, and job tracking tools. |
Our revenue by operating segment for the years ended December 31, 2010, 2009, and 2008 was as follows (in thousands):
| Years ended December 31, | % change | |||||||||||||||||||||||||||||||
| 2010 | 2009 | 2008 | 2010 over 2009 |
2009 over 2008 |
||||||||||||||||||||||||||||
| Fiery |
$ | 238,621 | 47 | % | $ | 193,012 | 48 | % | $ | 289,065 | 52 | % | 24 | % | (33 | )% | ||||||||||||||||
| Inkjet |
207,654 | 41 | 159,732 | 40 | 219,959 | 39 | 30 | (27 | ) | |||||||||||||||||||||||
| APPS |
57,732 | 12 | 48,364 | 12 | 51,356 | 9 | 19 | (6 | ) | |||||||||||||||||||||||
| Total revenue |
$ | 504,007 | 100 | % | $ | 401,108 | 100 | % | $ | 560,380 | 100 | % | 26 | % | (28 | )% | ||||||||||||||||
Proofing software revenue previously reported in the APPS operating segment of $8.6 and $10.3 million for the years ended December 31, 2009 and 2008, respectively, has been revised to conform to the year ended December 31, 2010 presentation, reflecting the reclassification of proofing software from the APPS to the Fiery operating segment. Total revenue for the years ended December 31, 2009 and 2008 has not changed.
Overview
Revenue was $504.0, $401.1, and $560.4 million for the years ended December 31, 2010, 2009, and 2008, respectively, resulting in a 26% increase in 2010 compared with 2009 and a 28% decrease in 2009 compared with 2008. The $102.9 million increase in 2010 compared with 2009 consisted of increased Fiery, Inkjet, and APPS revenue of $45.6, $47.9, and $9.4 million, respectively. The $159.3 million decrease in 2009 compared with 2008 consisted of decreased Fiery, Inkjet, and APPS revenue of $96.1, $60.2, and $3.0 million, respectively.
Fiery Revenue
Fiery revenue increased by $45.6 million, or 24%, in 2010 compared with 2009, which was primarily driven by strong demand for our digital color controllers in the high-end production market. Recent new and refreshed OEM engine launches contributed to the revenue increase.
Fiery revenue declined by $96.1 million, or 33%, in 2009 compared with 2008, which was primarily driven by reduced demand from our OEM customers due to a weak global economy in 2009, as well as OEM customers reducing their inventory levels. The tightening global credit markets also contributed to the revenue decline as it remained relatively more difficult for some of the customers of our OEMs to obtain financing.
36
Table of Contents
Inkjet Revenue
Inkjet revenue increased by $47.9 million, or 30%, in 2010 compared with 2009, primarily due to GS series printer sales and significantly increased UV printer and ink sales. Coming out of the 2009 downturn, the transition from solvent to UV printers has accelerated. UV ink and service part sales increased reflecting the high utilization that our UV printers are experiencing in the field, partially offset by decreased solvent printer installed base demand, also measured by solvent ink usage and service parts.
Inkjet revenue declined by $60.2 million, or 27%, in 2009 compared with 2008, primarily driven by a weak global economy and tight credit markets as some of our customers were challenged in their attempts to obtain financing to purchase our products. In addition, the softening of the retail sector and related demand for signs, billboards, and point of purchase displays impacted our customers’ businesses and their demand for ink, which resulted in a lower demand for our ink products beginning in the fourth quarter of 2008.
APPS Revenue
APPS revenue increased by $9.4 million, or 19% in 2010 compared with 2009 due to revenue realized from our recently acquired Radius packaging software, in addition to increased Pace and web-to-print revenue.
APPS revenue declined by $3.0 million, or 6% in 2009 compared with 2008, which did not decline as significantly on a percentage basis compared with our other operating segments due to the benefits realized from the Pace acquisition, which closed during the third quarter of 2008, and the recurring portion of APPS revenue. APPS recurring revenue includes subscription revenue and maintenance fees.
The APPS operating segment includes our PMIS software, including Monarch, Pace, PSI, Logic, PrintSmith and PrintFlow; our web-based order entry and order management software; and Radius, our print management packaging software. In July 2010, to establish our presence in the packaging industry, we acquired Golflane, a U.K. private limited company, the parent holding company of Radius, a leading provider of PMIS
to the packaging industry. In 2008, we reorganized our PMIS product lines after the acquisition of Pace to better leverage our investment in the APPS operating segment and concentrate our resources on fewer products. As a result, we no longer sell PSI and Logic to new customers and have reduced our investment in the development of these products. We currently sell PrintSmith to small print-for-pay and small commercial print shops; Pace to medium and large commercial print shops, display graphics providers, in-plant printing operations, and government printing operations; Monarch to large commercial, publication, and digital print shops; and Radius to the packaging industry.
Our revenue by geographic area for the years ended December 31, 2010, 2009, and 2008 was as follows (in thousands):
| For the years ended December 31, | % change | |||||||||||||||||||||||||||||||
| 2010 | 2009 | 2008 | 2010 over 2009 |
2009 over 2008 |
||||||||||||||||||||||||||||
| Americas |
$ | 293,747 | 58 | % | $ | 229,294 | 57 | % | $ | 297,896 | 53 | % | 28 | % | (23 | )% | ||||||||||||||||
| EMEA |
149,488 | 30 | 122,696 | 30 | 194,474 | 35 | 22 | % | (37 | ) | ||||||||||||||||||||||
| Japan |
41,853 | 8 | 35,041 | 9 | 52,048 | 9 | 19 | % | (33 | ) | ||||||||||||||||||||||
| Other international locations |
18,919 | 4 | 14,077 | 4 | 15,962 | 3 | 34 | % | (12 | ) | ||||||||||||||||||||||
| Total revenue |
$ | 504,007 | 100 | % | $ | 401,108 | 100 | % | $ | 560,380 | 100 | % | 26 | % | (28 | )% | ||||||||||||||||
Revenue rebounded in 2010 across all regions and all operating segments within each region. The operating segment geographic breakdown in 2010 remained comparable to 2009. Comparing 2010 to 2009, Americas, EMEA, Japan, and other international location revenue increased by 28%, 22%, 19%, and 34%, respectively. New Fiery and Inkjet product launches have mitigated the impact of the weak economic environment.
37
Table of Contents
Revenue declined in 2009 across all regions. In the individual regions, Fiery and Inkjet declined in the Americas and EMEA, while Fiery declined in Japan. Americas revenue increased from 53% of total revenue in 2008 to 57% of total revenue in 2009 and EMEA revenue decreased from 35% of total revenue in 2008 to 30% of total revenue in 2009, as a result of stronger sales in the Americas, as compared with EMEA, in 2009 as compared with 2008.
Americas revenue decreased by 23% in 2009 compared to 2008, primarily due to weakness in Fiery sales caused by reduced demand from our OEM customers due to the slow economy and weak Inkjet sales due to the tight global credit markets and the decline in global marketing spending. Likewise, the soft retail sector and the related demand impacted our customers’ businesses. EMEA revenue decreased 37% in 2009 compared to 2008 also due to the slow economy and tight credit markets in Europe. Japan revenue decreased 33% in 2009 compared to 2008 as a result of reduced Fiery demand. Other international location revenue decreased by 12% in 2009 compared to 2008 mainly driven by lower sales due to the impact of macro-economic conditions.
In the individual regions, Fiery revenue represented 41%, 49%, 90%, and 40% of 2010 revenue in the Americas, EMEA, Japan and other international locations, respectively, compared with 42%, 48%, 91%, and 42% of 2009 revenue.
Inkjet revenue represented 41%, 48%, 9%, and 57% of 2010 revenue in the Americas, EMEA, Japan, and other international locations, respectively, compared with 39%, 49%, 8%, and 55% of 2009 revenue.
APPS revenue represented 18%, 3%, 1%, and 3% of 2010 revenue in the Americas, EMEA, Japan, and other international locations, respectively, compared with 18%, 3%, 1%, and 3% of 2009 revenue.
Within each geographic region, proofing software revenue previously reported in the APPS operating segment for the year ended December 31, 2009 has been revised to conform to the year ended December 31, 2010 presentation, reflecting the reclassification of proofing software from the APPS to the Fiery operating segment. Total revenue for the year ended December 31, 2009 has not changed.
Shipments to some of our OEM customers are made to centralized purchasing and manufacturing locations, which in turn ship to other locations, making it more difficult to obtain accurate geographical shipment data. Accordingly, we believe that export sales of our products into each region may differ from what is reported. We expect that sales outside of the U.S. will continue to represent a significant portion of our total revenue.
A substantial portion of our revenue over the years has been attributable to sales through our OEM customers and independent distributor channels. Canon and Xerox each contributed over 10% of our revenue individually and together accounted for approximately 27%, 26%, and 29% of our revenue for the years ended December 31, 2010, 2009, and 2008, respectively. Our dependency on our OEM customers has been decreasing, although the OEM dependency percentage has leveled off in recent years. In 2010, 2009, and 2008, 57%, 57%, and 56%, respectively, of revenue were from non-OEM sources. Over time, we expect the OEM percentage to continue to decline. Because sales of our printer and copier-related products constitute a significant portion of our revenue and there is a limited number of OEMs producing copiers and printers in sufficient volume to be attractive customers for us, we expect that we will continue to depend on a relatively small number of OEM customers for a significant portion of our controller revenue in future periods.
Our decreasing revenue reliance on our major OEM customers is attributable to the increase in the Inkjet and APPS operating segments where most revenue is generated from sales to distributors and direct customers. No assurance can be given that our relationships with these and other significant OEM customers will continue or that we will be successful in increasing the number of our OEM customers or the size of our existing OEM relationships. Several of our OEM customers have reduced their purchases from us at various times in the past and any customer could do so in the future as there are no contractual obligations with most of our OEMs to purchase our products in significant amounts, or at all. Such reductions have occurred in the past and could in the
38
Table of Contents
future have a significant negative impact on our consolidated financial position and results of operations. We expect that if we increase our revenue from Inkjet and APPS products, the percentage of our revenue that comes from individual OEM customers will decrease.
We intend to continue to develop new products and technologies for each of our product lines including new generations of server and controller products, super-wide and wide format printers, and other new product lines, and to distribute those new products to or through current and new OEM customers, distributors, and end-users in 2011 and beyond. No assurance can be given that the introduction or market acceptance of current or future products will be successful.
If sales of our products do not grow over time in absolute terms, or if we are not able to meet demand for higher unit volumes, it could have a material adverse effect on our operating results. There can be no assurance that any products that we introduce in the future will successfully compete, be accepted by the market, or otherwise effectively replace the volume of revenue and/or income from our older products. Market acceptance of our software products, products acquired through acquisitions, and other products cannot be assured. In addition, we may experience loss of sales, unexpected costs, or adverse impact on relationships with customers or suppliers as a result of acquisitions.
We also believe that in addition to the factors described above, price reductions for our products will affect revenue in the future. We have previously reduced, and in the future will likely change, prices for our products. Depending on the price elasticity of demand for our products, the pricing and quality of competitive products, and other economic and competitive conditions, price changes have had, and may in the future have, an adverse impact on our revenue and profit.
Gross Profit
Gross profit by operating segment, excluding stock-based compensation, for the years ended December 31, 2010, 2009, and 2008 was as follows (in thousands):
| Year
Ended December 31, 2010 |
||||||||||||||||||||
| Fiery | Inkjet | APPS | Stock-based Compensation Expense |
Total | ||||||||||||||||
| Revenue |
$ | 238,621 | $ | 207,654 | $ | 57,732 | $ | — | $ | 504,007 | ||||||||||
| Cost of revenue |
77,402 | 139,533 | 18,403 | 984 | 236,322 | |||||||||||||||
| Gross profit |
$ | 161,219 | $ | 68,121 | $ | 39,329 | $ | (984 | ) | $ | 267,685 | |||||||||
| Gross profit percentages |
67.6 | % | 32.8 | % | 68.1 | % | 53.1 | % | ||||||||||||
| Year Ended December 31, 2009 |
||||||||||||||||||||
| Fiery | Inkjet | APPS | Stock-based Compensation Expense |
Total | ||||||||||||||||
| Revenue |
$ | 193,012 | $ | 159,732 | $ | 48,364 | $ | — | $ | 401,108 | ||||||||||
| Cost of revenue |
63,772 | 108,984 | 15,795 | 1,074 | 189,625 | |||||||||||||||
| Gross profit |
$ | 129,240 | $ | 50,748 | $ | 32,569 | $ | (1,074 | ) | $ | 211,483 | |||||||||
| Gross profit percentages |
67.0 | % | 31.8 | % | 67.3 | % | 52.7 | % | ||||||||||||
39
Table of Contents
| Year Ended December 31, 2008 |
||||||||||||||||||||
| Fiery | Inkjet | APPS | Stock-based Compensation Expense |
Total | ||||||||||||||||
| Revenue |
$ | 289,065 | $ | 219,959 | $ | 51,356 | $ | — | $ | 560,380 | ||||||||||
| Cost of revenue |
91,687 | 130,282 | 18,523 | 2,471 | 242,963 | |||||||||||||||
| Gross profit |
$ | 197,378 | $ | 89,677 | $ | 32,833 | $ | (2,471 | ) | $ | 317,417 | |||||||||
| Gross profit percentages |
68.3 | % | 40.8 | % | 63.9 | % | 56.6 | % | ||||||||||||
Proofing software gross profit previously reported in the APPS operating segment of $7.7 and $9.0 million for the years ended December 31, 2009 and 2008, respectively, has been revised to conform to the year ended December 31, 2010 presentation, reflecting the reclassification of proofing software from the APPS to the Fiery operating segment. Total gross profit for the years ended December 31, 2009 and 2008 has not changed.
Overview
Our gross profit percentages were 53.1%, 52.7%, and 56.6% for the years ended 2010, 2009, and 2008, respectively. All three operating segments contributed to the small increase in the gross profit percentage in 2010, as compared with 2009. The decrease in the gross profit percentage in 2009 of 52.7%, as compared with 56.6% in 2008, was primarily due to the reduced Inkjet gross profit percentage from 40.8% in 2008 to 31.8% in 2009.
Inkjet revenue was 41%, 40%, and 39% of total revenue in 2010, 2009, and 2008, respectively. Our Inkjet operating segment is growing as a percentage of revenue, which decreases the overall gross profit percentage. The Inkjet gross profit percentage is lower than each of the Fiery and APPS gross profit percentages. Our ink sales represent a continuing revenue stream to existing customers that will increase if our Inkjet customers’ production increases. Ink margins are typically higher than overall Inkjet margins.
Fiery Gross Profit
The Fiery gross profit percentage increased from 67.0% in 2009 to 67.6% in 2010 primarily due to a mix shift toward stand-alone servers as stand-alone servers have higher margins than embedded servers, along with costs to launch new products.
The decrease in the Fiery gross profit percentage from 68.3% in 2008 to 67.0% in 2009 was primarily mix-related as embedded servers have lower margins than stand alone servers, along with costs to launch new products. Fiery revenue decreased as a percentage of total revenue from 52% in 2008 to 48% in 2009.
Inkjet Gross Profit
The Inkjet gross profit percentage increased from 31.8% in 2009 to 32.8% in 2010. Improving Inkjet gross profit due to fixed manufacturing costs spread over higher Inkjet revenue, higher selling prices for new products launched in 2010, and favorable product mix shift toward higher margin printers, partially offset by the $2.3 million provision for excess solvent inventories and related end-of-life purchases resulting from the accelerating transition from solvent to UV technology and engineering design modifications to improve quality and reduce warranty exposure.
The decrease in the Inkjet gross profit percentage from 40.8% in 2008 to 31.8% in 2009 resulted from relatively fixed manufacturing costs spread over lower revenue and, to a lesser extent, costs associated with the consolidation of our ink production into a single facility to streamline the production process and reduce ink production costs. Inkjet fixed manufacturing costs decreased as compared with the prior year, but not by enough to offset the revenue decline.
40
Table of Contents
APPS Gross Profit
The increase in the APPS gross profit percentage from 67.3% in 2009 to 68.1% in 2010 was primarily due to increased revenue. APPS revenue was 12% of total revenue in 2010, which was comparable to 2009, but the increase in revenue dollars aided the gross profit percentage due to the fixed component included within the APPS cost of revenue.
The increase in the APPS gross profit percentage from 63.9% in 2008 to 67.3% in 2009 was primarily due to operating efficiencies, which continue to be achieved through the Pace acquisition, which closed during the third quarter of 2008. Our overall gross profit percentage was also aided by increased APPS revenue as a percentage of total revenue from 9% in 2008 to 12% in 2009.
If our product mix changes significantly, our gross profit will fluctuate. In addition, gross profit can be impacted by a variety of other factors. These factors include market prices achieved on our current and future products, availability and pricing of key components (including DRAM, processors, and print heads), subcontractor manufacturing costs, product mix, distribution channel, geographic mix, product transition results, new product introductions, competition, and general economic conditions in the U.S. and abroad. Consequently, gross profit may fluctuate from period to period. In addition, if we reduce prices, gross profit could be lower.
Many of our products and sub-assemblies are manufactured by subcontract manufacturers that purchase most of the necessary components. If our subcontract manufacturers cannot obtain necessary components at favorable prices, we could experience increased product costs. We purchase certain components directly, including processors, memory, certain ASICs, and software licensed from various sources, including Adobe PostScript® software.
Stock-based Compensation
Stock-based compensation expenses were $15.9, $18.6, and $33.4 million, respectively, for the years ended December 31, 2010, 2009, and 2008. We account for stock-based payment awards, in accordance with ASC 718, which requires stock-based compensation expense to be recognized based on the fair value of such awards on the date of grant. We amortize stock-based compensation expense on a graded vesting basis over the vesting period. Stock-based compensation cost is recognized over the requisite service period for each separately vesting tranche as though the award were, in substance, multiple awards. This has the impact of greater stock-based compensation expense during the initial years of the vesting period based on the grant date fair value.
Stock-based compensation expense decreased by $2.7 million, or 15%, from 2009 to 2010 due to fewer equity awards granted in 2010.
Stock-based compensation expense decreased by $14.8 million, or 44%, from 2008 to 2009. Equity awards issued during 2008 and the fourth quarter of 2007 were significant due to the fact that no equity awards were granted during the first 10 months of 2007 because of the stock option review being conducted at that time.
See Note 12—Employee Benefit Plans of the Notes to Consolidated Financial Statements for additional discussion of stock-based compensation.
41
Table of Contents
Operating Expenses
Operating expenses for the years ended December 31, 2010, 2009, and 2008, were as follows (in thousands):
| Years ended December 31, | ||||||||||||||||||||
| 2010 | 2009 | 2008 | % change | |||||||||||||||||
| 2010 over 2009 |
2009 over 2008 |
|||||||||||||||||||
| Research and development |
$ | 105,769 | $ | 110,822 | $ | 140,437 | (5 | )% | (21 | )% | ||||||||||
| Sales and marketing |
107,322 | 102,001 | 119,400 | 5 | (15 | ) | ||||||||||||||
| General and administrative |
38,185 | 35,033 | 47,685 | 9 | (27 | ) | ||||||||||||||
| Amortization of identified intangibles |
12,385 | 18,479 | 29,367 | (33 | ) | (37 | ) | |||||||||||||
| In-process research & development |
— | — | 2,680 | — | (100 | ) | ||||||||||||||
| Restructuring and other |
3,615 | 8,957 | 11,005 | (60 | ) | (19 | ) | |||||||||||||
| Goodwill and asset impairment |
685 | 3,208 | 111,858 | (79 | ) | (97 | ) | |||||||||||||
| Total operating expenses |
$ | 267,961 | $ | 278,500 | $ | 462,432 | (4 | )% | (40 | )% | ||||||||||
Operating expenses decreased by $10.5 million, or 4%, in 2010 as compared with 2009, and decreased by $183.9 million, or 40%, in 2009 as compared with 2008.
Operating expenses as a percent of revenue decreased from 70% in 2009 to 53% in 2010 primarily due to decreased amortization of identified intangibles, restructuring and other, and asset impairment. Decreased intangible amortization resulted from full amortization of VUTEk existing technology in 2009, partially offset by increased intangible amortization in 2010 due to the Radius acquisition. Restructuring and other and asset impairment decreased in 2010 as compared with 2009 primarily due to higher personnel-related restructuring charges in 2009 and the write-off of equipment and non-cancellable purchase orders incurred relating to a planned product that was cancelled in 2009.
Operating expenses as a percent of revenue decreased from 82% in 2008 to 70% in 2009 primarily due to impairment charges recorded on goodwill and certain long-lived assets as a result of the impairment analysis conducted during the fourth quarter of 2008 and IPR&D charges related to our 2008 acquisitions of Pace Systems Group, Inc. (“Pace”) and Raster Printers, Inc. (“Raster”).
Research and Development
Research and development expenses consist primarily of costs associated with personnel, consulting, and prototype materials. Research and development expenses for the years ended December 31, 2010, 2009, and 2008 were $105.8, or 21% of revenue, $110.8 million, or 28% of revenue, and $140.4 million, or 25% of revenue, respectively.
Research and development expenses decreased by $5.0 million, or 5%, in 2010 as compared with 2009. Personnel-related expenses decreased by $1.2 million primarily due to salary reductions in place for most of 2010, partially offset by increased Radius head count and increased variable compensation due to improved profitability and decreased utilization of vacation balances. Prototypes and non-recurring engineering expenses decreased by $1.0 million. Stock-based compensation expense decreased by $2.5 million due to the timing of equity awards issued during the last twelve months amortized under the graded vesting method. The remaining $0.4 million reduction in research and development expenses relates to facility downsizing achieved during the last year in the APPS operating segment and in Japan. Cost reductions achieved during the year ended December 31, 2010 are net of increased research and development spending due to the Radius acquisition, which closed during the third quarter of 2010.
Research and development expenses decreased by $29.6 million, or 21%, in 2009 as compared with 2008. Personnel-related expenses decreased by $17.6 million primarily due to head count, salary, variable compensation, consulting, and travel reductions. Prototypes and non-recurring engineering expenses decreased
42
Table of Contents
by $0.4 million. Stock-based compensation expense decreased by $6.3 million due to the timing of equity awards issued during the last twelve months amortized under the graded vesting method. The remaining $5.3 million reduction in research and development expenses relates to facility downsizing achieved during the last year in the APPS operating segment and cost reductions achieved by focused efforts on key initiatives in all areas. Cost reductions achieved during the year ended December 31, 2009 are net of increased research and development spending due to the Pace and Raster acquisitions, each of which closed during the latter half of 2008.
Research and development head count was 834, 820, and 894 as of December 31, 2010, 2009, and 2008, respectively.
We expect that if the U.S. dollar remains volatile against other currencies, research and development expenses reported in U.S. dollars could fluctuate.
Sales and Marketing
Sales and marketing expenses include personnel expenses, trade shows, marketing programs, promotional materials, sales commissions, travel and entertainment, depreciation, and costs associated with sales offices in the U.S., Europe, Asia, and other international locations. Sales and marketing expenses for the years ended December 31, 2010, 2009, and 2008 were $107.3 million, or 21% of revenue, $102.0 million, or 25% of revenue, and $119.4 million, or 21% of revenue, respectively.
Sales and marketing expenses increased by $5.3 million, or 5%, in 2010 as compared with 2009. Personnel-related expenses increased by $4.9 million primarily due to increased head count resulting from the Radius acquisition, variable compensation due to improved profitability, commission payments resulting from increased revenue, and decreased utilization of vacation balances. Travel expenses increased by $1.5 million primarily due to increased trade show activity. We have increased trade show and marketing program spending by $3.7 million as the printing industry has begun to recover. Stock-based compensation expense decreased by $0.5 million due to the timing of equity awards issued during the last twelve months amortized under the graded vesting method. The remaining $4.3 million reduction in sales and marketing expenses relates to facility downsizing achieved during the last year and a focused effort on cost reduction in all areas.
Sales and marketing expenses decreased by $17.4 million, or 15%, in 2009 as compared with 2008. Personnel-related expenses decreased by $6.1 million primarily due to head count, salary, and variable compensation reductions. Travel expenses decreased by $3.6 million due to reduced travel to trade shows in the current year. Marketing and trade show expenses decreased by $4.4 million due to more efficient spending and the inclusion of Drupa trade show expenses during the second quarter of 2008. Drupa is a European trade show that is held once every four years. Stock-based compensation expense decreased by $1.8 million due to the timing of equity awards issued during the last twelve months amortized under the graded vesting method. The remaining $1.5 million reduction in sales and marketing expenses relates to facility downsizing achieved during the last year and a focused effort on cost reduction in all areas.
Sales and marketing head count was 527, 507, and 515 of December 31, 2010, 2009, and 2008, respectively.
Over time, our sales and marketing expenses may increase in absolute terms, if revenue increases in future periods, as we continue to actively promote our products and introduce new products and services. We expect that if the U.S. dollar remains volatile against other currencies, sales and marketing expenses reported in U.S. dollars could fluctuate.
General and Administrative
General and administrative expenses consist primarily of costs associated with administrative personnel, legal, and finance expenses. General and administrative expenses for the years ended December 31, 2010, 2009, and 2008 were $38.2 million, or 8% of revenue, $35.0 million, or 9% of revenue, and $47.7 million, or 8% of revenue, respectively.
43
Table of Contents
General and administrative expenses increased $3.2 million, or 9%, in 2010 as compared with 2009. Personnel-related expenses increased by $0.7 million primarily due to variable compensation due to improved profitability, decreased utilization of vacation balances, increased recruiting, and increased travel, partially offset by reduced salaries and head count through most of the year. The increase in the fair value of the Radius earnout explained an additional $0.4 million of the increase in personnel-related expenses. Legal expenses decreased by $1.0 million as significant cases were settled in the prior year and more efficient spending. Stock-based compensation expense increased by $0.5 million due to the timing of equity awards issued during the last twelve months amortized under the graded vesting method. Consistent with the new accounting guidance with respect to business combinations, acquisition-related costs of $1.2 million were expensed during the nine months ended September 30, 2010 in connection with our acquisition of Radius. The remaining $1.4 million reduction in general and administrative expenses is due to focused effort on cost reduction in all areas.
General and administrative expenses decreased $12.7 million, or 27%, in 2009 as compared with 2008. Personnel-related expenses decreased by $1.8 million primarily due to head count, salary, variable compensation, and travel reductions. Consulting expenses decreased by $1.9 million, including additional costs associated with our fair value stock option exchange program. Expenses associated with the stock option review decreased by $1.8 million as the review was concluded in 2008. Legal expenses decreased by $4.4 million due to the settlement of certain cases and more efficient spending. Stock-based compensation expense decreased by $5.4 million due to the timing of equity awards issued during the last twelve months amortized under the graded vesting method. These decreases were partially offset by a $3.6 million legal reserve reduction, net of settlements. The remaining $1.0 million reduction in general and administrative expenses is due to focused effort on cost reduction in all areas.
Amortization of Identified Intangibles
Amortization of identified intangibles for the years ended December 31, 2010, 2009, and 2008 was $12.4 million, or 2% of revenue, $18.5 million, or 5% of revenue, and $29.4 million, or 5% of revenue, respectively.
The decrease of $6.1 million in 2010, as compared with 2009, is due to several intangible assets becoming fully amortized in 2010, partially offset by amortization of identified intangibles in the Radius acquisition, which closed during the third quarter of 2010, respectively, and a full year of shortened useful lives of certain trademarks primarily within the Inkjet operating segment.
The decrease of $10.9 million in 2009, as compared with 2008, is due to several intangible assets becoming fully amortized in 2009, partially offset by a full year of amortization of intangible assets identified as components of the Pace and Raster acquisitions, which closed during the third and fourth quarters of 2008, respectively, and shortened useful lives of certain trademarks primarily within the Inkjet operating segment.
IPR&D
In 2008, we incurred IPR&D expenses of $2.7 million as a result of our acquisitions of Pace and Raster. No IPR&D expenses were incurred with respect to our acquisition of Radius because all research and development efforts were in the deployment stage at the acquisition date. If Radius research and development efforts had progressed beyond the deployment stage, such IPR&D expenses would have been capitalized as an intangible asset at the acquisition date in accordance with the new acquisition accounting guidance that became effective in 2009.
Restructuring and Other
During the years ended December 31, 2010, 2009, and 2008, cost reduction actions were taken to lower our quarterly operating expense run rate as we analyzed our cost structure. We announced restructuring plans to better align our costs with revenue levels due to the economic environment and to re-align our cost structure following the acquisitions of Radius in 2010 and Pace in 2008. Restructuring and other consists primarily of restructuring, severance, facility downsizing, and acquisition integration expenses.
44
Table of Contents
Restructuring and other costs for the years ended December 31, 2010, 2009, and 2008 totaled $3.6, $9.0, and $11.0 million, respectively. Restructuring and other charges include severance costs of $2.4, $8.1, and $8.3, million related to head count reductions of 98, 227, and 166 for the years ended December 31, 2010, 2009, and 2008, respectively. Severance costs include severance payments, related employee benefits, retention bonuses, and outplacement or relocation costs. Restructuring and other includes a $0.6 million charge resulting from a decrease in estimated sublease income necessitated by continuing weakness in the commercial real estate market where these facilities are located, costs to downsize five facilities in 2010, and integration expenses resulting from the Radius acquisition. Restructuring and other includes charges to downsize three facilities during 2009 and charges to downsize five facilities and integrate our Pace and Raster acquisitions during 2008.
Other Income (Expense), Net
Interest and Other Income (Expense), Net
Interest and other income (expense), net, includes interest income, net, gains (losses) from sales of short-term investments, net, and net foreign currency transaction gains and losses. Interest and other income (expense), net, for the years ended December 31, 2010, 2009, and 2008 was $(1.4), $3.1, and $11.9 million, respectively.
Interest income for the years ended December 31, 2010, 2009, and 2008 was $1.7, $3.8, and $13.9 million, respectively. The decrease of $2.1 million from 2009 to 2010 and $10.1 million from 2008 to 2009 was driven by lower investment balances and interest rates as we sold a substantial portion of our investment portfolio during 2009 to generate cash for the repurchase of our common stock under the ASR during the first quarter of 2009 and the “modified Dutch auction” tender offer during the fourth quarter of 2009, and to generate cash for the redemption of our 1.50% convertible senior debentures, which occurred in June 2008.
We had net realized gains (losses) on our marketable securities of $0.4, $(0.8), and $3.0 million for the years ended December 31, 2010, 2009, and 2008, respectively, consisting of gains on our investments in marketable securities of $0.4, $0.6, and $3.9 million, respectively, offset by losses on our equity method investments of $0, $1.4, and $0.9 million, respectively.
Interest expense consists of interest and debt amortization expenses related to our 1.50% convertible senior debentures. Interest expense for the year ended December 31, 2008 was $1.5 million. The $240.0 million outstanding balance of our 1.50% convertible senior debentures was redeemed on June 2, 2008.
Realized and unrealized foreign exchange gains (losses) were $(3.4), $0.2, and $(2.9) million for the years ended December 31, 2010, 2009, and 2008, respectively. These fluctuations primarily result from recovery in the value of the Euro and, to a lesser extent, from recovery in the value of the British pound during the respective periods.
Gain on Sale of Building and Land
During the first quarter of 2009, we sold a portion of the Foster City, California campus for $137.3 million. Under the agreement, we sold the approximately 163,000 square foot building at 301 Velocity Way, as well as approximately 30 acres of related land and certain other assets related to the property. The cost of the land, building, improvements, and direct transaction costs were included in the determination of the $80 million gain on sale of building and land.
Goodwill Impairment
We perform our annual goodwill impairment analysis in the fourth quarter of each year according to the provisions of ASC 350-20-35, Goodwill—Intangibles and Other—Subsequent Measurement. A two-step impairment test of goodwill is required. In the first step, the fair value of each reporting unit is compared to its carrying value. If the fair value exceeds carrying value, goodwill is not impaired and further testing is not
45
Table of Contents
required. If the carrying value exceeds fair value, then the second step of the impairment test is required to determine the implied fair value of the reporting unit’s goodwill. The implied fair value of goodwill is calculated by deducting the fair value of all tangible and intangible net assets of the reporting unit, excluding goodwill, from the fair value of the reporting unit as determined in the first step. If the carrying value of the reporting unit’s goodwill exceeds its implied fair value, then an impairment loss must be recorded equal to the difference.
Based on the outcome of conditions existing during the fourth quarter of 2008, we determined that a triggering event requiring an interim impairment analysis had occurred relating to the Inkjet reporting unit. The resulting impairment analysis resulted in a non-cash goodwill impairment charge of $104 million during the fourth quarter of 2008. The goodwill valuation analysis was performed based on our respective reporting units—Fiery, Inkjet, and APPS—which are consistent with our operating segments identified in Note 15—Segment Information, Geographic Data, and Major Customers of the Notes to Consolidated Financial Statements.
We determined the fair value of the Inkjet and APPS reporting units as of December 31, 2010 by equally weighting the market and income approaches. The fair value of the Fiery reporting unit was determined based on the market approach. Under the market approach, we estimated fair value based on market multiples of revenue or earnings of comparable companies. Under the income approach, we measured fair value of the Inkjet and APPS reporting units based on a projected cash flow method using a discount rate determined by our management to be commensurate with the risk inherent in our current business model.
To identify suitable comparable companies under the market approach, consideration was given to the financial condition and operating performance of the reporting unit being evaluated relative to companies operating in the same or similar businesses, potentially subject to corresponding economic, environmental, and political factors and considered to be reasonable investment alternatives. Consideration was given to the investment characteristics of the subject company relative to those of similar publicly traded companies (i.e., guideline companies). Guideline company stocks are actively traded. In applying the Public Company Market Multiple Method (“PCMMM”), valuation multiples were derived from historical and projected operating data of guideline companies and applied to the appropriate operating data of our reporting units to arrive at an indication of fair value. Five, four, and seven suitable guideline companies were identified for the Fiery, Inkjet, and APPS reporting units, respectively. Based on our valuation results, we have determined that the fair values of our reporting units exceed their carrying values. Fiery, Inkjet, and APPS fair values are $226, $192, and $67 million, respectively, which exceed carrying value by 124%, 34%, and 26%, respectively.
Because the fair value of the Fiery reporting unit significantly exceeded its carrying value as of December 31, 2010 as indicated by the market-based valuation, management did not deem it necessary to further supplement the bases for this judgment. While the fair value of the Inkjet and APPS reporting units exceeded their carrying values based on the market-based valuation, management determined to further examine whether an impairment had occurred given the Inkjet impairment recognized in the fourth quarter of 2008 and the relatively small excess of the fair value of the APPS reporting unit over its carrying value. We reviewed the factors that could trigger an impairment charge and completed an income-based impairment analysis. As part of this process, we engaged a third party valuation firm to aid management in its analysis. All estimates, key assumptions, and forecasts were either provided by or reviewed by us. While we chose to utilize a third party valuation firm, the impairment analysis and related valuations represent the conclusions of management and not the conclusions or statements of any third party.
Solely for purposes of establishing inputs for the income approach to assess the fair value of the Inkjet and APPS reporting units, we made the following assumptions:
| • | Despite improved Inkjet performance in 2010, resulting from an improving economic climate in 2010 and new product introductions beginning in 2009 and continuing in 2010, Inkjet revenues remained below 2008 results. |
| • | APPS revenue in 2010 exceeded 2008 revenue due to improved APPS performance resulting from the Radius acquisition and continued strong performance from the Pace acquisition. |
46
Table of Contents
| • | Inkjet revenue will exceed 2008 revenue levels in 2011. |
| • | Achieving a normalized long-term growth model between 2011 and 2015. |
| • | Long-term industry growth past 2015. |
Our discounted cash flow projections for the Inkjet and APPS reporting units were based on six-year financial forecasts, which were based on annual financial forecasts developed internally by management for use in managing our business and through discussions with the independent valuation firm engaged by us. The significant assumptions utilized in these six-year forecasts included annual revenue growth rates ranging from 5% to 18%, which equates to compound annual growth rates of 8% and 10% for the Inkjet and APPS reporting units, respectively. Future cash flows were discounted to present value using a mid-year convention and a discount rate of 15%. Terminal values were calculated using the Gordon growth methodology with a long-term growth rate of 4.5%. The sum of the fair values of the Fiery, Inkjet, and APPS reporting units was reconciled to our current market capitalization (based on our stock price) plus an estimated control premium. Significant assumptions used in determining fair values of the reporting units include the determination of appropriate market comparables, estimated multiples of revenue and EBITDA that a willing buyer is likely to pay, estimated control premium a willing buyer is likely to pay, gross profit, and operating expenses. Inkjet gross profit is assumed to increase as fixed production costs are absorbed by increasing Inkjet volumes, while APPS gross profit is assumed to remain consistent during the forecast horizon. Gross profit and operating expenses as a percentage of revenue over the six-year forecast horizon are assumed to approximate percentages realized by the guideline companies.
To assess the reasonableness of the estimated control premium of 16%, we examined the most similar transactions in relevant industries and determined the average premium indicated by the transactions deemed to be most similar to a hypothetical transaction involving our reporting units. We examined the weighted average and median control premiums offered in these industries, industry specific control premiums, and specific transaction control premiums to conclude that our estimated control premium is reasonable.
We assess the impairment of identifiable intangibles and long-lived assets whenever events or changes in circumstances indicate the carrying value may not be recoverable or the life of the asset may need to be revised. Factors considered important that could trigger an impairment review include:
| • | significant negative industry or economic trends, |
| • | significant decline in our stock price for a sustained period, |
| • | our market capitalization relative to net book value, |
| • | significant changes in the manner of our use of the acquired assets, |
| • | significant changes in the strategy for our overall business, and |
| • | our assessment of growth and profitability in each reporting unit over the coming years. |
Given the uncertainty of the economic environment and the potential impact on our business, there can be no assurance that our estimates and assumptions regarding the duration of the ongoing economic downturn, or the period or strength of recovery, made for purposes of our goodwill impairment testing at December 31, 2010 will prove to be accurate predictions of the future. If our assumptions regarding forecasted revenue or gross profit rates are not achieved, we may be required to record additional goodwill impairment charges in future periods relating to any of our reporting units, whether in connection with the next annual impairment testing in the fourth quarter of 2011 or prior to that, if any such change constitutes an interim triggering event. It is not possible to determine if any such future impairment charge would result or, if it does, whether such charge would be material.
A 1% change in the market multiple impacts the Fiery fair value by 0.9% under the market approach. Because the Inkjet and APPS fair values were determined using a weighting of the market and income approaches, we
47
Table of Contents
reviewed the sensitivity of the discount rate, in addition to the market multiple, in evaluating the sensitivity of the Inkjet and APPS valuations. The impact of a change in the market multiple of 1% impacts the Inkjet and APPS fair values by 0.5%. Likewise, the impact of a change in the discount rate of one percentage point results in either an increase in the Inkjet and APPS fair values of 6.2% or a decrease of 5.2%. Consequently, we have concluded that no reasonably possible charges would reduce the fair value of the reporting units to such a level that it would cause a failure in step one of the impairment analysis.
Long-Lived Asset Impairment
Other investments, included within other assets, consist of equity and debt investments in privately-held companies that develop products, markets, and services that are strategic to us. In-substance common stock investments in which we exercise significant influence over operating and financial policies, but do not have a majority voting interest, are accounted for using the equity method of accounting. Investments not meeting these requirements are accounted for using the cost method of accounting.
The process of assessing whether a particular equity or debt investment’s fair value is less than its carrying cost requires a significant amount of judgment due to the lack of a mature and stable public market for these securities. In making this judgment, we carefully consider the investee’s most recent financial results, cash position, recent cash flow data, projected cash flows (both short and long-term), financing needs, recent financing rounds, most recent valuation data, the current investing environment, management or ownership changes, and competition. This analysis is based primarily on information that we request and receive from these privately-held companies and is performed on a quarterly basis. Although we evaluate all of our privately-held equity and debt investments for impairment based on this criteria, each investment’s fair value is only estimated when events or changes in circumstances have occurred that may have a significant effect on its fair value (because the fair value of each investment is not readily determinable). Where these factors indicate that the equity investment’s fair value is less than its carrying cost, and where we consider such diminution in value to be other than temporary, we record an impairment charge to reduce such equity investment to its estimated fair value.
During the fourth quarter of 2008, we assessed each remaining investment’s technology pipeline and market conditions in the industry for the next several years and determined it is no longer probable that they will generate enough positive future cash flows to recover the full carrying amount of the investment. As such, we recognized an impairment charge of $6.1 million.
During the second quarter of 2010, we further assessed each remaining investment’s ability to sustain an earnings capacity that would justify the carrying amount of the investment in accordance with ASC 323-10-35-32. Based on this assessment, we impaired the remaining carrying value of these investments of $0.3 million.
We recognized long-lived asset impairment charges of $0.7, $3.2, and $1.8 million for the years ended December 31, 2010, 2009, and 2008, respectively, consisting primarily of project abandonment costs related to equipment charges in the Inkjet operating segment, assets impaired related to an Inkjet facility closure, certain Inkjet printer equipment, and the impairment of our remaining equity method investees.
Income (Loss) before Income Taxes
The components of income (loss) before income taxes are as follows (in thousands):
| Years ended December 31, | ||||||||||||
| 2010 | 2009 | 2008 | ||||||||||
| U.S. |
$ | (18,818 | ) | $ | 24,470 | $ | (153,597 | ) | ||||
| Foreign |
17,188 | (8,435 | ) | 20,521 | ||||||||
| Total |
$ | (1,630 | ) | $ | 16,035 | $ | (133,076 | ) | ||||
48
Table of Contents
For the year ended December 31, 2010, pre-tax operating loss of $1.6 million included $18.8 million of U.S. pre-tax operating loss and $17.2 million of foreign pre-tax operating income. The pre-tax loss attributable to U.S. operations included amortization of identified intangibles of $11.5 million, stock-based compensation expense of $15.9 million, restructuring and other costs of $2.3 million, excess solvent inventory and related end-of-life purchases of $0.9 million, and asset impairment of $0.3 million. The pre-tax income attributable to foreign operations included restructuring and other costs of $1.3 million, Radius acquisition-related transaction costs of $1.2 million, amortization of identified intangibles of $0.9 million, excess solvent inventory and related end-of-life purchases of $1.4 million, and asset impairment of $0.4 million.
For the year ended December 31, 2009, pre-tax operating income of $16.0 million included $24.5 million of U.S. pre-tax operating income and $8.5 million of foreign pre-tax operating loss. The pre-tax income attributable to U.S. operations included the $80.0 million gain on sale of building and land, offset by the amortization of identified intangibles of $18.1 million, stock-based compensation expense of $18.6 million, restructuring and other costs of $8.6 million, and asset impairment of $3.2 million. The pre-tax loss attributable to foreign operations included restructuring and other costs of $2.2 million and amortization of identified intangibles of $0.4 million.
For the year ended December 31, 2008, pre-tax operating loss of $133.1 million included $153.6 million of U.S. pre-tax operating loss and $20.5 million of foreign pre-tax operating income. The pre-tax loss attributable to U.S. operations included asset and goodwill impairment of $111.4 million, amortization of identified intangibles of $31.7 million, stock-based compensation expense of $33.4 million, restructuring and other costs of $6.8 million, stock review and related costs of $1.8 million, partially offset by legal reserve adjustments of $3.6 million. The pre-tax income attributable to foreign operations included restructuring and other costs of $2.4 million, amortization of identified intangibles of $0.3 million, and asset and goodwill impairment of $0.5 million.
Income Taxes
We recorded a tax benefit in 2010 of $9.1 million on a pre-tax operating loss of $1.6 million, compared to a tax provision of $18.2 million in 2009 on pre-tax operating income of $16.0 million, and compared to a tax benefit of $19.6 million in 2008 on pre-tax operating loss of $133.1 million. In each of these years, we benefited from research and development credits. Our taxes also decreased due to lower taxes on foreign income in 2010 and 2008. Our taxes increased due to both non-deductible stock compensation charges in each of these years, decreased profitability in low tax jurisdictions in 2009, and non-deductible goodwill impairment charges in 2008.
As a result of discrete tax adjustments, our 2010 taxes increased $4.1 million related to tax shortfalls recorded pursuant to ASC 718-740, Stock Compensation—Income Taxes, and $0.4 million due to interest accrued on prior year tax contingency reserves. Discrete tax adjustments also reduced our 2010 taxes by $7.5 million as a result of the expiration of the statute of limitations for 2006 federal income tax purposes and 2005 state income tax purposes, $2.4 million due to a reassessment of taxes resulting from our filing of 2009 federal and state income tax returns, $1.1 million due to restructuring and severance costs, $1.0 million related to interest established in prior years for tax contingency reserves, $0.7 million related to tax deductions resulting from Employee Stock Purchase Plan (“ESPP”) dispositions, $0.4 million related to excess solvent inventories and related end-of-life purchases, and $0.3 million related to asset impairment charges.
As a result of discrete tax adjustments, our 2009 taxes increased $32.0 million related to the gain on sale of building and land, $5.8 million related to tax shortfalls recorded pursuant to ASC 718-740, and $0.7 million due to interest accrued on prior year tax contingency reserves. Discrete tax adjustments also reduced our 2009 taxes by $3.5 million due to restructuring and severance costs, $1.3 million related to asset impairment charges, $1.1 million due to a reduction in tax reserves established in prior years on income from foreign operations, $0.3 million as a result of the expiration of the statute of limitations for 2005 federal and state income tax purposes, $0.5 million related to tax deductions resulting from ESPP dispositions, and $0.6 million related to interest established in prior years for tax contingency reserves.
49
Table of Contents
As a result of discrete tax adjustments, our taxes in 2008 increased $0.7 million due to interest accrued on prior year tax contingency reserves and $2.5 million related to tax shortfalls recorded pursuant to ASC 718-740. Discrete tax adjustments also reduced our 2008 taxes by $0.5 million due to a reassessment of our taxes resulting from filing our 2007 federal and state income tax returns, $2.5 million due to the completion of our 2002-2004 Internal Revenue Service (“IRS”) audits, $2.2 million due to one-time severance costs, and $0.3 million due to a reduction in tax reserves established in prior years on income from foreign operations.
In 2008, the IRS completed their examination of the 2002 through 2004 tax years. As a result of the IRS audit settlement, we reduced our unrecognized tax benefits by $6.6 million, of which $2.5 million was recorded as a discrete tax benefit. These adjustments are primarily related to intercompany cost allocations and the research and development credits.
Unaudited Non-GAAP Net Income (Loss)
To supplement our consolidated financial results prepared under generally accepted accounting principles (“GAAP”), we use non-GAAP measures of net income (loss) and earnings per diluted share that are GAAP net income (loss) and GAAP earnings per diluted share adjusted to exclude certain recurring and non-recurring costs, expenses, and gains.
We believe the presentation of non-GAAP net income (loss) and non-GAAP earnings per diluted share provides important supplemental information to management and investors regarding non-cash expenses and significant recurring and non-recurring items we believe are important to understanding our financial and business trends relating to our financial condition and results of operations. Non-GAAP net income (loss) and non-GAAP earnings per diluted share are among the primary indicators used by management as a basis for planning and forecasting future periods and by management and our Board of Directors to determine whether our operating performance has met specified targets and thresholds. Management uses non-GAAP net income (loss) and non-GAAP earnings per diluted share when evaluating operating performance because they believe the exclusion of the items described below, for which the amounts and/or timing may vary significantly depending upon our activities and other factors, facilitates comparability of our operating performance. We have chosen to provide this information to investors so they can analyze our operating results in the same way that management does and use this information in their assessment of our business and valuation.
We compute non-GAAP net income (loss) and non-GAAP earnings per diluted share by adjusting GAAP net income (loss) and GAAP earnings per diluted share to remove the impact of recurring amortization of acquisition-related intangibles, stock-based compensation expense, as well as restructuring-related and non-recurring charges and gains and the tax effect of these adjustments. Such non-recurring charges and gains include provision for excess solvent inventories and related end-of-life purchases, project abandonment costs, asset impairment charges, certain legal settlements, sale of certain real estate assets, acquisition-related transaction costs and legal expenses, and costs to integrate such acquisitions into our business. Examples of these excluded items include:
| • | Recurring charges and gains, including: |
| • | Amortization of acquisition-related intangibles. |
Identified intangible assets acquired to date are being amortized on a straight-line basis over 2 to 18 years.
| • | Stock-based compensation expense is recognized in accordance with ASC 718. |
| • | Non-recurring charges and gains, including: |
| • | Provision for excess solvent inventories and related end-of-life purchases resulting from the accelerating transition from solvent to UV technology. |
| • | Acquisition-related transaction costs associated with the acquisition of privately held Golflane Limited, a U.K. private limited company, the parent holding company of Radius, which closed on July 2, 2010. |
50
Table of Contents
| • | Restructuring and other consists of: |
| • | Restructuring-related charges. |
We have incurred restructuring, severance, and facility closure charges as we reduce the number and size of our facilities and the size of our workforce.
| • | Integration expenses incurred to integrate Radius into our business |
| • | Asset impairment costs consist primarily of equipment and non-cancellable purchase orders incurred relating to a planned Inkjet product that was cancelled, a facility closure, and the impairment of our private minority equity investments. |
| • | Gain on sale of building & land. We sold a portion of the Foster City, California campus for $137.3 million resulting in a gain on sale of $80.0 million for the year ended December 31, 2009. |
| • | In the fourth quarter of 2008, we recognized a goodwill impairment charge of approximately $104 million, an impairment of our private minority investments of $6.1 million, and asset impairment of $1.8 million, totaling $111.9 million. |
| • | Tax effect of non-GAAP adjustments. |
| • | After removing the non-GAAP adjustments, we applied the principles of ASC 740, Income Taxes, to estimate the non-GAAP income tax provision in each jurisdiction in which we operate. |
| • | We have excluded the recognition of previously unrecognized tax benefits of $8.7 million, and interest accrued on prior year tax reserves of $0.6 million, from our non-GAAP net income for the year ended December 31, 2010, to facilitate comparability of our operating performance from period to period. |
These non-GAAP measures are not in accordance with or an alternative for GAAP measures and may be materially different from other non-GAAP measures, including similarly titled non-GAAP measures, used by other companies. The presentation of this additional information should not be considered in isolation from, as a substitute for, or superior to, net income (loss) or earnings per diluted share prepared in accordance with GAAP. Non-GAAP financial measures have limitations in that they do not reflect certain items that may have a material impact upon our reported financial results. We expect to continue to incur expenses of a nature similar to the non-GAAP adjustments described above, and exclusion of these items from our non-GAAP net income (loss) and non-GAAP earnings per diluted share should not be construed as an inference that these costs are unusual, infrequent, or non-recurring.
51
Table of Contents
Reconciliation of GAAP Net Income (Loss) to Non-GAAP Net Income (Loss)
(unaudited)
| Years Ended December 31, | ||||||||||||
| (millions, except per share data) |
2010 | 2009 | 2008 | |||||||||
| Net income (loss) |
$ | 7.5 | $ | (2.2 | ) | $ | (113.4 | ) | ||||
| Excess solvent inventories and related end-of-life purchases |
2.3 | — | — | |||||||||
| Amortization of identified intangible asset and in-process research & development |
12.4 | 18.5 | 32.0 | |||||||||
| Stock-based compensation expense |
15.9 | 18.6 | 33.4 | |||||||||
| Restructuring and other |
3.6 | 9.0 | 11.0 | |||||||||
| Acquisition costs |
1.2 | — | — | |||||||||
| Legal reserves |
— | (0.1 | ) | (3.6 | ) | |||||||
| Option review costs |
— | — | 1.8 | |||||||||
| Goodwill and asset impairment |
0.7 | 3.2 | 111.9 | |||||||||
| Gain on sale of building and land |
— | (80.0 | ) | — | ||||||||
| Tax effect of non-GAAP net income (loss) |
(15.8 | ) | 22.3 | (31.9 | ) | |||||||
| Non-GAAP net income (loss) |
27.8 | (10.7 | ) | 41.2 | ||||||||
| After-tax adjustment of convertible debt-related expense |
— | — | 1.3 | |||||||||
| Income for purposes of computing diluted non-GAAP net income (loss) per share |
$ | 27.8 | $ | (10.7 | ) | $ | 42.5 | |||||
| Non-GAAP net income (loss) per diluted share |
$ | 0.59 | $ | (0.22 | ) | $ | 0.74 | |||||
| Shares for purposes of computing diluted non-GAAP net income (loss) per share |
47.2 | 49.7 | 57.2 | |||||||||
Critical Accounting Policies
The preparation of the consolidated financial statements requires us to make estimates and judgments that affect the reported amounts of assets, liabilities, revenue, expenses, and related disclosure of contingent assets and liabilities. We evaluate our estimates, including those related to bad debts, inventories, intangible assets, income taxes, warranty obligations, purchase commitments, revenue recognition, and contingencies on an ongoing basis. The estimates are based on historical and current experience, the impact of the current economic environment, and various other assumptions believed to be reasonable under the circumstances at the time of the estimate, the results of which form the basis for making judgments about the carrying values of assets and liabilities that are not readily apparent from other sources. Actual results may differ from these estimates under different assumptions or conditions.
The following are our critical accounting policies and estimates:
| • | revenue recognition; |
| • | estimating allowance for doubtful accounts, inventory reserves, warranty reserves, litigation accruals, and restructuring reserves; |
| • | accounting for stock-based compensation; |
| • | accounting for income taxes; |
| • | valuation analyses for intangible assets and goodwill; |
| • | business combinations; and |
| • | determination of functional currencies for consolidating our international operations. |
52
Table of Contents
Revenue recognition. We derive our revenue primarily from product revenue, which includes hardware (controllers, design-licensed solutions including upgrades, inkjet printers including components replaced under maintenance agreements, and ink), software licensing and development, and royalties. We also receive service revenue from software license maintenance agreements, customer support, training, and consulting. As described below, significant management judgments and estimates must be made and used in connection with the revenue recognized in any accounting period. Material differences could result in the amount and timing of revenue for any period if our management made different judgments or utilized different estimates.
We recognize revenue in accordance with the provisions of SEC Staff Accounting Bulletin 104 “Revenue Recognition” (“SAB 104”) and when applicable, ASC 605-25, Revenue Recognition—Multiple-Element Arrangements, for the sale of controllers, printers, and ink. As such, revenue is generally recognized when persuasive evidence of an arrangement exists, the product has been delivered or services have been rendered, the fee is fixed or determinable, and collection of the resulting receivable is reasonably assured.
Products generally must be shipped against written purchase orders. We use either a binding purchase order or signed contract as evidence of an arrangement. Sales to some of our OEM customers are evidenced by a master agreement governing the relationship together with a binding purchase order. Sales to our resellers are also evidenced by binding purchase orders or signed contracts and do not generally contain rights of return or price protection. Our arrangements generally do not include product acceptance clauses. When acceptance is required, revenue is recognized when the product is accepted by the customer.
Delivery for hardware generally is complete when title and risk of loss is transferred at point of shipment from manufacturing facilities, or when the product is delivered to the customer’s local common carrier. We also sell products and services using sales arrangements with terms resulting in different timing for revenue recognition as follows:
| • | if the title and/or risk of loss is transferred at a location other than our manufacturing facility, revenue is recognized when title and/or risk of loss transfers to the customer, per the terms of the agreement; |
| • | if title is retained until payment is received, revenue is recognized when title is passed upon receipt of payment; |
| • | if payment is contingent upon installation, the revenue related to the portion of the payment for installation is deferred until installation is complete; |
| • | if the sales arrangement is classified as an operating lease, revenue is recognized ratably over the lease term; or |
| • | if the sales arrangement is a fixed price for performance extending over a long period and our right to receive future payment depends on our future performance in accordance with these agreements, revenue is recognized under the percentage of completion method. |
We assess whether the fee is fixed or determinable based on the terms of the contract or purchase order. We assess collection based on a number of factors, including past transaction history with the customer and the creditworthiness of the customer. We may not request collateral from our customers. If we determine that collection of a fee is not reasonably assured, we defer the fee and recognize revenue at the time collection becomes reasonably assured, which is generally upon receipt of cash.
We license our software primarily under perpetual licenses. Revenue from software consists of software licensing, post-contract customer support, and professional consulting. We apply the provisions of ASC 985-605, Software—Revenue Recognition and, if applicable, SAB 104 and ASC 605-25, Revenue Recognition—Multiple-Element Arrangements, to all transactions involving the sale of software products and hardware transactions where the software is not incidental.
When several elements, including software licenses, post-contract customer support, and professional services, are sold to a customer through a single contract, the revenue from such multiple-element arrangements are
53
Table of Contents
allocated to each element using the residual method in accordance with ASC 985-605. Revenue is allocated to the support elements and professional service elements of an agreement using vendor specific objective evidence (“VSOE”) of fair value and to the software license portion of the agreements using the residual method. We have established VSOE of the fair value of our professional services based on the rates charged to our customers in stand-alone orders. We have also established VSOE of fair value for post-contract customer support based on substantive renewal rates. Accordingly, software license fees are recognized under the residual method for arrangements in which the software is licensed with maintenance and/or professional services, and where the maintenance and professional services are not essential to the functionality of the delivered software. Revenue allocated to software licenses is recognized when the following four basic criteria are met: persuasive evidence of an arrangement exists, delivery has occurred, the price is fixed or determinable, and collectability is probable. Revenue allocated to post-contract support is recognized ratably over the term of the support contract assuming the four basic criteria are met. We also have subscription arrangements where the customer pays a fixed fee and receives services over a period of time. We recognize revenue from the subscriptions ratably over the service period. Any up front setup fees associated with our subscription arrangements are recognized ratably, generally over one year. Any up front setup fees that are not associated with our subscription arrangements are recognized upon completion.
We previously followed the completed contract method for revenue recognition on long-term contracts involving substantial customization. During the quarter ended September 30, 2010, we established the ability to produce estimates sufficiently dependable to require adoption of the percentage of completion method with respect to certain fixed price contracts.
Revenue on certain fixed price contracts where we provide information technology system development and implementation services is recognized over the contract term based on the percentage of development and implementation services that are provided during the period compared with the total estimated development and implementation services to be provided over the entire contract using guidance from ASC 605-35, Revenue Recognition–Construction-Type and Production–Type Contracts. These services require that we perform significant, extensive, and complex design, development, modification, or implementation activities of our customers’ systems. Performance will often extend over long periods, and our right to receive future payment depends on our future performance in accordance with these agreements.
The percentage of completion method involves recognizing probable and reasonably estimable revenue using the percentage of services completed, on a current cumulative cost to estimated total cost basis, using a reasonably consistent profit margin over the period. Due to the long-term nature of these projects, developing the estimates of costs often requires significant judgment. Factors that must be considered in estimating the progress of work completed and ultimate cost of the projects include, but are not limited to, the availability of labor and labor productivity, the nature and complexity of the work to be performed, and the impact of delayed performance. If changes occur in delivery, productivity, or other factors used in developing the estimates of costs or revenue, we revise our cost and revenue estimates, which may result in increases or decreases in revenue and costs, and such revisions are reflected in income in the period in which the facts that give rise to that revision become known.
We recognize losses on long-term fixed price contracts in the period that the contractual loss becomes probable and estimable. We record amounts invoiced to customers in excess of revenue recognized as deferred revenue until the revenue recognition criteria are met. We record revenue that is earned and recognized in excess of amounts invoiced on fixed price contracts as trade receivables.
Allowances for doubtful accounts. We establish an allowance for doubtful accounts to ensure that trade receivables are not overstated due to uncollectability. Our accounts receivable balance was $85.5 million, net of allowance for doubtful accounts and sales returns of $13.2 million, as of December 31, 2010.
To ensure that we have established an adequate allowance for doubtful accounts, management analyzes accounts receivable and historical bad debts, customer concentrations, customer creditworthiness, current economic trends
54
Table of Contents
and macroeconomic conditions, changes in customer payment terms, the length of time receivables are past due, and significant one-time events. We record specific reserves for individual accounts when we become aware of specific customer circumstances, such as bankruptcy filings, deterioration in the customer’s operating results or financial position, or potential unfavorable outcomes from disputes with customers or vendors.
Our Fiery products, which constitute approximately 47% of our revenue, are primarily sold to a limited number of OEMs. We expect that we will continue to depend on a relatively small number of OEM customers for a significant portion of our revenue, although the significance of that revenue is expected to decline in future periods as our revenue increases from Inkjet and APPS products. We perform ongoing credit evaluations of the financial condition of our OEM, third-party distributor, reseller, and other customers and require collateral, such as letters of credit and bank guarantees, in certain circumstances. The past due or delinquency status of a receivable is based on the contractual payment terms of the receivable. The need to write off a receivable balance depends on the age, size, and a determination of collectability of the receivable. We generally have experienced longer accounts receivable collection cycles in our Inkjet and APPS operating segments compared to our Fiery operating segment as, historically, OEM customers have paid on a more timely basis. Down payments are generally required from Inkjet and APPS customers as a means to ensure payment.
Inventory reserves. Management estimates potential future inventory obsolescence and purchase commitments to evaluate the need for inventory reserves. Current economic trends, changes in customer demand, product design changes, product life and demand, and the acceptance of our products are analyzed to evaluate the adequacy of such reserves. Significant management judgment and estimates must be made in connection with establishing inventory allowances and reserves in any accounting period. Material differences may result in changes in the amount and timing of our net income (loss) for any period, if management made different judgments or utilized different estimates. Our inventories were $46.2 million, net of inventory reserves of $10.4 million, as of December 31, 2010.
Warranty reserves. Our Fiery controller and Inkjet printer products are generally accompanied by a 12-month warranty from date of shipment, which covers both parts and labor. In accordance with ASC 450-30, Loss Contingencies, an accrual is made when the warranty liability is estimable and probable based upon historical experience. A provision for estimated future warranty work is recorded in cost of goods sold upon recognition of revenue and the resulting accrual is reviewed regularly and periodically adjusted to reflect changes in warranty estimates. Management must estimate potential inventory return rates and replacement or repair costs to evaluate the need for warranty reserves. Significant management judgments and estimates must be made and used in connection with establishing warranty reserves in each reporting period. Material differences may result in changes in the amount and timing of our income for any period, if management made different judgments or utilized different estimates. Warranty reserves were $9.2 million as of December 31, 2010.
Litigation accruals. We accrue for estimated litigation costs, including potential regulatory fines, when the likelihood of incurrence of the related cost is probable and management has the ability to estimate such costs. Until both of these conditions are met, the related litigation costs are recorded as incurred. The material assumptions used to estimate the required litigation accrual include:
| • | communication with our external attorneys regarding the expected duration of the lawsuit, the potential outcome of the lawsuit, and the likelihood of settlement; |
| • | our strategy regarding the lawsuit; |
| • | deductible amounts under our insurance policies; and |
| • | past experiences with similar lawsuits. |
The outcome of any particular lawsuit cannot be predicted and our income could be materially impacted, either positively or negatively, if the outcome is different than expected.
55
Table of Contents
Restructuring reserves. We have engaged, and may continue to engage, in restructuring actions, which require management to utilize significant estimates related to the timing and the expenses for severance and other employee separation costs, realizable values of assets made obsolete, lease cancellation, facility downsizing, and other exit costs. If actual amounts differ from our estimates, the amount of the restructuring charges could be materially impacted.
Accounting for stock-based compensation. We account for stock-based compensation in accordance with ASC 718, which requires stock-based compensation expense to be recognized based on the fair value of such awards on the date of grant. We amortize stock-based compensation expense on a graded vesting basis over the vesting period, after assessing the probability of achieving the requisite performance criteria with respect to performance-based awards. Stock-based compensation expense is recognized over the requisite service period for each separately vesting tranche as though the award were, in substance, multiple awards. We must use our judgment in determining and applying the assumptions needed for the valuation of stock options, RSUs, restricted stock awards (“RSAs”), and issuance of common stock under our ESPP.
We apply a forfeiture rate to reflect what we believe will be our final expense related to stock-based compensation. Our determination of the fair value of stock-based payment awards on the date of grant using an option pricing model is affected by various assumptions including volatility, expected term, and interest rates. Expected volatility is based on the historical volatility of our stock over a preceding period commensurate with the expected term of the option. The expected term is based upon management’s consideration of the historical life of the options, the vesting period of the options granted, and the contractual period of the options granted. The risk-free interest rate for the expected term of the option is based on the U.S. Treasury yield curve in effect at the time of grant. Expected dividend yield was not considered in the option pricing formula since we do not pay dividends and have no current plans to do so in the future.
The amounts to be recorded as stock-based compensation expense in the future are subject to change if our assumptions regarding the variables used in determining the fair value of the instruments and the forfeiture rates are revised. In adopting ASC 718, we elected to adopt the simplified method to establish our beginning balance for the additional paid-in capital (“APIC”) pool related to the tax effects of employee stock-based compensation. Tax shortfalls resulting from the tax effects of employee stock-based compensation absorbed the remaining balance of the APIC pool in 2008.
Accounting for income taxes. We are required to estimate income taxes in each of the jurisdictions in which we operate. We estimate our actual current tax expense and temporary differences resulting from differing treatment of items such as deferred revenue for tax and book accounting purposes. These differences result in deferred tax assets and liabilities, which are included within our consolidated balance sheet. We must then assess the likelihood that our deferred tax assets will be recovered from future taxable income. If we believe that recovery of these deferred tax assets is not likely, we establish a valuation allowance. To the extent we either establish or increase a valuation allowance in a period, we must include an expense within the tax provision in the statement of operations.
Significant management judgment is required to determine our provision for income taxes, our deferred tax assets and liabilities, and any valuation allowance recorded against our net deferred tax assets. We have established a valuation allowance of $3.6 million as of December 31, 2010 for foreign tax credits resulting from the 2003 acquisition of our proofing business, compensation deductions potentially limited by U.S. Internal Revenue Code (“IRC”) 162(m), and net operating losses resulting from the Radius acquisition. If actual results differ from these estimates or we adjust these estimates in future periods, we may need to establish an additional valuation allowance that could materially impact our financial position and results of operations.
Deferred tax assets, as of December 31, 2010 were $58.8 million, net of valuation allowance.
In accordance with ASC 740-10-25-5 through 17, Income Taxes—Basic Recognition Threshold, we account for uncertainty in income taxes by recognizing a tax position only when it is more likely than not that the tax
56
Table of Contents
position, based on its technical merits, will be sustained upon ultimate settlement with the applicable tax authority. The tax benefit to be recognized is the largest amount of tax benefit that is greater than fifty percent likely of being realized upon ultimate settlement with the applicable tax authority that has full knowledge of all relevant information.
Significant management judgment is required in evaluating our uncertain tax positions. Our gross unrecognized benefits are $32.5 million as of December 31, 2010. Our evaluation of uncertain tax positions is based on factors including, but not limited to, changes in facts or circumstances, changes in tax law, effectively settled issues under audit, and new audit activity. If actual settlements differ from these estimates, or we adjust these estimates in future periods, we may need to recognize additional tax benefits or charges that could materially impact our financial position and results of operations.
As of December 31, 2010, we have permanently reinvested $5.6 million of unremitted earnings. Should these earnings be remitted to the U.S., the tax on these earnings would be $2.0 million.
Valuation analyses of intangible assets and goodwill. We perform our annual goodwill impairment analysis in the fourth quarter of each year according to the provisions of ASC 350-20-35, Goodwill—Intangibles and Other—Subsequent Measurement. A two-step impairment test of goodwill is required. In the first step, the fair value of each reporting unit is compared to its carrying value. If the fair value exceeds carrying value, goodwill is not impaired and further testing is not required. If the carrying value exceeds fair value, then the second step of the impairment test is required to determine the implied fair value of the reporting unit’s goodwill. The implied fair value of goodwill is calculated by deducting the fair value of all tangible and intangible net assets of the reporting unit, excluding goodwill, from the fair value of the reporting unit as determined in the first step. If the carrying value of the reporting unit’s goodwill exceeds its implied fair value, then an impairment loss must be recorded equal to the difference.
Based on the outcome of conditions existing during the fourth quarter of 2008, we determined that a triggering event requiring an interim impairment analysis had occurred relating to the Inkjet reporting unit. The resulting impairment analysis resulted in a non-cash goodwill impairment charge of $104 million during the fourth quarter of 2008. The goodwill valuation analysis was performed based on our respective reporting units—Fiery, Inkjet, and APPS—which are consistent with our operating segments identified in Note 15—Segment Information, Geographic Data, and Major Customers of the Notes to Consolidated Financial Statements.
We determined the fair value of the Inkjet and APPS reporting units as of December 31, 2010 by equally weighting the market and income approaches. The fair value of the Fiery reporting unit was determined based on the market approach. Under the market approach, we estimated fair value based on market multiples of revenue or earnings of comparable companies. Under the income approach, we measured fair value of the Inkjet and APPS reporting units based on a projected cash flow method using a discount rate determined by our management to be commensurate with the risk inherent in our current business model.
To identify suitable comparable companies under the market approach, consideration was given to the financial condition and operating performance of the reporting unit being evaluated relative to companies operating in the same or similar businesses, potentially subject to corresponding economic, environmental, and political factors and considered to be reasonable investment alternatives. Consideration was given to the investment characteristics of the subject company relative to those of similar publicly traded companies (i.e., guideline companies). Guideline company stocks are actively traded. In applying the Public Company Market Multiple Method (“PCMMM”), valuation multiples were derived from historical and projected operating data of guideline companies and applied to the appropriate operating data of our reporting units to arrive at an indication of fair value. Five, four, and seven suitable guideline companies were identified for the Fiery, Inkjet, and APPS reporting units, respectively. Based on our valuation results, we have determined that the fair values of our reporting units exceed their carrying values. Fiery, Inkjet, and APPS fair values are $226, $192, and $67 million, respectively, which exceed carrying value by 124%, 34%, and 26%, respectively.
57
Table of Contents
Because the fair value of the Fiery reporting unit significantly exceeded its carrying value as of December 31, 2010 as indicated by the market-based valuation, management did not deem it necessary to further supplement the bases for this judgment. While the fair value of the Inkjet and APPS reporting units exceeded their carrying values based on the market-based valuation, management determined to further examine whether an impairment had occurred given the Inkjet impairment recognized in the fourth quarter of 2008 and the relatively small excess of the fair value of the APPS reporting unit over its carrying value. We reviewed the factors that could trigger an impairment charge and completed an income-based impairment analysis. As part of this process, we engaged a third party valuation firm to aid management in its analysis. All estimates, key assumptions, and forecasts were either provided by or reviewed by us. While we chose to utilize a third party valuation firm, the impairment analysis and related valuations represent the conclusions of management and not the conclusions or statements of any third party.
Solely for purposes of establishing inputs for the income approach to assess the fair value of the Inkjet and APPS reporting units, we made the following assumptions:
| • | Despite improved Inkjet performance in 2010, resulting from an improving economic climate in 2010 and new product introductions beginning in 2009 and continuing in 2010, Inkjet revenues remained below 2008 results. |
| • | APPS revenue in 2010 exceeded 2008 revenue due to improved APPS performance resulting from the Radius acquisition and continued strong performance from the Pace acquisition. |
| • | Inkjet revenue will exceed 2008 revenue levels in 2011. |
| • | Achieving a normalized long-term growth model between 2011 and 2015. |
| • | Long-term industry growth past 2015. |
Our discounted cash flow projections for the Inkjet and APPS reporting units were based on six-year financial forecasts, which were based on annual financial forecasts developed internally by management for use in managing our business and through discussions with the independent valuation firm engaged by us. The significant assumptions utilized in these six-year forecasts included annual revenue growth rates ranging from 5% to 18%, which equates to compound annual growth rates of 8% and 10% for the Inkjet and APPS reporting units, respectively. Future cash flows were discounted to present value using a mid-year convention and a discount rate of 15%. Terminal values were calculated using the Gordon growth methodology with a long-term growth rate of 4.5%. The sum of the fair values of the Fiery, Inkjet, and APPS reporting units was reconciled to our current market capitalization (based on our stock price) plus an estimated control premium. Significant assumptions used in determining fair values of the reporting units include the determination of appropriate market comparables, estimated multiples of revenue and EBITDA that a willing buyer is likely to pay, estimated control premium a willing buyer is likely to pay, gross profit, and operating expenses. Inkjet gross profit is assumed to increase as fixed production costs are absorbed by increasing Inkjet volumes, while APPS gross profit is assumed to remain consistent during the forecast horizon. Gross profit and operating expenses as a percentage of revenue over the six-year forecast horizon are assumed to approximate percentages realized by the guideline companies.
To assess the reasonableness of the estimated control premium of 16%, we examined the most similar transactions in relevant industries and determined the average premium indicated by the transactions deemed to be most similar to a hypothetical transaction involving our reporting units. We examined the weighted average and median control premiums offered in these industries, industry specific control premiums, and specific transaction control premiums to conclude that our estimated control premium is reasonable.
58
Table of Contents
We assess the impairment of identifiable intangibles and long-lived assets whenever events or changes in circumstances indicate the carrying value may not be recoverable or the life of the asset may need to be revised. Factors considered important that could trigger an impairment review include:
| • | significant negative industry or economic trends, |
| • | significant decline in our stock price for a sustained period, |
| • | our market capitalization relative to net book value, |
| • | significant changes in the manner of our use of the acquired assets, |
| • | significant changes in the strategy for our overall business, and |
| • | our assessment of growth and profitability in each reporting unit over the coming years. |
Given the uncertainty of the economic environment and the potential impact on our business, there can be no assurance that our estimates and assumptions regarding the duration of the ongoing economic downturn, or the period or strength of recovery, made for purposes of our goodwill impairment testing at December 31, 2010 will prove to be accurate predictions of the future. If our assumptions regarding forecasted revenue or gross profit rates are not achieved, we may be required to record additional goodwill impairment charges in future periods relating to any of our reporting units, whether in connection with the next annual impairment testing in the fourth quarter of 2011 or prior to that, if any such change constitutes an interim triggering event. It is not possible to determine if any such future impairment charge would result or, if it does, whether such charge would be material.
Business combinations. We allocate the purchase price of acquired companies to the tangible and intangible assets acquired, including IPR&D, and liabilities assumed based on their estimated fair values. Such a valuation requires management to make significant estimates and assumptions, especially with respect to intangible assets. All acquisitions are included in our financial statements from the date of acquisition.
In December 2007, ASC 805 was issued, which retained the fundamental requirement that the acquisition method of accounting be used for all business combinations while revising the accounting treatment for the fair values of certain acquired assets, liabilities, and expenses. See Note 1—The Company and its Significant Accounting Policies of our Notes to Consolidated Financial Statements for a summary of this recent accounting pronouncement and its impact on our accounting for business combinations. The amendment to ASC 805 applies prospectively to business combinations for which the acquisition date is on or after January 1, 2009.
Management estimates fair value based upon assumptions believed to be reasonable. These estimates are based on historical experience and information obtained from the management of the acquired companies. Critical estimates in valuing certain intangible assets include, but are not limited to: future expected cash flows; acquired developed technologies and patents; expected costs to develop IPR&D into commercially viable products and estimating cash flows from the projects when completed; the acquired company’s brand awareness and market position, as well as assumptions about the period of time the acquired brand will continue to be used in the combined company’s product portfolio; and discount rates. The fair value of IPR&D was expensed prior to the effective date of the amendment to ASC 805. There were no IPR&D costs associated with acquisitions after the effective date of this amendment.
The amendment to ASC 805 requires that we estimate the fair value of the acquisition-related contingent consideration based on the probability of the realization of the performance targets. That estimate is based on significant inputs that are not observable in the market, which ASC 820-10-35 refers to as Level 3 inputs, reflecting our assessment of the assumptions market participants would use to value these liabilities. The fair value of contingent consideration is remeasured at each reporting period, with any changes in the fair value recognized as a component of general and administrative expense.
59
Table of Contents
Other estimates associated with the accounting for acquisitions include severance costs and the costs to vacate or downsize facilities, including the future costs to operate and eventually abandon or relinquish duplicate facilities. These costs are based on estimates made by management and are subject to refinement. Estimated costs may change as additional information becomes available regarding assets acquired and liabilities assumed and as management continues its assessment of the pre-merger operations. Consistent with the amendments to ASC 805, acquisition-related costs of $1.2 million were expensed during the year ended December 31, 2010 in connection with our acquisition of Radius. Likewise, the amendments to ASC 805 also required that restructuring-related expenses associated with our acquisition of Radius be expensed as a component of Restructuring and Other.
On July 2, 2010, we purchased Radius for approximately $14.1 million, net of cash acquired, plus an additional future cash earnout, which is contingent on achieving certain performance targets. As of December 31, 2010, approximately $2.1 million had been earned against the earnout. The $0.4 million excess above the valuation at the acquisition date was expensed as a component of general and administrative expense in accordance with ASC 805. The potential undiscounted amount of all future contingent consideration cash payments that we could be required to make, beyond amounts currently accrued, is between $0 and $1.5 million as of December 31, 2010. We acquired Radius to establish our presence in the packaging industry.
On December 2, 2008, we acquired the remaining interest in Raster, a mid-market, wide format graphics printer developer and manufacturer in a step acquisition for approximately $5.3 million, to further expand our Inkjet operating segment.
On July 28, 2008, we purchased Pace for approximately $20.1 million, net of cash acquired, plus an additional future cash earnout, which is contingent on achieving certain performance targets. As of December 31, 2010, approximately $5.3 million had been earned against the earnout. The potential undiscounted amount of all future contingent consideration cash payments that we could be required to make, beyond amounts currently accrued, is between $0 and $0.6 million as of December 31, 2010. We acquired Pace to further strengthen our APPS operating segment.
The Radius, Pace, and Raster acquisitions are discussed more fully in Note 2—Acquisitions of the Notes to the Consolidated Financial Statements.
Our financial projections may ultimately prove to be inaccurate and unanticipated events and circumstances may occur. As a result, these estimates are inherently uncertain and unpredictable, assumptions may be incomplete or inaccurate, and unanticipated events and circumstances may occur, which may affect the accuracy or validity of such assumptions, estimates or other actual results. Therefore, no assurance can be given that the underlying assumptions used to establish the valuation for these acquired businesses will prove to be correct. We typically engage a third party valuation firm to aid management in its analysis. All estimates, key assumptions, and forecasts were either provided by or reviewed by us. While we chose to utilize a third party valuation firm, the valuations represent the conclusions of management and not the conclusions or statements of any third party.
Determining functional currencies for the purpose of consolidating our international operations. We have a number of foreign subsidiaries, which together account for approximately 42% of our net revenue, approximately 13% of our total assets and approximately 34% of our total liabilities as of December 31, 2010. We typically quote and invoice our international customers in U.S. dollars.
In preparing our consolidated financial statements, we must remeasure and translate balance sheet and income statement items into U.S. dollars. Foreign currency assets and liabilities are remeasured from the transaction currency into the functional currency at current exchange rates, except for non-monetary assets and capital accounts, which are remeasured at historical exchange rates. Revenue and expenses are remeasured at monthly exchange rates, which approximate average exchange rates in effect during each period. Gains or losses from foreign currency remeasurement are included in other income (expense), net. Net gains or losses resulting from foreign currency transactions, including hedging gains and losses, are reported in other income (expense), net, and were a gain (loss) of $(3.4), $0.2, and $(2.9) million for the years ended December 31, 2010, 2009, and 2008, respectively.
60
Table of Contents
For those subsidiaries that operate in a local currency functional environment, all assets and liabilities are translated into U.S. dollars using current exchange rates; revenue and expenses are translated using monthly exchange rates, which approximate the average exchange rates in effect during each period. Resulting translation adjustments are reported as a separate component of accumulated other comprehensive income (“OCI”) in stockholders’ equity. The cumulative translation adjustment balance at December 31, 2010 was an unrealized gain of $2.7 million.
Based on our assessment of the salient economic indicators discussed in ASC 830-10-55-5, Foreign Currency Matters, we consider the U.S. dollar to be the functional currency for each of our international subsidiaries except for our German subsidiary, EFI GmbH, for which we consider the Euro to be the subsidiary’s functional currency, our Japanese subsidiary, Electronics For Imaging Japan KK, for which we consider the Japanese Yen to be the subsidiary’s functional currency, and our U.K. subsidiary, Electrons For Imaging United Kingdom Limited, for which we consider the British pound sterling to be the subsidiary’s functional currency.
Recent Accounting Pronouncements
See Note 1—The Company and Its Significant Accounting Policies of the Notes to Consolidated Financial Statements for a full description of recent accounting pronouncements including the respective expected dates of adoption.
Liquidity and Capital Resources
| (in thousands) |
2010 | 2009 | 2008 | |||||||||
| Cash and cash equivalents |
$ | 126,363 | $ | 106,067 | $ | 132,152 | ||||||
| Short-term investments |
103,300 | 98,134 | 57,199 | |||||||||
| Total cash, cash equivalents, and short-term investments |
$ | 229,663 | $ | 204,201 | $ | 189,351 | ||||||
| Net cash provided by (used for) operating activities |
$ | 43,923 | $ | (19,668 | ) | $ | 27,819 | |||||
| Net cash provided by (used for) investing activities |
(27,480 | ) | 88,581 | 236,689 | ||||||||
| Net cash provided by (used for) financing activities |
3,698 | (95,019 | ) | (297,903 | ) | |||||||
| Effect of foreign exchange rate changes on cash and cash equivalents |
155 | 21 | (89 | ) | ||||||||
| Increase (decrease) in cash and cash equivalents |
$ | 20,296 | $ | (26,085 | ) | $ | (33,484 | ) | ||||
Overview
Cash, cash equivalents, and short-term investments increased $25.5 million to $229.7 million as of December 31, 2010 from $204.2 million as of December 31, 2009. The increase was primarily due to cash provided by operating activities of $43.9 million, ESPP proceeds of $5.7 million, and proceeds from the exercise of stock options of $1.0 million, partially offset by the $14.1 million purchase of Radius, net of cash acquired, payment of contingent consideration related to the Pace acquisition of $2.4 million, capital expenditures of $5.0 million, net settlement of RSUs for employee common stock-related tax liabilities of $2.9 million, and the payment of transaction costs of $0.6 million related to the tender offer concluded during the fourth quarter of 2009.
Cash, cash equivalents, and short-term investments increased $14.8 million to $204.2 million as of December 31, 2009 from $189.4 million as of December 31, 2008. The increase was primarily due to the receipt of $135.8 million, net of the direct transaction costs paid in 2009, related to the sale of building and land, offset by the repurchase of $100 million of common stock through the ASR and tender offer, repurchase of $0.2 million of stock options in conjunction with our fair value stock option exchange, net settlement of $0.9 million of RSUs and RSAs for employee common stock related tax liabilities, and cash used by operating activities of $19.7 million.
61
Table of Contents
On February 9, 2011, our Board of Directors approved a $30 million stock repurchase program.
On February 16, 2011, we entered into an agreement to acquire privately held Streamline for approximately $6.9 million in cash, plus an additional future cash earn out contingent on achieving certain performance targets. Streamline is the provider of PrintStream PMIS software focused on mailing and fulfillment services for the printing industry.
As of December 31, 2010, we have permanently reinvested $5.6 million of unremitted earnings, which are not available to meet our operating and working capital requirements in 2011.
Based on past performance and current expectations, we believe that our cash, cash equivalents, short-term investments, and cash generated from operating activities will satisfy our working capital needs, capital expenditures, investment requirements, stock repurchase requirements, commitments (see Note 8—Commitments and Contingencies of the Notes to Consolidated Financial Statements), and other liquidity requirements associated with our existing operations through at least the next twelve months. We believe that the most strategic uses of our cash resources include acquisitions, strategic investments to gain access to new technologies, repurchases of shares of our common stock, and working capital. At December 31, 2010, cash, cash equivalents, and short-term investments available for sale totaled $229.7 million. Despite the current economic environment, we believe that our liquidity position and capital resources continue to remain sufficient to meet our operating and working capital needs.
Operating Activities
Net cash provided by operating activities in 2010 of $43.9 compares with net cash used for operating activities in 2009 of $19.7 million and net cash provided by operating activities in 2008 of $27.8 million. Net cash provided by operating activities in 2010 consists primarily of net income of $7.5 million, non-cash charges and credits of $41.9 million, and net change in operating asset and liabilities of $5.5 million. Non-cash charges and credits consist primarily of $20.9 million in depreciation and amortization, $15.9 million of stock-based compensation expense, provision for inventory obsolescence of $3.5 million, and $2.3 million of excess solvent inventories and related end-of-life purchases, partially offset by $0.7 million of other non-cash credits, charges, and provisions. The net change in operating assets and liabilities of $5.5 million consists primarily of increases in accounts receivable, inventories, and other current assets of $5.7, $5.3, and $2.1 million, respectively; decreases in net taxes payable of $9.2 million; partially offset by increases in accounts payable and accrued liabilities of $16.8 million.
Accounts Receivable
Our historical and primary source of operating cash flow is the collection of accounts receivable from our customers and the timing of payments to our vendors and service providers. One measure of the effectiveness of our collection efforts is average days sales outstanding for accounts receivable (“DSO”). DSOs were 54 days, 65 days, and 66 days at December 31, 2010, 2009, and 2008, respectively. We calculate DSO by dividing net accounts receivable at the end of the quarter by revenue recognized during the quarter, multiplied by the total days in the quarter. The significant improvement in DSO in 2010 is due to effective collections, especially during the fourth quarter. We expect DSOs to vary from period to period because of changes in the mix of business between our direct and OEM customers, and the effectiveness of our collection efforts. As the percentage of Inkjet and APPS related revenue increases, we expect DSOs may trend higher. Our DSOs related to the Inkjet and APPS operating segments are traditionally higher than those related to OEM customers in our Fiery operating segment as, historically, OEM customers have paid on a more timely basis.
Inventories
Our inventories are procured primarily in support of the Inkjet and Fiery operating segments. Our inventories decreased by $2.6 million from $48.8 million in 2009 to $46.2 million in 2010 primarily due to the $2.3 million provision for excess solvent inventories and related end-of-life purchases.
62
Table of Contents
Accounts Payable, Accrued and Other Liabilities, and Net Income Taxes Payable
Our operating cash flows are impacted by the timing of payments to our vendors for accounts payable and by our accrual of liabilities. The change in accounts payable, accrued and other liabilities, and net income taxes payable/receivable increased our operating cash flows by $7.6 million and decreased our cash flows by approximately $16.1 and $4.4 million in 2009 and 2008, respectively. Our working capital, defined as current assets minus current liabilities, was $265.3 and $246.7 million at December 31, 2010 and 2009, respectively.
Investing Activities
A summary of our investing activities at December 31, 2010, 2009, and 2008 is as follows (in thousands):
| 2010 | 2009 | 2008 | ||||||||||
| Purchases of short-term investments |
$ | (111,619 | ) | $ | (167,465 | ) | $ | (170,732 | ) | |||
| Proceeds from sales and maturities of short-term investments |
105,603 | 127,163 | 461,929 | |||||||||
| Reclassification of funds from cash & cash equivalents to short term investments |
— | — | (14,836 | ) | ||||||||
| Purchases, net of proceeds from sales, of property and equipment |
(5,016 | ) | (5,218 | ) | (11,607 | ) | ||||||
| Proceeds from sale of building and land, net of direct transaction costs |
— | 135,802 | — | |||||||||
| Businesses purchased, net of cash acquired |
(16,448 | ) | — | (25,283 | ) | |||||||
| Purchases of other investments |
— | (1,701 | ) | (2,782 | ) | |||||||
| Net cash provided by (used for) investing activities |
$ | (27,480 | ) | $ | 88,581 | $ | 236,689 | |||||
Acquisitions
Radius Solutions Incorporated (“Radius”): On July 2, 2010, we purchased Radius for approximately $14.1 million, net of cash acquired, plus an additional future cash earnout, which is contingent on achieving certain performance targets. As of December 31, 2010, approximately $2.1 million had been earned against the earnout. The $0.4 million excess above the valuation at the acquisition date was expensed as a component of general and administrative expense in accordance with ASC 805. The potential undiscounted amount of all future contingent consideration cash payments that we could be required to make, beyond amounts currently accrued, is between $0 and $1.5 million as of December 31, 2010. Headquartered in Chicago, Illinois, Radius is a print management software company that provides PMIS solutions for the packaging industry.
Raster Printers, Inc. (“Raster”): On December 2, 2008, we acquired the remaining interest in Raster for approximately $5.3 million, including direct acquisition costs plus an additional cash earnout, which was contingent upon achieving certain performance targets. The earnout period expired December 31, 2010 with no additional consideration earned. Headquartered in San Jose, California, Raster sells UV wide format printers primarily to mid-range customers in the display graphics market.
Pace Systems Group, Inc (“Pace”): On July 28, 2008, we purchased Pace for approximately $20.1 million, net of cash acquired, including direct acquisition costs, plus an additional cash earnout amount, which is contingent upon achieving certain performance targets. The second earnout period ended December 31, 2010 with additional consideration earned of approximately $2.9 million, resulting in cumulative additional cash earnouts of $5.3 million, which have been accounted for as an adjustment to the purchase price. The potential undiscounted amount of all future contingent consideration cash payments that we could be required to make, beyond amounts currently accrued, is between $0 and $0.6 million as of December 31, 2010. Headquartered in Jacksonville, Florida, Pace is a print management software company that provides PMIS and e-commerce software solutions.
63
Table of Contents
Property and Equipment
Our net property and equipment purchases totaled $5.0, $5.2, and $11.6 million in 2010, 2009, and 2008, respectively. Our property and equipment additions have been funded by cash from operations.
We anticipate that we will continue to purchase property and equipment necessary in the normal course of our business. The amount and timing of these purchases and the related cash outflows in future periods are difficult to predict and are dependent on a number of factors including our hiring of employees, the rate of change in computer hardware/software used in our business, our business outlook, and decisions to further invest or expand business sites.
During the first quarter of 2009, we sold a portion of the Foster City, California campus for $137.3 million. Under the agreement, we sold the approximately 163,000 square foot building at 301 Velocity Way, as well as approximately 30 acres of related land and certain other assets related to the property. Net proceeds from the sale of building and land, net of direct transaction costs paid in 2009, were $135.8 million. The cost of the land, building, improvements, and direct transaction costs were included in the determination of the $80 million gain on sale of building and land.
Investments
During 2010 and 2009, we purchased, net of sales and maturities, marketable securities of $6.0 and $40.3 million, respectively. During 2008, we received net proceeds from sale and maturities of our marketable securities of $291.2 million, of which $240.0 million was used to repay the 1.50% convertible senior debenture holders.
We have classified our investment portfolio as “available for sale.” Our investments are made with a policy of capital preservation and liquidity as primary objectives. We may hold investments in corporate bonds and U.S. government agency securities to maturity; however, we may sell an investment at any time if the quality rating of the investment declines, the yield on the investment is no longer attractive, or we have better uses for the cash. Because we invest primarily in investment securities that are highly liquid with a ready market, we believe the purchase, maturity, or sale of our investments has no material impact on our overall liquidity.
Restricted Investments
We have restricted investments that are required to be maintained by the synthetic lease of our Foster City office facility. We are required to maintain cash in LIBOR-based interest-bearing accounts, which fully collateralize our synthetic lease. We had $56.9 of restricted investments at December 31, 2010, which was accounted for as restricted investments within noncurrent assets.
Financing Activities
The primary use of funds for financing activities in 2010, 2009, and 2008, was the use of $3.6, $101.1, and $65.2 million, respectively, of cash to repurchase outstanding shares of our common stock, which included our $30 million ASR and $70 million tender offer in 2009, repurchase of stock options from certain employees in conjunction with our fair value stock option exchange, and the net settlement of RSUs and RSAs for employee common stock related tax liabilities. See Item 5—Market for Registrant’s Common Equity, Related Stockholder Matters, and Issuer Purchases of Equity Securities for further discussion of our common stock repurchase programs.
Historically, our recurring cash flows provided by financing activities have been from the receipt of cash from the issuance of common stock from the exercise of stock options and for ESPP shares. We received proceeds from the exercise of stock options and employee purchases of ESPP shares of $6.7, $5.9, and $7.3 million in 2010, 2009, and 2008, respectively. While we may continue to receive proceeds from these plans in future
64
Table of Contents
periods, the timing and amount of such proceeds are difficult to predict and are contingent on a number of factors including the price of our common stock, the number of employees participating in the plans, and general market conditions. We anticipate that cash provided from the exercise of stock options may decline over time as we shift to issuance of RSUs, rather than stock options.
The synthetic lease agreement for our corporate headquarters provides a residual value guarantee. Under ASC 460, Guarantees, the fair value of a residual value guarantee in lease agreements entered into after December 31, 2002 must be recognized as a liability in our consolidated balance sheet. We have determined that the guarantee has no material value as of December 31, 2010.
On June 2, 2008, we exercised our option to redeem and paid in cash the outstanding balance of our 1.50% convertible senior debentures, which totaled $240 million. The redemption price for the securities was 100% of the principal amount, plus accrued and unpaid interest and additional interest amounts to, but not including, the redemption date.
Other Commitments
Our Fiery inventory consists primarily of raw and finished goods, memory subsystems, processors, and ASICs, which are sold to third party contract manufacturers responsible for manufacturing our products. Our Inkjet inventories consist of raw and finished goods, print heads, frames, UV ink, and other components in support of our internal manufacturing operations and solvent ink, which is purchased from third party contract manufacturers responsible for manufacturing our solvent ink. Should we decide to purchase components and do our own manufacturing of Fiery controllers or Inkjet solvent ink, or should it become necessary for us to purchase and sell components other than the processors, ASICs, or memory subsystems to our contract manufacturers, inventory balances and potentially property and equipment would increase significantly, thereby reducing our available cash resources. Further, the inventories we carry could become obsolete, thereby negatively impacting our financial condition and results of operations. We are also reliant on several sole-source suppliers for certain key components and could experience a further significant negative impact on our financial condition and results of operations if such supplies were reduced or not available.
We may be required to compensate our subcontract manufacturers for components purchased for orders subsequently cancelled by us. We periodically review the potential liability and the adequacy of the related allowance. Our financial condition and results of operations could be negatively impacted if we were required to compensate our subcontract manufacturers in amounts in excess of the related allowance.
Legal Proceedings
From time to time, we may be involved in a variety of claims, lawsuits, investigations, and proceedings relating to contractual disputes, securities law, intellectual property, employment matters, and other litigation matters relating to various claims that arise in the normal course of our business. We determine whether an estimated loss from a contingency should be accrued by assessing whether a loss is deemed probable and can be reasonably estimated. We assess our potential liability by analyzing our specific litigation and regulatory matters using available information.
We develop our views on estimated losses in consultation with inside and outside counsel, which involves a subjective analysis of potential results and outcomes, assuming various combinations of appropriate litigation
and settlement strategies. Because of the uncertainties related to both the amount and ranges of possible loss on the pending litigation matters, we are unable to predict with certainty the precise liability that could finally result from a range of possible unfavorable outcomes. However, taking all of the above factors into account, we reserve an amount that we could reasonably expect to pay for the cases discussed. Our estimates could be incorrect, and we could pay more or less than our current accrual. Litigation can be costly, diverting management’s attention and could, upon resolution, have a material adverse effect on our business, results of operations, financial condition, and cash flow.
65
Table of Contents
Please refer to Item 3, Legal Proceedings, in this Annual Report on Form 10-K for more information regarding our legal proceedings.
Contractual Obligations
The following table summarizes our significant contractual obligations at December 31, 2010 and the effect such obligations are expected to have on our liquidity and cash flows in future periods. This table excludes amounts already recorded on our balance sheet as liabilities at December 31, 2010, with the exception of the contingent liability resulting from the Radius acquisition.
| Payments due by period | ||||||||||||||||||||
| (in thousands) |
Total | Less than 1 year |
Between 1-3 years |
Between 3-5 years |
More than 5 years |
|||||||||||||||
| Operating lease obligations(1) |
$ | 19,007 | $ | 6,004 | $ | 8,850 | $ | 3,886 | $ | 267 | ||||||||||
| Contingent liability(2) |
2,744 | 2,125 | 619 | — | — | |||||||||||||||
| Purchase obligations(3) |
24,116 | 24,116 | — | — | — | |||||||||||||||
|
Total(3) |
$ | 45,867 | $ | 32,245 | $ | 9,469 | $ | 3,886 | $ | 267 | ||||||||||
| (1) | Lease obligations related to the principal corporate facilities are estimated based on current market interest rates (LIBOR). See Off-Balance Sheet Financing. |
| (2) | Represents the fair value of contingent consideration related to the Radius acquisition. This amount is reflected in our consolidated balance sheets under the captions “Accrued and other liabilities” and “Contingent liability.” The current fair value represents the first year earnout, which was earned based on realization of 2010 performance targets. The long-term fair value represents the present value of probability-adjusted revenues related to the second year earnout of $2.1 million. |
| (3) | Excludes contractual obligations recorded on the balance sheet as current liabilities and certain purchase orders as discussed below. |
Purchase obligations in the table above include agreements to purchase goods or services that are enforceable and legally binding and that specify all significant terms including: fixed or minimum quantities to be purchased; fixed, minimum, or variable price provisions; and the approximate timing of the transaction. Purchase obligations exclude purchase orders for raw materials and other goods and services that are cancelable without penalty. Our purchase orders are based on our current manufacturing needs and are generally fulfilled by our vendors within short time horizons. We also enter into contracts for outsourced services; however, the obligations under these contracts were not significant and the contracts generally contain clauses allowing for cancellation without significant penalty.
The expected timing of payment for the obligations listed above is estimated based on current information. Timing of payments and actual amounts paid may be different depending on when the goods or services are received or changes to agreed-upon amounts for some obligations.
The above table does not reflect unrecognized tax benefits of $32.5 million, the timing of which is uncertain. See Note 11—Income Taxes of Notes to the Consolidated Financial Statements for additional discussion of unrecognized tax benefits.
Off-Balance Sheet Financing
Synthetic Lease Arrangements
As of December 31, 2008 we were a party to two synthetic leases (the “301 Lease” and the “303 Lease”, together “Leases”) covering our Foster City facilities located at 301 and 303 Velocity Way, Foster City, California. The Leases provided a cost effective means of providing adequate office space for our corporate offices. The Leases
66
Table of Contents
included an option to purchase the facilities during or at the end of each Lease term for the amount expended by the lessor to purchase the facilities. The funds pledged under the Leases ($56.9 million for the 303 Lease and $31.7 million for the 301 Lease at December 31, 2008) were in LIBOR-based interest bearing accounts and restricted as to withdrawal at all times.
On January 29, 2009, we sold the 163,000 square foot 301 Velocity Way building, along with approximately 30 acres of land and certain other assets related to the property for $137.3 million. We retained ownership of the approximately 295,000 square foot building at 303 Velocity Way that we currently occupy along with the related land. We exercised our purchase option with respect to the 301 Lease in connection with the sale of the building and land and terminated the corresponding synthetic lease. Accordingly, the $31.7 million of pledged funds were recognized in the determination of the gain on sale of building and land in the Consolidated Statement of Operations for the year ended December 31, 2009.
We have guaranteed to the lessor a residual value associated with the building equal to 82% of their funding of the 303 Lease. Under the financial covenants, we must maintain a minimum net worth and a minimum tangible net worth as of the end of each quarter. There is an additional covenant regarding mergers. We were in compliance with all such financial and merger-related covenants as of December 31, 2010. We have assessed our exposure in relation to the first loss guarantee under the 303 Lease and have determined there is no deficiency to the guaranteed value at December 31, 2010. If there is a decline in value, we will record a loss associated with the residual value guarantee. In conjunction with the 303 Lease, we have entered into a separate ground lease with the lessor for approximately 30 years. As of December 31, 2010, we were treated as the owner of this building for federal income tax purposes. Since we exercised our purchase option with respect to the 301 Lease, our maximum exposure under our remaining synthetic lease arrangement is $56.9 million as of December 31, 2010.
Item 7A: Quantitative and Qualitative Disclosures about Market Risk
Market Risk
We are exposed to various market risks. Market risk is the potential loss arising from adverse changes in market rates and prices, general credit, foreign currency exchange rate fluctuation, liquidity, and interest rate risks, which may be exacerbated by the tightening of global credit markets and increase in economic uncertainty that have affected various sectors of the financial markets and continue to cause credit and liquidity issues. We do not enter into derivatives or other financial instruments for trading or speculative purposes. We may enter into financial instrument contracts to manage and reduce the impact of changes in foreign currency exchange rates on earnings and cash flows. The counterparties to such contracts are major financial institutions. During the fourth quarter of 2009, we began hedging our operating expense exposure in Indian rupees. The notional amount of our Indian rupee cash flow hedge was $2.5 million at December 31, 2010.
Interest Rate Risk
Marketable Securities
We maintain an investment portfolio of short-term investments of various holdings, types, and maturities. These short-term investments are generally classified as available–for-sale and, consequently, are recorded on the balance sheet at fair value with unrealized gains and losses reported as a separate component of OCI. At any time, a sharp rise in interest rates could have a material adverse impact on the fair value of our investment portfolio. Conversely, declines in interest rates could have a material impact on interest earnings for our portfolio. We do not currently hedge these interest rate exposures.
67
Table of Contents
The following table presents the hypothetical change in fair values in the financial instruments held by us at December 31, 2010 that are sensitive to changes in interest rates. The modeling technique measures the change in fair value arising from selected potential changes in interest rates. Market changes reflect immediate hypothetical parallel shifts in the yield curve of plus or minus 100 basis points over a twelve month time horizon (in thousands):
|
Valuation of |
No change in interest rates |
Valuation of securities given an interest rate increase of 100 basis points |
||||||
| 110,818 |
109,808 | 108,798 | ||||||
Foreign Currency Exchange Risk
A large portion of our business is conducted in countries other than the U.S. We are primarily exposed to changes in exchange rates for the Euro, British pound sterling, Indian rupee, and Japanese yen. Although the majority of our receivables are invoiced and collected in U.S. dollars, we have exposure from non-U.S. dollar-denominated sales (primarily Euro, British pound sterling, and Japanese yen) and operating expenses (primarily Euro, British pound sterling, Japanese yen, and Indian rupee) in foreign countries. We can benefit from a weaker dollar and we can be adversely affected from a stronger dollar relative to major currencies worldwide. Accordingly, changes in exchange rates, and in particular a weakening of the U.S. dollar, may adversely affect our consolidated operating expenses and operating income (loss) as expressed in U.S. dollars. During the fourth quarter of 2009, we began hedging our operating expense exposure in Indian rupees. The notional amount of our Indian rupee cash flow hedge was $2.5 million at December 31, 2010.
Financial Risk Management
The following discussion about our risk management activities includes “forward-looking statements” that involve risks and uncertainties. Actual results could differ materially from those projected in the forward-looking statements.
As a global concern, we face exposure to adverse movements in foreign currency exchange rates. These exposures may change over time as business practices evolve and could have a material adverse impact on our financial results. Our primary exposures are related to non-U.S. dollar denominated sales in Europe, Japan, and the U.K. and operating expenses in Europe, India, Japan, and the U.K. During the fourth quarter of 2009, we began hedging our operating expense exposure in Indian rupees. As of December 31, 2010, we had not entered into hedges against any other currency exposures, but we may consider hedging against currency movements in other currencies, as well as adjusting the hedged portion of our Indian rupee exposure in the future.
We maintain investment portfolio holdings of various issuers, types, and maturities, typically U.S. Treasury and government-sponsored entity securities, corporate debt instruments, and asset-backed instruments. These short-term investments are classified as available-for-sale and consequently are recorded on the balance sheet at fair value with unrealized gains and losses reported as a separate component of OCI. These securities are not leveraged and are held for purposes other than trading.
68
Table of Contents
Item 8: Financial Statements and Supplementary Data
INDEX TO CONSOLIDATED FINANCIAL STATEMENTS
69
Table of Contents
REPORT OF INDEPENDENT REGISTERED PUBLIC ACCOUNTING FIRM
To the Board of Directors and Stockholders of Electronics For Imaging, Inc.:
In our opinion, the consolidated financial statements listed in the index appearing under Item 15(a)(1) present fairly, in all material respects, the financial position of Electronics For Imaging, Inc. and its subsidiaries at December 31, 2010 and 2009, and the results of their operations and their cash flows for each of the three years in the period ended December 31, 2010 in conformity with accounting principles generally accepted in the United States of America. In addition, in our opinion, the financial statement schedule listed in the accompanying index appearing under Item 15(a)(2) presents fairly, in all material respects, the information set forth therein when read in conjunction with the related consolidated financial statements. Also in our opinion, the Company maintained, in all material respects, effective internal control over financial reporting as of December 31, 2010, based on criteria established in Internal Control—Integrated Framework issued by the Committee of Sponsoring Organizations of the Treadway Commission (COSO). The Company’s management is responsible for these financial statements and financial statement schedule, for maintaining effective internal control over financial reporting and for its assessment of the effectiveness of internal control over financial reporting, included in Management’s Report on Internal Control over Financial Reporting appearing under Item 9A. Our responsibility is to express opinions on these financial statements, on the financial statement schedule, and on the Company’s internal control over financial reporting based on our integrated audits. We conducted our audits in accordance with the standards of the Public Company Accounting Oversight Board (United States). Those standards require that we plan and perform the audits to obtain reasonable assurance about whether the financial statements are free of material misstatement and whether effective internal control over financial reporting was maintained in all material respects. Our audits of the financial statements included examining, on a test basis, evidence supporting the amounts and disclosures in the financial statements, assessing the accounting principles used and significant estimates made by management, and evaluating the overall financial statement presentation. Our audit of internal control over financial reporting included obtaining an understanding of internal control over financial reporting, assessing the risk that a material weakness exists, and testing and evaluating the design and operating effectiveness of internal control based on the assessed risk. Our audits also included performing such other procedures as we considered necessary in the circumstances. We believe that our audits provide a reasonable basis for our opinions.
As discussed in Note 4 to the consolidated financial statements, the Company changed the timing of its annual goodwill impairment assessment in 2009.
A company’s internal control over financial reporting is a process designed to provide reasonable assurance regarding the reliability of financial reporting and the preparation of financial statements for external purposes in accordance with generally accepted accounting principles. A company’s internal control over financial reporting includes those policies and procedures that (i) pertain to the maintenance of records that, in reasonable detail, accurately and fairly reflect the transactions and dispositions of the assets of the company; (ii) provide reasonable assurance that transactions are recorded as necessary to permit preparation of financial statements in accordance with generally accepted accounting principles, and that receipts and expenditures of the company are being made only in accordance with authorizations of management and directors of the company; and (iii) provide reasonable assurance regarding prevention or timely detection of unauthorized acquisition, use, or disposition of the company’s assets that could have a material effect on the financial statements.
Because of its inherent limitations, internal control over financial reporting may not prevent or detect misstatements. Also, projections of any evaluation of effectiveness to future periods are subject to the risk that controls may become inadequate because of changes in conditions, or that the degree of compliance with the policies or procedures may deteriorate.
As described in Management’s Report on Internal Control over Financial Reporting appearing under Item 9A, management has excluded Golflane Limited (“Radius”) from its assessment of internal control over financial reporting as of December 31, 2010 because it was acquired by the Company in a purchase business combination during 2010. We have excluded Radius from our audit of internal control over financial reporting. Radius is a wholly-owned subsidiary whose total assets and total revenue represent 3.1% and 1.5%, respectively, of the related consolidated financial statement amounts as of and for the year ended December 31, 2010.
/s/ PRICEWATERHOUSE COOPERS LLP
San Jose, California
March 9, 2011
70
Table of Contents
Consolidated Balance Sheets
| December 31, | ||||||||
| (in thousands) | 2010 | 2009 | ||||||
| Assets |
||||||||
| Current assets: |
||||||||
| Cash and cash equivalents |
$ | 126,363 | $ | 106,067 | ||||
| Short-term investments, available for sale |
103,300 | 98,134 | ||||||
| Accounts receivable, net of allowances of $13.2 and $13.1 million, respectively |
85,453 | 80,168 | ||||||
| Inventories |
46,216 | 48,786 | ||||||
| Other current assets |
24,317 | 15,291 | ||||||
| Total current assets |
385,649 | 348,446 | ||||||
| Property and equipment, net |
26,547 | 28,229 | ||||||
| Restricted investments |
56,850 | 56,850 | ||||||
| Goodwill |
139,517 | 122,840 | ||||||
| Intangible assets, net |
49,140 | 54,449 | ||||||
| Deferred tax assets |
47,137 | 47,777 | ||||||
| Other assets |
1,741 | 2,590 | ||||||
| Total assets |
$ | 706,581 | $ | 661,181 | ||||
| Liabilities and Stockholders’ Equity |
||||||||
| Current liabilities: |
||||||||
| Accounts payable |
$ | 49,189 | $ | 35,929 | ||||
| Accrued and other liabilities |
45,730 | 35,861 | ||||||
| Deferred revenue |
24,298 | 23,521 | ||||||
| Income taxes payable |
1,182 | 6,483 | ||||||
| Total current liabilities |
120,399 | 101,794 | ||||||
| Contingent liability |
619 | — | ||||||
| Deferred tax liabilities |
1,292 | — | ||||||
| Non-current income taxes payable |
32,522 | 36,961 | ||||||
| Total liabilities |
154,832 | 138,755 | ||||||
| Commitments and contingencies (Note 8) |
||||||||
| Stockholders’ equity: |
||||||||
| Preferred stock, $0.01 par value; 5,000 shares authorized; none issued and outstanding |
— | — | ||||||
| Common stock, $0.01 par value; 150,000 shares authorized; 74,456 and 72,276 shares issued and outstanding, respectively |
745 | 723 | ||||||
| Additional paid-in capital |
692,904 | 668,723 | ||||||
| Treasury stock, at cost, 28,031 and 27,788 shares, respectively |
(488,559 | ) | (485,618 | ) | ||||
| Accumulated other comprehensive income |
2,955 | 2,346 | ||||||
| Retained earnings |
343,704 | 336,252 | ||||||
| Total stockholders’ equity |
551,749 | 522,426 | ||||||
| Total liabilities and stockholders’ equity |
$ | 706,581 | $ | 661,181 | ||||
See accompanying notes to consolidated financial statements.
71
Table of Contents
Consolidated Statements of Operations
| For the years ended December 31, | ||||||||||||
| (in thousands, except per share amounts) | 2010 | 2009 | 2008 | |||||||||
| Revenue |
$ | 504,007 | $ | 401,108 | $ | 560,380 | ||||||
| Cost of revenue(1) |
236,322 | 189,625 | 242,963 | |||||||||
| Gross profit |
267,685 | 211,483 | 317,417 | |||||||||
| Operating expenses: |
||||||||||||
| Research and development(1) |
105,769 | 110,822 | 140,437 | |||||||||
| Sales and marketing(1) |
107,322 | 102,001 | 119,400 | |||||||||
| General and administrative(1) |
38,185 | 35,033 | 47,685 | |||||||||
| Amortization of identified intangibles |
12,385 | 18,479 | 29,367 | |||||||||
| In-process research & development |
— | — | 2,680 | |||||||||
| Restructuring and other (Note 14) |
3,615 | 8,957 | 11,005 | |||||||||
| Goodwill and asset impairment |
685 | 3,208 | 111,858 | |||||||||
| Total operating expenses |
267,961 | 278,500 | 462,432 | |||||||||
| Loss from operations |
(276 | ) | (67,017 | ) | (145,015 | ) | ||||||
| Other income (expense), net: |
||||||||||||
| Interest and other income (expense), net: |
(1,354 | ) | 3,061 | 11,939 | ||||||||
| Gain on sale of building and land |
— | 79,991 | — | |||||||||
| Total other income (expense), net |
(1,354 | ) | 83,052 | 11,939 | ||||||||
| Income (loss) before income taxes |
(1,630 | ) | 16,035 | (133,076 | ) | |||||||
| Benefit from (provision for) income taxes |
9,117 | (18,206 | ) | 19,632 | ||||||||
| Net income (loss) |
$ | 7,487 | $ | (2,171 | ) | $ | (113,444 | ) | ||||
| Net income (loss) per basic common share |
$ | 0.16 | $ | (0.04 | ) | $ | (2.16 | ) | ||||
| Net income (loss) per diluted common share |
$ | 0.16 | $ | (0.04 | ) | $ | (2.16 | ) | ||||
| Shares used in basic per-share calculation |
45,387 | 49,682 | 52,553 | |||||||||
| Shares used in diluted per-share calculation |
47,152 | 49,682 | 52,553 | |||||||||
|
(1) Includes stock-based compensation expense as follows: |
||||||||||||
| 2010 | 2009 | 2008 | ||||||||||
| Cost of revenue |
$ | 984 | $ | 1,074 | $ | 2,471 | ||||||
| Research and development |
4,114 | 6,664 | 12,923 | |||||||||
| Sales and marketing |
3,695 | 4,233 | 6,059 | |||||||||
| General and administrative |
7,132 | 6,613 | 11,974 | |||||||||
See accompanying notes to consolidated financial statements.
72
Table of Contents
Consolidated Statements of Stockholders’ Equity
| Common stock | Additional paid-in capital |
Treasury stock | Other comprehensive income (loss) |
Retained earnings |
Total stockholders’ equity |
|||||||||||||||||||||||||||
| (in thousands) | Shares | Amount | Shares | Amount | ||||||||||||||||||||||||||||
| Balances as of December 31, 2007 |
69,633 | $ | 696 | $ | 606,702 | (14,629 | ) | $ | (318,899 | ) | $ | 3,572 | $ | 451,925 | $ | 743,996 | ||||||||||||||||
| Net loss |
(113,444 | ) | ||||||||||||||||||||||||||||||
| Other comprehensive income, net of tax: |
||||||||||||||||||||||||||||||||
| Currency translation adjustment |
(295 | ) | ||||||||||||||||||||||||||||||
| Market valuation on short-term investments |
(1,601 | ) | ||||||||||||||||||||||||||||||
| Comprehensive loss |
(1,896 | ) | (113,444 | ) | (115,340 | ) | ||||||||||||||||||||||||||
| Exercise of common stock options |
162 | 2 | 3,403 | 3,405 | ||||||||||||||||||||||||||||
| Restricted stock vested |
461 | 5 | (5 | ) | — | |||||||||||||||||||||||||||
| Stock-based compensation |
33,671 | 33,671 | ||||||||||||||||||||||||||||||
| Stock repurchase |
(4,752 | ) | (65,230 | ) | (65,230 | ) | ||||||||||||||||||||||||||
| Stock issued pursuant to ESPP |
482 | 5 | 5,864 | 5,869 | ||||||||||||||||||||||||||||
| Tax expense related to stock plans |
(5,153 | ) | — | — | (5,153 | ) | ||||||||||||||||||||||||||
| Balances as of December 31, 2008 |
70,738 | $ | 708 | $ | 644,482 | (19,381 | ) | $ | (384,129 | ) | $ | 1,676 | $ | 338,481 | $ | 601,218 | ||||||||||||||||
| Net loss |
(2,171 | ) | ||||||||||||||||||||||||||||||
| Other comprehensive income, net of tax: |
||||||||||||||||||||||||||||||||
| Currency translation adjustment |
(59 | ) | ||||||||||||||||||||||||||||||
| Market valuation on short-term investments |
660 | |||||||||||||||||||||||||||||||
| Other |
11 | |||||||||||||||||||||||||||||||
| Comprehensive income (loss) |
612 | (2,171 | ) | (1,559 | ) | |||||||||||||||||||||||||||
| Cumulative effect adjustment upon adoption of ASC 320-10-65-1 as of April 1, 2009 |
58 | (58 | ) | — | ||||||||||||||||||||||||||||
| Repurchase in conjunction with our fair value stock option exchange |
(167 | ) | (167 | ) | ||||||||||||||||||||||||||||
| Restricted stock vested |
761 | 7 | (7 | ) | — | |||||||||||||||||||||||||||
| Stock-based compensation |
18,584 | 18,584 | ||||||||||||||||||||||||||||||
| Stock repurchase |
(8,407 | ) | (101,489 | ) | (101,489 | ) | ||||||||||||||||||||||||||
| Stock issued pursuant to ESPP |
777 | 8 | 5,831 | 5,839 | ||||||||||||||||||||||||||||
| Balances as of December 31, 2009 |
72,276 | $ | 723 | $ | 668,723 | (27,788 | ) | $ | (485,618 | ) | $ | 2,346 | $ | 336,252 | $ | 522,426 | ||||||||||||||||
| Net income |
7,487 | |||||||||||||||||||||||||||||||
| Other comprehensive income, net of tax: |
||||||||||||||||||||||||||||||||
| Currency translation adjustment |
727 | |||||||||||||||||||||||||||||||
| Market valuation on short-term investments |
(100 | ) | ||||||||||||||||||||||||||||||
| Other |
(18 | ) | ||||||||||||||||||||||||||||||
| Comprehensive income (loss) |
609 | 7,487 | 8,096 | |||||||||||||||||||||||||||||
| Exercise of common stock options |
86 | 1 | 1,021 | 1,022 | ||||||||||||||||||||||||||||
| Restricted stock vested |
1,344 | 13 | (13 | ) | — | |||||||||||||||||||||||||||
| Stock-based compensation |
15,925 | 15,925 | ||||||||||||||||||||||||||||||
| Stock repurchase |
(243 | ) | (2,941 | ) | (2,941 | ) | ||||||||||||||||||||||||||
| Stock issued pursuant to ESPP |
750 | 8 | 5,653 | 5,661 | ||||||||||||||||||||||||||||
| Tax benefit related to stock plans |
1,595 | 1,595 | ||||||||||||||||||||||||||||||
| Other |
(35 | ) | (35 | ) | ||||||||||||||||||||||||||||
| Balances as of December 31, 2010 |
74,456 | $ | 745 | $ | 692,904 | (28,031 | ) | $ | (488,559 | ) | $ | 2,955 | $ | 343,704 | $ | 551,749 | ||||||||||||||||
See accompanying notes to consolidated financial statements.
73
Table of Contents
Consolidated Statements of Cash Flows
| For the years ended December 31, | ||||||||||||
| (in thousands) | 2010 | 2009 | 2008 | |||||||||
| Cash flows from operating activities: |
||||||||||||
| Net income (loss) |
$ | 7,487 | $ | (2,171 | ) | $ | (113,444 | ) | ||||
| Adjustments to reconcile net income (loss) to net cash provided by (used for) operating activities: |
||||||||||||
| Depreciation and amortization |
20,943 | 29,453 | 41,437 | |||||||||
| Acquired in-process research & development |
— | — | 2,680 | |||||||||
| Deferred taxes |
(4,190 | ) | 6,806 | (33,988 | ) | |||||||
| Provision for allowance for bad debts and sales-related allowances |
2,525 | 7,703 | 5,420 | |||||||||
| Tax expense from employee stock plans |
— | — | (3,170 | ) | ||||||||
| Excess tax benefit from stock-based compensation |
(573 | ) | (180 | ) | (36 | ) | ||||||
| Gain on sale of building and land |
— | (79,991 | ) | — | ||||||||
| Provision for inventory obsolescence |
5,833 | 4,986 | 2,478 | |||||||||
| Stock-based compensation |
15,925 | 18,583 | 33,427 | |||||||||
| Goodwill and asset impairment |
685 | 2,334 | 111,858 | |||||||||
| Other non-cash charges and credits |
734 | 2,252 | (5,258 | ) | ||||||||
| Changes in operating assets and liabilities, net of effect of acquired companies: |
||||||||||||
| Accounts receivable |
(5,718 | ) | 9,799 | 5,008 | ||||||||
| Inventories |
(5,329 | ) | (6,454 | ) | (12,722 | ) | ||||||
| Other current assets |
(2,083 | ) | 3,325 | (1,435 | ) | |||||||
| Accounts payable and accrued liabilities |
16,836 | (23,383 | ) | (13,965 | ) | |||||||
| Income taxes payable/receivable, net |
(9,152 | ) | 7,270 | 9,529 | ||||||||
| Net cash provided by (used for) operating activities |
43,923 | (19,668 | ) | 27,819 | ||||||||
| Cash flows from investing activities: |
||||||||||||
| Purchases of short-term investments |
(111,619 | ) | (167,465 | ) | (170,732 | ) | ||||||
| Proceeds from sales and maturities of short-term investments |
105,603 | 127,163 | 461,929 | |||||||||
| Reclassification of funds from cash & cash equivalents to short term investments |
— | — | (14,836 | ) | ||||||||
| Purchases, net of proceeds from sales, of property and equipment |
(5,016 | ) | (5,218 | ) | (11,607 | ) | ||||||
| Proceeds from sale of building and land, net of direct transaction costs |
— | 135,802 | — | |||||||||
| Businesses purchased, net of cash acquired |
(16,448 | ) | — | (25,283 | ) | |||||||
| Purchases of other investments |
— | (1,701 | ) | (2,782 | ) | |||||||
| Net cash provided by (used for) investing activities |
(27,480 | ) | 88,581 | 236,689 | ||||||||
| Cash flows from financing activities: |
||||||||||||
| Repayment of convertible debentures |
— | — | (240,000 | ) | ||||||||
| Proceeds from issuance of common stock |
6,682 | 5,876 | 7,291 | |||||||||
| Purchases of treasury stock and net settlement of restricted stock, including transaction costs |
(3,557 | ) | (101,075 | ) | (65,230 | ) | ||||||
| Excess tax benefit from stock-based compensation |
573 | 180 | 36 | |||||||||
| Net cash provided by (used for) financing activities |
3,698 | (95,019 | ) | (297,903 | ) | |||||||
| Effect of foreign exchange rate changes on cash and cash equivalents |
155 | 21 | (89 | ) | ||||||||
| Increase (decrease) in cash and cash equivalents |
20,296 | (26,085 | ) | (33,484 | ) | |||||||
| Cash and cash equivalents at beginning of year |
106,067 | 132,152 | 165,636 | |||||||||
| Cash and cash equivalents at end of year |
$ | 126,363 | $ | 106,067 | $ | 132,152 | ||||||
See accompanying notes to consolidated financial statements.
74
Table of Contents
Notes to Consolidated Financial Statements
Note 1: The Company and Its Significant Accounting Policies
The Company
We are a world leader in customer-focused digital printing innovation, including color digital print controllers, super-wide and wide format printers and ink, and print management solutions. Our award-winning print management solutions are integrated from creation to print. Our product portfolio includes Fiery digital color print servers; Inkjet products including VUTEk super-wide digital inkjet printers, Jetrion industrial inkjet printing systems, Rastek wide format digital inkjet printers, and ink for each of these product lines; and APPS consisting of print production workflow, management information software, and corporate printing and packaging solutions. Our integrated solutions and award-winning technologies are designed to automate print and business processes, streamline workflow, provide profitable value-added services, and produce accurate digital output.
Significant Accounting Policies
Basis of Presentation
The accompanying consolidated financial statements include the accounts of EFI and our subsidiaries. All significant intercompany accounts and transactions have been eliminated in consolidation.
Use of Estimates
The preparation of the consolidated financial statements requires us to make estimates and judgments that affect the reported amounts of assets, liabilities, revenue, and expenses and related disclosure of contingent assets and liabilities. We evaluate our estimates, including those related to revenue recognition, the allowance for doubtful accounts, inventories, restructuring and other charges, asset impairment, depreciable lives of assets, goodwill and intangible assets, income taxes, warranty obligations, purchase commitments, contingent liabilities, and other contingencies on an ongoing basis. Estimates are based upon historical experience and various other assumptions believed to be reasonable under the circumstances at the time of the estimate, the results of which form the basis for making judgments about the carrying values of assets and liabilities that are not readily apparent from other sources. Actual results may differ from these estimates under different assumptions or conditions.
Cash, Cash Equivalents, and Short-term Investments
We invest our excess cash in deposits with major banks; money market securities; and municipal, U.S. government and sponsored entity, and corporate debt securities. By policy, we invest primarily in high-grade marketable securities. We are exposed to credit risk in the event of default by the financial institutions or issuers of these investments to the extent of amounts recorded on the consolidated balance sheet.
We consider all highly liquid investments with a maturity of three months or less at the time of purchase to be cash equivalents. Typically, the cost of these investments has approximated fair value. Marketable investments with a maturity greater than three months are classified as available-for-sale short-term investments. Available-for-sale securities are stated at fair market value with unrealized gains and losses reported as a separate component of stockholders’ equity, adjusted for deferred income taxes. Realized gains and losses on sales of investments are recognized upon sale of the investments using the specific identification method.
Fixed income debt securities are classified as available-for-sale and are carried at fair value, which is determined based on quoted market prices, with net unrealized gains and losses (other than the credit portion of any other-than-temporary impairment, which is included in net income (loss)) included in OCI, net of tax. We review investments in debt securities for other-than-temporary impairment whenever the fair value of an investment is
75
Table of Contents
Electronics For Imaging, Inc.
Notes to Consolidated Financial Statements—(Continued)
less than the amortized cost and evidence indicates that the investment’s carrying amount is not recoverable within a reasonable period of time. To determine whether an impairment is other-than-temporary, we consider whether we have the intent to sell the impaired security or if it will be more likely than not that we will be required to sell the impaired security before a market price recovery and whether evidence indicating the cost of the investment is recoverable outweighs evidence to the contrary. We have determined that gross unrealized losses on short-term investments at December 31, 2010 are temporary in nature because each investment meets our investment policy and credit quality requirements. We have the ability and intent to hold these investments until they recover their unrealized losses, which may not be until maturity. Evidence that we will recover our investments outweighs evidence to the contrary.
Investments that we currently own could suffer declines in fair value and become other-than-temporarily impaired. We continuously assess the fair value of individual securities as part of our ongoing portfolio management. Our other-than-temporary assessment includes reviewing the length of time and extent to which fair value has been less than amortized cost basis, the seniority and durations of the securities, adverse conditions related to a security, industry, or sector, historical and projected issuer financial performance, credit ratings, issuer specific news, and other available relevant information. Based on the above analysis, we identified one security that was other-than-temporarily impaired at December 31, 2008. As a result of our adoption of ASC 320-10-65-1, Transition Related to FASB Staff Position FAS 115-2 and FAS 124-2, Recognition and Presentation of Other-Than-Temporary Impairments, effective in the second quarter of 2009, we recorded a cumulative effect adjustment of $0.1 million, to reduce the cost of the previously identified security and retained earnings. In the fourth quarter of 2009, we identified two additional securities that were other-than-temporarily impaired at December 31, 2009 and recognized impairment losses of $0.2 million in other income (loss).
In determining whether a credit loss existed, we use our best estimate of the present value of cash flows expected to be collected from the debt security. For asset-backed and mortgage-backed securities, cash flow estimates including prepayment assumptions were based on data from widely accepted third party data sources or internal estimates. In addition to prepayment assumptions, cash flow estimates vary based on assumptions regarding the underlying collateral including default rates, recoveries, and changes in value. Expected cash flows were discounted using the effective interest rate implicit in the securities.
Allowance for Doubtful Accounts and Sales-related Allowances
We establish an allowance for doubtful accounts to ensure that trade receivables are not overstated due to uncollectability. To ensure that we have established an adequate allowance for doubtful accounts, management analyzes accounts receivable and historical bad debts, customer concentrations, customer creditworthiness, current economic trends and macroeconomic conditions, changes in customer payment terms, the length of time receivables are past due, and significant one-time events. We record specific reserves for individual accounts when we become aware of specific customer circumstances, such as bankruptcy filings, deterioration in the customer’s operating results or financial position, or potential unfavorable outcomes from disputes with customers or vendors.
We perform ongoing credit evaluations of the financial condition of our OEM, third-party distributor, reseller, and other customers and require collateral, such as letters of credit and bank guarantees, in certain circumstances. The past due or delinquency status of a receivable is based on the contractual payment terms of the receivable. The need to write off a receivable balance depends on the age, size, and a determination of collectability of the receivable. Balances are written off when we deem it probable that the receivable will not be recovered.
We also make provisions for sales rebates and revenue adjustments based upon analysis of current sales programs and revenue.
76
Table of Contents
Electronics For Imaging, Inc.
Notes to Consolidated Financial Statements—(Continued)
Concentration of Risk
We are exposed to credit risk in the event of default by any of our customers to the extent of amounts recorded in the consolidated balance sheet. We perform ongoing evaluations of the collectability of accounts receivable balances for our customers and maintain allowances for estimated credit losses. Actual losses have not historically been significant, but have risen over the past several years as our customer base has grown through acquisitions.
Our Fiery products, which constitute approximately 47% of our revenue, are primarily sold to a limited number of OEMs. We expect that we will continue to depend on a relatively small number of OEM customers for a significant portion of our revenue, although the significance of that revenue is expected to decline in future periods as our revenue increases from Inkjet and APPS products. We generally have experienced longer accounts receivable collection cycles in our Inkjet and APPS operating segments compared to our Fiery operating segment as, historically, OEM customers have paid on a more timely basis. Down payments are generally required from Inkjet and APPS customers as a means to ensure payment.
We are reliant on certain sole-source suppliers for key components of our products. We conduct our business with our component suppliers solely on a purchase order basis. Any disruption in the supply of key components would result in our inability to manufacture our products.
Many of our current Fiery and APPS products include software that we license from Adobe. To obtain licenses from Adobe, Adobe requires that we obtain quality assurance approvals from them for our products that use Adobe software. Although to date we have successfully obtained such quality assurance approvals from Adobe, we cannot be certain Adobe will grant us such approvals in the future. If Adobe does not grant us such licenses or approvals, if the Adobe licenses are terminated, or if our relationship with Adobe is otherwise materially impaired, we would likely be unable to manufacture products that incorporate Adobe PostScript® or other Adobe software.
We subcontract with other companies to manufacture our Fiery controllers, solvent ink, Jetrion, and Rastek products. We rely on the ability of our subcontractors to manufacture the products sold to our customers. A high concentration of our Fiery products is manufactured at one subcontractor location. If the subcontractor lost production capabilities at this facility, we would experience delays in delivering product to our customers. We do not maintain long-term agreements with our subcontractors, which could lead to an inability of such subcontractor to fill our orders.
Inventories
Inventories are stated at standard cost, which approximates the lower of actual cost using a first-in, first-out method, or market. We periodically review our inventories for potential slow-moving or obsolete items and write down specific items to net realizable value as appropriate. Work-in-process inventories consist of our product at various levels of assembly and include materials, labor, and manufacturing overhead. Finished goods inventory represents completed products awaiting shipment.
We estimate potential future inventory obsolescence and purchase commitments to evaluate the need for inventory reserves. Current economic trends, changes in customer demand, product design changes, product life and demand, and the acceptance of our products are analyzed to evaluate the adequacy of such reserves. Significant management judgment and estimates must be made and used in connection with establishing inventory allowances and reserves in any accounting period. Material differences may result in changes in the amount and timing of our net income (loss) for any period, if management made different judgments or utilized different estimates.
77
Table of Contents
Electronics For Imaging, Inc.
Notes to Consolidated Financial Statements—(Continued)
Property and Equipment, Net
Property and equipment is recorded at cost. Depreciation is computed using the straight-line method over the estimated useful lives of the assets. The estimated life for desktop and laptop computers is 24 months, furniture has an estimated life of seven years, software is amortized over three to five years, and buildings have an estimated life of 40 years. All other assets are typically considered to have a two to ten year life. Leasehold improvements are amortized using the straight-line method over the estimated useful lives of the improvements or the lease term, if shorter. Land improvements, such as parking lots and sidewalks, are amortized using the straight-line method over the estimated useful lives of the improvements.
When assets are disposed, we remove the asset and accumulated depreciation from our records and recognize the related gain or loss in results of operations. The cost and related accumulated depreciation applicable to property and equipment sold or no longer in service are eliminated from the accounts and any gain or loss is included in other income (expense), net.
Depreciation expense was $8.5, $10.9, and $11.4 million for the years ended December 31, 2010, 2009, and 2008, respectively.
Repairs and maintenance expenditures, which are not considered improvements and do not extend the useful life of property and equipment, are expensed as incurred.
Internal Use Software
We follow the guidance in ASC 350-40, Intangibles—Goodwill and Other—Internal-Use Software. Software development costs, including costs incurred to purchase third party software, are capitalized beginning when we determine that certain factors are present, including among others, that technology exists to achieve the performance requirements. The accumulation of software costs to be capitalized ceases when the software is substantially developed and is ready for its intended use. It is amortized over an estimated useful life of three years using the straight-line method.
Restricted Investments
We have restricted investments that are required to be maintained by the synthetic lease of our Foster City office facility. We are required to maintain cash in LIBOR-based interest-bearing accounts, which fully collateralize our synthetic lease. We had $56.9 million of restricted investments at December 31, 2010, which was accounted for as a noncurrent asset as restricted investments.
Goodwill
During the fourth quarter of 2009, we changed our annual goodwill impairment testing date from September 30 to December 31 of each year. This change was made to better align impairment testing procedures with year-end financial reporting and the annual business planning and budgeting process, which commences during the fourth quarter of each year. As a result, goodwill impairment testing now reflects the result of input from business and other operating personnel in the development of the budget. Accordingly, management considered this accounting change to be preferable. This change did not accelerate, delay, avoid, or cause an impairment charge, nor did this change result in adjustments to previously issued financial statements.
We perform our annual goodwill impairment analysis in the fourth quarter of each year according to the provisions of ASC 350-20-35, Goodwill—Intangibles and Other—Subsequent Measurement. A two-step impairment test of goodwill is required. In the first step, the fair value of each reporting unit is compared to its
78
Table of Contents
Electronics For Imaging, Inc.
Notes to Consolidated Financial Statements—(Continued)
carrying value. If the fair value exceeds carrying value, goodwill is not impaired and further testing is not required. If the carrying value exceeds fair value, then the second step of the impairment test is required to determine the implied fair value of the reporting unit’s goodwill. The implied fair value of goodwill is calculated by deducting the fair value of all tangible and intangible net assets of the reporting unit, excluding goodwill, from the fair value of the reporting unit as determined in the first step. If the carrying value of the reporting unit’s goodwill exceeds its implied fair value, then an impairment loss must be recorded equal to the difference.
Based on the outcome of conditions existing during the fourth quarter of 2008, we determined that a triggering event requiring an interim impairment analysis had occurred relating to the Inkjet reporting unit. The resulting impairment analysis resulted in a non-cash goodwill impairment charge of $104 million during the fourth quarter of 2008. The goodwill valuation analysis was performed based on our respective reporting units—Fiery, Inkjet, and APPS—which are consistent with our operating segments identified in Note 15—Segment Information, Geographic Data, and Major Customers of the Notes to Consolidated Financial Statements.
We determined the fair value of the Inkjet and APPS reporting units as of December 31, 2010 by equally weighting the market and income approaches. The fair value of the Fiery reporting unit was determined based on the market approach. Under the market approach, we estimated fair value based on market multiples of revenue or earnings of comparable companies. Under the income approach, we measured fair value of the Inkjet and APPS reporting units based on a projected cash flow method using a discount rate determined by our management to be commensurate with the risk inherent in our current business model. Based on our valuation results, we have determined that the fair values of our reporting units exceed their carrying values. Fiery, Inkjet, and APPS fair values are $226, $192, and $67 million, respectively, which exceed carrying value by 124%, 34%, and 26%, respectively.
Please see Note 4—Goodwill and Long-Lived Asset Impairment of the Notes to Consolidated Financial Statements.
Long-lived Assets, including Intangible Assets
We evaluate potential impairment with respect to long-lived assets whenever events or changes in circumstances indicate that its carrying amount may not be recoverable. We recognized long-lived asset impairment charges of $0.7, $3.2, and $1.8 million for the years ended December 31, 2010, 2009, and 2008, respectively, consisting primarily of project abandonment costs related to equipment charges in the Inkjet operating segment, assets impaired related to an Inkjet facility closure, certain Inkjet printer equipment, and the impairment of our remaining equity method investees.
Intangible assets are evaluated for impairment based on their estimated future undiscounted cash flows. Based on this analysis, no impairment of intangible assets, excluding goodwill, was recognized in 2010, 2009, or 2008.
Intangible assets acquired to date are being amortized on a straight-line basis over periods ranging from 2 to 18 years. No changes have been made to the useful lives of amortizable identifiable intangible assets in 2010, but the shortening of the useful lives of certain trademarks during 2009 and 2008 resulted in a $1.1, $0.6, and $0.1 million impact on amortization expense for the years ended December 31, 2010, 2009, and 2008, respectively. Intangible amortization expense was $12.4, $18.5, and $29.4 million for the years ended December 31, 2010, 2009, and 2008, respectively.
Other investments, included within other assets, consist of equity and debt investments in privately-held companies that develop products, markets, and services that are strategic to us. In-substance common stock
79
Table of Contents
Electronics For Imaging, Inc.
Notes to Consolidated Financial Statements—(Continued)
investments in which we exercise significant influence over operating and financial policies, but do not have a majority voting interest, are accounted for using the equity method of accounting. Investments not meeting these requirements are accounted for using the cost method of accounting.
The process of assessing whether a particular equity or debt investment’s fair value is less than its carrying cost requires a significant amount of judgment due to the lack of a mature and stable public market for these securities. In making this judgment, we carefully consider the investee’s most recent financial results, cash position, recent cash flow data, projected cash flows (both short and long-term), financing needs, recent financing rounds, most recent valuation data, the current investing environment, management or ownership changes, and competition. This analysis is based primarily on information that we request and receive from these privately-held companies and is performed on a quarterly basis. Although we evaluate all of our privately-held equity and debt investments for impairment based on this criteria, each investment’s fair value is only estimated when events or changes in circumstances have occurred that may have a significant effect on its fair value (because the fair value of each investment is not readily determinable). Where these factors indicate that the equity investment’s fair value is less than its carrying cost, and where we consider such diminution in value to be other than temporary, we record an impairment charge to reduce such equity investment to its estimated fair value.
During the fourth quarter of 2008, we assessed each remaining investment’s technology pipeline and market conditions in the industry for the next several years and determined it is no longer probable that they will generate enough positive future cash flows to recover the full carrying amount of the investment. As such, we recognized an impairment charge of $6.1 million.
Our investments accounted for using the equity method of accounting totaled $0.3 million as of December 31, 2009 and 2008. Our consolidated results of operations for the years ended December 31, 2009 and 2008 include, as a component of other income (expense), net, our share of the net losses of equity method investees of $1.4 and $0.9 million, respectively.
During the second quarter of 2010, we further assessed each remaining investment’s ability to sustain an earnings capacity that would justify the carrying amount of the investment in accordance with ASC 323-10-35-32. Based on this assessment, we impaired the remaining carrying value of these investments of $0.3 million.
On December 2, 2008, we acquired the remaining interest of Raster. As a result, Raster is consolidated in our financial statements as of December 2, 2008, and is no longer included in other assets.
Please refer to Note 4—Goodwill and Long-Lived Asset Impairment of the Notes to Consolidated Financial Statements.
Fair Value of Financial Instruments
The carrying amounts of our financial instruments, including cash, cash equivalents, accounts receivable, restricted investments, accounts payable, and accrued liabilities, approximate their respective fair market values due to the short maturities of these financial instruments. The fair value of our available-for-sale securities, derivative instruments, and contingent acquisition-related liability are disclosed in Note 5—Investments and Fair Value Measurements of the Notes to Consolidated Financial Statements. In June 2008, we redeemed the outstanding balance of our 1.50% convertible senior debentures for $240.0 million.
Warranty
Our Fiery controller and Inkjet printer products are generally accompanied by a 12-month warranty from date of shipment, which covers both parts and labor. In accordance with ASC 450-30, Loss Contingencies, an accrual is
80
Table of Contents
Electronics For Imaging, Inc.
Notes to Consolidated Financial Statements—(Continued)
made when it is estimable and probable based upon historical experience. A provision for estimated future warranty work is recorded in cost of goods sold upon recognition of revenue and the resulting accrual is reviewed regularly and periodically adjusted to reflect changes in warranty estimates. Management must estimate potential inventory return rates and replacement or repair costs to evaluate the need for warranty reserves. Significant management judgments and estimates must be made and used in connection with establishing warranty reserves in each reporting period. Material differences may result in changes in the amount and timing of our income for any period, if management made different judgments or utilized different estimates. Warranty reserves were $9.2 and $6.8 million as of December 31, 2010 and 2009, respectively.
Research and Development
We expense research and development costs associated with new software products as incurred until technological feasibility is established. Research and development costs include salaries and benefits of researchers, supplies, and other expenses incurred from research and development efforts. To date, we have not capitalized research and development costs associated with software development as products and enhancements have generally reached technological feasibility and have been released for sale at substantially the same time.
Revenue Recognition
We derive our revenue primarily from product revenue, which includes hardware (controllers, design-licensed solutions including upgrades, inkjet printers including components replaced under maintenance agreements, and ink), software licensing and development, and royalties. We also receive service revenue from software license maintenance agreements, customer support, training, and consulting. As described below, significant management judgments and estimates must be made and used in connection with the revenue recognized in any accounting period. Material differences could result in the amount and timing of revenue for any period if our management made different judgments or utilized different estimates.
We recognize revenue in accordance with the provisions of SEC Staff Accounting Bulletin 104 “Revenue Recognition” (“SAB 104”) and when applicable, ASC 605-25, Revenue Recognition—Multiple-Element Arrangements, for the sale of controllers, printers, and ink. As such, revenue is generally recognized when persuasive evidence of an arrangement exists, the product has been delivered or services have been rendered, the fee is fixed or determinable, and collection of the resulting receivable is reasonably assured.
Products generally must be shipped against written purchase orders. We use either a binding purchase order or signed contract as evidence of an arrangement. Sales to some of our OEM customers are evidenced by a master agreement governing the relationship together with a binding purchase order. Sales to our resellers are also evidenced by binding purchase orders or signed contracts and do not generally contain rights of return or price protection. Our arrangements generally do not include product acceptance clauses. When acceptance is required, revenue is recognized when the product is accepted by the customer.
Delivery for hardware generally is complete when title and risk of loss is transferred at point of shipment from manufacturing facilities, or when the product is delivered to the customer’s local common carrier. We also sell products and services using sales arrangements with terms resulting in different timing for revenue recognition as follows:
| • | if the title and/or risk of loss is transferred at a location other than our manufacturing facility, revenue is recognized when title and/or risk of loss transfers to the customer, per the terms of the agreement; |
| • | if title is retained until payment is received, revenue is recognized when title is passed upon receipt of payment; |
81
Table of Contents
Electronics For Imaging, Inc.
Notes to Consolidated Financial Statements—(Continued)
| • | if payment is contingent upon installation, the revenue related to the portion of the payment for installation is deferred until installation is complete; |
| • | if the sales arrangement is classified as an operating lease, revenue is recognized ratably over the lease term; or |
| • | if the sales arrangement is a fixed price for performance extending over a long period and our right to receive future payment depends on our future performance in accordance with these agreements, revenue is recognized under the percentage of completion method. |
We assess whether the fee is fixed or determinable based on the terms of the contract or purchase order. We assess collection based on a number of factors, including past transaction history with the customer and the creditworthiness of the customer. We may not request collateral from our customers. If we determine that collection of a fee is not reasonably assured, we defer the fee and recognize revenue at the time collection becomes reasonably assured, which is generally upon receipt of cash.
We license our software primarily under perpetual licenses. Revenue from software consists of software licensing, post-contract customer support, and professional consulting. We apply the provisions of ASC 985-605, Software—Revenue Recognition, and if applicable, SAB 104 and ASC 605-25, Revenue Recognition—Multiple-Element Arrangements, to all transactions involving the sale of software products and hardware transactions where the software is not incidental.
When several elements, including software licenses, post-contract customer support, and professional services, are sold to a customer through a single contract, the revenue from such multiple-element arrangements are allocated to each element using the residual method in accordance with ASC 985-605. Revenue is allocated to the support elements and professional service elements of an agreement using vendor specific objective evidence (“VSOE”) of fair value and to the software license portion of the agreements using the residual method. We have established VSOE of the fair value of our professional services based on the rates charged to our customers in stand-alone orders. We have also established VSOE of fair value for post-contract customer support based on substantive renewal rates. Accordingly, software license fees are recognized under the residual method for arrangements in which the software is licensed with maintenance and/or professional services, and where the maintenance and professional services are not essential to the functionality of the delivered software. Revenue allocated to software licenses is recognized when the following four basic criteria are met: persuasive evidence of an arrangement exists, delivery has occurred, the price is fixed or determinable, and collectability is probable. Revenue allocated to post-contract support is recognized ratably over the term of the support contract assuming the four basic criteria are met. We also have subscription arrangements where the customer pays a fixed fee and receives services over a period of time. We recognize revenue from the subscriptions ratably over the service period. Any up front setup fees associated with our subscription arrangements are recognized ratably, generally over one year.
We previously followed the completed contract method for revenue recognition on long-term contracts involving substantial customization. During the quarter ended September 30, 2010, we developed the ability to produce estimates sufficiently dependable to require adoption of the percentage of completion method with respect to certain fixed price contracts.
Revenue on certain fixed price contracts where we provide information technology system development and implementation services is recognized over the contract term based on the percentage of development and implementation services that are provided during the period compared with the total estimated development and implementation services to be provided over the entire contract using guidance from ASC 605-35, Revenue
82
Table of Contents
Electronics For Imaging, Inc.
Notes to Consolidated Financial Statements—(Continued)
Recognition—Construction-Type and Production—Type Contracts. These services require that we perform significant, extensive, and complex design, development, modification, or implementation activities of our customers’ systems. Performance will often extend over long periods, and our right to receive future payment depends on our future performance in accordance with these agreements.
The percentage of completion method involves recognizing probable and reasonably estimable revenue using the percentage of services completed, on a current cumulative cost to estimated total cost basis, using a reasonably consistent profit margin over the period. Due to the long-term nature of these projects, developing the estimates of costs often requires significant judgment. Factors that must be considered in estimating the progress of work completed and ultimate cost of the projects include, but are not limited to, the availability of labor and labor productivity, the nature and complexity of the work to be performed, and the impact of delayed performance. If changes occur in delivery, productivity, or other factors used in developing the estimates of costs or revenue, we revise our cost and revenue estimates, which may result in increases or decreases in revenue and costs, and such revisions are reflected in income in the period in which the facts that give rise to that revision become known.
We recognize losses on long-term fixed price contracts in the period that the contractual loss becomes probable and estimable. We record amounts invoiced to customers in excess of revenue recognized as deferred revenue until the revenue recognition criteria are met. We record revenue that is earned and recognized in excess of amounts invoiced on fixed price contracts as trade receivables.
Shipping and Handling Costs
Amounts billed to customers for shipping and handling costs are included in net sales. Shipping and handling costs are charged to cost of sales as incurred.
Advertising
Advertising costs are expensed as incurred. Total advertising and promotional expenses were $5.2, $3.7, and $4.9 million for the years ended December 31, 2010, 2009, and 2008, respectively.
Income Taxes
We account for income taxes under the provisions of ASC 740, Income Taxes, which requires that deferred tax liabilities and deferred tax assets be determined based on the differences between the financial statement and tax bases of assets and liabilities, using enacted tax rates in effect for the year in which the differences are expected to reverse. We estimate our actual current tax expense and the temporary differences resulting from differing treatment of items, such as deferred revenue, for tax and financial accounting purposes. These differences result in deferred tax assets and liabilities, which are included within our consolidated balance sheet. We must then assess the likelihood that our deferred tax assets will be recovered from future taxable income. If we believe that recovery of these deferred assets is not likely, we must establish a valuation allowance. To the extent we either establish or increase a valuation allowance in a period, we include an expense within the tax provision in the statement of operations.
In accordance with ASC 740-10-25-5 through 17, we account for uncertainty in income taxes by recognizing a tax position only when it is more likely than not that the tax position, based on its technical merits, will be sustained upon ultimate settlement with the applicable tax authority. The tax benefit to be recognized is the largest amount of tax benefit that is greater than fifty percent likely of being realized upon ultimate settlement with the applicable tax authority that has full knowledge of all relevant information.
83
Table of Contents
Electronics For Imaging, Inc.
Notes to Consolidated Financial Statements—(Continued)
Business Combinations
We allocate the purchase price of acquired companies to the tangible and intangible assets acquired, including IPR&D, and liabilities assumed based on their estimated fair values. Such a valuation requires management to make significant estimates and assumptions, especially with respect to intangible assets. All acquisitions are included in our financial statements from the date of acquisition.
In December 2007, ASC 805, Business Combinations, retained the fundamental requirement that the acquisition method of accounting be used for all business combinations with the following changes: an acquirer records 100% of assets and liabilities of the acquired business, including goodwill, at fair value, regardless of the level of interest acquired; certain contingent assets and liabilities are recognized at fair value at the acquisition date; contingent consideration is recognized at fair value at the acquisition date with changes in fair value recognized in earnings as assumptions are updated or upon settlement; IPR&D is recognized at fair value at the acquisition date subject to amortization after product launch or otherwise subject to impairment; acquisition-related transaction and restructuring costs are expensed as incurred; reversals of valuation allowances related to acquired deferred tax assets and liabilities and changes to acquired income tax uncertainties are recognized in earnings; and when making adjustments to finalize preliminary accounting, acquirers revise any previously issued post-acquisition financial information in future financial statements to reflect any adjustments as if they occurred on the acquisition date. ASC 805 applies prospectively to business combinations for which the acquisition date is on or after January 1, 2009. Accordingly, ASC 805 was applied to the accounting for the Radius acquisition.
On July 2, 2010, we acquired Radius to establish our presence in the packaging industry. On December 2, 2008, we acquired Raster, a mid-market, wide format graphics printer developer and manufacturer, to further expand our Inkjet line of products. On July 28, 2008, we acquired Pace to strengthen our APPS operating segment. The Radius, Raster, and Pace acquisitions are discussed in Note 2—Acquisitions in the Notes to Consolidated Financial Statements.
Stock-Based Compensation
We adopted the fair value recognition provisions of ASC 718 using the modified prospective transition method. Under this transition method, stock-based compensation expense in 2010, 2009, and 2008 includes compensation expense for all stock-based payment awards granted prior to, but not yet vested, as of January 1, 2006 based on the grant date fair value estimated in accordance with the original provisions of ASC 718 prior to amendment. Stock-based compensation expense for all stock-based payment awards granted after January 1, 2006 is based on the grant date fair value estimated in accordance with the provisions of ASC 718. We recognize these compensation costs using the graded vesting method over the requisite service period, after assessing the probability of achieving requisite performance criteria with respect to performance-based awards. Stock-based compensation expense is recognized over the requisite service period for each separately vesting tranche as though each award were, in substance, multiple awards.
ASC 718 requires forfeitures to be estimated at the time of grant and revised on a cumulative basis, if necessary, in subsequent periods if actual forfeitures differ from those estimates. We use historical data and future expectations of employee turnover to estimate forfeitures. The tax benefit resulting from tax deductions in excess of the tax benefits related to stock-based compensation expense recognized for those awards are classified as financing cash flows.
Our determination of the fair value of stock-based payment awards on the date of grant using an option pricing model is affected by various assumptions including volatility, expected term, and interest rates. Expected volatility is based on the historical volatility of our stock over a preceding period commensurate with the
84
Table of Contents
Electronics For Imaging, Inc.
Notes to Consolidated Financial Statements—(Continued)
expected term of the option. The expected term is based upon management’s consideration of the historical life of the options, the vesting period of the options granted, and the contractual period of the options granted. The risk-free interest rate for the expected term of the option is based on the U.S. Treasury yield curve in effect at the time of grant. Expected dividend yield was not considered in the option pricing formula since we do not pay dividends and have no current plans to do so in the future.
We adopted the alternative transition method for calculating the tax effects of stock-based compensation expense pursuant to ASC 718. The alternative transition method includes a simplified method to establish the beginning balance of the APIC pool related to the tax effects of employee stock-based compensation expense, which is available to absorb tax deficiencies recognized subsequent to the adoption of ASC 718. Tax shortfalls resulting from the tax effects of employee stock-based compensation absorbed the remaining balance of the APIC pool in 2008.
Foreign Currency Translation
In preparing our consolidated financial statements, we must remeasure and translate balance sheet and income statement items into U.S. dollars. Foreign currency assets and liabilities are remeasured from the transaction currency into the functional currency at current exchange rates, except for non-monetary assets and capital accounts, which are remeasured at historical exchange rates. Revenue and expenses are remeasured at monthly exchange rates, which approximate average exchange rates in effect during each period. Gains or losses from foreign currency remeasurement are included in other income (expense), net. Net gains or losses resulting from foreign currency transactions, including hedging gains and losses, are reported in other income (expense), net, and were a gain (loss) of $(3.4), $0.2, and $(2.9) million for the years ended December 31, 2010, 2009, and 2008, respectively.
For those subsidiaries that operate in a local currency functional environment, all assets and liabilities are translated into U.S. dollars using current exchange rates and all revenue and expenses are translated using monthly exchange rates, which approximate the average exchange rates in effect during each period. Resulting translation adjustments are reported as a separate component of OCI in stockholders’ equity. The cumulative translation adjustment balance at December 31, 2010 was an unrealized gain of $2.7 million.
Based on our assessment of the salient economic indicators discussed in ASC 830-10-55-5, Foreign Currency Matters, we consider the U.S. dollar to be the functional currency for each of our international subsidiaries except for our German subsidiary, EFI GmbH, for which we consider the Euro to be the subsidiary’s functional currency, our Japanese subsidiary, Electronics For Imaging Japan KK, for which we consider the Japanese Yen to be the subsidiary’s functional currency, and our U.K. subsidiary, Electrons For Imaging United Kingdom Limited, for which we consider the British pound sterling to be the subsidiary’s functional currency.
Computation of Net Income (Loss) per Common Share
Net income (loss) per basic common share is computed using the weighted average number of common shares outstanding during the period, excluding non-vested restricted stock. Net income (loss) per diluted common share is computed using the weighted average number of common shares and dilutive potential common shares outstanding during the period. Potential common shares result from the assumed exercise of outstanding common stock options having a dilutive effect using the treasury stock method, from non-vested shares of restricted stock having a dilutive effect, from shares to be purchased under the ESPP having a dilutive effect, from non-vested restricted stock for which the performance criteria have been met, and from the conversion of our 1.50% convertible senior debentures (“Debentures”) prior to redemption on June 2, 2008. In computing the dilutive effect of the Debentures, the numerator is adjusted to add back the after-tax amount of interest and amortized
85
Table of Contents
Electronics For Imaging, Inc.
Notes to Consolidated Financial Statements—(Continued)
debt issuance costs recognized in the period associated with the Debentures. Any potential shares that are anti-dilutive as defined in ASC 260, Earnings per Share, are excluded from the effect of dilutive securities.
ASC 260-10-45-48, Earnings per Share, requires that performance-based RSUs that would be issuable if the end of the reporting period were the end of the vesting period, if the result would be dilutive, are assumed to be outstanding for purposes of determining net income (loss) per diluted common share as of the later of the beginning of the period or the grant date. Accordingly, performance-based RSUs, which vest on March 2, 2011 based on achievement of specified performance criteria related to 2010 revenue and non-GAAP operating income targets, and performance-based RSAs, which vest on March 15, 2011 based on achievement of a specified percentage of the 2010 operating plan, are included in the determination of net income (loss) per diluted common share as of December 31, 2010. Performance-based and market-based targets were not met with respect to any other stock options or RSUs as of December 31, 2010.
The following table presents a reconciliation of basic and diluted earnings per share for the three years ended December 31, 2010 (in thousands, except per share amounts):
| For the years ended December 31, | ||||||||||||
| 2010 | 2009 | 2008 | ||||||||||
| Basic net income (loss) per share: |
||||||||||||
| Net income (loss) available to common shareholders |
$ | 7,487 | $ | (2,171 | ) | $ | (113,444 | ) | ||||
| Weighted average common shares outstanding |
45,387 | 49,682 | 52,553 | |||||||||
| Basic net income (loss) per share |
$ | 0.16 | $ | (0.04 | ) | $ | (2.16 | ) | ||||
| Dilutive net income (loss) per share: |
||||||||||||
| Net income (loss) available to common shareholders |
$ | 7,487 | $ | (2,171 | ) | $ | (113,444 | ) | ||||
| Weighted average common shares outstanding |
45,387 | 49,682 | 52,553 | |||||||||
| Dilutive stock options and non-vested restricted stock |
1,409 | — | — | |||||||||
| Performance-based RSUs |
356 | — | — | |||||||||
| Weighted average common shares outstanding for purposes of computing diluted net income (loss) per share |
47,152 | 49,682 | 52,553 | |||||||||
| Dilutive net income (loss) per share |
$ | 0.16 | $ | (0.04 | ) | $ | (2.16 | ) | ||||
The following table sets forth potential shares of common stock that are not included in the determination of diluted net income (loss) per share because to do so would be anti-dilutive for the periods presented, excluding any performance-based or market-based stock options or RSUs for which the performance criteria were not met as December 31, 2010, 2009, or 2008 (in thousands):
| For the years ended December 31, |
||||||||||||
| 2010 | 2009 | 2008 | ||||||||||
| Stock options, non-vested restricted stock, and ESPP shares |
2,281 | 5,547 | 7,801 | |||||||||
| Convertible senior debentures |
— | — | 3,783 | |||||||||
| Total potential shares of common stock excluded from the computation of diluted earnings per share |
2,281 | 5,547 | 11,584 | |||||||||
86
Table of Contents
Electronics For Imaging, Inc.
Notes to Consolidated Financial Statements—(Continued)
Effective for periods beginning after December 15, 2008, ASC 260-10-45 to 65 requires use of the two-class method to calculate earnings per share when non-vested RSAs are eligible to receive dividends (i.e., participating securities), even if we do not intend to declare dividends. The two-class method is not applicable to 2009 and 2008 when net losses were incurred as non-vested restricted stockholders do not “participate” in net losses. There were only 101 thousand weighted average non-vested restricted stock awards eligible to receive dividends for the year ended December, 2010; consequently, the impact on net income per diluted common share in applying the two-class method for the year ended December 31, 2010 was not material.
Accounting for Derivative Instruments and Risk Management
We are exposed to market risk and foreign currency exchange risk from changes in foreign currency exchange rates, which could affect operating results, financial position, and cash flows. We manage our exposure to these risks through our regular operating and financing activities and, when appropriate, through the use of derivative financial instruments. These derivative financial instruments are used to hedge economic exposures as well as to reduce earnings and cash flow volatility resulting from shifts in market rates. Our objective is to offset gains and losses resulting from these exposures with losses and gains on the derivative contracts used to hedge them, thereby reducing volatility of earnings or protecting fair values of assets and liabilities. We do not have any leveraged derivatives, nor do we use derivative contracts for speculative purposes. ASC 815, Derivatives and Hedging, requires the fair value of all derivative instruments, including those embedded in other contracts, to be recorded as assets or liabilities in our consolidated balance sheet. As permitted, foreign exchange contracts with notional amounts of $2.5 and $1.4 million and net asset/liability fair values that are immaterial have been designated for hedge accounting treatment at December 31, 2010 and 2009, respectively. The related cash flow impacts of our derivative contracts are reflected as cash flows from operating activities.
Our primary exposures are related to non-U.S. dollar-denominated sales in Europe, Japan, and the U.K. and operating expenses in Europe, India, Japan, and the U.K. During the fourth quarter of 2009, we began hedging our operating expense exposure in Indian rupees. As of December 31, 2010, we had not entered into hedges against any other currency exposures, but as these exposures grow we may consider hedging against currency movements in other currencies, as well as adjusting the hedged portion of our Indian rupee exposure.
By their nature, derivative instruments involve, to varying degrees, elements of market and credit risk. The market risk associated with these instruments resulting from currency exchange movement is expected to offset the market risk of the underlying transactions, assets, and liabilities being hedged (e.g., operating expense exposure in Indian rupees). We do not believe there is a significant risk of loss from non-performance by the counterparties associated with these instruments because these transactions are executed with a diversified group of major financial institutions. Further, by policy we deal with counterparties having a minimum investment grade or better credit rating. Credit risk is managed through the continuous monitoring of exposures to such counterparties.
Foreign currency derivative contracts with notional amounts of $2.5 and $1.4 million have been designated as cash flow hedges of our Indian rupee operating expense exposure. The changes in fair value of these contracts are reported as a component of OCI and reclassified to operating expense in the periods of payment of the hedged operating expenses. The amount of ineffectiveness that was recorded in the consolidated statement of operations for these designated cash flow hedges was immaterial. All components of each derivative’s gain or loss were included in the assessment of hedge effectiveness. As of December 31, 2010, the net asset/liability fair value of these contracts was immaterial.
87
Table of Contents
Electronics For Imaging, Inc.
Notes to Consolidated Financial Statements—(Continued)
Variable Interest Entities
The FASB amended the Variable Interest Entities (“VIE”) sub-section of ASC 810, Consolidation, effective January 2010. This sub-section of ASC 810 changes how a reporting entity evaluates whether an entity is considered the primary beneficiary of a VIE and is therefore required to consolidate the VIE. ASC 810 requires formal assessment at each reporting period regarding which party within the VIE is considered the primary beneficiary and requires a number of new disclosures related to VIE’s. A qualitative approach is required for identifying the primary beneficiary of a VIE based on the power to direct activities that most significantly impact the economic performance of the entity and the obligation to absorb losses or right to receive benefits that could be significant to us. The adoption of ASC 810 did not have a material impact on our financial condition or results of operations.
Recent Accounting Pronouncements
In July 2009, the FASB issued ASC 105-10, Generally Accepted Accounting Principles (“ASC 105-10”). ASC 105-10 establishes the exclusive authoritative reference for U.S. GAAP in financial statements, except for SEC rules and regulations, which are also authoritative U.S. GAAP for SEC registrants. The ASC supersedes all existing non-SEC accounting and reporting standards. We have included the references to the ASC, as appropriate, in the Notes to Consolidated Financial Statements.
In April 2009, the FASB issued three related staff positions, which modify ASC 820, Fair Value Measurements and Disclosures, by providing additional application guidance and enhancing disclosures regarding fair value measurements and impairments of securities.
| • | ASC 820-10-35, Fair Value Measurements and Disclosures—Subsequent Measurement, was amended to provide guidance on determining fair value when there is no active market or when the price inputs being used represent distressed sales and expands required disclosures of major security types. |
| • | ASC 825-10-50, Financial Instruments—Disclosure, was amended to require disclosure of the methods and significant assumptions used to estimate the fair value of financial instruments and ASC 270, Interim Reporting, was amended to require disclosures about the fair value of financial instruments for which it is practicable to estimate fair value, whether or not recognized in our financial statements, for interim as well as annual reporting. |
| • | ASC 320, Investments—Debt and Equity Securities, was amended to provide operational guidance on determining other-than-temporary impairments of debt securities and expand disclosure requirements. Other-than-temporary impairments of debt securities must be allocated between credit and non-credit components with the non-credit portion recognized as a component of OCI and the credit portion included in net income (loss). A cumulative effect adjustment to the opening balance of retained earnings and OCI is required in the period of adoption for other-than-temporary impairments of debt securities recognized in prior periods, which are still held as investments at the date of adoption. |
These amendments were adopted beginning in the second quarter of 2009. As a result of ASC 320-10-65-1, Transition Related to FASB Staff Position FAS 115-2 and FAS 124-2, Recognition and Presentation of Other-Than-Temporary Impairments, we recorded a cumulative effect adjustment of $0.1 million to retained earnings at the date of adoption.
In January 2010, the FASB issued Accounting Standards Update (“ASU”) 2010-06, Improving Disclosures about Fair Value Measurements, which amends ASC 820 to add two new disclosures: (1) transfers in and out of Level 1 and 2 measurements and the reasons for the transfers, and (2) gross presentation of activity within the Level 3 rollforward. ASU 2010-06 also includes clarifications to existing disclosure requirements on the level of
88
Table of Contents
Electronics For Imaging, Inc.
Notes to Consolidated Financial Statements—(Continued)
disaggregation and disclosures regarding inputs and valuation techniques. ASU 2010-06 became effective in the first quarter of 2010, except for the gross presentation of the Level 3 rollforward, which is not effective until the first quarter of 2011. The appropriate disclosures have been included in the accompanying condensed consolidated financial statements.
In September 2009, the FASB ratified Emerging Issues Task Force (“EITF”) consensuses reflected in ASU 2009-13, Multiple-Deliverable Revenue Arrangements (ASC 605), and ASU 2009-14, Certain Revenue Arrangements That Include Software Elements (ASC 985). These consensuses shall be applied on a prospective basis for revenue arrangements entered into or materially modified in fiscal years beginning after June 15, 2010 with earlier application permitted. ASU 2009-13 eliminates the residual method of allocation in multiple deliverable arrangements. When applying the relative selling price method, the selling price for each deliverable shall be determined using VSOE, if it exists. Otherwise, third party evidence of the selling price (“TPE”) shall be used. If neither VSOE nor TPE exists for a deliverable, then the best estimate of the selling price for that deliverable shall be used when applying the relative selling price method. ASU 2009-14 determined that tangible products containing software and non-software components that function together to deliver the product’s essential functionality are not required to follow the software revenue recognition guidance in ASC 985, Software Revenue Recognition, as long as the hardware components of the tangible product substantively contribute to its functionality. In addition, hardware components of a tangible product containing software components shall always be excluded from the guidance in ASC 985. We are currently evaluating the impact of these consensuses on our financial condition and results of operations.
Supplemental Cash Flow Information
| Years ended December 31, | ||||||||||||
| (in thousands) |
2010 | 2009 | 2008 | |||||||||
| Supplemental disclosure of cash flow information: |
||||||||||||
| Cash paid for interest expense |
$ | 43 | $ | 4 | $ | 1,837 | ||||||
| Cash paid for income taxes, net of refunds received |
$ | 4,128 | $ | 3,171 | $ | 8,303 | ||||||
| Acquisition related activities: |
||||||||||||
| Cash paid for acquisitions |
$ | 16,747 | $ | — | $ | 25,405 | ||||||
| Cash acquired in acquisitions |
(299 | ) | — | (122 | ) | |||||||
| Net cash paid for acquisitions |
$ | 16,448 | $ | — | $ | 25,283 | ||||||
Note 2: Acquisitions
Radius was acquired in 2010, while Raster and Pace were acquired in 2008. These acquisitions have been accounted for using the purchase method of accounting. Under purchase accounting, the consideration is allocated to the tangible and identifiable intangible assets acquired and liabilities assumed according to their respective fair values on the date of acquisition. Excess purchase consideration is recorded as goodwill. Factors contributing to a purchase price that results in goodwill include, but are not limited to, the retention of research and development personnel with skills to develop future technology, support personnel to provide maintenance services related to the products, a trained sales force capable of selling current and future products, the opportunity to cross-sell Radius, Rastek, Pace, and EFI products to existing customers, and the positive reputation that each of these companies have in the market.
89
Table of Contents
Electronics For Imaging, Inc.
Notes to Consolidated Financial Statements—(Continued)
Radius Solutions Incorporated
On July 2, 2010, we acquired a 100% interest in privately held Golflane, a U.K. private limited company, the parent holding company of Radius, for approximately $14.1 million, net of cash acquired, plus an additional future cash earnout contingent on achieving certain performance targets. Direct acquisition costs and restructuring charges were expensed in accordance with the new acquisition accounting guidance.
The fair value of the earnout was estimated to be $2.3 million by applying the income approach in accordance with ASC 805-30-25-5. The income approach is based on significant inputs that are not observable in the market, which ASC 820-10-35 refers to as Level 3 inputs. Key assumptions include a discount rate of 6.3% and probability-adjusted level Radius revenues. This contingent liability has been reflected in the consolidated balance sheet as a current liability of $1.7 million and a noncurrent liability of $0.6 million at the acquisition date. Earnout performance targets were achieved during the fourth quarter of 2010, which resulted in an increase in the fair value of the earnout by $0.4 million, which will also be paid in 2011. In accordance with ASC 805-30-35-1, changes in the fair value of contingent consideration subsequent to the acquisition date have been recognized in general and administrative expense. The potential undiscounted amount of all future contingent consideration cash payments that we could be required to make, beyond amounts currently accrued, is between $0 and $1.5 million as of December 31, 2010.
We acquired Radius to establish our presence in the packaging industry. The acquisition was accounted for as a purchase business combination. In accordance with ASC 805, the purchase price has been allocated to the tangible and identifiable intangible assets acquired and liabilities assumed on the basis of their estimated fair values on the date of acquisition based on valuations performed by a third party. We engaged a third party valuation firm to aid management in its analysis of the fair value of Radius. All estimates, key assumptions, and forecasts were either provided by or reviewed by us. While we chose to utilize a third party valuation firm, the fair value analysis and related valuations represent the conclusions of management and not the conclusions or statements of any third party. The purchase price allocation is subject to change within the measurement period as valuations are finalized. The primary areas of the preliminary purchase price allocations that are not yet finalized relate to the fair values of certain tangible assets acquired and liabilities assumed. We expect to continue to obtain information to assist us in determining the fair value of the net assets acquired at the acquisition date during the measurement period. Measurement period adjustments determined to be material will be applied retrospectively to the acquisition date in our consolidated financial statements and, depending on the nature of the adjustments, our operating results subsequent to the acquisition period could be affected.
The initial preliminary purchase price allocation was adjusted during the fourth quarter to reflect a $0.9 and $0.6 million increase to goodwill and deferred tax assets, respectively, offset by a corresponding decrease to customer relationships. This adjustment was recorded as an adjustment to the opening balance sheet resulting in a credit to intangible amortization expense of $0.2 million.
Pro forma results of operations for the Radius acquisition have not been presented because they are not material to our consolidated results of operations. Goodwill, which represents the excess of the purchase price over the net tangible and intangible assets acquired, is not deductible for tax purposes.
Raster Printers, Inc.
On December 2, 2008, we acquired the remaining interest in Raster for approximately $5.3 million, including direct acquisition costs plus an additional cash earnout, which was contingent upon achieving certain performance targets. The earnout period expired December 31, 2010 with no additional consideration earned. Adjustments to the purchase price allocation during 2009 were $0.6 million. Headquartered in San Jose, California, Raster sells UV wide format printers primarily to mid-range customers in the display graphics market.
90
Table of Contents
Electronics For Imaging, Inc.
Notes to Consolidated Financial Statements—(Continued)
Pace Systems Group, Inc.
On July 28, 2008, we purchased a 100% interest in Pace for approximately $20.1 million, net of cash acquired, including direct acquisition costs, plus an additional cash earnout amount, which is contingent upon achieving certain performance targets. The second earnout period ended December 31, 2010 with additional consideration earned of approximately $2.9 million, resulting in cumulative additional cash earnouts of $5.3 million, which have been accounted for as an adjustment to the purchase price. The potential undiscounted amount of all future contingent consideration cash payments that we could be required to make, beyond amounts currently accrued, is between $0 and $0.6 million as of December 31, 2010. In addition, the purchase price allocation was adjusted by $2.2 million during 2009 related to deferred taxes. Headquartered in Jacksonville, Florida, Pace is a print management software company that provides PMIS and e-commerce software solutions.
Valuation Methodology
Intangible assets acquired consist of existing technology, IPR&D, patents, trademarks and trade names, and customer relationships. Since all R&D efforts are in a deployment mode, there is no IPR&D related to the Radius acquisition. IPR&D would have been capitalized as an intangible asset in accordance with the new acquisition accounting guidance that became effective in 2009. We charged $0.7 million of IPR&D related to our acquisition of Raster and $2.0 million of IPR&D related to our acquisition of Pace to operating expenses at the acquisition date because technological feasibility had not been established and no future alternative uses existed.
The value of Raster and Pace IPR&D was determined by estimating the costs to develop the purchased IPR&D into a commercially viable product, estimating the resulting net cash flows from the sale of the products resulting from the completion of the IPR&D, and discounting the net cash flows back to their present value. Project completion schedules were based on management’s estimate of tasks completed and the tasks to be completed to bring the projects to technical and commercial feasibility.
| Raster | Pace | |||||||
| Discount rate for IPR&D |
17-18 | % | 24 | % | ||||
| Percentage of completion for in-process projects acquired |
64-81 | % | 23-83 | % | ||||
IPR&D on future acquisitions will be recognized at fair value at the acquisition date subject to amortization after product launch or otherwise subject to impairment.
The following table summarizes the allocation of the purchase price to assets acquired and liabilities assumed (in thousands) with respect to each of these acquisitions:
| Radius | Raster | Pace | ||||||||||||||||||||||
| Weighted average useful life |
Allocation at December 31, 2010 |
Weighted average useful life |
Allocation at December 31, 2010 |
Weighted average useful life |
Allocation at December 31, 2010 |
|||||||||||||||||||
| In-process research & development |
$ | — | $ | 680 | $ | 2,000 | ||||||||||||||||||
| Existing technology |
5 years | 2,850 | 3 years | 1,340 | 5 years | 8,100 | ||||||||||||||||||
| Customer contracts, relationships, and maintenance agreements |
5 years | 3,101 | 5 years | 980 | 9 years | 4,600 | ||||||||||||||||||
| Trademarks and trade names |
6 years | 1,050 | 4 years | 650 | 6 years | 300 | ||||||||||||||||||
| Goodwill |
13,774 | 2,560 | 12,727 | |||||||||||||||||||||
| 20,775 | 6,210 | 27,727 | ||||||||||||||||||||||
| Excess of liabilities assumed over assets acquired |
(4,075 | ) | (188 | ) | (5,661 | ) | ||||||||||||||||||
| Total purchase price |
$ | 16,700 | $ | 6,022 | $ | 22,066 | ||||||||||||||||||
91
Table of Contents
Electronics For Imaging, Inc.
Notes to Consolidated Financial Statements—(Continued)
Radius has been integrated into the APPS operating segment. The U.S. operations of Radius were integrated into our U.S. operations and its U.K. entities were integrated into our U.K. operations. Radius U.K. generates revenue and incurs operating expenses in British pounds sterling. This resulted in a change in the functional currency of our EFI U.K. entity to the British pound sterling.
Note 3: Balance Sheet Components
Selected balance sheet components are as follows (in thousands):
| December 31, | ||||||||
| 2010 | 2009 | |||||||
| Inventories, net of allowances: |
||||||||
| Raw materials |
$ | 19,178 | $ | 26,238 | ||||
| Work in process |
5,826 | 3,070 | ||||||
| Finished goods |
21,212 | 19,478 | ||||||
| $ | 46,216 | $ | 48,786 | |||||
| Property and equipment, net: |
||||||||
| Land, buildings, and improvements |
$ | 20,955 | $ | 20,941 | ||||
| Equipment and purchased software |
52,398 | 50,268 | ||||||
| Furniture and leasehold improvements |
19,409 | 18,903 | ||||||
| 92,762 | 90,112 | |||||||
| Less accumulated depreciation and amortization |
(66,215 | ) | (61,883 | ) | ||||
| $ | 26,547 | $ | 28,229 | |||||
| Accrued and other liabilities: |
||||||||
| Accrued compensation and benefits |
$ | 17,632 | $ | 13,432 | ||||
| Warranty provision |
9,232 | 6,838 | ||||||
| Accrued royalty payments |
4,423 | 3,313 | ||||||
| Contingent liabilities |
5,070 | 2,000 | ||||||
| Other accrued liabilities |
9,373 | 10,278 | ||||||
| $ | 45,730 | $ | 35,861 | |||||
Note 4: Goodwill and Long-Lived Asset Impairment
Purchased Intangible Assets
Our purchased intangible assets associated with completed acquisitions for the years ended December 31, 2010 and 2009 are as follows:
| December 31, 2010 | December 31, 2009 | |||||||||||||||||||||||||||
| (in thousands) | Weighted average useful life |
Gross carrying amount |
Accumulated amortization |
Net carrying amount |
Gross carrying amount |
Accumulated amortization |
Net carrying amount |
|||||||||||||||||||||
| Goodwill |
$ | 139,517 | $ | — | $ | 139,517 | $ | 122,840 | $ | — | $ | 122,840 | ||||||||||||||||
| Existing technology |
4.6 | $ | 113,076 | $ | (105,365 | ) | $ | 7,711 | $ | 110,302 | $ | (103,450 | ) | $ | 6,852 | |||||||||||||
| Patents, trademarks, and trade names |
14.5 | 51,555 | (20,432 | ) | 31,123 | 50,485 | (17,732 | ) | 32,753 | |||||||||||||||||||
| Other intangible assets |
6.0 | 66,769 | (56,463 | ) | 10,306 | 63,835 | (48,991 | ) | 14,844 | |||||||||||||||||||
| Amortizable intangible assets |
7.2 | $ | 231,400 | $ | (182,260 | ) | $ | 49,140 | $ | 224,622 | $ | (170,173 | ) | $ | 54,449 | |||||||||||||
92
Table of Contents
Electronics For Imaging, Inc.
Notes to Consolidated Financial Statements—(Continued)
Acquired existing technology, patents, trademarks, trade names, and other intangible assets are amortized over their estimated useful lives of 2 to 18 years using the straight-line method, which approximates the pattern in which the economic benefits of the intangible assets are realized. Aggregate amortization expense was $12.4, $18.5, $29.4 million for the years ended December 31, 2010, 2009, and 2008, respectively. As of December 31, 2010 future estimated amortization expense each of the next five years and thereafter related to amortizable intangible assets is estimated to be (in thousands):
| For the periods: |
Future amortization expense |
|||
| 2011 |
$ | 9,648 | ||
| 2012 |
6,961 | |||
| 2013 |
5,707 | |||
| 2014 |
4,561 | |||
| Thereafter |
22,263 | |||
| $ | 49,140 | |||
Goodwill Rollforward
The goodwill rollforward is presented for the years ended December 31, 2010 and 2009 as required by ASC 805 (in thousands).
| Fiery | Inkjet | APPS | Total | |||||||||||||
| Ending Balance, December 31, 2008 |
$ | 53,250 | $ | 36,125 | $ | 33,206 | $ | 122,581 | ||||||||
| Additions |
— | 580 | 2,000 | 2,580 | ||||||||||||
| Adjustments to deferred tax assets / liabilities in accordance with ASC 805-740-25, Business Combinations—Income Taxes—Recognition |
— | — | (2,231 | ) | (2,231 | ) | ||||||||||
| Foreign currency adjustments |
— | — | 107 | 107 | ||||||||||||
| Other |
— | (197 | )(1) | — | (197 | ) | ||||||||||
| Ending Balance, December 31, 2009 |
$ | 53,250 | $ | 36,508 | $ | 33,082 | $ | 122,840 | ||||||||
| Additions |
— | — | $ | 16,173 | 16,173 | |||||||||||
| Radius opening balance sheet adjustment |
— | — | 943 | 943 | ||||||||||||
| Reclassification of Proofing Business from APPS to Fiery |
6,228 | — | (6,228 | ) | — | |||||||||||
| Foreign currency adjustments |
528 | — | (967 | ) | (439 | ) | ||||||||||
| Ending Balance, December 31, 2010 |
$ | 60,006 | $ | 36,508 | $ | 43,003 | $ | 139,517 | ||||||||
| Accumulated Impairment, December 31, 2010 |
$ | — | $ | — | (103,991 | ) | (103,991 | ) | ||||||||
| (1) | R&D credits impacting taxes payable. |
Goodwill previously reported in the APPS operating segment for the years ended December 31, 2009 and 2008 has been revised to conform to the year ended December 31, 2010 presentation, reflecting the reclassification of proofing software from the APPS to the Fiery operating segment. Total goodwill for the years ended December 31, 2009 and 2008 has not changed.
93
Table of Contents
Electronics For Imaging, Inc.
Notes to Consolidated Financial Statements—(Continued)
Goodwill additions result from the Radius acquisition and Pace contingent consideration. The Pace acquisition closed prior to the effective date of ASC 805. Consequently, Pace contingent consideration is accounted for as an adjustment to the purchase price.
The initial preliminary allocation of the Radius purchase price was adjusted during the fourth quarter of 2010 to reflect a $0.9 and $0.6 million increase to goodwill and deferred tax assets, respectively, offset by a corresponding decrease to customer relationships. This adjustment was recorded as an adjustment to the opening balance sheet resulting in a credit to intangible amortization expense of $0.2 million.
Based on the outcome of conditions existing during the fourth quarter of 2008, we determined that a triggering event requiring an interim impairment analysis had occurred relating to the Inkjet reporting unit. The resulting impairment analysis resulted in a non-cash goodwill impairment charge of $104 million during the fourth quarter of 2008. The goodwill valuation analysis was performed based on our respective reporting units—Fiery, Inkjet, and APPS—which are consistent with our operating segments identified in Note 15—Segment Information, Geographic Data, and Major Customers of the Notes to Consolidated Financial Statements.
Goodwill Assessment
During the fourth quarter of 2009, we changed our annual goodwill impairment testing date from September 30 to December 31 of each year. This change was made to better align impairment testing procedures with year-end financial reporting and the annual business planning and budgeting process, which commences during the fourth quarter of each year. As a result, goodwill impairment testing now reflects the result of input from business and other operating personnel in the development of the budget. Accordingly, management considered this accounting change to be preferable. This change did not accelerate, delay, avoid, or cause an impairment charge, nor did this change result in adjustments to previously issued financial statements.
We perform our annual goodwill impairment analysis in the fourth quarter of each year according to the provisions of ASC 350-20-35, Goodwill—Intangibles and Other—Subsequent Measurement. A two-step impairment test of goodwill is required. In the first step, the fair value of each reporting unit is compared to its carrying value. If the fair value exceeds carrying value, goodwill is not impaired and further testing is not required. If the carrying value exceeds fair value, then the second step of the impairment test is required to determine the implied fair value of the reporting unit’s goodwill. The implied fair value of goodwill is calculated by deducting the fair value of all tangible and intangible net assets of the reporting unit, excluding goodwill, from the fair value of the reporting unit as determined in the first step. If the carrying value of the reporting unit’s goodwill exceeds its implied fair value, then an impairment loss must be recorded equal to the difference.
Based on the outcome of conditions existing during the fourth quarter of 2008, we determined that a triggering event requiring an interim impairment analysis had occurred relating to the Inkjet reporting unit. The resulting impairment analysis resulted in a non-cash goodwill impairment charge of $104 million during the fourth quarter of 2008. The goodwill valuation analysis was performed based on our respective reporting units—Fiery, Inkjet, and APPS—which are consistent with our operating segments identified in Note 15—Segment Information, Geographic Data, and Major Customers of the Notes to Consolidated Financial Statements.
We determined the fair value of the Inkjet and APPS reporting units as of December 31, 2010 by equally weighting the market and income approaches. The fair value of the Fiery reporting unit was determined based on the market approach. Under the market approach, we estimated fair value based on market multiples of revenue or earnings of comparable companies. Under the income approach, we measured fair value of the Inkjet and APPS reporting units based on a projected cash flow method using a discount rate determined by our management to be commensurate with the risk inherent in our current business model.
94
Table of Contents
Electronics For Imaging, Inc.
Notes to Consolidated Financial Statements—(Continued)
To identify suitable comparable companies under the market approach, consideration was given to the financial condition and operating performance of the reporting unit being evaluated relative to companies operating in the same or similar businesses, potentially subject to corresponding economic, environmental, and political factors and considered to be reasonable investment alternatives. Consideration was given to the investment characteristics of the subject company relative to those of similar publicly traded companies (i.e., guideline companies). Guideline company stocks are actively traded. In applying the Public Company Market Multiple Method (“PCMMM”), valuation multiples were derived from historical and projected operating data of guideline companies and applied to the appropriate operating data of our reporting units to arrive at an indication of fair value. Five, four, and seven suitable guideline companies were identified for the Fiery, Inkjet, and APPS reporting units, respectively. Based on our valuation results, we have determined that the fair values of our reporting units exceed their carrying values. Fiery, Inkjet, and APPS fair values are $226, $192, and $67 million, respectively, which exceed carrying value by 124%, 34%, and 26%, respectively.
Because the fair value of the Fiery reporting unit significantly exceeded its carrying value as of December 31, 2010 as indicated by the market-based valuation, management did not deem it necessary to further supplement the bases for this judgment. While the fair value of the Inkjet and APPS reporting units exceeded their carrying values based on the market-based valuation, management determined to further examine whether an impairment had occurred given the Inkjet impairment recognized in the fourth quarter of 2008 and the relatively small excess of the fair value of the APPS reporting unit over its carrying value. We reviewed the factors that could trigger an impairment charge and completed an income-based impairment analysis. As part of this process, we engaged a third party valuation firm to aid management in its analysis. All estimates, key assumptions, and forecasts were either provided by or reviewed by us. While we chose to utilize a third party valuation firm, the impairment analysis and related valuations represent the conclusions of management and not the conclusions or statements of any third party.
Solely for purposes of establishing inputs for the income approach to assess the fair value of the Inkjet and APPS reporting units, we made the following assumptions:
| • | Despite improved Inkjet performance in 2010, resulting from an improving economic climate in 2010 and new product introductions beginning in 2009 and continuing in 2010, Inkjet revenues remained below 2008 results. |
| • | APPS revenue in 2010 exceeded 2008 revenue due to improved APPS performance resulting from the Radius acquisition and continued strong performance from the Pace acquisition. |
| • | Inkjet revenue will exceed 2008 revenue levels in 2011. |
| • | Achieving a normalized long-term growth model between 2011 and 2015. |
| • | Long-term industry growth past 2015. |
Our discounted cash flow projections for the Inkjet and APPS reporting units were based on six-year financial forecasts, which were based on annual financial forecasts developed internally by management for use in managing our business and through discussions with the independent valuation firm engaged by us. The significant assumptions utilized in these six-year forecasts included annual revenue growth rates ranging from 5% to 18%, which equates to compound annual growth rates of 8% and 10% for the Inkjet and APPS reporting units, respectively. Future cash flows were discounted to present value using a mid-year convention and a discount rate of 15%. Terminal values were calculated using the Gordon growth methodology with a long-term growth rate of 4.5%. The sum of the fair values of the Fiery, Inkjet, and APPS reporting units was reconciled to our current market capitalization (based on our stock price) plus an estimated control premium. Significant assumptions used in determining fair values of the reporting units include the determination of appropriate market comparables, estimated multiples of revenue and EBITDA that a willing buyer is likely to pay, estimated
95
Table of Contents
Electronics For Imaging, Inc.
Notes to Consolidated Financial Statements—(Continued)
control premium a willing buyer is likely to pay, gross profit, and operating expenses. Inkjet gross profit is assumed to increase as fixed production costs are absorbed by increasing Inkjet volumes, while APPS gross profit is assumed to remain consistent during the forecast horizon. Gross profit and operating expenses as a percentage of revenue over the six-year forecast horizon are assumed to approximate percentages realized by the guideline companies.
To assess the reasonableness of the estimated control premium of 16%, we examined the most similar transactions in relevant industries and determined the average premium indicated by the transactions deemed to be most similar to a hypothetical transaction involving our reporting units. We examined the weighted average and median control premiums offered in these industries, industry specific control premiums, and specific transaction control premiums to conclude that our estimated control premium is reasonable.
We assess the impairment of identifiable intangibles and long-lived assets whenever events or changes in circumstances indicate the carrying value may not be recoverable or the life of the asset may need to be revised. Factors considered important that could trigger an impairment review include:
| • | significant negative industry or economic trends, |
| • | significant decline in our stock price for a sustained period, |
| • | our market capitalization relative to net book value, |
| • | significant changes in the manner of our use of the acquired assets, |
| • | significant changes in the strategy for our overall business, and |
| • | our assessment of growth and profitability in each reporting unit over the coming years. |
Given the uncertainty of the economic environment and the potential impact on our business, there can be no assurance that our estimates and assumptions regarding the duration of the ongoing economic downturn, or the period or strength of recovery, made for purposes of our goodwill impairment testing at December 31, 2010 will prove to be accurate predictions of the future. If our assumptions regarding forecasted revenue or gross profit rates are not achieved, we may be required to record additional goodwill impairment charges in future periods relating to any of our reporting units, whether in connection with the next annual impairment testing in the fourth quarter of 2011 or prior to that, if any such change constitutes an interim triggering event. It is not possible to determine if any such future impairment charge would result or, if it does, whether such charge would be material.
Long-Lived Assets
Other investments, included within other assets, consist of equity and debt investments in privately-held companies that develop products, markets, and services that are strategic to us. In-substance common stock investments in which we exercise significant influence over operating and financial policies, but do not have a majority voting interest, are accounted for using the equity method of accounting. Investments not meeting these requirements are accounted for using the cost method of accounting.
The process of assessing whether a particular equity or debt investment’s fair value is less than its carrying cost requires a significant amount of judgment due to the lack of a mature and stable public market for these securities. In making this judgment, we carefully consider the investee’s most recent financial results, cash position, recent cash flow data, projected cash flows (both short and long-term), financing needs, recent financing rounds, most recent valuation data, the current investing environment, management or ownership changes, and competition. This analysis is based primarily on information that we request and receive from these
96
Table of Contents
Electronics For Imaging, Inc.
Notes to Consolidated Financial Statements—(Continued)
privately-held companies and is performed on a quarterly basis. Although we evaluate all of our privately-held equity and debt investments for impairment based on this criteria, each investment’s fair value is only estimated when events or changes in circumstances have occurred that may have a significant effect on its fair value (because the fair value of each investment is not readily determinable). Where these factors indicate that the equity investment’s fair value is less than its carrying cost, and where we consider such diminution in value to be other than temporary, we record an impairment charge to reduce such equity investment to its estimated fair value.
During the fourth quarter of 2008, we assessed each remaining investment’s technology pipeline and market conditions in the industry for the next several years and determined it is no longer probable that they will generate enough positive future cash flows to recover the full carrying amount of the investment. As such, we recognized an impairment charge of $6.1 million.
Our investments accounted for using the equity method of accounting totaled $0.3 million as of December 31, 2009 and 2008. Our consolidated results of operations for the years ended December 31, 2009 and 2008 include, as a component of other income (expense), net, our share of the net losses of equity method investees of $1.4, and $0.9 million, respectively.
During the second quarter of 2010, we further assessed each remaining investment’s ability to sustain an earnings capacity that would justify the carrying amount of the investment in accordance with ASC 323-10-35-32. Based on this assessment, we impaired the remaining carrying value of these investments of $0.3 million.
We recognized long-lived asset impairment charges of $0.7, $3.2, and $1.8 million for the years ended December 31, 2010, 2009, and 2008, respectively, consisting primarily of project abandonment costs related to equipment charges in the Inkjet operating segment, assets impaired related to an Inkjet facility closure, certain Inkjet printer equipment, and the impairment of our remaining equity method investees.
On December 2, 2008, we acquired the remaining interest of Raster. As a result, Raster is consolidated in our financial statements as of December 2, 2008, and is no longer included in other assets.
Note 5: Investments and Fair Value Measurements
Fixed income debt securities are classified as available-for-sale and carried at fair value, which is determined based on quoted market prices. Net unrealized gains and losses are included in OCI, net of tax, except for the credit portion of any other-than-temporary impairment, which is included in net income (loss).
We review investments in debt securities for other-than-temporary impairment whenever the fair value is less than the amortized cost and evidence indicates the investment’s carrying amount is not recoverable within a reasonable period of time. To determine whether an impairment is other-than-temporary, we consider whether we have the intent to sell the impaired security or if it will be more likely than not that we will be required to sell the impaired security before a market price recovery and whether evidence indicating the cost of the investment is recoverable outweighs evidence to the contrary. We have determined that gross unrealized losses on short-term investments at December 31, 2010 are temporary in nature because each investment meets our investment policy and credit quality requirements. We have the ability and intent to hold these investments until they recover their unrealized losses, which may not occur until maturity. Evidence that we will recover our investments outweighs evidence to the contrary.
97
Table of Contents
Electronics For Imaging, Inc.
Notes to Consolidated Financial Statements—(Continued)
Our available-for-sale securities as of December 31, 2010 and 2009 are as follows (in thousands):
| Amortized cost |
Gross unrealized gains |
Gross unrealized losses |
Fair value |
|||||||||||||
| U.S. Government securities and sponsored entities |
$ | 26,635 | $ | 89 | $ | (11 | ) | $ | 26,713 | |||||||
| Corporate debt securities |
64,825 | 300 | (51 | ) | 65,074 | |||||||||||
| Mortgage-backed securities—residential |
11,451 | 80 | (18 | ) | 11,513 | |||||||||||
| Total short-term investments |
$ | 102,911 | $ | 469 | $ | (80 | ) | $ | 103,300 | |||||||
| U.S. Government securities and sponsored entities |
$ | 17,716 | $ | 8 | $ | (18 | ) | $ | 17,706 | |||||||
| Foreign Government securities |
3,400 | — | — | 3,400 | ||||||||||||
| Corporate debt securities |
61,466 | 444 | (28 | ) | 61,882 | |||||||||||
| Mortgage-backed securities—residential |
14,030 | 184 | (30 | ) | 14,184 | |||||||||||
| Money market funds(1) |
962 | — | — | 962 | ||||||||||||
| Total short-term investments |
$ | 97,574 | $ | 636 | $ | (76 | ) | $ | 98,134 | |||||||
| (1) | Money market funds of $1.0 million at December 31, 2009, net of reserves, represented funds in The Reserve Primary Fund (“Fund”) reclassified from cash and cash equivalents as the Fund had adopted a plan of liquidation. As a result, the Fund’s shares were not tradable at December 31, 2009. Our interest in the Fund was $14.8 million prior to their adoption of the liquidation plan. As of December 31, 2010, we have received $14.6 million in liquidation of our interest in the Fund, net of reserves, which has been invested in alternative money market funds, all of which are highly liquid and currently tradable at $1.00 Net Asset Value. We have no remaining exposure relative to the Fund. |
The fair value and duration that investments have been in a gross unrealized loss position as of December 31, 2010 and 2009 are as follows (in thousands):
| Less than 12 Months | More than 12 Months | TOTAL | ||||||||||||||||||||||
| Fair Value |
Unrealized Losses |
Fair Value |
Unrealized Losses |
Fair Value |
Unrealized Losses |
|||||||||||||||||||
| U.S. Government securities and sponsored entities |
$ | 8,839 | $ | (11 | ) | $ | — | $ | — | $ | 8,839 | $ | (11 | ) | ||||||||||
| Corporate debt securities |
17,964 | (51 | ) | — | — | 17,964 | (51 | ) | ||||||||||||||||
| Mortgage-backed securities—residential |
3,127 | (16 | ) | 72 | (2 | ) | 3,199 | (18 | ) | |||||||||||||||
| Total |
$ | 29,930 | $ | (78 | ) | $ | 72 | $ | (2 | ) | $ | 30,002 | $ | (80 | ) | |||||||||
| U.S. Government securities and sponsored entities |
$ | 6,840 | $ | (18 | ) | $ | — | $ | — | $ | 6,840 | $ | (18 | ) | ||||||||||
| Corporate debt securities |
5,323 | (28 | ) | — | — | 5,323 | (28 | ) | ||||||||||||||||
| Mortgage-backed securities—residential |
3,070 | (30 | ) | — | — | 3,070 | (30 | ) | ||||||||||||||||
| Total |
$ | 15,233 | $ | (76 | ) | $ | — | $ | — | $ | 15,233 | $ | (76 | ) | ||||||||||
For fixed income securities that have unrealized losses as of December 31, 2010, we have determined that we do not have the intent to sell any of these investments and it is not more likely than not that it will be required to sell any of these investments before recovery of the entire amortized cost basis. In addition, we have evaluated these fixed income securities and determined that no credit losses exist. Accordingly, management has determined that the unrealized losses on our fixed income securities as of December 31, 2010 were temporary in nature.
98
Table of Contents
Electronics For Imaging, Inc.
Notes to Consolidated Financial Statements—(Continued)
Amortized cost and estimated fair value of investments at December 31, 2010 is summarized by maturity date as follows (in thousands):
| Amortized cost | Fair value | |||||||
| Mature in less than one year |
$ | 63,385 | $ | 63,603 | ||||
| Mature in one to three years |
39,526 | 39,697 | ||||||
| Total short-term investments |
$ | 102,911 | $ | 103,300 | ||||
For the year ended December 31, 2010, $0.4 million was recognized in net realized gains, which was comprised of $0.6 million in realized gains from sale of investments, partially offset by $0.2 million in realized losses. For the year ended December 31, 2009, $0.6 million was recognized in net realized gains, which was comprised of $0.9 million in realized gains from sale of investments, partially offset by $0.3 million in realized losses, which included $0.2 million of credit-related impairment charges on two corporate debt instruments. For the year ended December 31, 2008, $3.9 million was recognized in net realized gains, which was comprised of $5.3 million in realized gains from sale of investments, partially offset by $1.4 million in realized losses, which included $0.6 million of credit-related impairment charges related to the Fund and one corporate debt instrument. As of December 31, 2010 and 2009, net unrealized gains of $0.4 and $0.6 million, respectively, were included in OCI in the accompanying consolidated balance sheets.
Fair Value Measurements
ASC 820 identifies fair value as the exchange price, or exit price, representing the amount that would be received to sell an asset or paid to transfer a liability in an orderly transaction between market participants. As a basis for considering market participant assumptions in fair value measurements, ASC 820 establishes a three-tier fair value hierarchy as follows:
Level 1: Inputs that are quoted prices in active markets for identical assets or liabilities that the reporting entity has the ability to access at the measurement date;
Level 2: Inputs that are other than quoted prices included within Level 1, that are either directly or indirectly observable for the asset or liability through correlation with market data at the measurement date for the duration of the instrument’s anticipated life or by comparison to similar instruments; and
Level 3: Inputs that are unobservable or inputs that reflect management’s best estimate of what market participants would use in pricing the asset or liability at the measurement date. These include management’s own judgments about market participant assumptions developed based on the best information available in the circumstances.
We utilize the market approach to measure fair value of our fixed income securities. The “market approach” is a valuation technique that uses prices and other relevant information generated by market transactions involving identical or comparable assets or liabilities. The fair value of our fixed income securities are obtained using readily-available market prices from a variety of industry standard data providers, large financial institutions, and other third-party sources for the identical underlying securities. The fair value of our investments in certain money market funds is expected to maintain a Net Asset Value of $1 per share and, as such, is priced at the expected market price.
99
Table of Contents
Electronics For Imaging, Inc.
Notes to Consolidated Financial Statements—(Continued)
Our investments have been presented in accordance with the fair value hierarchy specified in ASC 820 as of December 31, 2010 and 2009 as follows (in thousands):
| Quoted Prices in Active Markets for Identical Assets (Level 1) |
Significant other Observable Inputs (Level 2) |
Unobservable Inputs (Level 3) |
||||||||||||||
| Assets: |
||||||||||||||||
| U.S. Government securities and sponsored entities |
$ | 26,713 | $ | 4,778 | $ | 21,935 | $ | — | ||||||||
| Foreign Government securities |
2,500 | — | 2,500 | — | ||||||||||||
| Corporate debt securities |
69,272 | — | 69,223 | 49 | ||||||||||||
| Mortgage-backed securities—residential |
11,513 | — | 11,513 | — | ||||||||||||
| Money market funds |
73,864 | 73,864 | — | — | ||||||||||||
| $ | 183,862 | $ | 78,642 | $ | 105,171 | $ | 49 | |||||||||
| Liabilities: |
||||||||||||||||
| Liability for contingent consideration, current and noncurrent |
$ | 2,744 | $ | — | $ | — | $ | 2,744 | ||||||||
| Assets: |
||||||||||||||||
| U.S. Government securities and sponsored entities |
$ | 17,706 | $ | 3,700 | $ | 14,006 | $ | — | ||||||||
| Foreign Government securities |
3,400 | — | 3,400 | — | ||||||||||||
| Corporate debt securities |
61,882 | — | 61,800 | 82 | ||||||||||||
| Mortgage-backed securities—residential |
14,184 | — | 14,184 | — | ||||||||||||
| Money market funds |
68,446 | 67,484 | — | 962 | ||||||||||||
| $ | 165,618 | $ | 71,184 | $ | 93,390 | $ | 1,044 | |||||||||
Included in money market funds is $73.9 and $67.5 million, which have been classified as cash equivalents as of December 31, 2010 and 2009, respectively. Included in foreign government and corporate debt securities is $2.5 and $4.2 million, respectively, which have been classified as cash equivalents as of December 31, 2010.
Investments are generally classified within Level 1 or Level 2 of the fair value hierarchy because they are valued using quoted market prices or alternative pricing sources with reasonable levels of price transparency. Investments in overnight money market mutual funds have been classified as Level 1 because these securities are valued based upon quoted prices in active markets or they are actively traded at $1.00 Net Asset Value. There have been no transfers between Level 1 and 2 during the years ended December 31, 2010 and 2009.
Government agency investments and corporate debt instruments, including investments in asset-backed and mortgage-backed securities, have generally been classified as Level 2 because markets for these securities are less active or valuations for such securities utilize significant inputs, which are directly or indirectly observable.
At December 31, 2010 and 2009, one corporate debt instrument has been classified as Level 3 due to its significantly low level of trading activity. The portion of money market funds, which had been classified as Level 3 at December 31, 2009, consisted of funds placed in the Fund of $1.0 million, which were repaid after year-end.
100
Table of Contents
Electronics For Imaging, Inc.
Notes to Consolidated Financial Statements—(Continued)
The following table presents a rollforward of assets measured at fair value on a recurring basis using significant unobservable inputs (Level 3) (in thousands):
| Corporate Debt Securities |
Money Market Funds |
|||||||
| Balance at December 31, 2008 |
$ | 199 | $ | 2,900 | ||||
| Included in other income (expense), net |
(87 | ) | — | |||||
| Included in OCI |
(6 | ) | — | |||||
| Purchases, sales, and maturities |
(24 | ) | (1,938 | ) | ||||
| Balance at December 31, 2009 |
$ | 82 | $ | 962 | ||||
| Included in other income (expense), net |
(10 | ) | 33 | |||||
| Included in OCI |
(5 | ) | — | |||||
| Purchases, sales, and maturities |
(18 | ) | (995 | ) | ||||
| Balance at December 31, 2010 |
$ | 49 | $ | — | ||||
| Impairment charges for the year ended December 31, 2009 in other income, net, attributable to assets still held at December 31, 2009 |
$ | — | $ | — | ||||
| Impairment charges for the year ended December 31, 2010 in other income, net, attributable to assets still held at December 31, 2010 |
$ | — | $ | — | ||||
Investments that we own could suffer declines in fair value and become other-than-temporarily impaired. We continuously assess the fair value of individual securities as part of our ongoing portfolio management. Our other-than-temporary assessment includes reviewing the length of time and extent to which fair value has been less than amortized cost, the seniority and durations of the securities, adverse conditions related to a security, industry, or sector, historical and projected issuer financial performance, credit ratings, issuer specific news, and other available relevant information. Based on this analysis, we identified one Level 3 security that was other-than-temporarily impaired at December 31, 2008. As a result of our adoption of ASC 320-10-65-1 effective in the second quarter of 2009, we recorded a cumulative effect adjustment of $0.1 million to reduce retained earnings and the cost of the previously identified security. As of December 31, 2009, two Level 2 securities were identified as being other-than-temporarily impaired, resulting in an impairment loss of $0.2 million, which was recognized in other income (expense), net. There were no other-than-temporary impairments, including credit-related impairments, during the year ended December 31, 2010.
In determining whether a credit loss existed, we used our best estimate of the present value of cash flows expected to be collected from each debt security. For asset-backed and mortgage-backed securities, cash flow estimates including prepayment assumptions were based on data from widely accepted third party data sources or internal estimates. In addition to prepayment assumptions, cash flow estimates vary based on assumptions regarding the underlying collateral including default rates, recoveries, and changes in value. Expected cash flows were discounted using the effective interest rate implicit in the securities.
Liability for Contingent Consideration
Level 3 liabilities consist of the acquisition-related current and noncurrent liabilities for contingent consideration related to the Radius acquisition. The fair value of the earnout was estimated to be $2.7 million by applying the income approach in accordance with ASC 805-30-25-5. That measure is based on significant inputs that are not observable in the market, which ASC 820-10-35 refers to as Level 3 inputs. Key assumptions include a discount rate of 6.3% and a probability-adjusted level of Radius revenue. This contingent liability has been reflected in the consolidated balance sheet as a current liability of $2.1 million and a noncurrent liability of $0.6 million. Earnout
101
Table of Contents
Electronics For Imaging, Inc.
Notes to Consolidated Financial Statements—(Continued)
performance targets were achieved during the fourth quarter of 2010, which resulted in an increase in the fair value of the earnout of $0.4 million, which will be paid in 2011. In accordance with ASC 805-30-35-1, changes in the fair value of contingent consideration subsequent to the acquisition date have been recognized in general and administrative expense.
| Liability for Contingent Consideration December 31, 2010 |
||||
| Fair value at July 2, 2010 |
$ | 2,350 | ||
| Changes in valuation |
394 | |||
| Less: payments |
— | |||
| Fair value at December 31, 2010 |
$ | 2,744 | ||
The following table presents the change in accumulated other-than-temporary credit-related impairments charged to retained earnings and other income (expense), net:
| Impairments Charged to Retained Earnings |
Impairments Recognized in Other Income (Expense), Net |
TOTAL | ||||||||||
| Accumulated impairments, net attributable to assets still held at December 31, 2010, as of December 31, 2008 |
$ | — | $ | 640 | $ | 640 | ||||||
| Impairments recognized in other income (expense), net |
— | 217 | 217 | |||||||||
| Cumulative effect adjustment upon adoption of ASC 320-10-65-1 as of April 1, 2009 |
58 | — | 58 | |||||||||
| Accumulated impairments at December 31, 2009, net attributable to assets still held at December 31, 2010 |
$ | 58 | $ | 857 | $ | 915 | ||||||
| Impairments recognized in other income (expense), net |
— | — | — | |||||||||
| Accumulated impairments at December 31, 2010 |
58 | 857 | 915 | |||||||||
No other-than-temporary impairments have been recognized related to factors that are not credit-related.
Effective January 1, 2009, we adopted the provisions of ASC 820 regarding nonfinancial assets and liabilities that are recognized or disclosed at fair value in the condensed consolidated financial statements on a nonrecurring basis. The adoption of these provisions did not materially impact our financial position or results of operations.
We utilize the income approach to measure the fair value of our derivative assets and liabilities. The income approach uses pricing models that rely on market observable inputs such as yield curves, currency exchange rates, and forward prices, and are therefore classified as Level 2 measurements. The fair value of our derivative assets and liabilities having notional amounts of $2.5 and $1.4 million at December 31, 2010 and 2009, respectively, was not material.
Note 6: Convertible Debt
On June 4, 2003, we sold $240 million of 1.50% Debentures in a private placement, which are unsecured senior obligations, paying interest semi-annually in arrears at an annual rate of 1.50%.
On June 2, 2008, we redeemed the outstanding balance of the Debentures at our option, which totaled $240 million and was 100% of the principal amount. Interest paid during the second quarter of 2008 totaled $1.8 million, which consisted of accrued and unpaid interest payments between December 1, 2007 and June 2, 2008.
102
Table of Contents
Electronics For Imaging, Inc.
Notes to Consolidated Financial Statements—(Continued)
Note 7: Accumulated Other Comprehensive Income (“OCI”)
Other comprehensive income (loss), which includes net income (loss), market valuation adjustments on available for sale investments, net of tax, currency translation adjustments, and net deferral of losses on derivative instruments consists of the following (in thousands):
| Years ended December 31, | ||||||||||||
| 2010 | 2009 | 2008 | ||||||||||
| Net income (loss) |
$ | 7,487 | $ | (2,171 | ) | $ | (113,444 | ) | ||||
| Change in market valuation of investments, net of tax |
(100 | ) | 718 | (1,601 | ) | |||||||
| Change in currency translation adjustments |
727 | (59 | ) | (295 | ) | |||||||
| Other |
(18 | ) | (47 | ) | — | |||||||
| Comprehensive income (loss) |
$ | 8,096 | $ | (1,559 | ) | $ | (115,340 | ) | ||||
The activity in accumulated other comprehensive income and related tax effects are as follows (in thousands):
| Years ended December 31, | ||||||||||||
| 2010 | 2009 | 2008 | ||||||||||
| Net unrealized investment gains (losses): |
||||||||||||
| Unrealized holding gains, net of tax provision of $(0.2), $(0.8), and $(1.0) million in 2010, 2009, and 2008, respectively |
$ | 257 | $ | 1,169 | $ | 1,532 | ||||||
| Reclassification adjustment for losses included in net income (loss), net of tax benefit of $0.2, $0.3, and $2.1 million in 2010, 2009, and 2008, respectively |
(357 | ) | (451 | ) | (3,133 | ) | ||||||
| Net unrealized investment gains (losses) |
(100 | ) | 718 | (1,601 | ) | |||||||
| Currency translation adjustments |
727 | (59 | ) | (295 | ) | |||||||
| Other |
(18 | ) | 11 | — | ||||||||
| Other comprehensive income/(loss) |
$ | 609 | $ | 670 | $ | (1,896 | ) | |||||
The components of accumulated other comprehensive income was (in thousands):
| December 31, | ||||||||
| 2010 | 2009 | |||||||
| Net unrealized investment gains |
$ | 234 | $ | 334 | ||||
| Currency translation gains |
2,728 | 2,001 | ||||||
| Other |
(7 | ) | 11 | |||||
| Accumulated other comprehensive income |
$ | 2,955 | $ | 2,346 | ||||
Note 8: Commitments and Contingencies
Contingent Consideration
We are liable to make payments to former Radius stockholders based on the achievement of specified performance targets related to the acquisition of Radius. The fair value of the earnout was estimated to be $2.7 million by applying the income approach in accordance with ASC 805-30-25-5. That measure is based on significant inputs that are not observable in the market, which ASC 820-10-35 refers to as Level 3 inputs. Key assumptions include a discount rate of 6.3% and probability-adjusted Radius revenues. This contingent liability has been reflected in the consolidated balance sheet as a current liability of $2.1 million and a noncurrent liability
103
Table of Contents
Electronics For Imaging, Inc.
Notes to Consolidated Financial Statements—(Continued)
of $0.6 million. The potential undiscounted amount of all future contingent consideration cash payments that we could be required to make, beyond amounts currently accrued, is between $0 and $1.5 million as of December 31, 2010.
Off-Balance Sheet Financing—Synthetic Lease Arrangement
As of December 31, 2008 we were a party to two synthetic leases (the “301 Lease” and the “303 Lease”, together “Leases”) covering our Foster City facilities located at 301 and 303 Velocity Way, Foster City, California. The Leases provided a cost effective means of providing adequate office space for our corporate offices. The Leases included an option to purchase the facilities during or at the end of the each Lease term for the amount expended by the lessor to purchase the facilities. The funds pledged under the Leases ($56.9 million for the 303 Lease and $31.7 million for the 301 Lease at December 31, 2008) were in LIBOR-based interest bearing accounts and restricted as to withdrawal at all times.
On January 29, 2009, we sold the 163,000 square foot 301 Velocity Way building, along with approximately 30 acres of land and certain other assets related to the property for $137.3 million. We retained ownership of the approximately 295,000 square foot building at 303 Velocity Way that we currently occupy along with the related land. We exercised our purchase option with respect to the 301 Lease in connection with the sale of the building and land and terminated the corresponding synthetic lease. Accordingly, the $31.7 million of pledged funds were recognized in the determination of the gain on sale of building and land in the Consolidated Statement of Operations for the year ended December 31, 2009.
We have guaranteed to the lessor a residual value associated with the building equal to 82% of their funding of the 303 Lease. Under the financial covenants, we must maintain a minimum net worth and a minimum tangible net worth as of the end of each quarter. There is an additional covenant regarding mergers. We were in compliance with all such financial and merger-related covenants as of December 31, 2010. We have assessed our exposure in relation to the first loss guarantee under the 303 Lease and have determined there is no deficiency to the guaranteed value at December 31, 2010. If there is a decline in value, we will record a loss associated with the residual value guarantee. In conjunction with the 303 Lease, we have entered into a separate ground lease with the lessor for approximately 30 years. As of December 31, 2010, we were treated as the owner of this building for federal income tax purposes. Since we exercised our purchase option with respect to the 301 Lease, our maximum exposure under our remaining synthetic lease arrangement is $56.9 million as of December 31, 2010.
We lease office facilities in various locations in the U.S. and overseas. Future minimum lease payments under non-cancellable operating leases for each of the next five years and thereafter as of December 31, 2010 is as follows (in thousands):
| Fiscal Year |
Future Minimum Lease Payments |
Future Minimum Sublease Receipts |
||||||
| 2011 |
$ | 6,004 | $ | 651 | ||||
| 2012 |
4,986 | 1,070 | ||||||
| 2013 |
3,864 | 1,102 | ||||||
| 2014 |
2,640 | 1,135 | ||||||
| 2015 |
1,246 | 1,169 | ||||||
| Thereafter |
267 | 297 | ||||||
| Total |
$ | 19,007 | $ | 5,424 | ||||
104
Table of Contents
Electronics For Imaging, Inc.
Notes to Consolidated Financial Statements—(Continued)
Lease obligation related to the principal corporate facility is estimated based on current market interest rates (LIBOR) and collateralized assumptions. Future minimum sublease income results from an agreement with Gilead to lease 30,889 square feet in our 303 Velocity Way facility. This agreement was entered into subsequent to year-end.
Rent expense was approximately $6.9, $6.7, and $9.9 million for the years ended December 31, 2010, 2009, and 2008, respectively. Sublease rental income was approximately $0.1, $0.3, and $2.5 million for the years ended December 31, 2010, 2009, and 2008, respectively. The decrease in rent expense and sublease income in 2009 compared to 2008 is due to the sale of the building to Gilead and the closure or partial closure of twelve facilities, partially offset by increased rent in 2010 due to increased India square footage.
Purchase Commitments
We subcontract with other companies to manufacture our products. During the normal course of business, our subcontractors procure components based on orders placed by us. If we cancel all or part of our orders, we may still be liable to the subcontractors for the cost of the components purchased by the subcontractors to manufacture our products. We periodically review the potential liability compared to the adequacy of the related allowance. Our consolidated financial position and results of operations could be negatively impacted if we were required to compensate the subcontract manufacturers for amounts in excess of the related reserve.
Guarantees and Product Warranties
Under ASC 460, we are required to disclose guarantees upon issuance and recognize a liability for the fair value of obligations we assume under such guarantees.
Our Fiery controller and Inkjet printer products are generally accompanied by a 12-month warranty from date of shipment, which covers both parts and labor. In accordance with ASC 450-30, Loss Contingencies, an accrual is made when the warranty liability is estimable and probable based upon historical experience. A provision for estimated future warranty work is recorded in cost of goods sold upon recognition of revenue and the resulting accrual is reviewed regularly and periodically adjusted to reflect changes in warranty estimates.
Product warranty reserve activities for the years ended December 31, 2010 and 2009 were as follows (in thousands):
| Balance at December 31, 2008 |
$ | 6,791 | ||
| Additions |
7,665 | |||
| Settlements |
(7,618 | ) | ||
| Balance at December 31, 2009 |
6,838 | |||
| Additions |
14,136 | |||
| Settlements |
(11,742 | ) | ||
| Balance at December 31, 2010 |
$ | 9,232 | ||
The synthetic lease agreement for our corporate headquarters provides a residual value guarantee. Under ASC 460, Guarantees, the fair value of a residual value guarantee in lease agreements entered into after December 31, 2002 must be recognized as a liability in our consolidated balance sheet. We have determined that the guarantee has no material value as of December 31, 2010.
105
Table of Contents
Electronics For Imaging, Inc.
Notes to Consolidated Financial Statements—(Continued)
In the normal course of business and in an effort to facilitate the sales of our products, we sometimes indemnify other parties, including customers, lessors, and parties to other transactions with us. Typically, our indemnity provisions provide that we agree to hold the other party harmless against losses arising from a breach of representations and warranties or covenants and intellectual property infringement. Our indemnity provisions often limit the time within which an indemnification claim can be made as well as the amount of the claim which can be made. In addition, we have entered into indemnification agreements with our current and former officers and directors. Our amended and restated bylaws also contain similar indemnification obligations for our agents.
Legal Proceedings
We may be involved, from time to time, in a variety of claims, lawsuits, investigations, and proceedings relating to contractual disputes, securities laws, intellectual property rights, employment matters, and other litigation matters relating to various claims that arise in the normal course of business. We determine whether an estimated loss from a contingency should be accrued by assessing whether a loss is deemed probable and can be reasonably estimated. We assess our potential liability by analyzing specific litigation and regulatory matters using available information. We develop our views on estimated losses in consultation with inside and outside counsel, which involves a subjective analysis of potential results and outcomes, assuming various combinations of appropriate litigation and settlement strategies. Because of the uncertainties related to both the amount and ranges of possible loss from pending litigation matters, we are unable to predict with certainty the precise liability that could finally result from a range of possible unfavorable outcomes. Taking all of the above factors into account, we reserve an amount that we could reasonably expect to pay for the cases discussed. However, our estimates may be incorrect and we could pay more or less than our current accrual. Litigation can be costly, diverting management’s attention and could, upon resolution, have a material adverse effect on our business, results of operations, financial condition, and cash flow.
As of December 31, 2010, we were subject to the various claims, lawsuits, investigations, or proceedings discussed below, as well as certain other legal proceedings that have arisen in the ordinary course of business.
Durst Fototechnik Technology GmbH (“Durst”) v. Electronics for Imaging GmbH (“EFI GmbH”) and EFI, et al.:
On February 23, 2007, Durst brought an action to enforce a utility model registration patent right against EFI GmbH in the Mannheim District Court in Germany. On May 10, 2007, EFI GmbH filed its Statement of Defenses. These defenses include lack of jurisdiction, non-infringement, invalidity, and unenforceability based on Durst’s improper actions before the German patent office. EFI filed its Statement of Defense on August 29, 2007. EFI’s defenses include those for EFI GmbH, as well as an additional defense for prior use based on EFI’s own European patent rights. The Mannheim court conducted a trial on November 30, 2008, and, following a recess to receive additional expert testimony, finished the trial on August 28, 2009.
In a subsequent decision, the Manheim court invalidated Durst’s utility model registration patent and dismissed Durst’s actions against EFI on February 26, 2010. Durst has appealed the decision and the appeal is currently pending at the court of appeal in Karlsruhe, Germany.
N.V. Perfectproof Europe v. BEST GmbH
On December 31, 2001, N.V. Perfectproof Europe (“Perfectproof”) filed a complaint against BEST GmbH, currently Electronics for Imaging, GmbH (“BEST”) in the Tribunal de Commerce of Brussels, in Belgium (the
106
Table of Contents
Electronics For Imaging, Inc.
Notes to Consolidated Financial Statements—(Continued)
“Commercial Court”), alleging unlawful unilateral termination of an alleged “exclusive” distribution agreement and claiming damages of approximately EUR 599,946 for such termination and additional damages of EUR 247,894, or a total of approximately $1.1 million. In a judgment issued by the Commercial Court on June 24, 2002, the court declared that the distribution agreement was not “exclusive” and challenged its jurisdiction over the claim. Perfectproof appealed the judgment, and by decision dated November 30, 2004, the Court d’Appel of Brussels (the “Court of Appeal”) rejected the appeal and sent the case back to the Commercial Court. Subsequently, by judgment dated November 17, 2009, the Commercial Court dismissed the action for lack of jurisdiction of Belgian courts over the claim. On March 25, 2009, Pefectproof appealed to the Court of Appeal. On November 16, 2010, the Court of Appeal declared, among other things, that the Commercial Court was competent to hear the case and that the agreement between BEST and Perfectproof should be analyzed as an “exclusive” distribution agreement and as such, was subject to reasonable notice prior to termination. The court further determined that Perfectproof is entitled to damages, for lack of receiving such notice, and appointed an expert to determine the amount of damages within the court’s guidelines. While the determination of damages by the expert is in process, BEST intends to appeal the decision of the Court of Appeal to the Cour de cassation (the Supreme Court) of Brussels.
Although we do not believe that Perfectproof’s claims are founded and we do not believe it is probable that we will incur a loss in this matter, it is reasonably possible that cash flows or results of operations could be materially affected by the expert’s assessment of damages and the result of our appeal.
Note 9: Common Stock Repurchase Programs
In February 2009, our Board of Directors authorized the repurchase of $100 million of our outstanding common stock, including a $30 million accelerated stock repurchase (“ASR”), by utilizing a portion of the proceeds from the January 2009 sale of building and land. The purpose of the ASR was to combine the immediate share retirement benefits of a tender offer with the market impact and pricing benefits of a disciplined daily open market stock repurchase program.
On February 18, 2009, we entered into an agreement with UBS AG, London branch (“UBS”), to repurchase $30 million of our outstanding common stock under the ASR program. In March 2009, 2.8 million shares were delivered by UBS representing the minimum number of shares to be delivered under the ASR agreement. Upon the discretion of UBS, the ASR concluded in August 2009 with the delivery of 87 thousand shares. We are not obligated to issue or transfer any shares to UBS or make any payment to UBS beyond the $30 million payment made in the first quarter of 2009. Transaction costs of $0.1 million were incurred under the ASR.
In October 2009, our Board of Directors approved the repurchase of $70 million of our common stock through the use of a “modified Dutch auction” tender offer by utilizing the balance of the previously authorized $100 million share repurchase program. The tender offer closed on December 24, 2009 resulting in the repurchase of 5.5 million shares at a cost of $70.6 million, which included $0.6 million of direct transaction costs. All shares received from the ASR and the tender offer were recorded as additional treasury stock accounted for under the cost method, thereby reducing shares outstanding. Our buyback program is limited by SEC regulations and by compliance with our insider trading policy.
Our employees have the option to surrender shares of common stock to satisfy their tax withholding obligations that arise on the vesting of RSUs. Employees surrendered 243 and 74 thousand shares for an aggregate purchase price of $2.9 and $0.8 million for the years ended December 31, 2010 and 2009, respectively. These repurchased shares are recorded as treasury stock and are accounted for under the cost method. None of the shares of common stock that we have repurchased have been cancelled.
107
Table of Contents
Electronics For Imaging, Inc.
Notes to Consolidated Financial Statements—(Continued)
Note 10: Derivatives and Hedging
We are exposed to market risk and foreign currency exchange risk from changes in foreign currency exchange rates, which could affect operating results, financial position, and cash flows. We manage our exposure to these risks through our regular operating and financing activities and, when appropriate, through the use of derivative financial instruments. These derivative financial instruments are used to hedge economic exposures as well as to reduce earnings and cash flow volatility resulting from shifts in market rates. Our objective is to offset gains and losses resulting from these exposures with losses and gains on the derivative contracts used to hedge them, thereby reducing volatility of earnings or protecting fair values of assets and liabilities. We do not have any leveraged derivatives, nor do we use derivative contracts for speculative purposes. ASC 815, Derivatives and Hedging, requires the fair value of all derivative instruments, including those embedded in other contracts, to be recorded as assets or liabilities in our consolidated balance sheet. As permitted, foreign exchange contracts with notional amounts of $2.5 and $1.4 million and net asset/liability fair values that are immaterial have been designated for hedge accounting treatment at December 31, 2010 and 2009, respectively. The related cash flow impacts of our derivative contracts are reflected as cash flows from operating activities.
Our primary exposures are related to non-U.S. dollar-denominated sales in Europe, Japan, and the U.K. and operating expenses in Europe, India, Japan, and the U.K. During the fourth quarter of 2009, we began hedging our operating expense exposure in Indian rupees. As of December 31, 2010, we had not entered into hedges against any other currency exposures, but as these exposures grow we may consider hedging against currency movements in other currencies, as well as adjusting the hedged portion of our Indian rupee exposure.
By their nature, derivative instruments involve, to varying degrees, elements of market and credit risk. The market risk associated with these instruments resulting from currency exchange movement is expected to offset the market risk of the underlying transactions, assets, and liabilities being hedged (e.g., operating expense exposure in Indian rupees). We do not believe there is a significant risk of loss from non-performance by the counterparties associated with these instruments because these transactions are executed with a diversified group of major financial institutions. Further, by policy we deal with counterparties having a minimum investment grade or better credit rating. Credit risk is managed through the continuous monitoring of exposures to such counterparties.
Foreign currency derivative contracts with notional amounts of $2.5 and $1.4 million have been designated as cash flow hedges of our Indian rupee operating expense exposure. The changes in fair value of these contracts are reported as a component of OCI and re-classified to operating expenses in the periods of payment of the hedged operating expenses. The amount of ineffectiveness that was recorded in the consolidated statement of operations for these designated cash flow hedges was immaterial. All components of each derivative’s gain or loss were included in the assessment of hedge effectiveness. As of December 31, 2010 and 2009, the net asset/liability fair value of these contracts was immaterial.
Note 11: Income Taxes
The components of income from operations before income taxes are as follows (in thousands):
| Years ended December 31, | ||||||||||||
| 2010 | 2009 | 2008 | ||||||||||
| U.S. |
$ | (18,818 | ) | $ | 24,470 | $ | (153,597 | ) | ||||
| Foreign |
17,188 | (8,435 | ) | 20,521 | ||||||||
| Total |
$ | (1,630 | ) | $ | 16,035 | $ | (133,076 | ) | ||||
108
Table of Contents
Electronics For Imaging, Inc.
Notes to Consolidated Financial Statements—(Continued)
The provision (benefit) for income taxes is summarized as follows (in thousands):
| Years ended December 31, | ||||||||||||
| 2010 | 2009 | 2008 | ||||||||||
| Current: |
||||||||||||
| U.S. Federal |
$ | (6,819 | ) | $ | 7,049 | $ | 8,256 | |||||
| State |
136 | 2,395 | 825 | |||||||||
| Foreign |
1,755 | 1,956 | 5,099 | |||||||||
| Total current |
(4,928 | ) | 11,400 | 14,180 | ||||||||
| Deferred: |
||||||||||||
| U.S. Federal |
(2,384 | ) | 6,430 | (27,235 | ) | |||||||
| State |
(1,407 | ) | 456 | (6,465 | ) | |||||||
| Foreign |
(398 | ) | (80 | ) | (112 | ) | ||||||
| Total deferred |
(4,189 | ) | 6,806 | (33,812 | ) | |||||||
| Provision for (benefit from) income taxes |
$ | (9,117 | ) | $ | 18,206 | $ | (19,632 | ) | ||||
The tax effects of temporary differences that give rise to deferred tax assets (liabilities) are as follows (in thousands):
| December 31, | ||||||||
| 2010 | 2009 | |||||||
| Reserves and accruals not currently deductible for tax purposes |
$ | 8,371 | $ | 8,293 | ||||
| Net operating loss carry forwards |
20,644 | 13,886 | ||||||
| Tax credit carry forwards |
38,681 | 30,438 | ||||||
| Stock-based compensation |
7,853 | 14,197 | ||||||
| Other |
6,361 | 7,403 | ||||||
| Gross deferred tax assets |
81,910 | 74,217 | ||||||
| Depreciation |
(8,829 | ) | (6,193 | ) | ||||
| Amortization of identified intangibles |
(5,599 | ) | (3,941 | ) | ||||
| State taxes |
(5,122 | ) | (4,618 | ) | ||||
| Gross deferred tax liabilities |
(19,550 | ) | (14,752 | ) | ||||
| Deferred tax valuation allowance |
(3,551 | ) | (3,027 | ) | ||||
| Net deferred tax assets |
$ | 58,809 | $ | 56,438 | ||||
109
Table of Contents
Electronics For Imaging, Inc.
Notes to Consolidated Financial Statements—(Continued)
Reconciliation between the income tax provision (benefit) computed at the federal statutory rate and the actual tax provision (benefit) is as follows (in thousands):
| Years ended December 31, | ||||||||||||||||||||||||
| 2010 | 2009 | 2008 | ||||||||||||||||||||||
| Tax expense (benefit) at federal statutory rate |
$ | (571 | ) | 35.0 | % | $ | 5,613 | 35.0 | % | $ | (46,577 | ) | 35.0 | % | ||||||||||
| State income taxes, net of federal benefit |
(826 | ) | 50.6 | 1,853 | 11.6 | (2,059 | ) | 1.6 | ||||||||||||||||
| Research and development credits |
(2,572 | ) | 157.7 | (1,219 | ) | (7.6 | ) | (5,413 | ) | 4.1 | ||||||||||||||
| Foreign tax rate differential |
(894 | ) | 54.8 | 6,529 | 40.7 | (1,636 | ) | 1.2 | ||||||||||||||||
| Reduction in accrual for estimated potential tax assessments |
(8,163 | ) | 500.5 | (397 | ) | (2.5 | ) | (422 | ) | 0.3 | ||||||||||||||
| Non-deductible travel & entertainment |
332 | (20.4 | ) | 274 | 1.7 | 363 | (0.3 | ) | ||||||||||||||||
| Non-deductible stock compensation charge |
4,002 | (245.4 | ) | 6,512 | 40.6 | 7,015 | (5.3 | ) | ||||||||||||||||
| Goodwill impairment |
— | — | — | — | 29,663 | (22.3 | ) | |||||||||||||||||
| Valuation allowance changes affecting provision for income taxes |
123 | (7.5 | ) | (763 | ) | (4.8 | ) | (1,122 | ) | 0.9 | ||||||||||||||
| Other |
(548 | ) | 33.7 | (196 | ) | (1.2 | ) | 556 | (0.4 | ) | ||||||||||||||
| $ | (9,117 | ) | 559.0 | % | $ | 18,206 | 113.5 | % | $ | (19,632 | ) | 14.8 | % | |||||||||||
We have $50.0 million ($61.4 million for state tax purposes) and $18.1 million ($20.5 million for state tax purposes) of loss and credit carry-forwards at December 31, 2010 for US federal tax purposes. These losses and credits will expire between 2012 and 2031. A significant portion of these net operating loss and credit carryforwards relate to recent acquisitions and utilization of these loss and credit carryforwards will be subject to an annual limitation under the IRC. We also have a valuation allowance related to foreign tax credits resulting from the 2003 acquisition of Best GmbH, compensation limitations potentially limited by IRC 162(m), and net operating loss carryforwards resulting from the 2010 Radius acquisition. If these foreign tax credits, compensation deductions, and net operating loss carryforwards are ultimately utilized, the resulting benefit would reduce income tax expense.
110
Table of Contents
Electronics For Imaging, Inc.
Notes to Consolidated Financial Statements—(Continued)
As of December 31, 2010, 2009, and 2008, the total amount of gross unrecognized benefits was $32.5, $37.0, and $33.8 million, which would affect the effective tax rate if recognized. Over the next twelve months, our existing tax positions will continue to generate an increase in liabilities for unrecognized tax benefits. A reconciliation of the change in the gross unrecognized tax benefits from January 1, 2008 to December 31, 2010 is as follows:
| Federal, State and Foreign Tax |
Accrued Interest and Penalties |
Gross Unrecognized Income Tax Benefits |
||||||||||
| Balance at January 1, 2008 |
$ | 32.5 | $ | 0.9 | $ | 33.4 | ||||||
| Additions for tax positions of prior years |
0.2 | 0.7 | 0.9 | |||||||||
| Additions for tax positions related to 2008 |
7.4 | — | 7.4 | |||||||||
| Reductions for tax positions of prior years |
(0.2 | ) | — | (0.2 | ) | |||||||
| Settlements |
(6.9 | ) | — | (6.9 | ) | |||||||
| Reductions due to lapse of applicable statute of limitations |
(0.8 | ) | — | (0.8 | ) | |||||||
| Balance at December 31, 2008 |
$ | 32.2 | $ | 1.6 | $ | 33.8 | ||||||
| Additions for tax positions of prior years |
0.8 | 0.7 | 1.5 | |||||||||
| Additions for tax positions related to 2009 |
4.3 | — | 4.3 | |||||||||
| Reductions for tax positions of prior years |
(0.3 | ) | (0.1 | ) | (0.4 | ) | ||||||
| Settlements |
(1.1 | ) | (0.5 | ) | (1.6 | ) | ||||||
| Reductions due to lapse of applicable statute of limitations |
(0.5 | ) | (0.1 | ) | (0.6 | ) | ||||||
| Balance at December 31, 2009 |
$ | 35.4 | $ | 1.6 | $ | 37.0 | ||||||
| Additions for tax positions of prior years |
0.4 | 0.4 | 0.8 | |||||||||
| Additions for tax positions related to 2010 |
4.2 | — | 4.2 | |||||||||
| Reductions for tax positions of prior years |
(0.2 | ) | — | (0.2 | ) | |||||||
| Settlements |
— | — | — | |||||||||
| Reductions due to lapse of applicable statute of limitations |
(8.1 | ) | (1.2 | ) | (9.3 | ) | ||||||
| Balance at December 31, 2010 |
$ | 31.7 | $ | 0.8 | $ | 32.5 | ||||||
We recognize potential accrued interest and penalties related to unrecognized tax benefits in income tax expense. At December 31, 2010, 2009, and 2008, we have accrued $1.3, $2.7, and $2.6 million for potential payments of interest and penalties.
As of December 31, 2010, 2009, and 2008, net unrecognized benefits that would impact our effective tax rate, if recognized after December 31, 2010 were $32.5, $37.0, and $33.8 million, respectively, offset by deferred tax benefits of $2.9, $2.6, and $2.3 million related to the federal tax effect of state taxes for the same periods. We were subject to examination by both the IRS for the 2007-2009 tax years, state tax jurisdictions for the 2006-2009 tax years, and the Netherlands tax authority for the 2008-2009 tax years. In 2008, we finalized a closing agreement with the IRS to complete their examination of the 2002-2004 tax years. As a result of the IRS audit settlement, we reduced our unrecognized tax benefits by $6.6 million, of which $2.5 million was recorded as a tax benefit in 2008. The reduction in unrecognized tax benefits related primarily to intercompany cost allocations and research and development credits. Since the timing of the resolution of audits is uncertain, we are unable to estimate any potential adjustments in the next 12 months to the balance of unrecognized tax benefits.
111
Table of Contents
Electronics For Imaging, Inc.
Notes to Consolidated Financial Statements—(Continued)
Note 12: Employee Benefit Plans
Equity Incentive Plans
Our stockholders approved our 2009 Equity Incentive Award Plan on June 21, 2009. As a result, no awards may be granted under any of our prior plans. As of December 31, 2010, we had outstanding equity awards under eight equity incentive plans, including the 2009 Plan (defined below) and seven prior equity incentive plans.
Our primary equity incentive plans are summarized as follows:
2009 Stock Plan
In June 2009, our stockholders approved the 2009 Equity Incentive Award Plan (“2009 Plan”) and the reservation of an aggregate of 5.0 million shares of our common stock for issuance pursuant to such plan. The 2009 Plan provides for grants of stock options (both incentive stock options and nonqualified stock options), RSAs, stock appreciation rights, performance shares, performance stock units, dividend equivalents, stock payments, deferred stock, RSUs, and performance-based awards. Options and awards generally vest over a period of three to four years from the date of grant and generally expire seven to ten years from the date of the grant. The terms of the 2009 Plan provide that an option price shall not be less than 100% of fair market value on the date of the grant. Our Board of Directors may grant a stock bonus or stock unit award under the 2009 Plan in lieu of all or a portion of any cash bonus that a participant would have otherwise received for the related performance period.
The shares of common stock covered by the 2009 Plan may be treasury shares, authorized but unissued shares, or shares purchased in the open market. If an award under the 2009 Plan is forfeited (including a reimbursement of a non-vested award upon a participant’s termination of employment at a price equal to the par value of the common stock subject to the award) or expired, any shares of common stock subject to the award may be used again for new grants under the 2009 Plan.
The 2009 Plan is administered by the Compensation Committee of the Board of Directors (“Committee”). The Committee has the exclusive authority to administer the 2009 Plan, including the power to (i) designate participants under the 2009 Plan, (ii) determine the types of awards granted to participants under the 2009 Plan, the number of such awards, and the number of shares of our common stock that is subject to such awards, (iii) determine and interpret the terms and conditions of any awards under the 2009 Plan, including the vesting schedule, exercise price, whether to settle or accept the payment of any exercise price, in cash, common stock, other awards, or other property, and whether an award may be cancelled, forfeited, or surrendered, (iv) prescribe the form of each award agreement, and (v) adopt rules for the administration, interpretation, and application of the 2009 Plan. The Committee does not have the authority to accelerate vesting or waive forfeiture of any qualified performance-based awards.
Persons eligible to participate in the 2009 Plan include all of our employees, directors, and consultants, as determined by the Committee. As of December 31, 2010, approximately 2,100 employees and consultants and 4 non-employee directors were eligible to participate in the 2009 Plan.
As of December 31, 2010, there were 2.9 million shares outstanding and 1.5 million shares available for grant under the 2009 Plan.
2007 Stock Plan
With the adoption of the 2009 Plan, no additional awards may be granted under the 2007 Equity Incentive Award Plan (“2007 Plan”). Under the 2007 Plan, 3.3 million shares of common stock were reserved and authorized for
112
Table of Contents
Electronics For Imaging, Inc.
Notes to Consolidated Financial Statements—(Continued)
issuance. The 2007 Plan provides for grants of stock options (both incentive stock options and nonqualified stock options), restricted stock, stock appreciation rights, performance shares, performance stock units, dividend equivalents, stock payments, deferred stock, RSUs, and performance-based awards. Options and awards generally vest over a period of three to four years from date of grant and generally expire seven to ten years from date of the grant. The terms of the 2007 Plan provide that an option price shall not be less than 100% of fair market value on the date of the grant. Our Board of Directors may grant a stock bonus or stock unit award under the 2007 Plan in lieu of all or a portion of any cash bonus that a participant would have otherwise received for the related performance period.
The shares of common stock covered by the 2007 Plan may be treasury shares, authorized but unissued shares, or shares purchased in the open market. If an award under the 2007 Plan is forfeited (including reimbursement of a non-vested award upon a participant’s termination of employment at a price equal to the par value of the common stock subject to the award) or expired, any shares of common stock subject to the award may be used again for new grants under the 2007 Plan.
The 2007 Plan is administered by a committee, which may be the Board of Directors or the Committee. The Committee has the exclusive authority to administer the 2007 Plan, including the power to (i) designate participants under the 2007 Plan, (ii) determine the types of awards granted to participants under the 2007 Plan, the number of such awards, and the number of shares of our common stock subject to such awards, (iii) determine and interpret the terms and conditions of any awards under the 2007 Plan, including the vesting schedule, exercise price, whether to settle or accept the payment of any exercise price in cash, common stock, other awards, or other property, and whether an award may be cancelled, forfeited, or surrendered, (iv) prescribe the form of each award agreement, and (v) adopt rules for the administration, interpretation, and application of the 2007 Plan. The Committee does not have the authority to accelerate vesting or waive forfeiture of any qualified performance-based awards.
As of December 31, 2010 and 2009, there were 1.3 and 2.3 million shares outstanding, respectively, under the 2007 Plan. As of December 31, 2008, there were 2.4 million shares outstanding and 0.6 million shares available for grant under the 2007 Plan.
2004 Stock Plan
With the adoption of the 2007 Plan, no additional awards may be granted under the 2004 Stock Plan (the “2004 Plan”). Under the 2004 Plan, 8.4 million shares of common stock were authorized for issuance. This amount includes 0.1 million shares that were consolidated from the acquired Splash Plan, T/R Plan, and Printcafe Plans on June 7, 2006. The terms of the 2004 Plan provide that an option price shall not be less than 100% of fair market value on the date of the grant. The vesting period for restricted stock must be at least (a) one (1) year in the case of an RSA subject to a vesting schedule based on the achievement of specified performance goals by the participant or (b) three (3) years in the case of an RSA absent such performance-based vesting. Under this plan, restricted stock awards and RSUs could be granted that did not comply with the preceding minimum vesting requirement as long as the aggregate number of shares of common stock issued with respect to such non-conforming awards granted under the 2004 Plan did not exceed 10% of the shares reserved for issuance. The 2004 Plan provides for accelerated vesting if there is a change in control (as defined in the 2004 Plan). Options, RSUs, and restricted stock awards generally vest over a 42 to 48 month period and expire from seven to ten years from the date of the grant. As of December 31, 2010, 2009, and 2008, there were 0.6, 0.9, and 2.2 million shares, respectively, outstanding under the 2004 Plan.
113
Table of Contents
Electronics For Imaging, Inc.
Notes to Consolidated Financial Statements—(Continued)
1999 Stock Plan
With the adoption of the 2007 Plan, no additional awards may be granted under the 1999 Stock Plan (the “1999 Plan”). The 1999 Plan authorized 10.6 million shares of common stock for issuance. The terms of the 1999 Plan provide that an option price may not be less than 100% of fair market value and the purchase price under restricted stock purchase agreement may not be less than 50% of fair market value on the date of the grant. The Board of Directors or Committee had the authority to determine to whom options would be granted, the number of shares, the vesting period, the expiration date, and the exercise price. The 1999 Plan provides for accelerated vesting if there is a change in control (as defined in the 1999 Plan). Options, RSUs, and RSAs generally vest from two to four years and expire from seven to ten years from the date of the grant. As of December 31, 2010, 2009, and 2008, there were 0.2, 0.5, and 2.4 million shares, respectively, outstanding under the 1999 Plan.
1990 Stock Plan
The 1990 Stock Option Plan (the “1990 Plan”) by its terms expired in June 2000 and no additional awards may be granted under this plan. In June 1990, we adopted the 1990 Plan, which, as amended, provided for the issuance of incentive and nonqualified stock options to our employees, directors, and non-employees. We reserved 13.2 million shares of common stock for issuance under the 1990 Plan. The original terms of the 1990 Plan provided that the exercise price of nonqualified stock options could not be less than 85% of the fair market value on the date of the grant. In May 1995, the 1990 Plan was amended to provide that options could not be granted at less than 100% of the fair market value of our common stock on the date of the grant. Generally, the options vested over a four year period. The 1990 Plan allows us to buy out an option grant for cash or shares, which was an option previously granted based on terms and conditions as established at the time such offer is made. The 1990 Plan provides for accelerated vesting if there is a change in control (as defined in the 1990 Plan). The options are exercisable at times and increments as specified by the Board of Directors and expire not more than 10 years from date of grant. All options available under the 1990 Plan have been issued. Any shares (plus any shares that might in the future be returned to the 1990 Plan as a result of cancellations) that remained available for future grants under the 1990 Plan have been cancelled. As of December 31, 2010, no shares remain outstanding under the 1990 Plan. As of December 31, 2009 and 2008, there were less than 0.1 and 0.7 million shares, respectively, outstanding under the 1990 Plan.
Acquired Stock Plans
In connection with our acquisition of Splash Technology Holdings, Inc., T/R Systems, Inc., and Print Café,, we assumed their stock incentive plans. As of December 31, 2010 and 2009, there were less than 0.1 million options outstanding under these acquired stock plans. As of December 31, 2008 there were 0.2 million options outstanding.
Amended and Restated 2000 Employee Stock Purchase Plan
On June 2009, our stockholders approved the Amended and Restated 2000 Employee Stock Purchase Plan that increased the number of shares authorized for issuance pursuant to such plan by 3.0 million shares. The share increase was intended to ensure that we continue to have a sufficient reserve of common stock available under the ESPP to provide our eligible employees with the opportunity to acquire our common stock through participation in a payroll deduction-based ESPP designed to operate in compliance with Section 423 of the IRC. The amendment and restatement of the ESPP does not provide for an automatic increase in the number of shares reserved for issuance under the ESPP. As of December 31, 2010, 2009, and 2008, 2.2, 6.2, and 2.8 million shares of our common stock were reserved for issuance that remained outstanding under the ESPP.
114
Table of Contents
Electronics For Imaging, Inc.
Notes to Consolidated Financial Statements—(Continued)
In May 2000, our Board of Directors initially adopted the 2000 Employee Stock Purchase Plan, which became effective on August 1, 2000 and reserved 0.4 million shares of common stock for issuance under the ESPP. The ESPP, subsequently amended prior to 2009, had an automatic share increase feature pursuant to which the shares reserved under the ESPP automatically increased on the first trading day in January of each year, beginning with calendar year 2006. The increase was equal to three quarters of one percent (0.75%) of the total number of shares of common stock outstanding on the last trading day of December in the immediately preceding calendar year, but in no event could any such increase exceed 2.5 million shares annually.
The ESPP is qualified under Section 423 of the IRC. Eligible employees may contribute from one to ten percent of their base compensation not to exceed ten percent of the employee’s earnings. Employees are not able to purchase more than the number of shares having a value greater than $25,000 in any calendar year, as measured at the beginning of the offering period under the ESPP. The purchase price shall be the lesser of 85% of the fair market value of the stock, either on the offering date or on the purchase date. The offering period shall not exceed 27 months beginning with the offering date. The ESPP provided for offerings of four consecutive, overlapping six-month offering periods, with a new offering period commencing on the first trading day on or after February 1 and August 1 of each year.
In 2010, 2009, and 2008, 0.7, 0.8, and 0.5 million shares were issued under the ESPP at an average purchase price of $7.55, $7.51, and $12.18, respectively. As of December 31, 2010, there was $0.4 million of total unrecognized compensation cost related to stock-based compensation arrangements granted under the ESPP. That cost is expected to be recognized over a period of 1.8 years. At December 31, 2010, 2009, and 2008, there were 2.2, 2.9, and 0.3 million shares, respectively, available for issuance under the ESPP.
Valuation and Expense Information under ASC 718
We account for stock-based payment awards, in accordance with ASC 718, Stock Compensation, which requires the measurement and recognition of compensation expense for all equity awards made to our employees and directors, including employee stock options, RSAs, RSUs, and employee stock purchases related to all stock-based compensation plans based on the fair value of such awards on the date of grant. We amortize stock-based compensation cost on a graded vesting basis over the vesting period, after assessing the probability of achieving the requisite performance criteria with respect to performance-based awards. Stock-based compensation cost is recognized over the requisite service period for each separately vesting tranche of the award as though the award were, in substance, multiple awards.
We use the Black-Scholes-Merton (“BSM”) option pricing model to value stock-based compensation for all equity awards, except market based awards. Market based awards are valued using a Monte Carlo valuation model.
The BSM model determines the fair value of stock-based payment awards based on the stock price on the date of grant and is affected by assumptions regarding a number of highly complex and subjective variables. These variables include, but are not limited to, our expected stock price volatility over the term of the awards and actual and projected employee stock option exercise behaviors. Option pricing models were developed to estimate the value of traded options that have no vesting or hedging restrictions and are fully transferable. Because our employee stock options and awards have certain characteristics that are significantly different from traded options, and because changes in the subjective assumptions can materially affect the estimated value, in management’s opinion, the existing valuation models may not provide an accurate measure of the fair value of our employee stock options. Although the fair value of employee stock options is determined in accordance with ASC 718 and SAB No. 107 using an appropriate option pricing model, the value may not be indicative of the fair value observed in a willing buyer/willing seller market transaction.
115
Table of Contents
Electronics For Imaging, Inc.
Notes to Consolidated Financial Statements—(Continued)
Stock-based compensation expense related to stock options, employee stock purchases under the ESPP, RSUs, and RSAs under ASC 718 for the years ended December 31, 2010, 2009, and 2008 are summarized as follows (in thousands):
| 2010 | 2009 | 2008 | ||||||||||
| Stock -based compensation expense by type of award: |
||||||||||||
| Employee stock options |
$ | 1,545 | $ | 2,269 | $ | 5,759 | ||||||
| Non-vested RSUs and RSAs |
12,860 | 11,965 | 23,187 | |||||||||
| ESPP |
1,520 | 4,349 | 4,481 | |||||||||
| Total stock-based compensation |
15,925 | 18,583 | 33,427 | |||||||||
| Tax effect on stock-based compensation |
(1,696 | ) | 94 | (6,694 | ) | |||||||
| Net effect on net income (loss) |
$ | 14,229 | $ | 18,677 | $ | 26,733 | ||||||
Valuation Assumptions for Stock Options and ESPP Shares
Our determination of the fair value of stock-based payment awards on the date of grant using BSM is affected by various assumptions including volatility, expected term, and interest rates. Expected volatility is based on the historical volatility of our stock over a preceding period commensurate with the expected term of the stock option. The expected term is based upon management’s consideration of the historical life of the stock options, the vesting period of the stock options granted, and the contractual period of the stock options granted. The risk-free interest rate for the expected term of the stock options is based on the U.S. Treasury yield curve in effect at the time of grant. Expected dividend yield was not considered in the option pricing formula since we do not pay dividends and have no current plans to do so in the future.
The estimated per share weighted average fair value of stock options granted and ESPP shares issued and the assumptions used to estimate fair value are as follows for the periods indicated:
| Stock Options Years ended December 31, |
Employee Stock Purchase Plan Years ended December 31, |
|||||||||||||||||||||||
| BSM assumptions and fair value |
2010 | 2009 | 2008 | 2010 | 2009 | 2008 | ||||||||||||||||||
| Weighted average fair value per share |
$ | 4.48 | $ | 3.84 | $ | 5.51 | $ | 3.94 | $ | 3.93 | $ | 5.50 | ||||||||||||
| Expected volatility |
47 | % | 44 | % | 40 | % | 32%- 53% | 51% -66% | 32%- 74% | |||||||||||||||
| Risk-free interest rate |
1.2 | % | 1.8 | % | 2.8 | % | 0.2% - 0.9% | 0.3% -1.2% | 1.9%-2.5% | |||||||||||||||
| Expected term (in years) |
4.0 | 4.1 | 4.0 | 0.5 - 2.0 | 0.5 - 2.0 | 0.5 - 2.0 | ||||||||||||||||||
Non-vested RSUs and RSAs
The RSUs and non-vested shares of restricted stock generally vest over a service period of two to four years. The compensation expense incurred for these service-based awards is based on the closing market price of our stock on the date of grant and is amortized on a graded vesting basis over the requisite service period. The weighted average fair value of RSUs granted during the years ended December 31, 2010, 2009, and 2008 were $11.36, $10.84, and $13.53, respectively. No RSAs were granted during 2010, 2009, and 2008
In February 2008, the remaining 138,750 shares of market-based non-vested RSUs were modified to seven-year service-based RSUs. No incremental stock-based compensation expense was incurred as a result of the modification.
116
Table of Contents
Electronics For Imaging, Inc.
Notes to Consolidated Financial Statements—(Continued)
Performance-based Stock Options and RSUs
RSUs granted during the year ended December 31, 2010 include 384,875 performance-based RSUs, which vest when specified performance criteria are met based on 2010 revenue targets and non-GAAP operating income targets; otherwise, they are deemed forfeited. Non-GAAP operating income is defined as operating income determined in accordance with GAAP, adjusted to remove the impact of certain expenses, and the tax effects of these adjustments. The grant date fair value is estimated to be $4.7 million, which is being amortized over their service periods of 1.0 year. At December 31, 2010, 348,891 performance-based RSUs remain outstanding. The probability of achieving the requisite performance criteria was determined to be 88% as of December 31, 2010. Stock-based compensation expense has been adjusted accordingly.
Also granted during the year ended December 31, 2010 were 12,000 performance-based RSUs, which vest when specified performance criteria are met, prior to June 30, 2013, based on revenue and gross profit targets; otherwise, they are forfeited. The grant date fair value is estimated to be $0.1 million, which is being amortized over their service periods of 2.92 years. Achievement of these performance criteria is currently estimated as probable.
RSUs and stock options granted during the year ended December 31, 2009 include 98,000 market-based RSUs and 294,076 market-based stock options. These awards vest when our average closing stock price exceeds defined multiples of the June 18, 2009 or August 28, 2009 closing stock prices for 20 consecutive trading days. If these multiples are not achieved by June 18, 2016 or August 28, 2016, the awards are deemed forfeited. The grant date fair value is estimated to be $0.9 million for the RSUs and $1.7 million for the stock options, which are being amortized over their average derived service periods of 4.35 and 4.88 years, respectively. The average derived service period and total fair value was determined using the Monte Carlo valuation model based on our assumptions, which included a risk-free interest rate of 3.5% and 3.1%, respectively, and an implied volatility of 50%. At December 31, 2010, 88,000 market-based RSUs and 238,388 market-based stock options remain outstanding.
Stock options granted during the year ended December 31, 2009 include 32,674 performance-based stock options. These performance-based stock options vest when our annual non-GAAP return on equity exceeds defined multiples of the 2008 non-GAAP return on equity. Non-GAAP return on equity is defined as non-GAAP net income divided by stockholders’ equity. Non-GAAP net income is defined as net income determined in accordance with GAAP adjusted to remove the impact of certain expenses, and the tax effects of these adjustments. If these multiples are not achieved by August 28, 2016, the stock options are deemed forfeited. The grant date fair value is estimated to be $0.1 million, which is being amortized over their average derived service periods of 3.71 years. The performance-based stock options were valued using the BSM valuation model. Achievement of these performance criteria is currently estimated as probable. At December 31, 2010, 26,487 performance-based stock options remain outstanding.
2009 Fair Value Stock Option Exchange
We commenced a fair value stock option exchange on August 31, 2009 to allow employees, other than our named executive officers and members of our Board of Directors, the opportunity to exchange all or a portion of their eligible outstanding stock options for a smaller number of RSUs based on exchange ratios intended to result in the fair value of the newly issued RSUs being equal to the fair value of the stock options that were surrendered or for cash, in certain circumstances. Stock options that were “underwater” (i.e., those stock options with a per share exercise price that was greater than the per share closing price of our common stock as quoted on the NASDAQ Global Select Market as of the trading day immediately preceding August 31, 2009, the date the stock option exchange commenced, or $10.77 per share), excluding stock options granted six months prior to the commencement of the exchange or stock options expiring within six months after the completion of the exchange, were eligible for exchange.
117
Table of Contents
Electronics For Imaging, Inc.
Notes to Consolidated Financial Statements—(Continued)
The offering period closed on September 28, 2009. A total of 1,000 eligible employees participated in the stock option exchange. We accepted for exchange stock options to purchase an aggregate of 2.8 million shares of our common stock, representing 82% of the total stock options eligible at the commencement of the exchange. All surrendered stock options were cancelled and (i) we granted a total of 0.3 million new RSUs under the 2009 Plan, and (ii) we made cash payments in the aggregate amount of $0.2 million (less applicable withholdings and without interest). The resulting incremental compensation expense was not material to our condensed consolidated financial statements.
Stock Option Activity
Stock options outstanding and exercisable as of December 31, 2010, 2009, and 2008 and activity for each of the years then ended is as follows (in thousands, except weighted average exercise price and remaining contractual term):
| Shares | Weighted average exercise price |
Weighted average remaining contractual term (years) |
Aggregate intrinsic value |
|||||||||||||
| Options outstanding at January 1, 2008 |
7,513 | $ | 24.19 | |||||||||||||
| Options granted |
980 | 15.80 | ||||||||||||||
| Options forfeited and expired |
(2,286 | ) | 27.34 | |||||||||||||
| Options granted, net of forfeited and expired |
(1,306 | ) | ||||||||||||||
| Options exercised |
(146 | ) | 15.27 | |||||||||||||
| Options outstanding at December 31, 2008 |
6,061 | $ | 22.73 | |||||||||||||
| Options granted |
844 | 10.50 | ||||||||||||||
| Options forfeited, expired, and exchanged |
(4,081 | ) | 24.93 | |||||||||||||
| Options granted, net of forfeited, expired, and exchanged |
(3,237 | ) | ||||||||||||||
| Options exercised |
— | — | ||||||||||||||
| Options outstanding at December 31, 2009 |
2,824 | $ | 15.90 | |||||||||||||
| Options granted |
487 | 12.04 | ||||||||||||||
| Options forfeited and expired |
(696 | ) | 18.29 | |||||||||||||
| Options granted, net of forfeited and expired |
(209 | ) | ||||||||||||||
| Options exercised |
(86 | ) | 11.85 | |||||||||||||
| Options outstanding at December 31, 2010 |
2,529 | $ | 14.64 | 4.1 | $ | 3,311 | ||||||||||
| Options vested and expected to vest at December 31, 2010 |
2,363 | $ | 14.86 | 4.0 | $ | 2,824 | ||||||||||
| Options exercisable at December 31, 2010 |
1,444 | $ | 16.65 | 2.8 | $ | 513 | ||||||||||
Aggregate stock option intrinsic value represents the difference between the closing price per share of our common stock on the last trading day of the fiscal period and the exercise price of the underlying awards for the options that were in the money at December 31, 2010. No options were exercised during the year ended December 31, 2009. The total intrinsic value of options exercised, determined as of the date of option exercise, was $0.2 and $0.3 million for the years ended December 31, 2010 and 2008, respectively. There was $2.5 million of total unrecognized compensation cost related to stock options expected to vest as of December 31, 2010. That cost is expected to be recognized over a weighted average period of 1.7 years.
118
Table of Contents
Electronics For Imaging, Inc.
Notes to Consolidated Financial Statements—(Continued)
Stock options outstanding and exercisable as of December 31, 2010 are summarized as follows (shares in thousands):
| Options outstanding | Options exercisable | |||||||||||||||||||
| Range of exercise prices |
Shares | Weighted average remaining contractual term (years) |
Weighted average exercise price |
Shares | Weighted average exercise price |
|||||||||||||||
| $9.12 to $9.98 |
85 | 5.3 | $ | 9.82 | 34 | $ | 9.79 | |||||||||||||
| $10.77 to $10.77 |
484 | 5.7 | 10.77 | 77 | 10.77 | |||||||||||||||
| $10.80 to $13.72 |
507 | 6.4 | 11.91 | 26 | 10.95 | |||||||||||||||
| $15.25 to $15.77 |
5 | 2.6 | 15.46 | 4 | 15.49 | |||||||||||||||
| $15.88 to $15.88 |
550 | 4.2 | 15.88 | 452 | 15.88 | |||||||||||||||
| $16.06 and over |
898 | 1.8 | 17.96 | 851 | 18.04 | |||||||||||||||
| 2,529 | 4.1 | $ | 14.64 | 1,444 | $ | 16.65 | ||||||||||||||
Non-vested RSUs and RSAs
Non-vested RSUs and RSAs were awarded to employees under our equity incentive plans. Non-vested RSAs have the same voting rights as other common stock and are considered to be currently issued and outstanding. Non-vested RSAs are eligible to receive dividends (i.e., participating securities), even if we do not intend to declare dividends. RSUs do not have the voting rights of common stock and the shares underlying the RSUs are not considered issued and outstanding.
Non-vested RSUs and RSAs as of December 31, 2010, 2009, and 2008, and activity for each of the years then ended is as follows (shares in thousands):
| Restricted Stock Units | Restricted Stock Awards | |||||||||||||||
| Shares | Weighted average grant date fair value |
Shares | Weighted average grant date fair value |
|||||||||||||
| Non-vested at January 1, 2008 |
1,880 | $ | 22.07 | 336 | $ | 24.21 | ||||||||||
| Restricted stock granted |
926 | 13.78 | — | — | ||||||||||||
| Restricted stock vested |
(543 | ) | 11.62 | (174 | ) | 21.61 | ||||||||||
| Restricted stock forfeited |
(397 | ) | 21.07 | (44 | ) | 26.31 | ||||||||||
| Non-vested at December 31, 2008 |
1,866 | $ | 18.22 | 118 | $ | 27.21 | ||||||||||
| Restricted stock granted |
1,383 | 10.84 | — | — | ||||||||||||
| Restricted stock issued in exchange for stock options |
348 | 12.15 | — | — | ||||||||||||
| Restricted stock vested |
(727 | ) | 19.09 | (6 | ) | 27.89 | ||||||||||
| Restricted stock forfeited |
(163 | ) | 19.46 | — | — | |||||||||||
| Non-vested at December 31, 2009 |
2,707 | $ | 13.36 | 112 | $ | 27.18 | ||||||||||
| Restricted stock granted |
1,469 | 11.36 | — | — | ||||||||||||
| Restricted stock vested |
(1,355 | ) | 14.80 | — | — | |||||||||||
| Restricted stock forfeited |
(283 | ) | 12.62 | (11 | ) | 26.90 | ||||||||||
| Non-vested at December 31, 2010 |
2,538 | $ | 11.67 | 101 | $ | 27.21 | ||||||||||
119
Table of Contents
Electronics For Imaging, Inc.
Notes to Consolidated Financial Statements—(Continued)
RSUs
The fair value of RSUs that vested during the years ended December 31, 2010, 2009, and 2008, determined as of the vesting date, were $16.6, $8.2, and $6.4 million, respectively. The aggregate intrinsic value of RSUs vested and expected to vest at December 31, 2010 was $32.3 million, calculated as the closing price per share of our common stock on the last trading day of the fiscal period multiplied by 2.3 million of RSUs vested and expected to vest at December 31, 2010. There was approximately $11.8 million of unrecognized compensation costs related to RSUs expected to vest as of December 31, 2010. That cost is expected to be recognized over a weighted average period of 1.2 years.
RSAs
No RSAs vested during the year ended December 31, 2010 because the requisite performance criteria was not achieved. The fair value of RSAs that vested during the years ended December 31, 2009 and 2008, determined as of the vesting date, was $0.1 and $2.3 million, respectively. There was $0.1 million of unrecognized compensation cost related to non-vested RSAs expected to vest as of December 31, 2010. That cost will be recognized during the quarter ended March 31, 2011 because the RSAs vested on March 15, 2011 based on achievement of a specified percentage of the 2010 operating plan.
Employee 401(k) Plan
We sponsor a 401(k) Savings Plan (“401(k) Plan”) to provide retirement and incidental benefits for our employees. Employees may contribute from 1% to 40% of their annual compensation to the 401(k) Plan, limited to a maximum annual amount as set periodically by the IRS. We matched 50% of U.S. employee contributions, up to a maximum of the first 4% of the employee’s compensation contributed to the plan, subject to IRS limitations, except for a 17 month period during 2010 and 2009 when employer matching contributions were suspended. All matching contributions vest over four years starting with the hire date of the individual employee. Our matching contributions to the 401(k) Plan totaled $0.1, $0.6, and $1.9 million during the years ended December 31, 2010, 2009, and 2008, respectively. The employees’ and our contributions are cash contributions invested in mutual funds managed by an independent fund manager, or in self-directed retirement plans.
Note 13: Sale of Building and Land
On January 29, 2009, we sold a portion of the Foster City, California campus for $137.3 million. The property sold included an approximately 163,000 square foot building at 301 Velocity Way as well as approximately 30 acres of land. Direct transaction costs consist primarily of broker commissions, documentary transfer and title costs, legal fees, and other expenses. The cost of the land, building, and improvements were included in the determination of the gain on sale of building and land for the year ended December 31, 2009 as follows (in millions):
| Sales proceeds |
$ | 137.3 | ||
| Assets held for sale at December 31, 2008 |
55.4 | |||
| Direct transaction costs |
1.9 | |||
| Gain on sale of building and land |
$ | 80.0 | ||
Note 14: Restructuring and Other
During the years ended December 31, 2010, 2009, and 2008, cost reduction actions were taken to lower our quarterly operating expense run rate as we analyzed our cost structure. We announced restructuring plans to
120
Table of Contents
Electronics For Imaging, Inc.
Notes to Consolidated Financial Statements—(Continued)
better align our costs with revenue levels due to the current economic environment and to re-align our cost structure following the acquisitions of Radius in 2010 and Pace in 2008. Restructuring and other consists primarily of restructuring, severance, facility downsizing, and acquisition integration expenses. The restructuring plans are accounted for in accordance with ASC 420, Exit or Disposal Cost Obligations, and ASC 820, Fair Value Measurements and Disclosures, which became effective with respect to restructuring-related liabilities initially in the first quarter of 2009.
We recognized restructuring and other charges of $3.6, $9.0, and $11.0 million for the years ended December 31, 2010, 2009, and 2008, respectively, primarily consisting of restructuring, severance, facilities downsizing, and acquisition integration expenses. Restructuring and severance charges of $2.4, $8.1, and $8.3 million related to head count reductions of 98, 227, and 166 for the years ended December 31, 2010, 2009, and 2008, respectively. Severance costs include severance payments, related employee benefits, retention bonuses, and outplacement or relocation costs. Restructuring and other includes a $0.6 million charge resulting from a decrease in estimated sublease income necessitated by continuing weakness in the commercial real estate market where these facilities are located, costs to downsize five facilities in 2010, and integration expenses resulting from the Radius acquisition. Restructuring and other includes charges to downsize three facilities during 2009 and charges to downsize five facilities and integrate our Pace and Raster acquisitions during 2008.
Restructuring and other reserve activities for the years ended December 31, 2010 and 2009 are summarized as follows (in thousands):
| 2010 | 2009 | |||||||
| Reserve balance at January 1 |
$ | 2,796 | $ | 3,847 | ||||
| Restructuring charges |
1,902 | 7,800 | ||||||
| Other charges |
1,713 | 1,157 | ||||||
| Cash payments |
(4,616 | ) | (10,008 | ) | ||||
| Reserve balance at December 31 |
1,795 | 2,796 | ||||||
Note 15: Segment Information, Geographic Data, and Major Customers
Operating Segments
ASC 280, Segment Reporting, requires operating segment information to be presented based on internal reporting used by the chief operating decision maker to allocate resources and evaluate operating segment performance. Our enterprise management processes became further refined in 2009 to use financial information that is closely aligned with our three product categories at the gross profit level. Relevant discrete financial information is prepared at the gross profit level for each of our three operating segments that is used by the chief operating decision making group to allocate resources and assess the performance of each operating segment.
We classify our revenue, gross profit, assets, and liabilities in accordance with our operating segments as follows:
Fiery, which includes products, services, and technology, which transform digital copiers and printers into high performance networked printing devices, and is made up of stand-alone and embedded controllers, bundled solutions, and design-licensed solutions primarily for the office market and commercial printing markets. This operating segment includes our Fiery series (external print servers and embedded servers), Splash and MicroPress, color and black & white server products, software options for Fiery products, including proofing and scanning solutions, and parts.
121
Table of Contents
Electronics For Imaging, Inc.
Notes to Consolidated Financial Statements—(Continued)
Inkjet, which consists of sales of super-wide and wide format inkjet printers, industrial inkjet printers, ink, parts, and service revenue from the VUTEk, Jetrion, and Rastek businesses.
APPS, which consists of software technology focused on printing workflow, PMIS, e-commerce, and job tracking tools.
Our chief operating decision making group evaluates the performance of its operating segments based on net sales and gross profit. Gross profit for each operating segment includes revenue from sales to third parties and related cost of revenue attributable to the operating segment. Cost of revenue for each operating segment excludes certain expenses managed outside the operating segments consisting primarily of stock-based compensation expense. Operating income is not reported by operating segment because operating expenses include significant shared expenses and other costs that are managed outside of the operating segments. Such operating expenses include various corporate expenses such as stock-based compensation expense, corporate sales and marketing expenses, research and development, income taxes, various non-recurring charges, and other separately managed general and administrative expenses.
Summary gross profit information, excluding stock-based compensation expense, for the years ended December 31, 2010, 2009, and 2008 is as follows (in thousands):
| For the years ended December 31, | ||||||||||||
| 2010 | 2009 | 2008 | ||||||||||
| Fiery |
||||||||||||
| Revenue |
$ | 238,621 | $ | 193,012 | $ | 289,065 | ||||||
| Gross profit |
161,219 | 129,240 | 197,378 | |||||||||
| Gross profit percentages |
67.6 | % | 67.0 | % | 68.3 | % | ||||||
| Inkjet |
||||||||||||
| Revenue |
$ | 207,654 | $ | 159,732 | $ | 219,959 | ||||||
| Gross profit |
68,121 | 50,748 | 89,677 | |||||||||
| Gross profit percentages |
32.8 | % | 31.8 | % | 40.8 | % | ||||||
| APPS |
||||||||||||
| Revenue |
$ | 57,732 | $ | 48,364 | $ | 51,356 | ||||||
| Gross profit |
39,329 | 32,569 | 32,833 | |||||||||
| Gross profit percentages |
68.1 | % | 67.3 | % | 63.9 | % | ||||||
A reconciliation of operating segment gross profit to the consolidated statements of operations for the years ended December 31, 2010, 2009, and 2008 is as follows (in thousands):
| For the years ended December 31, | ||||||||||||
| 2010 | 2009 | 2008 | ||||||||||
| Segment gross profit |
$ | 268,669 | $ | 212,557 | $ | 319,888 | ||||||
| Stock-based compensation expense |
(984 | ) | (1,074 | ) | (2,471 | ) | ||||||
| Gross profit |
$ | 267,685 | $ | 211,483 | $ | 317,417 | ||||||
Proofing software revenue of $8.6 and $10.3 million and proofing gross profit of $7.7 and $9.0 million previously reported in the APPS operating segment for the years ended December 31, 2009 and 2008, respectively, has been revised to conform to the year ended December 31, 2010 presentation, reflecting the reclassification of proofing software from the APPS to the Fiery operating segment. Total revenue and gross profit for the years ended December 31, 2009 and 2008 has not changed.
122
Table of Contents
Electronics For Imaging, Inc.
Notes to Consolidated Financial Statements—(Continued)
Tangible and intangible assets, net of liabilities, are summarized by operating segment as follows (in thousands):
| Fiery | Inkjet | APPS | ||||||||||
| December 31, 2010 |
||||||||||||
| Goodwill |
$ | 60,005 | $ | 36,508 | $ | 43,005 | ||||||
| Identified intangible assets, net |
682 | 34,198 | 14,259 | |||||||||
| Tangible assets, net of liabilities |
40,046 | 72,766 | (3,861 | ) | ||||||||
| Net tangible and intangible assets |
$ | 100,733 | $ | 143,472 | $ | 53,403 | ||||||
| December 31, 2009 |
||||||||||||
| Goodwill |
$ | 53,249 | $ | 36,508 | $ | 33,083 | ||||||
| Identified intangible assets, net |
— | 43,442 | 11,007 | |||||||||
| Tangible assets, net of liabilities |
43,333 | 82,331 | 1,865 | |||||||||
| Net tangible and intangible assets |
$ | 96,582 | $ | 162,281 | $ | 45,955 | ||||||
Operating segment assets exclude corporate assets, such as cash, short-term and long-term investments, and taxes payable. Proofing software net tangible and intangible assets previously reported in the APPS operating segment of $8.3 million for the year ended December 31, 2009 has been revised to conform to the year ended December 31, 2010 presentation, reflecting the reclassification of the proofing software business from the APPS to the Fiery operating segment. Net tangible and intangible assets for the year ended December 31, 2009 has not changed.
Information about Geographic Areas
Our revenue originates in the U.S., The Netherlands, Germany, Japan, and the U.K. We report revenue by geographic area based on ship-to destinations. Shipments to some of our OEM customers are made to centralized purchasing and manufacturing locations, which in turn sell through to other locations. As a result of these factors, we believe that sales to certain geographic locations might be higher or lower, as the ultimate destinations are difficult to ascertain.
Our revenue by sales origin for the years ended December 31, 2010, 2009, and 2008 was as follows (in thousands):
| For the years ended December 31, | ||||||||||||
| 2010 | 2009 | 2008 | ||||||||||
| Americas |
$ | 293,747 | $ | 229,294 | $ | 297,896 | ||||||
| Europe, Middle East, and Africa |
149,488 | 122,696 | 194,474 | |||||||||
| Japan |
41,853 | 35,041 | 52,048 | |||||||||
| Other international locations |
18,919 | 14,077 | 15,962 | |||||||||
| Total Revenue |
$ | 504,007 | $ | 401,108 | $ | 560,380 | ||||||
Our long-lived assets located outside the Americas, all of which are in the EMEA region, as of December 31, 2010 and 2009 was as follows (in thousands):
| December 31, | ||||||||
| 2010 | 2009 | |||||||
| Goodwill |
$ | 20,744 | $ | 7,408 | ||||
| Intangible assets, net |
6,077 | 1,096 | ||||||
| $ | 26,821 | $ | 8,504 | |||||
123
Table of Contents
Electronics For Imaging, Inc.
Notes to Consolidated Financial Statements—(Continued)
Major Customers
For the past three years we have had two major customers, Xerox and Canon, each with total revenue greater than 10%. Canon and Xerox each contributed over 10% of our revenue individually and together accounted for approximately 27%, 26%, and 29% of our revenue for the years ended December 31, 2010, 2009, and 2008, respectively.
One customer, Xerox, had an accounts receivable balance greater than 10% of our net accounts receivable balance at December 31, 2010, accounting for 16%, and two customers, Xerox and Canon, had accounts receivable balances greater than 10% of our net accounts receivable balance at December 31, 2009, accounting for 15% and 10%, respectively.
Note 16: Subsequent Event
On February 9, 2011, our Board of Directors approved a $30 million stock repurchase program.
On February 16, 2011, we acquired privately held Streamline for approximately $6.9 million in cash, plus an additional future cash earn out contingent on achieving certain performance targets. Streamline is the provider of PrintStream PMIS software focused on mailing and fulfillment services for the printing industry.
124
Table of Contents
SUPPLEMENTARY DATA
Unaudited Quarterly Consolidated Financial Information
The following table presents our operating results for each of the quarters in the years ended December 31, 2010 and 2009. The information for each of these quarters is unaudited, but has been prepared on the same basis as our audited consolidated financial statements appearing elsewhere in this Annual Report on Form 10-K. In the opinion of management, all necessary adjustments (consisting only of normal recurring adjustments) have been included that are required to state fairly our unaudited quarterly results when read in conjunction with our audited consolidated financial statements and the notes thereto appearing in this Annual Report on Form 10-K. These operating results are not necessarily indicative of the results for any future period.
| 2010 | ||||||||||||||||
| (in thousands except per share data) |
Q1 | Q2 | Q3 | Q4(1) | ||||||||||||
| Revenue |
$ | 110,830 | $ | 119,117 | $ | 129,049 | $ | 145,011 | ||||||||
| Gross profit |
58,771 | 60,963 | 69,993 | 77,958 | ||||||||||||
| Income (loss) from operations |
(7,377 | ) | (2,827 | ) | 1,835 | 8,093 | ||||||||||
| Net income (loss) |
(11,378 | ) | (2,542 | ) | 13,357 | 8,050 | ||||||||||
| Net income (loss) per basic common share |
$ | (0.25 | ) | $ | (0.06 | ) | $ | 0.29 | $ | 0.17 | ||||||
| Net income (loss) per diluted common share |
$ | (0.25 | ) | $ | (0.06 | ) | $ | 0.29 | $ | 0.17 | ||||||
| 2009 | ||||||||||||||||
| (in thousands except per share data) |
Q1 | Q2 | Q3 | Q4 | ||||||||||||
| Revenue |
$ | 96,145 | $ | 90,110 | $ | 100,855 | $ | 113,998 | ||||||||
| Gross profit |
52,928 | 46,771 | 52,190 | 59,594 | ||||||||||||
| Loss from operations |
(22,972 | ) | (23,603 | ) | (15,060 | ) | (5,382 | ) | ||||||||
| Net income (loss) |
$ | 26,714 | $ | (13,309 | ) | $ | (12,169 | ) | $ | (3,407 | ) | |||||
| Net income (loss) per basic common share |
$ | 0.52 | $ | (0.27 | ) | $ | (0.25 | ) | $ | (0.07 | ) | |||||
| Net income (loss) per diluted common share |
$ | 0.52 | $ | (0.27 | ) | $ | (0.25 | ) | $ | (0.07 | ) | |||||
| Gain on sale of building and land |
$ | 79,363 | $ | 628 | $ | — | $ | — | ||||||||
| (1) | During the fourth quarter of 2010, we determined that we had not reversed stock-based compensation expense (“SBC”) related to certain employees terminated earlier in the year. When the recipient of an equity award leaves the Company, SBC should be reversed in the period of termination. The net effect of this fourth quarter adjustment was an over-statement of pre-tax loss of $0.3 million for the three and six months ended June 30, 2010, under-statement of pre-tax income of $0.1 million for the three months ended September 30, 2010, and over-statement of pre-tax loss of $0.4 million for the nine months ended September 30, 2010. This fourth quarter adjustment resulted in an over-statement of pre-tax income of $0.4 million for the three months ended December 31, 2010. Pre-tax income was not impacted for the year ended December 31, 2010. |
This adjustment is not considered material to the financial information taken as a whole for any of the periods presented.
125
Table of Contents
Item 9: Changes in and Disagreements with Accountants on Accounting and Financial Disclosure
None.
Item 9A: Controls and Procedures
Evaluation of Disclosure Controls and Procedures
We maintain “disclosure controls and procedures,” as such term is defined in Rule 13a-15(e) under the Exchange Act, that are designed to provide reasonable assurance that information required to be disclosed by us in reports that we file or submit under the Exchange Act is recorded, processed, summarized, and reported within the time periods specified in SEC rules and forms, and that such information is accumulated and communicated to our management, including our Chief Executive Officer and Chief Financial Officer, as appropriate, to allow timely decisions regarding required disclosure. Our management, including the Chief Executive Officer and Chief Financial Officer, is engaged in a comprehensive effort to review, evaluate, and improve our controls; however, management does not expect that our disclosure controls will prevent all errors and all fraud. A control system, no matter how well designed and operated, can provide only reasonable, not absolute, assurance that the control system’s objectives are met. Additionally, in designing disclosure controls and procedures, our management necessarily was required to apply its judgment in evaluating the cost-benefit relationship of possible disclosure controls and procedures. The design of any disclosure controls and procedures is also based in part upon certain assumptions about the likelihood of future events, and there can be no assurance that any design will succeed in achieving its stated goals under all potential future conditions.
Based on their evaluation as of the end of the period covered by this Annual Report on Form 10-K, our Chief Executive Officer and Chief Financial Officer have concluded that our disclosure controls and procedures were effective to provide reasonable assurance as of December 31, 2010.
Management’s Report on Internal Control over Financial Reporting
Our management is responsible for establishing and maintaining adequate internal control over financial reporting as defined in Rule 13a-15(f) of the Exchange Act. Because of its inherent limitations, internal control over financial reporting may not prevent or detect misstatements. Also, projections of any evaluation of effectiveness to future periods are subject to the risk that controls may become inadequate because of changes in conditions, or that the degree of compliance with the policies or procedures may deteriorate.
We assessed the effectiveness of the Company’s internal control over financial reporting as of December 31, 2010. In making this assessment, we used the criteria set forth by the Committee of Sponsoring Organizations of the Treadway Commission (“COSO”) in Internal Control—Integrated Framework.
Based on our assessment using those criteria, we concluded that our internal control over financial reporting was effective as of December 31, 2010.
We have excluded Radius from our assessment of internal control over financial reporting as of December 31, 2010 because Radius was acquired by us during fiscal year 2010. Radius is a wholly owned subsidiary whose total assets and total revenue represent 3.1% and 1.5%, respectively, of the related consolidated financial statement amounts as of and for the year ended December 31, 2010.
PricewaterhouseCoopers LLP, an independent registered public accounting firm, has audited the effectiveness of our internal control over financial reporting as of December 31, 2010, as stated in their report included in this Annual Report on Form 10-K.
126
Table of Contents
Changes in Internal Control over Financial Reporting
There were no changes in our internal control over financial reporting during the quarter ended December 31, 2010 that have materially affected, or are reasonably likely to materially affect, our internal control over financial reporting.
None.
127
Table of Contents
PART III
Item 10: Directors, Executive Officers and Corporate Governance
Information regarding our directors is incorporated by reference from the information contained under the caption “Election of Directors” in our Proxy Statement for our 2011 Annual Meeting of Stockholders (the “2011 Proxy Statement”). Information regarding our current executive officers is incorporated by reference from information contained under the caption “Executive Officers” in our 2011 Proxy Statement. Information regarding Section 16 reporting compliance is incorporated by reference from information contained under the caption “Section 16(a) Beneficial Ownership Reporting Compliance” in our 2011 Proxy Statement. Information regarding the Audit Committee of our Board of Directors and information regarding an Audit Committee financial expert is incorporated by reference from information contained under the caption “Meetings and Committees of the Board of Directors” in our 2011 Proxy Statement. Information regarding our code of ethics is incorporated by reference from information contained under the caption “Meetings and Committees of the Board of Directors” in our 2011 Proxy Statement. Information regarding our implementation of procedures for stockholder nominations to our Board of Directors is incorporated by reference from information contained under the caption “Meetings and Committees of the Board of Directors” in our 2011 Proxy Statement.
Item 11: Executive Compensation
The information required by this item is incorporated by reference from the information contained under the captions “Compensation Discussion and Analysis” and “Executive Compensation” in our 2011 Proxy Statement.
Item 12: Security Ownership of Certain Beneficial Owners and Management and Related Stockholder Matters
Other than information regarding securities authorized for issuance under equity compensation plans, which is set forth below, the information required by this item is incorporated by reference from the information contained under the caption “Security Ownership” in our 2011 Proxy Statement.
Securities Authorized for Issuance Under Equity Compensation Plans
The following table sets forth information as of December 31, 2010 concerning securities that are authorized under equity compensation plans.
| Plan category |
Number of securities to be issued upon exercise of outstanding options, warrants and rights |
Weighted-average exercise price of outstanding options, warrants and rights |
Number of securities remaining available for future issuance under equity compensation plans (excluding securities reflected in column 1) |
|||||||||
| Equity compensation plans approved by stockholders |
5,066,557 | (1) | $ | 14.71 | 3,657,370 | (2) | ||||||
| Equity compensation plans not approved by stockholders |
— | — | — | |||||||||
| Total |
5,066,557 | $ | 14.71 | 3,657,370 | ||||||||
| (1) | Includes options outstanding as of December 31, 2010, representing 5,594 shares with an average exercise price of $28.77 per share, that were assumed in connection with business combinations. |
| (2) | Includes 1,461,307 shares available under the 2009 Plan and 2,196,063 shares available under the ESPP. |
128
Table of Contents
Item 13: Certain Relationships and Related Transactions, and Director Independence
The information required by this item is incorporated by reference from the information contained under the caption “Certain Relationships and Related Transactions, and Director Independence” in our 2011 Proxy Statement.
Item 14: Principal Accountant Fees and Services
The information required by this item is incorporated by reference from the information contained under the caption “Principal Accountant Fees and Services” in our 2011 Proxy Statement.
129
Table of Contents
PART IV
Item 15: Exhibits and Financial Statement Schedules
| (a) | Documents Filed as Part of this Report |
| (1) | Index to Financial Statements |
The Financial Statements required by this item are submitted in Item 8 of this Annual Report on Form 10-K as follows:
| Page | ||||
| 70 | ||||
| Consolidated Balance Sheets as of December 31, 2010 and 2009 |
71 | |||
| Consolidated Statements of Operations for the Years Ended December 31, 2010, 2009, and 2008 |
72 | |||
| 73 | ||||
| Consolidated Statements of Cash Flows for the Years Ended December 31, 2010, 2009, and 2008 |
74 | |||
| 75 | ||||
| (2) Financial Statement Schedule |
||||
| 134 | ||||
(All other schedules are omitted because of the absence of conditions under which they are required or because the necessary information is provided in the consolidated financial statements or notes thereto in Item 8 of this Annual Report on Form 10-K.)
| (3) | Exhibits |
| Exhibit |
Description | |
| 2.1 | Agreement and Plan of Merger, dated as of August 30, 2000, by and among the Company, Vancouver Acquisition Corp. and Splash Technology Holdings, Inc. (1) | |
| 2.2 | Amendment No. 1, dated as of October 19, 2000, to the Agreement and Plan of Merger, dated as of August 30, 2000, by and among the Company, Vancouver Acquisition Corp. and Splash Technology Holdings, Inc. (2) | |
| 2.3 | Agreement and Plan of Merger and Reorganization, dated as of July 14, 1999, among the Company, Redwood Acquisition Corp. and Management Graphics, Inc. (3) | |
| 2.4 | Agreement and Plan of Merger, dated as of February 26, 2003 by and among the Company, Strategic Value Engineering, Inc. and Printcafe Software, Inc. (4) | |
| 2.5 | Merger Agreement, dated as of April 14, 2005 by and among the Company, VUTEk, Inc. and EFI Merger Sub, Inc. (5) | |
| 2.6+ | Amended and Restated Equity Purchase Agreement dated October 31, 2006 among the Company, Electronics for Imaging, International, Jetrion, LLC and Flint Group North America Corporation (6) | |
| 3.1 | Amended and Restated Certificate of Incorporation (7) | |
| 3.2 | Amended and Restated By-Laws of Electronics For Imaging, Inc., (as amended August 12, 2009) (8) | |
| 4.2 | Specimen Common Stock Certificate of the Company (9) | |
130
Table of Contents
| Exhibit |
Description | |
| 10.1+ | Agreement dated December 6, 2000, by and between Adobe Systems Incorporated and the Company (10) | |
| 10.2 | Electronics For Imaging, Inc. 1999 Equity Incentive Plan as amended (11) | |
| 10.3 | Amended and Restated 2000 Employee Stock Purchase Plan (12) | |
| 10.4 | Splash Technology Holdings, Inc. 1996 Stock Option Plan as amended to date (13) | |
| 10.5 | Printcafe Software, Inc. 2000 Stock Incentive Plan (14) | |
| 10.6 | Printcafe Software, Inc. 2002 Key Executive Stock Incentive Plan (14) | |
| 10.7 | Printcafe Software, Inc. 2002 Employee Stock Incentive Plan (14) | |
| 10.8 | T/R Systems, Inc. 1999 Stock Option Plan (15) | |
| 10.9 | Electronics For Imaging, Inc. 2004 Equity Incentive Plan (16) | |
| 10.10 | Electronics For Imaging, Inc. 2007 Equity Incentive Award Plan (17) | |
| 10.11 | Electronics For Imaging, Inc. 2007 Equity Incentive Award Plan Stock Option Grant Notice and Stock Option Agreement (18) | |
| 10.12 | Electronics For Imaging, Inc. 2007 Equity Incentive Award Plan Restricted Stock Award Grant Notice and Restricted Stock Award Agreement (18) | |
| 10.13 | Electronics For Imaging, Inc. 2007 Equity Incentive Award Plan Restricted Stock Unit Award Grant Notice and Restricted Stock Unit Award Agreement (18) | |
| 10.14 | Electronics For Imaging, Inc. 2009 Equity Incentive Award Plan (19) | |
| 10.15 | Electronics For Imaging, Inc. 2009 Equity Incentive Award Plan Stock Option Grant Notice and Stock Option Agreement (20) | |
| 10.16 | Electronics For Imaging, Inc. 2009 Equity Incentive Award Plan Restricted Stock Unit Award Grant Notice and Restricted Stock Unit Award Grant Agreement (20) | |
| 10.17 | Electronics For Imaging, Inc. 2009 Equity Incentive Award Plan Restricted Stock Award Grant Notice and Restricted Stock Award Grant Agreement (20) | |
| 10.18 | Form of Indemnification Agreement (9) | |
| 10.19 | Form of Indemnity Agreement (21) | |
| 10.20 | Lease Financing of Properties Located in Foster City, California, dated as of July 16, 2004, among the Company, Société Générale Financial Corporation and Société Générale (22) | |
| 10.21+ | OEM Distribution and License Agreement dated September 19, 2005 by and among Adobe Systems Incorporated, Adobe Systems Software Ireland Limited and the Company, as amended by Amendment No. 1 dated as of October 1, 2005 (23) | |
| 10.22+ | Amendment No. 2 to OEM Distribution and License Agreement by and among Adobe Systems Incorporated, Adobe Systems Software Ireland Limited and the Company, effective as of October 1, 2005 (24) | |
| 10.23 | Employment Agreement effective August 1, 2006, by and between Guy Gecht and the Company (25) | |
| 10.24 | Employment Agreement effective August 1, 2006, by and between Fred Rosenzweig and the Company (25) | |
| 10.25 | Employment Agreement effective August 1, 2006, by and between John Ritchie and the Company (25) | |
| 10.26+ | Amendment No. 4 to OEM Distribution and License Agreement by and among Adobe Systems Incorporated, Adobe Systems Software Ireland Limited and the Company, effective as of January 1, 2006 (26) | |
131
Table of Contents
| Exhibit |
Description | |
| 10.27 | Amendment of Stock Option Agreement and Stock Option Repayment Agreement, dated as of August 29, 2008, by and between the Company and Guy Gecht (27) | |
| 10.28 | Amendment of Stock Option Agreement and Stock Option Repayment Agreement, dated as of August 29, 2008, by and between the Company and Fred S. Rosenzweig (27) | |
| 10.29 | Amendment of Stock Option Agreement and Stock Option Repayment Agreement dated as of August 29, 2008, by and between the Company and John Ritchie (27) | |
| 10.30 | Amendment of Stock Option Agreement and Stock Option Repayment Agreement, dated as of August 29, 2008, by and between the Company and Dan Maydan (27) | |
| 10.31 | Amendment of Stock Option Agreement, dated as of August 29, 2008, by and between the Company and Gill Cogan (27) | |
| 10.32 | Purchase and Sale Agreement and Joint Escrow Instructions dated as of October 23, 2008 by and between the Company and Gilead Sciences, Inc., as amended (28) | |
| 10.33+ | Master Confirmation dated February 18, 2009 between the Company and UBS, AG, London Branch (29) | |
| 10.34+ | Supplemental Confirmation dated February 18, 2009 between the Company and UBS, AG, London Branch (29) | |
| 10.35 | Offer Letter to Vincent Pilette, dated December 29, 2010 (30) | |
| 10.36 | Executive Employment Agreement to Vincent Pilette, dated December 29, 2010 (30) | |
| 10.37 | EFI 2011 Executive Team Performance Bonus Program (31) | |
| 12.1 | Computation of Ratios of Earnings to Fixed Charges | |
| 21 | List of Subsidiaries | |
| 23.1 | Consent of Independent Registered Public Accounting Firm | |
| 24.1 | Power of Attorney (see signature page of this Annual Report on Form 10-K) | |
| 31.1 | Certification of Chief Executive Officer pursuant to Section 302 of the Sarbanes-Oxley Act of 2002 | |
| 31.2 | Certification of Chief Financial Officer pursuant to Section 302 of the Sarbanes-Oxley Act of 2002 | |
| 32.1 | Chief Executive Officer Certification pursuant to 18 U.S.C. Section 1350 as adopted pursuant to Section 906 of the Sarbanes-Oxley Act of 2002 and Chief Financial Officer Certification pursuant to 18 U.S.C. Section 1350 as adopted pursuant to Section 906 of the Sarbanes-Oxley Act of 2002 | |
| + | The Company has received confidential treatment with respect to portions of these documents | |
| (1) | Filed as exhibit (d) (1) to the Company’s Schedule TO-T on September 14, 2000 and incorporated herein by reference. | |
| (2) | Filed as exhibit (d) (5) to the Company’s Schedule TO/A No. 3 on October 20, 2000 and incorporated herein by reference. | |
| (3) | Filed as an exhibit to the Company’s Report of Unscheduled Events on Form 8-K on September 8, 1999 (File No. 000-18805) and incorporated herein by reference. | |
| (4) | Filed as exhibit 10 to Amendment No. 2 to the Schedule 13D filed on February 26, 2003 and incorporated herein by reference. | |
| (5) | Filed as an exhibit to the Company’s Current Report on Form 8-K filed on April 18, 2005 (File No. 000-18805) and incorporated herein by reference. | |
| (6) | Filed as an exhibit to the Company’s Current Report on Form 8-K filed on November 3, 2006 (File No. 000-18805) and incorporated herein by reference. | |
| (7) | Filed as an exhibit to the Company’s Registration Statement on Form S-1 (File No. 33-57382) and incorporated herein by reference. | |
| (8) | Filed as an exhibit to the Company’s Current Report on Form 8-K filed on August 17, 2009 and incorporated herein by reference. |
132
Table of Contents
| (9) | Filed as an exhibit to the Company’s Registration Statement on Form S-1 (No. 33-50966) and incorporated herein by reference. | |
| (10) | Filed as an exhibit to the Company’s Annual Report on Form 10-K for the year ended December 31, 2000 (File No. 000-18805) and incorporated herein by reference. | |
| (11) | Filed as an exhibit to the Company’s Registration Statement on Form S-8 on June 24, 2003 and incorporated herein by reference. | |
| (12) | Filed as Appendix A to the Company’s Proxy Statement filed on May 21, 2009 (File No. 000-18805) and incorporated herein by reference. | |
| (13) | Filed as an exhibit to the Company’s Quarterly Report on Form 10-Q for the quarter ended March 31, 2004 (File No. 000-18805) and incorporated herein by reference. | |
| (14) | Filed as an exhibit to Printcafe Software, Inc.’s Registration Statement on Form S-1 (File No. 333-82646) and incorporated herein by reference. | |
| (15) | Filed as an exhibit to T/R Systems, Inc.’s Registration Statement on Form S-1 (File No. 333-82646) and incorporated herein by reference. | |
| (16) | Filed as an exhibit to the Company’s Registration Statement on Form S-8 on June 16, 2004 and incorporated herein by reference. | |
| (17) | Filed as Appendix B to the Company’s Proxy Statement filed on November 14, 2007 (File No. 000-18805) and incorporated herein by reference. | |
| (18) | Filed as an exhibit to the Company’s Registration Statement on Form S-8 on December 20, 2007 and incorporated herein by reference. | |
| (19) | Filed as Appendix B to the Company’s Proxy Statement filed on May 21, 2009 (File No. 000-18805) and incorporated herein by reference. | |
| (20) | Filed as an exhibit to the Company’s Current Report on Form 8-K filed on August 17, 2009 (File No. 000-18805) and incorporated herein by reference. | |
| (21) | Filed as an exhibit to the Company’s Current Report on Form 8-K filed on February 15, 2008 (File No. 000-18805) and incorporated herein by reference. | |
| (22) | Filed as an exhibit to the Company’s Quarterly Report on Form 10-Q for the quarter ended June 30, 2004 (File No. 000-18805) and incorporated herein by reference. | |
| (23) | Filed as an exhibit to the Company’s Annual Report on Form 10-K for the year ended December 31, 2005 (File No. 000-18805) and incorporated herein by reference. | |
| (24) | Filed as an exhibit to the Company’s Quarterly Report on Form 10-Q for the quarter ended March 31, 2006 (File No. 18805) and incorporated herein by reference. | |
| (25) | Filed as an exhibit to the Company’s Current Report on Form 8-K filed on August 7, 2006 (File No. 000-18805) and incorporated herein by reference. | |
| (26) | Filed as an exhibit to the Company’s Quarterly Report on Form 10-Q for the quarter ended June 30, 2006 (File No. 18805) and incorporated herein by reference. | |
| (27) | Filed as an exhibit to the Company’s Current Report on Form 8-K filed on September 5, 2008 (File No. 000-18805) and incorporated herein by reference. | |
| (28) | Filed as an exhibit to the Company’s Annual Report on Form 10-K for the year ended December 31, 2008 (File No. 000-18805) and incorporated herein by reference. | |
| (29) | Filed as an exhibit to the Company’s Quarterly Report on Form 10-Q for the quarter ended March 31, 2009 (File No. 18805) and incorporated herein by reference. | |
| (30) | Filed as an exhibit to the Company’s Current Report on Form 8-K filed on January 4, 2011 (File No. 000-18805) and incorporated herein by reference. | |
| (31) | Filed as an exhibit to the Company’s Current Report on Form 8-K filed on February 11, 2011 (File No. 000-18805) and incorporated herein by reference. |
(b) List of Exhibits
See Item 15 (a).
(c) Consolidated Financial Statement Schedule II for the years ended December 31, 2010, 2009, and 2008.
133
Table of Contents
ELECTRONICS FOR IMAGING, INC.
Valuation and Qualifying Accounts (in thousands)
| Description |
Balance at beginning of period |
Charged to revenue and expenses |
Charged to/(from) other accounts |
Deductions | Balance at end of period |
|||||||||||||||
| Year Ended December 31, 2010 |
||||||||||||||||||||
| Allowance for doubtful accounts and sales-related allowances |
$ | 13,050 | $ | 2,525 | $ | 163 | (1) | $ | (2,571 | ) | $ | 13,167 | ||||||||
| Year Ended December 31, 2009 |
||||||||||||||||||||
| Allowance for doubtful accounts and sales-related allowances |
$ | 8,452 | $ | 7,703 | $ | — | $ | (3,105 | ) | $ | 13,050 | |||||||||
| Year Ended December 31, 2008 |
||||||||||||||||||||
| Allowance for doubtful accounts and sales-related allowances |
$ | 8,153 | $ | 5,420 | $ | 88 | (2) | $ | (5,209 | ) | $ | 8,452 | ||||||||
| (1) | Adjustment due to acquired bad debt allowance: Radius |
| (2) | Adjustment due to acquired bad debt allowance: Pace |
134
Table of Contents
Pursuant to the requirements of Sections 13 or 16(d) of the Securities Exchange Act of 1934, the registrant has duly caused this report to be signed on its behalf by the undersigned, thereunto duly authorized.
| ELECTRONICS FOR IMAGING, INC. | ||||||
| March 9, 2011 | By: | /S/ GUY GECHT | ||||
| Guy Gecht, | ||||||
| Chief Executive Officer | ||||||
POWER OF ATTORNEY
KNOW ALL PERSONS BY THESE PRESENT, that each person whose signature appears below constitutes and appoints Guy Gecht and Vincent Pilette jointly and severally, his attorneys-in-fact, each with the power of substitution, for him in any and all capacities, to sign any amendments to the Form 10-K Annual Report and to file the same, with exhibits thereto and other documents in connection therewith, with the Securities and Exchange Commission, hereby ratifying and confirming all that each of said attorneys-in-fact, or his substitute or substitutes, may do or cause to be done by virtue thereof.
Pursuant to the requirements of the Securities Exchange Act of 1934, this report has been signed below by the following persons on behalf of the registrant and in the capacities and on the dates indicated.
| Signature |
Title |
Date | ||
| /S/ GUY GECHT Guy Gecht |
Chief Executive Officer, Director (Principal Executive Officer) | March 9, 2011 | ||
| /S/ FRED ROSENZWEIG |
President, Director | March 9, 2011 | ||
| Fred Rosenzweig | ||||
| /S/ VINCENT PILETTE Vincent Pilette |
Chief Financial Officer (Principal Financial and Accounting Officer) | March 9, 2011 | ||
| /S/ THOMAS GEORGENS |
Director | March 9, 2011 | ||
| Thomas Georgens | ||||
| /S/ GILL COGAN |
Director | March 9, 2011 | ||
| Gill Cogan | ||||
| /S/ DAN MAYDAN |
Director | March 9, 2011 | ||
| Dan Maydan | ||||
| /S/ RICHARD A. KASHNOW |
Director | March 9, 2011 | ||
| Richard A. Kashnov | ||||
135
Table of Contents
Exhibit Index
| Exhibit |
Description | |
| 2.1 | Agreement and Plan of Merger, dated as of August 30, 2000, by and among the Company, Vancouver Acquisition Corp. and Splash Technology Holdings, Inc. (1) | |
| 2.2 | Amendment No. 1, dated as of October 19, 2000, to the Agreement and Plan of Merger, dated as of August 30, 2000, by and among the Company, Vancouver Acquisition Corp. and Splash Technology Holdings, Inc. (2) | |
| 2.3 | Agreement and Plan of Merger and Reorganization, dated as of July 14, 1999, among the Company, Redwood Acquisition Corp. and Management Graphics, Inc. (3) | |
| 2.4 | Agreement and Plan of Merger, dated as of February 26, 2003 by and among the Company, Strategic Value Engineering, Inc. and Printcafe Software, Inc. (4) | |
| 2.5 | Merger Agreement, dated as of April 14, 2005 by and among the Company, VUTEk, Inc. and EFI Merger Sub, Inc. (5) | |
| 2.6+ | Amended and Restated Equity Purchase Agreement dated October 31, 2006 among the Company, Electronics for Imaging, International, Jetrion, LLC and Flint Group North America Corporation (6) | |
| 3.1 | Amended and Restated Certificate of Incorporation (7) | |
| 3.2 | Amended and Restated By-Laws of Electronics For Imaging, Inc., (as amended August 12, 2009) (8) | |
| 4.2 | Specimen Common Stock Certificate of the Company (9) | |
| 10.1+ | Agreement dated December 6, 2000, by and between Adobe Systems Incorporated and the Company (10) | |
| 10.2 | Electronics For Imaging, Inc. 1999 Equity Incentive Plan as amended (11) | |
| 10.3 | Amended and Restated 2000 Employee Stock Purchase Plan (12) | |
| 10.4 | Splash Technology Holdings, Inc. 1996 Stock Option Plan as amended to date (13) | |
| 10.5 | Printcafe Software, Inc. 2000 Stock Incentive Plan (14) | |
| 10.6 | Printcafe Software, Inc. 2002 Key Executive Stock Incentive Plan (14) | |
| 10.7 | Printcafe Software, Inc. 2002 Employee Stock Incentive Plan (14) | |
| 10.8 | T/R Systems, Inc. 1999 Stock Option Plan (15) | |
| 10.9 | Electronics For Imaging, Inc. 2004 Equity Incentive Plan (16) | |
| 10.10 | Electronics For Imaging, Inc. 2007 Equity Incentive Award Plan (17) | |
| 10.11 | Electronics For Imaging, Inc. 2007 Equity Incentive Award Plan Stock Option Grant Notice and Stock Option Agreement (18) | |
| 10.12 | Electronics For Imaging, Inc. 2007 Equity Incentive Award Plan Restricted Stock Award Grant Notice and Restricted Stock Award Agreement (18) | |
| 10.13 | Electronics For Imaging, Inc. 2007 Equity Incentive Award Plan Restricted Stock Unit Award Grant Notice and Restricted Stock Unit Award Agreement (18) | |
| 10.14 | Electronics For Imaging, Inc. 2009 Equity Incentive Award Plan (19) | |
| 10.15 | Electronics For Imaging, Inc. 2009 Equity Incentive Award Plan Stock Option Grant Notice and Stock Option Agreement (20) | |
1
Table of Contents
| Exhibit |
Description | |
| 10.16 | Electronics For Imaging, Inc. 2009 Equity Incentive Award Plan Restricted Stock Unit Award Grant Notice and Restricted Stock Unit Award Grant Agreement (20) | |
| 10.17 | Electronics For Imaging, Inc. 2009 Equity Incentive Award Plan Restricted Stock Award Grant Notice and Restricted Stock Award Grant Agreement (20) | |
| 10.18 | Form of Indemnification Agreement (9) | |
| 10.19 | Form of Indemnity Agreement (21) | |
| 10.20 | Lease Financing of Properties Located in Foster City, California, dated as of July 16, 2004, among the Company, Société Générale Financial Corporation and Société Générale (22) | |
| 10.21+ | OEM Distribution and License Agreement dated September 19, 2005 by and among Adobe Systems Incorporated, Adobe Systems Software Ireland Limited and the Company, as amended by Amendment No. 1 dated as of October 1, 2005 (23) | |
| 10.22+ | Amendment No. 2 to OEM Distribution and License Agreement by and among Adobe Systems Incorporated, Adobe Systems Software Ireland Limited and the Company, effective as of October 1, 2005 (24) | |
| 10.23 | Employment Agreement effective August 1, 2006, by and between Guy Gecht and the Company (25) | |
| 10.24 | Employment Agreement effective August 1, 2006, by and between Fred Rosenzweig and the Company (25) | |
| 10.25 | Employment Agreement effective August 1, 2006, by and between John Ritchie and the Company (25) | |
| 10.26+ | Amendment No. 4 to OEM Distribution and License Agreement by and among Adobe Systems Incorporated, Adobe Systems Software Ireland Limited and the Company, effective as of January 1, 2006 (26) | |
| 10.27 | Amendment of Stock Option Agreement and Stock Option Repayment Agreement, dated as of August 29, 2008, by and between the Company and Guy Gecht (27) | |
| 10.28 | Amendment of Stock Option Agreement and Stock Option Repayment Agreement, dated as of August 29, 2008, by and between the Company and Fred S. Rosenzweig (27) | |
| 10.29 | Amendment of Stock Option Agreement and Stock Option Repayment Agreement, dated as of August 29, 2008, by and between the Company and John Ritchie (27) | |
| 10.30 | Amendment of Stock Option Agreement and Stock Option Repayment Agreement, dated as of August 29, 2008, by and between the Company and Dan Maydan (27) | |
| 10.31 | Amendment of Stock Option Agreement, dated as of August 29, 2008, by and between the Company and Gill Cogan (27) | |
| 10.32 | Purchase and Sale Agreement and Joint Escrow Instructions dated as of October 23, 2008 by and between the Company and Gilead Sciences, Inc., as amended (28) | |
| 10.33+ | Master Confirmation dated February 18, 2009 between the Company and UBS, AG, London Branch (29) | |
| 10.34+ | Supplemental Confirmation dated February 18, 2009 between the Company and UBS, AG, London Branch (29) | |
| 10.35 | Offer Letter to Vincent Pilette, dated December 29, 2010 (30) | |
| 10.36 | Executive Employment Agreement to Vincent Pilette, dated December 29, 2010 (30) | |
| 10.37 | EFI 2011 Executive Team Performance Bonus Program (31) | |
| 12.1 | Computation of Ratios of Earnings to Fixed Charges | |
| 21 | List of Subsidiaries | |
2
Table of Contents
| Exhibit |
Description | |
| 23.1 | Consent of Independent Registered Public Accounting Firm | |
| 24.1 | Power of Attorney (see signature page of this Annual Report on Form 10-K) | |
| 31.1 | Certification of Chief Executive Officer pursuant to Section 302 of the Sarbanes-Oxley Act of 2002 | |
| 31.2 | Certification of Chief Financial Officer pursuant to Section 302 of the Sarbanes-Oxley Act of 2002 | |
| 32.1 | Chief Executive Officer Certification pursuant to 18 U.S.C. Section 1350 as adopted pursuant to Section 906 of the Sarbanes-Oxley Act of 2002 and Chief Financial Officer Certification pursuant to 18 U.S.C. Section 1350 as adopted pursuant to Section 906 of the Sarbanes-Oxley Act of 2002 | |
| + | The Company has received confidential treatment with respect to portions of these documents |
| (1) | Filed as exhibit (d) (1) to the Company’s Schedule TO-T on September 14, 2000 and incorporated herein by reference. |
| (2) | Filed as exhibit (d) (5) to the Company’s Schedule TO/A No. 3 on October 20, 2000 and incorporated herein by reference. |
| (3) | Filed as an exhibit to the Company’s Report of Unscheduled Events on Form 8-K on September 8, 1999 (File No. 000-18805) and incorporated herein by reference. |
| (4) | Filed as exhibit 10 to Amendment No. 2 to the Schedule 13D filed on February 26, 2003 and incorporated herein by reference. |
| (5) | Filed as an exhibit to the Company’s Current Report on Form 8-K filed on April 18, 2005 (File No. 000-18805) and incorporated herein by reference. |
| (6) | Filed as an exhibit to the Company’s Current Report on Form 8-K filed on November 3, 2006 (File No. 000-18805) and incorporated herein by reference. |
| (7) | Filed as an exhibit to the Company’s Registration Statement on Form S-1 (File No. 33-57382) and incorporated herein by reference. |
| (8) | Filed as an exhibit to the Company’s Current Report on Form 8-K filed on August 17, 2009 and incorporated herein by reference. |
| (9) | Filed as an exhibit to the Company’s Registration Statement on Form S-1 (No. 33-50966) and incorporated herein by reference. |
| (10) | Filed as an exhibit to the Company’s Annual Report on Form 10-K for the year ended December 31, 2000 (File No. 000-18805) and incorporated herein by reference. |
| (11) | Filed as an exhibit to the Company’s Registration Statement on Form S-8 on June 24, 2003 and incorporated herein by reference. |
| (12) | Filed as Appendix A to the Company’s Proxy Statement filed on May 21, 2009 (File No. 000-18805) and incorporated herein by reference. |
| (13) | Filed as an exhibit to the Company’s Quarterly Report on Form 10-Q for the quarter ended March 31, 2004 (File No. 000-18805) and incorporated herein by reference. |
| (14) | Filed as an exhibit to Printcafe Software, Inc.’s Registration Statement on Form S-1 (File No. 333-82646) and incorporated herein by reference. |
| (15) | Filed as an exhibit to T/R Systems, Inc.’s Registration Statement on Form S-1 (File No. 333-82646) and incorporated herein by reference. |
| (16) | Filed as an exhibit to the Company’s Registration Statement on Form S-8 on June 16, 2004 and incorporated herein by reference. |
| (17) | Filed as Appendix B to the Company’s Proxy Statement filed on November 14, 2007 (File No. 000-18805) and incorporated herein by reference. |
| (18) | Filed as an exhibit to the Company’s Registration Statement on Form S-8 on December 20, 2007 and incorporated herein by reference. |
| (19) | Filed as Appendix B to the Company’s Proxy Statement filed on May 21, 2009 (File No. 000-18805) and incorporated herein by reference. |
3
Table of Contents
| (20) | Filed as an exhibit to the Company’s Current Report on Form 8-K filed on August 17, 2009 (File No. 000-18805) and incorporated herein by reference. |
| (21) | Filed as an exhibit to the Company’s Current Report on Form 8-K filed on February 15, 2008 (File No. 000-18805) and incorporated herein by reference. |
| (22) | Filed as an exhibit to the Company’s Quarterly Report on Form 10-Q for the quarter ended June 30, 2004 (File No. 000-18805) and incorporated herein by reference. |
| (23) | Filed as an exhibit to the Company’s Annual Report on Form 10-K for the year ended December 31, 2005 (File No. 000-18805) and incorporated herein by reference. |
| (24) | Filed as an exhibit to the Company’s Quarterly Report on Form 10-Q for the quarter ended March 31, 2006 (File No. 18805) and incorporated herein by reference. |
| (25) | Filed as an exhibit to the Company’s Current Report on Form 8-K filed on August 7, 2006 (File No. 000-18805) and incorporated herein by reference. |
| (26) | Filed as an exhibit to the Company’s Quarterly Report on Form 10-Q for the quarter ended June 30, 2006 (File No. 18805) and incorporated herein by reference. |
| (27) | Filed as an exhibit to the Company’s Current Report on Form 8-K filed on September 5, 2008 (File No. 000-18805) and incorporated herein by reference. |
| (28) | Filed as an exhibit to the Company’s Annual Report on Form 10-K for the year ended December 31, 2008 (File No. 000-18805) and incorporated herein by reference. |
| (29) | Filed as an exhibit to the Company’s Quarterly Report on Form 10-Q for the quarter ended March 31, 2009 (File No. 18805) and incorporated herein by reference. |
| (30) | Filed as an exhibit to the Company’s Current Report on Form 8-K filed on January 4, 2011 (File No. 000-18805) and incorporated herein by reference. |
| (31) | Filed as an exhibit to the Company’s Current Report on Form 8-K filed on February 11, 2011 (File No. 000-18805) and incorporated herein by reference. |
4